FEDERAL HOME LOAN MORTGAGE CORP
10-Ks and 10-Qs
UNITED STATES SECURITIES AND EXCHANGE COMMISSION
Washington, D.C. 20549
FORM 10-K
ANNUAL REPORT PURSUANT TO SECTION 13 OR 15(d)
OF THE SECURITIES EXCHANGE ACT OF 1934
For the fiscal year ended December 31, 2018
Commission File Number: 001-34139

Federal Home Loan Mortgage Corporation
(Exact name of registrant as specified in its charter)
|
Federally chartered
|
|
52-0904874
|
8200 Jones Branch Drive
|
22102-3110
|
|
(703) 903-2000
|
||
|
corporation
|
|
McLean, Virginia
|
|
|||||
|
(State or other jurisdiction of incorporation or organization)
|
|
(I.R.S. Employer
Identification No.)
|
(Address of principal executive offices)
|
(Zip Code)
|
|
(Registrant's telephone number,
including area code)
|
||
Securities registered pursuant to Section 12(b) of the Act: None
Securities registered pursuant to Section 12(g) of the Act:
Voting Common Stock, no par value per share (OTCQB: FMCC)
Variable Rate, Non-Cumulative Preferred Stock, par value $1.00 per share (OTCQB: FMCCI)
5% Non-Cumulative Preferred Stock, par value $1.00 per share (OTCQB: FMCKK)
Variable Rate, Non-Cumulative Preferred Stock, par value $1.00 per share (OTCQB: FMCCG)
5.1% Non-Cumulative Preferred Stock, par value $1.00 per share (OTCQB: FMCCH)
5.79% Non-Cumulative Preferred Stock, par value $1.00 per share (OTCQB: FMCCK)
Variable Rate, Non-Cumulative Preferred Stock, par value $1.00 per share (OTCQB: FMCCL)
Variable Rate, Non-Cumulative Preferred Stock, par value $1.00 per share (OTCQB: FMCCM)
Variable Rate, Non-Cumulative Preferred Stock, par value $1.00 per share (OTCQB: FMCCN)
5.81% Non-Cumulative Preferred Stock, par value $1.00 per share (OTCQB: FMCCO)
6% Non-Cumulative Preferred Stock, par value $1.00 per share (OTCQB: FMCCP)
Variable Rate, Non-Cumulative Preferred Stock, par value $1.00 per share (OTCQB: FMCCJ)
5.7% Non-Cumulative Preferred Stock, par value $1.00 per share (OTCQB: FMCKP)
Variable Rate, Non-Cumulative Perpetual Preferred Stock, par value $1.00 per share (OTCQB: FMCCS)
6.42% Non-Cumulative Perpetual Preferred Stock, par value $1.00 per share (OTCQB: FMCCT)
5.9% Non-Cumulative Perpetual Preferred Stock, par value $1.00 per share (OTCQB: FMCKO)
5.57% Non-Cumulative Perpetual Preferred Stock, par value $1.00 per share (OTCQB: FMCKM)
5.66% Non-Cumulative Perpetual Preferred Stock, par value $1.00 per share (OTCQB: FMCKN)
6.02% Non-Cumulative Perpetual Preferred Stock, par value $1.00 per share (OTCQB: FMCKL)
6.55% Non-Cumulative Perpetual Preferred Stock, par value $1.00 per share (OTCQB: FMCKI)
Fixed-to-Floating Rate Non-Cumulative Perpetual Preferred Stock, par value $1.00 per share (OTCQB: FMCKJ)
Indicate by check mark if the registrant is a well-known seasoned issuer, as defined in Rule 405 of the Securities Act. Yes
¨
No
x
Indicate by check mark if the registrant is not required to file reports pursuant to Section 13 or Section 15(d) of the Act. Yes
¨
No
x
Indicate by check mark whether the registrant: (1) has filed all reports required to be filed by Section 13 or 15(d) of the Securities Exchange Act of 1934 during the preceding 12 months (or for such shorter period that the registrant was required to file such reports); and (2) has been subject to such filing requirements for the past 90 days.
x
Yes
¨
No
Indicate by check mark whether the registrant has submitted electronically every Interactive Data File required to be submitted pursuant to Rule 405 of Regulation S-T (§232.405 of this chapter) during the preceding 12 months (or for such shorter period that the registrant was required to submit such files).
x
Yes
¨
No
Indicate by check mark if disclosure of delinquent filers pursuant to Item 405 of Regulation S-K is not contained herein, and will not be contained, to the best of registrant's knowledge, in definitive proxy or information statements incorporated by reference in Part III of this Form 10-K or any amendment to this Form 10-K.
x
Indicate by check mark whether the registrant is a large accelerated filer, an accelerated filer, a non-accelerated filer, a smaller reporting company, or an emerging growth company. See the definitions of "large accelerated filer," "accelerated filer," "smaller reporting company," and "emerging growth company" in Rule 12b-2 of the Exchange Act.
|
|
|
Large accelerated filer
x
|
|
|
|
Accelerated filer
¨
|
|
|
|
Non-accelerated filer
¨
|
|
Smaller reporting company
¨
|
||
|
Emerging growth company
¨
|
||||||
If an emerging growth company, indicate by check mark if the registrant has elected not to use the extended transition period for complying with any new or revised financial accounting standards provided pursuant to Section 13(a) of the Exchange Act.
¨
Indicate by check mark whether the registrant is a shell company (as defined in Rule 12b-2 of the Exchange Act). Yes
¨
No
x
The aggregate market value of the common stock held by non-affiliates computed by reference to the price at which the common equity was last sold on June 29, 2018 (the last business day of the registrant's most recently completed second fiscal quarter) was $1.0 billion.
As of February 1, 2019, there were
650,058,775
shares of the registrant's common stock outstanding.
DOCUMENTS INCORPORATED BY REFERENCE
: None
|
Table of Contents
|
|
Table of Contents
|
n
About Freddie Mac
|
|
|
n
Our Business
|
|
|
n
Forward-Looking Statements
|
|
|
SELECTED FINANCIAL DATA
|
|
|
MANAGEMENT'S DISCUSSION AND ANALYSIS OF FINANCIAL CONDITION AND RESULTS OF OPERATIONS
|
|
|
n
Key Economic Indicators
|
|
|
n
Consolidated Results of Operations
|
|
|
n
Consolidated Balance Sheets Analysis
|
|
|
n
Our Business Segments
|
|
|
n
Risk Management
|
|
|
l
Credit Risk
|
|
|
l
Operational Risk
|
|
|
l
Market Risk
|
|
|
n
Liquidity and Capital Resources
|
|
|
n
Conservatorship and Related Matters
|
|
|
n
Regulation and Supervision
|
|
|
n
Contractual Obligations
|
|
|
n
Off-Balance Sheet Arrangements
|
|
|
n
Critical Accounting Policies and Estimates
|
|
|
RISK FACTORS
|
|
|
LEGAL PROCEEDINGS
|
|
|
MARKET FOR REGISTRANT'S COMMON EQUITY, RELATED STOCKHOLDER MATTERS, AND ISSUER PURCHASES OF EQUITY SECURITIES
|
|
|
FINANCIAL STATEMENTS AND SUPPLEMENTARY DATA
|
|
|
QUARTERLY SELECTED FINANCIAL DATA
|
|
|
CONTROLS AND PROCEDURES
|
|
|
DIRECTORS, CORPORATE GOVERNANCE, AND EXECUTIVE OFFICERS
|
|
|
n
Directors
|
|
|
n
Corporate Governance
|
|
|
n
Executive Officers
|
|
|
EXECUTIVE COMPENSATION
|
|
|
n
Compensation Discussion and Analysis
|
|
|
n
Compensation and Risk
|
|
|
n
CEO Pay Ratio
|
|
|
n
2018 Compensation Information for NEOs
|
|
|
SECURITY OWNERSHIP OF CERTAIN BENEFICIAL OWNERS AND MANAGEMENT AND RELATED STOCKHOLDER MATTERS
|
|
|
CERTAIN RELATIONSHIPS AND RELATED TRANSACTIONS
|
|
|
PRINCIPAL ACCOUNTING FEES AND SERVICES
|
|
|
EXHIBITS AND FINANCIAL STATEMENT SCHEDULES
|
|
|
GLOSSARY
|
|
|
EXHIBIT INDEX
|
|
|
SIGNATURES
|
|
|
FORM 10-K INDEX
|
|
|
FREDDIE MAC
| 2018 Form 10-K
|
i
|
|
|
Table of Contents
|
MD&A Table Index
|
MD&A TABLE INDEX
|
Table
|
Description
|
Page
|
|
1
|
Selected Financial Data
|
|
|
2
|
Summary of Consolidated Statements of Comprehensive Income (Loss)
|
|
|
3
|
Components of Net Interest Income
|
|
|
4
|
Analysis of Net Interest Yield
|
|
|
5
|
Net Interest Income Rate / Volume Analysis
|
|
|
6
|
Components of Mortgage Loans Gains (Losses)
|
|
|
7
|
Components of Investment Securities Gains (Losses)
|
|
|
8
|
Components of Debt Gains (Losses)
|
|
|
9
|
Components of Derivative Gains (Losses)
|
|
|
10
|
Other Comprehensive Income (Loss)
|
|
|
11
|
Summarized Consolidated Balance Sheets
|
|
|
12
|
Single-Family Credit Guarantee Portfolio CRT Issuance
|
|
|
13
|
Single-Family Guarantee Segment Financial Results
|
|
|
14
|
Multifamily Market Support
|
|
|
15
|
Multifamily Segment Financial Results
|
|
|
16
|
Capital Markets Segment Financial Results
|
|
|
17
|
Capital Markets Segment Interest Rate-Related and Market Spread-Related Fair Value Changes, Net of Tax
|
|
|
18
|
All Other Category Comprehensive Income
|
|
|
19
|
Single-Family New Business Activity
|
|
|
20
|
Relief Refinance Loan Purchases
|
|
|
21
|
Details of Credit Enhanced Loans in Our Single-Family Credit Guarantee Portfolio
|
|
|
22
|
Non-Credit-Enhanced and Credit-Enhanced Loans in Our Single-Family Credit Guarantee Portfolio
|
|
|
23
|
Single-Family Guarantee Portfolio Credit Risk Transfer Sensitivity Analysis
|
|
|
24
|
Credit Quality Characteristics of Our Single-Family Credit Guarantee Portfolio
|
|
|
25
|
Characteristics of the Loans in Our Single-Family Credit Guarantee Portfolio
|
|
|
26
|
Single-Family Credit Guarantee Portfolio Higher Risk Loan Data
|
|
|
27
|
Single-Family Credit Guarantee Portfolio Attribute Combinations for Higher Risk Loans
|
|
|
28
|
Higher Risk Single-Family Loan Credit Characteristics
|
|
|
29
|
Timing of Scheduled Payment Changes for Certain Single-Family Loan Types
|
|
|
30
|
Alt-A Loans in Our Single-Family Credit Guarantee Portfolio
|
|
|
31
|
Geographic Concentration in Our Single-Family Credit Guarantee Portfolio
|
|
|
32
|
Single-Family Charge-Offs and Recoveries by Region
|
|
|
33
|
Concentration of Single-Family Loans in Each Region by CLTV Ratio
|
|
|
34
|
Single-Family Credit Guarantee Portfolio Credit Performance Metrics
|
|
|
35
|
Credit Characteristics of Certain Single-Family Loan Categories
|
|
|
36
|
Single-Family Allowance for Credit Losses Activity
|
|
|
37
|
Single-Family Individually Impaired Loans with an Allowance Recorded
|
|
|
38
|
Single-Family TDR and Non-Accrual Loans
|
|
|
39
|
Single-Family Relief Refinance Loans
|
|
|
40
|
Credit Characteristics of Single-Family Modified Loans
|
|
|
41
|
Payment Performance of Single-Family Modified Loans
|
|
|
42
|
Seriously Delinquent Single-Family Loans By Jurisdiction
|
|
|
43
|
Average Length of Foreclosure Process for Single-Family Loans
|
|
|
44
|
Single-Family REO Activity
|
|
|
45
|
Single-Family Severity Ratios
|
|
|
46
|
Multifamily Segment New Business Activity by Product Term
|
|
|
FREDDIE MAC
| 2018 Form 10-K
|
ii
|
|
|
Table of Contents
|
MD&A Table Index
|
|
47
|
Non-Credit-Enhanced and Credit-Enhanced Loans Underlying Our Multifamily Mortgage Portfolio
|
|
|
48
|
Multifamily Mortgage Portfolio Attributes
|
|
|
49
|
Single-Family Credit Guarantee Portfolio Non-Depository Servicers
|
|
|
50
|
Single-Family Mortgage Insurers
|
|
|
51
|
Derivative Counterparty Credit Exposure
|
|
|
52
|
PMVS-YC and PMVS-L Results Assuming Shifts of the LIBOR Yield Curve
|
|
|
53
|
Duration Gap and PMVS Results
|
|
|
54
|
PMVS-L Results Before Derivatives and After Derivatives
|
|
|
55
|
Estimated Net Interest Rate Effect on Comprehensive Income (Loss)
|
|
|
56
|
GAAP Adverse Scenario Before and After Hedge Accounting
|
|
|
57
|
Estimated Spread Effect on Comprehensive Income (Loss)
|
|
|
58
|
Sources of Liquidity
|
|
|
59
|
Other Investments Portfolio
|
|
|
60
|
Funding Sources
|
|
|
61
|
Other Debt Activity
|
|
|
62
|
Other Short-Term Debt
|
|
|
63
|
Activity for Debt Securities of Consolidated Trusts Held by Third Parties
|
|
|
64
|
Debt Securities of Consolidated Trusts Held by Third Parties
|
|
|
65
|
Freddie Mac Credit Ratings
|
|
|
66
|
Sources of Capital
|
|
|
67
|
Net Worth Activity
|
|
|
68
|
Returns on Conservatorship Capital
|
|
|
69
|
Mortgage-Related Investments Portfolio Details
|
|
|
70
|
2017 and 2016 Affordable Housing Goals Results
|
|
|
71
|
2018-2020 Affordable Housing Goals
|
|
|
72
|
Contractual Obligations
|
|
|
73
|
Quarterly Selected Financial Data
|
|
|
74
|
Board Compensation Levels
|
|
|
75
|
Director Compensation
|
|
|
76
|
2018 Target TDC
|
|
|
77
|
2018 Deferred Salary
|
|
|
78
|
CEO Pay Ratio
|
|
|
79
|
Compensation Summary
|
|
|
80
|
Grants of Plan-Based Awards
|
|
|
81
|
SERP and SERP II Benefits
|
|
|
82
|
Compensation and Benefits if NEO Terminated Employment as of December 31, 2018
|
|
|
83
|
Stock Ownership
|
|
|
84
|
5% Holders
|
|
|
85
|
Auditor Fees
|
|
|
FREDDIE MAC
| 2018 Form 10-K
|
iii
|
|
|
Introduction
|
About Freddie Mac
|
Introduction
This Annual Report on Form 10-K includes forward-looking statements that are based on current expectations and are subject to significant risks and uncertainties. These forward-looking statements are made as of the date of this Form 10-K. We undertake no obligation to update any forward-looking statement to reflect events or circumstances after the date of this Form 10-K. Actual results might differ significantly from those described in or implied by such statements due to various factors and uncertainties, including those described in the
Forward-Looking Statements
and
Risk Factors
sections of this Form 10-K.
Throughout this Form 10-K, we use certain acronyms and terms that are defined in the
Glossary
. In addition, throughout this Form 10-K, we refer to the three months ended December 31, 2018, the three months ended September 30, 2018, the three months ended June 30, 2018, the three months ended March 31, 2018, the three months ended December 31, 2017, the three months ended September 30, 2017, the three months ended June 30, 2017, the three months ended March 31, 2017, and the three months ended December 31, 2016 as "4Q 2018," "3Q 2018," "2Q 2018," "1Q 2018," "4Q 2017," "3Q 2017," "2Q 2017," "1Q 2017," and "4Q 2016," respectively.
ABOUT FREDDIE MAC
Freddie Mac is a GSE chartered by Congress in 1970. Our public mission is to provide liquidity, stability, and affordability to the U.S. housing market. We do this primarily by purchasing residential mortgage loans originated by lenders. In most instances, we package these loans into mortgage-related securities, which are guaranteed by us and sold in the global capital markets. In addition, we transfer mortgage credit risk exposure to private investors through our credit risk transfer programs, which include securities- and insurance-based offerings. We also invest in mortgage loans and mortgage-related securities. We do not originate loans or lend money directly to mortgage borrowers.
We support the U.S. housing market and the overall economy by enabling America's families to access mortgage loan funding with better terms and by providing consistent liquidity to the multifamily mortgage market. We have helped many distressed borrowers keep their homes or avoid foreclosure. We are working with FHFA, our customers, and the industry to build a better housing finance system for the nation.
Conservatorship and Government Support for Our Business
Since September 2008, we have been operating in conservatorship, with FHFA as our Conservator. The conservatorship and related matters significantly affect our management, business activities, financial condition, and results of operations. Our future is uncertain, and the conservatorship has no specified termination date. We do not know what changes may occur to our business model during or following conservatorship, including whether we will continue to exist.
Our Purchase Agreement with Treasury and the terms of the senior preferred stock we issued to Treasury also affect our business activities. Our ability to access funds from Treasury under the Purchase Agreement is critical to keeping us solvent and avoiding the appointment of a receiver by FHFA under
|
FREDDIE MAC
| 2018 Form 10-K
|
1
|
|
|
Introduction
|
About Freddie Mac
|
statutory mandatory receivership provisions. We believe that the support provided by Treasury pursuant to the Purchase Agreement currently enables us to have adequate liquidity to conduct normal business activities.
In connection with our entry into conservatorship, we entered into the Purchase Agreement with Treasury. Under the Purchase Agreement, we issued to Treasury both senior preferred stock and a warrant to purchase common stock. The senior preferred stock and warrant were issued as an initial commitment fee in consideration of Treasury's commitment to provide funding to us under the Purchase Agreement. Treasury, as the holder of the senior preferred stock, is entitled to receive cumulative quarterly cash dividends, when, as, and if declared by the Conservator, acting as successor to the rights, titles, powers, and privileges of our Board of Directors. The dividends we have paid to Treasury on the senior preferred stock have been declared by, and paid at the direction of, the Conservator.
Under the August 2012 amendment to the Purchase Agreement, our cash dividend requirement each quarter is the amount, if any, by which our Net Worth Amount at the end of the immediately preceding fiscal quarter, less the applicable Capital Reserve Amount, exceeds zero. Pursuant to the December 2017 Letter Agreement, the applicable Capital Reserve Amount is $3.0 billion. If for any reason we were not to pay our dividend requirement on the senior preferred stock in full in any future period, the unpaid amount would be added to the liquidation preference and the applicable Capital Reserve Amount would thereafter be zero, but this would not affect our ability to draw funds from Treasury under the Purchase Agreement.
The graph below shows our cumulative draws from Treasury and cumulative dividend payments to Treasury. The Treasury draw amounts shown are the total draws requested based on our quarterly net deficits for the periods presented. Draw requests are funded in the quarter subsequent to any net deficit. Under the Purchase Agreement, the payment of dividends does not reduce the outstanding liquidation preference of the senior preferred stock. The amount of available funding remaining under the Purchase Agreement was $140.2 billion at December 31, 2018, and will be reduced by any future draws. For more information on the conservatorship and government support for our business, see
MD&A - Conservatorship and Related Matters
and
Note 2
.
Draw Requests From and Dividend Payments To Treasury

|
FREDDIE MAC
| 2018 Form 10-K
|
2
|
|
|
Introduction
|
About Freddie Mac
|
Business Results
Portfolio Balances


Total Guarantee Portfolio
|
n
|
2018 vs. 2017 and 2017 vs. 2016
- The total guarantee portfolio grew $101 billion, or 5%, in 2018, driven by a 4% increase in our single-family credit guarantee portfolio and a 17% increase in our multifamily guarantee portfolio. The total guarantee portfolio grew $119 billion, or 6%, in 2017, driven by a 4% increase in our single-family credit guarantee portfolio and a 28% increase in our multifamily guarantee portfolio.
|
|
l
|
The growth in our single-family credit guarantee portfolio in both 2018 and 2017 was driven by increases in U.S. single-family mortgage debt outstanding as a result of continued home price appreciation. New business acquisitions had a higher average loan size compared to older vintages that continued to run off.
|
|
FREDDIE MAC
| 2018 Form 10-K
|
3
|
|
|
Introduction
|
About Freddie Mac
|
l
The growth in our multifamily guarantee portfolio in both 2018 and 2017 was primarily driven by strong loan purchase and securitization activity, which was attributable to healthy multifamily market fundamentals and strong demand for certain of our securitization products.
Total Investments Portfolio
|
n
|
2018 vs. 2017 and 2017 vs. 2016
- The total investments portfolio declined $62 billion, or 18%, and $51 billion, or 13%, in 2018 and 2017, respectively, primarily due to repayments and the active disposition of less liquid assets. We have reduced the mortgage-related investments portfolio as required by the Purchase Agreement and FHFA.
|
Consolidated Financial Results
Comprehensive Income

Key Drivers:
|
n
|
2018 vs. 2017
|
|
l
|
Comprehensive income was $8.6 billion for 2018, an increase of 55% compared to comprehensive income of $5.6 billion for 2017. The increase in comprehensive income primarily reflects two significant items in 2017: a non-cash charge of $5.4 billion due to the enactment of tax reform legislation and a $4.5 billion, or $2.9 billion after-tax, benefit from a litigation settlement related to non-agency mortgage-related securities in which the company no longer invests.
|
|
l
|
Other key drivers of comprehensive income for 2018 include:
|
|
FREDDIE MAC
| 2018 Form 10-K
|
4
|
|
|
Introduction
|
About Freddie Mac
|
— Solid business revenues driven by continued growth in our guarantee portfolios, partially offset by lower net interest income driven by a reduction in the balance of our mortgage-related investments portfolio;
— Strong credit quality resulting in a higher benefit for credit losses in 2018, primarily driven by estimated losses from the hurricanes in 2017;
— Ongoing modest impacts from market-related items, despite significant volatility in the financial markets, especially in 4Q 2018; and
— Lower income tax expense due to the reduction in the statutory corporate income tax rate in 2018.
|
n
|
2017 vs. 2016
|
|
l
|
Comprehensive income was $5.6 billion for 2017, a decrease of 22% compared to comprehensive income of $7.1 billion for 2016, primarily due to the two significant items that occurred in 2017.
|
|
l
|
Other key drivers of comprehensive income for 2017 include:
|
— Solid business revenues driven by continued growth in our guarantee portfolios, partially offset by lower net interest income driven by a reduction in the balance of our mortgage-related investments portfolio;
— Ongoing modest impacts from market-related items, driven by gains from spread tightening and single-family legacy asset dispositions; and
— Lower benefit for credit losses, as 2017 was negatively affected by the hurricanes.
|
FREDDIE MAC
| 2018 Form 10-K
|
5
|
|
|
Introduction
|
Our Business
|
OUR BUSINESS
Primary Business Strategies
Our primary business strategies describe how we plan to pursue our Charter Mission through at least 2021. The underlying assumption for these strategies is that the conservatorship will continue with no material changes during that period. FHFA or Congress could take actions that alter this assumption.
Charter Mission
We are a GSE with a specific and limited corporate purpose (i.e., Charter Mission) to support the liquidity, stability, and affordability of U.S. housing markets as a participant in the secondary mortgage market, while operating as a commercial enterprise earning an appropriate return. Everything we do must be done within the constraints of our Charter Mission.
Our Twin Goals
We have established overarching twin goals to enable us to reach our Charter Mission:
|
n
|
A Better Freddie Mac and
|
|
n
|
A Better Housing Finance System
|
Our Key Strategies
A Better Freddie Mac
We are focused on operating as a very well-run large financial institution by:
|
n
|
Achieving superior economic value of the company through strong risk, capital, and financial management;
|
|
n
|
Being an effective operating organization; and
|
|
n
|
Being a market leader through customer focus and innovation.
|
A Better Housing Finance System
We are focused on providing leadership, through innovation and constructive forward-looking engagement with FHFA, to improve the liquidity, stability, and affordability of the U.S. housing markets by:
|
n
|
Modernizing and improving the efficiency of the mortgage markets, including reducing costs to lenders and borrowers;
|
|
n
|
Developing greater responsible access to mortgage credit; and
|
|
n
|
Reducing taxpayer exposure to our risks and subsidy to our returns.
|
For further information on our goals and detailed strategies for each of our business segments, see
MD&A — Our Business Segments
.
|
FREDDIE MAC
| 2018 Form 10-K
|
6
|
|
|
Introduction
|
Our Business
|
Our Charter
Our Charter forms the framework for our business activities. Our Charter Mission is to:
|
n
|
Provide stability in the secondary mortgage market for residential loans;
|
|
n
|
Respond appropriately to the private capital market;
|
|
n
|
Provide ongoing assistance to the secondary mortgage market for residential loans (including activities relating to loans for low- and moderate-income families, involving a reasonable economic return that may be less than the return earned on other activities) by increasing the liquidity of mortgage investments and improving the distribution of investment capital available for residential mortgage financing; and
|
|
n
|
Promote access to mortgage loan credit throughout the United States (including central cities, rural areas, and other underserved areas) by increasing the liquidity of mortgage investments and improving the distribution of investment capital available for residential mortgage financing.
|
Our Charter permits us to purchase first-lien single-family loans with LTV ratios at the time of our purchase of less than or equal to 80%. Our Charter also permits us to purchase first-lien single-family loans that do not meet this criterion if we have certain specified credit protections, which include mortgage insurance from a qualified insurer on the portion of the UPB of the loan that exceeds an 80% LTV ratio, a seller's agreement to repurchase or replace a defaulted loan, or the retention by the seller of at least a 10% participation interest in the loan.
This Charter requirement does not apply to multifamily loans or to loans that have the benefit of any guarantee, insurance, or other obligation by the United States or any of its agencies or instrumentalities (e.g., the FHA, VA, or USDA Rural Development). Additionally, as part of HARP and our Enhanced Relief Refinance
SM
program, we purchase single-family refinanced loans we currently own or guarantee without obtaining additional credit enhancement in excess of that already in place for any such loan, even when the LTV ratio of the new loan is above 80%.
Our Charter does not permit us to originate loans or lend money directly to mortgage borrowers in the primary mortgage market. Our Charter limits our purchase of single-family loans to the conforming loan market, which consists of loans originated with UPBs at or below limits determined annually based on changes in FHFA's housing price index. In most of the United States, the maximum conforming loan limit for a one-family residence has been set at $484,350 for 2019, an increase from $453,100 for 2018, $424,100 for 2017, and $417,000 from 2006 to 2016. Higher limits have been established in certain "high-cost" areas (for 2019, up to $726,525 for a one-family residence). Higher limits also apply to two- to four-family residences and to one- to four-family residences in Alaska, Guam, Hawaii, and the U.S. Virgin Islands.
Business Segments
We have three reportable segments: Single-family Guarantee, Multifamily, and Capital Markets. Certain activities that are not part of a reportable segment are included in the All Other category. For more information on our segments, see
MD&A - Our Business Segments
and
Note 13
.
|
FREDDIE MAC
| 2018 Form 10-K
|
7
|
|
|
Introduction
|
Our Business
|
Employees
At February 1, 2019, we had
6,600
full-time and
42
part-time employees.
Properties
Our principal offices consist of four office buildings we own in McLean, Virginia, comprising approximately 1.3 million square feet. We operate our business in the United States and its territories, and accordingly, we generate no revenue from and have no long-lived assets, other than financial instruments, in geographic locations other than the United States and its territories.
Available Information
We file reports and other information with the SEC. In view of the Conservator's succession to all of the voting power of our stockholders, we have not prepared or provided proxy statements for the solicitation of proxies from stockholders since we entered into conservatorship, and do not expect to do so while we remain in conservatorship. Pursuant to SEC rules, our annual reports on Form 10-K contain certain information typically provided in an annual proxy statement.
We make available, free of charge through our website at
www.freddiemac.com
, our annual reports on Form 10-K, quarterly reports on Form 10-Q, current reports on Form 8-K, and all other SEC reports and amendments to those reports as soon as reasonably practicable after we electronically file the material with the SEC. The SEC also maintains an internet site (www.sec.gov) that contains reports, proxy and information statements, and other information regarding companies that file electronically with the SEC.
We are providing our website addresses and the website address of the SEC here and elsewhere in this Form 10-K solely for your information. Information appearing on our website or on the SEC's website is not incorporated into this Form 10-K.
We provide disclosure about our debt securities on our website at
www.freddiemac.com/debt
. From this address, investors can access the offering circular and related supplements for debt securities offerings under Freddie Mac's global debt facility, including pricing supplements for individual issuances of debt securities. Similar information about our STACR
®
transactions and SCR notes is available at
crt.freddiemac.com
and
mf.freddiemac.com/investors
, respectively.
We provide disclosure about our mortgage-related securities, some of which are off-balance sheet obligations (e.g., K Certificates and SB Certificates), on our website at
www.freddiemac.com/mbs
. From this address, investors can access information and documents, including offering circulars and offering circular supplements, for mortgage-related securities offerings.
We provide additional information, including product descriptions, investor presentations, securities issuance calendars, transaction volumes and details, redemption notices, Freddie Mac research, and material developments or other events that may be important to investors, in each case as applicable, on the websites for our business segments, which can be found at
www.freddiemac.com/singlefamily
,
mf.freddiemac.com
, and
www.freddiemac.com/capital-markets
.
|
FREDDIE MAC
| 2018 Form 10-K
|
8
|
|
|
Introduction
|
Forward-Looking Statements
|
FORWARD-LOOKING STATEMENTS
We regularly communicate information concerning our business activities to investors, the news media, securities analysts, and others as part of our normal operations. Some of these communications, including this Form 10-K, contain "forward-looking statements." Examples of forward-looking statements include, but are not limited to, statements pertaining to the conservatorship, our current expectations and objectives for the Single-family Guarantee, Multifamily, and Capital Markets segments of our business, our efforts to assist the housing market, our liquidity and capital management, economic and market conditions and trends, our market share, the effect of legislative and regulatory developments and new accounting guidance, the credit quality of loans we own or guarantee, the costs and benefits of our credit risk transfer transactions, and our results of operations and financial condition on a GAAP, Segment Earnings, and fair value basis. Forward-looking statements involve known and unknown risks and uncertainties, some of which are beyond our control. Forward-looking statements are often accompanied by, and identified with, terms such as "could," "may," "will," "believe," "expect," "anticipate," "forecast," and similar phrases. These statements are not historical facts, but rather represent our expectations based on current information, plans, judgments, assumptions, estimates, and projections. Actual results may differ significantly from those described in or implied by such forward-looking statements due to various factors and uncertainties, including those described in the
Risk Factors
section of this Form 10-K and:
|
n
|
The actions the U.S. government (including FHFA, Treasury, and Congress) may take, or require us to take, including to support the housing markets or to implement FHFA's Conservatorship Scorecards and other objectives for us;
|
|
n
|
The effect of the restrictions on our business due to the conservatorship and the Purchase Agreement, including our dividend requirement on the senior preferred stock;
|
|
n
|
Changes in our Charter or in applicable legislative or regulatory requirements (including any legislation affecting the future status of our company);
|
|
n
|
Changes in the fiscal and monetary policies of the Federal Reserve, including the balance sheet normalization program to reduce the Federal Reserve's holdings of mortgage-related securities;
|
|
n
|
Changes in tax laws;
|
|
n
|
Changes in accounting policies, practices, or guidance (e.g., FASB's accounting standards update related to the measurement of credit losses of financial instruments);
|
|
n
|
Changes in economic and market conditions, including changes in employment rates, interest rates, spreads, and home prices;
|
|
n
|
Changes in the U.S. residential mortgage market, including changes in the supply and type of loan products (e.g., refinance vs. purchase and fixed-rate vs. ARM);
|
|
n
|
The success of our efforts to mitigate our losses on our legacy and relief refinance single-family loan portfolio;
|
|
n
|
The success of our strategy to transfer mortgage credit risk through STACR debt note, STACR Trust, ACIS
®
, K Certificate, SB Certificate, and other credit risk transfer transactions;
|
|
n
|
Our ability to maintain adequate liquidity to fund our operations;
|
|
n
|
Our ability to maintain the security and resiliency of our operational systems and infrastructure, including against cyberattacks;
|
|
n
|
Our ability to effectively execute our business strategies, implement new initiatives, and improve
|
|
FREDDIE MAC
| 2018 Form 10-K
|
9
|
|
|
Introduction
|
Forward-Looking Statements
|
efficiency;
|
n
|
The adequacy of our risk management framework, including the adequacy of the CCF and our internal capital methodologies for measuring risk;
|
|
n
|
Our ability to manage mortgage credit risk, including the effect of changes in underwriting and servicing practices;
|
|
n
|
Our ability to limit or manage our economic exposure and GAAP earnings exposure to interest-rate volatility and spread volatility, including the availability of derivative financial instruments needed for interest-rate risk management purposes;
|
|
n
|
Our operational ability to issue new securities, make timely and correct payments on securities, and provide initial and ongoing disclosures;
|
|
n
|
Our reliance on CSS and the CSP for the operation of the majority of our single-family securitization activities;
|
|
n
|
Changes or errors in the methodologies, models, assumptions, and estimates we use to prepare our financial statements, make business decisions, and manage risks;
|
|
n
|
Changes in investor demand for our debt or mortgage-related securities;
|
|
n
|
Changes in the practices of loan originators, servicers, investors, and other participants in the secondary mortgage market;
|
|
n
|
The occurrence of a major natural or other disaster in areas in which our offices or significant portions of our total mortgage portfolio are located; and
|
n
Other factors and assumptions described in this Form 10-K, including in the
MD&A
section.
Forward-looking statements are made only as of the date of this Form 10-K, and we undertake no obligation to update any forward-looking statements we make to reflect events or circumstances occurring after the date of this Form 10-K.
|
FREDDIE MAC
| 2018 Form 10-K
|
10
|
|
|
Selected Financial Data
|
Selected Financial Data
The selected financial data presented below should be reviewed in conjunction with
MD&A
and our consolidated financial statements and accompanying notes.
Table 1 - Selected Financial Data
|
As of or For the Year Ended December 31,
|
||||||||||||||||
|
(Dollars in millions,
except share-related amounts
)
|
2018
|
2017
|
2016
|
2015
|
2014
|
|||||||||||
|
Statements of Comprehensive Income Data
|
||||||||||||||||
|
Net interest income
|
|
$12,021
|
|
|
$14,164
|
|
|
$14,379
|
|
|
$14,946
|
|
|
$14,263
|
|
|
|
Benefit (provision) for credit losses
|
736
|
|
84
|
|
803
|
|
2,665
|
|
(58
|
)
|
||||||
|
Non-interest income (loss)
|
3,544
|
|
6,869
|
|
500
|
|
(3,599
|
)
|
(113
|
)
|
||||||
|
Non-interest expense
|
(4,827
|
)
|
(4,283
|
)
|
(4,043
|
)
|
(4,738
|
)
|
(3,090
|
)
|
||||||
|
Income tax (expense) benefit
|
(2,239
|
)
|
(11,209
|
)
|
(3,824
|
)
|
(2,898
|
)
|
(3,312
|
)
|
||||||
|
Net income
|
9,235
|
|
5,625
|
|
7,815
|
|
6,376
|
|
7,690
|
|
||||||
|
Comprehensive income
|
8,622
|
|
5,558
|
|
7,118
|
|
5,799
|
|
9,426
|
|
||||||
|
Net income (loss) attributable to common stockholders
|
3,612
|
|
(3,244
|
)
|
97
|
|
(23
|
)
|
(2,336
|
)
|
||||||
|
Net income (loss) per common share - basic and diluted
|
1.12
|
|
(1.00
|
)
|
0.03
|
|
(0.01
|
)
|
(0.72
|
)
|
||||||
|
Cash dividends per common share
|
—
|
|
—
|
|
—
|
|
—
|
|
—
|
|
||||||
|
Balance Sheets Data
|
||||||||||||||||
|
Loans held-for-investment, at amortized cost by consolidated trusts (net of allowances for loan losses)
|
|
$1,842,850
|
|
|
$1,774,286
|
|
|
$1,690,218
|
|
|
$1,625,184
|
|
|
$1,558,094
|
|
|
|
Total assets
|
2,063,060
|
|
2,049,776
|
|
2,023,376
|
|
1,985,892
|
|
1,945,360
|
|
||||||
|
Debt securities of consolidated trusts held by third parties
|
1,792,677
|
|
1,720,996
|
|
1,648,683
|
|
1,556,121
|
|
1,479,473
|
|
||||||
|
Other debt
|
252,273
|
|
313,634
|
|
353,321
|
|
414,148
|
|
449,890
|
|
||||||
|
All other liabilities
|
13,633
|
|
15,458
|
|
16,297
|
|
12,683
|
|
13,346
|
|
||||||
|
Total stockholders' equity
|
4,477
|
|
(312
|
)
|
5,075
|
|
2,940
|
|
2,651
|
|
||||||
|
Portfolio Balances - UPB
|
||||||||||||||||
|
Total guarantee portfolio
|
|
$2,133,510
|
|
|
$2,031,955
|
|
|
$1,912,717
|
|
|
$1,821,896
|
|
|
$1,756,283
|
|
|
|
Mortgage-related investments portfolio
|
218,080
|
|
253,455
|
|
298,426
|
|
346,911
|
|
408,414
|
|
||||||
|
Other investments portfolio
|
62,917
|
|
89,955
|
|
95,041
|
|
100,913
|
|
78,037
|
|
||||||
|
TDRs on accrual status
|
41,914
|
|
51,720
|
|
77,399
|
|
82,347
|
|
82,908
|
|
||||||
|
Non-accrual loans
|
11,217
|
|
17,817
|
|
16,272
|
|
22,649
|
|
33,130
|
|
||||||
|
Ratios
|
||||||||||||||||
|
Return on average assets
|
0.4
|
%
|
0.3
|
%
|
0.4
|
%
|
0.3
|
%
|
0.4
|
%
|
||||||
|
Allowance for loan losses as percentage of loans, held-for-investment
|
0.3
|
|
0.5
|
|
0.7
|
|
0.9
|
|
1.3
|
|
||||||
|
FREDDIE MAC
| 2018 Form 10-K
|
11
|
|
|
Management's Discussion and Analysis
|
Key Economic Indicators
|
Management's Discussion and Analysis of Financial Condition and Results of Operations
KEY ECONOMIC INDICATORS
The following graphs and related discussion present certain macroeconomic indicators that can significantly affect our business and financial results.
Single-Family Home Prices
National Home Prices

|
n
|
Changes in home prices affect the amount of equity that borrowers have in their homes. Borrowers with less equity typically have higher delinquency rates. As home prices decline, the severity of losses we incur on defaulted loans that we hold or guarantee increases because the amount we can recover from the property securing the loan decreases.
|
|
n
|
Home prices continued to appreciate during 2018, increasing 4.7%, compared to an increase of 7.2% during 2017. We expect home price growth will continue in 2019, although at a slower pace than in 2018, due to increased supply and higher mortgage interest rates.
|
|
n
|
Home price appreciation continued to drive growth in mortgage debt outstanding and declines in single-family serious delinquency rates in the U.S. mortgage markets during 2018.
|
|
FREDDIE MAC
| 2018 Form 10-K
|
12
|
|
|
Management's Discussion and Analysis
|
Key Economic Indicators
|
Interest Rates
Key Market Interest Rates


|
n
|
The 30-year Primary Mortgage Market Survey (PMMS) interest rate is indicative of what a consumer could expect to be offered on a first-lien prime conventional conforming home purchase or refinance mortgage with an LTV of 80%. Increases (decreases) in the PMMS rate typically result in decreases (increases) in refinancing activity and originations.
|
|
n
|
Higher average mortgage interest rates drove a decline in origination volumes, especially refinance volume, during 2018.
|
|
n
|
Changes in the 10-year and 2-year LIBOR interest rates affect the fair value of certain of our assets and liabilities, including derivatives, measured at fair value. Changes in the 3-month LIBOR rate affect the interest earned on our short-term investments and interest expense on our short-term funding. For additional information on the effect of LIBOR rates on our financial results, see
Our Business Segments - Capital Markets -
Market Conditions
.
|
|
FREDDIE MAC
| 2018 Form 10-K
|
13
|
|
|
Management's Discussion and Analysis
|
Key Economic Indicators
|
Unemployment Rate
Unemployment Rate and Job Creation
(1)

Source: U.S. Bureau of Labor Statistics
(1) Excludes Puerto Rico and the U.S. Virgin Islands.
|
n
|
Changes in the national unemployment rate can affect several market factors, including the demand for both single-family and multifamily housing and the level of loan delinquencies.
|
|
n
|
Continued job growth, a declining unemployment rate, and generally favorable economic conditions resulted in strong credit quality and declining serious delinquency rates in 2018.
|
|
FREDDIE MAC
| 2018 Form 10-K
|
14
|
|
|
Management's Discussion and Analysis
|
Consolidated Results of Operations
|
CONSOLIDATED RESULTS OF OPERATIONS
You should read this discussion of our consolidated results of operations in conjunction with our consolidated financial statements and accompanying notes.
The table below compares our consolidated results of operations for the past three years.
Table 2 - Summary of Consolidated Statements of Comprehensive Income (Loss)
|
Year Over Year Change
|
||||||||||||||||||||||
|
Year Ended December 31,
|
2018 vs. 2017
|
2017 vs. 2016
|
||||||||||||||||||||
|
(Dollars in millions)
|
2018
|
2017
|
2016
|
$
|
%
|
$
|
%
|
|||||||||||||||
|
Net interest income
|
|
$12,021
|
|
|
$14,164
|
|
|
$14,379
|
|
|
($2,143
|
)
|
(15
|
)%
|
|
($215
|
)
|
(1
|
)%
|
|||
|
Benefit (provision) for credit losses
|
736
|
|
84
|
|
803
|
|
652
|
|
776
|
|
(719
|
)
|
(90
|
)
|
||||||||
|
Net interest income after benefit (provision) for credit losses
|
12,757
|
|
14,248
|
|
15,182
|
|
(1,491
|
)
|
(10
|
)
|
(934
|
)
|
(6
|
)
|
||||||||
|
Non-interest income (loss):
|
|
|
|
|
|
|
|
|
||||||||||||||
|
Guarantee fee income
|
811
|
|
662
|
|
513
|
|
149
|
|
23
|
|
149
|
|
29
|
|
||||||||
|
Mortgage loans gains (losses)
|
724
|
|
2,026
|
|
200
|
|
(1,302
|
)
|
(64
|
)
|
1,826
|
|
913
|
|
||||||||
|
Investment securities gains (losses)
|
(695
|
)
|
1,036
|
|
(269
|
)
|
(1,731
|
)
|
(167
|
)
|
1,305
|
|
485
|
|
||||||||
|
Debt gains (losses)
|
720
|
|
151
|
|
(473
|
)
|
569
|
|
377
|
|
624
|
|
132
|
|
||||||||
|
Derivative gains (losses)
|
1,270
|
|
(1,988
|
)
|
(274
|
)
|
3,258
|
|
164
|
|
(1,714
|
)
|
(626
|
)
|
||||||||
|
Other income (loss)
|
714
|
|
4,982
|
|
803
|
|
(4,268
|
)
|
(86
|
)
|
4,179
|
|
520
|
|
||||||||
|
Total non-interest income (loss)
|
3,544
|
|
6,869
|
|
500
|
|
(3,325
|
)
|
(48
|
)
|
6,369
|
|
1,274
|
|
||||||||
|
Non-interest expense:
|
|
|
|
|
|
|
|
|
||||||||||||||
|
Administrative expense
|
(2,293
|
)
|
(2,106
|
)
|
(2,005
|
)
|
(187
|
)
|
(9
|
)
|
(101
|
)
|
(5
|
)
|
||||||||
|
Real estate owned operations expense
|
(169
|
)
|
(189
|
)
|
(287
|
)
|
20
|
|
11
|
|
98
|
|
34
|
|
||||||||
|
Temporary Payroll Tax Cut Continuation Act of 2011 expense
|
(1,484
|
)
|
(1,340
|
)
|
(1,152
|
)
|
(144
|
)
|
(11
|
)
|
(188
|
)
|
(16
|
)
|
||||||||
|
Other expense
|
(881
|
)
|
(648
|
)
|
(599
|
)
|
(233
|
)
|
(36
|
)
|
(49
|
)
|
(8
|
)
|
||||||||
|
Total non-interest expense
|
(4,827
|
)
|
(4,283
|
)
|
(4,043
|
)
|
(544
|
)
|
(13
|
)
|
(240
|
)
|
(6
|
)
|
||||||||
|
Income before income tax (expense) benefit
|
11,474
|
|
16,834
|
|
11,639
|
|
(5,360
|
)
|
(32
|
)
|
5,195
|
|
45
|
|
||||||||
|
Income tax (expense) benefit
|
(2,239
|
)
|
(11,209
|
)
|
(3,824
|
)
|
8,970
|
|
80
|
|
(7,385
|
)
|
(193
|
)
|
||||||||
|
Net income (loss)
|
9,235
|
|
5,625
|
|
7,815
|
|
3,610
|
|
64
|
|
(2,190
|
)
|
(28
|
)
|
||||||||
|
Total other comprehensive income (loss), net of taxes and reclassification adjustments
|
(613
|
)
|
(67
|
)
|
(697
|
)
|
(546
|
)
|
(815
|
)
|
630
|
|
90
|
|
||||||||
|
Comprehensive income (loss)
|
|
$8,622
|
|
|
$5,558
|
|
|
$7,118
|
|
|
$3,064
|
|
55
|
%
|
|
($1,560
|
)
|
(22
|
)%
|
|||
See
Critical Accounting Policies and Estimates
for information concerning certain significant accounting policies and estimates applied in determining our reported results of operations and
Note 1
for information on our accounting policies and a summary of other significant accounting policies and the related notes in which information about them can be found.
|
FREDDIE MAC
| 2018 Form 10-K
|
15
|
|
|
Management's Discussion and Analysis
|
Consolidated Results of Operations
|
Net Interest Income
Net interest income consists of several primary components:
|
n
|
Contractual net interest income
- consists of two components:
|
|
l
|
Guarantee fees on debt securities issued by consolidated trusts. We record interest income on loans held by consolidated trusts and interest expense on the debt securities issued by the trusts. The difference between the interest income on the loans and the interest expense on the debt represents the guarantee fee income we receive as compensation for our guarantee of the principal and interest payments of the issued debt securities. This difference includes the legislated 10 basis point increase in guarantee fees that is remitted to Treasury as part of the Temporary Payroll Tax Cut Continuation Act of 2011 and
|
|
l
|
The difference between the interest income earned on all other interest-earning assets, excluding loans held by consolidated trusts, and the interest expense incurred on the liabilities used to fund those assets.
|
Contractual net interest income is driven by the volume of assets in the mortgage-related investments portfolio and the interest rate differential between those interest-earning assets and the related interest-bearing liabilities.
|
n
|
Amortization of cost basis adjustments
- consists of cost basis adjustments, such as premiums and discounts on loans, investment securities, and debt, that are amortized into interest income or interest expense based on the effective yield over the contractual life of the associated financial instrument.
|
The largest portion of our total net amortization relates to loans and debt securities of consolidated trusts and includes amortization of the upfront fees we receive when we acquire a loan. Amortization related to other assets, including investment securities and unsecuritized mortgage loans, and other debt makes up a smaller portion.
The net amortization of loans and debt securities of consolidated trusts is primarily driven by actual prepayments on the underlying loans. Increases in actual prepayments result in higher net amortization, while decreases in actual prepayments result in lower net amortization. The timing of amortization of loans may differ from the timing of amortization of the securities backed by the loans, as the proceeds from the loans backing these securities are remitted to the security holders at a date subsequent to the date these proceeds are received by us.
|
n
|
Hedge accounting impact
- consists of two components:
|
|
l
|
Deferred gains and losses on closed cash flow hedges related to forecasted debt issuances that are reclassified from AOCI to net interest income when the related forecasted transaction affects net interest income and
|
|
l
|
Fair value changes for the hedging instrument, including the accrual of periodic cash settlements, and fair value changes for the hedged item attributable to the risk being hedged for qualifying fair value hedge relationships, due to the adoption of amended hedge accounting guidance in 4Q 2017. See
Note 9
for additional detail on this change.
|
|
FREDDIE MAC
| 2018 Form 10-K
|
16
|
|
|
Management's Discussion and Analysis
|
Consolidated Results of Operations
|
The table below presents the components of net interest income.
Table 3 - Components of Net Interest Income
|
Year Over Year Change
|
||||||||||||||||||||||
|
Year Ended December 31,
|
2018 vs. 2017
|
2017 vs. 2016
|
||||||||||||||||||||
|
(Dollars in millions)
|
2018
|
2017
|
2016
|
$
|
%
|
$
|
%
|
|||||||||||||||
|
Contractual net interest income:
|
||||||||||||||||||||||
|
Guarantee fee income
|
|
$3,457
|
|
|
$3,270
|
|
|
$2,997
|
|
|
$187
|
|
6
|
%
|
|
$273
|
|
9
|
%
|
|||
|
Guarantee fee income related to the Temporary Payroll Tax Cut Continuation Act of 2011
|
1,438
|
|
1,314
|
|
1,142
|
|
124
|
|
9
|
|
172
|
|
15
|
|
||||||||
|
Other contractual net interest income
|
5,472
|
|
6,400
|
|
6,896
|
|
(928
|
)
|
(15
|
)
|
(496
|
)
|
(7
|
)
|
||||||||
|
Total contractual net interest income
|
10,367
|
|
10,984
|
|
11,035
|
|
(617
|
)
|
(6
|
)
|
(51
|
)
|
—
|
|
||||||||
|
Net amortization - loans and debt securities of consolidated trusts
|
2,900
|
|
3,258
|
|
3,333
|
|
(358
|
)
|
(11
|
)
|
(75
|
)
|
(2
|
)
|
||||||||
|
Net amortization - other assets and other debt
|
(315
|
)
|
(85
|
)
|
202
|
|
(230
|
)
|
(271
|
)
|
(287
|
)
|
(142
|
)
|
||||||||
|
Hedge accounting impact
|
(931
|
)
|
7
|
|
(191
|
)
|
(938
|
)
|
(13,400
|
)
|
198
|
|
104
|
|
||||||||
|
Net interest income
|
|
$12,021
|
|
|
$14,164
|
|
|
$14,379
|
|
|
($2,143
|
)
|
(15
|
)%
|
|
($215
|
)
|
(1
|
)%
|
|||
Key Drivers:
|
n
|
Guarantee fee income
|
|
l
|
2018 vs. 2017
- Increased
primarily due to the continued growth of the core single-family loan portfolio.
|
|
l
|
2017 vs. 2016
- Increased as a result of higher average contractual guarantee fee rates, as well as the continued growth in the size of the core single-family loan portfolio. Average contractual guarantee fees are generally higher on mortgage loans in our core single-family loan portfolio compared to those in our legacy and relief refinance single-family loan portfolio.
|
|
n
|
Other contractual net interest income
|
|
l
|
2018 vs. 2017 and 2017 vs. 2016
- Decreased during both comparative periods primarily due to the continued reduction in the balance of our mortgage-related investments portfolio, pursuant to the portfolio limits established by the Purchase Agreement and FHFA. See
Conservatorship and Related Matters -
Limits on Our Mortgage-Related Investments Portfolio and Indebtedness
for additional discussion of the limits on the mortgage-related investments portfolio.
|
|
n
|
Net amortization of loans and debt securities of consolidated trusts
|
|
l
|
2018 vs. 2017
- Decreased primarily driven by lower prepayments as a result of higher interest rates, partially offset by an increase in amortization from higher upfront fees on mortgage loans.
|
|
n
|
Net amortization of other assets and other debt
|
|
l
|
2018 vs. 2017
-
Increased primarily due to lower accretion related to unsecuritized mortgage loans, as certain of those loans were reclassified from held-for-investment to held-for-sale and ceased amortizing, and previously recognized other-than-temporary impairments, due to a decline in the population of impaired securities.
|
|
FREDDIE MAC
| 2018 Form 10-K
|
17
|
|
|
Management's Discussion and Analysis
|
Consolidated Results of Operations
|
|
l
|
2017 vs. 2016
- decreased due to lower accretion related to previously recognized other-than-temporary impairments due to a decline in the population of impaired securities.
|
|
n
|
Hedge accounting impact
|
|
l
|
2018 vs. 2017 and 2017 vs. 2016
- affected both comparative periods primarily due to the inclusion of fair value hedge accounting results within net interest income beginning in 4Q 2017, due to the adoption of amended hedge accounting guidance. In prior periods, this activity was included in other income and derivative gains (losses).
|
|
FREDDIE MAC
| 2018 Form 10-K
|
18
|
|
|
Management's Discussion and Analysis
|
Consolidated Results of Operations
|
Net Interest Yield Analysis
The table below presents an analysis of interest-earning assets and interest-bearing liabilities. To calculate the average balances, we generally use a daily weighted average of amortized cost. When daily average balance information is not available, such as for mortgage loans, we use monthly averages. Mortgage loans on non-accrual status, where interest income is generally recognized when collected, are included in the average balances.
Table 4 - Analysis of Net Interest Yield
|
|
Year Ended December 31,
|
||||||||||||||||||||||||||
|
|
2018
|
2017
|
2016
|
||||||||||||||||||||||||
|
(Dollars in millions)
|
Average
Balance
|
Interest
Income
(Expense)
|
Average
Rate
|
Average
Balance
|
Interest
Income
(Expense)
|
Average
Rate
|
Average
Balance
|
Interest
Income
(Expense)
|
Average
Rate
|
||||||||||||||||||
|
Interest-earning assets:
|
|||||||||||||||||||||||||||
|
Cash and cash equivalents
|
|
$7,189
|
|
|
$67
|
|
0.93
|
%
|
|
$10,965
|
|
|
$48
|
|
0.44
|
%
|
|
$16,932
|
|
|
$42
|
|
0.25
|
%
|
|||
|
Securities purchased under agreements to resell
|
45,360
|
|
880
|
|
1.94
|
|
57,883
|
|
588
|
|
1.02
|
|
59,639
|
|
217
|
|
0.36
|
|
|||||||||
|
Secured lending
|
1,350
|
|
35
|
|
2.58
|
|
859
|
|
21
|
|
2.42
|
|
484
|
|
11
|
|
2.28
|
|
|||||||||
|
Mortgage-related securities:
|
|||||||||||||||||||||||||||
|
Mortgage-related securities
|
143,424
|
|
6,026
|
|
4.20
|
|
164,663
|
|
6,402
|
|
3.89
|
|
189,982
|
|
7,262
|
|
3.82
|
|
|||||||||
|
Extinguishment of PCs held by Freddie Mac
|
(88,757
|
)
|
(3,437
|
)
|
(3.87
|
)
|
(87,665
|
)
|
(3,264
|
)
|
(3.72
|
)
|
(94,624
|
)
|
(3,509
|
)
|
(3.71
|
)
|
|||||||||
|
Total mortgage-related securities, net
|
54,667
|
|
2,589
|
|
4.74
|
|
76,998
|
|
3,138
|
|
4.08
|
|
95,358
|
|
3,753
|
|
3.94
|
|
|||||||||
|
Non-mortgage-related securities
|
18,955
|
|
446
|
|
2.35
|
|
17,558
|
|
277
|
|
1.58
|
|
15,734
|
|
102
|
|
0.65
|
|
|||||||||
|
Loans held by consolidated trusts
(1)
|
1,799,122
|
|
61,883
|
|
3.44
|
|
1,730,000
|
|
58,746
|
|
3.40
|
|
1,649,727
|
|
55,417
|
|
3.36
|
|
|||||||||
|
Loans held by Freddie Mac
(1)
|
98,005
|
|
4,154
|
|
4.24
|
|
117,043
|
|
4,989
|
|
4.26
|
|
135,882
|
|
5,623
|
|
4.14
|
|
|||||||||
|
Total interest-earning assets
|
2,024,648
|
|
70,054
|
|
3.46
|
|
2,011,306
|
|
67,807
|
|
3.37
|
|
1,973,756
|
|
65,165
|
|
3.30
|
|
|||||||||
|
Interest-bearing liabilities:
|
|||||||||||||||||||||||||||
|
Debt securities of consolidated trusts including PCs held by Freddie Mac
|
1,826,429
|
|
(54,966
|
)
|
(3.01
|
)
|
1,753,983
|
|
(50,920
|
)
|
(2.90
|
)
|
1,674,474
|
|
(48,108
|
)
|
(2.87
|
)
|
|||||||||
|
Extinguishment of PCs held by Freddie Mac
|
(88,757
|
)
|
3,437
|
|
3.87
|
|
(87,665
|
)
|
3,264
|
|
3.72
|
|
(94,624
|
)
|
3,509
|
|
3.71
|
|
|||||||||
|
Total debt securities of consolidated trusts held by third parties
|
1,737,672
|
|
(51,529
|
)
|
(2.97
|
)
|
1,666,318
|
|
(47,656
|
)
|
(2.86
|
)
|
1,579,850
|
|
(44,599
|
)
|
(2.82
|
)
|
|||||||||
|
Other debt:
|
|||||||||||||||||||||||||||
|
Short-term debt
|
62,893
|
|
(1,193
|
)
|
(1.90
|
)
|
72,071
|
|
(615
|
)
|
(0.85
|
)
|
86,284
|
|
(350
|
)
|
(0.41
|
)
|
|||||||||
|
Long-term debt
|
216,484
|
|
(5,311
|
)
|
(2.45
|
)
|
264,354
|
|
(5,372
|
)
|
(2.03
|
)
|
298,040
|
|
(5,837
|
)
|
(1.96
|
)
|
|||||||||
|
Total other debt
|
279,377
|
|
(6,504
|
)
|
(2.33
|
)
|
336,425
|
|
(5,987
|
)
|
(1.78
|
)
|
384,324
|
|
(6,187
|
)
|
(1.61
|
)
|
|||||||||
|
Total interest-bearing liabilities
|
2,017,049
|
|
(58,033
|
)
|
(2.88
|
)
|
2,002,743
|
|
(53,643
|
)
|
(2.68
|
)
|
1,964,174
|
|
(50,786
|
)
|
(2.58
|
)
|
|||||||||
|
Impact of net non-interest-bearing funding
|
7,599
|
|
—
|
|
0.01
|
|
8,563
|
|
—
|
|
0.01
|
|
9,582
|
|
—
|
|
0.01
|
|
|||||||||
|
Total funding of interest-earning assets
|
|
$2,024,648
|
|
|
($58,033
|
)
|
(2.87
|
)%
|
|
$2,011,306
|
|
|
($53,643
|
)
|
(2.67
|
)%
|
|
$1,973,756
|
|
|
($50,786
|
)
|
(2.57
|
)%
|
|||
|
Net interest income/yield
|
|
$12,021
|
|
0.59
|
%
|
|
$14,164
|
|
0.70
|
%
|
|
$14,379
|
|
0.73
|
%
|
||||||||||||
|
(1)
|
Loan fees, primarily consisting of amortization of upfront fees, included in interest income were $2.6 billion, $2.4 billion, and $2.6 billion for loans held by consolidated trusts and $104 million, $162 million, and $215 million for loans held by Freddie Mac during 2018, 2017, and 2016, respectively.
|
|
FREDDIE MAC
| 2018 Form 10-K
|
19
|
|
|
Management's Discussion and Analysis
|
Consolidated Results of Operations
|
Net Interest Income Rate / Volume Analysis
The table below presents a rate and volume analysis of our net interest income. Our net interest income reflects the reversal of interest income accrued, net of interest received on a cash basis, related to mortgage loans that are on non-accrual status.
Table 5 - Net Interest Income Rate / Volume Analysis
|
Variance Analysis
|
||||||||||||||||||||
|
2018 vs. 2017
|
2017 vs. 2016
|
|||||||||||||||||||
|
(Dollars in millions)
|
Rate
|
Volume
|
Total Change
|
Rate
|
Volume
|
Total Change
|
||||||||||||||
|
Interest-earning assets:
|
||||||||||||||||||||
|
Cash and cash equivalents
|
|
$45
|
|
|
($26
|
)
|
|
$19
|
|
|
$8
|
|
|
($2
|
)
|
|
$6
|
|
||
|
Securities purchased under agreements to resell
|
443
|
|
(151
|
)
|
292
|
|
380
|
|
(9
|
)
|
371
|
|
||||||||
|
Secured lending
|
1
|
|
13
|
|
14
|
|
1
|
|
9
|
|
10
|
|
||||||||
|
Mortgage-related securities:
|
||||||||||||||||||||
|
Mortgage-related securities
|
491
|
|
(867
|
)
|
(376
|
)
|
123
|
|
(983
|
)
|
(860
|
)
|
||||||||
|
Extinguishment of PCs held by Freddie Mac
|
(132
|
)
|
(41
|
)
|
(173
|
)
|
(14
|
)
|
259
|
|
245
|
|
||||||||
|
Total mortgage-related securities, net
|
359
|
|
(908
|
)
|
(549
|
)
|
109
|
|
(724
|
)
|
(615
|
)
|
||||||||
|
Non-mortgage-related securities
|
146
|
|
23
|
|
169
|
|
161
|
|
14
|
|
175
|
|
||||||||
|
Loans held by consolidated trusts
|
767
|
|
2,370
|
|
3,137
|
|
609
|
|
2,720
|
|
3,329
|
|
||||||||
|
Loans held by Freddie Mac
|
(28
|
)
|
(807
|
)
|
(835
|
)
|
165
|
|
(799
|
)
|
(634
|
)
|
||||||||
|
Total interest-earning assets
|
1,733
|
|
514
|
|
2,247
|
|
1,433
|
|
1,209
|
|
2,642
|
|
||||||||
|
Interest-bearing liabilities:
|
||||||||||||||||||||
|
Debt securities of consolidated trusts including PCs held by Freddie Mac
|
(1,902
|
)
|
(2,144
|
)
|
(4,046
|
)
|
(508
|
)
|
(2,304
|
)
|
(2,812
|
)
|
||||||||
|
Extinguishment of PCs held by Freddie Mac
|
132
|
|
41
|
|
173
|
|
14
|
|
(259
|
)
|
(245
|
)
|
||||||||
|
Total debt securities of consolidated trusts held by third parties
|
(1,770
|
)
|
(2,103
|
)
|
(3,873
|
)
|
(494
|
)
|
(2,563
|
)
|
(3,057
|
)
|
||||||||
|
Other debt:
|
||||||||||||||||||||
|
Short-term debt
|
(665
|
)
|
87
|
|
(578
|
)
|
(331
|
)
|
66
|
|
(265
|
)
|
||||||||
|
Long-term debt
|
(1,005
|
)
|
1,066
|
|
61
|
|
(214
|
)
|
679
|
|
465
|
|
||||||||
|
Total other debt
|
(1,670
|
)
|
1,153
|
|
(517
|
)
|
(545
|
)
|
745
|
|
200
|
|
||||||||
|
Total interest-bearing liabilities
|
(3,440
|
)
|
(950
|
)
|
(4,390
|
)
|
(1,039
|
)
|
(1,818
|
)
|
(2,857
|
)
|
||||||||
|
Net interest income
|
|
($1,707
|
)
|
|
($436
|
)
|
|
($2,143
|
)
|
|
|
$394
|
|
|
($609
|
)
|
|
($215
|
)
|
|
Benefit (Provision) for Credit Losses
|
n
|
2018 vs. 2017
- Increased benefit for credit losses during 2018, primarily driven by estimated losses from the hurricanes in 2017.
|
|
n
|
2017 vs. 2016
- Decline in benefit for credit losses in 2017 compared to 2016 primarily driven by:
|
|
l
|
The negative effects of the hurricanes in 2017;
|
|
l
|
Decrease in the accretion of TDR concessions due to a significant increase in the reclassification of reperforming loans from held-for-investment to held-for-sale; and
|
|
l
|
Change in accounting policy that was elected on January 1, 2017 for loan reclassification from held-for-investment to held-for-sale. See
Note 4
for further information about this change.
|
The decline was partially offset by improvement in our estimated loss severity.
|
FREDDIE MAC
| 2018 Form 10-K
|
20
|
|
|
Management's Discussion and Analysis
|
Consolidated Results of Operations
|
Guarantee Fee Income
Guarantee fee income consists of guarantee fees earned from guarantees to third parties and securitization trusts that we do not consolidate, and relates primarily to multifamily securitizations. For additional details, see
Our Business Segments -
Multifamily - Securitization, Guarantee, and Other Risk Transfer Products
.
|
n
|
2018 vs. 2017 and 2017 vs. 2016
- Increased due to the continued growth in the multifamily guarantee portfolio.
|
Mortgage Loans Gains (Losses)
Mortgage loans gains (losses) consists of the following:
|
n
|
Gains (losses) on certain mortgage loan purchase commitments
- represents the change in fair value between the commitment date and settlement date for certain multifamily loan purchase commitments for which we have elected the fair value option.
|
|
n
|
Gains (losses) on mortgage loans
- includes changes in fair value on held-for-sale loans, and loans for which we have elected the fair value option while held in our mortgage-related investments portfolio, as well as any gains and losses on the sales of these loans.
|
Mortgage loans gains (losses) are affected by a number of factors, including:
|
n
|
Volume of held-for-sale single-family seasoned mortgage loans;
|
|
n
|
Volume of multifamily loan purchase commitments and mortgage loans for which we have elected the fair value option; and
|
|
n
|
Changes in interest rates and market spreads.
|
The table below presents the components of mortgage loans gains (losses).
Table 6 - Components of Mortgage Loans Gains (Losses)
|
Year Over Year Change
|
||||||||||||||||||||||
|
Year Ended December 31,
|
2018 vs. 2017
|
2017 vs. 2016
|
||||||||||||||||||||
|
(Dollars in millions)
|
2018
|
2017
|
2016
|
$
|
%
|
$
|
%
|
|||||||||||||||
|
Gains (losses) on certain loan purchase commitments
|
|
$777
|
|
|
$1,098
|
|
|
$663
|
|
|
($321
|
)
|
(29
|
)%
|
|
$435
|
|
66
|
%
|
|||
|
Gains (losses) on mortgage loans
|
(53
|
)
|
928
|
|
(463
|
)
|
(981
|
)
|
(106
|
)
|
1,391
|
|
300
|
|
||||||||
|
Mortgage loans gains (losses)
|
|
$724
|
|
|
$2,026
|
|
|
$200
|
|
|
($1,302
|
)
|
(64
|
)%
|
|
$1,826
|
|
913
|
%
|
|||
Key Drivers:
n
2018 vs. 2017
- Gains decreased due to fair value losses on multifamily mortgage loans and commitments as a result of spread widening, coupled with higher fair value losses on single-family seasoned loans.
n
2017 vs. 2016
- Gains increased due to:
|
l
|
Higher average balances of multifamily held-for-sale commitments driven by strong demand for multifamily loan products;
|
|
l
|
Higher volume of single-family reperforming loan sales; and
|
|
l
|
Lower losses recognized on the reclassification of seriously delinquent loans from held-for-investment to held-for-sale as a result of an accounting policy change. See
Note 4
for more information.
|
|
FREDDIE MAC
| 2018 Form 10-K
|
21
|
|
|
Management's Discussion and Analysis
|
Consolidated Results of Operations
|
Investment Securities Gains (Losses)
Investment securities gains (losses) consists of the following:
|
n
|
Net impairment of available-for-sale-securities recognized in earnings
- includes the portion of other-than-temporary impairment on available-for-sale securities recognized in earnings.
|
|
n
|
Other gains (losses) on investment securities recognized in earnings
- includes fair value gains and losses recognized on trading securities and the realized gains and losses on the sale of available-for-sale securities.
|
Investment securities gains (losses) are affected by a number of factors, including:
|
n
|
Volume of sales of our available-for-sale securities;
|
|
n
|
Volume of available-for-sale securities deemed to be other-than-temporarily impaired and the amount of the impairment; and
|
|
n
|
Changes in interest rates and market spreads.
|
The table below presents the components of investment securities gains (losses).
Table 7 - Components of Investment Securities Gains (Losses)
|
Year Over Year Change
|
||||||||||||||||||||||
|
Year Ended December 31,
|
2018 vs. 2017
|
2017 vs. 2016
|
||||||||||||||||||||
|
(Dollars in millions)
|
2018
|
2017
|
2016
|
$
|
%
|
$
|
%
|
|||||||||||||||
|
Net impairment of available-for-sale securities recognized in earnings
|
|
($12
|
)
|
|
($18
|
)
|
|
($191
|
)
|
|
$6
|
|
33
|
%
|
|
$173
|
|
91
|
%
|
|||
|
Other gains (losses) on investment securities recognized in earnings
|
(683
|
)
|
1,054
|
|
(78
|
)
|
(1,737
|
)
|
(165
|
)
|
1,132
|
|
1,451
|
|
||||||||
|
Investment securities gains (losses)
|
|
($695
|
)
|
|
$1,036
|
|
|
($269
|
)
|
|
($1,731
|
)
|
(167
|
)%
|
|
$1,305
|
|
485
|
%
|
|||
Key Drivers:
n
2018 vs. 2017
- Shifted to losses during 2018 from gains during 2017 primarily driven by higher losses on trading securities due to increasing interest rates and spread widening during 2018, combined with lower volume of sales at gains of non-agency mortgage-related securities.
n
2017 vs. 2016
- Improved primarily due to:
|
l
|
Lower losses on trading securities as long-term interest rates increased less during 2017 than during 2016;
|
|
l
|
Larger gains on sales of available-for-sale securities due to additional spread tightening during 2017; and
|
|
l
|
Lower losses on impaired securities primarily due to a decline in the population of non-agency mortgage-related securities.
|
Debt Gains (Losses)
Debt gains (losses) consists of the following:
|
n
|
Fair value changes
- includes the gains and losses on debt for which we have elected the fair value option, primarily certain STACR debt notes.
|
|
n
|
Gains (losses) on extinguishment of debt
- represents the difference between the consideration paid and the debt carrying value when we purchase debt securities of consolidated trusts (i.e., PCs)
|
|
FREDDIE MAC
| 2018 Form 10-K
|
22
|
|
|
Management's Discussion and Analysis
|
Consolidated Results of Operations
|
as investments in our mortgage-related investments portfolio and when we repurchase or call other debt.
Debt gains (losses) are affected by a number of factors, including:
|
n
|
Changes in the market spreads between debt yields and benchmark interest rates and
|
|
n
|
Amount and type of debt selected for repurchase based on our investment and funding strategies, including our efforts to support the liquidity and price performance of our PCs.
|
The table below presents the components of debt gains (losses).
Table 8 - Components of Debt Gains (Losses)
|
Year Over Year Change
|
||||||||||||||||||||||
|
Year Ended December 31,
|
2018 vs. 2017
|
2017 vs. 2016
|
||||||||||||||||||||
|
(Dollars in millions)
|
2018
|
2017
|
2016
|
$
|
%
|
$
|
%
|
|||||||||||||||
|
Fair value changes
|
|
$142
|
|
|
($190
|
)
|
|
($262
|
)
|
|
$332
|
|
175
|
%
|
|
$72
|
|
27
|
%
|
|||
|
Gains (losses) on extinguishment of debt
|
578
|
|
341
|
|
(211
|
)
|
237
|
|
70
|
|
552
|
|
262
|
|
||||||||
|
Debt gains (losses)
|
|
$720
|
|
|
$151
|
|
|
($473
|
)
|
|
$569
|
|
377
|
%
|
|
$624
|
|
132
|
%
|
|||
Key Drivers:
n
2018 vs. 2017
- Improved primarily due to an increase in gains from the extinguishment of fixed-rate PCs, as market interest rates increased between the time of issuance and repurchase, coupled with fair value gains on STACR debt notes as a result of spread widening during 2018.
n
2017 vs. 2016
- Improved primarily due to an increase in gains from the extinguishment of fixed-rate PCs, as market interest rates increased between the time of issuance and repurchase, coupled with smaller fair value losses on STACR debt notes, as spreads tightened less during 2017 than during 2016.
Derivative Gains (Losses)
Derivative instruments are a key component of our interest-rate risk management strategy. We use derivatives to economically hedge our interest-rate risk exposure. We primarily use interest-rate swaps, futures, and option-based derivatives, such as swaptions, to manage our exposure to changes in interest-rates. We consider the cost of derivatives used in interest-rate risk management to be an inherent part of the cost of funding our mortgage-related investments portfolio.
In addition, we routinely enter into commitments to purchase and sell loans and mortgage-related securities. The majority of these commitments are accounted for as derivative instruments.
We continue to align our derivative portfolio with the changing duration of our assets and liabilities so as to economically hedge them. We manage our exposure to interest-rate risk on an economic basis to a low level as measured by our models. We believe the impact of derivatives on our GAAP financial results should be considered in the context of our overall interest-rate risk profile, including our PMVS and duration gap results. For more information about our interest-rate risk management activities and the sensitivity of reported GAAP earnings to those activities, see
Risk Management - Market Risk
.
Derivative gains (losses) consists of the following:
|
n
|
Fair value changes
- represents changes in the fair value of our derivatives while not designated in hedging relationships based on market conditions at the end of the period or at the time the
|
|
FREDDIE MAC
| 2018 Form 10-K
|
23
|
|
|
Management's Discussion and Analysis
|
Consolidated Results of Operations
|
derivative instrument is terminated. These amounts may or may not be realized over time, depending on future changes in market conditions and the terms of our derivative instruments.
|
n
|
Accrual of periodic cash settlements
- consists of the net amount we accrue during a period for interest-rate swap payments that we will make or receive for derivatives while not designated in hedging relationships. This accrual represents the ongoing cost of our hedging activities, and is economically equivalent to interest expense.
|
We apply fair value hedge accounting to certain single-family mortgage loans and long-term debt to reduce our GAAP earnings volatility. For the first three quarters of 2017, we included gains and losses on derivatives designated in qualifying hedge relationships in other income and the accrual of periodic cash settlements on derivatives in qualifying hedge relationships in derivatives gains (losses). Beginning in 4Q 2017, due to the adoption of amended hedge accounting guidance, we include gains and losses and the accrual of periodic cash settlements on derivatives designated in qualifying hedge relationships in the same line used to present the earnings effect of the hedged item. See
Note 9
for more information on hedge accounting and the adoption of amended hedge accounting guidance during 2017.
Derivative gains (losses) are affected by a number of factors, including:
|
n
|
Changes in interest rates
- Our primary derivative instruments are interest-rate swaps, including pay-fixed and receive-fixed interest-rate swaps. With a pay-fixed interest-rate swap, we pay a fixed rate of interest and receive a variable rate of interest based on a specified notional balance (the notional balance is for calculation purposes only). As interest rates decline, we recognize derivative losses, as the amount of interest we pay remains fixed, and the amount of interest we receive declines. As rates rise, we recognize derivative gains, as the amount of interest we pay remains fixed, but the amount of interest we receive increases. With a receive-fixed interest-rate swap, the opposite results occur.
|
|
n
|
Implied volatility
- Many of our assets and liabilities have embedded prepayment options. We use option-based derivatives, including swaptions, to economically hedge the prepayment options embedded in our mortgage assets and callable debt. Fair value gains and losses on swaptions are sensitive to changes in both interest rates and implied volatility, which reflects the market's expectation of future changes in interest rates. Assuming all other factors are unchanged, including interest rates, purchased swaptions generally become more valuable as implied volatility increases and less valuable as implied volatility decreases, with the opposite being true for written swaptions.
|
|
n
|
Changes in the shape of the yield curve
- We own assets and have outstanding debt with different cash flows along the yield curve. We use derivatives to hedge the yield exposure of assets and debt, resulting in derivatives with different maturities. As a result, changes in the shape of the yield curve will affect our derivative gains (losses).
|
|
n
|
Changes in the composition of our derivative portfolio
- The mix and balance of our derivative portfolio changes from period to period as we enter into or terminate derivative instruments to respond to changes in interest rates and changes in the balances and modeled characteristics of our assets and liabilities. Changes in the composition of our derivative portfolio will affect the derivative gains and losses we recognize in a given period, thereby affecting the volatility of comprehensive income.
|
|
FREDDIE MAC
| 2018 Form 10-K
|
24
|
|
|
Management's Discussion and Analysis
|
Consolidated Results of Operations
|
The table below presents the components of derivative gains (losses).
Table 9 - Components of Derivative Gains (Losses)
|
Year Over Year Change
|
||||||||||||||||||||||
|
Year Ended December 31,
|
2018 vs. 2017
|
2017 vs. 2016
|
||||||||||||||||||||
|
(Dollars in millions)
|
2018
|
2017
|
2016
|
$
|
%
|
$
|
%
|
|||||||||||||||
|
Fair value change in interest-rate swaps
|
|
$1,422
|
|
|
$626
|
|
|
$178
|
|
|
$796
|
|
127
|
%
|
|
$448
|
|
252
|
%
|
|||
|
Fair value change in option-based derivatives
|
(630
|
)
|
(1,041
|
)
|
421
|
|
411
|
|
39
|
|
(1,462
|
)
|
(347
|
)
|
||||||||
|
Fair value change in other derivatives
|
619
|
|
17
|
|
887
|
|
602
|
|
3,541
|
|
(870
|
)
|
(98
|
)
|
||||||||
|
Accrual of periodic cash settlements
|
(141
|
)
|
(1,590
|
)
|
(1,760
|
)
|
1,449
|
|
91
|
|
170
|
|
10
|
|
||||||||
|
Derivative gains (losses)
|
|
$1,270
|
|
|
($1,988
|
)
|
|
($274
|
)
|
|
$3,258
|
|
164
|
%
|
|
($1,714
|
)
|
(626
|
)%
|
|||
Key Drivers:
|
n
|
2018 vs. 2017
- Increases in long-term rates during 2018 resulted in derivative fair value gains compared to derivative fair value losses during 2017. The interest rate increases during 2018 resulted in fair value gains on our pay-fixed interest rate swaps, forward commitments to issue PCs, and futures, partially offset by fair value losses on our receive-fixed swaps and certain of our option-based derivatives. As a result of the adoption of amended hedge accounting guidance in 4Q 2017, fair value changes on derivatives in qualifying hedge relationships have been recorded within net interest income.
|
|
n
|
2017 vs. 2016
- Increased losses driven by lower levels of volatility during 2017, resulting in larger losses in our options portfolio, coupled with lower fair value gains on our pay-fixed interest rate swaps as long-term interest rates increased less during 2017 than during 2016. This was partially offset by reduced fair value losses on our receive-fixed interest rate swaps.
|
Other Income
|
n
|
2018 vs. 2017 and 2017 vs. 2016
- Primarily reflected the recognition of a $0.3 billion gain during 2018 from a judgment in litigation against Nomura Holding America, Inc. (Nomura) and $4.5 billion in proceeds received during 2017 from a litigation settlement with the Royal Bank of Scotland Group plc (RBS) related to certain of our non-agency mortgage related securities. We did not have any significant judgments or settlements during 2016. See
Note 14
for additional information on the Nomura judgment and RBS settlement.
|
Income Tax Expense
|
n
|
2018 vs. 2017
- Decreased due to the impact of the Tax Cuts and Jobs Act enacted in December 2017, which lowered the statutory corporate income tax rate from 35% in 2017 to 21% in 2018 and required us to measure our net deferred tax asset using the reduced rate and recognize a charge to income tax expense of $5.4 billion in 2017.
|
|
n
|
2017 vs. 2016
- Increased primarily due to the $5.4 billion charge to income tax expense resulting from the enactment of the Tax Cuts and Jobs Act.
|
Other Comprehensive Income (Loss)
Our investments in securities classified as available-for-sale are measured at fair value on our consolidated balance sheets. The fair value of these securities is primarily affected by changes in
|
FREDDIE MAC
| 2018 Form 10-K
|
25
|
|
|
Management's Discussion and Analysis
|
Consolidated Results of Operations
|
interest rates, market spreads, and the movement of these securities towards maturity. All unrealized gains and losses on these securities are excluded from earnings and reported in other comprehensive income until realized. We reclassify our unrealized gains and losses from AOCI to earnings upon the sale of the securities or if the securities are determined to be other-than-temporarily impaired.
If, subsequent to the recognition of other-than-temporary impairment, our expectation of the cash flows we will receive on a previously impaired security has significantly increased, we will accrete that increase in cash flows into earnings. The accretion into earnings will generally reduce the amount of unrealized gains that we would have otherwise recognized if not for the accretion.
The following table presents the attribution of the other comprehensive income (loss) reported on our consolidated statements of comprehensive income.
Table 10 - Other Comprehensive Income (Loss)
|
Year Over Year Change
|
||||||||||||||||||||||
|
Year Ended December 31,
|
2018 vs. 2017
|
2017 vs. 2016
|
||||||||||||||||||||
|
(Dollars in millions)
|
2018
|
2017
|
2016
|
$
|
%
|
$
|
%
|
|||||||||||||||
|
Other comprehensive income (loss), excluding certain items
|
|
($345
|
)
|
|
$1,084
|
|
|
($29
|
)
|
|
($1,429
|
)
|
(132
|
)%
|
|
$1,113
|
|
3,838
|
%
|
|||
|
Excluded items
|
||||||||||||||||||||||
|
Accretion due to significant increases in expected cash flows on previously impaired available-for-sale securities
|
(120
|
)
|
(164
|
)
|
(299
|
)
|
44
|
|
27
|
|
135
|
|
45
|
|
||||||||
|
Realized (gains) losses reclassified from AOCI
|
(148
|
)
|
(987
|
)
|
(369
|
)
|
839
|
|
85
|
|
(618
|
)
|
(167
|
)
|
||||||||
|
Total excluded items
|
(268
|
)
|
(1,151
|
)
|
(668
|
)
|
883
|
|
77
|
|
(483
|
)
|
(72
|
)
|
||||||||
|
Total other comprehensive income (loss)
|
|
($613
|
)
|
|
($67
|
)
|
|
($697
|
)
|
|
($546
|
)
|
(815
|
)%
|
|
$630
|
|
90
|
%
|
|||
Key Drivers:
|
n
|
Other comprehensive income (loss), excluding certain items
|
|
l
|
2018 vs. 2017
- S
hifted to losses in 2018 from income in 2017 primarily due to higher fair value losses due to increasing long-term interest rates during 2018, coupled with smaller spread-related fair value gains driven by lower balances of non-agency mortgage-related securities.
|
|
l
|
2017 vs. 2016
- Increased primarily due to market spread related gains as market spreads tightened more during 2017, coupled with smaller interest rate-related losses due to smaller increases in long-term interest rates during 2017.
|
Excluded items:
|
n
|
Accretion due to significant increases in expected cash flows on previously impaired available-for-sale securities
|
|
l
|
2018 vs. 2017 and 2017 vs. 2016
- Decreased during both comparative periods primarily due to a decline in the population of impaired securities.
|
|
n
|
Realized (gains) losses reclassified from AOCI
|
|
l
|
2018 vs. 2017
- Reflected smaller amounts of reclassified gains during 2018 due to lower sales of non-agency mortgage-related securities.
|
|
l
|
2017 vs. 2016
- Reflected larger amounts of reclassified gains during 2017 due to additional spread tightening and an increase in sales of non-agency mortgage-related securities.
|
|
FREDDIE MAC
| 2018 Form 10-K
|
26
|
|
|
Management's Discussion and Analysis
|
Consolidated Balance Sheets Analysis
|
CONSOLIDATED BALANCE SHEETS ANALYSIS
The table below compares our summarized consolidated balance sheets.
Table 11 - Summarized Consolidated Balance Sheets
|
As of December 31,
|
Year Over Year Change
|
||||||||||||
|
(Dollars in millions)
|
2018
|
2017
|
$
|
%
|
|||||||||
|
Assets:
|
|||||||||||||
|
Cash and cash equivalents
(1)
|
|
$7,273
|
|
|
$9,811
|
|
|
($2,538
|
)
|
(26
|
)%
|
||
|
Securities purchased under agreements to resell
|
34,771
|
|
55,903
|
|
(21,132
|
)
|
(38
|
)
|
|||||
|
Subtotal
|
42,044
|
|
65,714
|
|
(23,670
|
)
|
(36
|
)
|
|||||
|
Investments in securities, at fair value
|
69,111
|
|
84,318
|
|
(15,207
|
)
|
(18
|
)
|
|||||
|
Mortgage loans, net
|
1,926,978
|
|
1,871,217
|
|
55,761
|
|
3
|
|
|||||
|
Accrued interest receivable
|
6,728
|
|
6,355
|
|
373
|
|
6
|
|
|||||
|
Derivative assets, net
|
335
|
|
375
|
|
(40
|
)
|
(11
|
)
|
|||||
|
Deferred tax assets, net
|
6,888
|
|
8,107
|
|
(1,219
|
)
|
(15
|
)
|
|||||
|
Other assets
|
10,976
|
|
13,690
|
|
(2,714
|
)
|
(20
|
)
|
|||||
|
Total assets
|
|
$2,063,060
|
|
|
$2,049,776
|
|
|
$13,284
|
|
1
|
%
|
||
|
|
|
||||||||||||
|
Liabilities and Equity:
|
|
|
|||||||||||
|
Liabilities:
|
|
|
|||||||||||
|
Accrued interest payable
|
|
$6,652
|
|
|
$6,221
|
|
|
$431
|
|
7
|
%
|
||
|
Debt, net
|
2,044,950
|
|
2,034,630
|
|
10,320
|
|
1
|
|
|||||
|
Derivative liabilities, net
|
583
|
|
269
|
|
314
|
|
117
|
|
|||||
|
Other liabilities
|
6,398
|
|
8,968
|
|
(2,570
|
)
|
(29
|
)
|
|||||
|
Total liabilities
|
2,058,583
|
|
2,050,088
|
|
8,495
|
|
—
|
|
|||||
|
Total equity
|
4,477
|
|
(312
|
)
|
4,789
|
|
1,535
|
|
|||||
|
Total liabilities and equity
|
|
$2,063,060
|
|
|
$2,049,776
|
|
|
$13,284
|
|
1
|
%
|
||
(1) The current and prior period presentation has been modified to include restricted cash and cash equivalents in this line item due to recently adopted accounting guidance.
Key Drivers:
As of December 31, 2018 compared to December 31, 2017:
|
n
|
Cash and cash equivalents
and
securities purchased under agreements to resell
declined on a combined basis primarily due to lower near-term cash needs for fewer upcoming maturities and anticipated calls of other debt.
|
n
Investments in securities, at fair value
decreased as we continued to reduce the mortgage-related investments portfolio during 2018 as required by the Purchase Agreement and FHFA.
n
Deferred tax assets, net
decreased primarily due to an increase in long-term interest rates during 2018, which caused the difference between the GAAP and tax basis of assets held for investment and derivative instruments to decline.
|
n
|
Total equity
increased primarily as a result of higher comprehensive income, combined with our ability to retain equity as a result of an increase in the applicable Capital Reserve Amount, which was $3.0 billion as of January 1, 2018.
|
|
FREDDIE MAC
| 2018 Form 10-K
|
27
|
|
|
Management's Discussion and Analysis
|
Our Business Segments |
Segment Earnings
|
OUR BUSINESS SEGMENTS
As shown in the table below, we have three reportable segments, which are based on the way we manage our business. Certain activities that are not part of a reportable segment are included in the All Other category.
|
Segment/Category
|
Description
|
Primary Revenue Drivers
|
Primary Expense Drivers
|
||
|
Single-family Guarantee
|
Reflects results from our purchase, securitization, and guarantee of single-family loans and the management of single-family mortgage credit risk
|
•
|
Guarantee fee income
|
•
|
Credit-related expenses
|
|
•
|
Administrative expenses
|
||||
|
•
|
Credit risk transfer expenses
|
||||
|
Multifamily
|
Reflects results from our purchase, sale, securitization, and guarantee of multifamily loans and securities, our investments in those loans and securities, and the management of multifamily mortgage credit risk and market spread risk
|
•
|
Net interest income
|
•
|
Losses on loans
|
|
•
|
Guarantee fee income
|
•
|
Investment losses
|
||
|
•
|
Gains on loans
|
•
|
Derivative losses
|
||
|
•
|
Investment gains
|
•
|
Administrative expenses
|
||
|
•
|
Derivative gains
|
•
|
Credit-related expenses
|
||
|
Capital Markets
|
Reflects results from managing our mortgage-related investments portfolio (excluding Multifamily segment investments, single-family seriously delinquent loans, and the credit risk of single-family performing and reperforming loans), treasury function, single-family securitization activities, and interest-rate risk
|
•
|
Net interest income
|
•
|
Investment losses
|
|
•
|
Investment gains
|
•
|
Derivative losses
|
||
|
•
|
Derivative gains
|
•
|
Administrative expenses
|
||
|
All Other
|
Consists of material corporate-level activities that are infrequent in nature and based on decisions outside the control of the management of our reportable segments
|
N/A
|
N/A
|
||
Segment Earnings
We evaluate segment performance and allocate resources based on a Segment Earnings approach:
|
n
|
We make significant reclassifications among certain line items in our GAAP financial statements to reflect measures of guarantee fee income on guarantees, net interest income on investments, and benefit (provision) for credit losses on loans that are in line with how we manage our business.
|
|
n
|
We allocate certain revenues and expenses, including certain returns on assets, funding and hedging costs, and all administrative expenses to our three reportable segments.
|
|
n
|
The sum of Segment Earnings for each segment and the All Other category equals GAAP net income (loss). Likewise, the sum of comprehensive income (loss) for each segment and the All Other category equals GAAP comprehensive income (loss).
|
During 4Q 2018, we changed how we calculate certain components of our Segment Earnings for our Single-family Guarantee and Capital Markets segments. Prior period results have been revised to conform to the current period presentation. For more information on these changes and our segment reclassifications, see
Note 13
.
Segment Earnings differs significantly from, and should not be used as a substitute for, net income (loss) as determined in accordance with GAAP. Our definition of Segment Earnings may differ from similar measures used by other companies. We believe that Segment Earnings provides us with meaningful metrics to assess the financial performance of each segment and our company as a whole. See
Note 1
3
for additional details on Segment Earnings, including additional financial information for our
|
FREDDIE MAC
| 2018 Form 10-K
|
28
|
|
|
Management's Discussion and Analysis
|
Our Business Segments |
Segment Earnings
|
segments.
Segment Comprehensive Income
The graph below shows our comprehensive income by segment.
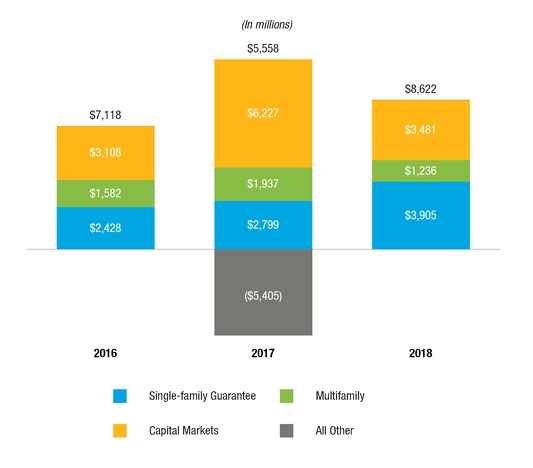
|
FREDDIE MAC
| 2018 Form 10-K
|
29
|
|
|
Management's Discussion and Analysis
|
Our Business Segments |
Single-Family Guarantee
|
Single-Family Guarantee
Business Overview
Our Single-family Guarantee segment supports our primary business strategies by creating:
A Better Freddie Mac:
|
n
|
Providing market leadership by delivering quality offerings, programs, and services to an increasingly diversified customer base and an evolving mortgage market;
|
|
n
|
Improving the customer experience through continued enhancement of our products, programs, processes, and technology;
|
|
n
|
Establishing effective risk management activities, including credit risk transfer transactions, that are appropriate for the level of risk;
|
|
n
|
Developing innovative technology platforms to provide sellers and servicers and Freddie Mac with better methods of assessing and managing single-family mortgage credit risk;
|
|
n
|
Providing quality risk-adjusted returns; and
|
|
n
|
Offering third-party investors new and innovative ways to share in the credit risk of the single-family credit guarantee portfolio.
|
A Better Housing Finance System:
|
n
|
Developing and implementing initiatives to cost-effectively reduce taxpayer exposure to our risks;
|
|
n
|
Expanding access to affordable housing in a responsible manner to support our Charter Mission as well as to meet specific mandated goals;
|
|
n
|
Working with FHFA, Fannie Mae, and CSS on the development of a new common securitization platform and implementing the Single Security initiative for Freddie Mac and Fannie Mae. The Single Security initiative is intended to increase the liquidity of the TBA market and to reduce the disparities in trading value between our PCs and Fannie Mae's single-class mortgage-related securities; and
|
|
n
|
Leveraging technology and big data to improve the mortgage process for all stakeholders, including reducing costs for lenders and borrowers and making the loan process more efficient and effective.
|
The U.S. residential mortgage market consists of a primary mortgage market that links homebuyers and lenders, and a secondary mortgage market that links lenders and investors. The size of the U.S. residential mortgage market is affected by many factors, including changes in interest rates, unemployment rates, homeownership rates, housing prices, the supply of housing, lender preferences regarding credit risk, and borrower preferences regarding mortgage debt.
In accordance with our Charter, we participate in the secondary mortgage market. The Single-family Guarantee segment provides liquidity and support to the single-family market through a variety of activities that include the purchase, securitization, and guarantee of single-family loans originated by sellers and servicers. The mix of loan products available for us to purchase is affected by several factors, including the volume of loans meeting the requirements of our Charter, our own preference for credit risk reflected in our purchase standards, and the loan purchase and securitization activity of other financial institutions.
|
FREDDIE MAC
| 2018 Form 10-K
|
30
|
|
|
Management's Discussion and Analysis
|
Our Business Segments |
Single-Family Guarantee
|
Our primary business model is to acquire loans that lenders originate and then pool those loans into mortgage-related securities that can be sold in the capital markets. The returns we generate from these activities are primarily derived from the ongoing guarantee fee we receive in exchange for providing our guarantee of the principal and interest payments of the issued mortgage-related securities.
In order to issue mortgage-related securities, we establish trusts pursuant to our Master Trust Agreements and serve as the trustee of those trusts. The lender or servicer administers the collection of borrowers' payments on their loans and remits the collected funds to us. We administer the distribution of payments to the investors in the mortgage-related securities, net of any applicable guarantee fees. To reduce our exposure under our guarantee, we transfer credit risk on a portion of our single-family credit guarantee portfolio to the private market when it is cost-effective to do so.
The diagram below illustrates our primary business model.

When a borrower prepays a loan that we have securitized, the outstanding balance of the security owned by investors is reduced by the amount of the prepayment. If the borrower becomes delinquent, we continue to make the applicable payments to the investors in the mortgage-related securities pursuant to our guarantee until we purchase the loan out of the trust. We have the option to purchase specified loans, including certain delinquent loans, from the trusts at a purchase price equal to the current UPB of the loan, less any outstanding advances of principal that have been previously distributed. If borrowers become delinquent, we work with the borrowers through our servicers to mitigate our losses through our loan workout programs, which are discussed in more detail in
Risk Management
. If we are unable to achieve a successful loan workout, we will pursue foreclosure of the underlying property, which will result in a third-party sale or an acquisition of the property as REO. The purchase and sale of delinquent loans are done in conjunction with the Capital Markets segment.
Guarantee Fees
We enter into loan purchase agreements with many of our single-family customers that outline the terms under which we agree to purchase loans from them over a period of time. For most of the loans we purchase, the guarantee fees are not specified contractually. Instead, we bid for some or all of the lender's loan volume on a monthly basis at a guarantee fee that we specify. As a result, our loan purchase volumes from individual customers can fluctuate significantly.
We seek to issue guarantees with fee terms that are commensurate with the aggregate risks assumed and that will, over the long-term, provide guarantee fee income that exceeds the credit-related and administrative expenses on the underlying loans and also provide a return on the capital that would be
|
FREDDIE MAC
| 2018 Form 10-K
|
31
|
|
|
Management's Discussion and Analysis
|
Our Business Segments |
Single-Family Guarantee
|
needed to support the related credit risk. The guarantee fees charged on new acquisitions generally consist of:
|
n
|
A contractual monthly fee paid as a percentage of the UPB of the underlying loan;
|
|
n
|
Upfront fees, which primarily include delivery fees that are calculated based on credit risk factors such as the loan product type, loan purpose, LTV ratio, and credit score. These delivery fees are charged to compensate us for higher levels of risk in some loan products;
|
|
n
|
Upfront payments made or received to buy up or buy down, respectively, the monthly contractual guarantee fee ("buy-up fees" or "buy-down fees"). These fees are paid in conjunction with the formation of a PC to provide for a uniform coupon rate for the mortgage pool underlying the PC. The payments made to buy-up the monthly contractual guarantee fee are not considered compensation for the credit risk assumed for purposes of our financial statements. Consequently, these amounts are allocated to the Capital Markets segment;
|
|
n
|
Market adjusted pricing costs based on the market pricing of our PCs relative to the market pricing of comparable Fannie Mae securities; and
|
|
n
|
The legislated 10 basis point increase in guarantee fees under the Temporary Payroll Tax Cut Continuation Act of 2011.
|
We operate in a competitive market by varying our pricing for different customers, loan products, and underwriting characteristics. We seek to maintain a broad-ranging mix of loan quality for the loans we purchase. However, sellers may elect to retain loans with better credit characteristics. A seller's decision to retain these loans could result in our purchases having a more adverse credit profile.
We must obtain FHFA's approval to implement across-the-board changes to our guarantee fees. In addition, from time to time, FHFA issues directives or guidance to us affecting the levels of guarantee fees that we may charge for various types of loans. In July 2016, FHFA issued a directive that addressed the safety and soundness risk that could arise if our guarantee fees were not sufficient to compensate us adequately for the credit risk we are taking. This directive puts some constraints on certain aspects of our guarantee fees, such as our ability to reduce the contractual guarantee fee. In December 2017 and February 2018, FHFA issued additional guidance that requires the GSEs to meet certain profitability levels on new fundings beginning in 2018.
Common Securitization Platform and the UMBS
In accordance with FHFA's 2014 Strategic Plan and the Conservatorship Scorecards, we continue to work with FHFA, Fannie Mae, and CSS on the development of a new Common Securitization Platform (CSP) and the implementation of the Single Security initiative for Freddie Mac and Fannie Mae. The Single Security initiative provides for Freddie Mac and Fannie Mae to issue a single (common) mortgage-related security, to be called the Uniform Mortgage-Backed Security, or UMBS.
In December 2016, we and FHFA announced the implementation of Release 1 of the CSP. Under Release 1, we began using the CSP for data acceptance, issuance support, and bond administration activities related to Freddie Mac single-class fixed-rate mortgage-related securities.
FHFA has announced that Release 2 of the CSP will be implemented in June 2019. Release 2 will allow Freddie Mac and Fannie Mae to each issue the UMBS. Release 2 will also add to the functionality of the platform by, among other things, enabling commingling of Freddie Mac and Fannie Mae UMBS and other TBA-eligible MBS in resecuritization transactions. Freddie Mac intends to offer an optional
|
FREDDIE MAC
| 2018 Form 10-K
|
32
|
|
|
Management's Discussion and Analysis
|
Our Business Segments |
Single-Family Guarantee
|
exchange program to enable security holders to exchange certain existing 45-day payment delay fixed-rate Gold PCs and Giant PCs for new 55-day payment delay Freddie Mac securities. As part of this program, Freddie Mac will pay exchanging security holders for the 10 additional days of payment delay, based on float compensation rates calculated by Freddie Mac. We do not expect to earn enough of a return from this additional float that it will be sufficient to offset our payments to the security holders.
In November 2018, FHFA reported that Freddie Mac and CSS completed system-to-system, bilateral end-to-end, and data conversion testing for Release 2. Tri-party end-to-end testing, with both Fannie Mae and Freddie Mac conducting daily processing and testing in a single CSP environment, is also complete. In addition, FHFA reported that in September 2018, Freddie Mac and CSS migrated Freddie Mac's production processing for single-class MBS from Release 1 to the relevant Release 2 code, confirming that the relevant Release 2 modules are production-ready. Production processing on the Release 2 code continues to perform as expected.
Freddie Mac, Fannie Mae, and CSS completed production data conversion and began parallel processing for Release 2 on schedule in November 2018.
With the implementation of Release 2 in June 2019, Freddie Mac will use the CSP for issuance and monthly processing of single-class UMBS backed by fixed-rate loans, single-class resecuritizations of UMBS, multiclass securities such as REMICs, and the related disclosures and tax reporting.
The successful implementation of Release 2 and a smooth transition of the market to trading the UMBS require planning, investment, and preparation on the part of a wide variety of market participants. Freddie Mac has engaged in extensive industry outreach to facilitate the transition, including participating in industry forums and conferences, webinars, conference calls, meetings with individual firms, and consultations with advisory and industry-sponsored working groups. As the implementation date for Release 2 approaches, Freddie Mac has accelerated and intensified our engagement with market participants.
Products and Activities
Securitization and Guarantee Products
We offer various types of guarantee and securitization products, primarily single-class securitizations and resecuritizations. In these securitization products, Freddie Mac functions in its capacity as depositor, guarantor, administrator, and trustee. We retain the credit risk and transfer the interest-rate and prepayment risks to the investors. While the Single-family Guarantee segment is responsible for the guarantee of our securities, the Capital Markets segment manages the securitization and resecuritization processes.
Single-Class Securitization Products
We offer a variety of single-class securitization products to our customers. Our single-class securitization products are pass-through securities that represent undivided beneficial interests in trusts that hold pools of loans. For our fixed-rate PCs, we guarantee the timely payment of principal and interest. For our ARM PCs, we guarantee the timely payment of the weighted average coupon interest rate for the underlying loans. We also guarantee the full and final payment of principal, but not the timely payment of principal, on ARM PCs. In exchange for our guarantee, we receive fees as described in the
Guarantee Fees
section above.
We issue the following types of single-class securitization products:
|
FREDDIE MAC
| 2018 Form 10-K
|
33
|
|
|
Management's Discussion and Analysis
|
Our Business Segments |
Single-Family Guarantee
|
|
n
|
Guarantor Swap PCs
-
We offer transactions in which our customers, primarily large mortgage banking companies and commercial banks, provide us with loans in exchange for PCs, as shown in the diagram below:
|

|
n
|
Cash PCs
-
We offer cash products to our customers, primarily community and regional banks. In these transactions, we purchase performing loans for cash and securitize them for retention in our mortgage-related investments portfolio or for sale to third parties. For the period of time between loan purchase and securitization, we refer to the loan as being in our securitization pipeline. The purchase of loans and sale of PCs are managed by the Capital Markets segment. The diagram below illustrates a cash PC transaction. We securitize certain reperforming loans into PCs using a similar process. We may subsequently resecuritize a portion of the PCs backed by reperforming loans, with some of the resulting interests being sold to third parties. For additional information, see
Our Business Segments - Capital Markets -
Business Overview
.
|
|
FREDDIE MAC
| 2018 Form 10-K
|
34
|
|
|
Management's Discussion and Analysis
|
Our Business Segments |
Single-Family Guarantee
|

Resecuritization Products
We offer resecuritization products to our customers. Our resecuritization products represent beneficial interests in pools of PCs and certain other types of mortgage assets. We create these securities by using PCs or our previously issued resecuritization products as the underlying collateral. We leverage the issuance of these securities to expand the range of investors in our mortgage-related securities to include those seeking specific security attributes. Similar to our PCs, we guarantee the payment of principal and interest to the investors in our resecuritization products. We do not charge a guarantee fee for these securities if the underlying collateral is already guaranteed by us since no additional credit risk is introduced, although we typically receive a transaction fee as compensation for creating the security and future administrative responsibilities.
All of the cash flows from the collateral underlying our resecuritization products are generally passed through to investors in these securities. We do not issue resecuritization products that have concentrations of credit risk beyond those embedded in the underlying assets. In many of our resecuritization transactions, securities dealers or investors deliver mortgage assets in exchange for the resecuritization product. In certain cases, we may also transfer our own mortgage assets in exchange for the resecuritization product. The resecuritization activities are managed by the Capital Markets segment. The following diagram provides a general example of how we create resecuritization products:
|
FREDDIE MAC
| 2018 Form 10-K
|
35
|
|
|
Management's Discussion and Analysis
|
Our Business Segments |
Single-Family Guarantee
|

We issue the following types of resecuritization products:
|
n
|
Giant PCs
-
Resecuritizations of previously issued PCs or Giant PCs. Giant PCs are single-class securities that involve the straight pass through of all cash flows of the underlying collateral to holders of the beneficial interests.
|
|
n
|
Stripped Giant PCs
-
Multiclass securities that are formed by resecuritizing previously issued PCs or Giant PCs and issuing stripped securities, including principal-only and interest-only securities or floating rate and inverse interest-only securities, backed by the cash flows from the underlying collateral.
|
|
n
|
REMICs
-
Resecuritizations of previously issued PCs, Giant PCs, Stripped Giant PCs, or REMICs. REMICs are multiclass securities that divide all cash flows of the underlying collateral into two or more classes with varying maturities, payment priorities, and coupons.
|
|
n
|
Other securitization products
- Guaranteed mortgage-related securities collateralized by non-Freddie Mac mortgage-related securities. However, we have not entered into these types of transactions as part of our Single-family Guarantee business in several years.
|
Sales of Mortgage Loans
We continually manage the balance of our less liquid assets. We offer to sell select mortgage loans through a variety of methods that include whole loan sales or certain securitization transactions. In these transactions, we reduce or eliminate our credit risk, in addition to our interest-rate and prepayment risk, associated with the underlying mortgage loans. The sales of these mortgage loans are managed by the Capital Markets segment.
Our mortgage loans are sold through the following transactions:
|
n
|
Whole loan sales
-
Sales of seriously delinquent loans for cash.
|
|
FREDDIE MAC
| 2018 Form 10-K
|
36
|
|
|
Management's Discussion and Analysis
|
Our Business Segments |
Single-Family Guarantee
|
|
n
|
Senior subordinate securitization structures (non-consolidated)
-
Transactions where we issue guaranteed senior securities and unguaranteed subordinated securities. The collateral for these structures primarily consists of reperforming loans. The unguaranteed subordinated securities absorb first losses on the related loans. Unlike other senior subordinate securitization structures, in these transactions the loans are not serviced in accordance with our Guide and we do not control the servicing. See
Risk Management - Single-Family Mortgage Credit Risk -
Transferring Credit Risk of the Single-Family Credit Guarantee Portfolio to Investors in New and Innovative Ways
for a description of various forms of credit enhancements we use to transfer a portion of the credit risk on our single-family loans, including senior subordinate securitization structures.
|
Long-Term Standby Commitments
We also offer a guarantee on mortgage assets held by third parties, in exchange for guarantee fees, without securitizing those assets. These long-term standby commitments obligate us to purchase seriously delinquent loans that are covered by those commitments. From time to time, we have consented to the termination of our long-term standby commitments and simultaneously entered into guarantor swap transactions with the same counterparty, issuing PCs backed by many of the same loans.
|
The primary impacts of the aforementioned products and transactions to Segment Earnings are:
|
|
|
•
|
Guarantee fee income earned on our guarantee of principal and interest payments on these mortgage-related securities;
|
|
•
|
Benefit (provision) for credit losses, which is affected by changes in estimated probabilities of default and estimated loss severities, the actual level of loan defaults, the effect of loss mitigation efforts, and payment performance of our individually impaired mortgage portfolio; and
|
|
•
|
Gains and losses recognized on the reclassification of loans held-for-investment to held-for-sale and subsequent sale of these loans.
|
Credit Risk Transfer (CRT) Transactions
To reduce our credit risk exposure, we engage in various credit enhancement arrangements, which include CRT transactions and other credit enhancements. We define CRT transactions as those arrangements where we actively transfer the credit risk exposure on mortgages that we own or guarantee. We define other credit enhancements as those arrangements, such as traditional primary mortgage insurance, where we do not actively take part in the transfer of the credit risk exposure. Our CRT transactions are designed to reduce the amount of conservatorship capital needed under the CCF, to transfer portions of credit losses on groups of previously acquired loans to third-party investors, and to reduce the risk of future losses to us and taxpayers if borrowers go into default. The payments we make in exchange for this credit protection effectively reduce our guarantee fee income from the associated mortgages. The following strategic considerations were incorporated into the design of our CRT transactions:
n
Offer repeatable and scalable execution with a broad appeal to diversified investors;
n
Execute at a cost that is economically sensible;
n
Result in no or minimal effect on the TBA market;
|
n
|
Minimize changes required of, and effects on, sellers and servicers by having Freddie Mac serve as the credit manager for investors; and
|
n
Avoid or very substantially mitigate the risk that our losses are not reimbursed timely and in full.
|
FREDDIE MAC
| 2018 Form 10-K
|
37
|
|
|
Management's Discussion and Analysis
|
Our Business Segments |
Single-Family Guarantee
|
A detailed list of our CRT transactions, along with other credit enhancement arrangements, is included in
Risk Management - Single-Family Mortgage Credit Risk -
Transferring Credit Risk of the Single-Family Credit Guarantee Portfolio to Investors in New and Innovative Ways
.
Our primary CRT transactions include:
|
n
|
STACR debt notes
- Transactions in which we create a reference pool of loans from our single-family loan portfolio and an associated securitization-like structure with notional credit risk positions (e.g., first loss, mezzanine, and senior positions). We issue STACR debt notes linked to certain of the notional credit risk positions to third-party investors. In certain of our STACR debt note transactions, we transferred risk in both first loss and mezzanine notional credit risk positions, while in other transactions we only transferred risk in the mezzanine notional credit risk position.
|
We make payments of principal and interest on the issued STACR debt notes, but are not required to repay principal to the extent that the notional credit risk position is reduced as a result of specified credit events. The amount of risk transferred in each transaction affects the interest rate we pay on the notes.
Generally, the notional amounts of the credit risk positions will be reduced based on principal payments that occur on the loans in the reference pool. The notional amounts are also reduced by losses from loans in the reference pool when certain specified credit events occur. Depending on the particular transaction, and as specified in the offering documents, losses are allocated to the notional amounts of the credit risk positions based on calculated losses using a predefined formula, or based on the actual losses on the loans in the reference pool. For loans that are covered by CRT transactions based on calculated losses (generally STACR debt notes issued prior to 2015), we write down the STACR debt notes or receive reimbursement of losses when the loans experience a credit event, which predominantly includes a loan becoming 180 days delinquent. For loans that are covered by CRT transactions based on actual losses, we write down the STACR debt notes or receive reimbursement of losses once an actual loss event (e.g., short sale, third-party sale or REO disposition) occurs.
The following diagram illustrates a typical STACR debt note transaction:
|
FREDDIE MAC
| 2018 Form 10-K
|
38
|
|
|
Management's Discussion and Analysis
|
Our Business Segments |
Single-Family Guarantee
|

While STACR debt notes have been one of our primary CRT transactions in recent years, we expect that going forward we will instead primarily utilize STACR Trust transactions.
n
STACR Trust
- We introduced STACR Trust transactions in 2Q 2018 as an enhancement to STACR debt note transactions. The key difference between STACR Trust and STACR debt note transactions is that the notes in STACR Trust transactions are issued by a third-party bankruptcy-remote trust. Under this structure, we pay a credit premium and certain shortfalls to the trust and receive payments from the trust as a result of defined credit events on the reference pool. The trust issues the notes and makes periodic payments of principal and interest on the notes to investors, and Freddie Mac receives payments from the trust that otherwise would have been made to the noteholders to the extent there are certain defined credit events on the mortgages in the related reference pool. The note balances are reduced by the amount of the payments to us.
STACR Trust results in an accounting treatment that better aligns the timing of financial reporting and underlying economics. With STACR Trust transactions, the income derived from the credit protection is recognized in the same period as the allowance for credit losses, thus reducing the volatility of GAAP earnings and equity. With STACR debt notes, the recognition of the allowance for credit losses typically precedes the reporting of associated credit benefits.
|
FREDDIE MAC
| 2018 Form 10-K
|
39
|
|
|
Management's Discussion and Analysis
|
Our Business Segments |
Single-Family Guarantee
|
The following diagram illustrates a typical STACR Trust transaction:

|
n
|
ACIS insurance policies
- Transactions in which we purchase insurance policies, generally underwritten by a group of insurers and reinsurers, that provide credit protection for certain specified credit events that occur and are typically allocated to the non-issued notional credit risk positions of a STACR transaction (i.e., the risk positions that Freddie Mac retains). We also enter into ACIS transactions that provide credit protection for certain specified credit events on loans not included in a reference pool created for a STACR transaction, such as 15- and 20-year fixed-rate loans. An additional offering in the ACIS program is the ACIS Forward Risk Mitigation (AFRM
SM
) transaction, which provides front-end credit risk transfer as loans come into the portfolio. Under each of these insurance policies, we pay monthly premiums that are determined based on the outstanding balance of the reference pool. When specific credit events occur, we generally receive compensation from the insurance policy up to an aggregate limit based on actual losses. We require our ACIS counterparties to partially collateralize their exposure to reduce the risk that we will not be reimbursed for our claims under the policies.
|
|
FREDDIE MAC
| 2018 Form 10-K
|
40
|
|
|
Management's Discussion and Analysis
|
Our Business Segments |
Single-Family Guarantee
|
|
The primary impacts of our credit risk transfer transactions to Segment Earnings are:
|
|
|
•
|
Interest expense on our STACR debt notes, net of reinvestment income;
|
|
•
|
Fair value gains and losses recognized on certain of our STACR debt notes, net of the costs of hedging interest rate risk;
|
|
•
|
Premium expense for ACIS and STACR Trust contracts; and
|
|
•
|
Benefits recognized from recoveries under the CRT transactions. Benefits from certain of our STACR transactions are recognized as debt gains, whereas benefits from other CRT transactions are recognized as other income.
|
Customers
Our customers in the Single-family Guarantee segment are predominantly financial institutions that originate, sell, and perform the ongoing servicing of loans for new or existing homeowners. These companies include mortgage banking companies, commercial banks, regional banks, community banks, credit unions, HFAs, savings institutions, and non-depository financial institutions. Many of these companies are both sellers and servicers for us. In addition, we maintain relationships with investors and dealers in our guaranteed mortgage-related securities.
We acquire a significant portion of our loans from several lenders that are among the largest originators in the U.S. In addition, a significant portion of our single-family loans is serviced by several large servicers. The following charts show the concentration of our 2018 single-family purchase volume by our largest sellers and our loan servicing by our largest servicers as of
December 31, 2018
. Any seller or servicer with a 10% or greater share is listed separately.
|
FREDDIE MAC
| 2018 Form 10-K
|
41
|
|
|
Management's Discussion and Analysis
|
Our Business Segments |
Single-Family Guarantee
|
Percentage of Single-Family Purchase Volume

Percentage of Single-Family Servicing Volume
(1)

(1)
Percentage of servicing volume is based on the total single-family credit guarantee portfolio, excluding loans where we do not exercise control over the associated servicing.
For additional information about seller and servicer concentration risk and our relationships with our seller and servicer customers, see
Risk Management - Counterparty Credit Risk
-
Sellers and Servicers
and
Note 14
.
|
FREDDIE MAC
| 2018 Form 10-K
|
42
|
|
|
Management's Discussion and Analysis
|
Our Business Segments |
Single-Family Guarantee
|
Competition
Our principal competitors in the Single-family Guarantee segment are Fannie Mae, FHA/VA (with Ginnie Mae securitization), and other financial institutions that retain or securitize loans, such as commercial and investment banks, dealers, and savings institutions. We compete on the basis of price, products, securities structure, and service. Competition to acquire single-family loans can also be significantly affected by changes in our credit standards. The conservatorship, including direction provided to us by our Conservator, may affect our ability to compete. The areas in which we and Fannie Mae compete have been limited by the Single Security initiative as we have been required by FHFA to align certain of our single-family mortgage purchase offerings, servicing, and securitization practices with Fannie Mae to achieve market acceptance of the UMBS. A proposed rule published by FHFA in September 2018 may limit our and Fannie Mae's ability to compete with each other in areas that affect prepayment speeds of single-family mortgage-related securities. For more information, see
Risk Factors - Other Risks -
Competition from banking and non-banking institutions (including Fannie Mae and FHA/VA with Ginnie Mae securitization) may harm our business. FHFA's actions, as Conservator of both companies, could affect competition between us and Fannie Mae
.
|
FREDDIE MAC
| 2018 Form 10-K
|
43
|
|
|
Management's Discussion and Analysis
|
Our Business Segments |
Single-Family Guarantee
|
Market Conditions
The graphs and related discussion below present certain single-family market indicators, for the most recent five years, that can significantly affect the business and financial results of our Single-family Guarantee segment.

U.S. Single-Family Home Sales

Source: National Association of Realtors news release dated January 22, 2019.
|
n
|
U.S. single-family loan origination volumes decreased in 2018 compared to 2017, driven by lower refinance volume as a result of higher average mortgage interest rates.
|
|
n
|
U.S. single-family existing home sales volume decreased in 2018 compared to 2017, primarily driven by higher mortgage interest rates and low levels of for-sale inventory in many markets across the country. U.S. single-family new home sales volume is reported by the U.S. Census Bureau; 2018 data is not currently available.
|
|
n
|
In 2019, we expect U.S. single-family home purchase volume to remain relatively flat, while a moderate increase in mortgage interest rates is expected to result in a lower refinance volume. Freddie Mac's single-family loan purchase volumes typically follow a similar trend.
|
|
FREDDIE MAC
| 2018 Form 10-K
|
44
|
|
|
Management's Discussion and Analysis
|
Our Business Segments |
Single-Family Guarantee
|
Single-Family Mortgage Debt Outstanding as of December 31,

Source: Federal Reserve Financial Accounts of the United States of America dated December 6, 2018. For 2018, the amount is as of September 30, 2018 (latest available information).
Single-Family Serious Delinquency Rates as of December 31,

Source: National Delinquency Survey from the Mortgage Bankers Association. For 2018, the rates (excluding Freddie Mac) are as of September 30, 2018 (latest available information).
|
n
|
U.S. single-family mortgage debt outstanding increased in 2018 compared to 2017, primarily driven by house price appreciation. An increase in U.S. single-family mortgage debt outstanding, combined with our sustained market share, typically results in growth of our single-family credit guarantee portfolio.
|
|
n
|
The U.S. single-family serious delinquency rate decreased in 2018 compared to 2017 due to macroeconomic factors, such as a low unemployment rate and continued home price appreciation. Our single-family serious delinquency rate typically follows a similar trend. Additionally, the 2017 serious delinquency rate was elevated due to the greater impact of the hurricanes in 2017 than subsequent hurricanes in 2018. See
Risk Management - Single-Family Mortgage Credit Risk -
Monitoring Loan Performance and Characteristics of the Single-Family Credit Guarantee Portfolio and Individual Sellers and Servicers - Single-Family Credit Guarantee Portfolio
for additional information on our serious delinquency rate.
|
|
n
|
As reported by the U.S. Census Bureau, the U.S. homeownership rate was 64.4% in the third quarter of 2018 (latest available information) compared to a high point of 69.2% in the fourth quarter of 2004, and the average of 66.1% from 1990 to the present.
|
|
FREDDIE MAC
| 2018 Form 10-K
|
45
|
|
|
Management's Discussion and Analysis
|
Our Business Segments |
Single-Family Guarantee
|
Business Results
The following graphs and related discussion present the business results of our Single-family Guarantee segment.
New Business Activity

Number of Families Helped to Own a Home

|
n
|
We maintain a consistent market presence by providing lenders with a constant source of liquidity for conforming loan products. We have funded approximately
17.0 million
single-family homes since January 1, 2009 and purchased approximately
1.4 million
HARP loans since the initiative began in 2009, which includes just over 3,000 during 2018 as the program is winding down and is being replaced by the Enhanced Relief Refinance
program.
|
|
n
|
Our loan purchase and guarantee activity decreased in 2018 compared to 2017 primarily due to a decline in refinance activity as a result of higher average mortgage interest rates, partially offset by higher home purchase volume.
|
|
n
|
We continued working to improve access to affordable housing, including through our Home Possible
®
loan initiatives. Our Home Possible
®
loan initiatives offer down payment options as low as 3% and are designed to help qualified borrowers with limited savings buy a home. We purchased over 149,000 loans under these initiatives in 2018. We also continue to implement programs that support responsibly broadening access to affordable housing by:
|
|
l
|
Improving the effectiveness of pre-purchase and early delinquency counseling for borrowers;
|
|
l
|
Expanding our ability to support borrowers who do not have a credit score;
|
|
l
|
Implementing the Duty to Serve Underserved Markets plan; and
|
|
l
|
Increasing support for first-time home buyers and mortgage industry professionals.
|
|
FREDDIE MAC
| 2018 Form 10-K
|
46
|
|
|
Management's Discussion and Analysis
|
Our Business Segments |
Single-Family Guarantee
|
While we are responsibly expanding our programs and outreach capabilities to better serve low- and moderate-income borrowers and underserved markets, these loans result in increased credit risk. Expanding access to affordable housing will continue to be a top priority in 2019. See
Regulation and Supervision
-
Federal Housing Finance Agency - Duty to Serve Underserved Markets Plan
for more information.
Single-Family Credit Guarantee Portfolio


|
n
|
The single-family credit guarantee portfolio increased during 2018 by approximately 4%, driven by an increase in U.S. single-family mortgage debt outstanding as a result of continued home price appreciation. New business acquisitions had a higher average loan size compared to older vintages that continued to run off.
|
|
n
|
The core single-family loan portfolio grew to
82%
of the single-family credit guarantee portfolio at
December 31, 2018
compared to 78% at December 31, 2017, as new loan purchases exceeded liquidations.
|
|
n
|
The legacy and relief refinance single-family loan portfolio declined to
18%
of the single-family credit guarantee portfolio at
December 31, 2018
compared to 22% at December 31, 2017, driven primarily by loan liquidations.
|
|
FREDDIE MAC
| 2018 Form 10-K
|
47
|
|
|
Management's Discussion and Analysis
|
Our Business Segments |
Single-Family Guarantee
|
Guarantee Fees
We receive fees for guaranteeing the payment of principal and interest to investors in our mortgage-related securities. These fees consist primarily of a combination of base contractual guarantee fees paid on a monthly basis and initial upfront payments. The average portfolio Segment Earnings guarantee fee rate recognizes upfront fee income over the contractual life of the related loans (usually 30 years). If the related loans prepay, the remaining upfront fee income is recognized immediately. In contrast, the average guarantee fee rate charged on new acquisitions recognizes upfront fee income over the estimated life of the related loans using our expectations of prepayments and other liquidations. See
Single-Family Guarantee
- Business Overview - Guarantee Fees
for more information on our guarantee fees.

Average Guarantee Fee Rate
(1)
Charged on New Acquisitions for the Year Ended December 31,

(1) Excludes the legislated 10 basis point increase in guarantee fees.
(2) Reflects an average rate for our total single-family credit guarantee portfolio and is not limited to purchases in the applicable period.
|
n
|
The average portfolio Segment Earnings guarantee fee rate
declined slightly in 2018 compared to 2017 due to a decrease in the recognition of upfront fees driven by a lower prepayment rate. This decrease was partially offset by an increase in contractual guarantee fees as older vintages were replaced by acquisitions of new loans with higher contractual guarantee fees.
|
|
n
|
The average guarantee fee rate charged on new acquisitions
remained consistent in 2018 compared to 2017.
|
|
FREDDIE MAC
| 2018 Form 10-K
|
48
|
|
|
Management's Discussion and Analysis
|
Our Business Segments |
Single-Family Guarantee
|
CRT Activities
The table below provides the issuance amounts during 2018 and the cumulative issuance amounts as of December 31, 2018 on the protected UPB and maximum coverage by loss position associated with CRT transactions for loans in our single-family credit guarantee portfolio.
Table 12 - Single-Family Credit Guarantee Portfolio CRT Issuance
|
Issuance for the Year Ended December 31, 2018
|
Cumulative Issuance as of December 31, 2018
|
|||||||||||||||||||||||||
|
Protected UPB
(1)
|
Maximum Coverage
(2)
|
Protected UPB
(1)
|
Maximum Coverage
(2)
|
|||||||||||||||||||||||
|
(In millions)
|
Total
|
First Loss
(3)
|
Mezzanine
|
Total
|
Total
|
First Loss
(3)
|
Mezzanine
|
Total
|
||||||||||||||||||
|
CRT Activities:
|
||||||||||||||||||||||||||
|
STACR transactions
|
|
$243,007
|
|
|
$1,893
|
|
|
$5,042
|
|
|
$6,935
|
|
|
$1,059,528
|
|
|
$3,789
|
|
|
$27,054
|
|
|
$30,843
|
|
||
|
ACIS transactions
|
269,483
|
|
679
|
|
2,306
|
|
2,985
|
|
1,102,504
|
|
1,561
|
|
10,010
|
|
11,571
|
|
||||||||||
|
Senior subordinate securitization structures
|
30,911
|
|
746
|
|
1,238
|
|
1,984
|
|
42,489
|
|
1,823
|
|
2,121
|
|
3,944
|
|
||||||||||
|
Other
|
11,541
|
|
155
|
|
345
|
|
500
|
|
20,602
|
|
6,415
|
|
345
|
|
6,760
|
|
||||||||||
|
Less: UPB with more than one type of CRT activity
|
(219,072
|
)
|
—
|
|
—
|
|
—
|
|
(1,017,618
|
)
|
—
|
|
—
|
|
—
|
|
||||||||||
|
Total CRT Activities
|
|
$335,870
|
|
|
$3,473
|
|
|
$8,931
|
|
|
$12,404
|
|
|
$1,207,505
|
|
|
$13,588
|
|
|
$39,530
|
|
|
$53,118
|
|
||
(
1) For STACR and ACIS transactions, represents the UPB of the assets included in the reference pool. For senior subordinate securitization structure transactions, represents the UPB of the guaranteed securities.
|
(2)
|
For STACR transactions, represents the outstanding balance held by third parties. For ACIS transactions, represents the remaining aggregate limit of insurance purchased from third parties. For senior subordinate securitization structures, represents the UPB of the securities that are subordinate to our guarantee and held by third parties.
|
(3) First loss includes all B tranches in our STACR transactions and their equivalent in ACIS and Other CRT transactions.
n
We retained exposure to
$323.5 billion
and
$1,154.4 billion
of the protected UPB for the CRT issuances during 2018 and the cumulative issuances as of December 31, 2018, respectively, including first loss and mezzanine positions.
|
n
|
As of December 31, 2018, we had cumulatively transferred a portion of credit risk on nearly
$1.2 trillion
of our single-family mortgages, based upon the UPB at issuance of the CRT transactions.
|
|
l
|
FHFA's conservatorship capital needed for credit risk was reduced by approximately 60% through CRT transactions on new business activity in the twelve months ended December 31, 2017.
|
|
l
|
The reduction in the amount of conservatorship capital needed for credit risk on new business activity is calculated as conservatorship credit capital released from CRT transactions (primarily through STACR and ACIS) divided by total conservatorship credit capital on new business activity at the time of purchase. For more information on the CCF and the calculation of conservatorship capital, see
Liquidity and Capital Resources -
Capital Resources - Conservatorship Capital Framework - Return on Conservatorship Capital.
|
n
In September 2018, we modified our primary CRT structure to reduce conservatorship capital needed for credit risk by approximately
80%
on related new business activity. This modified structure sells more of the first loss position and extends the maturity from 12.5 to 30 years.
n
In 2018, we paid
$728 million
in interest expense, net of reinvestment income, on our outstanding STACR transactions and
$317 million
in ACIS premiums, compared to
$621 million
in interest
|
FREDDIE MAC
| 2018 Form 10-K
|
49
|
|
|
Management's Discussion and Analysis
|
Our Business Segments |
Single-Family Guarantee
|
expense, net of reinvestment income, on our outstanding STACR transactions and
$234 million
in ACIS premiums in 2017.
|
n
|
As of December 31, 2018, we had experienced minimal write-downs on our STACR transactions and filed minimal claims for reimbursement of losses under our ACIS transactions.
|
We are continually evaluating our credit risk transfer strategy and make changes depending on market conditions and our business strategy. The aggregate cost of our credit risk transfer activity, as well as the amount of risk transferred, will continue to increase as we continue to do new transactions.
Loss Mitigation Activities


|
n
|
We continue to help struggling families retain their homes or otherwise avoid foreclosure through loan workouts. Our loan workout activity increased in 2018 compared to 2017, primarily driven by the hurricanes in 2017.
|
|
n
|
As part of our strategy to mitigate losses and reduce our holdings of less liquid assets, we sold seriously delinquent loans totaling
$0.7 billion
in UPB during 2018. Of the
$20.9 billion
in UPB of single-family loans classified as held-for-sale at December 31, 2018,
$2.6 billion
related to loans that were seriously delinquent. We believe selling certain of these loans provides better economic returns than continuing to hold them.
|
|
n
|
The relief refinance program has been replaced with the Enhanced Relief Refinance program, which became available in January 2019 for loans originated on or after October 1, 2017. This program provides liquidity for borrowers who are current on their mortgages but are unable to refinance because their LTV ratios exceed our standard refinance limits. While the HARP program ended in December 2018, we will continue to purchase HARP loans with application received dates on or prior to December 31, 2018 through September 30, 2019.
|
See
Risk Management
for additional information on our loan workout activities.
|
FREDDIE MAC
| 2018 Form 10-K
|
50
|
|
|
Management's Discussion and Analysis
|
Our Business Segments |
Single-Family Guarantee
|
Financial Results
The table below presents the components of the Segment Earnings and comprehensive income for our Single-family Guarantee segment.
Table 13 - Single-Family Guarantee Segment Financial Results
|
Year Over Year Change
|
||||||||||||||||||||||
|
Year Ended December 31,
|
2018 vs. 2017
|
2017 vs. 2016
|
||||||||||||||||||||
|
(Dollars in millions)
|
2018
|
2017
|
2016
|
$
|
%
|
$
|
%
|
|||||||||||||||
|
Guarantee fee income
|
|
$6,570
|
|
|
$6,350
|
|
|
$6,356
|
|
|
$220
|
|
3
|
%
|
|
($6
|
)
|
—
|
%
|
|||
|
Benefit (provision) for credit losses
|
522
|
|
(770
|
)
|
(481
|
)
|
1,292
|
|
168
|
%
|
(289
|
)
|
(60
|
)%
|
||||||||
|
Financial instrument gains (losses)
(1)
|
174
|
|
(245
|
)
|
(391
|
)
|
419
|
|
171
|
%
|
146
|
|
37
|
%
|
||||||||
|
Other non-interest income (loss)
|
905
|
|
1,838
|
|
928
|
|
(933
|
)
|
(51
|
)%
|
910
|
|
98
|
%
|
||||||||
|
Administrative expense
|
(1,491
|
)
|
(1,381
|
)
|
(1,323
|
)
|
(110
|
)
|
(8
|
)%
|
(58
|
)
|
(4
|
)%
|
||||||||
|
REO operations income (expense)
|
(189
|
)
|
(203
|
)
|
(298
|
)
|
14
|
|
7
|
%
|
95
|
|
32
|
%
|
||||||||
|
Other non-interest expense
|
(1,639
|
)
|
(1,382
|
)
|
(1,169
|
)
|
(257
|
)
|
(19
|
)%
|
(213
|
)
|
(18
|
)%
|
||||||||
|
Segment Earnings before income tax expense
|
4,852
|
|
4,207
|
|
3,622
|
|
645
|
|
15
|
%
|
585
|
|
16
|
%
|
||||||||
|
Income tax expense
|
(944
|
)
|
(1,448
|
)
|
(1,185
|
)
|
504
|
|
35
|
%
|
(263
|
)
|
(22
|
)%
|
||||||||
|
Segment Earnings, net of taxes
|
3,908
|
|
2,759
|
|
2,437
|
|
1,149
|
|
42
|
%
|
322
|
|
13
|
%
|
||||||||
|
Total other comprehensive income (loss), net of tax
|
(3
|
)
|
40
|
|
(9
|
)
|
(43
|
)
|
(108
|
)%
|
49
|
|
544
|
%
|
||||||||
|
Total comprehensive income (loss)
|
|
$3,905
|
|
|
$2,799
|
|
|
$2,428
|
|
|
$1,106
|
|
40
|
%
|
|
$371
|
|
15
|
%
|
|||
|
(1)
|
Consists of fair value gains and losses on debt for which we have elected the fair value option and derivatives.
|
Key Drivers:
|
n
|
2018 vs. 2017
|
|
l
|
Continued growth in our single-family credit guarantee portfolio and increased credit fee/buy-down short-term returns, resulting in increased guarantee fee income.
|
|
l
|
Increased benefit for credit losses during 2018 primarily driven by estimated losses from the hurricanes in 2017.
|
|
l
|
Lower gains during 2018 compared to 2017 on single-family seasoned loan reclassifications between held-for-investment and held-for-sale.
|
|
l
|
Fair value gains on STACR debt notes during 2018 compared to fair value losses during 2017 as a result of market spreads between STACR yields and LIBOR widening during 2018, while spreads tightened during 2017.
|
|
l
|
Higher outstanding cumulative volumes of CRT transactions that resulted in increased CRT expense (interest expense on STACR transactions and premiums paid to ACIS counterparties) in 2018.
|
|
n
|
2017 vs. 2016
|
|
l
|
Continued growth in our single-family credit guarantee portfolio and higher average contractual guarantee fee rates, offset by lower upfront fee amortization due to lower prepayments, resulting in guarantee fee income remaining relatively unchanged.
|
|
l
|
Decline in benefit for credit losses primarily driven by estimated losses related to the hurricanes in 2017, offset by improvements in loss severity.
|
|
FREDDIE MAC
| 2018 Form 10-K
|
51
|
|
|
Management's Discussion and Analysis
|
Our Business Segments |
Single-Family Guarantee
|
l
Higher volume of reperforming loans reclassified from held-for-investment to held-for-sale and subsequently sold resulted in gains in 2017 compared to losses recognized on seriously delinquent loans in 2016.
|
l
|
Higher outstanding cumulative volumes of CRT transactions that resulted in increased credit risk transfer expense (interest expense on STACR debt notes and premiums paid to ACIS counterparties).
|
|
FREDDIE MAC
| 2018 Form 10-K
|
52
|
|
|
Management's Discussion and Analysis
|
Our Business Segments |
Multifamily
|
Multifamily
Business Overview
The Multifamily segment supports our primary business strategies by creating:
A Better Freddie Mac:
|
n
|
Continuing to provide financing to the multifamily mortgage market and expanding our market presence for workforce housing in line with our mission;
|
|
n
|
Improving our risk-adjusted returns by leveraging private capital in our risk transfer transactions;
|
|
n
|
Identifying new opportunities beyond our existing K Certificate and SB Certificate transactions to cost-effectively transfer risk to third parties and reduce taxpayer exposure; and
|
|
n
|
Maintaining strong credit and capital management discipline.
|
A Better Housing Finance System:
|
n
|
Operating in a customer focused manner to build business value and support the creation of a strong, long-lasting rental housing system;
|
|
n
|
Fostering innovation through the development of products that expand the availability of workforce housing in the marketplace; and
|
|
n
|
Leveraging technology to make the multifamily loan process more efficient industry-wide.
|
The Multifamily segment provides liquidity and support to the multifamily mortgage market through a variety of activities that include the purchase, guarantee, sale, and/or securitization of multifamily mortgage loans and mortgage-related securities. The overall market demand for multifamily loans is generally affected by local and regional economic factors, such as unemployment rates, construction cycles, property prices, preferences for homeownership versus renting, and the relative affordability of single-family homes, as well as certain macroeconomic factors, such as interest rates.
Our primary business model is to acquire multifamily loans for aggregation and then securitization through the issuance and guarantee of debt securities. The returns we generate from these activities are primarily derived from (i) the net interest income we earn on the loans prior to their securitization, (ii) the price received upon securitization of the loans versus the price we paid to acquire the loans, and (iii) the ongoing guarantee fee we receive in exchange for providing our guarantee primarily on the issued senior securities. We evaluate these factors collectively to maximize our returns and to assess the profitability of any given transaction.
Our securitization activities generally (i) provide us with a mechanism to finance our loan product offerings, (ii) transfer to third parties a large majority of expected and stress credit risk on the loans that we purchase, (iii) reduce our interest-rate risk exposure, and (iv) reduce our conservatorship capital under CCF. For multifamily loans that we do not intend to securitize, we may pursue other strategies, including structured sales or the execution of other risk transfer products designed to transfer to third parties all or a portion of the loans' interest-rate risk and credit risk, thereby reducing taxpayer exposure.
Our support of the multifamily market generally begins with our underwriting of the mortgage loans that we commit to purchase from our approved lenders and typically ends with the disposition of those loans, generally through a borrower payoff. Through our support of the multifamily mortgage market,
|
FREDDIE MAC
| 2018 Form 10-K
|
53
|
|
|
Management's Discussion and Analysis
|
Our Business Segments |
Multifamily
|
borrowers can obtain lower financing costs, which can benefit renters through lower rental rates and/or improved services or amenities.
Products and Activities
Loan Products
Through our network of approved lenders, we offer borrowers a variety of loan products for the acquisition, refinance, and/or rehabilitation of multifamily properties. While our approved lenders originate the loans that we purchase, we use a prior-approval underwriting approach, in contrast to the delegated underwriting approach used in our Single-family Guarantee segment. Under this approach, we maintain credit discipline by completing our own underwriting, credit review, and legal review for each loan, including review of third-party appraisals and cash flow analysis, prior to issuing a loan purchase commitment. We also price every loan or transaction based on the specific terms, structure, and type of execution.
Multifamily loans are typically originated by our lenders without recourse to the borrower, making repayment dependent on the cash flows generated by the underlying property. Cash flows generated by a property are significantly influenced by vacancy and rental rates, as well as conditions in the local rental market, the physical condition of the property, the quality of property management, and the level of operating expenses.
Our primary multifamily loan products include the following:
|
n
|
Conventional loans
- Financing that includes fixed-rate and floating-rate loans, loans in lease-up and with moderate property upgrades, manufactured housing community loans, senior housing loans, student housing loans, supplemental loans, and certain Green Advantage loans.
|
|
n
|
Small balance loans
- Financing provided to small rental property borrowers for the acquisition or refinance of multifamily properties. Financing ranges from $1 million to $7.5 million and is focused on affordable or workforce housing properties from 5 to 50 units.
|
|
n
|
Targeted affordable housing
- Financing provided to borrowers in underserved areas that have restricted units affordable to households with low income (earning up to 80% of the area median income) and very-low income (earning up to 50% of the area median income) and that typically receive government subsidies.
|
The amount and type of multifamily loans that we purchase is significantly influenced by the production cap that is established by the annual Conservatorship Scorecard, which limits the aggregate UPB of multifamily loans we may purchase in a year. While purchases of certain multifamily loans are subject to the cap, purchases of multifamily loans that support workforce housing in affordable and underserved markets and that support improvements to energy or water efficiency are generally not subject to the cap. Examples of multifamily loans that are either not subject to the cap or only partially subject to the cap include certain senior housing loans, small balance loans, manufactured housing loans, targeted affordable housing loans, and Green Advantage loans.
In addition, the amount and type of multifamily loans that we purchase is influenced by our current business strategy (e.g., whether to maintain or grow our share of the multifamily mortgage market) and overall market demand for multifamily loan products.
|
FREDDIE MAC
| 2018 Form 10-K
|
54
|
|
|
Management's Discussion and Analysis
|
Our Business Segments |
Multifamily
|
Index Lock Commitments
We offer borrowers an option to lock the Treasury index component of their fixed interest-rate loans at any time after the loan is under application with an approved lender. This option enables borrowers to lock the most volatile part of their coupon, thereby providing an enhanced level of risk mitigation against interest-rate volatility. The index lock commitment period for most loans is 60 days and is generally followed by a loan purchase commitment. These commitments do not qualify for accounting recognition and therefore temporarily introduce volatility in our financial results until they proceed to a loan purchase commitment.
We economically hedge our interest-rate exposure resulting from these commitments primarily by entering into pay-fixed, receive-float interest rate swaps.
|
The primary impact to Segment Earnings is:
|
|
|
•
|
Fair value gains or losses recognized on interest-rate derivatives. These gains or losses are offset once an index lock commitment becomes a loan purchase commitment and is accounted for at fair value.
|
Loan Purchase Commitments
Prior to issuing an unconditional commitment to purchase a multifamily loan, we negotiate with the lender and borrower to determine the specific economic terms and conditions of our commitment, including the loan's purchase price, index, or mortgage spread. During periods when we seek to increase our share of the total multifamily mortgage debt outstanding, we strategically bid more competitively, generally resulting in a higher commitment price or lower mortgage spread, and potentially reduced profitability.
At the time we commit to purchase a multifamily loan, we preliminarily determine our intent with respect to that loan. For commitments to purchase loans that we intend to sell or securitize (i.e., held-for-sale commitments), we elect the fair value option and therefore recognize and measure these commitments at fair value on our consolidated financial statements. No such election is made for commitments to purchase loans that we intend to hold for the foreseeable future (i.e., held-for-investment commitments), and therefore these commitments are not recognized on our consolidated financial statements.
|
The primary impacts to Segment Earnings are:
|
|
|
•
|
For each of our held-for-sale commitments, at the commitment date, we recognize the estimated fair value of the commitment, which represents the gain we expect to realize on the sale of the loan. This unrealized gain, which results from our ability to purchase loans in the whole loan market while exiting through the securitization market, effectively represents the incremental benefit that can be realized by accessing the securitization market;
|
|
•
|
After the commitment date, but prior to settlement, we recognize changes in the fair value of the commitment. These fair value adjustments result from changes in the pricing of our securitizations due to changes in interest rates and securitization market spreads; and
|
|
•
|
Fair value gains or losses recognized on interest-rate derivatives.
|
Loan Purchases
When we purchase a loan, we finalize our intent with respect to that loan. Multifamily loans that we intend to hold for the foreseeable future are classified as held-for-investment and measured at amortized cost, while multifamily loans that we intend to sell or securitize are classified as held-for-sale and typically measured at fair value through a separate fair value option election.
|
FREDDIE MAC
| 2018 Form 10-K
|
55
|
|
|
Management's Discussion and Analysis
|
Our Business Segments |
Multifamily
|
The vast majority of all new multifamily loan purchases are initially classified as held-for-sale and included in our securitization pipeline. The holding period for loans in our securitization pipeline generally ranges between two and five months, as we aggregate sufficient loans with similar terms and risk characteristics to securitize. For example, loans purchased during the first quarter will generally be used as collateral for securitizations that occur in the second and third quarters of that same year.
Our multifamily held-for-sale commitments and held-for-sale loans are subject to changes in fair value due to two main risks: (i) interest-rate risk and (ii) spread risk. While we use derivatives to economically hedge the interest rate-related fair value changes of most of our multifamily commitments and loans measured at fair value, we continue to be exposed to spread-related fair value changes. We partially reduce our spread-related fair value exposure by purchasing or entering into certain spread-related derivatives, thereby obtaining some protection against significant adverse movements in market spreads. We refer to the fair value adjustments resulting from changes in these risks, net of any offsetting fair value adjustments from our derivatives, as our holding period fair value gains and losses.
|
The primary impacts to Segment Earnings are:
|
|
|
•
|
During the holding period, we recognize changes in the fair value of loans classified as held-for-sale. These fair value adjustments result from changes in the pricing of our securitizations due to changes in interest rates and securitization market spreads;
|
|
•
|
Fair value gains or losses recognized on interest-rate derivatives. These changes generally offset interest-rate related fair value changes on the loans;
|
|
•
|
Fair value gains or losses recognized on spread-related derivatives. These changes may offset spread-related fair value changes on the loans; and
|
|
•
|
Interest income on loans while held in our mortgage-related investments portfolio.
|
Securitization, Guarantee, and Other Risk Transfer Products
In our Multifamily segment, we enter into various types of securitizations and other risk transfer products that generally result in the transfer of all or a portion of the underlying collateral's interest-rate risk and/or credit risk to third parties. These activities, except for our other risk transfer products (e.g., loan sales and SCR notes), make up our guarantee portfolio.
The collateral used in our securitization activities can vary and may include loans underwritten and purchased by us at loan origination or loans we do not own prior to securitization and that we underwrite after (rather than at) origination. In our typical securitizations, we guarantee the issued senior securities. In exchange for providing this guarantee, we receive an ongoing guarantee fee that is commensurate with the risks assumed and that will, over the long-term, provide us with guarantee fee income that is expected to exceed the credit-related and administrative expenses of the underlying loans. Structural deal features, such as term, type of underlying loan product, and subordination levels, generally influence the deal's risk profile, which ultimately affects the guarantee fee rate we set at the time of securitization.
Our typical securitization structure and level of subordination are designed to obtain a AAA credit rating on the guaranteed securities to maximize the return we earn when we sell loans for securitization. Depending on the securitization product and subordination levels selected, we may realize a higher (lower) gain on sale, but recognize lower (higher) ongoing guarantee fee income.
|
FREDDIE MAC
| 2018 Form 10-K
|
56
|
|
|
Management's Discussion and Analysis
|
Our Business Segments |
Multifamily
|
We continue to seek new and innovative risk transfer opportunities beyond our current product offerings so that we can provide further liquidity to the multifamily market and reduce taxpayer exposure to interest-rate risk and credit risk.
Primary Risk Transfer Securitization Activities
Our primary risk transfer securitization products are K Certificates and SB Certificates, which transfer substantially all of the interest-rate risk and credit risk of the associated collateral. The structures of these transactions typically involve the issuance of senior, mezzanine, and subordinated securities that represent undivided beneficial interests in trusts that hold pools of multifamily loans that we previously purchased. The volume of our primary risk transfer securitizations is generally influenced by the size of our securitization pipeline, along with market demand for multifamily securities. As shown in the diagram below, in a typical K Certificate transaction, we sell multifamily loans to a non-Freddie Mac securitization trust that issues senior, mezzanine, and subordinated securities, and simultaneously purchase and place the senior securities into a Freddie Mac securitization trust that issues guaranteed K Certificates. In these transactions, we guarantee the senior securities, but do not issue or guarantee the mezzanine or subordinated securities. As a result, the interest-rate risk and a large majority of expected and stress credit risk is sold to third-party investors through the mezzanine and subordinated securities, thereby reducing our risk exposure.

|
n
|
K Certificates
- Regularly issued structured pass-through securities backed by recently originated multifamily loans. This product provides investors with a wide-range of structural and collateral options that provide for stable cash flows and a structured credit enhancement. While the amount of guarantee fee we receive may vary by collateral type, it is generally fixed for those K Certificate series that we issue with regular frequency (e.g., 5, 7, and 10-year fixed-rate K Certificates and our Floating Rate K Certificates). The guarantee fee received on these standard K Certificates currently ranges between 20 basis points and 45 basis points.
|
|
FREDDIE MAC
| 2018 Form 10-K
|
57
|
|
|
Management's Discussion and Analysis
|
Our Business Segments |
Multifamily
|
The guarantee fee on K Certificates that we do not issue on a regular basis, such as our single-sponsor K Certificates, is determined based on the specific risks associated with the underlying collateral and the structure of the securitization, including tranche sizes and risk distribution.
|
n
|
SB Certificates
- Regularly issued securities typically backed by multifamily small balance loans that we underwrite at loan origination and purchase prior to securitization. Similar to our K Certificate transactions, a non-Freddie Mac trust will issue the senior classes of securities, which we guarantee, as well as the unguaranteed subordinated securities. However, unlike our K Certificate transactions, while we may purchase a portion of the senior securities, we do not place those securities into a Freddie Mac trust. The guarantee fee we receive in these transactions is generally 35 basis points.
|
From time to time, we may undertake certain activities to support the liquidity of K Certificates and SB Certificates. For more information, see
Risk Factors - Other Risks -
The profitability of our multifamily business could be adversely affected by a significant decrease in demand for our K Certificates and SB Certificates.
Other Risk Transfer Securitizations
Our other risk transfer securitizations involve the issuance of single-class or multi-class pass-through securities that represent beneficial interests in trusts that hold pools of multifamily loans. We guarantee the single-class securities and may guarantee some or all of the multi-class securities. The collateral for these securitizations may include loans underwritten and purchased by us at loan origination or loans we do not own prior to securitization and that we underwrite after (rather than at) origination.
Our other risk transfer securitizations include the following:
|
n
|
PCs
- We securitize multifamily loans into fixed-rate pass-through securities that are similar in structure to our Single-family Guarantee segment fixed-rate PCs. In these securitizations, we guarantee the full payment of principal and timely payment of interest and direct loss mitigation activities. As a result, we consolidate this structure.
|
|
n
|
K Certificates without subordination
- We securitize multifamily loans that we own and issue K Certificates without subordination using a transaction structure similar to our K Certificates. However, unlike K Certificates, these transactions are fully guaranteed by Freddie Mac and no mezzanine or subordinated securities are issued. In addition, we direct loss mitigation activities and, as a result, we consolidate this structure.
|
|
n
|
ML Certificates
- We securitize pools of tax-exempt or taxable loans that we underwrite and own prior to securitization and the trust issues both guaranteed senior ML Certificates and unguaranteed subordinated ML Certificates.
|
|
n
|
Multifamily Aggregation Risk Transfer Certificates (KT Certificates)
- These securities are backed by a revolving pool of multifamily loans that are awaiting sale into a K Certificate transaction. Using this structure, we issue guaranteed senior certificates generally purchased by Freddie Mac and unguaranteed mezzanine and subordinated securities to third parties. During the revolving period of this product, we will purchase loans from the KT trust for sale into a K Certificate transaction and replace those purchased loans with additional eligible loans. Through this product, we transfer a portion of the front-end credit risk associated with our securitization pipeline prior to final securitization. Given our right to purchase loans from the KT trust along with our guarantee of the senior certificates, we consolidate this structure and the loans in the revolving pool remain in our securitization pipeline until securitization.
|
|
n
|
KI Certificates
- We issue KI Certificates using a securitization structure that is similar to our K
|
|
FREDDIE MAC
| 2018 Form 10-K
|
58
|
|
|
Management's Discussion and Analysis
|
Our Business Segments |
Multifamily
|
Certificates and that provides for structural credit enhancements through subordination. However, unlike K Certificates, the loans backing the KI Certificates are contributed by third-party whole loan funds.
|
n
|
Q Certificates
- We issue Q Certificates using a securitization structure that is similar to our K Certificates and that provides for structural credit enhancements that may include either subordination or other loss sharing features. However, unlike K Certificates, the loans backing the Q Certificates are contributed by third parties (i.e., we do not own them prior to securitization) and are underwritten by us after (rather than at) origination.
|
|
n
|
M Certificates
- We securitize pools of tax-exempt or taxable multifamily housing revenue bonds typically contributed by third parties and issue guaranteed senior M Certificates and unguaranteed subordinated M Certificates.
|
Summary of Our Primary Business Model and Its Impacts to Segment Earnings
The following diagram summarizes the activities included in our primary business model and the corresponding impacts to our Segment Earnings.

Other Risk Transfer Products
For the multifamily assets for which we have not transferred interest-rate risk or credit risk through securitizations, we may pursue other strategies to reduce our risk exposure. Our other risk transfer products include the following:
|
n
|
SCR notes
- Through the issuance of our SCR notes, which are unsecured and unguaranteed corporate debt obligations, we transfer to third parties a portion of the credit risk of the loans underlying certain of our consolidated other risk transfer securitizations and certain of our other mortgage-related guarantees. The interest we pay on our SCR notes effectively reduces the guarantee fee income we would otherwise earn on the other mortgage-related guarantees. SCR notes are generally similar in structure to our Single-family Guarantee segment's STACR debt notes.
|
|
n
|
Loan sales
-
To reduce our interest-rate risk and credit risk exposure related to certain loans, we engage in non-securitization related transactions, including whole loan sales. These may include
|
|
FREDDIE MAC
| 2018 Form 10-K
|
59
|
|
|
Management's Discussion and Analysis
|
Our Business Segments |
Multifamily
|
sales to funds to which we may also provide secured financing.
|
n
|
Multifamily Credit Insurance Pool (MCIP)
- Beginning in 4Q 2018, we purchased insurance policies, generally underwritten by a group of insurers and reinsurers, that provide first loss credit protection for certain specified credit events. These transactions are similar in structure to the ACIS contracts purchased by the Single-family Guarantee segment, except the reference pool, in addition to loans, may include bonds underlying our other mortgage-related guarantees. When specific credit events occur, we receive compensation from the insurance policy up to an aggregate limit based on actual losses. We require our counterparties to partially collateralize their exposure to reduce the risk that we will not be reimbursed for our claims under the policies.
|
Other Guarantee Activities
|
n
|
Other mortgage-related guarantees
-
We guarantee mortgage-related assets held by third parties in exchange for guarantee fee income, without securitizing those assets. For example, we provide guarantees on certain tax-exempt multifamily housing revenue bonds secured by low- and moderate-income multifamily loans. The guarantee fees we receive on these transactions are negotiated.
|
Investing Activities
|
n
|
Mortgage loans
- We hold a portfolio of multifamily mortgage loans as part of a buy-and-hold investment strategy. Although we continue to purchase new multifamily mortgage loans for this portfolio, our new purchase activity has leveled off as this buy-and-hold strategy is not part of our primary business model.
|
|
n
|
Agency mortgage-related securities
- We generally purchase or retain a portion of the K Certificates and SB Certificates, depending on market conditions, and we may also buy or sell these securities in the secondary market.
|
|
n
|
Other investments
- We invest in certain non-mortgage investments, including LIHTC partnerships and other secured lending activities. These LIHTC partnerships invest directly in limited partnerships that own and operate affordable multifamily rental properties that generate federal income tax credits and deductible operating losses.
|
|
n
|
Non-agency mortgage-related securities
- We may purchase a portion of the unguaranteed mezzanine and subordinated securities related to our securitization transactions, depending on market conditions. However, to date, we have not purchased any of the unguaranteed subordinated securities that are in the first loss position.
|
Customers
Our multifamily loan activity is sourced through our approved lenders, who are primarily non-bank real estate finance companies and banks. We generally provide post-construction financing to apartment project operators with established performance records. The following charts show the concentration of our 2018 multifamily new business activity by our largest sellers and loan servicing by our largest servicers as of
December 31, 2018
. Any seller or servicer with a 10% or greater share is listed separately.
|
FREDDIE MAC
| 2018 Form 10-K
|
60
|
|
|
Management's Discussion and Analysis
|
Our Business Segments |
Multifamily
|
Percentage of Multifamily New Business Activity
(1)

(1) Excludes LIHTC new business activity.
Percentage of Multifamily Servicing Volume
(2)

(2) Excludes loans underlying securitizations where we are not in a first loss position, primarily K Certificates and SB Certificates.
Competition
We compete on the basis of price, service and products, including our use of certain securitization structures. Our principal competitors in the multifamily market are Fannie Mae, FHA, commercial and investment banks, CMBS conduits, savings institutions, and life insurance companies.
|
FREDDIE MAC
| 2018 Form 10-K
|
61
|
|
|
Management's Discussion and Analysis
|
Our Business Segments |
Multifamily
|
Market Conditions
The graphs and related discussion below present certain multifamily market indicators that can significantly affect the business and financial results of our Multifamily segment.
Apartment Vacancy Rates as of December 31 and Change in Effective Rents for the Year Ended December 31,

Source: REIS, Inc.
Apartment Completions and Net Absorption for the Year Ended December 31,

Source: REIS, Inc.
|
n
|
Apartment completions are an indication of the supply of rental housing. Net absorption, which is a measurement of the rate at which available apartments are occupied, is an indication of demand for rental housing.
|
|
n
|
While vacancy rates increased during 2018, as apartment completions outpaced net absorption, rates remain below the long-term average of
5.4%
from 2000 to 2018. Although we expect continued strong demand, it may take longer to absorb new units, resulting in renters possibly receiving additional concessions in 2019 compared to prior years.
|
|
n
|
Growth in effective rent (i.e., the average rent paid by the tenant over the term of the lease, adjusted for concessions by the landlord and costs borne by the tenant) for 2018 remained strong relative to the long-term average of
3.1%
from 2000 to 2018. The strong effective rent is primarily due to an increase in potential renters driven by healthy employment levels, higher wages, higher single-family home prices, rising mortgage interest rates, and a growing demand for rental housing due to lifestyle changes and demographic trends.
|
|
n
|
Multifamily property prices continued to grow, with
9%
annualized growth in 2018, indicating a healthy multifamily market, though prices were tempered by higher vacancy rates and rising interest rates.
|
|
FREDDIE MAC
| 2018 Form 10-K
|
62
|
|
|
Management's Discussion and Analysis
|
Our Business Segments |
Multifamily
|
Multifamily Mortgage Debt Outstanding as of December 31,
 Source: Federal Reserve Financial Accounts of the United States of America. For 2018, the amount is as of September 30, 2018 (latest available information).
Multifamily Delinquency Rates as of December 31,

Source: Freddie Mac, FDIC Quarterly Banking Profile, Trepp, LLC, Intex Solutions, Inc., and Wells Fargo Securities (Multifamily CMBS market, excluding REOs), American Council of Life Insurers (ACLI). For 2018, the amounts for FDIC insured institutions and ACLI investment bulletin are as of September 30, 2018 and the amount for Multifamily CMBS market is as of December 31, 2018 (latest available information).
|
n
|
During 2018, the multifamily mortgage market grew because of continued strong demand for multifamily loan products due to an elevated number of new apartment completions and strong multifamily market fundamentals. Multifamily market fundamentals were primarily driven by a healthy job market, population growth, high propensity to rent among young adults, and rising single-family home prices. We expect continued growth in the multifamily mortgage market during 2019 due to these same drivers.
|
|
n
|
While the multifamily mortgage market grew, our share of multifamily mortgage debt outstanding remained flat during 2018 due to ongoing competition from other market participants, which we expect to continue in the future.
|
|
n
|
Our multifamily delinquency rates during 2018 remained low compared to other industry participants, ending the year at 1 basis point, primarily due to our prior-approval underwriting approach and strong multifamily market fundamentals. See
Risk Management - Multifamily Mortgage Credit Risk -
Managing Our Portfolio, Including Loss Mitigation Activities
for additional information on our delinquency rates.
|
|
FREDDIE MAC
| 2018 Form 10-K
|
63
|
|
|
Management's Discussion and Analysis
|
Our Business Segments |
Multifamily
|
|
n
|
We expect the credit losses and delinquency rates for the multifamily mortgage portfolio to remain low in the near term.
|
K Certificate Benchmark Spreads as of December 31,

Source: Independent Dealers
|
n
|
The valuation of our securitization pipeline and the profitability of our primary risk transfer securitization product, the K Certificate,
are affected by both changes in K Certificate benchmark spreads and deal-specific attributes, such as tranche size, risk distribution, and collateral characteristics (loan term, coupon type, prepayment restrictions, and underlying property type). These market spread movements and deal-specific attributes contribute to our earnings volatility, which we manage by controlling the size of our securitization pipeline and by entering into certain spread-related derivatives. Spread tightening generally results in fair value gains, while spread widening generally results in fair value losses.
|
|
n
|
K Certificate benchmark spreads are market-quoted spreads over the U.S. swap curve. The 10-year fixed-rate spread represents the spread for the largest guaranteed class of a typical fixed-rate K Certificate, while the 7-year floating-rate spread represents the spread for the largest guaranteed class of a typical floating-rate K Certificate.
|
|
FREDDIE MAC
| 2018 Form 10-K
|
64
|
|
|
Management's Discussion and Analysis
|
Our Business Segments |
Multifamily
|
Business Results
The graphs, tables and related discussion below present the business results of our Multifamily segment.
New Business Activity

Acquisition of Units by Area Median Income (AMI) for the Year Ended December 31,

|
n
|
The 2018 Conservatorship Scorecard annual production cap was $35.0 billion and will remain unchanged in 2019. The production cap is subject to reassessment throughout the year by FHFA to determine whether an increase in the cap is appropriate based on a stronger than expected overall market.
|
|
n
|
In 3Q 2018, we began to invest in LIHTC fund partnerships. The reported LIHTC new business activity reflects our total new capital commitments to these fund partnerships, of which we have funded
$71 million
as of December 31, 2018.
|
|
FREDDIE MAC
| 2018 Form 10-K
|
65
|
|
|
Management's Discussion and Analysis
|
Our Business Segments |
Multifamily
|
|
n
|
Outstanding commitments, including index lock commitments, and commitments to purchase or guarantee multifamily assets were
$18.7 billion
and $14.5 billion as of December 31, 2018 and December 31, 2017, respectively. Both period-end balances include loan purchase commitments where we have elected the fair value option.
|
|
n
|
The combination of our new business activity and outstanding commitments was higher for 2018 than 2017 due to continued strong demand for multifamily loan products, our continued competitive pricing efforts, and new LIHTC investment activity.
|
|
n
|
Excluding our LIHTC new business activity, approximately
42%
of our multifamily new business activity for 2018 counted towards the 2018 Conservatorship Scorecard production cap, while the remaining
58%
was considered uncapped.
|
|
n
|
Our uncapped new business activity increased during 2018 compared to 2017 as we continued our efforts to support borrowers in certain property types and communities that meet the criteria for affordability and Green Advantage loans.
|
|
n
|
Approximately
90%
of our 2018 new business activity compared to 88% of our 2017 new business activity was intended for our securitization pipeline. Combined with market demand for our securities, our 2018 new business activity will be a driver for securitizations in the first two quarters of 2019.
|
|
n
|
Approximately
93%
of the eligible units we financed during 2018 were affordable to households earning at or below 120% of the median income in their area. Furthermore, during 2018, we continued our support of workforce housing through our continued purchases of manufactured housing community loans and small balance loans.
|
Multifamily Portfolio and Market Support
Multifamily Market Support
The following table summarizes our support of the multifamily market.
Table 14 - Multifamily Market Support
|
(In millions)
|
December 31, 2018
|
December 31, 2017
|
|||||
|
Guarantee portfolio
|
|
$237,323
|
|
|
$203,074
|
|
|
|
Mortgage-related investments portfolio:
|
|||||||
|
Unsecuritized mortgage loans held-for-sale
|
23,959
|
|
20,537
|
|
|||
|
Unsecuritized mortgage loans held-for-investment
|
10,828
|
|
17,702
|
|
|||
|
Mortgage-related securities
(1)
|
7,385
|
|
7,451
|
|
|||
|
Total mortgage-related investments portfolio
|
42,172
|
|
45,690
|
|
|||
|
Other investments
(2)
|
708
|
|
473
|
|
|||
|
Total multifamily portfolio
|
280,203
|
|
249,237
|
|
|||
|
Add: Unguaranteed securities
(3)
|
35,835
|
|
30,890
|
|
|||
|
Less: Acquired mortgage-related securities
(4)
|
(7,160
|
)
|
(7,109
|
)
|
|||
|
Total multifamily market support
|
|
$308,878
|
|
|
$273,018
|
|
|
|
(1)
|
Includes mortgage-related securities acquired by us from our securitizations.
|
|
(2)
|
Includes the carrying value of LIHTC investments and the UPB of non-mortgage loans, including financing provided to whole loan funds.
|
|
(3)
|
Reflects the UPB of unguaranteed securities issued as part of our securitizations and amounts related to loans sold to whole loan funds that were not financed by Freddie Mac.
|
|
(4)
|
Reflects the UPB of mortgage-related securities that were both issued as part of our securitizations and acquired by us. This UPB must be removed to avoid double-counting the exposure, as it is already reflected within the guarantee portfolio or unguaranteed securities.
|
|
FREDDIE MAC
| 2018 Form 10-K
|
66
|
|
|
Management's Discussion and Analysis
|
Our Business Segments |
Multifamily
|
|
n
|
Our total multifamily portfolio increased during 2018, primarily due to our strong loan purchase and securitization activity, which is attributable to healthy multifamily market fundamentals and a strong demand for certain of our securitization products. We expect continued portfolio growth in 2019 as purchase and securitization activities should outpace run off.
|
|
n
|
At December 31, 2018, approximately
74%
of our held-for-sale loans and held-for-sale loan commitments, both of which are measured at fair value, were fixed-rate, while the remaining
26%
were floating-rate.
|
|
n
|
We expect our guarantee portfolio to continue to grow as a result of ongoing securitizations, which we expect to be driven by continued strong new business activity.
|
Net Interest Yield and Average Balance
Net Interest Yield Earned & Average Investment Portfolio Balance

|
FREDDIE MAC
| 2018 Form 10-K
|
67
|
|
|
Management's Discussion and Analysis
|
Our Business Segments |
Multifamily
|
|
n
|
Net interest yield increased during 2018 compared to 2017 primarily due to higher prepayment income received from interest-only securities, coupled with an increase in our interest-only security holdings which generally have higher yields relative to our non-interest-only securities and loans, partially offset by higher average funding costs on our held-for-sale mortgage loans driven by higher interest rates.
|
|
n
|
The weighted average portfolio balance of interest-earning assets decreased during 2018 due to the run off of our held-for-investment loans.
|
Risk Transfer Activity

Credit Risk Transfer Activity for the Year Ended December 31,
(1)

(1) The amounts disclosed in the graph above represent the net credit risk transferred to third parties.
|
n
|
The UPB of our primary risk transfer securitization transactions was higher in 2018 compared to 2017, primarily due to a larger average balance in our securitization pipeline, which was driven by strong loan purchase activity and demand for our securities during 2018.
|
|
FREDDIE MAC
| 2018 Form 10-K
|
68
|
|
|
Management's Discussion and Analysis
|
Our Business Segments |
Multifamily
|
|
n
|
In addition to transferring a large majority of the expected and stress credit risk, nearly all of our risk transfer securitization activities also shifted substantially all the interest-rate and liquidity risk associated with the underlying collateral away from Freddie Mac to third-party investors.
|
|
n
|
As of December 31, 2018, we had cumulatively transferred the large majority of credit risk on the multifamily guarantee portfolio.
|
|
l
|
Conservatorship capital needed for credit risk was reduced by approximately 90% through CRT transactions on new business activity in the twelve months ended December 31, 2017; we plan similar risk reduction transactions for this year's new business activity.
|
|
l
|
The reduction in the amount of conservatorship capital needed for credit risk on new business activity is calculated as conservatorship credit capital released from CRT transactions (primarily through K Certificates and SB Certificates) divided by total conservatorship credit capital on new business activity. For more information on the CCF and the calculation of conservatorship capital, see
Liquidity and Capital Resources -
Capital Resources -
Conservatorship Capital Framework -
Return on Conservatorship Capital
.
|
|
n
|
While our K Certificate and SB Certificate issuances continue to be our primary mechanism to transfer multifamily mortgage credit risk and interest-rate risk, we employ other methods as well and expect to continue to develop new risk transfer initiatives.
|
|
FREDDIE MAC
| 2018 Form 10-K
|
69
|
|
|
Management's Discussion and Analysis
|
Our Business Segments |
Multifamily
|
Guarantee Activities

Remaining Unearned Guarantee Fees as of December 31,

|
n
|
We earn guarantee fees in exchange for providing our guarantee of some or all of the securities we issue as part of our risk transfer securitization activities. Each time we enter into a financial guarantee contract, we initially recognize unearned guarantee fees on our balance sheet, which represent the present value of future guarantee fees we expect to receive in cash. We recognize these fees in Segment Earnings over the remaining average guarantee term, which was eight years as of December 31, 2018. While we expect to collect these future fees based on historical performance, the actual amount collected will depend on the performance of the underlying collateral subject to our financial guarantee.
|
n
New unearned guarantee fee assets decreased during 2018 compared to 2017 primarily due to a change in the product mix of our securitizations, resulting in a lower average guarantee fee rate due to underlying loan products that, by their nature and design, have less risk.
|
n
|
The balance of unearned guarantee fees increased during 2018 due to the continued growth of our multifamily guarantee business, as our risk transfer securitization volume continued to be strong, outpacing run off.
|
|
FREDDIE MAC
| 2018 Form 10-K
|
70
|
|
|
Management's Discussion and Analysis
|
Our Business Segments |
Multifamily
|
Financial Results
The table below presents the components of the Segment Earnings and comprehensive income for our Multifamily segment.
Table 15 - Multifamily Segment Financial Results
|
Year Over Year Change
|
||||||||||||||||||||||
|
Year Ended December 31,
|
2018 vs. 2017
|
2017 vs. 2016
|
||||||||||||||||||||
|
(Dollars in millions)
|
2018
|
2017
|
2016
|
$
|
%
|
$
|
%
|
|||||||||||||||
|
Net interest income
|
|
$1,096
|
|
|
$1,206
|
|
|
$1,022
|
|
|
($110
|
)
|
(9
|
)%
|
|
$184
|
|
18
|
%
|
|||
|
Guarantee fee income
|
817
|
|
676
|
|
511
|
|
141
|
|
21
|
|
165
|
|
32
|
|
||||||||
|
Benefit (provision) for credit losses
|
24
|
|
(13
|
)
|
22
|
|
37
|
|
285
|
|
(35
|
)
|
(159
|
)
|
||||||||
|
Financial instrument gains (losses)
(1)
|
(1
|
)
|
1,504
|
|
1,354
|
|
(1,505
|
)
|
(100
|
)
|
150
|
|
11
|
|
||||||||
|
Administrative expense
|
(437
|
)
|
(395
|
)
|
(362
|
)
|
(42
|
)
|
(11
|
)
|
(33
|
)
|
(9
|
)
|
||||||||
|
Other non-interest income (expense)
|
139
|
|
96
|
|
161
|
|
43
|
|
45
|
|
(65
|
)
|
(40
|
)
|
||||||||
|
Segment Earnings before income tax expense
|
1,638
|
|
3,074
|
|
2,708
|
|
(1,436
|
)
|
(47
|
)
|
366
|
|
14
|
|
||||||||
|
Income tax expense
|
(319
|
)
|
(1,060
|
)
|
(890
|
)
|
741
|
|
70
|
|
(170
|
)
|
(19
|
)
|
||||||||
|
Segment Earnings, net of taxes
|
1,319
|
|
2,014
|
|
1,818
|
|
(695
|
)
|
(35
|
)
|
196
|
|
11
|
|
||||||||
|
Total other comprehensive income (loss), net of tax
|
(83
|
)
|
(77
|
)
|
(236
|
)
|
(6
|
)
|
(8
|
)
|
159
|
|
67
|
|
||||||||
|
Total comprehensive income (loss)
|
|
$1,236
|
|
|
$1,937
|
|
|
$1,582
|
|
|
($701
|
)
|
(36
|
)%
|
|
$355
|
|
22
|
%
|
|||
|
(1)
|
Consists of fair value gains and losses on loan purchase commitments, mortgage loans and debt for which we have elected the fair value option, investment securities, and derivatives.
|
Key Drivers:
|
n
|
2018 vs. 2017
|
|
l
|
Lower net interest income due to a decline in our weighted average portfolio balance of interest-earning assets, partially offset by higher net interest yields on an increased balance of interest-only securities.
|
|
l
|
Higher guarantee fee income due to continued growth in our multifamily guarantee portfolio, partially offset by lower average guarantee fee rates on new guarantee business volume.
|
|
l
|
Spread widening during 2018, coupled with the effects of greater competitive pricing on new business activity, resulted in fair value losses on mortgage loans and commitments and mortgage-related securities.
|
|
n
|
2017 vs. 2016
|
|
l
|
Higher net interest income due to higher net interest yields, partially offset by a decline in our weighted average portfolio balance of interest-earning assets.
|
|
l
|
Higher guarantee fee income due to continued growth in our multifamily guarantee portfolio, partially offset by slightly lower average guarantee fee rates on new guarantee business volume.
|
|
l
|
Larger fair value gains due to larger average balances of held-for-sale commitments and securitization pipeline loans, partially offset by less tightening of K Certificate benchmark spreads and the effects of competitive pricing.
|
|
l
|
Larger gains on non-agency CMBS due to the disposition of certain non-agency CMBS, coupled with spread tightening.
|
|
FREDDIE MAC
| 2018 Form 10-K
|
71
|
|
|
Management's Discussion and Analysis
|
Our Business Segments |
Capital Markets
|
Capital Markets
Business Overview
The Capital Markets segment supports our primary business strategies by creating:
A Better Freddie Mac:
|
n
|
Engaging in economically sensible transactions to reduce our less liquid assets;
|
|
n
|
Managing the mortgage-related investments portfolio's risk-versus-return profile based on our internal economic capital framework, which is aligned with the Conservatorship Capital Framework;
|
|
n
|
Enhancing the liquidity of our issued securities in the secondary mortgage market to support our business needs;
|
|
n
|
Responding to market opportunities in funding our business activities;
|
|
n
|
Managing our economic interest-rate risk through the use of derivatives and various debt instruments; and
|
|
n
|
Attempting to align prepayment and pooling profiles for Freddie Mac TBA programs to match Fannie Mae's TBA characteristics.
|
A Better Housing Finance System:
|
n
|
Delivering mortgage capital markets services including our cash loan purchase program, in conjunction with the Single-family Guarantee segment and
|
|
n
|
Implementing the Single Security initiative for Freddie Mac and Fannie Mae, which is intended to increase the liquidity of the TBA market and to reduce the disparities in trading value between our PCs and Fannie Mae's single-class mortgage-related securities.
|
The Capital Markets segment is responsible for managing the majority of our mortgage-related investments portfolio, and providing company-wide treasury and interest-rate risk management functions. In addition, we are responsible for managing our securitization and resecuritization activities related to single-family loans, and supporting multifamily securitizations.
Our mortgage portfolio management activities primarily include single-family unsecuritized loans, a diminishing portfolio of non-agency mortgage-related securities, and purchases and sales of agency mortgage-related securities. In addition, we actively engage in the structuring of our agency mortgage-related securities. Our portfolio management activities also include responsibility for maintaining the other investments portfolio, which is primarily used for short-term liquidity management. However, certain portions of the mortgage-related investments portfolio are not managed by us, including the portions of the portfolio related to multifamily assets, single-family seriously delinquent loans, and the credit risk on single-family performing and reperforming loans.
We provide a company-wide treasury function, primarily managing our funding and liquidity needs on both a short- and long-term basis. The primary activities of the treasury function include issuing, calling and repurchasing debt and maintaining a portfolio of non-mortgage investments.
Our interest-rate risk management function consolidates and manages the overall interest-rate risk of the company. To reduce our exposure to changes in the cash flows of interest-rate sensitive assets and liabilities due to interest rate changes, we actively monitor and economically hedge this risk, primarily through the use of derivative instruments. In addition, we further reduce these interest-rate exposures
|
FREDDIE MAC
| 2018 Form 10-K
|
72
|
|
|
Management's Discussion and Analysis
|
Our Business Segments |
Capital Markets
|
through active management of our debt funding mix and through the structuring of our investments in mortgage-related securities.
Finally, the Capital Markets segment is responsible for management of our securitization and resecuritization activities related to single-family loans, which are discussed in more detail in
Our Business Segments - Single-Family Guarantee.
Although we manage our business on an economic basis, we have previously executed certain transactions to reduce the probability of our having a negative net worth due to changes in interest rates and thus being required to draw from Treasury. In 2017, we implemented fair value hedge accounting, which has reduced the need for these types of transactions. Also, we may forgo certain investment opportunities for a variety of reasons, including the limit on the size of our mortgage-related investments portfolio or the risk that an accounting treatment may create earnings variability as well as result in a future draw from Treasury. For additional information on the limits on the mortgage-related investments portfolio established by the Purchase Agreement and by FHFA, see
Conservatorship and Related Matters -
Limits on Our Mortgage-Related Investments Portfolio and Indebtedness.
Products and Activities
Investing, Liquidity Management, and Related Activities
In our Capital Markets segment, our objectives are to make appropriate risk and capital management decisions, effectively execute our strategy and be responsive to market conditions. We manage the following types of products:
|
n
|
Agency mortgage-related securities
- We primarily invest in Freddie Mac mortgage-related securities, but may also invest in Fannie Mae and Ginnie Mae mortgage-related securities from time to time. In the future, we will also invest in UMBS with the implementation of the Single Security initiative. Our activities with respect to these products may include purchases and sales, dollar roll transactions, and structuring activities (e.g., resecuritizing existing agency securities into REMICs and selling some or all of the resulting REMIC tranches).
|
|
n
|
Single-family unsecuritized loans
- We acquire single-family unsecuritized loans in two primary ways:
|
|
l
|
Loans acquired through our cash loan purchase program that are awaiting securitization
-
We securitize most of the loans acquired through our cash loan purchase program into Freddie Mac mortgage-related securities, primarily PCs, which may be sold to investors or retained in our mortgage-related investments portfolio and
|
|
l
|
Seriously delinquent or modified loans that we have removed from PC pools:
|
|
–
|
Certain of these loans may reperform, either on their own or through modification. Reperforming loans are managed by both the Capital Markets and Single-family Guarantee segments, but are included in the Capital Markets segment's financial results. We continue to reduce the balance of our reperforming loans through a variety of methods, including the following:
|
|
¨
|
Sales and securitization using a senior subordinate securitization structure, where we guarantee the resulting senior securities. We may retain some senior securities at the time of issuance. For more information on senior subordinate securitization structures, see
Our Business Segments - Single-Family Guarantee -
Business Overview - Products and Activities - Sales of Mortgage Loans
and
|
|
FREDDIE MAC
| 2018 Form 10-K
|
73
|
|
|
Management's Discussion and Analysis
|
Our Business Segments |
Capital Markets
|
|
¨
|
Securitization into Freddie Mac PCs, with all of the resulting mortgage-related securities initially being retained. We may resecuritize a portion of the retained mortgage-related securities, with some of the resulting interests being sold to third parties.
|
|
–
|
Loans that remain seriously delinquent are also managed by both the Capital Markets and Single-family Guarantee segments, but are included in the Single-family Guarantee segment's financial results. We continue to reduce the balance of our seriously delinquent loans through loss mitigation and foreclosure activities, which are managed by the Single-family Guarantee segment, and through direct loan sales, when possible.
|
|
n
|
Other investments portfolio
- We invest in other investments, including: (i) the Liquidity and Contingency Operating Portfolio, primarily used for short-term liquidity management, (ii) cash and other investments held by consolidated trusts, (iii) investments used to pledge as collateral, and (iv) secured lending activities.
|
In our secured lending activities, we provide funds to lenders for: (i) mortgage loans that they will subsequently either sell through our cash purchase program or securitize into PCs that they will deliver to us, (ii) secured term financing through revolving lines of credit collateralized by the value of contractual mortgage servicing rights on certain mortgages we own, and (iii) securities purchased under agreements to resell as a mechanism to provide financing to investors in Freddie Mac securities to increase liquidity and expand the investor base for those securities. We may execute other types of secured lending transactions in the future.
|
n
|
Non-agency mortgage-related securities
- We generally no longer purchase non-agency mortgage-related securities, but continue to have minimal investments in such securities that we acquired in prior years. Our activities with respect to this product are primarily sales. In recent years, we and FHFA reached settlements with a number of institutions to mitigate or recover losses we recognized in prior years.
|
|
The primary impacts to Segment Earnings are:
|
|
|
•
|
Interest income on agency and non-agency mortgage-related securities, unsecuritized loans, and our other investments portfolio;
|
|
•
|
Fair value gains and losses due to changes in interest rate and market spreads on our agency and non-agency mortgage-related securities and on certain securities held within our other investments portfolio that are accounted for as investment securities. These amounts are recognized in Segment Earnings or total other comprehensive income(loss) depending upon their classification (trading or available-for-sale, respectively); and
|
|
•
|
Gains and losses on the sale of unsecuritized loans.
|
We evaluate the liquidity of our mortgage-related assets based on three categories (in order of liquidity):
|
n
|
Liquid
- single-class and multi-class agency securities, excluding certain structured agency securities collateralized by non-agency mortgage-related securities;
|
|
n
|
Securitization Pipeline
- performing single-family loans purchased for cash and primarily held for a short period until securitized, with the resulting Freddie Mac issued securities being sold or retained; and
|
|
n
|
Less Liquid
- assets that are less liquid than both agency securities and loans in the securitization pipeline (e.g., reperforming loans and non-agency mortgage-related securities).
|
We may undertake various activities to support our presence in the agency securities market or to support the liquidity of our PCs, including their price performance relative to comparable Fannie Mae securities. These activities may include the purchase and sale of agency securities, dollar roll
|
FREDDIE MAC
| 2018 Form 10-K
|
74
|
|
|
Management's Discussion and Analysis
|
Our Business Segments |
Capital Markets
|
transactions, and structuring activities, such as resecuritization of existing agency securities and the sale of some or all of the resulting securities. Depending upon market conditions, there may be substantial variability in any period in the total amount of securities we purchase or sell. The purchase or sale of agency securities could, at times, adversely affect the price performance of our PCs relative to comparable Fannie Mae securities.
We incur costs to support our presence in the agency securities market and to support the liquidity and price performance of our PCs, including by engaging in transactions that yield less than our target rate of return. For more information, see
Risk Factors - Other Risks -
A significant decline in the price performance of or demand for our PCs could have an adverse effect on the volume and/or profitability of our new single-family guarantee business
.
Funding and Liquidity Management Activities
Our treasury function manages the funding needs of the company, including the Capital Markets segment, primarily through the issuance of unsecured other debt. The type and term of debt issued is based on a variety of factors and is designed to meet our ongoing cash needs and to comply with our Liquidity Management Framework. This Framework provides a mechanism for us to sustain periods of market illiquidity, while being able to maintain certain business activities and remain current on our obligations. See
Liquidity and Capital Resources -
Liquidity Management Framework
for additional discussion of our Liquidity Management Framework.
We primarily use the following types of products as part of our funding and liquidity management activities:
|
n
|
Discount Notes and Reference Bills
®
- We issue short-term instruments with maturities of one year or less. These products are generally sold on a discounted basis, paying principal only at maturity. Reference Bills are auctioned to dealers on a regular schedule, while discount notes are issued in response to investor demand and our cash needs.
|
|
n
|
Medium-term Notes
- We issue a variety of fixed-rate and variable-rate medium-term notes, including callable and non-callable securities, and zero-coupon securities, with various maturities.
|
|
n
|
Reference Notes
®
Securities
- Reference Notes securities are non-callable fixed-rate securities, which we currently issue with original maturities greater than or equal to two years.
|
|
n
|
Securities sold under agreements to repurchase
- Collateralized short-term borrowings where we sell securities to a counterparty with an agreement to repurchase those securities at a future date.
|
In addition, proceeds from the issuance of STACR and SCR debt notes are used to meet the funding needs of the company. We consider the issuance of these debt notes when managing the treasury function for the company. For a description of STACR debt notes, see
Our Business Segments - Single-Family Guarantee -
Business Overview
-
Products and Activities
, and for a description of SCR notes, see
Our Business Segments - Multifamily
-
Business Overview - Products and Activities
.
The average life of our assets is longer than the average life of our liabilities, which creates liquidity risk. To manage short-term liquidity risk, we may hold a combination of cash, cash-equivalent, and non-mortgage-related investments in our Liquidity and Contingency Operating Portfolio. These instruments are limited to those we expect to be liquid or mature in the short term. We also lend available cash on a short-term basis through transactions where we purchase securities under agreements to resell. This portfolio is designed to allow us to meet all of our obligations in the event that we lose access to the unsecured debt markets for a period of time.
|
FREDDIE MAC
| 2018 Form 10-K
|
75
|
|
|
Management's Discussion and Analysis
|
Our Business Segments |
Capital Markets
|
See
Liquidity and Capital Resources
for a further discussion of our funding and liquidity management activities.
|
The primary impacts to Segment Earnings are:
|
|
|
•
|
Interest expense on our various funding products and
|
|
•
|
Gains and losses on the early termination (call or repurchase) of our funding products.
|
Interest-Rate Risk Management Activities
We manage the economic interest-rate risk for the company and have management-approved limits for interest-rate risk, as measured by our models. See
Risk Management - Market Risk
for additional information, including the measurement of the interest-rate sensitivity of our financial assets and liabilities.
There is a cash flow mismatch between the company's assets and liabilities that we use to fund those assets. This mismatch in cash flows not only leads to liquidity risk, but also results in interest-rate risk. We typically use interest-rate derivatives to reduce the economic risk exposure due to this mismatch. Using our risk management practices described in the
Risk Management - Market Risk
section, we seek to reduce this impact to low levels. Additionally, assets that are likely to be sold prior to their final maturity may have a different debt and derivative mix than assets that we plan to hold for a longer period. As a result, interest-rate risk measurements for those assets may include additional assumptions (such as a view on expected changes in market spreads) concerning their price sensitivity rather than just a longer-term view of cash flows.
To manage our interest-rate risk, we primarily use interest rate swaps, options, swaptions, and futures. When we use derivatives to mitigate our risk exposures, we consider a number of factors, including cost, exposure to counterparty credit risk, and our overall risk management strategy.
While our interest-rate risk management activities are primarily focused on reducing our economic interest-rate risk, during 2017, we adopted hedge accounting strategies to reduce our GAAP earnings variability. The adoption of hedge accounting was a business decision intended to better align earnings with the economics of our business, but it is not intended to change the investment and portfolio management decisions that our segment would otherwise make. For more information on our use of hedge accounting see
Risk Management -
Market Risk -
GAAP Earnings Variability
and
Note 9
.
In 2018, we began to participate in transactions that support the development of the Secured Overnight Financing Rate (SOFR) as an alternative rate to LIBOR. These transactions include investment in and issuance of SOFR indexed floating-rate debt securities and execution of SOFR indexed derivatives. For additional details on SOFR see
Risk Factors -
Other Risks -
The discontinuance of LIBOR after 2021 could negatively affect the fair value of our financial assets and liabilities, results of operations, and net worth. A transition to an alternative reference interest rate could present operational problems and result in market disruption, including inconsistent approaches for different financial products, as well as disagreements with counterparties.
|
FREDDIE MAC
| 2018 Form 10-K
|
76
|
|
|
Management's Discussion and Analysis
|
Our Business Segments |
Capital Markets
|
|
The primary impacts to Segment Earnings are:
|
|
|
•
|
Fair value gains and losses on derivatives not designated in qualifying hedge relationships;
|
|
•
|
Interest income/expense on derivatives; and
|
|
•
|
Differences between changes in the fair value of the hedged item attributable to the risk being hedged and changes in the fair value of the hedging instrument for derivatives designated in qualifying fair value hedge accounting relationships.
|
Summary of our Primary Business Model and Its Impacts to Segment Earnings

Securitization Activities
We manage the company's securitization and resecuritization activities related to single-family loans. See
Our Business Segments - Single-Family Guarantee
for a discussion of our single-family securitization and guarantee products.
Customers
Our customers include banks and other depository institutions, insurance companies, money managers, central banks, pension funds, state and local governments, REITs, brokers and dealers, and a variety of lenders as discussed in
Our Business Segments - Single-Family Guarantee -
Business Overview - Customers
.
Our unsecured other debt securities and structured mortgage-related securities are initially purchased by dealers and redistributed to their customers.
|
FREDDIE MAC
| 2018 Form 10-K
|
77
|
|
|
Management's Discussion and Analysis
|
Our Business Segments |
Capital Markets
|
Competition
Our competitors in the Capital Markets segment are firms that invest in loans and mortgage-related assets and issue corporate debt, including Fannie Mae, REITs, supranationals (international institutions that provide development financing for member countries), commercial and investment banks, dealers, savings institutions, insurance companies, the Federal Farm Credit Banks, and the FHLBs.
|
FREDDIE MAC
| 2018 Form 10-K
|
78
|
|
|
Management's Discussion and Analysis
|
Our Business Segments |
Capital Markets
|
Market Conditions
The following graph and related discussion presents the par swap rate curve for the most recent three years. Changes in the par swap rate can significantly affect the business and financial results of our Capital Markets segment.
Par Swap Rates as of December 31,

Source: BlackRock
|
n
|
Par swap rate changes can significantly affect the fair value of our debt, derivatives, and mortgage and non-mortgage-related securities. In addition, the GAAP accounting treatment for our financial assets and liabilities, including derivatives (i.e., some are measured at amortized cost, while others are measured at fair value) creates variability in our GAAP earnings when interest rates change. We have elected hedge accounting for certain assets and liabilities in an effort to reduce GAAP earnings variability and better align GAAP results with the economics of our business.
|
|
n
|
We primarily use LIBOR-based derivatives and fixed-rate debt to hedge our interest-rate risk. The mortgage-related investments portfolio's exposure to interest-rate risk is calculated by our models that project loan and security cash flows over a variety of scenarios. For additional information on our exposure to interest-rate risk, see
Risk Management - Market Risk
.
|
|
FREDDIE MAC
| 2018 Form 10-K
|
79
|
|
|
Management's Discussion and Analysis
|
Our Business Segments |
Capital Markets
|
|
n
|
2018 vs. 2017
|
|
l
|
The par swap curve flattened during 2018 as short-term interest rates increased more than long-term interest rates. Long-term interest rates increased during 2018, while they remained relatively flat during 2017. The increases during 2018 resulted in fair value gains for our pay-fixed interest rate swaps, forward commitments to issue PCs, and futures, partially offset by fair value losses for our receive-fixed interest rate swaps, certain of our option-based derivatives, and the vast majority of our investments in securities. The net amount of these changes in fair value was mostly offset by the change in fair value of the hedged items attributable to interest-rate risk in our hedge accounting programs.
|
|
n
|
2017 vs. 2016
|
|
l
|
The 2-year and 10-year swap rates increased, resulting in gains for our pay-fixed interest rate swaps and losses for our receive-fixed interest rate swaps, certain of our option contracts, and the vast majority of our investments in securities.
|
|
l
|
3-month LIBOR increased during 2017 and during the fourth quarter of 2016, resulting in higher yields for our short-term interest-earning assets, higher costs for our short-term interest-bearing liabilities, and interest-rate related losses for certain of our shorter duration trading securities.
|
|
n
|
As the Capital Markets segment is responsible for managing interest-rate risk for the company, its Segment Earnings may include gains and losses on certain economic hedges on financial assets and liabilities primarily reported in the Single-family Guarantee segment.
|
|
FREDDIE MAC
| 2018 Form 10-K
|
80
|
|
|
Management's Discussion and Analysis
|
Our Business Segments |
Capital Markets
|
Business Results
The graphs and related discussion below present the business results of our Capital Markets segment.
Investing Activity
The following graphs present the Capital Markets segment's total investments portfolio and the composition of its mortgage investments portfolio by liquidity category.


|
n
|
We have reduced the size of our mortgage investments portfolio to comply with the mortgage-related investments portfolio's year-end limits. The balance of our mortgage investments portfolio declined 14.4% between December 31, 2017 and December 31, 2018.
|
|
n
|
The balance of our other investments portfolio decreased 30.5% primarily due to lower near-term cash needs for upcoming maturities and anticipated calls of other debt at the end of 2018 compared to the end of 2017.
|
|
n
|
The percentage of less liquid assets relative to our total mortgage investments portfolio declined to 26.6% at December 31, 2018 from 28.4% at December 31, 2017, primarily due to repayments, sales, and securitizations of our less liquid assets.
|
|
n
|
The overall liquidity of our mortgage investments portfolio continued to improve as our less liquid assets decreased at a faster pace than the overall decline of our mortgage investments portfolio.
|
|
FREDDIE MAC
| 2018 Form 10-K
|
81
|
|
|
Management's Discussion and Analysis
|
Our Business Segments |
Capital Markets
|
Reduction in Less Liquid Assets


|
n
|
Since 2013, we have focused on reducing, in an economically sensible manner, our holdings of certain less liquid assets, including single-family reperforming loans and non-agency mortgage-related securities. Our disposition strategies for our less liquid assets include securitizations and sales.
|
|
n
|
During 2018, our sales of less liquid assets included
$2.6 billion
in UPB of non-agency mortgage-related securities and
$9.5 billion
of reperforming loans. Our sales of reperforming loans involved securitization of the loans using senior subordinate securitization structures, in which we guaranteed the resulting senior securities. As part of these transactions, we retained certain of the guaranteed senior securities for our mortgage-related investments portfolio.
|
|
n
|
One of our strategies related to reperforming loans is to create Freddie Mac PCs and initially retain all of the resulting mortgage-related securities, which may be resecuritized and sold to third parties. During 2018, we securitized
$1.6 billion
of single-family reperforming loans through PC securitization. The use of this strategy has declined over time with our principal strategy now being the securitization of the loans using senior subordinate securitization structures.
|
|
FREDDIE MAC
| 2018 Form 10-K
|
82
|
|
|
Management's Discussion and Analysis
|
Our Business Segments |
Capital Markets
|
Net Interest Yield and Average Balances
Net Interest Yield Earned & Average Investment Portfolio Balance

|
n
|
2018 vs. 2017
- Net interest yield increased 15 basis points during 2018 compared to 2017, primarily due to:
|
l
Higher yields on our newly acquired mortgage-related assets and other investments as a result of increases in interest rates;
l
Changes in our investment mix due to reductions in both our less liquid assets and the percentage of our other investments portfolio relative to our total investments portfolio; and
l
Larger benefit provided by non-interest bearing funding due to increases in both short-term interest rates and the percentage of non-interest bearing funding relative to our total liabilities.
|
n
|
2017 vs. 2016
- Net interest yield remained relatively flat.
|
n
Net interest yield for the Capital Markets segment is not affected by our hedge accounting programs due to reclassifications made for Segment Earnings. See
Note 13
for more information.
|
FREDDIE MAC
| 2018 Form 10-K
|
83
|
|
|
Management's Discussion and Analysis
|
Our Business Segments |
Capital Markets
|
Financial Results
The table below presents the components of the Segment Earnings and comprehensive income for our Capital Markets segment.
Table 16 - Capital Markets Segment Financial Results
|
Year Over Year Change
|
||||||||||||||||||||||
|
Year Ended December 31,
|
2018 vs. 2017
|
2017 vs. 2016
|
||||||||||||||||||||
|
(Dollars in millions)
|
2018
|
2017
|
2016
|
$
|
%
|
$
|
%
|
|||||||||||||||
|
Net interest income
|
|
$3,217
|
|
|
$3,279
|
|
|
$3,736
|
|
|
($62
|
)
|
(2
|
)%
|
|
($457
|
)
|
(12
|
)%
|
|||
|
Investment securities gains (losses)
|
(102
|
)
|
1,048
|
|
165
|
|
(1,150
|
)
|
(110
|
)%
|
883
|
|
535
|
%
|
||||||||
|
Debt gains (losses)
|
531
|
|
437
|
|
77
|
|
94
|
|
22
|
%
|
360
|
|
468
|
%
|
||||||||
|
Derivative gains (losses)
|
1,314
|
|
(587
|
)
|
1,151
|
|
1,901
|
|
324
|
%
|
(1,738
|
)
|
(151
|
)%
|
||||||||
|
Other non-interest income (expense)
|
389
|
|
5,706
|
|
500
|
|
(5,317
|
)
|
(93
|
)%
|
5,206
|
|
1,041
|
%
|
||||||||
|
Administrative expense
|
(365
|
)
|
(330
|
)
|
(320
|
)
|
(35
|
)
|
(11
|
)%
|
(10
|
)
|
(3
|
)%
|
||||||||
|
Segment Earnings before income tax expense
|
4,984
|
|
9,553
|
|
5,309
|
|
(4,569
|
)
|
(48
|
)%
|
4,244
|
|
80
|
%
|
||||||||
|
Income tax expense
|
(976
|
)
|
(3,296
|
)
|
(1,749
|
)
|
2,320
|
|
70
|
%
|
(1,547
|
)
|
(88
|
)%
|
||||||||
|
Segment Earnings, net of taxes
|
4,008
|
|
6,257
|
|
3,560
|
|
(2,249
|
)
|
(36
|
)%
|
2,697
|
|
76
|
%
|
||||||||
|
Total other comprehensive income (loss), net of tax
|
(527
|
)
|
(30
|
)
|
(452
|
)
|
(497
|
)
|
(1,657
|
)%
|
422
|
|
93
|
%
|
||||||||
|
Total comprehensive income (loss)
|
|
$3,481
|
|
|
$6,227
|
|
|
$3,108
|
|
|
($2,746
|
)
|
(44
|
)%
|
|
$3,119
|
|
100
|
%
|
|||
The portion of total comprehensive income (loss) driven by interest rate-related and market spread-related fair value changes, after-tax, is presented in the table below. These amounts affect various line items in the table above, including investment securities gains (losses), debt gains (losses), derivative gains (losses), income tax expense, and total other comprehensive income (loss), net of tax.
Table 17 - Capital Markets Segment Interest Rate-Related and Market Spread-Related Fair Value Changes, Net of Tax
|
Year Over Year Change
|
||||||||||||||||||||||
|
Year Ended December 31,
|
2018 vs. 2017
|
2017 vs. 2016
|
||||||||||||||||||||
|
(Dollars in millions)
|
2018
|
2017
|
2016
|
$
|
%
|
$
|
%
|
|||||||||||||||
|
Interest rate-related
|
|
($0.3
|
)
|
|
($0.3
|
)
|
|
$0.2
|
|
|
$—
|
|
—
|
%
|
|
($0.5
|
)
|
(250
|
)%
|
|||
|
Market spread-related
|
0.4
|
|
0.8
|
|
0.3
|
|
(0.4
|
)
|
(50
|
)
|
0.5
|
|
167
|
|
||||||||
Key Drivers:
|
n
|
2018 vs. 2017
|
|
l
|
Lower net interest income during 2018 primarily due to the continued reduction in the balance of our mortgage-related investments portfolio, partially offset by:
|
|
–
|
Higher yields on our newly acquired mortgage-related assets and other investments as a result of increases in interest rates;
|
|
–
|
Changes in our investment mix due to reductions in both our less liquid assets and the percentage of our other investments portfolio relative to our total investments portfolio; and
|
|
–
|
Larger benefit provided by non-interest bearing funding due to increases in both short-term interest rates and the percentage of non-interest bearing funding relative to our total liabilities.
|
l
Relatively flat interest rate-related fair value losses during 2018.
|
FREDDIE MAC
| 2018 Form 10-K
|
84
|
|
|
Management's Discussion and Analysis
|
Our Business Segments |
Capital Markets
|
|
–
|
Long-term interest rates increased during the 2018 periods, while rates remained relatively flat during 2017, resulting in higher fair value losses for the vast majority of our investments in securities (some of which are recorded in other comprehensive income), our receive-fixed interest rate swaps, and certain of our option-based derivatives, offset by higher fair value gains for our pay-fixed interest rate swaps, forward commitments to issue PCs, and futures.
|
|
–
|
The net amount of these changes in fair value was mostly offset by the change in fair value of the hedged items attributable to interest-rate risk in our hedge accounting programs.
|
|
–
|
The remaining amount of interest rate-related fair value changes was primarily attributable to the implied net cost on instruments such as swaptions, futures, and forward purchase and sale commitments from our hedging and interest-rate risk management activities. See
Risk Management - Market Risk
for additional information on the effect of market-related items on our comprehensive income.
|
|
l
|
Lower spread-related gains during 2018 driven by lower non-agency mortgage-related securities balances.
|
l
Recognition of $4.5 billion in proceeds received during 2017 from the RBS settlement compared to a $0.3 billion gain recognized from the Nomura judgment during 2018 related to certain of our non-agency mortgage related securities. For more information, see
Note 14
.
l
Lower amortization of debt securities of consolidated trusts during 2018 driven by a decrease in prepayments as a result of higher interest rates.
|
n
|
2017 vs. 2016
|
|
l
|
The continued reduction in the balance of our mortgage-related investments portfolio resulted in a decrease in net interest income.
|
|
l
|
Interest rate-related fair value changes during 2017. Losses increased, driven by lower levels of volatility during 2017, resulting in larger losses in our options portfolio, coupled with lower fair value gains in our pay-fixed interest rate swaps as long-term interest rates increased less. This was partially offset by reduced fair value losses in our receive-fixed interest rate swaps and the majority of our investments in securities.
|
|
l
|
Higher spread-related fair value gains driven by market spread tightening during 2017 on our non-agency mortgage-related securities.
|
|
l
|
Higher gains on the extinguishment of debt as long-term interest rates increased between the time of issuance and repurchase during 2017.
|
|
l
|
Proceeds of $4.5 billion received from the RBS settlement during 2017 related to certain of our non-agency mortgage-related securities. For more information on this settlement, see
Note 14
.
|
|
FREDDIE MAC
| 2018 Form 10-K
|
85
|
|
|
Management's Discussion and Analysis
|
Our Business Segments
|
All Other
|
All Other
Comprehensive Income
The table below shows our comprehensive income (loss) for the All Other category.
Table 18 - All Other Category Comprehensive Income
|
Year Over Year Change
|
||||||||||||||||||||
|
Year Ended December 31,
|
2018 vs. 2017
|
2017 vs. 2016
|
||||||||||||||||||
|
(Dollars in millions)
|
2018
|
2017
|
2016
|
$
|
%
|
$
|
%
|
|||||||||||||
|
Comprehensive income (loss) - All Other
|
|
$—
|
|
|
($5,405
|
)
|
|
$—
|
|
|
$5,405
|
|
100%
|
|
($5,405
|
)
|
N/A
|
|||
Key Drivers:
|
n
|
2018 vs. 2017 and 2017 vs. 2016
- Changes in comprehensive income (loss) driven by:
|
|
l
|
Higher income tax expense in 2017 due to the revaluation of our net deferred tax asset driven by the Tax Cuts and Jobs Act, which reduced the statutory corporate income tax rate from 35% to 21% for tax years after 2017. For more information on the statutory tax rate change, see
Note 12
.
|
|
FREDDIE MAC
| 2018 Form 10-K
|
86
|
|
|
Management's Discussion and Analysis
|
Risk Management
|
Overview
|
RISK MANAGEMENT
Overview
We take risks as an integral part of our business activities. Risk is the possibility that events will adversely affect the achievement of our mission, strategy, and business objectives. Risk can manifest itself in many ways. We seek to take risks in a safe and sound, well-controlled manner to earn acceptable risk-adjusted returns on both a corporate-wide and, where applicable, transaction basis.
We utilize a risk taxonomy to define and classify risks that we face in operating our business. These risks have the potential to adversely affect our current or projected financial results and condition and operational resilience. The risk taxonomy is also the basis for aligning corporate risk policies and standards. The key types of risks are:
|
n
|
Credit risk;
|
|
n
|
Operational Risk;
|
|
n
|
Market Risk;
|
|
n
|
Liquidity Risk;
|
|
n
|
Strategic Risk; and
|
|
n
|
Reputation Risk.
|
Strategic and reputation risks are factored into business decisions and are a shared responsibility of senior management. For more discussion of these and other risks facing our business, see
Risk Factors
. See
Liquidity and Capital Resources
for a discussion of liquidity risk.
Enterprise Risk Framework
The enterprise risk framework establishes the foundation for how we manage risk to achieve our objectives and strategies. The enterprise risk framework:
|
n
|
Serves as the basis for performing risk functions across a range of stress scenarios;
|
|
n
|
Allows the company to manage risk in a consistent manner;
|
|
n
|
Defines risk roles, accountabilities, and authority across the three lines of defense; and
|
|
n
|
Promotes risk ownership and provides for independent risk assessment and transparency in risk management decisions and execution.
|
The framework includes the following components:
|
n
|
Three Lines of Defense
- The business lines, independent risk management, and internal audit make up the three lines of defense.
|
|
n
|
Risk Culture
- The board and senior management support an effective risk culture by setting the "tone at the top" and by encouraging proactive risk discussions. A strong risk culture reinforces the importance of our risk management strategy, and promotes collaboration and transparency among the three lines of defense and a supportive environment for all employees where business is conducted in a lawful and ethical manner.
|
|
n
|
Risk Governance
- Risk governance comprises the risk responsibilities of the three lines of defense, the risk committee structure at the division, enterprise, and Board levels, and reporting and
|
|
FREDDIE MAC
| 2018 Form 10-K
|
87
|
|
|
Management's Discussion and Analysis
|
Risk Management
|
Overview
|
escalation requirements.
|
n
|
Risk Appetite
- The risk appetite is the aggregate level and types of risk that the Board and management are willing to assume to achieve the company's strategic objectives. The risk appetite is integrated and aligned with the strategic plans for the company and each business segment.
|
|
n
|
Risk Authority
- The Board delegates authority to the CEO, and the CEO delegates authority to members of executive management.
|
|
n
|
Corporate Risk Policies and Standards
- Corporate risk policies provide clarity on roles and responsibilities, establish risk approval requirements, and define escalation and reporting requirements. Corporate risk standards provide the minimum requirements to implement corporate risk policies and may also establish risk approval requirements.
|
|
n
|
Capital Framework
- We use both FHFA's CCF and internal capital methodologies to measure risk for making economically effective decisions. See
Liquidity and Capital Resources -
Capital Resources - Conservatorship Capital Framework.
|
|
n
|
Risk-Adjusted Return
- We use risk-adjusted return, based on the CCF, to measure returns of business lines, transactions, and initiatives. We seek to achieve acceptable risk-adjusted returns consistent with pre-set targets.
|
|
n
|
Risk Profile
- The risk profile is a point-in-time assessment of inherent and/or residual risk for a specific risk type, measured at a divisional or enterprise level for the relevant risk types. The assessment incorporates results from stress testing or scenario analysis, judgmental evaluation of external and internal factors, effectiveness of controls, or any development that may affect performance relative to the strategy and business objectives.
|
Enterprise Risk Governance Structure
We manage risk using a three-lines-of-defense risk management model and governance structure that includes enterprise-wide oversight by the Board and its committees, the CERO, the CCO, and our corporate ERC.
The information and diagram below present the responsibilities associated with our three-lines-of-defense risk management model and our risk governance structure. The risk governance structure also includes management risk committees for each business line to actively discuss and monitor business-specific risk profiles, risk decisions, and risk appetite metrics, limits and thresholds, and risk type committees to oversee specific risk types that are present in and span across business lines.
For more information on the role of the Board and its committees, see
Directors, Corporate Governance, and Executive Officers - Corporate Governance -
Board and Committee Information
.
|
FREDDIE MAC
| 2018 Form 10-K
|
88
|
|
|
Management's Discussion and Analysis
|
Risk Management
|
Overview
|

|
FREDDIE MAC
| 2018 Form 10-K
|
89
|
|
|
Management's Discussion and Analysis
|
Risk Management
|
Credit Risk
|
Credit Risk
Overview
Credit risk is the risk associated with the inability or failure of a borrower, issuer, or counterparty to meet its financial and/or contractual obligations. We are exposed to both mortgage credit risk and counterparty credit risk.
Mortgage credit risk is the risk associated with the inability or failure of a borrower to meet its financial and/or contractual obligations. We are exposed to two types of mortgage credit risk:
|
n
|
Single-family mortgage credit risk
, through our ownership or guarantee of loans in the single-family credit guarantee portfolio and
|
|
n
|
Multifamily mortgage credit risk
, through our ownership or guarantee of loans in the multifamily mortgage portfolio.
|
Counterparty credit risk is the risk associated with the inability or failure of a counterparty to meet its contractual obligations.
In the sections below, we provide a general discussion of our enterprise risk framework and current risk environment for mortgage credit risk, and for counterparty credit risk.
Single-Family Mortgage Credit Risk
We manage our exposure to single-family mortgage credit risk, which is a type of consumer credit risk, using the following principal strategies:
|
n
|
Maintaining policies and procedures for new business activity, including prudent underwriting standards;
|
|
n
|
Transferring credit risk of the single-family credit guarantee portfolio to investors in new and innovative ways;
|
|
n
|
Monitoring loan performance and characteristics of the single-family credit guarantee portfolio and individual sellers and servicers;
|
|
n
|
Engaging in loss mitigation activities; and
|
|
n
|
Managing foreclosure and REO activities.
|
Maintaining Policies and Procedures for New Business Activity, Including Prudent Underwriting Standards
We use a delegated underwriting process in connection with our acquisition of single-family loans whereby we set eligibility and underwriting standards, and sellers represent and warrant to us that loans they sell to us meet these standards. Our eligibility and underwriting standards evaluate loans based on a number of characteristics.
Limits are established on the purchase of loans with certain higher risk characteristics. These limits are designed to balance our credit risk exposure while supporting affordable housing in a responsible manner. Our purchase guidelines generally provide for a maximum original LTV ratio of 95%, a maximum
|
FREDDIE MAC
| 2018 Form 10-K
|
90
|
|
|
Management's Discussion and Analysis
|
Risk Management |
Single-Family Mortgage Credit Risk
|
LTV ratio of 80% for cash-out refinance loans, and no maximum LTV ratio for fixed-rate HARP loans and fixed-rate Enhanced Relief Refinance program loans. We purchase certain loans with LTV ratios up to 97% under an initiative designed to serve a targeted segment of creditworthy borrowers meeting certain Area Median Income requirements. In 2Q 2018, we launched the HomeOne
SM
offering which expanded the 97% program to a broader segment of creditworthy first-time home buyers.
The majority of our purchase volume is evaluated using either Freddie Mac's proprietary underwriting software Loan Product Advisor
®
, Fannie Mae's comparable software Desktop Underwriter (DU) or the seller's proprietary automated underwriting system. The performance of all loans is monitored to assess compliance with our risk appetite. Fannie Mae announced changes to its DU in July 2017, which led to an increase in eligibility for purchase of new loans with DTI ratios between 45% and 50% (high DTI). These loans have minimal impact on our single-family credit guarantee portfolio, but we are monitoring the overall credit quality and performance of these loans. During 2018, we initiated steps to limit the volume of these loans that we purchase with high DTI ratios that have other high-risk characteristics.
We employ a quality control process to review loan underwriting documentation for compliance with our standards using both random and targeted samples. We also perform quality control reviews of many delinquent loans and review all loans that have resulted in credit losses before the representations and warranties are relieved. Sellers may appeal our ineligible loan determinations prior to repurchase of the loan.
We use a standard quality control process that facilitates more timely reviews and is designed to identify breaches of representations and warranties early in the life of the loan. Proprietary tools, such as Quality Control Advisor, provide greater transparency into our customer quality control reviews.
Our Loan Advisor Suite, a set of integrated software applications, is designed to give lenders a way to originate and deliver high quality mortgage loans to us and to actively monitor representation and warranty relief earlier in the mortgage loan production process. Loan Advisor Suite offers limited relief of representations and warranties for certain loans that satisfy automated controls related to appraisal quality, collateral valuation, borrower assets, and borrower income. In general, limited representation and warranty relief is only offered when we have validated the information provided by lenders against independent data sources.
If we discover that the representations or warranties related to a loan were breached (i.e., that contractual standards were not followed), we can exercise certain contractual remedies to mitigate our actual or potential credit losses. These contractual remedies include the ability to require the seller or servicer to repurchase the loan at its current UPB, reimburse us for losses realized with respect to the loan after consideration of any other recoveries, and/or indemnify us. Our current remedies framework provides for the categorization of loan origination defects for loans with settlement dates on or after January 1, 2016. Among other items, the framework provides that "significant defects" will result in a repurchase request or a repurchase alternative, such as recourse or indemnification.
Under our current selling and servicing representation and warranty framework for our mortgage loans, we relieve sellers of repurchase obligations for breaches of certain selling representations and warranties for certain types of loans, including:
|
n
|
Loans that have established an acceptable payment history for 36 months (12 months for relief refinance loans) of consecutive, on-time payments after purchase, subject to certain exclusions and
|
|
n
|
Loans that have satisfactorily completed a quality control review.
|
|
FREDDIE MAC
| 2018 Form 10-K
|
91
|
|
|
Management's Discussion and Analysis
|
Risk Management |
Single-Family Mortgage Credit Risk
|
An independent dispute resolution process for alleged breaches of selling or servicing representations and warranties on our loans allows for a neutral third party to render a decision on demands that remain unresolved after the existing appeal and escalation processes have been exhausted.
The credit quality of our single-family loan purchases is strong by historical standards. However, risk increased during 2018 as our refinance volume declined due to rising interest rates and our purchase of loans under affordable housing initiatives increased. The graphs below show the credit profile of the single-family loans we purchased or guaranteed in each of the last three years.


|
FREDDIE MAC
| 2018 Form 10-K
|
92
|
|
|
Management's Discussion and Analysis
|
Risk Management |
Single-Family Mortgage Credit Risk
|
The table below contains additional information about the single-family loans we purchased or guaranteed in the last three years.
Table 19 - Single-Family New Business Activity
|
Year Ended December 31,
|
||||||||||||||||||
|
2018
|
2017
|
2016
|
||||||||||||||||
|
(Dollars in millions)
|
Amount
|
% of Total
|
Amount
|
% of Total
|
Amount
|
% of Total
|
||||||||||||
|
30-year or more amortizing fixed-rate
|
|
$266,995
|
|
87
|
%
|
|
$275,677
|
|
80
|
%
|
|
$307,572
|
|
78
|
%
|
|||
|
20-year amortizing fixed-rate
|
8,373
|
|
3
|
|
12,338
|
|
4
|
|
17,011
|
|
4
|
|
||||||
|
15-year amortizing fixed-rate
|
28,878
|
|
9
|
|
45,597
|
|
13
|
|
61,223
|
|
16
|
|
||||||
|
Adjustable-rate
|
3,848
|
|
1
|
|
9,841
|
|
3
|
|
6,555
|
|
2
|
|
||||||
|
FHA/VA and other governmental
|
103
|
|
—
|
|
113
|
|
—
|
|
146
|
|
—
|
|
||||||
|
Total
|
|
$308,197
|
|
100
|
%
|
|
$343,566
|
|
100
|
%
|
|
$392,507
|
|
100
|
%
|
|||
|
Percentage of purchases
|
||||||||||||||||||
|
With credit enhancements
|
40
|
%
|
30
|
%
|
26
|
%
|
||||||||||||
|
Detached/townhome property type
|
92
|
|
91
|
|
92
|
|
||||||||||||
|
Primary residence
|
90
|
|
89
|
|
90
|
|
||||||||||||
|
Loan purpose
|
||||||||||||||||||
|
Purchase
|
69
|
|
58
|
|
45
|
|
||||||||||||
|
Cash-out refinance
|
19
|
|
22
|
|
22
|
|
||||||||||||
|
Other refinance
|
12
|
|
20
|
|
33
|
|
||||||||||||
The table below contains additional details on the relief refinance loans we purchased.
Table 20 - Relief Refinance Loan Purchases
|
Year Ended December 31,
|
||||||||||||||||||
|
2018
|
2017
|
|||||||||||||||||
|
(UPB in millions)
|
UPB
|
Loan Count
|
Average
Loan Size
|
UPB
|
Loan Count
|
Average
Loan Size
|
||||||||||||
|
Above 125% Original LTV
|
|
$28
|
|
217
|
|
|
$131,000
|
|
|
$141
|
|
936
|
|
|
$151,000
|
|
||
|
Above 100% to 125% Original LTV
|
119
|
|
685
|
|
174,000
|
|
589
|
|
3,197
|
|
184,000
|
|
||||||
|
Above 80% to 100% Original LTV
|
438
|
|
2,495
|
|
176,000
|
|
1,760
|
|
9,737
|
|
181,000
|
|
||||||
|
80% and below Original LTV
|
1,775
|
|
12,294
|
|
144,000
|
|
5,900
|
|
40,941
|
|
144,000
|
|
||||||
|
Total
|
|
$2,360
|
|
15,691
|
|
|
$150,000
|
|
|
$8,390
|
|
54,811
|
|
|
$153,000
|
|
||
Transferring Credit Risk of the Single-Family Credit Guarantee Portfolio to Investors in New and Innovative Ways
Our Charter requires coverage by specified credit enhancements or participation interests on single-family loans with LTV ratios above 80% at the time of purchase. In addition to obtaining credit enhancements required by our Charter, we also enter into various CRT transactions in which we transfer mortgage credit risk to third parties.
The table below contains a description of credit enhancements which transfer a portion of the credit risk on our single-family loans.
|
FREDDIE MAC
| 2018 Form 10-K
|
93
|
|
|
Management's Discussion and Analysis
|
Risk Management |
Single-Family Mortgage Credit Risk
|
|
Credit Enhancement
|
Description
|
CRT
|
When Coverage is Effective
|
|
|
Primary mortgage insurance
|
•
|
Provides loan-level protection against loss up to a specified amount, the premium for which is typically paid by the borrower. Generally, an insured loan must be in default and the borrower's interest in the underlying property must have been extinguished, such as through a short sale or foreclosure sale, before a claim can be filed under a primary mortgage insurance policy. The mortgage insurer has a prescribed period of time within which to process a claim and make a determination as to its validity and amount. Most of our loans with LTV ratios above 80% are protected by primary mortgage insurance.
|
No
|
At the time we acquire the loan
|
|
STACR transactions
|
•
|
STACR debt notes
- Obligations we issue to third-party investors related to certain notional credit risk positions. Freddie Mac makes payments of principal and interest on the issued STACR debt notes. The amount of principal that is required to be paid to the STACR debt note investors is linked to the credit performance of a reference pool of mortgage loans. As a result, Freddie Mac is not required to repay principal to the extent that the notional credit risk position is reduced as a result of a specified credit event.
STACR debt notes
- Obligations
|
Yes
|
Subsequent to our purchase or guarantee of loans
|
|
•
|
STACR Trust
- Similar to STACR debt note transactions, except that the notes are issued by a third-party bankruptcy-remote trust. Under this structure, we pay a credit premium and certain shortfalls on the investment collateral account to the trust and receive payments from the trust as a result of defined credit events on the reference pool.
|
Yes
|
Subsequent to our purchase or guarantee of loans
|
|
|
ACIS transactions
|
•
|
ACIS
- Policies that provide credit protection on a portion of the non-issued notional credit risk positions we retain in a STACR transaction. We also enter into ACIS transactions that provide credit protection for certain specified credit events on loans not included in a reference pool created for a STACR transaction. In exchange for our payment of premiums, we receive compensation for certain losses under the insurance policy up to an aggregate limit when specified credit events occur.
|
Yes
|
Subsequent to our purchase or guarantee of loans
|
|
•
|
ACIS Forward Risk Mitigation (AFRM) transactions
- Transfer risks on a representative sample of loans from our single-family loan portfolio, locking in committed sources of institution based capital with stable pricing. When specific credit events occur, we receive compensation from the insurance policy up to an aggregate limit based on actual losses. AFRM includes Deep MI CRT which provides additional coverage beyond primary mortgage insurance
.
|
Yes
|
At the time we acquire the loan
|
|
|
Senior subordinate securitization structures
|
•
|
Senior subordinate securitization structures (non-consolidated)
- Structures in which we issue guaranteed senior securities and unguaranteed subordinated securities backed by certain reperforming single-family loans. The unguaranteed subordinated securities absorb first losses on the related loans. The loans are not serviced in accordance with our Guide and we do not control the servicing.
|
Yes
|
Subsequent to our purchase or guarantee of loans
|
|
•
|
Senior subordinate securitization structures (consolidated)
- Structures in which we issue guaranteed senior securities or PCs and unguaranteed subordinated securities backed by recently originated single-family loans. The unguaranteed subordinated securities absorb first losses on the related loans. The loans are serviced in accordance with our Guide.
|
Yes
|
Subsequent to our purchase or guarantee of loans
|
|
|
Other
|
•
|
Integrated Mortgage Insurance (IMAGIN
SM
)
- A new insurance based offering that provides loan-level protection for loans with 80% and higher LTV ratios. IMAGIN is designed to expand and diversify sources of private capital supporting low down payment lending, while enabling better management of taxpayer exposure to our mortgage and counterparty risks. Each loan is first provided Charter-compliant primary mortgage insurance and is then reinsured by a panel of reinsurers that are reviewed and approved by Freddie Mac. IMAGIN is offered to a broad range of Freddie Mac sellers, who can choose IMAGIN or traditional primary mortgage insurance at their discretion.
|
Yes
|
At the time we acquire the loan
|
|
•
|
Lender recourse and indemnification agreements
- Require a lender to repurchase a loan upon default or to reimburse us for realized credit losses. Lender recourse and lender indemnification agreements are entered into as an alternative to requiring primary mortgage insurance or in exchange for a lower guarantee fee. We have not used lender recourse or lender indemnification agreements on a broad basis in recent years.
|
Yes
|
At the time we acquire the loan
|
|
|
•
|
Pool insurance
- Provides insurance on a group of loans up to a stated aggregate loss limit. We have not purchased pool insurance policies since 2008, and the majority of our pool insurance policies will expire in the next two years.
|
Yes
|
At the time we acquire the loan
|
|
See
Our Business Segments - Single-Family Guarantee, Note 3,
and
Note 6
for additional information on these transactions.
|
FREDDIE MAC
| 2018 Form 10-K
|
94
|
|
|
Management's Discussion and Analysis
|
Risk Management |
Single-Family Mortgage Credit Risk
|
The tables below provide information on the total protected UPB and maximum coverage associated with credit enhanced loans in our single-family credit guarantee portfolio as of
December 31, 2018
and December 31,
2017
, respectively. These tables include all types of single-family credit enhancements.
Table 21 - Details of Credit Enhanced Loans in Our Single-Family Credit Guarantee Portfolio
|
Outstanding as of December 31, 2018
|
|||||||||||||||
|
Protected UPB
(1)
|
Percentage of Single-Family Credit Guarantee Portfolio
|
Maximum Coverage
(2)
|
|||||||||||||
|
(In millions)
|
Total
|
Total
|
First Loss
(3)
|
Mezzanine
|
Total
|
||||||||||
|
CRT Activities:
|
|||||||||||||||
|
STACR transactions
|
|
$766,415
|
|
40
|
%
|
|
$3,777
|
|
|
$18,845
|
|
|
$22,622
|
|
|
|
ACIS transactions
|
807,885
|
|
43
|
|
1,552
|
|
7,571
|
|
9,123
|
|
|||||
|
Senior subordinate securitization structures
|
39,860
|
|
2
|
|
1,807
|
|
2,046
|
|
3,853
|
|
|||||
|
Other
|
18,136
|
|
1
|
|
5,049
|
|
340
|
|
5,389
|
|
|||||
|
Less: UPB with more than one type of
CRT Activity
|
(736,334
|
)
|
(39
|
)
|
—
|
|
—
|
|
—
|
|
|||||
|
Total CRT Activities
|
|
$895,962
|
|
47
|
%
|
|
$12,185
|
|
|
$28,802
|
|
|
$40,987
|
|
|
|
Other Credit Enhancements:
|
|||||||||||||||
|
Primary Mortgage Insurance
|
378,594
|
|
20
|
%
|
96,996
|
|
—
|
|
96,996
|
|
|||||
|
Other
|
2,642
|
|
—
|
|
1,341
|
|
—
|
|
1,341
|
|
|||||
|
Less: UPB with both CRT and other credit enhancements
|
(254,774
|
)
|
(13
|
)
|
—
|
|
—
|
|
—
|
|
|||||
|
Single-family credit guarantee portfolio with credit enhancement
|
1,022,424
|
|
54
|
|
110,522
|
|
28,802
|
|
139,324
|
|
|||||
|
Single-family credit guarantee portfolio without credit enhancement
|
873,762
|
|
46
|
|
—
|
|
—
|
|
—
|
|
|||||
|
Total
|
|
$1,896,186
|
|
100
|
%
|
|
$110,522
|
|
|
$28,802
|
|
|
$139,324
|
|
|
|
FREDDIE MAC
| 2018 Form 10-K
|
95
|
|
|
Management's Discussion and Analysis
|
Risk Management |
Single-Family Mortgage Credit Risk
|
|
Outstanding as of December 31, 2017
|
|||||||||||||||
|
Protected UPB
(1)
|
Percentage of Single-Family Credit Guarantee Portfolio
|
Maximum Coverage
(2)
|
|||||||||||||
|
(In millions)
|
Total
|
Total
|
First Loss
(3)
|
Mezzanine
|
Total
|
||||||||||
|
CRT Activities:
|
|||||||||||||||
|
STACR transactions
|
|
$604,356
|
|
33
|
%
|
|
$1,888
|
|
|
$15,900
|
|
|
$17,788
|
|
|
|
ACIS transactions
|
625,082
|
|
34
|
|
881
|
|
6,052
|
|
6,933
|
|
|||||
|
Senior subordinate securitization structures
|
10,688
|
|
1
|
|
1,070
|
|
683
|
|
1,753
|
|
|||||
|
Other
|
7,233
|
|
—
|
|
4,892
|
|
—
|
|
4,892
|
|
|||||
|
Less: UPB with more than one type of
CRT Activity
|
(581,529
|
)
|
(32
|
)
|
—
|
|
—
|
|
—
|
|
|||||
|
Total CRT Activities
|
|
$665,830
|
|
36
|
%
|
|
$8,731
|
|
|
$22,635
|
|
|
$31,366
|
|
|
|
Other Credit Enhancements:
|
|||||||||||||||
|
Primary Mortgage Insurance
|
334,189
|
|
18
|
|
85,429
|
|
—
|
|
85,429
|
|
|||||
|
Other
|
2,985
|
|
—
|
|
1,550
|
|
—
|
|
1,550
|
|
|||||
|
Less: UPB with both CRT and other credit enhancements
|
(194,222
|
)
|
(11
|
)
|
—
|
|
—
|
|
—
|
|
|||||
|
Single-family credit guarantee portfolio with credit enhancement
|
808,782
|
|
44
|
%
|
95,710
|
|
22,635
|
|
118,345
|
|
|||||
|
Single-family credit guarantee portfolio without credit enhancement
|
1,020,098
|
|
56
|
|
—
|
|
—
|
|
—
|
|
|||||
|
Total
|
|
$1,828,880
|
|
100
|
%
|
|
$95,710
|
|
|
$22,635
|
|
|
$118,345
|
|
|
(
1) For STACR and ACIS transactions, represents the UPB of the assets included in the reference pool. For senior subordinate securitization structure transactions, represents the UPB of the guaranteed securities.
|
(2)
|
For STACR transactions, represents the outstanding balance held by third parties. For ACIS transactions, represents the remaining aggregate limit of insurance purchased from third parties. For senior subordinate securitization structures, represents the UPB of the securities that are subordinate to our guarantee and held by third parties.
|
(3) First loss includes all B tranches in our STACR transactions and their equivalent in ACIS and Other CRT transactions.
We had coverage remaining of
$139.3 billion
and
$118.3 billion
on our single-family credit guarantee portfolio as of December 31, 2018 and December 31, 2017, respectively. Credit risk transfer transactions provided
29.4%
and
26.5%
of the coverage remaining at those dates.
Since the launch of the IMAGIN offering in March 2018, we have obtained coverage of
$155 million
on
$607 million
in UPB with approximately
20
lenders participating in this offering.
The table below provides information on the non-credit-enhanced and credit-enhanced loans in our single-family credit guarantee portfolio. The credit enhanced categories are not mutually exclusive as a single loan may be covered by both primary mortgage insurance and other credit protection.
Table 22 - Non-Credit-Enhanced and Credit-Enhanced Loans in Our Single-Family Credit Guarantee Portfolio
|
As of December 31,
|
|||||||||||||||
|
2018
|
2017
|
2016
|
|||||||||||||
|
(Percentage of portfolio based on UPB)
|
% of Portfolio
|
SDQ Rate
|
% of Portfolio
|
SDQ Rate
|
% of Portfolio
|
SDQ Rate
|
|||||||||
|
Non-credit-enhanced
|
47
|
%
|
0.83
|
%
|
56
|
%
|
1.16
|
%
|
64
|
%
|
1.02
|
%
|
|||
|
Credit-enhanced
|
|||||||||||||||
|
Primary mortgage insurance
|
20
|
|
0.86
|
|
18
|
|
1.43
|
|
17
|
|
1.46
|
|
|||
|
Other
|
48
|
|
0.31
|
|
37
|
|
0.53
|
|
27
|
|
0.43
|
|
|||
|
Total
|
N/A
|
|
0.69
|
%
|
N/A
|
|
1.08
|
%
|
N/A
|
|
1.00
|
%
|
|||
|
FREDDIE MAC
| 2018 Form 10-K
|
96
|
|
|
Management's Discussion and Analysis
|
Risk Management |
Single-Family Mortgage Credit Risk
|
The table below provides information on estimated recoveries we could receive over the risk transfer coverage period from our most significant credit risk transfer transactions (i.e., STACR debt notes, STACR Trusts, and ACIS insurance policies) under various home price scenarios.
The timing of our recognition of the recoveries in our statements of comprehensive income will depend on the type of CRT transaction and whether we are reimbursed based on calculated losses or actual losses, which may result in timing differences between the recognition of CRT recoveries and the related provisions for losses in the financial statements. We recognize losses on the loans in the reference pool when losses are incurred as defined by GAAP. For certain CRT transactions based on actual losses, including STACR Trust and ACIS transactions, recoveries are recognized at the same time as we recognize the losses on the loans in the reference pool. However, for our STACR debt notes based on actual losses, recoveries are recognized in the financial statements when the loss confirming event occurs (i.e., third-party foreclosure sale or REO disposition, deed in lieu of foreclosure, short sale, etc.), which may be several years after the related losses are incurred. Credit risk transfer transactions based on calculated losses are measured at fair value through earnings, so the change in fair value may be recognized prior to the incurrence of the loss.
In the table below, we estimate the potential recoveries from our STACR and ACIS transactions using a sensitivity analysis that utilizes our historical loss and prepayment experience related to loans originated during periods that experienced above average home price appreciation, moderate home price appreciation, and severe home price depreciation. We match these loans to similar groups within the reference pools (related to our CRT transactions with collateral that is reasonably similar to the historical time periods being compared; for example, HARP loans, which did not exist prior to 2009, are excluded from this analysis) using two of the more significant observed credit sensitive mortgage loan attributes, LTV ratios, and origination FICO scores. Our recoveries under these scenarios were estimated based on loan losses, net of mortgage insurance claim amounts.
These are only estimated projections and are designed to illustrate the potential for significant differences in losses and recoveries depending on the economic environment and other factors. Our actual losses and recoveries under these scenarios could differ materially from these estimates. For example, significant improvements to underwriting standards and origination practices since the financial crisis may result in lower loan losses and loss coverage ratio than the scenario-based projections in the table below. In addition, these estimates do not include interest expense and transaction costs we incur to issue our STACR debt notes and premiums we pay on ACIS and STACR Trust transactions.
|
FREDDIE MAC
| 2018 Form 10-K
|
97
|
|
|
Management's Discussion and Analysis
|
Risk Management |
Single-Family Mortgage Credit Risk
|
Table 23 - Single-Family Guarantee Portfolio Credit Risk Transfer Sensitivity Analysis
|
(In millions)
|
As of December 31, 2018
|
|
|
|||||||||||||||
|
UPB of loans covered by STACR transactions and ACIS insurance policies
|
$
|
806,114
|
|
|
||||||||||||||
|
|
Performance Under Home Price Scenarios at December 31, 2018
|
|||||||||||||||||
|
|
Above Average Home Price Appreciation (47%)
(1)
|
Moderate Home Price Appreciation (7%)
(1)
|
Severe Home Price Depreciation (-24%)
(1)
|
|||||||||||||||
|
(Dollars in millions)
|
Amount
|
bps
|
Amount
|
bps
|
Amount
|
bps
|
||||||||||||
|
Estimated credit losses
|
|
$515
|
|
6
|
|
|
$3,064
|
|
38
|
|
|
$19,047
|
|
236
|
|
|||
|
Estimated recoveries from STACR transactions and ACIS insurance policies
|
|
$112
|
|
1
|
|
|
$1,227
|
|
15
|
|
|
$12,568
|
|
156
|
|
|||
|
Loss coverage ratio
|
22
|
%
|
N/A
|
|
40
|
%
|
N/A
|
|
66
|
%
|
N/A
|
|
||||||
(
1) Home price change is over a four-year period.
Monitoring Loan Performance and Characteristics of the Single-Family Credit Guarantee Portfolio and Individual Sellers and Servicers
We review loan performance, including delinquency statistics and related loan characteristics in conjunction with housing market and economic conditions, to determine if our pricing and eligibility standards reflect the risk associated with the loans we purchase and guarantee. We review the payment performance of our loans to facilitate early identification of potential problem loans, which could inform our loss mitigation strategies. We also review performance metrics for additional loan characteristics that may expose us to concentrations of credit risk, including:
|
n
|
Higher risk loan attributes and attribute combinations;
|
|
n
|
Higher risk loan product types; and
|
|
n
|
Geographic concentrations.
|
We actively monitor seller and servicer performance, including compliance with our standards, and periodically review their operational processes. We also periodically change seller/servicer guidelines based on the results of our mortgage portfolio monitoring, if warranted.
Delinquency Rates
Our single-family serious delinquency rate declined in
2018
compared to 2017 due to the greater impact of the hurricane activity in 2017 than subsequent hurricanes in 2018. This decline is also attributable to our continued loss mitigation efforts and sales of certain seriously delinquent loans, as well as home price appreciation and a low unemployment rate. In addition, this improvement was driven by the continued shift in the single-family credit guarantee portfolio mix, as the legacy and relief refinance loan portfolio runs off and we add high credit quality loans to our core single-family loan portfolio.
Our loss mitigation activities may create fluctuations in our delinquency statistics. For example, loans in modification trial periods, loans subject to forbearance agreements, and loans in repayment plans continue to be reported as seriously delinquent. There may also be temporary lags in the reporting of payment status and modification completion due to differing practices of our servicers that can affect our delinquency statistics.
The charts below show the credit losses and serious delinquency rates for each of our single-family loan portfolios. Our core single-family loan portfolio continues to perform well and account for a small percentage of our credit losses, as shown below. Our legacy and relief refinance single-family loan
|
FREDDIE MAC
| 2018 Form 10-K
|
98
|
|
|
Management's Discussion and Analysis
|
Risk Management |
Single-Family Mortgage Credit Risk
|
portfolio continues to decline as a percentage of our overall portfolio, but continues to account for the majority of our credit losses.


The chart below shows the delinquency rates for mortgage loans in our single-family credit guarantee portfolio that are one month and two months past due.
Total Delinquency Rates for Loans One Month and Two Months Past Due

|
FREDDIE MAC
| 2018 Form 10-K
|
99
|
|
|
Management's Discussion and Analysis
|
Risk Management |
Single-Family Mortgage Credit Risk
|
Loan Characteristics
The table below contains a description of some of the loan characteristics we monitor in our single-family credit guarantee portfolio.
|
Characteristic
|
Description
|
Impact on Credit Quality
|
|
|
LTV Ratio
|
Ratio of the UPB of the loan to the value of the underlying property collateralizing the loan. Original LTV ratio is measured at loan origination, while current LTV (CLTV) ratio is defined as the ratio of the current loan UPB to the estimated current property value
|
•
|
Measures ability of the underlying property to cover our exposure on the loan
|
|
•
|
Higher LTV ratios indicate higher risk, as proceeds from sale of the property may not cover our exposure on the loan
|
||
|
•
|
Lower LTV ratios indicate borrowers are more likely to repay
|
||
|
Credit Score
|
Statistically-derived number used by lenders to assess a borrower's likelihood to repay debt. We use FICO scores, which are currently the most commonly used credit scores for mortgages
|
•
|
Borrowers with higher credit scores are generally more likely to repay or have the ability to refinance their loans than those with lower scores
|
|
•
|
Credit scores presented in this Form 10-K are at the time of origination and may not be indicative of the borrowers' current creditworthiness
|
||
|
Loan Purpose
|
Indicates how the borrower intends to use the proceeds from a loan (i.e., purchase, cash-out refinance, or other refinance)
|
•
|
Cash-out refinancings, which increase the LTV ratios, generally have had a higher risk of default than loans originated in purchase or other refinance transactions
|
|
Property Type
|
Indicates whether the property is a detached single-family house, townhouse, condominium, or co-op
|
•
|
Detached single-family houses and townhouses are the predominant type of single-family property
|
|
•
|
Condominiums historically have experienced greater volatility in home prices than detached single-family houses, which may expose us to more risk
|
||
|
Occupancy Type
|
Indicates whether the borrower intends to use the property as a primary residence, second home, or investment property
|
•
|
Loans on primary residence properties tend to have lower credit risk than loans on second homes or investment properties
|
|
Product Type
|
Indicates the type of loan based on key loan terms, such as the contractual maturity, type of interest rate, and payment characteristics of the loan
|
•
|
Loan products that contain terms which result in scheduled changes in monthly payments may result in higher risk
|
|
•
|
Shorter loan terms result in faster repayment of principal and may indicate lower risk
|
||
|
Second Liens
|
Indicates whether the underlying property is covered by more than one loan at the time of origination
|
•
|
Second liens can increase the risk of default
|
|
•
|
Borrowers are free to obtain second-lien financing after origination, and we are not entitled to receive notification when a borrower does so
|
||
|
DTI Ratio
|
Ratio of the borrower's total monthly debt payments to gross monthly income. One indicator of the creditworthiness of borrowers, as it measures borrowers' ability to manage monthly payments and repay debts.
|
•
|
Borrowers with lower DTI ratios are generally more likely to repay their loans than those with higher DTI ratios, holding all other factors equal
|
|
•
|
DTI ratios are at the time of origination and may not be indicative of the borrowers' current credit worthiness.
|
||
|
FREDDIE MAC
| 2018 Form 10-K
|
100
|
|
|
Management's Discussion and Analysis
|
Risk Management |
Single-Family Mortgage Credit Risk
|
The tables below contain details on characteristics of the loans in our single-family credit guarantee portfolio.
Table 24 - Credit Quality Characteristics of Our Single-Family Credit Guarantee Portfolio
|
As of December 31, 2018
|
||||||||||||||
|
(Dollars in billions)
|
UPB
|
Average
Credit Score |
Original
LTV Ratio
|
Current
LTV Ratio |
Current
LTV Ratio
>100%
|
Alt-A %
|
||||||||
|
Core single-family loan portfolio
|
|
$1,550
|
|
750
|
|
74
|
%
|
59
|
%
|
—
|
%
|
—
|
%
|
|
|
Legacy and relief refinance single-family loan portfolio
|
346
|
|
705
|
|
78
|
|
45
|
|
2
|
|
7
|
|
||
|
Total
|
|
$1,896
|
|
743
|
|
76
|
%
|
58
|
%
|
1
|
%
|
1
|
%
|
|
|
|
As of December 31, 2017
|
|||||||||||||
|
(Dollars in billions)
|
UPB
|
Average
Credit Score |
Original
LTV Ratio
|
Current
LTV Ratio |
Current
LTV Ratio
>100%
|
Alt-A %
|
||||||||
|
Core single-family loan portfolio
|
|
$1,424
|
|
751
|
|
73
|
%
|
59
|
%
|
—
|
%
|
—
|
%
|
|
|
Legacy and relief refinance single-family loan portfolio
|
405
|
|
707
|
|
77
|
|
47
|
|
3
|
|
7
|
|
||
|
Total
|
|
$1,829
|
|
743
|
|
75
|
%
|
59
|
%
|
1
|
%
|
1
|
%
|
|
|
FREDDIE MAC
| 2018 Form 10-K
|
101
|
|
|
Management's Discussion and Analysis
|
Risk Management |
Single-Family Mortgage Credit Risk
|
Table 25 - Characteristics of the Loans in Our Single-Family Credit Guarantee Portfolio
|
As of December 31,
|
|||||||
|
(Percentage of portfolio based on UPB)
|
2018
|
2017
|
2016
|
||||
|
Original LTV Ratio Range
|
|||||||
|
60% and below
|
19
|
%
|
20
|
%
|
20
|
%
|
|
|
Above 60% to 80%
|
52
|
%
|
52
|
%
|
53
|
%
|
|
|
Above 80% to 100%
|
26
|
%
|
24
|
%
|
23
|
%
|
|
|
Above 100%
|
3
|
%
|
4
|
%
|
4
|
%
|
|
|
Portfolio weighted average original LTV ratio
|
76
|
%
|
75
|
%
|
75
|
%
|
|
|
Current LTV Ratio Range
|
|||||||
|
60% and below
|
51
|
%
|
49
|
%
|
45
|
%
|
|
|
Above 60% to 80%
|
36
|
%
|
37
|
%
|
38
|
%
|
|
|
Above 80% to 100%
|
12
|
%
|
13
|
%
|
15
|
%
|
|
|
Above 100%
|
1
|
%
|
1
|
%
|
2
|
%
|
|
|
Portfolio weighted average current LTV ratio
|
58
|
%
|
59
|
%
|
61
|
%
|
|
|
Credit Score
|
|||||||
|
740 and above
|
60
|
%
|
60
|
%
|
60
|
%
|
|
|
700 to 739
|
22
|
%
|
21
|
%
|
21
|
%
|
|
|
660 to 699
|
12
|
%
|
12
|
%
|
12
|
%
|
|
|
620 to 659
|
4
|
%
|
5
|
%
|
5
|
%
|
|
|
Less than 620
|
2
|
%
|
2
|
%
|
2
|
%
|
|
|
Portfolio weighted average credit score
|
743
|
|
743
|
|
743
|
|
|
|
Loan Purpose
|
|||||||
|
Purchase
|
45
|
%
|
39
|
%
|
35
|
%
|
|
|
Cash-out refinance
|
20
|
%
|
21
|
%
|
21
|
%
|
|
|
Other refinance
|
35
|
%
|
40
|
%
|
44
|
%
|
|
In addition, at
December 31, 2018
, December 31,
2017
, and December 31,
2016
:
|
n
|
More than 90% of our loans were secured by detached homes or townhomes;
|
|
n
|
Approximately 90% of our loans were secured by properties used as the borrower's primary residence at origination; and
|
|
n
|
More than 90% of our loans were fixed-rate.
|
At
December 31, 2018
, approximately
8%
of our loans had second-lien financing by the originator or other third party at origination, and these loans comprised approximately
14%
of our seriously delinquent loan population. It is likely that additional borrowers have post-origination second-lien financing.
|
FREDDIE MAC
| 2018 Form 10-K
|
102
|
|
|
Management's Discussion and Analysis
|
Risk Management |
Single-Family Mortgage Credit Risk
|
Higher Risk Loan Attributes and Attribute Combinations
Certain of the loan attributes shown above may indicate a higher risk of default. For example, loans with original LTV ratios over 90% and/or credit scores below 620 at origination may be higher risk. The tables below provide information on loans in our portfolio with these characteristics. The tables include a presentation of each higher risk category in isolation. A single loan may fall within more than one category.
Table 26 - Single-Family Credit Guarantee Portfolio Higher Risk Loan Data
|
As of December 31, 2018
|
||||||||||
|
(Dollars in billions)
|
UPB
|
CLTV
|
% Modified
|
SDQ Rate
|
||||||
|
Original LTV ratio greater than 90%, HARP loans
|
|
$85.1
|
|
70
|
%
|
2.9
|
%
|
0.90
|
%
|
|
|
Original LTV ratio greater than 90%, all other loans
|
248.3
|
|
79
|
|
4.4
|
|
1.10
|
|
||
|
Loans with credit scores below 620 at origination
|
33.6
|
|
62
|
|
20.0
|
|
4.59
|
|
||
|
|
As of December 31, 2017
|
|||||||||
|
(Dollars in billions)
|
UPB
|
CLTV
|
% Modified
|
SDQ Rate
|
||||||
|
Original LTV ratio greater than 90%, HARP loans
|
|
$98.9
|
|
76
|
%
|
2.3
|
%
|
1.37
|
%
|
|
|
Original LTV ratio greater than 90%, all other loans
|
205.5
|
|
80
|
|
5.6
|
|
1.88
|
|
||
|
Loans with credit scores below 620 at origination
|
35.2
|
|
65
|
|
21.4
|
|
6.34
|
|
||
In addition, certain combinations of loan attributes can indicate an even higher degree of credit risk, such as loans with both higher LTV ratios and lower credit scores. The following tables show the combination of credit score and CLTV ratio attributes of loans in our single-family credit guarantee portfolio.
Table 27 - Single-Family Credit Guarantee Portfolio Attribute Combinations for Higher Risk Loans
|
As of December 31, 2018
|
||||||||||||||||||||||
|
|
CLTV ≤ 80
|
|
CLTV > 80 to 100
|
|
CLTV > 100
|
|
All Loans
|
|||||||||||||||
|
(Credit score)
|
% Portfolio
|
SDQ Rate
|
|
% Portfolio
|
SDQ Rate
(1)
|
|
% Portfolio
|
SDQ Rate
(1)
|
|
% Portfolio
|
SDQ Rate
|
% Modified
|
||||||||||
|
Core single-family loan portfolio:
|
||||||||||||||||||||||
|
< 620
|
0.3
|
%
|
2.18
|
%
|
—
|
%
|
NM
|
|
—
|
%
|
NM
|
|
0.3
|
%
|
2.34
|
%
|
3.7
|
%
|
||||
|
620 to 659
|
2.0
|
|
1.13
|
|
0.3
|
|
1.27
|
%
|
—
|
|
NM
|
|
2.3
|
|
1.15
|
|
1.9
|
|
||||
|
≥ 660
|
69.0
|
|
0.17
|
|
10.0
|
|
0.25
|
|
—
|
|
NM
|
|
79.0
|
|
0.18
|
|
0.3
|
|
||||
|
Not available
|
0.1
|
|
1.52
|
|
—
|
|
NM
|
|
—
|
|
NM
|
|
0.1
|
|
2.60
|
|
3.6
|
|
||||
|
Total
|
71.4
|
%
|
0.21
|
%
|
10.3
|
%
|
0.30
|
%
|
—
|
%
|
NM
|
|
81.7
|
%
|
0.22
|
%
|
0.4
|
%
|
||||
|
Legacy and relief refinance single-family loan portfolio:
|
||||||||||||||||||||||
|
< 620
|
1.2
|
%
|
4.16
|
%
|
0.2
|
%
|
8.76
|
%
|
0.1
|
%
|
14.34
|
%
|
1.5
|
%
|
4.94
|
%
|
22.6
|
%
|
||||
|
620 to 659
|
1.7
|
|
3.13
|
|
0.3
|
|
6.78
|
|
0.1
|
|
11.69
|
|
2.1
|
|
3.68
|
|
19.8
|
|
||||
|
≥ 660
|
13.0
|
|
1.12
|
|
1.2
|
|
3.60
|
|
0.4
|
|
5.81
|
|
14.6
|
|
1.33
|
|
7.1
|
|
||||
|
Not available
|
0.1
|
|
4.62
|
|
—
|
|
NM
|
|
—
|
|
NM
|
|
0.1
|
|
4.98
|
|
19.5
|
|
||||
|
Total
|
16.0
|
%
|
1.62
|
%
|
1.7
|
%
|
4.78
|
%
|
0.6
|
%
|
8.18
|
%
|
18.3
|
%
|
1.93
|
%
|
10.0
|
%
|
||||
|
FREDDIE MAC
| 2018 Form 10-K
|
103
|
|
|
Management's Discussion and Analysis
|
Risk Management |
Single-Family Mortgage Credit Risk
|
|
As of December 31, 2017
|
||||||||||||||||||||||
|
|
CLTV ≤ 80
|
CLTV > 80 to 100
|
CLTV > 100
|
All Loans
|
||||||||||||||||||
|
(Credit score)
|
% Portfolio
|
SDQ Rate
|
% Portfolio
|
SDQ Rate
(1)
|
% Portfolio
|
SDQ Rate
(1)
|
% Portfolio
|
SDQ Rate
|
% Modified
|
|||||||||||||
|
Core single-family loan portfolio:
|
||||||||||||||||||||||
|
< 620
|
0.3
|
%
|
2.89
|
%
|
—
|
%
|
NM
|
|
—
|
%
|
NM
|
|
0.3
|
%
|
3.18
|
%
|
3.3
|
%
|
||||
|
620 to 659
|
1.8
|
|
1.63
|
|
0.3
|
|
1.92
|
|
—
|
|
NM
|
|
2.1
|
|
1.67
|
|
1.4
|
|
||||
|
≥ 660
|
65.9
|
|
0.27
|
|
9.5
|
|
0.46
|
|
—
|
|
NM
|
|
75.4
|
|
0.29
|
|
0.2
|
|
||||
|
Not available
|
0.1
|
|
2.48
|
|
—
|
|
NM
|
|
—
|
|
NM
|
|
0.1
|
|
4.47
|
|
3.6
|
|
||||
|
Total
|
68.1
|
%
|
0.32
|
%
|
9.8
|
%
|
0.55
|
%
|
—
|
%
|
NM
|
|
77.9
|
%
|
0.35
|
%
|
0.3
|
%
|
||||
|
Legacy and relief refinance single-family loan portfolio:
|
||||||||||||||||||||||
|
< 620
|
1.2
|
%
|
5.61
|
%
|
0.3
|
%
|
10.17
|
%
|
0.1
|
%
|
16.24
|
%
|
1.6
|
%
|
6.71
|
%
|
23.5
|
%
|
||||
|
620 to 659
|
2.0
|
|
4.17
|
|
0.4
|
|
8.05
|
|
0.2
|
|
13.75
|
|
2.6
|
|
5.04
|
|
20.3
|
|
||||
|
≥ 660
|
14.9
|
|
1.47
|
|
2.2
|
|
4.11
|
|
0.7
|
|
6.67
|
|
17.8
|
|
1.81
|
|
7.3
|
|
||||
|
Not available
|
0.1
|
|
5.60
|
|
—
|
|
NM
|
|
—
|
|
NM
|
|
0.1
|
|
6.07
|
|
17.8
|
|
||||
|
Total
|
18.2
|
%
|
2.11
|
%
|
2.9
|
%
|
5.39
|
%
|
1.0
|
%
|
9.14
|
%
|
22.1
|
%
|
2.59
|
%
|
10.1
|
%
|
||||
|
(1)
|
NM - not meaningful due to the percentage of the portfolio rounding to zero.
|
Higher Risk Loan Product Types
There are several types of loan products that contain terms which result in scheduled changes in the borrower's monthly payments after specified initial periods, such as interest-only and option ARM loans. These products may result in higher credit risk because the payment changes may increase the borrower's monthly payment, resulting in a higher risk of default. The majority of these loans are in our legacy and relief refinance single-family loan portfolio. Only a small percentage of our core single-family loan portfolio consists of ARM loans. We fully discontinued purchases of option ARM loans in 2007, Alt-A loans in 2009, and interest-only loans in 2010.
The balance of our interest-only and option ARM loans has continued to decline in recent years as many of these borrowers have repaid or refinanced their loans, received loan modifications or completed foreclosure alternatives or foreclosure sales.
While we have not categorized option ARM loans as either subprime or Alt-A for presentation in this Form 10-K and elsewhere in our reporting, they could exhibit similar credit performance to collateral sometimes referred to as subprime or Alt-A by market participants. For reporting purposes, loans within the option ARM category continue to be presented in that category following a modification of the loan, even though the modified loan no longer provides for optional payment provisions.
|
FREDDIE MAC
| 2018 Form 10-K
|
104
|
|
|
Management's Discussion and Analysis
|
Risk Management |
Single-Family Mortgage Credit Risk
|
The tables below provide credit characteristic information on higher risk loan product types.
Table 28 - Higher Risk Single-Family Loan Credit Characteristics
|
As of December 31, 2018
|
||||||||||
|
(Dollars in billions)
|
UPB
|
CLTV
|
% Modified
|
SDQ Rate
|
||||||
|
Amortizing ARM and option ARM
(1)
|
|
$47.7
|
|
50
|
%
|
1.9
|
%
|
0.88
|
%
|
|
|
Interest-only
|
11.0
|
|
64
|
|
0.1
|
|
3.43
|
|
||
|
Step-rate modified
|
14.5
|
|
64
|
|
100
|
|
6.12
|
|
||
|
As of December 31, 2017
|
||||||||||
|
(Dollars in billions)
|
UPB
|
CLTV
|
% Modified
|
SDQ Rate
|
||||||
|
Amortizing ARM and option ARM
(1)
|
|
$56.0
|
|
52
|
%
|
1.7
|
%
|
1.13
|
%
|
|
|
Interest-only
|
13.0
|
|
68
|
|
0.1
|
|
4.97
|
|
||
|
Step-rate modified
|
22.2
|
|
70
|
|
100
|
|
8.03
|
|
||
|
(1)
|
Includes
$3.0 billion
and $3.6 billion in UPB of option ARM loans as of
December 31, 2018
and December 31,
2017
, respectively. As of
December 31, 2018
and December 31,
2017
, the option ARM loans had: (a) current LTV ratios of
54%
and 58%, (b) loan modification percentages of
17.9%
and 15.6%, and (c) serious delinquency rates of
3.40%
and 4.58%, respectively.
|
The table below shows the timing of scheduled payment changes for certain types of loans within our single-family credit guarantee portfolio. The amounts in the table below are aggregated by product type and categorized by the year in which the loan will experience a payment change. The timing of the actual payment change may differ from that presented in the table due to a number of factors, including if the borrower refinances the loan. Loans where the year of first payment change is
2018
or prior have already had one or more payment changes as of
December 31, 2018
; loans where the year of first payment change is 2019 or later have not had a payment change as of
December 31, 2018
and will not experience a payment change until a future period. Step-rate modified loans are shown in each year that the borrower will experience a scheduled interest-rate increase; therefore, a single loan may be included in multiple periods. However, the total of step-rate loans in the table reflects the ending UPB of such loans as of
December 31, 2018
.
Table 29 - Timing of Scheduled Payment Changes for Certain Single-Family Loan Types
|
As of December 31, 2018
|
|||||||||||||||||||||||||
|
(In millions)
|
2018 and Prior
|
2019
|
2020
|
2021
|
2022
|
2023
|
Thereafter
|
Total
(1)
|
|||||||||||||||||
|
ARM/amortizing
|
|
$10,342
|
|
|
$3,707
|
|
|
$5,048
|
|
|
$4,625
|
|
|
$5,672
|
|
|
$4,556
|
|
|
$10,487
|
|
|
$44,437
|
|
|
|
ARM/interest-only
|
6,500
|
|
51
|
|
120
|
|
—
|
|
—
|
|
—
|
|
—
|
|
6,671
|
|
|||||||||
|
Fixed/interest-only
|
669
|
|
2
|
|
2
|
|
11
|
|
34
|
|
2
|
|
—
|
|
720
|
|
|||||||||
|
Step-rate modified
|
12,519
|
|
2,652
|
|
2,092
|
|
1,600
|
|
396
|
|
93
|
|
47
|
|
14,485
|
|
|||||||||
|
Total
|
|
$30,030
|
|
|
$6,412
|
|
|
$7,262
|
|
|
$6,236
|
|
|
$6,102
|
|
|
$4,651
|
|
|
$10,534
|
|
|
$66,313
|
|
|
|
(1)
|
Excludes loans underlying certain other securitization products since the payment change information is not available to us for these loans.
|
We believe that the performance of these types of loans has been affected by prior adverse macroeconomic conditions, such as unemployment rates and home price declines in many geographic areas, in addition to the increase in the borrower's monthly payment. However, we continue to monitor the performance of these loans as many have experienced a payment change or are scheduled to have a payment change in 2019 or thereafter, which is likely to subject the borrowers to higher monthly payments. Since a substantial portion of these loans were originated in 2005 through 2008 and are located in geographic areas that were most affected by declines in home prices that began in 2006, we believe that the serious delinquency rate for these types of loans will remain high in 2019.
|
FREDDIE MAC
| 2018 Form 10-K
|
105
|
|
|
Management's Discussion and Analysis
|
Risk Management |
Single-Family Mortgage Credit Risk
|
Other Higher Risk Loans - Alt-A and Subprime Loans
While we have referred to certain loans as subprime or Alt-A for purposes of the discussion below and elsewhere in this Form 10-K, there is no universally accepted definition of subprime or Alt-A, and the classification of such loans may differ from company to company. We do not rely on these loan classifications to evaluate the credit risk exposure relating to such loans in our single-family credit guarantee portfolio.
Participants in the mortgage market have characterized single-family loans based upon their overall credit quality at the time of origination, including as prime or subprime. While we have not historically characterized the loans in our single-family credit guarantee portfolio as either prime or subprime, we monitor the amount of loans we have guaranteed with characteristics that indicate a higher degree of credit risk. In addition, we estimate that approximately
$0.9 billion
and $1.1 billion of security collateral underlying our other securitization products at
December 31, 2018
and December 31,
2017
, respectively, were identified as subprime based on information provided to us when we entered into these transactions.
Mortgage market participants have classified single-family loans as Alt-A if these loans have credit characteristics that range between their prime and subprime categories, if they are underwritten with lower or alternative income or asset documentation requirements compared to a full documentation loan, or both. Although we have discontinued new purchases of loans with lower documentation standards, we continue to purchase certain amounts of such loans in cases where the loan was either purchased pursuant to a previously issued guarantee, part of our relief refinance initiative or part of another refinance loan initiative and the pre-existing loan was originated under less than full documentation standards. In the event we purchase a refinance loan and the original loan had been previously identified as Alt-A, such refinance loan may no longer be categorized or reported as an Alt-A loan in this Form 10-K and our other financial reports because the new refinance loan replacing the original loan would not be identified by the seller or servicer as an Alt-A loan. As a result, our reported Alt-A balances may be lower than would otherwise be the case had such refinancing not occurred. From the time the relief refinance initiative began in 2009 to
December 31, 2018
, we have purchased approximately
$36.3 billion
of relief refinance loans that were previously categorized as Alt-A loans in our portfolio, including
$0.4 billion
in
2018
.
The table below contains information on Alt-A loans in our single-family credit guarantee portfolio.
Table 30 - Alt-A Loans in Our Single-Family Credit Guarantee Portfolio
|
As of December 31, 2018
|
As of December 31, 2017
|
|||||||||||||||||||
|
(Dollars in billions)
|
UPB
|
CLTV
|
% Modified
|
SDQ Rate
|
UPB
|
CLTV
|
% Modified
|
SDQ Rate
|
||||||||||||
|
Alt-A
|
|
$23.9
|
|
63
|
%
|
23.2
|
%
|
4.13
|
%
|
|
$27.1
|
|
67
|
%
|
24.1
|
%
|
5.62
|
%
|
||
The UPB of Alt-A loans in our single-family credit guarantee portfolio declined during
2018
primarily due to borrowers refinancing into other mortgage products, foreclosure sales, and other liquidation events. Significant portions of the Alt-A loans in our portfolio are concentrated in Arizona, California, Florida, and Nevada.
|
FREDDIE MAC
| 2018 Form 10-K
|
106
|
|
|
Management's Discussion and Analysis
|
Risk Management |
Single-Family Mortgage Credit Risk
|
Geographic Concentrations
We purchase mortgage loans from across the U.S. and maintain a geographically diverse portfolio. However, local economic conditions can affect borrowers' ability to repay and the value of the underlying collateral, leading to concentrations of credit risk in certain geographic areas.
The following table presents certain geographic concentrations in our single-family credit guarantee portfolio. The states presented below had the largest number of seriously delinquent loans as of
December 31, 2018
. See
Note 14
for additional information on the concentration of credit risk in our single-family credit guarantee portfolio.
Table 31 - Geographic Concentration in Our Single-Family Credit Guarantee Portfolio
|
As of December 31, 2018
|
Full Year 2018 Credit Losses
|
As of December 31, 2017
|
Full Year 2017 Credit Losses
|
As of December 31, 2016
|
Full Year 2016 Credit Losses
|
|||||||||||||||||||||||||
|
(Dollars in millions)
|
SDQ
Loan Count
|
% of SDQ
Loans
|
SDQ Rate
|
SDQ
Loan Count
|
% of SDQ
Loans
|
SDQ Rate
|
SDQ
Loan Count
|
% of SDQ
Loans
|
SDQ Rate
|
|||||||||||||||||||||
|
Florida
|
6,888
|
|
9
|
%
|
1.01
|
%
|
|
$263
|
|
22,253
|
|
19
|
%
|
3.33
|
%
|
|
$614
|
|
9,355
|
|
9
|
%
|
1.42
|
%
|
|
$157
|
|
|||
|
New York
|
6,312
|
|
8
|
|
1.37
|
|
289
|
|
8,117
|
|
7
|
|
1.74
|
|
415
|
|
9,574
|
|
9
|
|
2.05
|
|
163
|
|
||||||
|
Illinois
|
4,750
|
|
6
|
|
0.86
|
|
244
|
|
6,228
|
|
5
|
|
1.13
|
|
445
|
|
7,291
|
|
7
|
|
1.34
|
|
170
|
|
||||||
|
California
|
4,610
|
|
6
|
|
0.35
|
|
275
|
|
5,514
|
|
5
|
|
0.41
|
|
884
|
|
5,992
|
|
6
|
|
0.46
|
|
83
|
|
||||||
|
Texas
|
4,081
|
|
5
|
|
0.59
|
|
55
|
|
8,908
|
|
8
|
|
1.36
|
|
44
|
|
4,357
|
|
4
|
|
0.70
|
|
15
|
|
||||||
|
All Others
|
48,499
|
|
66
|
|
0.67
|
|
1,454
|
|
64,669
|
|
56
|
|
0.90
|
|
2,413
|
|
69,365
|
|
65
|
|
0.98
|
|
1,140
|
|
||||||
|
Total
|
75,140
|
|
100
|
%
|
0.69
|
%
|
|
$2,580
|
|
115,689
|
|
100
|
%
|
1.08
|
%
|
|
$4,815
|
|
105,934
|
|
100
|
%
|
1.00
|
%
|
|
$1,728
|
|
|||
The following table presents our single-family charge-offs and recoveries in each geographic region. See
Single-Family Credit Guarantee Portfolio
in
Note 14
for a description of these regions.
Table 32 - Single-Family Charge-Offs and Recoveries by Region
|
|
|
Year Ended December 31,
|
||||||||||||||||||||||||||||
|
|
|
2018
|
|
2017
|
|
2016
|
||||||||||||||||||||||||
|
(In millions)
|
|
Charge-offs,
gross (1) |
Recoveries
|
Charge-offs,
net |
|
Charge-offs,
gross (1) |
Recoveries
|
Charge-offs,
net |
|
Charge-offs,
gross (1) |
Recoveries
|
Charge-offs,
net |
||||||||||||||||||
|
Northeast
|
|
|
$1,105
|
|
|
($175
|
)
|
|
$930
|
|
|
|
$1,690
|
|
|
($155
|
)
|
|
$1,535
|
|
|
|
$752
|
|
|
($188
|
)
|
|
$564
|
|
|
North Central
|
|
544
|
|
(88
|
)
|
456
|
|
|
774
|
|
(81
|
)
|
693
|
|
|
425
|
|
(94
|
)
|
331
|
|
|||||||||
|
West
|
|
522
|
|
(72
|
)
|
450
|
|
|
1,382
|
|
(62
|
)
|
1,320
|
|
|
247
|
|
(58
|
)
|
189
|
|
|||||||||
|
Southeast
|
|
515
|
|
(98
|
)
|
417
|
|
|
1,001
|
|
(95
|
)
|
906
|
|
|
401
|
|
(121
|
)
|
280
|
|
|||||||||
|
Southwest
|
199
|
|
(42
|
)
|
157
|
|
204
|
|
(32
|
)
|
172
|
|
113
|
|
(36
|
)
|
77
|
|
||||||||||||
|
Total
|
|
|
$2,885
|
|
|
($475
|
)
|
|
$2,410
|
|
|
|
$5,051
|
|
|
($425
|
)
|
|
$4,626
|
|
|
|
$1,938
|
|
|
($497
|
)
|
|
$1,441
|
|
|
(1)
|
2016 does not include lower-of-cost-or-fair-value adjustments and other expenses related to property taxes and insurance recognized when we transfer loans from held-for-investment to held-for-sale, which totaled $1.2 billion. 2018 and 2017 include charge-offs of $2.1 billion and $3.8 billion, respectively, related to the transfer of loans from held-for-investment to held-for-sale.
|
|
FREDDIE MAC
| 2018 Form 10-K
|
107
|
|
|
Management's Discussion and Analysis
|
Risk Management |
Single-Family Mortgage Credit Risk
|
The tables below present the concentration of loans in each geographic region by CLTV ratio.
Table 33 - Concentration of Single-Family Loans in Each Region by CLTV Ratio
|
As of December 31, 2018
|
||||||||||||||||||||
|
CLTV <= 80%
|
CLTV > 80% to 100%
|
CLTV > 100%
|
All Loans
|
|||||||||||||||||
|
% of Portfolio
|
SDQ Rate
|
% of Portfolio
|
SDQ Rate
|
% of Portfolio
|
SDQ Rate
|
% of Portfolio
|
SDQ Rate
|
|||||||||||||
|
North Central
|
14
|
%
|
0.55
|
%
|
2
|
%
|
0.93
|
%
|
—
|
%
|
6.23
|
%
|
16
|
%
|
0.63
|
%
|
||||
|
Northeast
|
21
|
|
0.79
|
|
3
|
|
1.62
|
|
—
|
|
10.57
|
|
24
|
|
0.96
|
|
||||
|
Southeast
|
14
|
|
0.79
|
|
2
|
|
1.37
|
|
—
|
|
7.75
|
|
16
|
|
0.90
|
|
||||
|
Southwest
|
12
|
|
0.56
|
|
2
|
|
0.58
|
|
—
|
|
5.80
|
|
14
|
|
0.57
|
|
||||
|
West
|
27
|
|
0.35
|
|
2
|
|
0.76
|
|
1
|
|
3.81
|
|
30
|
|
0.38
|
|
||||
|
Total
|
88
|
%
|
0.60
|
%
|
11
|
%
|
1.09
|
%
|
1
|
%
|
7.98
|
%
|
100
|
%
|
0.69
|
%
|
||||
|
As of December 31, 2017
|
||||||||||||||||||||
|
CLTV <= 80%
|
CLTV > 80% to 100%
|
CLTV > 100%
|
All Loans
|
|||||||||||||||||
|
% of Portfolio
|
SDQ Rate
|
% of Portfolio
|
SDQ Rate
|
% of Portfolio
|
SDQ Rate
|
% of Portfolio
|
SDQ Rate
|
|||||||||||||
|
North Central
|
13
|
%
|
0.65
|
%
|
3
|
%
|
1.29
|
%
|
—
|
%
|
6.77
|
%
|
16
|
%
|
0.81
|
%
|
||||
|
Northeast
|
21
|
|
0.96
|
|
4
|
|
2.13
|
|
—
|
|
11.17
|
|
25
|
|
1.24
|
|
||||
|
Southeast
|
14
|
|
1.67
|
|
2
|
|
3.34
|
|
—
|
|
10.58
|
|
16
|
|
1.95
|
|
||||
|
Southwest
|
11
|
|
0.94
|
|
2
|
|
1.23
|
|
—
|
|
6.73
|
|
13
|
|
0.98
|
|
||||
|
West
|
27
|
|
0.40
|
|
2
|
|
1.14
|
|
1
|
|
5.36
|
|
30
|
|
0.47
|
|
||||
|
Total
|
86
|
%
|
0.89
|
%
|
13
|
%
|
1.87
|
%
|
1
|
%
|
8.95
|
%
|
100
|
%
|
1.08
|
%
|
||||
Credit Losses and Recoveries
On January 1, 2017, we elected a new accounting policy for loan reclassifications from held-for-investment to held-for-sale that increased the amount of charge-offs recognized during 2017. Under the new policy, when we reclassify (transfer) a loan from held-for-investment to held-for-sale, we charge off the entire difference between the loan's recorded investment and its fair value if the loan has a history of credit-related issues. Expenses related to property taxes and insurance are included as part of the charge-off. See
Note 4
for further information about this change.
The table below contains certain credit performance metrics of our single-family credit guarantee portfolio.
Table 34 - Single-Family Credit Guarantee Portfolio Credit Performance Metrics
|
Year Ended December 31,
|
||||||||||
|
(Dollars in millions)
|
2018
|
2017
|
2016
|
|||||||
|
Charge-offs, gross
(1)
|
|
$2,885
|
|
|
$5,051
|
|
|
$1,938
|
|
|
|
Recoveries
|
(475
|
)
|
(425
|
)
|
(497
|
)
|
||||
|
Charge-offs, net
|
2,410
|
|
4,626
|
|
1,441
|
|
||||
|
REO operations expense
|
170
|
|
189
|
|
287
|
|
||||
|
Total credit losses
|
|
$2,580
|
|
|
$4,815
|
|
|
$1,728
|
|
|
|
Total credit losses
(1)
(in bps)
|
13.7
|
|
27.0
|
|
9.9
|
|
||||
|
(1)
|
2016 does not include lower-of-cost-or-fair value adjustments and other expenses related to property taxes and insurance recognized when we transfer loans from held-for-investment to held-for-sale, which totaled $1.2 billion. 2018 and 2017 include charge-offs of
$2.1 billion
and $3.8 billion, respectively, related to the transfer of loans from held-for-investment to held-for-sale.
|
|
FREDDIE MAC
| 2018 Form 10-K
|
108
|
|
|
Management's Discussion and Analysis
|
Risk Management |
Single-Family Mortgage Credit Risk
|
We recognized recoveries from primary mortgage insurance (excluding recoveries that represent reimbursements for our expenses, such as REO operations expenses) of
$151 million
,
$263 million
, and
$329 million
that reduced our charge-offs of single-family loans during
2018
,
2017
, and
2016
, respectively. We also recognized recoveries from primary mortgage insurance of
$47 million
, $50 million, and $47 million during
2018
,
2017
, and
2016
, respectively, as part of REO operations (expense) income.
Our credit losses and seriously delinquent loan population are concentrated in the legacy and relief refinance single-family loan portfolio. In addition, our credit losses and seriously delinquent loan population are also concentrated within loans having certain characteristics, as shown in the table below. These categories are not mutually exclusive; for example, an Alt-A loan can be associated with a property located in a judicial foreclosure state and/or have a CLTV ratio of greater than 100%. Additional detail on loans in judicial foreclosure states is presented in the
Managing Foreclosure and REO Activities
section below.
Table 35 - Credit Characteristics of Certain Single-Family Loan Categories
|
2018
|
2017
|
|||||||||||||||
|
As of December 31
|
Year Ended December 31
|
As of December 31
|
Year Ended December 31
|
|||||||||||||
|
|
|
% of Portfolio
|
SDQ Rate
|
% of Credit Losses
|
% of Portfolio
|
SDQ Rate
|
% of Credit Losses
|
|||||||||
|
CLTV > 100%
|
|
1
|
%
|
7.98
|
%
|
16
|
%
|
1
|
%
|
8.95
|
%
|
28
|
%
|
|||
|
Alt-A loans
|
|
1
|
|
4.13
|
|
16
|
|
1
|
|
5.62
|
|
22
|
|
|||
|
Judicial foreclosure states
|
|
38
|
|
0.92
|
|
59
|
|
38
|
|
1.56
|
|
53
|
|
|||
Allowance for Credit Losses
Our allowance for credit losses continued to decline in 2018, primarily driven by charge-offs as a result of our transfer of loans from held-for-investment to held-for-sale.
The table below summarizes our single-family allowance for credit losses activity.
Table 36 - Single-Family Allowance for Credit Losses Activity
|
Year Ended December 31,
|
||||||||||||||||
|
(Dollars in millions)
|
2018
|
2017
|
2016
|
2015
|
2014
|
|||||||||||
|
Beginning balance
|
|
$8,979
|
|
|
$13,463
|
|
|
$15,348
|
|
|
$21,793
|
|
|
$24,578
|
|
|
|
Provision (benefit) for credit losses
|
(712
|
)
|
(97
|
)
|
(781
|
)
|
(2,639
|
)
|
113
|
|
||||||
|
Charge-offs, gross
(1)
|
(2,885
|
)
|
(5,051
|
)
|
(1,938
|
)
|
(5,071
|
)
|
(4,892
|
)
|
||||||
|
Recoveries
|
475
|
|
425
|
|
497
|
|
717
|
|
1,258
|
|
||||||
|
Transfers, net
|
—
|
|
—
|
|
—
|
|
—
|
|
—
|
|
||||||
|
Other
(2)
|
319
|
|
239
|
|
337
|
|
548
|
|
736
|
|
||||||
|
Ending balance
|
|
$6,176
|
|
|
$8,979
|
|
|
$13,463
|
|
|
$15,348
|
|
|
$21,793
|
|
|
|
As a percentage of our single-family credit guarantee portfolio
|
0.33
|
%
|
0.49
|
%
|
0.77
|
%
|
0.90
|
%
|
1.31
|
%
|
||||||
|
(1)
|
2016, 2015, and 2014 do not include lower-of-cost-or-fair value adjustments and other expenses related to property taxes and insurance recognized when we transfer loans from held-for-investment to held-for-sale, which totaled $1.2 billion, $3.4 billion, and $0.3 billion, respectively. 2018 and 2017 include charge-offs of $2.1 billion and $3.8 billion, respectively, related to the transfer of loans from held-for-investment to held-for-sale.
|
|
(2)
|
Primarily includes capitalization of past due interest on modified loans.
|
|
FREDDIE MAC
| 2018 Form 10-K
|
109
|
|
|
Management's Discussion and Analysis
|
Risk Management |
Single-Family Mortgage Credit Risk
|
TDRs and Individually Impaired Loans
Single-family loans that have been individually evaluated for impairment, such as modified loans, generally have a higher associated allowance for loan losses than loans that have been collectively evaluated for impairment. Due to the large number of loan modifications completed in recent years, a significant portion of our allowance for loan losses is attributable to individually impaired single-family loans. As of December 31, 2018,
45%
of the allowance for loan losses for single-family loans related to interest rate concessions provided to borrowers as part of loan modifications. Most of our modified single-family loans, including TDRs, were current and performing at
December 31, 2018
. We expect our allowance for loan losses associated with existing single-family TDRs to decline over time as we continue to sell reperforming loans. In addition, these allowances for loan losses will decline as borrowers continue to make monthly payments under the modified terms and interest rate concessions are amortized into earnings.
The table below summarizes the carrying value on our consolidated balance sheets for individually impaired single-family loans for which we have recorded an allowance determined on an individual basis.
Table 37 - Single-Family Individually Impaired Loans with an Allowance Recorded
|
|
2018
|
|
2017
|
|||||||||
|
(Dollars in millions)
|
Loan Count
|
Amount
|
|
Loan Count
|
Amount
|
|||||||
|
TDRs, at January 1
|
364,704
|
|
|
$54,415
|
|
|
485,709
|
|
|
$78,869
|
|
|
|
New additions
|
52,300
|
|
8,115
|
|
|
41,343
|
|
5,714
|
|
|||
|
Repayments and reclassifications to held-for-sale
|
(119,366
|
)
|
(19,285
|
)
|
|
(151,941
|
)
|
(28,737
|
)
|
|||
|
Foreclosure sales and foreclosure alternatives
|
(7,383
|
)
|
(991
|
)
|
|
(10,407
|
)
|
(1,431
|
)
|
|||
|
TDRs, at December 31
|
290,255
|
|
42,254
|
|
|
364,704
|
|
54,415
|
|
|||
|
Loans impaired upon purchase
|
2,555
|
|
170
|
|
|
5,040
|
|
340
|
|
|||
|
Total impaired loans with an allowance recorded
|
292,810
|
|
42,424
|
|
|
369,744
|
|
54,755
|
|
|||
|
Allowance for loan losses
|
|
(4,369
|
)
|
|
|
(6,630
|
)
|
|||||
|
Net investment, at December 31
|
|
|
$38,055
|
|
|
|
|
$48,125
|
|
|||
|
FREDDIE MAC
| 2018 Form 10-K
|
110
|
|
|
Management's Discussion and Analysis
|
Risk Management |
Single-Family Mortgage Credit Risk
|
The tables below present information about the UPB of single-family TDRs and non-accrual loans on our consolidated balance sheets.
Table 38 - Single-Family TDR and Non-Accrual Loans
|
As of December 31,
|
||||||||||||||||
|
(In millions)
|
2018
|
2017
|
2016
|
2015
|
2014
|
|||||||||||
|
TDRs on accrual status
|
|
$41,839
|
|
|
$51,644
|
|
|
$77,122
|
|
|
$82,026
|
|
|
$82,373
|
|
|
|
Non-accrual loans
|
11,197
|
|
17,748
|
|
16,164
|
|
22,460
|
|
32,745
|
|
||||||
|
Total TDRs and non-accrual loans
|
|
$53,036
|
|
|
$69,392
|
|
|
$93,286
|
|
|
$104,486
|
|
|
$115,118
|
|
|
|
Allowance for loan losses associated with:
|
||||||||||||||||
|
TDRs on accrual status
|
|
$3,612
|
|
|
$5,257
|
|
|
$10,295
|
|
|
$12,105
|
|
|
$13,728
|
|
|
|
Non-accrual loans
|
1,003
|
|
1,883
|
|
2,290
|
|
2,677
|
|
6,935
|
|
||||||
|
Total
|
|
$4,615
|
|
|
$7,140
|
|
|
$12,585
|
|
|
$14,782
|
|
|
$20,663
|
|
|
|
Year Ended December 31,
|
||||||||||||||||
|
(In millions)
|
2018
|
2017
|
2016
|
2015
|
2014
|
|||||||||||
|
Foregone interest income on TDRs and non-accrual loans
(1)
|
|
$1,122
|
|
|
$1,604
|
|
|
$2,109
|
|
|
$2,690
|
|
|
$3,235
|
|
|
|
(1)
|
Represents the amount of interest income that we did not recognize but would have recognized during the period for loans outstanding at the end of each period, had the loans performed according to their original contractual terms.
|
Engaging in Loss Mitigation Activities
Servicers perform loss mitigation activities as well as foreclosures on loans that they service for us. Our loss mitigation strategy emphasizes early intervention by servicers in delinquent loans and offers alternatives to foreclosure by providing servicers with default management programs designed to manage non-performing loans more effectively and to assist borrowers in maintaining home ownership or to facilitate foreclosure alternatives.
We offer a variety of borrower assistance programs, including refinance programs for certain eligible loans and loan workout activities for struggling borrowers. Our loan workouts include both home retention options and foreclosure alternatives. We also engage in transfers of servicing for and sales of certain seriously delinquent loans.
Relief Refinance Program
As part of our loss mitigation activities, servicers contact borrowers that are eligible for the relief refinance initiative. Our relief refinance initiative allows eligible homeowners whose loans we already own or guarantee to refinance with more favorable terms (such as reduction in payment, reduction in interest rate or movement to a more stable loan product) and without the need to obtain additional mortgage insurance. Prior to January 2019, our relief refinance program included HARP, the portion of our relief refinance initiative for loans with LTV ratios above 80%. The HARP program ended on December 31, 2018, although we will continue to purchase HARP loans with application received dates on or prior to December 31, 2018 through September 30, 2019.
The relief refinance program has been replaced with the Enhanced Relief Refinance program, which became available in January 2019 for loans originated on or after October 1, 2017. This program provides liquidity for borrowers who are current on their mortgages but are unable to refinance because their LTV ratios exceed our standard refinance limits.
|
FREDDIE MAC
| 2018 Form 10-K
|
111
|
|
|
Management's Discussion and Analysis
|
Risk Management |
Single-Family Mortgage Credit Risk
|
The following table includes information about the performance of our relief refinance mortgage portfolio.
Table 39 - Single-Family Relief Refinance Loans
|
As of December 31,
|
||||||||||||||||
|
2018
|
2017
|
|||||||||||||||
|
(Dollars in millions)
|
UPB
|
Loan Count
|
SDQ Rate
|
UPB
|
Loan Count
|
SDQ Rate
|
||||||||||
|
Above 125% Original LTV
|
|
$18,847
|
|
117,410
|
|
0.97
|
%
|
|
$21,814
|
|
131,045
|
|
1.76
|
%
|
||
|
Above 100% to 125% Original LTV
|
37,084
|
|
228,419
|
|
0.93
|
|
43,177
|
|
256,189
|
|
1.34
|
|
||||
|
Above 80% to 100% Original LTV
|
61,843
|
|
410,027
|
|
0.77
|
|
71,559
|
|
455,451
|
|
1.05
|
|
||||
|
80% and below Original LTV
|
83,647
|
|
762,477
|
|
0.42
|
|
95,700
|
|
835,381
|
|
0.58
|
|
||||
|
Total
|
|
$201,421
|
|
1,518,333
|
|
0.64
|
%
|
|
$232,250
|
|
1,678,066
|
|
0.92
|
%
|
||
Loan Workout Activities
When refinancing is not practicable, we require our servicers first to evaluate the loan for a forbearance agreement, repayment plan or loan modification, because our level of recovery on a loan that reperforms is often much higher than for a loan that proceeds to a foreclosure alternative or foreclosure. We offer the following types of home retention options:
|
n
|
Forbearance agreements
- Arrangements that require reduced or no payments during a defined period, generally less than one year, to allow borrowers to return to compliance with the original mortgage terms or to implement another loan workout. For agreements completed in 2018, the average time period for reduced or suspended payments was between four and five months.
|
|
n
|
Repayment plans
- Contractual plans designed to repay past due amounts to allow borrowers to return to compliance with the original mortgage terms. For plans completed in 2018, the average time period to repay past due amounts was approximately four months. Servicers are paid incentive fees for repayment plans that are paid in full and loans brought to current status.
|
|
n
|
Loan modifications
- Contractual plans that may involve changing the terms of the loan, adding outstanding indebtedness, such as delinquent interest, to the UPB of the loan, or a combination of both, including principal forbearance. Our modification programs generally require completion of a trial period of at least three months prior to receiving the modification. If a borrower fails to complete the trial period, the loan is considered for our other workout activities. These modification programs offer eligible borrowers extension of the loan's term up to 480 months and a fixed interest rate. Servicers are paid incentive fees for each completed modification, and there are limits on the number of times a loan may be modified.
|
The volume of these activities increased during 2018 compared to 2017 primarily driven by the hurricanes in 2017.
When a seriously delinquent single-family loan cannot be resolved through an economically sensible home retention option, we typically seek to pursue a foreclosure alternative or sale of the seriously delinquent loan. We pay servicers incentive fees for each completed foreclosure alternative. In some cases, we provide cash relocation assistance to the borrower, while allowing the borrower to exit the home in an orderly manner. We offer the following types of foreclosure alternatives:
|
n
|
Short sale
- The borrower sells the property for less than the total amount owed under the terms of the loan. A short sale is preferable to a borrower because we provide limited relief to the borrower from repaying the entire amount owed on the loan. A short sale allows Freddie Mac to avoid the costs we would otherwise incur to complete the foreclosure and subsequently sell the property.
|
|
FREDDIE MAC
| 2018 Form 10-K
|
112
|
|
|
Management's Discussion and Analysis
|
Risk Management |
Single-Family Mortgage Credit Risk
|
|
n
|
Deed in lieu of foreclosure
- The borrower voluntarily agrees to transfer title of the property to us without going through formal foreclosure proceedings.
|
We discuss sales of seriously delinquent loans in the
Servicing Transfers and Sales of Certain Seriously Delinquent Loans
section below.
The volume of foreclosures moderated in recent periods, primarily due to generally declining volumes of seriously delinquent loans, the success of our loan workout programs, and our sales of certain seriously delinquent loans. The volume of our short sale transactions declined in
2018
compared to
2017
, continuing the trend in recent periods. Similarly, the volume of short sales in the overall market also declined in recent periods as home prices have continued to increase.
The following graphs provide details about our single-family loan workout activities and foreclosure sales.


The tables below contain credit characteristic data on our single-family modified loans.
Table 40 - Credit Characteristics of Single-Family Modified Loans
|
As of December 31, 2018
|
||||||||||
|
(Dollars in billions)
|
UPB
|
% of Portfolio
|
CLTV Ratio
|
SDQ Rate
|
||||||
|
Loan Modifications
|
|
$55.4
|
|
3
|
%
|
68
|
%
|
9.16
|
%
|
|
|
As of December 31, 2017
|
||||||||||
|
(Dollars in billions)
|
UPB
|
% of Portfolio
|
CLTV Ratio
|
SDQ Rate
|
||||||
|
Loan Modifications
|
|
$64.6
|
|
4
|
%
|
73
|
%
|
11.34
|
%
|
|
|
FREDDIE MAC
| 2018 Form 10-K
|
113
|
|
|
Management's Discussion and Analysis
|
Risk Management |
Single-Family Mortgage Credit Risk
|
The table below contains information about the payment performance of modified loans in our single-family credit guarantee portfolio, based on the number of loans that were current or paid off one year and, if applicable, two years after modification.
Table 41 - Payment Performance of Single-Family Modified Loans
|
|
|
Quarter of Loan Modification Completion
|
|||||||||||||||
|
|
|
4Q 2017
|
3Q 2017
|
2Q 2017
|
1Q 2017
|
4Q 2016
|
3Q 2016
|
2Q 2016
|
1Q 2016
|
||||||||
|
Current or paid off
one year after modification: |
|
63
|
%
|
60
|
%
|
62
|
%
|
62
|
%
|
57
|
%
|
62
|
%
|
63
|
%
|
67
|
%
|
|
|
|
|
|
|
|
|
|
|
|
|
|
|
|
|
|
|
|
|
Current or paid off
two years after modification: |
|
N/A
|
|
N/A
|
|
N/A
|
|
N/A
|
|
63
|
|
62
|
|
63
|
|
63
|
|
Servicing Transfers and Sales of Certain Seriously Delinquent Loans
From time to time, we facilitate the transfer of servicing for certain groups of loans that are delinquent or are deemed at risk of default to servicers that we believe have capabilities and resources necessary to improve the loss mitigation associated with the loans. See
Sellers and Servicers
in
Counterparty Credit Risk
for additional information on these activities.
We pursue sales of seriously delinquent loans when we believe the sale of these loans provides better economic returns than continuing to hold them. During
2018
and
2017
, we completed sales of
$0.7 billion
and $0.5 billion, respectively, in UPB of seriously delinquent single-family loans. Of the
$20.9 billion
in UPB of single-family loans classified as held-for-sale at
December 31, 2018
,
$2.6 billion
related to loans that were seriously delinquent. The FHFA requirements guiding these transactions, including bidder qualifications, loan modifications, and performance reporting, are designed to improve borrower outcomes.
Managing Foreclosure and REO Activities
In a foreclosure, we may acquire the underlying property and later sell it, using the proceeds of the sale to reduce our losses.
We typically acquire properties as a result of borrower defaults and subsequent foreclosures on loans that we own or guarantee. We evaluate the condition of, and market for, newly acquired REO properties to determine if repairs are needed, determine occupancy status and whether there are legal or other issues to be addressed, and determine our sale or disposition strategy. When we sell REO properties, we typically provide an initial period where we consider offers by owner occupants and entities engaged in community stabilization activities before offers by investors. We also consider alternative disposition strategies, such as auctions, as appropriate to improve collateral recoveries and/or when traditional sales strategies (i.e., marketing via Multiple Listing Service and a real estate agent) are not effective.
The pace and volume of REO acquisitions are affected by the length of the foreclosure process, which extends the time it takes for loans to be foreclosed upon and the underlying properties to transition to REO.
Delays in Foreclosure Process and Average Length of Foreclosure Process
Our serious delinquency rates and credit losses may be adversely affected by delays in the foreclosure process in states where a judicial foreclosure is required. Foreclosures generally take longer to complete in such states, resulting in concentrations of delinquent loans in those states, as shown in the table
|
FREDDIE MAC
| 2018 Form 10-K
|
114
|
|
|
Management's Discussion and Analysis
|
Risk Management |
Single-Family Mortgage Credit Risk
|
below. At
December 31, 2018
, loans in states with a judicial foreclosure process comprised
38%
of our single-family credit guarantee portfolio.
The table below presents the length of time our loans have been seriously delinquent, by jurisdiction type.
Table 42 - Seriously Delinquent Single-Family Loans by Jurisdiction
|
As of December 31,
|
|||||||||||||||
|
2018
|
2017
|
2016
|
|||||||||||||
|
Aging, by locality
|
Loan Count
|
Percent
|
Loan Count
|
Percent
|
Loan Count
|
Percent
|
|||||||||
|
Judicial states
|
|||||||||||||||
|
<= 1 year
|
27,811
|
|
37
|
%
|
50,554
|
|
44
|
%
|
35,599
|
|
34
|
%
|
|||
|
> 1 year and <= 2 years
|
8,268
|
|
11
|
|
10,649
|
|
9
|
|
12,257
|
|
11
|
|
|||
|
> 2 years
|
6,871
|
|
9
|
|
10,863
|
|
9
|
|
14,318
|
|
14
|
|
|||
|
Non-judicial states
|
|||||||||||||||
|
<= 1 year
|
25,675
|
|
34
|
|
34,850
|
|
30
|
|
32,949
|
|
31
|
|
|||
|
> 1 year and <= 2 years
|
4,133
|
|
6
|
|
5,406
|
|
5
|
|
6,075
|
|
6
|
|
|||
|
> 2 years
|
2,382
|
|
3
|
|
3,367
|
|
3
|
|
4,736
|
|
4
|
|
|||
|
Combined
|
|||||||||||||||
|
<= 1 year
|
53,486
|
|
71
|
|
85,404
|
|
74
|
|
68,548
|
|
65
|
|
|||
|
> 1 year and <= 2 years
|
12,401
|
|
17
|
|
16,055
|
|
14
|
|
18,332
|
|
17
|
|
|||
|
> 2 years
|
9,253
|
|
12
|
|
14,230
|
|
12
|
|
19,054
|
|
18
|
|
|||
|
Total
|
75,140
|
|
100
|
%
|
115,689
|
|
100
|
%
|
105,934
|
|
100
|
%
|
|||
The longer a loan remains delinquent, the greater the associated costs we incur. Loans that remain delinquent for more than one year are more challenging to resolve as many of these borrowers may not be in contact with the servicer, may not be eligible for loan modifications or may determine that it is not economically beneficial for them to enter into a loan modification due to the amount of costs incurred on their behalf while the loan was delinquent. We expect the portion of our credit losses related to loans in states with judicial foreclosure processes will remain high as loans awaiting court proceedings in those states transition to REO or other loss events. The number of our single-family loans delinquent for more than one year declined
28%
during
2018
.
Our servicing guidelines do not allow initiation of the foreclosure process on a primary residence until a loan is at least 121 days delinquent, regardless of where the property is located. However, we evaluate the timeliness of foreclosure completion by our servicers based on the state where the property is located. Our servicing guide provides for instances of allowable foreclosure delays in excess of the expected timelines for specific situations involving delinquent loans, such as when the borrower files for bankruptcy or appeals a denial of a loan modification.
|
FREDDIE MAC
| 2018 Form 10-K
|
115
|
|
|
Management's Discussion and Analysis
|
Risk Management |
Single-Family Mortgage Credit Risk
|
The table below presents average completion times for foreclosures of our single-family loans.
Table 43 - Average Length of Foreclosure Process for Single-Family Loans
|
|
|
Year Ended December 31,
|
|||||
|
(Average days)
|
|
2018
|
2017
|
2016
|
|||
|
Judicial states
|
|
|
|||||
|
Florida
|
|
1,173
|
|
1,069
|
|
1,205
|
|
|
New Jersey
|
|
1,343
|
|
1,497
|
|
1,767
|
|
|
New York
|
|
1,790
|
|
1,658
|
|
1,599
|
|
|
All other judicial states
|
|
710
|
|
704
|
|
742
|
|
|
Judicial states, in aggregate
|
|
926
|
|
907
|
|
1,030
|
|
|
Non-judicial states, in aggregate
|
|
530
|
|
545
|
|
562
|
|
|
Total
|
|
766
|
|
751
|
|
827
|
|
As indicated in the table above, the average length of the foreclosure process for our single-family loans has been trending downward in recent years for some jurisdictions, particularly in states with a non-judicial foreclosure process, but it has remained elevated in others, particularly in states with a judicial foreclosure process, such as Florida and New York.
Our REO inventory continued to decline in
2018
primarily due to a decrease in REO acquisitions driven by the improved credit quality of our portfolio, effective loss mitigation strategies, and a large proportion of property sales to third parties at foreclosure. Third-party sales at foreclosure auction allow us to avoid the REO property expenses that we would have otherwise incurred if we held the property in our REO inventory until disposition.
We expect the rate of decline in our REO inventory may slow as a large portion of newly acquired REO properties are older, lower value, and more geographically disbursed, thus creating additional challenges in marketing and selling them. In addition, legal-related delays (i.e., redemption periods, litigations, and eviction procedures) continue to result in extended holding periods.
The table below shows our single-family REO activity.
Table 44 - Single-Family REO Activity
|
Year Ended December 31,
|
||||||||||||||||||
|
2018
|
2017
|
2016
|
||||||||||||||||
|
(Dollars in millions)
|
Number of Properties
|
Amount
|
Number of Properties
|
Amount
|
Number of Properties
|
Amount
|
||||||||||||
|
Beginning balance - REO
|
8,299
|
|
|
$900
|
|
11,418
|
|
|
$1,215
|
|
17,004
|
|
|
$1,774
|
|
|||
|
Additions
|
10,442
|
|
1,012
|
|
12,240
|
|
1,191
|
|
16,161
|
|
1,562
|
|
||||||
|
Dispositions
|
(11,641
|
)
|
(1,132
|
)
|
(15,359
|
)
|
(1,506
|
)
|
(21,747
|
)
|
(2,121
|
)
|
||||||
|
Ending balance - REO
|
7,100
|
|
780
|
|
8,299
|
|
900
|
|
11,418
|
|
1,215
|
|
||||||
|
Beginning balance, valuation allowance
|
(14
|
)
|
(17
|
)
|
(52
|
)
|
||||||||||||
|
Change in valuation allowance
|
3
|
|
3
|
|
35
|
|
||||||||||||
|
Ending balance, valuation allowance
|
(11
|
)
|
(14
|
)
|
(17
|
)
|
||||||||||||
|
Ending balance - REO, net
|
|
$769
|
|
|
$886
|
|
|
$1,198
|
|
|||||||||
Severity Ratios
Severity ratios are the percentages of our realized losses when loans are resolved by the completion of REO dispositions and third-party foreclosure sales or short sales. Severity ratios are calculated as the amount of our recognized losses divided by the aggregate UPB of the related loans. The amount of
|
FREDDIE MAC
| 2018 Form 10-K
|
116
|
|
|
Management's Discussion and Analysis
|
Risk Management |
Single-Family Mortgage Credit Risk
|
recognized losses is equal to the amount by which the UPB of the loans exceeds the amount of sales proceeds from disposition of the properties, net of capitalized repair and selling expenses, if applicable. Loss severity excludes the cost of funding the loans after they are repurchased from the associated PC pool.
The table below presents single-family severity ratios.
Table 45 - Single-Family Severity Ratios
|
Year Ended December 31,
|
|||||||
|
|
2018
|
2017
|
2016
|
||||
|
REO dispositions and third-party foreclosure sales
|
24.2
|
%
|
27.2
|
%
|
32.8
|
%
|
|
|
Short sales
|
26.6
|
|
27.7
|
|
29.0
|
|
|
Our severity ratios remained relatively stable during
2018
compared to
2017
. These severity ratios are influenced by several factors, including the geographic location of the property and the related selling expenses for REO dispositions and short sales.
REO Property Status
A significant portion of our REO portfolio is unable to be marketed at any given time because the properties are occupied, involved in legal matters (e.g., bankruptcy, litigation, etc.) or subject to a redemption period, which is a post-foreclosure period during which borrowers may reclaim a foreclosed property. Redemption periods increase the average holding period of our inventory by as much as 10% or more. As of
December 31, 2018
, approximately
37%
of our REO properties were unable to be marketed because the properties were occupied, located in states with a redemption period or subject to other legal matters. Another 31% of the properties were being prepared for sale (i.e., valued, marketing strategies determined and repaired). As of
December 31, 2018
, approximately
22%
of our REO properties were listed and available for sale, and
10%
of our inventory was pending the settlement of sales. Though it varied significantly in different states, the average holding period of our single-family REO properties, excluding any redemption period, was
244
days and 265 days for our REO dispositions during
2018
and
2017
, respectively.
|
FREDDIE MAC
| 2018 Form 10-K
|
117
|
|
|
Management's Discussion and Analysis
|
Risk Management
|
Multifamily Mortgage Credit Risk
|
Multifamily Mortgage Credit Risk
We manage our exposure to multifamily mortgage credit risk, which is a type of commercial real estate credit risk, using the following principal strategies:
|
n
|
Maintaining policies and procedures for new business activity, including prudent underwriting standards;
|
|
n
|
Transferring a large majority of credit risk to third parties through our risk transfer securitization products, primarily K Certificates and SB Certificates; and
|
|
n
|
Managing our portfolio, including loss mitigation activities.
|
Maintaining Policies and Procedures for New Business Activity, Including Prudent Underwriting Standards
We use a prior approval underwriting approach for multifamily loans, in contrast to the delegated underwriting approach used for single-family loans. Under this approach, we maintain credit discipline by completing our own underwriting and credit review for each new loan prior to issuance of a loan commitment, including review of third-party appraisals and cash flow analysis. Our underwriting standards focus on the LTV ratio and DSCR, which estimates ability to repay using the secured property's cash flow, after expenses. A higher DSCR indicates lower credit risk. Our standards require maximum LTV ratios and minimum DSCRs that vary based on the characteristics and features of the loan. Loans are generally underwritten with a maximum original LTV ratio of 80% and a DSCR of greater than 1.25, assuming monthly payments that reflect amortization of principal. However, certain loans may have a higher LTV ratio and/or a lower DSCR, typically where this will serve our mission and contribute to achieving our affordable housing goals. For more detail on LTV ratios of our portfolio, see
Managing Our Portfolio, Including Loss Mitigation Activities
in this section.
Consideration is also given to other qualitative factors, such as borrower experience, the type of loan, location of the property, and the strength of the local market. Sellers provide certain representations and warranties to us regarding the loans they sell to us, and are required to repurchase loans for which there has been a breach of representation or warranty. However, repurchases of multifamily loans have been rare due to our underwriting approach, which is completed prior to issuance of a loan commitment.
Multifamily loans may be amortizing or interest-only (for the full term or a portion thereof) and have a fixed or variable rate of interest. Multifamily loans generally have shorter terms than single-family loans and typically have maturities ranging from five to ten years. Most multifamily loans require a balloon payment at maturity, making ability to refinance or pay off the loan at maturity a key attribute. Some borrowers may be unable to refinance during periods of rising interest rates or adverse market conditions, increasing the likelihood of borrower default.
We may take on additional credit risk through the issuance of certain other risk transfer securitization products (e.g., Q Certificates and M Certificates). In these transactions, the loans or bonds underlying the issued securities are contributed by third parties and are underwritten by us after (rather than at) origination. Prior to securitization, we are not exposed to the credit risk of these loans or bonds. However, as we may guarantee some or all of the securities issued by the trusts used in these transactions, we effectively assume credit risk equal to the guaranteed UPB. Similar to our K Certificates and SB Certificates, these other risk transfer securitization products generally provide for structural
|
FREDDIE MAC
| 2018 Form 10-K
|
118
|
|
|
Management's Discussion and Analysis
|
Risk Management
|
Multifamily Mortgage Credit Risk
|
credit enhancements (e.g., subordination or other loss sharing features) that allocate first loss exposure to securities held by third parties.
The table below presents our new business activity related to loan purchases and guarantees by product term.
Table 46 - Multifamily Segment New Business Activity by Product Term
|
Year Ended December 31,
|
||||||||||||||||||
|
2018
|
2017
|
2016
|
||||||||||||||||
|
(Dollars in millions)
|
Amount
|
% of Total
|
Amount
|
% of Total
|
Amount
|
% of Total
|
||||||||||||
|
10-year loans, fixed or adjustable
|
|
$36,527
|
|
47
|
%
|
|
$31,338
|
|
43
|
%
|
|
$24,378
|
|
43
|
%
|
|||
|
7-year loans, fixed or adjustable
|
21,158
|
|
27
|
|
23,844
|
|
33
|
|
19,367
|
|
34
|
|
||||||
|
Other
|
19,786
|
|
26
|
|
18,019
|
|
24
|
|
13,085
|
|
23
|
|
||||||
|
Total
|
|
$77,471
|
|
100
|
%
|
|
$73,201
|
|
100
|
%
|
|
$56,830
|
|
100
|
%
|
|||
Transferring a Large Majority of Credit Risk Through Our Risk Transfer Securitizations and Other Risk Transfer Products
In connection with the acquisition of a loan or group of loans, we may obtain various forms of credit protection that reduce our credit risk exposure to the underlying mortgage borrower. Examples of this credit protection may include obtaining recourse and/or indemnification protection from our lenders or sellers.
In addition to obtaining credit protection at the time of loan acquisition, we may also reduce our credit risk exposure to the underlying borrower by using one or more of our risk transfer securitization products. Our principal credit risk transfer mechanism continues to be our K Certificates and SB Certificates. In these transactions, we sell loans to a securitization trust that issues senior, mezzanine, and subordinated securities. While we guarantee the senior securities and therefore retain the associated credit risk of those securities, we transfer a large majority of credit risk of the underlying loans through the trusts' issuances of the unguaranteed mezzanine and subordinate securities to third-party investors, thereby reducing our overall credit risk exposure. These unguaranteed mezzanine and subordinate securities will absorb any credit losses prior to our guarantee.
We may also transfer credit risk through a variety of other risk transfer products, including loan sales and SCR notes. A SCR note is an unsecured and unguaranteed corporate debt obligation where the amount of principal and interest payments due to investors is linked to the credit performance of a reference pool of mortgage assets where we currently have credit risk exposure. The reference pool is structured to include multiple notional credit risk positions (e.g., first loss, mezzanine, and senior positions) with the issued SCR notes being linked to one or more of these notional positions. To the extent that the notional credit risk position of the reference pool is reduced because of a specified credit event, the associated SCR note will be written down, reducing the amount of principal and interest payments that the investor will ultimately receive.
Since 2009, we have transferred a portion of the credit risk related to
$318.6 billion
in UPB of multifamily loans through our risk transfer securitizations, primarily K Certificates and SB Certificates, and other risk transfer products. The average remaining level of subordination on all outstanding K Certificates and SB Certificates was
14%
at both
December 31, 2018
and
December 31, 2017
. Since we began issuing K
|
FREDDIE MAC
| 2018 Form 10-K
|
119
|
|
|
Management's Discussion and Analysis
|
Risk Management
|
Multifamily Mortgage Credit Risk
|
Certificates and SB Certificates, we have not experienced credit losses associated with our guarantees on these securities.
We continue to develop other strategies to reduce our credit risk exposure to multifamily loans and securities. See
Our Business Segments - Multifamily
for additional information on our existing risk transfer products.
See
Our Business Segments - Multifamily -
Business Overview - Products and Activities -
Securitization, Guarantee, and Other Risk Transfer Products
for additional information on our 2018 risk transfer activity.
Managing Our Portfolio, Including Loss Mitigation Activities
To help mitigate our potential losses, we generally require sellers to act as the primary servicer for loans they have sold to us, including property monitoring tasks beyond those typically performed by single-family servicers. We typically transfer the role of master servicer in our K Certificate transactions to third parties, while retaining that role in our SB Certificate transactions. Servicers for unsecuritized loans over $1 million must generally provide us with an assessment of the mortgaged property at least annually based on the servicer's analysis of the property as well as the borrower's financial statements. In situations where a borrower or property is in distress, the frequency of communications with the borrower may be increased. We rate servicing performance on a regular basis, and we may conduct on-site reviews to confirm compliance with our standards.
We primarily use credit enhancements, such as the subordination provided by our risk transfer securitizations (e.g., K Certificates and SB Certificates), to mitigate our credit losses. For unsecuritized loans, we may offer a workout option to give the borrower an opportunity to bring the loan current and retain ownership of the property, such as providing a short-term extension of up to 12 months. These arrangements are entered into with the expectation that we will recover our initial investment or minimize our losses. We do not enter into these arrangements in situations where we believe we would experience a loss in the future that is greater than or equal to the loss we would experience if we foreclosed on the property at the time of the agreement. Our multifamily loan modification and other workout activities have been minimal in the last three years.
After the loans have been securitized and the large majority of credit risk has been transferred to third-party investors, we monitor the performance of our risk transfer securitizations to assess our potential exposure to losses. Due to the subordination protection typically provided by our risk transfer securitizations, our primary credit risk exposure in our multifamily mortgage portfolio results from our unsecuritized loans. By their nature, loans awaiting securitization that we hold for sale remain on our balance sheet for a shorter period of time than loans we hold for investment. However, during the holding period, we transfer a portion of the front-end credit risk of our securitization pipeline through the issuance of KT Certificates.
In addition to subordination, the Multifamily segment has various other credit enhancements, primarily related to our mortgage loans, other risk transfer securitization products, and other mortgage-related guarantees, in the form of collateral posting requirements, pool insurance, bond insurance, loss sharing agreements, and other similar arrangements. These credit enhancements, along with the proceeds received from the sale of the underlying mortgage collateral, are designed to enable us to recover all or a portion of our losses on our mortgage loans or the amounts paid under our financial guarantee contracts. Our historical losses paid under our guarantee contracts and related recoveries pursuant to
|
FREDDIE MAC
| 2018 Form 10-K
|
120
|
|
|
Management's Discussion and Analysis
|
Risk Management
|
Multifamily Mortgage Credit Risk
|
these agreements have not been significant. See
Note 6
for more information on the total current and protected UPB of our multifamily mortgage portfolio that is credit-enhanced and the associated maximum coverage.
We report multifamily delinquency rates based on the UPB of loans in our multifamily mortgage portfolio that are two monthly payments or more past due or in the process of foreclosure, as reported by our servicers. Loans that have been modified (or are subject to forbearance agreements) are not counted as delinquent as long as the borrower is less than two monthly payments past due under the modified (or forbearance) terms.
The table below shows the delinquency rates for both credit-enhanced and non-credit-enhanced loans in our multifamily mortgage portfolio.
Table 47 - Non-Credit-Enhanced and Credit-Enhanced Loans Underlying Our Multifamily Mortgage Portfolio
|
As of December 31,
|
|||||||||||||||
|
2018
|
2017
|
2016
|
|||||||||||||
|
% of Portfolio
|
Delinquency Rate
|
% of Portfolio
|
Delinquency Rate
|
% of Portfolio
|
Delinquency Rate
|
||||||||||
|
Non-credit-enhanced
|
13
|
%
|
—
|
%
|
18
|
%
|
0.06
|
%
|
24
|
%
|
0.04
|
%
|
|||
|
Credit-enhanced
|
87
|
|
0.01
|
|
82
|
|
0.01
|
|
76
|
|
0.02
|
|
|||
|
Total
|
100
|
%
|
0.01
|
%
|
100
|
%
|
0.02
|
%
|
100
|
%
|
0.03
|
%
|
|||
|
FREDDIE MAC
| 2018 Form 10-K
|
121
|
|
|
Management's Discussion and Analysis
|
Risk Management
|
Multifamily Mortgage Credit Risk
|
The table below presents information about the composition and delinquency rates of the multifamily mortgage portfolio.
Table 48 - Multifamily Mortgage Portfolio Attributes
|
As of December 31,
|
||||||||||||
|
2018
|
2017
|
|||||||||||
|
(Dollars in billions)
|
UPB
|
Delinquency Rate
|
UPB
|
Delinquency Rate
|
||||||||
|
Unsecuritized loans
|
|
$34.8
|
|
0.01
|
%
|
|
$38.2
|
|
0.01
|
%
|
||
|
Securitization-related products
|
226.9
|
|
0.01
|
|
192.5
|
|
0.02
|
|
||||
|
Other mortgage-related guarantees
|
9.8
|
|
—
|
|
10.0
|
|
—
|
|
||||
|
Total
|
|
$271.5
|
|
0.01
|
%
|
|
$240.7
|
|
0.02
|
%
|
||
|
Unsecuritized loans, excluding HFS loans
|
||||||||||||
|
Original LTV ratio
|
||||||||||||
|
Below 75%
|
|
$7.1
|
|
—
|
%
|
|
$10.0
|
|
—
|
%
|
||
|
75% to 80%
|
3.0
|
|
—
|
|
6.1
|
|
—
|
|
||||
|
Above 80%
|
0.7
|
|
—
|
|
1.6
|
|
—
|
|
||||
|
Total
|
|
$10.8
|
|
—
|
%
|
|
$17.7
|
|
—
|
%
|
||
|
Weighted average LTV ratio at origination
|
68
|
%
|
69
|
%
|
||||||||
|
Maturity dates
|
||||||||||||
|
2018
|
N/A
|
|
N/A
|
|
|
$2.4
|
|
—
|
%
|
|||
|
2019
|
|
$1.7
|
|
—
|
%
|
3.9
|
|
—
|
|
|||
|
2020
|
1.5
|
|
—
|
|
2.2
|
|
—
|
|
||||
|
2021
|
1.8
|
|
—
|
|
3.0
|
|
—
|
|
||||
|
2022
|
1.4
|
|
—
|
|
1.6
|
|
—
|
|
||||
|
Thereafter
|
4.4
|
|
—
|
|
4.6
|
|
—
|
|
||||
|
Total
|
|
$10.8
|
|
—
|
%
|
|
$17.7
|
|
—
|
%
|
||
|
Year of acquisition
|
||||||||||||
|
2010 and prior
|
|
$2.9
|
|
—
|
%
|
|
$6.7
|
|
—
|
%
|
||
|
2011 and after
|
7.9
|
|
—
|
|
11.0
|
|
—
|
|
||||
|
Total
|
|
$10.8
|
|
—
|
%
|
|
$17.7
|
|
—
|
%
|
||
|
K Certificates, SB Certificates and other risk transfer securitization products:
|
||||||||||||
|
Year of issuance
|
||||||||||||
|
2013 and prior
|
|
$51.5
|
|
—
|
%
|
|
$59.9
|
|
0.06
|
%
|
||
|
2014
|
12.1
|
|
0.05
|
|
13.8
|
|
—
|
|
||||
|
2015
|
22.9
|
|
—
|
|
26.7
|
|
0.01
|
|
||||
|
2016
|
30.7
|
|
0.02
|
|
37.7
|
|
—
|
|
||||
|
2017
|
49.8
|
|
0.01
|
|
54.4
|
|
—
|
|
||||
|
2018
|
59.9
|
|
0.01
|
|
N/A
|
|
N/A
|
|
||||
|
Total
|
|
$226.9
|
|
0.01
|
%
|
|
$192.5
|
|
0.02
|
%
|
||
|
Subordination level at issuance
|
||||||||||||
|
No subordination
|
|
$12.0
|
|
—
|
%
|
|
$9.0
|
|
0.22
|
%
|
||
|
Less than 10%
|
3.2
|
|
—
|
|
3.9
|
|
—
|
|
||||
|
10% to 15%
|
155.0
|
|
0.01
|
|
116.0
|
|
0.01
|
|
||||
|
Greater than 15%
|
56.7
|
|
0.01
|
|
63.6
|
|
—
|
|
||||
|
Total
|
|
$226.9
|
|
0.01
|
%
|
|
$192.5
|
|
0.02
|
%
|
||
|
FREDDIE MAC
| 2018 Form 10-K
|
122
|
|
|
Management's Discussion and Analysis
|
Risk Management
|
Multifamily Mortgage Credit Risk
|
REO Activity
Our REO activity has remained low in the past several years as a result of the strong property performance of our multifamily mortgage portfolio. As of
December 31, 2018
, we had
no
REO properties.
Credit Losses and Allowance for Credit Losses
Our multifamily credit losses remain low due to the strong property performance of our multifamily mortgage portfolio. See
Note 4
for additional information regarding multifamily credit losses and allowance for credit losses.
|
FREDDIE MAC
| 2018 Form 10-K
|
123
|
|
|
Management's Discussion and Analysis
|
Risk Management |
Counterparty Credit Risk
|
Counterparty Credit Risk
We are exposed to counterparty credit risk, which is a type of institutional credit risk, as a result of our contracts with sellers and servicers, credit enhancement providers (mortgage insurers, investors, etc.), financial intermediaries, clearinghouses, and other counterparties. We manage our exposure to counterparty credit risk using the following principal strategies:
|
n
|
Maintaining eligibility standards;
|
|
n
|
Evaluating creditworthiness and monitoring performance; and
|
|
n
|
Working with underperforming counterparties and limiting our losses from their nonperformance of obligations, when possible.
|
In the sections below, we discuss our management of counterparty credit risk for each type of counterparty to which we have significant exposure.
Sellers and Servicers
Overview
In our single-family guarantee business, we do not originate loans or have our own loan servicing operation. Instead, our sellers and servicers perform the primary loan origination and loan servicing functions on our behalf. We establish underwriting and servicing standards for our sellers and servicers to follow and have contractual arrangements with them under which they represent and warrant that the loans they sell to us meet our standards and that they will service loans in accordance with our standards. If we discover that the representations or warranties related to a loan were breached (i.e., that contractual standards were not followed), we can exercise certain contractual remedies to mitigate our actual or potential credit losses. If our sellers or servicers lack appropriate controls, experience a failure in their controls, or experience an operating disruption, including as a result of financial pressure, legal or regulatory actions or ratings downgrades, we could experience a decline in mortgage servicing quality and/or be less likely to recover losses through lender repurchases, recourse agreements, or other credit enhancements, where applicable.
In our multifamily business, we are exposed to the risk that multifamily sellers and servicers could come under financial pressure, which could potentially cause degradation in the quality of the servicing they provide us, including their monitoring of each property's financial performance and physical condition. This could also, in certain cases, reduce the likelihood that we could recover losses through lender repurchases, recourse agreements, or other credit enhancements, where applicable. This risk primarily relates to multifamily loans that we hold on our consolidated balance sheets where we retain all of the related credit risk.
In addition, our single-family guarantee and multifamily businesses are exposed to settlement risk on the non-performance of sellers and servicers as a result of our forward settlement loan purchase programs. For additional details, see
Counterparty Credit Risk -
Financial Intermediaries, Clearinghouses, and Other Counterparties - Other Counterparties - Forward Settlement Counterparties.
|
FREDDIE MAC
| 2018 Form 10-K
|
124
|
|
|
Management's Discussion and Analysis
|
Risk Management |
Counterparty Credit Risk
|
Maintaining Eligibility Standards
Our eligibility standards for sellers and servicers require the following: a demonstrated operating history in residential mortgage origination and servicing, or an eligible agent acceptable to us; adequate insurance coverage; a quality control program that meets our standards; and sufficient net worth, capital, liquidity, and funding sources.
Evaluating Counterparty Creditworthiness and Monitoring Performance
We perform ongoing monitoring and review of our exposure to individual sellers or servicers in accordance with our institutional credit risk management framework, including requiring our counterparties to provide regular financial reporting to us. We also monitor and rate our sellers and servicers' compliance with our standards and periodically review their operational processes. We may disqualify or suspend a seller or servicer with or without cause at any time. Once a seller or servicer is disqualified or suspended, we no longer purchase loans originated by that counterparty and generally no longer allow that counterparty to service loans for us, while seeking to transfer servicing of existing portfolios.
As discussed in more detail in
Our Business Segments
, we acquire a significant portion of both our single-family and multifamily loan purchase volume from several large lenders, and a large percentage of our loans are also serviced by several large servicers.
We have significant exposure to non-depository and smaller depository financial institutions in our single-family business. These institutions may not have the same financial strength or operational capacity, or be subject to the same level of regulatory oversight as large depository institutions.
Although our business with our single-family loan sellers is concentrated, a number of our largest single-family loan seller counterparties reduced or eliminated their purchases of loans from mortgage brokers and correspondent lenders in recent years. As a result, we acquire a greater portion of our single-family business volume directly from non-depository and smaller depository financial institutions.
Since the financial crisis, there has been a shift in our single-family servicing from depository institutions to non-depository institutions. Some of these non-depository institutions have grown rapidly in recent years and now service a large share of our loans. The table below summarizes the concentration of non-depository servicers of our single-family credit guarantee portfolio.
Table 49 - Single-Family Credit Guarantee Portfolio Non-Depository Servicers
|
As of December 31,
|
||||||||||
|
2018
|
2017
|
|||||||||
|
% of Portfolio
(1)
|
% of Serious Delinquent Single-Family Loans
|
% of Portfolio
(1)
|
% of Serious Delinquent Single-Family Loans
|
|||||||
|
Top five non-depository servicers
|
16
|
%
|
17
|
%
|
15
|
%
|
23
|
%
|
||
|
Other non-depository servicers
|
20
|
|
40
|
|
20
|
|
30
|
|
||
|
Total
|
36
|
%
|
57
|
%
|
|
35
|
%
|
53
|
%
|
|
|
(1)
|
Excludes loans where we do not exercise control over the associated servicing.
|
Working with Underperforming Counterparties and Limiting Our Losses from Their Nonperformance of Obligations, When Possible
We actively manage the current quality of loan originations of our largest single-family sellers by performing loan quality control sampling reviews and communicating loan defect rates and the causes
|
FREDDIE MAC
| 2018 Form 10-K
|
125
|
|
|
Management's Discussion and Analysis
|
Risk Management |
Counterparty Credit Risk
|
of those defects to such sellers on a monthly basis. If necessary, we work with these sellers to develop an appropriate plan of corrective action.
We use a variety of tools and techniques to engage our single-family sellers and servicers and limit our losses, including the following:
|
n
|
Repurchases and other remedies
- For certain violations of our single-family selling or servicing policies, we can require the counterparty to repurchase loans or provide alternative remedies, such as reimbursement of realized losses or indemnification, and/or suspend or terminate the selling and servicing relationship. We typically first issue a notice of defect and allow a period of time to correct the problem prior to issuing a repurchase request. The UPB of loans subject to repurchase requests issued to our single-family sellers and servicers was
$0.4 billion
and $0.2 billion at
December 31, 2018
and December 31, 2017, respectively. See
Note 14
for additional information about loans subject to repurchase requests.
|
|
n
|
Incentives and compensatory fees
- We pay various incentives to single-family servicers for completing workouts of problem loans. We also assess compensatory fees if single-family servicers do not achieve certain benchmarks with respect to servicing delinquent loans.
|
|
n
|
Servicing transfers
- From time to time, we may facilitate the transfer of servicing as a result of poor servicer performance, or for certain groups of single-family loans that are delinquent or are deemed at risk of default, to servicers that we believe have the capabilities and resources necessary to improve the loss mitigation associated with the loans. We may also facilitate the transfer of servicing on loans at the request of the servicer.
|
Credit Enhancement Providers
Overview
We have exposure to credit enhancement providers through credit enhancements we obtain on single-family loans. We also have exposure to insurers and reinsurers through our ACIS transactions. If any of our credit enhancement providers fail to fulfill their obligations, we may not receive reimbursement for credit losses to which we are contractually entitled pursuant to our credit enhancement arrangements.
With respect to primary mortgage insurers, we currently cannot differentiate pricing based on counterparty strength or revoke a primary mortgage insurer's status as an eligible insurer without FHFA approval. Further, we generally do not select the insurance provider on a specific loan, because the selection is made by the lender at the time the loan is originated. Accordingly, we are unable to manage our concentration risk with respect to primary mortgage insurers.
As part of our ACIS credit risk transfer transactions, we regularly obtain insurance coverage from global insurers and reinsurers. These transactions incorporate several features designed to increase the likelihood that we will recover on the claims we file with the insurers and reinsurers, including the following:
|
n
|
In each ACIS transaction, we require the individual ACIS insurers and reinsurers to post collateral to cover portions of their exposure, which helps to promote certainty and timeliness of claim payment and
|
|
n
|
While private mortgage insurance companies are required to be monoline (i.e., to participate solely in the mortgage insurance business, although the holding company may be a diversified insurer), our
|
|
FREDDIE MAC
| 2018 Form 10-K
|
126
|
|
|
Management's Discussion and Analysis
|
Risk Management |
Counterparty Credit Risk
|
ACIS insurers and reinsurers generally participate in multiple types of insurance businesses, which helps to diversify their risk exposure.
Maintaining Eligibility Standards
We maintain eligibility standards for mortgage insurers and other insurers and reinsurers. Our eligibility requirements include financial requirements determined using a risk-based framework and were designed to promote the ability of mortgage insurers to fulfill their intended role of providing consistent liquidity throughout the mortgage cycle. Our mortgage insurers are required to submit audited financial information and certify compliance with these requirements on an annual basis.
Evaluating Counterparty Creditworthiness and Monitoring Our Exposure
We monitor our exposure to individual insurers by performing periodic analysis of the financial capacity of each insurer under various adverse economic conditions. Monitoring performance and potentially identifying underperformance allows us to plan for loss mitigation.
The table below summarizes our exposure to single-family mortgage insurers as of December 31, 2018. In the event a mortgage insurer fails to perform, the coverage amounts represent our maximum exposure to credit losses resulting from such a failure.
Table 50 - Single-Family Mortgage Insurers
|
|
|
|
|
As of December 31, 2018
|
|||||||||||||
|
|
|
|
|
UPB
|
|
Coverage
|
|||||||||||
|
(In millions)
|
|
Credit
Rating (1) |
Credit
Rating Outlook (1) |
Primary
MI |
Pool
Insurance |
|
Primary
MI |
Pool
Insurance |
|||||||||
|
Arch Mortgage Insurance Company
|
A-
|
Stable
|
|
$89,381
|
|
|
$2
|
|
|
$23,093
|
|
|
$2
|
|
|||
|
Radian Guaranty Inc. (Radian)
|
|
BBB
|
Stable
|
77,282
|
|
4
|
|
19,846
|
|
3
|
|
||||||
|
Mortgage Guaranty Insurance Corporation (MGIC)
|
|
BBB
|
Stable
|
70,253
|
|
—
|
|
18,061
|
|
—
|
|
||||||
|
Genworth Mortgage Insurance Corporation
|
|
BB+
|
Watch Dev
|
54,106
|
|
9
|
|
13,943
|
|
9
|
|
||||||
|
Essent Guaranty, Inc.
|
|
BBB+
|
Stable
|
52,981
|
|
—
|
|
13,429
|
|
—
|
|
||||||
|
National Mortgage Insurance (NMI)
|
BBB-
|
Stable
|
25,769
|
|
—
|
|
6,425
|
|
—
|
|
|||||||
|
PMI Mortgage Insurance Co. (PMI)
|
|
Not Rated
|
N/A
|
4,015
|
|
35
|
|
1,006
|
|
29
|
|
||||||
|
Republic Mortgage Insurance Company (RMIC)
|
|
Not Rated
|
N/A
|
3,023
|
|
12
|
|
756
|
|
8
|
|
||||||
|
Triad Guaranty Insurance Corporation (Triad)
|
|
Not Rated
|
N/A
|
1,653
|
|
6
|
|
415
|
|
2
|
|
||||||
|
Others
|
N/A
|
N/A
|
131
|
|
—
|
|
22
|
|
—
|
|
|||||||
|
Total
|
|
|
|
|
$378,594
|
|
|
$68
|
|
|
|
$96,996
|
|
|
$53
|
|
|
|
(1)
|
Ratings and outlooks are for the corporate entity to which we have the greatest exposure. Coverage amounts may include coverage provided by consolidated affiliates and subsidiaries of the counterparty. Latest rating available as of December 31, 2018. Represents the lower of S&P and Moody's credit ratings and outlooks stated in terms of the S&P equivalent.
|
The majority of our mortgage insurance exposure is concentrated with five mortgage insurers. Although the financial condition of our mortgage insurers improved in recent years, there is still a risk that some of these counterparties may fail to fully meet their obligations under a stress economic scenario since they are monoline entities primarily exposed to mortgage credit risk.
On October 23, 2016, Genworth Financial, Inc. announced that it had entered into an agreement to be acquired by China Oceanwide Holdings Group Co., Ltd. Because Genworth Mortgage Insurance Corporation, a subsidiary of Genworth Financial, Inc., is an approved mortgage insurer, Freddie Mac has evaluated the planned acquisition and approved China Oceanwide Holdings Group's control of Genworth Mortgage Insurance Corporation. Regulatory and other approvals of the acquisition are still
|
FREDDIE MAC
| 2018 Form 10-K
|
127
|
|
|
Management's Discussion and Analysis
|
Risk Management |
Counterparty Credit Risk
|
pending. For more information about counterparty credit risk associated with mortgage insurers, see
Note 14
.
PMI and Triad are both under the control of their state regulators and no longer issue new insurance. Both of these insurers pay a substantial portion of their claims as deferred payment obligations. RMIC is under regulatory supervision and is no longer issuing new insurance; however, it continues to pay its claims in cash.
If, as we currently expect, PMI and Triad do not pay the full amount of their deferred payment obligations in cash, we would lose a portion of the coverage from these insurers shown in the table above. As of
December 31, 2018
, we had cumulative unpaid deferred payment obligations of
$0.5 billion
from these insurers. We have reserved substantially all of these unpaid amounts as collectability is uncertain.
Except for those insurers under regulatory supervision, which no longer issue new coverage, we continue to acquire new loans with mortgage insurance from the mortgage insurers shown in the table above, some of which have credit ratings below investment grade.
Financial Intermediaries, Clearinghouses, and Other Counterparties
Derivative Counterparties
We use cleared derivatives, exchange-traded derivatives, OTC derivatives, and forward sales and purchase commitments to mitigate risk, and are exposed to the non-performance of each of the related financial intermediaries and clearinghouses. The Capital Markets segment manages this risk for the company. Our financial intermediaries and clearinghouse credit exposure relates principally to interest-rate derivative contracts. We maintain internal standards for approving new derivative counterparties, clearinghouses, and clearing members.
|
n
|
Cleared derivatives
- Cleared derivatives expose us to counterparty credit risk of central clearinghouses and our clearing members. Our exposure to the clearinghouses we use to clear interest-rate derivatives has increased and may become more concentrated over time. The use of cleared derivatives mitigates our counterparty credit risk exposure to individual counterparties because a central counterparty is substituted for individual counterparties, and changes in the value of open contracts are settled daily via payments made through the clearinghouse. We are required to post initial and variation margin to the clearinghouses. The amount of initial margin we must post for cleared and exchange-traded derivatives may be based, in part, on S&P or Moody's credit rating of our long-term senior unsecured debt securities. Our obligation to post margin may increase as a result of the lowering or withdrawal of our credit rating by S&P or Moody's or by changes in the potential future exposure generated by the derivative transactions.
|
|
n
|
Exchange-traded derivatives
- Exchange-traded derivatives expose us to counterparty credit risk of the central clearinghouses and our clearing members. We are required to post initial and variation margin with our clearing members in connection with exchange-traded derivatives. The use of exchange-traded derivatives mitigates our counterparty credit risk exposure to individual counterparties because a central counterparty is substituted for individual counterparties, and changes in the value of open exchange-traded derivatives are settled daily via payments made through the financial clearinghouse.
|
|
n
|
OTC derivatives
- OTC derivatives expose us to counterparty credit risk of individual counterparties, because these transactions are executed and settled directly between us and each counterparty,
|
|
FREDDIE MAC
| 2018 Form 10-K
|
128
|
|
|
Management's Discussion and Analysis
|
Risk Management |
Counterparty Credit Risk
|
exposing us to potential losses if a counterparty fails to meet its contractual obligations. When a counterparty in OTC derivatives that is subject to a master netting agreement has a net obligation to us with a market value above an agreed upon threshold, if any, the counterparty is obligated to deliver collateral in the form of cash, securities, or a combination of both to satisfy its obligation to us under the master netting agreement. Our OTC derivatives also require us to post collateral to counterparties in accordance with agreed upon thresholds, if any, when we are in a derivative liability position. The collateral posting thresholds we assign to our OTC counterparties, as well as the ones they assign to us, are generally based on S&P or Moody's credit rating. The lowering or withdrawal of our credit rating by S&P or Moody's may increase our obligation to post collateral, depending on the amount of the counterparty's exposure to Freddie Mac with respect to the derivative transactions. Only OTC derivatives transactions executed prior to March 1, 2017 are subject to collateral posting thresholds. Based upon regulations that took effect March 1, 2017, OTC derivative transactions executed after that date require posting of variation margin without the application of any thresholds.
Evaluating Counterparty Creditworthiness and Monitoring Performance
Over time, our exposure to derivative counterparties varies depending on changes in fair values, which are affected by changes in interest rates and other factors. Due to risk limits with certain counterparties, we may be forced to execute transactions with lower returns with other counterparties when managing our interest-rate risk. We manage our exposure through master netting and collateral agreements and stress-testing to evaluate potential exposure under possible adverse market scenarios. Collateral is typically transferred within one business day based on the values of the related derivatives. We regularly review the market values of the securities pledged to us as non-cash collateral, primarily agency, and U.S. Treasury securities, to manage our exposure to loss. We conduct additional reviews of our exposure when market conditions dictate or certain events affecting an individual counterparty occur. When non-cash collateral is posted to us, we require collateral in excess of our exposure to satisfy the net obligation to us in accordance with the counterparty agreement.
In the event a counterparty defaults, our economic loss may be higher than the uncollateralized exposure of our derivatives if we are not able to replace the defaulted derivatives in a timely and cost-effective fashion (e.g., due to a significant interest rate movement during the period or other factors). We could also incur economic losses if non-cash collateral posted to us by the defaulting counterparty cannot be liquidated at prices that are sufficient to recover the amount of such exposure.
|
FREDDIE MAC
| 2018 Form 10-K
|
129
|
|
|
Management's Discussion and Analysis
|
Risk Management |
Counterparty Credit Risk
|
The table below compares the gross fair value of our derivative asset positions after counterparty netting with our net exposure to these positions after considering cash and non-cash collateral held.
Table 51 - Derivative Counterparty Credit Exposure
|
|
As of December 31, 2018
|
||||||||
|
(Dollars in millions)
|
Number of Counterparties
|
Fair Value -
Gain positions
|
Fair Value - Gain positions, net of collateral
|
||||||
|
OTC interest-rate swap and swaption counterparties (by rating)
|
|||||||||
|
AA- or above
|
3
|
|
|
$178
|
|
|
$16
|
|
|
|
A+, A, or A-
|
15
|
|
2,449
|
|
32
|
|
|||
|
BBB+, BBB, or BBB-
|
3
|
|
42
|
|
—
|
|
|||
|
Total OTC
|
21
|
|
2,669
|
|
48
|
|
|||
|
Cleared and exchange-traded derivatives
|
2
|
|
3
|
|
23
|
|
|||
|
Total
|
23
|
|
|
$2,672
|
|
|
$71
|
|
|
Approximately
98%
of our exposure at fair value for OTC interest-rate swap and option-based derivatives, excluding amounts related to our posting of cash collateral in excess of our derivative liability determined at the counterparty level, was collateralized at
December 31, 2018
. The remaining exposure was primarily due to market movements between the measurement of a derivative at fair value and our receipt of the related collateral, as well as exposure amounts below the then applicable counterparty collateral posting threshold, if any. The concentration of our derivative exposure among our primary OTC derivative counterparties remains high and could further increase.
Other Counterparties
We have exposure to other types of counterparties to transactions that we enter into in the ordinary course of business, including the following:
|
n
|
Other investments
- We are exposed to the non-performance of institutions relating to other investments (including non-mortgage-related securities and cash and cash equivalents) transactions, including those entered into on behalf of our securitization trusts. Our policies require that the institution be evaluated using our internal rating model prior to our entering into such transactions. We monitor the financial strength of these institutions and may use collateral maintenance requirements to manage our exposure to individual counterparties.
|
The major financial institutions with which we transact regarding our other investments (including non-mortgage-related securities and cash and cash equivalents) include other GSEs, Treasury, the Federal Reserve Bank of New York, the Government Securities Division of Fixed Income Clearing Corporation (GSD/FICC), highly-rated supranational institutions, depository and non-depository institutions, brokers and dealers, and government money market funds. For more information on our other investments portfolio, see
Liquidity and Capital Resources
.
We utilize the GSD/FICC as a clearinghouse to transact many of our trades involving securities purchased under agreements to resell, securities sold under agreements to repurchase, and other non-mortgage related securities. As a clearing member of GSD/FICC, we are required to post initial and variation margin payments and are exposed to the counterparty credit risk of GSD/FICC (including its clearing members). In the event a clearing member fails and causes losses to the GSD/FICC clearing system, we could be subject to the loss of the margin that we have posted to the GSD/FICC. Moreover, our exposure could exceed that amount, as members are generally required to cover losses caused by defaulting members on a pro rata basis. It is difficult to estimate our
|
FREDDIE MAC
| 2018 Form 10-K
|
130
|
|
|
Management's Discussion and Analysis
|
Risk Management |
Counterparty Credit Risk
|
maximum exposure under these transactions, as this would require an assessment of transactions that we and other members of the GSD/FICC may execute in the future. We believe that it is unlikely we will have to make any material payments under these arrangements and the risk of loss is expected to be remote because of the GSD/FICC's financial safeguards and our ability to terminate our membership in the clearinghouse (which would limit our loss).
|
n
|
Forward settlement counterparties -
We are exposed to the non-performance (settlement risk) of counterparties relating to the forward settlement of loans and securities (including agency debt, agency RMBS, and cash loan purchase program loans). Our policies require that the counterparty be evaluated using our internal counterparty rating model prior to our entering into such transactions. We monitor the financial strength of these counterparties and may use collateral maintenance requirements to manage our exposure to individual counterparties.
|
We also execute forward purchase and sale commitments of mortgage-related securities, including dollar roll transactions, that are treated as derivatives for accounting purposes and utilize the Mortgage Backed Securities Division of the Fixed Income Clearing Corporation (MBSD/FICC) as a clearinghouse. As a clearing member of the clearinghouse, we post margin to the MBSD/FICC and are exposed to the counterparty credit risk of the organization. In the event a clearing member fails and causes losses to the MBSD/FICC clearing system, we could be subject to the loss of the margin that we have posted to the MBSD/FICC. Moreover, our exposure could exceed the amount of margin we have posted to the MBSD/FICC, as clearing members are generally required to cover losses caused by defaulting members on a pro rata basis. It is difficult to estimate our maximum exposure, as this would require an assessment of transactions that we and other members of the MBSD/FICC may execute in the future. We believe that it is unlikely we will have to make any material payments under these arrangements and the risk of loss is expected to be remote because of the MBSD/FICC's financial safeguards and our ability to terminate our membership in the clearinghouse (which would limit our loss). As of December 31, 2018, the gross fair value of such forward purchase and sale commitments that were in derivative asset positions was $65 million.
|
n
|
Secured lending activities -
As part of our other investments portfolio, we enter into secured lending arrangements to provide financing for certain Freddie Mac securities and other assets related to our guarantee businesses in an attempt to improve the market for these assets. These transactions differ from those we use for liquidity purposes, as the borrowers may not be major financial institutions, potentially exposing us to the institutional credit risk of these institutions. We also provide advances to lenders for mortgage loans that they will subsequently either sell through our cash purchase program or securitize into PCs that they will deliver to us, and secured term financing through revolving lines of credit collateralized by the value of contractual mortgage servicing rights on certain mortgages we own. In addition, we may invest in other secured lending activities. For additional information, see
Note 14
.
|
Other Market Participants
We have exposure to other market participant counterparties for transactions that we enter into in the ordinary course of business, including the following:
|
n
|
Document custodians
- We use third-party document custodians to provide loan document certification and custody services for the loans that we purchase and securitize. In many cases, our sellers and servicers or their affiliates also serve as document custodians for us. Our ownership rights to the loans that we own or that back our securitization products could be challenged if a
|
|
FREDDIE MAC
| 2018 Form 10-K
|
131
|
|
|
Management's Discussion and Analysis
|
Risk Management |
Counterparty Credit Risk
|
seller or servicer intentionally or negligently pledges, sells or fails to obtain a release of prior liens on the loans that we purchased, which could result in financial losses to us. When a seller or servicer, or one of its affiliates, acts as a document custodian for us, the risk that our ownership interest in the loans may be adversely affected is increased, particularly in the event the seller or servicer were to become insolvent. To manage these risks, we establish qualifying standards for our document custodians and maintain legal and contractual arrangements that identify our ownership interest in the loans. We also monitor the financial strength of our document custodians on an ongoing basis in accordance with our counterparty credit risk management framework, and we require transfer of documents to a different third-party document custodian if we have concerns about the solvency or competency of the document custodian.
|
n
|
The MERS
®
System
- The MERS System is an electronic registry that is widely used by sellers and servicers, Freddie Mac, and other participants in the mortgage industry to maintain records of beneficial ownership of mortgage loans. A significant portion of the loans we own or guarantee are registered in the MERS System. Our business could be adversely affected if we were prevented from using the MERS System, or if our use of the MERS System adversely affects our ability to enforce our rights with respect to our loans registered in the MERS System.
|
|
FREDDIE MAC
| 2018 Form 10-K
|
132
|
|
|
Management's Discussion and Analysis
|
Risk Management
|
Operational Risk
|
Operational Risk
Operational risk is the risk of direct or indirect loss resulting from inadequate or failed internal processes, people or systems or from external events. Operational risk is inherent in all our activities. Operational risk events include accounting, financial reporting or operational errors, technology failures, business interruptions, non-compliance with legal or regulatory requirements, fraudulent acts, inappropriate acts by employees, information security incidents, or third parties who do not perform in accordance with their contracts. These operational risk events could result in financial loss, legal actions, regulatory fines, and reputational harm.
Operational Risk Management and Risk Profile
Our operational risk management framework includes risk identification, assessment, measurement, monitoring, mitigation, and reporting. When operational risk events are identified, our policies require that the events be documented and analyzed to determine whether changes are required in our systems, people, and/or processes to mitigate the risk of future events.
In order to evaluate and monitor operational risk, each business line periodically completes an assessment using the RCSA framework. The framework is designed to identify and assess the business line's exposure to operational risk and determine if action is required to manage the risk to an acceptable level.
In addition to the RCSA process, we employ several tools to identify, measure, and monitor operational risks, including loss event data, key risk indicators, root cause analysis, and testing. Our operational risk framework requires that the primary responsibility for managing both the day-to-day risk and longer-term or emerging risks lies with the business lines, with independent oversight performed by the second line of defense.
We continue to face heightened operational risk and expect the risk to remain elevated for the near term. This elevated risk profile is due to the layering impact of several factors including: legacy systems requiring upgrade for operational resiliency; reliance on manual processes; volume and complexity of new business initiatives, including those we are pursuing as required by the Conservatorship Scorecards; external events such as cybersecurity threats and third-party failures; and issues requiring remediation. Other factors contributing to our heightened operational risk are discussed in
Risk Factors - Operational Risks
.
While our operational risk profile remains elevated, we are continuing to strengthen our operational control environment by building out our operational risk resources within Enterprise Risk Management and within the first line of defense.
Business Resiliency Risk
We continue to enhance our business resiliency capabilities for mission critical systems and processes. Freddie Mac has established business resiliency policies and standards to strengthen enterprise-wide risk reduction activities, program execution, and program maturity. Program enhancements include geographical redundancies as well as continuous technological transformation to achieve recovery of critical business functions and supporting assets in the event of a business disruption.
|
FREDDIE MAC
| 2018 Form 10-K
|
133
|
|
|
Management's Discussion and Analysis
|
Risk Management
|
Operational Risk
|
Internal Processes and New Initiatives
We periodically make improvements to the design of our process for business lines with increased business volumes and complexity of transactions to achieve effectiveness and efficiency in our operations. New initiatives that pose significant risks to the company are subject to additional evaluation, documentation, reporting, review, and approvals (including by the second line), prior to execution.
Common Securitization Platform
We continue to make various multi-year investments to build the infrastructure for a better housing finance system, including the development of the CSP by CSS (jointly owned by Freddie Mac and Fannie Mae) and the UMBS. With regard to the CSP, while we exercise influence over CSS through our representation on the CSS Board of Managers, we do not control its day-to-day operations. CSS' day-to-day operations are managed by CSS management, which is overseen by the CSS Board of Managers. The Board of Managers consists of two Freddie Mac and two Fannie Mae representatives.
The transition to the CSP presents significant operational and technological challenges. Freddie Mac began its transition to the CSP in late 2016 through CSP Release 1. Freddie Mac and CSS have performed activities as expected with no major issues to date. In addition, we are employing various processes and procedures to mitigate the operational risks related to Release 1. We will continue working with FHFA, CSS, and Fannie Mae to develop processes and procedures related to the risks associated with CSP Release 2, which is targeted for June 2019.
For additional information see
Risk Factors - Operational Risks
-
A failure in our operational systems or infrastructure, or those of third parties, could impair our liquidity, disrupt our business, damage our reputation, and cause losses
.
Cybersecurity Risk
Our operations rely on the secure, accurate and timely receipt, processing, storage, and transmission of confidential and other information in our computer systems and networks and with customers, counterparties, service providers, and financial institutions. Information risks for companies like ours have increased significantly in recent years. Like many companies and government entities, from time to time we have been, and likely will continue to be, the target of attempted cyberattacks and other information security threats.
We continue to invest in the information risk and security area to strengthen our capabilities to prevent, detect, respond to and mitigate risk, and protect our computer systems, software, networks, and other technology assets against unauthorized attempts to access confidential information or to disrupt or degrade our business operations. We have obtained insurance coverage relating to cybersecurity risks. However, this insurance may not be sufficient to provide adequate loss coverage. Although to date we have not experienced any cyberattacks resulting in significant impact to the company, there is no assurance that our cybersecurity risk management program will prevent cyberattacks from having significant impacts in the future.
For additional information, see
Risk Factors - Operational Risks -
Potential cybersecurity threats are changing rapidly and growing in sophistication. We may not be able to
|
FREDDIE MAC
| 2018 Form 10-K
|
134
|
|
|
Management's Discussion and Analysis
|
Risk Management
|
Operational Risk
|
protect our systems or the confidentiality of our information from cyberattack and other unauthorized access, disclosure, and disruption.
Third-Party Risk
We continue to enhance our third-party risk management program through established policies and formulation of standards. The third-party policies and standards focus on key areas such as due diligence, contract negotiations, on-going monitoring and termination of third parties, identifying the risks created by the use of third parties, and oversight, reporting, and analytics of third parties.
Model Risk
Model risk is defined as the potential for adverse consequences from model errors or decisions based on incorrect or misused model outputs. Our business activities significantly rely on the use of models. We use a variety of models to inform management decisions related to our businesses. These include models that forecast significant factors such as interest rates, mortgage rates, and house prices, as well as models that project future cash flows related to borrower prepayment and default behavior.
Model development, changes to existing models and model risks are managed in each business line according to our three-lines-of-defense framework. New model development and changes to existing models undergo a review process. Each business periodically reviews model performance, embedded assumptions, and limitations and modeling techniques, and updates its models as it deems appropriate. The ERM Division independently validates the work done by the business lines (e.g., conducting independent assessments of ongoing monitoring results, model risk ratings, performance monitoring, and reporting against thresholds and alerts).
Given the importance and complexity of models in our business, model development may take significant time to complete. Delays in our model development process could affect our ability to make sound business and risk management decisions, and increase our exposure to risk. We have procedures designed to mitigate this risk.
In 2018, we improved our model governance processes by strengthening model policies, standards, and procedures. We will continue to refine our model risk rating methodology and its use as an input into overarching model risk appetite.
We face significant risks associated with our use of models, as discussed in
Risk Factors - Operational Risks
- We face risks and uncertainties associated with the models that we use to inform business and risk management decisions and for financial accounting and reporting purposes
.
Effectiveness of Our Disclosure Controls and Procedures
Management, including the company's CEO and CFO, conducted an evaluation of the effectiveness of our disclosure controls and procedures as of
December 31, 2018
. As of
December 31, 2018
, we had one material weakness related to conservatorship, which remained unremediated, causing us to conclude that our disclosure controls and procedures were not effective at a reasonable level of assurance. For additional information, see
Controls and Procedures
.
|
FREDDIE MAC
| 2018 Form 10-K
|
135
|
|
|
Management's Discussion and Analysis
|
Risk Management |
Market Risk
|
Market Risk
Overview
Our business segments have embedded exposure to market risk, which is the economic risk associated with adverse changes in interest rates, volatility, and spreads. Interest-rate risk is consolidated and primarily managed by the Capital Markets segment, while spread risk is owned and managed by each individual business segment. Market risk can adversely affect future cash flows, or economic value, as well as earnings and net worth.
The majority of our interest-rate risk comes from our investments in mortgage-related assets (securities and loans) and the debt we issue to fund them. Typically, an existing loan or bond investment is worth less to an investor when interest rates (yields) rise and worth more when they decline. In addition, for a majority of our single-family mortgage-related assets, the borrower has the option to make unscheduled principal payments at any time before maturity without incurring a prepayment penalty. Thus, our mortgage-related asset portfolio is also exposed to uncertainty as to when borrowers will exercise their option and pay the outstanding principal balance of their loans. We face similar (and in most cases directionally opposite) exposure related to unsecured debt. Unsecured debt is typically worth less to an investor when interest rates (yields) rise and worth more when they decline. In addition, we issue debt with embedded options, such as an option to call, which provides us flexibility concerning the timing of our debt maturities. We actively manage our economic exposure to interest rate fluctuations.
Our primary goal in managing interest-rate risk is to reduce the amount of change in the value of our future cash flows due to future changes in interest rates. We use models to analyze possible future interest-rate scenarios, along with the cash flows of our assets and liabilities over those scenarios.
Management of Market Risk
We employ risk management practices that seek to maintain certain interest-rate characteristics of our assets and liabilities within our risk limits through a number of different strategies, including:
|
n
|
Asset selection and structuring, such as acquiring or structuring mortgage-related securities with certain expected prepayment and other characteristics;
|
|
n
|
Issuance of both callable and non-callable unsecured debt; and
|
|
n
|
Use of interest-rate derivatives, including swaps, swaptions, and futures.
|
Our use of derivatives is an important part of our strategy to manage interest-rate risk. When deciding to use derivatives to mitigate our exposures, we consider a number of factors, including cost, exposure to counterparty credit risks, and our overall risk management strategy. See
Risk Management - Counterparty Credit Risk
and
Risk Factors
for more discussion of our market risk exposures, including those related to derivatives, institutional counterparties, and other market risks.
|
FREDDIE MAC
| 2018 Form 10-K
|
136
|
|
|
Management's Discussion and Analysis
|
Risk Management |
Market Risk
|
Although we have limited ability to manage spread risk, we employ the following strategies:
|
n
|
Limiting the size of our assets that are exposed to spread risk;
|
|
n
|
Using short-TBA positions to hedge primarily loans acquired through our cash loan purchase program that are awaiting securitization and portions of our agency mortgage-related securities portfolio; and
|
|
n
|
Entering into certain spread-related derivatives to offset our spread exposures.
|
|
FREDDIE MAC
| 2018 Form 10-K
|
137
|
|
|
Management's Discussion and Analysis
|
Risk Management |
Market Risk
|
Spread Risk
Spread risk is the risk that yields in different asset classes may not move together and may adversely affect our economic value. This risk arises principally because interest rates on our mortgage-related investments may not move in tandem with interest rates on our financial liabilities and derivatives, potentially affecting the effectiveness of our hedges. We are exposed to the following types of market spread risk:
n
Market spread risk arising from funding mortgage-related investments with debt securities;
|
n
|
Market spread risk arising from our use of LIBOR- or Treasury-based instruments in our risk management activities;
|
|
n
|
Market spread risk arising from the difference in time between when we commit to purchase a multifamily mortgage loan and when we securitize the loan. During this time, market spreads can widen, causing losses due to changes in fair value; and
|
|
n
|
Market spread risk on the K Certificates and SB Certificates we hold in our mortgage-related investments portfolio.
|
Interest-Rate Risk
Interest-rate risk is the economic risk related to adverse changes in the level or volatility of interest rates.
A change in the level of interest rates (represented by a parallel shift of the yield curve, all else constant) exposes our assets and liabilities to risk, potentially affecting expected future cash flows and their present values. This is reflected in our PMVS-L and duration gap disclosures. Similarly, changes in the shape or slope of the yield curve (often reflecting changes in the market's expectation of future interest rates) expose our assets and liabilities to risk, potentially affecting expected future cash flows and their present values. This is reflected in our PMVS-YC disclosure. Volatility risk is the risk that changes in the market's expectation of the magnitude of future variations in interest rates will adversely affect our economic value. We are exposed to volatility risk in both our mortgage-related assets and liabilities, especially in instruments with embedded options.
Measurement of Interest-Rate Risk
We calculate our exposure to changes in interest rates for our interest rate sensitive assets and liabilities using effective duration and effective convexity, based on our models.
|
n
|
Effective duration measures the percentage change in the price of financial instruments from a 100 basis point change in interest rates. Financial instruments with positive duration increase in value as interest rates decline. Conversely, financial instruments with negative duration increase in value as interest rates rise.
|
|
n
|
Effective convexity measures the change in effective duration for a 100 basis point change in interest rates. Effective duration is not constant over the entire yield curve and effective convexity measures how effective duration changes over large changes in interest rates
.
|
Together, effective duration and effective convexity provide a measure of an instrument's overall price sensitivity to changes in interest rates. We utilize the concepts of effective duration and effective convexity in calculating our primary interest-rate risk measures: duration gap and PMVS.
|
n
|
Duration gap
-
The net effective duration of our overall portfolio of interest-rate sensitive assets and liabilities is expressed in months as our duration gap. Duration gap measures the difference in price
|
|
FREDDIE MAC
| 2018 Form 10-K
|
138
|
|
|
Management's Discussion and Analysis
|
Risk Management |
Market Risk
|
sensitivity to interest rate changes between our financial assets and liabilities and is expressed in months relative to the market value of assets. For example, assets with a six-month duration and liabilities with a five-month duration would result in a positive duration gap of one month.
The table below shows various duration gap measurements and the effects that changes in interest rates would generally have on portfolio value.
|
Negative Duration Gap
|
Zero Duration Gap
|
Positive Duration Gap
|
|
Asset Duration < Liability Duration
|
Asset Duration = Liability Duration
|
Asset Duration > Liability Duration
|
|
Net portfolio will increase in value when interest rates rise and decrease in value when interest rates fall.
|
Net portfolio economic value will be unchanged. The change in the value of assets from an instantaneous move in interest rates, either up or down, would be expected to be accompanied by an equal and offsetting change in the value of liabilities.
|
Net portfolio will increase in value when interest rates fall and decrease in value when interest rates rise.
|
We actively measure and manage our duration gap exposure on a daily basis. In addition to duration gap management, we also measure and manage the price sensitivity of our portfolio to a number of different specific interest rate changes along the yield curve. The price sensitivity of an instrument to specific changes in interest rates is known as the instrument's key rate duration risk. By managing our duration exposure both in aggregate through duration gap and to specific changes in interest rates through key rate duration, we expect to limit our exposure to interest rate changes for a wide range of interest rate yield curve scenarios.
|
n
|
PMVS
-
PMVS is our estimate of the change in the market value of our financial assets and liabilities from an instantaneous shock to interest rates, assuming spreads are held constant and no rebalancing actions are undertaken. PMVS is measured in two ways, one measuring the estimated sensitivity of our portfolio's market value to a 50 basis point parallel movement in interest rates (PMVS-L) and the other to a nonparallel movement (PMVS-YC), resulting from a 25 basis point change in slope of the LIBOR yield curve. The 50 basis point shift and 25 basis point change in slope of the LIBOR yield curve used for our PMVS measures reflect reasonably possible near-term changes that we believe provide a meaningful measure of our interest-rate risk sensitivity.
|
To calculate PMVS, the interest rate shock is applied to the duration (and convexity for PMVS-L) of all interest-rate sensitive financial instruments. The resulting change in market value for the aggregate portfolio is computed for both the up rate and down rate shock, and whichever produces the more adverse outcome is the PMVS. In cases where both the up rate and down rate shocks result in a positive effect, the PMVS is zero. PMVS results are shown on a pre-tax basis.
|
FREDDIE MAC
| 2018 Form 10-K
|
139
|
|
|
Management's Discussion and Analysis
|
Risk Management |
Market Risk
|
Interest-Rate Risk Results
The tables below provide our duration gap, estimated point-in-time and minimum and maximum PMVS-L and PMVS-YC results, and an average of the daily values and standard deviation for the years ended December 31, 2018 and December 31, 2017. The tables below also provide PMVS-L estimates assuming an immediate 100 basis point shift in the LIBOR yield curve. The interest-rate sensitivity of our mortgage portfolio varies across a wide range of interest rates.
Table 52 - PMVS-YC and PMVS-L Results Assuming Shifts of the LIBOR Yield Curve
|
As of December 31,
|
||||||||||||||||||||||
|
2018
|
2017
|
|||||||||||||||||||||
|
|
PMVS-YC
|
PMVS-L
|
PMVS-YC
|
PMVS-L
|
||||||||||||||||||
|
(In millions)
|
25 bps
|
50 bps
|
100 bps
|
25 bps
|
50 bps
|
100 bps
|
||||||||||||||||
|
Assuming shifts of the LIBOR yield curve, (gains) losses on:
(1)
|
||||||||||||||||||||||
|
Assets
|
|
($447
|
)
|
|
$5,367
|
|
|
$10,988
|
|
|
$463
|
|
|
$5,587
|
|
|
$11,446
|
|
||||
|
Liabilities
|
(109
|
)
|
(1,889
|
)
|
(3,948
|
)
|
185
|
|
(2,377
|
)
|
(4,968
|
)
|
||||||||||
|
Derivatives
|
560
|
|
(3,446
|
)
|
(6,917
|
)
|
(646
|
)
|
(3,200
|
)
|
(6,477
|
)
|
||||||||||
|
Total
|
|
$4
|
|
|
$32
|
|
|
$123
|
|
|
$2
|
|
|
$10
|
|
|
$1
|
|
||||
|
PMVS
|
|
$4
|
|
|
$32
|
|
|
$123
|
|
|
$2
|
|
|
$10
|
|
|
$1
|
|
||||
|
(1)
|
The categorization of the PMVS impact between assets, liabilities, and derivatives on this table is based upon the economic characteristics of those assets and liabilities, not their accounting classification. For example, purchase and sale commitments of mortgage-related securities and debt securities of consolidated trusts held by the mortgage-related investments portfolio are both categorized as assets on this table.
|
Table 53 - Duration Gap and PMVS Results
|
|
Year Ended December 31,
|
|||||||||||||||||
|
|
2018
|
2017
|
||||||||||||||||
|
(Duration gap in months,
dollars in millions
)
|
Duration
Gap
|
PMVS-YC
25 bps
|
PMVS-L
50 bps
|
Duration
Gap
|
PMVS-YC
25 bps
|
PMVS-L
50 bps
|
||||||||||||
|
Average
|
—
|
|
|
$11
|
|
|
$15
|
|
0.1
|
|
|
$7
|
|
|
$16
|
|
||
|
Minimum
|
(0.4
|
)
|
—
|
|
—
|
|
(0.4
|
)
|
—
|
|
—
|
|
||||||
|
Maximum
|
0.3
|
|
31
|
|
77
|
|
0.8
|
|
26
|
|
78
|
|
||||||
|
Standard deviation
|
0.1
|
|
6
|
|
16
|
|
0.2
|
|
5
|
|
19
|
|
||||||
The disclosure in our Monthly Volume Summary reports, which are available on our website
www.freddiemac.com/investors/financials/monthly-volume-summaries
, reflects the average of the daily PMVS-L, PMVS-YC, and duration gap estimates for a given reporting period (a month, a quarter, or a year).
Derivatives enable us to reduce our economic interest-rate risk exposure as we continue to align our derivative portfolio with the changing duration of our economically hedged assets and liabilities. The table below shows that the PMVS-L risk levels, assuming a 50 basis point shift in the LIBOR yield curve for the periods presented, would have been higher if we had not used derivatives.
|
FREDDIE MAC
| 2018 Form 10-K
|
140
|
|
|
Management's Discussion and Analysis
|
Risk Management |
Market Risk
|
Table 54 - PMVS-L Results Before Derivatives and After Derivatives
|
PMVS-L (50 bps)
|
|||||||||||
|
(In millions)
|
Before
Derivatives
|
After
Derivatives
|
Effect of
Derivatives
|
||||||||
|
December 31, 2018
|
|
$3,478
|
|
|
$32
|
|
|
($3,446
|
)
|
||
|
December 31, 2017
|
3,210
|
|
10
|
|
(3,200
|
)
|
|||||
Limitations of Interest-Rate Risk Measures
While we believe that PMVS and duration gap are useful risk management tools, they should be understood as estimates rather than as precise measurements. Mis-estimation of economic market risk could result in over or under hedging of interest-rate risk, significant economic losses, and an adverse impact on earnings. The limitations of our economic market risk measures include the following:
|
n
|
Our PMVS and duration gap estimates are determined using models that involve our judgment of interest-rate and prepayment assumptions.
|
|
n
|
There could be times when we hedge differently than our model estimates during the period, such as when we are making changes or market updates to these models.
|
|
n
|
PMVS and duration gap do not capture the potential effect of certain other market risks, such as changes in volatility and market spread risk. The effect of these other market risks can be significant.
|
|
n
|
Our sensitivity analyses for PMVS and duration gap contemplate only certain movements in interest rates and are performed at a particular point in time based on the estimated fair value of our existing portfolio.
|
|
n
|
Although the mortgage-related investments portfolio is the main contributor of interest-rate risk to the company, other core businesses also contribute to our interest-rate risk and may be managed differently. We have certain assets that have a relatively short holding period. As a result, we may manage the risk of these assets based on their disposition, while our risk measures use long-term cash flows. Hedging these businesses at times requires additional assumptions concerning risk metrics to accommodate changes in pricing that may not be related to the future cash flow of the assets. This could create a perceived risk exposure as the hedged risk may differ from the model risk.
|
|
n
|
The choice of the benchmark rate used to model and hedge our positions is a significant assumption. The effectiveness of our hedges ultimately depends on how closely the different instruments (assets, liabilities, and derivatives) react to the underlying chosen benchmark. In the simplest example, all instruments would have interest-rate risk based on the same underlying benchmark, in our case, the swap rate. In practice, however, different instruments react differently versus the benchmark rate, which creates a market spread between the benchmark rate and the instrument. As the market spreads of these instruments move differently, our ability to predict the behavior of each instrument relative to the others is reduced, potentially affecting the effectiveness of our hedges.
|
|
n
|
Our reported measurements do not include the sensitivity to interest-rate changes of the following assets and liabilities:
|
|
l
|
Credit guarantee activities
- We currently do not hedge the interest-rate exposure of our credit guarantees except for the interest-rate exposure related to buy-ups, float, and STACR debt
|
|
FREDDIE MAC
| 2018 Form 10-K
|
141
|
|
|
Management's Discussion and Analysis
|
Risk Management |
Market Risk
|
notes. Float, which arises from timing differences between the borrower's principal payments on the loan and the reduction of the PC balance, can lead to significant interest expense if the interest rate paid to a PC investor is higher than the reinvestment rate earned by the securitization trusts on payments received from borrowers and paid to us as trust management income.
|
l
|
Other assets and other liabilities
- We do not include other miscellaneous assets and liabilities, primarily deferred tax assets, accounts payable and receivable, and non-cash basis adjustments.
|
We are considering updating our interest-rate risk measures to include two additional items that are not currently incorporated in our asset and liability interest-rate risk management strategy and definition: (i) upfront fees (including buy-downs) related to single-family credit guarantee activity and (ii) net worth. If these updates were included, they would reflect, respectively, (i) that the present value of upfront fees related to single-family credit guarantee activity decreases (increases) when interest rates increase (decrease), and (ii) that we view net worth as having long-term duration rather than short-term duration, and that the present value of net worth therefore increases (decreases) when interest rates increase (decrease).
GAAP Earnings Variability
The GAAP accounting treatment for our financial assets and liabilities (i.e., some are measured at amortized cost, while others are measured at fair value) creates variability in our GAAP earnings when interest rates and spreads change. This variability of GAAP earnings, which may not reflect the economics of our business, increases the risk of our having a negative net worth and thus being required to draw from Treasury.
Interest-Rate Volatility
While we manage our interest-rate risk exposure on an economic basis to a low level as measured by our models, our GAAP financial results are still subject to significant earnings variability from period to period. Based upon the composition of our financial assets and liabilities, including derivatives, at December 31, 2018, we generally recognize fair value losses in GAAP earnings when interest rates decline.
In an effort to reduce our GAAP earnings variability and better align our GAAP results with the economics of our business, we began using hedge accounting during 2017. See
Note 9
for additional information on hedge accounting.
The table below presents the effect of derivatives used in our interest-rate risk management activities on our comprehensive income, net of tax, after considering any offsetting interest rate effects related to financial instruments measured at fair value and the effects of fair value hedge accounting.
|
FREDDIE MAC
| 2018 Form 10-K
|
142
|
|
|
Management's Discussion and Analysis
|
Risk Management |
Market Risk
|
Table 55 - Estimated Net Interest Rate Effect on Comprehensive Income (Loss)
|
Year Ended December 31,
|
|||||||
|
(In billions)
|
2018
|
2017
|
|||||
|
Interest rate effect on derivative fair values
|
|
$2.5
|
|
|
$—
|
|
|
|
Estimate of offsetting interest rate effect related to financial instruments measured at fair value
(1)
|
(1.9
|
)
|
(0.7
|
)
|
|||
|
Gains (losses) on mortgage loans and debt in fair value hedge relationships
|
(1.6
|
)
|
0.3
|
|
|||
|
Amortization of deferred hedge accounting gains and losses
|
0.3
|
|
—
|
|
|||
|
Income tax (expense) benefit
|
0.1
|
|
0.1
|
|
|||
|
Estimated net interest rate effect on comprehensive income (loss)
|
|
($0.6
|
)
|
|
($0.3
|
)
|
|
|
(1)
|
Includes the interest-rate effect on our trading securities, available-for-sale securities, mortgage loans held-for-sale and other assets and debt for which we elected the fair value option, which is reflected in other non-interest income (loss) and total other comprehensive income (loss) on our consolidated statements of comprehensive income.
|
We evaluate the potential benefits of fair value hedge accounting by evaluating a range of interest-rate scenarios and identifying which of those scenarios produces the most adverse GAAP earnings outcome. The interest-rate scenarios evaluated include parallel shifts in the yield curve of plus and minus 100 basis points, non-parallel yield curve shifts in which long-term interest rates increase or decrease by 100 basis points, and non-parallel yield curve shifts in which short-term and medium-term interest rates increase or decrease by 100 basis points.
n
At December 31, 2018, the GAAP adverse scenario before fair value hedge accounting was a non-parallel shift in which long-term rates decrease by 100 basis points, while the adverse scenario after fair value hedge accounting was a non-parallel shift in which short and medium-term rates decrease by 100 basis points.
n
At December 31, 2017, the GAAP adverse scenario both before and after fair value hedge accounting was a non-parallel shift in which long-term rates decrease by 100 basis points.
The results of this evaluation are shown in the table below.
Table 56 - GAAP Adverse Scenario Before and After Hedge Accounting
|
GAAP Adverse Scenario (Before-Tax)
|
|||||||||
|
(Dollars in billions)
|
Before Hedge Accounting
|
After Hedge Accounting
|
% Change
|
||||||
|
December 31, 2018
|
|
($2.7
|
)
|
|
($0.2
|
)
|
93
|
%
|
|
|
December 31, 2017
|
(3.1
|
)
|
(0.5
|
)
|
84
|
|
|||
Hedge accounting is designed to reduce the impact to GAAP earnings in the adverse scenario described above. However, the after hedge accounting impact may not always result in an improvement over the before hedge accounting impact. For example, there are certain interest-rate scenarios in which the after hedge accounting impact would result in a lower gain or a larger loss than the before hedge accounting impact.
For further discussion of financial results related to interest-rate risk, see
Our Business Segments -
Capital Markets
.
Spread Volatility
We have limited ability to manage our spread risk exposure and therefore the volatility of market spreads may contribute to significant GAAP earnings variability. For financial assets measured at fair value, we
|
FREDDIE MAC
| 2018 Form 10-K
|
143
|
|
|
Management's Discussion and Analysis
|
Risk Management |
Market Risk
|
generally recognize fair value losses when market spreads widen. Conversely, for financial liabilities measured at fair value, we generally recognize fair value gains when market spreads widen.
The table below shows the estimated effect of spreads on our comprehensive income (loss), after tax, by segment.
Table 57 - Estimated Spread Effect on Comprehensive Income (Loss)
|
Year Ended December 31,
|
|||||||
|
(In billions)
|
2018
|
2017
|
|||||
|
Capital Markets
|
|
$0.4
|
|
|
$0.8
|
|
|
|
Multifamily
|
(0.4
|
)
|
0.3
|
|
|||
|
Single-family Guarantee
(1)
|
0.1
|
|
(0.2
|
)
|
|||
|
Spread effect on comprehensive income (loss)
|
|
$0.1
|
|
|
$0.9
|
|
|
|
(1)
|
Represents spread exposure on certain STACR debt securities for which we have elected the fair value option.
|
For further discussion of significant financial results related to spread risk, see
Our Business Segments - Multifamily
and
Our Business Segments - Capital Markets
.
|
FREDDIE MAC
| 2018 Form 10-K
|
144
|
|
|
Management's Discussion and Analysis
|
Liquidity and Capital Resources
|
LIQUIDITY AND CAPITAL RESOURCES
Overview
Our business activities require that we maintain adequate liquidity to meet our financial obligations as they come due and meet the needs of customers in a timely and cost-efficient manner. We also must maintain adequate capital resources to avoid being placed into receivership by FHFA.
Sources and Uses of Funds
Our primary source of funding for the assets on our balance sheet is the issuance of debt. In addition to the funding provided by issuing debt, our other sources of funds include:
|
n
|
Principal payments on and sales of securities and loans that we own;
|
|
n
|
Repurchase transactions;
|
|
n
|
Net worth, which represents funding available to us prior to our dividend requirement on our senior preferred stock; and
|
|
n
|
Draws from Treasury under the Purchase Agreement, which are only made if we have a quarterly deficit in our net worth.
|
We use these sources to fund the assets on our balance sheet. Our primary uses of funds include:
|
n
|
Principal payments upon the maturity, redemption, or repurchase of our other debt;
|
|
n
|
Purchases of mortgage loans, including purchases of seriously delinquent or modified loans from PC trusts, mortgage-related securities, and other investments;
|
|
n
|
Payments related to derivative contracts and posting or pledging of collateral to third parties in connection with secured financing and daily trade activities; and
|
|
n
|
Dividend requirements on our senior preferred stock.
|
We receive cash from our revenue-generating activities, primarily interest income on securities and loans that we own, guarantee fees (inclusive of initial upfront fees) and other fee income. We use cash to pay interest expense on our debt and our other expenses.
In addition to the uses and sources of cash described above, we are involved in various legal proceedings, including those discussed in
Legal Proceedings
, which may result in a need to use cash to settle claims or pay certain costs or receipt of cash from settlements.
Our securities and other obligations are not guaranteed by the U.S. government and do not constitute a debt or obligation of the U.S. government or any agency or instrumentality thereof, other than Freddie Mac. We continue to manage our debt issuances to remain in compliance with the aggregate indebtedness limits set forth in the Purchase Agreement. For a description of our debt products, see
Our Business Segments -
Capital Markets
.
|
FREDDIE MAC
| 2018 Form 10-K
|
145
|
|
|
Management's Discussion and Analysis
|
Liquidity and Capital Resources
|
Liquidity Management Framework
The support provided by Treasury pursuant to the Purchase Agreement enables us to have adequate liquidity to conduct our normal business activities. However, the costs and availability of our debt funding could vary for a number of reasons, including the uncertainty about the future of the GSEs and any future downgrades in our credit ratings or the credit ratings of the U.S. government.
We make extensive use of the Federal Reserve's payment system in our business activities. The Federal Reserve requires that we fully fund our accounts at the Federal Reserve Bank of New York to the extent necessary to cover cash payments on our debt and mortgage-related securities each day, before the Federal Reserve Bank of New York, acting as our fiscal agent, will initiate such payments. Although we seek to maintain sufficient intraday liquidity to fund our activities through the Federal Reserve's payment system, we have limited access to cash once the debt markets are closed for the day. Insufficient cash may cause our account to be overdrawn, potentially resulting in penalties and reputational harm.
Maintaining sufficient liquidity is of primary importance to, and a cost of, our business. Under our liquidity management practices and policies, we:
|
n
|
Manage intraday cash needs and provide for the contingency of an unexpected cash demand;
|
|
n
|
Maintain cash and non-mortgage investments to enable us to meet ongoing cash obligations for a limited period of time, assuming no access to unsecured debt markets;
|
|
n
|
Maintain unencumbered securities with a value greater than or equal to the largest projected daily cash shortfall for an extended period of time, assuming no access to unsecured debt markets; and
|
|
n
|
Manage the maturity of our unsecured debt based on our asset profile.
|
To facilitate cash management, we forecast cash outflows and inflows using assumptions and models. These forecasts help us to manage our liabilities with respect to the timing of our cash flows. Differences between actual and forecasted cash flows have resulted in higher costs from issuing a higher amount of debt than needed or unexpectedly needing to issue debt, and may do so in the future. Differences between actual and forecasted cash flows also could result in our account at the Federal Reserve Bank of New York being overdrawn. We maintain daily cash reserves to manage this risk.
|
FREDDIE MAC
| 2018 Form 10-K
|
146
|
|
|
Management's Discussion and Analysis
|
Liquidity and Capital Resources
|
Liquidity Profile
Primary Sources of Liquidity
The following table lists the sources of our liquidity, the balances as of December 31, 2018 and a brief description of their importance to Freddie Mac. Our ability to maintain sufficient liquidity, including by pledging mortgage-related and other securities as collateral to other institutions, could cease or change rapidly and the cost of the available funding could increase significantly due to changes in market interest rates, market confidence, operational risks, and other factors.
Table 58 - Sources of Liquidity
|
Source
|
Balance
(1)
(In billions)
|
Description
|
||||
|
Liquidity
|
||||||
|
•
|
Other Investments Portfolio - Liquidity and Contingency Operating Portfolio
|
|
$43.7
|
|
•
|
The Liquidity and Contingency Operating Portfolio, included within our other investments portfolio, is primarily used for short-term liquidity management.
|
|
•
|
Liquid Portion of the Mortgage-Related Investments Portfolio
|
|
$120.4
|
|
•
|
The liquid portion of our mortgage-related investments portfolio can be pledged or sold for liquidity purposes. The amount of cash we may be able to successfully raise may be substantially less than the balance.
|
|
(1)
|
Represents carrying value for the Liquidity and Contingency Operating Portfolio, included within our other investments portfolio, and UPB for the liquid portion of the mortgage-related investments portfolio.
|
Other Investments Portfolio
The table below summarizes the balances in our other investments portfolio, which includes the Liquidity and Contingency Operating Portfolio. The investments in our other investments portfolio are important to our cash flow, collateral management, asset and liability management, and ability to provide liquidity and stability to the mortgage market. The other investments portfolio consists of the Liquidity and Contingency Operating Portfolio, primarily used for short-term liquidity management, cash and other investments held by consolidated trusts, and other investments, which include investments in debt securities used to pledge as collateral, LIHTC partnerships and secured lending activities.
|
FREDDIE MAC
| 2018 Form 10-K
|
147
|
|
|
Management's Discussion and Analysis
|
Liquidity and Capital Resources
|
Table 59 - Other Investments Portfolio
|
As of December 31, 2018
|
As of December 31, 2017
|
|||||||||||||||||||||||||
|
(In billions)
|
Liquidity and Contingency Operating Portfolio
|
Custodial Account
|
Other
|
Total Other Investments Portfolio
|
Liquidity and Contingency Operating Portfolio
|
Custodial Account
|
Other
|
Total Other Investments Portfolio
|
||||||||||||||||||
|
Cash and cash equivalents
(1)
|
|
$6.7
|
|
|
$0.6
|
|
|
$—
|
|
|
$7.3
|
|
|
$9.3
|
|
|
$0.5
|
|
|
$—
|
|
|
$9.8
|
|
||
|
Securities purchased under agreements to resell
|
20.2
|
|
12.1
|
|
2.5
|
|
34.8
|
|
38.9
|
|
16.8
|
|
0.2
|
|
55.9
|
|
||||||||||
|
Non-mortgage related securities
|
16.8
|
|
—
|
|
2.4
|
|
19.2
|
|
22.2
|
|
—
|
|
0.6
|
|
22.8
|
|
||||||||||
|
Secured lending and other
|
—
|
|
—
|
|
1.8
|
|
1.8
|
|
—
|
|
—
|
|
1.3
|
|
1.3
|
|
||||||||||
|
Total
|
|
$43.7
|
|
|
$12.7
|
|
|
$6.7
|
|
|
$63.1
|
|
|
$70.4
|
|
|
$17.3
|
|
|
$2.1
|
|
|
$89.8
|
|
||
|
(1)
|
The current and prior period presentation has been modified to include restricted cash and cash equivalents due to recently adopted accounting guidance and re-designation of cash collateral posted to us as part of the Liquidity and Contingency Operating Portfolio.
|
The Liquidity and Contingency Operating Portfolio consist of funds deposited at the Federal Reserve Bank of New York, non-mortgage-related securities which primarily consist of U.S. Treasury securities, and other investments that we could sell to provide us with an additional source of liquidity to fund our business operations. In 2018, we began to maintain interest-bearing deposits at commercial banks.
In addition, the Liquidity and Contingency Operating Portfolio includes collateral posted to us in the form of cash primarily by derivatives counterparties of $3.0 billion and $2.4 billion as of December 31, 2018 and December 31, 2017, respectively. We have invested this collateral in securities purchased under agreements to resell and non-mortgage-related securities as part of our Liquidity and Contingency Operating Portfolio, although the collateral may be subject to return to our counterparties based on the terms of our master netting and collateral agreements.
Mortgage Loans and Mortgage-Related Securities
We invest principally in mortgage loans and mortgage-related securities, certain categories of which are largely unencumbered and liquid. Our primary source of liquidity among these mortgage assets is our holdings of single-class and multiclass agency securities, excluding certain structured agency securities collateralized by non-agency mortgage-related securities.
In addition, we hold unsecuritized single-family loans and multifamily held-for-sale loans that could be securitized and would then be available for sale or for use as collateral for repurchase agreements. Due to the large size of our portfolio of liquid assets, the amount of mortgage-related assets that we may successfully sell or borrow against in the event of a liquidity crisis or significant market disruption may be substantially less than the amount of mortgage-related assets we hold. There would likely be insufficient market demand for large amounts of these assets over a prolonged period of time, which would limit our ability to sell or borrow against these assets.
We hold other mortgage assets, but given their characteristics, they may not be available for immediate sale or for use as collateral for repurchase agreements. These assets consist of certain structured agency securities collateralized by non-agency mortgage-related securities, non-agency CMBS, non-agency RMBS backed by subprime, option ARM, Alt-A, and other loans, and unsecuritized seriously delinquent and modified single-family loans.
We are subject to limits on the amount of mortgage assets we can sell in any calendar month without review and approval by FHFA and, if FHFA so determines, Treasury.
|
FREDDIE MAC
| 2018 Form 10-K
|
148
|
|
|
Management's Discussion and Analysis
|
Liquidity and Capital Resources
|
Primary Sources of Funding
Debt securities that we issue are classified either as debt securities of consolidated trusts held by third parties or other debt. The following table lists the sources and balances of our funding as of December 31, 2018 and a brief description of their importance to Freddie Mac.
Table 60 - Funding Sources
|
Source
|
Balance
(1)
(In billions)
|
Description
|
||||
|
Funding
|
||||||
|
•
|
Other Debt
|
|
$255.0
|
|
•
|
Other debt is used to fund our business activities, including single-family guarantee activities not funded by debt securities of consolidated trusts.
|
|
•
|
Debt Securities of Consolidated Trusts
|
|
$1,792.7
|
|
•
|
Debt securities of consolidated trusts are used primarily to fund our single-family guarantee activities. This type of debt is principally repaid by the cash flows of the associated mortgage loans. As a result, our repayment obligation is limited to amounts paid pursuant to our guarantee of principal and interest and to purchase modified or seriously delinquent loans from the trusts.
|
|
(1)
|
Represents UPB of debt balances.
|
Other Debt Activities
We issue other debt to fund our operations. Competition for funding can vary with economic, financial market, and regulatory environments.
During
2018
, we had sufficient access to the debt markets due largely to support from the U.S. government. We rely significantly on our ability to issue debt on an on-going basis to refinance our effective short-term debt. Our effective short-term debt percentage, which represents the percentage of our total other debt that is expected to mature within one year, was
42.7%
and 45.4% as of December 31, 2018 and December 31, 2017, respectively.
Our debt cap under the Purchase Agreement was
$346.1 billion
in
2018
and declined to
$300.0 billion
on January 1, 2019. As of
December 31, 2018
, our aggregate indebtedness, calculated as the par value of other debt, was
$255.7 billion
. We disclose the amount of our indebtedness on this basis monthly under the caption "Other Debt Activities - Total Debt Outstanding" in our Monthly Volume Summary reports, which are available on our website at
www.freddiemac.com/investors/financials/monthly-volume-summaries
.
To fund our business activities, we depend on the continuing willingness of investors to purchase our debt securities. The reduction in our mortgage-related investments portfolio has reduced our funding needs. Changes or perceived changes in the government's support of us could have a severe negative effect on our access to the debt markets and on our debt funding costs.
In addition, any change in applicable legislative or regulatory exemptions, including those described in
Regulation and Supervision
, could adversely affect our access to some debt investors, thereby potentially increasing our debt funding costs. For more information on our short- and long-term liquidity needs, see
Contractual Obligations
.
|
FREDDIE MAC
| 2018 Form 10-K
|
149
|
|
|
Management's Discussion and Analysis
|
Liquidity and Capital Resources
|
The tables below summarize the par value and the average rate of other debt securities we issued or paid off, including regularly scheduled principal payments, payments resulting from calls, and payments for repurchases. We call, exchange, or repurchase our outstanding debt securities from time to time for a variety of reasons, including managing our funding composition and supporting the liquidity of our debt securities.
Table 61 - Other Debt Activity
|
Year Ended December 31, 2018
|
|||||||||||
|
(Dollars in millions)
|
Short-term
|
Average Rate
(1)
|
Long-term
|
Average Rate
(1)
|
|||||||
|
Discount notes and Reference Bills
|
|||||||||||
|
Beginning balance
|
|
$45,717
|
|
1.19
|
%
|
|
$—
|
|
—
|
%
|
|
|
Issuances
|
356,129
|
|
1.40
|
|
—
|
|
—
|
|
|||
|
Repurchases
|
—
|
|
—
|
|
—
|
|
—
|
|
|||
|
Maturities
|
(373,059
|
)
|
1.29
|
|
—
|
|
—
|
|
|||
|
Ending Balance
|
28,787
|
|
2.36
|
|
—
|
|
—
|
|
|||
|
Securities sold under agreements to repurchase
|
|||||||||||
|
Beginning balance
|
9,681
|
|
1.06
|
|
—
|
|
—
|
|
|||
|
Additions
|
162,524
|
|
1.82
|
|
—
|
|
—
|
|
|||
|
Repayments
|
(166,186
|
)
|
1.75
|
|
—
|
|
—
|
|
|||
|
Ending Balance
|
6,019
|
|
2.40
|
|
—
|
|
—
|
|
|||
|
Callable debt
|
|||||||||||
|
Beginning balance
|
—
|
|
—
|
|
113,822
|
|
1.58
|
|
|||
|
Issuances
|
2,000
|
|
2.28
|
|
26,191
|
|
3.13
|
|
|||
|
Repurchases
|
—
|
|
—
|
|
(1,396
|
)
|
2.64
|
|
|||
|
Calls
|
—
|
|
—
|
|
(3,580
|
)
|
2.23
|
|
|||
|
Maturities
|
—
|
|
—
|
|
(29,831
|
)
|
1.06
|
|
|||
|
Ending Balance
|
2,000
|
|
2.53
|
|
105,206
|
|
2.09
|
|
|||
|
Non-callable debt
|
|||||||||||
|
Beginning balance
|
17,792
|
|
1.03
|
|
111,169
|
|
2.11
|
|
|||
|
Issuances
|
14,965
|
|
2.02
|
|
11,514
|
|
2.21
|
|
|||
|
Repurchases
|
—
|
|
—
|
|
(1,340
|
)
|
2.11
|
|
|||
|
Maturities
|
(18,317
|
)
|
1.06
|
|
(40,554
|
)
|
1.35
|
|
|||
|
Ending Balance
|
14,440
|
|
2.04
|
|
80,789
|
|
2.56
|
|
|||
|
STACR and SCR Debt
(2)
|
|||||||||||
|
Beginning balance
|
—
|
|
—
|
|
17,925
|
|
5.04
|
|
|||
|
Issuances
|
—
|
|
—
|
|
1,885
|
|
3.67
|
|
|||
|
Repurchases
|
—
|
|
—
|
|
—
|
|
—
|
|
|||
|
Maturities
|
—
|
|
—
|
|
(2,081
|
)
|
4.14
|
|
|||
|
Ending Balance
|
—
|
|
—
|
|
17,729
|
|
6.02
|
|
|||
|
Total other debt
|
|
$51,246
|
|
2.28
|
%
|
|
$203,724
|
|
2.62
|
%
|
|
Referenced footnotes are included after the next table.
|
FREDDIE MAC
| 2018 Form 10-K
|
150
|
|
|
Management's Discussion and Analysis
|
Liquidity and Capital Resources
|
|
Year Ended December 31, 2017
|
|||||||||||
|
(Dollars in millions)
|
Short-term
|
Average Rate
(1)
|
Long-term
|
Average Rate
(1)
|
|||||||
|
Discount notes and Reference Bills
|
|||||||||||
|
Beginning balance
|
|
$61,042
|
|
0.47
|
%
|
|
$—
|
|
—
|
%
|
|
|
Issuances
|
376,685
|
|
0.85
|
|
—
|
|
—
|
|
|||
|
Repurchases
|
(57
|
)
|
0.91
|
|
—
|
|
—
|
|
|||
|
Maturities
|
(391,953
|
)
|
0.76
|
|
—
|
|
—
|
|
|||
|
Ending Balance
|
45,717
|
|
1.19
|
|
—
|
|
—
|
|
|||
|
Securities sold under agreements to repurchase
|
|||||||||||
|
Beginning balance
|
3,040
|
|
0.42
|
|
—
|
|
—
|
|
|||
|
Additions
|
133,223
|
|
0.72
|
|
—
|
|
—
|
|
|||
|
Repayments
|
(126,582
|
)
|
0.67
|
|
—
|
|
—
|
|
|||
|
Ending Balance
|
9,681
|
|
1.06
|
|
—
|
|
—
|
|
|||
|
Callable debt
|
|||||||||||
|
Beginning balance
|
—
|
|
—
|
|
98,420
|
|
1.44
|
|
|||
|
Issuances
|
—
|
|
—
|
|
56,894
|
|
1.92
|
|
|||
|
Repurchases
|
—
|
|
—
|
|
(335
|
)
|
1.83
|
|
|||
|
Calls
|
—
|
|
—
|
|
(27,414
|
)
|
1.75
|
|
|||
|
Maturities
|
—
|
|
—
|
|
(13,743
|
)
|
0.87
|
|
|||
|
Ending Balance
|
—
|
|
—
|
|
113,822
|
|
1.58
|
|
|||
|
Non-callable debt
|
|||||||||||
|
Beginning balance
|
7,435
|
|
0.41
|
|
172,204
|
|
1.90
|
|
|||
|
Issuances
|
21,504
|
|
0.99
|
|
19,798
|
|
1.63
|
|
|||
|
Repurchases
|
(500
|
)
|
0.82
|
|
(1,211
|
)
|
1.40
|
|
|||
|
Maturities
|
(10,647
|
)
|
0.52
|
|
(79,621
|
)
|
1.55
|
|
|||
|
Ending Balance
|
17,792
|
|
1.03
|
|
111,170
|
|
2.11
|
|
|||
|
STACR and SCR Debt
(2)
|
|||||||||||
|
Beginning balance
|
—
|
|
—
|
|
14,602
|
|
4.38
|
|
|||
|
Issuances
|
—
|
|
—
|
|
5,712
|
|
3.80
|
|
|||
|
Repurchases
|
—
|
|
—
|
|
—
|
|
—
|
|
|||
|
Maturities
|
—
|
|
—
|
|
(2,390
|
)
|
3.01
|
|
|||
|
Ending Balance
|
—
|
|
—
|
|
17,924
|
|
5.04
|
|
|||
|
Total other debt
|
|
$73,190
|
|
1.14
|
%
|
|
$242,916
|
|
2.08
|
%
|
|
|
(1)
|
Average rate is weighted based on par value.
|
|
(2)
|
STACR and SCR debt notes are subject to prepayment risk as their payments are based upon the performance of a reference pool of mortgage assets that may be prepaid by the related mortgage borrower at any time generally without penalty and are therefore included as a separate category in the table.
|
Our outstanding other debt balance has continued to decline as we reduced our indebtedness along with the decline in our mortgage-related investments portfolio. As a result, our total issuances, payoffs and maturities of other debt, excluding securities sold under agreements to repurchase, decreased in 2018 compared to 2017. In addition, STACR debt should continue to decline as run off will primarily be replaced with STACR Trust transactions.
During 2018, we replaced a portion of called or matured medium-term and long-term debt with callable debt. Our callable debt provides us with the option to repay the outstanding principal balance of the debt prior to its contractual maturity date. As of December 31, 2018,
$71 billion
of the outstanding
$107 billion
of callable debt may be called within one year, not including callable debt due to contractually mature within one year.
|
FREDDIE MAC
| 2018 Form 10-K
|
151
|
|
|
Management's Discussion and Analysis
|
Liquidity and Capital Resources
|
Other Short-Term Debt
The tables below contain details on the characteristics of our other short-term debt.
Table 62 - Other Short-Term Debt
|
As of December 31, 2018
|
||||||||||||||||
|
Ending Balance
|
Yearly Average
|
|||||||||||||||
|
(Dollars in millions)
|
Carrying Value
|
Weighted Average Effective Rate
(1)
|
Carrying Value
|
Weighted Average Effective Rate
(1)
|
Maximum Carrying Value Outstanding at Any Month End
|
|||||||||||
|
Discount notes and Reference Bills
|
|
$28,621
|
|
2.36
|
%
|
|
$35,126
|
|
1.79
|
%
|
|
$46,892
|
|
|||
|
Medium-term notes
|
16,440
|
|
2.10
|
|
15,403
|
|
1.37
|
|
18,200
|
|
||||||
|
Securities sold under agreements to repurchase
|
6,019
|
|
2.40
|
|
9,411
|
|
1.79
|
|
11,719
|
|
||||||
|
Total
|
|
$51,080
|
|
2.28
|
%
|
|||||||||||
|
As of December 31, 2017
|
||||||||||||||||
|
Ending Balance
|
Yearly Average
|
|||||||||||||||
|
(Dollars in millions)
|
Carrying Value
|
Weighted Average Effective Rate
(1)
|
Carrying Value
|
Weighted Average Effective Rate
(1)
|
Maximum Carrying Value Outstanding at Any Month End
|
|||||||||||
|
Discount notes and Reference Bills
|
|
$45,596
|
|
1.19
|
%
|
|
$50,867
|
|
0.85
|
%
|
|
$60,967
|
|
|||
|
Medium-term notes
|
17,792
|
|
1.03
|
|
12,172
|
|
0.78
|
|
17,967
|
|
||||||
|
Securities sold under agreements to repurchase
|
9,681
|
|
1.06
|
|
8,092
|
|
0.65
|
|
11,491
|
|
||||||
|
Total
|
|
$73,069
|
|
1.14
|
%
|
|||||||||||
|
As of December 31, 2016
|
||||||||||||||||
|
Ending Balance
|
Yearly Average
|
|||||||||||||||
|
(Dollars in millions)
|
Carrying Value
|
Weighted Average Effective Rate
(1)
|
Carrying Value
|
Weighted Average Effective Rate
(1)
|
Maximum Carrying Value Outstanding at Any Month End
|
|||||||||||
|
Discount notes and Reference Bills
|
|
$60,976
|
|
0.47
|
%
|
|
$73,169
|
|
0.41
|
%
|
|
$96,767
|
|
|||
|
Medium-term notes
|
7,435
|
|
0.41
|
|
7,035
|
|
0.23
|
|
9,545
|
|
||||||
|
Securities sold under agreements to repurchase
|
3,040
|
|
0.42
|
|
3,112
|
|
0.10
|
|
8,294
|
|
||||||
|
Total
|
|
$71,451
|
|
0.47
|
%
|
|||||||||||
|
(1)
|
Average rate is weighted based on carrying value.
|
|
FREDDIE MAC
| 2018 Form 10-K
|
152
|
|
|
Management's Discussion and Analysis
|
Liquidity and Capital Resources
|
Maturity and Redemption Dates
The following graphs present our other debt by contractual maturity date and earliest redemption date. The earliest redemption date refers to the earliest call date for callable debt and the contractual maturity date for all other debt.

Earliest Redemption Date as of December 31, 2018
(1)

|
(1)
|
STACR and SCR debt notes are subject to prepayment risk as their payments are based upon the performance of a reference pool of mortgage assets that may be prepaid by the related mortgage borrower at any time generally without penalty and are therefore included as a separate category in the graphs.
|
Debt Securities of Consolidated Trusts
The largest component of debt on our consolidated balance sheets is debt securities of consolidated trusts, which relates to securitization transactions that we consolidated for accounting purposes. We issue this type of debt by securitizing mortgage loans primarily to fund the majority of our single-family guarantee activities. When we consolidate securitization trusts, we recognize the following on our consolidated balance sheets:
|
n
|
The assets held by the securitization trusts, the majority of which are mortgage loans. We recognized $1,842.9 billion and $1,774.3 billion of mortgage loans, which represented 89.3% and 86.6% of our total assets, as of December 31, 2018 and December 31, 2017, respectively.
|
|
n
|
The debt securities issued by the securitization trusts, the majority of which are PCs. PCs are pass-through securities, where the cash flows of the mortgage loans held by the securitization trust are passed through to the holders of the PCs. We recognized $1,792.7 billion and $1,721.0 billion of debt securities of consolidated trusts, which represented 87.7% and 84.6% of our total debt, as of December 31, 2018 and December 31, 2017, respectively.
|
|
FREDDIE MAC
| 2018 Form 10-K
|
153
|
|
|
Management's Discussion and Analysis
|
Liquidity and Capital Resources
|
Debt securities of consolidated trusts are principally repaid from the cash flows of the mortgage loans held by the securitization trusts that issued the debt securities. In circumstances when the cash flows of the mortgage loans are not sufficient to repay the debt, we make up the shortfall because we have guaranteed the payment of principal and interest on the debt. In certain circumstances, we have the right and/or obligation to purchase the loan from the trust prior to its contractual maturity.
The table below shows the issuance and extinguishment activity for the debt securities of our consolidated trusts.
Table 63 - Activity for Debt Securities of Consolidated Trusts Held by Third Parties
|
Year Ended December 31,
|
|||||||
|
(In millions)
|
2018
|
2017
|
|||||
|
Beginning balance
|
|
$1,672,605
|
|
|
$1,602,162
|
|
|
|
Issuances:
|
|||||||
|
New issuances to third parties
|
185,877
|
|
256,931
|
|
|||
|
Additional issuances of securities
|
190,207
|
|
150,651
|
|
|||
|
Total issuances
|
376,084
|
|
407,582
|
|
|||
|
Extinguishments:
|
|
|
|||||
|
Purchases of debt securities from third parties
|
(41,453
|
)
|
(42,797
|
)
|
|||
|
Debt securities received in settlement of secured lending
|
(25,220
|
)
|
(34,560
|
)
|
|||
|
Repayments of debt securities
|
(233,278
|
)
|
(259,782
|
)
|
|||
|
Total extinguishments
|
(299,951
|
)
|
(337,139
|
)
|
|||
|
Ending balance
|
1,748,738
|
|
1,672,605
|
|
|||
|
Unamortized premiums and discounts
|
43,939
|
|
48,391
|
|
|||
|
Debt securities of consolidated trusts held by third parties
|
|
$1,792,677
|
|
|
$1,720,996
|
|
|
Debt securities of our consolidated trusts represent our liability to third parties that hold beneficial interests on our consolidated securitization trusts. Our exposure on debt securities of consolidated trusts is limited to the guarantee we provide on the payment of principal and interest on these securities, as the primary source of repayment of these debt securities comes from the cash flows of the mortgage loans held by the trusts which back the securities. At
December 31, 2018
, our estimated exposure (including the amounts that are due to Freddie Mac for debt securities of consolidated trusts that we purchased) to these debt securities is recognized as the allowance for loan losses on mortgage loans held by consolidated trusts. See
Note 4
for details on our allowance for loan losses.
|
FREDDIE MAC
| 2018 Form 10-K
|
154
|
|
|
Management's Discussion and Analysis
|
Liquidity and Capital Resources
|
The table below provides information on the UPB of debt securities issued by our consolidated trusts.
Table 64 - Debt Securities of Consolidated Trusts Held by Third Parties
|
As of December 31,
|
|||||||
|
(In millions)
|
2018
|
2017
|
|||||
|
Single-family
|
|||||||
|
PCs:
|
|||||||
|
30-year or more amortizing fixed-rate
|
|
$1,434,879
|
|
|
$1,331,463
|
|
|
|
20-year amortizing fixed-rate
|
79,079
|
|
81,889
|
|
|||
|
15-year amortizing fixed-rate
|
253,245
|
|
274,561
|
|
|||
|
Adjustable-rate
|
45,051
|
|
52,870
|
|
|||
|
Interest-only
|
6,697
|
|
9,867
|
|
|||
|
FHA/VA and other governmental
|
1,939
|
|
2,157
|
|
|||
|
Total single-family PCs
|
1,820,890
|
|
1,752,807
|
|
|||
|
Other single-family
|
2,961
|
|
3,650
|
|
|||
|
Total single-family
|
1,823,851
|
|
1,756,457
|
|
|||
|
Total multifamily
|
7,220
|
|
5,747
|
|
|||
|
Total Freddie Mac mortgage-related securities
|
1,831,071
|
|
1,762,204
|
|
|||
|
Freddie Mac mortgage-related securities repurchased or retained at issuance
|
(82,333
|
)
|
(89,599
|
)
|
|||
|
Debt securities of consolidated trusts held by third parties
|
|
$1,748,738
|
|
|
$1,672,605
|
|
|
Credit Ratings
Our ability to access the capital markets and other sources of funding, as well as our cost of funds, may be affected by our credit ratings. The table below indicates our credit ratings as of February 1, 2019.
Table 65 - Freddie Mac Credit Ratings
|
Nationally Recognized Statistical Rating
Organization
|
|||
|
S&P
|
Moody's
|
||
|
Senior long-term debt
|
AA+
|
Aaa
|
|
|
Short-term debt
|
A-1+
|
P-1
|
|
|
Subordinated debt
|
AA-
|
Aa2
|
|
|
Preferred stock
(1)
|
D
|
Ca
|
|
|
Outlook
|
Stable
|
Stable
|
|
|
(1)
|
Does not include senior preferred stock issued to Treasury.
|
Our credit ratings and outlooks are primarily based on the support we receive from Treasury and, therefore, are affected by changes in the credit ratings and outlooks of the U.S. government.
A security rating is not a recommendation to buy, sell, or hold securities. It may be subject to revision or withdrawal at any time by the assigning rating organization. Each rating should be evaluated independently of any other rating.
|
FREDDIE MAC
| 2018 Form 10-K
|
155
|
|
|
Management's Discussion and Analysis
|
Liquidity and Capital Resources
|
Cash Flows
n
2018 vs. 2017
- Cash and cash equivalents (including restricted cash and cash equivalents) decreased by $2.5 billion from $9.8 billion as of December 31, 2017 to $7.3 billion as of December 31, 2018, primarily driven by fewer proceeds from debt issuances as we continued to reduce our indebtedness along with the decline in our mortgage-related investments portfolio. The decrease in cash and cash equivalents (including restricted cash and cash equivalents) was partially offset by a decrease in securities purchased under agreements to resell due to lower near-term cash needs for fewer upcoming maturities and anticipated calls of other debt.
n
2017 vs. 2016
- Cash and cash equivalents (including restricted cash and cash equivalents) decreased by $12.4 billion from $22.2 billion as of December 31, 2016 to $9.8 billion as of December 31, 2017, primarily driven by an increase in securities purchased under agreements to resell, as excess cash was invested in securities to earn a yield. The decrease in cash and cash equivalents (including restricted cash and cash equivalents) was partially offset by a decrease in net repayments of other debt, as we reduced our indebtedness along with the decline in our mortgage-related investments portfolio.
Capital Resources
Primary Sources of Capital
The following table lists the sources and balances of our capital as of December 31, 2018 and a brief description of their importance to Freddie Mac.
Table 66 - Sources of Capital
|
Source
|
Balance
(1)
(In billions)
|
Description
|
||||
|
Capital
|
||||||
|
•
|
Net Worth
|
|
$4.5
|
|
•
|
GAAP net worth represents capital available prior to our dividend requirement to Treasury under the Purchase Agreement.
|
|
•
|
Available Funding under Purchase Agreement
|
|
$140.2
|
|
•
|
FHFA may request that available funding under the Purchase Agreement be drawn on our behalf from Treasury.
|
|
(1)
|
Represents carrying value of net worth.
|
Our entry into conservatorship resulted in significant changes to the assessment of our capital adequacy and our management of capital. Under the Purchase Agreement, Treasury made a commitment to provide us with equity funding, under certain conditions, to eliminate deficits in our net worth. Obtaining equity funding from Treasury pursuant to its commitment under the Purchase Agreement enables us to avoid being placed into receivership by FHFA and to maintain the confidence of the debt markets as a very high-quality credit, upon which our business model is dependent.
At
December 31, 2018
, our assets exceeded our liabilities under GAAP; therefore, no draw is being requested from Treasury under the Purchase Agreement. Based on our Net Worth Amount of
$4.5 billion
as of
December 31, 2018
and the applicable Capital Reserve Amount of $3.0 billion, our dividend requirement to Treasury in March 2019 will be
$1.5 billion
. Under the Purchase Agreement, the payment of dividends does not reduce the outstanding liquidation preference on the senior preferred stock.
|
FREDDIE MAC
| 2018 Form 10-K
|
156
|
|
|
Management's Discussion and Analysis
|
Liquidity and Capital Resources
|
Upon the Conservator, acting as successor to the rights, titles, powers, and privileges of the Board of Directors, declaring a senior preferred stock dividend equal to our dividend requirement and directing us to pay it, we would pay a dividend of
$1.5 billion
by March 31, 2019. If for any reason we were not to pay our dividend requirement on the senior preferred stock in full, the unpaid amount would be added to the liquidation preference and our applicable Capital Reserve Amount would thereafter be zero, but this would not affect our ability to draw funds from Treasury under the Purchase Agreement. Our cumulative senior preferred stock dividend payments totaled $116.5 billion as of December 31, 2018.
The aggregate liquidation preference of the senior preferred stock owned by Treasury was
$75.6 billion
and the amount of available funding remaining under the Purchase Agreement was
$140.2 billion
as of December 31, 2018. To the extent we draw additional funds in the future, the aggregate liquidation preference will increase and the amount of available funding will decrease by the amount of those draws. See
Conservatorship and Related Matters
and
Regulation and Supervision
for more information.
In June 2016, FASB issued a new Accounting Standards Update (ASU 2016-13, Financial Instruments—Credit Losses) related to the measurement of credit losses on financial instruments that will be effective as of January 1, 2020, with early adoption permitted as of January 1, 2019. This Update replaces the incurred loss impairment methodology in current GAAP with a methodology that reflects lifetime expected credit losses. While we are still evaluating the effect that the adoption of this Update will have on our financial results, it will increase (perhaps substantially) our provision for credit losses in the period of adoption. This Update increases the risk that we will need to request a draw from Treasury for the period of adoption.
The table below presents activity related to our net worth.
Table 67 - Net Worth Activity
|
Year Ended December 31,
|
||||||||||
|
(In millions)
|
2018
|
2017
|
2016
|
|||||||
|
Beginning balance
|
|
($312
|
)
|
|
$5,075
|
|
|
$2,940
|
|
|
|
Comprehensive income (loss)
|
8,622
|
|
5,558
|
|
7,118
|
|
||||
|
Capital draws from Treasury
|
312
|
|
—
|
|
—
|
|
||||
|
Senior preferred stock dividends declared
|
(4,145
|
)
|
(10,945
|
)
|
(4,983
|
)
|
||||
|
Total equity / net worth
|
|
$4,477
|
|
|
($312
|
)
|
|
$5,075
|
|
|
|
Aggregate draws under Purchase Agreement
|
|
$71,648
|
|
|
$71,336
|
|
|
$71,336
|
|
|
|
Aggregate cash dividends paid to Treasury
|
116,538
|
|
112,393
|
|
101,448
|
|
||||
Conservatorship Capital Framework
In May 2017, FHFA, as Conservator, issued guidance to us to evaluate and manage our financial risk and to make economic business decisions, while in conservatorship, utilizing a newly-developed risk-based CCF, an economic capital system with detailed formulae provided by FHFA. The CCF also provides the foundation for the risk-based component of the proposed Enterprise Capital Rule published by FHFA in the Federal Register in July 2018.
The CCF is used to establish the modeled capital needed to evaluate business decisions and ensure the company makes such decisions prudently when pricing transactions and managing its businesses. This framework focuses on the profits earned versus an estimated cost of equity capital needed to support
|
FREDDIE MAC
| 2018 Form 10-K
|
157
|
|
|
Management's Discussion and Analysis
|
Liquidity and Capital Resources
|
the risk assumed to generate those profits. Management relies upon this framework in its decision-making.
The existing regulatory capital requirements have been suspended by FHFA during conservatorship. Consequently, we refer to the capital needed under the CCF for analysis of transactions and businesses as "conservatorship capital."
Under the Purchase Agreement, we are not able to permanently retain total equity, as calculated under GAAP, in excess of the $3.0 billion Capital Reserve Amount. As a result, we do not have capital sufficient to support our aggregate risk-taking activities. Instead, we rely upon the Purchase Agreement to maintain market confidence.
Return on Conservatorship Capital
The table below provides the ROCC, calculated as (1) annualized comprehensive income for the period divided by (2) average conservatorship capital during the period. Each quarter, we consider whether certain "significant items" occurred that should be excluded from comprehensive income and our calculation of ROCC. If we have identified significant items in any of the periods presented, we also include comprehensive income excluding significant items as well as an adjusted ROCC based on comprehensive income excluding significant items, both non-GAAP measures. We believe that these non-GAAP financial measures are useful to investors as they better reflect our on-going financial results.
All conservatorship capital figures presented below are based on the CCF as of December 31, 2018. The CCF has been and may be further revised by FHFA from time to time, and may be revised specifically in connection with FHFA's consideration and adoption of a final Enterprise Capital Rule, which could possibly result in material changes in our conservatorship capital. For example, beginning in 4Q 2018, our conservatorship capital includes capital for deferred tax assets. Prior period conservatorship capital results have been revised to conform to the current period presentation.
|
FREDDIE MAC
| 2018 Form 10-K
|
158
|
|
|
Management's Discussion and Analysis
|
Liquidity and Capital Resources
|
The ROCC shown in the table below is not based on our total equity and does not reflect actual returns on total equity. We do not believe that returns on total equity are meaningful because of the current $3.0 billion limitation on the amount of total equity that we are able to permanently retain under the Purchase Agreement.
Table 68 - Returns on Conservatorship Capital
|
Year Ended December 31,
|
|||
|
(Dollars in billions)
|
2018
|
2017
|
|
|
GAAP comprehensive income
|
$8.6
|
$5.6
|
|
|
Significant items:
|
|||
|
Non-agency mortgage-related securities settlement and judgment
(1) (2)
|
(0.3)
|
(4.5)
|
|
|
Tax effect related to settlement and judgment
(1) (2)
|
0.1
|
1.6
|
|
|
Write-down of net deferred tax asset
|
—
|
5.4
|
|
|
Total significant items
|
(0.2)
|
2.5
|
|
|
Comprehensive income, excluding significant items
|
$8.4
|
$8.1
|
|
|
Conservatorship capital (average during the period)
(3)
|
$56.6
|
$67.6
|
|
|
ROCC, based on GAAP comprehensive income
(3)
|
15.2%
|
8.2%
|
|
|
Adjusted ROCC, based on comprehensive income excluding significant items
(3)
|
14.8%
|
11.9%
|
|
|
(1)
|
2017 GAAP comprehensive income included settlement proceeds of $4,525 million (pre-tax) from RBS related to litigation involving certain of our non-agency mortgage-related securities. The tax effect related to this settlement was ($1,584) million.
|
|
(2)
|
2018 GAAP comprehensive income included a benefit of $334 million (pre-tax) from a final judgment against Nomura Holding America, Inc. in litigation involving certain of our non-agency mortgage-related securities. The tax effect related to this judgment was ($70) million.
|
|
(3)
|
Prior period conservatorship capital results have been revised to include capital for deferred tax assets.
|
Our 2018 ROCC, based on GAAP comprehensive income, increased compared to the 2017 return, partially driven by the increase in GAAP comprehensive income in 2018. The increase in comprehensive income primarily reflected the two significant items in 2017 in the table above. In addition, both 2018 ROCC and 2018 Adjusted ROCC increased compared to our 2017 returns due to the lower level of conservatorship capital needed in 2018, resulting from home price appreciation, the efficient disposition of legacy assets, and the increasing credit risk transfer activity in both our Single-family Guarantee and Multifamily segments.
Our three business segments have different capital requirements, returns, and profitability. The ROCC for our Single-family Guarantee segment, which has FHFA-prescribed guidance on guarantee fee levels, is generally lower than the company's overall return, while the returns in our Multifamily and Capital Markets segments are generally higher.
We find the returns calculated above, as well as the returns calculated on specific transactions and individual business lines, to be a reasonable measure of return-versus-risk to support our decision-making while we remain in conservatorship. These returns may not be indicative of the returns that would be generated if we were to exit conservatorship, especially as the terms and timing of any such exit are not currently known and will depend upon future actions by the U.S. government. Our belief, should we leave conservatorship, is that returns at that time would most likely be below the levels calculated above, assuming the same portfolio of risk assets, as we expect that we would hold capital
|
FREDDIE MAC
| 2018 Form 10-K
|
159
|
|
|
Management's Discussion and Analysis
|
Liquidity and Capital Resources
|
post-conservatorship above the minimum required regulatory capital. It is also likely that we would be required to pay fees for federal government support, thereby reducing our total comprehensive income.
|
FREDDIE MAC
| 2018 Form 10-K
|
160
|
|
|
Management's Discussion and Analysis
|
Conservatorship and Related Matters
|
CONSERVATORSHIP AND RELATED MATTERS
Supervision of Our Company During Conservatorship
FHFA has broad powers when acting as our Conservator. Upon its appointment, the Conservator immediately succeeded to all rights, titles, powers, and privileges of Freddie Mac and of any stockholder, officer, or director of Freddie Mac with respect to Freddie Mac and its assets. The Conservator also succeeded to the title to all books, records, and assets of Freddie Mac held by any other legal custodian or third party.
Under the GSE Act, the Conservator may take any actions it determines are necessary to put us in a safe and solvent condition and appropriate to carry on our business and preserve and conserve our assets and property. The Conservator's powers include the ability to transfer or sell any of our assets or liabilities, subject to certain limitations and post-transfer notice provisions, without any approval, assignment of rights or consent of any party. However, the GSE Act provides that loans and mortgage-related assets that have been transferred to a Freddie Mac securitization trust must be held by the Conservator for the beneficial owners of the trust and cannot be used to satisfy our general creditors.
We conduct our business subject to the direction of FHFA as our Conservator. The Conservator has provided authority to the Board of Directors to oversee management's conduct of our business operations so we can operate in the ordinary course. The directors serve on behalf of, exercise authority as provided by, and owe their fiduciary duties of care and loyalty to the Conservator. The Conservator retains the authority to withdraw or revise the authority it has provided at any time. The Conservator also retains certain significant authorities for itself, and has not provided them to the Board. The Conservator continues to provide strategic direction for the company and directs the efforts of the Board and management to implement its strategy. Many management decisions are subject to review and/or approval by FHFA and management frequently receives direction from FHFA on various matters involving day-to-day operations.
Our current business objectives reflect direction we have received from the Conservator including the Conservatorship Scorecards. At the direction of the Conservator, we have made changes to certain business practices that are designed to provide support for the mortgage market in a manner that serves our public mission and other non-financial objectives. Given our public mission and the important role our Conservator has placed on Freddie Mac in addressing housing and mortgage market conditions, we sometimes take actions that could have a negative impact on our business, operating results or financial condition, and could thus contribute to a need for additional draws under the Purchase Agreement. Certain of these actions are intended to help homeowners and the mortgage market.
|
FREDDIE MAC
| 2018 Form 10-K
|
161
|
|
|
Management's Discussion and Analysis
|
Conservatorship and Related Matters
|
Purchase Agreement, Warrant, and Senior Preferred Stock
In connection with our entry into conservatorship, we entered into the Purchase Agreement with Treasury. Under the Purchase Agreement, we issued to Treasury both senior preferred stock and a warrant to purchase common stock. The Purchase Agreement, the warrant, and the senior preferred stock do not contain any provisions causing them to terminate or cease to exist upon the termination of conservatorship. The conservatorship, the Purchase Agreement, the warrant, and the senior preferred stock materially limit the rights of our common and preferred stockholders (other than Treasury).
Pursuant to the Purchase Agreement, which we entered into through FHFA, in its capacity as Conservator, on September 7, 2008, we issued to Treasury one million shares of Variable Liquidation Preference Senior Preferred Stock with an initial liquidation preference of $1 billion and a warrant to purchase, for a nominal price, shares of our common stock equal to 79.9% of the total number of shares outstanding. The senior preferred stock and warrant were issued to Treasury as an initial commitment fee in consideration of Treasury's commitment to provide funding to us under the Purchase Agreement. We did not receive any cash proceeds from Treasury as a result of issuing the senior preferred stock or the warrant. Under the Purchase Agreement, our ability to repay the liquidation preference of the senior preferred stock is limited and we will not be able to do so for the foreseeable future, if at all.
The Purchase Agreement provides that, on a quarterly basis, we generally may draw funds up to the amount, if any, by which our total liabilities exceed our total assets, as reflected on our GAAP consolidated balance sheet for the applicable fiscal quarter, provided that the aggregate amount funded under the Purchase Agreement may not exceed Treasury's commitment. The amount of any draw will be added to the aggregate liquidation preference of the senior preferred stock and will reduce the amount of available funding remaining. Deficits in our net worth have made it necessary for us to make substantial draws on Treasury's funding commitment under the Purchase Agreement. In addition, the Letter Agreement increased the aggregate liquidation preference of the senior preferred stock by $3.0 billion on December 31, 2017. As of
December 31, 2018
, the aggregate liquidation preference of the senior preferred stock was $75.6 billion, and the amount of available funding remaining under the Purchase Agreement was $140.2 billion.
Treasury, as the holder of the senior preferred stock, is entitled to receive cumulative quarterly cash dividends, when, as, and if declared by our Board of Directors. The dividends we have paid to Treasury on the senior preferred stock have been declared by, and paid at the direction of, the Conservator, acting as successor to the rights, titles, powers, and privileges of the Board. Under the August 2012 amendment to the Purchase Agreement, our cash dividend requirement each quarter is the amount, if any, by which our Net Worth Amount at the end of the immediately preceding fiscal quarter, less the applicable Capital Reserve Amount, exceeds zero. Under the Letter Agreement, the dividend for the dividend period from October 1, 2017 through and including December 31, 2017 was reduced to $2.25 billion. The applicable Capital Reserve Amount from January 1, 2018 and thereafter is $3.0 billion. As a result of the net worth sweep dividend, our future profits in excess of the applicable Capital Reserve Amount will be distributed to Treasury, and the holders of our common stock and non-senior preferred stock will not receive benefits that could otherwise flow from such future profits. If for any reason we were not to pay the amount of our dividend requirement on the senior preferred stock in full, the unpaid amount would be added to the liquidation preference and our applicable Capital Reserve Amount would
|
FREDDIE MAC
| 2018 Form 10-K
|
162
|
|
|
Management's Discussion and Analysis
|
Conservatorship and Related Matters
|
thereafter be zero, but this would not affect our ability to draw funds from Treasury under the Purchase Agreement.
The senior preferred stock is senior to our common stock and all other outstanding series of our preferred stock, as well as any capital stock we issue in the future, as to both dividends and rights upon liquidation. We are not permitted to redeem the senior preferred stock prior to the termination of Treasury's funding commitment under the Purchase Agreement.
The Purchase Agreement and warrant contain covenants that significantly restrict our business and capital activities. For example, the Purchase Agreement provides that, until the senior preferred stock is repaid or redeemed in full, we may not, without the prior written consent of Treasury:
|
n
|
Pay dividends on our equity securities, other than the senior preferred stock or warrant, or repurchase our equity securities;
|
|
n
|
Issue any additional equity securities, except in limited instances;
|
|
n
|
Sell, transfer, lease, or otherwise dispose of any assets, other than dispositions for fair market value in the ordinary course of business, consistent with past practices, and in other limited circumstances; and
|
|
n
|
Issue any subordinated debt.
|
Limits on Our Mortgage-Related Investments Portfolio and Indebtedness
Our ability to acquire and sell mortgage assets is significantly constrained by limitations under the Purchase Agreement and other limitations imposed by FHFA:
|
n
|
Under the Purchase Agreement and FHFA regulation, the UPB of our mortgage-related investments portfolio is subject to a cap that reached $250 billion at December 31, 2018.
|
|
n
|
Under the Purchase Agreement, we may not incur indebtedness that would result in the par value of our aggregate indebtedness exceeding 120% of the amount of mortgage assets we are permitted to own on December 31 of the immediately preceding calendar year. Our debt cap under the Purchase Agreement was $346.1 billion in 2018 and declined to $300.0 billion on January 1, 2019. As of December 31, 2018, our aggregate indebtedness for purposes of the debt cap was $255.7 billion.
|
|
n
|
Since 2014, we have been managing the mortgage-related investments portfolio so that it does not exceed 90% of the cap established by the Purchase Agreement. In February 2019, FHFA directed us to maintain the mortgage-related investments portfolio at or below $225 billion at all times.
|
|
n
|
FHFA has indicated that any portfolio sales should be commercially reasonable transactions that consider impacts to the market, borrowers, and neighborhood stability.
|
Our decisions with respect to managing the mortgage-related investments portfolio affect all three business segments. In order to achieve all of our portfolio goals, it is possible that we may forgo economic opportunities in one business segment in order to pursue opportunities in another business segment.
Our results against the limits imposed on our mortgage-related investments portfolio and aggregate indebtedness for the year ended December 31, 2018 are shown below.
|
FREDDIE MAC
| 2018 Form 10-K
|
163
|
|
|
Management's Discussion and Analysis
|
Conservatorship and Related Matters
|
Mortgage Assets

Indebtedness

Managing Our Mortgage-Related Investments Portfolio Over Time
Our mortgage-related investments portfolio includes assets held by all three business segments and consists of:
|
n
|
Agency securities, which include both single-family and multifamily Freddie Mac mortgage-related securities and non-Freddie Mac agency mortgage-related securities;
|
|
n
|
Non-agency mortgage-related securities, which include single-family non-agency mortgage-related securities, CMBS, housing revenue bonds, and other multifamily securities; and
|
|
n
|
Single-family and multifamily unsecuritized loans.
|
|
FREDDIE MAC
| 2018 Form 10-K
|
164
|
|
|
Management's Discussion and Analysis
|
Conservatorship and Related Matters
|
We evaluate the liquidity of the assets in our mortgage-related investments portfolio based on three categories (in order of liquidity):
|
n
|
Liquid
-
single-class and multi-class agency securities, excluding certain structured agency securities collateralized by non-agency mortgage-related securities;
|
|
n
|
Securitization Pipeline
-
primarily includes performing multifamily and single-family loans purchased for cash and primarily held for a short period until securitized, with the resulting Freddie Mac issued securities being sold or retained; and
|
|
n
|
Less Liquid
-
assets that are less liquid than both agency securities and loans in the securitization pipeline (e.g., reperforming loans, single-family seriously delinquent loans, and non-agency mortgage-related securities).
|
Freddie Mac mortgage-related securities include mortgage-related securities issued or guaranteed by Freddie Mac. In prior periods, certain of these securities that were issued by third-party trusts but guaranteed by Freddie Mac were classified as non-agency mortgage-related securities. Prior periods have been revised to conform to the current period presentation.
The table below presents the UPB of our mortgage-related investments portfolio, for purposes of the limit imposed by the Purchase Agreement and FHFA regulation. The Purchase Agreement cap for this portfolio decreased to $250 billion at December 31, 2018.
|
FREDDIE MAC
| 2018 Form 10-K
|
165
|
|
|
Management's Discussion and Analysis
|
Conservatorship and Related Matters
|
Table 69 - Mortgage-Related Investments Portfolio Details
|
As of December 31, 2018
|
As of December 31, 2017
|
|||||||||||||||||||||||||
|
(Dollars in millions)
|
Liquid
|
Securitiz-ation Pipeline
|
Less Liquid
|
Total
|
Liquid
|
Securitiz-ation Pipeline
|
Less Liquid
|
Total
|
||||||||||||||||||
|
Capital Markets segment - Mortgage investments portfolio
|
||||||||||||||||||||||||||
|
Single-family unsecuritized loans
|
|
|
||||||||||||||||||||||||
|
Performing loans
|
|
$—
|
|
|
$8,955
|
|
|
$—
|
|
|
$8,955
|
|
|
$—
|
|
|
$9,999
|
|
|
$—
|
|
|
$9,999
|
|
||
|
Reperforming loans
|
—
|
|
—
|
|
39,402
|
|
39,402
|
|
—
|
|
—
|
|
46,666
|
|
46,666
|
|
||||||||||
|
Total single-family unsecuritized loans
|
—
|
|
8,955
|
|
39,402
|
|
48,357
|
|
|
—
|
|
9,999
|
|
46,666
|
|
56,665
|
|
|||||||||
|
Freddie Mac mortgage-related securities
|
109,880
|
|
—
|
|
3,108
|
|
112,988
|
|
124,654
|
|
—
|
|
3,817
|
|
128,471
|
|
||||||||||
|
Non-agency mortgage-related securities
|
—
|
|
—
|
|
2,122
|
|
2,122
|
|
—
|
|
—
|
|
5,152
|
|
5,152
|
|
||||||||||
|
Other Non-Freddie Mac agency mortgage-related securities
|
3,968
|
|
—
|
|
—
|
|
3,968
|
|
5,211
|
|
—
|
|
—
|
|
5,211
|
|
||||||||||
|
Total Capital Markets segment - Mortgage investments portfolio
|
113,848
|
|
8,955
|
|
44,632
|
|
167,435
|
|
129,865
|
|
9,999
|
|
55,635
|
|
195,499
|
|
||||||||||
|
Single-family Guarantee segment - Single-family unsecuritized seriously delinquent loans
|
—
|
|
—
|
|
8,473
|
|
8,473
|
|
—
|
|
—
|
|
12,267
|
|
12,267
|
|
||||||||||
|
Multifamily segment
|
||||||||||||||||||||||||||
|
Unsecuritized mortgage loans
|
—
|
|
23,203
|
|
11,584
|
|
34,787
|
|
—
|
|
19,653
|
|
18,585
|
|
38,238
|
|
||||||||||
|
Mortgage-related securities
|
6,570
|
|
—
|
|
815
|
|
7,385
|
|
6,181
|
|
—
|
|
1,270
|
|
7,451
|
|
||||||||||
|
Total Multifamily segment
|
6,570
|
|
23,203
|
|
12,399
|
|
42,172
|
|
|
6,181
|
|
19,653
|
|
19,855
|
|
45,689
|
|
|||||||||
|
Total mortgage-related investments portfolio
|
|
$120,418
|
|
|
$32,158
|
|
|
$65,504
|
|
|
$218,080
|
|
|
$136,046
|
|
|
$29,652
|
|
|
$87,757
|
|
|
$253,455
|
|
||
|
Percentage of total mortgage-related investments portfolio
|
55
|
%
|
15
|
%
|
30
|
%
|
100
|
%
|
54
|
%
|
12
|
%
|
34
|
%
|
100
|
%
|
||||||||||
|
Mortgage-related investments portfolio cap at December 31, 2018 and December 31, 2017
|
|
$250,000
|
|
|
$288,408
|
|
||||||||||||||||||||
|
90% of mortgage-related investments portfolio cap at December 31, 2018 and December 31, 2017
|
|
$225,000
|
|
|
$259,567
|
|
||||||||||||||||||||
We are particularly focused on reducing, in an economically sensible manner, the balance of the less liquid assets that we hold in our mortgage-related investments portfolio. Our efforts to reduce our holdings of these assets help satisfy several objectives, including to improve the overall liquidity of our mortgage-related investments portfolio and comply with the mortgage-related investments portfolio limits. The decline in our holdings of less liquid assets, which included repayments and active dispositions, accounted for the majority of the decline in our mortgage-related investments portfolio during
2018
. Our active dispositions of less liquid assets included the following:
|
n
|
Sales of $
12.8 billion
of less liquid assets, including $
2.6 billion
in UPB of single-family non-agency mortgage-related securities, $
0.7 billion
in UPB of seriously delinquent unsecuritized single-family loans, and $
9.5 billion
in UPB of single-family reperforming loans;
|
|
n
|
Securitizations of $
1.7 billion
in UPB of less liquid multifamily loans;
|
|
n
|
Transfers of $
1.8 billion
in UPB of less liquid multifamily loans to the securitization pipeline; and
|
|
n
|
Securitization of $
1.6 billion
in UPB of single-family reperforming loans into Freddie Mac PCs, thereby enhancing their liquidity.
|
|
FREDDIE MAC
| 2018 Form 10-K
|
166
|
|
|
Management's Discussion and Analysis
|
Conservatorship and Related Matters
|
FHFA's Strategic Plan and Scorecards for Freddie Mac and Fannie Mae Conservatorships
In May 2014, FHFA issued its 2014 Strategic Plan. The 2014 Strategic Plan updated FHFA's vision for implementing its obligations as Conservator of Freddie Mac and Fannie Mae.
The 2014 Strategic Plan established three reformulated strategic goals for the conservatorships of Freddie Mac and Fannie Mae:
|
n
|
Maintain
, in a safe and sound manner, foreclosure prevention activities and credit availability for new and refinanced loans to foster liquid, efficient, competitive, and resilient national housing finance markets.
|
|
n
|
Reduce
taxpayer risk through increasing the role of private capital in the mortgage market.
|
|
n
|
Build
a new single-family securitization infrastructure for use by Freddie Mac and Fannie Mae and adaptable for use by other participants in the secondary market in the future.
|
FHFA has also published annual Conservatorship Scorecards for Freddie Mac and Fannie Mae, which establish annual objectives as well as performance targets and measures related to the strategic goals set forth in the 2014 Strategic Plan. FHFA issued the 2018 and 2019 Conservatorship Scorecards in December 2017 and December 2018, respectively. We continue to align our resources and internal business plans to meet the goals and objectives provided by FHFA.
For information about the 2018 Conservatorship Scorecard, and our performance with respect to it, see
Executive Compensation - Compensation Discussion and Analysis
. For information about the 2019 Conservatorship Scorecard, see our current report on Form 8-K filed on December 20, 2018.
For more information on the conservatorship and related matters, see
Regulation and Supervision
,
Risk Factors - Conservatorship and Related Matters, Note 2, Note 11
and
Directors, Corporate Governance, and Executive Officers -
Authority of the Board and Board Committees
.
|
FREDDIE MAC
| 2018 Form 10-K
|
167
|
|
|
Management's Discussion and Analysis
|
Regulation and Supervision
|
REGULATION AND SUPERVISION
In addition to our oversight by FHFA as our Conservator, we are subject to regulation and oversight by FHFA under our Charter and the GSE Act and to certain regulation by other government agencies. Furthermore, regulatory activities by other government agencies can affect us indirectly, even if we are not directly subject to such agencies' regulation or oversight. For example, regulations that modify requirements applicable to the purchase or servicing of mortgages can affect us.
Federal Housing Finance Agency
FHFA is an independent agency of the federal government responsible for oversight of the operations of Freddie Mac, Fannie Mae, and the FHLBs.
Under the GSE Act, FHFA has safety and soundness authority that is comparable to, and in some respects broader than, that of the federal banking agencies. FHFA is responsible for implementing the various provisions of the GSE Act that were added by the Reform Act.
Receivership
Under the GSE Act, FHFA must place us into receivership if FHFA determines in writing that our assets are less than our obligations for a period of 60 days. FHFA notified us that the measurement period for any mandatory receivership determination with respect to our assets and obligations would commence no earlier than the SEC public filing deadline for our quarterly or annual financial statements and would continue for 60 calendar days after that date. FHFA also advised us that, if, during that 60-day period, we receive funds from Treasury in an amount at least equal to the deficiency amount under the Purchase Agreement, the Director of FHFA will not make a mandatory receivership determination. In addition, we could be put into receivership at the discretion of the Director of FHFA at any time for other reasons set forth in the GSE Act.
Certain aspects of conservatorship and receivership operations of Freddie Mac, Fannie Mae, and the FHLBs are addressed in an FHFA rule. Among other provisions, the rule indicates that FHFA generally will not permit payment of securities litigation claims during conservatorship and that claims by current or former shareholders arising as a result of their status as shareholders would receive the lowest priority of claim in receivership. In addition, the rule indicates that administrative expenses of the conservatorship will also be deemed to be administrative expenses of receivership and that capital distributions may not be made during conservatorship, except as specified in the rule.
Capital Standards
FHFA suspended capital classification of us during conservatorship in light of the Purchase Agreement. The existing statutory and FHFA regulatory capital requirements are not binding during the conservatorship. These capital standards are described in
Note 17
. Under the GSE Act, FHFA has the authority to increase our minimum capital levels temporarily or to establish additional capital and reserve requirements for particular purposes.
Pursuant to an FHFA rule, FHFA-regulated entities are required to conduct annual stress tests to determine whether such companies have sufficient capital to absorb losses as a result of adverse economic conditions. Under the rule, Freddie Mac is required to conduct annual stress tests using
|
FREDDIE MAC
| 2018 Form 10-K
|
168
|
|
|
Management's Discussion and Analysis
|
Regulation and Supervision
|
scenarios specified by FHFA that reflect a minimum of three sets of economic and financial conditions and publicly disclose the results of the stress test under the "severely adverse" scenario. In August 2018, we disclosed the results of our most recent "severely adverse" scenario stress test which projected an improvement in the amount of available funding remaining under the Purchase Agreement compared to the test results disclosed in August 2017.
New Products
The GSE Act requires Freddie Mac and Fannie Mae to obtain the approval of FHFA before initially offering any product (as defined in the statute), subject to certain exceptions. The GSE Act also requires us to provide FHFA with written notice of any new activity that we consider not to be a product. While FHFA published an interim final rule on prior approval of new products, it stated that permitting us to engage in new products is inconsistent with the goals of conservatorship and instructed us not to submit such requests under the interim final rule.
Affordable Housing Goals
We are subject to annual affordable housing goals. We view the purchase of loans that are eligible to count toward our affordable housing goals to be a principal part of our mission and business, and we are committed to facilitating the financing of affordable housing for very low-, low-, and moderate-income families. In light of the affordable housing goals, we may make adjustments to our strategies for purchasing loans, which could potentially increase our credit losses. These strategies could include entering into purchase and securitization transactions with lower expected economic returns than our typical transactions. In February 2010, FHFA stated that it does not intend for us to undertake uneconomic or high-risk activities in support of the housing goals nor does it intend for the state of conservatorship to be a justification for withdrawing our support from these market segments.
If the Director of FHFA finds that we failed (or there is a substantial probability that we will fail) to meet a housing goal and that achievement of the housing goal was or is feasible, the Director may require the submission of a housing plan that describes the actions we will take to achieve the unmet goal. FHFA has the authority to take actions against us if we fail to submit a required housing plan, submit an unacceptable plan, fail to comply with a plan approved by FHFA, or fail to submit certain mortgage purchase data, information or reports as required by law. See
Risk Factors - Legal And Regulatory Risks -
We may make certain changes to our business in an attempt to meet our housing goals and duty to serve requirements, which may adversely affect our profitability
.
2017 Affordable Housing Goals and Housing Plan
In December 2018, FHFA informed us that, for 2017, we achieved three of our five single-family housing goals and all three of our multifamily goals. We may achieve a single-family housing goal by meeting or exceeding either:
|
n
|
the FHFA benchmark for the goal (Goals) or
|
|
n
|
the actual share of the market that meets the criteria for that goal (Market Level).
|
|
FREDDIE MAC
| 2018 Form 10-K
|
169
|
|
|
Management's Discussion and Analysis
|
Regulation and Supervision
|
Due to our failure to meet two of the five single-family housing goals for 2014 and 2015, we operated under an FHFA-required housing plan through 2018. Although FHFA determined that we did not meet two of our single-family housing goals in 2017 and that achievement of those goals was feasible, FHFA did not require us to extend our housing plan beyond 2018. FHFA will continue to closely monitor and evaluate our housing goals performance in 2018 and 2019. Our performance compared to our goals, as determined by FHFA for 2017 and 2016, is set forth below.
Table 70 - 2017 and 2016 Affordable Housing Goals Results
|
2017
|
2016
|
|||||||||||||
|
Affordable Housing Goals
|
Goals
|
Market Level
|
Results
|
Goals
|
Market Level
|
Results
|
||||||||
|
Single-family purchase money goals (benchmark levels):
|
||||||||||||||
|
Low-income
|
24
|
%
|
24.3
|
%
|
23.2
|
%
|
24
|
%
|
22.9
|
%
|
23.8
|
%
|
||
|
Very low-income
|
6
|
%
|
5.9
|
%
|
5.7
|
%
|
6
|
%
|
5.4
|
%
|
5.7
|
%
|
||
|
Low-income areas
|
18
|
%
|
21.5
|
%
|
20.9
|
%
|
17
|
%
|
19.7
|
%
|
19.9
|
%
|
||
|
Low-income areas subgoal
|
14
|
%
|
17.1
|
%
|
16.4
|
%
|
14
|
%
|
15.9
|
%
|
15.6
|
%
|
||
|
Single-family refinance low-income goal (benchmark level)
|
21
|
%
|
25.4
|
%
|
24.8
|
%
|
21
|
%
|
19.8
|
%
|
21.0
|
%
|
||
|
Multifamily low-income goal (In units)
|
300,000
|
|
N/A
|
|
408,096
|
|
300,000
|
|
N/A
|
|
406,958
|
|
||
|
Multifamily very low-income subgoal (In units)
|
60,000
|
|
N/A
|
|
92,274
|
|
60,000
|
|
N/A
|
|
73,030
|
|
||
|
Multifamily small property low-income subgoal (In units)
|
10,000
|
|
N/A
|
|
39,473
|
|
8,000
|
|
N/A
|
|
22,101
|
|
||
2018-2020 Affordable Housing Goals
Current FHFA housing goals applicable to our purchases consist of four goals and one subgoal for single-family owner-occupied housing, one multifamily affordable housing goal, and two multifamily affordable housing subgoals. Single-family goals are expressed as a percentage of the total number of eligible loans underlying our total single-family loan purchases, while the multifamily goals are expressed in terms of minimum numbers of units financed.
Three of the single-family housing goals and the subgoal target purchase money loans for low-income families, very low-income families, and/or families that reside in low-income areas. The single-family housing goals also include one goal that targets refinancing loans for low-income families. The multifamily affordable housing goal targets multifamily rental housing affordable to low-income families. The multifamily affordable housing subgoals target multifamily rental housing affordable to very low-income families and small (5- to 50-unit) multifamily properties affordable to low-income families.
The single-family goals are measured by comparing our performance with the actual share of the market that meets the criteria for each goal and a benchmark level established by FHFA, for that particular year. If our performance on a single-family goal falls short of the benchmark, we still could achieve the goal if our performance meets or exceeds the actual share of the market that meets the criteria for the goal for that year.
Our goals for 2018 through 2020 are set forth below.
|
FREDDIE MAC
| 2018 Form 10-K
|
170
|
|
|
Management's Discussion and Analysis
|
Regulation and Supervision
|
Table 71 - 2018-2020 Affordable Housing Goals
|
2018
|
2019 - 2020
|
||||
|
Single-family purchase money goals (Benchmark levels):
|
|||||
|
Low-income
|
24
|
%
|
24
|
%
|
|
|
Very low-income
|
6
|
%
|
6
|
%
|
|
|
Low-income areas
|
18
|
%
|
TBD
|
|
|
|
Low-income areas subgoal
|
14
|
%
|
14
|
%
|
|
|
Single-family refinance low-income goal (Benchmark level)
|
21
|
%
|
21
|
%
|
|
|
Multifamily low-income goal (In units)
|
315,000
|
|
315,000
|
|
|
|
Multifamily very low-income subgoal (In units)
|
60,000
|
|
60,000
|
|
|
|
Multifamily small property low-income subgoal (In units)
|
10,000
|
|
10,000
|
|
|
We expect to report our performance with respect to the 2018 affordable housing goals in March 2019. At this time, based on preliminary information, we believe we met all five of our single-family goals and our three multifamily goals for 2018. FHFA may not make a final determination on our 2018 performance until the release of market data in late 2019.
Duty to Serve Underserved Markets Plan
The GSE Act establishes a duty for Freddie Mac and Fannie Mae to serve three underserved markets (manufactured housing, affordable housing preservation, and rural areas) by providing leadership in developing loan products and flexible underwriting guidelines to facilitate a secondary market for mortgages for very low-, low-, and moderate-income families in those markets.
In December 2017, FHFA released Freddie Mac's underserved markets plan for 2018-2020. The plan became effective January 1, 2018. On December 19, 2018, FHFA published Freddie Mac's modified underserved markets plan for 2018-2020. FHFA will evaluate Freddie Mac's performance under the plan after receiving the company's annual report containing information on all activities and objectives undertaken during the year.
Affordable Housing Fund Allocations
The GSE Act requires us to set aside in each fiscal year an amount equal to 4.2 basis points of each dollar of total new business purchases, and pay such amount to certain housing funds. FHFA suspended this requirement when we were placed into conservatorship. However, in December 2014, FHFA terminated the suspension and instructed us to begin setting aside and paying amounts into those funds, subject to any subsequent guidance or instruction from FHFA.
During 2018, we completed
$385.2 billion
of new business purchases subject to this requirement and accrued
$161.7 million
of related expense, of which
$105.1 million
is related to the Housing Trust Fund administered by HUD and
$56.6 million
is related to the Capital Magnet Fund administered by Treasury. We are prohibited from passing through the costs of these allocations to the originators of the loans that we purchase.
|
FREDDIE MAC
| 2018 Form 10-K
|
171
|
|
|
Management's Discussion and Analysis
|
Regulation and Supervision
|
Portfolio Activities
The GSE Act provides FHFA with the power to regulate the size and content of our mortgage-related investments portfolio. The GSE Act requires FHFA to establish, by regulation, criteria governing portfolio holdings to ensure the holdings are backed by sufficient capital and consistent with our mission and safe and sound operations. FHFA adopted the portfolio holdings criteria established in the Purchase Agreement, as it may be amended from time to time, for so long as we remain subject to the Purchase Agreement. See
Conservatorship and Related Matters -
Limits on Our Mortgage-Related Investments Portfolio and Indebtedness
for more information.
Subordinated Debt
FHFA directed us to continue to make interest and principal payments on our subordinated debt, even if we fail to maintain required capital levels. As a result, the terms of any of our subordinated debt that provide for us to defer payments of interest under certain circumstances, including our failure to maintain specified capital levels, are no longer applicable.
Under the Purchase Agreement, we may not issue subordinated debt without Treasury's consent. During
2018
and 2017, we did not call, repurchase, or issue any Freddie SUBS® securities. The last outstanding issue of Freddie SUBS securities matured in December 2018.
Department of Housing and Urban Development
HUD has regulatory authority over Freddie Mac with respect to fair lending. Our loan purchase activities are subject to federal anti-discrimination laws. In addition, the GSE Act prohibits discriminatory practices in our loan purchase activities, requires us to submit data to HUD to assist in its fair lending investigations of primary market lenders with which we do business, and requires us to undertake remedial actions against such lenders found to have engaged in discriminatory lending practices. HUD periodically reviews and comments on our underwriting and appraisal guidelines for consistency with the Fair Housing Act and the anti-discrimination provisions of the GSE Act.
Department of the Treasury
Treasury has significant rights and powers as a result of the Purchase Agreement. In addition, under our Charter, the Secretary of the Treasury has approval authority over our issuances of notes, debentures, and substantially identical types of unsecured debt obligations (including the interest rates and maturities of these securities), as well as new types of mortgage-related securities issued subsequent to the enactment of the Financial Institutions Reform, Recovery and Enforcement Act of 1989. The Secretary of the Treasury has performed this debt securities approval function by coordinating GSE debt offerings with Treasury funding activities. Our Charter also authorizes Treasury to purchase Freddie Mac debt obligations not exceeding $2.25 billion in aggregate principal amount at any time. In February 2018, Treasury released its Strategic Plan 2018-2022, which includes a goal of promoting financial stability through housing finance reform, including resolution of the conservatorships of Freddie Mac and Fannie Mae.
|
FREDDIE MAC
| 2018 Form 10-K
|
172
|
|
|
Management's Discussion and Analysis
|
Regulation and Supervision
|
Consumer Financial Protection Bureau
The CFPB regulates consumer financial products and services. The CFPB adopted a number of final rules relating to loan origination, finance, and servicing practices that generally went into effect in January 2014. The rules include an ability-to-repay rule, which requires loan originators to make a reasonable and good faith determination that a borrower has a reasonable ability to repay the loan according to its terms. This rule provides certain protection from liability for originators making loans that satisfy the definition of a qualified mortgage. The ability-to-repay rule applies to most loans acquired by Freddie Mac, and for loans covered by the rule, FHFA has directed us to limit our single-family acquisitions to loans that generally would constitute qualified mortgages under applicable CFPB regulations. The directive generally restricts us from acquiring loans that are not fully amortizing, have a term greater than 30 years, or have points and fees in excess of 3% of the total loan amount.
Securities and Exchange Commission
We are subject to the reporting requirements applicable to registrants under the Exchange Act, including the requirement to file with the SEC annual reports on Form 10-K, quarterly reports on Form 10-Q, and current reports on Form 8-K. Although our common stock is required to be registered under the Exchange Act, we continue to be exempt from certain federal securities law requirements, including the following:
|
n
|
Securities we issue or guarantee are "exempted securities" and may be sold without registration under the Securities Act of 1933;
|
|
n
|
We are excluded from the definitions of "government securities broker" and "government securities dealer" under the Exchange Act;
|
|
n
|
The Trust Indenture Act of 1939 does not apply to securities issued by us; and
|
|
n
|
We are exempt from the Investment Company Act of 1940 and the Investment Advisers Act of 1940, as we are an "agency, authority, or instrumentality" of the U.S. for purposes of such Acts.
|
Legislative and Regulatory Developments
Legislation Related to Freddie Mac and Its Future Status
Our future structure and role will be determined by the Administration, Congress, and potentially FHFA, and it is possible, and perhaps likely, that there will be significant changes beyond the near-term.
Several bills were introduced in recent sessions of Congress concerning the future status of Freddie Mac, Fannie Mae, and the mortgage finance system, including bills that provided for the wind down of Freddie Mac and Fannie Mae, modification of the terms of the Purchase Agreement, or an increase in credit risk transfer transactions. None of these bills was enacted. It is likely that similar or new bills will be introduced and considered in the current or future sessions of Congress. We cannot predict whether any of such bills will be enacted.
The Trump Administration indicated in January that it expects to announce a framework for the development of a policy for comprehensive housing finance reform, and that it will work with Congress to formulate a reform plan.
|
FREDDIE MAC
| 2018 Form 10-K
|
173
|
|
|
Management's Discussion and Analysis
|
Regulation and Supervision
|
Common Securitization Platform and the UMBS Update
On September 17, 2018, FHFA published in the Federal Register a proposed rule on the new UMBS. The proposed rule is intended to improve the liquidity of Freddie Mac and Fannie Mae TBA-eligible MBS by requiring Freddie Mac and Fannie Mae to maintain policies that promote aligned investor cash flows both on current TBA-eligible MBS, and, upon implementation, on the UMBS. Implementation of requirements established by a final rule could affect our business practices in the future.
On October 23, 2018, FHFA determined in connection with the Single Security initiative that the market would benefit from aligned timing for the repurchase of delinquent mortgages from Fannie Mae Mortgage Backed Securities and Freddie Mac PCs based on similar approaches.
|
FREDDIE MAC
| 2018 Form 10-K
|
174
|
|
|
Management's Discussion and Analysis
|
Contractual Obligations
|
CONTRACTUAL OBLIGATIONS
Our contractual obligations affect our short- and long-term liquidity and capital resource needs. The table below provides aggregated information about the listed categories of our contractual obligations as of December 31, 2018. The table includes information about undiscounted future cash payments due under these contractual obligations, aggregated by type of contractual obligation, including the contractual maturity profile of our debt securities (other than debt securities of consolidated trusts held by third parties, STACR transactions, and SCR notes). The timing of actual future payments may differ from those presented due to a number of factors, including discretionary debt repurchases.
The amounts of future interest payments on debt securities outstanding at December 31, 2018 are based on the contractual terms of our debt securities at that date. These amounts were determined using certain assumptions, including that variable-rate debt continues to accrue interest at the contractual rates in effect at December 31, 2018 until maturity and callable debt continues to accrue interest until its contractual maturity. Accordingly, the amounts presented in the table do not represent a forecast of our future cash interest payments or interest expense.
Our contractual obligations include purchase obligations that are enforceable and legally binding, and exclude contracts that we may cancel without penalty. We include our purchase obligations through the termination date specified in the respective agreement, even if the contract is renewable.
The table excludes certain obligations that could significantly affect our short- and long-term liquidity and capital resource needs. These items, which are listed below, have generally been excluded because the amount and timing of the related future cash payments are uncertain:
|
n
|
Future payments of principal and interest related to debt securities of consolidated trusts held by third parties because the amount and timing of such payments are generally contingent upon the occurrence of future events and are therefore uncertain. These payments generally include payments of principal and interest we make to the holders of our guaranteed mortgage-related securities in the event a loan underlying a security becomes delinquent. We remove loans from pools underlying our PCs in certain circumstances, including when loans are 120 days or more delinquent, and retire the associated debt securities of consolidated trusts;
|
|
n
|
Future payments of principal and interest related to STACR transactions and SCR notes, as well as payment of premiums related to ACIS transactions, because the amount and timing of such payments are contingent upon the occurrence of future events on the reference pool of mortgage loans and are therefore uncertain;
|
|
n
|
Future cash payments associated with the liquidation preference of the senior preferred stock, the quarterly commitment fee (which has been suspended), and dividends on the senior preferred stock;
|
|
n
|
Future cash settlements on derivative agreements not yet accrued, because the amount and timing of such payments are dependent upon items such as changes in interest rates;
|
|
n
|
Future dividends on outstanding preferred stock (other than the senior preferred stock), because dividends on these securities are non-cumulative and because we are currently prohibited from paying dividends on these securities; and
|
|
n
|
The guarantee payments and commitments to advance funds pertaining to off-balance sheet arrangements.
|
|
FREDDIE MAC
| 2018 Form 10-K
|
175
|
|
|
Management's Discussion and Analysis
|
Contractual Obligations
|
Table 72 - Contractual Obligations
|
(In millions)
|
Total
|
2019
|
2020
|
2021
|
2022
|
2023
|
Thereafter
|
|||||||||||||||
|
Other long-term debt
(1)
|
|
$185,995
|
|
|
$58,002
|
|
|
$42,296
|
|
|
$30,898
|
|
|
$20,802
|
|
|
$15,929
|
|
|
$18,068
|
|
|
|
Other short-term debt
(1)
|
51,246
|
|
51,246
|
|
—
|
|
—
|
|
—
|
|
—
|
|
—
|
|
||||||||
|
Interest payable
(2)
|
23,401
|
|
10,607
|
|
2,902
|
|
2,303
|
|
1,550
|
|
1,026
|
|
5,013
|
|
||||||||
|
Other contractual liabilities reflected on our consolidated balance sheets
(3)
|
2,443
|
|
1,866
|
|
187
|
|
173
|
|
10
|
|
5
|
|
202
|
|
||||||||
|
Purchase obligations:
|
|
|
||||||||||||||||||||
|
Purchase commitments
(4)
|
27,583
|
|
27,583
|
|
—
|
|
—
|
|
—
|
|
—
|
|
—
|
|
||||||||
|
Other purchase obligations
(5)
|
317
|
|
268
|
|
22
|
|
14
|
|
6
|
|
3
|
|
4
|
|
||||||||
|
Lease obligations
|
35
|
|
14
|
|
10
|
|
5
|
|
2
|
|
1
|
|
3
|
|
||||||||
|
Total specified contractual obligations
|
|
$291,020
|
|
|
$149,586
|
|
|
$45,417
|
|
|
$33,393
|
|
|
$22,370
|
|
|
$16,964
|
|
|
$23,290
|
|
|
|
(1)
|
Represents par value. Callable debt is included in this table at its contractual maturity. For additional information about our debt, see
Note 8
.
|
|
(2)
|
Includes estimated future interest payments on our short-term and long-term debt securities as well as the accrual of periodic cash settlements of derivatives, netted by counterparty. Also includes accrued interest payable recorded on our consolidated balance sheet.
|
|
(3)
|
Includes (i) obligations related to our qualified and non-qualified defined contribution plans, retiree medical plan, and other benefit plans; (ii) future cash payments due under our contractual obligations to make delayed equity contributions to LIHTC partnerships; and (iii) payables to the consolidated trusts established for the administration of cash remittances received related to the underlying assets of Freddie Mac mortgage-related securities.
|
|
(4)
|
Purchase commitments represent our obligations to purchase loans and mortgage-related securities from third parties, most of which are accounted for as derivatives in accordance with the accounting guidance for derivatives and hedging.
|
|
(5)
|
Primarily includes unconditional purchase obligations that are legally binding and that are subject to a cancellation penalty.
|
|
FREDDIE MAC
| 2018 Form 10-K
|
176
|
|
|
Management's Discussion and Analysis
|
Off-Balance Sheet Arrangements
|
OFF-BALANCE SHEET ARRANGEMENTS
We enter into certain business arrangements that are not recorded on our consolidated balance sheets or that may be recorded in amounts that differ from the full contract or notional amount of the transaction and that may expose us to potential losses in excess of the amounts recorded on our consolidated balance sheets. See
Note 3
and
Note 5
for more information on our off-balance sheet securitization and guarantee activities.
Securitization Activities and Other Guarantees
We have certain off-balance sheet arrangements related to our securitization activities involving guaranteed loans and mortgage-related securities, though most of our securitization activities are on-balance sheet. Our off-balance sheet arrangements related to these securitization activities primarily consist of K Certificates and SB Certificates. We also have off-balance sheet arrangements related to certain other securitization products and other mortgage-related guarantees.
Our maximum potential off-balance sheet exposure to credit losses relating to these securitization activities and guarantees is primarily represented by the UPB of the underlying loans and securities, which was
$254.9 billion
and $215.7 billion at
December 31, 2018
and December 31, 2017, respectively.
As part of the guarantee arrangements pertaining to certain multifamily housing revenue bonds and securities backed by multifamily housing revenue bonds, we provided commitments to advance funds, commonly referred to as "liquidity guarantees," which were
$6.7 billion
and $7.4 billion at
December 31, 2018
and December 31, 2017, respectively. These guarantees require us to advance funds to third parties that enable them to repurchase tendered bonds or securities that are unable to be remarketed. At both
December 31, 2018
and December 31, 2017, there were no liquidity guarantee advances outstanding.
Our exposure to losses on the transactions described above would be partially mitigated by the recovery we would receive through exercising our rights to the collateral backing the underlying loans and the available credit enhancements. In addition, we provide for incurred losses each period on these guarantees within our provision for credit losses.
Other Agreements
We own interests in numerous entities that are considered to be VIEs for which we are not the primary beneficiary and which we do not consolidate in accordance with the accounting guidance for the consolidation of VIEs. These VIEs relate primarily to our investment activity in mortgage-related assets. Our consolidated balance sheets reflect only our investment in the VIEs, rather than the full amount of the VIEs' assets and liabilities.
As part of our credit guarantee business, we routinely enter into forward purchase and sale commitments for loans and mortgage-related securities. Some of these commitments are accounted for as derivatives. Their fair values are reported as either derivative assets, net or derivative liabilities, net on our consolidated balance sheets. For more information, see
Risk Management - Counterparty Credit Risk
- Financial Intermediaries, Clearinghouses, and Other Counterparties -Derivative Counterparties
and
Note 9
. We also enter into purchase commitments primarily related to future guarantor swap transactions for single-family loans, and, to a lesser extent, index lock commitments and commitments to purchase or guarantee multifamily loans. These non-derivative
|
FREDDIE MAC
| 2018 Form 10-K
|
177
|
|
|
Management's Discussion and Analysis
|
Off-Balance Sheet Arrangements
|
commitments totaled
$382.1 billion
and $296.4 billion in notional value at
December 31, 2018
and December 31, 2017, respectively.
In connection with the execution of the Purchase Agreement, we, through FHFA, in its capacity as Conservator, issued a warrant to Treasury to purchase 79.9% of our common stock outstanding on a fully diluted basis on the date of exercise. See
Note 11
for further information.
|
FREDDIE MAC
| 2018 Form 10-K
|
178
|
|
|
Management's Discussion and Analysis
|
Critical Accounting Policies and Estimates
|
CRITICAL ACCOUNTING POLICIES AND ESTIMATES
The preparation of financial statements in accordance with GAAP requires us to make a number of judgments, estimates, and assumptions that affect the reported amounts within our consolidated financial statements. Certain of our accounting policies, as well as estimates we make, are critical, as they are both important to the presentation of our financial condition and results of operations and require management to make difficult, complex, or subjective judgments and estimates, often regarding matters that are inherently uncertain. Actual results could differ from our estimates, and the use of different judgments and assumptions related to these policies and estimates could have a material impact on our consolidated financial statements.
Our critical accounting policies and estimates relate to the single-family allowance for loan losses and fair value measurements. For additional information about our critical accounting policies and estimates and other significant accounting policies, as well as recently issued accounting guidance, see
Note 1
.
Single-Family Allowance for Loan Losses
The single-family allowance for loan losses represents an estimate of probable incurred credit losses. The single-family allowance for loan losses pertains to all single-family loans classified as held-for-investment on our consolidated balance sheets.
Determining the appropriateness of the single-family allowance for loan losses is a complex process that is subject to numerous estimates and assumptions requiring significant management judgment about matters that involve a high degree of subjectivity. This process involves the use of models that require us to make judgments about matters that are difficult to predict, the most significant of which are the probability of default, prepayment, and loss severity. We regularly evaluate the underlying estimates and models we use when determining the single-family allowance for loan losses and update our assumptions to reflect our historical experience and current view of economic factors. See
Risk Factors - Operational Risks -
We face risks and uncertainties associated with the models that we use to inform business and risk management decisions and for financial accounting and reporting purposes
.
We believe the level of our single-family allowance for loan losses is appropriate based on internal reviews of the factors and methodologies used. No single statistic or measurement determines the appropriateness of the allowance for loan losses. Changes in one or more of the estimates or assumptions used to calculate the single-family allowance for loan losses could have a material impact on the allowance for loan losses and provision for credit losses.
Most single-family loans are aggregated into pools based on similar risk characteristics and measured collectively using a statistically based model that evaluates a variety of factors affecting collectability, including but not limited to current LTV ratios, trends in home prices, loan product type, delinquency/default status and history, and geographic location. Inputs used by the model are regularly updated for changes in the underlying data, assumptions, and market conditions. We review the output of this model by considering qualitative factors such as macroeconomic and other factors to see whether the model outputs are consistent with our expectations. Management adjustments may be necessary to take into consideration external factors and current economic events that have occurred but that are not yet
reflected in the factors used to derive the model outputs. Significant judgment is exercised in making
|
FREDDIE MAC
| 2018 Form 10-K
|
179
|
|
|
Management's Discussion and Analysis
|
Critical Accounting Policies and Estimates
|
these adjustments.
Some examples of the qualitative factors considered include:
|
n
|
Regional housing trends;
|
|
n
|
Applicable home price indices;
|
|
n
|
Unemployment and employment dislocation trends;
|
|
n
|
The effects of changes in government policies and programs;
|
|
n
|
Industry trends;
|
|
n
|
Consumer credit statistics;
|
|
n
|
Third-party credit enhancements; and
|
|
n
|
Natural disasters (such as hurricanes and wildfires).
|
The inability to realize the benefits of our loss mitigation activities, a lower realized rate of seller/servicer repurchases, declines in home prices, deterioration in the financial condition of our mortgage insurers, or increases in delinquency rates would cause our losses to be significantly higher than those currently estimated.
Individually impaired single-family loans include loans that have undergone a TDR and are measured for impairment as the excess of our recorded investment in the loan over the present value of the expected future cash flows. Our expectation of future cash flows incorporates many of the judgments indicated above.
Fair Value Measurements
We use fair value measurements for the initial recording of certain assets and liabilities and periodic remeasurement of certain assets and liabilities on a recurring or non-recurring basis. Assets and liabilities within our consolidated financial statements measured at fair value include:
|
n
|
Mortgage-related and non-mortgage related securities;
|
|
n
|
Certain loans held-for-sale;
|
|
n
|
Derivative instruments; and
|
|
n
|
Certain debt securities of consolidated trusts held by third parties and certain other debt.
|
The accounting guidance for fair value measurements establishes a framework for measuring fair value, and also establishes a three-level fair value hierarchy that prioritizes the inputs to valuation techniques used to measure fair value based on the assumptions a market participant would use at the measurement date. Fair value measurements under this hierarchy are distinguished among quoted market prices, observable inputs, and unobservable inputs. The measurement of fair value requires management to make judgments and assumptions. The process for determining fair value using unobservable inputs is generally more subjective and involves a higher degree of management judgment
and assumptions than the measurement of fair value using observable inputs. These judgments and assumptions may have a significant effect on our measurements of fair value, and the use of different judgments and assumptions, as well as changes in market conditions, could have a material effect on our consolidated statements of comprehensive income and consolidated balance sheets. See
Note 15
for additional information regarding fair value hierarchy and measurements, valuation risk, and controls over fair value measurement.
|
FREDDIE MAC
| 2018 Form 10-K
|
180
|
|
|
Risk Factors
|
Conservatorship and Related Matters
|
Risk Factors
The following section discusses material risks and uncertainties that could adversely affect our business, financial condition, results of operations, cash flows, reputation, strategies, and/or prospects.
CONSERVATORSHIP AND RELATED MATTERS
Freddie Mac's future is uncertain.
It is possible and perhaps likely that future legislative or regulatory action will materially affect our role in the mortgage industry, business model, structure, and results of operations. Some or all of our functions could be transferred to other institutions, and we could cease to exist as a stockholder-owned company, or at all. If any of these events occur, our shares could further diminish in value, or cease to have any value. Our stockholders may not receive any compensation for such loss in value.
Several bills have been introduced in recent sessions of Congress concerning the future status of Freddie Mac, Fannie Mae, and the mortgage finance system, including bills which provided for the wind down of Freddie Mac and Fannie Mae, modification of the terms of the Purchase Agreement, or an increase in credit risk transfer transactions. While none of these bills has been enacted, it is likely that similar or new bills will be introduced and considered in the future. In addition, in June 2018, the Office of Management and Budget released a plan that proposed changes in the government's role in housing finance, including ending the conservatorships of Freddie Mac and Fannie Mae, reducing their role in the housing market, and providing an explicit, limited federal backstop separate from the support for low- and moderate-income homebuyers. It is possible that the Administration could take steps, even in the absence of legislative action, to implement certain aspects of such a plan.
The conservatorship is indefinite in duration. The timing, likelihood, and circumstances under which we might emerge from conservatorship are uncertain. Under the Purchase Agreement, Treasury would be required to consent to the termination of the conservatorship, except in connection with receivership, and there can be no assurance it would do so. Even if the conservatorship is terminated, we would remain subject to the Purchase Agreement and the terms of the senior preferred stock. It is possible that the conservatorship could end with our being placed into receivership.
Because Treasury holds a warrant to acquire nearly 80% of our common stock for nominal consideration, we could effectively remain under the control of the U.S. government even if the conservatorship ends and the voting rights of common stockholders are restored. If Treasury exercises the warrant, the ownership interest of our existing common stockholders will be substantially diluted.
In the past several years, numerous lawsuits have been filed against the U.S. government, Freddie Mac and Fannie Mae challenging certain government actions related to the conservatorship and the Purchase Agreement. These lawsuits may add to the uncertainty surrounding our future.
For more information, see
MD&A - Regulation and Supervision -
Legislative and Regulatory Developments
,
Legal Proceedings
and
Note 16
.
|
FREDDIE MAC
| 2018 Form 10-K
|
181
|
|
|
Risk Factors
|
Conservatorship and Related Matters
|
We are experiencing significant changes in key external and internal positions during 2019, including the Director of FHFA, the Chair and other members of our Board of Directors, and our CEO. These changes may result in significant changes in our priorities and strategy, which could in turn affect our business and results of operations.
We are under the control of FHFA, as our Conservator, and FHFA determines our strategic direction. An interim FHFA Director was appointed in January 2019 to replace the previous Director, and a candidate for a full term as Director is awaiting Senate confirmation. Either the interim or the full term Director could decide to change our priorities and strategy in various ways, and could direct us to undertake new business activities and limit or cease existing activities. These changes could adversely affect our results of operations.
FHFA has provided authority to the Board of Directors to oversee management's conduct of our business operations. During 2019, five of our independent directors, including the Chair, have left or will leave the Board, one for health and family reasons and four because their terms of Board service have reached the limit set forth in the Guidelines. Since March 2018, two new directors have been elected, and the Board is continuing to recruit for additional members. This turnover could affect the manner in which the Board is able to fulfill its oversight functions. In addition, our CEO has announced that he will retire in the second half of 2019, and the Board is conducting a search for his replacement. The transition to a new CEO, including any related organizational changes, may demand significant management attention and affect, at least during the transition period, the efficiency with which we are able to conduct our ongoing business operations.
We cannot retain capital from the earnings generated by our business operations in excess of the applicable Capital Reserve Amount under the Purchase Agreement, which could result in our having to request additional draws from Treasury in future periods.
As a result of the net worth sweep dividend requirement, we cannot retain capital from the earnings generated by our business operations in excess of the applicable Capital Reserve Amount of $3.0 billion. If for any reason we were not to pay our dividend requirement on the senior preferred stock in full in any future period, the applicable Capital Reserve Amount would thereafter be zero, and we would not be able to retain any capital from the earnings generated by our business. While in conservatorship, dividends we pay to Treasury are declared by, and paid at the direction of, the Conservator, acting as successor to the rights, titles, powers, and privileges of the Board. Our inability to build and retain capital in excess of the applicable Capital Reserve Amount could cause us to require draws in future periods. A variety of factors could influence whether we could require a draw, including the following:
|
n
|
Deterioration of economic conditions, including increased levels of unemployment and declines in home prices or family incomes;
|
|
n
|
Adverse changes in interest rates, yield curves, implied volatility, or market spreads, which could affect our financial assets and liabilities, including derivatives, and increase realized and unrealized losses recorded in earnings or AOCI;
|
|
n
|
The success of any transactions or other steps we may take intended to help reduce earnings variability and address some of the measurement differences between our GAAP financial results and the underlying economics of our business, including the adoption of hedge accounting;
|
|
n
|
Limitations on the size of our mortgage-related investments portfolio, reductions of higher yielding assets, or other limitations on our investment activities that reduce our earnings capacity;
|
|
n
|
Restrictions on our single-family guarantee activities that could reduce our income from these
|
|
FREDDIE MAC
| 2018 Form 10-K
|
182
|
|
|
Risk Factors
|
Conservatorship and Related Matters
|
activities;
|
n
|
Restrictions on the volume of multifamily business we may conduct or other limits on multifamily business activities that could reduce our income from these activities;
|
|
n
|
Adverse changes in our liquidity, funding, or hedging costs or limitations on our access to public debt markets;
|
|
n
|
A failure of one or more of our major counterparties to meet their obligations to us;
|
|
n
|
The effects of our foreclosure prevention and loss mitigation efforts;
|
|
n
|
Changes in accounting policies, practices, or guidance, such as FASB's accounting standards update related to the measurement of credit losses on financial instruments, which may increase (perhaps substantially) our provision for credit losses in the period of adoption;
|
|
n
|
The occurrence of a major natural or other disaster in areas in which our offices or significant portions of our total mortgage portfolio are located; or
|
|
n
|
Changes in business practices resulting from legislative and regulatory developments or direction from our Conservator.
|
Additional draws, which will increase the already substantial liquidation preference of our senior preferred stock and decrease the amount of Treasury's remaining commitment under the Purchase Agreement, may add to the uncertainty regarding our long-term financial sustainability.
FHFA, as our Conservator, controls our business activities. We may be required to take actions that reduce our profitability, are difficult to implement, or expose us to additional risk.
We are under the control of FHFA, as our Conservator, and are not managed to maximize stockholder returns. FHFA determines our strategic direction. We face a variety of different, and sometimes competing, business objectives and FHFA-mandated activities, such as the initiatives we are pursuing under the Conservatorship Scorecards. Some of the activities FHFA has required us to undertake are costly and difficult to implement, such as building the CSP.
FHFA has required us to make changes to our business that have adversely affected our financial results and could require us to make additional changes at any time. For example, FHFA may require us to undertake activities that:
|
n
|
Reduce our profitability;
|
|
n
|
Expose us to additional credit, market, funding, operational, and other risks; or
|
|
n
|
Provide additional support for the mortgage market that serves our public mission, but adversely affects our financial results.
|
From time to time, FHFA has prevented us from engaging in business activities or transactions that we believe would be profitable, and it may do so again in the future. For example, FHFA could further limit the size of our mortgage-related investments portfolio or the amount of new multifamily business we may obtain, or it could establish limits on our single-family business.
Due to the reduced earnings capacity of our mortgage-related investments portfolio, we are placing greater emphasis on our guarantee activities to generate revenue. However, our ability to do so may be limited for several reasons. We may be required to adopt business practices that help serve our public mission and other non-financial objectives, but that may negatively affect our future financial results. Congress or FHFA may require us to set aside or otherwise pay monies to fund third-party initiatives,
|
FREDDIE MAC
| 2018 Form 10-K
|
183
|
|
|
Risk Factors
|
Conservatorship and Related Matters
|
such as the existing requirement under the GSE Act that we allocate amounts for certain housing funds. The combination of the restrictions on our business activities and our potential inability to generate sufficient revenue through our guarantee activities to offset the effects of those restrictions may have an adverse effect on our results of operations and financial condition.
The Purchase Agreement and the terms of the senior preferred stock significantly limit our business activities.
The Purchase Agreement and the terms of the senior preferred stock place significant restrictions on our ability to manage our business, including limiting:
|
n
|
The amount of indebtedness we may incur;
|
|
n
|
The size of our mortgage-related investments portfolio; and
|
|
n
|
Our ability to pay dividends, transfer certain assets, raise capital, and pay down the liquidation preference of the senior preferred stock.
|
The limitation on the size of our mortgage-related investments portfolio, as required by the Purchase Agreement and FHFA, and other limitations on our investment activity, including significant constraints on our ability to purchase or sell mortgage assets, will reduce the earnings capacity of our mortgage-related investments portfolio. We can provide no assurance that the cap on our mortgage-related investments portfolio will not, over time, force us to sell mortgage assets at unattractive prices or that our current strategies will not have an adverse impact on our business or financial results. For more information, see
MD&A - Conservatorship and Related Matters
- Limits on Our Mortgage-Related Investments Portfolio and Indebtedness
.
The Purchase Agreement prohibits us from taking a variety of actions without Treasury's consent. Treasury has the right to withhold its consent for any reason. The warrant held by Treasury, the restrictions on our business under the Purchase Agreement, and the senior status and net worth sweep dividend provisions of the senior preferred stock could adversely affect our ability to attract capital from the private sector in the future, should we be in a position to do so.
If FHFA placed us into receivership, our assets would be liquidated. The liquidation proceeds might not be sufficient to pay claims outstanding against Freddie Mac, repay the liquidation preference of our preferred stock, or make any distribution to our common stockholders.
We can be put into receivership at the discretion of the Director of FHFA at any time for a number of reasons set forth in the GSE Act. Several bills considered by Congress in the past several years provided for Freddie Mac to be placed into receivership. In addition, FHFA could be required to place us into receivership if Treasury were unable to provide us with funding requested under the Purchase Agreement to address a deficit in our net worth. Treasury might not be able to provide the requested funding if, for example, the U.S. government were not fully operational because Congress had failed to approve funding or the government had reached its borrowing limit. For more information, see
MD&A - Regulation and Supervision -
Federal Housing Finance Agency - Receivership
.
Being placed into receivership would terminate the conservatorship. The purpose of receivership is to liquidate our assets and resolve claims against us. The appointment of FHFA as our receiver would terminate all rights and claims that our stockholders and creditors might have against our assets or under our Charter as a result of their status as stockholders or creditors, other than possible payment upon our liquidation.
|
FREDDIE MAC
| 2018 Form 10-K
|
184
|
|
|
Risk Factors
|
Conservatorship and Related Matters
|
The GSE Act provides that, if we were placed into receivership, the receiver would hold the mortgages underlying our mortgage-related securities (and the payments thereon) for the benefit of the holders of those securities. However, payments on the mortgages underlying our mortgage-related securities might not be sufficient to make full payments of principal and interest on the securities. In that event, if we were unable to fulfill our guarantee, the holders of our mortgage-related securities would experience delays in receiving payments on the securities because the relevant systems are not designed to make partial payments.
If our assets were liquidated, the liquidation proceeds might not be sufficient to pay the secured and unsecured claims against us (including claims on our guarantees), repay the liquidation preference on any series of our preferred stock, or make any distribution to our common stockholders. Proceeds would first be applied to the secured and unsecured claims against the company, the administrative expenses of the receiver, and the liquidation preference of the senior preferred stock. Any remaining proceeds would then be available to repay the liquidation preference of other series of preferred stock. Only after the liquidation preference of all series of preferred stock is repaid would any proceeds be available for distribution to the holders of our common stock.
|
FREDDIE MAC
| 2018 Form 10-K
|
185
|
|
|
Risk Factors
|
Credit Risk
|
CREDIT RISK
We are subject to mortgage credit risk. Credit costs related to this risk could adversely affect our financial results.
Mortgage credit risk is the risk that a borrower will fail to make timely payments on a loan we own or guarantee. This exposes us to the risk of credit losses and credit-related expenses, which could adversely affect our financial results. We are primarily exposed to mortgage credit risk with respect to the single-family and multifamily loans and securities reflected as assets on our consolidated balance sheets. We are also exposed to mortgage credit risk with respect to guaranteed securities and guarantee arrangements that are not reflected as assets on our consolidated balance sheets, including K Certificates, SB Certificates, and certain senior subordinate securitization structures.
We continue to have loans in our single-family credit guarantee portfolio with certain characteristics, such as Alt-A loans, interest-only loans, option ARM loans, loans with original LTV ratios greater than 90%, and loans to borrowers with credit scores less than 620 at the time of origination, that expose us to greater credit risk than other types of loans. See
MD&A - Risk Management - Single-Family Mortgage Credit Risk -
Monitoring Loan Performance and Characteristics of the Single-family Credit Guarantee Portfolio and Individual Sellers and Servicers
.
We also have recently begun acquiring loans with higher LTV ratios through our Home Possible initiatives, as well as loans with higher DTI ratios, generally up to 50%, which will increase our exposure to credit risk. Our efforts to increase access to single-family mortgage credit, including our expanded affordable housing program and our plan for fulfilling our duty to serve underserved markets, expose us to increased mortgage credit risk.
We face significant risks related to our delegated underwriting process for single-family loans, including risks related to data accuracy and mortgage fraud. Changes to the process could increase our risks.
We delegate to our sellers the underwriting for the single-family loans we purchase or securitize. Our contracts with sellers describe mortgage eligibility and underwriting standards, and the sellers represent and warrant to us that the loans they deliver to us meet these standards. We do not independently verify most of the information provided to us before we purchase or securitize a loan. This exposes us to the risk that one or more of the parties involved in a transaction (such as the borrower, property seller, broker, appraiser, title agent, loan officer, or lender) misrepresented facts about the borrower, underlying property, or loan, or otherwise engaged in fraud.
We review a sample of loans after we purchase them to determine if they comply with our contractual standards. However, our review may not detect any misrepresentations by the parties involved in the transaction, deter loan fraud, or reduce our exposure to these risks.
We can exercise certain contractual remedies, including requiring repurchase of the loan, for loans that do not meet our standards. However, in recent years, at the direction of FHFA, we have significantly revised our representation and warranty framework (including changes to remedies for certain defects) to relieve sellers of certain repurchase obligations in specific cases with respect to single-family loans. As a result, we may face greater exposure to credit and other losses under this revised framework, because our ability to seek recovery or repurchase from sellers is more limited and we must identify breaches of representations and warranties early in the life of the loan.
Our Loan Advisor Suite offers limited representation and warranty relief for certain loans that satisfy
|
FREDDIE MAC
| 2018 Form 10-K
|
186
|
|
|
Risk Factors
|
Credit Risk
|
automated controls related to appraisal quality, collateral valuation, borrower assets, and borrower income. In general, limited representation and warranty relief is offered when information provided by the lender is validated against independent data sources. However, there is a risk that the enhanced tools and processes provided by the Loan Advisor Suite will not enable us to identify all breaches in a timely manner. For more information, see
MD&A - Risk Management - Single-Family Mortgage Credit Risk -
Maintaining Policies and Procedures for New Business Activity, Including Prudent Underwriting Standards
.
Declines in national or regional home prices or other adverse changes in the housing market could negatively affect our business and financial results.
Our financial results and business volumes can be negatively affected by declines in home prices and other adverse changes in the housing market. This could:
|
n
|
Reduce our return or result in losses on our single-family guarantee business, as default rates could be higher than we expected when we issued the guarantees;
|
|
n
|
Cause us to hedge prepayment risk incorrectly;
|
|
n
|
Negatively affect loan pricing, which could cause us to change our disposition strategies for our single-family unsecuritized loans; or
|
|
n
|
Increase our losses on foreclosure alternatives, third-party sales, and dispositions of REO properties.
|
For more information regarding these risks, see
MD&A - Risk Management - Credit Risk.
The proportion of our refinance loan purchases to total loan purchases could decrease if mortgage interest rates increase. This could increase our exposure to mortgage credit risk, as refinance loans (particularly those that do not involve "cash-out") generally present less credit risk than purchase loans. Some of our seller/servicer counterparties are highly dependent on refinance loan volumes. A decrease in such volumes could adversely affect these counterparties, which could increase our exposure to counterparty credit risk.
We are exposed to counterparty credit risk with respect to our business counterparties. Our financial results may be adversely affected if one or more of our counterparties fail to meet their contractual obligations to us.
We depend on our institutional counterparties to provide services that are critical to our business. We face the risk that one or more of our counterparties may fail to meet their contractual obligations to us. Our major counterparties include seller/servicers, mortgage and credit insurers, and counterparties to derivatives, short-term lending, and other funding transactions (i.e., cash and other investments transactions).
Many of our major counterparties provide several types of services to us. The concentration of our exposure to our counterparties remains high. Efforts we take to reduce exposure to financially weak counterparties could concentrate our exposure to other counterparties, increase our costs, and reduce our revenue. In recent years, challenging market conditions have, at times, adversely affected the liquidity and financial condition of our counterparties, and some of our major counterparties have failed. Similar events may occur in future periods. Many of our counterparties are subject to increasingly complex regulatory requirements and oversight, which place additional stress on their resources and may affect their ability or willingness to do business with us.
|
FREDDIE MAC
| 2018 Form 10-K
|
187
|
|
|
Risk Factors
|
Credit Risk
|
Credit risk related to single-family seller/servicers
We are exposed to credit risk from the seller/servicers of our single-family loans, as described below.
|
n
|
A decline in servicing performance
-
A decline in a servicer's performance, such as delayed foreclosures or missed opportunities for loan modifications, could significantly affect our ability to mitigate credit losses and could affect the overall credit performance of our single-family credit guarantee portfolio. A large volume of seriously delinquent loans, the complexity of the servicing function, and heightened liquidity requirements are significant factors contributing to the risk of a decline in performance by servicers. We could be adversely affected if our servicers lack appropriate controls, experience a failure in their controls, or experience a disruption in their ability to service loans, including as a result of legal or
regulatory actions or ratings downgrades. We also are exposed to fraud by third parties in the loan servicing function, particularly with respect to short sales and other dispositions of non-performing assets.
|
We could attempt to mitigate our exposure to a poorly performing servicer by terminating its right to service our loans; however, we may not be able to find successor servicers who have the capacity to service the affected loans and who are also willing to assume the representations and warranties of the terminated servicer. In addition, terminating a large servicer may not be feasible because of the operational and capacity challenges related to transferring large servicing portfolios. If we replace a servicer, we would likely incur costs and potential increases in servicing fees. We may also be exposed to concentrations of credit risk among certain servicers.
|
n
|
A failure by seller/servicers to fulfill their obligations to repurchase loans or indemnify us as a result of breaches of representations and warranties
-
While we may have the contractual right to require a seller or servicer to repurchase loans from us, it may be difficult, expensive, and time-consuming to enforce such repurchase obligations. We could enter into settlements to resolve repurchase obligations; however, the amounts we receive under any such settlements may be less than the losses we ultimately incur on the underlying loans.
|
Under our representation and warranty framework, revised as directed by FHFA, we are required in some cases to utilize an alternative remedy, such as indemnification, in lieu of repurchase. The amount we recover under an alternative remedy may be less than the amount we could have recovered in a repurchase.
|
n
|
Increased exposure to non-depository and smaller financial institutions
-
A large and increasing volume of our single-family loans are acquired from and serviced by non-depository and smaller financial institutions. These institutions may not have the same financial strength or operational capacity, or be subject to the same level of regulatory oversight, as large depository institutions. As a result, we face increased risk that these counterparties could fail to perform their obligations to us. In particular, non-depository servicers rapidly grew their servicing portfolios in the last several years. This appears to have resulted in operational strains that have subjected some of these servicers to regulatory scrutiny. This rapid growth could expose us to increased risks if any operational strain adversely affects these servicers' servicing performance or their financial strength. In addition, these servicers may not always have ready access to appropriate sources of liquidity to finance their operations, particularly during periods when the mortgage market is experiencing a downturn. If these servicers reduce their servicing portfolios, overall servicing capacity may be constrained.
|
Our seller/servicers also have a significant role in servicing loans in our multifamily mortgage portfolio. We are exposed to the risk that multifamily seller/servicers could come under financial pressure, which
|
FREDDIE MAC
| 2018 Form 10-K
|
188
|
|
|
Risk Factors
|
Credit Risk
|
could potentially cause a decline in their servicing performance.
We are also exposed to settlement risk on the non-performance of sellers and servicers as a result of our forward settlement loan purchase programs in our single-family and multifamily businesses.
For more information, see
MD&A - Risk Management - Counterparty Credit Risk -
Sellers and Servicers
.
Credit risk related to counterparties to derivatives, funding, short-term lending, and other transactions
We have significant exposure to institutions in the financial services industry relating to derivatives, funding, short-term lending, securities, and other transactions (e.g., cash and other investments transactions). These transactions are critical to our business, including our ability to:
|
n
|
Manage interest-rate risk and other risks related to our investments in mortgage-related assets;
|
|
n
|
Fund our business operations; and
|
|
n
|
Service our customers.
|
We face the risk of operational failure of the clearing members, exchanges, clearinghouses, or other financial intermediaries we use to facilitate derivatives, short-term lending, and other transactions. If a clearing member or clearinghouse were to fail, we could lose the collateral or margin posted with the clearing member or clearinghouse.
We are a clearing member of the clearinghouses through which we execute mortgage-related and Treasury securities transactions. As a result, we could be subject to losses because we are required to participate in the coverage of losses incurred by other clearing members if they fail to meet their obligations to the clearinghouse.
If our counterparties to short-term lending transactions fail, we are exposed to losses to the extent the transaction is unsecured or the collateral posted to us is insufficient.
Certain of our derivatives counterparties and a major derivatives clearinghouse are based in the United Kingdom. If these entities are adversely affected by Brexit, this could affect their ability to do business with us, potentially resulting in further concentration of our exposure to other derivative counterparties, as well as reduced liquidity and increased costs in the derivatives market.
For more information, see
MD&A - Risk Management - Counterparty Credit Risk -
Financial Intermediaries, Clearinghouses, and Other Counterparties - Other Counterparties
.
Credit risk related to mortgage and credit insurers
It is unlikely that we will receive full payment of our claims from a few of the mortgage insurers of single-family loans that we purchased prior to 2009, as these insurers are insolvent or are paying only a portion of our claims under our mortgage insurance policies. For more information, see
Note 14
.
If a mortgage insurer fails to meet its obligations to reimburse us for claims, our credit losses could increase. In addition, if a regulator determines that a mortgage insurer lacks sufficient capital to pay all claims when due, the regulator could take action that might affect the timing and amount of claim payments made to us. We face similar risks with respect to our counterparties on ACIS transactions.
We cannot differentiate pricing based on the strength of a mortgage insurer or revoke a mortgage insurer's status as an eligible insurer without FHFA approval. In addition, we generally do not select the mortgage insurance provider on a specific loan because the selection is usually made by the lender at
|
FREDDIE MAC
| 2018 Form 10-K
|
189
|
|
|
Risk Factors
|
Credit Risk
|
the time the loan is originated. As a result, we could acquire a concentration of risk to certain insurance providers. We continue to acquire new loans with mortgage insurance from mortgage insurers that have credit ratings below investment grade.
For more information, see
MD&A - Risk Management - Counterparty Credit Risk -
Credit Enhancement Providers
.
Our loss mitigation activities may be unsuccessful or costly and may adversely affect our financial results.
Our loss mitigation activities may not be successful. The costs we incur related to loan modifications and other loss mitigation activities have been, and could continue to be, significant. For example, we generally bear the full cost of the monthly payment reductions related to modifications of loans we own or guarantee, as well as all applicable servicer incentive fees for our mortgage modifications.
We could be required to make changes to our loss mitigation activities that could make these activities more costly to us. FHFA, as Conservator, may continue to issue directives and Advisory Bulletins to assist borrowers and align servicing practices for the GSEs. These directives could make these activities more costly to us, especially with regard to loan modification initiatives. FHFA may continue to issue these directives for a variety of reasons, including consumer relief and alignment of security prepayment behavior as the GSEs transition to the UMBS.
We have loans on trial period plans as required under certain loan modification programs. Some of these loans will fail to complete the trial period or fail to qualify for our other borrower assistance programs. For these loans, the trial period will have effectively delayed the foreclosure process and could increase our losses.
Many of our HAMP loans, which initially were set at a below-market interest rate, have provisions for the interest rates to increase gradually until they reach the market rate that was in effect at the time of the modification. The resulting increase in the borrowers' payments may increase the risk that these borrowers will default.
The type of loss mitigation activities we pursue could affect prepayments on our PCs and REMICs, which could affect the value of these securities or the earnings from mortgage-related assets in our Capital Markets segment mortgage investments portfolio. In addition, loss mitigation activities may adversely affect our ability to securitize, resecuritize, and sell the loans subject to those activities.
We devote significant resources to our borrower assistance initiatives. The size and scope of these efforts may compete with other business opportunities or corporate initiatives.
For more information on our loss mitigation activities, see
MD&A - Our Business Segments - Single-Family Guarantee -
Loss Mitigation Activities
and
MD&A - Risk Management - Single-Family Mortgage Credit Risk -
Engaging in Loss Mitigation Activities
.
We have been, and will continue to be, adversely affected by delays and deficiencies in the single-family foreclosure process.
The average length of time for foreclosure of a Freddie Mac loan has significantly increased since 2008, particularly in states that require a judicial foreclosure process, and may further increase. Delays in the foreclosure process could:
|
n
|
Cause our expenses to increase. For example, properties awaiting foreclosure could deteriorate until we acquire them, resulting in increased expenses to repair and maintain the properties and
|
|
FREDDIE MAC
| 2018 Form 10-K
|
190
|
|
|
Risk Factors
|
Credit Risk
|
|
n
|
Adversely affect trends in home prices regionally or nationally, which could adversely affect our financial results.
|
We are exposed to increased credit losses and credit related expenses in the event of a major natural disaster or other catastrophic event.
The occurrence of a major natural or environmental disaster or similar catastrophic event in an area where we own or guarantee mortgage loans or REO properties, especially in densely populated geographic areas, could increase our credit losses and credit related expenses. A natural disaster or catastrophic event that either damages or destroys residential or multifamily real estate underlying mortgage loans or REO properties we own or guarantee, or negatively affects the ability of borrowers to continue to make payments on mortgage loans we own or guarantee, could increase our serious delinquency rates and average loan loss severity in the affected areas. Such events could have a material adverse effect on our business and financial results. We may not have adequate insurance coverage for some of these catastrophic events.
Our credit risk transfer transactions may not be available to us in adverse economic conditions. These transactions also lower our profitability.
We are increasingly using credit risk transfer transactions to mitigate some of our potential credit losses. Our ability to transfer credit risk (and the cost to us of doing so) could change rapidly depending on market conditions. In particular, it is possible that there will not be sufficient investor demand for credit risk transfer transactions at acceptable prices during a housing downturn. Some of our credit risk transfer transactions are new, and it is uncertain if there will be adequate demand for them over the long term. Some of these transactions use novel structures that have not yet been tested in adverse market conditions. It is possible that, under such conditions, they will provide less protection than we expect, and they may not prevent us from incurring substantial losses. Most of these transactions have termination dates that are earlier than the maturities of the related loans, and losses on the loans occurring beyond the terms of the transactions are not covered. The costs associated with these transactions are significant and may increase. For many of these transactions, there could be a significant difference in time between when we recognize a credit loss in earnings and when we recognize the related recovery in earnings, and this lag could adversely affect our financial results in the earlier period. For more information regarding these transactions, see
Note 4
.
|
FREDDIE MAC
| 2018 Form 10-K
|
191
|
|
|
Risk Factors
|
Market Risk
|
MARKET RISK
Changes in interest rates could negatively affect the fair value of financial assets and liabilities, our results of operations, and our net worth.
Our financial results can be significantly affected by changes in interest rates.
Interest rates can fluctuate for many reasons, including changes in the fiscal and monetary policies of the federal government and its agencies as well as geopolitical events or changes in general economic conditions.
Changes in interest rates could adversely affect the cash flows and prepayment rates on assets that we own and related debt and derivatives. In addition, changes in interest rates could adversely affect the prepayment rate or default rate on the loans that we guarantee. For example:
|
n
|
When interest rates decrease, borrowers are more likely to prepay their loans by refinancing them at a lower rate. An increased likelihood of prepayment on the loans underlying our mortgage-related securities may adversely affect the value of these securities.
|
|
n
|
When interest rates increase:
|
|
l
|
Borrowers with higher risk adjustable-rate loans may have fewer opportunities to refinance into fixed-rate loans and
|
|
l
|
A borrower's payments on loans with adjustable payment terms, including any additional debt obligations (such as home equity lines of credit and second liens) with such terms, may increase, which in turn increases the risk that the borrower may default on a loan we own or guarantee.
|
Additionally, we issue callable debt instruments to manage the duration and prepayment risk of expected cash flows of the mortgage assets we own. We may exercise the option to repay the outstanding principal balance when interest rates decrease. However, we may replace the called debt at a higher spread rate due to the market conditions at that time. In the event we decide not to call our debt, we may incur higher hedging costs.
We incur costs to manage these risks, which may not be successful. Our interest-rate risk management activities are designed to reduce our economic exposure to changes in interest rates to a low level as measured by our models. However, the accounting treatment for certain of our assets and liabilities, including derivatives, creates variability in our earnings when interest rates fluctuate, as some assets and liabilities are measured at amortized cost and some are measured at fair value, while all derivatives are measured at fair value. This variability generally is not indicative of the underlying economics of our business.
We use hedge accounting for certain single-family mortgage loans and long-term debt, which is intended to partially reduce the interest-rate volatility in our GAAP earnings by eliminating a portion of the measurement differences between our GAAP financial results and the underlying economics of our business. Our single-family mortgage hedge accounting program is complex and unique in the industry. We may fail to properly implement this program and related changes to systems and processes. Our hedges may fail in any given future period, which could expose us to significant earnings variability in that period and increase the risk that we will need a draw from Treasury.
Changes in market spreads could materially affect our results of operations and net worth.
Changes in market conditions, including changes in interest rates, liquidity, prepayment, and/or default expectations and the level of uncertainty in the market for a particular asset class, may cause
|
FREDDIE MAC
| 2018 Form 10-K
|
192
|
|
|
Risk Factors
|
Market Risk
|
fluctuations in market spreads (also referred to as OAS). Our financial results and net worth can be significantly affected by changes in market spreads, especially results driven by financial instruments that are measured at fair value. These instruments include trading securities, available-for-sale securities, derivatives, loans held-for-sale, and loans and debt with the fair value option elected.
A widening of the market spreads on a given asset is typically associated with a decline in the fair value of that asset, which may adversely affect our near-term financial results and net worth. While wider market spreads may create favorable investment opportunities, our ability to take advantage of any such opportunities is limited due to various restrictions on our mortgage-related investments portfolio activities. See
MD&A - Conservatorship and Related Matters -
Limits on Our Mortgage-Related Investments Portfolio and Indebtedness.
A narrowing or tightening of the market spreads on a given asset is typically associated with an increase in the fair value of that asset. Narrowing market spreads may reduce the number of attractive investment opportunities and could increase the cost of our activities to support the liquidity and price performance of our PCs and other securities. Consequently, a tightening of the market spreads on our assets may adversely affect our future financial results and net worth.
Changes in market spreads also affect the fair value of our debt with the fair value option elected. A narrowing or tightening of the market spreads on a given liability is typically associated with an increase in the fair value of that liability, which is recognized as a loss by us.
|
FREDDIE MAC
| 2018 Form 10-K
|
193
|
|
|
Risk Factors
|
Operational Risks
|
OPERATIONAL RISKS
A failure in our operational systems or infrastructure, or those of third parties, could impair our liquidity, disrupt our business, damage our reputation, and cause losses.
We face significant levels of operational risk due to a variety of factors, including the size and complexity of our business operations, the amount of change to our core systems required to keep pace with regulatory and other requirements and business initiatives, and the ever-changing cybersecurity landscape. Shortcomings or failures in our internal processes, people, or systems, or those of third parties with which we interact, could lead to impairment of our liquidity, disruption of our business (e.g., issuing mortgage and/or debt securities), incorrect payments to investors in our securities, errors in our financial statements, liability to customers or investors, further legislative or regulatory intervention, reputational damage, and financial and economic loss.
Our business is highly dependent on our ability to process a large number of transactions on a daily basis and manage and analyze significant amounts of information, much of which is provided by third parties. This information may be incorrect, or we may fail to properly manage or analyze it.
The transactions we process are complex and are subject to various legal, accounting, and regulatory standards, which can change rapidly in response to external events, such as the implementation of government-mandated programs and changes in market conditions. Our financial, accounting, data processing, or other operating systems and facilities may contain design flaws or may fail to operate properly, adversely affecting our ability to process these transactions, including our ability to compile and process legally required information. We have certain systems that require manual support and intervention, which may lead to heightened risk of system failures. The inability of our systems to accommodate an increasing volume of transactions or new types of transactions or products could constrain our ability to pursue new business initiatives or improve existing business activities.
Our technological connections with our customers, counterparties, service providers, and other financial institutions continue to increase, which increases our risk exposure with respect to an operational failure of their infrastructure systems. We have developed, and expect to continue to develop, software tools for use by our customers in the customers' loan production and other processes. These tools may fail to operate properly, which could disrupt our or our customers' business and adversely affect our relationships with our customers.
We are in the process of migrating a number of our core information technology and other systems and customer-facing applications to a third-party cloud infrastructure platform. If we do not execute the transition to these new environments in a well-managed, secure, and effective manner, we may experience unplanned service disruption or unforeseen costs which may harm our business and operating results. In addition, our cloud infrastructure providers, or other service providers, could experience system breakdowns or failures, outages, downtime, cyber-attacks, adverse changes to financial condition, bankruptcy, or other adverse conditions, which could have a material adverse effect on our business and reputation. Thus, our plans to increase the amount of our infrastructure that we outsource to "the cloud" or to other third parties may increase our risk exposure.
We face increased operational risk due to the magnitude and complexity of the new initiatives we are undertaking, including our efforts to help build a better housing finance system. Some of these initiatives require significant changes to our operational systems. In some cases, the changes must be implemented within a short period of time. Our legacy systems may create increased operational risk for
|
FREDDIE MAC
| 2018 Form 10-K
|
194
|
|
|
Risk Factors
|
Operational Risks
|
these new initiatives. Internal corporate reorganizations may also increase our operational risk, particularly during the period of implementation.
We also face significant risks related to the FHFA-directed development of the UMBS with Fannie Mae and CSS and the development and operation of the CSP. The transition to the CSP presents significant operational and technological challenges. In addition, we will increasingly rely on CSS and the CSP (which is owned and operated by CSS) for the operation of our single-family securitization activities, particularly after implementation of the UMBS and other aspects of the Single Security initiative, which are currently scheduled for June 3, 2019. Our business activities would be adversely affected and the market for Freddie Mac securities would be disrupted if the CSP were to fail or otherwise become unavailable to us or if CSS were unable to perform its obligations to us, including as a result of an operational failure by Fannie Mae. In the event of a CSS operational failure, we may be unable to issue certain new single-family mortgage-related securities, and investors in mortgage-related securities hosted on the CSS platform may experience payment delays. Any measures we could take to mitigate these risks might not be sufficient to prevent our business from being harmed.
Our employees could act improperly for their own or third-party gain and cause unexpected losses or reputational damage. While we have processes and systems in place designed to prevent and detect fraud, there can be no assurance that such processes and systems will be successful.
Most of our key business activities are conducted in our offices in Virginia and represent a concentrated risk of people, technology, and facilities. As a result, an infrastructure disruption in the area near our offices or affecting the power grid, such as from a terrorist event or natural disaster, could significantly adversely affect our ability to conduct normal business operations. Any measures we take to mitigate this risk may not be sufficient to respond to the full range of events that may occur or allow us to resume normal business operations in a timely manner.
Potential cybersecurity threats are changing rapidly and growing in sophistication. We may not be able to protect our systems or the confidentiality of our information from cyberattack and other unauthorized access, disclosure, and disruption.
Our operations rely on the secure, accurate, and timely receipt, processing, storage, and transmission of confidential and other information in our computer systems and networks and with customers, counterparties, service providers, and financial institutions.
Information risks for companies like ours have significantly increased in recent years, in part because of the proliferation of new technologies, the use of the internet and telecommunications technologies to conduct financial transactions, and the increased sophistication and activities of organized crime, hackers, terrorists, and other external parties, including foreign state-sponsored actors. There have been several highly publicized cases involving financial services companies, consumer-based companies, and other organizations reporting the unauthorized disclosure of client, customer, or other confidential information, as well as cyberattacks involving the dissemination, theft, or destruction of corporate information, intellectual property, cash, or other valuable assets. There have also been several highly publicized cases where hackers have requested "ransom" payments in exchange for not disclosing customer information or for not making the targets' computer systems unavailable. In addition, there have been cases where hackers have misled company personnel into making unauthorized transfers of funds to the hackers' accounts.
|
FREDDIE MAC
| 2018 Form 10-K
|
195
|
|
|
Risk Factors
|
Operational Risks
|
Like many companies and government entities, from time to time we have been, and likely will continue to be, the target of attempted cyberattacks, including malware, denial-of-service, and phishing, as part of an effort to disrupt operations, potentially test cybersecurity capabilities, or obtain confidential, proprietary, or other information. We could also be adversely affected by cyberattacks that target the infrastructure of the internet, as such attacks could cause widespread unavailability of websites and degrade website performance. Our risk and exposure to these matters remain heightened because of, among other things, the evolving nature of these threats, our role in the financial services industry, the outsourcing of some of our business operations, and the current global economic and political environment.
Because we are interconnected with and dependent on third-party vendors, exchanges, clearinghouses, fiscal and paying agents, and other financial institutions, we could be adversely affected if any of them is subject to a successful cyberattack or other information security event. Third parties with which we do business may also be sources of cybersecurity or other technology risks. We routinely transmit and receive personal, confidential, and proprietary information by electronic means. This information could be subject to interception, misuse, or mishandling. Our exposure to these risks could increase as a result of our proposed migration of core systems and applications to a third-party cloud environment.
Although we devote significant resources to protecting our critical assets and provide employee awareness training about phishing, malware, and other cyber risks, there is no assurance that these measures will provide effective security. Our computer systems, software, end point devices, and networks may be vulnerable to cyberattack, unauthorized access, supply chain disruptions, computer viruses or other malicious code, or other attempts to harm them or misuse or steal information. We routinely identify cyber threats as well as vulnerabilities in our systems and work to address them, but these efforts may be insufficient. Breaches of our security measures may result from employee error or misconduct. Outside parties may attempt to induce employees, customers, counterparties, service providers, financial institutions, or other users of our systems to disclose sensitive information in order to gain access to our systems and the information they contain. We may not be able to anticipate, detect, or recognize threats to our systems and assets, or implement effective preventative measures against security breaches, especially because the techniques used change frequently or are not recognized until launched.
A cyberattack could occur and persist for an extended period of time without detection. We expect that any investigation of a cyberattack would take time, during which we would not necessarily know the extent of the harm or how best to remediate it. Although to date we have not experienced any cyberattacks resulting in significant impacts to the company, there is no assurance that our cybersecurity risk management program will prevent cyberattacks from having significant impacts in the future. We have obtained insurance coverage relating to cybersecurity risks, but this insurance may not be sufficient to provide adequate loss coverage.
The occurrence of one or more cyberattacks could result in thefts of important assets (such as cash or source code) or the unauthorized disclosure, misuse, or corruption of confidential and other information (including information about our borrowers, our customers, or our counterparties) or could otherwise cause interruptions or malfunctions in our operations or the operations of our customers or counterparties. This could result in significant losses or reputational damage, adversely affect our relationships with our customers and counterparties, negatively affect our competitive position, or otherwise harm our business. We could also face regulatory and other legal action, including for any failure to provide timely disclosure concerning, or appropriately to limit trading in our securities following,
|
FREDDIE MAC
| 2018 Form 10-K
|
196
|
|
|
Risk Factors
|
Operational Risks
|
an attack. We might be required to expend significant additional resources to modify our internal controls and other protective measures or to investigate and remediate vulnerabilities or other exposures, and we might be subject to litigation and financial losses that are not fully insured. In addition, there can be no assurance that customers, counterparties, financial intermediaries, and governmental organizations are adequately protecting the information that we share with them. As a result, a cyberattack on their systems and networks, or a breach of their security measures, may result in harm to our business and business relationships.
We rely on third parties for certain important functions. Any failures by those vendors and service providers (or other third parties that work for the vendors/service providers) could disrupt our business operations or expose us to loss of confidential information or intellectual property.
Our use of vendors and service providers exposes us to the risk of failures in their risk and control environments. We outsource certain key functions to external parties, including some that are critical to financial reporting (including our use of hedge accounting), valuations, our mortgage-related investment activity, loan underwriting, loan servicing, and PC issuance and administration (i.e., CSS). We may enter into other key outsourcing relationships in the future, including in connection with a proposal to expand our use of public cloud services. If one or more of these key external parties were not able to perform their functions for a period of time, perform them at an acceptable service level or handle increased volumes, or if one of them experiences a disruption in its own business or technology from any cause, our business operations could be constrained, disrupted, or otherwise negatively affected. Our use of vendors also exposes us to the risk of losing intellectual property or confidential information and to other harm, including to our reputation. Our ability to monitor the activities or performance of vendors and service providers may be constrained, which may make it difficult for us to assess and manage the risks associated with these relationships.
We face risks and uncertainties associated with the models that we use to inform business and risk management decisions and for financial accounting and reporting purposes.
We use models to project significant factors in our businesses, including, but not limited to, interest rates and house prices under a variety of scenarios. We also use models to project borrower prepayment and default behavior and loss severity over long periods of time. Models are inherently imperfect predictors of actual results. There is inherent uncertainty associated with model projections of economic variables and the downstream projections of prepayment and default behavior dependent on these variables.
Uncertainty and risks related to models may arise from a number of sources, including the following:
|
n
|
We could fail to design, implement, operate, adjust, or use our models as intended. We may fail to code a model correctly, we could use incorrect or insufficient data inputs or fail to fully understand the data inputs, or model implementation software could malfunction. The complexity and interconnectivity of our models create additional risk regarding the accuracy of model output. We may not be able to deploy or update models in a timely manner.
|
|
n
|
When market conditions change in unforeseen ways, our model projections may not accurately reflect these conditions, or we may not fully understand the model outputs. For example, models may not fully reflect the effect of certain government policy changes or new industry trends. In such cases, it is often necessary to make assumptions and judgments to accommodate the effect of
|
|
FREDDIE MAC
| 2018 Form 10-K
|
197
|
|
|
Risk Factors
|
Operational Risks
|
scenarios that are not sufficiently well represented in the historical data. While we may adjust our models in response to new events, considerable residual uncertainty remains.
|
n
|
We also use selected third-party models. While the use of such models may reduce our risk where no internal model is available, it exposes us to additional risk, as third parties typically do not provide us with proprietary information regarding their models. We have little control over the processes by which these models are adjusted or changed. As a result, we may be unable to fully evaluate the risks associated with the use of such models.
|
We risk making poor business decisions in situations where we rely on models to provide key information. Our use of models could affect decisions concerning the purchase, sale, securitization, and credit risk transfer of loans; the purchase and sale of securities; funding; the setting of guarantee fee prices; and the management of interest-rate, market, and credit risk. Our use of models also affects our quality-control sampling strategies for loans in our single-family credit guarantee portfolio and potential settlements with our counterparties. Our use of hedge accounting increases our reliance on models for financial reporting. See
MD&A - Risk Management - Market Risk
and
Critical Accounting Policies and Estimates
for more information on our use of models.
|
FREDDIE MAC
| 2018 Form 10-K
|
198
|
|
|
Risk Factors
|
Liquidity Risks
|
LIQUIDITY RISKS
Our activities may be adversely affected by limited availability of financing and increased funding costs.
The amount, type, and cost of our unsecured funding directly affects our interest expense and results of operations. A number of factors could make such financing more difficult to obtain, more expensive, or unavailable on any terms, including:
|
n
|
Market and other factors;
|
|
n
|
Changes in U.S. government support for us; and
|
|
n
|
Reduced demand for our debt securities.
|
Market and Other Factors
Our ability to obtain funding in the public unsecured debt markets or by selling or pledging mortgage-related and other securities as collateral to other institutions could change rapidly or cease. The cost of available funding could increase significantly due to changes in market interest rates, market confidence, operational risks, regulatory requirements, and other factors.
Prolonged wide market spreads on long-term debt could cause us to reduce our long-term debt issuances and increase our reliance on short-term and callable debt issuances. Such increased reliance on short-term and callable debt could increase the risk that we may be unable to refinance our debt when it becomes due and result in a greater use of derivatives. Greater derivatives use could increase the variability of our comprehensive income or increase our credit exposure to our counterparties. Additionally, we may incur higher hedging costs in the event we decide not to call our debt.
We may incur higher funding costs due to our liquidity management practices and procedures. There can be no assurance that such practices and procedures would provide us with sufficient liquidity to meet our ongoing cash obligations under all circumstances. In particular, we believe that our liquidity contingency plans may be inadequate or difficult to execute during a liquidity crisis or period of significant market turmoil. If we cannot access the unsecured debt markets, our ability to repay maturing indebtedness and fund our operations could be significantly impaired or eliminated, as our alternative sources of liquidity (e.g., cash and other investments) may not be sufficient to meet our liquidity needs. We have limited ability to use the less liquid assets in our mortgage-related investments portfolio as a significant source of liquidity (e.g., through sales or as collateral in secured borrowing transactions).
We make extensive use of the Federal Reserve's payment system in our business activities. The Federal Reserve requires that we fully fund accounts at the Federal Reserve Bank of New York to the extent necessary to cover cash payments on our debt and mortgage-related securities each day, before the Federal Reserve Bank of New York, acting as our fiscal agent, will initiate such payments. Although we seek to maintain sufficient intraday liquidity to fund our activities through the Federal Reserve's payment system, we have limited access to cash once the debt markets are closed for the day. Insufficient cash may cause our account to be overdrawn, potentially resulting in penalties and reputational harm. Unlike certain of our competitors, we do not have access to the Federal Reserve's discount window or emergency credit facilities.
|
FREDDIE MAC
| 2018 Form 10-K
|
199
|
|
|
Risk Factors
|
Liquidity Risks
|
Changes in U.S. Government Support
Treasury supports us through the Purchase Agreement and Treasury's ability to purchase up to $2.25 billion of our obligations under its permanent statutory authority. Changes or perceived changes in the U.S. government's support for us could have a severe negative effect on our access to the unsecured debt markets and our debt funding costs. Our access to the unsecured debt markets and the costs of our debt funding could be adversely affected by several factors relating to U.S. government support, including:
|
n
|
Uncertainty about the future of the GSEs;
|
|
n
|
Any concerns by debt investors that we face increasing risk of being placed in receivership; and
|
|
n
|
Future draws that significantly reduce the amount of available funding remaining under the Purchase Agreement.
|
The amount of the net worth sweep dividends we pay to Treasury could vary substantially from quarter to quarter for a number of reasons, including as a result of non-cash changes in net worth. It is possible that, due to non-cash increases in net worth, such as increases in the fair value of our securities or a reduction in our loan loss reserves, the amount of our dividend for a quarter could exceed the amount of available cash, which could have an adverse effect on our financial results.
For more information, see
MD&A - Liquidity and Capital Resources -
Capital Resources.
Reduced Demand for Debt Securities
If investor demand for our debt securities were to decrease, our liquidity, business, and results of operations could be materially adversely affected. The willingness of investors to purchase and hold our debt securities can be influenced by many factors, including changes in the world economy, changes in exchange rates, and regulatory and political factors, as well as the availability of and investor preferences for other investments. We compete for debt funding with Fannie Mae, the FHLBs, and other institutions. Our funding costs and liquidity contingency plans may also be affected by changes in the amount of, and demand for, debt issued by Treasury.
If investors were to reduce their purchases of our debt securities or divest their holdings, our funding costs could increase and our business activities could be curtailed. The market for our debt securities may become less liquid as a result of our having reached the Purchase Agreement limits on the size of our mortgage-related investments portfolio and the amount of our unsecured debt. This could lead to a decrease in demand for our debt securities and an increase in our funding costs.
See
MD&A - Our Business Segments - Capital Markets
for a description of our debt issuance programs.
Any downgrade in the credit ratings of the U.S. government would likely be followed by a downgrade in our credit ratings. A downgrade in the credit ratings of our debt could adversely affect our liquidity and other aspects of our business.
Our credit ratings are important to our liquidity. We currently receive ratings for our unsecured debt from two nationally recognized statistical rating organizations (S&P and Moody's). These ratings are primarily based on the support we receive from Treasury, and therefore are affected by changes in the credit ratings of the U.S. government. Any downgrade in the credit ratings of the U.S. government would be expected to be followed or accompanied by a downgrade in our credit ratings.
|
FREDDIE MAC
| 2018 Form 10-K
|
200
|
|
|
Risk Factors
|
Liquidity Risks
|
In addition to a downgrade in the credit ratings of or outlook on the U.S. government, several other events could adversely affect our debt credit ratings, including actions by governmental entities, changes in government support for us, future GAAP losses, and additional draws under the Purchase Agreement. Any such downgrades could lead to major disruptions in the mortgage and financial markets and to our business due to lower liquidity, higher borrowing costs, lower asset values, and higher credit losses, and could cause us to experience net losses and net worth deficits.
For more information, see
MD&A - Liquidity and Capital Resources -
Liquidity Profile
- Primary Sources of Funding - Credit Ratings
.
|
FREDDIE MAC
| 2018 Form 10-K
|
201
|
|
|
Risk Factors
|
Legal and Regulatory Risks
|
LEGAL AND REGULATORY RISKS
Legislative or regulatory actions could adversely affect our business activities and financial results.
We operate in a highly regulated industry and are subject to heightened supervision from FHFA, as our Conservator. Our compliance systems and programs may not be adequate to ensure that we are in compliance with all legal and other requirements. We could incur fines or other negative consequences for inadvertent violations.
Our business may be directly adversely affected by future legislative, regulatory or judicial actions at the federal, state, and local levels. Such actions could affect us in a number of ways, including by imposing significant additional legal, compliance, and other costs on us, limiting our business activities and diverting management attention or other resources.
Our ability to recruit and retain executives and other employees with the necessary skills to conduct our business may be adversely affected by legislative or regulatory actions (e.g., significant restrictions on compensation). We could also be negatively affected by legislative, regulatory, or judicial action that:
|
n
|
Changes the foreclosure process;
|
|
n
|
Limits or otherwise adversely affects the rights of a holder of a first lien on a mortgage (such as by granting priority rights in foreclosure proceedings for homeowner associations or providing a lien priority in connection with loans to finance energy efficiency or similar improvements);
|
|
n
|
Expands the responsibilities of and costs to servicers for maintaining vacant properties prior to foreclosure; or
|
|
n
|
Prevents us from using the MERS System or disrupts foreclosures of loans registered in the MERS System.
|
We are subject to complex and evolving laws and regulations governing privacy and the protection of personal information of individuals as well as the protection of material, non-public information. Our business could be adversely affected if we fail to protect the confidentiality of such information or if it is mishandled or misused.
Regulatory changes related to the Dodd-Frank Act, including expiration or modification of the temporary exemption for GSE-eligible mortgages included in the CFPB's Qualified Mortgage Rule, could cause or require us to make changes to our business practices, such as practices related to mortgage underwriting and servicing.
Legislation or regulatory actions could indirectly adversely affect us to the extent they affect the activities of banks, savings institutions, insurance companies, derivative counterparties, clearinghouses, securities dealers, and other regulated entities that constitute a significant portion of our customers or counterparties, or to the extent that they modify industry practices. Legislative or regulatory actions that remove incentives for these entities to purchase our securities or enter into derivatives or other transactions with us could have a material adverse effect on our business and financial results. Changes in business practices resulting from new laws and regulations could have a negative effect on the volume of loan originations or could modify or remove incentives for financial institutions to sell loans to us, either of which could adversely affect the number of loans available for us to purchase or guarantee.
In addition, the emerging regulatory framework based on the Basel III standards developed by the Basel Committee on Banking Supervision could decrease demand for our debt and mortgage-related
|
FREDDIE MAC
| 2018 Form 10-K
|
202
|
|
|
Risk Factors
|
Legal and Regulatory Risks
|
securities and/or affect competition in the market for loan originations and servicing, with possible adverse consequences for our business and financial results. The phase-in of enhanced capital and liquidity requirements for banking organizations may also reduce the level of participation of such organizations in (and thus the liquidity of) trading markets for various types of financial instruments, including asset-backed securities. In turn, this could decrease the liquidity of the markets for our debt and mortgage-related securities, which could increase our funding and other costs and adversely affect our business.
We may make certain changes to our business in an attempt to meet our housing goals and duty to serve requirements, which may adversely affect our profitability.
We may make adjustments to our loan sourcing and purchase strategies in an effort to meet our housing goals and subgoals, including relaxing some of our underwriting standards and expanding the use of targeted initiatives to reach underserved populations. For example, we may purchase loans that offer lower expected returns on our investment and potentially increase our exposure to credit losses. We may also make changes to our business in response to our duty to serve underserved markets that could adversely affect our profitability.
If we do not meet our housing goals or duty to serve requirements, and FHFA finds that the goals or requirements were feasible, we may become subject to a housing plan that could require us to take additional steps that could potentially adversely affect our profitability. Due to our failure to meet two single-family housing goals for 2014 and 2015, we operated under an FHFA-approved housing plan that addressed achievement of the missed goals through 2018. FHFA has not required us to extend the housing plan beyond 2018, but it will continue to closely monitor and evaluate our housing goals performance in 2018 and 2019, and could require us to take additional steps or operate under a housing plan again in the future.
We are involved in legal proceedings that could result in the payment of substantial damages or otherwise harm our business.
We are a party to various claims and other legal proceedings. We also have been, and in the future may be, involved in governmental investigations and regulatory proceedings and IRS examinations. In addition, certain of our former officers are involved in legal proceedings for which they may be entitled to reimbursement by us for related costs and expenses. We may be required to establish reserves and to make substantial payments in the event of adverse judgments or settlements of any such claims, proceedings, investigations, or examinations. Any related issue, even if resolved in our favor, could result in negative publicity or cause us to incur significant legal and other expenses. Furthermore, the costs (including settlement costs) related to these legal proceedings and governmental investigations and examinations may differ from our expectations and exceed our reserves or require adjustments to such reserves. These various matters could divert management's attention and other resources from the needs of the business. In addition, numerous lawsuits have been filed against the U.S. government relating to conservatorship and the Purchase Agreement that could adversely affect us. See
Legal Proceedings
and
Note 16
for information about these various pending legal proceedings.
|
FREDDIE MAC
| 2018 Form 10-K
|
203
|
|
|
Risk Factors
|
Other Risks
|
OTHER RISKS
The loss of business from a key customer or a decrease in the availability of mortgage insurance could result in a decline in our market share and revenues.
Our business depends on our ability to acquire a steady flow of loans. We purchase a significant percentage of our single-family loans from several large loan originators. Similarly, we acquire a significant portion of our multifamily loans from several large lenders. For more information, see
Note 14
.
We enter into loan purchase commitments with many of our single-family customers that are typically less than one year in duration. Lenders may fail to deliver loans to us in accordance with their commitments. The loss of business from any of our major lenders could adversely affect our market share and revenues.
Our Charter requires that single-family loans with LTV ratios above 80% at the time of purchase be covered by mortgage insurance or other credit enhancements. If the availability of mortgage insurance for loans with LTV ratios above 80% is reduced, we may be restricted in our ability to purchase or securitize such loans. This could reduce our overall volume of new business.
Competition from banking and non-banking institutions (including Fannie Mae and FHA/VA with Ginnie Mae securitization) may harm our business. FHFA's actions, as Conservator of both companies, could affect competition between us and Fannie Mae.
Competition in the secondary mortgage market may make it more difficult for us to purchase mortgage loans. Increased competition from Fannie Mae, FHA/VA (with Ginnie Mae securitization), and new entrants may alter our product mix, lower our volumes, and reduce our revenues on new business.
We also compete with other financial institutions that retain or securitize loans, such as commercial and investment banks, dealers, savings institutions, and insurance companies. There is a risk that financial institutions may retain loans with better credit characteristics rather than sell them to us, or otherwise seek to structure financial transactions that result in our loan purchases having a higher proportion of loans with lower credit scores and higher LTV ratios. While we charge upfront fees for higher levels of credit risk, sellers' retention of loans with better credit characteristics could result in us having lower overall purchase volumes and a more adverse credit risk profile, reducing our revenues and returns.
FHFA is also Conservator of Fannie Mae, our primary competitor. FHFA's actions, as Conservator of both companies, could affect competition between us and Fannie Mae. It is possible that FHFA could require us and Fannie Mae to take a uniform approach that, because of differences in our respective businesses, could place Freddie Mac at a competitive disadvantage to Fannie Mae. FHFA also may prevent us from taking actions that could give us a competitive advantage.
We have faced increased competition in the multifamily market in recent years from life insurers, banks, CMBS conduits, and other market participants as multifamily market fundamentals have improved. FHFA may take actions that could encourage further competition or limit our ability to meet such competition.
|
FREDDIE MAC
| 2018 Form 10-K
|
204
|
|
|
Risk Factors
|
Other Risks
|
A significant decline in the price performance of or demand for our PCs could have an adverse effect on the volume and/or profitability of our new single-family guarantee business.
The price performance of our PCs relative to comparable Fannie Mae securities is one of Freddie Mac's more significant risks and competitive issues. Our PCs are an integral part of our loan purchase program. Our competitiveness in purchasing single-family loans from our sellers and the volume and profitability of our new single-family guarantee business are directly affected by the price performance of our PCs relative to comparable Fannie Mae securities.
Our PCs have typically traded at a discount relative to comparable Fannie Mae securities. This difference in relative pricing creates an economic incentive for sellers to conduct a disproportionate share of their single-family business with Fannie Mae.
There may not be a liquid market for our PCs, which could adversely affect their price performance and our single-family market share. A significant reduction in our market share, and thus in the volume of loans that we securitize, or a reduction in the trading volume of our PCs could further reduce the liquidity of our PCs. While we may employ various strategies to support the liquidity and price performance of our PCs, those strategies may fail or adversely affect our business. We may cease such activities at any time, or FHFA could require us to do so, which could adversely affect the liquidity and price performance of our PCs.
The liquidity-related price differences between our PCs and comparable Fannie Mae securities could be influenced by factors that are largely outside of our control. For example, the level of the Federal Reserve's purchases and sales of agency mortgage-related securities, including the balance sheet normalization program to reduce the Federal Reserve's holdings of mortgage-related securities, could affect the demand for and values of our PCs. Therefore, any strategies we employ to reduce the liquidity-related price differences may not reduce or eliminate these price differences over the long term.
In certain circumstances, we compensate sellers for the difference in price between our PCs and comparable Fannie Mae securities by reducing our guarantee fees, which adversely affects the profitability of our single-family guarantee business. We also incur costs in connection with our efforts to support the liquidity and price performance of our PCs, including by engaging in transactions that yield less than our target rate of return. For more information, see
MD&A - Our Business Segments - Single-Family Guarantee -
Business Overview - Products and Activities
and
- Capital Markets Segment -
Business Overview - Products and Activities
.
The Single Security initiative is intended to reduce the pricing disparity between UMBS (the successor to the Gold PC) issued by us and UMBS issued by Fannie Mae. There can be no assurance that the UMBS will be successful or that the pricing disparity will be eliminated or reduced. Freddie Mac is currently expected to cease issuing Gold PCs on June 3, 2019.
The initiative to develop the UMBS presents increased operational and counterparty risk. If this initiative is not successfully implemented or if the UMBS does not receive widespread market acceptance, the liquidity and price performance of our single-family mortgage-related securities and our market share and profitability could be adversely affected.
In accordance with FHFA's 2014 Strategic Plan and the Conservatorship Scorecards, we are developing a single (common) security, the UMBS, which is designed to reduce the price performance disparities between the mortgage-related securities of Freddie Mac and Fannie Mae. This initiative is complex and
|
FREDDIE MAC
| 2018 Form 10-K
|
205
|
|
|
Risk Factors
|
Other Risks
|
requires significant changes to trading processes and systems of key market participants. It is possible that we could experience a disruption in the liquidity of Freddie Mac mortgage-related securities during the period in which we transition to the UMBS and other aspects of the Single Security initiative. Although we expect to employ various strategies as needed to support the transition to and liquidity of the UMBS, these strategies may fail or adversely affect our business, and they may be discontinued at any time. We have been required by FHFA to align certain of our single-family mortgage purchase offerings, servicing, and securitization practices with Fannie Mae to achieve market acceptance of the UMBS and other aspects of the Single Security initiative, but there can be no assurance that the UMBS will reduce the pricing disparities discussed above. These alignment activities may adversely affect our business and our ability to compete with Fannie Mae. We may be required to further align our business processes with those of Fannie Mae. Uncertainty concerning the timing of implementation of the UMBS or the extent of the alignment between Freddie Mac's and Fannie Mae's mortgage purchase, servicing, and securitization practices may affect the degree to which the UMBS and other aspects of the Single Security initiative receive widespread market acceptance.
It is possible that uncertainty surrounding the implementation and overall impact of the UMBS could contribute to declines in the liquidity or market value of our single-family mortgage-related securities. The industry has expressed concerns that Freddie Mac and Fannie Mae UMBS may not be truly fungible. If investors do not accept the fungibility of Freddie Mac and Fannie Mae UMBS or if investors prefer Fannie Mae UMBS over Freddie Mac UMBS, it could have a significant adverse impact on our business, liquidity, financial condition, net worth, and results of operations, and could adversely affect the liquidity or market value of our single-family mortgage-related securities.
The Single Security initiative will also cause us to have counterparty credit exposure to Fannie Mae. Once the initiative is implemented, investors will be able to commingle certain Freddie Mac and Fannie Mae securities in resecuritizations. When we resecuritize Fannie Mae securities, our guarantee of principal and interest would extend to the underlying Fannie Mae securities. In the event Fannie Mae were to fail to make a payment on a Fannie Mae security that we resecuritized, Freddie Mac would be responsible for making the payment. We will not control or limit the amount of resecuritized Fannie Mae securities that we could be required to guarantee. We will be dependent on FHFA, Fannie Mae, and Treasury (pursuant to Fannie Mae's and our respective Purchase Agreements with Treasury) to avoid a liquidity event or default. We are not planning to modify our liquidity strategies to address the possibility of non-timely payment by Fannie Mae.
The profitability of our multifamily business could be adversely affected by a significant decrease in demand for our K Certificates and SB Certificates.
Our current multifamily business model is highly dependent on our ability to finance purchased multifamily loans through securitization into K Certificates and SB Certificates. A significant decrease in demand for K Certificates and SB Certificates could have an adverse impact on the profitability of the multifamily business to the extent that our holding period for the loans increases and we are exposed to credit, spread, and other market risks for a longer period of time or receive reduced proceeds from securitization. We employ various strategies to support the liquidity of our K Certificates and SB Certificates, but those strategies may fail or adversely affect our business. We may cease such activities at any time, or FHFA could require us to do so, which could adversely affect the liquidity and price performance of our K Certificates and SB Certificates.
|
FREDDIE MAC
| 2018 Form 10-K
|
206
|
|
|
Risk Factors
|
Other Risks
|
There may not be an active, liquid trading market for our equity securities.
Our common stock and the publicly traded classes of our preferred stock trade exclusively on the OTCQB Marketplace. Trading volumes on the OTCQB Marketplace can fluctuate significantly, which could make it difficult for investors to execute transactions in our securities and could cause declines or volatility in the prices of our equity securities.
The discontinuance of LIBOR after 2021 could negatively affect the fair value of our financial assets and liabilities, results of operations, and net worth. A transition to an alternative reference interest rate could present operational problems and result in market disruption, including inconsistent approaches for different financial products, as well as disagreements with counterparties.
The Chief Executive of the United Kingdom's Financial Conduct Authority (FCA) has announced the FCA's intention to cease sustaining LIBOR after 2021. He has also indicated that market participants should expect LIBOR to be subsequently discontinued and should proceed expeditiously with preparations for transitioning to an alternative reference interest rate. U.S. regulators have made similar statements.
The Federal Reserve Board convened the Alternative Reference Rates Committee (ARRC) to identify a set of alternative reference interest rates for possible use as market benchmarks. Based on the ARRC's recommendation, the Federal Reserve Bank of New York began publishing the Secured Overnight Financing Rate (SOFR) and two other alternative rates beginning in April 2018. Since then, certain derivative products and debt securities tied to SOFR have been introduced, and various industry groups have continued working to develop plans and documentation to facilitate a transition to SOFR as the new market benchmark.
We are not able to predict whether LIBOR will actually cease to be available after 2021, whether SOFR will become the market benchmark in its place, or what impact such a transition may have on our business, results of operations, and financial condition. We have various financial products, including mortgage loans, mortgage-related securities, other debt securities, and derivatives, that are tied to LIBOR, and we continue to enter into transactions involving such products that will mature after 2021. While the documentation for many of these products provides us with discretion to select an alternative reference rate if LIBOR is discontinued, there is a possibility of disagreement with counterparties concerning our exercise of this discretion.
The selection of SOFR as the alternative reference rate for these products currently presents certain market concerns, because a term structure for SOFR has not yet developed, and there is not yet a generally accepted methodology for adjusting SOFR, which represents an overnight, risk-free rate, so that it will be comparable to LIBOR, which has various tenors and reflects a risk component. In addition, SOFR may not be a suitable alternative to LIBOR for all of our financial products, and it is uncertain what other rates might be appropriate for that purpose. Although the majority of the ARMs we currently purchase are tied to LIBOR, we also currently purchase ARMs tied to other indices, including constant maturity Treasury indices published by the Federal Reserve Board. It is uncertain whether these other indices will remain acceptable alternatives for such products, or how long it will take us to develop the systems and processes necessary to purchase ARMs tied to SOFR or other new indices. Inconsistent approaches to a transition from LIBOR to an alternative rate among different market participants and for different financial products may cause market disruption and operational problems, which could
|
FREDDIE MAC
| 2018 Form 10-K
|
207
|
|
|
Risk Factors
|
Other Risks
|
adversely affect us, including by exposing us to increased basis risk and resulting costs in connection with our hedging and other business activities.
|
FREDDIE MAC
| 2018 Form 10-K
|
208
|
|
|
Legal Proceedings
|
Legal Proceedings
We are involved as a party to a variety of legal proceedings arising from time to time in the ordinary course of business. See
Note 16
for more information regarding our involvement as a party to various legal proceedings. We discuss below certain litigation against the U.S. government concerning conservatorship and the Purchase Agreement.
Over the last several years, numerous lawsuits have been filed against the U.S. government and, in some cases, the Secretary of the Treasury and the Director of FHFA. These lawsuits challenge certain government actions related to the conservatorship (including actions taken in connection with the imposition of conservatorship) and the Purchase Agreement. Several of the lawsuits seek to invalidate the net worth sweep dividend provisions of the senior preferred stock, which were implemented pursuant to the August 2012 amendment to the Purchase Agreement. Some of these cases also have challenged the constitutionality of the structure of FHFA. A number of cases have been dismissed. Cases are currently pending in the U.S. Court of Federal Claims, the U.S. District Court for the Western District of Michigan, and the U.S. District Court for the Eastern District of Pennsylvania. In addition, plaintiffs are appealing a July 2018 order by the U.S. District Court for the District of Minnesota to dismiss the case in that Court. Plaintiffs also are appealing a May 2017 order by the U.S. District Court for the Southern District of Texas to dismiss the case in that Court; the U.S. Court of Appeals for the Fifth Circuit is considering the appeal en banc. It is possible that additional similar lawsuits will be filed in the future.
Freddie Mac is not a party to any of these lawsuits. However, a number of other lawsuits have been filed against Freddie Mac concerning the August 2012 amendment to the Purchase Agreement. See
Note 16
for information on the lawsuits filed against Freddie Mac. Pershing Square Capital Management, L.P. (Pershing) is a plaintiff in one of the lawsuits filed against Freddie Mac. Pershing has filed reports with the SEC, most recently in March 2014, indicating that it beneficially owned more than 5% of our common stock. We do not know Pershing's current beneficial ownership of our common stock. For more information, see
Security Ownership of Certain Beneficial Owners and Management and Related Stockholder Matters
.
It is not possible for us to predict the outcome of these lawsuits (including the outcome of any appeal), or the actions the U.S. government (including Treasury and FHFA) might take in response to any ruling or finding in any of these lawsuits or any future lawsuits. However, it is possible that we could be adversely affected by these events, including, for example, by changes to the Purchase Agreement, or any resulting actual or perceived changes in the level of U.S. government support for our business.
|
FREDDIE MAC
| 2018 Form 10-K
|
209
|
|
|
Market for Registrant's Common Equity, Related Stockholder Matters and Issuer Purchases of Equity Securities
|
Market for Registrant's Common Equity, Related Stockholder Matters, and Issuer Purchases of Equity Securities
MARKET INFORMATION
Holders
As of February 1, 2019, we had
1,632
common stockholders of record.
Recent Sales of Unregistered Securities
The securities we issue are "exempted securities" under the Securities Act of 1933. As a result, we do not file registration statements with the SEC with respect to offerings of our securities.
Following our entry into conservatorship, we suspended the operation of, and ceased making grants under, equity compensation plans. Previously, we had provided equity compensation under these plans to employees and members of our Board of Directors. Under the Purchase Agreement, we cannot issue any new options, rights to purchase, participations or other equity interests without Treasury's prior approval. However, grants outstanding as of the date of the Purchase Agreement remain in effect in accordance with their terms. At December 31, 2018, no stock options were outstanding. See
Note 11
for more information.
ISSUER PURCHASES OF EQUITY SECURITIES
We did not repurchase any of our common or preferred stock during 2018. Additionally, we do not currently have any outstanding authorizations to repurchase common or preferred stock. Under the Purchase Agreement, we cannot repurchase our common or preferred stock without Treasury's prior consent, and we may only purchase or redeem the senior preferred stock in certain limited circumstances set forth in the certificate of designation of the senior preferred stock.
TRANSFER AGENT AND REGISTRAR
Computershare Trust Company, N.A.
P.O. Box 505000
Louisville, KY 40233-5000
Telephone: 877-373-6374
https://www-us.computershare.com/investor
|
FREDDIE MAC
| 2018 Form 10-K
|
210
|
|
|
Financial Statements
|
|
|
Financial Statements and Supplementary Data
|
|
FREDDIE MAC
| 2018 Form 10-K
|
211
|
|
|
Financial Statements
|
Report of Independent Registered Public Accounting Firm
|
Report of Independent Registered Public Accounting Firm
To
the Board of Directors and Stockholders of Freddie Mac
Opinions on the Financial Statements and Internal Control over Financial Reporting
We have audited the accompanying consolidated balance sheets of Freddie Mac, a stockholder-owned government sponsored enterprise, and its subsidiaries (the "Company") as of December 31, 2018 and 2017,
and the related consolidated statements of comprehensive income, of equity and of cash flows for each of the three years in the period ended December 31, 2018, including the related notes (collectively referred to as the "consolidated financial statements").
We also have audited the Company's internal control over financial reporting as of December 31, 2018, based on criteria established in
Internal Control - Integrated Framework
(2013)
issued by the Committee of Sponsoring Organizations of the Treadway Commission (COSO).
In our opinion, the consolidated financial statements referred to above present fairly, in all material respects, the financial position of the Company as of December 31, 2018 and 2017, and the results of its operations and its cash flows for each of the three years in the period ended December 31, 2018
in conformity with accounting principles generally accepted in the United States of America. Also in our opinion, the Company did not maintain, in all material respects, effective internal control over financial reporting as of December 31, 2018, based on criteria established in
Internal Control - Integrated Framework
(2013)
issued by the COSO because a material weakness in internal control over financial reporting related to disclosure controls and procedures that do not provide adequate mechanisms for information known to the Federal Housing Finance Agency (FHFA) that may have financial statement disclosure ramifications to be communicated to management of Freddie Mac existed as of that date.
A material weakness is a deficiency, or a combination of deficiencies, in internal control over financial reporting, such that there is a reasonable possibility that a material misstatement of the annual or interim financial statements will not be prevented or detected on a timely basis. The material weakness
referred to above is described in Management's Report on Internal Control over Financial Reporting, appearing under Item 9A. We considered this material weakness in determining the nature, timing, and extent of audit tests applied in our audit of the 2018 consolidated
financial statements, and our opinion regarding the effectiveness of the Company's internal control over financial reporting does not affect our opinion on those consolidated
financial statements.
Basis for Opinions
The Company's management is responsible for these consolidated financial statements, for maintaining effective internal control over financial reporting, and for its assessment of the effectiveness of internal control over financial reporting included in management's report referred to above. Our responsibility is to express opinions on the Company's consolidated financial statements and on the Company's internal control over financial reporting based on our audits. We are a public accounting firm registered with the Public Company Accounting Oversight Board (United States) (PCAOB) and are required to be independent with respect to the Company in accordance with the U.S. federal securities laws and the applicable rules and regulations of the Securities and Exchange Commission and the PCAOB.
|
FREDDIE MAC
| 2018 Form 10-K
|
212
|
|
|
Financial Statements
|
Report of Independent Registered Public Accounting Firm
|
We conducted our audits in accordance with the standards of the PCAOB. Those standards require that we plan and perform the audits to obtain reasonable assurance about whether the consolidated financial statements are free of material misstatement, whether due to error or fraud, and whether effective internal control over financial reporting was maintained in all material respects.
Our audits of the consolidated financial statements included performing procedures to assess the risks of material misstatement of the consolidated financial statements, whether due to error or fraud, and performing procedures that respond to those risks. Such procedures included examining, on a test basis, evidence regarding the amounts and disclosures in the consolidated financial statements. Our audits also included evaluating the accounting principles used and significant estimates made by management, as well as evaluating the overall presentation of the consolidated financial statements. Our audit of internal control over financial reporting included obtaining an understanding of internal control over financial reporting, assessing the risk that a material weakness exists, and testing and evaluating the design and operating effectiveness of internal control based on the assessed risk. Our audits also included performing such other procedures as we considered necessary in the circumstances. We believe that our audits provide a reasonable basis for our opinions.
Emphasis of Matter - Conservatorship
As discussed in
Note 2: Conservatorship and Related Matters
, in September 2008, the Company was placed into conservatorship by FHFA. The U.S. Department of the Treasury (Treasury) has committed financial support to the Company, and FHFA, as Conservator, provided for the Board of Directors to perform certain functions and to oversee management and the Board delegated to management authority to conduct business operations during conservatorship. The Company is dependent upon the continued support of Treasury and FHFA.
Definition and Limitations of Internal Control over Financial Reporting
A company's internal control over financial reporting is a process designed to provide reasonable assurance regarding the reliability of financial reporting and the preparation of financial statements for external purposes in accordance with generally accepted accounting principles. A company's internal control over financial reporting includes those policies and procedures that (i) pertain to the maintenance of records that, in reasonable detail, accurately and fairly reflect the transactions and dispositions of the assets of the company; (ii) provide reasonable assurance that transactions are recorded as necessary to permit preparation of financial statements in accordance with generally accepted accounting principles, and that receipts and expenditures of the company are being made only in accordance with authorizations of management and directors of the company; and (iii) provide reasonable assurance regarding prevention or timely detection of unauthorized acquisition, use, or disposition of the company's assets that could have a material effect on the financial statements.
Because of its inherent limitations, internal control over financial reporting may not prevent or detect misstatements. Also, projections of any evaluation of effectiveness to future periods are subject to the risk that controls may become inadequate because of changes in conditions, or that the degree of compliance with the policies or procedures may deteriorate.
/s/ PricewaterhouseCoopers LLP
McLean, Virginia
February 14, 2019
We have served as the Company's auditor since 2002.
|
FREDDIE MAC
| 2018 Form 10-K
|
213
|
|
|
Financial Statements
|
Consolidated Statements of Comprehensive Income
|
FREDDIE MAC
Consolidated Statements of Comprehensive Income (Loss)
|
|
Year Ended December 31,
|
|||||||||
|
(
In millions
, except share-related amounts)
|
2018
|
2017
|
2016
|
|||||||
|
Interest income
|
||||||||||
|
Mortgage loans
|
|
$66,037
|
|
|
$63,735
|
|
|
$61,040
|
|
|
|
Investments in securities
|
3,035
|
|
3,415
|
|
3,855
|
|
||||
|
Other
|
982
|
|
657
|
|
270
|
|
||||
|
Total interest income
|
70,054
|
|
67,807
|
|
65,165
|
|
||||
|
Interest expense
|
(58,033
|
)
|
(53,643
|
)
|
(50,786
|
)
|
||||
|
Net interest income
|
12,021
|
|
14,164
|
|
14,379
|
|
||||
|
Benefit (provision) for credit losses
|
736
|
|
84
|
|
803
|
|
||||
|
Net interest income after benefit (provision) for credit losses
|
12,757
|
|
14,248
|
|
15,182
|
|
||||
|
Non-interest income (loss)
|
||||||||||
|
Guarantee fee income
|
811
|
|
662
|
|
513
|
|
||||
|
Mortgage loans gains (losses)
|
724
|
|
2,026
|
|
200
|
|
||||
|
Investment securities gains (losses)
|
(695
|
)
|
1,036
|
|
(269
|
)
|
||||
|
Debt gains (losses)
|
720
|
|
151
|
|
(473
|
)
|
||||
|
Derivative gains (losses)
|
1,270
|
|
(1,988
|
)
|
(274
|
)
|
||||
|
Other income (loss)
|
714
|
|
4,982
|
|
803
|
|
||||
|
Non-interest income (loss)
|
3,544
|
|
6,869
|
|
500
|
|
||||
|
Non-interest expense
|
||||||||||
|
Salaries and employee benefits
|
(1,227
|
)
|
(1,098
|
)
|
(989
|
)
|
||||
|
Professional services
|
(486
|
)
|
(452
|
)
|
(489
|
)
|
||||
|
Other administrative expense
|
(580
|
)
|
(556
|
)
|
(527
|
)
|
||||
|
Total administrative expense
|
(2,293
|
)
|
(2,106
|
)
|
(2,005
|
)
|
||||
|
Real estate owned operations expense
|
(169
|
)
|
(189
|
)
|
(287
|
)
|
||||
|
Temporary Payroll Tax Cut Continuation Act of 2011 expense
|
(1,484
|
)
|
(1,340
|
)
|
(1,152
|
)
|
||||
|
Other expense
|
(881
|
)
|
(648
|
)
|
(599
|
)
|
||||
|
Non-interest expense
|
(4,827
|
)
|
(4,283
|
)
|
(4,043
|
)
|
||||
|
Income (loss) before income tax (expense) benefit
|
11,474
|
|
16,834
|
|
11,639
|
|
||||
|
Income tax (expense) benefit
|
(2,239
|
)
|
(11,209
|
)
|
(3,824
|
)
|
||||
|
Net income (loss)
|
9,235
|
|
5,625
|
|
7,815
|
|
||||
|
Other comprehensive income (loss), net of taxes and reclassification adjustments:
|
||||||||||
|
Changes in unrealized gains (losses) related to available-for-sale securities
|
(722
|
)
|
(253
|
)
|
(825
|
)
|
||||
|
Changes in unrealized gains (losses) related to cash flow hedge relationships
|
114
|
|
124
|
|
141
|
|
||||
|
Changes in defined benefit plans
|
(5
|
)
|
62
|
|
(13
|
)
|
||||
|
Total other comprehensive income (loss), net of taxes and reclassification adjustments
|
(613
|
)
|
(67
|
)
|
(697
|
)
|
||||
|
Comprehensive income (loss)
|
|
$8,622
|
|
|
$5,558
|
|
|
$7,118
|
|
|
|
Net income (loss)
|
|
$9,235
|
|
|
$5,625
|
|
|
$7,815
|
|
|
|
Undistributed net worth sweep and senior preferred stock dividends
|
(5,623
|
)
|
(8,869
|
)
|
(7,718
|
)
|
||||
|
Net income (loss) attributable to common stockholders
|
|
$3,612
|
|
|
($3,244
|
)
|
|
$97
|
|
|
|
Net income (loss) per common share — basic and diluted
|
|
$1.12
|
|
|
($1.00
|
)
|
|
$0.03
|
|
|
|
Weighted average common shares outstanding (in millions) — basic and diluted
|
3,234
|
|
3,234
|
|
3,234
|
|
||||
The accompanying notes are an integral part of these consolidated financial statements.
|
FREDDIE MAC
| 2018 Form 10-K
|
214
|
|
|
Financial Statements
|
Consolidated Balance Sheets
|
FREDDIE MAC
Consolidated Balance Sheets
|
As of December 31,
|
|||||||
|
(
In millions
, except share-related amounts)
|
2018
|
2017
|
|||||
|
Assets
|
|||||||
|
Cash and cash equivalents (Notes 1, 3, 14) (includes $596 and $2,963 of restricted cash and cash equivalents)
|
|
$7,273
|
|
|
$9,811
|
|
|
|
Securities purchased under agreements to resell (Notes 3, 10)
|
34,771
|
|
55,903
|
|
|||
|
Investments in securities, at fair value (Note 7)
|
69,111
|
|
84,318
|
|
|||
|
Mortgage loans held-for-sale (Notes 3, 4) (includes $23,106 and $20,054 at fair value)
|
41,622
|
|
34,763
|
|
|||
|
Mortgage loans held-for-investment (Notes 3, 4) (net of allowance for loan losses of $6,139 and $8,966)
|
1,885,356
|
|
1,836,454
|
|
|||
|
Accrued interest receivable (Note 3)
|
6,728
|
|
6,355
|
|
|||
|
Derivative assets, net (Notes 9, 10)
|
335
|
|
375
|
|
|||
|
Deferred tax assets, net (Note 12)
|
6,888
|
|
8,107
|
|
|||
|
Other assets (Notes 3, 18) (includes $3,929 and $3,353 at fair value)
|
10,976
|
|
13,690
|
|
|||
|
Total assets
|
|
$2,063,060
|
|
|
$2,049,776
|
|
|
|
Liabilities and equity
|
|||||||
|
Liabilities
|
|||||||
|
Accrued interest payable (Note 3)
|
|
$6,652
|
|
|
$6,221
|
|
|
|
Debt, net (Notes 3, 8) (includes $5,112 and $5,799 at fair value)
|
2,044,950
|
|
2,034,630
|
|
|||
|
Derivative liabilities, net (Notes 9, 10)
|
583
|
|
269
|
|
|||
|
Other liabilities (Notes 3, 18)
|
6,398
|
|
8,968
|
|
|||
|
Total liabilities
|
2,058,583
|
|
2,050,088
|
|
|||
|
Commitments and contingencies (Notes 5, 9, 16)
|
|
|
|||||
|
Equity (Note 11)
|
|||||||
|
Senior preferred stock (redemption value of $75,648 and $75,336)
|
72,648
|
|
72,336
|
|
|||
|
Preferred stock, at redemption value
|
14,109
|
|
14,109
|
|
|||
|
Common stock, $0.00 par value, 4,000,000,000 shares authorized, 725,863,886 shares issued and 650,058,775 shares and 650,054,731 shares outstanding
|
—
|
|
—
|
|
|||
|
Additional paid-in capital
|
—
|
|
—
|
|
|||
|
Retained earnings (accumulated deficit)
|
(78,260
|
)
|
(83,261
|
)
|
|||
|
AOCI, net of taxes, related to:
|
|||||||
|
Available-for-sale securities (includes $221 and $593, related to net unrealized gains on securities for which other-than-temporary impairment has been recognized in earnings)
|
83
|
|
662
|
|
|||
|
Cash flow hedge relationships
|
(315
|
)
|
(356
|
)
|
|||
|
Defined benefit plans
|
97
|
|
83
|
|
|||
|
Total AOCI, net of taxes
|
(135
|
)
|
389
|
|
|||
|
Treasury stock, at cost, 75,805,111 shares and 75,809,155 shares
|
(3,885
|
)
|
(3,885
|
)
|
|||
|
Total equity
(See Note 11 for information on our dividend requirement to Treasury)
|
4,477
|
|
(312
|
)
|
|||
|
Total liabilities and equity
|
|
$2,063,060
|
|
|
$2,049,776
|
|
|
The table below presents the carrying value and classification of the assets and liabilities of consolidated VIEs on our consolidated balance sheets.
|
As of December 31,
|
|||||||
|
(
In millions
)
|
2018
|
2017
|
|||||
|
Consolidated Balance Sheet Line Item
|
|||||||
|
Assets: (Note 3)
|
|||||||
|
Mortgage loans held-for-investment
|
|
$1,842,850
|
|
|
$1,774,286
|
|
|
|
All other assets
|
20,237
|
|
25,753
|
|
|||
|
Total assets of consolidated VIEs
|
|
$1,863,087
|
|
|
$1,800,039
|
|
|
|
Liabilities: (Note 3)
|
|||||||
|
Debt, net
|
|
$1,792,677
|
|
|
$1,720,996
|
|
|
|
All other liabilities
|
5,335
|
|
5,030
|
|
|||
|
Total liabilities of consolidated VIEs
|
|
$1,798,012
|
|
|
$1,726,026
|
|
|
The accompanying notes are an integral part of these consolidated financial statements.
|
FREDDIE MAC
| 2018 Form 10-K
|
215
|
|
|
Financial Statements
|
Consolidated Statements of Equity
|
FREDDIE MAC
Consolidated Statements of Equity
|
|
Shares Outstanding
|
Senior
Preferred
Stock
|
Preferred
Stock, at
Redemption
Value
|
Common
Stock, at
Par Value
|
Additional
Paid-In
Capital
|
Retained
Earnings
(Accumulated
Deficit)
|
AOCI,
Net of
Tax
|
Treasury
Stock, at
Cost
|
Total
Equity
|
||||||||||||||||||||||
|
(In millions)
|
Senior
Preferred
Stock
|
Preferred
Stock
|
Common
Stock
|
||||||||||||||||||||||||||||
|
Balance at December 31, 2015
|
1
|
|
464
|
|
650
|
|
|
$72,336
|
|
|
$14,109
|
|
|
$—
|
|
|
$—
|
|
|
($80,773
|
)
|
|
$1,153
|
|
|
($3,885
|
)
|
|
$2,940
|
|
|
|
Comprehensive income (loss):
|
|
|
|
|
|
|
|
|
|
|
|
|
|
|
|
|
|
|
|
|
|||||||||||
|
Net income (loss)
|
—
|
|
—
|
|
—
|
|
—
|
|
—
|
|
—
|
|
—
|
|
7,815
|
|
—
|
|
—
|
|
7,815
|
|
|||||||||
|
Other comprehensive income (loss), net of taxes
|
—
|
|
—
|
|
—
|
|
—
|
|
—
|
|
—
|
|
—
|
|
—
|
|
(697
|
)
|
—
|
|
(697
|
)
|
|||||||||
|
Comprehensive income (loss)
|
—
|
|
—
|
|
—
|
|
—
|
|
—
|
|
—
|
|
—
|
|
7,815
|
|
(697
|
)
|
—
|
|
7,118
|
|
|||||||||
|
Senior preferred stock dividends declared
|
—
|
|
—
|
|
—
|
|
—
|
|
—
|
|
—
|
|
—
|
|
(4,983
|
)
|
—
|
|
—
|
|
(4,983
|
)
|
|||||||||
|
Ending balance at December 31, 2016
|
1
|
|
464
|
|
650
|
|
|
$72,336
|
|
|
$14,109
|
|
|
$—
|
|
|
$—
|
|
|
($77,941
|
)
|
|
$456
|
|
|
($3,885
|
)
|
|
$5,075
|
|
|
|
Balance at December 31, 2016
|
1
|
|
464
|
|
650
|
|
|
$72,336
|
|
|
$14,109
|
|
|
$—
|
|
|
$—
|
|
|
($77,941
|
)
|
|
$456
|
|
|
($3,885
|
)
|
|
$5,075
|
|
|
|
Comprehensive income (loss):
|
|
|
|
|
|
|
|
|
|
|
|
|
|
|
|
|
|
|
|
|
|
||||||||||
|
Net income (loss)
|
—
|
|
—
|
|
—
|
|
—
|
|
—
|
|
—
|
|
—
|
|
5,625
|
|
—
|
|
—
|
|
5,625
|
|
|||||||||
|
Other comprehensive income (loss), net of taxes
|
—
|
|
—
|
|
—
|
|
—
|
|
—
|
|
—
|
|
—
|
|
—
|
|
(67
|
)
|
—
|
|
(67
|
)
|
|||||||||
|
Comprehensive income (loss)
|
—
|
|
—
|
|
—
|
|
—
|
|
—
|
|
—
|
|
—
|
|
5,625
|
|
(67
|
)
|
—
|
|
5,558
|
|
|||||||||
|
Senior preferred stock dividends declared
|
—
|
|
—
|
|
—
|
|
—
|
|
—
|
|
—
|
|
—
|
|
(10,945
|
)
|
—
|
|
—
|
|
(10,945
|
)
|
|||||||||
|
Ending balance at December 31, 2017
|
1
|
|
464
|
|
650
|
|
|
$72,336
|
|
|
$14,109
|
|
|
$—
|
|
|
$—
|
|
|
($83,261
|
)
|
|
$389
|
|
|
($3,885
|
)
|
|
($312
|
)
|
|
|
Balance at December 31, 2017
|
1
|
|
464
|
|
650
|
|
|
$72,336
|
|
|
$14,109
|
|
|
$—
|
|
|
$—
|
|
|
($83,261
|
)
|
|
$389
|
|
|
($3,885
|
)
|
|
($312
|
)
|
|
|
Comprehensive income (loss):
|
|||||||||||||||||||||||||||||||
|
Net income (loss)
|
—
|
|
—
|
|
—
|
|
—
|
|
—
|
|
—
|
|
—
|
|
9,235
|
|
—
|
|
—
|
|
9,235
|
|
|||||||||
|
Other comprehensive income (loss), net of taxes
|
—
|
|
—
|
|
—
|
|
—
|
|
—
|
|
—
|
|
—
|
|
—
|
|
(613
|
)
|
—
|
|
(613
|
)
|
|||||||||
|
Comprehensive income (loss)
|
—
|
|
—
|
|
—
|
|
—
|
|
—
|
|
—
|
|
—
|
|
9,235
|
|
(613
|
)
|
—
|
|
8,622
|
|
|||||||||
|
Cumulative effect of change in accounting principle
(1)
|
—
|
|
—
|
|
—
|
|
—
|
|
—
|
|
—
|
|
—
|
|
(89
|
)
|
89
|
|
—
|
|
—
|
|
|||||||||
|
Increase in liquidation preference
|
—
|
|
—
|
|
—
|
|
312
|
|
—
|
|
—
|
|
—
|
|
—
|
|
—
|
|
—
|
|
312
|
|
|||||||||
|
Senior preferred stock dividends declared
|
—
|
|
—
|
|
—
|
|
—
|
|
—
|
|
—
|
|
—
|
|
(4,145
|
)
|
—
|
|
—
|
|
(4,145
|
)
|
|||||||||
|
Ending balance at December 31, 2018
|
1
|
|
464
|
|
650
|
|
|
$72,648
|
|
|
$14,109
|
|
|
$—
|
|
|
$—
|
|
|
($78,260
|
)
|
|
($135
|
)
|
|
($3,885
|
)
|
|
$4,477
|
|
|
|
(1)
|
Includes the effect of adopting the accounting guidance on reclassification of stranded tax effects of the Tax Cuts and Jobs Act. See
Note 1
and
Note 11
for additional information.
|
The accompanying notes are an integral part of these consolidated financial statements.
|
FREDDIE MAC
| 2018 Form 10-K
|
216
|
|
|
Financial Statements
|
Consolidated Statements of Cash Flows
|
FREDDIE MAC
Consolidated Statements of Cash Flows
The accompanying notes are an integral part of these consolidated financial statements.
|
Year Ended December 31,
|
||||||||||
|
(In millions)
|
2018
|
2017
|
2016
|
|||||||
|
Cash flows from operating activities
|
||||||||||
|
Net income (loss)
|
|
$9,235
|
|
|
$5,625
|
|
|
$7,815
|
|
|
|
Adjustments to reconcile net income to net cash provided by (used in) operating activities:
|
||||||||||
|
Derivative (gains) losses
|
(1,450
|
)
|
370
|
|
(1,516
|
)
|
||||
|
Asset-related amortization — premiums, discounts, and basis adjustments
|
5,282
|
|
6,038
|
|
7,089
|
|
||||
|
Debt-related amortization — premiums and discounts on certain debt securities and basis adjustments
|
(7,399
|
)
|
(8,653
|
)
|
(10,151
|
)
|
||||
|
Debt (gains) losses
|
(720
|
)
|
(151
|
)
|
473
|
|
||||
|
(Benefit) provision for credit losses
|
(736
|
)
|
(84
|
)
|
(803
|
)
|
||||
|
Mortgage loans (gains) losses
|
(724
|
)
|
(2,026
|
)
|
(200
|
)
|
||||
|
Investment securities (gains) losses
|
695
|
|
(1,036
|
)
|
269
|
|
||||
|
Hedge accounting earnings mismatch
|
658
|
|
(357
|
)
|
—
|
|
||||
|
Deferred income tax expense (benefit)
|
1,391
|
|
7,773
|
|
2,787
|
|
||||
|
Purchases of mortgage loans acquired as held-for-sale
|
(70,482
|
)
|
(64,827
|
)
|
(48,379
|
)
|
||||
|
Proceeds from sales of mortgage loans acquired as held-for-sale
|
66,889
|
|
61,744
|
|
49,350
|
|
||||
|
Repayments of mortgage loans acquired as held-for-sale
|
494
|
|
306
|
|
1,259
|
|
||||
|
Payments to servicers for pre-foreclosure expense and servicer incentive fees
|
(282
|
)
|
(377
|
)
|
(585
|
)
|
||||
|
Change in accrued interest receivable
|
(373
|
)
|
(220
|
)
|
(61
|
)
|
||||
|
Change in Interest payable
|
440
|
|
273
|
|
(52
|
)
|
||||
|
Change in income taxes receivable
|
(1,269
|
)
|
1,912
|
|
(1,230
|
)
|
||||
|
Other, net
|
(975
|
)
|
(2,086
|
)
|
(1,670
|
)
|
||||
|
Net cash provided by (used in) operating activities
|
674
|
|
4,224
|
|
4,395
|
|
||||
|
Cash flows from investing activities
|
||||||||||
|
Purchases of trading securities
|
(131,977
|
)
|
(160,333
|
)
|
(104,045
|
)
|
||||
|
Proceeds from sales of trading securities
|
126,012
|
|
150,448
|
|
79,095
|
|
||||
|
Proceeds from maturities and repayments of trading securities
|
11,375
|
|
8,570
|
|
22,244
|
|
||||
|
Purchases of available-for-sale securities
|
(19,701
|
)
|
(10,549
|
)
|
(28,306
|
)
|
||||
|
Proceeds from sales of available-for-sale securities
|
21,952
|
|
23,034
|
|
20,699
|
|
||||
|
Proceeds from maturities and repayments of available-for-sale securities
|
6,002
|
|
11,758
|
|
15,869
|
|
||||
|
Purchases of held-for-investment mortgage loans
|
(151,836
|
)
|
(126,162
|
)
|
(169,948
|
)
|
||||
|
Proceeds from sales of mortgage loans held-for-investment
|
10,661
|
|
8,883
|
|
4,507
|
|
||||
|
Repayments of mortgage loans held-for-investment
|
248,115
|
|
277,819
|
|
340,348
|
|
||||
|
Advances under secured lending arrangements
|
(27,463
|
)
|
(35,452
|
)
|
(30,730
|
)
|
||||
|
Repayments of secured lending arrangements
|
1,592
|
|
—
|
|
—
|
|
||||
|
Net proceeds from dispositions of real estate owned and other recoveries
|
1,336
|
|
1,861
|
|
2,519
|
|
||||
|
Net (increase) decrease in securities purchased under agreements to resell
|
21,132
|
|
(4,355
|
)
|
12,096
|
|
||||
|
Derivative premiums and terminations, swap collateral, and exchange settlement payments, net
|
3,020
|
|
(538
|
)
|
555
|
|
||||
|
Changes in other assets
|
(572
|
)
|
(428
|
)
|
(357
|
)
|
||||
|
Net cash provided by (used in) investing activities
|
119,648
|
|
144,556
|
|
164,546
|
|
||||
|
Cash flows from financing activities
|
||||||||||
|
Proceeds from issuance of debt securities of consolidated trusts held by third parties
|
217,574
|
|
191,638
|
|
254,236
|
|
||||
|
Repayments and redemptions of debt securities of consolidated trusts held by third parties
|
(275,402
|
)
|
(303,142
|
)
|
(355,020
|
)
|
||||
|
Proceeds from issuance of other debt
|
574,472
|
|
613,280
|
|
659,108
|
|
||||
|
Repayments of other debt
|
(635,669
|
)
|
(652,017
|
)
|
(720,184
|
)
|
||||
|
Increase in liquidation preference of senior preferred stock
|
312
|
|
—
|
|
—
|
|
||||
|
Payment of cash dividends on senior preferred stock
|
(4,145
|
)
|
(10,945
|
)
|
(4,983
|
)
|
||||
|
Changes in other liabilities
|
(2
|
)
|
(3
|
)
|
(6
|
)
|
||||
|
Net cash provided by (used in) financing activities
|
(122,860
|
)
|
(161,189
|
)
|
(166,849
|
)
|
||||
|
Net (decrease) increase in cash and cash equivalents (includes restricted cash and cash equivalents)
|
(2,538
|
)
|
(12,409
|
)
|
2,092
|
|
||||
|
Cash and cash equivalents (includes restricted cash and cash equivalents) at the beginning of year
|
9,811
|
|
22,220
|
|
20,128
|
|
||||
|
Cash and cash equivalents (includes restricted cash and cash equivalents) at end of period
|
|
$7,273
|
|
|
$9,811
|
|
|
$22,220
|
|
|
|
Supplemental cash flow information
|
||||||||||
|
Cash paid for:
|
||||||||||
|
Debt interest
|
|
$65,721
|
|
|
$63,574
|
|
|
$60,862
|
|
|
|
Income taxes
|
2,125
|
|
1,872
|
|
2,324
|
|
||||
|
Non-cash investing and financing activities (Notes 4 and 7)
|
||||||||||
|
FREDDIE MAC
| 2018 Form 10-K
|
217
|
|
|
Financial Statements
|
Notes to the Consolidated Financial Statements |
Note 1
|
Notes to Consolidated Financial Statements
NOTE 1
Summary of Significant Accounting Policies
Freddie Mac is a GSE chartered by Congress in 1970. Our public mission is to provide liquidity, stability, and affordability to the U.S. housing market. We are regulated by FHFA, the SEC, HUD, and Treasury, and are currently operating under the conservatorship of FHFA. For more information on the roles of FHFA and Treasury, see
Note 2
. Throughout our consolidated financial statements and related notes, we use certain acronyms and terms which are defined in the
Glossary
.
Basis of Presentation
The accompanying consolidated financial statements have been prepared in accordance with GAAP and include our accounts as well as the accounts of other entities in which we have a controlling financial interest. All intercompany balances and transactions have been eliminated.
We are operating under the basis that we will realize assets and satisfy liabilities in the normal course of business as a going concern and in accordance with the authority provided by FHFA to our Board of Directors to oversee management's conduct of our business operations. Certain amounts in prior periods' consolidated financial statements have been reclassified to conform to the current presentation.
We evaluate the materiality of identified errors in the financial statements using both an income statement, or "rollover," and a balance sheet, or "iron curtain," approach, based on relevant quantitative and qualitative factors. Net income includes certain adjustments to correct immaterial errors related to previously reported periods.
Use of Estimates
The preparation of financial statements requires us to make estimates and assumptions that affect the reported amounts of assets and liabilities and disclosure of contingent assets and liabilities at the date of the financial statements and the reported amounts of revenues, expenses, gains, and losses during the reporting period. Management has made significant estimates in preparing the financial statements for establishing the allowance for credit losses and valuing financial instruments and other assets and liabilities. Actual results could be different from these estimates.
|
FREDDIE MAC
| 2018 Form 10-K
|
218
|
|
|
Financial Statements
|
Notes to the Consolidated Financial Statements |
Note 1
|
Consolidation and Equity Method Accounting
For each entity with which we are involved, we determine whether the entity should be consolidated in our financial statements. We generally consolidate entities in which we have a controlling financial interest. The method for determining whether a controlling financial interest exists varies depending on whether the entity is a VIE. For entities that are not VIEs, we hold a controlling financial interest in entities where we hold a majority of the voting rights or a majority of a limited partnership's kick-out rights through voting interests. We do not currently consolidate any entities which are not VIEs. We use the equity method to account for our interests in entities in which we do not have a controlling financial interest, but over which we have significant influence.
Cash and Cash Equivalents
Highly liquid investment securities that have an original maturity of three months or less are accounted for as cash equivalents. Cash collateral accepted from counterparties that we do not have the right to use for general corporate purposes is classified as restricted cash on our consolidated balance sheets. Restricted cash includes cash remittances received from servicers of the underlying assets of our consolidated trusts which are deposited into a separate custodial account. We invest the cash held in the custodial account in short-term investments and are entitled to the interest income earned on these short-term investments, which is recorded as interest income, other on our consolidated statements of comprehensive income.
Comprehensive Income
Comprehensive income includes all changes in equity during a period, except those resulting from investments by stockholders. We define comprehensive income as consisting of net income (loss) plus after-tax changes in:
|
n
|
Unrealized gains and losses on available-for-sale securities;
|
|
n
|
Unrealized gains and losses related to cash flow hedge relationships; and
|
n
Defined benefit plans.
Other Significant Accounting Policies
The table below identifies our other significant accounting policies and the related note in which information about them can be found.
|
FREDDIE MAC
| 2018 Form 10-K
|
219
|
|
|
Financial Statements
|
Notes to the Consolidated Financial Statements |
Note 1
|
|
Note
|
Accounting Policy
|
|
Variable Interest Entities
|
|
|
Note 4
|
Mortgage Loans and Allowance for Loan Losses
|
|
Note 5
|
Financial Guarantees
|
|
Note 6
|
Credit Enhancements
|
|
Note 7
|
Investments in Securities
|
|
Note 8
|
Debt
|
|
Note 9
|
Derivatives
|
|
Note 10
|
Collateralized Agreements and Offsetting Arrangements
|
|
Note 10
|
Repurchase and Resale Agreements and Dollar Roll transactions
|
|
Note 11
|
Earnings Per Share
|
|
Note 11
|
Stockholders' Equity
|
|
Note 12
|
Income Taxes
|
|
Note 13
|
Segment Reporting
|
|
Note 15
|
Fair Value Measurements
|
|
FREDDIE MAC
| 2018 Form 10-K
|
220
|
|
|
Financial Statements
|
Notes to the Consolidated Financial Statements |
Note 1
|
Recently Issued Accounting Guidance
|
Recently Adopted Accounting Guidance
|
|||
|
Standard
|
Description
|
Date of Adoption
|
Effect on Consolidated Financial Statements
|
|
ASU 2014-09
, Revenue from Contracts with Customers (Topic 606) and
ASU 2015-14
, Topic 606: Deferral of the Effective Date
|
The amendment requires entities to recognize revenue to depict the transfer of promised goods or services to customers in amounts that reflect the consideration to which the entity expects to be entitled in exchange for those goods or services. ASU 2015-14 defers the effective date of ASU 2014-09 for all entities by one year.
|
January 1, 2018
|
The adoption of the amendment did not have a material effect on our consolidated financial statements or on our disclosures.
|
|
ASU 2016-01
, Recognition and Measurement of Financial Assets and Financial Liabilities (Subtopic 825-10)
|
The amendment addresses certain aspects of recognition, measurement, presentation, and disclosure of financial instruments.
|
January 1, 2018
|
The adoption of the amendment did not have a material effect on our consolidated financial statements or on our disclosures.
|
|
ASU 2016-08
, Topic 606: Principal versus Agent Considerations (Reporting Revenue Gross versus Net)
|
The amendments in this Update do not change the core principle of the guidance in Topic 606. The amendments clarify the implementation guidance on principal versus agent considerations.
|
January 1, 2018
|
The adoption of the amendments did not have a material effect on our consolidated financial statements or on our disclosures.
|
|
ASU 2016-10
, Topic 606: Identifying Performance Obligations and Licensing
|
The amendments in this Update do not change the core principle of the guidance in Topic 606, but they clarify two issues: i) identifying performance obligations and ii) licensing. These clarifications are intended to reduce diversity in practice and to reduce the cost and complexity of Topic 606 at transition and on an ongoing basis.
|
January 1, 2018
|
The adoption of the amendments did not have a material effect on our consolidated financial statements or on our disclosures.
|
|
ASU 2016-12
, Topic 606: Narrow-Scope Improvements and Practical Expedients
|
The amendments in this Update do not change the core principle of the guidance in Topic 606, but affect aspects of the guidance and technical corrections.
|
January 1, 2018
|
The adoption of the amendments did not have a material effect on our consolidated financial statements or on our disclosures.
|
|
ASU 2016-15
, Statement of Cash Flows (Topic 230): Classification of Certain Cash Receipts and Cash Payments (a consensus of the Emerging Issues Task Force)
|
The amendments in this Update primarily address the diversity in practice that currently exists in regard to how certain cash receipts and cash payments are presented and classified in the statement of cash flows under Topic 230, Statement of Cash Flows, and other Topics. This Update addresses eight specific cash flow issues with the objective of reducing the existing diversity in practice.
|
January 1, 2018
|
Upon adoption of the amendments, the portion of the cash payment attributable to the accreted interest related to zero-coupon debt is presented in the operating activities section, a classification change from the financing activities section where this item was previously presented. As a result, we reclassified approximately $1.2 billion and $0.5 billion of cash payments from financing activities to operating activities on our consolidated statements of cash flows for the years ended December 31, 2017 and December 31, 2016.
|
|
FREDDIE MAC
| 2018 Form 10-K
|
221
|
|
|
Financial Statements
|
Notes to the Consolidated Financial Statements |
Note 1
|
|
Recently Adopted Accounting Guidance
|
|||
|
Standard
|
Description
|
Date of Adoption
|
Effect on Consolidated Financial Statements
|
|
ASU 2016-18
, Statement of Cash Flows (Topic 230): Restricted Cash (a consensus of the FASB Emerging Issues Task Force)
|
The amendments in this Update address the diversity in the classification and presentation of changes in restricted cash on the statement of cash flows under Topic 230, Statement of Cash Flows. Specifically, this amendment dictates that the statement of cash flows should explain the change in the period of the total of cash, cash equivalents, and restricted cash balances.
|
January 1, 2018
|
The adoption of the amendments did not have a material effect on our consolidated financial statements; however, we modified the presentation of restricted cash and cash equivalent balances on our consolidated balance sheets. The presentation of our consolidated statements of cash flows has also been revised to reflect the change of total cash and cash equivalents and restricted cash and cash equivalents balances.
|
|
ASU 2016-20
, Technical Corrections and Improvements to Topic 606
|
The amendments in this Update are of a similar nature to the items typically addressed in the Technical Corrections and Improvements project. However, the Board decided to issue a separate Update for technical corrections and improvements to Topic 606 and other Topics amended by Update 2014-09 to increase stakeholders' awareness of the proposals and to expedite improvements to Update 2014-09.
|
January 1, 2018
|
The adoption of the amendments did not have a material effect on our consolidated financial statements or on our disclosures.
|
|
ASU 2018-02
, Income Statement—Reporting Comprehensive Income (Topic 220): Reclassification of Certain Tax Effects from Accumulated Other Comprehensive Income
|
The amendments in this Update allow a reclassification from accumulated other comprehensive income to retained earnings for stranded tax effects resulting from the Tax Cuts and Jobs Act.
|
January 1, 2018
|
The adoption of the amendments did not have a material effect on our consolidated financial statements or on our disclosures.
|
|
ASU 2018-03
, Technical Corrections and Improvements to Financial Instruments—Overall (Subtopic 825-10) Recognition and Measurement of Financial Assets and Financial Liabilities
|
The amendments clarify certain aspects of the guidance issued in Update 2016-01 and address six specific issues.
|
January 1, 2018
|
The adoption of the amendments did not have a material effect on our consolidated financial statements or on our disclosures.
|
|
Recently Issued Accounting Guidance, Not Yet Adopted Within Our Consolidated Financial Statements
|
|||
|
Standard
|
Description
|
Date of Planned Adoption
|
Effect on Consolidated Financial Statements
|
|
ASU 2016-02
, Leases (Topic 842)
|
The amendment addresses the accounting for lease arrangements.
|
January 1, 2019
|
We do not expect that the adoption of this amendment will have a material effect on our consolidated financial statements.
|
|
FREDDIE MAC
| 2018 Form 10-K
|
222
|
|
|
Financial Statements
|
Notes to the Consolidated Financial Statements |
Note 1
|
|
Recently Issued Accounting Guidance, Not Yet Adopted Within Our Consolidated Financial Statements
|
|||
|
Standard
|
Description
|
Date of Planned Adoption
|
Effect on Consolidated Financial Statements
|
|
ASU 2016-13
, Financial Instruments—Credit Losses (Topic 326): Measurement of Credit Losses on Financial Instruments
|
The amendments in this Update replace the incurred loss impairment methodology in current GAAP with a methodology that reflects lifetime expected credit losses and requires consideration of a broader range of reasonable and supportable information to inform credit loss estimates.
|
January 1, 2020
|
We have developed our models to estimate lifetime expected credit losses on our financial instruments measured at amortized cost primarily using a discounted cash flow methodology. These models are currently undergoing testing and validation. The amendments will be applied through a cumulative effect adjustment to retained earnings as of the beginning of the year of adoption. While we are not able to reasonably estimate the effect that the adoption of these amendments will have on our consolidated financial statements, it may increase (perhaps substantially) our allowance for credit losses in the period of adoption
.
|
|
ASU 2018-13
, Fair Value Measurement (Topic 820): Disclosure Framework - Changes to the Disclosure Requirements for Fair Value Measurement
|
The amendments in this Update modify the disclosure requirements on fair value measurements in Topic 820, Fair Value Measurements, based on the concepts in the Concepts Statement, including the consideration of costs and benefits. Certain disclosure requirements were either removed, modified, or added.
|
January 1, 2020
|
On October 1, 2018, we adopted the amendments to remove or modify certain disclosures, which did not have a material effect on the notes to our consolidated financial statements. We are delaying adoption of the amendments to add certain disclosures until their effective date. We are evaluating the effect that the adoption of the additional disclosures will have on the notes to our consolidated financial statements.
|
|
ASU 2018-15
, Intangibles - Goodwill and Other - Internal-Use Software (Subtopic 350-40): Customer's Accounting for Implementation Costs Incurred in a Cloud Computing Arrangement That Is a Service Contract
|
The amendments in this Update align the requirements for capitalizing implementation costs incurred in a hosting arrangement that is a service contract with the requirements for capitalizing implementation costs incurred to develop or obtain internal-use software (and hosting arrangements that include an internal-use software license).
|
January 1, 2020
|
We do not expect that the adoption of these amendments will have a material effect on our consolidated financial statements.
|
|
ASU 2018-16
, Derivatives and Hedging (Topic 815): Inclusion of the Secured Overnight Financing Rate (SOFR) Overnight Index Swap (OIS) Rate as a Benchmark Interest Rate for Hedge Accounting Purposes
|
The amendments in this Update permit the OIS rate based on SOFR, as an eligible U.S. benchmark interest rate for purposes of applying hedge accounting under Topic 815.
|
January 1, 2019
|
We do not expect that the adoption of these amendments will have a material effect on our consolidated financial statements.
|
|
FREDDIE MAC
| 2018 Form 10-K
|
223
|
|
|
Financial Statements
|
Notes to the Consolidated Financial Statements |
Note 1
|
|
Recently Issued Accounting Guidance, Not Yet Adopted Within Our Consolidated Financial Statements
|
|||
|
Standard
|
Description
|
Date of Planned Adoption
|
Effect on Consolidated Financial Statements
|
|
ASU 2018-17
, Consolidation (Topic 810): Targeted Improvements to Related Party Guidance for Variable Interest Entities
|
The amendments in this Update require that indirect interests held through related parties under common control be considered on a proportional basis when determining whether fees paid to decision makers or service providers are variable interests. These amendments align with the determination of whether a reporting entity within a related party group is the primary beneficiary of a VIE.
|
January 1, 2020
|
We are evaluating the effect that the adoption of these amendments will have on our consolidated financial statements.
|
|
ASU 2018-20
, Leases (Topic 842): Narrow-Scope Improvements for Lessors
|
The amendments in this Update address certain ASU 2016-02 implementation issues including the recognition of taxes collected from lessees, lessor costs paid directly by a lessee and recognition of variable payments for contracts with lease, and non-lease components.
|
January 1, 2019
|
We do not expect that the adoption of these amendments will have a material effect on our consolidated financial statements.
|
|
FREDDIE MAC
| 2018 Form 10-K
|
224
|
|
|
Financial Statements
|
Notes to the Consolidated Financial Statements |
Note 2
|
NOTE 2
Conservatorship and Related Matters
Business Objectives
We operate under the conservatorship that commenced on September 6, 2008, conducting our business under the direction of FHFA, as our Conservator. The conservatorship and related matters significantly affect our management, business activities, financial condition, and results of operations. Upon its appointment, FHFA, as Conservator, immediately succeeded to all rights, titles, powers, and privileges of Freddie Mac, and of any stockholder, officer, or director thereof, with respect to the company and its assets. The Conservator also succeeded to the title to all books, records, and assets of Freddie Mac held by any other legal custodian or third party. The Conservator provided for the Board of Directors to perform certain functions and to oversee management, and the Board delegated to management authority to conduct business operations so that the company can continue to operate in the ordinary course. The directors serve on behalf of, and perform such functions as provided by, the Conservator.
We are subject to certain constraints on our business activities under the Purchase Agreement. However, the support provided by Treasury pursuant to the Purchase Agreement currently enables us to maintain our access to the debt markets and to have adequate liquidity to conduct our normal business activities, although the costs of our debt funding could vary. Our ability to access funds from Treasury under the Purchase Agreement is critical to keeping us solvent.
Our current business objectives reflect direction we have received from the Conservator (including the Conservatorship Scorecards). At the direction of the Conservator, we have made changes to certain business practices that are designed to provide support for the mortgage market in a manner that serves our public mission and other non-financial objectives but may not contribute to our profitability. Certain of these objectives are intended to help homeowners and the mortgage market and may help to mitigate future credit losses. Some of these initiatives affect our near- and long-term financial results. Given our public mission and the important role the Administration and our Conservator have placed on Freddie Mac in addressing housing and mortgage market conditions, we may be required to take actions that could have a negative impact on our business, operating results, or financial condition, and thus contribute to a need for additional draws under the Purchase Agreement.
In May 2014, FHFA issued its 2014 Strategic Plan, which updated FHFA's vision for implementing its obligations as Conservator of Freddie Mac and Fannie Mae and established three reformulated strategic goals. FHFA also has issued annual Conservatorship Scorecards since 2014. The annual Conservatorship Scorecards establish objectives and performance targets and measures for Freddie Mac and Fannie Mae (the Enterprises) related to the strategic goals set forth in the Strategic Plan.
The 2014 Strategic Plan established
three
reformulated strategic goals for the conservatorships of Freddie Mac and Fannie Mae:
|
n
|
Maintain
, in a safe and sound manner, foreclosure prevention activities and credit availability for new and refinanced loans to foster liquid, efficient, competitive, and resilient national housing finance markets;
|
|
n
|
Reduce
taxpayer risk through increasing the role of private capital in the mortgage market; and
|
|
FREDDIE MAC
| 2018 Form 10-K
|
225
|
|
|
Financial Statements
|
Notes to the Consolidated Financial Statements |
Note 2
|
|
n
|
Build
a new single-family securitization infrastructure for use by the Enterprises and adaptable for use by other participants in the secondary market in the future.
|
As part of the first goal, the 2014 Strategic Plan describes various steps related to increasing access to mortgage credit for credit-worthy borrowers. The 2014 Strategic Plan provides for the Enterprises to continue to play an ongoing role in supporting multifamily housing needs, particularly for low-income households. The plan states that FHFA will continue to impose a production cap on Freddie Mac's and Fannie Mae's multifamily businesses. However, in 2015, FHFA allowed loans in certain affordable and underserved market segments to be excluded from the production cap. This allowance was maintained in all of the subsequent Conservatorship Scorecards with slight modification.
The second goal focuses on ways to transfer risk to private market participants and away from the Enterprises in a responsible way that does not reduce liquidity or adversely affect the availability of mortgage credit. The second goal provides for us to increase the use of single-family credit risk transfer transactions, continue using risk transfer transactions in the multifamily business, and limit our mortgage-related investments portfolio consistent with the requirements in the Purchase Agreement, with a focus on selling less liquid assets.
The third goal includes the continued development of the common securitization platform. FHFA refined the scope of this project to focus on making the new shared system operational for Freddie Mac's and Fannie Mae's existing single-family securitization activities. The third goal also provides for the Enterprises to work towards the development of a UMBS and other aspects of the Single Security initative.
We continue to align our resources and internal business plans to meet the goals and objectives provided to us by FHFA.
As a result of the net worth sweep dividend provisions of the senior preferred stock, we cannot retain capital from the earnings generated by our business operations in excess of the applicable Capital Reserve Amount under the Purchase Agreement (which was
$3.0 billion
as of January 1, 2018 but will be reduced to
zero
if for any reason we do not pay the full dividend requirement in a future period) or return capital to stockholders other than Treasury, the holder of our senior preferred stock. Our future is uncertain, and the conservatorship has no specified termination date. We do not know what changes may occur to our business model during or following conservatorship, including whether we will continue to exist. Our Conservator has not made us aware of any plans to make any significant change to our business model or capital structure in the near term. Our future structure and role will be determined by the Administration and Congress, and it is possible and perhaps likely that there will be significant changes beyond the near term. We have no ability to predict the outcome of these deliberations.
Purchase Agreement and Warrant
Overview
On September 7, 2008, we, through FHFA, in its capacity as Conservator, entered into the Purchase Agreement with Treasury. The Purchase Agreement was subsequently amended and restated on September 26, 2008, and further amended on May 6, 2009, December 24, 2009, August 17, 2012, and December 21, 2017. The amount of available funding remaining under the Purchase Agreement was
$140.2 billion
as of
December 31, 2018
. This amount will be reduced by any future draws.
|
FREDDIE MAC
| 2018 Form 10-K
|
226
|
|
|
Financial Statements
|
Notes to the Consolidated Financial Statements |
Note 2
|
The Purchase Agreement requires Treasury, upon the request of the Conservator, to provide funds to us after any quarter in which we have a negative net worth (that is, our total liabilities exceed our total assets, as reflected on our consolidated balance sheets). In addition, the Purchase Agreement requires Treasury, upon the request of the Conservator, to provide funds to us if the Conservator determines, at any time, that it will be mandated by law to appoint a receiver for us unless we receive these funds from Treasury. In exchange for Treasury's funding commitment, we issued to Treasury, as an aggregate initial commitment fee,
one million
shares of Variable Liquidation Preference Senior Preferred Stock (with an initial liquidation preference of
$1 billion
), which we refer to as the senior preferred stock, and a warrant to purchase, for a nominal price, shares of our common stock equal to
79.9%
of the total number of shares of our common stock outstanding on a fully diluted basis at the time the warrant is exercised, which we refer to as the warrant. We received
no
cash proceeds or other consideration from Treasury for issuing the senior preferred stock or the warrant.
Treasury, as the holder of the senior preferred stock, is entitled to receive quarterly cash dividends, when, as and if declared by our Board of Directors. The dividends we have paid to Treasury on the senior preferred stock have been declared by, and paid at the direction of, the Conservator, acting as successor to the rights, titles, powers, and privileges of the Board. Through December 31, 2012, the senior preferred stock accrued quarterly cumulative dividends at a rate of
10%
per year. However, under the August 2012 amendment to the Purchase Agreement, the fixed dividend rate was replaced with a net worth sweep dividend beginning in the first quarter of 2013.
Under the August 2012 amendment to the Purchase Agreement and the December 2017 Letter Agreement, for each quarter from January 1, 2013 and thereafter, the dividend payment will be the amount, if any, by which our Net Worth Amount at the end of the immediately preceding fiscal quarter, less the applicable Capital Reserve Amount, exceeds zero. The term Net Worth Amount is defined as the total assets of Freddie Mac (excluding Treasury's commitment and any unfunded amounts thereof), less our total liabilities (excluding any obligation in respect of capital stock), in each case as reflected on our consolidated balance sheets prepared in accordance with GAAP. If the calculation of the dividend payment for a quarter does not exceed zero, then no dividend will accrue or be payable for that quarter. Pursuant to the Letter Agreement, the applicable Capital Reserve Amount is
$3.0 billion
. If for any reason we do not pay the net worth sweep dividend in full for any period, the applicable Capital Reserve Amount will thereafter be zero. The amounts payable for dividends on the senior preferred stock could be substantial and will have an adverse impact on our financial position and net worth. The senior preferred stock is senior in liquidation preference to our common stock and all other series of preferred stock.
In addition to the issuance of the senior preferred stock and warrant, we are required under the Purchase Agreement to pay a quarterly commitment fee to Treasury. Under the Purchase Agreement, the fee is to be determined in an amount mutually agreed to by us and Treasury with reference to the market value of Treasury's funding commitment as then in effect. However, pursuant to the August 2012 amendment to the Purchase Agreement, for each quarter commencing January 1, 2013, and for as long as the net worth sweep dividend provisions remain in form and content substantially the same, no periodic commitment fee under the Purchase Agreement will be set, accrue, or be payable.
Under the Purchase Agreement, our ability to repay the liquidation preference of the senior preferred stock is limited, and we will not be able to do so for the foreseeable future, if at all. On December 31, 2018, the aggregate liquidation preference of the senior preferred stock was
$75.6 billion
. The liquidation
|
FREDDIE MAC
| 2018 Form 10-K
|
227
|
|
|
Financial Statements
|
Notes to the Consolidated Financial Statements |
Note 2
|
preference will increase if we receive additional draws under the Purchase Agreement or if any dividends or quarterly commitment fees payable under the Purchase Agreement are not paid in cash.
The Purchase Agreement includes significant restrictions on our ability to manage our business, including limiting the amount of indebtedness we can incur and the size of our mortgage-related investments portfolio.
The Purchase Agreement has an indefinite term and can terminate only in limited circumstances, which do not include the end of the conservatorship. The Purchase Agreement therefore could continue after the conservatorship ends. However, Treasury's consent is required for a termination of conservatorship other than in connection with receivership. Treasury has the right to exercise the warrant, in whole or in part, at any time on or before September 7, 2028.
Purchase Agreement Covenants
The Purchase Agreement provides that, until the senior preferred stock is repaid or redeemed in full, we may not, without the prior written consent of Treasury:
|
n
|
Declare or pay any dividend (preferred or otherwise) or make any other distribution with respect to any Freddie Mac equity securities (other than with respect to the senior preferred stock or warrant);
|
|
n
|
Redeem, purchase, retire, or otherwise acquire any Freddie Mac equity securities (other than the senior preferred stock or warrant);
|
|
n
|
Sell or issue any Freddie Mac equity securities (other than the senior preferred stock, the warrant, and the common stock issuable upon exercise of the warrant and other than as required by the terms of any binding agreement in effect on the date of the Purchase Agreement);
|
|
n
|
Terminate the conservatorship (other than in connection with a receivership);
|
|
n
|
Sell, transfer, lease, or otherwise dispose of any assets, other than dispositions for fair market value:
|
|
l
|
To a limited life regulated entity (in the context of a receivership);
|
|
l
|
Of assets and properties in the ordinary course of business, consistent with past practice;
|
|
l
|
Of assets and properties having fair market value individually or in aggregate less than
$250 million
in one transaction or a series of related transactions;
|
|
l
|
In connection with our liquidation by a receiver;
|
|
l
|
Of cash or cash equivalents for cash or cash equivalents; or
|
|
l
|
To the extent necessary to comply with the covenant described below relating to the reduction of our mortgage-related investments portfolio;
|
|
n
|
Issue any subordinated debt;
|
|
n
|
Enter into a corporate reorganization, recapitalization, merger, acquisition, or similar event; or
|
|
n
|
Engage in transactions with affiliates unless the transaction is:
|
|
l
|
Pursuant to the Purchase Agreement, the senior preferred stock, or the warrant;
|
|
l
|
Upon arm's length terms; or
|
|
l
|
A transaction undertaken in the ordinary course or pursuant to a contractual obligation or customary employment arrangement in existence on the date of the Purchase Agreement.
|
The Purchase Agreement also required us to reduce the amount of mortgage assets we own. The Purchase Agreement, as revised in the August 2012 amendment, provides that we could not own mortgage assets with UPB in excess of
$650 billion
on December 31, 2012, and on December 31 of
|
FREDDIE MAC
| 2018 Form 10-K
|
228
|
|
|
Financial Statements
|
Notes to the Consolidated Financial Statements |
Note 2
|
each year thereafter may not own mortgage assets with UPB in excess of
85%
of the aggregate amount of mortgage assets we are permitted to own as of December 31 of the immediately preceding calendar year. The Purchase Agreement limit reached $250 billion at December 31, 2018. Under the Purchase Agreement, we also may not, without the prior written consent of Treasury, incur indebtedness that would result in the par value of our aggregate indebtedness exceeding
120%
of the amount of mortgage assets we are permitted to own on December 31 of the immediately preceding calendar year. The mortgage asset and indebtedness limitations are determined without giving effect to the changes to the accounting guidance for transfers of financial assets and consolidation of VIEs, under which we consolidated our single-family PC trusts and certain other VIEs in our financial statements as of January 1, 2010.
In addition, the Purchase Agreement provides that we may not enter into any new compensation arrangements or increase amounts or benefits payable under existing compensation arrangements of any named executive officer or other executive officer (as such terms are defined by SEC rules) without the consent of the Director of FHFA, in consultation with the Secretary of the Treasury.
The Purchase Agreement also provides that, on an annual basis, we are required to deliver a risk management plan to Treasury setting out our strategy for reducing our enterprise-wide risk profile and the actions we will take to reduce the financial and operational risk associated with each of our reportable business segments.
Warrant Covenants
The warrant we issued to Treasury includes, among others, the following covenants:
|
n
|
Our SEC filings under the Exchange Act will comply in all material respects as to form with the Exchange Act and the rules and regulations thereunder;
|
|
n
|
Without the prior written consent of Treasury, we may not permit any of our significant subsidiaries to issue capital stock or equity securities, or securities convertible into or exchangeable for such securities, or any stock appreciation rights or other profit participation rights to any person other than Freddie Mac or its wholly-owned subsidiaries;
|
|
n
|
We may not take any action that will result in an increase in the par value of our common stock;
|
|
n
|
Unless waived or consented to in writing by Treasury, we may not take any action to avoid the observance or performance of the terms of the warrant and we must take all actions necessary or appropriate to protect Treasury's rights against impairment or dilution; and
|
|
n
|
We must provide Treasury with prior notice of specified actions relating to our common stock, such as setting a record date for a dividend payment, granting subscription or purchase rights, authorizing a recapitalization, reclassification, merger or similar transaction, commencing a liquidation of the company, or any other action that would trigger an adjustment in the exercise price or number or amount of shares subject to the warrant.
|
Termination Provisions
The Purchase Agreement provides that the Treasury's funding commitment will terminate under any of the following circumstances:
|
n
|
The completion of our liquidation and fulfillment of Treasury's obligations under its funding commitment at that time;
|
|
n
|
The payment in full of, or reasonable provision for, all of our liabilities (whether or not contingent, including mortgage guarantee obligations); and
|
|
FREDDIE MAC
| 2018 Form 10-K
|
229
|
|
|
Financial Statements
|
Notes to the Consolidated Financial Statements |
Note 2
|
|
n
|
The funding by Treasury of the maximum amount of the commitment under the Purchase Agreement.
|
In addition, Treasury may terminate its funding commitment and declare the Purchase Agreement null and void if a court vacates, modifies, amends, conditions, enjoins, stays, or otherwise affects the appointment of the Conservator or otherwise curtails the Conservator's powers. Treasury may not terminate its funding commitment under the Purchase Agreement solely by reason of our being in conservatorship, receivership or other insolvency proceeding, or due to our financial condition or any adverse change in our financial condition.
Waivers and Amendments
The Purchase Agreement provides that most provisions of the agreement may be waived or amended by mutual written agreement of the parties; however, no waiver or amendment of the agreement is permitted that would decrease Treasury's aggregate funding commitment or add conditions to Treasury's funding commitment if the waiver or amendment would adversely affect in any material respect the holders of our debt securities or mortgage guarantee obligations.
Third-Party Enforcement Rights
In the event of our default on payments with respect to our debt securities or mortgage guarantee obligations, if Treasury fails to perform its obligations under its funding commitment and if we and/or the Conservator are not diligently pursuing remedies in respect of that failure, the holders of these debt securities or mortgage guarantee obligations may file a claim in the United States Court of Federal Claims for relief requiring Treasury to fund to us the lesser of:
|
n
|
The amount necessary to cure the payment defaults on our debt securities and mortgage guarantee obligations and
|
|
n
|
The lesser of:
|
|
l
|
The deficiency amount and
|
|
l
|
The maximum amount of the commitment less the aggregate amount of funding previously provided under the commitment.
|
Any payment that Treasury makes under those circumstances will be treated for all purposes as a draw under the Purchase Agreement that will increase the liquidation preference of the senior preferred stock.
Impact of Conservatorship and Related Developments on the Mortgage-Related Investments Portfolio
For purposes of the limit imposed by the Purchase Agreement and FHFA regulation, the UPB of our mortgage-related investments portfolio could not exceed
$250.0 billion
at
December 31, 2018
and was
$218.1 billion
at that date.
Since 2014, we have been managing the UPB of the mortgage-related investments portfolio so that it does not exceed
90%
of the annual cap established by the Purchase Agreement. In February 2019, FHFA directed us to maintain the mortgage-related investments portfolio at or below
$225 billion
at all times. Our ability to acquire and sell mortgage assets continues to be significantly constrained by limitations of the Purchase Agreement and those imposed by FHFA.
|
FREDDIE MAC
| 2018 Form 10-K
|
230
|
|
|
Financial Statements
|
Notes to the Consolidated Financial Statements |
Note 2
|
Government Support for Our Business
We receive substantial support from Treasury and are dependent upon its continued support in order to continue operating our business. Our ability to access funds from Treasury under the Purchase Agreement is critical to:
|
n
|
Keeping us solvent;
|
|
n
|
Allowing us to focus on our primary business objectives under conservatorship; and
|
|
n
|
Avoiding the appointment of a receiver by FHFA under statutory mandatory receivership provisions.
|
At September 30, 2018, our assets exceeded our liabilities under GAAP; therefore, FHFA did not request a draw on our behalf and, as a result, we did
not
receive any funding from Treasury under the Purchase Agreement during the three months ended
December 31, 2018
. Since conservatorship began through
December 31, 2018
, we have paid cash dividends of
$116.5 billion
to Treasury at the direction of the Conservator.
At December 31, 2018, our assets exceeded our liabilities under GAAP. As a result, FHFA will not submit a draw request from Treasury on our behalf. Based on our Net Worth Amount at December 31, 2018 and the Capital Reserve Amount of
$3.0 billion
, our dividend requirement to Treasury in March 2019 will be
$1.5 billion
.
Additionally, in recent years, the Federal Reserve purchased significant amounts of mortgage-related securities issued by us, Fannie Mae and Ginnie Mae.
See
Note 8
and
Note 11
for more information on the conservatorship and the Purchase Agreement.
Related Parties as a Result of Conservatorship
As a result of our issuance to Treasury of the warrant to purchase shares of our common stock equal to
79.9%
of the total number of shares of our common stock outstanding, on a fully diluted basis, we are deemed a related party to the U.S. government. During the years ended December 31, 2018, 2017, and 2016,
no
transactions outside of normal business activities have occurred between us and the U.S. government (or any of its related parties), except for the following:
|
n
|
The transactions with Treasury discussed above in
Purchase Agreement and Warrant
and
Government Support for Our Business
;
|
|
n
|
The transactions entered into whereby we and Fannie Mae, in conjunction with Treasury, provided assistance to state and local HFAs. Treasury will reimburse Freddie Mac for initial guarantee losses on these transactions;
|
|
n
|
The transactions discussed in
Note 4
,
Note 8
, and
Note 11
; and
|
|
n
|
The allocation or transfer of 4.2 basis points of each dollar of new business purchases to certain housing funds as required under the GSE Act.
|
In addition, we are deemed related parties with Fannie Mae as both we and Fannie Mae have the same relationships with FHFA and Treasury. All transactions between us and Fannie Mae have occurred in the normal course of business in conservatorship. In October 2013, FHFA announced the formation of CSS. CSS is equally-owned by Freddie Mac and Fannie Mae. In connection with the formation of CSS, we entered into a limited liability company agreement with Fannie Mae. In November 2014, we and Fannie
|
FREDDIE MAC
| 2018 Form 10-K
|
231
|
|
|
Financial Statements
|
Notes to the Consolidated Financial Statements |
Note 2
|
Mae announced that a chief executive officer had been named for CSS. Additionally, we and Fannie Mae each appointed two executives to the CSS Board of Managers and signed governance and operating agreements for CSS. Therefore, CSS is also deemed a related party. During the year ended
December 31, 2018
, we contributed
$135 million
of capital to CSS, and we have contributed
$464 million
since the fourth quarter of 2014.
|
FREDDIE MAC
| 2018 Form 10-K
|
232
|
|
|
Financial Statements
|
Notes to the Consolidated Financial Statements |
Note 3
|
NOTE 3
Securitization Activities and Consolidation
Our primary business activities in our Single-family Guarantee and Multifamily segments involve the securitization of loans or other mortgage-related assets using trusts that are VIEs. These trusts issue beneficial interests in the loans or other mortgage-related assets that they own. We guarantee the principal and interest payments on some or all of the issued beneficial interests in substantially all of our securitization transactions. See
Note 5
for additional information on our guarantee activities. We also use trusts that are VIEs in certain single-family credit risk transfer products.
We consolidate VIEs when we have a controlling financial interest in the VIE and are therefore considered the primary beneficiary of the VIE. We are the primary beneficiary of a VIE when we have both the power to direct the activities of the VIE that most significantly impact its economic performance and exposure to losses or benefits of the VIE that could potentially be significant to the VIE. We evaluate whether we are the primary beneficiary of VIEs in which we have interests on an ongoing basis, and our primary beneficiary determination may change over time as our interest in the VIE changes.
Securitization Activities
PCs
PCs are pass-through debt securities that represent undivided beneficial interests in a pool of loans held by a securitization trust. We serve as both administrator and guarantor for our PC trusts. As administrator, we have the right to establish servicing terms and direct loss mitigation activities for the loans held by the PC trusts. As guarantor, we guarantee the payment of principal and interest on our PCs in exchange for a guarantee fee, and we have the right to purchase delinquent loans from the PC trust to help improve the economic performance of the trust. We absorb all credit losses of the PC trusts through our guarantee of the principal and interest payments.
The economic performance of our PC trusts is most significantly affected by the performance of the underlying loans. Our rights as administrator and guarantor provide us with the power to direct the activities that most significantly affect the performance of the underlying loans. We also have the obligation to absorb losses of our PC trusts that could potentially be significant through our guarantee of principal and interest payments. Accordingly, we concluded that we are the primary beneficiary of our PC trusts and, therefore, consolidate those trusts.
Loans held by our PC trusts are recognized on our consolidated balance sheets as mortgage loans held-for-investment. The corresponding PCs held by third parties are recognized on our consolidated balance sheets as debt, net. We extinguish the outstanding debt securities of the related consolidated trust and recognize gains or losses on debt extinguishment for the difference between the consideration paid and the debt carrying value when we purchase PCs as investments in our mortgage-related investments portfolio. Sales of PCs previously held as investments in our mortgage-related investments portfolio are accounted for as debt issuances. See
Note 4
and
Note 8
for additional information on loans and debt securities of consolidated trusts.
At both
December 31, 2018
and December 31,
2017
, we were the primary beneficiary of, and therefore consolidated, PC trusts with assets totaling
$1.8 trillion
. Substantially all of these consolidated trusts
|
FREDDIE MAC
| 2018 Form 10-K
|
233
|
|
|
Financial Statements
|
Notes to the Consolidated Financial Statements |
Note 3
|
were single-family PC trusts. During the years ended
December 31, 2018
and December 31,
2017
, we issued approximately
$310.9 billion
and
$347.7 billion
, respectively, of guaranteed PCs. Our exposure for guarantees to consolidated securitization trusts is generally equal to the UPB of the loans recorded on our consolidated balance sheets.
Resecuritization Products
We create resecuritization products primarily by using PCs or our previously issued resecuritization products as the underlying collateral. In a typical resecuritization transaction, previously issued PCs or resecuritization products are transferred to a resecuritization trust that issues beneficial interests in the underlying collateral. We establish parameters that define eligibility standards for assets that may be used as collateral for each of our resecuritization programs. Resecuritization products can then be created based on the parameters that we have established. Similar to our PCs, we guarantee the full payment of principal and interest to the investors in our resecuritization products. However, because we have already guaranteed the underlying assets, we do not assume any incremental credit risk by issuing these securities. The main types of resecuritization products we create are Giant PCs, REMICs, and Stripped Giant PCs.
|
n
|
Giant PCs -
Giant PCs are direct pass-throughs of the cash flows of the underlying collateral, which may be previously issued PCs or Giant PCs. We do not consolidate Giant PCs as their resecuritization does not result in any new or incremental risk to the holders of the securities issued by the resecuritization trust and because we are not exposed to any incremental rights to receive benefits or obligations to absorb losses that could be significant to the resecuritization trust.
|
Purchases of Giant PCs as investments in our mortgage-related investments portfolio are accounted for as debt extinguishments of a pro-rata portion of the underlying single-family PCs because Giant PCs are considered substantially the same as the underlying single-family PCs. Similarly, sales of Giant PCs previously held as investments in our mortgage-related investments portfolio are accounted for as debt issuances of a pro-rata portion of the underlying single-family PCs.
|
n
|
REMICs and Stripped Giant PCs
-
REMICs and Stripped Giant PCs are multiclass resecuritizations of the cash flows of the underlying collateral, which may be previously issued PCs, Giant PCs, or other REMICs and Stripped Giant PCs. The activity that most significantly impacts the economic performance of our multiclass resecuritization trusts is typically the initial design and structuring of the trust. Substantially all multiclass resecuritization trusts are created as part of customer-driven transactions in which an investor or dealer participates in the decisions made during the design and establishment of the trust. As a result, we do not have the unilateral ability to direct the activities of our multiclass resecuritization trusts that most significantly impact the economic performance of those trusts. In addition, we do not have the right to receive benefits or the obligation to absorb losses that could potentially be significant to the trusts because we have already provided a guarantee on the underlying assets. As a result, we have concluded that we are not the primary beneficiary of our multiclass resecuritization trusts and, therefore, do not consolidate those trusts.
|
Because we have already guaranteed the underlying assets, we do not receive any incremental guarantee fees in exchange for our guarantee, and, accordingly, we do not recognize any additional guarantee assets, guarantee obligations or reserves for guarantee losses related to multiclass resecuritization trusts. Instead, we receive a one-time transaction fee which represents compensation for both the structuring and creation of the securities and for our ongoing administrative responsibilities to service the securities. We recognize the portion of the transaction
|
FREDDIE MAC
| 2018 Form 10-K
|
234
|
|
|
Financial Statements
|
Notes to the Consolidated Financial Statements |
Note 3
|
fee related to creation of the securities immediately in earnings. We defer the portion of the fee related to ongoing administrative responsibilities and amortize it over the life of the associated trust.
When we purchase a REMIC or Stripped Giant PC as an investment in our mortgage-related investments portfolio, we generally record the security as an investment in debt securities rather than extinguishment of debt since we are generally investing in the debt securities of a non-consolidated entity. We do not consolidate REMIC or Stripped Giant PC trusts in which we hold variable interests, as we are not deemed to be the primary beneficiary of the trusts, unless we have the unilateral ability to collapse the trust. Similarly, sales of REMICs or Stripped Giant PCs previously held as investments in our mortgage-related investments portfolio are accounted for as sales of investments in debt securities. See
Note 7
for additional information on accounting for investments in debt securities.
Senior Subordinate Securitization Structures
We are the primary beneficiary of and, therefore, consolidate certain of our single-family senior subordinate securitization structures because we have both the ability to direct the loss mitigation activities of the underlying loans and the obligation to absorb credit losses through our guarantee of the issued senior securities. As a result, we consolidated certain of the trusts used in these senior subordinate securitization structures with underlying assets totaling
$26.1 billion
and
$3.6 billion
, at
December 31, 2018
and December 31,
2017
, respectively.
We do not consolidate single-family senior subordinate securitization structures when we do not have the ability to direct the loss mitigation activities of the underlying loans, which is the most significant activity affecting the economic performance of the VIE. For those securitizations that we do not consolidate where we sell loans to the VIE, we derecognize the transferred loans and account for our guarantee to the non-consolidated VIE. We account for our investments in the beneficial interests issued by the non-consolidated VIE as investments in debt securities. During
2018
and
2017
, we issued approximately
$8.4 billion
and
$6.8 billion
, respectively, of guaranteed securities in these senior subordinate securitization structures for which a guarantee asset and guarantee obligation were generally recognized.
Single-Family Other Securitization Products
We are the primary beneficiary of and, therefore, consolidate the trusts used to issue our single-family other securitization products when we have the ability to direct the activities that most significantly affect the economic performance of the trusts and we have the obligation to absorb credit losses through our guarantee of some or all of the issued securities. As a result, we consolidated trusts used to issue these products with underlying assets totaling
$3.4 billion
and
$4.1 billion
at
December 31, 2018
and December 31,
2017
, respectively. We do not consolidate the trusts used to issue our single-family other securitization products that do not meet these conditions. We have not entered into single-family other securitization products in several years.
K Certificates
In a K Certificate transaction, we sell multifamily loans to a non-Freddie Mac securitization trust that issues senior, mezzanine, and subordinate securities, and simultaneously purchase and place the senior securities into a Freddie Mac securitization trust that issues guaranteed K Certificates. In these transactions, we guarantee the senior securities issued by the Freddie Mac securitization trust and do not issue or guarantee the mezzanine or subordinate securities issued by the non-Freddie Mac
|
FREDDIE MAC
| 2018 Form 10-K
|
235
|
|
|
Financial Statements
|
Notes to the Consolidated Financial Statements |
Note 3
|
securitization trust. We receive a guarantee fee in exchange for our guarantee. We serve as guarantor of our K Certificate trusts and, from time to time, as master servicer. However, in contrast to single-family PC trusts, the rights to direct loss mitigation activities of the underlying loans and to purchase delinquent loans from the securitization trust are generally held by the investor in the most subordinate remaining securities issued by the non-Freddie Mac trust, and therefore we do not have any power to direct those activities unless we are the investor in the most subordinate remaining securities.
The economic performance of our K Certificate trusts is most significantly affected by the performance of the underlying loans. Because our rights in a K Certificate transaction do not provide us with the power to direct the activities that most significantly affect the performance of the underlying loans and we do not hold the most subordinate remaining securities, we are not the primary beneficiary of our K Certificate trusts and, therefore, do not consolidate those trusts.
When we sell loans to a K Certificate trust, we derecognize the transferred loans and account for our guarantee to the non-consolidated K Certificate trust. We account for our investments in the beneficial interests issued by non-consolidated K Certificate trusts as investments in debt securities.
During
2018
and
2017
, we issued approximately
$52.2 billion
and
$48.5 billion
, respectively, of K Certificates for which a guarantee asset and guarantee obligation were generally recognized.
SB Certificates
In SB Certificate transactions, we securitize multifamily small balance loans using a non-Freddie Mac SB Certificate trust that issues senior classes of securities that we guarantee, as well as subordinated classes of securities that we do not guarantee. Similar to our K Certificate transactions, we are not the primary beneficiary of and, therefore, do not consolidate our SB Certificate trusts, as we do not have the ability to direct loss mitigation activities of the underlying loans, which is the most significant activity affecting the economic performance of the VIE.
In a typical SB Certificate transaction, we sell loans to a SB Certificate trust, derecognize the transferred loans and account for our guarantee to the non-consolidated SB Certificate trust. We account for our investments in the beneficial interests issued by non-consolidated SB Certificate trusts as investments in debt securities.
During
2018
and
2017
, we issued approximately
$6.3 billion
and
$4.9 billion
, respectively, of SB Certificates for which a guarantee asset and guarantee obligation were recognized.
Multifamily Other Risk Transfer Securitizations
We are the primary beneficiary of and, therefore, consolidate the trusts used to issue our KT Certificates and K Certificates without subordination because we have the ability to direct the activities that most significantly affect the economic performance of the trusts and we have the obligation to absorb credit losses through our guarantee of some or all of the issued securities. As a result, we consolidated trusts used to issue these products with underlying assets totaling
$5.0 billion
and
$4.4 billion
at
December 31, 2018
and December 31,
2017
, respectively. Our multifamily PCs are included in
Note 3 -
Securitization Activities - PCs
.
We do not consolidate the trusts used to issue our other risk transfer securitization products that do not meet these conditions, including those trusts that issue ML Certificates, KI Certificates, Q Certificates, and M Certificates. For those products, we account for our guarantee to the non-consolidated VIE. During
2018
and
2017
, we issued approximately
$3.4 billion
and
$5.6 billion
, respectively, of these securities for which a guarantee asset and guarantee obligation were generally recognized.
|
FREDDIE MAC
| 2018 Form 10-K
|
236
|
|
|
Financial Statements
|
Notes to the Consolidated Financial Statements |
Note 3
|
CRT Activities
STACR Trust
In a STACR Trust transaction, we pay a credit premium payment to a trust that issues credit-linked notes whose repayments are based on the credit performance of a reference pool of mortgage loans. The trust issues the notes and makes periodic payments of principal and interest on the notes to investors, and we receive payments from the trust that otherwise would have been made to the noteholders to the extent there are credit events on the mortgages in the reference pool. The note balances are reduced by the amount of the payments to us. STACR Trust was designed to create and pass along to its interest holders the variability related to the credit risk of the mortgages in the reference pool. Because our credit protection arrangement is a creator rather than an absorber of that variability, we do not have a variable interest in the risk that the STACR Trust was designed to create and pass along to its interest holders and do not consolidate the trusts used in the STACR Trust transactions.
Consolidated VIEs
We consolidated the VIEs for which we are the primary beneficiary as discussed above. Our exposure on debt securities of consolidated trusts represents our liability to third parties that hold beneficial interests in our consolidated securitization trusts.
When we consolidate a VIE, we recognize the assets and liabilities of the VIE on our consolidated balance sheets and account for those assets and liabilities based on the applicable GAAP for each specific type of asset or liability. Assets and liabilities that we transfer to a VIE at, after or shortly before the date we become the primary beneficiary of the VIE are initially measured at the same amounts that they would have been measured if they had not been transferred, and no gain or loss is recognized on these transfers. For all other VIEs that we consolidate, we recognize the assets and liabilities of the VIE at fair value, and we recognize a gain or loss for the difference between:
|
n
|
The sum of the fair value of the consideration paid, the fair value of any noncontrolling interests, and the reported amount of any previously held interests and
|
|
n
|
The net fair value of the assets and liabilities recognized. Guarantees to consolidated VIEs are eliminated in consolidation and are therefore not separately recognized on our consolidated balance sheets.
|
|
FREDDIE MAC
| 2018 Form 10-K
|
237
|
|
|
Financial Statements
|
Notes to the Consolidated Financial Statements |
Note 3
|
The table below presents the carrying value and classification of the assets and liabilities of consolidated VIEs on our consolidated balance sheets.
Table 3.1 - Consolidated VIEs
|
(In millions)
|
As of December 31, 2018
|
As of December 31, 2017
|
|||||
|
Consolidated Balance Sheet Line Item
|
|||||||
|
Assets:
|
|||||||
|
Cash and cash equivalents (includes $566 and $518 of restricted cash and cash equivalent)
|
|
$567
|
|
|
$518
|
|
|
|
Securities purchased under agreements to resell
|
12,125
|
|
16,750
|
|
|||
|
Mortgage loans held-for-investment
|
1,842,850
|
|
1,774,286
|
|
|||
|
Accrued interest receivable
|
5,914
|
|
5,747
|
|
|||
|
Other assets
|
1,631
|
|
2,738
|
|
|||
|
Total assets of consolidated VIEs
|
|
$1,863,087
|
|
|
$1,800,039
|
|
|
|
Liabilities:
|
|||||||
|
Accrued interest payable
|
|
$5,335
|
|
|
$5,028
|
|
|
|
Debt, net
|
1,792,677
|
|
1,720,996
|
|
|||
|
Other liabilities
|
—
|
|
2
|
|
|||
|
Total liabilities of consolidated VIEs
|
|
$1,798,012
|
|
|
$1,726,026
|
|
|
Non-Consolidated VIEs
Our involvement with VIEs for which we are not the primary beneficiary may take the form of purchasing an investment in these entities or providing a guarantee to these entities. Our maximum exposure to loss for those VIEs where we have purchased an investment is calculated as the maximum potential charge that we would recognize in earnings if that investment were to become worthless. Our maximum exposure to loss for those VIEs where we have provided a guarantee represents the contractual amounts that could be lost under the guarantees if counterparties or borrowers defaulted, without consideration of possible recoveries under credit enhancement arrangements. We do not believe the maximum exposure to loss disclosed in the table below is representative of the actual loss we are likely to incur, based on our historical loss experience and after consideration of proceeds from related collateral liquidation, including possible recoveries under credit enhancement arrangements. See
Note 6
for additional information on credit enhancement arrangements.
The following table presents the carrying amounts and classification of the assets and liabilities recorded on our consolidated balance sheets related to non-consolidated VIEs with which we were involved in the design and creation and have a significant continuing involvement, as well as our maximum exposure to loss.
|
FREDDIE MAC
| 2018 Form 10-K
|
238
|
|
|
Financial Statements
|
Notes to the Consolidated Financial Statements |
Note 3
|
Table 3.2 - Non-Consolidated VIEs
|
(In millions)
|
|
As of December 31, 2018
|
As of December 31, 2017
|
||||
|
Assets and Liabilities Recorded on our Consolidated Balance Sheets
(1)
|
|
|
|||||
|
Assets:
|
|
|
|||||
|
Investments in securities, at fair value
|
|
|
$44,020
|
|
|
$51,494
|
|
|
Accrued interest receivable
|
|
235
|
|
233
|
|
||
|
Derivative assets, net
|
1
|
|
7
|
|
|||
|
Other assets
|
|
3,119
|
|
2,591
|
|
||
|
Liabilities:
|
|
||||||
|
Derivative liabilities, net
|
|
88
|
|
—
|
|
||
|
Other liabilities
|
|
3,049
|
|
2,489
|
|
||
|
Maximum Exposure to Loss
(2)(3)
|
|
|
$241,055
|
|
|
$200,196
|
|
|
Total Assets of Non-Consolidated VIEs
(3)
|
|
|
$284,724
|
|
|
$232,762
|
|
|
(1)
|
Includes our variable interests in REMICs and Stripped Giant PCs, K Certificates, SB Certificates, certain senior subordinate securitization structures, other securitization products, and other risk transfer securitizations that we do not consolidate.
|
|
(2)
|
Our maximum exposure to loss includes the guaranteed UPB of assets held by the non-consolidated VIEs, the UPB of unguaranteed securities that we acquired from these securitization transactions, and the UPB of guarantor advances made to the holders of the guaranteed securities.
|
|
(3)
|
Our maximum exposure to loss and total assets of non-consolidated VIEs exclude our investments in and obligations to REMICs and Stripped Giant PCs, because we already consolidate the underlying collateral of these trusts on our consolidated balance sheets. In addition, our maximum exposure to loss excludes certain securitization activity and other mortgage-related guarantees measured at fair value where our exposure may be unlimited. We generally reduce our exposure to these guarantees with unlimited exposure through separate contracts with third parties.
|
We also obtain interests in various other VIEs created by third parties through the normal course of business, such as through our investments in certain non-Freddie Mac mortgage-related securities, purchases of multifamily loans, guarantees of multifamily housing revenue bonds, as a derivative counterparty or through other activities. To the extent that we were not involved in the design or creation of these VIEs, they are excluded from the table above. Our interests in these VIEs are generally passive in nature and are not expected to result in us obtaining a controlling financial interest in these VIEs in the future. As a result, we do not consolidate these VIEs and we account for our interests in these VIEs in the same manner that we account for our interests in other third-party transactions. See
Note 7
for additional information regarding our investments in non-Freddie Mac mortgage-related securities. See
Note 4
for more information regarding multifamily loans.
|
FREDDIE MAC
| 2018 Form 10-K
|
239
|
|
|
Financial Statements
|
Notes to the Consolidated Financial Statements
|
Note 4
|
NOTE 4
Mortgage Loans and Allowance for Credit Losses
The table below provides details of the loans on our consolidated balance sheets as of
December 31, 2018
and December 31,
2017
.
Table 4.1 - Mortgage Loans
|
|
December 31, 2018
|
|
December 31, 2017
|
|||||||||||||||||
|
(In millions)
|
Held by Freddie Mac
|
Held by
consolidated trusts |
Total
|
Held by Freddie Mac
|
Held by
consolidated trusts |
Total
|
||||||||||||||
|
Held-for-sale:
|
||||||||||||||||||||
|
Single-family
|
|
$20,946
|
|
|
$—
|
|
|
$20,946
|
|
|
$17,039
|
|
|
$—
|
|
|
$17,039
|
|
||
|
Multifamily
|
23,959
|
|
—
|
|
23,959
|
|
20,537
|
|
—
|
|
20,537
|
|
||||||||
|
Total UPB
|
44,905
|
|
—
|
|
44,905
|
|
37,576
|
|
—
|
|
37,576
|
|
||||||||
|
Cost basis and fair value adjustments, net
|
(3,283
|
)
|
—
|
|
(3,283
|
)
|
(2,813
|
)
|
—
|
|
(2,813
|
)
|
||||||||
|
Total held-for-sale loans, net
|
41,622
|
|
—
|
|
41,622
|
|
34,763
|
|
—
|
|
34,763
|
|
||||||||
|
Held-for-investment:
|
||||||||||||||||||||
|
Single-family
|
35,885
|
|
1,814,008
|
|
1,849,893
|
|
51,893
|
|
1,742,736
|
|
1,794,629
|
|
||||||||
|
Multifamily
|
10,828
|
|
4,220
|
|
15,048
|
|
17,702
|
|
3,747
|
|
21,449
|
|
||||||||
|
Total UPB
|
46,713
|
|
1,818,228
|
|
1,864,941
|
|
69,595
|
|
1,746,483
|
|
1,816,078
|
|
||||||||
|
Cost basis adjustments
|
(1,198
|
)
|
27,752
|
|
26,554
|
|
(2,148
|
)
|
31,490
|
|
29,342
|
|
||||||||
|
Allowance for loan losses
|
(3,009
|
)
|
(3,130
|
)
|
(6,139
|
)
|
(5,279
|
)
|
(3,687
|
)
|
(8,966
|
)
|
||||||||
|
Total held-for-investment loans, net
|
42,506
|
|
1,842,850
|
|
1,885,356
|
|
62,168
|
|
1,774,286
|
|
1,836,454
|
|
||||||||
|
Total loans, net
|
|
$84,128
|
|
|
$1,842,850
|
|
|
$1,926,978
|
|
|
$96,931
|
|
|
$1,774,286
|
|
|
$1,871,217
|
|
||
On February 2, 2017, we started applying fair value hedge accounting to certain single-family mortgage loans. The fair value hedge accounting related loan basis adjustments are included in the table above.
We own both single-family loans, which are secured by one to four unit residential properties, and multifamily loans, which are secured by properties with five or more residential rental units. Our single-family loans are predominantly first lien, fixed-rate loans secured by the borrower's primary residence.
Upon acquisition, we classify a loan as either held-for-investment or held-for-sale. Loans that we have the ability and intent to hold for the foreseeable future are classified as held-for-investment. Loans that we intend to securitize using an entity we will consolidate are classified as held-for-investment both prior to and subsequent to their securitization. Otherwise, they will be classified as held-for-sale. Held-for-investment loans are reported on our consolidated balance sheets at their outstanding UPB, net of deferred fees and other cost basis adjustments (including unamortized premiums and discounts, upfront fees, and other pricing adjustments).
Loans not classified as held-for-investment are classified as held-for-sale. Held-for-sale loans are reported at lower-of-cost-or-fair-value on our consolidated balance sheets, unless the fair value option is elected. Any excess of a held-for-sale loan's cost over its fair value is recognized as a valuation allowance in mortgage loans gains (losses) on our consolidated statements of comprehensive income, with changes in this valuation allowance also being recorded in mortgage loans gains (losses). Premiums, discounts, and other cost basis adjustments (including lower-of-cost-or-fair-value adjustments) on single-family loans classified as held-for-sale are deferred and not amortized. We elected the fair value option for certain multifamily loans that we intend to securitize and sell to investors. Therefore, these multifamily loans are measured at fair value on a recurring basis, with subsequent gains or losses related to changes in fair value reported in mortgage loans gains (losses) on
|
FREDDIE MAC
| 2018 Form 10-K
|
240
|
|
|
Financial Statements
|
Notes to the Consolidated Financial Statements
|
Note 4
|
our consolidated statements of comprehensive income.
Cash flows related to loans originally classified as held-for-investment are classified as either investing activities (e.g., principal repayments) or operating activities (e.g., interest payments received from borrowers included within net income (loss)). Cash flows related to loans originally classified as held-for-sale are classified as operating activities.
The table below provides details of the UPB of loans we purchased, reclassified from held-for-investment to held-for-sale, and sold.
Table 4.2 - Loans Purchased, Reclassified from Held-for-Investment to Held-for-Sale, and Sold
|
(In billions)
|
2018
|
2017
|
|||||
|
Single-family:
|
|||||||
|
Purchases
|
|||||||
|
Held-for-investment loans
|
|
$307.7
|
|
|
$343.0
|
|
|
|
Reclassified from held-for-investment to held-for-sale
(1)
|
21.7
|
|
26.2
|
|
|||
|
Sale of held-for-sale loans
(2)
|
10.2
|
|
8.7
|
|
|||
|
Multifamily:
|
|||||||
|
Purchases
|
|||||||
|
Held-for-investment loans
|
5.0
|
|
5.3
|
|
|||
|
Held-for-sale loans
|
70.3
|
|
64.6
|
|
|||
|
Reclassified from held-for-investment to held-for-sale
(1)
|
1.8
|
|
1.6
|
|
|||
|
Sale of held-for-sale loans
(3)
|
68.1
|
|
61.9
|
|
|||
|
(1)
|
We reclassify loans from held-for-investment to held-for-sale when we no longer have the intent or ability to hold for the foreseeable future. For additional information regarding the fair value of our loans classified as held-for-sale, see
Note 15.
|
|
(2)
|
Our sales of single-family loans reflect the sale of seasoned single-family loans. The sale of seasoned single-family mortgage loans is part of our strategy to mitigate and reduce our holdings of less liquid assets.
|
|
(3)
|
Our sales of multifamily loans occur primarily through the issuance of multifamily K Certificates and SB Certificates. See
Note 3
for more information on our K Certificates and SB Certificates.
|
Interest Income
We recognize interest income on an accrual basis except when we believe the collection of principal and interest in full is not reasonably assured, which generally occurs when a loan is three monthly payments or more past due, unless the loan is well secured and in the process of collection based upon an individual loan assessment. A loan is considered past due if a full payment of principal and interest is not received within one month of its due date.
Cost basis adjustments on held-for-investment loans are amortized into interest income over the contractual lives of the loans using the effective interest method.
A non-accrual loan may be returned to accrual status when the collectability of principal and interest in full is reasonably assured. For single-family loans, we determine that collectability is reasonably assured when we have received payment of principal and interest such that the loan becomes less than three monthly payments past due. For multifamily loans, the collectability of principal and interest is considered reasonably assured based on an analysis of the factors specific to the loan being assessed. Upon a loan's return to accrual status, all previously reversed interest income is recognized and amortization of any basis adjustments into interest income is resumed.
|
FREDDIE MAC
| 2018 Form 10-K
|
241
|
|
|
Financial Statements
|
Notes to the Consolidated Financial Statements
|
Note 4
|
Credit Quality
Single-Family
The current LTV ratio is one key factor we consider when estimating our allowance for credit losses for single-family loans. As current LTV ratios increase, the borrower's equity in the home decreases, which may negatively affect the borrower's ability to refinance (outside of the Enhanced Relief Refinance program) or to sell the property for an amount at or above the balance of the outstanding loan.
A second-lien loan also reduces the borrower's equity in the home, and has a similar negative effect on the borrower's ability to refinance or sell the property for an amount at or above the combined balances of the first and second loans. However, borrowers are free to obtain second-lien financing after origination, and we are not entitled to receive notification when a borrower does so. For further information about concentrations of risk associated with our single-family and multifamily loans, see
Note 14
.
The table below presents the recorded investment of single-family held-for-investment loans by current LTV ratios. Our current LTV ratios are estimates based on available data through the end of each respective period presented.
Table 4.3 - Recorded Investment of Single-Family Held-for-Investment Loans by Current LTV Ratios
|
As of December 31, 2018
|
As of December 31, 2017
|
|||||||||||||||||||||||||
|
|
Current LTV Ratio
|
Total
|
Current LTV Ratio
|
Total
|
||||||||||||||||||||||
|
(In millions)
|
≤ 80
|
> 80 to 100
|
> 100
(1)
|
≤ 80
|
> 80 to 100
|
> 100
(1)
|
||||||||||||||||||||
|
20 and 30-year or more, amortizing fixed-rate
|
|
$1,336,310
|
|
|
$214,703
|
|
|
$6,654
|
|
|
$1,557,667
|
|
|
$1,240,224
|
|
|
$214,177
|
|
|
$13,303
|
|
|
$1,467,704
|
|
||
|
15-year amortizing fixed-rate
|
251,152
|
|
4,522
|
|
157
|
|
255,831
|
|
270,266
|
|
7,351
|
|
381
|
|
277,998
|
|
||||||||||
|
Adjustable-rate
|
42,117
|
|
1,883
|
|
7
|
|
44,007
|
|
48,596
|
|
2,963
|
|
28
|
|
51,587
|
|
||||||||||
|
Alt-A, interest-only, and option ARM
|
16,498
|
|
1,903
|
|
559
|
|
18,960
|
|
21,013
|
|
4,256
|
|
1,429
|
|
26,698
|
|
||||||||||
|
Total single-family loans
|
|
$1,646,077
|
|
|
$223,011
|
|
|
$7,377
|
|
|
$1,876,465
|
|
|
$1,580,099
|
|
|
$228,747
|
|
|
$15,141
|
|
|
$1,823,987
|
|
||
|
(1)
|
The serious delinquency rate for the total of single-family held-for-investment mortgage loans with current LTV ratios in excess of 100% was
7.24%
and
8.43%
as of
December 31, 2018
and December 31,
2017
, respectively.
|
For reporting purposes:
|
n
|
Loans within the Alt-A category continue to be presented in that category following modification, even though the borrower may have provided full documentation of assets and income to complete the modification and
|
|
n
|
Loans within the option ARM category continue to be presented in that category following modification, even though the modified loan no longer provides for optional payment provisions.
|
Multifamily
The table below presents the recorded investment in our multifamily held-for-investment loans, by credit quality indicator based on available data through the end of each period presented. These indicators involve significant management judgment.
|
FREDDIE MAC
| 2018 Form 10-K
|
242
|
|
|
Financial Statements
|
Notes to the Consolidated Financial Statements
|
Note 4
|
Table 4.4 - Recorded Investment of Multifamily Held-for-Investment Loans by Credit Quality Indicator
|
(In millions)
|
As of December 31, 2018
|
As of December 31, 2017
|
|||||
|
Credit risk profile by internally assigned grade:
(1)
|
|||||||
|
Pass
|
|
$14,648
|
|
|
$20,963
|
|
|
|
Special mention
|
201
|
|
301
|
|
|||
|
Substandard
|
181
|
|
169
|
|
|||
|
Doubtful
|
—
|
|
—
|
|
|||
|
Totals
|
|
$15,030
|
|
|
$21,433
|
|
|
|
(1)
|
A loan categorized as: "Pass" is current and adequately protected by the current financial strength and debt service capacity of the borrower; "Special mention" has administrative issues that may affect future repayment prospects but does not have current credit weaknesses; "Substandard" has a weakness that jeopardizes the timely full repayment; and "Doubtful" has a weakness that makes collection or liquidation in full highly questionable and improbable based on existing conditions.
|
Mortgage Loan Performance
The following tables present the recorded investment of our single-family and multifamily loans, held-for-investment, by payment status.
Table 4.5 - Recorded Investment of Held-for-Investment Loans by Payment Status
|
As of December 31, 2018
|
|||||||||||||||||||
|
(In millions)
|
Current
|
One
Month
Past Due
|
Two
Months
Past Due
|
Three Months or
More Past Due,
or in Foreclosure
(1)
|
Total
|
Non-accrual
|
|||||||||||||
|
Single-family:
|
|||||||||||||||||||
|
20 and 30-year or more, amortizing fixed-rate
|
|
$1,532,499
|
|
|
$14,683
|
|
|
$3,602
|
|
|
$6,883
|
|
|
$1,557,667
|
|
|
$6,881
|
|
|
|
15-year amortizing fixed-rate
|
254,376
|
|
1,021
|
|
171
|
|
263
|
|
255,831
|
|
263
|
|
|||||||
|
Adjustable-rate
|
43,549
|
|
287
|
|
58
|
|
113
|
|
44,007
|
|
113
|
|
|||||||
|
Alt-A, interest-only, and option ARM
|
16,975
|
|
793
|
|
327
|
|
865
|
|
18,960
|
|
864
|
|
|||||||
|
Total single-family
|
1,847,399
|
|
16,784
|
|
4,158
|
|
8,124
|
|
1,876,465
|
|
8,121
|
|
|||||||
|
Total multifamily
|
15,030
|
|
—
|
|
—
|
|
—
|
|
15,030
|
|
17
|
|
|||||||
|
Total single-family and multifamily
|
|
$1,862,429
|
|
|
$16,784
|
|
|
$4,158
|
|
|
$8,124
|
|
|
$1,891,495
|
|
|
$8,138
|
|
|
|
|
As of December 31, 2017
|
||||||||||||||||||
|
(In millions)
|
Current
|
One
Month Past Due |
Two
Months Past Due |
Three Months or
More Past Due, or in Foreclosure (1) |
Total
|
Non-accrual
|
|||||||||||||
|
Single-family:
|
|
|
|
|
|
|
|||||||||||||
|
20 and 30-year or more, amortizing fixed-rate
|
|
$1,431,342
|
|
|
$18,297
|
|
|
$5,660
|
|
|
$12,405
|
|
|
$1,467,704
|
|
|
$12,401
|
|
|
|
15-year amortizing fixed-rate
|
275,864
|
|
1,288
|
|
290
|
|
556
|
|
277,998
|
|
556
|
|
|||||||
|
Adjustable-rate
|
50,915
|
|
383
|
|
84
|
|
205
|
|
51,587
|
|
205
|
|
|||||||
|
Alt-A, interest-only, and option ARM
|
23,235
|
|
1,297
|
|
509
|
|
1,657
|
|
26,698
|
|
1,656
|
|
|||||||
|
Total single-family
|
1,781,356
|
|
21,265
|
|
6,543
|
|
14,823
|
|
1,823,987
|
|
14,818
|
|
|||||||
|
Total multifamily
|
21,414
|
|
—
|
|
—
|
|
19
|
|
21,433
|
|
64
|
|
|||||||
|
Total single-family and multifamily
|
|
$1,802,770
|
|
|
$21,265
|
|
|
$6,543
|
|
|
$14,842
|
|
|
$1,845,420
|
|
|
$14,882
|
|
|
|
(1)
|
Includes
$2.9 billion
and
$4.1 billion
of loans that were in the process of foreclosure as of
December 31, 2018
and December 31,
2017
, respectively.
|
We have the option under our PC master trust agreement to remove loans that underlie our PCs under certain circumstances to resolve an existing or impending delinquency or default. Our practice generally has been to remove loans from PC trusts when the loans have been delinquent for 120 days or more.
|
FREDDIE MAC
| 2018 Form 10-K
|
243
|
|
|
Financial Statements
|
Notes to the Consolidated Financial Statements
|
Note 4
|
When we remove loans from PC trusts, we record an extinguishment of the corresponding portion of the debt securities of the consolidated trusts and we reclassify the loans from mortgage loans held-for-investment by consolidated trusts to mortgage loans held-for-investment by Freddie Mac. We removed
$7.8 billion
and
$6.3 billion
in UPB of loans from PC trusts (or purchased delinquent loans associated with other mortgage-related guarantees) during the years ended
December 31, 2018
and December 31,
2017
, respectively.
The table below summarizes the delinquency rates of loans within our single-family credit guarantee and multifamily mortgage portfolios.
Table 4.6 - Delinquency Rates
|
(Dollars in millions)
|
December 31, 2018
|
December 31, 2017
|
|||||
|
Single-family:
|
|||||||
|
Non-credit-enhanced portfolio:
|
|||||||
|
Serious delinquency rate
|
0.83
|
%
|
1.16
|
%
|
|||
|
Total number of seriously delinquent loans
|
51,197
|
|
81,668
|
|
|||
|
Credit-enhanced portfolio:
(1)
|
|||||||
|
Primary mortgage insurance:
|
|||||||
|
Serious delinquency rate
|
0.86
|
%
|
1.43
|
%
|
|||
|
Total number of seriously delinquent loans
|
15,287
|
|
23,275
|
|
|||
|
Other credit protection:
(2)
|
|||||||
|
Serious delinquency rate
|
0.31
|
%
|
0.53
|
%
|
|||
|
Total number of seriously delinquent loans
|
12,920
|
|
16,259
|
|
|||
|
Total Single-family
|
|||||||
|
Serious delinquency rate
|
0.69
|
%
|
1.08
|
%
|
|||
|
Total number of seriously delinquent loans
|
75,649
|
|
116,662
|
|
|||
|
Multifamily
(3)
|
|||||||
|
Non-credit-enhanced portfolio:
|
|||||||
|
Delinquency rate
|
—
|
%
|
0.06
|
%
|
|||
|
UPB of delinquent loans
|
|
$2
|
|
|
$24
|
|
|
|
Credit-enhanced portfolio:
|
|||||||
|
Delinquency rate
|
0.01
|
%
|
0.01
|
%
|
|||
|
UPB of delinquent loans
|
|
$28
|
|
|
$16
|
|
|
|
Total Multifamily
|
|||||||
|
Delinquency rate
|
0.01
|
%
|
0.02
|
%
|
|||
|
UPB of delinquent loans
|
|
$30
|
|
|
$40
|
|
|
|
(1)
|
The credit-enhanced categories are not mutually exclusive, as a single loan may be covered by both primary mortgage insurance and other credit protection.
|
|
(2)
|
Consists of single-family loans covered by financial arrangements (other than primary mortgage insurance) that are designed to reduce our credit risk exposure. See
Note 6
for additional information on our credit enhancements.
|
|
(3)
|
Multifamily delinquency performance is based on the UPB of loans that are two monthly payments or more past due or those in the process of foreclosure.
|
We continue to implement a number of initiatives to refinance and modify single-family loans. As part of these initiatives, we pay various incentives to servicers and borrowers. HAMP ended in December 2016 and HARP ended in December 2018. The relief refinance program has been replaced with the Enhanced Relief Refinance program, which became available in January 2019 for loans originated on or after October 1, 2017. This program provides liquidity for borrowers who are current on their mortgages but are unable to refinance because their LTV ratios exceed our standard refinance limits.
|
FREDDIE MAC
| 2018 Form 10-K
|
244
|
|
|
Financial Statements
|
Notes to the Consolidated Financial Statements
|
Note 4
|
Allowance for Credit Losses
The allowance for credit losses represents estimates of probable incurred credit losses which we recognize by recording a charge to the provision for credit losses on our consolidated statements of comprehensive income. The allowance for credit losses includes:
|
n
|
Our allowance for loan losses, which pertains to all single-family and multifamily loans classified as held-for-investment on our consolidated balance sheets and
|
|
n
|
Our reserve for guarantee losses, which pertains to single-family and multifamily loans underlying our K Certificates, SB Certificates, senior subordinate securitization structures (non-consolidated), other securitization products, and other mortgage-related guarantees.
|
A significant number of unsecuritized single-family loans on our consolidated balance sheets include seriously delinquent and TDR loans that we previously removed from our PC pools. These seriously delinquent and TDR loans historically have a higher associated allowance for loan losses than loans that remain in consolidated trusts.
The table below summarizes changes in our allowance for credit losses.
Table 4.7 - Details of Allowance for Credit Losses
|
|
Year Ended December 31,
|
|||||||||||||||||||||||||
|
2018
|
|
2017
|
||||||||||||||||||||||||
|
|
Allowance for Loan Losses
|
Reserve for
Guarantee Losses |
Total
|
|
Allowance for Loan Losses
|
Reserve for
Guarantee Losses |
Total
|
|||||||||||||||||||
|
(In millions)
|
Held by Freddie Mac
|
Held By
Consolidated Trusts |
|
Held by Freddie Mac
|
Held By
Consolidated Trusts |
|||||||||||||||||||||
|
Single-family:
|
|
|
|
|
|
|
|
|
|
|||||||||||||||||
|
Beginning balance
|
|
$5,251
|
|
|
$3,680
|
|
|
$48
|
|
|
$8,979
|
|
|
|
$10,443
|
|
|
$2,968
|
|
|
$52
|
|
|
$13,463
|
|
|
|
Provision (benefit) for credit losses
|
(861
|
)
|
145
|
|
4
|
|
(712
|
)
|
|
(1,447
|
)
|
1,350
|
|
—
|
|
(97
|
)
|
|||||||||
|
Charge-offs
|
(2,823
|
)
|
(56
|
)
|
(6
|
)
|
(2,885
|
)
|
|
(4,939
|
)
|
(108
|
)
|
(4
|
)
|
(5,051
|
)
|
|||||||||
|
Recoveries
|
467
|
|
8
|
|
—
|
|
475
|
|
|
419
|
|
6
|
|
—
|
|
425
|
|
|||||||||
|
Transfers, net
(1)
|
676
|
|
(676
|
)
|
—
|
|
—
|
|
|
540
|
|
(540
|
)
|
—
|
|
—
|
|
|||||||||
|
Other
(2)
|
293
|
|
26
|
|
—
|
|
319
|
|
235
|
|
4
|
|
—
|
|
239
|
|
||||||||||
|
Ending balance
|
|
$3,003
|
|
|
$3,127
|
|
|
$46
|
|
|
$6,176
|
|
|
|
$5,251
|
|
|
$3,680
|
|
|
$48
|
|
|
$8,979
|
|
|
|
Multifamily:
|
|
|
|
|
|
|
|
|
|
|||||||||||||||||
|
Beginning balance
|
|
$28
|
|
|
$7
|
|
|
$9
|
|
|
$44
|
|
|
|
$18
|
|
|
$2
|
|
|
$15
|
|
|
$35
|
|
|
|
Provision (benefit) for credit losses
|
(23
|
)
|
—
|
|
(1
|
)
|
(24
|
)
|
|
15
|
|
4
|
|
(6
|
)
|
13
|
|
|||||||||
|
Charge-offs
|
(6
|
)
|
—
|
|
(2
|
)
|
(8
|
)
|
|
(4
|
)
|
—
|
|
—
|
|
(4
|
)
|
|||||||||
|
Recoveries
|
3
|
|
—
|
|
—
|
|
3
|
|
|
—
|
|
—
|
|
—
|
|
—
|
|
|||||||||
|
Transfers, net
(1)
|
4
|
|
(4
|
)
|
—
|
|
—
|
|
|
(1
|
)
|
1
|
|
—
|
|
—
|
|
|||||||||
|
Other
(2)
|
—
|
|
—
|
|
—
|
|
—
|
|
—
|
|
—
|
|
—
|
|
—
|
|
||||||||||
|
Ending balance
|
|
$6
|
|
|
$3
|
|
|
$6
|
|
|
$15
|
|
|
|
$28
|
|
|
$7
|
|
|
$9
|
|
|
$44
|
|
|
|
Total:
|
|
|
|
|
|
|
|
|
|
|||||||||||||||||
|
Beginning balance
|
|
$5,279
|
|
|
$3,687
|
|
|
$57
|
|
|
$9,023
|
|
|
|
$10,461
|
|
|
$2,970
|
|
|
$67
|
|
|
$13,498
|
|
|
|
Provision (benefit) for credit losses
|
(884
|
)
|
145
|
|
3
|
|
(736
|
)
|
|
(1,432
|
)
|
1,354
|
|
(6
|
)
|
(84
|
)
|
|||||||||
|
Charge-offs
|
(2,829
|
)
|
(56
|
)
|
(8
|
)
|
(2,893
|
)
|
|
(4,943
|
)
|
(108
|
)
|
(4
|
)
|
(5,055
|
)
|
|||||||||
|
Recoveries
|
470
|
|
8
|
|
—
|
|
478
|
|
|
419
|
|
6
|
|
—
|
|
425
|
|
|||||||||
|
Transfers, net
(1)
|
680
|
|
(680
|
)
|
—
|
|
—
|
|
|
539
|
|
(539
|
)
|
—
|
|
—
|
|
|||||||||
|
Other
(2)
|
293
|
|
26
|
|
—
|
|
319
|
|
235
|
|
4
|
|
—
|
|
239
|
|
||||||||||
|
Ending balance
|
|
$3,009
|
|
|
$3,130
|
|
|
$52
|
|
|
$6,191
|
|
|
|
$5,279
|
|
|
$3,687
|
|
|
$57
|
|
|
$9,023
|
|
|
|
(1)
|
Relates to removal of delinquent loans from consolidated trusts and resecuritization after such removal
.
|
|
(2)
|
Primarily includes capitalization of past due interest on modified loans.
|
|
FREDDIE MAC
| 2018 Form 10-K
|
245
|
|
|
Financial Statements
|
Notes to the Consolidated Financial Statements
|
Note 4
|
Allowance for Loan Losses Determined on a Collective Basis
Single-Family Loans
We estimate allowance for loan losses on homogeneous pools of single-family loans using a model that evaluates a variety of factors affecting collectability. We review the outputs of this model by considering qualitative factors such as macroeconomic and other factors to see whether the model outputs are consistent with our expectations. Management adjustments may be necessary to take into consideration external factors and current economic events that have occurred but that are not yet reflected in the factors used to derive the model outputs. Significant judgment is exercised in making these adjustments. The homogeneous pools of single-family loans are determined based on common underlying characteristics, including current LTV ratios, trends in home prices, loan product type, and geographic region.
We rely upon third-parties to service our loans. At loan delivery, the seller provides us with loan data, which includes characteristics and underwriting information. Each subsequent month, the servicers provide us with monthly loan level servicing data, including delinquency and loss information.
Our single-family allowance for loan losses default models produce estimates based on 12 months of loan level performance data, which includes a history of delinquency, foreclosures, foreclosure alternatives, and modifications. Our allowance for loan losses estimate includes projections of:
|
n
|
Loss mitigation activities, including loan modifications for troubled borrowers and the incidence of redefault we have experienced on similar loans that have completed a loan modification and
|
|
n
|
Defaults we believe are likely to occur as a result of loss events that have occurred through the respective balance sheet date.
|
These projections are based on our recent historical experience and current business practices and require significant management judgment. We validate and update our models and factors to capture changes in actual loss experience, as well as the effects of changes in underwriting practices and in our loss mitigation strategies. In determining our allowance for loan losses, we also consider macroeconomic and other factors that affect the quality of the loans underlying our portfolio, including regional housing trends, applicable home price indices, unemployment and employment dislocation trends, the effects of changes in government policies and programs, consumer credit statistics, and the extent of third-party insurance.
Our single-family allowance for loan losses severity is based on the repeat housing sales index and actual REO dispositions, short sales, and third-party sales that incorporate the most recent:
|
n
|
Twelve months of sales experience realized on our distressed property dispositions and
|
|
n
|
Twelve months of pre-foreclosure expenses on our distressed properties, including REO, short sales, and third-party sales.
|
Our single-family allowance for loan losses severity estimate also captures expectations about recoveries, such as primary mortgage insurance. We use historical trends in home prices in our single-family allowance for loan losses process, primarily through the use of current LTV ratios in our default models and through the use of recent home price sales experience in our severity estimate. However, we do not use a forecast of trends in home prices in our single-family allowance for loan losses process.
For loans where foreclosure is probable, we measure impairment based upon an estimate of the fair value of the underlying collateral less estimated disposition costs. Our estimate also considers the effect
|
FREDDIE MAC
| 2018 Form 10-K
|
246
|
|
|
Financial Statements
|
Notes to the Consolidated Financial Statements
|
Note 4
|
of historical home price changes on borrower behavior.
We apply proceeds from primary mortgage insurance and from other credit enhancements, including repurchase recoveries, entered into contemporaneously with, and in contemplation of, a guarantee or loan purchase transaction as a recovery of our recorded investment in a charged-off loan, up to the amount of loss recognized as a charge-off. Proceeds received in excess of our recorded investment in loans are recorded as a decrease to REO operations expense on our consolidated statements of comprehensive income. We record benefits related to freestanding credit enhancements based on actual losses (e.g., ACIS insurance policies) when realization of our claims is deemed probable and a loss has been recognized on the covered loans. We record benefits for our debt with embedded credit enhancements for which we have not elected the fair value option (e.g., certain STACR debt notes and certain senior subordinate securitization structures) when the realized loss event occurs. We generally record repurchase recoveries on a cash basis due to the uncertainty of the timing and amount of collections of such recoveries.
Multifamily Loans
Multifamily loans evaluated collectively for impairment are aggregated into book year vintage portfolios. Potential impairment related to these portfolios is measured by benchmarking published historical commercial loan performance data to those vintages based upon available economic data related to multifamily real estate, including apartment vacancy and rental rates.
Allowance for Loan Losses Determined on an Individual Basis
We consider a loan to be impaired when, based on current information, it is probable that we will not receive all amounts due (including both principal and interest) in accordance with the contractual terms of the original loan agreement.
Single-family loans individually evaluated for impairment include TDRs, as well as loans acquired under our financial guarantees with deteriorated credit quality prior to 2010. Multifamily loans individually evaluated for impairment include TDRs, loans three monthly payments or more past due, and loans that are impaired based on management judgment.
Troubled Debt Restructurings
A modification to the contractual terms of a loan that results in granting a concession to a borrower experiencing financial difficulties is considered a TDR. A concession is deemed granted when, as a result of the restructuring, we do not expect to collect all amounts due, including interest accrued, at the original contractual interest rate. As appropriate, we also consider other qualitative factors in determining whether a concession is deemed granted, including whether the borrower's modified interest rate is consistent with that of a non-troubled borrower. We do not consider restructurings that result in an insignificant delay in payment to be a concession. We generally consider a delay in monthly
amortizing payments of three months or less to be insignificant. A concession typically includes one or more of the following being granted to the borrower:
|
n
|
A trial period where the expected permanent modification will change our expectation of collecting all amounts due at the original contract rate;
|
|
n
|
A delay in payment that is more than insignificant;
|
|
n
|
A reduction in the contractual interest rate;
|
|
FREDDIE MAC
| 2018 Form 10-K
|
247
|
|
|
Financial Statements
|
Notes to the Consolidated Financial Statements
|
Note 4
|
|
n
|
Interest forbearance for a period of time that is more than insignificant or forgiveness of accrued but uncollected interest amounts;
|
|
n
|
Principal forbearance that is more than insignificant; and
|
|
n
|
Discharge of the borrower's obligation in Chapter 7 bankruptcy.
|
The table below presents the volume of single-family and multifamily loans that were newly classified as TDRs during the years ended
December 31, 2018
and December 31,
2017
, based on the original product category of the loan before the loan was classified as a TDR. Loans classified as a TDR in one period may be subject to further action (such as a modification or remodification) in a subsequent period. In such cases, the subsequent action would not be reflected in the table below since the loan would already have been classified as a TDR.
Table 4.8 - TDR Activity
|
Year Ended December 31,
|
||||||||||||
|
|
2018
|
2017
|
||||||||||
|
(Dollars in millions)
|
Number of
Loans
|
Post-TDR
Recorded
Investment
|
Number of
Loans
|
Post-TDR
Recorded
Investment
|
||||||||
|
Single-family:
(1)
|
||||||||||||
|
20 and 30-year or more, amortizing fixed-rate
|
43,742
|
|
|
$7,084
|
|
33,745
|
|
|
$4,818
|
|
||
|
15-year amortizing fixed-rate
|
5,944
|
|
584
|
|
4,569
|
|
356
|
|
||||
|
Adjustable-rate
|
902
|
|
140
|
|
892
|
|
128
|
|
||||
|
Alt-A, interest-only, and option ARM
|
2,602
|
|
432
|
|
2,784
|
|
495
|
|
||||
|
Total single-family
|
53,190
|
|
8,240
|
|
41,990
|
|
5,797
|
|
||||
|
Multifamily
|
1
|
|
|
$15
|
|
1
|
|
|
$—
|
|
||
|
(1)
|
The pre-TDR recorded investment for single-family loans initially classified as TDR during the years ended
December 31, 2018
and December 31,
2017
was
$8.3 billion
and
$5.8 billion
, respectively.
|
The table below presents the volume of our TDR modifications that experienced payment defaults (i.e., loans that became two months delinquent or completed a loss event) during the applicable periods and had completed a modification during the year preceding the payment default. The table presents loans based on their original product category before modification.
Table 4.9 - Payment Defaults of Completed TDR Modifications
|
|
Year Ended December 31,
|
|||||||||||
|
2018
|
2017
|
|||||||||||
|
(Dollars in millions)
|
Number of Loans
|
Post-TDR
Recorded
Investment
|
Number of Loans
|
Post-TDR
Recorded
Investment
|
||||||||
|
Single-family:
|
||||||||||||
|
20 and 30-year or more, amortizing fixed-rate
|
13,548
|
|
|
$1,847
|
|
13,973
|
|
|
$2,231
|
|
||
|
15-year amortizing fixed-rate
|
565
|
|
44
|
|
720
|
|
57
|
|
||||
|
Adjustable-rate
|
176
|
|
25
|
|
225
|
|
33
|
|
||||
|
Alt-A, interest-only, and option ARM
|
1,178
|
|
199
|
|
1,254
|
|
253
|
|
||||
|
Total single-family
|
15,467
|
|
2,115
|
|
16,172
|
|
2,574
|
|
||||
|
Multifamily
|
—
|
|
|
$—
|
|
—
|
|
|
$—
|
|
||
In addition to modifications, loans may be classified as TDRs as a result of other loss mitigation activities (i.e., repayment plans, forbearance agreements, or trial period modifications). During the years ended
December 31, 2018
and December 31,
2017
,
8,488
and
7,090
, respectively, of such loans (with a
|
FREDDIE MAC
| 2018 Form 10-K
|
248
|
|
|
Financial Statements
|
Notes to the Consolidated Financial Statements
|
Note 4
|
post-TDR recorded investment of
$1.0 billion
and
$0.9 billion
, respectively) experienced a payment default within a year after the loss mitigation activity occurred.
Single-Family Loans
Impairment of a single-family loan having undergone a TDR is generally measured as the excess of our recorded investment in the loan over the present value of the expected future cash flows, discounted at the loan's effective interest rate for fixed-rate loans, or at the loan's effective interest rate prior to the restructuring for ARM loans. Our expectation of future cash flows incorporates, among other items, an estimated probability of default which is based on a number of market factors as well as the characteristics of the loan, such as past due status. Subsequent to the restructuring date, interest income is recognized at the modified interest rate, subject to our non-accrual policy as discussed in
Interest Income
above, with all other changes in the present value of expected future cash flows being recognized as a component of the provision for credit losses on our consolidated statements of comprehensive income. If we determine that foreclosure on the underlying collateral is probable, we measure impairment based upon the fair value of the collateral, as reduced by estimated disposition costs and adjusted for estimated proceeds from insurance and similar sources.
Of the single-family loan modifications that were classified as TDRs during 2018 and 2017 respectively:
n
12%
and
37%
involved interest rate reductions and, in certain cases, term extensions;
n
24%
and
14%
involved principal forbearance in addition to interest rate reductions and, in certain cases, term extensions;
n
The average term extension was
132
and
176
months; and
n
The average interest rate reduction was
0.2%
and
0.6%
.
Substantially all of our completed single-family loan modifications classified as a TDR during
2018
resulted in a modified loan with a fixed interest rate. However, many of these fixed-rate loans include provisions for the reduced interest rates to remain fixed for the first five years of the modification and then increase at a rate of up to one percent per year until the interest rate has been adjusted to the market rate that was in effect at the time of the modification.
Multifamily Loans
Multifamily impaired loans include TDRs, loans three monthly payments or more past due, and loans that are deemed impaired based on management judgment. Factors considered by management in determining whether a loan is impaired include the underlying property's operating performance as represented by its current DSCR, available credit enhancements, current LTV ratio, management of the underlying property, and the property's geographic location.
Multifamily loans are generally measured individually for impairment based on the fair value of the underlying collateral, as reduced by estimated disposition costs, as the repayment of these loans is generally provided from the cash flows of the underlying collateral and any associated credit enhancement. Except for cases of fraud and certain other types of borrower defaults, most multifamily loans are non-recourse to the borrower. As a result, the cash flows of the underlying property (including any associated credit enhancements) serve as the source of funds for repayment of the loan. Interest income recognition on multifamily impaired loans is subject to our non-accrual policy as discussed in
Interest Income
above.
The assessment as to whether a multifamily loan restructuring is considered a TDR contemplates the unique facts and circumstances of each loan. This assessment considers qualitative factors such as
|
FREDDIE MAC
| 2018 Form 10-K
|
249
|
|
|
Financial Statements
|
Notes to the Consolidated Financial Statements
|
Note 4
|
whether the borrower's modified interest rate is consistent with that of a non-troubled borrower having a similar credit profile at the time of modification. In certain cases, for maturing loans we may provide short-term loan extensions of up to one year with no changes to the effective borrowing rate. In other cases, we may make more significant modifications of terms for borrowers experiencing financial difficulty, such as reducing the interest rate, extending the maturity for longer than one year, providing principal forbearance, or some combination of these terms.
Impaired Loans
The tables below present the UPB, recorded investment, the related allowance for loan losses, average recorded investment, and interest income recognized for individually impaired loans.
Table 4.10 - Individually Impaired Loans
|
|
Balance at December 31, 2018
|
Balance at December 31, 2017
|
||||||||||||||||||
|
(In millions)
|
UPB
|
Recorded
Investment
|
Associated
Allowance
|
UPB
|
Recorded
Investment
|
Associated
Allowance
|
||||||||||||||
|
Single-family:
|
||||||||||||||||||||
|
With no allowance recorded:
(1)
|
||||||||||||||||||||
|
20 and 30-year or more, amortizing fixed-rate
|
|
$3,335
|
|
|
$2,666
|
|
N/A
|
|
|
$3,768
|
|
|
$2,908
|
|
N/A
|
|
||||
|
15-year amortizing fixed-rate
|
23
|
|
22
|
|
N/A
|
|
24
|
|
21
|
|
N/A
|
|
||||||||
|
Adjustable-rate
|
227
|
|
226
|
|
N/A
|
|
259
|
|
256
|
|
N/A
|
|
||||||||
|
Alt-A, interest-only, and option ARM
|
1,286
|
|
1,083
|
|
N/A
|
|
1,558
|
|
1,297
|
|
N/A
|
|
||||||||
|
Total with no allowance recorded
|
4,871
|
|
3,997
|
|
N/A
|
|
5,609
|
|
4,482
|
|
N/A
|
|
||||||||
|
With an allowance recorded:
(2)
|
||||||||||||||||||||
|
20 and 30-year or more, amortizing fixed-rate
|
37,579
|
|
36,959
|
|
(3,660
|
)
|
47,897
|
|
46,783
|
|
(5,505
|
)
|
||||||||
|
15-year amortizing fixed-rate
|
703
|
|
713
|
|
(19
|
)
|
752
|
|
757
|
|
(24
|
)
|
||||||||
|
Adjustable-rate
|
164
|
|
162
|
|
(8
|
)
|
232
|
|
228
|
|
(14
|
)
|
||||||||
|
Alt-A, interest-only, and option ARM
|
4,867
|
|
4,590
|
|
(682
|
)
|
7,407
|
|
6,987
|
|
(1,087
|
)
|
||||||||
|
Total with an allowance recorded
|
43,313
|
|
42,424
|
|
(4,369
|
)
|
56,288
|
|
54,755
|
|
(6,630
|
)
|
||||||||
|
Combined single-family:
|
||||||||||||||||||||
|
20 and 30-year or more, amortizing fixed-rate
|
40,914
|
|
39,625
|
|
(3,660
|
)
|
51,665
|
|
49,691
|
|
(5,505
|
)
|
||||||||
|
15-year amortizing fixed-rate
|
726
|
|
735
|
|
(19
|
)
|
776
|
|
778
|
|
(24
|
)
|
||||||||
|
Adjustable-rate
|
391
|
|
388
|
|
(8
|
)
|
491
|
|
484
|
|
(14
|
)
|
||||||||
|
Alt-A, interest-only, and option ARM
|
6,153
|
|
5,673
|
|
(682
|
)
|
8,965
|
|
8,284
|
|
(1,087
|
)
|
||||||||
|
Total single-family
|
48,184
|
|
46,421
|
|
(4,369
|
)
|
61,897
|
|
59,237
|
|
(6,630
|
)
|
||||||||
|
Multifamily :
|
||||||||||||||||||||
|
With no allowance recorded:
(1)
|
89
|
|
82
|
|
N/A
|
|
106
|
|
97
|
|
N/A
|
|
||||||||
|
With an allowance recorded
|
3
|
|
3
|
|
—
|
|
35
|
|
35
|
|
(7
|
)
|
||||||||
|
Total multifamily
|
92
|
|
85
|
|
—
|
|
141
|
|
132
|
|
(7
|
)
|
||||||||
|
Total single-family and multifamily
|
|
$48,276
|
|
|
$46,506
|
|
|
($4,369
|
)
|
|
$62,038
|
|
|
$59,369
|
|
|
($6,637
|
)
|
||
Referenced footnotes are included after the next table.
|
FREDDIE MAC
| 2018 Form 10-K
|
250
|
|
|
Financial Statements
|
Notes to the Consolidated Financial Statements
|
Note 4
|
|
Year Ended December 31,
|
||||||||||||||||||||
|
2018
|
2017
|
|||||||||||||||||||
|
(In millions)
|
Average Recorded Investment
|
Interest Income Recognized
|
Interest Income Recognized On Cash Basis
(3)
|
Average
Recorded
Investment
|
Interest
Income
Recognized
|
Interest Income Recognized On Cash Basis
(3)
|
||||||||||||||
|
Single-family:
|
||||||||||||||||||||
|
With no allowance recorded:
(1)
|
||||||||||||||||||||
|
20 and 30-year or more, amortizing fixed-rate
|
|
$3,236
|
|
|
$346
|
|
|
$16
|
|
|
$3,556
|
|
|
$399
|
|
|
$16
|
|
||
|
15-year amortizing fixed-rate
|
21
|
|
3
|
|
—
|
|
25
|
|
1
|
|
—
|
|
||||||||
|
Adjustable rate
|
248
|
|
12
|
|
1
|
|
292
|
|
11
|
|
—
|
|
||||||||
|
Alt-A, interest-only, and option ARM
|
1,264
|
|
88
|
|
4
|
|
1,471
|
|
110
|
|
5
|
|
||||||||
|
Total with no allowance recorded
|
4,769
|
|
449
|
|
21
|
|
5,344
|
|
521
|
|
21
|
|
||||||||
|
With an allowance recorded:
(2)
|
||||||||||||||||||||
|
20 and 30-year or more, amortizing fixed-rate
|
44,055
|
|
2,156
|
|
274
|
|
44,057
|
|
2,513
|
|
248
|
|
||||||||
|
15-year amortizing fixed-rate
|
798
|
|
28
|
|
9
|
|
599
|
|
32
|
|
6
|
|
||||||||
|
Adjustable rate
|
197
|
|
6
|
|
3
|
|
261
|
|
9
|
|
3
|
|
||||||||
|
Alt-A, interest-only, and option ARM
|
5,953
|
|
273
|
|
30
|
|
7,366
|
|
378
|
|
33
|
|
||||||||
|
Total with an allowance recorded
|
51,003
|
|
2,463
|
|
316
|
|
52,283
|
|
2,932
|
|
290
|
|
||||||||
|
Combined single-family:
|
||||||||||||||||||||
|
20 and 30-year or more, amortizing fixed-rate
|
47,291
|
|
2,502
|
|
290
|
|
47,613
|
|
2,912
|
|
264
|
|
||||||||
|
15-year amortizing fixed-rate
|
819
|
|
31
|
|
9
|
|
624
|
|
33
|
|
6
|
|
||||||||
|
Adjustable rate
|
445
|
|
18
|
|
4
|
|
553
|
|
20
|
|
3
|
|
||||||||
|
Alt-A, interest-only, and option ARM
|
7,217
|
|
361
|
|
34
|
|
8,837
|
|
488
|
|
38
|
|
||||||||
|
Total single-family
|
55,772
|
|
2,912
|
|
337
|
|
57,627
|
|
3,453
|
|
311
|
|
||||||||
|
Multifamily:
|
||||||||||||||||||||
|
With no allowance recorded:
(1)
|
131
|
|
6
|
|
2
|
|
286
|
|
9
|
|
3
|
|
||||||||
|
With an allowance recorded
|
3
|
|
—
|
|
—
|
|
45
|
|
1
|
|
1
|
|
||||||||
|
Total multifamily
|
134
|
|
6
|
|
2
|
|
331
|
|
10
|
|
4
|
|
||||||||
|
Total single-family and multifamily
|
|
$55,906
|
|
|
$2,918
|
|
|
$339
|
|
|
$57,958
|
|
|
$3,463
|
|
|
$315
|
|
||
|
(1)
|
Individually impaired loans with no allowance primarily represent those loans for which the collateral value is sufficiently in excess of the loan balance to result in recovery of the entire recorded investment if the property were foreclosed upon or otherwise subject to disposition.
|
|
(2)
|
Consists primarily of loans classified as TDRs.
|
|
(3)
|
Consists of income recognized during the period related to loans on non-accrual status.
|
The table below presents our allowance for loan losses and our recorded investment in loans, held-for-investment, by impairment evaluation methodology.
Table 4.11 - Net Investment in Loans
|
December 31, 2018
|
December 31, 2017
|
|||||||||||||||||||
|
(In millions)
|
Single-family
|
Multifamily
|
Total
|
Single-family
|
Multifamily
|
Total
|
||||||||||||||
|
Recorded investment:
|
||||||||||||||||||||
|
Collectively evaluated
|
|
$1,830,044
|
|
|
$14,945
|
|
|
$1,844,989
|
|
|
$1,764,750
|
|
|
$21,301
|
|
|
$1,786,051
|
|
||
|
Individually evaluated
|
46,421
|
|
85
|
|
46,506
|
|
59,237
|
|
132
|
|
59,369
|
|
||||||||
|
Total recorded investment
|
1,876,465
|
|
15,030
|
|
1,891,495
|
|
1,823,987
|
|
21,433
|
|
1,845,420
|
|
||||||||
|
Ending balance of the allowance for loan losses:
|
||||||||||||||||||||
|
Collectively evaluated
|
(1,761
|
)
|
(9
|
)
|
(1,770
|
)
|
(2,301
|
)
|
(28
|
)
|
(2,329
|
)
|
||||||||
|
Individually evaluated
|
(4,369
|
)
|
—
|
|
(4,369
|
)
|
(6,630
|
)
|
(7
|
)
|
(6,637
|
)
|
||||||||
|
Total ending balance of the allowance
|
(6,130
|
)
|
(9
|
)
|
(6,139
|
)
|
(8,931
|
)
|
(35
|
)
|
(8,966
|
)
|
||||||||
|
Net investment in loans
|
|
$1,870,335
|
|
|
$15,021
|
|
|
$1,885,356
|
|
|
$1,815,056
|
|
|
$21,398
|
|
|
$1,836,454
|
|
||
A significant number of unsecuritized single-family loans on our consolidated balance sheets are individually evaluated for impairment while substantially all single-family loans held by our consolidated
|
FREDDIE MAC
| 2018 Form 10-K
|
251
|
|
|
Financial Statements
|
Notes to the Consolidated Financial Statements
|
Note 4
|
trusts are collectively evaluated for impairment. The ending balance of the allowance for loan losses associated with our held-for-investment unsecuritized loans represented approximately
6.6%
and
7.8%
of the recorded investment in such loans at
December 31, 2018
and December 31,
2017
, respectively, and a substantial portion of the allowance associated with these loans represented interest rate concessions provided to borrowers as part of loan modifications. The ending balance of the allowance for loan losses associated with loans held by our consolidated trusts represented approximately
0.2%
of the recorded investment in such loans as of both
December 31, 2018
and December 31,
2017
.
Loan Reclassifications
On January 1, 2017, we elected a new accounting policy for loan reclassifications from held-for-investment to held-for-sale. Under the new policy, when we reclassify (transfer) a loan from held-for-investment to held-for-sale, we charge off the entire difference between the loan's recorded investment and its fair value if the loan has a history of credit-related issues. Expenses related to property taxes and insurance are included as part of the charge-off. If the charge-off amount exceeds the existing allowance for loan losses amount, an additional provision for credit losses is recorded. Any declines in loan fair value after the date of transfer will be recognized as a valuation allowance, with an offset recorded to mortgage loans gains (losses). This new policy election was applied prospectively, as it was not practical to apply it retrospectively.
The new policy election did not affect our net income; however, it affected where the loan reclassifications from held-for-investment to held-for-sale were recorded on our consolidated statements of comprehensive income. Prior to the policy change, upon a loan reclassification from held-for-investment to held-for-sale, we reversed the related allowance for loan losses to the benefit (provision) for credit losses, recorded a valuation allowance for any difference between the loan's recorded investment and its fair value to other income (loss), and recorded property taxes and insurance expenses related to the transferred loans in other expense. Under the new policy, benefit (provision) for credit losses is the only line item affected when a transfer occurs.
Non-Cash Investing and Financing Activities
During the years ended
December 31, 2018
, December 31, 2017 and December 31, 2016, we acquired
$164.0 billion
,
$229.2 billion
, and
$234.6 billion
, respectively, of loans held-for-investment in exchange for the issuance of debt securities of consolidated trusts in guarantor swap transactions. We received approximately
$25.8 billion
,
$35.9 billion
, and
$30.3 billion
of loans from sellers during the years ended
December 31, 2018
, December 31, 2017, and December 31, 2016, respectively, to satisfy advances to lenders that were recorded in other assets on our consolidated balance sheets. These loans were primarily included in the guarantor swap transactions.
In addition, we acquire REO properties through foreclosure sales or by deed in lieu of foreclosure. These acquisitions represent non-cash transfers. During the years ended
December 31, 2018
, December 31, 2017, and December 31, 2016, we had transfers of
$1.0 billion
, $
1.1 billion
, and
$1.5 billion
, respectively, from loans to REO.
|
FREDDIE MAC
| 2018 Form 10-K
|
252
|
|
|
Financial Statements
|
Notes to the Consolidated Financial Statements |
Note 5
|
NOTE 5
Guarantee Activities
We generate revenue through our guarantee activities by agreeing to absorb the credit risk associated with certain financial instruments that are owned or held by third parties. In exchange for providing this guarantee, we receive an ongoing guarantee fee that is commensurate with the risks assumed and that will, over the long-term, provide us with cash flows that are expected to exceed the credit-related and administrative expenses of the underlying financial instruments. The profitability of our guarantee activities may vary and will be dependent on our guarantee fee and the actual credit performance of the underlying financial instruments that we have guaranteed.
Guarantees to consolidated entities are eliminated in consolidation and therefore are not separately recognized on our consolidated balance sheets. The accounting treatment for guarantees provided to non-consolidated entities or other third parties will depend on whether the guarantee contract qualifies as a financial guarantee.
If the guarantee contract qualifies as a financial guarantee and exposes us to incremental credit risk, we will recognize both a guarantee obligation at fair value and the consideration we receive for providing the guarantee, which typically consists of a guarantee asset that represents the fair value of future guarantee fees. As a practical expedient, the measurement of the fair value of the guarantee obligation is set equal to the consideration we receive to provide the guarantee, and no gain or loss is recognized upon issuance of the guarantee. Subsequently, we recognize changes in the fair value of the guarantee asset in current period earnings and amortize the guarantee obligation into earnings as we are released from risk under the guarantee. We also recognize a reserve for guarantee losses when it is probable that a loss has been incurred under the guarantee.
If the guarantee contract provided to non-consolidated entities does not qualify as a financial guarantee, that contract will generally be accounted for as a derivative and measured at fair value on our consolidated financial statements.
Guarantee Activities
Our principal guarantee activities include the following:
Securitization Activity Guarantees
For substantially all of our securitization transactions, we guarantee the principal and interest payments on some or all of the issued beneficial interests. Typically, these guarantees will cover the senior classes of beneficial interests issued by the securitization trust(s). Securitization activity guarantees provided to non-consolidated trusts will generally be accounted for, and qualify as, financial guarantees. Our maximum exposure on these guarantees is generally limited to the UPB of the beneficial interests that we have guaranteed.
Other Mortgage-Related Guarantees
In certain circumstances, we provide a guarantee of mortgage-related assets held by third parties, in exchange for a guarantee fee, without securitizing those assets. These guarantees consist of the following:
|
FREDDIE MAC
| 2018 Form 10-K
|
253
|
|
|
Financial Statements
|
Notes to the Consolidated Financial Statements |
Note 5
|
|
n
|
Long-term standby commitments of single-family loans which obligate us to purchase the covered loans when they become seriously delinquent. Periodically, certain of our customers seek to terminate long-term standby commitments and simultaneously enter into guarantor swap transactions to obtain our PCs backed by many of the same loans. During both
2018
and
2017
, we guaranteed
$0.5 billion
of loans under new long-term standby commitments and
|
|
n
|
Guarantees of multifamily bonds, including guarantees that require us to advance funds to enable others to repurchase any tendered tax-exempt and related taxable bonds that are unable to be sold. The vast majority of these guarantees were guarantees of multifamily housing revenue bonds that were issued by HFAs.
No
advances under these guarantees were outstanding at both
December 31, 2018
and December 31,
2017
. During
2018
and
2017
, we guaranteed
$0.6 billion
and
$1.1 billion
, respectively, of multifamily bonds.
|
Our other mortgage-related guarantees will generally be accounted for, and qualify as, financial guarantees. Our maximum exposure on these guarantees is limited to the UPB of the mortgage-related assets that we have guaranteed.
Other Guarantees Measured at Fair Value
Other guarantees that do not qualify as financial guarantees are generally accounted for as derivative instruments and measured at fair value. These guarantees primarily include:
|
n
|
Certain guarantees related to our securitization and guarantee activities that do not qualify as financial guarantees;
|
|
n
|
Certain market value guarantees, including written options and written swaptions; and
|
|
n
|
Guarantees of third-party derivative instruments.
|
Other Indemnifications
In connection with certain business transactions, we may provide indemnification to counterparties for claims arising out of breaches of certain obligations (e.g., those arising from representations and warranties) in contracts entered into in the normal course of business. Our assessment is that the risk of any material loss from such a claim for indemnification is remote and there are no significant probable and estimable losses associated with these contracts. In addition, we provided indemnification for litigation defense costs to certain former officers who are subject to ongoing litigation. See
Note 16
for information on ongoing litigation. These indemnification obligations will generally be accounted for and qualify as financial guarantees. The recognized liabilities on our consolidated balance sheets related to indemnifications were not significant at both
December 31, 2018
and December 31,
2017
.
The table below shows our maximum exposure, recognized liability, and maximum remaining term of our recognized guarantees to non-consolidated VIEs and other third parties. This table does not include our unrecognized guarantees, such as guarantees to consolidated VIEs or to resecuritization trusts that do not expose us to incremental credit risk. The maximum exposure disclosed in the table is not representative of the actual loss we are likely to incur, based on our historical loss experience and after consideration of proceeds from related collateral liquidation, including possible recoveries under credit enhancement arrangements. See
Note 6
for additional information on our credit enhancement arrangements.
|
FREDDIE MAC
| 2018 Form 10-K
|
254
|
|
|
Financial Statements
|
Notes to the Consolidated Financial Statements |
Note 5
|
Table 5.1 - Financial Guarantees
|
|
As of December 31, 2018
|
|
As of December 31, 2017
|
|||||||||||||
|
(
Dollars in millions
, terms in years)
|
Maximum
Exposure (1) |
Recognized
Liability (2) |
Maximum
Remaining Term |
|
Maximum
Exposure (1) |
Recognized
Liability (2) |
Maximum
Remaining Term |
|||||||||
|
Single-family:
|
||||||||||||||||
|
Securitization activity guarantees
|
|
$17,783
|
|
|
$220
|
|
40
|
|
|
$10,817
|
|
|
$120
|
|
40
|
|
|
Other mortgage-related guarantees
|
6,139
|
|
167
|
|
30
|
|
6,264
|
|
190
|
|
31
|
|||||
|
Total single-family
|
|
$23,922
|
|
|
$387
|
|
|
$17,081
|
|
|
$310
|
|
||||
|
Multifamily:
|
||||||||||||||||
|
Securitization activity guarantees
|
|
$221,245
|
|
|
$2,746
|
|
40
|
|
$188,768
|
|
|
$2,305
|
|
40
|
||
|
Other mortgage-related guarantees
|
9,779
|
|
428
|
|
35
|
9,888
|
|
466
|
|
36
|
||||||
|
Total multifamily
|
|
$231,024
|
|
|
$3,174
|
|
|
$198,656
|
|
|
$2,771
|
|
||||
|
Other guarantees measured at fair value
|
|
$16,251
|
|
|
$242
|
|
30
|
|
|
$9,661
|
|
|
$141
|
|
28
|
|
|
(1)
|
The maximum exposure represents the contractual amounts that could be lost if counterparties or borrowers defaulted, without consideration of possible recoveries under credit enhancement arrangements, such as recourse provisions, third-party insurance contracts or from collateral held or pledged. For other guarantees measured at fair value, this amount represents the notional value if it relates to our market value guarantees or guarantees of third-party derivative instruments or the UPB if it relates to a guarantee of a mortgage-related asset. For certain of our other guarantees measured at fair value, our exposure may be unlimited. We generally reduce our exposure to these guarantees with unlimited exposure through separate contracts with third parties.
|
|
(2)
|
For securitization activity guarantees and other mortgage-related guarantees, this amount represents the guarantee obligation on our consolidated balance sheets. This amount excludes our reserve for guarantee losses, which totaled
$52 million
and
$57 million
as of
December 31, 2018
and December 31,
2017
, respectively, and is included within other liabilities on our consolidated balance sheets. For other guarantees measured at fair value, this amount represents the fair value of the contract.
|
|
FREDDIE MAC
| 2018 Form 10-K
|
255
|
|
|
Financial Statements
|
Notes to the Consolidated Financial Statements |
Note 6
|
NOTE 6
Credit Enhancements
In connection with many of our mortgage loans, securitization activity guarantees, other mortgage-related guarantees, and other credit risk transfer transactions, we obtain various forms of credit enhancements that reduce our exposure to credit losses. These credit enhancements may be associated with mortgage loans or guarantees recognized on our consolidated balance sheets or embedded in debt instruments recognized on our consolidated balance sheets.
Mortgage Loan Credit Enhancements
Attached mortgage loan credit enhancements are obtained contemporaneously with, and in contemplation of, the origination of the underlying mortgage loans, and effectively travel with the loan upon sale. Attached credit enhancements include primary mortgage insurance, which provides us with loan-level protection up to a specified percentage.
Expected recoveries from attached credit enhancements are considered in determining the allowance for loan losses, resulting in a reduction in the recognized provision for credit losses by the amount of the expected credit enhancement recoveries. See
Note 4
for additional information concerning the determination of our allowance for credit losses.
Freestanding mortgage loan credit enhancements are contracts that are entered into separately from the origination of the mortgage loans or entered into in conjunction with some other transaction and are legally detachable and separately exercisable. Freestanding credit enhancements include ACIS and STACR Trust transactions, which are accounted for separately from the underlying mortgage loans.
ACIS transactions are insurance policies we purchase, generally underwritten by a group of insurers and reinsurers, that provide credit protection for certain specified credit events that occur on a reference pool of single-family mortgage loans. Under the ACIS contracts, we pay insurers and reinsurers premiums for insurance coverage. Each month, we accrue for our obligation to make such payments for all tranches covered by the ACIS contracts. When specific credit events occur, we generally receive compensation from the insurance policy up to an aggregate limit based on actual losses. We require our counterparties to partially collateralize their exposure to reduce the risk that we will not be reimbursed for our claims under the policies.
STACR Trust transactions are similar to STACR debt notes as discussed in
Debt with Embedded Credit Enhancements
below. The key difference between STACR Trust and STACR debt note transactions is that the notes in STACR Trust transactions are issued by a third-party bankruptcy-remote trust. Under this structure, we pay a credit premium and certain shortfalls on the investment collateral account to the trust and receive payments from the trust as a result of defined credit events on the reference pool. Each month, we accrue for our obligation to make such payments to the trust. The trust issues the notes and makes periodic payments of principal and interest on the notes to investors, and we receive payments from the trust that otherwise would have been made to the noteholders to the extent there are certain defined credit events on the mortgages in the related reference pool. The note balances are reduced by the amount of the payments to us.
|
FREDDIE MAC
| 2018 Form 10-K
|
256
|
|
|
Financial Statements
|
Notes to the Consolidated Financial Statements |
Note 6
|
Expected recoveries for credit losses covered under ACIS contracts based on actual losses and STACR Trust transactions are recognized separately in other assets on our consolidated balance sheets, with an offset to other income when realization of our claim for recovery is deemed probable.
We also have various other freestanding credit enhancements that provide credit protection on our single-family loans, where we recognize a separate credit enhancement asset in other assets on our consolidated balance sheets upon acquisition of coverage. If the coverage is acquired as part of a transaction in which we also acquire mortgage loans, the credit enhancement asset is recognized based on the relative fair values of the consideration paid for the mortgage loan and the credit enhancement. If the coverage is acquired as a standalone transaction, the credit enhancement asset is recognized at cost. The credit enhancement assets are amortized over the life of the contract. Expected recoveries for these other types of freestanding credit enhancements are recognized separately in other assets on our consolidated balance sheets, with an offset to other income when realization of our claim for recovery is deemed probable.
The table below presents the total current and protected UPB and maximum amounts of potential loss recovery related to our mortgage loan credit enhancements. For information about counterparty credit risk associated with mortgage insurers, see
Note 14
.
Table 6.1 - Mortgage Loan Credit Enhancements
|
December 31, 2018
|
December 31, 2017
|
|||||||||||||
|
(In millions)
|
Total Current and Protected UPB
(1)
|
Maximum Coverage
|
Total Current and Protected UPB
(1)
|
Maximum Coverage
|
||||||||||
|
Single-family:
|
||||||||||||||
|
Primary mortgage insurance
|
|
$378,594
|
|
|
$96,996
|
|
|
$334,189
|
|
|
$85,429
|
|
||
|
ACIS transactions
(2)
|
807,885
|
|
9,123
|
|
625,082
|
|
6,933
|
|
||||||
|
STACR Trust transactions
|
161,152
|
|
5,026
|
|
—
|
|
—
|
|
||||||
|
Other
|
18,136
|
|
5,389
|
|
7,233
|
|
4,892
|
|
||||||
|
Total mortgage loan credit enhancements
|
|
$116,534
|
|
|
$97,254
|
|
||||||||
|
(1)
|
Underlying loans may be covered by more than one form of credit enhancement.
|
|
(2)
|
As of December 31, 2018 and December 31, 2017, our counterparties posted collateral on our ACIS transactions of
$1.5 billion
and
$1.1 billion
, respectively.
|
Guarantee Credit Enhancements
In connection with our securitization activity guarantees, we obtain credit enhancement through the creation of unguaranteed subordinated securities. In these transactions, the securities that are subordinate to our guarantee provide protection by absorbing first losses prior to us having to perform on our guarantee of the senior securities. We recognize a reserve for guarantee losses when it is probable that a loss has been incurred under our guarantee, which occurs only when losses exceed subordination.
Our other guarantee credit enhancements are primarily freestanding contracts that are accounted for separately from the associated guarantee. For these types of credit enhancements, we recognize a separate credit enhancement asset in other assets on our consolidated balance sheets upon acquisition of coverage and subsequently amortize the asset over the life of the contract. Expected recoveries
|
FREDDIE MAC
| 2018 Form 10-K
|
257
|
|
|
Financial Statements
|
Notes to the Consolidated Financial Statements |
Note 6
|
under these contracts are recognized separately in other assets on our consolidated balance sheets, with an offset to other income when realization of our claim for recovery is deemed probable.
Table 6.2 - Guarantee Credit Enhancements
|
December 31, 2018
|
December 31, 2017
|
|||||||||||||
|
(In millions)
|
Total Current and Protected UPB
(1)
|
Maximum Coverage
(2)
|
Total Current and Protected UPB
(1)
|
Maximum Coverage
(2)
|
||||||||||
|
Single-family:
|
||||||||||||||
|
Subordination (non-consolidated VIEs)
|
|
$16,271
|
|
|
$2,933
|
|
|
$8,953
|
|
|
$1,734
|
|
||
|
Other
|
1,226
|
|
1,226
|
|
1,390
|
|
1,390
|
|
||||||
|
Total single-family
|
|
|
4,159
|
|
|
|
3,124
|
|
||||||
|
Multifamily:
|
||||||||||||||
|
Subordination (non-consolidated VIEs)
|
220,733
|
|
35,661
|
|
187,299
|
|
30,689
|
|
||||||
|
Other
|
2,349
|
|
815
|
|
1,833
|
|
726
|
|
||||||
|
Total multifamily
|
36,476
|
|
31,415
|
|
||||||||||
|
Total guarantee credit enhancements
|
|
$40,635
|
|
|
$34,539
|
|
||||||||
|
(1)
|
Underlying loans may be covered by more than one form of credit enhancement. For subordination, total current and protected UPB includes the UPB of the guaranteed securities and the UPB of guarantor advances made to the holders of the guaranteed securities.
|
|
(2)
|
For subordination, maximum coverage represents the UPB of the securities that are subordinate to our guarantee and held by third parties. For all other credit enhancements, maximum coverage represents the remaining amount of loss recovery that is available subject to the terms of counterparty agreements.
|
The Multifamily segment also has other credit enhancements in the form of collateral posting requirements, indemnification, pool insurance, bond insurance, recourse, and other similar arrangements. These credit enhancements, along with the proceeds received from the sale of the underlying mortgage collateral, are designed to recover all or a portion of our losses on our mortgage loans or the amounts paid under our financial guarantee contracts. Our historical losses and related recoveries pursuant to these agreements have not been significant and therefore these other types of credit enhancements are excluded from the table above.
Debt with Embedded Credit Enhancements
We also transfer credit risk after our acquisition or guarantee of mortgage assets by either issuing unsecured debt with embedded credit enhancements or recognizing debt of consolidated VIEs that includes structural credit enhancements.
Unsecured Debt with Embedded Credit Enhancements
For certain of our unsecured debt issuances, we create a reference pool of mortgage assets (generally loans) to which we currently have credit risk exposure and an associated securitization-like structure with notional credit risk positions. To the extent a specified credit event occurs on the mortgage assets in the reference pool, the outstanding balance of our debt obligations is written down, thereby reducing our future principal and interest payment obligations. The principal types of unsecured debt with embedded credit enhancements are single-family STACR debt notes and multifamily SCR notes.
Most of our STACR debt notes are recorded as other debt on our consolidated balance sheets and accounted for at amortized cost. When the realized loss events (e.g., third-party foreclosure sale, short sale, or REO disposition) occur on the underlying loans in the reference pool, the STACR debt notes are
|
FREDDIE MAC
| 2018 Form 10-K
|
258
|
|
|
Financial Statements
|
Notes to the Consolidated Financial Statements |
Note 6
|
written down and the benefits are recognized as debt gains on our consolidated statements of comprehensive income.
The structure of multifamily SCR notes is similar to STACR debt notes, although the mortgage assets within the reference pool may be loans or multifamily housing revenue bonds to which we have credit exposure. While our SCR notes are recorded as other debt on our consolidated balance sheets, these debt obligations are measured at fair value, as we elected the fair value option for them. Fair value changes are recorded in debt gains (losses) on our consolidated statement of comprehensive income.
Consolidated Debt with Structural Credit Enhancements
Similar to our non-consolidated VIEs, we obtain credit enhancement in our KT Certificates and certain of our consolidated senior subordinate securitization structures and other securitization products through the creation of unguaranteed subordinated securities. These unguaranteed subordinated securities will absorb first losses on the underlying loans prior to us performing pursuant to our guarantee obligation. The unguaranteed subordinated debt securities held by third parties are recorded as debt of consolidated trusts on our consolidated balance sheets and accounted for at amortized cost. When losses are realized on the loans underlying the securities, the subordinated debt is written down and the benefits are recognized as debt gains on our consolidated statements of comprehensive income.
The table below presents the total current and protected UPB and maximum amounts of potential loss recovery related to debt with embedded credit enhancements.
Table 6.3 - Debt with Embedded Credit Enhancements
|
December 31, 2018
|
December 31, 2017
|
|||||||||||||
|
(In millions)
|
Total Current and Protected UPB
(1)
|
Maximum Coverage
(2)
|
Total Current and Protected UPB
(1)
|
Maximum Coverage
(2)
|
||||||||||
|
Single-family:
|
||||||||||||||
|
STACR debt notes
|
|
$605,263
|
|
|
$17,596
|
|
|
$604,356
|
|
|
$17,788
|
|
||
|
Subordination (consolidated VIEs)
|
25,006
|
|
1,036
|
|
3,330
|
|
179
|
|
||||||
|
Total single-family
|
|
|
18,632
|
|
|
|
17,967
|
|
||||||
|
Multifamily:
|
||||||||||||||
|
SCR notes
|
2,667
|
|
133
|
|
2,732
|
|
137
|
|
||||||
|
Subordination (consolidated VIEs)
|
2,700
|
|
280
|
|
1,800
|
|
180
|
|
||||||
|
Total multifamily
|
|
|
413
|
|
|
|
317
|
|
||||||
|
Total debt with embedded credit enhancements
|
|
|
|
$19,045
|
|
|
$18,284
|
|
||||||
|
(1)
|
Underlying loans may be covered by more than one form of credit enhancement. For STACR debt notes and SCR notes, total current and protected UPB represents the UPB of the assets included in the reference pool. For subordination, total current and protected UPB represents the UPB of the guaranteed securities.
|
|
(2)
|
For STACR debt notes and SCR notes, maximum coverage amount represents the outstanding balance of the STACR debt notes and SCR notes held by third parties. For subordination, maximum coverage amount represents the UPB of the securities that are subordinate to our guarantee and held by third parties.
|
|
FREDDIE MAC
| 2018 Form 10-K
|
259
|
|
|
Financial Statements
|
Notes to the Consolidated Financial Statements |
Note 7
|
NOTE 7
Investments in Securities
The table below summarizes the fair values of our investments in debt securities by classification.
Table 7.1 - Investments in Securities
|
(In millions)
|
As of December 31, 2018
|
As of December 31, 2017
|
|||||
|
Trading securities
|
|
$35,548
|
|
|
$40,721
|
|
|
|
Available-for-sale securities
|
33,563
|
|
43,597
|
|
|||
|
Total
|
|
$69,111
|
|
|
$84,318
|
|
|
We currently classify and account for our securities as either available-for-sale or trading. As of
December 31, 2018
and December 31, 2017, we did
not
classify any securities as held-to-maturity, although we may elect to do so in the future. Securities classified as available-for-sale and trading are reported at fair value with changes in fair value included in AOCI, net of income taxes and investment securities gains (losses), respectively. See
Note 15
for more information on how we determine the fair value of securities.
We generally record purchases and sales of securities on the trade date when the related forward commitments are exempt from the accounting guidance for derivatives. Alternatively, we record purchases and sales of securities on the expected settlement date, with a corresponding derivative recorded on the trade date, when the related forward commitments are not exempt from the accounting guidance for derivatives.
We include interest on securities on our consolidated statements of comprehensive income. For most of our securities, interest income is recognized using the effective interest method, which considers the contractual terms of the security. Deferred items, including premiums, discounts, and other basis adjustments, are amortized into interest income over the contractual lives of the securities.
For certain securities, interest income is recognized using the prospective effective interest method. We apply this method to securities that:
|
n
|
Can contractually be prepaid or otherwise settled in such a way that we may not recover substantially all of our recorded investment;
|
|
n
|
Are not of high credit quality at acquisition; or
|
|
n
|
Have been determined to be other-than-temporarily impaired.
|
Under this method, we recognize as interest income, over the expected life of the securities, the excess of the cash flows expected to be collected over the securities' carrying value. We update our estimates of expected cash flows periodically and recognize changes in the calculated effective interest rate on a prospective basis.
For securities classified as trading or available-for-sale, we classify the cash flows as investing activities because we hold these securities for investment purposes. In cases where the transfer of a security represents a secured borrowing, we classify the related cash flows as financing activities.
Freddie Mac mortgage-related securities include mortgage-related securities issued or guaranteed by Freddie Mac. In prior periods, certain of these securities that were issued by third-party trusts but
|
FREDDIE MAC
| 2018 Form 10-K
|
260
|
|
|
Financial Statements
|
Notes to the Consolidated Financial Statements |
Note 7
|
guaranteed by Freddie Mac were classified as non-agency mortgage-related securities. Prior periods have been revised to conform to the current period presentation.
Trading Securities
The table below presents the estimated fair values by major security type for our securities classified as trading. Our non-mortgage-related securities primarily consist of investments in U.S. Treasury securities.
Table 7.2 - Trading Securities
|
(In millions)
|
As of December 31, 2018
|
As of December 31, 2017
|
|||||
|
Mortgage-related securities:
|
|||||||
|
Freddie Mac
|
|
$13,821
|
|
|
$14,300
|
|
|
|
Other agency
|
2,551
|
|
3,574
|
|
|||
|
Non-agency RMBS
|
1
|
|
1
|
|
|||
|
Non-agency CMBS
|
—
|
|
27
|
|
|||
|
Total mortgage-related securities
|
16,373
|
|
17,902
|
|
|||
|
Non-mortgage-related securities
|
19,175
|
|
22,819
|
|
|||
|
Total fair value of trading securities
|
|
$35,548
|
|
|
$40,721
|
|
|
For trading securities held at
December 31, 2018
, 2017, and 2016, we recorded net unrealized gains (losses) of
($479) million
,
($365) million
, and
($791) million
during 2018, 2017 and 2016, respectively.
Available-for-Sale Securities
At both
December 31, 2018
and December 31, 2017, all available-for-sale securities were mortgage-related securities.
The tables below present the amortized cost, gross unrealized gains and losses, and fair value by major security type for our securities classified as available-for-sale.
|
FREDDIE MAC
| 2018 Form 10-K
|
261
|
|
|
Financial Statements
|
Notes to the Consolidated Financial Statements |
Note 7
|
Table 7.3 - Available-for-Sale Securities
|
As of December 31, 2018
|
||||||||||||||||||
|
Amortized
Cost
|
Gross
Unrealized
Gains
|
Gross Unrealized Losses
|
Fair
Value
|
|||||||||||||||
|
(In millions)
|
Other-Than-Temporary Impairment
(1)
|
Temporary Impairment
(2)
|
||||||||||||||||
|
Available-for-sale securities:
|
||||||||||||||||||
|
Freddie Mac
|
|
$30,407
|
|
|
$320
|
|
|
$—
|
|
|
($528
|
)
|
|
$30,199
|
|
|||
|
Other agency
|
1,675
|
|
38
|
|
—
|
|
(7
|
)
|
1,706
|
|
||||||||
|
Non-agency RMBS
|
1,124
|
|
280
|
|
—
|
|
(1
|
)
|
1,403
|
|
||||||||
|
Non-agency CMBS
|
18
|
|
—
|
|
—
|
|
—
|
|
18
|
|
||||||||
|
Obligations of states and political subdivisions
|
236
|
|
2
|
|
—
|
|
(1
|
)
|
237
|
|
||||||||
|
Total available-for-sale securities
|
|
$33,460
|
|
|
$640
|
|
|
$—
|
|
|
($537
|
)
|
|
$33,563
|
|
|||
|
As of December 31, 2017
|
||||||||||||||||||
|
Amortized
Cost
|
Gross
Unrealized Gains |
Gross Unrealized Losses
|
Fair
Value
|
|||||||||||||||
|
(In millions)
|
Other-Than-Temporary Impairment
(1)
|
Temporary Impairment
(2)
|
||||||||||||||||
|
Available-for-sale securities:
|
||||||||||||||||||
|
Freddie Mac
|
|
$37,109
|
|
|
$521
|
|
|
$—
|
|
|
($464
|
)
|
|
$37,166
|
|
|||
|
Other agency
|
2,008
|
|
56
|
|
—
|
|
(11
|
)
|
2,053
|
|
||||||||
|
Non-agency RMBS
|
3,012
|
|
927
|
|
(5
|
)
|
(1
|
)
|
3,933
|
|
||||||||
|
Non-agency CMBS
|
97
|
|
—
|
|
(9
|
)
|
—
|
|
88
|
|
||||||||
|
Obligations of states and political subdivisions
|
352
|
|
5
|
|
—
|
|
—
|
|
357
|
|
||||||||
|
Total available-for-sale securities
|
|
$42,578
|
|
|
$1,509
|
|
|
($14
|
)
|
|
($476
|
)
|
|
$43,597
|
|
|||
|
(1)
|
Represents the gross unrealized losses for securities for which we have previously recognized other-than-temporary impairment in earnings.
|
|
(2)
|
Represents the gross unrealized losses for securities for which we have not previously recognized other-than-temporary impairment in earnings.
|
The fair value of our available-for-sale securities held at December 31, 2018 scheduled to contractually mature after ten years was
$29.1 billion
, with an additional
$3.8 billion
scheduled to contractually mature after five years through ten years.
|
FREDDIE MAC
| 2018 Form 10-K
|
262
|
|
|
Financial Statements
|
Notes to the Consolidated Financial Statements |
Note 7
|
Available-for-Sale Securities in a Gross Unrealized Loss Position
The tables below present available-for-sale securities in a gross unrealized loss position, and whether such securities have been in a gross unrealized loss position for less than 12 months, or 12 months or greater.
Table 7.4 - Available-for-Sale Securities in a Gross Unrealized Loss Position
|
As of December 31, 2018
|
||||||||||||||
|
|
Less than 12 Months
|
12 Months or Greater
|
||||||||||||
|
(In millions)
|
Fair
Value
|
Gross Unrealized Losses
|
Fair
Value
|
Gross Unrealized Losses
|
||||||||||
|
Available-for-sale securities:
|
||||||||||||||
|
Freddie Mac
|
|
$4,259
|
|
|
($38
|
)
|
|
$14,751
|
|
|
($490
|
)
|
||
|
Other agency
|
351
|
|
(1
|
)
|
638
|
|
(6
|
)
|
||||||
|
Non-agency RMBS
|
—
|
|
—
|
|
5
|
|
(1
|
)
|
||||||
|
Non-agency CMBS
|
—
|
|
—
|
|
—
|
|
—
|
|
||||||
|
Obligations of states and political subdivisions
|
43
|
|
(1
|
)
|
1
|
|
—
|
|
||||||
|
Total available-for-sale securities in a gross unrealized loss position
|
|
$4,653
|
|
|
($40
|
)
|
|
$15,395
|
|
|
($497
|
)
|
||
|
As of December 31, 2017
|
||||||||||||||
|
Less than 12 Months
|
12 Months or Greater
|
|||||||||||||
|
(In millions)
|
Fair
Value |
Gross Unrealized Losses
|
Fair
Value |
Gross Unrealized Losses
|
||||||||||
|
Available-for-sale securities:
|
||||||||||||||
|
Freddie Mac
|
|
$11,329
|
|
|
($109
|
)
|
|
$9,251
|
|
|
($355
|
)
|
||
|
Other agency
|
40
|
|
—
|
|
1,079
|
|
(11
|
)
|
||||||
|
Non-agency RMBS
|
5
|
|
—
|
|
105
|
|
(6
|
)
|
||||||
|
Non-agency CMBS
|
34
|
|
—
|
|
52
|
|
(9
|
)
|
||||||
|
Obligations of states and political subdivisions
|
12
|
|
—
|
|
21
|
|
—
|
|
||||||
|
Total available-for-sale securities in a gross unrealized loss position
|
|
$11,420
|
|
|
($109
|
)
|
|
$10,508
|
|
|
($381
|
)
|
||
At
December 31, 2018
, total gross unrealized losses on available-for-sale securities were
$0.5 billion
. The gross unrealized losses relate to
350
separate securities. We purchase multiple lots of individual securities at different times and at different costs. We determine gross unrealized gains and gross unrealized losses by specifically evaluating investment positions at the lot level; therefore, some of the lots we hold for an individual security may be in a gross unrealized gain position, while other lots for that security may be in a gross unrealized loss position.
Impairment Recognition on Investments in Securities
We evaluate available-for-sale securities in an unrealized loss position as of the end of each quarter to determine whether the decline in value is other-than-temporary. An unrealized loss exists when the fair value of an individual lot is less than its amortized cost basis. As discussed further below, certain other-than-temporary impairment losses are recognized in earnings.
Other-than-temporary impairment is considered to have occurred if the fair value of the security lot is less than its amortized cost basis and we either intend to sell the security or more likely than not will be required to sell the security lot prior to recovery of its amortized cost basis. Under these circumstances, the security's entire decline in fair value is deemed to be other-than-temporary and is recorded within
|
FREDDIE MAC
| 2018 Form 10-K
|
263
|
|
|
Financial Statements
|
Notes to the Consolidated Financial Statements |
Note 7
|
our consolidated statements of comprehensive income as investment securities gains (losses).
If we do not intend to sell the security or we believe it is not more likely than not that we will be required to sell prior to recovery of the security's amortized cost basis, we recognize only the credit component of other-than-temporary impairment in earnings and the amounts attributable to all other factors are recorded in AOCI. The credit component represents the amount by which the present value of cash flows expected to be collected from the security is less than its amortized cost basis. The present value of cash flows expected to be collected represents our estimate of future contractual cash flows that we expect to collect, discounted at the security's original effective interest rate or, if applicable, the effective interest rate determined based on significantly improved cash flows subsequent to a prior other-than-temporary impairment.
The evaluation of whether unrealized losses on available-for-sale securities are other-than-temporary requires significant management judgments, assumptions, and consideration of numerous factors. We perform an evaluation on a security lot basis considering all available information. The relative importance of this information varies based on the facts and circumstances surrounding each security, as well as the economic environment at the time of assessment.
Freddie Mac and Other Agency Securities
The principal and interest on these securities are guaranteed. We generally hold these securities that are in an unrealized loss position to recovery. As a result, unless we intend to sell the security, we consider unrealized losses on these securities to be temporary.
Non-Agency Residential Mortgage-Backed Securities
We believe the unrealized losses on the non-agency RMBS we hold are mainly attributable to poor underlying collateral performance, limited liquidity, and risk premiums. In evaluating securities for impairment, we use an internal model that considers the credit performance of the underlying collateral and incorporates assumptions about the economic environment.
Our analysis is subject to change as new information regarding delinquencies, severities, loss timing, prepayments, and other factors becomes available. While it is possible that, under certain conditions, collateral losses on our remaining available-for-sale securities for which we have not recorded an impairment charge could exceed our credit enhancement levels and a principal or interest loss could occur, we do not believe that those conditions were likely as of
December 31, 2018
.
Other-than-Temporary Impairments
We recognized
$12 million
,
$18 million
, and
$191 million
in net impairment of available-for-sale securities in earnings during 2018, 2017, and 2016, respectively. For our available-for-sale securities in an unrealized loss position at December 31, 2018, we have asserted that we have no intent to sell or believe it is not more likely than not that we will be required to sell the security before recovery of its amortized cost basis.
The ending balance of remaining credit losses on available-for-sale securities where a portion of other-than-temporary impairment was recognized in other comprehensive income was
$0.8 billion
,
$1.1 billion
, and
$4.1 billion
as of 4Q 2018, 4Q 2017, and 4Q 2016, respectively.
|
FREDDIE MAC
| 2018 Form 10-K
|
264
|
|
|
Financial Statements
|
Notes to the Consolidated Financial Statements |
Note 7
|
Realized Gains and Losses on Sales of Available-for-Sale Securities
Gains and losses on the sale of securities are included in investment securities gains (losses), including those gains (losses) reclassified into earnings from AOCI. We use the specific identification method for determining the cost basis of a security in computing the gain or loss.
The table below summarizes the gross realized gains and gross realized losses from the sale of available-for-sale securities.
Table 7.5 - Gross Realized Gains and Gross Realized Losses from Sales of Available-for-Sale Securities
|
|
Year Ended December 31,
|
|||||||||
|
(In millions)
|
2018
|
2017
|
2016
|
|||||||
|
Gross realized gains
|
|
$627
|
|
|
$1,792
|
|
|
$1,062
|
|
|
|
Gross realized losses
|
(303
|
)
|
(66
|
)
|
(91
|
)
|
||||
|
Net realized gains
|
|
$324
|
|
|
$1,726
|
|
|
$971
|
|
|
Non-Cash Investing and Financing Activities
We account for transactions where we obtain beneficial interests as consideration for transfers of securities to non-consolidated trusts as non-cash transactions when these transactions do not involve exchanges of gross cash flows. During the years ended December 31, 2018 and December 31, 2017, we obtained beneficial interests of
$0.1 billion
and
$3.8 billion
, respectively, related to such transactions. We did
not
have such activity during the year ended December 31, 2016.
|
FREDDIE MAC
| 2018 Form 10-K
|
265
|
|
|
Financial Statements
|
Notes to the Consolidated Financial Statements |
Note 8
|
NOTE 8
Debt Securities and Subordinated Borrowings
The table below summarizes the interest expense per our consolidated statements of comprehensive income and the balances of total debt, net per our consolidated balance sheets.
Table 8.1 - Total Debt, Net
|
Balance, Net
|
Interest Expense
|
||||||||||||||||
|
As of December 31,
|
For The Year Ended December 31,
|
||||||||||||||||
|
(In millions)
|
2018
|
2017
|
2018
|
2017
|
2016
|
||||||||||||
|
Debt securities of consolidated trusts held by third parties
|
|
$1,792,677
|
|
|
$1,720,996
|
|
|
$51,529
|
|
|
$47,656
|
|
|
$44,599
|
|
||
|
Other debt:
|
|||||||||||||||||
|
Short-term debt
|
51,080
|
|
73,069
|
|
1,193
|
|
615
|
|
350
|
|
|||||||
|
Long-term debt
|
201,193
|
|
240,565
|
|
5,311
|
|
5,372
|
|
5,837
|
|
|||||||
|
Total other debt
|
252,273
|
|
313,634
|
|
6,504
|
|
5,987
|
|
6,187
|
|
|||||||
|
Total debt, net
|
|
$2,044,950
|
|
|
$2,034,630
|
|
|
$58,033
|
|
|
$53,643
|
|
|
$50,786
|
|
||
On November 30, 2017, we started applying fair value hedge accounting to certain debt issuances. The fair value hedge accounting related basis adjustments are included in the table above.
Debt securities that we issue are classified as either debt securities of consolidated trusts held by third parties or other debt. We issue other debt to fund our operations.
With the exception of certain debt for which we elected the fair value option or designated in a qualifying fair value hedge relationship, our debt is reported at amortized cost. Deferred items, including premiums, discounts, issuance costs, and hedging-related basis adjustments, are reported as a component of total debt, net. These items are amortized and reported through interest expense using the effective interest method over the contractual life of the related indebtedness. Amortization of premiums, discounts, and issuance costs begins at the time of debt issuance. Amortization of hedging-related basis adjustments begins upon the discontinuation of the related hedge relationship.
We elected the fair value option on debt that contains embedded derivatives, including certain STACR and SCR debt notes. For additional information on STACR and SCR debt notes, see
Note 6
. Changes in the fair value of these debt obligations are recorded in debt gains (losses), with any upfront costs and fees incurred or received in exchange for the issuance of the debt being recognized in earnings as incurred and not deferred. Related interest expense continues to be reported as interest expense based on the stated terms of the debt securities. For additional information on our election of the fair value option, see
Note 15
.
When we repurchase or call outstanding debt securities, we recognize the difference between the amount paid to redeem the debt security and the carrying value in earnings as a component of debt gains (losses). Contemporaneous transfers of cash between us and a creditor in connection with the issuance of a new debt security and satisfaction of an existing debt security are accounted for as either an extinguishment or a modification of an existing debt security. If the debt securities have substantially different terms, the transaction is accounted for as an extinguishment of the existing debt security. The issuance of a new debt security is recorded at fair value, fees paid to the creditor are expensed as incurred, and fees paid to third parties are deferred and amortized into interest expense over the life of the new debt security using the effective interest method. If the terms of the existing debt security and
|
FREDDIE MAC
| 2018 Form 10-K
|
266
|
|
|
Financial Statements
|
Notes to the Consolidated Financial Statements |
Note 8
|
the new debt security are not substantially different, the transaction is accounted for as a modification of the existing debt. Fees paid to the creditor are deferred and amortized into interest expense over the life of the modified debt security using the effective interest method and fees paid to third parties are expensed as incurred.
We also engage in dollar roll transactions whereby we enter into an agreement to sell and subsequently repurchase (or purchase and subsequently resell) agency securities. When these transactions involve securities issued by consolidated entities, they are treated as issuances and extinguishments of debt.
Under the Purchase Agreement, without the prior written consent of Treasury, we may not incur indebtedness that would result in the par value of our aggregate indebtedness exceeding
120%
of the amount of mortgage assets we are allowed to own on December 31 of the immediately preceding calendar year. Because of this debt limit, we may be restricted in the amount of debt we are allowed to issue to fund our operations. Under the Purchase Agreement, the amount of our "indebtedness" is determined without giving effect to the January 1, 2010 change in the accounting guidance related to transfers of financial assets and consolidation of VIEs. Therefore, "indebtedness" generally does not include debt securities of consolidated trusts held by third parties. We also cannot become liable for any subordinated indebtedness without the prior consent of Treasury. See
Note 2
for information regarding restrictions on the amount of mortgage-related securities that we may own.
Our debt cap under the Purchase Agreement was
$346.1 billion
in
2018
and declined to
$300.0 billion
on January 1, 2019. As of
December 31, 2018
, our aggregate indebtedness for purposes of the debt cap was
$255.7 billion
. Our aggregate indebtedness primarily includes the par value of other short- and long-term debt.
Debt Securities of Consolidated Trusts Held By Third Parties
Debt securities of consolidated trusts held by third parties represents our liability to third parties that hold beneficial interests in our consolidated securitization trusts. Debt securities of consolidated trusts held by third parties are subject to prepayment risk as their payments are based upon the performance of the underlying mortgage loans that may be prepaid by the related mortgage borrower at any time without penalty.
|
FREDDIE MAC
| 2018 Form 10-K
|
267
|
|
|
Financial Statements
|
Notes to the Consolidated Financial Statements |
Note 8
|
The table below summarizes the debt securities of consolidated trusts held by third parties based on underlying loan product type.
Table 8.2 - Debt Securities of Consolidated Trusts Held by Third Parties
|
As of December 31, 2018
|
As of December 31, 2017
|
|||||||||||||||||||
|
(Dollars in millions)
|
Contractual
Maturity
|
UPB
|
Carrying Amount
(1)
|
Weighted
Average
Coupon
(2)
|
Contractual
Maturity
|
UPB
|
Carrying Amount
(1)
|
Weighted
Average
Coupon
(2)
|
||||||||||||
|
Single-family:
|
||||||||||||||||||||
|
30-year or more, fixed-rate
|
2019-2057
|
|
$1,389,113
|
|
|
$1,426,060
|
|
3.72
|
%
|
2018 - 2055
|
|
$1,278,911
|
|
|
$1,318,350
|
|
3.68
|
%
|
||
|
20-year fixed-rate
|
2019-2039
|
70,547
|
|
72,354
|
|
3.43
|
%
|
2018 - 2038
|
73,866
|
|
76,022
|
|
3.43
|
%
|
||||||
|
15-year fixed-rate
|
2019-2034
|
240,310
|
|
244,587
|
|
2.89
|
%
|
2018 - 2033
|
260,633
|
|
266,241
|
|
2.86
|
%
|
||||||
|
Adjustable-rate
|
2019-2049
|
38,361
|
|
39,153
|
|
3.12
|
%
|
2018 - 2048
|
47,169
|
|
48,220
|
|
2.85
|
%
|
||||||
|
Interest-only
|
2026-2048
|
5,322
|
|
5,386
|
|
4.41
|
%
|
2026 - 2041
|
7,303
|
|
7,379
|
|
3.74
|
%
|
||||||
|
FHA/VA
|
2019-2046
|
720
|
|
736
|
|
4.78
|
%
|
2018 - 2046
|
847
|
|
866
|
|
4.85
|
%
|
||||||
|
Total Single-family
|
1,744,373
|
|
1,788,276
|
|
1,668,729
|
|
1,717,078
|
|
||||||||||||
|
Multifamily
|
2019-2047
|
4,365
|
|
4,401
|
|
4.02
|
%
|
2019 - 2047
|
3,876
|
|
3,918
|
|
3.99
|
%
|
||||||
|
Total debt securities of consolidated trusts held by third parties
|
|
$1,748,738
|
|
|
$1,792,677
|
|
|
$1,672,605
|
|
|
$1,720,996
|
|
||||||||
|
(1)
|
Includes
$755 million
and
$639 million
at
December 31, 2018
and December 31, 2017, respectively, of debt of consolidated trusts that represents the fair value of debt securities with the fair value option elected.
|
|
(2)
|
The effective rate for debt securities of consolidated trusts held by third parties was
3.07%
and
2.84%
as of
December 31, 2018
and December 31, 2017, respectively.
|
Other Short-Term Debt
As indicated in the table below, a majority of other short-term debt consisted of discount notes and Reference Bills securities, paying only principal at maturity. Discount notes, Reference Bills securities, and medium-term notes are unsecured general corporate obligations. Securities sold under agreements to repurchase are effectively collateralized borrowings where we sell securities with an agreement to repurchase such securities at a future date. Certain medium-term notes that have original maturities of one year or less are classified as other short-term debt for purposes of this presentation.
The table below summarizes the balances and effective interest rates for other short-term debt.
Table 8.3 - Other Short-Term Debt
|
As of December 31, 2018
|
As of December 31, 2017
|
|||||||||||||||||
|
(Dollars in millions)
|
Par Value
|
Carrying Amount
|
Weighted
Average
Effective Rate
|
Par Value
|
Carrying Amount
|
Weighted
Average
Effective Rate
|
||||||||||||
|
Other short-term debt:
|
||||||||||||||||||
|
Discount notes and Reference Bills
|
|
$28,787
|
|
|
$28,621
|
|
2.36
|
%
|
|
$45,717
|
|
|
$45,596
|
|
1.19
|
%
|
||
|
Medium-term notes
|
16,440
|
|
16,440
|
|
2.10
|
|
17,792
|
|
17,792
|
|
1.03
|
|
||||||
|
Securities sold under agreements to repurchase
|
6,019
|
|
6,019
|
|
2.40
|
|
9,681
|
|
9,681
|
|
1.06
|
|
||||||
|
Total other short-term debt
|
|
$51,246
|
|
|
$51,080
|
|
2.28
|
%
|
|
$73,190
|
|
|
$73,069
|
|
1.14
|
%
|
||
|
FREDDIE MAC
| 2018 Form 10-K
|
268
|
|
|
Financial Statements
|
Notes to the Consolidated Financial Statements |
Note 8
|
Other Long-Term Debt
The table below summarizes our other long-term debt.
Table 8.4 - Other Long-Term Debt
|
As of December 31, 2018
|
As of December 31, 2017
|
||||||||||||||||||
|
(Dollars in millions)
|
Contractual Maturity
|
Par Value
|
Carrying Amount
(1)
|
Weighted
Average
Effective Rate
(2)
|
Par Value
|
Carrying Amount
|
Weighted
Average
Effective Rate
(2)
|
||||||||||||
|
Other long-term debt:
|
|||||||||||||||||||
|
Other senior debt:
|
|||||||||||||||||||
|
Fixed-rate:
|
|||||||||||||||||||
|
Medium-term notes — callable
|
2019-2037
|
|
$78,810
|
|
|
$78,786
|
|
2.01
|
%
|
|
$86,311
|
|
|
$86,284
|
|
1.47
|
%
|
||
|
Medium-term notes — non-callable
|
2019-2028
|
4,761
|
|
4,811
|
|
1.83
|
%
|
10,839
|
|
10,973
|
|
1.40
|
%
|
||||||
|
Reference Notes securities — non-callable
|
2019-2032
|
65,362
|
|
65,385
|
|
2.39
|
%
|
79,991
|
|
80,019
|
|
2.17
|
%
|
||||||
|
STACR and SCR
|
2031-2042
|
133
|
|
136
|
|
12.76
|
%
|
137
|
|
140
|
|
12.77
|
%
|
||||||
|
Variable-rate:
|
|||||||||||||||||||
|
Medium-term notes — callable
|
2019-2033
|
26,396
|
|
26,364
|
|
2.33
|
%
|
27,510
|
|
27,475
|
|
1.95
|
%
|
||||||
|
Medium-term notes — non-callable
|
2019-2026
|
5,325
|
|
5,325
|
|
1.47
|
%
|
14,746
|
|
14,746
|
|
0.68
|
%
|
||||||
|
STACR
|
2023-2042
|
17,596
|
|
17,868
|
|
5.99
|
%
|
17,788
|
|
18,198
|
|
5.00
|
%
|
||||||
|
Zero-coupon:
|
|||||||||||||||||||
|
Medium-term notes — non-callable
|
2019-2039
|
5,009
|
|
2,428
|
|
6.29
|
%
|
5,141
|
|
2,415
|
|
5.94
|
%
|
||||||
|
Other
|
2047-2048
|
—
|
|
2
|
|
0.63
|
%
|
—
|
|
—
|
|
—
|
%
|
||||||
|
Hedging-related basis adjustments
|
N/A
|
|
(215
|
)
|
N/A
|
|
(79
|
)
|
|||||||||||
|
Total other senior debt
|
203,392
|
|
200,890
|
|
242,463
|
|
240,171
|
|
|||||||||||
|
Other subordinated debt:
|
|||||||||||||||||||
|
Fixed-rate
|
|
—
|
|
—
|
|
—
|
%
|
121
|
|
121
|
|
7.83
|
%
|
||||||
|
Zero-coupon
|
2019
|
332
|
|
303
|
|
10.51
|
%
|
332
|
|
273
|
|
10.51
|
%
|
||||||
|
Total other subordinated debt
|
332
|
|
303
|
|
453
|
|
394
|
|
|||||||||||
|
Total other long-term debt
|
|
$203,724
|
|
|
$201,193
|
|
2.58
|
%
|
|
$242,916
|
|
|
$240,565
|
|
2.04
|
%
|
|||
|
(1)
|
Represents par value, net of associated discounts or premiums and issuance costs. Includes
$4.4 billion
and
$5.2 billion
at December 31, 2018 and December 31, 2017, respectively, of other long term-debt that represents the fair value of debt securities with the fair value option elected.
|
|
(2)
|
Based on carrying amount, excluding hedge-related basis adjustments.
|
A portion of our other long-term debt is callable. Callable debt gives us the option to redeem the debt security at par on one or more specified call dates or at any time on or after a specified call date.
|
FREDDIE MAC
| 2018 Form 10-K
|
269
|
|
|
Financial Statements
|
Notes to the Consolidated Financial Statements |
Note 8
|
The table below summarizes the contractual maturities of other long-term debt securities at
December 31, 2018
.
Table 8.5 - Contractual Maturities of Other Long-Term Debt and Debt Securities
|
(In millions)
|
Par Value
|
|||
|
Annual Maturities
|
||||
|
Other long-term debt (excluding STACR and SCR):
|
||||
|
2019
|
|
$58,002
|
|
|
|
2020
|
42,296
|
|
||
|
2021
|
30,898
|
|
||
|
2022
|
20,802
|
|
||
|
2023
|
15,929
|
|
||
|
Thereafter
|
18,068
|
|
||
|
Debt securities of consolidated trusts held by third parties, STACR, and SCR
(1)
|
1,766,467
|
|
||
|
Total
|
1,952,462
|
|
||
|
Net discounts, premiums, debt issuance costs, hedge-related, and other basis adjustments
(2)
|
41,408
|
|
||
|
Total debt securities of consolidated trusts held by third parties, STACR, SCR and other long-term debt
|
|
$1,993,870
|
|
|
|
(1)
|
Contractual maturities of these debt securities are not presented because they are subject to prepayment risk, as their payments are based upon the performance of a pool of mortgage assets that may be prepaid by the related mortgage borrower at any time without penalty.
|
|
(2)
|
Other basis adjustments primarily represent changes in fair value on debt where we have elected the fair value option.
|
|
FREDDIE MAC
| 2018 Form 10-K
|
270
|
|
|
Financial Statements
|
Notes to the Consolidated Financial Statements |
Note 9
|
NOTE 9
Derivatives
On October 1, 2017, we adopted accounting guidance that modifies the presentation of hedge accounting results disclosed on our consolidated statements of comprehensive income and in the notes to the consolidated financial statements. For qualifying fair value hedge relationships, the modifications include presenting all changes in the fair value of the derivative hedging instrument in the same consolidated statements of comprehensive income line used to present the earnings effect of the hedged item. For qualifying fair value hedge relationships, the modifications also include separate disclosures of cumulative basis adjustments and their impact to the hedged item's carrying value.
Derivatives are reported at their fair value on our consolidated balance sheets. Derivatives in a net asset position, including net derivative interest receivable or payable, are reported as derivative assets, net. Similarly, derivatives in a net liability position, including net derivative interest receivable or payable, are reported as derivative liabilities, net. We offset fair value amounts recognized for the right to reclaim cash collateral or the obligation to return cash collateral against fair value amounts recognized for derivative instruments executed with the same counterparty under a master netting agreement. Changes in fair value and interest accruals on derivatives not in qualifying fair value hedge relationships are recorded as derivative gains (losses) on our consolidated statements of comprehensive income. Non-cash collateral held is not recognized on our consolidated balance sheets as we do not obtain effective control over the collateral, and non-cash collateral posted is not de-recognized from our consolidated balance sheets as we do not relinquish effective control over the collateral. Therefore, non-cash collateral held or posted is not presented as an offset against derivative assets or derivative liabilities on our consolidated balance sheets.
We evaluate whether financial instruments that we purchase or issue contain embedded derivatives. We generally elect to measure newly acquired or issued financial instruments that contain embedded derivatives at fair value, with changes in fair value recorded in earnings.
On the consolidated statements of cash flows, cash flows related to the acquisition and termination of derivatives, other than forward commitments, are generally classified in investing activities. Cash flows related to forward commitments are classified within the section of the consolidated statements of cash flows in accordance with the cash flows of the financial instruments to which they relate.
Use of Derivatives
We use derivatives primarily to hedge interest-rate sensitivity mismatches between our financial assets and liabilities. We analyze the interest-rate sensitivity of financial assets and liabilities on a daily basis across a variety of interest-rate scenarios based on market prices, models, and economics. When we use derivatives to mitigate our exposures, we consider a number of factors, including cost, exposure to counterparty credit risk, and our overall risk management strategy.
We classify derivatives into
three
categories:
|
n
|
Exchange-traded derivatives;
|
|
n
|
Cleared derivatives; and
|
|
n
|
OTC derivatives.
|
|
FREDDIE MAC
| 2018 Form 10-K
|
271
|
|
|
Financial Statements
|
Notes to the Consolidated Financial Statements |
Note 9
|
Exchange-traded derivatives include standardized interest-rate futures contracts and options on futures contracts. Cleared derivatives include interest-rate swaps that the U.S. Commodity Futures Trading Commission has determined are subject to the central clearing requirement of the Dodd-Frank Act. OTC derivatives refer to those derivatives that are neither exchange-traded derivatives nor cleared derivatives.
Types of Derivatives
We principally use the following types of derivatives:
|
n
|
LIBOR-based interest-rate swaps;
|
|
n
|
LIBOR- and Treasury-based purchased options (including swaptions); and
|
|
n
|
LIBOR- and Treasury-based exchange-traded futures.
|
We also purchase swaptions on credit indices in order to obtain protection against adverse movements in multifamily spreads which may affect the profitability of our K Certificate or SB Certificate transactions.
In addition to swaps, futures, and purchased options, our derivative positions include written options and swaptions, commitments, and credit derivatives.
Written Options and Swaptions
Written call and put swaptions are sold to counterparties allowing them the option to enter into receive-fixed and pay-fixed interest rate swaps, respectively. Written call and put options on mortgage-related securities give the counterparty the right to execute a contract under specified terms, which generally occurs when we are in a liability position. We may, from time to time, write other derivative contracts such as interest-rate futures.
Commitments
We routinely enter into commitments that include commitments to:
|
n
|
Purchase and sell investments in securities;
|
|
n
|
Purchase and sell loans; and
|
|
n
|
Purchase and extinguish or issue debt securities of our consolidated trusts.
|
Most of these commitments are considered derivatives and therefore are subject to the accounting guidance for derivatives and hedging.
Credit Derivatives
We have purchased loans containing debt cancellation contracts, which provide for mortgage debt or payment cancellation for borrowers who experience unanticipated losses of income dependent on a covered event. The rights and obligations under these agreements have been assigned to the servicers. However, in the event the servicer does not perform as required by contract, we would be obligated under our guarantee to make the required contractual payments.
|
FREDDIE MAC
| 2018 Form 10-K
|
272
|
|
|
Financial Statements
|
Notes to the Consolidated Financial Statements |
Note 9
|
Hedge Accounting
Fair Value Hedges
On February 2, 2017, we started applying fair value hedge accounting to certain single-family mortgage loans where we hedge the changes in fair value of these loans attributable to the designated benchmark interest rate (i.e., LIBOR), using LIBOR-based interest-rate swaps. The hedge period is one day, and we re-balance our hedge relationships on a daily basis. In addition, on November 30, 2017, we started applying fair value hedge accounting to certain issuances of debt where we hedge the changes in fair value of the debt attributable to the designated benchmark interest rate (i.e., LIBOR), using LIBOR-based interest-rate swaps.
We apply hedge accounting to qualifying hedge relationships. A qualifying hedge relationship exists when changes in the fair value of a derivative hedging instrument are expected to be highly effective in offsetting changes in the fair value of the hedged item attributable to the risk being hedged during the term of the hedge relationship. No amounts have been excluded from the assessment of hedge effectiveness. To assess hedge effectiveness, we use a statistical regression analysis.
At inception of the hedge relationship, we prepare formal contemporaneous documentation of our risk management objective and strategies for undertaking the hedge.
Beginning on October 1, 2017, due to the adoption of amended hedge accounting guidance, if a hedge relationship qualifies for fair value hedge accounting, all changes in fair value of the derivative hedging instrument, including interest accruals, are recognized in the same consolidated statements of comprehensive income line item used to present the earnings effect of the hedged item. Therefore, changes in the fair value of the hedged item, mortgage loans and debt, attributable to the risk being hedged are recognized in interest income - mortgage loans and interest expense, respectively, along with the changes in the fair value of the respective derivative hedging instruments. Prior to October 1, 2017, if the hedge relationship qualified for hedge accounting, changes in fair value of the derivative hedging instrument and changes in the fair value of the hedged item attributable to the risk being hedged were recognized in other income (loss) and interest accruals on the derivative hedging instrument were included in derivative gains (losses).
Changes in the fair value of the hedged item attributable to the risk being hedged are recognized as a cumulative basis adjustment against the mortgage loans and debt. The cumulative basis adjustments are amortized to the same consolidated statements of comprehensive income line item used to present the changes in fair value of the hedged item using the effective interest method considering the contractual terms of the hedged item, with amortization beginning no later than the period in which hedge accounting was discontinued.
|
FREDDIE MAC
| 2018 Form 10-K
|
273
|
|
|
Financial Statements
|
Notes to the Consolidated Financial Statements |
Note 9
|
Cash Flow Hedges
There are amounts recorded in AOCI related to discontinued cash flow hedges which are recognized in earnings when the originally forecasted transactions affect earnings. If it becomes probable the originally forecasted transaction will not occur, the associated deferred gain or loss in AOCI would be reclassified to earnings immediately. Amounts reclassified from AOCI are recorded in interest expense. In the years ended
December 31, 2018
and December 31,
2017
, we reclassified from AOCI into earnings, losses of
$133 million
and
$164 million
, respectively, related to closed cash flow hedges. See
Note 11
for information about future reclassifications of deferred net losses related to closed cash flow hedges to net income.
|
FREDDIE MAC
| 2018 Form 10-K
|
274
|
|
|
Financial Statements
|
Notes to the Consolidated Financial Statements |
Note 9
|
Derivative Assets and Liabilities at Fair Value
The table below presents the notional value and fair value of derivatives reported on our consolidated balance sheets.
Table 9.1 - Derivative Assets and Liabilities at Fair Value
|
As of December 31, 2018
|
As of December 31, 2017
|
|||||||||||||||||||
|
|
Notional or
Contractual
Amount
|
Derivatives at Fair Value
|
Notional or
Contractual
Amount
|
Derivatives at Fair Value
|
||||||||||||||||
|
(In millions)
|
Assets
|
Liabilities
|
Assets
|
Liabilities
|
||||||||||||||||
|
Not designated as hedges
|
||||||||||||||||||||
|
Interest-rate swaps:
|
||||||||||||||||||||
|
Receive-fixed
|
|
$145,386
|
|
|
$1,380
|
|
|
($181
|
)
|
|
$213,717
|
|
|
$2,121
|
|
|
($1,224
|
)
|
||
|
Pay-fixed
|
170,899
|
|
476
|
|
(2,287
|
)
|
185,400
|
|
751
|
|
(5,008
|
)
|
||||||||
|
Basis (floating to floating)
|
5,404
|
|
1
|
|
—
|
|
5,244
|
|
—
|
|
(2
|
)
|
||||||||
|
Total interest-rate swaps
|
321,689
|
|
1,857
|
|
(2,468
|
)
|
404,361
|
|
2,872
|
|
(6,234
|
)
|
||||||||
|
Option-based:
|
||||||||||||||||||||
|
Call swaptions
|
||||||||||||||||||||
|
Purchased
|
43,625
|
|
2,007
|
|
—
|
|
58,975
|
|
2,709
|
|
—
|
|
||||||||
|
Written
|
4,400
|
|
—
|
|
(133
|
)
|
4,650
|
|
—
|
|
(101
|
)
|
||||||||
|
Put swaptions
|
||||||||||||||||||||
|
Purchased
(1)
|
88,075
|
|
1,565
|
|
—
|
|
47,810
|
|
1,058
|
|
—
|
|
||||||||
|
Written
|
1,750
|
|
—
|
|
(4
|
)
|
3,000
|
|
—
|
|
(20
|
)
|
||||||||
|
Other option-based derivatives
(2)
|
10,481
|
|
628
|
|
—
|
|
10,683
|
|
757
|
|
—
|
|
||||||||
|
Total option-based
|
148,331
|
|
4,200
|
|
(137
|
)
|
125,118
|
|
4,524
|
|
(121
|
)
|
||||||||
|
Futures
|
161,185
|
|
—
|
|
—
|
|
267,385
|
|
—
|
|
—
|
|
||||||||
|
Commitments
|
36,044
|
|
90
|
|
(179
|
)
|
54,207
|
|
44
|
|
(64
|
)
|
||||||||
|
Credit derivatives
|
2,030
|
|
—
|
|
(35
|
)
|
3,569
|
|
7
|
|
(46
|
)
|
||||||||
|
Other
|
12,212
|
|
1
|
|
(103
|
)
|
2,906
|
|
1
|
|
(19
|
)
|
||||||||
|
Total derivatives not designated as hedges
|
681,491
|
|
6,148
|
|
(2,922
|
)
|
857,546
|
|
7,448
|
|
(6,484
|
)
|
||||||||
|
Designated as fair value hedges
|
||||||||||||||||||||
|
Interest-rate swaps:
|
||||||||||||||||||||
|
Receive-fixed
|
117,038
|
|
23
|
|
(935
|
)
|
83,352
|
|
2
|
|
(714
|
)
|
||||||||
|
Pay-fixed
|
77,513
|
|
247
|
|
(571
|
)
|
69,402
|
|
1,388
|
|
(291
|
)
|
||||||||
|
Total derivatives designated as fair value hedges
|
194,551
|
|
270
|
|
(1,506
|
)
|
|
152,754
|
|
1,390
|
|
(1,005
|
)
|
|||||||
|
Derivative interest receivable (payable)
(3)
|
889
|
|
(1,096
|
)
|
1,407
|
|
(1,596
|
)
|
||||||||||||
|
Netting adjustments
(4)
|
(6,972
|
)
|
4,941
|
|
(9,870
|
)
|
8,816
|
|
||||||||||||
|
Total derivative portfolio, net
|
|
$876,042
|
|
|
$335
|
|
|
($583
|
)
|
|
$1,010,300
|
|
|
$375
|
|
|
($269
|
)
|
||
|
(1)
|
Includes swaptions on credit indices with a notional or contractual amount of
$45.9 billion
and
$13.4 billion
at December 31, 2018 and December 31, 2017, respectively, and a fair value of
$113.0 million
and
$5.0 million
at
December 31, 2018
and December 31, 2017, respectively.
|
|
(2)
|
Primarily consists of purchased interest-rate caps and floors.
|
|
(3)
|
Includes other derivative receivables and payables.
|
|
(4)
|
Represents counterparty netting and cash collateral netting.
|
See
Note 10
for information related to our derivative counterparties and collateral held and posted.
|
FREDDIE MAC
| 2018 Form 10-K
|
275
|
|
|
Financial Statements
|
Notes to the Consolidated Financial Statements |
Note 9
|
Gains and Losses on Derivatives
The table below presents the gains and losses on derivatives, including the accrual of periodic cash settlements, while not designated in qualifying hedge relationships and reported on our consolidated statements of comprehensive income as derivative gains (losses). In addition, for the first three quarters of 2017, the table includes the accrual of periodic cash settlements on derivatives in qualifying hedge relationships.
Table 9.2 - Gains and Losses on Derivatives
|
Year Ended December 31,
|
||||||||||
|
(In millions)
|
2018
|
2017
|
2016
|
|||||||
|
Not designated as hedges
|
||||||||||
|
Interest-rate swaps:
|
||||||||||
|
Receive-fixed
|
|
($2,457
|
)
|
|
($1,343
|
)
|
|
($3,539
|
)
|
|
|
Pay-fixed
|
3,880
|
|
1,972
|
|
3,717
|
|
||||
|
Basis (floating to floating)
|
(1
|
)
|
(3
|
)
|
—
|
|
||||
|
Total interest-rate swaps
|
1,422
|
|
626
|
|
178
|
|
||||
|
Option based:
|
||||||||||
|
Call swaptions
|
||||||||||
|
Purchased
|
(791
|
)
|
(404
|
)
|
234
|
|
||||
|
Written
|
20
|
|
24
|
|
(45
|
)
|
||||
|
Put swaptions
|
||||||||||
|
Purchased
|
272
|
|
(673
|
)
|
210
|
|
||||
|
Written
|
(2
|
)
|
50
|
|
35
|
|
||||
|
Other option-based derivatives
(1)
|
(129
|
)
|
(38
|
)
|
(13
|
)
|
||||
|
Total option-based
|
(630
|
)
|
(1,041
|
)
|
421
|
|
||||
|
Other:
|
||||||||||
|
Futures
|
57
|
|
144
|
|
334
|
|
||||
|
Commitments
|
606
|
|
(91
|
)
|
631
|
|
||||
|
Credit derivatives
|
(5
|
)
|
(29
|
)
|
(75
|
)
|
||||
|
Other
|
(39
|
)
|
(7
|
)
|
(3
|
)
|
||||
|
Total other
|
619
|
|
17
|
|
887
|
|
||||
|
Accrual of periodic cash settlements:
|
||||||||||
|
Receive-fixed interest-rate swaps
|
364
|
|
1,511
|
|
2,316
|
|
||||
|
Pay-fixed interest-rate swaps
|
(584
|
)
|
(3,101
|
)
|
(4,077
|
)
|
||||
|
Other
|
79
|
|
—
|
|
1
|
|
||||
|
Total accrual of periodic cash settlements
|
(141
|
)
|
(1,590
|
)
|
(1,760
|
)
|
||||
|
Total
|
|
$1,270
|
|
|
($1,988
|
)
|
|
($274
|
)
|
|
|
(1)
|
Primarily consists of purchased interest-rate caps and floors.
|
|
FREDDIE MAC
| 2018 Form 10-K
|
276
|
|
|
Financial Statements
|
Notes to the Consolidated Financial Statements |
Note 9
|
Fair Value Hedges
The tables below present the gains and losses on derivatives and hedged items while designated in qualifying fair value hedge relationships.
Table 9.3 - Gains and Losses on Fair Value Hedges
|
Year Ended December 31, 2018
|
||||||||||
|
(In millions)
|
Interest Income - Mortgage Loans
|
Interest Expense
|
Other Income (Loss)
|
|||||||
|
Total amounts of income and expense line items presented on our consolidated statements of comprehensive income in which the effects of fair value hedges are recorded:
|
|
$66,037
|
|
|
($58,033
|
)
|
|
$714
|
|
|
|
Interest contracts on mortgage loans held-for-investment:
|
||||||||||
|
Gain or (loss) on fair value hedging relationships:
|
||||||||||
|
Hedged items
|
(1,776
|
)
|
—
|
|
—
|
|
||||
|
Derivatives designated as hedging instruments
|
1,091
|
|
—
|
|
—
|
|
||||
|
Interest accruals on hedging instruments
|
(439
|
)
|
—
|
|
—
|
|
||||
|
Discontinued hedge related basis adjustment amortization
|
133
|
|
—
|
|
—
|
|
||||
|
Interest contracts on debt:
|
||||||||||
|
Gain or (loss) on fair value hedging relationships:
|
||||||||||
|
Hedged Items
|
—
|
|
145
|
|
—
|
|
||||
|
Derivatives designated as hedging instruments
|
—
|
|
155
|
|
—
|
|
||||
|
Interest accruals on hedging instruments
|
—
|
|
(313
|
)
|
—
|
|
||||
|
Discontinued hedge related basis adjustment amortization
|
—
|
|
(3
|
)
|
—
|
|
||||
|
Year Ended December 31, 2017
|
||||||||||
|
(In millions)
|
Interest Income - Mortgage Loans
|
Interest Expense
|
Other Income (Loss)
|
|||||||
|
Total amounts of income and expense line items presented on our consolidated statements of comprehensive income in which the effects of fair value hedges are recorded:
|
|
$63,735
|
|
|
($53,643
|
)
|
|
$4,982
|
|
|
|
Interest contracts on mortgage loans held-for-investment:
|
||||||||||
|
Gain or (loss) on fair value hedging relationships:
(1)
|
||||||||||
|
Hedged items
|
(107
|
)
|
—
|
|
351
|
|
||||
|
Derivatives designated as hedging instruments
(2)
|
313
|
|
—
|
|
(215
|
)
|
||||
|
Interest accruals on hedging instruments
|
(83
|
)
|
—
|
|
—
|
|
||||
|
Discontinued hedge related basis adjustment amortization
|
(16
|
)
|
—
|
|
—
|
|
||||
|
Interest contracts on debt:
|
||||||||||
|
Gain or (loss) on fair value hedging relationships:
|
||||||||||
|
Hedged Items
|
—
|
|
93
|
|
—
|
|
||||
|
Derivatives designated as hedging instruments
|
—
|
|
(53
|
)
|
—
|
|
||||
|
Interest accruals on hedging instruments
|
—
|
|
8
|
|
—
|
|
||||
|
Discontinued hedge related basis adjustment amortization
|
—
|
|
—
|
|
—
|
|
||||
|
(1)
|
For the first three quarters of 2017, the gains or losses on derivatives and hedged items were recorded on other income (loss). Beginning in 4Q 2017, gains or losses are recorded in interest income - mortgage loans on our consolidated statements of comprehensive income due to adoption of amended hedge accounting guidance.
|
|
(2)
|
The gain or (loss) on fair value hedging relationships in 2017 excludes
($277) million
of interest accruals which were recorded in derivatives gains (losses) on our consolidated statements of comprehensive income.
|
|
FREDDIE MAC
| 2018 Form 10-K
|
277
|
|
|
Financial Statements
|
Notes to the Consolidated Financial Statements |
Note 9
|
Cumulative Basis Adjustments due to Fair Value Hedging
The tables below present the carrying amounts of the hedged items that have been in a qualifying fair value hedge by their respective balance sheet line item, as well as the hedged item's cumulative basis adjustments. The hedged item carrying amounts include both designated and discontinued hedges.
Table 9.4 - Cumulative Basis Adjustments due to Fair Value Hedging
|
As of December 31, 2018
|
|||||||||||
|
Carrying Amount Assets / (Liabilities)
|
Cumulative Amount of Fair Value Hedging Basis Adjustment Included in the Carrying Amount
|
||||||||||
|
(In millions)
|
Total
|
Discontinued - Hedge Related
|
|||||||||
|
Mortgage loans held-for-investment
|
|
$193,547
|
|
|
($1,237
|
)
|
|
($1,237
|
)
|
||
|
Debt
|
(127,215
|
)
|
216
|
|
(8
|
)
|
|||||
|
As of December 31, 2017
|
|||||||||||
|
Carrying Amount Assets / (Liabilities)
|
Cumulative Amount of Fair Value Hedging Basis Adjustment Included in the Carrying Amount
|
||||||||||
|
(In millions)
|
Total
|
Discontinued - Hedge Related
|
|||||||||
|
Mortgage loans held-for-investment
|
|
$128,140
|
|
|
$198
|
|
|
$198
|
|
||
|
Debt
|
(92,277
|
)
|
79
|
|
(14
|
)
|
|||||
|
FREDDIE MAC
| 2018 Form 10-K
|
278
|
|
|
Financial Statements
|
Notes to the Consolidated Financial Statements |
Note 10
|
NOTE 10
Collateralized Agreements and Offsetting Arrangements
Derivative Portfolio
Derivative Counterparties
Our use of cleared derivatives, exchange-traded derivatives, and OTC derivatives exposes us to counterparty credit risk. We are required to post margin in connection with our derivatives transactions. This requirement exposes us to counterparty credit risk in the event that our counterparties fail to meet their obligations. However, the use of cleared and exchange-traded derivatives decreases our credit risk exposure to individual counterparties because a central counterparty is substituted for individual counterparties. OTC derivatives expose us to the credit risk of individual counterparties because transactions are executed and settled between us and each counterparty, exposing us to potential losses if a counterparty fails to meet its obligations.
Our use of interest-rate swaps and option-based derivatives is subject to internal credit and legal reviews. On an ongoing basis, we review the credit fundamentals of all of our derivative counterparties, clearinghouses, and clearing members to confirm that they continue to meet our internal risk management standards.
Over-the-Counter Derivatives
We use master netting and collateral agreements to reduce our credit risk exposure to our OTC derivative counterparties for interest-rate swap and option-based derivatives. Master netting agreements provide for the netting of amounts receivable and payable from an individual counterparty, as well as posting of collateral in the form of cash, Treasury securities or agency mortgage-related or debt securities, or a combination of both by either the counterparty or us, depending on which party is in a liability position. Although it is our practice not to repledge assets held as collateral, these agreements may allow us or our counterparties to repledge all or a portion of the collateral.
We have master netting agreements in place with all of our OTC derivative counterparties. On a daily basis, the market value of each counterparty's derivatives outstanding is calculated to determine the amount of our net credit exposure, which is equal to the market value of derivatives in a net gain position by counterparty after giving consideration to collateral posted. In the event a counterparty defaults on its obligations under the derivatives agreement and the default is not remedied in the manner prescribed in the agreement, we have the right under the agreement to sell the collateral. As a result, our use of master netting and collateral agreements reduces our exposure to our counterparties in the event of default.
In the event that all of our counterparties for OTC interest-rate swaps and option-based derivatives were to have defaulted simultaneously on
December 31, 2018
, our maximum loss for accounting purposes after applying netting agreements and collateral on an individual counterparty basis would have been approximately
$48 million
. A significant majority of our net uncollateralized exposure to OTC derivative counterparties is concentrated among
five
counterparties, all of which were investment grade as of
|
FREDDIE MAC
| 2018 Form 10-K
|
279
|
|
|
Financial Statements
|
Notes to the Consolidated Financial Statements |
Note 10
|
December 31, 2018
. We regularly review the market value of securities pledged as collateral and derivative counterparty collateral posting thresholds, where applicable, in an effort to manage our exposure to losses.
Regulations adopted by certain financial institution regulators (including FHFA) that became effective March 1, 2017 require posting of variation margin without the application of any thresholds for OTC derivative transactions executed after that date. As a result, our and the counterparties' credit ratings are no longer used in determining the amount of collateral to be posted in connection with these transactions
.
However, for OTC derivative transactions executed before March 1, 2017 the amount of collateral we pledge to counterparties related to our derivative instruments is determined after giving consideration to our credit rating. The aggregate fair value of our OTC derivative instruments containing credit-risk related contingent features, netted by counterparty, that were in a liability position on
December 31, 2018
was
$0.4 billion
for which we posted cash and non-cash collateral of
$0.3 billion
in the normal course of business. A reduction in our credit ratings may trigger additional collateral requirements related to these OTC derivative instruments. If a reduction in our credit ratings had triggered additional collateral requirements related to these OTC derivative instruments on
December 31, 2018
, we would have been required to post an additional
$123 million
of collateral to our counterparties.
Cleared and Exchange-Traded Derivatives
The majority of our interest-rate swaps are subject to the central clearing requirement. Changes in the value of open exchange-traded contracts and cleared derivatives are settled or collateralized daily via payments made through the clearinghouse. We net our exposure to cleared derivatives by clearinghouse and clearing member. Exchange-traded derivatives are settled on a daily basis through the payment of variation margin. A reduction in our credit ratings could cause the clearinghouses or clearing members we use for our cleared and exchange-traded derivatives to demand additional collateral.
In October 2017, the CFTC issued an interpretation letter clarifying that variation margin payments for cleared swaps constitute daily settlement of exposure and not the posting of margin collateral. We changed the characterization of variation margin payments from posting of margin collateral to settlements in 1Q 2017 for cleared swaps transacted with the Chicago Mercantile Exchange (CME) and in 1Q 2018 for cleared swaps transacted with LCH Group, as a result of certain rule amendments made by those organizations.
Other Derivatives
We also execute forward purchase and sale commitments of loans and mortgage-related securities, including dollar roll transactions, that are treated as derivatives for accounting purposes. The total exposure on our forward purchase and sale commitments was
$90 million
and
$44 million
at
December 31, 2018
and December 31,
2017
, respectively.
Many of our transactions involving forward purchase and sale commitments of mortgage-related securities utilize the MBSD/FICC as a clearinghouse. As a clearing member of the clearinghouse, we post margin to the MBSD/FICC and are exposed to the counterparty credit risk of the organization (including its clearing members). In the event a clearing member fails and causes losses to the MBSD/FICC clearing system, we could be subject to the loss of the margin that we have posted to the MBSD/
|
FREDDIE MAC
| 2018 Form 10-K
|
280
|
|
|
Financial Statements
|
Notes to the Consolidated Financial Statements |
Note 10
|
FICC. Moreover, our exposure could exceed that amount, as members are generally required to cover losses caused by defaulting members on a pro rata basis. It is difficult to estimate our maximum exposure under these transactions, as this would require an assessment of transactions that we and other members of the MBSD/FICC may execute in the future.
Securities Purchased Under Agreements to Resell
As an investor, we enter into arrangements to purchase securities under agreements to subsequently resell the identical or substantially the same securities to our counterparty. Our counterparties to these transactions are required to pledge the purchased securities as collateral for their obligation to repurchase those securities at a later date. While such transactions involve the legal transfer of securities, they are accounted for as secured financings because the transferor does not relinquish effective control over the securities transferred. Although it is our practice not to repledge assets held as collateral, these agreements may allow us to repledge all or a portion of the collateral.
We consider the types of securities being pledged to us as collateral when determining how much we lend in transactions involving securities purchased under agreements to resell. Additionally, we regularly review the market values of these securities compared to amounts loaned in an effort to manage our exposure to losses.
Beginning in 2017, we began to utilize the GSD/FICC as a clearinghouse to transact many of our trades involving securities purchased under agreements to resell, securities sold under agreements to repurchase, and other non-mortgage related securities. As a clearing member of GSD/FICC, we are required to post initial and variation margin payments and are exposed to the counterparty credit risk of GSD/FICC (including its clearing members). Although our membership provides us with the right to offset certain of our open receivable and payable positions by collateral type, we have elected not to offset these positions within our consolidated balance sheets. In the event a clearing member fails and causes losses to the GSD/FICC clearing system, we could be subject to the loss of the margin that we have posted to the GSD/FICC. Moreover, our exposure could exceed that amount, as members are generally required to cover losses caused by defaulting members on a pro rata basis. It is difficult to estimate our maximum exposure under these transactions, as this would require an assessment of transactions that we and other members of the GSD/FICC may execute in the future.
Securities Sold Under Agreements to Repurchase
Securities sold under agreements to repurchase are effectively collateralized borrowings where we sell securities with an agreement to repurchase such securities at a future date. We are required to pledge the sold securities to the counterparties to these transactions as collateral for our obligation to repurchase these securities at a later date. Similar to the securities purchased under agreements to resell transactions, these transactions involve the legal transfer of securities. However, they are accounted for as secured financings because they require the identical or substantially the same securities to be subsequently repurchased. These agreements may allow our counterparties to repledge all or a portion of the collateral. Beginning in 2017, certain of our trades involving securities sold under agreements to repurchase utilized GSD/FICC as a clearinghouse.
|
FREDDIE MAC
| 2018 Form 10-K
|
281
|
|
|
Financial Statements
|
Notes to the Consolidated Financial Statements |
Note 10
|
Offsetting of Financial Assets and Liabilities
When we receive cash collateral, we recognize the amount received along with a corresponding obligation to return the collateral. When we post cash collateral, we derecognize the amount posted along with a corresponding asset for our right to receive the return of the collateral. We generally do not recognize or derecognize collateral received or pledged in the form of securities as the transferor in such arrangements does not relinquish effective control over the securities transferred. See
Note 9
for additional information on our consolidated balance sheets presentation of collateral related to derivatives transactions. At
December 31, 2018
and December 31,
2017
, all amounts of cash collateral related to derivatives with master netting and collateral agreements were offset against derivative assets, net or derivative liabilities, net, as applicable.
|
FREDDIE MAC
| 2018 Form 10-K
|
282
|
|
|
Financial Statements
|
Notes to the Consolidated Financial Statements |
Note 10
|
The tables below present offsetting and collateral information related to derivatives, securities purchased under agreements to resell, and securities sold under agreements to repurchase. Securities sold under agreements to repurchase are included in debt, net on our consolidated balance sheets.
Table 10.1 - Offsetting and Collateral Information of Financial Assets and Liabilities
|
|
As of December 31, 2018
|
||||||||||||||||||||
|
Gross
Amount
Recognized
|
Amount Offset in the
Consolidated
Balance Sheets
|
Net Amount
Presented on
the Consolidated
Balance Sheets
|
Gross Amount
Not Offset on
the Consolidated
Balance Sheets
(2)
|
Net
Amount
|
|||||||||||||||||
|
(In millions)
|
Counterparty Netting
|
Cash Collateral Netting
(1)
|
|||||||||||||||||||
|
Assets:
|
|||||||||||||||||||||
|
Derivatives:
|
|||||||||||||||||||||
|
OTC derivatives
|
|
$7,213
|
|
|
($4,544
|
)
|
|
($2,448
|
)
|
|
$221
|
|
|
($173
|
)
|
|
$48
|
|
|||
|
Cleared and exchange-traded derivatives
|
3
|
|
—
|
|
20
|
|
23
|
|
—
|
|
23
|
|
|||||||||
|
Other
|
91
|
|
—
|
|
—
|
|
91
|
|
—
|
|
91
|
|
|||||||||
|
Total derivatives
|
7,307
|
|
(4,544
|
)
|
(2,428
|
)
|
335
|
|
(173
|
)
|
162
|
|
|||||||||
|
Securities purchased under agreements to resell
(3)(4)
|
34,771
|
|
—
|
|
—
|
|
34,771
|
|
(34,771
|
)
|
—
|
|
|||||||||
|
Total
|
|
$42,078
|
|
|
($4,544
|
)
|
|
($2,428
|
)
|
|
$35,106
|
|
|
($34,944
|
)
|
|
$162
|
|
|||
|
Liabilities:
|
|||||||||||||||||||||
|
Derivatives:
|
|||||||||||||||||||||
|
OTC derivatives
|
|
($4,963
|
)
|
|
$4,544
|
|
|
$296
|
|
|
($123
|
)
|
|
$—
|
|
|
($123
|
)
|
|||
|
Cleared and exchange-traded derivatives
|
(244
|
)
|
—
|
|
101
|
|
(143
|
)
|
—
|
|
(143
|
)
|
|||||||||
|
Other
|
(317
|
)
|
—
|
|
—
|
|
(317
|
)
|
—
|
|
(317
|
)
|
|||||||||
|
Total derivatives
|
(5,524
|
)
|
4,544
|
|
397
|
|
(583
|
)
|
—
|
|
(583
|
)
|
|||||||||
|
Securities sold under agreements to repurchase
(4)
|
(6,019
|
)
|
—
|
|
—
|
|
(6,019
|
)
|
6,019
|
|
—
|
|
|||||||||
|
Total
|
|
($11,543
|
)
|
|
$4,544
|
|
|
$397
|
|
|
($6,602
|
)
|
|
$6,019
|
|
|
($583
|
)
|
|||
|
|
As of December 31, 2017
|
||||||||||||||||||||
|
Gross
Amount
Recognized
|
Amount Offset in the
Consolidated
Balance Sheets
|
Net Amount
Presented on
the Consolidated
Balance Sheets
|
Gross Amount
Not Offset on
the Consolidated
Balance Sheets
(2)
|
Net
Amount
|
|||||||||||||||||
|
(In millions)
|
Counterparty Netting
|
Cash Collateral Netting
(1)
|
|||||||||||||||||||
|
Assets:
|
|||||||||||||||||||||
|
Derivatives:
|
|||||||||||||||||||||
|
OTC derivatives
|
|
$7,648
|
|
|
($5,499
|
)
|
|
($1,903
|
)
|
|
$246
|
|
|
($205
|
)
|
|
$41
|
|
|||
|
Cleared and exchange-traded derivatives
|
2,545
|
|
(2,266
|
)
|
(202
|
)
|
77
|
|
—
|
|
77
|
|
|||||||||
|
Other
|
52
|
|
—
|
|
—
|
|
52
|
|
—
|
|
52
|
|
|||||||||
|
Total derivatives
|
10,245
|
|
(7,765
|
)
|
(2,105
|
)
|
375
|
|
(205
|
)
|
170
|
|
|||||||||
|
Securities purchased under agreements to resell
(3)(4)
|
55,903
|
|
—
|
|
—
|
|
55,903
|
|
(55,903
|
)
|
—
|
|
|||||||||
|
Total
|
|
$66,148
|
|
|
($7,765
|
)
|
|
($2,105
|
)
|
|
$56,278
|
|
|
($56,108
|
)
|
|
$170
|
|
|||
|
Liabilities:
|
|||||||||||||||||||||
|
Derivatives:
|
|||||||||||||||||||||
|
OTC derivatives
|
|
($6,285
|
)
|
|
$5,499
|
|
|
$688
|
|
|
($98
|
)
|
|
$—
|
|
|
($98
|
)
|
|||
|
Cleared and exchange-traded derivatives
|
(2,671
|
)
|
2,266
|
|
363
|
|
(42
|
)
|
—
|
|
(42
|
)
|
|||||||||
|
Other
|
(129
|
)
|
—
|
|
—
|
|
(129
|
)
|
—
|
|
(129
|
)
|
|||||||||
|
Total derivatives
|
(9,085
|
)
|
7,765
|
|
1,051
|
|
(269
|
)
|
—
|
|
(269
|
)
|
|||||||||
|
Securities sold under agreements to repurchase
(4)
|
(9,681
|
)
|
—
|
|
—
|
|
(9,681
|
)
|
9,681
|
|
—
|
|
|||||||||
|
Total
|
|
($18,766
|
)
|
|
$7,765
|
|
|
$1,051
|
|
|
($9,950
|
)
|
|
$9,681
|
|
|
($269
|
)
|
|||
|
(1)
|
Excess cash collateral held is presented as a derivative liability, while excess cash collateral posted is presented as a derivative asset.
|
|
FREDDIE MAC
| 2018 Form 10-K
|
283
|
|
|
Financial Statements
|
Notes to the Consolidated Financial Statements |
Note 10
|
|
(2)
|
Does not include the fair value amount of non-cash collateral posted or held that exceeds the associated net asset or liability, netted by counterparty, presented on the consolidated balance sheets. For cleared and exchange-traded derivatives, does not include non-cash collateral posted by us as initial margin with an aggregate fair value of
$2.5 billion
and
$3.1 billion
as of
December 31, 2018
and December 31, 2017, respectively.
|
|
(3)
|
We primarily execute securities purchased under agreements to resell transactions with central clearing organizations where we have the right to repledge the collateral that has been pledged to us, either with the central clearing organization or with other counterparties. At
December 31, 2018
and December 31,
2017
, we had
$20.1 billion
and
$34.8 billion
, respectively, of securities pledged to us in these transactions. In addition, at
December 31, 2018
and December 31, 2017, we had
$2.5 billion
and
$3.4 billion
, respectively, of securities pledged to us for transactions involving securities purchased under agreements to resell not executed with central clearing organizations that we had the right to repledge.
|
|
(4)
|
Does not include the impacts of netting by central clearing organizations.
|
Collateral Pledged
Collateral Pledged to Freddie Mac
We have cash pledged to us as collateral primarily related to OTC derivative transactions. We had
$3.0 billion
and
$2.4 billion
pledged to us as collateral that was invested as part of our Liquidity and Contingency Operating Portfolio as of December 31, 2018 and December 31, 2017, respectively.
Collateral Pledged by Freddie Mac
The tables below summarize the fair value of the securities pledged as collateral by us for derivatives and collateralized borrowing transactions, including securities that the secured party may repledge.
Table 10.2 - Collateral in the Form of Securities Pledged
|
As of December 31, 2018
|
|||||||||||||
|
(In millions)
|
Derivatives
|
Securities sold under agreements to repurchase
|
Other
(3)
|
Total
|
|||||||||
|
Cash equivalents
(1)
|
|
$—
|
|
|
$2,595
|
|
|
$—
|
|
|
$2,595
|
|
|
|
Debt securities of consolidated trusts
(2)
|
362
|
|
—
|
|
179
|
|
541
|
|
|||||
|
Available-for-sale securities
|
—
|
|
—
|
|
1
|
|
1
|
|
|||||
|
Trading securities
|
2,160
|
|
3,432
|
|
73
|
|
5,665
|
|
|||||
|
Total securities pledged
|
|
$2,522
|
|
|
$6,027
|
|
|
$253
|
|
|
$8,802
|
|
|
|
December 31, 2017
|
|||||||||||||
|
(In millions)
|
Derivatives
|
Securities sold under agreements to repurchase
|
Other
(3)
|
Total
|
|||||||||
|
Debt securities of consolidated trusts
(2)
|
|
$375
|
|
|
$—
|
|
|
$111
|
|
|
$486
|
|
|
|
Trading securities
|
2,766
|
|
9,705
|
|
362
|
|
12,833
|
|
|||||
|
Total securities pledged
|
|
$3,141
|
|
|
$9,705
|
|
|
$473
|
|
|
$13,319
|
|
|
|
(1)
|
Represents U.S. Treasury securities accounted for as cash equivalents.
|
|
(2)
|
Represents PCs held by us in our Capital Markets segment mortgage investments portfolio which are recorded as a reduction to debt securities of consolidated trusts held by third parties on our consolidated balance sheets.
|
|
(3)
|
Includes other collateralized borrowings and collateral related to transactions with certain clearinghouses.
|
|
FREDDIE MAC
| 2018 Form 10-K
|
284
|
|
|
Financial Statements
|
Notes to the Consolidated Financial Statements |
Note 10
|
The table below summarizes the underlying collateral pledged and the remaining contractual maturity of our gross obligations under securities sold under agreements to repurchase.
Table 10.3 - Underlying Collateral Pledged
|
As of December 31, 2018
|
||||||||||||||||
|
(In millions)
|
Overnight and continuous
|
30 days or less
|
After 30 days through 90 days
|
Greater than
90 days
|
Total
|
|||||||||||
|
U.S. Treasury securities
|
|
$—
|
|
|
$2,103
|
|
|
$3,924
|
|
|
$—
|
|
|
$6,027
|
|
|
|
FREDDIE MAC
| 2018 Form 10-K
|
285
|
|
|
Financial Statements
|
Notes to the Consolidated Financial Statements |
Note 11
|
NOTE 11
Stockholders' Equity and Earnings Per Share
Accumulated Other Comprehensive Income
The tables below present changes in AOCI after the effects of our federal statutory tax rates of
21%
and
35%
for 2018 and 2017, respectively, related to available-for-sale securities, closed cash flow hedges, and our defined benefit plans.
Table 11.1 - Changes in AOCI by Component, Net of Taxes
|
Year Ended December 31, 2018
|
|||||||||||||
|
(In millions)
|
AOCI Related
to Available-
For-Sale
Securities
|
AOCI Related
to Cash Flow
Hedge
Relationships
|
AOCI Related
to Defined
Benefit Plans
|
Total
|
|||||||||
|
Beginning balance
|
|
$662
|
|
|
($356
|
)
|
|
$83
|
|
|
$389
|
|
|
|
Other comprehensive income before reclassifications
(1)
|
(476
|
)
|
—
|
|
11
|
|
(465
|
)
|
|||||
|
Amounts reclassified from accumulated other comprehensive income
|
(246
|
)
|
114
|
|
(16
|
)
|
(148
|
)
|
|||||
|
Changes in AOCI by component
|
(722
|
)
|
114
|
|
(5
|
)
|
(613
|
)
|
|||||
|
Cumulative effect of change in accounting principle
(2)
|
|
$143
|
|
|
($73
|
)
|
|
$19
|
|
|
$89
|
|
|
|
Ending balance
|
|
$83
|
|
|
($315
|
)
|
|
$97
|
|
|
($135
|
)
|
|
|
|
Year Ended December 31, 2017
|
||||||||||||
|
(In millions)
|
AOCI Related
to Available-
For-Sale
Securities
|
AOCI Related
to Cash Flow
Hedge
Relationships
|
AOCI Related
to Defined
Benefit Plans
|
Total
|
|||||||||
|
Beginning balance
|
|
$915
|
|
|
($480
|
)
|
|
$21
|
|
|
$456
|
|
|
|
Other comprehensive income before reclassifications
(1)
|
857
|
|
—
|
|
63
|
|
920
|
|
|||||
|
Amounts reclassified from accumulated other comprehensive income
|
(1,110
|
)
|
124
|
|
(1
|
)
|
(987
|
)
|
|||||
|
Changes in AOCI by component
|
(253
|
)
|
124
|
|
62
|
|
(67
|
)
|
|||||
|
Ending balance
|
|
$662
|
|
|
($356
|
)
|
|
$83
|
|
|
$389
|
|
|
|
|
Year Ended December 31, 2016
|
||||||||||||
|
(In millions)
|
AOCI Related
to Available-
For-Sale
Securities
|
AOCI Related
to Cash Flow
Hedge
Relationships
|
AOCI Related
to Defined
Benefit Plans
|
Total
|
|||||||||
|
Beginning balance
|
|
$1,740
|
|
|
($621
|
)
|
|
$34
|
|
|
$1,153
|
|
|
|
Other comprehensive income before reclassifications
(1)
|
(318
|
)
|
—
|
|
(10
|
)
|
(328
|
)
|
|||||
|
Amounts reclassified from accumulated other comprehensive income
|
(507
|
)
|
141
|
|
(3
|
)
|
(369
|
)
|
|||||
|
Changes in AOCI by component
|
(825
|
)
|
141
|
|
(13
|
)
|
(697
|
)
|
|||||
|
Ending balance
|
|
$915
|
|
|
($480
|
)
|
|
$21
|
|
|
$456
|
|
|
|
(1)
|
For the years ended
December 31, 2018
, 2017, and 2016, net of tax expense (benefit) of
$(0.1) billion
,
$0.5 billion
, and
($0.2) billion
, respectively, for AOCI related to available-for-sale securities.
|
|
(2)
|
Includes the effect of adopting the accounting guidance on reclassification of stranded tax effects of the Tax Cuts and Jobs Act.
|
|
FREDDIE MAC
| 2018 Form 10-K
|
286
|
|
|
Financial Statements
|
Notes to the Consolidated Financial Statements |
Note 11
|
In 1Q 2018, we adopted the accounting guidance related to the reclassification of stranded tax effects resulting from the Tax Cuts and Jobs Act from accumulated other comprehensive income to retained earnings. The reclassification includes stranded tax effects related to unrealized gains and losses on available-for-sale securities, deferred net losses on closed cash flow hedges, and our defined benefit plans.
Reclassifications from AOCI to Net Income
The table below presents reclassifications from AOCI to net income, including the affected line item on our consolidated statements of comprehensive income.
Table 11.2 - Reclassifications from AOCI to Net Income
|
Year Ended December 31,
|
||||||||||
|
(In millions)
|
2018
|
2017
|
2016
|
|||||||
|
AOCI related to available-for-sale securities
|
||||||||||
|
Affected line items on the consolidated statements of comprehensive income:
|
||||||||||
|
Investment securities gains (losses)
|
|
$312
|
|
|
$1,708
|
|
|
$780
|
|
|
|
Total before tax
|
312
|
|
1,708
|
|
780
|
|
||||
|
Income tax (expense) or benefit
|
(66
|
)
|
(598
|
)
|
(273
|
)
|
||||
|
Net of tax
|
246
|
|
1,110
|
|
507
|
|
||||
|
AOCI related to cash flow hedge relationships
|
||||||||||
|
Affected line items on the consolidated statements of comprehensive income:
|
||||||||||
|
Interest expense
|
(133
|
)
|
(164
|
)
|
(192
|
)
|
||||
|
Income tax (expense) or benefit
|
19
|
|
40
|
|
51
|
|
||||
|
Net of tax
|
(114
|
)
|
(124
|
)
|
(141
|
)
|
||||
|
AOCI related to defined benefit plans
|
||||||||||
|
Affected line items on the consolidated statements of comprehensive income:
|
||||||||||
|
Salaries and employee benefits
|
20
|
|
2
|
|
4
|
|
||||
|
Income tax (expense) or benefit
|
(4
|
)
|
(1
|
)
|
(1
|
)
|
||||
|
Net of tax
|
16
|
|
1
|
|
3
|
|
||||
|
Total reclassifications in the period net of tax
|
|
$148
|
|
|
$987
|
|
|
$369
|
|
|
Future Reclassifications from AOCI to Net Income Related to Closed Cash Flow Hedges
The total AOCI related to derivatives designated as cash flow hedges was a loss of
$0.3 billion
and
$0.4 billion
at
December 31, 2018
and December 31, 2017, respectively, composed of deferred net losses on closed cash flow hedges. Closed cash flow hedges involve derivatives that have been terminated or are no longer designated as cash flow hedges. Fluctuations in prevailing market interest rates have no effect on the deferred portion of AOCI relating to losses on closed cash flow hedges.
The previously deferred amount related to closed cash flow hedges remains in our AOCI balance and will be recognized into earnings over the expected time period for which the forecasted transactions affect earnings, unless it is deemed probable that the forecasted transactions will not occur. Over the next 12 months, we estimate that approximately
$75 million
, net of taxes, of the $
0.3 billion
of cash flow hedge losses in AOCI at
December 31, 2018
will be reclassified into earnings. The maximum remaining
|
FREDDIE MAC
| 2018 Form 10-K
|
287
|
|
|
Financial Statements
|
Notes to the Consolidated Financial Statements |
Note 11
|
length of time over which we have hedged the exposure related to the variability in future cash flows on forecasted transactions, primarily forecasted debt issuances, is
15
years.
Senior Preferred Stock
Pursuant to the Purchase Agreement described in
Note 2
, we issued
one million
shares of senior preferred stock to Treasury on September 8, 2008, in partial consideration of Treasury's commitment to provide funds to us.
Shares of the senior preferred stock have a par value of
$1
, and have a stated value and initial liquidation preference of
$1 billion
, or
$1,000
per share. The liquidation preference of the senior preferred stock is subject to adjustment. Dividends that are not paid in cash for any dividend period will accrue and be added to the liquidation preference of the senior preferred stock. In addition, any amounts Treasury pays to us pursuant to its funding commitment under the Purchase Agreement and any quarterly commitment fees that are not paid in cash to Treasury nor waived by Treasury will be added to the liquidation preference of the senior preferred stock. The liquidation preference also increased by
$3.0 billion
on December 31, 2017 pursuant to the Letter Agreement. As described below, we may make payments to reduce the liquidation preference of the senior preferred stock in limited circumstances. As discussed in
Note 2
, the quarterly commitment fee has been suspended.
Treasury, as the holder of the senior preferred stock, is entitled to receive quarterly cash dividends, when, as and if declared by our Board of Directors. The dividends we have paid to Treasury on the senior preferred stock have been declared by, and paid at the direction of, the Conservator, acting as successor to the rights, titles, powers, and privileges of the Board. The dividend is presented in the period in which it is determinable for the senior preferred stock, as a reduction to net income (loss) available to common stockholders and net income (loss) per common share. The dividend is declared and paid in the following period and recorded as a reduction to equity in the period declared. Total dividends paid in cash during
2018
, 2017, and 2016 at the direction of the Conservator were
$4.1 billion
,
$10.9 billion
, and
$5.0 billion
, respectively. See
Note 2
for a discussion of our net worth sweep dividend.
The senior preferred stock is senior to our common stock and all other outstanding series of our preferred stock, as well as any capital stock we issue in the future, as to both dividends and rights upon liquidation. The senior preferred stock provides that we may not, at any time, declare or pay dividends on, make distributions with respect to, redeem, purchase or acquire, or make a liquidation payment with respect to, any common stock or other securities ranking junior to the senior preferred stock unless:
n
Full cumulative dividends on the outstanding senior preferred stock (including any unpaid dividends added to the liquidation preference) have been declared and paid in cash and
n
All amounts required to be paid with the net proceeds of any issuance of capital stock for cash (as described below) have been paid in cash.
Shares of the senior preferred stock are not convertible. Shares of the senior preferred stock have no general or special voting rights, other than those set forth in the certificate of designation for the senior preferred stock or otherwise required by law. The consent of holders of at least two-thirds of all outstanding shares of senior preferred stock is generally required to amend the terms of the senior preferred stock or to create any class or series of stock that ranks prior to or on parity with the senior preferred stock.
|
FREDDIE MAC
| 2018 Form 10-K
|
288
|
|
|
Financial Statements
|
Notes to the Consolidated Financial Statements |
Note 11
|
We are not permitted to redeem the senior preferred stock prior to the termination of Treasury's funding commitment set forth in the Purchase Agreement; however, we are permitted to pay down the liquidation preference of the outstanding shares of senior preferred stock to the extent of accrued and unpaid dividends previously added to the liquidation preference and not previously paid down and quarterly commitment fees previously added to the liquidation preference and not previously paid down. In addition, if we issue any shares of capital stock for cash while the senior preferred stock is outstanding, the net proceeds of the issuance must be used to pay down the liquidation preference of the senior preferred stock; however, the liquidation preference of each share of senior preferred stock may not be paid down below $1,000 per share prior to the termination of Treasury's funding commitment. Following the termination of Treasury's funding commitment, we may pay down the liquidation preference of all outstanding shares of senior preferred stock at any time, in whole or in part. If, after termination of Treasury's funding commitment, we pay down the liquidation preference of each outstanding share of senior preferred stock in full, the shares will be deemed to have been redeemed as of the payment date.
The table below provides a summary of our senior preferred stock outstanding at
December 31, 2018
.
Table 11.3 - Senior Preferred Stock
|
(
In millions
, except initial liquidation preference price per share)
|
Shares
Authorized
|
Shares
Outstanding
|
Total
Par Value
|
Initial
Liquidation
Preference
Price per Share
|
Total
Liquidation
Preference
|
|||||||||
|
Non-draw Adjustment Dates:
|
||||||||||||||
|
September 8, 2008
|
1.00
|
|
1.00
|
|
|
$1.00
|
|
|
$1,000
|
|
|
$1,000
|
|
|
|
December 31, 2017
|
—
|
|
—
|
|
—
|
|
N/A
|
|
3,000
|
|
||||
|
Draw Dates:
|
||||||||||||||
|
November 24, 2008
|
—
|
|
—
|
|
—
|
|
N/A
|
|
13,800
|
|
||||
|
March 31, 2009
|
—
|
|
—
|
|
—
|
|
N/A
|
|
30,800
|
|
||||
|
June 30, 2009
|
—
|
|
—
|
|
—
|
|
N/A
|
|
6,100
|
|
||||
|
June 30, 2010
|
—
|
|
—
|
|
—
|
|
N/A
|
|
10,600
|
|
||||
|
September 30, 2010
|
—
|
|
—
|
|
—
|
|
N/A
|
|
1,800
|
|
||||
|
December 30, 2010
|
—
|
|
—
|
|
—
|
|
N/A
|
|
100
|
|
||||
|
March 31, 2011
|
—
|
|
—
|
|
—
|
|
N/A
|
|
500
|
|
||||
|
September 30, 2011
|
—
|
|
—
|
|
—
|
|
N/A
|
|
1,479
|
|
||||
|
December 30, 2011
|
—
|
|
—
|
|
—
|
|
N/A
|
|
5,992
|
|
||||
|
March 30, 2012
|
—
|
|
—
|
|
—
|
|
N/A
|
|
146
|
|
||||
|
June 29, 2012
|
—
|
|
—
|
|
—
|
|
N/A
|
|
19
|
|
||||
|
March 30, 2018
|
—
|
|
—
|
|
—
|
|
N/A
|
|
312
|
|
||||
|
Total, senior preferred stock
|
1.00
|
|
1.00
|
|
|
$1.00
|
|
|
$75,648
|
|
||||
Because we had a net worth deficit at December 31, 2017, FHFA, as Conservator, submitted a draw request for
$312 million
on our behalf to Treasury under the Purchase Agreement. We received this funding during 2018. We had positive net worth at March 31, 2018, June 30, 2018, September 30, 2018, and December 31, 2018; consequently, FHFA did not request a draw on our behalf in 2018. The aggregate liquidation preference of the senior preferred stock owned by Treasury was
$75.6 billion
and
$75.3 billion
as of December 31, 2018 and December 31, 2017, respectively.
Our quarterly senior preferred stock dividend requirement is the amount, if any, by which our Net Worth Amount at the end of the immediately preceding fiscal quarter exceeds the applicable Capital Reserve Amount of
$3.0 billion
. If, for any reason, we were not to pay our dividend requirement on the senior
|
FREDDIE MAC
| 2018 Form 10-K
|
289
|
|
|
Financial Statements
|
Notes to the Consolidated Financial Statements |
Note 11
|
preferred stock in full in any future period, the applicable Capital Reserve Amount would thereafter be zero. See
Note 2
for additional information.
Common Stock Warrant
Pursuant to the Purchase Agreement described in
Note 2
, on September 7, 2008, we issued a warrant to purchase common stock to Treasury, in partial consideration of Treasury's commitment to provide funds to us.
The warrant may be exercised in whole or in part at any time on or before September 7, 2028, by delivery to us of a notice of exercise, payment of the exercise price of
$0.00001
per share and the warrant. If the market price of one share of our common stock is greater than the exercise price, then, instead of paying the exercise price, Treasury may elect to receive shares equal to the value of the warrant (or portion thereof being canceled) pursuant to the formula specified in the warrant. Upon exercise of the warrant, Treasury may assign the right to receive the shares of common stock issuable upon exercise to any other person.
We account for the warrant in permanent equity. At issuance on September 7, 2008, we recognized the warrant at fair value, and we do not recognize subsequent changes in fair value while the warrant remains classified in equity. We recorded an aggregate fair value of
$2.3 billion
for the warrant as a component of additional paid-in-capital. We derived the fair value of the warrant using a modified Black-Scholes model. If the warrant is exercised, the stated value of the common stock issued will be reclassified to common stock on our consolidated balance sheets. The warrant was determined to be in-substance non-voting common stock, because the warrant's exercise price of
$0.00001
per share is considered non-substantive (compared to the market price of our common stock). As a result, the shares associated with the warrant are included in the computation of basic and diluted earnings (loss) per share. The weighted average shares of common stock outstanding for the years ended
December 31, 2018
, 2017, and 2016 included shares of common stock that would be issuable upon full exercise of the warrant issued to Treasury.
Preferred Stock
We have the option to redeem our preferred stock on specified dates, at their redemption price plus dividends accrued through the redemption date. However, without the consent of Treasury, we are restricted from making payments to purchase or redeem preferred stock as well as paying any preferred dividends, other than dividends on the senior preferred stock. All
24
classes of preferred stock are perpetual and non-cumulative, and carry no significant voting rights or rights to purchase additional Freddie Mac stock or securities. Costs incurred in connection with the issuance of preferred stock are charged to additional paid-in capital.
|
FREDDIE MAC
| 2018 Form 10-K
|
290
|
|
|
Financial Statements
|
Notes to the Consolidated Financial Statements |
Note 11
|
The table below provides a summary of our preferred stock outstanding at their redemption values at
December 31, 2018
.
Table 11.4 - Preferred Stock
|
(
In millions
, except redemption price per share)
|
Issue Date
|
Shares
Authorized
|
Shares
Outstanding
|
Total
Par Value
|
Redemption
Price per
Share
|
Total
Outstanding
Balance
|
Redeemable
On or After
|
OTCQB
Symbol
|
||||||||
|
Preferred stock:
|
|
|
|
|||||||||||||
|
1996 Variable-rate
(1)
|
April 26, 1996
|
5.00
|
|
5.00
|
|
|
$5.00
|
|
|
$50.00
|
|
|
$250
|
|
June 30, 2001
|
FMCCI
|
|
5.81%
|
October 27, 1997
|
3.00
|
|
3.00
|
|
3.00
|
|
50.00
|
|
150
|
|
October 27, 1998
|
(2)
|
|||
|
5%
|
March 23, 1998
|
8.00
|
|
8.00
|
|
8.00
|
|
50.00
|
|
400
|
|
March 31, 2003
|
FMCKK
|
|||
|
1998 Variable-rate
(3)
|
September 23 and 29, 1998
|
4.40
|
|
4.40
|
|
4.40
|
|
50.00
|
|
220
|
|
September 30, 2003
|
FMCCG
|
|||
|
5.10%
|
September 23, 1998
|
8.00
|
|
8.00
|
|
8.00
|
|
50.00
|
|
400
|
|
September 30, 2003
|
FMCCH
|
|||
|
5.30%
|
October 28, 1998
|
4.00
|
|
4.00
|
|
4.00
|
|
50.00
|
|
200
|
|
October 30, 2000
|
(2)
|
|||
|
5.10%
|
March 19, 1999
|
3.00
|
|
3.00
|
|
3.00
|
|
50.00
|
|
150
|
|
March 31, 2004
|
(2)
|
|||
|
5.79%
|
July 21, 1999
|
5.00
|
|
5.00
|
|
5.00
|
|
50.00
|
|
250
|
|
June 30, 2009
|
FMCCK
|
|||
|
1999 Variable-rate
(4)
|
November 5, 1999
|
5.75
|
|
5.75
|
|
5.75
|
|
50.00
|
|
287
|
|
December 31, 2004
|
FMCCL
|
|||
|
2001 Variable-rate
(5)
|
January 26, 2001
|
6.50
|
|
6.50
|
|
6.50
|
|
50.00
|
|
325
|
|
March 31, 2003
|
FMCCM
|
|||
|
2001 Variable-rate
(6)
|
March 23, 2001
|
4.60
|
|
4.60
|
|
4.60
|
|
50.00
|
|
230
|
|
March 31, 2003
|
FMCCN
|
|||
|
5.81%
|
March 23, 2001
|
3.45
|
|
3.45
|
|
3.45
|
|
50.00
|
|
173
|
|
March 31, 2011
|
FMCCO
|
|||
|
6%
|
May 30, 2001
|
3.45
|
|
3.45
|
|
3.45
|
|
50.00
|
|
173
|
|
June 30, 2006
|
FMCCP
|
|||
|
2001 Variable-rate
(7)
|
May 30, 2001
|
4.02
|
|
4.02
|
|
4.02
|
|
50.00
|
|
201
|
|
June 30, 2003
|
FMCCJ
|
|||
|
5.70%
|
October 30, 2001
|
6.00
|
|
6.00
|
|
6.00
|
|
50.00
|
|
300
|
|
December 31, 2006
|
FMCKP
|
|||
|
5.81%
|
January 29, 2002
|
6.00
|
|
6.00
|
|
6.00
|
|
50.00
|
|
300
|
|
March 31, 2007
|
(2)
|
|||
|
2006 Variable-rate
(8)
|
July 17, 2006
|
15.00
|
|
15.00
|
|
15.00
|
|
50.00
|
|
750
|
|
June 30, 2011
|
FMCCS
|
|||
|
6.42%
|
July 17, 2006
|
5.00
|
|
5.00
|
|
5.00
|
|
50.00
|
|
250
|
|
June 30, 2011
|
FMCCT
|
|||
|
5.90%
|
October 16, 2006
|
20.00
|
|
20.00
|
|
20.00
|
|
25.00
|
|
500
|
|
September 30, 2011
|
FMCKO
|
|||
|
5.57%
|
January 16, 2007
|
44.00
|
|
44.00
|
|
44.00
|
|
25.00
|
|
1,100
|
|
December 31, 2011
|
FMCKM
|
|||
|
5.66%
|
April 16, 2007
|
20.00
|
|
20.00
|
|
20.00
|
|
25.00
|
|
500
|
|
March 31, 2012
|
FMCKN
|
|||
|
6.02%
|
July 24, 2007
|
20.00
|
|
20.00
|
|
20.00
|
|
25.00
|
|
500
|
|
June 30, 2012
|
FMCKL
|
|||
|
6.55%
|
September 28, 2007
|
20.00
|
|
20.00
|
|
20.00
|
|
25.00
|
|
500
|
|
September 30, 2017
|
FMCKI
|
|||
|
2007 Fixed-to-floating rate
(9)
|
December 4, 2007
|
240.00
|
|
240.00
|
|
240.00
|
|
25.00
|
|
6,000
|
|
December 31, 2012
|
FMCKJ
|
|||
|
Total, preferred stock
|
464.17
|
|
464.17
|
|
|
$464.17
|
|
|
$14,109
|
|
||||||
|
(1)
|
Dividend rate resets quarterly and is equal to the sum of three-month LIBOR plus 1% divided by 1.377, and is capped at 9.00%.
|
|
(2)
|
Issued through private placement.
|
|
(3)
|
Dividend rate resets quarterly and is equal to the sum of three-month LIBOR plus 1% divided by 1.377, and is capped at 7.50%.
|
|
(4)
|
Dividend rate resets on January 1 every five years after January 1, 2005 based on a five-year Constant Maturity Treasury rate, and is capped at 11.00%.
Optional redemption on December 31, 2004 and on December 31 every five years thereafter.
|
|
(5)
|
Dividend rate resets on April 1 every two years after April 1, 2003 based on the two-year Constant Maturity Treasury rate plus 0.10%, and is capped at 11.00%.
Optional redemption on March 31, 2003 and on March 31 every two years thereafter.
|
|
(6)
|
Dividend rate resets on April 1 every year based on 12-month LIBOR minus 0.20%, and is capped at 11.00%.
Optional redemption on March 31, 2003 and on March 31 every year thereafter.
|
|
(7)
|
Dividend rate resets on July 1 every two years after July 1, 2003 based on the two-year Constant Maturity Treasury rate plus 0.20%, and is capped at 11.00%.
Optional redemption on June 30, 2003 and on June 30 every two years thereafter.
|
|
(8)
|
Dividend rate resets quarterly and is equal to the sum of three-month LIBOR plus 0.50% but not less than 4.00%.
|
|
(9)
|
Dividend rate is set at an annual fixed rate of 8.375% from December 4, 2007 through December 31, 2012. For the period beginning on or after January 1, 2013, dividend rate resets quarterly and is equal to the higher of: (a) the sum of three-month LIBOR plus 4.16% per annum or (b) 7.875% per annum. Optional redemption on December 31, 2012 and on December 31 every five years thereafter.
|
|
FREDDIE MAC
| 2018 Form 10-K
|
291
|
|
|
Financial Statements
|
Notes to the Consolidated Financial Statements |
Note 11
|
Stock-Based Compensation
Following the implementation of the conservatorship in September 2008, we suspended the operation of and/or ceased making grants under our stock-based compensation plans. Under the Purchase Agreement, we cannot issue any new options, rights to purchase, participations or other equity interests without Treasury's prior approval. However, grants outstanding as of the date of the Purchase Agreement remain in effect in accordance with their terms.
We did not repurchase or issue any of our common shares or non-cumulative preferred stock during 2018 and 2017, except for issuances of treasury stock as reported on our consolidated statements of equity relating to stock-based compensation granted prior to conservatorship. Common stock delivered under these stock-based compensation plans consists of treasury stock or shares acquired in market transactions on behalf of the participants. During 2018, the deferral period lapsed on
350
RSUs. At
December 31, 2018
,
1,053
RSUs remained outstanding. In addition, there were
41,160
shares of restricted stock outstanding at both
December 31, 2018
and December 31, 2017. At
December 31, 2018
,
no
stock options were outstanding.
Earnings Per Share
We have participating securities related to RSUs with dividend equivalent rights that receive dividends as declared on an equal basis with common shares but are not obligated to participate in undistributed net losses. These participating securities consist of vested RSUs that earn dividend equivalents at the same rate when and as declared on common stock.
Consequently, in accordance with accounting guidance, we use the "two-class" method of computing earnings per common share. The "two-class" method is an earnings allocation formula that determines earnings per share for common stock and participating securities based on dividends declared and participation rights in undistributed earnings.
Basic earnings per common share is computed as net income attributable to common stockholders divided by the weighted average common shares outstanding for the period. The weighted average common shares outstanding for the period includes the weighted average number of shares that are associated with the warrant for our common stock issued to Treasury pursuant to the Purchase Agreement. These shares are included since the warrant is unconditionally exercisable by the holder at a minimal cost.
Diluted earnings per common share is computed as net income attributable to common stockholders divided by the weighted average common shares outstanding during the period adjusted for the dilutive effect of common equivalent shares outstanding. For periods with net income attributable to common stockholders, the calculation includes the effect of the weighted-average of RSUs.
During periods in which a net loss attributable to common stockholders has been incurred, potential common equivalent shares outstanding are not included in the calculation because it would have an antidilutive effect.
For purposes of the earnings-per-share calculation, antidilutive potential common shares excluded from the computation of dilutive potential common shares were
0
,
0
, and
22,684
at
December 31, 2018
, December 31, 2017, and December 31, 2016, respectively.
|
FREDDIE MAC
| 2018 Form 10-K
|
292
|
|
|
Financial Statements
|
Notes to the Consolidated Financial Statements |
Note 11
|
Dividends and Dividend Restrictions
No
common dividends were declared in 2018 or 2017. During the three months ended March 31, 2018 and June 30, 2018, we did
no
t pay dividends, and during the three months ended September 30, 2018 and
December 31, 2018
, we paid dividends of
$1.6 billion
and
$2.6 billion
, respectively, in cash on the senior preferred stock at the direction of our Conservator. We did
no
t declare or pay dividends on any other series of Freddie Mac preferred stock outstanding during 2018.
Our payment of dividends is subject to the following restrictions:
n
Restrictions Relating to the Conservatorship
- The Conservator has prohibited us from paying any dividends on our common stock or on any series of our preferred stock (other than the senior preferred stock). FHFA has instructed our Board of Directors that it should consult with and obtain the approval of FHFA before taking actions involving dividends. In addition, FHFA has adopted a regulation prohibiting us from making capital distributions during conservatorship, except as authorized by the Director of FHFA.
n
Restrictions Under the Purchase Agreement
-
The Purchase Agreement prohibits us and any of our subsidiaries from declaring or paying any dividends on Freddie Mac equity securities (other than with respect to the senior preferred stock or warrant) without the prior written consent of Treasury.
n
Restrictions Under the GSE Act
-
Under the GSE Act, FHFA has authority to prohibit capital distributions, including payment of dividends, if we fail to meet applicable capital requirements. However, our capital requirements have been suspended during conservatorship.
n
Restrictions Under our Charter
- Without regard to our capital classification, we must obtain prior written approval of FHFA to make any capital distribution that would decrease total capital to an amount less than the risk-based capital level or that would decrease core capital to an amount less than the minimum capital level. As noted above, our capital requirements have been suspended during conservatorship.
n
Restrictions Relating to Preferred Stock
- Payment of dividends on our common stock is also subject to the prior payment of dividends on our
24
series of preferred stock and
one
series of senior preferred stock, representing an aggregate of
464,170,000
shares and
1,000,000
shares, respectively, outstanding as of December 31, 2018. Payment of dividends on all outstanding preferred stock, other than the senior preferred stock, is subject to the prior payment of dividends on the senior preferred stock. We paid dividends on the senior preferred stock during 2018 at the direction of the Conservator, as discussed in
the
Senior Preferred Stock
section above. We did not declare or pay dividends on any other series of preferred stock outstanding in 2018.
Delisting of Common Stock and Preferred Stock from NYSE
On July 8, 2010, we delisted our common and
20
previously listed classes of preferred stock from the NYSE pursuant to a directive by our Conservator.
Our common stock and the classes of preferred stock that were previously listed on the NYSE are traded exclusively in the OTCQB Marketplace. Shares of our common stock now trade under the ticker symbol
FMCC
. We expect that our common stock and the previously listed classes of preferred stock will continue to trade in the OTCQB Marketplace so long as market makers demonstrate an interest in trading the common and preferred stock.
|
FREDDIE MAC
| 2018 Form 10-K
|
293
|
|
|
Financial Statements
|
Notes to the Consolidated Financial Statements
|
Note 12
|
NOTE 12
Income Taxes
Income Tax Expense
Total income tax expense includes:
n
Current income tax expense, which represents the amount of federal tax currently payable to or receivable from the Internal Revenue Service, including interest and penalties and amounts accrued for unrecognized tax benefits, if any, and
n
Deferred income tax expense, which represents the net change in the deferred tax asset or liability balance during the year, including any change in the valuation allowance.
Income tax expense excludes the tax effects related to adjustments recorded to other comprehensive income, such as unrealized gains and losses on available-for-sale securities.
The table below presents the components of our federal income tax expense for 2018, 2017, and 2016. We are exempt from state and local income taxes.
Table 12.1 - Federal Income Tax Expense
|
|
Year Ended December 31,
|
|||||||||
|
(In millions)
|
2018
|
2017
|
2016
|
|||||||
|
Current income tax expense
|
|
($848
|
)
|
|
($3,436
|
)
|
|
($1,037
|
)
|
|
|
Deferred income tax expense
|
(1,391
|
)
|
(7,773
|
)
|
(2,787
|
)
|
||||
|
Total income tax expense
|
|
($2,239
|
)
|
|
($11,209
|
)
|
|
($3,824
|
)
|
|
Income tax expense decreased from 2017 to 2018 and increased from 2016 to 2017, primarily due to higher income tax expense in 2017 driven by the revaluation of the net deferred tax asset. The revaluation was required due to the enactment of the Tax Cuts and Jobs Act in 2017, which reduced the corporate income tax rate from
35%
to
21%
for tax years after 2017. Accounting rules required that we measure our net deferred tax asset using the reduced rate in the period in which the legislation was enacted. Therefore, income tax expense in 2017 reflected a
$5.4 billion
charge associated with the reduction in the net deferred tax asset.
|
FREDDIE MAC
| 2018 Form 10-K
|
294
|
|
|
Financial Statements
|
Notes to the Consolidated Financial Statements
|
Note 12
|
The table below presents the reconciliation between our federal statutory income tax rate and our effective tax rate for
2018
,
2017
, and
2016
.
Table 12.2 - Reconciliation of Federal Statutory Income Tax Rate to Effective Tax Rate
|
Year Ended December 31,
|
||||||||||||||||||
|
|
2018
|
2017
|
2016
|
|||||||||||||||
|
(Dollars in millions)
|
Amount
|
Percent
|
Amount
|
Percent
|
Amount
|
Percent
|
||||||||||||
|
Statutory corporate tax rate
|
|
($2,410
|
)
|
21.0
|
%
|
|
($5,892
|
)
|
35.0
|
%
|
|
($4,074
|
)
|
35.0
|
%
|
|||
|
Tax-exempt interest
|
19
|
|
(0.2
|
)
|
39
|
|
(0.2
|
)
|
36
|
|
(0.3
|
)
|
||||||
|
Tax credits
|
56
|
|
(0.5
|
)
|
135
|
|
(0.8
|
)
|
243
|
|
(2.1
|
)
|
||||||
|
Valuation allowance
|
(13
|
)
|
0.1
|
|
(54
|
)
|
0.3
|
|
—
|
|
—
|
|
||||||
|
Revaluation of deferred tax asset to enacted rate
|
184
|
|
(1.6
|
)
|
(5,405
|
)
|
32.1
|
|
—
|
|
—
|
|
||||||
|
Other
|
(75
|
)
|
0.7
|
|
(32
|
)
|
0.2
|
|
(29
|
)
|
0.3
|
|
||||||
|
Effective tax rate
|
|
($2,239
|
)
|
19.5
|
%
|
|
($11,209
|
)
|
66.6
|
%
|
|
($3,824
|
)
|
32.9
|
%
|
|||
Deferred Tax Assets, Net
We use the asset and liability method of accounting for income taxes for financial reporting purposes. Under this method, deferred tax assets and liabilities are recognized based upon the expected future tax consequences of existing temporary differences between the financial reporting and the tax reporting basis of assets and liabilities using enacted statutory tax rates as well as tax net operating loss and tax credit carryforwards, if any. To the extent tax laws change, deferred tax assets and liabilities are adjusted in the period that the tax change is enacted. The realization of our net deferred tax assets is dependent upon the generation of sufficient taxable income.
The table below presents the balance of significant deferred tax assets and liabilities at December 31, 2018 and December 31, 2017. The valuation allowance relates to capital loss carryforwards included in Other Items, net that we expect to expire unused.
Table 12.3 - Deferred Tax Assets and Liabilities
|
Year Ended December 31,
|
|||||||
|
(In millions)
|
2018
|
2017
|
|||||
|
Deferred tax assets:
|
|||||||
|
Deferred fees
|
|
$4,424
|
|
|
$4,679
|
|
|
|
Basis differences related to derivative instruments
|
1,767
|
|
2,041
|
|
|||
|
Credit related items and allowance for loan losses
|
177
|
|
291
|
|
|||
|
Basis differences related to assets held for investment
|
569
|
|
1,288
|
|
|||
|
LIHTC partnerships and AMT credit carryforward
|
—
|
|
—
|
|
|||
|
Other items, net
|
20
|
|
55
|
|
|||
|
Total deferred tax assets
|
6,957
|
|
8,354
|
|
|||
|
Deferred tax liabilities:
|
|||||||
|
Unrealized gains related to available-for-sale securities
|
(23
|
)
|
(214
|
)
|
|||
|
Total deferred tax liabilities
|
(23
|
)
|
(214
|
)
|
|||
|
Valuation allowance
|
(46
|
)
|
(33
|
)
|
|||
|
Deferred tax assets, net
|
|
$6,888
|
|
|
$8,107
|
|
|
Valuation Allowance
|
FREDDIE MAC
| 2018 Form 10-K
|
295
|
|
|
Financial Statements
|
Notes to the Consolidated Financial Statements
|
Note 12
|
A valuation allowance is recorded to reduce the net deferred tax asset when it is more likely than not that all or part of our tax benefits will not be realized. On a quarterly basis, we determine whether a valuation allowance is necessary. In doing so, we consider all evidence available, both positive and negative, in determining whether, based on the weight of the evidence, it is more likely than not that the net deferred tax asset will be realized.
We are not permitted to consider in our analysis the impacts proposed legislation may have on our business because the timing and certainty of those actions are unknown and beyond our control.
Based on all positive and negative evidence available at December 31, 2018, we determined that it is more likely than not that our net deferred tax assets, except for the deferred tax asset related to our capital loss carryforwards, will be realized. A valuation allowance of
$46 million
has been recorded against our capital loss carryforward deferred tax asset.
Unrecognized Tax Benefits and IRS Examinations
We recognize a tax position taken or expected to be taken (and any associated interest and penalties) if it is more likely than not that it will be sustained upon examination, including resolution of any related appeals or litigation processes, based on the technical merits of the position. We measure the tax position at the largest amount of benefit that is greater than 50% likely of being realized upon ultimate settlement. We evaluated all income tax positions and determined that there were
no
uncertain tax positions that required reserves as of
December 31, 2018
.
|
FREDDIE MAC
| 2018 Form 10-K
|
296
|
|
|
Financial Statements
|
Notes to the Consolidated Financial Statements |
Note 13
|
NOTE 13
Segment Reporting
We have
three
reportable segments, which are based on the type of business activities each performs - Single-family Guarantee, Multifamily, and Capital Markets. The chart below provides a summary of our three reportable segments and the All Other category.
|
Segment/Category
|
Description
|
Financial Performance Measurement Basis
|
|
|
Single-family Guarantee
|
The Single-family Guarantee segment reflects results from our purchase of single-family loans, our guarantee of principal and interest payments on securitized mortgage loans in exchange for guarantee fees, and the management of single-family mortgage credit risk. The Single-family Guarantee segment manages single-family mortgage credit risk through risk transfer transactions, performing loss mitigation activities, and managing foreclosure and REO activities.
Segment Earnings for this segment consist primarily of guarantee fee income, less credit-related expenses, credit risk transfer expenses, administrative expenses, allocated funding and hedging costs, and allocated reinvestment income.
|
•
|
Contribution to GAAP net income (loss)
|
|
Multifamily
|
The Multifamily segment reflects results from our purchase, sale, securitization, and guarantee of multifamily loans and securities, our investments in those loans and securities, and the management of multifamily mortgage credit risk and market spread risk. Our primary business model is to purchase multifamily loans for aggregation and then securitization through issuance of multifamily K Certificates and SB Certificates. We also issue and guarantee other risk transfer securitization products, issue other risk transfer products, and provide other guarantee activities.
Segment Earnings for this segment consist primarily of returns on assets related to multifamily investment activities and guarantee fee income, less credit-related expenses, administrative expenses, and allocated funding costs.
|
•
|
Contribution to GAAP comprehensive income (loss)
|
|
Capital Markets
|
The Capital Markets segment reflects results from managing the company's mortgage-related investments portfolio (excluding Multifamily segment investments, single-family seriously delinquent loans, and the credit risk of single-family performing and reperforming loans), treasury function, single-family securitization activities, and interest-rate risk for the company.
Segment Earnings for this segment consist primarily of the returns on these investments, less the related funding, hedging, and administrative expenses.
|
•
|
Contribution to GAAP comprehensive income (loss)
|
|
All Other
|
The All Other category consists of material corporate-level activities that are infrequent in nature and based on decisions outside the control of the management of our reportable segments.
|
N/A
|
|
|
FREDDIE MAC
| 2018 Form 10-K
|
297
|
|
|
Financial Statements
|
Notes to the Consolidated Financial Statements |
Note 13
|
Segment Earnings
We present Segment Earnings by reclassifying certain credit guarantee-related activities and investment-related activities between various line items on our GAAP consolidated statements of comprehensive income and allocating certain revenues and expenses, including certain returns on assets, funding and hedging costs and administrative expenses, to our three reportable segments.
We do not consider our assets by segment when evaluating segment performance or allocating resources. We operate our business in the United States and its territories, and accordingly, we generate no revenue from and have no long-lived assets, other than financial instruments, in geographic locations other than the United States and its territories.
We evaluate segment performance and allocate resources based on a Segment Earnings approach, subject to the conduct of our business under the direction of the Conservator. See
Note 2
for information about the conservatorship.
During 4Q 2018, we changed how we calculate certain components of our Segment Earnings for our Single-family Guarantee and Capital Markets segments. The purpose of this change is to more closely align Segment Earnings results relative to the business operations and to better reflect how management evaluates the Single-family Guarantee and Capital Markets segments. Prior period results have been revised to conform to the current period presentation. Changes were made to:
|
n
|
Share the economic return on loans acquired through our cash loan purchase program between the Capital Markets segment and the Single-family Guarantee segment. Previously, the Capital Markets segment recognized the full benefit from the cash loan purchase program. This change resulted in a decrease to other non-interest income for our Capital Markets segment and an increase to other non-interest income for our Single-family Guarantee segment of
$87 million
and
$89 million
for 2017 and 2016, respectively.
|
|
n
|
Transfer the short-term interest earned on cash received related to delivery fees and buy-down fees on single-family loans from the Capital Markets segment to the Single-family Guarantee segment. This change resulted in a decrease to net interest income for our Capital Markets segment and an increase to guarantee fee income for our Single-family Guarantee segment of
$110 million
and
$38 million
for 2017 and 2016, respectively.
|
|
n
|
Recognize buy-up/buy-down fees on securitized loans acquired through our cash loan purchase program similar to the way we recognize buy-up/buy-down fees on loans purchased via our guarantor swap transactions. Buy-up fees and associated amortization are recognized in the Capital Markets segment, rather than the Single-family Guarantee segment, and buy-down fees and associated amortization are recognized in the Single-family Guarantee segment, rather than the Capital Markets segment. This change resulted in:
|
|
l
|
An increase to guarantee fee income for our Single-family Guarantee segment of
$146 million
, a decrease to other non-interest income for our Capital Markets segment of
$201 million
and an increase to net interest income for our Capital Markets segment of
$55 million
for 2017 and
|
|
l
|
An increase to guarantee fee income for our Single-family Guarantee segment of
$227 million
, a decrease to other non-interest income for our Capital Markets segment of
$225 million
and a decrease to net interest income for our Capital Markets segment of
$2 million
for 2016.
|
|
FREDDIE MAC
| 2018 Form 10-K
|
298
|
|
|
Financial Statements
|
Notes to the Consolidated Financial Statements |
Note 13
|
The sum of Segment Earnings for each segment and the All Other category equals GAAP net income (loss). Likewise, the sum of comprehensive income (loss) for each segment and the All Other category equals GAAP comprehensive income (loss). However, the accounting principles we apply to present certain financial statement line items in Segment Earnings for our reportable segments differ significantly from those applied in preparing the comparable line items on our consolidated financial statements prepared in accordance with GAAP in order to reflect the business activities each segment performs. The significant reclassifications are discussed below. Many of the reclassifications and allocations described below relate to the amendments to the accounting guidance for transfers of financial assets and consolidation of VIEs, which we adopted effective January 1, 2010. These amendments require us to consolidate our single-family PC trusts and certain other VIEs. Due to the adoption of this guidance, the results of our operating segments from a GAAP perspective do not reflect how the Segments are managed.
Credit Activity-Related Reclassifications
Certain credit activity-related income and costs are included in Segment Earnings guarantee fee income or provision for credit losses.
|
n
|
Net guarantee fees, including upfront fee amortization and implied guarantee fee income related to unsecuritized loans held in the mortgage-related investments portfolio, are reclassified in Segment Earnings from net interest income to guarantee fee income.
|
|
n
|
Short-term returns on cash received related to certain upfront fees on single-family loans are reclassified in Segment Earnings from net interest income to guarantee fee income.
|
|
n
|
The revenue and expense related to the 10 basis point increase which was legislated in the Temporary Payroll Tax Cut Continuation Act of 2011 are netted within guarantee fee income.
|
Investment Activity-Related Reclassifications
We move certain items into or out of net interest income so that, on a Segment Earnings basis, net interest income reflects how we measure the effective yield earned on securities held in our mortgage investments portfolio and our other investments portfolio.
We use derivatives extensively in our investment activity. The reclassifications described below allow us to reflect, in Segment Earnings net interest income, the costs associated with this use of derivatives.
|
n
|
The accrual of periodic cash settlements of derivatives recorded within derivative gains (losses) is reclassified in Segment Earnings from derivatives gains (losses) into net interest income to fully reflect the periodic cost associated with the protection provided by these contracts. Beginning in 4Q 2017, the accrual of periodic cash settlements of derivatives in qualifying hedge relationships is recorded directly to net interest income due to the adoption of amended hedge accounting guidance. As a result, only the accrual of periodic cash settlements of derivatives while not in qualifying hedge relationships is reclassified for Segment Earnings.
|
|
n
|
For Segment Earnings, changes in the fair value of the hedging instrument and changes in the fair value of the hedged item attributable to the risk being hedged are recorded in other income. Beginning in 4Q 2017, for qualifying hedge relationships, changes in the fair value of the derivative hedging instrument and changes in fair value of the hedged item attributable to the risk being hedged are reclassified in Segment Earnings from net interest income to other income. For periods
|
|
FREDDIE MAC
| 2018 Form 10-K
|
299
|
|
|
Financial Statements
|
Notes to the Consolidated Financial Statements |
Note 13
|
prior to the adoption of amended hedge accounting guidance in 4Q 2017, these amounts were recorded directly to other income. As a result, no reclassification for Segment Earnings was necessary.
Amortization related to certain items is not relevant to how we measure the effective yield earned on the securities held in our investments portfolios. Therefore, as described below, we reclassify the following items in Segment Earnings from net interest income to non-interest income:
|
n
|
Amortization related to derivative commitment basis adjustments associated with mortgage-related and non-mortgage-related securities.
|
|
n
|
Amortization related to accretion of other-than-temporary impairments on available-for-sale securities.
|
|
n
|
Amortization of discounts on loans purchased with deteriorated credit quality that are on accrual status.
|
|
n
|
Amortization related to premiums and discounts, including non-cash premiums and discounts, on single-family loans in trusts and on the associated consolidated PCs.
|
|
n
|
Amortization related to premiums and discounts associated with PCs issued by our consolidated trusts that we previously held and subsequently transferred to third parties.
|
Certain debt-related costs are not relevant to how we measure the effective yield earned on the securities held in our investments portfolio. Therefore, as described below, we reclassify the following items in Segment Earnings:
|
n
|
Costs associated with STACR debt note expenses are reclassified from net interest income to other non-interest expense.
|
|
n
|
Internally allocated costs associated with the refinancing of debt related to Multifamily segment held-for-investment loans which we securitized are reclassified from net interest income to other non-interest income.
|
Mortgage Loan Classification-Related Reclassifications
In order to better reflect how we manage our Single-family Guarantee segment, we reclassify the impacts related to single-family mortgage loans held-for-sale from benefit (provision) for credit losses, mortgage loans gains (losses), and other non-interest expense into other non-interest income (loss).
Segment Allocations
The results of each reportable segment include directly attributable revenues and expenses. Administrative expenses that are not directly attributable to a segment are allocated to our segments using various methodologies, depending on the nature of the expense. Net interest income for each segment includes allocated debt funding and hedging costs related to certain assets of each segment. Funding and interest-rate risk is consolidated and primarily managed by the Capital Markets segment for all other business segments. In connection with this activity, the Capital Markets segment transfers costs or income to the other segments. The actual costs or income may vary relative to these intra-company transfers. In addition, the financial statement variability associated with the use of derivatives to hedge certain assets outside the Capital Markets segment is not fully allocated to other segments. These allocations do not include the effects of dividends paid on our senior preferred stock.
|
FREDDIE MAC
| 2018 Form 10-K
|
300
|
|
|
Financial Statements
|
Notes to the Consolidated Financial Statements |
Note 13
|
The table below presents Segment Earnings by segment.
Table 13.1 - Segment Earnings
|
|
Year Ended December 31,
|
|||||||||
|
(In millions)
|
2018
|
2017
|
2016
|
|||||||
|
Segment Earnings (loss), net of taxes:
|
||||||||||
|
Single-family Guarantee
|
|
$3,908
|
|
|
$2,759
|
|
|
$2,437
|
|
|
|
Multifamily
|
1,319
|
|
2,014
|
|
1,818
|
|
||||
|
Capital Markets
|
4,008
|
|
6,257
|
|
3,560
|
|
||||
|
All Other
|
—
|
|
(5,405
|
)
|
—
|
|
||||
|
Total Segment Earnings, net of taxes
|
9,235
|
|
5,625
|
|
7,815
|
|
||||
|
Net income (loss)
|
|
$9,235
|
|
|
$5,625
|
|
|
$7,815
|
|
|
|
Comprehensive income (loss) of segments:
|
||||||||||
|
Single-family Guarantee
|
|
$3,905
|
|
|
$2,799
|
|
|
$2,428
|
|
|
|
Multifamily
|
1,236
|
|
1,937
|
|
1,582
|
|
||||
|
Capital Markets
|
3,481
|
|
6,227
|
|
3,108
|
|
||||
|
All Other
|
—
|
|
(5,405
|
)
|
—
|
|
||||
|
Comprehensive income (loss) of segments
|
8,622
|
|
5,558
|
|
7,118
|
|
||||
|
Comprehensive income (loss)
|
|
$8,622
|
|
|
$5,558
|
|
|
$7,118
|
|
|
|
FREDDIE MAC
| 2018 Form 10-K
|
301
|
|
|
Financial Statements
|
Notes to the Consolidated Financial Statements |
Note 13
|
The table below presents detailed reconciliations between our GAAP financial statements and Segment Earnings for our reportable segments and All Other.
Table 13.2 - Segment Earnings and Reconciliations to GAAP Financial Statements
|
|
Year Ended December 31, 2018
|
|||||||||||||||||||||
|
|
Single-family
Guarantee
|
Multifamily
|
Capital Markets
|
All
Other
|
Total Segment
Earnings (Loss)
|
Reclassifications
|
Total per
Consolidated
Statements of
Comprehensive
Income
|
|||||||||||||||
|
(In millions)
|
||||||||||||||||||||||
|
Net interest income
|
|
$—
|
|
|
$1,096
|
|
|
$3,217
|
|
|
$—
|
|
|
$4,313
|
|
|
$7,708
|
|
|
$12,021
|
|
|
|
Guarantee fee income
|
6,570
|
|
817
|
|
—
|
|
—
|
|
7,387
|
|
(6,576
|
)
|
811
|
|
||||||||
|
Benefit (provision) for credit losses
|
522
|
|
24
|
|
—
|
|
—
|
|
546
|
|
190
|
|
736
|
|
||||||||
|
Mortgage loans gains (losses)
|
—
|
|
33
|
|
—
|
|
—
|
|
33
|
|
691
|
|
724
|
|
||||||||
|
Investment securities gains (losses)
|
—
|
|
(441
|
)
|
(102
|
)
|
—
|
|
(543
|
)
|
(152
|
)
|
(695
|
)
|
||||||||
|
Debt gains (losses)
|
165
|
|
54
|
|
531
|
|
—
|
|
750
|
|
(30
|
)
|
720
|
|
||||||||
|
Derivative gains (losses)
|
9
|
|
353
|
|
1,314
|
|
—
|
|
1,676
|
|
(406
|
)
|
1,270
|
|
||||||||
|
Other non-interest income
|
905
|
|
191
|
|
400
|
|
—
|
|
1,496
|
|
(782
|
)
|
714
|
|
||||||||
|
Administrative expense
|
(1,491
|
)
|
(437
|
)
|
(365
|
)
|
—
|
|
(2,293
|
)
|
—
|
|
(2,293
|
)
|
||||||||
|
REO operations (expense) income
|
(189
|
)
|
1
|
|
—
|
|
—
|
|
(188
|
)
|
19
|
|
(169
|
)
|
||||||||
|
Other non-interest (expense) income
|
(1,639
|
)
|
(53
|
)
|
(11
|
)
|
—
|
|
(1,703
|
)
|
(662
|
)
|
(2,365
|
)
|
||||||||
|
Income tax (expense) benefit
|
(944
|
)
|
(319
|
)
|
(976
|
)
|
—
|
|
(2,239
|
)
|
—
|
|
(2,239
|
)
|
||||||||
|
Net income (loss)
|
3,908
|
|
1,319
|
|
4,008
|
|
—
|
|
9,235
|
|
—
|
|
9,235
|
|
||||||||
|
Changes in unrealized gains (losses) related to available-for-sale securities
|
—
|
|
(82
|
)
|
(640
|
)
|
—
|
|
(722
|
)
|
—
|
|
(722
|
)
|
||||||||
|
Changes in unrealized gains (losses) related to cash flow hedge relationships
|
—
|
|
—
|
|
114
|
|
—
|
|
114
|
|
—
|
|
114
|
|
||||||||
|
Changes in defined benefit plans
|
(3
|
)
|
(1
|
)
|
(1
|
)
|
—
|
|
(5
|
)
|
—
|
|
(5
|
)
|
||||||||
|
Total other comprehensive income (loss), net of taxes
|
(3
|
)
|
(83
|
)
|
(527
|
)
|
—
|
|
(613
|
)
|
—
|
|
(613
|
)
|
||||||||
|
Comprehensive income (loss)
|
|
$3,905
|
|
|
$1,236
|
|
|
$3,481
|
|
|
$—
|
|
|
$8,622
|
|
|
$—
|
|
|
$8,622
|
|
|
|
FREDDIE MAC
| 2018 Form 10-K
|
302
|
|
|
Financial Statements
|
Notes to the Consolidated Financial Statements |
Note 13
|
|
|
Year Ended December 31, 2017
|
|||||||||||||||||||||
|
|
Single-family
Guarantee
|
Multifamily
|
Capital Markets
|
All
Other
|
Total Segment
Earnings (Loss)
|
Reclassifications
|
Total per
Consolidated
Statements of
Comprehensive
Income
|
|||||||||||||||
|
(In millions)
|
||||||||||||||||||||||
|
Net interest income
|
|
$—
|
|
|
$1,206
|
|
|
$3,279
|
|
|
$—
|
|
|
$4,485
|
|
|
$9,679
|
|
|
$14,164
|
|
|
|
Guarantee fee income
|
6,350
|
|
676
|
|
—
|
|
—
|
|
7,026
|
|
(6,364
|
)
|
662
|
|
||||||||
|
Benefit (provision) for credit losses
|
(770
|
)
|
(13
|
)
|
—
|
|
—
|
|
(783
|
)
|
867
|
|
84
|
|
||||||||
|
Mortgage loans gains (losses)
|
—
|
|
1,096
|
|
—
|
|
—
|
|
1,096
|
|
930
|
|
2,026
|
|
||||||||
|
Investment securities gains (losses)
|
—
|
|
237
|
|
1,048
|
|
—
|
|
1,285
|
|
(249
|
)
|
1,036
|
|
||||||||
|
Debt gains (losses)
|
(208
|
)
|
(10
|
)
|
437
|
|
—
|
|
219
|
|
(68
|
)
|
151
|
|
||||||||
|
Derivative gains (losses)
|
(37
|
)
|
181
|
|
(587
|
)
|
—
|
|
(443
|
)
|
(1,545
|
)
|
(1,988
|
)
|
||||||||
|
Other non-interest income
|
1,838
|
|
162
|
|
5,788
|
|
—
|
|
7,788
|
|
(2,806
|
)
|
4,982
|
|
||||||||
|
Administrative expense
|
(1,381
|
)
|
(395
|
)
|
(330
|
)
|
—
|
|
(2,106
|
)
|
—
|
|
(2,106
|
)
|
||||||||
|
REO operations (expense) income
|
(203
|
)
|
—
|
|
—
|
|
—
|
|
(203
|
)
|
14
|
|
(189
|
)
|
||||||||
|
Other non-interest (expense) income
|
(1,382
|
)
|
(66
|
)
|
(82
|
)
|
—
|
|
(1,530
|
)
|
(458
|
)
|
(1,988
|
)
|
||||||||
|
Income tax expense
|
(1,448
|
)
|
(1,060
|
)
|
(3,296
|
)
|
(5,405
|
)
|
(11,209
|
)
|
—
|
|
(11,209
|
)
|
||||||||
|
Net income (loss)
|
2,759
|
|
2,014
|
|
6,257
|
|
(5,405
|
)
|
5,625
|
|
—
|
|
5,625
|
|
||||||||
|
Changes in unrealized gains (losses) related to available-for-sale securities
|
—
|
|
(86
|
)
|
(167
|
)
|
—
|
|
(253
|
)
|
—
|
|
(253
|
)
|
||||||||
|
Changes in unrealized gains (losses) related to cash flow hedge relationships
|
—
|
|
—
|
|
124
|
|
—
|
|
124
|
|
—
|
|
124
|
|
||||||||
|
Changes in defined benefit plans
|
40
|
|
9
|
|
13
|
|
—
|
|
62
|
|
—
|
|
62
|
|
||||||||
|
Total other comprehensive income (loss), net of taxes
|
40
|
|
(77
|
)
|
(30
|
)
|
—
|
|
(67
|
)
|
—
|
|
(67
|
)
|
||||||||
|
Comprehensive income (loss)
|
|
$2,799
|
|
|
$1,937
|
|
|
$6,227
|
|
|
($5,405
|
)
|
|
$5,558
|
|
|
$—
|
|
|
$5,558
|
|
|
|
|
Year Ended December 31, 2016
|
|||||||||||||||||||||
|
|
Single-family
Guarantee
|
Multifamily
|
Capital Markets
|
All
Other
|
Total Segment
Earnings (Loss)
|
Reclassifications
|
Total per
Consolidated
Statements of
Comprehensive
Income
|
|||||||||||||||
|
(In millions)
|
||||||||||||||||||||||
|
Net interest income
|
|
$—
|
|
|
$1,022
|
|
|
$3,736
|
|
|
$—
|
|
|
$4,758
|
|
|
$9,621
|
|
|
$14,379
|
|
|
|
Guarantee fee income
|
6,356
|
|
511
|
|
—
|
|
—
|
|
6,867
|
|
(6,354
|
)
|
513
|
|
||||||||
|
Benefit (provision) for credit losses
|
(481
|
)
|
22
|
|
—
|
|
—
|
|
(459
|
)
|
1,262
|
|
803
|
|
||||||||
|
Mortgage loans gains (losses)
|
—
|
|
972
|
|
—
|
|
—
|
|
972
|
|
(772
|
)
|
200
|
|
||||||||
|
Investment securities gains (losses)
|
—
|
|
28
|
|
165
|
|
—
|
|
193
|
|
(462
|
)
|
(269
|
)
|
||||||||
|
Debt gains (losses)
|
(322
|
)
|
(53
|
)
|
77
|
|
—
|
|
(298
|
)
|
(175
|
)
|
(473
|
)
|
||||||||
|
Derivative gains (losses)
|
(69
|
)
|
407
|
|
1,151
|
|
—
|
|
1,489
|
|
(1,763
|
)
|
(274
|
)
|
||||||||
|
Other non-interest income
|
928
|
|
219
|
|
481
|
|
—
|
|
1,628
|
|
(825
|
)
|
803
|
|
||||||||
|
Administrative expense
|
(1,323
|
)
|
(362
|
)
|
(320
|
)
|
—
|
|
(2,005
|
)
|
—
|
|
(2,005
|
)
|
||||||||
|
REO operations (expense) income
|
(298
|
)
|
—
|
|
—
|
|
—
|
|
(298
|
)
|
11
|
|
(287
|
)
|
||||||||
|
Other non-interest (expense) income
|
(1,169
|
)
|
(58
|
)
|
19
|
|
—
|
|
(1,208
|
)
|
(543
|
)
|
(1,751
|
)
|
||||||||
|
Income tax expense
|
(1,185
|
)
|
(890
|
)
|
(1,749
|
)
|
—
|
|
(3,824
|
)
|
—
|
|
(3,824
|
)
|
||||||||
|
Net income (loss)
|
2,437
|
|
1,818
|
|
3,560
|
|
—
|
|
7,815
|
|
—
|
|
7,815
|
|
||||||||
|
Changes in unrealized gains (losses) related to available-for-sale securities
|
—
|
|
(234
|
)
|
(591
|
)
|
—
|
|
(825
|
)
|
—
|
|
(825
|
)
|
||||||||
|
Changes in unrealized gains (losses) related to cash flow hedge relationships
|
—
|
|
—
|
|
141
|
|
—
|
|
141
|
|
—
|
|
141
|
|
||||||||
|
Changes in defined benefit plans
|
(9
|
)
|
(2
|
)
|
(2
|
)
|
—
|
|
(13
|
)
|
—
|
|
(13
|
)
|
||||||||
|
Total other comprehensive income (loss), net of taxes
|
(9
|
)
|
(236
|
)
|
(452
|
)
|
—
|
|
(697
|
)
|
—
|
|
(697
|
)
|
||||||||
|
Comprehensive income (loss)
|
|
$2,428
|
|
|
$1,582
|
|
|
$3,108
|
|
|
$—
|
|
|
$7,118
|
|
|
$—
|
|
|
$7,118
|
|
|
|
FREDDIE MAC
| 2018 Form 10-K
|
303
|
|
|
Financial Statements
|
Notes to the Consolidated Financial Statements |
Note 14
|
NOTE 14
Concentration of Credit and Other Risks
Concentrations of credit risk may arise when we do business with a number of customers or counterparties that engage in similar activities or have similar economic characteristics that make them vulnerable in similar ways to changes in industry conditions, which could affect their ability to meet their contractual obligations. Concentrations of credit risk may also arise when there are a limited number of counterparties in a certain industry. Based on our assessment of business conditions that could affect our financial results, we have determined that concentrations of credit risk exist among certain borrowers (including geographic concentrations and loans with certain higher risk characteristics), loan sellers and servicers, mortgage insurers, cash and other investment counterparties, and non-agency mortgage-related security issuers. In the sections below, we discuss our concentration of credit risk for each of the groups to which we are exposed. For a discussion of our derivative counterparties as well as related master netting, and collateral agreements, see
Note 10
.
Single-Family Credit Guarantee Portfolio
Regional economic conditions may affect a borrower's ability to repay his or her loan and/or the property value underlying the loan. Geographic concentrations increase the exposure of our portfolio to changes in credit risk. Single-family borrowers are primarily affected by home prices, unemployment rates, and interest rates.
The table below summarizes the concentration by loan portfolio and geographic area of the approximately
$1.9 trillion
and
$1.8 trillion
UPB of our single-family credit guarantee portfolio at
December 31, 2018
and December 31,
2017
, respectively. See
Note 4
and
Note 7
for more information about credit risk associated with loans and mortgage-related securities that we hold or guarantee.
|
FREDDIE MAC
| 2018 Form 10-K
|
304
|
|
|
Financial Statements
|
Notes to the Consolidated Financial Statements |
Note 14
|
Table 14.1 - Concentration of Credit Risk of Our Single-Family Credit Guarantee Portfolio
|
December 31, 2018
|
December 31, 2017
|
Percent of Credit Losses
|
|||||||||||||
|
|
Percentage of
Portfolio
|
Serious
Delinquency
Rate
|
Percentage of
Portfolio
|
Serious
Delinquency
Rate
|
2018
|
2017
|
|||||||||
|
Core single-family loan portfolio
|
82
|
%
|
0.22
|
%
|
78
|
%
|
0.35
|
%
|
10
|
%
|
3
|
%
|
|||
|
Legacy and relief refinance single-family loan portfolio
|
18
|
|
1.93
|
|
22
|
|
2.59
|
|
90
|
|
97
|
|
|||
|
Total
|
100
|
%
|
0.69
|
|
100
|
%
|
1.08
|
|
100
|
%
|
100
|
%
|
|||
|
Region
(1)
|
|||||||||||||||
|
West
|
30
|
%
|
0.38
|
|
30
|
%
|
0.47
|
|
17
|
%
|
27
|
%
|
|||
|
Northeast
|
24
|
|
0.96
|
|
25
|
|
1.24
|
|
39
|
|
34
|
|
|||
|
North Central
|
16
|
|
0.63
|
|
16
|
|
0.81
|
|
19
|
|
15
|
|
|||
|
Southeast
|
16
|
|
0.90
|
|
16
|
|
1.95
|
|
18
|
|
20
|
|
|||
|
Southwest
|
14
|
|
0.57
|
|
13
|
|
0.98
|
|
7
|
|
4
|
|
|||
|
Total
|
100
|
%
|
0.69
|
|
100
|
%
|
1.08
|
|
100
|
%
|
100
|
%
|
|||
|
State
(2)
|
|||||||||||||||
|
California
|
18
|
%
|
0.35
|
|
18
|
%
|
0.41
|
|
11
|
%
|
18
|
%
|
|||
|
New York
|
5
|
|
1.37
|
|
5
|
|
1.74
|
|
11
|
|
9
|
|
|||
|
Florida
|
6
|
|
1.01
|
|
6
|
|
3.33
|
|
10
|
|
13
|
|
|||
|
New Jersey
|
3
|
|
1.24
|
|
3
|
|
1.78
|
|
9
|
|
9
|
|
|||
|
Illinois
|
5
|
|
0.86
|
|
5
|
|
1.13
|
|
9
|
|
9
|
|
|||
|
All other
|
63
|
|
0.64
|
|
63
|
|
0.91
|
|
50
|
|
42
|
|
|||
|
Total
|
100
|
%
|
0.69
|
%
|
100
|
%
|
1.08
|
%
|
100
|
%
|
100
|
%
|
|||
|
(1)
|
Region designation: West (AK, AZ, CA, GU, HI, ID, MT, NV, OR, UT, WA); Northeast (CT, DE, DC, MA, ME, MD, NH, NJ, NY, PA, RI, VT, VA, WV); North Central (IL, IN, IA, MI, MN, ND, OH, SD, WI); Southeast (AL, FL, GA, KY, MS, NC, PR, SC, TN, VI); Southwest (AR, CO, KS, LA, MO, NE, NM, OK, TX, WY).
|
|
(2)
|
States presented based on those with the highest percentage of credit losses during the year ended
December 31, 2018
.
|
The REO balance, net at
December 31, 2018
and December 31,
2017
associated with single-family properties was
$0.8 billion
and
$0.9 billion
, respectively, and the balance associated with multifamily properties was
$0 million
and
$6 million
, respectively. Our single-family REO inventory consisted of
7,100
properties and
8,299
properties at
December 31, 2018
and December 31,
2017
, respectively. Although the average length of the foreclosure process has been trending downward in recent years for some jurisdictions, it remained elevated in others, particularly states with a judicial foreclosure process, which extends the time it takes for loans to be foreclosed upon and the underlying property to transition to REO.
Credit Performance of Certain Higher-Risk Single-Family Loan Categories
Participants in the mortgage market have characterized single-family loans based upon their overall credit quality at the time of origination, including as prime or subprime. Mortgage market participants have classified single-family loans as Alt-A if these loans have credit characteristics that range between their prime and subprime categories, if they are underwritten with lower or alternative income or asset documentation requirements compared to a full documentation loan, or both. Although we discontinued new purchases of loans with lower documentation standards beginning March 1, 2009, we continued to purchase certain amounts of these loans in cases where the loan was either:
|
n
|
Purchased pursuant to a previously issued other mortgage-related guarantee;
|
|
n
|
Part of our relief refinance initiative; or
|
|
FREDDIE MAC
| 2018 Form 10-K
|
305
|
|
|
Financial Statements
|
Notes to the Consolidated Financial Statements |
Note 14
|
|
n
|
In another refinance loan initiative and the pre-existing loan (including Alt-A loans) was originated under less than full documentation standards.
|
In the event we purchase a refinance loan and the original loan had been previously identified as Alt-A, such refinance loan may no longer be categorized or reported as Alt-A in the table below because the new refinance loan replacing the original loan would not be identified by the seller/servicer as an Alt-A loan. As a result, our reported Alt-A balances may be lower than would otherwise be the case had such refinancing not occurred.
Although we do not categorize single-family loans we purchase or guarantee as prime or subprime, we recognize that there are a number of loan types with certain characteristics that indicate a higher degree of credit risk.
For example, a borrower's credit score is a useful measure for assessing the credit quality of the borrower. Statistically, borrowers with higher credit scores are more likely to repay or have the ability to refinance than those with lower scores.
Presented below is a summary of the serious delinquency rates of certain higher-risk categories (based on characteristics of the loan at origination) of loans in our single-family credit guarantee portfolio. The table includes a presentation of each higher-risk category in isolation. A single loan may fall within more than one category (for example, an interest-only loan may also have an original LTV ratio greater than 90%). Loans with a combination of these attributes may have an even higher risk of delinquency than those with an individual attribute.
Table 14.2 - Certain Higher Risk Categories in Our Single-Family Credit Guarantee Portfolio
|
Percentage of Portfolio
(1)
|
Serious Delinquency Rate
(1)
|
|||||||||
|
(Percentage of portfolio based on UPB)
|
December 31, 2018
|
December 31, 2017
|
December 31, 2018
|
December 31, 2017
|
||||||
|
Interest-only
|
1
|
%
|
1
|
%
|
3.43
|
%
|
4.97
|
%
|
||
|
Alt-A
|
1
|
|
1
|
|
4.13
|
|
5.62
|
|
||
|
Original LTV ratio greater than 90%
(2)
|
18
|
|
17
|
|
1.04
|
|
1.70
|
|
||
|
Lower credit scores at origination (less than 620)
|
2
|
|
2
|
|
4.59
|
|
6.34
|
|
||
|
(1)
|
Excludes loans underlying certain other securitization products for which data was not available.
|
|
(2)
|
Includes HARP loans, which we purchased as part of our participation in the MHA Program.
|
We categorize our investments in non-agency mortgage-related securities as subprime, option ARM, or Alt-A if the securities were identified as such based on information provided to us when we entered into these transactions. We do not consider option ARM, CMBS, obligations of states and political subdivisions, and manufactured housing securities as either subprime or Alt-A securities. See
Note 7
for further information on these categories and other concentrations in our investments in securities.
Multifamily Mortgage Portfolio
Numerous factors affect a multifamily borrower's ability to repay the loan and the value of the property underlying the loan. The most significant factors affecting credit risk are rental rates and capitalization rates for the mortgaged property. Rental rates vary among geographic regions of the United States. The average UPB for multifamily loans is significantly larger than for single-family loans and, therefore, individual defaults for multifamily borrowers can result in more significant losses.
The table below summarizes the concentration of multifamily loans in our multifamily mortgage portfolio classified by legal structure, based on UPB.
|
FREDDIE MAC
| 2018 Form 10-K
|
306
|
|
|
Financial Statements
|
Notes to the Consolidated Financial Statements |
Note 14
|
Table 14.3 - Concentration of Credit Risk of Our Multifamily Mortgage Portfolio
|
As of December 31, 2018
|
As of December 31, 2017
|
|||||||||||
|
(Dollars in billions)
|
UPB
|
Delinquency
Rate
(1)
|
UPB
|
Delinquency
Rate
(1)
|
||||||||
|
Unsecuritized loans
|
|
$34.8
|
|
0.01
|
%
|
|
$38.2
|
|
0.01
|
%
|
||
|
Securitization-related products
|
226.9
|
|
0.01
|
|
192.5
|
|
0.02
|
|
||||
|
Other mortgage-related guarantees
|
9.8
|
|
—
|
|
10.0
|
|
—
|
|
||||
|
Total
|
|
$271.5
|
|
0.01
|
%
|
|
$240.7
|
|
0.02
|
%
|
||
|
(1)
|
Based on loans two monthly payments or more delinquent or in foreclosure.
|
In the multifamily mortgage portfolio, the primary concentration of credit risk is based on the legal structure of the investments we hold. Our exposure to credit risk in K Certificates and SB Certificates is minimal, as the expected credit risk is absorbed by the subordinate tranches, which are generally sold to private investors. As a result, our multifamily mortgage credit risk is primarily related to loans that have not been securitized.
Sellers and Servicers
We acquire a significant portion of our single-family and multifamily loan purchase volume from several large sellers. The tables below summarize the concentration of single-family and multifamily sellers who provided 10% or more of our purchase volume.
Table 14.4 - Seller Concentration
|
Single-family Sellers
|
2018
|
2017
|
|||
|
Wells Fargo Bank, N.A.
|
12
|
%
|
15
|
%
|
|
|
Other top 10 sellers
|
38
|
|
38
|
|
|
|
Top 10 single-family sellers
|
50
|
%
|
53
|
%
|
|
|
Multifamily Sellers
|
2018
|
2017
|
|||
|
CBRE Capital Markets, Inc.
|
18
|
%
|
18
|
%
|
|
|
Berkadia Commercial Mortgage LLC
|
13
|
|
11
|
|
|
|
Walker & Dunlop, LLC
|
9
|
|
10
|
|
|
|
Other top 10 sellers
|
39
|
|
39
|
|
|
|
Top 10 multifamily sellers
|
79
|
%
|
78
|
%
|
|
In recent years, there has been a shift in our single-family purchase volume from depository institutions to non-depository and smaller depository financial institutions. Some of these non-depository sellers have grown rapidly in recent years, and we purchase a significant share of our loans from them. Our top five non-depository sellers provided approximately
22%
and
20%
of our single-family purchase volume during
2018
and 2017, respectively.
We are exposed to counterparty credit risk arising from the potential insolvency or non-performance by our sellers and servicers of their obligations to repurchase loans or (at our option) indemnify us in the event of breaches of the representations and warranties they made when they sold the loans to us or failure to comply with our servicing requirements. Our contracts require that a seller/servicer repurchase a loan after we issue a repurchase request, unless the seller/servicer avails itself of an appeals process provided for in our contracts, in which case the deadline for repurchase is extended until we decide on the appeal. As of
December 31, 2018
and December 31,
2017
, the UPB of loans subject to our
|
FREDDIE MAC
| 2018 Form 10-K
|
307
|
|
|
Financial Statements
|
Notes to the Consolidated Financial Statements |
Note 14
|
repurchase requests issued to our single-family sellers and servicers was approximately
$0.4 billion
and
$0.2 billion
, respectively (these figures include repurchase requests for which appeals were pending). During both
2018
and
2017
, we recovered amounts that covered losses with respect to
$0.3 billion
in UPB of loans subject to our repurchase requests.
At the direction of FHFA, we and Fannie Mae revised our representation and warranty framework for conventional loans purchased by the GSEs on or after January 1, 2013. The objective of the revised framework is to clarify lenders' repurchase exposures and liability on future sales of loans to Freddie Mac and Fannie Mae. This framework does not affect seller/servicers' obligations under their contracts with us with respect to loans sold to us prior to January 1, 2013. This framework also does not affect their obligation to service these loans in accordance with our servicing standards. Under this framework, sellers are relieved of certain repurchase obligations for loans that meet specific payment requirements. This includes, subject to certain exclusions, loans with 36 months (12 months for relief refinance loans) of consecutive, on-time payments after we purchase them.
In May 2014, we announced changes to our representation and warranty framework for loans acquired on and after July 1, 2014. These changes relieve sellers of additional representations and warranties for these loans and provide relief for loans we have fully reviewed in our quality control process and determined to be acceptable. As of
December 31, 2018
, approximately
75%
in UPB of loans in our single-family credit guarantee portfolio were purchased since January 1, 2013 and are subject to our revised representation and warranty framework.
At the direction of FHFA, we implemented a new remedies framework for the categorization of loan origination defects for loans with settlement dates on or after January 1, 2016. Among other items, the framework provides that "significant defects" will result in a repurchase request or a repurchase alternative, such as recourse or indemnification. We may require the seller to pay us additional fees or provide us with additional data on the loan.
The ultimate amounts of recovery payments we receive from seller/servicers related to their repurchase obligations may be significantly less than the amount of our estimates of potential exposure to losses. Our estimate of probable incurred losses for exposure to seller/servicers for their repurchase obligations is considered in our allowance for loan losses. See
Note 4
for further information.
We are also exposed to the risk that servicers might fail to service loans in accordance with our contractual requirements, resulting in increased credit losses. For example, our servicers have an active role in our loss mitigation efforts, and we therefore have exposure to them to the extent a decline in their performance results in a failure to realize the anticipated benefits of our loss mitigation plans. Since we do not have our own servicing operation, if our servicers lack appropriate controls, experience a failure in their controls, or experience an operating disruption in their ability to service loans, our business and financial results could be adversely affected.
Significant portions of our single-family and multifamily loans are serviced by several large servicers. The tables below summarize the concentration of single-family and multifamily servicers who serviced 10% or more of our single-family credit guarantee portfolio and our multifamily mortgage portfolio, excluding loans underlying multifamily securitizations where we are not in first loss position, primarily K Certificates and SB Certificates.
|
FREDDIE MAC
| 2018 Form 10-K
|
308
|
|
|
Financial Statements
|
Notes to the Consolidated Financial Statements |
Note 14
|
Table 14.5 - Servicer Concentration
|
Single-family Servicers
|
December 31, 2018
(1)
|
December 31, 2017
(1)
|
|||
|
Wells Fargo Bank, N.A.
|
17
|
%
|
18
|
%
|
|
|
Other top 10 servicers
|
39
|
|
40
|
|
|
|
Top 10 single-family servicers
|
56
|
%
|
58
|
%
|
|
|
Multifamily Servicers
|
December 31, 2018
|
December 31, 2017
|
|||
|
Wells Fargo Bank, N.A.
|
14
|
%
|
16
|
%
|
|
|
CBRE Capital Markets, Inc.
|
14
|
|
12
|
|
|
|
Berkadia Commercial Mortgage LLC
|
11
|
|
11
|
|
|
|
Other top 10 servicers
|
36
|
|
36
|
|
|
|
Top 10 multifamily servicers
|
75
|
%
|
75
|
%
|
|
|
(1)
|
Percentage of servicing volume is based on the total single-family credit guarantee portfolio, excluding loans where we do not exercise control over the associated servicing.
|
In recent years, there has been a shift in our single-family servicing from depository institutions to non-depository servicers. Some of these non-depository servicers have grown rapidly in recent years and now service a large share of our loans. As of
December 31, 2018
and December 31,
2017
, approximately
16%
and
15%
of our single-family credit guarantee portfolio, respectively, excluding loans where we do not exercise control over the associated servicing, was serviced by our five largest non-depository servicers, on a combined basis. We routinely monitor the performance of our largest non-depository servicers.
In our multifamily business, we are exposed to the risk that multifamily seller/servicers could come under financial pressure, which could potentially cause degradation in the quality of the servicing they provide us, including their monitoring of each property's financial performance and physical condition. This could also, in certain cases, reduce the likelihood that we could recover losses through lender repurchases, recourse agreements or other credit enhancements, where applicable. This risk primarily relates to multifamily loans that we hold on our consolidated balance sheets where we retain all of the related credit risk. We monitor the status of all our multifamily seller/servicers in accordance with our counterparty credit risk management framework.
Credit Enhancement Providers
We have counterparty credit risk relating to the potential insolvency of, or non-performance by, mortgage insurers that insure single-family loans we purchase or guarantee. We also have similar exposure to insurers and reinsurers through our ACIS transactions where we purchase insurance policies as part of our CRT activities.
We evaluate the recovery and collectability from mortgage insurers as part of the estimate of our allowance for credit losses. See
Note 4
for additional information. As of
December 31, 2018
, mortgage insurers provided coverage with maximum loss limits of
$97.0 billion
, for
$378.7 billion
of UPB, in connection with our single-family credit guarantee portfolio. These amounts are based on gross coverage without regard to netting of coverage that may exist to the extent an affected loan is covered under both primary and pool insurance.
The table below summarizes the concentration of mortgage insurer counterparties who provided 10% or more of our overall mortgage insurance coverage. On October 23, 2016, Genworth Financial, Inc.
|
FREDDIE MAC
| 2018 Form 10-K
|
309
|
|
|
Financial Statements
|
Notes to the Consolidated Financial Statements |
Note 14
|
announced that it had entered into an agreement to be acquired by China Oceanwide Holdings Group Co., Ltd. Because Genworth Mortgage Insurance Corporation, a subsidiary of Genworth Financial, Inc., is an approved mortgage insurer, Freddie Mac has evaluated the planned acquisition and approved China Oceanwide Holdings Group's control of Genworth Mortgage Insurance Corporation. Regulatory and other approvals of the acquisition are still pending.
Table 14.6 - Mortgage Insurer Concentration
|
Mortgage Insurance Coverage
(2)
|
|||||||
|
Mortgage Insurer
|
Credit Rating
(1)
|
December 31, 2018
|
December 31, 2017
|
||||
|
Arch Mortgage Insurance Company
|
A-
|
24
|
%
|
24
|
%
|
||
|
Radian Guaranty Inc.
|
BBB
|
20
|
|
21
|
|
||
|
Mortgage Guaranty Insurance Corporation
|
BBB
|
19
|
|
19
|
|
||
|
Genworth Mortgage Insurance Corporation
|
BB+
|
14
|
|
15
|
|
||
|
Essent Guaranty, Inc.
|
BBB+
|
14
|
|
12
|
|
||
|
Total
|
91
|
%
|
91
|
%
|
|||
|
(1)
|
Ratings are for the corporate entity to which we have the greatest exposure. Latest rating available as of December 31, 2018. Represents the lower of S&P and Moody's credit ratings stated in terms of the S&P equivalent.
|
|
(2)
|
Coverage amounts may include coverage provided by affiliates and subsidiaries of the counterparty.
|
We received proceeds of
$0.2 billion
and
$0.4 billion
during
2018
and
2017
, respectively, from our primary and pool mortgage insurance policies for recovery of losses on our single-family loans. We had outstanding receivables from mortgage insurers of
$0.1 billion
(excluding deferred payment obligations associated with unpaid claim amounts) as of both
December 31, 2018
and December 31,
2017
. The balance of these receivables, net of associated reserves, was approximately
$0.1 billion
at both
December 31, 2018
and December 31,
2017
.
PMI Mortgage Insurance Co. and Triad Guaranty Insurance Corp. are both under the control of their state regulators and are in run-off. A substantial portion of their claims is recorded by us as deferred payment obligations. These insurers no longer issue new insurance but continue to pay a portion of their respective claims in cash. In 2014, PMI began paying valid claims
67%
in cash,
33%
in deferred payment obligations, and made a one-time cash payment to us for claims that were previously settled for
55%
in cash. In 2015, PMI began paying valid claims
70%
in cash,
30%
in deferred payment obligations, and made a one-time cash payment to us for claims that were previously settled for
67%
in cash. In 2013, Triad began paying valid claims
75%
in cash,
25%
in deferred payment obligations, and made a one-time cash payment to us for claims that were previously settled for
60%
in cash. If, as we currently expect, these insurers do not pay the full amount of their deferred payment obligations in cash, we would lose a portion of the coverage from these insurers. As of both
December 31, 2018
and December 31,
2017
, we had cumulative unpaid deferred payment obligations of
$0.5 billion
from these insurers. We have reserved substantially all of these unpaid amounts as collectability is uncertain. It is not clear how the regulators of these companies will administer their respective deferred payment plans in the future, nor when or if those obligations will be paid.
RMIC is under regulatory supervision and is no longer issuing new insurance. In 2014, RMIC resumed paying valid claims at
100%
of the claim amount. Previously, RMIC had been paying all valid claims
60%
in cash and
40%
in deferred payment obligations.
As part of our ACIS transactions, we regularly obtain insurance coverage from global insurers and reinsurers. These transactions incorporate several features designed to increase the likelihood that we will recover on the claims we file with the insurers and reinsurers, including the following:
|
FREDDIE MAC
| 2018 Form 10-K
|
310
|
|
|
Financial Statements
|
Notes to the Consolidated Financial Statements |
Note 14
|
|
n
|
In each ACIS transaction, we require the individual ACIS insurers and reinsurers to post collateral to cover portions of their exposure, which helps to promote certainty and timeliness of claim payment and
|
|
n
|
While private mortgage insurance companies are required to be monoline (i.e., to participate solely in the mortgage insurance business, although the holding company may be a diversified insurer), our ACIS insurers and reinsurers generally participate in multiple types of insurance businesses, which helps diversify their risk exposure.
|
Other Investment Counterparties
We are exposed to the non-performance of counterparties relating to other investments (including non-mortgage-related securities and cash equivalents) transactions, including those entered into on behalf of our securitization trusts. Our policies require that the counterparty be evaluated using our internal counterparty rating model prior to our entering such transactions. We monitor the financial strength of our counterparties to these transactions and may use collateral maintenance requirements to manage our exposure to individual counterparties. The permitted term and dollar limits for each of these transactions are also based on the counterparty's financial strength.
Our other investments (including non-mortgage-related securities and cash equivalents) counterparties are primarily major financial institutions, including other GSEs, Treasury, the Federal Reserve Bank of New York, GSD/FICC, highly-rated supranational institutions, depository and non-depository institutions, brokers and dealers, and government money market funds. As of
December 31, 2018
and December 31,
2017
, including amounts related to our consolidated VIEs, the balance of our other investments portfolio was
$63.1 billion
and
$89.8 billion
, respectively. The balance consists primarily of cash, securities purchased under agreements to resell invested with counterparties, U.S. Treasury securities, cash deposited with the Federal Reserve Bank of New York, and secured lending activities. As of
December 31, 2018
, all of our securities purchased under agreements to resell were fully collateralized. As of December 31, 2018 and December 31, 2017,
$2.5 billion
, and
$0.2 billion
of our securities purchased under agreements to resell were used to provide financing to investors in Freddie Mac securities to increase liquidity and expand the investor base for those securities. These transactions differ from the securities purchased under agreements to resell that we use for liquidity purposes as the counterparties we face may not be major financial institutions and we are exposed to the counterparty credit risk of these institutions.
Non-Agency Mortgage-Related Security Issuers
We are engaged in various loss mitigation efforts concerning certain investments in non-agency mortgage-related securities, including the matters described below.
In 2011, FHFA, as Conservator for Freddie Mac and Fannie Mae, filed lawsuits against a number of corporate families of financial institutions and related defendants alleging securities laws violations, and in some cases, fraud. On July 12, 2017, FHFA reached a settlement with the Royal Bank of Scotland Group plc, related companies and specifically named individuals (collectively RBS). The settlement resolves all claims in the lawsuit filed by FHFA against RBS in the U.S. District Court for the District of Connecticut. Under the terms of the agreement, RBS paid Freddie Mac
$4.5 billion
. We recognized this amount within non-interest income on our consolidated statements of comprehensive income during the
|
FREDDIE MAC
| 2018 Form 10-K
|
311
|
|
|
Financial Statements
|
Notes to the Consolidated Financial Statements |
Note 14
|
third quarter of 2017. The separate lawsuit filed by FHFA against Nomura Holding America, Inc. (Nomura) and RBS in the U.S. District Court for the Southern District of New York went to trial in March 2015. In May 2015, the judge ruled against the defendants and ordered them to pay an aggregate of
$806 million
, of which
$779 million
was to be paid to Freddie Mac, adjusted by any principal and interest collected by Freddie Mac between the date of the judgment and the date on which the judgment was executed. The judgment also provided for Freddie Mac to transfer to defendants the six mortgage-related securities at issue in the case and ordered the defendants to reimburse Freddie Mac for certain costs, legal fees and expenses. In September 2017, the U.S. Court of Appeals for the Second Circuit affirmed the District Court's decision. Nomura and RBS filed a petition for writ of certiorari in the U.S. Supreme Court, and on June 25, 2018, the U.S. Supreme Court denied certiorari. On July 20, 2018, Freddie Mac received approximately
$652 million
, which included post-judgment interest, and tendered to Nomura the six certificates at issue. In addition, Freddie Mac received
$16.5 million
from Nomura as reimbursement of attorneys' fees and costs. We recognized the benefit of the judgment during 2Q 2018 and recorded a gain of
$334 million
within non-interest income on our consolidated statements of comprehensive income.
|
FREDDIE MAC
| 2018 Form 10-K
|
312
|
|
|
Financial Statements
|
Notes to the Consolidated Financial Statements |
Note 15
|
NOTE 15
Fair Value Disclosures
The accounting guidance for fair value measurements and disclosures defines fair value, establishes a framework for measuring fair value and sets forth disclosure requirements regarding fair value measurements. This guidance applies whenever other accounting guidance requires or permits assets or liabilities to be measured at fair value. Fair value represents the price that would be received to sell an asset or paid to transfer a liability in an orderly transaction between market participants at the measurement date. Fair value measurement assumes that the transaction to sell the asset or transfer the liability takes place either in the principal market for the asset or liability, or, in the absence of a principal market, in the most advantageous market for the asset or liability.
We use fair value measurements for the initial recording of certain assets and liabilities and periodic remeasurement of certain assets and liabilities on a recurring or non-recurring basis.
Fair Value Measurements
The accounting guidance for fair value measurements and disclosures establishes a three-level fair value hierarchy that prioritizes the inputs into the valuation techniques used to measure fair value. The levels of the fair value hierarchy are defined as follows in priority order:
|
n
|
Level 1 - inputs to the valuation techniques are based on quoted prices in active markets for identical assets or liabilities.
|
n
Level 2 - inputs to the valuation techniques are based on observable inputs other than quoted prices in active markets for identical assets or liabilities.
|
n
|
Level 3 - one or more inputs to the valuation technique are unobservable and significant to the fair value measurement.
|
We use quoted market prices and valuation techniques that seek to maximize the use of observable inputs, where available, and minimize the use of unobservable inputs. Our inputs are based on the assumptions a market participant would use in valuing the asset or liability. Assets and liabilities are classified in their entirety within the fair value hierarchy based on the lowest level input that is significant to the fair value measurement.
Valuation Risk and Controls Over Fair Value Measurements
Valuation risk is the risk that fair values used for financial disclosures, risk metrics, and performance measures do not reasonably reflect market conditions and prices.
We designed our control processes so that our fair value measurements are appropriate and reliable, that they are based on observable inputs where possible, and that our valuation approaches are consistently applied and the assumptions and inputs are reasonable. Our control processes provide a framework for segregation of duties and oversight of our fair value methodologies, techniques, validation procedures, and results.
Groups within our Finance Division, independent of our business functions, execute and validate the valuation processes and are responsible for determining the fair values of the majority of our financial
|
FREDDIE MAC
| 2018 Form 10-K
|
313
|
|
|
Financial Statements
|
Notes to the Consolidated Financial Statements |
Note 15
|
assets and liabilities. In determining fair value, we consider the credit risk of our counterparties in estimating the fair values of our assets and our own credit risk in estimating the fair values of our liabilities. The fair values determined by our Finance Division are further verified by an independent group within our ERM Division.
The independent validation procedures performed by the ERM Division are intended to ensure that the prices we receive from third parties are consistent with our observations of market activity, and that fair value measurements developed using internal data reflect the assumptions that a market participant would use in pricing our assets and liabilities. These validation procedures include performing a daily price review and a monthly independent verification of fair value measurements through independent modeling, analytics, and comparisons to other market source data, if available. If we are unable to validate the reasonableness of a given price, we ultimately do not use that price for fair value measurements on our consolidated financial statements. These procedures are risk-based and are executed before we finalize the prices used in preparing our fair value measurements for our financial statements.
In addition to performing the validation procedures noted above, the ERM Division provides independent risk governance over all valuation processes by establishing and maintaining a corporate-wide valuation risk policy. The ERM Division also independently reviews significant judgments, methodologies, and valuation techniques to ensure compliance with established policies.
Our Valuation Risk Committee (Valuation Committee), which includes representation from our business lines, the ERM Division, and the Finance Division, provides senior management's governance over valuation processes, methodologies, controls, and fair value measurements. Identified exceptions are reviewed and resolved through the verification process and reviewed at the Valuation Committee.
Where models are employed to assist in the measurement and verification of fair values, changes made to those models during the period are reviewed and approved according to the corporate model change governance process, with material changes reviewed at the Valuation Committee. Inputs used by models are regularly updated for changes in the underlying data, assumptions, valuation inputs, and market conditions and are subject to the valuation controls noted above.
Use of Third-Party Pricing Data in Fair Value Measurement
Many of our valuation techniques use, either directly or indirectly, data provided by third-party pricing services or dealers. The techniques used by these pricing services and dealers to develop the prices generally are either:
|
n
|
A comparison to transactions involving instruments with similar collateral and risk profiles, adjusted as necessary based on specific characteristics of the asset or liability being valued or
|
n
Industry-standard modeling, such as a discounted cash flow model.
The prices provided by the pricing services and dealers reflect their observations and assumptions related to market activity, including risk premiums and liquidity adjustments. The models and related assumptions used by the pricing services and dealers are owned and managed by them and, in many cases, the significant inputs used in the valuation techniques are not reasonably available to us. However, we have an understanding of the processes and assumptions used to develop the prices based on our ongoing due diligence, which includes discussions with our vendors at least annually and often more frequently. We believe that the procedures executed by the pricing services and dealers,
|
FREDDIE MAC
| 2018 Form 10-K
|
314
|
|
|
Financial Statements
|
Notes to the Consolidated Financial Statements |
Note 15
|
combined with our internal verification and analytical procedures, provide assurance that the prices used in our financial statements comply with the accounting guidance for fair value measurements and disclosures and reflect the assumptions that a market participant would use in pricing our assets and liabilities. The price quotes we receive are non-binding both to us and to our counterparties.
In many cases, we receive quotes from third-party pricing services or dealers and use those prices without adjustment. For a large majority of the assets and liabilities we value using pricing services and dealers, we obtain quotes from multiple external sources and use the median of the prices to measure fair value. This technique is referred to below as "median of external sources." The significant inputs used in the fair value measurement of assets and liabilities that are valued using the median of external sources pricing technique are the third-party quotes. Significant increases (decreases) in any of the third-party quotes in isolation may result in a significantly higher (lower) fair value measurement. In limited circumstances, we may be able to receive pricing information from only a single external source. This technique is referred to below as "single external source."
Valuation Techniques
The following table contains a description of the valuation techniques we use for fair value measurement and disclosure; the significant inputs used in those techniques (if applicable); the classification within the fair value hierarchy; and, for those measurements that we report on our consolidated balance sheets and are classified as Level 3 of the hierarchy, a narrative description of the uncertainty of the fair value measurement to changes in significant unobservable inputs. Although the uncertainties of the unobservable inputs are discussed below in isolation, interrelationships exist among the inputs such that a change in one unobservable input can result in a change to one or more of the other inputs. For example, the most common interrelationship that affects the majority of our fair value measurements is between future interest rates, prepayment speeds, and probabilities of default. Generally, a change in the assumption used for future interest rates results in a directionally opposite change in the assumption used for prepayment speeds and a directionally similar change in the assumption used for probabilities of default.
Each technique discussed below may not be used in a given reporting period, depending on the composition of our assets and liabilities measured at fair value and relevant market activity during that
period.
|
FREDDIE MAC
| 2018 Form 10-K
|
315
|
|
|
Financial Statements
|
Notes to the Consolidated Financial Statements |
Note 15
|
|
Instrument
|
Valuation Technique
|
Classification in the Fair Value Hierarchy
|
|
|
Securities
|
|||
|
U.S. Treasury Securities
|
Quoted prices in active markets
|
Level 1
|
|
|
Agency mortgage-related securities
|
Fixed-rate single-class
|
Median of external sources
|
Level 2
|
|
Adjustable-rate single-class and majority of multi-class securities
|
Median of external sources
|
Predominantly Level 2
|
|
|
Certain multi-class securities
|
Single external source
|
Levels 2 and 3
|
|
|
Certain multi-class securities with limited market activity
|
Discounted cash flows or risk metric pricing.
Significant inputs used in the discounted cash flow technique include OAS. Significant increases (decreases) in the OAS in isolation would result in a significantly lower (higher) fair value measurement.
Significant inputs used in the risk metric pricing technique include key risk metrics, such as key rate durations. Significant increases (decreases) in key rate durations in isolation would result in a significant increase (decrease) in the magnitude of change of fair value measurement in response to key rate movements. Under risk metric pricing, securities are valued by starting with a prior period price and adjusting that price for market changes in the key risk metric input used.
|
Level 3
|
|
|
Commercial mortgage-related securities
|
Single external source or, in limited circumstances, a median of external sources
|
Predominantly Level 3
|
|
|
Other non-agency mortgage-related securities
|
Median of external sources
|
Level 3
|
|
|
Derivatives
|
|||
|
Exchange-traded futures
|
Quoted prices in active markets
|
Level 1
|
|
|
Interest-rate swaps
|
Discounted cash flows. Significant inputs include market-based interest rates.
|
Level 2
|
|
|
Option-based derivatives
|
Option-pricing models. Significant inputs include interest-rate volatility matrices.
|
Level 2
|
|
|
Purchase and sale commitments
|
See Agency mortgage-related securities
|
Level 2
|
|
|
Debt
|
|||
|
Debt securities of consolidated trusts
held by third parties
|
See Agency mortgage-related securities
|
Level 2 or 3
|
|
|
Other debt
|
Median of external sources
|
Predominantly Level 2
|
|
|
Single external source
|
|||
|
Published yield matrices
|
|||
|
FREDDIE MAC
| 2018 Form 10-K
|
316
|
|
|
Financial Statements
|
Notes to the Consolidated Financial Statements |
Note 15
|
|
Instrument
|
Valuation Technique
|
Classification in the Fair Value Hierarchy
|
|
|
Mortgage Loans
|
|||
|
Single-family loans
|
GSE securitization market
|
Benchmark security pricing for actively traded mortgage-related securities with similar characteristics, adjusting for the value of our guarantee fee and our credit obligation related to performing our guarantee (see Guarantee obligation). The credit obligation is based on: delivery and guarantee fees we charge under current market pricing for loans that qualify under our current underwriting standards (Level 2) and internal credit models for loans that do not qualify under our current underwriting standards (Level 3).
|
Level 2 or 3
|
|
Whole loan market
|
Median of external sources, referencing market activity for deeply delinquent and modified loans, where available
|
Level 3
|
|
|
Impaired held-for-investment
|
Internal models that estimate the fair value of the underlying collateral for impaired loans. Significant inputs used by our internal models include REO disposition, short sale, and third-party sale values, combined with mortgage loan level characteristics using the repeat housing sales index to estimate the current fair value of the mortgage loan. Significant increases (decreases) in the historical average sales proceeds per mortgage loan in isolation would result in significantly higher (lower) fair value measurements.
|
Level 3
|
|
|
Multifamily loans
|
Held-for-sale
|
Market prices from a third-party pricing service, using discounted cash flows based on K Certificate and SB Certificate market spreads
|
Level 2
|
|
Held-for-investment
|
Market prices from a third-party pricing service using discounted cash flows incorporating credit spreads for similar loans based on the loan's LTV and DSCR
|
Level 3
|
|
|
Other Assets
|
|||
|
Guarantee asset
|
Single-family
|
Median of external sources with adjustments for specific loan characteristics
|
Level 3
|
|
Multifamily
|
Discounted cash flows. Significant inputs include current OAS-to-benchmark interest rates for new guarantees. Significant increases (decreases) in the OAS in isolation would result in a significantly lower (higher) fair value measurement.
|
Level 3
|
|
|
Mortgage servicing rights
|
Market prices from a third party or internally developed prices using discounted cash flows. Significant inputs include:
|
Level 3
|
|
|
Ÿ
Estimated prepayment rates,
|
|||
|
Ÿ
Estimated costs to service both performing and non-accrual loans, and
|
|||
|
Ÿ
Estimated servicing income per loan (including ancillary income).
|
|||
|
FREDDIE MAC
| 2018 Form 10-K
|
317
|
|
|
Financial Statements
|
Notes to the Consolidated Financial Statements |
Note 15
|
|
Instrument
|
Valuation Technique
|
Classification in the Fair Value Hierarchy
|
|
|
Significant increases (decreases) in cost to service per loan and prepayment rate in isolation would result in a significantly lower (higher) fair value measurement. Significant increases (decreases) in servicing income per loan in isolation would result in a significantly higher (lower) fair value measurement.
|
|||
|
Other Liabilities
|
|||
|
Guarantee obligation
|
Single-family
|
Delivery and guarantee fees that we charge under our current market pricing
|
Level 2
|
|
Internal credit models. Significant inputs include loan characteristics, loan performance, and status information.
|
Level 3
|
||
|
Multifamily
|
Discounted cash flows. Significant inputs are similar to those used in the valuation technique for the Multifamily guarantee asset.
|
Level 3
|
|
Assets and Liabilities Measured at Fair Value on a Recurring Basis
The tables below present our assets and liabilities measured on our consolidated balance sheets at fair value on a recurring basis subsequent to initial recognition, including instruments where we have elected the fair value option.
|
FREDDIE MAC
| 2018 Form 10-K
|
318
|
|
|
Financial Statements
|
Notes to the Consolidated Financial Statements |
Note 15
|
Table 15.1 - Assets and Liabilities Measured at Fair Value on a Recurring Basis
|
|
December 31, 2018
|
|||||||||||||||
|
(In millions)
|
Level 1
|
Level 2
|
Level 3
|
Netting Adjustment
(1)
|
Total
|
|||||||||||
|
Assets:
|
|
|
|
|
|
|||||||||||
|
Investments in securities:
|
|
|
|
|
|
|||||||||||
|
Available-for-sale, at fair value:
|
|
|
|
|
|
|||||||||||
|
Mortgage-related securities:
|
|
|
|
|
|
|||||||||||
|
Freddie Mac
|
|
$—
|
|
|
$26,102
|
|
|
$4,097
|
|
|
$—
|
|
|
$30,199
|
|
|
|
Other agency
|
—
|
|
1,668
|
|
38
|
|
—
|
|
1,706
|
|
||||||
|
Non-agency RMBS
|
—
|
|
—
|
|
1,403
|
|
—
|
|
1,403
|
|
||||||
|
Non-agency CMBS
|
—
|
|
18
|
|
—
|
|
—
|
|
18
|
|
||||||
|
Obligations of states and political subdivisions
|
—
|
|
—
|
|
237
|
|
—
|
|
237
|
|
||||||
|
Total available-for-sale securities, at fair value
|
—
|
|
27,788
|
|
5,775
|
|
—
|
|
33,563
|
|
||||||
|
Trading, at fair value:
|
|
|
|
|||||||||||||
|
Mortgage-related securities:
|
|
|
|
|||||||||||||
|
Freddie Mac
|
—
|
|
10,535
|
|
3,286
|
|
—
|
|
13,821
|
|
||||||
|
Other agency
|
—
|
|
2,544
|
|
7
|
|
—
|
|
2,551
|
|
||||||
|
All other
|
—
|
|
—
|
|
1
|
|
—
|
|
1
|
|
||||||
|
Total mortgage-related securities
|
—
|
|
13,079
|
|
3,294
|
|
—
|
|
16,373
|
|
||||||
|
Non-mortgage-related securities
|
15,885
|
|
3,290
|
|
—
|
|
—
|
|
19,175
|
|
||||||
|
Total trading securities, at fair value
|
15,885
|
|
16,369
|
|
3,294
|
|
—
|
|
35,548
|
|
||||||
|
Total investments in securities
|
15,885
|
|
44,157
|
|
9,069
|
|
—
|
|
69,111
|
|
||||||
|
Mortgage loans:
|
|
|
|
|
|
|||||||||||
|
Held-for-sale, at fair value
|
—
|
|
23,106
|
|
—
|
|
—
|
|
23,106
|
|
||||||
|
Derivative assets, net:
|
||||||||||||||||
|
Interest-rate swaps
|
—
|
|
2,127
|
|
—
|
|
—
|
|
2,127
|
|
||||||
|
Option-based derivatives
|
—
|
|
4,200
|
|
—
|
|
—
|
|
4,200
|
|
||||||
|
Other
|
—
|
|
90
|
|
1
|
|
—
|
|
91
|
|
||||||
|
Subtotal, before netting adjustments
|
—
|
|
6,417
|
|
1
|
|
—
|
|
6,418
|
|
||||||
|
Netting adjustments
(1)
|
—
|
|
—
|
|
—
|
|
(6,083
|
)
|
(6,083
|
)
|
||||||
|
Total derivative assets, net
|
—
|
|
6,417
|
|
1
|
|
(6,083
|
)
|
335
|
|
||||||
|
Other assets:
|
|
|
||||||||||||||
|
Guarantee asset, at fair value
|
—
|
|
—
|
|
3,633
|
|
—
|
|
3,633
|
|
||||||
|
Non-derivative held-for-sale purchase commitments, at fair value
|
—
|
|
159
|
|
—
|
|
—
|
|
159
|
|
||||||
|
All other, at fair value
|
—
|
|
—
|
|
137
|
|
—
|
|
137
|
|
||||||
|
Total other assets
|
—
|
|
159
|
|
3,770
|
|
—
|
|
3,929
|
|
||||||
|
Total assets carried at fair value on a recurring basis
|
|
$15,885
|
|
|
$73,839
|
|
|
$12,840
|
|
|
($6,083
|
)
|
|
$96,481
|
|
|
|
Liabilities:
|
||||||||||||||||
|
Debt securities of consolidated trusts held by third parties, at fair value
|
|
$—
|
|
|
$27
|
|
|
$728
|
|
|
$—
|
|
|
$755
|
|
|
|
Other debt, at fair value
|
—
|
|
4,223
|
|
134
|
|
—
|
|
4,357
|
|
||||||
|
Derivative liabilities, net:
|
|
|
|
|
|
|||||||||||
|
Interest-rate swaps
|
—
|
|
3,974
|
|
—
|
|
—
|
|
3,974
|
|
||||||
|
Option-based derivatives
|
—
|
|
137
|
|
—
|
|
—
|
|
137
|
|
||||||
|
Other
|
—
|
|
225
|
|
92
|
|
—
|
|
317
|
|
||||||
|
Subtotal, before netting adjustments
|
—
|
|
4,336
|
|
92
|
|
—
|
|
4,428
|
|
||||||
|
Netting adjustments
(1)
|
—
|
|
—
|
|
—
|
|
(3,845
|
)
|
(3,845
|
)
|
||||||
|
Total derivative liabilities, net
|
—
|
|
4,336
|
|
92
|
|
(3,845
|
)
|
583
|
|
||||||
|
Other liabilities:
|
||||||||||||||||
|
Non-derivative held-for-sale purchase commitments, at fair value
|
—
|
|
17
|
|
—
|
|
—
|
|
17
|
|
||||||
|
Total liabilities carried at fair value on a recurring basis
|
|
$—
|
|
|
$8,603
|
|
|
$954
|
|
|
($3,845
|
)
|
|
$5,712
|
|
|
Referenced footnote is included after the next table.
|
FREDDIE MAC
| 2018 Form 10-K
|
319
|
|
|
Financial Statements
|
Notes to the Consolidated Financial Statements |
Note 15
|
|
|
December 31, 2017
|
|||||||||||||||
|
(In millions)
|
Level 1
|
Level 2
|
Level 3
|
Netting Adjustment
(1)
|
Total
|
|||||||||||
|
Assets:
|
||||||||||||||||
|
Investments in securities:
|
||||||||||||||||
|
Available-for-sale, at fair value:
|
||||||||||||||||
|
Mortgage-related securities:
|
||||||||||||||||
|
Freddie Mac
|
|
$—
|
|
|
$30,415
|
|
|
$6,751
|
|
|
$—
|
|
|
$37,166
|
|
|
|
Other agency
|
—
|
|
2,007
|
|
46
|
|
—
|
|
2,053
|
|
||||||
|
Non-agency RMBS
|
—
|
|
—
|
|
3,933
|
|
—
|
|
3,933
|
|
||||||
|
Non-agency CMBS
|
—
|
|
87
|
|
1
|
|
—
|
|
88
|
|
||||||
|
Obligations of states and political subdivisions
|
—
|
|
—
|
|
357
|
|
—
|
|
357
|
|
||||||
|
Total available-for-sale securities, at fair value
|
—
|
|
32,509
|
|
11,088
|
|
—
|
|
43,597
|
|
||||||
|
Trading, at fair value:
|
||||||||||||||||
|
Mortgage-related securities:
|
||||||||||||||||
|
Freddie Mac
|
—
|
|
11,393
|
|
2,907
|
|
—
|
|
14,300
|
|
||||||
|
Other agency
|
—
|
|
3,565
|
|
9
|
|
—
|
|
3,574
|
|
||||||
|
All other
|
—
|
|
27
|
|
1
|
|
—
|
|
28
|
|
||||||
|
Total mortgage-related securities
|
—
|
|
14,985
|
|
2,917
|
|
—
|
|
17,902
|
|
||||||
|
Non-mortgage-related securities
|
20,159
|
|
2,660
|
|
—
|
|
—
|
|
22,819
|
|
||||||
|
Total trading securities, at fair value
|
20,159
|
|
17,645
|
|
2,917
|
|
—
|
|
40,721
|
|
||||||
|
Total investments in securities
|
20,159
|
|
50,154
|
|
14,005
|
|
—
|
|
84,318
|
|
||||||
|
Mortgage loans:
|
||||||||||||||||
|
Held-for-sale, at fair value
|
—
|
|
20,054
|
|
—
|
|
—
|
|
20,054
|
|
||||||
|
Derivative assets, net:
|
||||||||||||||||
|
Interest-rate swaps
|
—
|
|
4,262
|
|
—
|
|
—
|
|
4,262
|
|
||||||
|
Option-based derivatives
|
—
|
|
4,524
|
|
—
|
|
—
|
|
4,524
|
|
||||||
|
Other
|
—
|
|
44
|
|
8
|
|
—
|
|
52
|
|
||||||
|
Subtotal, before netting adjustments
|
—
|
|
8,830
|
|
8
|
|
—
|
|
8,838
|
|
||||||
|
Netting adjustments
(1)
|
—
|
|
—
|
|
—
|
|
(8,463
|
)
|
(8,463
|
)
|
||||||
|
Total derivative assets, net
|
—
|
|
8,830
|
|
8
|
|
(8,463
|
)
|
375
|
|
||||||
|
Other assets:
|
||||||||||||||||
|
Guarantee asset, at fair value
|
—
|
|
—
|
|
3,171
|
|
—
|
|
3,171
|
|
||||||
|
Non-derivative held-for-sale purchase commitments, at fair value
|
—
|
|
137
|
|
—
|
|
—
|
|
137
|
|
||||||
|
All other, at fair value
|
—
|
|
—
|
|
45
|
|
—
|
|
45
|
|
||||||
|
Total other assets
|
—
|
|
137
|
|
3,216
|
|
—
|
|
3,353
|
|
||||||
|
Total assets carried at fair value on a recurring basis
|
|
$20,159
|
|
|
$79,175
|
|
|
$17,229
|
|
|
($8,463
|
)
|
|
$108,100
|
|
|
|
Liabilities:
|
||||||||||||||||
|
Debt securities of consolidated trusts held by third parties, at fair value
|
|
$—
|
|
|
$9
|
|
|
$630
|
|
|
$—
|
|
|
$639
|
|
|
|
Other debt, at fair value
|
—
|
|
5,023
|
|
137
|
|
—
|
|
5,160
|
|
||||||
|
Derivative liabilities, net:
|
||||||||||||||||
|
Interest-rate swaps
|
—
|
|
7,239
|
|
—
|
|
—
|
|
7,239
|
|
||||||
|
Option-based derivatives
|
—
|
|
121
|
|
—
|
|
—
|
|
121
|
|
||||||
|
Other
|
—
|
|
64
|
|
65
|
|
—
|
|
129
|
|
||||||
|
Subtotal, before netting adjustments
|
—
|
|
7,424
|
|
65
|
|
—
|
|
7,489
|
|
||||||
|
Netting adjustments
(1)
|
—
|
|
—
|
|
—
|
|
(7,220
|
)
|
(7,220
|
)
|
||||||
|
Total derivative liabilities, net
|
—
|
|
7,424
|
|
65
|
|
(7,220
|
)
|
269
|
|
||||||
|
Other liabilities:
|
||||||||||||||||
|
Non-derivative held-for-sale purchase commitments, at fair value
|
—
|
|
4
|
|
—
|
|
—
|
|
4
|
|
||||||
|
Total liabilities carried at fair value on a recurring basis
|
|
$—
|
|
|
$12,460
|
|
|
$832
|
|
|
($7,220
|
)
|
|
$6,072
|
|
|
|
(1)
|
Represents counterparty netting, cash collateral netting, and net derivative interest receivable or payable.
|
|
FREDDIE MAC
| 2018 Form 10-K
|
320
|
|
|
Financial Statements
|
Notes to the Consolidated Financial Statements |
Note 15
|
Level 3 Fair Value Measurements
The tables below present a reconciliation of all assets and liabilities measured on our consolidated balance sheets at fair value on a recurring basis using significant unobservable inputs (Level 3), including transfers into and out of Level 3. The tables also present gains and losses due to changes in fair value, including both realized and unrealized gains and losses, recognized on our consolidated statements of comprehensive income for Level 3 assets and liabilities.
The tables below present a reconciliation of all assets and liabilities measured on our consolidated balance sheets at fair value on a recurring basis using significant unobservable inputs (Level 3), including transfers into and out of Level 3. The tables also present gains and losses due to changes in fair value, including both realized and unrealized gains and losses, recognized on our consolidated statements of comprehensive income for Level 3 assets and liabilities.
Table 15.2 - Fair Value Measurements of Assets and Liabilities Using Significant Unobservable Inputs
|
|
Year Ended December 31, 2018
|
|||||||||||||||||||||||||||||||||||||||||||||||
|
|
Balance,
January 1, 2018 |
Realized and unrealized gains (losses)
|
|
Purchases
|
|
Issues
|
|
Sales
|
|
Settlements,
net |
|
Transfers
into Level 3 (1) |
|
Transfers
out of Level 3 (1) |
|
Balance,
December 31, 2018 |
|
Unrealized
gains (losses) still held (3) |
||||||||||||||||||||||||||||||
|
(In millions)
|
Included in
earnings |
Included in other
comprehensive income |
|
Total
|
|
|
|
|
|
|
|
|
||||||||||||||||||||||||||||||||||||
|
|
|
|||||||||||||||||||||||||||||||||||||||||||||||
|
Assets
|
|
|
|
|
|
|
|
|
|
|
|
|
|
|
|
|
|
|
|
|
|
|||||||||||||||||||||||||||
|
Investments in securities:
|
|
|
|
|
|
|
|
|
|
|
|
|
|
|
|
|
|
|
|
|
|
|||||||||||||||||||||||||||
|
Available-for-sale, at fair value:
|
|
|
|
|
|
|
|
|
|
|
|
|
|
|
|
|
|
|
|
|
|
|||||||||||||||||||||||||||
|
Mortgage-related securities:
|
|
|
|
|
|
|
|
|
|
|
|
|
|
|
|
|
|
|
|
|
||||||||||||||||||||||||||||
|
Freddie Mac
|
|
$6,751
|
|
|
($31
|
)
|
|
($213
|
)
|
|
($244
|
)
|
|
$56
|
|
|
$—
|
|
|
($1,546
|
)
|
|
($920
|
)
|
|
$—
|
|
|
$—
|
|
|
$4,097
|
|
|
($7
|
)
|
||||||||||||
|
Other agency
|
46
|
|
—
|
|
(1
|
)
|
(1
|
)
|
—
|
|
—
|
|
—
|
|
(6
|
)
|
—
|
|
(1
|
)
|
38
|
|
—
|
|
||||||||||||||||||||||||
|
Non-agency RMBS
|
3,933
|
|
948
|
|
(641
|
)
|
307
|
|
—
|
|
—
|
|
(2,481
|
)
|
(356
|
)
|
—
|
|
—
|
|
1,403
|
|
23
|
|
||||||||||||||||||||||||
|
Non-agency CMBS
|
1
|
|
—
|
|
—
|
|
—
|
|
—
|
|
—
|
|
—
|
|
(1
|
)
|
—
|
|
—
|
|
—
|
|
—
|
|
||||||||||||||||||||||||
|
Obligations of states and political subdivisions
|
357
|
|
—
|
|
(3
|
)
|
(3
|
)
|
—
|
|
—
|
|
—
|
|
(117
|
)
|
—
|
|
—
|
|
237
|
|
—
|
|
||||||||||||||||||||||||
|
Total available-for-sale mortgage-related securities
|
11,088
|
|
|
917
|
|
|
(858
|
)
|
59
|
|
56
|
|
—
|
|
(4,027
|
)
|
|
(1,400
|
)
|
|
—
|
|
|
(1
|
)
|
|
5,775
|
|
|
16
|
|
|||||||||||||||||
|
Trading, at fair value:
|
|
|
||||||||||||||||||||||||||||||||||||||||||||||
|
Mortgage-related securities:
|
|
|
||||||||||||||||||||||||||||||||||||||||||||||
|
Freddie Mac
|
2,907
|
|
(515
|
)
|
—
|
|
(515
|
)
|
1,484
|
|
—
|
|
(1,058
|
)
|
(79
|
)
|
579
|
|
(32
|
)
|
3,286
|
|
(448
|
)
|
||||||||||||||||||||||||
|
Other agency
|
9
|
|
(2
|
)
|
—
|
|
(2
|
)
|
—
|
|
—
|
|
—
|
|
—
|
|
—
|
|
—
|
|
7
|
|
(1
|
)
|
||||||||||||||||||||||||
|
All other
|
1
|
|
—
|
|
—
|
|
—
|
|
—
|
|
—
|
|
—
|
|
—
|
|
—
|
|
—
|
|
1
|
|
—
|
|
||||||||||||||||||||||||
|
Total trading mortgage-related securities
|
2,917
|
|
|
(517
|
)
|
|
—
|
|
|
(517
|
)
|
|
1,484
|
|
|
—
|
|
|
(1,058
|
)
|
|
(79
|
)
|
|
579
|
|
|
(32
|
)
|
|
3,294
|
|
|
(449
|
)
|
|||||||||||||
|
Other assets:
|
||||||||||||||||||||||||||||||||||||||||||||||||
|
Guarantee asset
|
3,171
|
|
(80
|
)
|
—
|
|
(80
|
)
|
—
|
|
1,118
|
|
—
|
|
(576
|
)
|
—
|
|
—
|
|
3,633
|
|
(80
|
)
|
||||||||||||||||||||||||
|
All other, at fair value
|
45
|
|
28
|
|
—
|
|
28
|
|
102
|
|
31
|
|
(57
|
)
|
(12
|
)
|
—
|
|
—
|
|
137
|
|
25
|
|
||||||||||||||||||||||||
|
Total other assets
|
|
$3,216
|
|
|
|
($52
|
)
|
|
|
$—
|
|
|
($52
|
)
|
|
$102
|
|
|
|
$1,149
|
|
|
|
($57
|
)
|
|
|
($588
|
)
|
|
|
$—
|
|
|
|
$—
|
|
|
$3,770
|
|
|
($55
|
)
|
|||||
|
|
|
|
|
|
|
|
|
|
|
|
|
|
|
|
|
|
|
|
|
|
|
|||||||||||||||||||||||||||
|
|
Balance,
January 1, 2018 |
Realized and unrealized (gains) losses
|
|
Purchases
|
|
Issues
|
|
Sales
|
|
Settlements,
net |
|
Transfers
into Level 3 (1) |
|
Transfers
out of Level 3 (1) |
|
Balance,
December 31, 2018 |
|
Unrealized
(gains) losses still held (3) |
||||||||||||||||||||||||||||||
|
|
Included in
earnings |
Included in
other comprehensive income |
|
Total
|
|
|
|
|
|
|
|
|
||||||||||||||||||||||||||||||||||||
|
|
|
|||||||||||||||||||||||||||||||||||||||||||||||
|
Liabilities
|
|
|
|
|
|
|
|
|
|
|
|
|
|
|
||||||||||||||||||||||||||||||||||
|
Debt securities of consolidated trusts held by third parties, at fair value
|
|
$630
|
|
|
($2
|
)
|
|
$—
|
|
|
($2
|
)
|
|
$—
|
|
|
$100
|
|
|
$—
|
|
|
$—
|
|
|
$—
|
|
|
$—
|
|
|
$728
|
|
|
($2
|
)
|
||||||||||||
|
Other debt, at fair value
|
137
|
|
—
|
|
—
|
|
—
|
|
—
|
|
2
|
|
—
|
|
(5
|
)
|
—
|
|
—
|
|
134
|
|
—
|
|
||||||||||||||||||||||||
|
Net derivatives
(2)
|
|
$57
|
|
|
$37
|
|
|
$—
|
|
|
$37
|
|
|
$—
|
|
|
$15
|
|
|
$—
|
|
|
($18
|
)
|
|
$—
|
|
|
$—
|
|
|
$91
|
|
|
$20
|
|
||||||||||||
Referenced footnotes are included after the prior period tables.
|
FREDDIE MAC
| 2018 Form 10-K
|
321
|
|
|
Financial Statements
|
Notes to the Consolidated Financial Statements |
Note 15
|
|
Year Ended December 31, 2017
|
||||||||||||||||||||||||||||||||||||||||||||||||
|
|
Balance,
January 1,
2017
|
Realized and unrealized gains (losses)
|
Purchases
|
Issues
|
Sales
|
Settlements,
net
|
Transfers
into
Level 3
(1)
|
Transfers
out of
Level 3
(1)
|
Balance,
December 31,
2017
|
Unrealized
gains (losses)
still held
(3)
|
||||||||||||||||||||||||||||||||||||||
|
(In millions)
|
Included in
earnings
|
Included in
other
comprehensive
income
|
Total
|
|||||||||||||||||||||||||||||||||||||||||||||
|
|
||||||||||||||||||||||||||||||||||||||||||||||||
|
Assets
|
||||||||||||||||||||||||||||||||||||||||||||||||
|
Investments in securities:
|
||||||||||||||||||||||||||||||||||||||||||||||||
|
Available-for-sale, at fair value:
|
||||||||||||||||||||||||||||||||||||||||||||||||
|
Mortgage-related securities:
|
||||||||||||||||||||||||||||||||||||||||||||||||
|
Freddie Mac
|
|
$9,847
|
|
|
($12
|
)
|
|
$103
|
|
|
$91
|
|
|
$2,175
|
|
|
$—
|
|
|
($932
|
)
|
|
($1,352
|
)
|
|
$17
|
|
|
($3,095
|
)
|
|
$6,751
|
|
|
($22
|
)
|
||||||||||||
|
Other agency
|
66
|
|
—
|
|
(1
|
)
|
(1
|
)
|
—
|
|
—
|
|
—
|
|
(11
|
)
|
—
|
|
(8
|
)
|
46
|
|
—
|
|
||||||||||||||||||||||||
|
Non-agency RMBS
|
11,797
|
|
1,564
|
|
(270
|
)
|
1,294
|
|
—
|
|
—
|
|
(7,688
|
)
|
(1,470
|
)
|
—
|
|
—
|
|
3,933
|
|
124
|
|
||||||||||||||||||||||||
|
Non-agency CMBS
|
3,366
|
|
347
|
|
(120
|
)
|
227
|
|
—
|
|
—
|
|
(3,556
|
)
|
(36
|
)
|
—
|
|
—
|
|
1
|
|
2
|
|
||||||||||||||||||||||||
|
Obligations of states and political subdivisions
|
665
|
|
1
|
|
(3
|
)
|
(2
|
)
|
—
|
|
—
|
|
—
|
|
(306
|
)
|
—
|
|
—
|
|
357
|
|
—
|
|
||||||||||||||||||||||||
|
Total available-for-sale mortgage-related securities
|
25,741
|
|
1,900
|
|
|
(291
|
)
|
1,609
|
|
2,175
|
|
|
—
|
|
|
(12,176
|
)
|
|
(3,175
|
)
|
|
17
|
|
|
(3,103
|
)
|
11,088
|
|
104
|
|
||||||||||||||||||
|
Trading, at fair value:
|
||||||||||||||||||||||||||||||||||||||||||||||||
|
Mortgage-related securities:
|
|
|
||||||||||||||||||||||||||||||||||||||||||||||
|
Freddie Mac
|
1,207
|
|
(136
|
)
|
—
|
|
(136
|
)
|
2,655
|
|
—
|
|
(592
|
)
|
(36
|
)
|
14
|
|
(205
|
)
|
2,907
|
|
(125
|
)
|
||||||||||||||||||||||||
|
Other agency
|
12
|
|
(3
|
)
|
—
|
|
(3
|
)
|
—
|
|
—
|
|
—
|
|
—
|
|
—
|
|
—
|
|
9
|
|
(3
|
)
|
||||||||||||||||||||||||
|
All other
|
1
|
|
—
|
|
—
|
|
—
|
|
—
|
|
—
|
|
—
|
|
—
|
|
—
|
|
—
|
|
1
|
|
—
|
|
||||||||||||||||||||||||
|
Total trading mortgage-related securities
|
1,220
|
|
(139
|
)
|
—
|
|
(139
|
)
|
2,655
|
|
|
—
|
|
|
(592
|
)
|
|
(36
|
)
|
|
14
|
|
|
(205
|
)
|
2,917
|
|
(128
|
)
|
|||||||||||||||||||
|
Other assets:
|
|
|
|
|
|
|||||||||||||||||||||||||||||||||||||||||||
|
Guarantee asset
|
2,298
|
|
(27
|
)
|
—
|
|
(27
|
)
|
—
|
|
1,387
|
|
—
|
|
(487
|
)
|
—
|
|
—
|
|
3,171
|
|
(26
|
)
|
||||||||||||||||||||||||
|
All other, at fair value
|
2
|
|
(10
|
)
|
—
|
|
(10
|
)
|
33
|
|
31
|
|
(11
|
)
|
—
|
|
—
|
|
—
|
|
45
|
|
(10
|
)
|
||||||||||||||||||||||||
|
Total other assets
|
|
$2,300
|
|
|
($37
|
)
|
|
$—
|
|
|
($37
|
)
|
|
$33
|
|
|
|
$1,418
|
|
|
|
($11
|
)
|
|
|
($487
|
)
|
|
|
$—
|
|
|
|
$—
|
|
|
$3,216
|
|
|
($36
|
)
|
|||||||
|
|
Balance,
January 1, 2017 |
Realized and unrealized (gains) losses
|
Purchases
|
Issues
|
Sales
|
Settlements,
net
|
Transfers
into
Level 3
(1)
|
Transfers
out of
Level 3
(1)
|
Balance,
December 31, 2017 |
Unrealized
(gains)
losses
still held
(3)
|
||||||||||||||||||||||||||||||||||||||
|
|
Included in
earnings
|
Included in
other
comprehensive
income
|
Total
|
|||||||||||||||||||||||||||||||||||||||||||||
|
|
||||||||||||||||||||||||||||||||||||||||||||||||
|
Liabilities
|
||||||||||||||||||||||||||||||||||||||||||||||||
|
Debt securities of consolidated trusts held by third parties, at fair value
|
|
$—
|
|
|
$—
|
|
|
$—
|
|
|
$—
|
|
|
$—
|
|
|
$630
|
|
|
$—
|
|
|
$—
|
|
|
$—
|
|
|
$—
|
|
|
$630
|
|
|
$—
|
|
||||||||||||
|
Other debt, at fair value
|
95
|
|
—
|
|
—
|
|
—
|
|
—
|
|
50
|
|
—
|
|
(8
|
)
|
—
|
|
—
|
|
137
|
|
—
|
|
||||||||||||||||||||||||
|
Net derivatives
(2)
|
|
$52
|
|
|
$40
|
|
|
$—
|
|
|
$40
|
|
|
$—
|
|
|
($10
|
)
|
|
$—
|
|
|
($25
|
)
|
|
$—
|
|
|
$—
|
|
|
$57
|
|
|
$20
|
|
||||||||||||
|
(1)
|
Transfers out of Level 3 during 2018 and 2017 consisted primarily of certain mortgage-related securities due to an increased volume and level of activity in the market and availability of price quotes from dealers and third-party pricing services. Certain Freddie Mac securities are classified as Level 3 at issuance and generally are classified as Level 2 when they begin trading. Transfers into Level 3 during 2018 and 2017 consisted primarily of certain mortgage-related securities due to a decrease in market activity and the availability of relevant price quotes from dealers and third-party pricing services.
|
|
(2)
|
Amounts are the net of derivative assets and liabilities prior to counterparty netting, cash collateral netting, net trade/settle receivable or payable, and net derivative interest receivable or payable.
|
|
(3)
|
Represents the amount of total gains or losses for the period, included in earnings, attributable to the change in unrealized gains and losses related to assets and liabilities classified as Level 3 that were still held at December 31, 2018 and December 31, 2017, respectively. Included in these amounts are other-than temporary impairments recorded on available-for-sale securities.
|
|
FREDDIE MAC
| 2018 Form 10-K
|
322
|
|
|
Financial Statements
|
Notes to the Consolidated Financial Statements |
Note 15
|
The tables below provide valuation techniques, the range, and the weighted average of significant unobservable inputs for Level 3 assets and liabilities measured on our consolidated balance sheets at fair value on a recurring basis.
Table 15.3 - Quantitative Information about Recurring Level 3 Fair Value Measurements
|
|
December 31, 2018
|
|||||||||||||
|
|
Level 3
Fair Value |
|
Predominant
Valuation Technique(s) |
|
Unobservable Inputs
|
|||||||||
|
(
Dollars in millions
, except for certain unobservable inputs as shown)
|
Type
|
|
Range
|
|
Weighted
Average |
|||||||||
|
Assets
|
|
|
|
|
|
|
|
|
|
|||||
|
Available-for-sale, at fair value
|
|
|
|
|
|
|
|
|
|
|||||
|
Mortgage-related securities
|
|
|
|
|
|
|
|
|
|
|||||
|
Freddie Mac
|
|
$2,838
|
|
Discounted cash flows
|
OAS
|
30 - 325 bps
|
81 bps
|
|
||||||
|
1,259
|
|
Single external source
|
External pricing sources
|
$96.1 - $104.1
|
|
$102.3
|
|
|||||||
|
Non-agency RMBS
|
1,403
|
|
|
Median of external sources
|
|
External pricing sources
|
|
$64.3 - $71.1
|
|
|
$67.3
|
|
||
|
Obligations of states and political subdivisions
|
237
|
|
|
Single external source
|
|
External pricing sources
|
|
$93.1 - $110.7
|
|
|
$100.7
|
|
||
|
Trading, at fair value
|
|
|
|
|
|
|
|
|
|
|||||
|
Mortgage-related securities
|
|
|
|
|
|
|
|
|
|
|
|
|||
|
Freddie Mac
|
1,587
|
|
|
Single external source
|
|
External pricing sources
|
|
$0.0 - $99.2
|
|
|
$56.6
|
|
||
|
1,178
|
|
Discounted cash flows
|
OAS
|
(21,945) - 6,639 bps
|
90 bps
|
|
||||||||
|
521
|
|
Other
|
||||||||||||
|
Guarantee asset, at fair value
|
3,391
|
|
|
Discounted cash flows
|
|
OAS
|
|
17-198 bps
|
|
49 bps
|
|
|||
|
242
|
|
Other
|
||||||||||||
|
Insignificant Level 3 assets
(1)
|
184
|
|
||||||||||||
|
Total level 3 assets
|
12,840
|
|
||||||||||||
|
Liabilities
|
|
|
|
|
|
|
|
|
|
|||||
|
Debt securities of consolidated trusts held by third parties, at fair value
|
728
|
|
Single External Source
|
External Pricing Sources
|
$97.4 - $101.1
|
|
$99.6
|
|
||||||
|
Insignificant Level 3 liabilities
(1)
|
226
|
|
|
|
|
|
|
|
|
|
|
|||
Referenced footnotes are included after the next table.
|
FREDDIE MAC
| 2018 Form 10-K
|
323
|
|
|
Financial Statements
|
Notes to the Consolidated Financial Statements |
Note 15
|
|
|
December 31, 2017
|
|||||||||||||
|
|
Level 3
Fair
Value
|
Predominant
Valuation
Technique(s)
|
Unobservable Inputs
|
|||||||||||
|
(
Dollars in millions
, except for certain unobservable inputs as shown)
|
Type
|
Range
|
Weighted
Average
|
|||||||||||
|
Assets
|
||||||||||||||
|
Available-for-sale, at fair value
|
||||||||||||||
|
Mortgage-related securities
|
||||||||||||||
|
Freddie Mac
|
|
$5,020
|
|
Discounted cash flows
|
OAS
|
27 - 501 bps
|
68 bps
|
|
||||||
|
1,731
|
|
Single external source
|
External pricing sources
|
$97.1 - $108.9
|
|
$108.5
|
|
|||||||
|
Non-agency RMBS
|
3,933
|
|
Median of external sources
|
External pricing sources
|
$75.6 - $80.8
|
|
$77.7
|
|
||||||
|
Obligations of states and political subdivisions
|
357
|
|
Median of external sources
|
External pricing sources
|
$101.2 - $101.6
|
|
$101.4
|
|
||||||
|
Trading, at fair value
|
|
|
||||||||||||
|
Mortgage-related securities
|
|
|
||||||||||||
|
Freddie Mac
|
|
$2,068
|
|
Single external source
|
External pricing sources
|
$1.2 - $101.3
|
|
$97.9
|
|
|||||
|
582
|
|
Discounted cash flows
|
OAS
|
(8,905) - 27,202 bps
|
(88) bps
|
|
||||||||
|
257
|
|
Other
|
||||||||||||
|
Guarantee asset, at fair value
|
3,171
|
|
Discounted cash flows
|
OAS
|
17 - 198 bps
|
45 bps
|
|
|||||||
|
Insignificant Level 3 assets
(1)
|
110
|
|
||||||||||||
|
Total level 3 assets
|
|
$17,229
|
|
|||||||||||
|
Liabilities
|
||||||||||||||
|
Debt securities of consolidated trusts held by third parties, at fair value
|
630
|
|
Single external source
|
External pricing sources
|
$99.2 - $100.2
|
|
$100.1
|
|
||||||
|
Insignificant Level 3 liabilities
(1)
|
202
|
|
||||||||||||
|
(1)
|
Represents the aggregate amount of Level 3 assets or liabilities measured at fair value on a recurring basis that are individually and in the aggregate insignificant.
|
|
FREDDIE MAC
| 2018 Form 10-K
|
324
|
|
|
Financial Statements
|
Notes to the Consolidated Financial Statements |
Note 15
|
Assets Measured at Fair Value on a Non-Recurring Basis
We may be required, from time to time, to measure certain assets at fair value on a non-recurring basis after our initial recognition. These adjustments usually result from the application of lower-of-cost-or-fair-value accounting or measurement of impairment based on the fair value of the underlying collateral. Certain of the fair values in the tables below were not obtained as of the period end, but were obtained during the period.
The table below presents assets measured on our consolidated balance sheets at fair value on a non-recurring basis.
Table 15.4 - Assets Measured at Fair Value on a Non-Recurring Basis
|
December 31, 2018
|
December 31, 2017
|
|||||||||||||||||||||||||
|
(In millions)
|
Level 1
|
Level 2
|
Level 3
|
Total
|
Level 1
|
Level 2
|
Level 3
|
Total
|
||||||||||||||||||
|
Assets measured at fair value on a non-recurring basis:
|
||||||||||||||||||||||||||
|
Mortgage loans
(1)
|
|
$—
|
|
|
$24
|
|
|
$7,519
|
|
|
$7,543
|
|
|
$—
|
|
|
$494
|
|
|
$6,199
|
|
|
$6,693
|
|
||
|
(1)
|
Includes loans that are classified as held-for-investment and have been measured for impairment based on the fair value of the underlying collateral and held-for-sale loans where the fair value is below cost.
|
The tables below provide valuation techniques, the range, and the weighted average of significant unobservable inputs for Level 3 assets and liabilities measured on our consolidated balance sheets at fair value on a non-recurring basis.
Table 15.5 - Quantitative Information about Non-Recurring Level 3 Fair Value Measurements
|
|
December 31, 2018
|
|||||||||||
|
|
Level 3
Fair
Value
|
Predominant
Valuation
Technique(s)
|
Unobservable Inputs
|
|||||||||
|
(
Dollars in millions
, except for certain unobservable inputs as shown)
|
Type
|
Range
|
Weighted
Average
|
|||||||||
|
Non-recurring fair value measurements
|
||||||||||||
|
Mortgage loans
|
|
|
||||||||||
|
|
$7,519
|
|
Internal model
|
Historical sales proceeds
|
$3,000 - $750,500
|
$177,725
|
||||||
|
Internal model
|
Housing sales index
|
44 - 480 bps
|
108 bps
|
|||||||||
|
Median of external sources
|
External pricing sources
|
$36.2 - $94.6
|
$82.5
|
|||||||||
|
|
December 31, 2017
|
|||||||||||
|
|
Level 3
Fair
Value
|
Predominant
Valuation
Technique(s)
|
Unobservable Inputs
|
|||||||||
|
(
Dollars in millions
, except for certain unobservable inputs as shown)
|
Type
|
Range
|
Weighted
Average
|
|||||||||
|
Non-recurring fair value measurements
|
||||||||||||
|
Mortgage loans
|
|
$6,199
|
|
|||||||||
|
Internal model
|
Historical sales proceeds
|
$3,000 - $899,000
|
$176,558
|
|||||||||
|
Internal model
|
Housing sales index
|
43 - 394 bps
|
102 bps
|
|||||||||
|
Median of external sources
|
External pricing sources
|
$36.5 - $94.9
|
$80.9
|
|||||||||
|
FREDDIE MAC
| 2018 Form 10-K
|
325
|
|
|
Financial Statements
|
Notes to the Consolidated Financial Statements |
Note 15
|
Fair Value of Financial Instruments
The tables below present the carrying value and estimated fair value of our financial instruments. For certain types of financial instruments, such as cash and cash equivalents, securities purchased under agreements to resell, secured lending and other, and certain debt, the carrying value on our GAAP balance sheets approximates fair value, as these assets and liabilities are short-term in nature and have limited fair value volatility.
Table 15.6 - Fair Value of Financial Instruments
|
|
December 31, 2018
|
||||||||||||||||||||||||
|
|
GAAP Measurement Category
(1)
|
GAAP Carrying Amount
|
Fair Value
|
||||||||||||||||||||||
|
(In millions)
|
Level 1
|
Level 2
|
Level 3
|
Netting
Adjustments
(2)
|
Total
|
||||||||||||||||||||
|
Financial Assets
|
|||||||||||||||||||||||||
|
Cash and cash equivalents
(3)
|
Amortized cost
|
|
$7,273
|
|
|
$7,273
|
|
|
$—
|
|
|
$—
|
|
|
$—
|
|
|
$7,273
|
|
||||||
|
Securities purchased under agreements to resell
|
Amortized cost
|
34,771
|
|
—
|
|
34,771
|
|
—
|
|
—
|
|
34,771
|
|
||||||||||||
|
Investments in securities:
|
|
|
|
|
|
||||||||||||||||||||
|
Available-for-sale, at fair value
|
FV - OCI
|
33,563
|
|
—
|
|
27,788
|
|
5,775
|
|
—
|
|
33,563
|
|
||||||||||||
|
Trading, at fair value
|
FV - NI
|
35,548
|
|
15,885
|
|
16,369
|
|
3,294
|
|
—
|
|
35,548
|
|
||||||||||||
|
Total investments in securities
|
69,111
|
|
15,885
|
|
44,157
|
|
9,069
|
|
—
|
|
69,111
|
|
|||||||||||||
|
Mortgage loans:
|
|||||||||||||||||||||||||
|
Loans held by consolidated trusts
|
1,842,850
|
|
—
|
|
1,605,874
|
|
209,542
|
|
—
|
|
1,815,416
|
|
|||||||||||||
|
Loans held by Freddie Mac
|
84,128
|
|
—
|
|
33,946
|
|
52,212
|
|
—
|
|
86,158
|
|
|||||||||||||
|
Total mortgage loans
|
Various
(4)
|
1,926,978
|
|
—
|
|
1,639,820
|
|
261,754
|
|
—
|
|
1,901,574
|
|
||||||||||||
|
Derivative assets, net
|
FV - NI
|
335
|
|
—
|
|
6,417
|
|
1
|
|
(6,083
|
)
|
335
|
|
||||||||||||
|
Guarantee asset
|
FV - NI
|
3,633
|
|
—
|
|
—
|
|
3,642
|
|
—
|
|
3,642
|
|
||||||||||||
|
Non-derivative purchase commitments, at fair value
|
FV - NI
|
159
|
|
—
|
|
159
|
|
2
|
|
—
|
|
161
|
|
||||||||||||
|
Secured lending and other
|
Amortized cost
|
1,805
|
|
—
|
|
195
|
|
873
|
|
—
|
|
1,068
|
|
||||||||||||
|
Total financial assets
|
|
$2,044,065
|
|
|
$23,158
|
|
|
$1,725,519
|
|
|
$275,341
|
|
|
($6,083
|
)
|
|
$2,017,935
|
|
|||||||
|
Financial Liabilities
|
|||||||||||||||||||||||||
|
Debt, net:
|
|||||||||||||||||||||||||
|
Debt securities of consolidated trusts
held by third parties
|
|
$1,792,677
|
|
|
$—
|
|
|
$1,759,911
|
|
|
$2,698
|
|
|
$—
|
|
|
$1,762,609
|
|
|||||||
|
Other debt
|
252,273
|
|
—
|
|
251,543
|
|
3,629
|
|
—
|
|
255,172
|
|
|||||||||||||
|
Total debt, net
|
Various
(5)
|
2,044,950
|
|
—
|
|
2,011,454
|
|
6,327
|
|
—
|
|
2,017,781
|
|
||||||||||||
|
Derivative liabilities, net
|
FV - NI
|
583
|
|
—
|
|
4,336
|
|
92
|
|
(3,845
|
)
|
583
|
|
||||||||||||
|
Guarantee obligation
|
Amortized cost
|
3,561
|
|
—
|
|
—
|
|
4,146
|
|
—
|
|
4,146
|
|
||||||||||||
|
Non-derivative purchase commitments, at fair value
|
FV - NI
|
17
|
|
—
|
|
17
|
|
11
|
|
—
|
|
28
|
|
||||||||||||
|
Total financial liabilities
|
|
$2,049,111
|
|
|
$—
|
|
|
$2,015,807
|
|
|
$10,576
|
|
|
($3,845
|
)
|
|
$2,022,538
|
|
|||||||
|
(1)
|
FV - NI denotes fair value through net income. FV - OCI denotes fair value through other comprehensive income.
|
|
(2)
|
Represents counterparty netting, cash collateral netting, and net derivative interest receivable or payable.
|
|
(3)
|
The current and prior period presentation has been modified to include restricted cash and cash equivalents due to recently adopted accounting guidance.
|
|
(4)
|
As of December 31, 2018, the GAAP carrying amounts measured at amortized cost, lower-of-cost-or-fair-value and FV - NII were
$1.9 trillion
,
$18.5 billion
and
$23.1 billion
, respectively.
|
|
(5)
|
As of December 31, 2018, the GAAP carrying amounts measured at amortized cost and FV - NII were
$2.0 trillion
and
$5.1 billion
, respectively.
|
|
FREDDIE MAC
| 2018 Form 10-K
|
326
|
|
|
Financial Statements
|
Notes to the Consolidated Financial Statements |
Note 15
|
|
December 31, 2017
|
|||||||||||||||||||||||||
|
|
GAAP Measurement Category
(1)
|
GAAP Carrying Amount
|
Fair Value
|
||||||||||||||||||||||
|
(In millions)
|
Level 1
|
Level 2
|
Level 3
|
Netting Adjustments
(2)
|
Total
|
||||||||||||||||||||
|
Financial Assets
|
|||||||||||||||||||||||||
|
Cash and cash equivalents
(3)
|
Amortized cost
|
|
$9,811
|
|
|
$9,811
|
|
|
$—
|
|
|
$—
|
|
|
$—
|
|
|
$9,811
|
|
||||||
|
Securities purchased under agreements to resell
|
Amortized cost
|
55,903
|
|
—
|
|
55,903
|
|
—
|
|
—
|
|
55,903
|
|
||||||||||||
|
Investments in securities:
|
|
|
|||||||||||||||||||||||
|
Available-for-sale, at fair value
|
FV - OCI
|
43,597
|
|
—
|
|
32,509
|
|
11,088
|
|
—
|
|
43,597
|
|
||||||||||||
|
Trading, at fair value
|
FV - NI
|
40,721
|
|
20,159
|
|
17,645
|
|
2,917
|
|
—
|
|
40,721
|
|
||||||||||||
|
Total investments in securities
|
84,318
|
|
20,159
|
|
|
50,154
|
|
|
14,005
|
|
|
—
|
|
84,318
|
|
||||||||||
|
Mortgage loans:
|
|
|
|||||||||||||||||||||||
|
Loans held by consolidated trusts
|
1,774,286
|
|
—
|
|
1,635,137
|
|
145,911
|
|
—
|
|
1,781,048
|
|
|||||||||||||
|
Loans held by Freddie Mac
|
96,931
|
|
—
|
|
32,169
|
|
67,932
|
|
—
|
|
100,101
|
|
|||||||||||||
|
Total mortgage loans
|
Various
(4)
|
1,871,217
|
|
—
|
|
|
1,667,306
|
|
|
213,843
|
|
|
—
|
|
1,881,149
|
|
|||||||||
|
Derivative assets, net
|
FV - NI
|
375
|
|
—
|
|
8,830
|
|
8
|
|
(8,463
|
)
|
375
|
|
||||||||||||
|
Guarantee asset
|
FV - NI
|
3,171
|
|
—
|
|
—
|
|
3,359
|
|
—
|
|
3,359
|
|
||||||||||||
|
Non-derivative purchase commitments, at fair value
|
FV - NI
|
137
|
|
—
|
|
137
|
|
55
|
|
—
|
|
192
|
|
||||||||||||
|
Secured lending and other
|
Amortized cost
|
1,269
|
|
—
|
|
473
|
|
796
|
|
—
|
|
1,269
|
|
||||||||||||
|
Total financial assets
|
|
$2,026,201
|
|
|
$29,970
|
|
|
|
$1,782,803
|
|
|
|
$232,066
|
|
|
|
($8,463
|
)
|
|
$2,036,376
|
|
||||
|
Financial Liabilities
|
|
|
|||||||||||||||||||||||
|
Debt, net:
|
|
|
|||||||||||||||||||||||
|
Debt securities of consolidated trusts
held by third parties
|
|
$1,720,996
|
|
|
$—
|
|
|
$1,721,091
|
|
|
$2,679
|
|
|
$—
|
|
|
$1,723,770
|
|
|||||||
|
Other debt
|
313,634
|
|
—
|
|
313,688
|
|
3,892
|
|
—
|
|
317,580
|
|
|||||||||||||
|
Total debt, net
|
Various
(5)
|
2,034,630
|
|
—
|
|
|
2,034,779
|
|
|
6,571
|
|
|
—
|
|
2,041,350
|
|
|||||||||
|
Derivative liabilities, net
|
FV - NI
|
269
|
|
—
|
|
7,424
|
|
65
|
|
(7,220
|
)
|
269
|
|
||||||||||||
|
Guarantee obligation
|
Amortized cost
|
3,081
|
|
—
|
|
—
|
|
3,742
|
|
—
|
|
3,742
|
|
||||||||||||
|
Non-derivative purchase commitments, at fair value
|
FV - NI
|
4
|
|
—
|
|
4
|
|
15
|
|
—
|
|
19
|
|
||||||||||||
|
Total financial liabilities
|
|
$2,037,984
|
|
|
$—
|
|
|
|
$2,042,207
|
|
|
|
$10,393
|
|
|
|
($7,220
|
)
|
|
$2,045,380
|
|
||||
|
(1)
|
FV - NI denotes fair value through net income. FV - OCI denotes fair value through other comprehensive income.
|
|
(2)
|
Represents counterparty netting, cash collateral netting and net derivative interest receivable or payable.
|
|
(3)
|
The current and prior period presentation has been modified to include restricted cash and cash equivalents due to recently adopted accounting guidance.
|
|
(4)
|
As of December 31, 2017, the GAAP carrying amounts measured at amortized cost, lower-of-cost-or-fair-value and FV - NII were
$1.8 trillion
,
$14.7 billion
and
$20.1 billion
, respectively.
|
|
(5)
|
As of December 31, 2017, the GAAP carrying amounts measured at amortized cost and FV - NII were
$2.0 trillion
and
$5.8 billion
, respectively.
|
|
FREDDIE MAC
| 2018 Form 10-K
|
327
|
|
|
Financial Statements
|
Notes to the Consolidated Financial Statements |
Note 15
|
HARP Loans
The fair value of mortgage loans includes loans refinanced under HARP of
$30.2 billion
as of December 31, 2017, where the beneficial pricing afforded to HARP is reflected in the estimated loan fair value. The fair value of HARP loans reflected the total compensation that we received for the delivery of the HARP loans, based on the pricing that we were willing to offer because HARP was a part of a broader government program intended to provide assistance to homeowners and prevent foreclosures. HARP ended on December 31, 2018, so the beneficial pricing afforded to HARP loans is no longer reflected in the pricing structure of our guarantee fees or the fair value of the HARP loans as of December 31, 2018. If these benefits were not reflected in the pricing for these loans as of December 31, 2017, the fair value of our loans would have decreased by
$2.1 billion
.
Fair Value Option
We elected the fair value option for multifamily held-for-sale loans, certain multifamily held-for-sale loan purchase commitments, and certain long-term debt.
We elected the fair value option for multifamily held-for-sale loans, certain multifamily held-for-sale loan purchase commitments, and certain long-term debt.
Multifamily Held-for-Sale Loans and Held-for-Sale Commitments
We elected the fair value option for multifamily loan purchase commitments and the related loans that were acquired for securitization. We use derivatives to economically hedge the interest rate-related fair value changes of the multifamily commitments and loans for which we have elected the fair value option. These loans are classified as held-for-sale loans on our consolidated balance sheets to reflect our intent to sell in the future and are measured at fair value on a recurring basis, with subsequent gains or losses related to changes in fair value (net of accrued interest income) reported in mortgage loans gains (losses) on our consolidated statements of comprehensive income. We elected to report separately the portion of the changes in fair value of the loans related to accrued interest from the remaining changes in fair value. Related interest income continues to be reported, based on the stated terms of the loans, as interest income on our consolidated statements of comprehensive income.
Debt Securities of Consolidated Trusts Held by Third Parties and Other Debt
We elected the fair value option on debt that contains embedded derivatives, primarily certain STACR debt notes. Fair value changes are recorded in debt gains (losses) on our consolidated statements of comprehensive income. For debt where we have elected the fair value option,
upfront costs and fees are recognized in earnings as incurred and not deferred. Related interest expense continues to be reported as interest expense based on the stated terms of the debt securities.
The table below presents the fair value and UPB related to certain loans and long-term debt for which we have elected the fair value option. This table does not include interest-only securities related to debt securities of consolidated trusts held by third parties with a fair value of
$26 million
and
$9 million
and multifamily held-for-sale loan purchase commitments with a fair value of
$142 million
and
$133 million
, as of December 31, 2018 and December 31, 2017, respectively.
|
FREDDIE MAC
| 2018 Form 10-K
|
328
|
|
|
Financial Statements
|
Notes to the Consolidated Financial Statements |
Note 15
|
Table 15.7 - Difference between Fair Value and Unpaid Principal Balance for Certain Financial Instruments with Fair Value Option Elected
|
|
December 31, 2018
|
December 31, 2017
|
||||||||||||||||||
|
(In millions)
|
Multifamily
Held-For-Sale
Loans
|
Other Debt -
Long Term
|
Debt Securities of Consolidated Trusts Held by Third Parties
(1)
|
Multifamily
Held-For-Sale
Loans
|
Other Debt -
Long Term
|
Debt Securities of Consolidated Trusts Held by Third Parties
(1)
|
||||||||||||||
|
Fair value
|
|
$23,106
|
|
|
$4,357
|
|
|
$728
|
|
|
$20,054
|
|
|
$5,160
|
|
|
$630
|
|
||
|
Unpaid principal balance
|
22,693
|
|
3,998
|
|
730
|
|
19,762
|
|
4,666
|
|
630
|
|
||||||||
|
Difference
|
|
$413
|
|
|
$359
|
|
|
($2
|
)
|
|
$292
|
|
|
$494
|
|
|
$—
|
|
||
Changes in Fair Value Under the Fair Value Option Election
The table below presents the changes in fair value included in non-interest income (loss) on our consolidated statements of comprehensive income, related to items for which we have elected the fair value option.
Table 15.8 - Changes in Fair Value under the Fair Value Option Election
|
December 31, 2018
|
December 31, 2017
|
December 31, 2016
|
|||||
|
(In millions)
|
Gains (Losses)
|
||||||
|
Multifamily held-for-sale loans
|
(745
|
)
|
2
|
|
250
|
|
|
|
Multifamily held-for-sale loan purchase commitments
|
777
|
|
1,098
|
|
663
|
|
|
|
Other debt - long term
|
138
|
|
(212
|
)
|
—
|
|
|
|
Debt securities of consolidated trusts held by third parties
|
5
|
|
22
|
|
63
|
|
|
Changes in fair value attributable to instrument-specific credit risk were not material for the years ended December 31, 2018, 2017 or 2016 for any assets or liabilities for which we elected the fair value option.
|
FREDDIE MAC
| 2018 Form 10-K
|
329
|
|
|
Financial Statements
|
Notes to the Consolidated Financial Statements |
Note 16
|
NOTE 16
Legal Contingencies
We are involved as a party in a variety of legal and regulatory proceedings arising from time to time in the ordinary course of business including, among other things, contractual disputes, personal injury claims, employment-related litigation, and other legal proceedings incidental to our business. We are frequently involved, directly or indirectly, in litigation involving mortgage foreclosures. From time to time, we are also involved in proceedings arising from our termination of a seller's or servicer's eligibility to sell loans to, and/or service loans for, us. In these cases, the former seller or servicer sometimes seeks damages against us for wrongful termination under a variety of legal theories. In addition, we are sometimes sued in connection with the origination or servicing of loans. These suits typically involve claims alleging wrongful actions of sellers and servicers. Our contracts with our sellers and servicers generally provide for indemnification of Freddie Mac against liability arising from sellers' and servicers' wrongful actions with respect to loans sold to or serviced for Freddie Mac.
Litigation and claims resolution are subject to many uncertainties and are not susceptible to accurate prediction. In accordance with the accounting guidance for contingencies, we reserve for litigation claims and assessments asserted or threatened against us when a loss is probable (as defined in such guidance) and the amount of the loss can be reasonably estimated.
Putative Securities Class Action Lawsuit: Ohio Public Employees Retirement System vs. Freddie Mac, Syron, Et Al.
This putative securities class action lawsuit was filed against Freddie Mac and certain former officers on January 18, 2008 in the U.S. District Court for the Northern District of Ohio purportedly on behalf of a class of purchasers of Freddie Mac stock from August 1, 2006 through November 20, 2007. FHFA later intervened as Conservator, and the plaintiff amended its complaint on several occasions. The plaintiff alleged, among other things, that the defendants violated federal securities laws by making false and misleading statements concerning our business, risk management, and the procedures we put into place to protect the company from problems in the mortgage industry. The plaintiff seeks unspecified damages and interest, and reasonable costs and expenses, including attorney and expert fees.
In October 2013, defendants filed motions to dismiss the complaint. In October 2014, the District Court granted defendants' motions and dismissed the case in its entirety against all defendants, with prejudice. In November 2014, plaintiff filed a notice of appeal in the U.S. Court of Appeals for the Sixth Circuit. On July 20, 2016, the Court of Appeals reversed the District Court's dismissal and remanded the case to the District Court for further proceedings. On August 14, 2018, the District Court denied the plaintiff's motion for class certification. On January 23, 2019, the Court of Appeals denied plaintiff's petition for leave to appeal that decision.
At present, it is not possible for us to predict the probable outcome of this lawsuit or any potential effect on our business, financial condition, liquidity, or results of operations. In addition, we are unable to reasonably estimate the possible loss or range of possible loss in the event of an adverse judgment in the foregoing matter due to the following factors, among others: pre-trial litigation is inherently uncertain; while the District Court denied plaintiff's motion for class certification, this denial may be appealed upon the entry of final judgment; and the District Court has not yet ruled upon motions for summary
|
FREDDIE MAC
| 2018 Form 10-K
|
330
|
|
|
Financial Statements
|
Notes to the Consolidated Financial Statements |
Note 16
|
judgment. In particular, absent a final resolution of whether a class will be certified, the identification of a class if one is certified, and the identification of the alleged statement or statements that survive dispositive motions, we cannot reasonably estimate any possible loss or range of possible loss.
LIBOR Lawsuit
On March 14, 2013, Freddie Mac filed a lawsuit in the U.S. District Court for the Eastern District of Virginia against the British Bankers Association and the
16
U.S. Dollar LIBOR panel banks and a number of their affiliates. The case was subsequently transferred to the U.S. District Court for the Southern District of New York. The complaint alleges, among other things, that the defendants fraudulently and collusively depressed LIBOR, a benchmark interest rate indexed to trillions of dollars of financial products, and asserts claims for antitrust violations, breach of contract, tortious interference with contract and fraud. Freddie Mac filed an amended complaint in July 2013, and a second amended complaint in October 2014. In August 2015, the District Court dismissed the portion of our claim related to antitrust violations and fraud and we filed a motion for reconsideration. On March 31, 2016, the District Court granted a portion of our motion, finding personal jurisdiction over certain defendants, and denied the portion of our motion with respect to statutes of limitation for our fraud claims. Subsequently, in a related case, the U.S. Court of Appeals for the Second Circuit reversed the District Court's dismissal of certain plaintiffs' antitrust claims and remanded the case to the District Court for consideration of whether, among other things, the plaintiffs are "efficient enforcers" of the antitrust laws.
On December 20, 2016, after briefing and argument on the defendants' renewed motions to dismiss on personal jurisdiction and efficient enforcer grounds, the District Court denied defendants' motions in part and granted them in part. The District Court held that Freddie Mac is an efficient enforcer of the antitrust laws, but dismissed on personal jurisdiction grounds Freddie Mac's antitrust claims against all defendants except HSBC USA, N.A. Then, in an order issued February 2, 2017, the District Court effectively dismissed Freddie Mac's remaining antitrust claim against HSBC USA, N.A. At present, Freddie Mac's breach of contract actions against Bank of America, N.A., Barclays Bank, Citibank, N.A., Credit Suisse, Deutsche Bank, Royal Bank of Scotland, and UBS AG are its only claims remaining in the District Court.
On February 23, 2018, the Second Circuit reversed the District Court's dismissal of certain plaintiffs' state law fraud and unjust enrichment claims on statutes of limitations grounds. While Freddie Mac was not a party to the appeal, this decision could have the effect of reinstating Freddie Mac's fraud claims against the above-named defendants. The Second Circuit also reversed certain aspects of the District Court's personal jurisdiction rulings and remanded with instructions to allow the named appellant to amend its complaint. On June 15, 2018, Freddie Mac filed a motion for leave to file an amended complaint, along with a proposed amended complaint.
|
FREDDIE MAC
| 2018 Form 10-K
|
331
|
|
|
Financial Statements
|
Notes to the Consolidated Financial Statements |
Note 16
|
Litigation Concerning the Purchase Agreement
Since July 2013, a number of lawsuits have been filed against us concerning the August 2012 amendment to the Purchase Agreement, which created the net worth sweep dividend provisions of the senior preferred stock. The plaintiffs in the lawsuits allege that they are holders of common stock and/or junior preferred stock issued by Freddie Mac and Fannie Mae. (For purposes of this discussion, junior preferred stock refers to the various series of preferred stock of Freddie Mac and Fannie Mae other than the senior preferred stock issued to Treasury.) It is possible that similar lawsuits will be filed in the future. The lawsuits against us are described below.
Litigation in the U.S. District Court for the District of Columbia
In re Fannie Mae/Freddie Mac Senior Preferred Stock Purchase Agreement Class Action Litigations.
This case is the result of the consolidation of three putative class action lawsuits:
Cacciapelle and Bareiss vs. Federal National Mortgage Association, Federal Home Loan Mortgage Corporation and FHFA
, filed on July 29, 2013;
American European Insurance Company vs. Federal National Mortgage Association, Federal Home Loan Mortgage Corporation and FHFA
, filed on July 30, 2013; and
Marneu Holdings, Co. vs. FHFA, Treasury, Federal National Mortgage Association and Federal Home Loan Mortgage Corporation
, filed on September 18, 2013. (The Marneu
case was also filed as a shareholder derivative lawsuit.) A consolidated amended complaint was filed in December 2013. In the consolidated amended complaint, plaintiffs allege, among other items, that the August 2012 amendment to the Purchase Agreement breached Freddie Mac's and Fannie Mae's respective contracts with the holders of junior preferred stock and common stock and the covenant of good faith and fair dealing inherent in such contracts. Plaintiffs sought unspecified damages, equitable and injunctive relief, and costs and expenses, including attorney and expert fees.
The Cacciapelle and American European Insurance Company lawsuits were filed purportedly on behalf of a class of purchasers of junior preferred stock issued by Freddie Mac or Fannie Mae who held stock prior to, and as of, August 17, 2012. The Marneu lawsuit was filed purportedly on behalf of a class of purchasers of junior preferred stock and purchasers of common stock issued by Freddie Mac or Fannie Mae over a not-yet-defined period of time.
Arrowood Indemnity Company vs. Federal National Mortgage Association, Federal Home Loan Mortgage Corporation, FHFA, and Treasury.
This case was filed on September 20, 2013. The allegations and demands made by plaintiffs in this case were generally similar to those made by the plaintiffs in the In re Fannie Mae/Freddie Mac Senior Preferred Stock Purchase Agreement Class Action Litigations case described above. Plaintiffs in the Arrowood lawsuit also requested that, if injunctive relief were not granted, the Arrowood plaintiffs be awarded damages against the defendants in an amount to be determined including, but not limited to, the aggregate par value of their junior preferred stock, the total of which they stated to be approximately
$42 million
.
American European Insurance Company, Cacciapelle, and Miller vs. Treasury and FHFA.
This case was filed as a shareholder derivative lawsuit, purportedly on behalf of Freddie Mac as a "nominal" defendant, on July 30, 2014. The complaint alleged that, through the August 2012 amendment to the Purchase Agreement, Treasury and FHFA breached their respective fiduciary duties to Freddie Mac, causing Freddie Mac to suffer damages. The plaintiffs asked that Freddie Mac be awarded compensatory damages and disgorgement, as well as attorneys' fees, costs, and other expenses.
|
FREDDIE MAC
| 2018 Form 10-K
|
332
|
|
|
Financial Statements
|
Notes to the Consolidated Financial Statements |
Note 16
|
FHFA, joined by Freddie Mac and Fannie Mae, moved to dismiss the In re Fannie Mae/Freddie Mac Senior Preferred Stock Purchase Agreement Class Action Litigations case and the other related cases in January 2014. Treasury filed a motion to dismiss the same day. In September 2014, the District Court granted the motions and dismissed the plaintiffs' claims. All plaintiffs appealed that decision, and on February 21, 2017, the U.S. Court of Appeals for the District of Columbia Circuit affirmed in part and remanded in part the decision granting the motions to dismiss. The Court of Appeals affirmed dismissal of all claims except certain claims seeking monetary damages for breach of contract and breach of implied duty of good faith and fair dealing. In March 2017, certain institutional and class plaintiffs filed petitions for panel rehearing with respect to certain claims. On July 17, 2017, the Court of Appeals granted the petitions for rehearing and issued a modified decision, which permitted the institutional plaintiffs to pursue the breach of contract and breach of implied duty of good faith and fair dealing claims that had been remanded. The Court of Appeals also removed language related to the standard to be applied to the implied duty claims, leaving that issue for the District Court to determine on remand. On October 16, 2017, certain institutional and class plaintiffs filed petitions for a writ of certiorari in the U.S. Supreme Court challenging whether HERA's prohibition on injunctive relief against FHFA bars judicial review of the net worth sweep dividend provisions of the August 2012 amendment to the Purchase Agreement, as well as whether HERA bars shareholders from pursuing derivative litigation where they allege the conservator faces a conflict of interest. The Supreme Court denied the petitions on February 20, 2018. On November 1, 2017, certain institutional and class plaintiffs and plaintiffs in another case in which Freddie Mac was not originally a defendant,
Fairholme Funds, Inc. v. FHFA, Treasury, and Federal National Mortgage Association
, filed proposed amended complaints in the District Court. Each of the proposed amended complaints names Freddie Mac as a defendant for breach of contract and breach of the covenant of good faith and fair dealing claims as well as for new claims alleging breach of fiduciary duty and breach of Virginia corporate law. On January 10, 2018, FHFA, Freddie Mac, and Fannie Mae moved to dismiss the amended complaints. On August 16, 2018, plaintiffs in the
In re Fannie Mae/Freddie Mac Senior Preferred Stock Purchase Agreement Class Action
Litigations
case filed a motion for class certification in the District Court. On September 28, 2018, the District Court dismissed all of the claims except those alleging breach of the implied covenant of good faith and fair dealing. On October 15, 2018, defendants filed a motion seeking reconsideration of the denial of the motion to dismiss as to the implied covenant claims. Discovery is ongoing.
Angel vs. The Federal Home Loan Mortgage Corporation et al.
This case was filed pro se on May 21, 2018 against Freddie Mac, Fannie Mae, certain current and former directors of Freddie Mac and Fannie Mae, and FHFA as a nominal defendant. The complaint alleges, among other things, breach of contract, breach of the implied covenant of good faith and fair dealing, and that defendants aided and abetted the government's "avoidance" of plaintiff's dividend rights. On July 12, 2018, the defendants filed a motion to dismiss the complaint.
Litigation in the U.S. Court of Federal Claims
Reid and Fisher vs. the United States of America and Federal Home Loan Mortgage Corporation.
This case was filed as a derivative lawsuit, purportedly on behalf of Freddie Mac as a "nominal" defendant, on February 26, 2014. The complaint alleges, among other items, that the net worth sweep dividend provisions of the senior preferred stock constitute an unlawful taking of private property for public use without just compensation. The plaintiffs ask that Freddie Mac be awarded just compensation for the U.S. government's alleged taking of its property, attorneys' fees, costs, and other
|
FREDDIE MAC
| 2018 Form 10-K
|
333
|
|
|
Financial Statements
|
Notes to the Consolidated Financial Statements |
Note 16
|
expenses. On March 8, 2018, the plaintiffs filed an amended complaint under seal, with a redacted copy filed in November 14, 2018. Defendants filed a motion to dismiss on August 1, 2018 and an amended motion to dismiss on October 1, 2018.
Rafter, Rattien and Pershing Square Capital Management vs. the United States of America et al.
This case was filed as a shareholder derivative lawsuit, purportedly on behalf of Freddie Mac as a "nominal" defendant, on August 14, 2014. The complaint alleges that the net worth sweep dividend provisions of the senior preferred stock constitute an unlawful taking of private property for public use without just compensation, and the U.S. government breached an implied-in-fact contract with Freddie Mac. In September 2015, plaintiffs filed an amended complaint, which contains one claim involving Freddie Mac. The amended complaint alleges that Freddie Mac's charter is a contract with its common stockholders, and that, through the August 2012 amendment to the Purchase Agreement, the U.S. government breached the implied covenant of good faith and fair dealing inherent in such contract. Plaintiffs ask that they be awarded damages or other appropriate relief for the alleged breach of contract as well as attorneys' fees, costs, and expenses. Plaintiffs filed a further amended complaint under seal on March 8, 2018, and a redacted public version on April 20, 2018. The amended complaint no longer lists Freddie Mac as a nominal defendant.
Fairholme Funds, Inc., et al. vs. the United States of America, Federal National Mortgage Association, and Federal Home Loan Mortgage Corporation.
This case was originally filed on July 9, 2013 against the United States of America. On March 8, 2018, plaintiffs filed an amended complaint under seal. A redacted public version was filed on May 11, 2018 and adds Freddie Mac and Fannie Mae as nominal defendants. The amended complaint alleges, among other items, that the net worth sweep dividend provisions of the senior preferred stock constitute an unlawful taking or exaction of private property for public use without just compensation, and that by enacting the net worth sweep, the government breached the fiduciary duty it owed to Freddie Mac and Fannie Mae, and implied-in-fact contracts between the United States on the one hand and Freddie Mac and Fannie Mae on the other. The plaintiffs ask that plaintiffs, Freddie Mac, and Fannie Mae be awarded (1) just compensation for the government's alleged taking or exaction of their property, (2) damages for the government's breach of fiduciary duties, and (3) damages for the government's breach of the alleged implied-in-fact contracts. In addition, plaintiffs seek pre- and post-judgment interest, attorneys' fees, costs, and other expenses. Defendants filed a motion to dismiss on August 1, 2018 and an amended motion to dismiss on October 1, 2018.
Perry Capital LLC vs. the United States of America, Federal National Mortgage Association, and Federal Home Loan Mortgage Corporation.
This case was filed as a derivative lawsuit, purportedly on behalf of Freddie Mac and Fannie Mae as "nominal" defendants, on August 15, 2018. The complaint alleges, among other items, that the net worth sweep dividend provisions of the senior preferred stock constitute an unlawful taking of private property for public use without just compensation or an illegal exaction in violation of the Fifth Amendment, and that by enacting the net worth sweep, the government breached the fiduciary duty it owed to Freddie Mac and Fannie Mae, and implied-in-fact contracts between the United States on the one hand and Freddie Mac and Fannie Mae on the other. The plaintiffs ask that plaintiffs, Freddie Mac, and Fannie Mae be awarded just compensation for the government's alleged taking of their property or damages for the illegal exaction; damages for the government's breach of fiduciary duties; and damages for the government's breach of the alleged implied-in-fact contracts. The proceedings have been stayed pending a ruling on defendants' motion to dismiss in the Fairholme Funds, Inc. litigation.
|
FREDDIE MAC
| 2018 Form 10-K
|
334
|
|
|
Financial Statements
|
Notes to the Consolidated Financial Statements |
Note 16
|
Litigation in the U.S. District Court for the District of Delaware
Jacobs and Hindes vs. FHFA and Treasury.
This case was filed on August 17, 2015 as a putative class action lawsuit purportedly on behalf of a class of holders of preferred stock or common stock issued by Freddie Mac or Fannie Mae. The case was also filed as a shareholder derivative lawsuit, purportedly on behalf of Freddie Mac and Fannie Mae as "nominal" defendants. The complaint alleges, among other items, that the August 2012 amendment to the Purchase Agreement violated applicable state law and constituted a breach of contract, as well as a breach of covenants of good faith and fair dealing. Plaintiffs seek equitable and injunctive relief (including restitution of the monies paid by Freddie Mac and Fannie Mae to Treasury under the net worth sweep dividend), compensatory damages, attorneys' fees, costs and expenses. On November 27, 2017, the Court dismissed the case with prejudice after defendants filed a motion to dismiss. On December 21, 2017, plaintiffs filed a notice of appeal to the U.S. Court of Appeals for the Third Circuit, and on November 14, 2018, the Court of Appeals affirmed the dismissal.
At present, it is not possible for us to predict the probable outcome of the lawsuits discussed above in the U.S. District Courts and the U.S. Court of Federal Claims (including the outcome of any appeal) or any potential effect on our business, financial condition, liquidity, or results of operations. In addition, we are unable to reasonably estimate the possible loss or range of possible loss in the event of an adverse judgment in the foregoing matters due to a number of factors, including the inherent uncertainty of pre-trial litigation. In addition, with respect to the In re Fannie Mae/Freddie Mac Senior Preferred Stock Purchase Agreement Class Action Litigations case, the plaintiffs have not demanded a stated amount of damages they believe are due, and the Court has not certified a class.
|
FREDDIE MAC
| 2018 Form 10-K
|
335
|
|
|
Financial Statements
|
Notes to the Consolidated Financial Statements |
Note 17
|
NOTE 17
Regulatory Capital
In October 2008, FHFA announced that it was suspending capital classification of us during conservatorship in light of the Purchase Agreement. FHFA continues to monitor our capital levels, but the existing statutory and FHFA regulatory capital requirements are not binding during conservatorship. We continue to provide quarterly submissions to FHFA on minimum capital.
During 2017, we and Fannie Mae worked with FHFA to develop an overall risk measurement framework for evaluating our risk management and business decisions during conservatorship, known as the CCF. We are required to submit quarterly reports to FHFA related to CCF requirements.
Regulatory Capital Standards
The GSE Act established minimum, critical, and risk-based capital standards for us. However, per guidance received from FHFA, we no longer are required to submit risk-based capital reports to FHFA.
Prior to our entry into conservatorship, those standards determined the amounts of core capital that we were to maintain to meet regulatory capital requirements. Core capital consisted of the par value of outstanding common stock (common stock issued less common stock held in treasury), the par value of outstanding non-cumulative, perpetual preferred stock, additional paid-in capital, and retained earnings (accumulated deficit), as determined in accordance with GAAP.
Minimum Capital
The minimum capital standard required us to hold an amount of core capital that was generally equal to the sum of
2.50%
of aggregate on-balance sheet assets and approximately
0.45%
of the sum of our PCs held by third parties and other aggregate off-balance sheet obligations.
Pursuant to regulatory guidance from FHFA, our minimum capital requirement was not affected by adoption of amendments to the accounting guidance for transfers of financial assets and consolidation of VIEs effective January 1, 2010. Specifically, upon adoption of these amendments, FHFA directed us, for purposes of minimum capital, to continue reporting single-family PCs and certain other securitization products held by third parties using a 0.45% capital requirement. FHFA reserves the authority under the GSE Act to raise the minimum capital requirement for any of our assets or activities.
Critical Capital
The critical capital standard required us to hold an amount of core capital that was generally equal to the sum of
1.25%
of aggregate on-balance sheet assets and approximately
0.25%
of the sum of our PCs held by third parties and other aggregate off-balance sheet obligations.
|
FREDDIE MAC
| 2018 Form 10-K
|
336
|
|
|
Financial Statements
|
Notes to the Consolidated Financial Statements |
Note 17
|
Performance Against Regulatory Capital Standards
The table below summarizes our minimum capital requirements and deficits and net worth.
Table 17.1 - Net Worth and Minimum Capital
|
(In millions)
|
December 31, 2018
|
December 31, 2017
|
|||||
|
GAAP net worth (deficit)
|
|
$4,477
|
|
|
($312
|
)
|
|
|
Core capital (deficit)
(1)(2)
|
(68,036
|
)
|
(73,037
|
)
|
|||
|
Less: Minimum capital requirement
(1)
|
17,553
|
|
18,431
|
|
|||
|
Minimum capital surplus (deficit)
(1)
|
|
($85,589
|
)
|
|
($91,468
|
)
|
|
|
(1)
|
Core capital and minimum capital figures are estimates and represent amounts submitted to FHFA. FHFA is the authoritative source for our regulatory capital.
|
|
(2)
|
Core capital excludes certain components of GAAP total equity (i.e., AOCI and the liquidation preference of the senior preferred stock) as these items do not meet the statutory definition of core capital.
|
The Purchase Agreement provides that, if FHFA determines as of quarter end that our liabilities have exceeded our assets under GAAP, Treasury will contribute funds to us in an amount at least equal to the difference between such liabilities and assets.
Under the GSE Act, FHFA must place us into receivership if FHFA determines that our assets are and have been less than our obligations for a period of
60 days
. FHFA has notified us that the measurement period for any mandatory receivership determination with respect to our assets and obligations would commence no earlier than the SEC public filing deadline for our quarterly or annual financial statements and would continue for 60 calendar days after that date. FHFA has advised us that, if, during that 60-day period, we receive funds from Treasury in an amount at least equal to the deficiency amount under the Purchase Agreement, the Director of FHFA will not make a mandatory receivership determination. If funding has been requested under the Purchase Agreement to address a deficit in our net worth, and Treasury is unable to provide us with such funding within the 60-day period specified by FHFA, FHFA would be required to place us into receivership if our assets remain less than our obligations during that 60-day period.
At
December 31, 2018
, our assets exceeded our liabilities under GAAP; therefore, no draw is being requested from Treasury under the Purchase Agreement. As of
December 31, 2018
, our aggregate funding received from Treasury under the Purchase Agreement was
$71.6 billion
. This aggregate funding amount does not include the initial
$1.0 billion
liquidation preference of senior preferred stock that we issued to Treasury in September 2008 as an initial commitment fee and for which
no
cash was received, nor does it include the additional
$3.0 billion
increase in the liquidation preference pursuant to the Letter Agreement.
Subordinated Debt Commitment
In October 2000, we announced our adoption of a series of commitments designed to enhance market discipline, liquidity, and capital. In September 2005, we entered into a written agreement with FHFA that updated those commitments and set forth a process for implementing them. FHFA, as Conservator, has suspended the requirements in the September 2005 agreement with respect to issuance, maintenance, and reporting and disclosure of Freddie Mac subordinated debt during the term of conservatorship and thereafter until instructed otherwise.
|
FREDDIE MAC
| 2018 Form 10-K
|
337
|
|
|
Financial Statements
|
Notes to the Consolidated Financial Statements |
Note 18
|
NOTE 18
Selected Financial Statement Line Items
The table below presents the significant components of other income (loss) on our consolidated statements of comprehensive income (loss).
Table 18.1 - Significant Components of Other Income (Loss)
|
|
Year Ended December 31,
|
|||||||||
|
(In millions)
|
2018
|
2017
|
2016
|
|||||||
|
Other income (loss)
|
||||||||||
|
Non-agency mortgage-related securities settlement and judgment
|
|
$338
|
|
|
$4,532
|
|
|
$—
|
|
|
|
Income on guarantee obligation
|
711
|
|
601
|
|
449
|
|
||||
|
All other
|
(335
|
)
|
(151
|
)
|
354
|
|
||||
|
Total other income (loss)
|
|
$714
|
|
|
$4,982
|
|
|
$803
|
|
|
The table below presents the significant components of other assets and other liabilities on our consolidated balance sheets.
Table 18.2 - Significant Components of Other Assets and Other Liabilities
|
As of December 31,
|
|||||||
|
(In millions)
|
2018
|
2017
|
|||||
|
Other assets:
|
|||||||
|
Real estate owned, net
|
|
$769
|
|
|
$892
|
|
|
|
Accounts and other receivables
(1)(2)
|
2,447
|
|
6,924
|
|
|||
|
Guarantee asset
|
3,633
|
|
3,171
|
|
|||
|
Fixed assets
|
959
|
|
798
|
|
|||
|
Secured lending and other
(2)
|
1,805
|
|
1,269
|
|
|||
|
All other
|
1,363
|
|
636
|
|
|||
|
Total other assets
|
|
$10,976
|
|
|
$13,690
|
|
|
|
Other liabilities:
|
|||||||
|
Servicer liabilities
|
|
$289
|
|
|
$628
|
|
|
|
Guarantee obligation
|
3,561
|
|
3,081
|
|
|||
|
Accounts payable and accrued expenses
|
1,014
|
|
754
|
|
|||
|
Payables related to securities
|
—
|
|
2,813
|
|
|||
|
Income taxes payable
|
—
|
|
656
|
|
|||
|
All other
|
1,534
|
|
1,036
|
|
|||
|
Total other liabilities
|
|
$6,398
|
|
|
$8,968
|
|
|
|
(1)
|
Primarily consists of servicer receivables and other non-interest receivables.
|
|
(2)
|
Current and prior period presentation has been modified to reflect certain secured lending activity. Previously this activity was included in accounts and other receivables.
|
END OF CONSOLIDATED FINANCIAL STATEMENTS AND ACCOMPANYING NOTES
|
FREDDIE MAC
| 2018 Form 10-K
|
338
|
|
|
Quarterly Selected Financial Data
|
|
Quarterly Selected Financial Data (Unaudited)
Table 73 - Quarterly Selected Financial Data
|
|
2018
|
|||||||||||||||
|
(
In millions
, except share-related amounts)
|
1Q
|
2Q
|
3Q
|
4Q
|
Full-Year
|
|||||||||||
|
Net interest income
|
|
$3,018
|
|
|
$3,003
|
|
|
$3,257
|
|
|
$2,743
|
|
|
$12,021
|
|
|
|
Benefit (provision) for credit losses
|
(63
|
)
|
60
|
|
380
|
|
359
|
|
736
|
|
||||||
|
Non-interest income (loss):
|
|
|
||||||||||||||
|
Guarantee fee income
|
194
|
|
200
|
|
209
|
|
208
|
|
811
|
|
||||||
|
Mortgage loans gains (losses)
|
(215
|
)
|
354
|
|
94
|
|
491
|
|
724
|
|
||||||
|
Investment securities gains (losses)
|
(232
|
)
|
(349
|
)
|
(443
|
)
|
329
|
|
(695
|
)
|
||||||
|
Debt gains (losses)
|
121
|
|
166
|
|
158
|
|
275
|
|
720
|
|
||||||
|
Derivative gains (losses)
|
1,830
|
|
416
|
|
728
|
|
(1,704
|
)
|
1,270
|
|
||||||
|
Other non-interest income (loss)
|
131
|
|
438
|
|
79
|
|
66
|
|
714
|
|
||||||
|
Non-interest income (loss)
|
1,829
|
|
1,225
|
|
825
|
|
(335
|
)
|
3,544
|
|
||||||
|
Non-interest expense:
|
||||||||||||||||
|
Administrative expense
|
(520
|
)
|
(558
|
)
|
(569
|
)
|
(646
|
)
|
(2,293
|
)
|
||||||
|
Real estate owned operations expense
|
(34
|
)
|
(15
|
)
|
(38
|
)
|
(82
|
)
|
(169
|
)
|
||||||
|
Temporary Payroll Tax Cut Continuation Act of 2011 expense
|
(359
|
)
|
(366
|
)
|
(375
|
)
|
(384
|
)
|
(1,484
|
)
|
||||||
|
Other non-interest expense
|
(197
|
)
|
(204
|
)
|
(218
|
)
|
(262
|
)
|
(881
|
)
|
||||||
|
Non-interest expense
|
(1,110
|
)
|
(1,143
|
)
|
(1,200
|
)
|
(1,374
|
)
|
(4,827
|
)
|
||||||
|
Income tax (expense) benefit
|
(748
|
)
|
(642
|
)
|
(556
|
)
|
(293
|
)
|
(2,239
|
)
|
||||||
|
Net income (loss)
|
2,926
|
|
2,503
|
|
2,706
|
|
1,100
|
|
9,235
|
|
||||||
|
Total other comprehensive income (loss), net of taxes and reclassification adjustments
|
(776
|
)
|
(68
|
)
|
(147
|
)
|
378
|
|
(613
|
)
|
||||||
|
Comprehensive income (loss)
|
|
$2,150
|
|
|
$2,435
|
|
|
$2,559
|
|
|
$1,478
|
|
|
$8,622
|
|
|
|
Net income (loss) attributable to common stockholders
|
|
$2,926
|
|
|
$918
|
|
|
$147
|
|
|
($379
|
)
|
|
$3,612
|
|
|
|
Net income (loss) per common share – basic and diluted
(1)
|
|
$0.90
|
|
|
$0.28
|
|
|
$0.05
|
|
|
($0.12
|
)
|
|
$1.12
|
|
|
|
FREDDIE MAC
| 2018 Form 10-K
|
339
|
|
|
Quarterly Selected Financial Data
|
|
|
|
2017
|
|||||||||||||||
|
(
In millions
, except share-related amounts)
|
1Q
|
2Q
|
3Q
|
4Q
|
Full-Year
|
|||||||||||
|
Net interest income
|
|
$3,795
|
|
|
$3,379
|
|
|
$3,489
|
|
|
$3,501
|
|
|
$14,164
|
|
|
|
Benefit (provision) for credit losses
|
116
|
|
422
|
|
(716
|
)
|
262
|
|
84
|
|
||||||
|
Non-interest income (loss):
|
|
|
||||||||||||||
|
Guarantee fee income
|
149
|
|
158
|
|
169
|
|
186
|
|
662
|
|
||||||
|
Mortgage loans gains (losses)
|
238
|
|
524
|
|
474
|
|
790
|
|
2,026
|
|
||||||
|
Investment securities gains (losses)
|
43
|
|
58
|
|
722
|
|
213
|
|
1,036
|
|
||||||
|
Debt gains (losses)
|
129
|
|
(52
|
)
|
90
|
|
(16
|
)
|
151
|
|
||||||
|
Derivative gains (losses)
|
(302
|
)
|
(1,096
|
)
|
(678
|
)
|
88
|
|
(1,988
|
)
|
||||||
|
Other non-interest income (loss)
|
117
|
|
114
|
|
4,697
|
|
54
|
|
4,982
|
|
||||||
|
Non-interest income (loss)
|
374
|
|
(294
|
)
|
5,474
|
|
1,315
|
|
6,869
|
|
||||||
|
Non-interest expense:
|
||||||||||||||||
|
Administrative expenses
|
(511
|
)
|
(513
|
)
|
(524
|
)
|
(558
|
)
|
(2,106
|
)
|
||||||
|
Real estate owned operations expense
|
(56
|
)
|
(37
|
)
|
(35
|
)
|
(61
|
)
|
(189
|
)
|
||||||
|
Temporary Payroll Tax Cut Continuation Act of 2011 expense
|
(321
|
)
|
(330
|
)
|
(339
|
)
|
(350
|
)
|
(1,340
|
)
|
||||||
|
Other non-interest expense
|
(76
|
)
|
(126
|
)
|
(159
|
)
|
(287
|
)
|
(648
|
)
|
||||||
|
Non-interest expense
|
(964
|
)
|
(1,006
|
)
|
(1,057
|
)
|
(1,256
|
)
|
(4,283
|
)
|
||||||
|
Income tax (expense) benefit
|
(1,110
|
)
|
(837
|
)
|
(2,519
|
)
|
(6,743
|
)
|
(11,209
|
)
|
||||||
|
Net income (loss)
|
2,211
|
|
1,664
|
|
4,671
|
|
(2,921
|
)
|
5,625
|
|
||||||
|
Total other comprehensive income (loss), net of taxes and reclassification adjustments
|
23
|
|
322
|
|
(21
|
)
|
(391
|
)
|
(67
|
)
|
||||||
|
Comprehensive income (loss)
|
|
$2,234
|
|
|
$1,986
|
|
|
$4,650
|
|
|
($3,312
|
)
|
|
$5,558
|
|
|
|
Net income (loss) attributable to common stockholders
|
|
($23
|
)
|
|
($322
|
)
|
|
$21
|
|
|
($2,920
|
)
|
|
($3,244
|
)
|
|
|
Net income (loss) per common share – basic and diluted
(1)
|
|
($0.01
|
)
|
|
($0.10
|
)
|
|
$0.01
|
|
|
($0.90
|
)
|
|
($1.00
|
)
|
|
|
(1)
|
Earnings (loss) per common share is computed independently for each of the quarters presented. Due to the use of weighted average common shares outstanding when calculating earnings (loss) per share, the sum of the four quarters may not equal the full-year amount. Earnings (loss) per common share amounts may not recalculate using the amounts shown in this table due to rounding.
|
|
FREDDIE MAC
| 2018 Form 10-K
|
340
|
|
|
Controls and Procedures
|
|
Controls and Procedures
MANAGEMENT'S REPORT ON INTERNAL CONTROL OVER FINANCIAL REPORTING
Management is responsible for establishing and maintaining adequate internal control over financial reporting, as such term is defined in Exchange Act Rule 13a-15(f). Internal control over financial reporting is a process designed by, or under the supervision of, our Chief Executive Officer and Chief Financial Officer and effected by the Board of Directors, management, and other personnel to provide reasonable assurance regarding the reliability of our financial reporting and the preparation of financial statements for external purposes in accordance with GAAP.
Because of its inherent limitations, internal control over financial reporting may not prevent or detect misstatements. It is a process that involves human diligence and compliance and is, therefore, subject to lapses in judgment and breakdowns resulting from human error. It also can be circumvented by collusion or improper management override. Because of its limitations, there is a risk that internal control over financial reporting may not prevent or detect, on a timely basis, errors that could cause a material misstatement of the financial statements.
We assessed the effectiveness of our internal control over financial reporting as of
December 31, 2018
. In making our assessment, we used the criteria set forth by the Committee of Sponsoring Organizations of the Treadway Commission, or COSO, in Internal Control — Integrated Framework (2013 Framework). A material weakness is a deficiency, or a combination of deficiencies, in internal control over financial reporting, such that there is a reasonable possibility that a material misstatement of the company's annual or interim financial statements will not be prevented or detected on a timely basis by a company's internal controls. Based on our assessment, we identified a material weakness related to our inability to update our disclosure controls and procedures in a manner that adequately ensures the accumulation and communication to management of information known to FHFA that is needed to meet our disclosure obligations under the federal securities laws, including disclosures affecting our consolidated financial statements.
We have been under conservatorship of FHFA since September 6, 2008. FHFA is an independent agency that currently functions as both our Conservator and our regulator with respect to our safety, soundness and mission. Because we are in conservatorship, some of the information that we may need to meet our disclosure obligations may be solely within the knowledge of FHFA. As our Conservator, FHFA has the power to take actions without our knowledge that could be material to investors and could significantly affect our financial performance. Although we and FHFA have attempted to design and implement disclosure policies and procedures to account for the conservatorship and accomplish the same objectives as disclosure controls and procedures for a typical reporting company, there are inherent structural limitations on our ability to design, implement, test, or operate effective disclosure controls and procedures under the circumstances of conservatorship. As our Conservator and regulator, FHFA is limited in its ability to design and implement a complete set of disclosure controls and procedures relating to us, particularly with respect to current reporting pursuant to Form 8-K. Similarly, as a regulated entity, we are limited in our ability to design, implement, operate, and test the controls and procedures for which FHFA is responsible. For example, FHFA may formulate certain intentions with
|
FREDDIE MAC
| 2018 Form 10-K
|
341
|
|
|
Controls and Procedures
|
|
respect to the conduct of our business that, if known to management, would require consideration for disclosure or reflection in our financial statements, but that FHFA, for regulatory reasons, may be constrained from communicating to management. As a result of these considerations, we have concluded that this control deficiency constitutes a material weakness in our internal control over financial reporting.
Because of this material weakness, we have concluded that our internal control over financial reporting was not effective as of
December 31, 2018
based on the COSO criteria (2013 Framework). PricewaterhouseCoopers LLP, an independent registered public accounting firm, audited the effectiveness of our internal control over financial reporting as of
December 31, 2018
and also determined that our internal control over financial reporting was not effective. PricewaterhouseCoopers LLP's report appears in
Financial Statements and Supplementary Data — Report of Independent Registered Public Accounting Firm
.
EVALUATION OF DISCLOSURE CONTROLS AND PROCEDURES
Disclosure controls and procedures include, without limitation, controls and procedures designed to ensure that the information we are required to disclose in reports that we file or submit under the Exchange Act is recorded, processed, summarized, and reported within the time periods specified by the SEC's rules and forms and that such information is accumulated and communicated to management of the company, including the company's Chief Executive Officer and Chief Financial Officer, as appropriate, to allow timely decisions regarding required disclosure. In designing our disclosure controls and procedures, we recognize that any controls and procedures, no matter how well designed and operated, can provide only reasonable assurance of achieving the desired control objectives, and we must apply judgment in implementing possible controls and procedures.
Management, including the company's Chief Executive Officer and Chief Financial Officer, conducted an evaluation of the effectiveness of our disclosure controls and procedures as of
December 31, 2018
. As a result of management's evaluation, our Chief Executive Officer and Chief Financial Officer concluded that our disclosure controls and procedures were not effective as of
December 31, 2018
, at a reasonable level of assurance, because we have not been able to update our disclosure controls and procedures to provide reasonable assurance that information known by FHFA on an ongoing basis is communicated from FHFA to Freddie Mac's management in a manner that allows for timely decisions regarding our required disclosure under the federal securities laws. As discussed above, we consider this situation to be a material weakness in our internal control over financial reporting. Based on discussions with FHFA and the structural nature of this continuing weakness, we believe it is likely that we will not remediate this material weakness while we are under conservatorship.
|
FREDDIE MAC
| 2018 Form 10-K
|
342
|
|
|
Controls and Procedures
|
|
MITIGATING ACTIONS RELATED TO THE MATERIAL WEAKNESS IN INTERNAL CONTROL OVER FINANCIAL REPORTING
As described above under
Management's Report on Internal Control Over Financial Reporting
, we have one material weakness in internal control over financial reporting as of
December 31, 2018
that we have not remediated.
Given the structural nature of this material weakness, we believe it is likely that we will not remediate it while we are under conservatorship. However, both we and FHFA have continued to engage in activities and employ procedures and practices intended to permit accumulation and communication to management of information needed to meet our disclosure obligations under the federal securities laws. These include the following:
|
n
|
FHFA has established the Division of Conservatorship, which is intended to facilitate operation of the company with the oversight of the Conservator.
|
|
n
|
We provide drafts of our SEC filings to FHFA personnel for their review and comment prior to filing. We also provide drafts of external press releases, statements, and certain speeches to FHFA personnel for their review and comment prior to release.
|
|
n
|
FHFA personnel, including senior officials, review our SEC filings prior to filing, including this Form 10-K, and engage in discussions with us regarding issues associated with the information contained in those filings. Prior to filing this Form 10-K, FHFA provided us with a written acknowledgment that it had reviewed the Form 10-K, was not aware of any material misstatements or omissions in the Form 10-K, and had no objection to our filing the Form 10-K.
|
|
n
|
The Director of FHFA is in frequent communication with our Chief Executive Officer, typically meeting (in person or by phone) on at least a bi-weekly basis.
|
|
n
|
FHFA representatives attend meetings frequently with various groups within the company to enhance the flow of information and to provide oversight on a variety of matters, including accounting, credit and capital markets management, external communications, and legal matters.
|
|
n
|
Senior officials within FHFA's accounting group meet frequently with our senior financial executives regarding our accounting policies, practices, and procedures.
|
In view of our mitigating actions related to this material weakness, we believe that our consolidated financial statements for the year ended
December 31, 2018
have been prepared in conformity with GAAP.
|
FREDDIE MAC
| 2018 Form 10-K
|
343
|
|
|
Controls and Procedures
|
|
CHANGES IN INTERNAL CONTROL OVER FINANCIAL REPORTING DURING THE QUARTER ENDED DECEMBER 31, 2018
We evaluated the changes in our internal control over financial reporting that occurred during the quarter ended
December 31, 2018
and concluded that there were no changes that materially affected, or are reasonably likely to materially affect, our internal control over financial reporting.
|
FREDDIE MAC
| 2018 Form 10-K
|
344
|
|
|
Directors, Corporate Governance, and Executive Officers
|
Directors
|
Directors, Corporate Governance, and Executive Officers
DIRECTORS
Election of Directors
As Conservator, FHFA determines the size of the company's Board and the scope of its authority. At the start of Conservatorship, FHFA determined that the Board is to have a Non-Executive Chair, and is to consist of a minimum of 9 and not more than 13 directors, with the CEO being the only corporate officer serving as a member of the Board. The Board currently has 12 members.
In addition, because FHFA as Conservator has succeeded to the rights of all stockholders of the company, the Conservator elects the directors. Accordingly, we will not solicit proxies, distribute a proxy statement to stockholders, or hold an annual meeting of stockholders in 2019. Instead, the Conservator has elected directors by written consent in lieu of an annual meeting. Annually, the Board identifies director nominees for the Conservator to consider for election by written consent. When there is a vacancy on the Board, the Board may exercise the authority provided to it by the Conservator to fill such vacancy, subject to review by the Conservator.
On February 11, 2019, the Conservator executed a written consent, effective as of February 15, 2019, re-electing the nine directors submitted by the company for election as a member of our Board. The individuals re-elected as directors by the Conservator are listed below:
|
n
|
Lance F. Drummond
|
n
|
Grace A. Huebscher
|
n
|
Sara Mathew
|
|
n
|
Aleem Gillani
|
n
|
Steven W. Kohlhagen
|
n
|
Saiyid T. Naqvi
|
|
n
|
Christopher E. Herbert
|
n
|
Donald H. Layton
|
n
|
Eugene B. Shanks, Jr.
|
The company did not submit for re-election, and FHFA did not re-elect, current directors Carolyn H. Byrd, Christopher S. Lynch, or Anthony A. Williams to the Board as the terms of their service on the Board had reached the limit set forth in our Corporate Governance Guidelines, or the Guidelines. Ms. Byrd and Messrs. Lynch and Williams will depart the Board on February 15, 2019. Although Mr. Shanks' term of service on the Board has reached the limit set forth in the Guidelines, FHFA re-elected Mr. Shanks for a term expiring June 30, 2019 to allow him to continue ongoing director recruitment efforts with which he has been involved. Messrs. Herbert and Gillani were first elected to the Board in March 2018 and January 2019, respectively.
See
Director Biographical Information
for information about each of our current directors. The terms of the directors re-elected by FHFA will end on the date of the next annual meeting of our stockholders or the effective date of the Conservator's next election of directors by written consent, whichever occurs first, except for Mr. Shanks, whose term will expire on June 30, 2019.
|
FREDDIE MAC
| 2018 Form 10-K
|
345
|
|
|
Directors, Corporate Governance, and Executive Officers
|
Directors
|
Director Criteria, Diversity, Qualifications, Experience, and Tenure
Our Board seeks candidates for directorship who have achieved a high level of stature, success, and respect in their principal occupations.
Each of our current directors was selected as a candidate because of his or her character, judgment, experience, and expertise. Consistent with our Charter and FHFA's rule regarding the Responsibilities of Boards of Directors, Corporate Practices and Corporate Governance Matters, or the Corporate Governance Rule, the factors considered include the knowledge directors would have, as a group, in the areas of business, finance, accounting, risk management, technology (including cybersecurity), public policy, mortgage lending, real estate, low-income housing, homebuilding, regulation of financial institutions, and any other areas that may be relevant to our safe and sound operation. We also considered whether a candidate's other commitments, including the number of other board memberships held by the candidate, would permit the candidate to devote sufficient time to the candidate's duties and responsibilities as a director. Our Charter provides that our Board have at least one person from each of the homebuilding, mortgage lending, and real estate industries and at least one person from an organization representing community or consumer interests or one person who has demonstrated a career commitment to the provision of housing for low-income households.
FHFA's rule regarding minority and women inclusion generally requires us to consider diversity and the inclusion of women, minorities, and individuals with disabilities in all activities, including considering diversity in the process of nominating directors. In addition, the Board has adopted a policy with regard to the consideration of diversity in identifying director nominees and candidates. As articulated in the Guidelines, the Board seeks to have a diversity of talent, perspectives, expertise, experience, and cultures among its members, including minorities, women, and individuals with disabilities, and considers such diversity in the candidate identification and nomination processes. The Guidelines explain that when identifying director nominees, the Nominating and Governance Committee considers, among other factors, our needs, the talents and skills then available on the Board, and, with respect to incumbent directors, their continued involvement in business and professional activities relevant to us, the skills and experience that should be represented on the Board, the availability of other individuals with desirable skills to join the Board, and the desire to maintain a diverse Board.
|
FREDDIE MAC
| 2018 Form 10-K
|
346
|
|
|
Directors, Corporate Governance, and Executive Officers
|
Directors
|
Director Biographical Information
The following summarizes each director's Board service, experience, qualifications, attributes, and/or skills that led to his or her selection as a director, and provides other biographical information, as of February 13, 2019. For a list of committee assignments effective as of February 21, 2019, see
Corporate Governance - Board and Committee Information.
Carolyn H. Byrd
|
Age
|
Director Since
|
Freddie Mac Committees
|
Public Company Directorships
|
||
|
70
|
December 2008
|
•
|
Compensation
|
•
|
Regions Financial Corporation
|
|
•
|
Risk
|
||||
Ms. Byrd is an experienced finance executive who has held a variety of leadership positions and has significant public company board experience. Ms. Byrd will depart the Board on February 15, 2019.
Experience and Qualifications
|
n
|
Founder, Chairman, and Chief Executive Officer of GlobalTech Financial, LLC (2000-present)
|
|
n
|
President of Coca-Cola Financial Corporation (1997-2000)
|
|
n
|
Various domestic and international positions with The Coca-Cola Company, including Chief of Internal Audits and Director of the Corporate Auditing Department (1977-1997)
|
|
n
|
Member of the Board and Chair of the Audit Committee and former member of the Risk Committee of Regions Financial Corporation (2010-present)
|
|
n
|
Member of the Board, Audit Committee and Executive Committee and Chair of the Corporate Governance and Nominating Committee of Popeyes Louisiana Kitchen, Inc. (2001-2017)
|
|
n
|
Member of the Board and Audit Committee of Circuit City Stores, Inc. (2000-2009)
|
|
n
|
Member of the Board and Audit Committee of RARE Hospitality International, Inc. (2000-2007)
|
Lance F. Drummond
|
Age
|
Director Since
|
Freddie Mac Committees
|
Public Company Directorships
|
||
|
64
|
July 2015
|
•
|
Audit
|
•
|
CurAegis Technologies, Inc.
|
|
•
|
Nominating & Governance
|
•
|
United Community Banks, Inc.
|
||
Mr. Drummond is a senior business leader with extensive experience, specializing in business transforming strategy development and execution, operations, technology, and process re-engineering.
Experience and Qualifications
|
n
|
Executive in Residence, Christopher Newport University (2015-2017)
|
|
n
|
Executive Vice President of Operations and Technology of TD Canada Trust (2011-2014)
|
|
n
|
Executive Vice President of Human Resources and Shared Services of Fiserv Inc. (2009-2011)
|
|
n
|
Senior Vice President and Supply Chain Executive, Service and Fulfillment Executive for Global Technology and Operations, and eCommerce and ATM Executive of Bank of America (2002-2008)
|
|
n
|
Various positions with Eastman Kodak Company, including Chief Operating Officer and Corporate Vice President of Kodak Professional Division (1976-2002)
|
|
FREDDIE MAC
| 2018 Form 10-K
|
347
|
|
|
Directors, Corporate Governance, and Executive Officers
|
Directors
|
|
n
|
Member of the Board and Risk, Compensation, and Nominating and Governance Committees of United Community Banks, Inc. (2018-present)
|
|
n
|
Member of the Board of the Financial Industry Regulatory Authority (2018-present)
|
|
n
|
Member of the Board and Audit Committee of CurAegis Technologies, Inc. (2018-present)
|
Aleem Gillani
|
Age
|
Director Since
|
Freddie Mac Committees
|
Public Company Directorships
|
||
|
56
|
January 2019
|
•
|
Audit
|
None
|
|
|
•
|
Compensation
|
||||
Mr. Gillani is an executive with extensive experience at sophisticated financial institutions. He brings a blend of industry, financial, and risk management experience to the Board.
Experience and Qualifications
|
n
|
Chief Financial Officer and Corporate Executive Vice President of SunTrust Banks, Inc. (2011-2018)
|
|
n
|
Executive Vice President and Corporate Treasurer of SunTrust Banks, Inc. (2010-2011)
|
|
n
|
Senior Vice President and Chief Market Risk Officer of SunTrust Banks, Inc. (2007-2010)
|
|
n
|
Senior Vice President and Chief Market Risk Officer of PNC Financial Services Group, Inc. (2004-2007)
|
|
n
|
Chief Market Risk Officer of BankBoston and FleetBoston Corp. (1996-2004)
|
|
n
|
Member of the Board of SunTrust Robinson Humphrey (2011-2018)
|
|
n
|
Founding Chair of the Market Risk Council for the Risk Management Association (1998)
|
Christopher E. Herbert
|
Age
|
Director Since
|
Freddie Mac Committees
|
Public Company Directorships
|
||
|
58
|
March 2018
|
•
|
Compensation
|
None
|
|
|
•
|
Risk
|
||||
Mr. Herbert is an experienced leader in the governmental and educational sectors, with in-depth knowledge of housing policy and urban development, including the financial and demographic dimensions of home ownership.
Experience and Qualifications
|
n
|
Managing Director for Harvard University's Joint Center for Housing Studies and Lecturer in Urban Planning and Design at the Harvard Graduate School of Design (2015-present)
|
|
n
|
Research Director for Harvard University's Joint Center for Housing Studies (2010-2014)
|
|
n
|
Senior Associate at Abt Associates, Inc. (1997-2010)
|
|
n
|
Member of the Board of the Homeownership Preservation Foundation (2011-present)
|
|
n
|
Member of the Research Advisory Council for the Center for Responsible Lending (2006-present)
|
|
n
|
Member of the Board of GreenPath Financial Wellness (2017-present)
|
|
n
|
Member of the Federal Reserve Bank of Boston's Community Development Research Advisory Council (2014-2016)
|
|
FREDDIE MAC
| 2018 Form 10-K
|
348
|
|
|
Directors, Corporate Governance, and Executive Officers
|
Directors
|
Grace A. Huebscher
|
Age
|
Director Since
|
Freddie Mac Committees
|
Public Company Directorships
|
||
|
59
|
December 2017
|
•
|
Nominating & Governance
|
None
|
|
|
•
|
Risk
|
||||
Ms. Huebscher is an executive with extensive experience in capital markets and real estate. She brings to the Board deep multifamily industry knowledge, entrepreneurship, and savvy.
Experience and Qualifications
|
n
|
Advisor to Capital One Commercial Bank (2017)
|
|
n
|
President of Capital One Multifamily Finance, LLC (2013-2017)
|
|
n
|
Co-Founder and Chief Executive Officer of Beech Street Capital, LLC (2009-2013)
|
|
n
|
Various positions with Fannie Mae, including Vice President, Capital Markets (1997-2009)
|
|
n
|
Member of the Board of The Kenyon Review (1998-present)
|
|
n
|
Member of the Commercial Board of Governors of the Mortgage Bankers Association (2014-2017)
|
Steven W. Kohlhagen
|
Age
|
Director Since
|
Freddie Mac Committees
|
Public Company Directorships
|
||
|
71
|
February 2013
|
•
|
Compensation, Chair
|
•
|
AMETEK, Inc.
|
|
•
|
Executive
|
||||
|
•
|
Risk
|
||||
Mr. Kohlhagen is nationally recognized as a leading financial expert with extensive knowledge of mortgage finance and the capital markets. He brings to the Board a unique combination of senior executive leadership skills and a deep understanding of economics, modeling, and complex financial instruments.
Experience and Qualifications
|
n
|
Various positions with First Union National Bank (predecessor to Wachovia National Bank and Wells Fargo), last serving as Managing Director of the Fixed Income Division (1992-2003)
|
|
n
|
Various positions with AIG Financial Products (1990-1992); Stamford Capital Group (1987-1990); Bankers Trust Corporation (1985-1987); and Lehman Brothers, Inc. (1983-1985)
|
|
n
|
Consulting work for the Organization for Economic Cooperation and Development (1980-1981), Treasury (1976-1977), and the Federal Reserve Board (1976)
|
|
n
|
Senior Staff Economist for the Council of Economic Advisors, White House Staff (1978-1979)
|
|
n
|
Professor of International Economics and Finance at the University of California, Berkeley (1973-1983)
|
|
n
|
Member of the Board and Audit and Corporate Governance/Nominating Committees of AMETEK, Inc. (2006-present)
|
|
n
|
Member of the Board and Audit and Compensation Committees of GulfMark Offshore, Inc. (2013-2017)
|
|
n
|
Member of the Board and Compensation Committee and Chair of the Governance and Nominating Committee of Reval, Inc. (2007-2016)
|
|
FREDDIE MAC
| 2018 Form 10-K
|
349
|
|
|
Directors, Corporate Governance, and Executive Officers
|
Directors
|
|
n
|
Member of the Board and Audit Committee of Abtech Holdings, Inc. (2013-2014)
|
|
n
|
Advisory Board member of the Stanford Institute for Economic Policy Research (2001-present)
|
|
n
|
Advisory Board member of the Roper St. Francis Cancer Center (2011-present)
|
|
n
|
Member of the Board of IQ Mutual Funds, a family of Merrill Lynch registered, closed-end investment companies (2005-2010)
|
Donald H. Layton
|
Age
|
Director Since
|
Freddie Mac Committees
|
Public Company Directorships
|
||
|
68
|
May 2012
|
•
|
Executive
|
None
|
|
Mr. Layton is an experienced financial institution executive and leader of finance and investment organizations. Mr. Layton provides valuable insight to the Board as a result of his leadership of Freddie Mac and his knowledge of our business and industry, as well as his extensive financial services industry experience.
Experience and Qualifications
|
n
|
Chief Executive Officer of Freddie Mac (2012-present)
|
|
n
|
Chairman of E*TRADE Financial (2007-2009); Chief Executive Officer (2008-2009)
|
|
n
|
Senior Advisor to the Securities Industry and Financial Markets Association (2006-2008)
|
|
n
|
Various positions with JPMorgan Chase and its predecessors, beginning as a trainee and rising to Vice Chairman and a member of the company's three-person Office of the Chairman (1975-2004); positions included Head of Chase Financial Services (2002-2004); Co-Chief Executive Officer of J.P. Morgan, the investment bank of the company (2000-2002); Head of Treasury and Securities Services (1999-2004); and Head of Chase Manhattan's worldwide capital markets and trading activities, including foreign exchange, risk management products, emerging markets, fixed income, and the bank's investment portfolio and funding department (1996 to 2000; prior to Chase's merger with J.P. Morgan)
|
|
n
|
Chairman Emeritus of the Partnership for the Homeless (2015-present); Chairman of the Board (2005-2015)
|
|
n
|
Member of the Board of Assured Guaranty Ltd. (2006-2012)
|
|
n
|
Member of the Board of American International Group (2010-2012)
|
Christopher S. Lynch
|
Age
|
Director Since
|
Freddie Mac Committees
|
Public Company Directorships
|
||
|
61
|
December 2008
|
•
|
Executive, Chair
|
•
|
American International Group, Inc.
|
Mr. Lynch is an experienced senior executive who was responsible for one of the Big Four's Financial Services practice and served as the lead audit signing partner and account executive for several large financial institutions with mortgage lending businesses. He also has significant public company audit committee and risk management experience. Mr. Lynch's extensive experience in finance, accounting, and risk management enables him to provide valuable guidance to the Board on complex operating, strategic, governance, financial reporting, troubled-asset management, and risk management issues. He has served as Non-Executive Chair of the Board since December 2011. Mr. Lynch will depart the Board on February 15, 2019.
|
FREDDIE MAC
| 2018 Form 10-K
|
350
|
|
|
Directors, Corporate Governance, and Executive Officers
|
Directors
|
Experience and Qualifications
|
n
|
Independent consultant providing a variety of services to financial intermediaries, including corporate restructuring, risk management, strategy, governance, financial and regulatory reporting, and troubled-asset management (2007-present)
|
|
n
|
Various positions with KPMG LLP, including National Partner in Charge - Financial Services; Chairman of KPMG’s Americas Financial Services; Member of the Global Financial Services and U.S. Industries Leadership teams; and Department of Professional Practice partner (1979-2007)
|
|
n
|
Practice Fellow at the FASB (1987-1989)
|
|
n
|
Member of the Board, Chair of the Nominating and Corporate Governance Committee, member of the Risk and Capital and Technology Committees, and former Chair of the Audit Committee of American International Group (2009-present)
|
|
n
|
Advisory Board member of the Stanford Institute for Economic Policy Research (2014-present)
|
|
n
|
Member of the National Audit Committee Chair Advisory Council of the National Association of Corporate Directors (2014-present)
|
Sara Mathew
|
Age
|
Director Since
|
Freddie Mac Committees
|
Public Company Directorships
|
||
|
63
|
December 2013
|
•
|
Audit, Chair
|
•
|
Campbell Soup Company
|
|
•
|
Executive
|
•
|
State Street Corporation
|
||
|
•
|
Nominating & Governance
|
||||
Ms. Mathew is an executive with global financial and general management experience. Ms. Mathew's extensive business, financial, and management experience, and her public company board and audit committee experience, enable her to contribute to the Board's oversight of our internal control over financial reporting and compliance matters. She will become Non-Executive Chair of the Board on February 15, 2019.
Experience and Qualifications
|
n
|
Various positions with Dun & Bradstreet Corporation (2001-2013), including Chairman and Chief Executive Officer (2010-2013); President and Chief Operating Officer (2007-2010); and Senior Vice President and CFO (2001-2006)
|
|
n
|
Various finance and management positions with The Procter & Gamble Company, including Vice President of Finance for Australia, Asia, and India (1983-2001)
|
|
n
|
Member of the Board and Audit and Finance and Corporate Development Committees of Campbell Soup Company (2005-present)
|
|
n
|
Member of the Board and Nominating and Corporate Governance and Risk Committees of State Street Corporation (2018-present)
|
|
n
|
Member of the Board, Chair of the Audit, Compliance and Risk Committee, member of the Nomination and Governance Committee, and former member of the Remuneration Committee of Shire plc (2015-2019)
|
|
n
|
Member of the Board and Finance and Nominating and Corporate Governance Committees of Avon Products, Inc. (2014-2016)
|
|
n
|
Member of the Board of Dun & Bradstreet Corporation (2008-2013)
|
|
FREDDIE MAC
| 2018 Form 10-K
|
351
|
|
|
Directors, Corporate Governance, and Executive Officers
|
Directors
|
|
n
|
Member of the International Advisory Council of Zurich Financial Services Group (2012-2017)
|
Saiyid T. Naqvi
|
Age
|
Director Since
|
Freddie Mac Committees
|
Public Company Directorships
|
||
|
69
|
August 2013
|
•
|
Compensation
|
None
|
|
|
•
|
Executive
|
||||
|
•
|
Risk, Chair
|
||||
Mr. Naqvi is a seasoned financial executive with proven leadership experience and detailed knowledge of mortgage and consumer financial operations, as well as a deep background in risk and operational management.
Experience and Qualifications
|
n
|
President and Chief Executive Officer of PNC Mortgage, a division of PNC Bank, National Association, which is a subsidiary of PNC Financial Services Group (2009-2013)
|
|
n
|
President of Harley-Davidson Financial Services, Inc. (2007-2009)
|
|
n
|
Chief Executive Officer of DeepGreen Financial, Inc. (2005-2006)
|
|
n
|
President and Chief Financial Officer of Setara Corporation (2002-2005)
|
|
n
|
President and Chief Executive Officer of PNC Mortgage Corporation of America (1995-2001)
|
|
n
|
Member of the Board of Genworth Financial (2005-2009)
|
|
n
|
Member of the Board of Hanover Mortgage Capital Holdings, Inc. (1998-2006)
|
|
n
|
Member of the Housing Council of the Financial Services Roundtable (2009-2013)
|
Eugene B. Shanks, Jr.
|
Age
|
Director Since
|
Freddie Mac Committees
|
Public Company Directorships
|
||
|
71
|
December 2008
|
•
|
Audit
|
•
|
Chubb Limited (formerly ACE Limited)
|
|
•
|
Executive
|
||||
|
•
|
Nominating & Governance, Chair
|
||||
Mr. Shanks is an experienced finance executive with leadership and risk management expertise. Mr. Shanks' leadership and risk management experience enables him to provide the Board with valuable guidance on risk management issues and our strategic direction.
Experience and Qualifications
|
n
|
Founder, President, and Chief Executive Officer of NetRisk, Inc. (1997-2002)
|
|
n
|
Various positions with Bankers Trust New York Corporation, including Head of Global Markets and President and Director (1973-1978 and 1980-1995)
|
|
n
|
Treasurer of Commerce Union Bank in Nashville, Tennessee (1978-1980)
|
|
n
|
Member of the Board and Risk and Finance Committee of Chubb Limited (2011-present)
|
|
n
|
Advisory Board member of the Stanford Institute for Economic Policy Research (2010-present)
|
|
n
|
Senior Advisor of Bain and Company (2008-2011)
|
|
n
|
Founding Director of The Posse Foundation (1992-present)
|
|
n
|
Trustee Emeritus of Vanderbilt University (2015-present), Trustee (1992-2015)
|
|
FREDDIE MAC
| 2018 Form 10-K
|
352
|
|
|
Directors, Corporate Governance, and Executive Officers
|
Directors
|
Anthony A. Williams
|
Age
|
Director Since
|
Freddie Mac Committees
|
Public Company Directorships
|
||
|
67
|
December 2008
|
•
|
Nominating & Governance
|
•
|
None
|
|
•
|
Risk
|
||||
Mr. Williams is an experienced leader in national, state, and local governments, with extensive knowledge concerning real estate and housing for low-income individuals. He also has significant experience in financial matters and is an experienced academic focusing on public management issues. Mr. Williams’ leadership and operating experience in the public sector allows him to provide a unique perspective on state and local housing issues. Mr. Williams will depart the Board on February 15, 2019.
Experience and Qualifications
|
n
|
Chief Executive Officer and Executive Director of Federal City Council (2012-present)
|
|
n
|
Senior Advisor at King & Spalding (2016-present)
|
|
n
|
Senior Advisor at Dentons (2015-2016)
|
|
n
|
Senior Fellow (2012) and Executive Director of Global Government Practice (2010-2012) of the Corporate Executive Board Company
|
|
n
|
Bloomberg Lecturer in Public Management at Harvard’s Kennedy School of Government (2009-2012)
|
|
n
|
Senior Advisor, Intergovernmental Practice at Arent Fox LLP (2009-2010)
|
|
n
|
Chief Executive Officer of Primum Public Realty Trust (2007-2008)
|
|
n
|
Mayor of Washington, DC (1999-2007)
|
|
n
|
Chief Financial Officer of Washington, DC (1995-1998)
|
|
n
|
President of the National League of Cities (2005)
|
|
n
|
Vice-Chair of the Metropolitan Washington Council of Governments (2005-2006)
|
|
n
|
Chief Financial Officer for the U.S. Department of Agriculture (1993-1995)
|
|
n
|
Deputy State Comptroller of Connecticut (1991-1993)
|
|
n
|
Executive Director of the Community Development Agency of St. Louis, Missouri (1989-1991)
|
|
n
|
Assistant Director of the Boston Redevelopment Agency and Head of the Department of Neighborhood Housing and Development (1988-1989)
|
|
n
|
Member of the Board of the Bank of Georgetown (2012-2016)
|
|
n
|
Member of the Board and Audit Committee of Calvert Funds (2010-present)
|
|
n
|
Member of the Board and Audit Committee of Weston Solutions (2008-2015)
|
|
n
|
Member of the Board and Audit Committee of Meruelo Maddox Properties, Inc. (2007-2009)
|
|
FREDDIE MAC
| 2018 Form 10-K
|
353
|
|
|
Directors, Corporate Governance, and Executive Officers
|
Corporate Governance
|
|
CORPORATE GOVERNANCE
Our Corporate Governance Practices
The company is committed to best practices in corporate governance. The Board regularly reviews our governance practices, assesses the regulatory and legislative environment, and adopts governance practices that are in the best interests of the company.
Our Board has adopted the company's Corporate Governance Guidelines. The Guidelines are available on our website at
www.freddiemac.com/governance/pdf/gov_guidelines.pdf
. The Guidelines are reviewed annually by our Board and were last updated in June 2017. The Guidelines establish corporate governance practices, and include: qualifications for directors, a limitation on the number of boards on which a director may serve, term limits, director orientation and continuing education, and a requirement that the Board and each of its committees perform an annual self-evaluation.
We regularly review our practices to ensure effective collaboration of management and the Board. We have instituted the following specific corporate governance practices:
|
n
|
Our Board has an independent Non-Executive Chair, whose responsibilities include presiding over meetings of the Board and executive sessions of the non-employee or independent directors. Mr. Lynch has served as Non-Executive Chair since December 2011. Ms. Mathew will become Non-Executive Chair on February 15, 2019.
|
|
n
|
Of the Board's 12 directors, 11 are independent, including the Non-Executive Chair.
|
|
n
|
Our directors are elected annually.
|
|
n
|
Each of the Audit, Compensation, Nominating and Governance, and Risk Committees consists entirely of independent directors.
|
|
n
|
Each committee operates pursuant to a written charter that has been approved by the Board (these charters are available at
http://www.freddiemac.com/governance/board-committees.html
).
|
|
n
|
Independent directors meet regularly without management.
|
|
n
|
The Board and each of the Audit, Compensation, Nominating and Governance, and Risk Committees conduct an annual self-evaluation.
|
|
n
|
New directors receive a full orientation regarding the company and issues specific to the committees to which they have been appointed.
|
|
n
|
All directors are provided with access to, and are encouraged to utilize, third party continuing education.
|
|
n
|
Management provides the Board and committees with in-depth technical briefings on substantive issues affecting the company.
|
|
n
|
The Board reviews management talent and succession planning at least annually.
|
Director Independence and Relevant Considerations
Our non-employee Board members have evaluated the independence, as defined in Sections 4 and 5 of the Guidelines and in Section 303A.02 of the NYSE Listed Company Manual, of each of our non-employee Board members and determined that all current members of our Board (other than Mr. Layton, our CEO) are, and that past members of our Board, Messrs. Thomas M. Goldstein, Richard C. Hartnack,
|
FREDDIE MAC
| 2018 Form 10-K
|
354
|
|
|
Directors, Corporate Governance, and Executive Officers
|
Corporate Governance
|
|
and Nicolas P. Retsinas, were, independent directors. Mr. Layton is not considered an independent director because he is our CEO.
Our non-employee Board members concluded that all current members of our Audit Committee, Compensation Committee, and Nominating and Governance Committee are independent within the meaning of Sections 4 and 5 of the Guidelines and Section 303A.02 of the NYSE Listed Company Manual. Our Board also determined that: (i) all current members of our Audit Committee are independent within the meaning of Exchange Act Rule 10A-3 and Section 303A.06 of the NYSE Listed Company Manual; and (ii) all current members of our Compensation Committee are independent within the meaning of Exchange Act Rule 10C-1 and Section 303A.02(a)(ii) of the NYSE Listed Company Manual.
In determining the independence of each Board member, our non-employee Board members reviewed the following categories or types of relationships, in addition to those specifically addressed by the standards contained in Section 5 of the Guidelines, to determine whether those relationships, either individually or in aggregate, would constitute a material relationship between the director and us that would impair a director's judgment as a member of the Board or create the perception or appearance of such an impairment:
|
n
|
Employment Affiliations with Business Partners
- Messrs. Herbert and Williams are employed by organizations that engage or have engaged in business with us resulting in payments between us and the organizations. Under the Guidelines, no specific independence determination is required with respect to these payments because they do not exceed the greater of $1 million or 2% of the firm's consolidated gross revenues for each of the last three fiscal years. After considering the nature and extent of the specific relationships between the organizations and us, our non-employee Board members concluded that the business relationships do not constitute material relationships between either Mr. Herbert or Mr. Williams and us that would impair their respective independence as our directors.
|
|
n
|
Employment Affiliations with Competitors
- During 2018, an immediate family member of Ms. Huebscher served as an employee of a company that is a competitor of Freddie Mac. After considering the nature and extent of the specific relationship between the competitor and the immediate family member and between the competitor and Freddie Mac, our non-employee Board members concluded that the business relationship does not constitute a material relationship that would impair Ms. Huebscher's independence as our director.
|
|
n
|
Board Memberships with Charitable Organizations to Which We Have Made Payments
- During 2018, Mr. Retsinas (who served as a director until February 13, 2018) served as Director Emeritus of a charitable organization that received payments from us. Because the total annual amount paid to the charitable organization did not exceed the greater of $1 million or 2% of the organization's consolidated gross revenues for each of the last three fiscal years, no specific independence determination with respect to these payments was required under the Guidelines; moreover, since Mr. Retsinas was neither a board member nor a trustee of the charitable organization, the payments would not have required an independence determination in any event. The non-employee members of the Board considered the payments and the nature of the organization and concluded that the relationship with the charitable organization did not constitute a material relationship between Mr. Retsinas and us that impaired his independence as our director.
|
|
n
|
Board Memberships with Business Partners
- Ms. Byrd and Messrs. Drummond, Herbert, Lynch, and Williams serve or have served as directors of other organizations that engage or have engaged
|
|
FREDDIE MAC
| 2018 Form 10-K
|
355
|
|
|
Directors, Corporate Governance, and Executive Officers
|
Corporate Governance
|
|
in business with us resulting in payments between us and such organizations during the past three fiscal years. After considering the nature and extent of the specific relationship between each of those organizations and us, and the fact that these current or past Board members are or were directors of these other organizations rather than employees, our non-employee Board members concluded that those business relationships do not constitute material relationships between any of the directors and us that would impair their independence as our directors.
|
n
|
Financial Relationships with Business Partners
- Messrs. Gillani, Hartnack (who served as a director until February 13, 2018), and Kohlhagen each own stock in companies with which we conduct significant business, and such ownership represents a material portion of their respective net worth. To eliminate any potential conflict of interest that might arise as a result of their respective stock ownership, we have established mechanisms pursuant to which they will be recused from discussing and acting upon any matters considered by the Board or any of the committees of which they are a member and that directly relate to the company in which they have such stock ownership. In situations where matters are frequently presented to the Board regarding these companies, we have established formal recusal arrangements. The Audit Committee Chair, in consultation with the Non-Executive Chair, addresses any questions regarding whether recusal from a particular discussion or action is appropriate.
|
In evaluating the independence of Messrs. Gillani, Hartnack, and Kohlhagen in light of their stock ownership of our business partners, our non-employee Board members considered the nature and extent of our business relationships with such business partners and any potential impact that their respective stock ownership may have on their independent judgment as our directors, taking into account the relevant recusal mechanisms. Our non-employee Board members concluded that these mechanisms addressed any actual or potential conflicts of interest that may have arisen with respect to the stock ownership. Accordingly, our non-employee Board members concluded that the stock ownership of our business partners of each of Messrs. Gillani, Hartnack, and Kohlhagen did not constitute material relationships between them and Freddie Mac that would impair their independence as Freddie Mac directors.
Board and Committee Information
Authority of the Board and Board Committees
The directors serve on behalf of, and exercise authority as directed by, the Conservator and owe their fiduciary duties of care and loyalty to the Conservator. Although the Conservator has provided authority for the Board and its committees to function in accordance with the duties and authorities set forth in applicable statutes, regulations, guidance, orders and directives, and our Bylaws and committee charters, the Conservator has reserved certain powers of approval to itself. The Conservator provided instructions to the Board in 2008 and 2012 to consult with and obtain the Conservator's decision before taking certain actions. In December 2017, the Conservator further revised these instructions, which became effective on March 31, 2018.
The Conservator's revised instructions require that we obtain the Conservator's decision before taking action on any matters that require the consent of or consultation with Treasury under the Purchase Agreement. See
Note 2: Conservatorship and Related Matters
for a list of matters that require the approval of Treasury under the Purchase Agreement.
|
FREDDIE MAC
| 2018 Form 10-K
|
356
|
|
|
Directors, Corporate Governance, and Executive Officers
|
Corporate Governance
|
|
The Conservator's revised instructions also require us to obtain the Conservator's decision before taking action in the areas identified in the table below. For some matters, the Conservator's revised instructions specify that our Board must review and approve the matter before we request the Conservator's decision, and for other matters the Board is expected to determine the appropriate level of its engagement.
|
Matters Requiring Prior Board Review and Approval
|
Other Matters
|
|
• redemptions or repurchases of our subordinated debt, except as may be necessary to comply with the Purchase Agreement;
• creation of any subsidiary or affiliate, or entering into a substantial transaction with a subsidiary or affiliate, except for routine, ongoing transactions with CSS or the creation of, or a transaction with, a subsidiary or affiliate undertaken in the ordinary course of business;
•
changes to, or removal of, Board risk limits that would result in an increase in the amount of risk that may be taken by us;
•
retention and termination of external auditors to perform an integrated audit of our financial statements and internal controls over financial reporting and termination of law firms serving as consultants to the Board;
• proposed
amendments to our bylaws or Board committee charters;
• setting or increasing the compensation or benefits payable to members of the Board; and
• establishing the annual operating budget.
|
• material changes in accounting policy;
• proposed changes in our business operations, activities, and transactions that, in the reasonable business judgment of our management, are more likely than not to result in a significant increase in credit, market, reputational, operational, or other key risks;
• matters, including our initiation or substantive response to litigation, that impact or question the Conservator's powers, our status in conservatorship, the legal effect of the conservatorship, interpretations of the Purchase Agreement or terms and conditions of the Financial Agency Agreement with Treasury or our performance under the Financial Agency Agreement;
• agreements with respect to any securities litigation claim; and agreements under which we settle, resolve, or compromise demands, claims, litigation, lawsuits, prosecutions, regulatory proceedings, or tax matters when the amount in dispute is more than $50 million, including each separate agreement with the same counterparty involving the same dispute or common facts when the aggregate amount in dispute totals more than $50 million (excluding loan workouts);
• mergers, acquisitions and changes in control of a Key Counterparty where we have a direct contractual right to cease doing business with such Key Counterparty or object to the merger or acquisition;
• changes to requirements, policies, frameworks, standards, or products that are aligned with Fannie Mae's, pursuant to FHFA's direction;
• credit risk transfers that are new transaction types, recurring transactions with any material change in terms, and transactions that involve collateral types not previously included in a risk transfer transaction;
• mortgage servicing rights sales and transfers involving:
○ 100,000 or more loans to a non-bank transferee; or
○ 25,000 or more loans to any transferee servicer when the transfer would increase the number of the transferee's Freddie Mac- and Fannie Mae-owned seriously delinquent loans by at least 25 percent and the servicing transfer has a minimum of 500 seriously delinquent loans; and
• changes in employee compensation that could significantly impact our employees, including retention awards, special incentive plans, and merit increase pool funding.
|
In addition, FHFA requires us to provide it with timely notice of (i) activities that represent a significant change in current business practices, operations, policies, or strategies not otherwise addressed in the Conservator decision items referenced above; (ii) exceptions and waivers to aligned requirements, policies, frameworks, standards or products if not otherwise submitted to FHFA for Conservator approval as required above; and (iii) accounting error corrections to previously issued financial statements that are not de minimis. FHFA will then determine whether any such items require
|
FREDDIE MAC
| 2018 Form 10-K
|
357
|
|
|
Directors, Corporate Governance, and Executive Officers
|
Corporate Governance
|
|
Conservator approval. For more information on the conservatorship, see
MD&A - Conservatorship and Related Matters
.
Board Committees
The Board has five standing committees: Audit, Compensation, Executive, Nominating and Governance, and Risk. All standing committees, other than the Executive Committee, meet regularly and are chaired by, and consist entirely of, independent directors. The Committees perform essential functions on behalf of the Board. The Committee Chairs review and approve agendas for all meetings of their respective Committees. Charters for the standing committees describe each committee's responsibilities and have been adopted by the Board and approved by the Conservator. These charters are available on our website at
http://www.freddiemac.com/governance/board-committees.html
. The membership of each committee as of February 13, 2019 is set forth below, together with a description of the primary responsibilities of each committee.
|
Committee
|
Meetings in 2018
|
Chair
|
Members
|
||
|
Audit Committee
|
11 Committee meetings;
1 joint meeting with the Risk Committee
|
Sara Mathew
|
•
|
Lance F. Drummond
|
|
|
•
|
Aleem Gillani
|
||||
|
•
|
Eugene B. Shanks. Jr.
|
||||
|
Compensation Committee
|
9 Committee meetings
|
Steven W. Kohlhagen
|
•
|
Carolyn H. Byrd
(1)
|
|
|
•
|
Aleem Gillani
|
||||
|
•
|
Christopher E. Herbert
|
||||
|
•
|
Saiyid T. Naqvi
|
||||
|
Executive Committee
|
None
|
Christopher S. Lynch
(1)
|
•
|
Steven W. Kohlhagen
|
|
|
•
|
Donald H. Layton
|
||||
|
•
|
Sara Mathew
(1)
|
||||
|
•
|
Saiyid T. Naqvi
|
||||
|
•
|
Eugene B. Shanks, Jr.
|
||||
|
Nominating and Governance Committee
|
6 Committee meetings
|
Eugene B. Shanks, Jr.
|
•
|
Lance F. Drummond
|
|
|
•
|
Grace A. Huebscher
|
||||
|
•
|
Sara Mathew
|
||||
|
•
|
Anthony A. Williams
(1)
|
||||
|
Risk Committee
|
5 Committee meetings;
1 joint meeting with the Audit Committee
|
Saiyid T. Naqvi
|
•
|
Carolyn H. Byrd
(1)
|
|
|
•
|
Christopher E. Herbert
|
||||
|
•
|
Grace A. Huebscher
|
||||
|
•
|
Steven W. Kohlhagen
|
||||
|
•
|
Anthony A. Williams
(1)
|
||||
|
(1)
|
Ms. Byrd and Messrs. Lynch and Williams will depart from the Board on February 15, 2019. In addition, Ms. Mathew will replace Mr. Lynch as Chair of the Executive Committee on that date.
|
|
FREDDIE MAC
| 2018 Form 10-K
|
358
|
|
|
Directors, Corporate Governance, and Executive Officers
|
Corporate Governance
|
|
Effective as of February 21, 2019, the membership of each committee will be as follows:
|
Committee
|
Chair
|
Members
|
||
|
Audit Committee
|
Aleem Gillani
|
•
|
Lance F. Drummond
|
|
|
•
|
Grace A. Huebscher
|
|||
|
•
|
Eugene B. Shanks. Jr.
|
|||
|
Compensation Committee
|
Steven W. Kohlhagen
|
•
|
Lance F. Drummond
|
|
|
•
|
Aleem Gillani
|
|||
|
•
|
Christopher E. Herbert
|
|||
|
Executive Committee
|
Sara Mathew
|
•
|
Aleem Gillani
|
|
|
•
|
Steven W. Kohlhagen
|
|||
|
•
|
Donald H. Layton
|
|||
|
•
|
Saiyid T. Naqvi
|
|||
|
•
|
Eugene B. Shanks, Jr.
|
|||
|
Nominating and Governance Committee
|
Eugene B. Shanks, Jr.
|
•
|
Grace A. Huebscher
|
|
|
•
|
Saiyid T. Naqvi
|
|||
|
Risk Committee
|
Saiyid T. Naqvi
|
•
|
Christopher E. Herbert
|
|
|
•
|
Steven W. Kohlhagen
|
|||
Audit Committee
The Audit Committee provides oversight of the company's accounting and financial reporting and disclosure processes, the adequacy of the systems of disclosure and internal control established by management, and the audit of the company's financial statements. Among other things, the Audit Committee: (i) appoints the independent auditor and evaluates its independence and performance; (ii) reviews the audit plans for and results of the independent audit and internal audits; and (iii) reviews reports related to processes established by management to provide compliance with legal and regulatory requirements. The Audit Committee's activities during 2018 with respect to the oversight of the independent auditor are described in more detail in
Principal Accounting Fees and Services — Approval of Independent Auditor Services and Fees
. The Audit Committee also periodically reviews the company's guidelines and policies governing the processes for assessing and managing the company's risks and generally reviews the company's major financial risk exposures and the steps taken to monitor and control such exposures. The Audit Committee also approves all decisions regarding the appointment, removal, and compensation of the General Auditor, who reports independently to the Audit Committee.
Our Audit Committee satisfies the definition of "audit committee" in Exchange Act Section 3(a)(58)(A) and the requirements of Exchange Act Rule 10A-3. Although our stock is no longer listed on the NYSE, certain of the corporate governance requirements of the NYSE Listed Company Manual, including those relating to audit committees, continue to apply to us because they are incorporated by reference in the Corporate Governance Rule. Our Audit Committee satisfies the "audit committee" requirements in Sections 303A.06 and 303A.07 of the NYSE Listed Company Manual. The Board has determined that all
|
FREDDIE MAC
| 2018 Form 10-K
|
359
|
|
|
Directors, Corporate Governance, and Executive Officers
|
Corporate Governance
|
|
members of our Audit Committee are independent and that Ms. Mathew, a member of the Audit Committee since December 2013 and its current chair, and Mr. Gillani, a member of the Audit Committee since January 2019 and its chair effective February 21, 2019, both meet the definition of an "audit committee financial expert" under SEC regulations.
Compensation Committee
The Compensation Committee oversees the company's compensation and benefits policies and programs. The company's processes for consideration and determination of executive compensation, and the role of the Compensation Committee in those processes, are further described in
Executive Compensation — CD&A
. The Compensation Committee Report is included in
Executive Compensation — CD&A —
Compensation Committee Report
.
The Compensation Committee consists entirely of independent directors. None of the members of the Compensation Committee during fiscal year 2018 were officers or employees of Freddie Mac or had any relationship with us that would be required to be disclosed by us under Item 407(e)(4) of Regulation S-K.
Executive Committee
The Executive Committee consists of the Non-Executive Chair, the chair of each other standing committee and our CEO, Mr. Layton. Other than Mr. Layton, each member is independent. The Executive Committee is authorized to exercise the corporate powers of the Board between meetings of the Board, except for those powers reserved to the Board by our Bylaws or otherwise.
Nominating and Governance Committee
The Nominating and Governance Committee, which consists entirely of independent directors, oversees the company's corporate governance, including reviewing the company's Bylaws and the Guidelines. It also assists the Board and its committees in conducting annual self-evaluations and identifying qualified individuals to become members of the Board. The Nominating and Governance Committee also reviews Board member independence and qualifications and recommends membership of the Board committees.
Risk Committee
The Risk Committee, which consists entirely of independent directors, oversees on an enterprise-wide basis the company's risk management framework, including credit risk, market risk, liquidity risk, operational risk, and enterprise-wide strategic risk. The Risk Committee reviews and approves the company's enterprise risk policy and Board-level risk appetite metrics, limits and thresholds, and reviews significant: (i) enterprise risk exposures; (ii) risk management strategies; (iii) results of risk management reviews and assessments; and (iv) emerging risks, among other responsibilities. The Risk Committee also approves all decisions regarding the appointment or removal of the CERO, and the CERO reports independently to the Risk Committee, in addition to the CEO.
|
FREDDIE MAC
| 2018 Form 10-K
|
360
|
|
|
Directors, Corporate Governance, and Executive Officers
|
Corporate Governance
|
|
Additional Board Oversight
The Board and Risk Committee provide oversight of the company's information and cybersecurity operations by receiving periodic reports from the Chief Information Officer and other senior officers. These updates include information regarding management's ongoing efforts to improve information security and decrease cybersecurity risk, and the steps management has taken to address and mitigate the evolving cybersecurity threat environment. In addition, the Risk Committee receives updates regarding any assessments by external parties about the company's cybersecurity program. Senior management discusses cybersecurity developments with the Chair of the Risk Committee and other Board members between Board and committee meetings, as necessary. The company has procedures to escalate information regarding certain cybersecurity incidents to the appropriate members of the Board in a timely fashion. The Board and its committees also have authority, as they deem appropriate to fulfill Board or committee responsibilities, to engage outside consultants or advisors, including technology consultants and cybersecurity experts, and to evaluate the company's information security program.
Board Leadership Structure
The positions of CEO and Non-Executive Chair of the Board are held by different individuals. This leadership structure was established by the Conservator. FHFA's Corporate Governance Rule requires that the position of chairperson of the Board be filled by an independent director as defined under the rules of the NYSE. See
MD&A — Risk Management — Overview
for more information on the Board's role in risk oversight.
For a discussion of the Compensation Committee's conclusion that our compensation policies and practices do not create risks that are reasonably likely to have a material adverse effect on us, see
Executive Compensation — Compensation and Risk
.
Communications with Directors
Interested parties wishing to communicate any concerns or questions about Freddie Mac to the Board or its directors may do so by U.S. mail, addressed to the Corporate Secretary, Freddie Mac, 8200 Jones Branch Drive, McLean, VA 22102-3110. Communications may be directed to the Non-Executive Chair, to any other director or directors, or to groups of directors, such as the independent or non-employee directors.
Codes of Conduct
We have separate codes of conduct for our employees and Board members. The employee code also serves as the code of ethics for senior executives and financial officers. All employees, including senior executives and financial officers, are required to sign an annual acknowledgment that they have read the employee code and agree to abide by it and will report suspected deviations from the employee code. When joining our Board, our directors acknowledge that they have reviewed and understand the director code and agree to be bound by its provisions, and each director executes a related confirmation annually.
Copies of our employee and director codes of conduct are available, and any amendments or waivers that would be required to be disclosed are posted, on our website at
www.freddiemac.com
.
|
FREDDIE MAC
| 2018 Form 10-K
|
361
|
|
|
Directors, Corporate Governance, and Executive Officers
|
Corporate Governance
|
|
Director Compensation
Non-employee Board members receive compensation in the form of cash retainers, paid on a quarterly basis. Non-employee directors are also reimbursed for reasonable out-of-pocket costs for attending meetings of the Board or a Board committee of which they are a member and for other reasonable expenses associated with carrying out their responsibilities as directors.
Our directors are compensated entirely in cash because the Purchase Agreement prohibits us from issuing any shares of our equity securities without the prior written consent of Treasury. See
Executive Compensation — CD&A —
Overview of Executive Management Compensation Program
. Unlike compensation for our executives, there is no provision in the director compensation program for pay that varies depending on business results. Although such incentive compensation is deemed appropriate to give management strong incentives to devise and execute business plans and achieve positive financial results, it is viewed as inconsistent with the oversight role of directors.
2018 Non-Employee Director Compensation Levels
Board compensation levels during conservatorship are shown in the table below.
Table 74 - Board Compensation Levels
|
Board Service
|
Cash Compensation
|
|||
|
Annual Retainer for Non-Executive Chair
|
|
$290,000
|
|
|
|
Annual Retainer for Directors (other than the Non-Executive Chair)
|
160,000
|
|
||
|
Committee Service
|
Cash Compensation
|
|||
|
Annual Retainer for Audit Committee Chair
|
|
$25,000
|
|
|
|
Annual Retainer for Risk Committee Chair
|
15,000
|
|
||
|
Annual Retainer for Committee Chairs (other than Audit or Risk)
|
10,000
|
|
||
|
Annual Retainer for Audit Committee Members
|
10,000
|
|
||
|
FREDDIE MAC
| 2018 Form 10-K
|
362
|
|
|
Directors, Corporate Governance, and Executive Officers
|
Corporate Governance
|
|
2018 Director Compensation
The following table summarizes the 2018 compensation earned by all persons who served as non-employee directors during 2018.
Table 75 - Director Compensation
|
Non-Employee Director
|
Fees Earned or
Paid in Cash
(1)
|
Total
|
||||||
|
Christopher S. Lynch
|
|
$290,000
|
|
|
$290,000
|
|
||
|
Carolyn H. Byrd
|
160,000
|
|
160,000
|
|
||||
|
Lance F. Drummond
|
170,000
|
|
170,000
|
|
||||
|
Thomas M. Goldstein
(2)
|
178,806
|
|
178,806
|
|
||||
|
Richard C. Hartnack
(3)
|
20,306
|
|
20,306
|
|
||||
|
Christopher E. Herbert
(4)
|
121,333
|
|
121,333
|
|
||||
|
Grace A. Huebscher
|
160,000
|
|
160,000
|
|
||||
|
Steven W. Kohlhagen
(2)
|
168,806
|
|
168,806
|
|
||||
|
Sara Mathew
|
185,000
|
|
185,000
|
|
||||
|
Saiyid T. Naqvi
|
175,000
|
|
175,000
|
|
||||
|
Nicolas P. Retsinas
(3)
|
21,500
|
|
21,500
|
|
||||
|
Eugene B. Shanks, Jr.
(2)
|
173,207
|
|
173,207
|
|
||||
|
Anthony A. Williams
|
160,000
|
|
160,000
|
|
||||
|
(1)
|
We do not have pension or retirement plans for our non-employee directors, and all compensation is paid in cash with no additional compensation paid. Therefore, the "Change in Pension Value and Non-qualified Deferred Compensation Earnings"
and "All Other Compensation" c
olumns have been omitted.
|
|
(2)
|
In addition to the annual Board service and appropriate Committee Chair retainers, the amount reflects partial annual compensation for service as a member of the Audit Committee or as a Com
mittee Chair during 2018
. Mr. Goldstein (who resigned in January 2019) became Chair of the Nominating and Governance Committee and Mr. Kohlhagen became Chair of the Compensation Committee in February 2018. Mr. Shanks began serving as acting Chair of the Nominating and Governance Committee in September 2018.
|
|
(3)
|
Messrs. Hartnack and Retsinas left the Board in February 2018.
|
|
(4)
|
Mr. Herbert joined the Board in March 2018.
|
Indemnification
We have made arrangements to indemnify our directors against certain liabilities which are similar to the terms on which our executive officers are in
demnified. For a description of such terms, see
Executive Compensation — CD&A
—
Written Agreements Relating to NEO Employment — Indemnification Agreements
.
|
FREDDIE MAC
| 2018 Form 10-K
|
363
|
|
|
Directors, Corporate Governance, and Executive Officers
|
Executive Officers
|
|
EXECUTIVE OFFICERS
As of February 13, 2019, our executive officers are as follows:
Donald H. Layton
|
Age
|
Year of Affiliation
|
Position
|
|
68
|
2012
|
Chief Executive Officer
|
Mr. Layton has served as our CEO and a member of our Board since May 2012. See
Director Biographical Information
for a brief biographical description for Mr. Layton.
David M. Brickman
|
Age
|
Year of Affiliation
|
Position
|
|
53
|
1999
|
President
|
Mr. Brickman has served as our President since September 2018 where he contributes to the strategic leadership of the company. After a brief transition period, as of February 2019, he is responsible for the Single-family, Multifamily, Investments and Capital Markets, Information Technology and Internal Audit divisions as well as the Enterprise Operations department. Before becoming President, he served as our EVP - Multifamily since February 2014 and prior to that as our SVP - Multifamily since July 2011. In these roles, he was responsible for overall management of our Multifamily division. From June 2011 until July 2011, he served as SVP - Multifamily Capital Markets, and from March 2004 to June 2011, he served as Vice President in charge of Multifamily Capital Markets. In his previous roles at Freddie Mac, Mr. Brickman led the multifamily securitization, pricing, costing, portfolio management, and research teams; was responsible for the development and implementation of our multifamily securitization program, new quantitative pricing models, and financial risk analysis frameworks for all multifamily programs; and designed and led the development of several of our multifamily loan and securitization offerings, including the Capital Markets Execution and the K-Deal Securitization Program. Prior to joining Freddie Mac in 1999, Mr. Brickman co-led the Mortgage Finance and Credit Analysis group in the consulting practice at PricewaterhouseCoopers LLP.
Ricardo A. Anzaldua
|
Age
|
Year of Affiliation
|
Position
|
|
65
|
2018
|
Executive Vice President - General Counsel & Corporate Secretary
|
Mr. Anzaldua has served as our EVP - General Counsel & Corporate Secretary since January 2019. He joined us in May 2018 as EVP - Senior Legal Advisor. Previously, he was Executive Vice President and General Counsel of MetLife, Inc., from 2012 until 2017. From 2007 to 2012, he held senior positions in the legal department of the Hartford Financial Services Group. He began his legal career at the law firm of Cleary, Gottlieb, Steen & Hamilton LLP, where he became a partner in 1999.
|
FREDDIE MAC
| 2018 Form 10-K
|
364
|
|
|
Directors, Corporate Governance, and Executive Officers
|
Executive Officers
|
|
Stacey Goodman
|
Age
|
Year of Affiliation
|
Position
|
|
56
|
2017
|
Executive Vice President - Chief Information Officer
|
Ms. Goodman has served as our EVP - Chief Information Officer since September 2017. In this role, she leads the Information Technology division and provides enterprise-wide leadership for the company's technology activities. Previously, from 2012 to 2016, Ms. Goodman was at CIT where she was the EVP and Chief Information and Operations Officer. Prior to working at CIT, she worked at Bank of America from 2005 to 2011 in roles of increasing responsibility, last serving as managing director and divisional Chief Information Officer of global technology and operations.
Anil D. Hinduja
|
Age
|
Year of Affiliation
|
Position
|
|
55
|
2015
|
Executive Vice President - Chief Enterprise Risk Officer
|
Mr. Hinduja has served as our EVP - Chief Enterprise Risk Officer since July 2015. In this role, he provides overall direction and leadership for the Risk function and is responsible for leading an integrated risk management framework for all aspects of risk across the company. He joined Freddie Mac from Barclays PLC, where he served in increasingly broader risk management roles beginning in 2009, including Chief Risk Officer for Barclays Africa Group Limited, Group Credit Director for Retail Credit Risk, and Chief Risk Officer for Barclays' retail bank in the U.K. Prior to joining Barclays, Mr. Hinduja spent 19 years at Citigroup in diverse roles with increasing responsibility across finance, operations, sales and distribution, business, and risk management in global consumer businesses. In risk, he was Director for Global Consumer Credit Risk and then Chief Risk Officer for the Consumer Lending Group, where he was responsible for managing risk in the mortgage, auto, and student loan businesses. His tenure at Citigroup culminated in his term as President and CEO of Citi Home Equity.
Michael T. Hutchins
|
Age
|
Year of Affiliation
|
Position
|
|
63
|
2013
|
Executive Vice President - Investments and Capital Markets
|
Mr. Hutchins has served as our EVP - Investments and Capital Markets since January 2015 and prior to that served as SVP - Investments and Capital Markets from July 2013. Previously, Mr. Hutchins was Co-Founder and Chief Executive Officer of PrinceRidge, a financial services firm. Prior to PrinceRidge, he was with UBS from 1996 to 2007, holding a variety of positions, including the Global Head of the Fixed Income Rates & Currencies Group. Prior to UBS, Mr. Hutchins worked at Salomon Brothers from 1986 to 1996, where he held a number of management positions, including Co-Head of Fixed Income Capital Markets.
Deborah L. Jenkins
|
Age
|
Year of Affiliation
|
Position
|
|
51
|
2008
|
Executive Vice President - Multifamily
|
Ms. Jenkins has served as our EVP - Multifamily since November 2018 and, prior to that, served as SVP - Multifamily Underwriting and Credit. In this role, she was the principal manager of underwriting and
|
FREDDIE MAC
| 2018 Form 10-K
|
365
|
|
|
Directors, Corporate Governance, and Executive Officers
|
Executive Officers
|
|
credit approvals for all Multifamily debt investments, credit policy governance, and asset level securitization activities. Ms. Jenkins spearheaded enhancements in the Multifamily division’s underwriting process specifically to stand up its securitization program, including its signature K- and SB-Deals. Ms. Jenkins was a Senior Vice President with Wells Fargo National Bank in Michigan before joining Freddie Mac in March 2008.
David B. Lowman
|
Age
|
Year of Affiliation
|
Position
|
|
61
|
2013
|
Executive Vice President - Single-Family Business
|
Mr. Lowman has served as our EVP - Single-Family Business since May 2013. In addition, he served as a member of the Board of Managers of CSS from November 2014 through April 2017. Previously, Mr. Lowman served as a Senior Advisor to The Boston Consulting Group. Prior to that, he was the Chief Executive Officer of Chase Home Lending from 2006 to 2011. Before Chase Home Lending, he spent a decade in senior leadership roles in various lending businesses of Citigroup, including head of CitiMortgage and Citicorp Trust Bank, FSB. Before joining Citigroup, Mr. Lowman spent 11 years at The Prudential Home Mortgage Company, Inc. in progressively senior leadership roles. He started his career at KPMG where his clients included banks, thrifts, and mortgage bankers.
James G. Mackey
|
Age
|
Year of Affiliation
|
Position
|
|
51
|
2013
|
Executive Vice President - Chief Financial Officer
|
Mr. Mackey has served as our EVP - Chief Financial Officer since November 2013. He joined us from Ally Financial Inc., an auto finance and direct banking financial services company, where he served as Executive Vice President and Chief Financial Officer beginning in June 2011, after serving as Interim Chief Financial Officer from April 2010. Mr. Mackey joined Ally Financial in March 2009 as Group Vice President and Senior Finance Executive. Previously, he served as Chief Financial Officer for the Corporate Investments, Corporate Treasury, and Private Equity divisions at Bank of America Corporation, a financial services firm, from 2007 to 2009.
Jerry Weiss
|
Age
|
Year of Affiliation
|
Position
|
|
60
|
2003
|
Executive Vice President - Chief Administrative Officer
|
Mr. Weiss has served as our EVP - Chief Administrative Officer since August 2010. In this role, he manages the services and operations of Freddie Mac's External Relations, including Government and Industry Relations and Public Policy; Public Relations and Corporate Marketing; Internal Communications; Making Home Affordable - Compliance; Conservatorship and Regulatory Affairs; and Economic and Housing Research organizations. In addition, since November 2014 he has served as a member of the Board of Managers of CSS. He also served as our CCO from August 2010 until June 2011. Prior to August 2010, Mr. Weiss served as our SVP and CCO and in various other senior management capacities since joining us in October 2003. Prior to joining us, Mr. Weiss worked from 1990 at Merrill Lynch Investment Managers, including as First Vice President and Global Head of Compliance. From 1982 to 1990, Mr. Weiss was with a national law practice in Washington, D.C., where he specialized in securities regulation and corporate finance matters.
|
FREDDIE MAC
| 2018 Form 10-K
|
366
|
|
|
Executive Compensation
|
Compensation Discussion and Analysis
|
Executive Compensation
COMPENSATION DISCUSSION AND ANALYSIS
This section contains information regarding our compensation programs (all of which have been approved by FHFA) and the compensation of the following individuals who we determined to be our Named Executive Officers, or NEOs, for the year ended December 31, 2018.
|
Named Executive Officers
|
|
|
Donald H. Layton
|
Chief Executive Officer
|
|
David M. Brickman
|
President
|
|
Michael T. Hutchins
|
Executive Vice President - Investments and Capital Markets
|
|
David B. Lowman
|
Executive Vice President - Single-Family Business
|
|
James G. Mackey
|
Executive Vice President - Chief Financial Officer
|
For information on our primary business objectives and the progress we made during 2018 toward accomplishing those objectives, see
Introduction — About Freddie Mac
.
Overview of Executive Management Compensation Program
Compensation in 2018 for each NEO, other than Mr. Layton, whose compensation is discussed below, was governed by the Executive Management Compensation Program, or EMCP. The EMCP balances our need to retain and attract executive talent with promoting the conservatorship objectives included in FHFA's Conservatorship Scorecard, as well as goals separately established by management related to the commercial aspects of our business, which are included in our Corporate Scorecard. All compensation under the EMCP is delivered in cash because the Purchase Agreement does not permit us to provide equity-based compensation to our employees unless approved by Treasury.
|
FREDDIE MAC
| 2018 Form 10-K
|
367
|
|
|
Executive Compensation
|
Compensation Discussion and Analysis
|
Elements of Target TDC
Compensation under the EMCP in 2018 consisted of the following elements:
|
Base Salary
|
Deferred Salary
|
|||||||||
|
n
|
The amount earned in each quarter, including interest, is paid on the last pay date of the corresponding quarter in the following year.
|
|||||||||
|
Fixed Deferred Salary
|
At-Risk Deferred Salary
|
|||||||||
|
n
|
To encourage achievement of conservatorship, corporate, and individual performance goals
|
|||||||||
|
Conservatorship Scorecard
|
Corporate Scorecard/ Individual
|
|||||||||
|
n
|
$500,000 or less unless exception approved by FHFA
|
n
|
To encourage executive retention
|
n
|
Subject to reduction based on Conservatorship Scorecard performance
|
n
|
Subject to reduction based on performance against both the Corporate Scorecard and individual objectives
|
|||
|
n
|
Equal to total Deferred Salary less the At-Risk portion
|
|||||||||
|
n
|
Earned and paid bi-weekly
|
|||||||||
The objectives against which 2018 corporate performance was measured, together with the assessment of actual performance against those objectives, are described in
Determination of 2018 At-Risk Deferred Salary — At-Risk Deferred Salary Based on Conservatorship Scorecard Performance
and
Determination of 2018 At-Risk Deferred Salary — At-Risk Deferred Salary Based on Corporate Scorecard Goals and Individual Performance
. These performance measures were chosen because they reflected our 2018 priorities during conservatorship.
See
Other Executive Compensation Considerations — Effect of Termination of Employment
for information on the effect of a termination of employment, including the timing and payment of any unpaid portion of Deferred Salary and related interest.
Executive Compensation Best Practices
|
What We Do
|
What We Don't Do
|
|||
|
n
|
Clawback provisions with a significant portion of compensation subject to recapture and/or forfeiture
|
n
|
No agreements that guarantee a specific amount of compensation for a specified term of employment
|
|
|
n
|
Use of an independent compensation consultant by the Board's Compensation Committee
|
n
|
No golden parachute payments or other similar change in control provisions
|
|
|
n
|
Annual compensation risk review
|
n
|
No tax "gross-ups"
|
|
|
n
|
Single executive perquisite, reimbursement of tax, estate, and/or personal financial planning expenses (up to $4,500 annually, with an additional $2,500 in the first year of eligibility)
|
n
|
No hedging or pledging of company securities permitted
|
|
|
n
|
Evaluation of company performance against multiple measures, including non-financial measures
|
|||
CEO Compensation
Mr. Layton's compensation in 2018 consisted solely of an annual Base Salary of $600,000, a level established by FHFA pursuant to the Equity in Government Compensation Act of 2015. In 2018, he did not, and currently does not, participate in the EMCP and therefore has no compensation subject to either corporate or individual performance. Mr. Layton's compensation in 2019 is unchanged from 2018.
|
FREDDIE MAC
| 2018 Form 10-K
|
368
|
|
|
Executive Compensation
|
Compensation Discussion and Analysis
|
Mr. Layton is eligible to participate in all employee benefit plans offered to Freddie Mac's other senior executives under the terms of those plans.
Determination of 2018 Target TDC for Eligible NEOs
Role of Compensation Consultant
As part of the annual process to determine the Target TDC for each of the eligible NEOs, the Compensation Committee receives guidance from Meridian Compensation Partners, LLC, or Meridian, its independent compensation consultant. In addition to the annual process to determine Target TDC, Meridian provides guidance to the Compensation Committee throughout the year on other executive compensation matters.
Meridian has not provided the Compensation Committee with any non-executive compensation services, nor has the firm provided any consulting or other services to our management. During 2018, the Compensation Committee reviewed Meridian's independence based on the factors outlined in Exchange Act Rule 10C-1(b)(4) and determined that Meridian continues to be independent.
2018 Comparator Group Companies
The Compensation Committee annually evaluates each eligible NEO's Target TDC in relation to the compensation of executives in comparable positions at companies that are either in a similar line of business or are otherwise comparable for purposes of recruiting and retaining individuals with the necessary skills and capabilities. We refer to this group of companies as the Comparator Group.
When there is either no reasonable match or insufficient data from the Comparator Group for a position, or if Meridian believes that additional data sources would strengthen the analysis of competitive market compensation levels, the Compensation Committee may use alternative survey sources.
At FHFA's recommendation, Freddie Mac and Fannie Mae have aligned their Comparator Groups so that consistent compensation data is used by both companies for the same or similar senior officer positions.
The Comparator Group used in determining compensation for 2018 consisted of the following companies:
|
Allstate
|
|
Discover Financial Services
|
|
Prudential
|
|
|
Ally Financial
|
|
Fannie Mae
|
|
Regions Financial
|
|
|
AIG
|
|
Fifth Third Bancorp
|
|
State Street
|
|
|
American Express
|
The Hartford
|
SunTrust
|
|||
|
Bank of America*
|
|
JPMorgan Chase*
|
|
Synchrony Financial
|
|
|
Bank of New York Mellon
|
|
KeyCorp
|
|
U.S. Bancorp
|
|
|
BB&T
|
|
Mastercard
|
|
Visa
|
|
|
Capital One
|
MetLife
|
Voya Financial
|
|||
|
Citigroup*
|
|
Northern Trust
|
|
Wells Fargo*
|
|
|
Citizens Financial Group
|
PNC
|
||||
|
*
|
Only mortgage or real estate division-level compensation data from these diversified banking firms may be utilized where available and appropriate for the position being benchmarked.
|
||||
|
FREDDIE MAC
| 2018 Form 10-K
|
369
|
|
|
Executive Compensation
|
Compensation Discussion and Analysis
|
The Compensation Committee has determined that these same companies will comprise the 2019 Comparator Group.
Establishing Target TDC
The Compensation Committee developed its 2018 Target TDC recommendations for the eligible NEOs, other than Mr. Hutchins, by reviewing data from the Comparator Group. For Mr. Hutchins, the Compensation Committee reviewed data from a broader financial services survey reflecting companies with significant assets under management. The Compensation Committee's 2018 Target TDC recommendation for each of the eligible NEOs was reviewed and approved by FHFA.
2018 Target TDC
The following table sets forth the components of 2018 Target TDC for each of our eligible NEOs.
Table 76 - 2018 Target TDC
|
2018 Target TDC
|
||||||||||||
|
Named Executive Officer
(1)
|
Base
Salary
|
Fixed
Deferred Salary
|
At-Risk
Deferred Salary
|
Target TDC
|
||||||||
|
David M. Brickman
|
500,000
|
|
1,775,000
|
|
975,000
|
|
3,250,000
|
|
||||
|
Michael T. Hutchins
|
500,000
|
|
1,600,000
|
|
900,000
|
|
3,000,000
|
|
||||
|
David B. Lowman
|
500,000
|
|
1,775,000
|
|
975,000
|
|
3,250,000
|
|
||||
|
James G. Mackey
|
500,000
|
|
1,775,000
|
|
975,000
|
|
3,250,000
|
|
||||
|
(1)
|
Mr. Layton did not participate in the EMCP in 2018 and therefore is not included in this table. For a discussion of Mr. Layton's compensation, see
CEO Compensation
.
|
The 2018 Target TDC amount for Mr. Hutchins reflects a modest increase from the 2017 level effective in late February 2018 which took into account his individual performance and moved his compensation closer to the 50th percentile of the competitive market compensation level. The 2018 Target TDC for Mr. Brickman reflects an increase effective in early September 2018 in connection with his promotion to President and moved his compensation closer to the 50th percentile of the competitive market compensation level.
Determination of 2018 At-Risk Deferred Salary
The Compensation Committee and FHFA considered our achievements in pursuing our primary business objectives, as well as other factors, in determining the funding level for At-Risk Deferred Salary in 2018. FHFA determined the funding level for the portion of At-Risk Deferred Salary based on Conservatorship Scorecard performance, and the Compensation Committee determined, with FHFA's review and approval, the amounts payable to each eligible NEO for the portion of At-Risk Deferred Salary based on Corporate Scorecard goals and individual performance.
|
FREDDIE MAC
| 2018 Form 10-K
|
370
|
|
|
Executive Compensation
|
Compensation Discussion and Analysis
|
At-Risk Deferred Salary Based on Conservatorship Scorecard Performance
Half of each eligible NEO's 2018 At-Risk Deferred Salary, or 15% of Target TDC, was subject to reduction based on FHFA's assessment of the company's performance against the objectives in the 2018 Conservatorship Scorecard. FHFA independently assessed the company's performance and determined that a 100% funding level was justified for the portion of the eligible NEOs' At-Risk Deferred Salary based on the 2018 Conservatorship Scorecard. FHFA noted the following considerations in assessing our performance against the 2018 Conservatorship Scorecard:
|
n
|
Our dedication to finalizing the post-crisis loss mitigation, which resulted in the publication of guidance on foreclosure alternatives, servicing, forbearance, and standardized timeline calculations;
|
|
n
|
Our continuing efforts to reduce taxpayer risk by pursuing new and innovative approaches through single-family and multifamily credit risk transfer transactions;
|
n
Our continued effective collaboration and coordination with CSS and Fannie Mae in moving the Single Security initiative and the CSP forward; and
|
n
|
Our contribution to the progress that was made on the Language Access Project, resulting in the launch of the Mortgage Translations website ahead of schedule.
|
In making its assessment, FHFA also considered the following:
|
n
|
The extent to which the company conducts initiatives in a safe and sound manner consistent with FHFA's expectations for all activities;
|
|
n
|
The extent to which the outcomes of the company's activities support a competitive and resilient secondary mortgage market to support homeowners and renters;
|
|
n
|
The extent to which the company conducts initiatives with consideration for diversity and inclusion consistent with FHFA's expectations for all activities;
|
|
n
|
Cooperation and collaboration with FHFA, Fannie Mae, CSS, the industry, and other stakeholders; and
|
|
n
|
The quality, thoroughness, creativity, effectiveness, and timeliness of the company's work products.
|
The table below presents the Conservatorship Scorecard objectives and FHFA's assessment of our achievement against those objectives.
|
FREDDIE MAC
| 2018 Form 10-K
|
371
|
|
|
Executive Compensation
|
Compensation Discussion and Analysis
|
|
Performance Goals
|
FHFA's Summary of Performance
|
||||||
|
Maintain, in a safe and sound manner, credit availability and foreclosure prevention activities for new and refinanced mortgages to foster liquid, efficient, competitive, and resilient national housing finance markets
(40%)
|
|||||||
|
Continue efforts to increase access to single-family mortgage credit for creditworthy borrowers, including underserved segments of the market:
|
All goals were achieved with the introduction of the HomeOne mortgage, improvements to Home Possible; and launch of the Mortgage Translations website.
|
||||||
|
•
|
Continue to identify opportunities to improve access to credit in a safe and sound manner, taking into consideration the changing circumstances and needs facing prospective borrower segments.
|
||||||
|
•
|
Assess the availability of low-balance loan financing and develop recommendations as appropriate.
|
||||||
|
•
|
Continue to support access to credit for borrowers with limited English proficiency, including by finalizing multiyear language access plans and beginning plan implementation.
|
||||||
|
•
|
Informed by request for input feedback, conclude the assessment of updated credit score models and, as appropriate, plan for implementation.
|
||||||
|
•
|
Research, assess, and begin planning for appraisal process modernization, which could include revised appraisal forms and data requirements.
|
||||||
|
•
|
Research and assess opportunities to further partnerships with housing finance agencies.
|
||||||
|
Finalize post-crisis loss mitigation activities:
|
All goals were achieved with the issuance of guidance on foreclosure alternatives, standardized foreclosure timeline calculations and updates to the short-term hardship offerings.
|
||||||
|
•
|
Complete the post-crisis loss mitigation toolkit, including foreclosure alternatives and short-term hardships.
|
||||||
|
Continue to responsibly support the Neighborhood Stabilization Initiative.
|
Goal was achieved.
|
||||||
|
Assess the current mortgage servicing business model and develop plans to support ongoing liquidity in the mortgage servicing market:
|
All goals were achieved.
|
||||||
|
•
|
Informed by the 2017 Joint Servicing Market Survey, assess the challenges and potential solutions for improving the borrower experience, expanding liquidity, and increasing efficiency of the servicing market.
|
||||||
|
•
|
Work collaboratively with industry and other stakeholders.
|
||||||
|
Single-Family Rental Strategies:
|
Goal was achieved.
|
||||||
|
•
|
Continue to gather and report to FHFA information needed to inform policy decisions regarding single-family rentals, and assist FHFA in assessing single-family rental strategies.
|
||||||
|
Develop plans to further support liquidity in the multifamily workforce housing market and consider market cost differences:
|
Goal was achieved.
|
||||||
|
•
|
Explore opportunities to further support liquidity in multifamily workforce housing, including through pilots and initiatives.
|
||||||
|
Manage the dollar volume of new multifamily business to remain at or below $35 billion:
|
Goal was achieved.
|
||||||
|
•
|
Loans in affordable and underserved market segments, as defined by FHFA, are to be excluded from the $35 billion cap.
|
||||||
|
Reduce taxpayer risk through increasing the role of private capital in the mortgage market (30%)
|
|||||||
|
Single-Family Credit Risk Transfers:
|
All goals were achieved through the company's innovative approaches to transferring credit risk on single-family mortgages.
|
||||||
|
•
|
Transfer a meaningful portion of credit risk on at least 90 percent of the UPB of newly acquired single-family mortgages in loan categories targeted for credit risk transfer, subject to FHFA target adjustments as may be necessary to reflect market conditions and economic considerations.
|
||||||
|
•
|
For 2018, targeted single-family loan categories include: non-HARP, fixed-rate mortgages with terms greater than 20 years and LTV ratios above 60 percent.
|
||||||
|
•
|
Report to FHFA the actual amount of underlying mortgage credit risk transferred.
|
||||||
|
FREDDIE MAC
| 2018 Form 10-K
|
372
|
|
|
Executive Compensation
|
Compensation Discussion and Analysis
|
|
Performance Goals
|
FHFA's Summary of Performance
|
||||||
|
Multifamily Credit Risk Transfers:
|
All goals were achieved through the company’s innovative approaches to transferring credit risk on multifamily mortgages.
|
||||||
|
•
|
Transfer a meaningful portion of the credit risk on newly acquired mortgages, subject to FHFA target adjustments as may be necessary to reflect market conditions and economic considerations.
|
||||||
|
•
|
Report to FHFA the actual amount of underlying mortgage credit risk transferred.
|
||||||
|
Retained Portfolio:
|
Goal was achieved.
|
||||||
|
•
|
Execute FHFA-approved retained portfolio plans that meet, even under adverse conditions, the annual Purchase Agreement requirements and the $250 billion Purchase Agreement cap by December 31, 2018. Any sales should be commercially reasonable transactions that consider impacts to the market, borrowers, and neighborhood stability.
|
||||||
|
Private Mortgage Insurer Eligibility Requirements (PMIERs 2.0):
|
Goal was achieved with the publication of updated eligibility requirements for mortgage insurers.
|
||||||
|
•
|
Evaluate existing PMIERs and whether changes or updates are appropriate.
|
||||||
|
Build a new single-family infrastructure for use by the Enterprises and adaptable for use by other participants in the secondary market in the future (30%)
|
|||||||
|
Common Securitization Platform and Single Security Initiative:
|
All goals were achieved with focus on activities to support the implementation of the Single Security in the second quarter of 2019.
|
||||||
|
•
|
Continue working with FHFA, Fannie Mae and CSS to implement the Single Security Initiative on the CSP for both Enterprises.
|
||||||
|
•
|
Incorporate the following design principles in developing the CSP:
|
||||||
|
○
|
Focus on the functions necessary for current Enterprise single-family securitization activities.
|
||||||
|
○
|
Include the development of operational and system capabilities necessary for CSP to facilitate the issuance and administration of a common single security for the Enterprises.
|
||||||
|
○
|
Allow for the integration of additional market participants in the future.
|
||||||
|
•
|
Continue to work with Fannie Mae and CSS to obtain and use input from the Single Security Initiative/CSP Industry Advisory Group.
|
||||||
|
•
|
Work proactively with the industry to help market participants prepare for the implementation of the Single Security Initiative
|
||||||
|
Provide Active Support for Mortgage Data Standardization Initiatives:
|
All goals were achieved.
|
||||||
|
•
|
Continue the development and implementation of the Uniform Closing Dataset.
|
||||||
|
•
|
Continue implementation of the redesigned Uniform Residential Loan Application and the Uniform Loan Application Dataset/Automated Underwriting System specifications.
|
||||||
|
•
|
Assess and, as appropriate, begin implementation of strategies to redesign the Uniform Appraisal Dataset.
|
||||||
|
FREDDIE MAC
| 2018 Form 10-K
|
373
|
|
|
Executive Compensation
|
Compensation Discussion and Analysis
|
At-Risk Deferred Salary Based on Corporate Scorecard Goals and Individual Performance
The other half of each eligible NEO's At-Risk Deferred Salary, also equal to 15% of Target TDC, was subject to reduction based on the company's performance against the Corporate Scorecard goals and the NEO's individual performance. The five Corporate Scorecard goals drive how we manage and improve the commercial aspects of our business and are intended to complement the FHFA Strategic Plan and Conservatorship Scorecard. Certain of the individual performance objectives for the eligible NEOs were either Conservatorship Scorecard objectives or Corporate Scorecard goals, or directly supported their achievement.
No weightings were assigned to the Corporate Scorecard goals. As a result, it was necessary for the Compensation Committee to use its judgment in determining the overall level of performance. In making its determination, the Committee primarily considered the fact that the vast majority of the Corporate Scorecard goals were achieved or exceeded. The Compensation Committee determined that, based on the company's performance against the Corporate Scorecard, no reduction should be applied due to company performance for this portion of At-Risk Deferred Salary.
The Board has adopted Corporate Scorecard goals for 2019 that are similar to the 2018 goals.
The table below presents the Corporate Scorecard goals and the Compensation Committee's assessment of our achievement against those goals.
|
Corporate Scorecard Goal
|
Assessment of Performance
|
|
Customer
|
The company achieved all elements of this goal. Both the single-family and multifamily businesses made significant progress in customer satisfaction.
|
|
Compete for business by being a customer-centric organization
|
|
|
People and Culture
|
The company achieved or exceeded all elements of this goal. The company exceeded its goal for the retention of high-performing employees. It received strong scores on the company's people survey, including in the leadership diversity and overall employee engagement levels, highlighting that efforts to build the company's desired culture continue to yield positive results.
|
|
Hire and retain talented people in a winning culture
|
|
|
Operating Performance
|
The company achieved or exceeded most elements of this goal. We exceeded plan in multifamily new business volume, capital markets comprehensive income and the percentage of corporate spend that goes to diverse suppliers
.
The company failed to achieve elements related to multifamily comprehensive income, project performance and corporate general and administrative expenses.
|
|
Operate as well as the best-run financial institutions
|
|
|
Risk and Capital Management
|
The company achieved or exceeded all elements of this goal. The company's efforts to mitigate its risk through the transfer of credit risk on single-family and multifamily new business was above-plan. It also successfully improved results related to the timely closure of significant issues and the decline in capital for all assets. The company met its planned goals relating to financial risk appetite measures for each of the three business lines.
|
|
Manage risk and capital as well as the largest financial institutions
|
|
|
Community Mission
|
Based on preliminary information, the company believes it met all five of its single-family affordable housing goals and all three of its multifamily affordable housing goals for 2018. The company also expects to receive a high satisfactory or better score for Duty to Serve, which includes specific objectives for both single-family and multifamily. It also exceeded its goal for uncapped new multifamily volume, excluding Green Advantage offerings.
|
|
Responsibly increase access to housing finance
|
|
The Compensation Committee also assessed the individual performance of each eligible NEO. In making its assessments, the Committee took into consideration input from Mr. Layton as well as the company's Corporate Scorecard performance. In each case, the Compensation Committee's
|
FREDDIE MAC
| 2018 Form 10-K
|
374
|
|
|
Executive Compensation
|
Compensation Discussion and Analysis
|
determination was consistent with Mr. Layton's recommendation. FHFA reviewed and approved the compensation associated with these determinations.
Each NEO's individual performance is discussed below.
|
David M. Brickman,
President
|
|
|
Performance Highlights
|
|
|
n
|
Achieved strong business results and customer satisfaction ratings with continued focus on risk-adjusted returns, innovation, market presence, research and industry thought leadership.
|
|
n
|
Further expanded offerings that create and preserve affordable rental housing in communities across the nation including through a new mezzanine loan offering and a new platform for LIHTC.
|
|
n
|
Implemented enhanced risk management capabilities associated with continued focus on operational improvements.
|
|
n
|
Strong leadership in the ongoing development of management in the Multifamily division, including the continued build-out of the leadership team and effective transition of responsibilities to Ms. Jenkins as head of the multifamily business.
|
|
n
|
Successfully transitioning to the role of President, including gaining a deeper understanding of all aspects of the company and providing leadership in developing the company’s 2019 business plan, financial budget, and key priorities.
|
|
At-Risk Deferred Salary (Corporate Scorecard/Individual) Funding Decision
|
|
|
The Compensation Committee determined that Mr. Brickman should receive 100% of his At-Risk Deferred Salary that was subject to reduction based on the company's performance against the Corporate Scorecard and his individual performance.
|
|
|
Michael T. Hutchins,
Executive Vice President - Investments and Capital Markets
|
|
|
Performance Highlights
|
|
|
n
|
Completed the execution of the FHFA-approved 2013 - 2018 multi-year retained portfolio plan, which included reduction in the overall size of the retained portfolio and decrease of less liquid assets in an economically efficient manner.
|
|
n
|
Provided strong leadership to support the Single Security initiative, including plans and strategies to promote market readiness to trade the new UMBS.
|
|
n
|
Continued to support efforts to improve the liquidity of Freddie Mac's traded bonds in the secondary mortgage market.
|
|
n
|
Continued to support the guarantee businesses, including improving the market penetration of the single-family "cash window" as well as successful efforts to finance certain mortgage-backed securities and mortgage servicing rights.
|
|
n
|
Managed successful execution of risk management objectives, including conducting market responsive transactions in debt funding and interest-rate hedging, and efficiently meeting the company's liquidity and funding needs.
|
|
n
|
Demonstrated strong expense discipline while assembling a talented and motivated team and supporting investments to strengthen operational, technology and model risk management.
|
|
At-Risk Deferred Salary (Corporate Scorecard/Individual) Funding Decision
|
|
|
The Compensation Committee determined that Mr. Hutchins should receive 100% of his At-Risk Deferred Salary that was subject to reduction based on the company's performance against the Corporate Scorecard and his individual performance.
|
|
|
FREDDIE MAC
| 2018 Form 10-K
|
375
|
|
|
Executive Compensation
|
Compensation Discussion and Analysis
|
|
David B. Lowman,
Executive Vice President - Single-Family Business
|
|
|
Performance Highlights
|
|
|
n
|
Strong leadership of the Single-family business, with continued focus on increasing competitiveness, managing risks (with particular emphasis on credit risk), improving operations, and enhancing technology.
|
|
n
|
Continued focus on operational and technology improvements to transform the client experience through innovative and creative solutions.
|
|
n
|
Executed credit risk transfer transactions, including achieving a milestone by transferring a portion of credit risk on over $1 trillion of single-family mortgages.
|
|
n
|
Successfully reimagined our Home Possible suite of products to better serve low- to moderate-income families, including the introduction of the new HomeOne mortgage to serve the needs of more first-time homebuyers.
|
|
At-Risk Deferred Salary (Corporate Scorecard/Individual) Funding Decision
|
|
|
The Compensation Committee determined that Mr. Lowman should receive 100% of his At-Risk Deferred Salary that was subject to reduction based on the company's performance against the Corporate Scorecard and his individual performance.
|
|
|
James G. Mackey,
Executive Vice President - Chief Financial Officer
|
|
|
Performance Highlights
|
|
|
n
|
Formalized a new framework for Dodd-Frank Act stress tests and created new disclosures for the CCF.
|
|
n
|
Implemented enhanced analytical and reporting capabilities for internal management and improved external disclosures.
|
|
n
|
Improved control of corporate-wide general and administrative expenses.
|
|
n
|
Continued the focus on operational improvements, which included the implementation of shared organizational resources between the Finance and Enterprise Risk Management divisions, simplification of general and administrative expense and project reporting to reduce costs and increase efficiencies, and deployment of financial management technology to improve processes and the employee experience.
|
|
n
|
Successfully completed major campus infrastructure and office modernization projects.
|
|
n
|
Strong leadership in the ongoing development of management in the Finance division, including the continued build-out of the leadership team.
|
|
At-Risk Deferred Salary (Corporate Scorecard/Individual) Funding Decision
|
|
|
The Compensation Committee determined that Mr. Mackey should receive 100% of his At-Risk Deferred Salary that was subject to reduction based on the company's performance against the Corporate Scorecard and his individual performance.
|
|
|
FREDDIE MAC
| 2018 Form 10-K
|
376
|
|
|
Executive Compensation
|
Compensation Discussion and Analysis
|
2018 Deferred Salary
The following chart reports the actual amounts of 2018 Deferred Salary for each eligible NEO. The target amounts of deferred salary for Messrs. Hutchins and Brickman reflect prorated targets based on their compensation increases in 2018. The actual amount earned in each calendar quarter is scheduled to be paid on the last pay date of the corresponding calendar quarter in 2019.
Table 77 - 2018 Deferred Salary
|
|
2018 Actual Deferred Salary
(2)
|
||||||||||||||||
|
|
Fixed
|
At-Risk
|
Total Actual Deferred
Salary
|
% of Target
|
|||||||||||||
|
Named Executive Officer
(1)
|
Conservatorship Scorecard
|
% of Target
|
Corporate Scorecard/ Individual
|
% of Target
|
|||||||||||||
|
Mr. Brickman
|
1,507,478
|
|
430,174
|
|
100%
|
430,174
|
|
100%
|
2,367,826
|
|
100%
|
||||||
|
Mr. Hutchins
|
1,575,208
|
|
444,688
|
|
100%
|
444,688
|
|
100%
|
2,464,583
|
|
100%
|
||||||
|
Mr. Lowman
|
1,775,000
|
|
487,500
|
|
100%
|
487,500
|
|
100%
|
2,750,000
|
|
100%
|
||||||
|
Mr. Mackey
|
1,775,000
|
|
487,500
|
|
100%
|
487,500
|
|
100%
|
2,750,000
|
|
100%
|
||||||
|
(1)
|
Mr. Layton was not eligible for deferred salary in 2018 and therefore is not included in this table.
|
|
(2)
|
For Messrs. Hutchins and Brickman, the amounts of actual deferred salary differ from the amounts presented in
Table 76 - 2018 Target TDC
because the increase to Target TDC amounts became effective
in late February 2018 and early September 2018, respectively.
|
Written Agreements Relating to NEO Employment
We entered into letter agreements with each of our NEOs, other than Mr. Brickman, in connection with their hiring. The letter agreements set forth specific initial levels of Base Salary and, where applicable, Target TDC. The compensation of each NEO is subject to change by FHFA and the terms of the EMCP. See
Determination of 2018 Target TDC
for 2018 Target TDC amounts for the NEOs. The amounts reflected below were effective as of the date of the respective letter agreement.
We also entered into restrictive covenant and confidentiality agreements with each of our NEOs. The non-competition and non-solicitation provisions included in the restrictive covenant and confidentiality agreements are described in
Restrictive Covenant and Confidentiality Agreements
.
The NEOs are not currently entitled to severance benefits upon any type of termination event. For additional information on compensation and benefits payable in the event of a termination of employment, see
Potential Payments Upon Termination of Employment
.
Mr. Layton
We entered into a letter agreement and a restrictive covenant and confidentiality agreement with Mr. Layton in connection with his employment as our CEO. The terms of Mr. Layton's letter agreement provide him with an annual Base Salary of $600,000 and the opportunity to participate in all employee benefit plans offered to Freddie Mac's executive officers pursuant to the terms of these plans. Copies of Mr. Layton's letter agreement and restrictive covenant and confidentiality agreement were filed as Exhibits 10.1 and 10.2, respectively, to our Current Report on Form 8-K filed on May 10, 2012.
|
FREDDIE MAC
| 2018 Form 10-K
|
377
|
|
|
Executive Compensation
|
Compensation Discussion and Analysis
|
Mr. Brickman
We entered into a new restrictive covenant and confidentiality agreement with Mr. Brickman in connection with his promotion to President. A copy of Mr. Brickman's restrictive covenant and confidentiality agreement was filed as Exhibit 10.2 to our Current Report on Form 8-K filed on September 6, 2018.
Mr. Hutchins
We entered into a letter agreement and a restrictive covenant and confidentiality agreement with Mr. Hutchins in connection with his employment as our EVP - Investments and Capital Markets (SVP - Investments and Capital Markets at the time he began his service). The terms of Mr. Hutchins' letter agreement originally provided him with an annual Target TDC opportunity of $2,000,000, consisting of Base Salary of $500,000 and Deferred Salary of $1,500,000, and the opportunity to participate in all employee benefit plans offered to Freddie Mac's executive officers pursuant to the terms of these plans. The company has also agreed that Mr. Hutchins may, subject to Mr. Layton's approval, take additional days off from time to time as unpaid leave. Copies of Mr. Hutchins' letter agreement and restrictive covenant and confidentiality agreement were filed as Exhibits 10.32 and 10.33, respectively, to our Annual Report on Form 10-K filed on February 18, 2016.
Mr. Lowman
We entered into a letter agreement and a restrictive covenant and confidentiality agreement with Mr. Lowman in connection with his employment as our EVP - Single-Family Business. The terms of Mr. Lowman's letter agreement originally provided him with an annual Target TDC opportunity of $3,000,000, consisting of Base Salary of $500,000 and Deferred Salary of $2,500,000, and the opportunity to participate in all employee benefit plans offered to Freddie Mac's executive officers pursuant to the terms of these plans. Copies of Mr. Lowman's letter agreement and restrictive covenant and confidentiality agreement were filed as Exhibits 10.48 and 10.49, respectively, to our Annual Report on Form 10-K filed on February 27, 2014.
Mr. Mackey
We entered into a letter agreement and a restrictive covenant and confidentiality agreement with Mr. Mackey in connection with his employment as our CFO. The terms of Mr. Mackey's letter agreement originally provided him with an annual Target TDC opportunity of $3,000,000, consisting of Base Salary of $500,000 and Deferred Salary of $2,500,000, and the opportunity to participate in all employee benefit plans offered to Freddie Mac's executive officers pursuant to the terms of these plans. Copies of Mr. Mackey's letter agreement and restrictive covenant and confidentiality agreement were filed as Exhibits 10.1 and 10.2, respectively, to our Current Report on Form 8-K filed on September 30, 2013.
Restrictive Covenant and Confidentiality Agreements
Each of our NEOs is subject to a restrictive covenant and confidentiality agreement with us. Each agreement provides that the NEO will not seek employment with designated competitors that involves
|
FREDDIE MAC
| 2018 Form 10-K
|
378
|
|
|
Executive Compensation
|
Compensation Discussion and Analysis
|
performing similar duties for a specified period immediately following termination of employment, regardless of whether the executive's employment is terminated by the executive, by us, or by mutual agreement. The specified period is twenty-four months for Mr. Layton and twelve months for the other NEOs. During the twelve-month period immediately following termination, each NEO agrees not to solicit or recruit any of our managerial employees. The agreements also provide for the confidentiality of information that constitutes trade secrets or proprietary or other confidential information.
Recapture and Forfeiture Agreement
Freddie Mac has adopted, with the approval of FHFA, the Recapture and Forfeiture Agreement, or the Recapture Agreement. In order to participate in the EMCP, each of our NEOs has entered into a Recapture Agreement.
The Recapture Agreement provides for the recapture and/or forfeiture of Deferred Salary (including related interest) earned, paid, or to be paid pursuant to the terms of the EMCP if, after providing the required notice, our Board of Directors, in the good faith exercise of its sole discretion, determines that a Forfeiture Event has occurred. The Forfeiture Events and the Deferred Salary subject to recapture and/or forfeiture are described below. Mr. Layton's Recapture Agreement applies only to the Deferred Salary he earned from July 1, 2015 through November 24, 2015.
Materially Inaccurate Information
|
n
|
Forfeiture Event -
The NEO has earned or obtained the legally binding right to a payment of Deferred Salary based on materially inaccurate financial statements or any other materially inaccurate performance measure.
|
|
n
|
Compensation Subject to Recapture and/or Forfeiture -
Any Deferred Salary in excess of the amount that the Board determines would likely have been otherwise earned using accurate measures during the two years prior to the Forfeiture Event.
|
Termination for Felony Conviction or Willful Misconduct
|
n
|
Forfeiture Event -
The NEO's employment is terminated in any of the following circumstances:
|
|
l
|
Termination of employment because the NEO is convicted of, or pleads guilty or nolo contendere to, a felony;
|
|
l
|
Subsequent to termination of employment, the NEO is convicted of, or pleads guilty or nolo contendere to, a felony, based on conduct occurring prior to termination, and within one year of such conviction or plea, the Board determines that such conduct is materially harmful to Freddie Mac; or
|
|
l
|
Termination of employment because, or within two years of termination, the Board determines that, the NEO engaged in willful misconduct in the performance of his or her duties that was materially harmful to Freddie Mac.
|
|
n
|
Compensation Subject to Recapture and/or Forfeiture -
Any Deferred Salary earned during the two years prior to the date that the NEO is terminated, any Deferred Salary scheduled to be paid within two years after termination, and any cash payment made or to be made as consideration for any release of claims agreement.
|
|
FREDDIE MAC
| 2018 Form 10-K
|
379
|
|
|
Executive Compensation
|
Compensation Discussion and Analysis
|
Gross Neglect or Gross Misconduct
|
n
|
Forfeiture Event -
The NEO's employment is terminated because, in carrying out his or her duties, the NEO engages in conduct that constitutes gross neglect or gross misconduct that is materially harmful to Freddie Mac, or within two years after the NEO's termination of employment, the Board determines that the NEO, prior to his or her termination, engaged in such conduct.
|
|
n
|
Compensation Subject to Recapture and/or Forfeiture -
Any Deferred Salary paid at the time of termination or subsequent to the date of termination, including any cash payment made as consideration for any release of claims agreement.
|
Violation of a Post-Termination Non-Competition Covenant
|
n
|
Forfeiture Event -
The NEO violates a post-termination non-competition covenant set forth in the restrictive covenant and confidentiality agreement in effect when a payment of Deferred Salary is scheduled to be made.
|
|
n
|
Compensation Subject to Recapture and/or Forfeiture -
50% of the Deferred Salary paid during the twelve months immediately preceding the violation and 100% of any unpaid Deferred Salary.
|
Under the Recapture Agreement, the Board has discretion to determine the appropriate dollar amount, if any, to be recaptured from and/or forfeited by the NEO, which is intended to be the gross amount of compensation in excess of what Freddie Mac would have paid the NEO had Freddie Mac taken the Forfeiture Event into consideration at the time such compensation decision was made.
A copy of the form of the Recapture Agreement was filed as Exhibit 10.18 to our Annual Report on Form 10-K filed on February 16, 2017.
The following additional event is applicable only to the CEO and CFO, to the extent they have compensation subject to reimbursement in accordance with Section 304 of the Sarbanes-Oxley Act.
|
n
|
Accounting Restatement Resulting from Misconduct -
If, as a result of misconduct, we are required to prepare an accounting restatement due to material non-compliance with financial reporting requirements, the CEO and CFO are required to reimburse us for amounts determined in accordance with Section 304.
|
Indemnification Agreements
We have entered into indemnification agreements with each of our current executive officers (including each of our NEOs) and directors, each an indemnitee. For indemnification agreements entered into with executive officers in or after August 2011, the form of agreement has been revised to provide that indemnification rights under the agreement would terminate if and when the executive officer remained with Freddie Mac after ceasing to report directly to the CEO with respect to any claims arising from matters occurring after the officer no longer reported directly to the CEO. Similar indemnification rights would continue to be available to such executive officers under the Bylaws going forward. The indemnification agreements provide that we will indemnify the indemnitee to the fullest extent permitted by our Bylaws and Virginia law. This obligation includes, subject to certain terms and conditions, indemnification against all liabilities and expenses (including attorneys' fees) actually and reasonably incurred by the indemnitee in connection with any threatened or pending action, suit, or proceeding,
|
FREDDIE MAC
| 2018 Form 10-K
|
380
|
|
|
Executive Compensation
|
Compensation Discussion and Analysis
|
except such liabilities and expenses as are incurred because of the indemnitee's willful misconduct or knowing violation of criminal law. The indemnification agreements provide that if requested by the indemnitee, we will advance expenses, subject to repayment by the indemnitee of any funds advanced if it is ultimately determined that the indemnitee is not entitled to indemnification. The rights to indemnification under the indemnification agreements are not exclusive of any other right the indemnitee may have under any statute, agreement, or otherwise. Our obligations under the indemnification agreements will continue after the indemnitee is no longer a director or officer of the company with respect to any possible claims based on the fact that the indemnitee was a director or officer, and the indemnification agreements will remain in effect in the event the conservatorship is terminated. The indemnification agreements also provide that indemnification for actions instituted by FHFA will be governed by the standards set forth in FHFA's Notice of Proposed Rulemaking, published in the Federal Register on November 14, 2008.
Other Executive Compensation Considerations
Effect of Termination of Employment
The timing and payment of any unpaid portion of Deferred Salary and related interest is based upon the reason for termination, as discussed in
Potential Payments Upon Termination of Employment
.
Perquisites
We believe that perquisites should be a minimal part of the compensation package for our NEOs. Total annual perquisites for any NEO cannot exceed $25,000 without FHFA approval, and we do not provide a gross-up to cover any taxes due on the perquisite itself. The only perquisite provided to our NEOs during 2018 was reimbursement for assistance with personal financial planning, tax planning, and/or estate planning, up to an annual maximum benefit of $4,500, with an additional $2,500 allowance provided in the first year in which an NEO becomes eligible for the benefit.
SERP and SERP II
Our NEOs are eligible to participate in our SERP. The SERP is designed to provide participants with the full amount of benefits to which they would have been entitled under our Thrift/401(k) Plan if that plan was not subject to certain dollar limits under the Internal Revenue Code. This is referred to as the "SERP Benefit." As of 2012, for participants in the EMCP (or prior executive compensation programs), no SERP Benefit is accrued with respect to annual pay in excess of two times a participant's Base Salary.
On February 18, 2015, FHFA approved, effective January 1, 2014, a new nonqualified retirement plan, referred to as the SERP II. We previously offered a Pension Plan, which was a tax-qualified, defined benefit pension plan, covering substantially all employees hired before 2012 who had attained age 21 and completed one year of service with us. In October 2013, FHFA directed us to cease accruals under the Pension Plan effective December 31, 2013, and to commence terminating the Pension Plan. The Transitional Plan, a tax-qualified defined contribution plan established in January 2014, was available to employees who were participants in the company's Pension Plan as of the date it was terminated. For each eligible employee, the company contributed a percentage of each participant's compensation ranging from 0.5% to 6.5%, depending on a participant's age, referred to as the age-based contribution.
|
FREDDIE MAC
| 2018 Form 10-K
|
381
|
|
|
Executive Compensation
|
Compensation Discussion and Analysis
|
The age-based contribution was available for plan years 2014-2018. The SERP II is intended to provide participants with the full amount of the benefits to which they would have been entitled to under the Transitional Plan if that plan was not subject to certain dollar limits under the Internal Revenue Code. This is referred to as the "SERP II Benefit." Mr. Brickman was the only NEO who accrued a SERP II Benefit in 2018.
For additional information regarding the Transitional Plan, see our Annual Report on Form 10-K filed on February 19, 2015. For additional information regarding these benefits, see
2018 Compensation Information for NEOs
and
Nonqualified Deferred Compensation
.
Stock Ownership, Hedging, and Pledging Policies
Our stock ownership guidelines were suspended when conservatorship began because we ceased paying our executives stock-based compensation. The Purchase Agreement prohibits us from issuing any shares of our equity securities without the prior written consent of Treasury. The suspension of stock ownership requirements is expected to continue through conservatorship and until such time that we resume granting stock-based compensation.
Pursuant to our company policy, all employees, including our NEOs, are prohibited from:
|
n
|
Engaging in all transactions (including purchasing and selling equity and non-equity securities) involving our securities (except selling company securities owned prior to the implementation of the policy and then only with pre-clearance);
|
|
n
|
Purchasing or selling derivative securities related to our equity securities or dealing in any derivative securities related to our equity securities;
|
|
n
|
Transacting in options (other than options granted by us, and then only with pre-clearance) or other hedging instruments related to our securities; and
|
|
n
|
Holding our securities in a margin account or pledging our securities as collateral for a loan.
|
FHFA's Role in Setting Compensation
Although the Compensation Committee plays a significant role in considering and recommending executive compensation, FHFA is actively involved in determining such compensation in its role as our Conservator and as our regulator. The Compensation Committee's authority and flexibility is, therefore, subject to certain limitations, including:
Although the Compensation Committee plays a significant role in considering and recommending executive compensation, FHFA is actively involved in determining such compensation in its role as our Conservator and as our regulator. The Compensation Committee's authority and flexibility is, therefore, subject to certain limitations, including:
|
n
|
The powers of FHFA as our Conservator include the authority to set executive compensation. Under the terms of the Purchase Agreement, FHFA is required to consult with Treasury on any increases in compensation or new compensation arrangements for our executive officers.
|
|
n
|
Our directors serve on behalf of the Conservator and exercise their authority as provided by the Conservator. More information about the role of our directors is provided above in
Directors, Corporate Governance, and Executive Officers —
Board and Committee Information — Authority of the Board and Board Committees
.
|
|
n
|
FHFA requires us to submit to it proposed new compensation arrangements or increased amounts or benefits payable under existing compensation arrangements for executive officers.
|
|
FREDDIE MAC
| 2018 Form 10-K
|
382
|
|
|
Executive Compensation
|
Compensation Discussion and Analysis
|
|
n
|
FHFA retains the authority not only to approve both the terms and amount of any compensation prior to payment to any of our executive officers, but also to modify any existing compensation arrangements.
|
Section 162(m) Limits on the Tax Deductibility of Compensation Expenses
Section 162(m) of the Internal Revenue Code imposes a $1 million limit on the amount that we may annually deduct for compensation to anyone serving as CEO or CFO at any time during the year, certain other NEOs employed by us at any time during the year and any individual who was a CEO, CFO, or NEO after 2016 and who is receiving Freddie Mac compensation (unless pursuant to a binding contract in effect on November 2, 2017 that is eligible for grandfathering). For calendar years after 2017 (pursuant to the Tax Cuts and Jobs Act), this limit applies even if the compensation is "performance-based."
Section 162(m) of the Internal Revenue Code imposes a $1 million limit on the amount that we may annually deduct for compensation to anyone serving as CEO or CFO at any time during the year, certain other NEOs employed by us at any time during the year and any individual who was a CEO, CFO, or NEO after 2016 and who is receiving Freddie Mac compensation (unless pursuant to a binding contract in effect on November 2, 2017 that is eligible for grandfathering). For calendar years after 2017 (pursuant to the Tax Cuts and Jobs Act), this limit applies even if the compensation is "performance-based."
Compensation Committee Report
The Compensation Committee has reviewed and discussed the
Compensation Discussion and Analysis
with management and, based on such review and discussion, has recommended to the Board that the
Compensation Discussion and Analysis
be included in this Form 10-K.
This report is respectfully submitted by the members of the Compensation Committee.
|
Steven W. Kohlhagen, Chair
|
|
Carolyn H. Byrd
|
|
Aleem Gillani
|
|
Christopher E. Herbert
|
|
Saiyid T. Naqvi
|
|
FREDDIE MAC
| 2018 Form 10-K
|
383
|
|
|
Executive Compensation
|
Compensation and Risk
|
|
COMPENSATION AND RISK
Our management conducted an assessment of our compensation policies and practices that apply to employees at all levels, including those participating in the EMCP. The assessment was conducted by members of our ERM and human resources teams, and included an evaluation of:
|
n
|
The types of compensation offered (including fixed, variable, and deferred);
|
|
n
|
Eligibility for participation in compensation programs;
|
|
n
|
Compensation program design and governance;
|
|
n
|
The process for establishing performance objectives; and
|
|
n
|
Processes and program approvals for our compensation programs.
|
The assessment was discussed with the Compensation Committee in January 2019. Management's conclusion, with which the Compensation Committee concurred, is that the company's compensation programs and practices do not encourage unnecessary or excessive risk behaviors in pursuit of Corporate or Conservatorship Scorecard objectives or otherwise, and the programs and practices would not be reasonably likely to have a material adverse effect on Freddie Mac.
|
FREDDIE MAC
| 2018 Form 10-K
|
384
|
|
|
Executive Compensation
|
CEO Pay Ratio
|
|
CEO PAY RATIO
SEC rules require annual disclosure of the ratio of a company's CEO's total annual compensation to that of its median employee. For 2018, we identified our median employee as of November 25, 2018, using payroll data as reported on Form W-2, Box 5 and annualized the compensation for individuals that had not worked the full year. After identifying the median employee, we calculated that employee's total annual compensation for 2018 using the same method required for calculating the CEO's (and other NEOs') total annual compensation for purposes of
Table 79 - Summary Compensation Table
.
We changed our methodology for identifying the 2018 median employee from using Box 1 to using Box 5 on Form W-2. We believe that Box 5 represents a more comprehensive view of our employees' total compensation during the year because it includes elements of compensation that Box 1 does not capture, such as pre-tax contributions an employee makes to the Thrift/401(k) Plan. In addition, we determined it was appropriate to identify a new median employee due to the expansion of non-officer level employees who are eligible to participate in our annual incentive program.
The table below sets forth the total annual compensation for our CEO and median employee and the ratio between the two.
Table 78 - CEO Pay Ratio
|
CEO Pay Ratio
|
|||
|
Employee
|
Total Compensation
|
Ratio
|
|
|
Donald H. Layton (CEO)
|
651,000
|
4.65 to 1
|
|
|
Median Employee
|
139,941
|
||
Per the Equity in Government Compensation Act of 2015, the CEO's compensation is limited to a base salary of $600,000. See
CEO Compensation
for further discussion of Mr. Layton's compensation. Given the different methodologies that companies may use to determine their CEO pay ratio, the ratio reported above should not be used as a basis for comparison between companies.
|
FREDDIE MAC
| 2018 Form 10-K
|
385
|
|
|
Executive Compensation
|
2018 Compensation Information for NEOs
|
|
2018 COMPENSATION INFORMATION FOR NEOs
The following sections set forth compensation information for our NEOs: our CEO, CFO, and the three other most highly compensated executive officers who were serving as executive officers as of December 31, 2018.
Summary Compensation Table
Table 79 - Compensation Summary
|
|
|
Salary
|
Bonus
|
Non-Equity Incentive Plan Compensation
(3)
|
All Other Compensation
(4)
|
Total
|
||||||||||||||||||
|
Named Executive Officer
|
Year
|
Earned During Year
(1)
|
Deferred
(2)
|
|||||||||||||||||||||
|
Donald H. Layton
|
2018
|
|
$600,000
|
|
|
$—
|
|
|
$—
|
|
|
$—
|
|
|
$51,000
|
|
|
$651,000
|
|
|||||
|
Chief Executive Officer
|
2017
|
600,000
|
|
—
|
|
—
|
|
—
|
|
51,000
|
|
651,000
|
|
|||||||||||
|
2016
|
600,000
|
|
—
|
|
—
|
|
—
|
|
101,609
|
|
701,609
|
|
||||||||||||
|
David M. Brickman
(5)
|
2018
|
500,000
|
|
1,507,478
|
|
867,919
|
|
163,266
|
|
3,038,663
|
|
|||||||||||||
|
President
|
||||||||||||||||||||||||
|
Michael T. Hutchins
(5)(6)
|
2018
|
500,000
|
|
1,575,208
|
|
897,202
|
|
98,862
|
|
3,071,272
|
|
|||||||||||||
|
EVP — Investments & Capital Markets
|
2017
|
490,447
|
|
1,394,575
|
|
—
|
|
804,358
|
|
89,305
|
|
2,778,685
|
|
|||||||||||
|
2016
|
482,759
|
|
1,219,178
|
|
—
|
|
726,545
|
|
85,897
|
|
2,514,379
|
|
||||||||||||
|
David B. Lowman
|
2018
|
500,000
|
|
1,775,000
|
|
983,580
|
|
100,620
|
|
3,359,200
|
|
|||||||||||||
|
EVP — Single-family Business
|
2017
|
500,000
|
|
1,763,818
|
|
—
|
|
964,588
|
|
92,496
|
|
3,320,902
|
|
|||||||||||
|
2016
|
500,000
|
|
1,600,000
|
|
—
|
|
893,896
|
|
89,874
|
|
3,083,770
|
|
||||||||||||
|
James G. Mackey
|
2018
|
500,000
|
|
1,775,000
|
|
983,580
|
|
100,620
|
|
3,359,200
|
|
|||||||||||||
|
EVP — Chief Financial Officer
|
2017
|
500,000
|
|
1,763,818
|
|
—
|
|
964,588
|
|
92,496
|
|
3,320,902
|
|
|||||||||||
|
2016
|
500,000
|
|
1,600,000
|
|
—
|
|
893,896
|
|
89,874
|
|
3,083,770
|
|
||||||||||||
|
(1)
|
Amounts shown reflect Base Salary earned during the year.
|
|
(2)
|
Amounts shown reflect Fixed Deferred Salary earned during the year. The interest rate for Fixed Deferred Salary earned during 2018, 2017, and 2016 was 0.880%, 0.425%, and 0.325%, respectively, which is equal to 50% of the one-year Treasury Bill rate as of December 31 of the applicable prior year. Fixed Deferred Salary earned during each quarter is paid in cash on the last pay date of the corresponding quarter in the following year, along with accrued interest. The remaining portion of Deferred Salary is reported in "Non-Equity Incentive Plan Compensation" and is referred to as "At-Risk" because it is subject to reduction based on corporate and individual performance. Interest on Fixed Deferred Salary earned during 2018, 2017, and 2016 is included in All Other Compensation.
|
|
(3)
|
Amounts shown reflect At-Risk Deferred Salary earned during each year as well as interest on that At-Risk Deferred Salary. The interest rate for At-Risk Deferred Salary earned during 2018, 2017, and 2016 was the same as noted for the interest rate for the Fixed Deferred Salary. At-Risk Deferred Salary earned during each quarter is paid in cash on the last pay date of the corresponding quarter in the following year. See
Determination of 2018 At-Risk Deferred Salary
.
|
|
FREDDIE MAC
| 2018 Form 10-K
|
386
|
|
|
Executive Compensation
|
2018 Compensation Information for NEOs
|
|
|
(4)
|
Amounts for 2018 reflect (i) contributions made under our tax-qualified Thrift/401(k) Plan and Transitional Plan for plan year 2018; (ii) accruals earned pursuant to the SERP Benefit for plan year 2018; (iii) accruals earned pursuant to the SERP II Benefit for plan year 2018; (iv) interest on Fixed Deferred Salary earned during 2018; and (v) perquisites. The amounts for 2018 are as follows:
|
|
Named Executive Officer
|
Thrift/401(k) Plan
Contributions
|
SERP Benefit
Accruals
|
SERP II Benefit Accruals
|
Interest on Fixed Deferred Salary
|
Perquisites
|
|||||||||||||||
|
Mr. Layton
|
|
$23,375
|
|
|
$27,625
|
|
|
$—
|
|
|
$—
|
|
|
$—
|
|
|||||
|
Mr. Brickman
|
41,250
|
|
43,500
|
|
65,250
|
|
13,266
|
|
||||||||||||
|
Mr. Hutchins
|
23,375
|
|
61,625
|
|
—
|
|
13,862
|
|
—
|
|
||||||||||
|
Mr. Lowman
|
23,375
|
|
61,625
|
|
—
|
|
15,620
|
|
—
|
|
||||||||||
|
Mr. Mackey
|
23,375
|
|
61,625
|
|
—
|
|
15,620
|
|
—
|
|
||||||||||
Employer contributions to the Thrift/401(k) Plan are generally available on the same terms to all of our employees. After the first year of employment, we match up to 6% of eligible compensation at 100% of the employee's contributions. Also, after their first year of employment, employees receive an additional employer contribution to our Thrift/401(k) Plan equal to 2.5% of compensation earned in the prior year. Employee contributions, our matching contributions, and the 2.5% employer contribution are invested in accordance with the employee's investment elections and are immediately vested. Mr. Brickman was the only NEO eligible for the age-based contributions pursuant to the Transitional Plan. His plan year 2018 age-based contribution is reflected in his Thrift/401(k) Savings Plan Contribution amount. For additional information regarding the SERP Benefit and SERP II Benefit, see
Nonqualified Deferred Compensation
.
Perquisites are valued at their aggregate incremental cost to us. During the years reported, the aggregate value of perquisites received by all NEOs was less than $10,000. In accordance with SEC rules, amounts shown under "All Other Compensation" do not include perquisites for an NEO that, in the aggregate, amount to less than $10,000.
|
(5)
|
Pursuant to SEC reporting requirements, we are reporting amounts earned by Mr. Hutchins in 2016 even though he was not an NEO for that fiscal year because he was an NEO for fiscal years 2015 and 2017. Because Mr. Brickman has not previously been an NEO, prior year information is not required to be disclosed.
|
|
(6)
|
Amounts reported for Mr. Hutchins in the Salary-Earned During Year, Salary-Deferred and Non-Equity Incentive Plan Compensation columns are less than the corresponding annual target amounts for 2016 and 2017 because he took additional vacation as leave without pay during those years.
|
Grants of Plan-Based Awards
The following table contains information concerning grants of plan-based awards to each of the NEOs during 2018. The Purchase Agreement prohibits us from issuing equity securities without Treasury's consent. No stock awards were granted during 2018. For a description of the performance and other measures used to determine payouts, see
Elements of Target Total Direct Compensation
,
Determination of 2018 Target TDC for NEOs
,
Determination of 2018 At-Risk Deferred Salary
, and
2018 Deferred Salary
.
|
FREDDIE MAC
| 2018 Form 10-K
|
387
|
|
|
Executive Compensation
|
2018 Compensation Information for NEOs
|
|
Table 80 - Grants of Plan-Based Awards
|
|
|
Estimated Future Payouts Under
Non-Equity Incentive Plan Awards
(2)
|
|||||||
|
Named Executive Officer
(1)
|
At-Risk Deferred Salary Award
|
Threshold
|
Target/Maximum
|
||||||
|
Mr. Brickman
|
Conservatorship Scorecard
|
—
|
|
|
$430,174
|
|
|||
|
Corporate Scorecard/Individual
|
—
|
|
430,174
|
|
|||||
|
Total
|
—
|
|
860,348
|
|
|||||
|
Mr. Hutchins
|
Conservatorship Scorecard
|
—
|
|
444,688
|
|
||||
|
Corporate Scorecard/Individual
|
—
|
|
444,688
|
|
|||||
|
Total
|
—
|
|
889,375
|
|
|||||
|
Mr. Lowman
|
Conservatorship Scorecard
|
—
|
|
487,500
|
|
||||
|
Corporate Scorecard/Individual
|
—
|
|
487,500
|
|
|||||
|
Total
|
—
|
|
975,000
|
|
|||||
|
Mr. Mackey
|
Conservatorship Scorecard
|
—
|
|
487,500
|
|
||||
|
Corporate Scorecard/Individual
|
—
|
|
487,500
|
|
|||||
|
Total
|
—
|
|
975,000
|
|
|||||
|
(1)
|
Mr. Layton was not eligible to receive Deferred Salary in 2018 and therefore is not included in this table.
|
|
(2)
|
The amounts reported reflect At-Risk Deferred Salary granted in 2018 which is subject to reduction based on: (i) corporate performance against the Conservatorship Scorecard; and (ii) the company's performance against the Corporate Scorecard goals and an officer's individual performance. The amount of At-Risk Deferred Salary actually earned can range from 0% of target (reported in the Threshold column) to a maximum of 100% of target (reported in the Target/Maximum column). Actual At-Risk Deferred Salary amounts earned during 2018 are reported in the
Non-Equity Incentive Plan Compensation
column of
Table 79 - Summary Compensation Table
.
|
Outstanding Equity Awards at Fiscal Year-End
None of the NEOs had unexercised options or unvested RSUs as of December 31, 2018.
Option Exercises and Stock Vested
None of the NEOs exercised options or had RSUs vest during 2018.
Pension Benefits
Freddie Mac previously offered a Pension Plan, which was a tax-qualified, defined benefit pension plan, covering substantially all employees hired before 2012 who had attained age 21 and completed one year of service with us. In October 2013, FHFA directed us to cease accruals under the Pension Plan effective December 31, 2013, and to commence terminating the Pension Plan. A Pension Benefits table is not presented here as the Pension Plan termination was completed in 2015. For additional information, see
Other Executive Compensation Considerations
.
|
FREDDIE MAC
| 2018 Form 10-K
|
388
|
|
|
Executive Compensation
|
2018 Compensation Information for NEOs
|
|
Nonqualified Deferred Compensation
Non-qualified deferred compensation for the NEOs consists of the SERP Benefit and, for those NEOs eligible for the Transitional Plan (or those NEOs who may have deferred Roth contributions into their Thrift/401(k) Plan account), the SERP II Benefit. The SERP and SERP II are unfunded, non-qualified defined contribution plans designed to provide participants with the full amount of benefits to which they would have been entitled under the Thrift/401(k) Plan and Transitional Plan (for those NEOs eligible) if these plans were not subject to certain dollar limits under the Internal Revenue Code.
The SERP Benefit equals the amount of the employer matching and 2.5% contributions for each NEO that would have been made to the Thrift/401(k) Plan during the year, based upon the participant's eligible compensation, without application of those limits, less the amount of the matching contributions and 2.5% contributions made to the Thrift/401(k) Plan during the year, but does not take into account pay that exceeds two times the NEO's Base Salary. We believe the SERP Benefit is an appropriate benefit because offering such a benefit helps us remain competitive with the companies in our Comparator Group.
To be eligible for the SERP Benefit, the NEO must be eligible for matching contributions and the 2.5% contribution under the Thrift/401(k) Plan for part of the year, as discussed in Footnote 4 to
Table 79 - Summary Compensation Table
. In addition, to be eligible for the portion of the SERP Benefit attributable to employer matching contributions, the NEO must contribute the maximum amount permitted under the terms of the Thrift/401(k) Plan on either a pre- or post-tax basis.
The SERP II Benefit provides an accrual for each year an NEO participates in the Transitional Plan equal to the amount of the employer contribution that would have been made to the Transitional Plan for the year, without application of the Internal Revenue Code limits, less the amount of the contribution actually made to the Transitional Plan, but does not take into account pay that exceeds two times the NEO's Base Salary. The SERP II also provides participants with the flexibility to make Roth contributions to the Thrift/401(k) Plan and still receive employer matching contributions as noted above.
Participants are credited with earnings or losses in their SERP and SERP II Benefit accounts based upon each participant's individual direction of the investment of such notional amounts among the virtual investment funds available under the SERP and SERP II, which are the same as the investment options available under the Thrift/401(k) Plan. SERP and SERP II Benefits are generally distributed in a lump sum 90 days after the end of the calendar year in which a separation from service occurs. A six-month delay in the commencement of distributions on account of a separation from service applies to key employees, in accordance with Internal Revenue Code Section 409A. If the NEO dies, the vested SERP Benefit is paid in the form of a lump sum within 90 days of death, and the SERP II Benefit is paid by March 31st following the year the NEO dies.
The following table shows the contributions, earnings, withdrawals and distributions, and accumulated balances under the SERP and SERP II Benefits for each NEO.
|
FREDDIE MAC
| 2018 Form 10-K
|
389
|
|
|
Executive Compensation
|
2018 Compensation Information for NEOs
|
|
Table 81 - SERP and SERP II Benefits
|
Named Executive Officer
|
Executive
Contribution in
Last FY ($)
(1)
|
Freddie Mac
Accruals in
Last FY ($)
(2)
|
Aggregate
Earnings in
Last FY ($)
(3)
|
Aggregate
Withdrawals/
Distributions ($)
|
Balance at
Last FYE ($)
(4)
|
|||||||||||||||
|
Mr. Layton
|
||||||||||||||||||||
|
SERP Benefit
|
|
$—
|
|
|
$27,625
|
|
|
($12,528
|
)
|
|
$—
|
|
|
$265,820
|
|
|||||
|
Mr. Brickman
|
||||||||||||||||||||
|
SERP Benefit
|
—
|
|
43,500
|
|
(83,980
|
)
|
—
|
|
657,048
|
|
||||||||||
|
SERP II Benefit
|
65,250
|
|
(19,575
|
)
|
302,389
|
|
||||||||||||||
|
Mr. Hutchins
|
||||||||||||||||||||
|
SERP Benefit
|
—
|
|
61,625
|
|
5,115
|
|
—
|
|
290,020
|
|
||||||||||
|
Mr. Lowman
|
||||||||||||||||||||
|
SERP Benefit
|
—
|
|
61,625
|
|
(12,716
|
)
|
—
|
|
311,169
|
|
||||||||||
|
Mr. Mackey
|
||||||||||||||||||||
|
SERP Benefit
|
—
|
|
61,625
|
|
2,531
|
|
—
|
|
266,532
|
|
||||||||||
|
(1)
|
The SERP and SERP II do not allow for employee contributions.
|
|
(2)
|
Amounts reported reflect accruals under the SERP and SERP II Benefits during 2018, including the 2.5% contribution accruals and, for Mr. Brickman, the age-based contribution accrual which will be allocated to NEO accounts in 2019. These amounts are also reported in the "All Other Compensation" column in
Table 79 - Summary Compensation Table
.
|
|
(3)
|
Amounts reported represent the total interest and other earnings credited to each NEO under the SERP and SERP II Benefits.
|
|
(4)
|
Amounts reported reflect the accumulated balances under the SERP and SERP II Benefits for each NEO and include the plan year 2018 accruals noted in footnote 2 above. All NEOs are fully vested in their SERP and, for Mr. Brickman, his SERP II, Benefit account balances.
|
The following 2017 SERP Benefit accrual amounts were reported in the "All Other Compensation" column in the 2017 Summary Compensation Table as compensation for each NEO for whom accruals were made during 2017: Mr. Layton: $28,050, Mr. Mackey: $62,050, Mr. Hutchins: $60,428, and Mr. Lowman: $62,050. See our Annual Report on Form 10-K filed on February 15, 2018.
The following 2016 SERP Benefit accrual amounts were reported in the "All Other Compensation" column in the 2016 Summary Compensation Table as compensation for each NEO for whom accruals were made during 2016: Mr. Layton: $79,084, Mr. Mackey: $62,149 and Mr. Lowman: $62,149. See our Annual Report on Form 10-K filed on February 16, 2017. The 2016 SERP Benefit accrual amount for Mr. Hutchins, whose information was not reported in our Annual Report on Form 10-K filed on February 16, 2017 because he was not an NEO in 2016, was $59,218.
Potential Payments Upon Termination of Employment
The EMCP addresses the treatment of Base Salary and Deferred Salary upon various termination events. Base Salary ceases upon an NEO's termination of employment, regardless of the termination reason. An NEO generally does not need to be employed by us on the payment date to receive payments of Deferred Salary (including related interest) that are unpaid at the time of termination of employment. The following table describes the effect of various termination events upon unpaid Deferred Salary. The actual payment of any level of termination benefits that is not otherwise provided for in the EMCP is subject to FHFA review and approval.
|
n
|
Forfeiture Event —
All earned but unpaid Fixed and At-Risk Deferred Salary (including related interest) is subject to forfeiture upon the occurrence of a Forfeiture Event, as described above under
Written Agreements Relating to NEO Employment — Recapture and Forfeiture Agreement
.
|
|
n
|
Death —
All earned but unpaid Fixed and At-Risk Deferred Salary (including related interest) is paid in full as soon as administratively possible, but not later than 90 calendar days after the date of
|
|
FREDDIE MAC
| 2018 Form 10-K
|
390
|
|
|
Executive Compensation
|
2018 Compensation Information for NEOs
|
|
death. Any earned but unpaid At-Risk Deferred Salary is not subject to reduction based on corporate and individual performance if the reduction has not been determined as of the date of death.
|
n
|
Long-Term Disability —
All earned but unpaid Fixed and At-Risk Deferred Salary (including related interest) is paid in full in accordance with the Approved Payment Schedule. Any earned but unpaid At-Risk Deferred Salary is not subject to reduction based on corporate and individual performance if the reduction has not been determined as of the termination date.
|
|
n
|
Any Other Reason (including, but not limited to, voluntary termination, retirement, and involuntary termination for any reason other than a Forfeiture Event) —
All earned but unpaid Deferred Salary (including related interest) is paid in accordance with the Approved Payment Schedule, and earned but unpaid At-Risk Deferred Salary remains subject to the performance assessment and reduction process. Except in the case of retirement, the amount of earned but unpaid Fixed Deferred Salary will be reduced by 2% for each full or partial month by which the NEO's termination precedes January 31 of the second calendar year following the calendar year in which the Fixed Deferred Salary is earned. No such reduction is applicable if an NEO retires, which is deemed to have occurred upon a voluntary termination of employment after attaining or exceeding 62 years of age, without regard to length of service, or attaining or exceeding 55 years of age with 10 or more years of service.
|
The table below describes the compensation and benefits that would have been payable to each NEO had the officer terminated his employment under various circumstances as of December 31, 2018. Mr. Layton is excluded from this table because he is not entitled to receive any payments in connection with a termination of employment.
The table below does not address changes in control, as we are not obligated to provide any additional compensation to our NEOs in connection with a change in control. The table also does not address potential payments upon a termination for cause, which is a termination resulting from the occurrence of an event or conduct described in the Recapture Agreement. All earned but unpaid Deferred Salary is subject to forfeiture upon the occurrence of such a termination. However, the amount of compensation, if any, to be recaptured and/or forfeited is determined by the Board of Directors, which can only occur following the occurrence of a for cause termination. See
Written Agreements Relating to NEO Employment — Recapture and Forfeiture Agreement
.
The table below also does not include vested balances in the SERP and SERP II. All NEOs are fully vested in their account balances. Amounts shown in the table also do not include certain items available to all employees generally upon a termination event.
The table below also does not include stock options or RSUs, as there were no outstanding stock options or RSUs held by NEOs as of December 31, 2018.
|
FREDDIE MAC
| 2018 Form 10-K
|
391
|
|
|
Executive Compensation
|
2018 Compensation Information for NEOs
|
|
Table 82 - Compensation and Benefits if NEO Terminated Employment as of December 31, 2018
|
Named Executive Officer
(1)
|
Death
|
Disability
|
Retirement
(2)
|
All Other Not
For Cause
Terminations
(3)
|
||||||||||||
|
David M. Brickman
|
||||||||||||||||
|
Deferred Salary:
|
||||||||||||||||
|
Fixed
|
|
$1,507,478
|
|
|
$1,507,478
|
|
|
$1,115,534
|
|
|||||||
|
At Risk-Conservatorship Scorecard
(4)
|
430,174
|
|
430,174
|
|
430,174
|
|
||||||||||
|
At Risk-Corporate Scorecard/Individual
(5)
|
430,174
|
|
430,174
|
|
430,174
|
|
||||||||||
|
Interest on Deferred Salary
(6)
|
12,407
|
|
20,837
|
|
17,388
|
|
||||||||||
|
Total
|
|
$2,380,233
|
|
|
$2,388,663
|
|
|
$1,993,270
|
|
|||||||
|
Michael T. Hutchins
|
||||||||||||||||
|
Deferred Salary:
|
||||||||||||||||
|
Fixed
|
|
$1,575,208
|
|
|
$1,575,208
|
|
|
$1,575,208
|
|
|||||||
|
At Risk-Conservatorship Scorecard
(4)
|
444,688
|
|
444,688
|
|
444,688
|
|
||||||||||
|
At Risk-Corporate Scorecard/Individual
(5)
|
444,688
|
|
444,688
|
|
444,688
|
|
||||||||||
|
Interest on Deferred Salary
(6)
|
13,416
|
|
21,688
|
|
21,688
|
|
||||||||||
|
Total
|
|
$2,478,000
|
|
|
$2,486,272
|
|
|
$2,486,272
|
|
|
|
|||||
|
David B. Lowman
|
||||||||||||||||
|
Deferred Salary:
|
||||||||||||||||
|
Fixed
|
|
$1,775,000
|
|
|
$1,775,000
|
|
|
$1,313,500
|
|
|||||||
|
At Risk-Conservatorship Scorecard
(4)
|
487,500
|
|
487,500
|
|
487,500
|
|
||||||||||
|
At Risk-Corporate Scorecard/Individual
(5)
|
487,500
|
|
487,500
|
|
487,500
|
|
||||||||||
|
Interest on Deferred Salary
(6)
|
15,100
|
|
24,200
|
|
20,139
|
|
||||||||||
|
Total
|
|
$2,765,100
|
|
|
$2,774,200
|
|
|
|
|
$2,308,639
|
|
|||||
|
James G. Mackey
|
||||||||||||||||
|
Deferred Salary:
|
||||||||||||||||
|
Fixed
|
|
$1,775,000
|
|
|
$1,775,000
|
|
|
$1,313,500
|
|
|||||||
|
At Risk-Conservatorship Scorecard
(4)
|
487,500
|
|
487,500
|
|
487,500
|
|
||||||||||
|
At Risk-Corporate Scorecard/Individual
(5)
|
487,500
|
|
487,500
|
|
487,500
|
|
||||||||||
|
Interest on Deferred Salary
(6)
|
15,100
|
|
24,200
|
|
20,139
|
|
||||||||||
|
Total
|
|
$2,765,100
|
|
|
$2,774,200
|
|
|
$2,308,639
|
|
|||||||
|
(1)
|
Mr. Layton is excluded from this table because he is not entitled to receive any payments in connection with a termination of employment.
|
|
(2)
|
Mr. Hutchins is the only retirement-eligible NEO under the EMCP.
|
|
(3)
|
All Other Not For Cause Terminations refer to voluntary terminations other than for retirement and involuntary terminations other than for cause. No amount is shown for Mr. Hutchins because he is retirement eligible. In accordance with early termination provisions in the EMCP, the amounts disclosed for Deferred Salary: Fixed for all other NEOs have been reduced by 26% to reflect a December 31, 2018 termination event.
|
|
(4)
|
The amounts reported for Deferred Salary: At Risk-Conservatorship Scorecard reflect the funding level determined by FHFA with respect to performance against the 2018 Conservatorship Scorecard. In cases of death or disability, the process for determining funding level is waived if the funding level has not been determined at the date of termination.
|
|
(5)
|
The amounts reported for Deferred Salary: At Risk-Corporate Scorecard/Individual in the Retirement and All Other Not For Cause Terminations columns reflect the assessment of 2018 performance approved by the Compensation Committee and FHFA. For death or disability, the provisions are the same as for the amounts reported for Deferred Salary: At Risk-Conservatorship Scorecard.
|
|
(6)
|
Interest on Deferred Salary is accrued and paid in accordance with the terms of the EMCP. The amount of interest in the Death column assumes that payment occurs on the 90th day following the date of death, which is assumed to be December 31, 2018.
|
|
FREDDIE MAC
| 2018 Form 10-K
|
392
|
|
|
Security Ownership of Certain Beneficial Owners and Management and Related Stockholder Matters
|
|
Security Ownership of Certain Beneficial Owners and Management and Related Stockholder Matters
SECURITY OWNERSHIP
Our only class of voting stock is our common stock. Upon its appointment as Conservator, FHFA immediately succeeded to the voting rights of holders of our common stock. The following table shows the beneficial ownership of our common stock as of February 13, 2019 by our current directors, our NEOs, all of our directors and executive officers as a group, and holders of more than 5% of our common stock. Beneficial ownership is determined in accordance with SEC rules for computing the number of shares of common stock beneficially owned by a person and the percentage ownership of that person. As of February 13, 2019, each director and NEO, and all of our directors and executive officers as a group, owned less than 1% of our outstanding common stock. We ceased paying our executives and directors stock-based compensation when we entered conservatorship. In addition, the Purchase Agreement prohibits us from issuing any of our equity securities, including as compensation to our directors and executive officers, without the prior written consent of Treasury, and no equity securities, other than the senior preferred stock issued to Treasury, have been issued since we entered conservatorship. In addition, company policy prohibits directors and executive officers from engaging in transactions involving our equity securities, except selling company securities owned prior to the implementation of the policy. See
Executive Compensation - Other Executive Compensation Considerations - Stock Ownership, Hedging and Pledging Policies
for additional information.
Unless otherwise noted, the information presented below is based on information provided to us by the individuals or entities specified in the table.
|
FREDDIE MAC
| 2018 Form 10-K
|
393
|
|
|
Security Ownership of Certain Beneficial Owners and Management and Related Stockholder Matters
|
|
Stock Ownership By Directors and Executive Officers
Table 83 - Stock Ownership
|
Directors and Named Executive Officers
|
Position
|
Common Stock
Beneficially Owned
Excluding
Stock Options
(1)
|
Stock Options
Exercisable
Within 60 Days of
Feb. 13, 2019
|
Total Common Stock Beneficially Owned
|
|||||||
|
Carolyn H. Byrd
|
Director
|
—
|
|
—
|
|
—
|
|
||||
|
Lance F. Drummond
|
Director
|
—
|
|
—
|
|
—
|
|
||||
|
Aleem Gillani
|
Director
|
—
|
|
—
|
|
—
|
|
||||
|
Christopher E. Herbert
|
Director
|
—
|
—
|
|
—
|
|
—
|
|
|||
|
Grace A. Huebscher
|
Director
|
—
|
|
—
|
|
—
|
|
—
|
|
||
|
Steven W. Kohlhagen
|
Director
|
—
|
|
—
|
|
—
|
|
||||
|
Christopher S. Lynch
|
Director
|
—
|
|
—
|
|
—
|
|
||||
|
Sara Mathew
|
Director
|
—
|
|
—
|
|
—
|
|
||||
|
Saiyid T. Naqvi
|
Director
|
—
|
|
—
|
|
—
|
|
||||
|
Eugene B. Shanks, Jr.
|
Director
|
—
|
|
—
|
|
—
|
|
||||
|
Anthony A. Williams
|
Director
|
—
|
|
—
|
|
—
|
|
||||
|
Donald H. Layton
|
Chief Executive Officer
|
—
|
|
—
|
|
—
|
|
||||
|
David M. Brickman
|
President
|
3,395
|
|
—
|
|
3,395
(2)
|
|
||||
|
Michael T. Hutchins
|
EVP - Investments and Capital Markets
|
—
|
|
—
|
|
—
|
|
||||
|
David B. Lowman
|
EVP - Single-family Business
|
—
|
|
—
|
|
—
|
|
||||
|
James G. Mackey
|
EVP - Chief Financial Officer
|
—
|
|
—
|
|
—
|
|
||||
|
All directors and executive officers as a group
(21 persons)
|
3,934
|
|
—
|
|
3,934
(2)
|
|
|||||
|
(1)
|
Includes shares of stock beneficially owned as of February 13, 2019.
|
|
(2)
|
Represents shares of stock beneficially owned prior to the company's entry into conservatorship.
|
Stock Ownership by Greater-Than 5% Holders
Table 84 - 5% Holders
|
5% Holders
(1)
|
Common Stock Beneficially Owned
|
Percent of Class
|
|
U.S. Department of the Treasury
1500 Pennsylvania Avenue, NW
Washington, D.C. 20220
|
Variable
(2)
|
79.9%
|
|
(1)
|
Pershing Square Capital Management, L.P., PS Management GP, LLC, and William A. Ackman ("Pershing") have filed certain reports on Schedule 13D, the latest of which was filed on March 31, 2014. In that report, Pershing reported a beneficial ownership percentage calculation of 9.78%, based solely on the 650,039,533 shares of our common stock outstanding as reported in our Annual Report on Form 10-K filed on February 27, 2014, and excluding the shares issuable to Treasury pursuant to the warrant. The Schedule 13D indicated that Pershing also had additional economic exposure to approximately 8,434,958 notional shares of common stock, bringing the total aggregate economic exposure on the date of that filing to 72,010,523 shares of common stock (approximately 11.08% of the outstanding common stock). In that filing, Pershing indicated that because it believes our common stock is not a voting security, it had determined not to file future reports on Schedule 13D. We do not know Pershing's current beneficial ownership of our common stock.
|
|
(2)
|
In September 2008, we issued to Treasury a warrant to purchase, for one one-thousandth of a cent ($0.00001) per share, shares of our common stock equal to 79.9% of the total number of shares of our common stock outstanding on a fully diluted basis at the time the warrant is exercised. The warrant may be exercised in whole or in part at any time until September 7, 2028. As of the date of this filing, Treasury has not exercised the warrant. The information above assumes Treasury beneficially owns no other shares of our common stock.
|
|
FREDDIE MAC
| 2018 Form 10-K
|
394
|
|
|
Security Ownership of Certain Beneficial Owners and Management and Related Stockholder Matters
|
|
Section 16(a) Beneficial Ownership Reporting Compliance
Section 16(a) of the Exchange Act requires the directors and executive officers of a reporting company and persons who own more than 10% of a registered class of such company's equity securities to file reports of ownership and changes in ownership with the SEC. Based solely on a review of such reports, we believe that during 2018 all of our directors and executive officers complied with such reporting obligations.
SECURITIES AUTHORIZED FOR ISSUANCE UNDER EQUITY COMPENSATION PLANS
We have no shares of common stock available for issuance upon the exercise of options, warrants, and rights under our existing equity compensation plans at December 31, 2018. Prior to conservatorship, stockholders approved the Employee Stock Purchase Plan, the 2004 Stock Compensation Plan, and the 1995 Stock Compensation Plan (together, the Employee Plans), and the 1995 Directors' Stock Compensation Plan (the Directors' Plan). The authorizations to issue shares of common stock under the Employee Plans and Directors' Plan have expired pursuant to their respective terms. Therefore, we are not providing an Equity Compensation Table.
|
FREDDIE MAC
| 2018 Form 10-K
|
395
|
|
|
Certain Relationships and Related Transactions
|
|
Certain Relationships And Related Transactions
POLICY GOVERNING RELATED PERSON TRANSACTIONS
The Board has adopted a written policy governing the approval of related person transactions. This policy sets forth procedures for the review and approval or ratification of transactions involving related persons. Under the policy, "related person" means any person who is, or was at any time since the beginning of our last completed fiscal year, a director, a director nominee, an executive officer, or an immediate family member of any of the foregoing persons.
Under authority delegated by the Board, the Nominating and Governance Committee, or its Chair or other designated member under certain circumstances, each an Authorized Approver, is responsible for applying the Related Person Transactions Policy. Transactions covered by the Related Person Transactions Policy consist of any transaction, arrangement, or relationship or series of similar transactions, arrangements, or relationships, in which:
|
n
|
The aggregate amount involved exceeded or is expected to exceed $120,000;
|
|
n
|
We were or are expected to be a participant; and
|
|
n
|
Any related person had or will have a direct or indirect material interest.
|
The Related Person Transactions Policy includes a list of categories of transactions identified by the Board as having no significant potential for an actual conflict of interest or the appearance of a conflict or improper benefit to a related person, and thus such transactions are not considered potential related person transactions subject to review.
Our Legal Division (or our Compliance Department in certain limited circumstances) assesses whether any proposed transaction involving a related person is covered by the Related Person Transactions Policy. If so, the transaction is reviewed by the appropriate Authorized Approver.
If possible, approval of a related person transaction is obtained prior to the effectiveness or consummation of the transaction. If advance approval of a related person transaction by the Authorized Approver is not feasible or is otherwise not obtained, then the transaction is considered promptly by the Authorized Approver to determine whether ratification is warranted.
In determining whether to approve or ratify a related person transaction covered by the Related Person Transactions Policy, the Authorized Approver reviews and considers all relevant information, which may include:
|
n
|
The nature of the related person's interest in the transaction;
|
|
n
|
The approximate total dollar value of, and extent of the related person's interest in, the transaction;
|
|
n
|
Whether the transaction was or would be undertaken in the ordinary course of our business;
|
|
n
|
Whether the transaction is proposed to be, or was, entered into on terms no less favorable to us than terms that could have been reached with an unrelated third party; and
|
|
FREDDIE MAC
| 2018 Form 10-K
|
396
|
|
|
Certain Relationships and Related Transactions
|
|
|
n
|
The purpose, and potential benefits to us, of the transaction.
|
TRANSACTIONS WITH 5% SHAREHOLDERS
In connection with our entry into conservatorship, we issued a warrant to Treasury to purchase shares of our common stock equal to 79.9% of the total number of shares of our common stock outstanding, on a fully diluted basis. There have been a number of transactions between us and Treasury since the beginning of 2018, as discussed in
MD&A — Consolidated Results of Operations
,
MD&A — Liquidity and Capital Resources
,
MD&A — Conservatorship and Related Matters
,
MD&A — Regulation and Supervision
,
Note 2
,
Note 8
, and
Note 11
.
We are the compliance agent for Treasury for certain foreclosure avoidance activities under HAMP. Among other duties, as the program compliance agent, we conduct examinations and review servicer compliance with the published requirements for the program.
FHFA, as conservator, approved the Purchase Agreement and our role as compliance agent in the MHA Program and the Memorandum of Understanding with Treasury, FHFA, and Fannie Mae under the HFA Initiative. FHFA also instructed us to implement a $5,000 principal reduction incentive under HAMP in which Treasury will pay the incentive for borrowers with certain of our HAMP modified loans. The remaining transactions described in the sections referenced above did not require review and approval under any of our policies and procedures relating to transactions with related persons.
TRANSACTIONS WITH INSTITUTIONS RELATED TO DIRECTORS
In the ordinary course of business, we were a party during 2018, and expect to continue to be a party during 2019, to certain business transactions with institutions affiliated with members of our Board. Management believes that the terms and conditions of the transactions were no more and no less favorable to us than the terms of similar transactions with unaffiliated institutions to which we are, or expect to be, a party. None of these transactions were required to be disclosed under SEC rules.
TRANSACTIONS WITH INSTITUTIONS RELATED TO EXECUTIVE OFFICERS
Mr. Layton joined us in May 2012 as CEO and as a member of the Board. Mr. Layton previously served as a senior executive officer of JPMorgan Chase, ending his service in 2004. Mr. Layton receives a pension from JPMorgan Chase and has a deferred compensation balance under JPMorgan Chase's Deferred Compensation Plan which earns a return based upon a defined list of mutual funds that Mr. Layton designates. Mr. Layton's deferred compensation balance is less than 10% of his total net worth on an after-tax basis. The payment amounts of Mr. Layton's pension and deferred compensation do not depend on JPMorgan Chase's performance.
Freddie Mac has an extensive business relationship with JPMorgan Chase (through its subsidiaries) as it is one of our largest seller/servicers and a significant counterparty in capital markets, derivatives and multifamily transactions. The Board has reviewed Mr. Layton's and the company's relationship with JPMorgan Chase and determined that Mr. Layton does not have a material interest in our relationship with JPMorgan Chase. Nevertheless, to eliminate any potential conflicts of interest, Mr. Layton has
|
FREDDIE MAC
| 2018 Form 10-K
|
397
|
|
|
Certain Relationships and Related Transactions
|
|
agreed to recuse himself from acting upon matters directly relating to JPMorgan Chase that may be considered by the Board, or presented to him in his capacity as CEO and a member of the Board, if such matter has the potential to affect JPMorgan Chase's ability to satisfy its obligations to him.
CONSERVATORSHIP AGREEMENTS
Treasury, FHFA, and the Federal Reserve have taken a number of actions to support us during conservatorship, including entering into the Purchase Agreement, described in this Form 10-K. See
MD&A — Conservatorship and Related Matters
and
Note 2
.
|
FREDDIE MAC
| 2018 Form 10-K
|
398
|
|
|
Principal Accounting Fees and Services
|
|
Principal Accounting Fees and Services
DESCRIPTION OF FEES
PricewaterhouseCoopers LLP has served as our independent public accountants since 2002. The following is a description of fees billed to us by PricewaterhouseCoopers LLP during 2018 and 2017.
Auditor Fees
(1)
Table 85 - Auditor Fees
|
(In thousands)
|
2018
|
2017
|
|||||
|
Audit Fees
(2)
|
|
$21,420
|
|
|
$22,582
|
|
|
|
Audit-Related Fees
(3)
|
8,325
|
|
5,580
|
|
|||
|
Tax Fees
(4)
|
105
|
|
59
|
|
|||
|
All Other Fees
(5)
|
278
|
|
243
|
|
|||
|
Total
|
|
$30,128
|
|
|
$28,464
|
|
|
|
(1)
|
These fees represent amounts billed (including reimbursable expenses within the designated year).
|
|
(2)
|
Audit fees include fees in connection with quarterly reviews of our interim financial information and the audit of our annual consolidated financial statements.
|
|
(3)
|
Audit-related fees include: (i) fees for the performance of certain agreed-upon procedures regarding aspects of compliance with the Purchase Agreement covenants; (ii) compliance evaluation of the minimum servicing standards as set forth in the Uniform Single Attestation Program for Mortgage Bankers; (iii) fees for pre-implementation assistance for lease accounting and current expected credit losses accounting; (iv) fees related to accounting policy consultations; and (v) fees for the performance of certain agreed-upon procedures related to our risk transfer and structured transactions, pursuant to engagement letters with the company, including where the fees are billed to and paid by unconsolidated trusts created in connection with such transactions.
|
|
(4)
|
The tax fees billed relate to non-audit tax consulting services to provide advice and recommendations related to tax planning or reporting matters.
|
|
(5)
|
All other fees include: (i) our subscription to a web-based suite of human resources benchmark data; (ii) advice and recommendations related to retention strategies; (iii) our subscription to accounting research software; and (iv) non-audit advice and recommendations related to the procurement process and technology implementation in the governance process.
|
APPROVAL OF INDEPENDENT AUDITOR SERVICES AND FEES
Under its charter, the Audit Committee is responsible for the following:
|
n
|
Appointing our independent public accounting firm (subject to FHFA approval as required);
|
|
n
|
Approving all audit and non-audit services permitted under applicable law to be performed by the independent public accounting firm (subject to FHFA approval as required); and
|
|
n
|
Approving the scope of the annual audit.
|
The Sarbanes-Oxley Act of 2002 and related SEC rules require that all services provided to companies subject to the reporting requirements of the Exchange Act by their independent auditors be pre-approved by their audit committee or by authorized members of the committee, with certain exceptions. The Audit Committee's charter requires that the Audit Committee pre-approve any audit services, and
|
FREDDIE MAC
| 2018 Form 10-K
|
399
|
|
|
Principal Accounting Fees and Services
|
|
any non-audit services permitted under applicable law, to be performed by our independent auditors (or to designate one or more members of the Audit Committee to pre-approve such services and report such pre-approval to the Audit Committee).
Audit services that are within the scope of an auditor's engagement approved by the Audit Committee prior to the performance of those services are deemed pre-approved and do not require separate pre-approval. Audit services not within the scope of an Audit Committee-approved engagement, as well as permissible non-audit services, must be separately pre-approved by the Audit Committee.
When the Audit Committee pre-approves a service, it typically sets a dollar limit for such service. Management endeavors to obtain pre-approval of the Audit Committee, or of the Chair of the Audit Committee (when the Chair of the Audit Committee has been delegated such authority), before it incurs fees exceeding the dollar limit. If the Chair of the Audit Committee approves the increase, the Chair will report such approval at the Audit Committee's next scheduled meeting. The Audit Committee has delegated to the Chair the authority to address requests to pre-approve certain additional audit and non-audit services to be performed by the company's independent auditor with fees totaling up to a maximum of $250,000 per quarter, with reporting of any such approval decisions to the Audit Committee at its next scheduled meeting.
The pre-approval procedure is administered by our senior financial management, which reports throughout the year to the Audit Committee. The Audit Committee pre-approved all audit, audit-related, tax, and other services performed by our independent public accounting firm in 2018 and 2017.
The Audit Committee appoints the independent public accounting firm on an annual basis. In evaluating the performance of the independent public accounting firm, the Audit Committee considers a number of factors, including the following:
|
n
|
The firm's status as a registered public accounting firm with the Public Company Accounting Oversight Board (United States), or PCAOB, as required by the Sarbanes-Oxley Act of 2002 and the Rules of the PCAOB;
|
|
n
|
Its independence and processes for maintaining its independence;
|
|
n
|
Its approach to resolving significant accounting and auditing matters;
|
|
n
|
Its capability and expertise in handling the complexity of the company's business, including the capability and expertise of the lead audit partner and of the key members of the engagement team;
|
|
n
|
Historical and recent performance, including the extent and quality of the independent public accounting firm's communications with the Audit Committee, and the results of a management survey of the independent public accounting firm's overall performance;
|
|
n
|
Data related to audit quality and performance, including recent PCAOB inspection reports on the firm; and
|
|
n
|
The appropriateness of its fees, both on an absolute basis and as compared with peers.
|
The Audit Committee has determined that the non-audit services rendered by PricewaterhouseCoopers during its most recent fiscal year are compatible with maintaining PricewaterhouseCoopers' independence.
|
FREDDIE MAC
| 2018 Form 10-K
|
400
|
|
|
Exhibits and Financial Statement Schedules
|
|
Exhibits and Financial Statement Schedules
(a) Documents filed as part of this report:
(1) Consolidated Financial Statements
The consolidated financial statements required to be filed in this Form 10-K are included in
Financial Statements and Supplementary Data
.
(2) Financial Statement Schedules
None.
(3) Exhibits
An
Exhibit Index
has been filed as part of this Form 10-K beginning on page 415.
|
FREDDIE MAC
| 2018 Form 10-K
|
401
|
|
|
Glossary
|
|
Glossary
This Glossary includes acronyms and defined terms that are used throughout this report.
|
n
|
ACIS
- Agency Credit Insurance Structure - Transactions in which we purchase insurance policies that provide credit protection for certain specified credit events that occur and are typically allocated to the non-issued notional credit risk positions of a STACR transaction. We also enter into other ACIS transactions that provide credit protection for certain specified credit events on loans not included in a reference pool created for a STACR transaction, or provide front-end credit risk transfer as loans come into the portfolio. Under each of these insurance policies, we pay monthly premiums that are determined based on the outstanding balance of the reference pool. When specific credit events occur, we generally receive compensation from the insurance policy up to an aggregate limit based on actual losses.
|
|
n
|
Administration
- Executive branch of the U.S. government.
|
|
n
|
Agency securities
- Generally refers to mortgage-related securities issued or guaranteed by the GSEs or government agencies.
|
|
n
|
Alt-A loan
- Although there is no universally accepted definition of Alt-A, many mortgage market participants have classified single-family loans as Alt-A if these loans have credit characteristics that range between their prime and subprime categories, if these loans are underwritten with lower or alternative income or asset documentation requirements compared to a full documentation loan, or both. We categorize loans in our single-family credit guarantee portfolio as Alt-A if the lender that delivers them to us classified the loans as Alt-A, or if the loans had reduced documentation requirements as well as a combination of certain credit characteristics and expected performance characteristics at acquisition which, when compared to full documentation loans in our portfolio, indicate that the loan should be classified as Alt-A. In the event we purchase a refinance loan and the original loan had been previously identified as Alt-A, such refinance loan may no longer be categorized as an Alt-A loan because the refinance loan is not identified by the servicer as an Alt-A loan. We categorize our investments in non-agency mortgage-related securities as Alt-A if the securities were identified as such based on information provided to us when we entered into these transactions.
|
n
AMT
- Alternative Minimum Tax.
n
AOCI
- Accumulated other comprehensive income (loss), net of taxes.
|
n
|
ARM
- Adjustable-rate mortgage - A mortgage loan with an interest rate that adjusts periodically over the life of the loan based on changes in a benchmark index.
|
|
n
|
Board
- Board of Directors.
|
|
n
|
Bps
- Basis points - One one-hundredth of 1%. This term is commonly used to quote the yields of debt instruments or movements in interest rates.
|
|
n
|
B tranches
- The most junior tranches in a typical STACR debt note, STACR Trust transaction structure or ACIS transaction. B tranches provide credit support to the tranches that have higher seniority. Any losses on mortgage loans in the reference pool due to certain credit events are allocated in reverse sequential order, beginning with the most subordinate B tranche outstanding, until the balances of all of the B tranches reach zero. Freddie Mac may retain all or a portion of the B tranches.
|
|
FREDDIE MAC
| 2018 Form 10-K
|
402
|
|
|
Glossary
|
|
|
n
|
CCF
- Conservatorship Capital Framework - An economic capital system with detailed formulae provided by FHFA that is used to evaluate and manage our financial risk and to make economic business decisions while in conservatorship.
|
|
n
|
CCO
- Chief Compliance Officer.
|
|
n
|
CD&A
- Compensation Discussion and Analysis.
|
|
n
|
CEO
- Chief Executive Officer.
|
|
n
|
CERO
- Chief Enterprise Risk Officer.
|
|
n
|
CFO
- Chief Financial Officer.
|
|
n
|
CFPB
- Consumer Financial Protection Bureau.
|
|
n
|
Charge-offs, gross
- Represent the amount of a loan that has been discharged in order to remove the loan from our consolidated balance sheets when the loan is deemed uncollectible, regardless of when the impact of the credit loss was recorded on our consolidated statements of comprehensive income. Generally the amount of a charge-off is the recorded investment in excess of the fair value of the loan's collateral.
|
|
n
|
Charter
- The Federal Home Loan Mortgage Corporation Act, as amended, 12 U.S.C. § 1451 et seq.
|
|
n
|
CMBS
- Commercial mortgage-backed security - A security backed by loans on commercial property (often including multifamily rental properties) as opposed to one-to-four family residential real estate. Although the loan pools underlying CMBS can include loans financing multifamily properties and commercial properties, such as office buildings and hotels, the classes of CMBS that we hold receive distributions of scheduled cash flows only from multifamily properties.
|
|
n
|
Comprehensive income (loss)
- Consists of net income (loss) plus other comprehensive income (loss).
|
|
n
|
Conforming loan/Conforming loan limit
- A conventional single-family loan with an original principal balance that is equal to or less than the applicable statutory conforming loan limit, which is a dollar amount cap on the original principal balance of single-family loans we are permitted by law to purchase or securitize. The conforming loan limit is determined annually based on changes in FHFA's housing price index.
|
|
n
|
Conservator
- The Federal Housing Finance Agency, acting in its capacity as Conservator of Freddie Mac.
|
|
n
|
Conservatorship Capital
- The capital needed under the CCF for analysis of transactions and business.
|
|
n
|
Convexity
- A measure of how much a financial instrument's duration changes as interest rates change.
|
|
n
|
Core single-family loan portfolio
- Consists of loans in our single-family credit guarantee portfolio that were originated after 2008. We do not include relief refinance loans, including HARP loans, in this loan portfolio as underwriting procedures for relief refinance loans are limited, and, in many cases, do not include all of the changes in underwriting standards we have implemented since 2008.
|
|
n
|
Credit enhancement
- A financial arrangement that is designed to reduce credit risk by partially or fully compensating an investor in a mortgage or security (e.g., Freddie Mac) in the event of specified losses. Examples of credit enhancements include insurance, credit risk transfer transactions, overcollateralization, indemnification agreements, and government guarantees.
|
|
n
|
Credit losses
- Consists of charge-offs and REO operations (income) expense, which are both net
|
|
FREDDIE MAC
| 2018 Form 10-K
|
403
|
|
|
Glossary
|
|
of recoveries.
|
n
|
Credit-related (benefit) expenses
(or credit-related expenses) - Consists of our provision (benefit) for credit losses and REO operations (income) expense.
|
|
n
|
Credit score
- Credit score data is based on FICO scores, a credit scoring system developed by Fair, Isaac and Co. FICO scores are currently the most commonly used credit scores. FICO scores are ranked on a scale of approximately 300 to 850 points with a higher value indicating a lower likelihood of credit default. Although we obtain updated credit information on certain borrowers after the origination of a loan, such as those borrowers seeking a modification, the scores presented in our reports represent the credit score of the borrower at either the time of loan origination or our purchase and may not be indicative of the current credit worthiness of the borrower.
|
|
n
|
CSS
- Common Securitization Solutions, LLC
SM
.
|
|
n
|
CSP
- Common Securitization Platform.
|
|
n
|
Current LTV Ratio or CLTV
- The current LTV ratios are management estimates, which are updated on a monthly basis. Current market values are estimated by adjusting the value of the property at origination based on changes in the market value of homes in the same geographic area since that time. Changes in market value are derived from our internal index, which measures price changes for repeat sales and refinancing activity on the same properties using Freddie Mac and Fannie Mae single-family loan acquisitions. Estimates of the current LTV ratio exclude any secondary financing by third parties.
|
|
n
|
DTI
- Debt-to-income.
|
|
n
|
Deed in lieu of foreclosure
- An alternative to foreclosure in which the borrower voluntarily conveys title to the property to the lender and the lender accepts such title (sometimes together with an additional payment by the borrower) in full satisfaction of the mortgage indebtedness.
|
|
n
|
Delinquency
- A failure to make timely payments of principal and/or interest on a loan. For single-family loans, we generally report delinquency rate information based on the number of loans that are seriously delinquent. For multifamily loans, we report delinquency rate information based on the UPB of loans that are two monthly payments or more past due or in the process of foreclosure. Loans that have been modified are not counted as delinquent as long as the borrower is not delinquent under the modified terms. Unless stated otherwise, multifamily delinquency rates presented in this Form 10-K refer to gross delinquency rates before consideration of risk transfers.
|
|
n
|
Delivery fee
- An upfront fee charged to sellers above base contractual guarantee fees to compensate us for higher levels of risk in some loan products.
|
|
n
|
Derivative
- A financial instrument whose value depends upon the characteristics and value of an underlying such as a financial asset or index. Examples of an underlying include a security or commodity price, interest or currency rates, and other financial indices.
|
|
n
|
Dodd-Frank Act
- Dodd-Frank Wall Street Reform and Consumer Protection Act.
|
|
n
|
Dollar roll transactions
- Transactions whereby we enter into an agreement to sell and subsequently repurchase (or purchase and subsequently resell) agency securities.
|
|
n
|
DSCR
- Debt Service Coverage Ratio - An indicator of future credit performance for multifamily loans. The DSCR estimates a multifamily borrower's ability to service its mortgage obligation using the secured property's cash flow, after deducting non-mortgage expenses from income. The higher the DSCR, the more likely a multifamily borrower will be able to continue servicing its loan obligation.
|
|
n
|
Duration
- Duration is a measure of a financial instrument's price sensitivity to changes in interest
|
|
FREDDIE MAC
| 2018 Form 10-K
|
404
|
|
|
Glossary
|
|
rates.
|
n
|
Duration gap
- One of our primary interest-rate risk measures. Duration gap is a measure of the difference between the estimated durations of our interest rate sensitive assets and liabilities. We present the duration gap of our financial instruments in units expressed as months. A duration gap of zero implies that the change in value of our interest rate sensitive assets from an instantaneous change in interest rates would be expected to be accompanied by an equal and offsetting change in the value of our interest rate sensitive liabilities, thus leaving economic value unchanged.
|
|
n
|
EMCP
- Executive Management Compensation Program.
|
|
n
|
Enhanced Relief Refinance
- Provides liquidity for borrowers who are current on their mortgages but unable to refinance because their LTV ratios exceed standard refinance limits. This program became available in January 2019 for loans originated on or after October 1, 2017.
|
|
n
|
ER Policy
- Enterprise Risk Policy - The ER Policy sets forth the core components of the enterprise risk framework that defines how we identify, assess, manage, control, and report on risks.
|
|
n
|
ERC
- Enterprise Risk Committee.
|
|
n
|
ERM
- Enterprise Risk Management.
|
|
n
|
EVP
- Executive Vice President.
|
|
n
|
Exchange Act
- Securities Exchange Act of 1934, as amended.
|
|
n
|
Fannie Mae
- Federal National Mortgage Association.
|
|
n
|
FASB
- Financial Accounting Standards Board.
|
|
n
|
Federal Reserve
- Board of Governors of the Federal Reserve System.
|
|
n
|
FHA
- Federal Housing Administration.
|
|
n
|
FHFA
- Federal Housing Finance Agency - An independent agency of the U.S. government with responsibility for regulating Freddie Mac, Fannie Mae, and the FHLBs.
|
|
n
|
FHLB
- Federal Home Loan Bank.
|
|
n
|
Fixed-rate loan
- Refers to a loan originated at a specific rate of interest that remains constant over the life of the loan. For purposes of presentation in this report, we have categorized a number of modified loans as fixed-rate loans, even though the modified loans have rate adjustment provisions. In these cases, while the terms of the modified loans provide for the interest rate to adjust in the future, such future rates are determined at the time of the modification rather than at a subsequent date.
|
|
n
|
Foreclosure alternative
- A workout option pursued when a home retention action is not successful or not possible. A foreclosure alternative is either a short sale or deed in lieu of foreclosure.
|
|
n
|
Foreclosure or foreclosure sale
- Refers to our completion of a transaction provided for by the foreclosure laws of the applicable state, in which a delinquent borrower's ownership interest in a mortgaged property is terminated and title to the property is transferred to us or to a third party. When we, as loan holder, acquire a property in this manner, we pay for it by extinguishing some or all of the mortgage debt.
|
|
n
|
Freddie Mac mortgage-related securities
- Securities we issue and guarantee that are backed by mortgages.
|
|
n
|
GAAP
- Generally accepted accounting principles in the United States of America.
|
|
n
|
Giant PCs
- Resecuritizations of previously issued PCs or Giant PCs. Giant PCs are single-class securities that involve the straight pass through of all cash flows of the underlying collateral to
|
|
FREDDIE MAC
| 2018 Form 10-K
|
405
|
|
|
Glossary
|
|
holders of the beneficial interests.
|
n
|
Ginnie Mae
- Government National Mortgage Association, which guarantees the timely payment of principal and interest on mortgage-related securities backed by federally insured or guaranteed loans, primarily those insured by FHA or guaranteed by the VA.
|
|
n
|
Green Advantage loan
- A multifamily loan that we offer under our Green Advantage initiative, whereby borrowers finance the installation of green technologies that reduce energy and water consumption.
|
|
n
|
GSD/FICC
- Government Securities Division of Fixed Income Clearing Corporation.
|
|
n
|
GSE Act
- The Federal Housing Enterprises Financial Safety and Soundness Act of 1992, as amended by the Reform Act.
|
|
n
|
GSEs
- Government sponsored enterprises - Refers to certain legal entities created by the U.S. government, including Freddie Mac, Fannie Mae, and the FHLBs.
|
|
n
|
Guarantee fee
- The fee that we receive for guaranteeing the payment of principal and interest to mortgage security investors, which consists primarily of a combination of a monthly guarantee fee paid as a percentage of the UPB of the underlying loans, and initial upfront payments, such as delivery fees.
|
|
n
|
Guidelines
- Corporate Governance Guidelines, as revised.
|
|
n
|
HAMP
- Home Affordable Modification Program - Refers to the effort under the MHA Program whereby the U.S. government, Freddie Mac, and Fannie Mae committed funds to help eligible homeowners avoid foreclosure and keep their homes through loan modifications. HAMP ended in December 2016.
|
|
n
|
HARP
- Home Affordable Refinance Program - Refers to the effort under the MHA Program that sought to help eligible borrowers with existing loans that are guaranteed by us or Fannie Mae to refinance into loans with more affordable monthly payments and/or fixed-rate terms without obtaining new mortgage insurance in excess of the insurance coverage, if any, that was already in place. HARP was targeted at borrowers with current LTV ratios above 80%. The HARP program ended in December 2018 and has been replaced by Freddie Mac's Enhanced Relief Refinance program.
|
|
n
|
HFA
- State or local Housing Finance Agency.
|
|
n
|
HUD
- U.S. Department of Housing and Urban Development - HUD has authority over Freddie Mac with respect to fair lending.
|
|
n
|
Integrated Mortgage Insurance (IMAGIN)
- A new insurance based offering that provides loan-level protection for loans with 80% and higher LTV ratios. IMAGIN is designed to expand and diversify sources of private capital supporting low down payment lending, while enabling better management of taxpayer exposure to our mortgage and counterparty risks. Each loan is first provided Charter-compliant primary mortgage insurance and is then reinsured by a panel of reinsurers that are reviewed and approved by Freddie Mac. IMAGIN is offered to a broad range of Freddie Mac sellers, who can choose IMAGIN or traditional primary mortgage insurance at their discretion.
|
|
n
|
Implied volatility
- A measurement of how the value of a financial instrument changes due to changes in the market's expectation of potential changes in future interest rates. A decrease in implied volatility generally increases the estimated fair value of our mortgage-related assets and decreases the estimated fair value of our callable debt and option-based derivatives, while an
|
|
FREDDIE MAC
| 2018 Form 10-K
|
406
|
|
|
Glossary
|
|
increase in implied volatility generally has the opposite effect.
|
n
|
Initial margin
- The collateral that we post with a derivatives clearinghouse in order to do business with such clearinghouse. The amount of initial margin varies over time.
|
|
n
|
Interest-only loan
- A loan that allows the borrower to pay only interest (either fixed-rate or adjustable-rate) for a fixed period of time before payments of principal begin. After the interest-only period, the borrower may choose to refinance the loan, pay off the principal balance in total, or pay the scheduled principal and interest payment due on the loan.
|
|
n
|
IRS
- Internal Revenue Service.
|
|
n
|
K Certificates
- Structured pass-through certificates backed primarily by recently originated multifamily loans purchased by Freddie Mac.
|
|
n
|
KI Certificates
- Structured pass-through certificates, similar to K Certificates, except these certificates are backed by loans that are contributed by third-party whole loan funds.
|
|
n
|
KT Certificates
- Structured pass-through certificates backed by a revolving pool of multifamily loans awaiting securitization into a K Certificate.
|
|
n
|
Legacy and relief refinance single-family loan portfolio
- Consists of loans in our single-family credit guarantee portfolio that were originated in 2008 and prior, as well as relief refinance loans, including HARP loans that were originated after 2008.
|
|
n
|
Letter Agreement
- An agreement the Conservator, acting on our behalf, entered into with Treasury on December 21, 2017 to amend the Amended and Restated Certificate of Creation, Designation, Powers, Preferences, Rights, Privileges, Qualifications, Limitations, Restrictions, Terms, and Conditions of Variable Liquidation Preference Senior Preferred Stock (Par Value $1.00 Per Share) dated September 27, 2012.
|
|
n
|
LIBOR
- London Interbank Offered Rate.
|
|
n
|
LIHTC partnerships
- Low-income housing tax credit partnerships - These LIHTC partnerships invest directly in limited partnerships that own and operate affordable multifamily rental properties that generate federal income tax credits and deductible operating losses.
|
|
n
|
Liquidation preference
- Generally refers to an amount that holders of preferred securities are entitled to receive out of available assets upon liquidation of a company. The initial liquidation preference of our senior preferred stock was $1.0 billion. The aggregate liquidation preference of our senior preferred stock includes the initial liquidation preference plus amounts funded by Treasury under the Purchase Agreement, as well as $3.0 billion added pursuant to the Letter Agreement. In addition, dividends not paid in cash are added to the liquidation preference of the senior preferred stock. We may make payments to reduce the liquidation preference of the senior preferred stock only in limited circumstances.
|
|
n
|
Liquidity and Contingency Operating Portfolio
- Subset of our other investments portfolio. Consists of cash and cash equivalents, certain securities purchased under agreements to resell, and certain non-mortgage-related securities.
|
|
n
|
Loan liquidations -
Loans removed from the pools underlying Freddie Mac mortgage-related securities and other mortgage-related guarantees due to prepayment, maturity, repurchase or charge-off, foreclosure alternatives, third-party sales, and loans going into REO. Loans are also terminated through sales of seriously delinquent loans and non-consolidated senior subordinate securitization structure transactions collateralized by reporforming loans. In addition, periodic paydown of loan principal is also included in loan liquidations.
|
|
FREDDIE MAC
| 2018 Form 10-K
|
407
|
|
|
Glossary
|
|
|
n
|
Long-term debt
- Other debt due after one year based on the original contractual maturity of the debt instrument. Our long-term debt issuances include medium-term notes, Reference Notes securities, STACR debt notes, and SCR notes.
|
|
n
|
LTV ratio
- Loan-to-value ratio - The ratio of the unpaid principal amount of a loan to the value of the property that serves as collateral for the loan, expressed as a percentage. We report LTV ratios based solely on the amount of the loan purchased or guaranteed by us, generally excluding any second-lien loans (unless we own or guarantee the second lien).
|
|
n
|
Market spread
- The difference between the yields of two debt securities, or the difference between the yield of a debt security and a benchmark yield, such as LIBOR. We measure market spreads primarily using our models.
|
|
n
|
MBS
- Mortgage-backed security
.
|
|
n
|
MBSD/FICC
- Mortgage Backed Securities Division of the Fixed Income Clearing Corporation.
|
|
n
|
M Certificates
- Structured pass-through certificates backed by pools of tax-exempt or taxable multifamily housing revenue bonds.
|
|
n
|
MD&A
- Management's Discussion and Analysis of Financial Condition and Results of Operations.
|
|
n
|
MHA Program
- Making Home Affordable Program - The MHA Program was designed to help in the housing recovery, promote liquidity and housing affordability, expand foreclosure prevention efforts, and set market standards. The MHA Program included HARP and HAMP.
|
|
n
|
ML Certificates
- Structured pass-through certificates backed by tax-exempt or taxable loans.
|
|
n
|
Mortgage assets
- Refers to both loans and the mortgage-related securities we hold in our mortgage-related investments portfolio.
|
|
n
|
Mortgage-related investments portfolio
- Our mortgage investment portfolio, which consists of mortgage-related securities and unsecuritized single-family and multifamily loans. The size of our mortgage-related investments portfolio under the Purchase Agreement is determined without giving effect to the January 1, 2010 change in accounting guidance related to transfers of financial assets and consolidation of VIEs.
|
|
n
|
Mortgage-to-debt OAS
- The net OAS between the mortgage asset and agency debt sectors. This is an important factor in determining the expected level of net interest yield on a new mortgage asset. Higher mortgage-to-debt OAS means that a newly purchased mortgage asset is expected to provide a greater return relative to the cost of the debt issued to fund the purchase of the asset and, therefore, a higher net interest yield. Mortgage-to-debt OAS tends to be higher when there is weak demand for mortgage assets and lower when there is strong demand for mortgage assets.
|
|
n
|
Multifamily loan
- A loan secured by a property with five or more residential rental units or by a manufactured housing community.
|
|
n
|
Multifamily mortgage portfolio
- Consists of multifamily mortgage loans held by us on our consolidated balance sheets as well as our guarantee of securitization products, primarily K Certificates, SB Certificates, and other mortgage-related guarantees that are held by third parties. It excludes loans underlying our guarantees of HFA bonds.
|
|
n
|
Multifamily new business activity
- Represents loan purchases, issuances of other mortgage-related guarantees, and issuances of other securitization products for which we have not previously purchased the underlying loans.
|
|
n
|
Net worth (deficit)
- The amount by which our total assets exceed (or are less than) our total liabilities as reflected on our consolidated balance sheets prepared in conformity with GAAP.
|
|
FREDDIE MAC
| 2018 Form 10-K
|
408
|
|
|
Glossary
|
|
|
n
|
Net worth sweep dividend
,
Net Worth Amount, and Capital Reserve Amount
- For each quarter from January 1, 2013 and thereafter, the dividend payment on the senior preferred stock will be the amount, if any, by which our Net Worth Amount at the end of the immediately preceding fiscal quarter, less the applicable Capital Reserve Amount, exceeds zero. The term Net Worth Amount is defined as the total assets of Freddie Mac (excluding Treasury's commitment and any unfunded amounts thereof), less our total liabilities (excluding any obligation in respect of capital stock), in each case as reflected on our consolidated balance sheets prepared in conformity with GAAP. If the calculation of the dividend payment for a quarter does not exceed zero, then no dividend shall accrue or be payable for that quarter. The applicable Capital Reserve Amount was $1.2 billion for 2016 and $600 million for 2017, and has been $3.0 billion since 2018 (if we were not to pay our dividend requirement on the senior preferred stock in full in any future period, the applicable Capital Reserve Amount would thereafter be zero).
|
|
n
|
Non-accrual loan
- A loan for which we are not accruing interest income. We place loans on non-accrual status when we believe collectability of principal and interest in full is not reasonably assured, which generally occurs when a loan is three monthly payments past due, unless the loan is well secured and in the process of collection based upon an individual loan assessment.
|
|
n
|
Non-performing loan
-
a loan where the borrower is three months or more past due or is in the process of foreclosure.
|
|
n
|
NYSE
- New York Stock Exchange.
|
|
n
|
OAS
- Option-adjusted spread - An estimate of the incremental yield spread between a particular financial instrument (e.g., a security, loan, or derivative contract) and a benchmark yield curve (e.g., LIBOR, agency, or U.S. Treasury securities). This includes consideration of potential variability in the instrument's cash flows resulting from any options embedded in the instrument, such as prepayment options. When the OAS on a given asset widens, the fair value of that asset will typically decline, all other market factors being equal. The opposite is true when the OAS on a given asset tightens.
|
|
n
|
Option ARM loan
- Loans that permit a variety of repayment options, including minimum, interest-only, fully amortizing 30-year, and fully amortizing 15-year payments. The minimum payment alternative for option ARM loans allows the borrower to make monthly payments that may be less than the interest accrued for the period. The unpaid interest is added to the principal balance of the loan, known as negative amortization. For our non-agency mortgage-related securities that are backed by option ARM loans, we categorize securities as option ARM if the securities were identified as such based on information provided to us when we entered into these transactions. We have not identified option ARM securities as either subprime or Alt-A securities.
|
|
n
|
Original LTV ratio
- A credit measure for loans, calculated as the UPB of the loan divided by the lesser of the appraised value of the property at the time of loan origination or the borrower's purchase price. Second liens not owned or guaranteed by us are excluded from the LTV ratio calculation. The existence of a second-lien loan reduces the borrower's equity in the home and, therefore, can increase the risk of default and the amount of the gross loss if a default occurs.
|
|
n
|
OTC
- Over-the-counter.
|
|
n
|
OTCQB
- A marketplace, operated by the OTC Markets Group Inc., for OTC-traded U.S. companies that are registered and current in their reporting with the SEC or a U.S. banking or insurance regulator.
|
|
n
|
PCs
- Participation Certificates - Single-class pass-through securities that we issue and guarantee as part of a securitization transaction. Typically we purchase loans from sellers, place a pool of loans
|
|
FREDDIE MAC
| 2018 Form 10-K
|
409
|
|
|
Glossary
|
|
into a PC trust, and issue PCs from that trust. The PCs are generally transferred to the seller of the loans as consideration for the loans or are sold to third-party investors or retained by us if we purchased the loans for cash.
|
n
|
Pension Plan
- The Federal Home Loan Mortgage Corporation Employees' Pension Plan.
|
|
n
|
Performing loan
- A loan where the borrower is less than three months past due and is not in the process of foreclosure.
|
|
n
|
PMVS
- Portfolio Market Value Sensitivity - One of our primary interest-rate risk measures. PMVS measures are estimates of the amount of average potential pre-tax loss in the market value of our net assets due to parallel (PMVS-L) and non-parallel (PMVS-YC) changes in LIBOR.
|
|
n
|
Primary mortgage market
- The market where lenders originate loans by lending funds to borrowers. We do not lend money directly to homeowners and do not participate in this market.
|
|
n
|
Purchase Agreement / Senior Preferred Stock Purchase Agreement
- An agreement the Conservator, acting on our behalf, entered into with Treasury on September 7, 2008, relating to Treasury's purchase of senior preferred stock, which was subsequently amended and restated on September 26, 2008 and further amended on May 6, 2009, December 24, 2009, August 17, 2012, and December 21, 2017.
|
|
n
|
Q Certificates
- Structured pass-through certificates, similar to K Certificates, except these certificates are backed by loans that are contributed by a third party.
|
|
n
|
RCSA
- Risk and Control Self-Assessment.
|
|
n
|
Recorded investment
- The dollar amount of a loan recorded on our consolidated balance sheets, excluding any allowance, such as the allowance for loan losses, but including direct write-downs of the investment. Recorded investment excludes accrued interest income.
|
|
n
|
Recoveries of charge-offs
- Recoveries of charge-offs generally occur after loans go into foreclosure alternatives or foreclosure sales and where a share of default risk is assumed by mortgage insurers or a reimbursement of our losses from a seller or servicer associated with a repurchase request is received by us on such loans.
|
|
n
|
Reform Act
- The Federal Housing Finance Regulatory Reform Act of 2008, which, among other things, amended the GSE Act by establishing a single regulator, FHFA, for Freddie Mac, Fannie Mae, and the FHLBs.
|
|
n
|
REIT
- Real estate investment trust.
|
|
n
|
Relief refinance loan
- A single-family loan delivered to us for purchase or guarantee that meets the criteria of the Freddie Mac Relief Refinance Mortgage
SM
initiative. Part of this initiative was our implementation of HARP for our loans, and relief refinance options are also available for certain non-HARP loans. Although HARP was targeted at borrowers with current LTV ratios above 80%, our initiative also allows borrowers with LTV ratios of 80% and below to participate.
|
|
n
|
REMIC
- Real Estate Mortgage Investment Conduit - A type of multiclass mortgage-related security that divides the cash flows (principal and interest) of the underlying mortgage-related assets into two or more classes that meet the investment criteria and portfolio needs of different investors.
|
|
n
|
REO
- Real estate owned - Real estate which we have acquired through a foreclosure sale or through a deed in lieu of foreclosure.
|
|
n
|
Reperforming loan -
A loan that was previously three months or more past due or in the process of foreclosure, but the borrower subsequently made payments such that the loan returns to less than three months past due, or a performing modified loan, which is a loan that was modified and is less
|
|
FREDDIE MAC
| 2018 Form 10-K
|
410
|
|
|
Glossary
|
|
than three months past due and is not in the process of foreclosure.
|
n
|
Reputation risk
- The risk of damage to the Freddie Mac brand and reputation from any action, inaction, or association that is perceived to be inappropriate, unethical, or inconsistent with our mission.
|
|
n
|
Risk appetite
- The risk appetite is the aggregate level and types of risk that the Board and management are willing to assume to achieve the company's strategic objectives.
|
|
n
|
RMBS
- Residential mortgage-backed security - A security backed by loans on one-to-four family residential real estate.
|
|
n
|
ROCC
- Return on conservatorship capital.
|
|
n
|
RSU
- Restricted stock unit.
|
|
n
|
2014 Strategic Plan
- The 2014 Strategic Plan for the Conservatorships of Fannie Mae and Freddie Mac, published by FHFA on May 13, 2014.
|
|
n
|
S&P
- Standard & Poor's.
|
|
n
|
SB Certificates
- Structured pass-through certificates backed primarily by recently originated small balance multifamily loans purchased by Freddie Mac.
|
|
n
|
SCR note
- Structured Credit Risk debt notes - A debt security where the principal balance is subject to the performance of a reference pool of multifamily loans guaranteed by Freddie Mac.
|
|
n
|
SEC
- U.S. Securities and Exchange Commission.
|
|
n
|
Seasoned single-family mortgage loans
- Includes seriously delinquent and reperforming loans.
|
|
n
|
Secondary mortgage market
- A market consisting of institutions engaged in buying and selling loans in the form of whole loans (i.e., loans that have not been securitized) and mortgage-related securities. We participate in the secondary mortgage market by issuing guaranteed mortgage-related securities, principally PCs, and by purchasing loans and mortgage-related securities for investment.
|
|
n
|
Segment Earnings
- Segment Earnings are presented for each segment by reclassifying certain credit guarantee-related activities and investment-related activities between various line items on our GAAP consolidated statements of comprehensive income and allocating certain revenues and expenses, including certain returns on assets, funding and hedging costs, and administrative expenses, to our three reportable segments - Single-family Guarantee, Multifamily, and Capital Markets. Certain activities that are not part of a reportable segment are included in the All Other category.
|
|
n
|
Senior preferred stock
- The shares of Variable Liquidation Preference Senior Preferred Stock issued to Treasury under the Purchase Agreement.
|
|
n
|
Senior subordinate securitization structures
- Structures in which we issue guaranteed senior securities or PCs and unguaranteed subordinated securities backed by reperforming single-family loans or recently originated single-family loans.
|
|
n
|
Seriously delinquent or SDQ
- Single-family loans that are three monthly payments or more past due or in the process of foreclosure as reported to us by our servicers. Unless stated otherwise, SDQ rates presented in this Form 10-K refer to gross SDQ rates before consideration of credit enhancements.
|
|
n
|
SERP
- The Federal Home Loan Mortgage Corporation Supplemental Executive Retirement Plan.
|
|
n
|
Short sale
- An alternative to foreclosure consisting of a sale of a mortgaged property in which the
|
|
FREDDIE MAC
| 2018 Form 10-K
|
411
|
|
|
Glossary
|
|
homeowner sells the home at market value and the lender accepts proceeds (sometimes together with an additional payment or promissory note from the borrower) that are less than the outstanding loan indebtedness in full satisfaction of the loan.
|
n
|
Short-term debt
- Other debt due within one year based on the original contractual maturity of the debt instrument. Our short-term debt issuances primarily include discount notes and Reference Bills securities.
|
|
n
|
Single-family credit guarantee portfolio
- Consists of unsecuritized single-family loans, single-family loans held by consolidated trusts, single-family loans underlying non-consolidated resecuritization products, single-family loans covered by long-term standby commitments, and certain mortgage-related securities not issued by us that we guarantee that are collateralized by single-family loans. Excludes our resecuritizations of Ginnie Mae Certificates because these guarantees do not expose us to meaningful amounts of credit risk due to the credit enhancement provided on them by the U.S. government.
|
|
n
|
Single-family loan
- A loan secured by a property containing four or fewer residential dwelling units.
|
|
n
|
Single-family new business activity
- Single-family loans we purchased or guaranteed.
|
|
n
|
Single Security initiative
- An initiative that provides for Freddie Mac and Fannie Mae to issue a single (common) mortgage-related security, to be called the UMBS.
|
|
n
|
STACR debt
note
- Structured Agency Credit Risk debt note - A Freddie Mac issued debt security where the principal balance is linked to the credit performance of a reference pool of single-family loans owned or guaranteed by Freddie Mac.
|
|
n
|
STACR Trust
- Structured Agency Credit Risk Trust - A debt security issued by an unconsolidated trust where the principal balance is linked to the credit performance of a reference pool of single-family loans owned or guaranteed by Freddie Mac. When actual losses on the reference pool of single-family loans occur, Freddie Mac receives a loss protection payment from the trust in exchange for paying monthly credit premiums.
|
|
n
|
Step-rate modified loan
- A term that we generally use to refer to our HAMP loans that have provisions for reduced interest rates that remain fixed for the first five years and then increase over a period of time to a market rate.
|
|
n
|
Strategic risk
- The risk to earnings, capital, profitability, mission, or reputation arising from adverse business decisions, or the improper implementation of those decisions, that may negatively affect the company's strategy.
|
|
n
|
Stripped Giant PCs
- Multiclass securities that are formed by resecuritizing previously issued PCs or Giant PCs and issuing principal-only and interest-only securities backed by the cash flows from the underlying collateral.
|
|
n
|
SOFR
- Secured Overnight Financing Rate.
|
|
n
|
Subprime
- Participants in the mortgage market may characterize single-family loans, based upon their overall credit quality at the time of origination, generally considering them to be prime or subprime. Subprime generally refers to the credit risk classification of a loan. There is no universally accepted definition of subprime. The subprime segment of the mortgage market primarily serves borrowers with poorer credit payment histories and such loans typically have a mix of credit characteristics that indicate a higher likelihood of default and higher loss severities than prime loans. Such characteristics might include, among other factors, a combination of high LTV ratios, low credit scores, or originations using lower underwriting standards, such as limited or no documentation of a
|
|
FREDDIE MAC
| 2018 Form 10-K
|
412
|
|
|
Glossary
|
|
borrower's income. While we have not historically characterized the loans in our single-family credit guarantee portfolio as either prime or subprime, we monitor the amount of loans we have guaranteed with characteristics that indicate a higher degree of credit risk. Certain security collateral underlying our other securitization products has been identified as subprime based on information provided to Freddie Mac when the transactions were entered into. We also categorize our investments in non-agency mortgage-related securities as subprime if they were identified as such based on information provided to us when we entered into these transactions.
|
n
|
SVP
- Senior Vice President.
|
|
n
|
Swaption
- An option contract to enter into an interest-rate swap. In exchange for an option premium, a buyer obtains the right but not the obligation to enter into a specified swap agreement with the issuer on a specified future date.
|
|
n
|
Target TDC
- Target total direct compensation.
|
|
n
|
TBA
- To be announced.
|
|
n
|
The Tax Cuts and Jobs Act
- The tax reform bill ("An Act to Provide for Reconciliation Pursuant to Titles II and V of the Concurrent Resolution on the Budget for Fiscal Year 2018, Pub. Law No. 115-97") enacted on December 22, 2017, which included a reduction of the statutory corporate income tax rate from 35% to 21%.
|
|
n
|
TDR
- Troubled debt restructuring - A restructuring of a debt constitutes a TDR if the creditor, for economic or legal reasons related to the debtor's financial difficulties grants a concession to the debtor, that it would not otherwise consider.
|
|
n
|
Thrift/401(k) Plan
- The Federal Home Loan Mortgage Corporation Thrift/401(k) Savings Plan.
|
|
n
|
Total mortgage portfolio
- Includes loans and mortgage-related securities held on our consolidated balance sheets as well as our non-consolidated issued and guaranteed single-class and multiclass securities, and other mortgage-related guarantees issued to third parties.
|
|
n
|
Total other comprehensive income (loss) (or other comprehensive income (loss))
- Consists of the after-tax changes in the unrealized gains and losses on available-for-sale securities, the effective portion of derivatives accounted for as cash flow hedge relationships, and defined benefit plans.
|
|
n
|
Treasury
- U.S. Department of the Treasury.
|
|
n
|
UMBS
- Uniform mortgage-backed security - A single (common) mortgage-related security currently expected to be issued on and after June 3, 2019 by Freddie Mac and Fannie Mae. The UMBS represents undivided beneficial ownership interest in, and the right to receive payments from, pools of one- to four- family residential mortgages that are held in trust for investors.
|
|
n
|
UPB
- Unpaid principal balance - Loan UPB amounts in this report have not been reduced by charge-offs recognized prior to the loan being subject to a foreclosure sale, deed in lieu of foreclosure, or short sale transaction.
|
|
n
|
Upfront fee
- A fee charged to sellers that primarily includes delivery fees that are calculated based on credit risk factors such as the loan product type, loan purpose, LTV ratio, and credit score.
|
|
n
|
USDA
- U.S. Department of Agriculture.
|
|
n
|
VA
- U.S. Department of Veterans Affairs.
|
|
n
|
Variation margin
- Payments we make to or receive from a derivatives clearinghouse or counterparty based on the change in fair value of a derivative instrument. Variation margin is typically transferred within one business day.
|
|
FREDDIE MAC
| 2018 Form 10-K
|
413
|
|
|
Glossary
|
|
|
n
|
VIE
- Variable Interest Entity - A VIE is an entity that has a total equity investment at risk that is not sufficient to finance its activities without additional subordinated financial support provided by another party, or where the group of equity holders does not have: (i) the ability to make significant decisions about the entity's activities; (ii) the obligation to absorb the entity's expected losses; or (iii) the right to receive the entity's expected residual returns.
|
|
n
|
Warrant
- Refers to the warrant we issued to Treasury on September 7, 2008 pursuant to the Purchase Agreement. The warrant provides Treasury the ability to purchase, for a nominal price, shares of our common stock equal to 79.9% of the total number of shares of Freddie Mac common stock outstanding on a fully diluted basis on the date of exercise.
|
|
n
|
Workforce housing
-
Multifamily housing that is affordable to the majority of low to middle income households.
|
|
n
|
Workout, or loan workout
- A workout is either a home retention action, which is either a loan modification, repayment plan, or forbearance agreement, or a foreclosure alternative, which is either a short sale or a deed in lieu of foreclosure.
|
|
n
|
XBRL
- eXtensible Business Reporting Language.
|
|
n
|
Yield curve
- A graphical display of the relationship between yields and maturity dates for bonds of the same credit quality. The slope of the yield curve is an important factor in determining the level of net interest yield on a new mortgage asset, both initially and over time. For example, if a mortgage asset is purchased when the yield curve is inverted (i.e., short-term interest rates higher than long-term interest rates), our net interest yield on the asset will tend to be lower initially and then increase over time. Likewise, if a mortgage asset is purchased when the yield curve is steep (i.e., short-term interest rates lower than long-term interest rates), our net interest yield on the asset will tend to be higher initially and then decrease over time.
|
|
FREDDIE MAC
| 2018 Form 10-K
|
414
|
|
|
Exhibit Index
|
|
Exhibit Index
|
Exhibit
|
Description*
|
|
3.1
|
|
|
3.2
|
|
|
4.1
|
|
|
4.2
|
|
|
4.3
|
|
|
4.4
|
|
|
4.5
|
|
|
4.6
|
|
|
4.7
|
|
|
4.8
|
|
|
4.9
|
|
|
4.10
|
|
|
* The SEC file numbers for the Registrant's Registration Statement on Form 10, Annual Reports on Form 10-K, Quarterly Reports on Form 10-Q, and Current Reports on Form 8-K are 000-53330 and 001-34139.
|
|
|
FREDDIE MAC
| 2018 Form 10-K
|
415
|
|
|
Exhibit Index
|
|
|
Exhibit
|
Description*
|
|
4.11
|
|
|
4.12
|
|
|
|
|
|
4.13
|
|
|
4.14
|
|
|
4.15
|
|
|
4.16
|
|
|
4.17
|
|
|
4.18
|
|
|
4.19
|
|
|
4.20
|
|
|
4.21
|
|
|
4.22
|
|
|
4.23
|
|
|
* The SEC file numbers for the Registrant's Registration Statement on Form 10, Annual Reports on Form 10-K, Quarterly Reports on Form 10-Q, and Current Reports on Form 8-K are 000-53330 and 001-34139.
|
|
|
FREDDIE MAC
| 2018 Form 10-K
|
416
|
|
|
Exhibit Index
|
|
|
Exhibit
|
Description*
|
|
4.24
|
|
|
4.25
|
|
|
4.26
|
|
|
4.27
|
|
|
4.28
|
|
|
10.1
|
|
|
10.2
|
|
|
10.3
|
|
|
10.4
|
|
|
10.5
|
|
|
10.6
|
|
|
10.7
|
|
|
10.8
|
|
|
* The SEC file numbers for the Registrant's Registration Statement on Form 10, Annual Reports on Form 10-K, Quarterly Reports on Form 10-Q, and Current Reports on Form 8-K are 000-53330 and 001-34139.
† This exhibit is a management contract or compensatory plan, contract, or arrangement.
|
|
|
FREDDIE MAC
| 2018 Form 10-K
|
417
|
|
|
Exhibit Index
|
|
|
Exhibit
|
Description*
|
|
10.9
|
|
|
10.10
|
|
|
10.11
|
|
|
10.12
|
|
|
10.13
|
|
|
10.14
|
|
|
10.15
|
|
|
10.16
|
|
|
10.17
|
|
|
10.18
|
|
|
10.19
|
|
|
10.20
|
|
|
10.21
|
|
|
10.22
|
|
|
10.23
|
|
|
* The SEC file numbers for the Registrant's Registration Statement on Form 10, Annual Reports on Form 10-K, Quarterly Reports on Form 10-Q, and Current Reports on Form 8-K are 000-53330 and 001-34139.
† This exhibit is a management contract or compensatory plan, contract, or arrangement.
|
|
|
FREDDIE MAC
| 2018 Form 10-K
|
418
|
|
|
Exhibit Index
|
|
|
Exhibit
|
Description*
|
|
10.24
|
|
|
10.25
|
|
|
10.26
|
|
|
10.27
|
|
|
10.28
|
|
|
10.29
|
|
|
|
|
|
10.30
|
|
|
10.31
|
|
|
10.32
|
|
|
10.33
|
|
|
10.34
|
|
|
10.35
|
|
|
10.36
|
|
|
* The SEC file numbers for the Registrant's Registration Statement on Form 10, Annual Reports on Form 10-K, Quarterly Reports on Form 10-Q, and Current Reports on Form 8-K are 000-53330 and 001-34139.
† This exhibit is a management contract or compensatory plan, contract, or arrangement.
|
|
|
FREDDIE MAC
| 2018 Form 10-K
|
419
|
|
|
Exhibit Index
|
|
|
Exhibit
|
Description*
|
|
10.37
|
|
|
10.38
|
|
|
10.39
|
|
|
24.1
|
|
|
31.1
|
|
|
31.2
|
|
|
32.1
|
|
|
32.2
|
|
|
101.INS
|
XBRL Instance Document
|
|
101.SCH
|
XBRL Taxonomy Extension Schema
|
|
101.CAL
|
XBRL Taxonomy Extension Calculation
|
|
101.LAB
|
XBRL Taxonomy Extension Labels
|
|
101.PRE
|
XBRL Taxonomy Extension Presentation
|
|
101.DEF
|
XBRL Taxonomy Extension Definition
|
|
* The SEC file numbers for the Registrant's Registration Statement on Form 10, Annual Reports on Form 10-K, Quarterly Reports on Form 10-Q, and Current Reports on Form 8-K are 000-53330 and 001-34139.
|
|
|
FREDDIE MAC
| 2018 Form 10-K
|
420
|
|
|
Signatures
|
|
Signatures
Pursuant to the requirements of Section 13 or 15(d) of the Securities Exchange Act of 1934, the registrant has duly caused this report to be signed on its behalf by the undersigned thereunto duly authorized.
|
Federal Home Loan Mortgage Corporation
|
|
|
By:
|
/s/ Donald H. Layton
|
|
|
Donald H. Layton
|
|
|
Chief Executive Officer
|
|
Date: February 14, 2019
|
|
|
FREDDIE MAC
| 2018 Form 10-K
|
421
|
|
|
Signatures
|
|
Pursuant to the requirements of the Securities Exchange Act of 1934, this report has been signed below by the following persons on behalf of the registrant and in the capacities and on the dates indicated.
|
Signature
|
|
Capacity
|
|
Date
|
||
|
|
|
|
||||
|
/s/ Christopher S. Lynch*
|
|
Non-Executive Chairman of the Board
|
|
February 14, 2019
|
||
|
Christopher S. Lynch
|
|
|
||||
|
|
|
|
||||
|
/s/ Donald H. Layton
|
|
Chief Executive Officer and Director
|
|
February 14, 2019
|
||
|
Donald H. Layton
|
|
(Principal Executive Officer)
|
|
|||
|
|
|
|
||||
|
/s/ James G. Mackey
|
|
Executive Vice President — Chief Financial Officer
|
|
February 14, 2019
|
||
|
James G. Mackey
|
|
(Principal Financial Officer)
|
|
|||
|
|
|
|
||||
|
/s/ Donald Kish
|
|
Senior Vice President — Corporate Controller and
|
|
February 14, 2019
|
||
|
Donald Kish
|
|
Principal Accounting Officer (Principal Accounting Officer)
|
|
|||
|
/s/ Carolyn H. Byrd*
|
Director
|
February 14, 2019
|
||||
|
Carolyn H. Byrd
|
||||||
|
/s/ Lance F. Drummond*
|
Director
|
February 14, 2019
|
||||
|
Lance F. Drummond
|
||||||
|
/s/ Aleem Gillani*
|
|
Director
|
|
February 14, 2019
|
||
|
Aleem Gillani
|
|
|
||||
|
/s/ Christopher E. Herbert*
|
|
Director
|
|
February 14, 2019
|
||
|
Christopher E. Herbert
|
|
|
||||
|
/s/ Grace A. Huebscher*
|
|
Director
|
|
February 14, 2019
|
||
|
Grace A. Huebscher
|
||||||
|
/s/ Steven W. Kohlhagen*
|
|
Director
|
|
February 14, 2019
|
||
|
Steven W. Kohlhagen
|
||||||
|
/s/ Sara Mathew*
|
|
Director
|
|
February 14, 2019
|
||
|
Sara Mathew
|
||||||
|
/s/ Saiyid T. Naqvi*
|
|
Director
|
|
February 14, 2019
|
||
|
Saiyid T. Naqvi
|
||||||
|
|
|
|
||||
|
/s/ Eugene B. Shanks, Jr.*
|
|
Director
|
|
February 14, 2019
|
||
|
Eugene B. Shanks, Jr.
|
|
|
||||
|
|
|
|
||||
|
/s/ Anthony A. Williams*
|
|
Director
|
|
February 14, 2019
|
||
|
Anthony A. Williams
|
|
|
||||
|
*By:
|
|
/s/ Alicia S. Myara
|
|
|||
|
|
Alicia S. Myara
|
|
|
|||
|
|
Attorney-in-Fact
|
|
|
|||
|
FREDDIE MAC
| 2018 Form 10-K
|
422
|
|
|
Index
|
|
Form 10-K Index
|
Item Number
|
Page(s)
|
|
|
PART I
|
||
|
Item 1
|
Business
|
1-2, 6-8, 30-43, 53-61, 72-78, 161-174
|
|
Item 1A
|
Risk Factors
|
181-208
|
|
Item 1B
|
Unresolved Staff Comments
|
Not Applicable
|
|
Item 2
|
Properties
|
8
|
|
Item 3
|
Legal Proceedings
|
209
|
|
Item 4
|
Mine Safety Disclosures
|
Not Applicable
|
|
PART II
|
||
|
Item 5
|
Market for Registrant's Common Equity, Related Stockholder Matters and Issuer Purchases of Equity Securities
|
210
|
|
Item 6
|
Selected Financial Data
|
11
|
|
Item 7
|
Management's Discussion and Analysis of Financial Condition and Results of Operations
|
1-5, 9-10, 12-29, 44-52, 62-71, 79-135, 145-160, 175-180
|
|
Item 7A
|
Quantitative and Qualitative Disclosures About Market Risk
|
136-144
|
|
Item 8
|
Financial Statements and Supplementary Data
|
211-340
|
|
Item 9
|
Changes in and Disagreements With Accountants on Accounting and Financial Disclosure
|
Not Applicable
|
|
Item 9A
|
Controls and Procedures
|
212-213, 341-344
|
|
Item 9B
|
Other Information
|
345
|
|
PART III
|
||
|
Item 10
|
Directors, Executive Officers and Corporate Governance
|
87-89, 345-366, 395
|
|
Item 11
|
Executive Compensation
|
360, 362-363, 367-392
|
|
Item 12
|
Security Ownership of Certain Beneficial Owners and Management and Related Stockholder Matters
|
393-395
|
|
Item 13
|
Certain Relationships and Related Transactions, and Director Independence
|
354-356, 396-398
|
|
Item 14
|
Principal Accounting Fees and Services
|
399-400
|
|
PART IV
|
||
|
Item 15
|
Exhibits and Financial Statement Schedules
|
401, 415-420
|
|
Item 16
|
Form 10-K Summary
|
Not Applicable
|
|
Signatures
|
421-422
|
|
|
FREDDIE MAC
| 2018 Form 10-K
|
423
|
|
TABLE OF CONTENTS
Part IItem 1business1-2, 6-8, 30-43, 53-61, 72-78, 161-174Item 1arisk Factors181-208Item 1bunresolved Staff Commentsnot ApplicableItem 2properties8Item 3legal Proceedings209Item 4mine Safety Disclosuresnot ApplicablePart IIItem 5market For Registrant's Common Equity, Related Stockholder Matters and Issuer Purchases Of Equity Securities210Item 6selected Financial Data11Item 7aquantitative and Qualitative Disclosures About Market Risk136-144Item 8financial Statements and Supplementary Data211-340Item 9changes in and Disagreements with Accountants on Accounting and Financial Disclosurenot ApplicableItem 9acontrols and Procedures212-213, 341-344Item 9bother Information345Part IIIItem 10directors, Executive Officers and Corporate Governance87-89, 345-366, 395Item 11executive Compensation360, 362-363, 367-392Item 12security Ownership Of Certain Beneficial Owners and Management and Related Stockholder Matters393-395Item 13certain Relationships and Related Transactions, and Director Independence354-356, 396-398Item 14principal Accounting Fees and Services399-400Part IVItem 15exhibits and Financial Statement Schedules401, 415-420Item 16form 10-k Summarynot Applicable