FNB CORP/PA/
10-Ks and 10-Qs
|
|
|
|
|
|
|
|
|
|
|
|
|
|
|
|
|
|
|
|
|
|
|
|
|
|
|
|
|
|
|
|
|
|
|
|
|
|
|
|
|
|
|
|
|
|
|
|
|
|
|
|
|
|
|
|
UNITED STATES SECURITIES AND EXCHANGE COMMISSION
WASHINGTON, D.C. 20549
FORM 10-K
Annual Report Pursuant to Section 13 or 15(d) of the Securities Exchange Act of 1934
For the fiscal year ended
December 31, 2018
Commission file number 001-31940
F.N.B. CORPORATION
(Exact name of registrant as specified in its charter)
|
Pennsylvania
|
25-1255406
|
|
|
(State or other jurisdiction of incorporation or organization)
|
(I.R.S. Employer Identification No.)
|
|
|
12 Federal Street, One North Shore Center, Pittsburgh, PA
|
15212
|
|
|
(Address of principal executive offices)
|
(Zip Code)
|
|
|
Registrant’s telephone number, including area code:
|
800-555-5455
|
|
|
Securities registered pursuant to Section 12(b) of the Act:
|
||
|
Title of Each Class
|
Name of Exchange on which Registered
|
|
|
Common Stock, par value $0.01 per share
|
New York Stock Exchange
|
|
|
Depositary Shares each representing a 1/40th interest in a
share of Fixed-to-Floating Rate Non-Cumulative Perpetual
Preferred Stock, Series E, par value $0.01 per share
|
New York Stock Exchange
|
|
Securities registered pursuant to Section 12(g) of the Act: None
Indicate by check mark if the registrant is a well-known seasoned issuer, as defined in Rule 405 of the Securities Act. Yes ☒ No ☐
Indicate by check mark if the registrant is not required to file reports pursuant to Section 13 or Section 15(d) of the Exchange Act. Yes ☐ No ☒
Indicate by check mark whether the registrant (1) has filed all reports required to be filed by Section 13 or 15(d) of the Securities Exchange Act of 1934 during the preceding 12 months (or for such shorter period that the registrant was required to file such reports), and (2) has been subject to such filing requirements for the past 90 days. Yes ☒ No ☐
Indicate by check mark whether the registrant has submitted electronically every Interactive Data File required to be submitted pursuant to Rule 405 of Regulation S-T (§232.405 of this chapter) during the preceding 12 months (or for such shorter period that the registrant was required to submit such files). Yes ☒ No ☐
Indicate by check mark if disclosure of delinquent filers pursuant to Item 405 of Regulation S-K is not contained herein, and will not be contained, to the best of the registrant’s knowledge, in definitive proxy or information statements incorporated by reference in Part III of this Form 10-K or any amendment to this Form 10-K. ☒
Indicate by check mark whether the registrant is a large accelerated filer, an accelerated filer, a non-accelerated filer, a smaller reporting company or an emerging growth company. See definitions of “large accelerated filer,” “accelerated filer,” “smaller reporting company” and "emerging growth company" in Rule 12b-2 of the Exchange Act.
|
Large Accelerated Filer ☒
|
Accelerated Filer ☐
|
Non-accelerated Filer ☐
|
Smaller Reporting Company ☐
|
Emerging Growth Company ☐
|
||||
If an emerging growth company, indicate by check mark if the registrant has elected not to use the extended transition period for complying with any new or revised financial accounting standards provided pursuant to Section 13(a) of the Exchange Act. ☐
Indicate by check mark whether the registrant is a shell company (as defined in Rule 12b-2 of the Exchange Act). Yes ☐ No ☒
The aggregate market value of the registrant’s outstanding voting common stock held by non-affiliates on
June 30, 2018
, determined using a per share closing price on that date of
$13.42
, as quoted on the New York Stock Exchange, was
$4,249,166,897
.
As of
January 31, 2019
, the registrant had outstanding
324,493,346
shares of common stock.
DOCUMENTS INCORPORATED BY REFERENCE
Portions of F.N.B. Corporation’s definitive proxy statement to be filed pursuant to Regulation 14A for the Annual Meeting of Stockholders to be held on
May 15, 2019
are incorporated by reference into Part III, Items 10, 11, 12, 13 and 14, of this Annual Report on Form 10-K. F.N.B. Corporation will file its definitive proxy statement with the Securities and Exchange Commission on or before
April 15, 2019
.
INDEX
|
PAGE
|
||
|
PART I
|
||
|
Item 1.
|
||
|
Item 1A.
|
||
|
Item 1B.
|
||
|
Item 2.
|
||
|
Item 3.
|
||
|
Item 4.
|
||
|
PART II
|
||
|
Item 5.
|
||
|
Item 6.
|
||
|
Item 7.
|
||
|
Item 7A.
|
||
|
Item 8.
|
||
|
Item 9.
|
||
|
Item 9A.
|
||
|
Item 9B.
|
||
|
PART III
|
||
|
Item 10.
|
||
|
Item 11.
|
||
|
Item 12.
|
||
|
Item 13.
|
||
|
Item 14.
|
||
|
PART IV
|
||
|
Item 15.
|
||
|
Item 16.
|
||
Glossary of Acronyms and Terms
|
ADC
|
Acquisition, development or construction
|
|
AFS
|
Available for sale
|
|
ALCO
|
Asset/Liability Committee
|
|
ANNB
|
Annapolis Bancorp, Inc.
|
|
AOCI
|
Accumulated other comprehensive income
|
|
ASC
|
Accounting Standards Codification
|
|
ASU
|
Accounting Standards Update
|
|
BOLI
|
Bank owned life insurance
|
|
Basel III
|
Basel III Capital Rules
|
|
BCSB
|
BCSB Bancorp, Inc.
|
|
BHC Act
|
Bank Holding Company Act of 1956, as amended
|
|
CECL
|
Current expected credit losses
|
|
CET1
|
Common equity tier 1
|
|
CFPB
|
Consumer Financial Protection Bureau
|
|
CPP
|
Capital Purchase Program
|
|
CRA
|
Community Reinvestment Act of 1977
|
|
DIF
|
Deposit Insurance Fund
|
|
Dodd-Frank Act
|
Dodd-Frank Wall Street Reform and Consumer Protection Act of 2010
|
|
DOJ
|
U.S. Department of Justice
|
|
DTA
|
Deferred tax asset
|
|
DTL
|
Deferred tax liability
|
|
Economic Growth Act
|
Economic Growth, Regulatory Relief and Consumer Protection Act
|
|
EVE
|
Economic value of equity
|
|
ERISA
|
Employee Retirement Income Security Act of 1974
|
|
FASB
|
Financial Accounting Standards Board
|
|
FDIC
|
Federal Deposit Insurance Corporation
|
|
FDICIA
|
Federal Deposit Insurance Corporation Improvement Act of 1991
|
|
FHLB
|
Federal Home Loan Bank
|
|
FICO
|
Fair Isaac Corporation
|
|
Fifth Third
|
Fifth Third Bank
|
|
FINRA
|
Financial Industry Regulatory Authority
|
|
FNB
|
F.N.B. Corporation
|
|
FNBIA
|
F.N.B. Investment Advisors, Inc.
|
|
FNBPA
|
First National Bank of Pennsylvania
|
|
FNIA
|
First National Insurance Agency, LLC
|
|
FNTC
|
First National Trust Company
|
|
FOMC
|
Federal Open Market Committee
|
|
FRB
|
Board of Governors of the Federal Reserve System
|
|
FSOC
|
Financial Stability Oversight Council
|
|
FTE
|
Fully taxable equivalent
|
|
FVO
|
Fair value option
|
|
GAAP
|
U.S. generally accepted accounting principles
|
|
GLB Act
|
Gramm-Leach Bliley Act of 1999
|
|
GSE
|
Government-sponsored entity
|
|
HTM
|
Held to maturity
|
|
HUD
|
Department of Housing and Urban Development
|
|
HVCRE
|
High volatility commercial real estate
|
|
IRLC
|
Interest rate lock commitments
|
|
LCR
|
Liquidity Coverage Ratio
|
|
LIBOR
|
London Inter-bank Offered Rate
|
|
LIHTC
|
Low income housing tax credit
|
|
LTV
|
Loan-to-value
|
|
MCH
|
Months of Cash on Hand
|
|
METR
|
Metro Bancorp, Inc.
|
|
MD&A
|
Management's Discussion and Analysis
|
|
MSA
|
Mortgage servicing asset
|
|
MSR
|
Mortgage servicing rights
|
|
NYSE
|
New York Stock Exchange
|
|
OBA
|
OBA Financial Services, Inc.
|
|
OCC
|
Office of the Comptroller of the Currency
|
|
OREO
|
Other real estate owned
|
|
OTTI
|
Other-than-temporary impairment
|
|
Penn-Ohio
|
Penn-Ohio Life Insurance Company
|
|
QM
|
Qualified mortgage
|
|
Regency
|
Regency Finance Company
|
|
RESPA
|
Real Estate Settlement Procedures Act
|
|
SAB
|
Staff Accounting Bulletin
|
|
SBA
|
Small Business Administration
|
|
SEC
|
Securities and Exchange Commission
|
|
SOX
|
Sarbanes-Oxley Act of 2002
|
|
TCJA
|
Tax Cuts and Jobs Act of 2017
|
|
TDR
|
Troubled debt restructuring
|
|
TILA
|
Truth in Lending Act
|
|
TPS
|
Trust preferred securities
|
|
UST
|
U.S. Department of the Treasury
|
|
YDKN
|
Yadkin Financial Corporation
|
PART I
Forward-Looking Statements: From time to time F.N.B. Corporation has made and may continue to make written or oral forward-looking statements with respect to our outlook or expectations for earnings, revenues, expenses, capital levels, asset quality or other future financial or business performance, strategies or expectations, or the impact of legal, regulatory or supervisory matters on our business operations or performance. This Annual Report on Form 10-K (the Report) also includes forward-looking statements. See Cautionary Statement Regarding Forward-Looking Information in Item 7 of this Report.
The terms “FNB,” “the Corporation,” “we,” “us” and “our” throughout this Report mean F.N.B. Corporation and its subsidiaries, when appropriate.
|
ITEM 1.
|
BUSINESS
|
Overview
We are a financial holding company under the Gramm-Leach-Bliley Act of 1999. We were formed in 1974 as a bank holding company and are headquartered in Pittsburgh, Pennsylvania. With our subsidiaries, we have been in business since 1864. We completed a redomestication from the State of Florida to the Commonwealth of Pennsylvania on August 30, 2016. The redomestication was effected pursuant to a plan of conversion approved by our Board of Directors and stockholders. As a result of the redomestication, we are organized under and subject to Pennsylvania law, and remain the same entity that existed before the redomestication, with the same legal existence without interruption, and are deemed to have commenced our existence as of the time we were incorporated under Florida law in 2001. We were originally incorporated in 1974 in Pennsylvania and reincorporated in Florida in 2001 after experiencing substantial growth of our business and operations in Florida in prior years. In 2004, we spun-off our Florida operations in a newly formed public company and refocused on growing our markets in Pennsylvania. Since that time, the majority of our assets, operations and employees have been located in Pennsylvania.
The redomestication did not cause any change in the business, physical location, management, assets, debts or liabilities of FNB. All individuals who served as directors, officers and employees of FNB prior to the redomestication continued to serve in those capacities after the redomestication. Except for the change in the state law governing our legal existence, the redomestication did not affect our common stock or Fixed-to-Floating Rate Non-Cumulative Perpetual Preferred Stock, Series E shares or the trading of those securities on the NYSE under the symbols “FNB” and “FNBPrE,” respectively.
As a diversified financial services holding company, FNB, through our subsidiaries, provides a full range of financial services, principally to consumers, corporations, governments and small- to medium-sized businesses in our market areas through our subsidiary network, which is led by our largest subsidiary, FNBPA. Our business strategy focuses primarily on providing quality, consumer- and commercial-based financial services adapted to the needs of each of the markets we serve. We seek to maintain our community orientation by providing local management with certain autonomy in decision making, enabling them to respond to customer requests more quickly and to concentrate on transactions within their market areas. We seek to preserve some decision making at a local level, however, we have centralized legal, loan review, credit underwriting, accounting, investment, audit, loan operations, deposit operations and data processing functions. The centralization of these processes enables us to maintain consistent quality of these functions and to achieve certain economies of scale.
As of
December 31, 2018
, we have three reportable business segments: Community Banking, Wealth Management and Insurance. As of
December 31, 2018
, we have
396
Community Banking offices in Pennsylvania, Ohio, Maryland, West Virginia, North Carolina and South Carolina.
As of
December 31, 2018
, we had total assets of
$33.1 billion
, loans of
$22.2 billion
and deposits of
$23.5 billion
. See Item 7, “Management’s Discussion and Analysis of Financial Condition and Results of Operations,” and Item 8, “Financial Statements and Supplementary Data,” of this Report.
3
Significant Business Combinations
We seek to grow through a combination of organic growth and acquisitions. A summary of the acquisitions, exclusive of branch and insurance acquisitions, completed during the past five years is summarized below:
|
Acquired Entity
|
Acquired Bank
|
Year
|
Fair Value of
Assets Acquired
|
|||||
|
(dollars in millions)
|
||||||||
|
Yadkin Financial Corporation
|
Yadkin Bank
|
2017
|
$
|
6,780
|
|
|||
|
Metro Bancorp, Inc.
|
Metro Bank
|
2016
|
2,784
|
|
||||
|
OBA Financial Services, Inc.
|
OBA Bank
|
2014
|
390
|
|
||||
|
BCSB Bancorp, Inc.
|
Baltimore County Savings Bank
|
2014
|
596
|
|
||||
For more detailed information concerning acquisitions, see Note 3, “Mergers and Acquisitions” in the Notes to Consolidated Financial Statements, which is included in Item 8 of this Report.
Recent Developments
Regency Finance Corporation
On August 31, 2018, we completed the sale of 100 percent of the issued and outstanding capital stock of Regency to Mariner Finance, LLC in exchange for cash consideration of $142 million. This transaction was completed to accomplish several strategic objectives, including enhancing the credit risk profile of the consumer loan portfolio, offering additional liquidity and selling a non-strategic business segment that no longer fits with our core business. The transaction included a reduction of $131.9 million in direct installment consumer loans, a net charge-off of $7.1 million for the mark to fair value on the Regency loans prior to sale with no associated provision impact, a write-off of $1.8 million of goodwill, and a reduction of branch/retail properties leased by FNB. As a result of the sale, we recognized a gain on sale of $5.1 million during the third quarter.
Business Segments
In addition to the following information relating to our business segments, more detailed information is contained in Note 23, “Business Segments” in the Notes to Consolidated Financial Statements, which is included in Item 8 of this Report. As of
December 31, 2018
, FNB had three business segments, with the largest being the Community Banking segment consisting of a regional community bank. The Wealth Management segment consists of a trust company, a registered investment advisor and a subsidiary that offers broker-dealer services through a third-party networking arrangement with a non-affiliated licensed broker-dealer entity. The Insurance segment consists of an insurance agency and a reinsurer.
Community Banking
Our Community Banking segment consists of FNBPA, which offers commercial and consumer banking services. Commercial banking solutions include corporate banking, small business banking, investment real estate financing, business credit, capital markets and lease financing. Consumer banking products and services include deposit products, mortgage lending, consumer lending and a complete suite of mobile and online banking services. Additionally, Bank Capital Services, LLC, a subsidiary of FNBPA, offers commercial loans and leases to customers in need of new or used equipment. As of
December 31, 2018
, our Community Banking segment operated in seven states and the District of Columbia. Our branch network spans several major metropolitan areas including: Pittsburgh, Pennsylvania; Baltimore, Maryland; Cleveland, Ohio; and Charlotte, Raleigh, Durham and the Piedmont Triad (Winston-Salem, Greensboro and High Point) in North Carolina.
The goals of Community Banking are to generate high-quality, profitable revenue growth through increased business with our current customers, attract new customer relationships through FNBPA’s current branches and expand into new and existing markets through de novo branch openings and the establishment of loan production offices. We consider Community Banking an important source of revenue opportunity through the cross-selling of products and services offered by our other business segments.
The lending philosophy of Community Banking is to establish high-quality customer relationships, while minimizing credit losses by following strict credit approval standards (which include independent analysis of realizable collateral value), diversifying our loan portfolio by industry, product and borrower, and conducting ongoing review and management of the loan
4
portfolio. Commercial loans are generally made to established businesses within the geographic market areas served by Community Banking.
No material portion of the loans or deposits of Community Banking has been obtained from a single customer or small group of customers, and the loss of any one customer’s loans or deposits or a small group of customers’ loans or deposits by Community Banking would not have a material adverse effect on the Community Banking segment or on FNB. The substantial majority of the loans and deposits have been generated within the geographic market areas in which Community Banking operates.
Wealth Management
Our Wealth Management segment delivers wealth management services to individuals, corporations and retirement funds, as well as existing customers of Community Banking, located primarily within our geographic markets.
Our Wealth Management operations are conducted through three subsidiaries of FNBPA. FNTC provides a broad range of personal and corporate fiduciary services, including the administration of decedent and trust estates. As of
December 31, 2018
, the fair value of trust assets under management was approximately $5.1 billion. FNTC is required to maintain certain minimum capitalization levels in accordance with regulatory requirements. FNTC periodically measures its capital position to ensure all minimum capitalization levels are maintained.
Our Wealth Management segment also includes two other subsidiaries. First National Investment Services Company, LLC offers a broad array of investment products and services for customers of Wealth Management through a networking relationship with a third-party licensed brokerage firm. FNBIA, an investment advisor registered with the SEC, offers customers of Wealth Management comprehensive investment programs featuring mutual funds, annuities, stocks and bonds.
No material portion of the business of Wealth Management has been obtained from a single customer or small group of customers, and the loss of any one customer’s business or the business of a small group of customers by Wealth Management would not have a material adverse effect on the Wealth Management segment or on FNB.
Insurance
Our Insurance segment operates principally through FNIA, which is a subsidiary of FNB. FNIA is a full-service insurance brokerage agency offering numerous lines of commercial and personal insurance through major carriers to businesses and individuals primarily within FNB’s geographic markets. The goal of FNIA is to grow revenue through cross-selling to existing clients of Community Banking and to gain new clients through its own channels.
Our Insurance segment also includes a reinsurance subsidiary, Penn-Ohio. Penn-Ohio underwrites, as a reinsurer, credit life and accident and health insurance sold by FNB’s lending subsidiaries. Additionally, FNBPA owns a direct subsidiary, First National Corporation, which offers title insurance products.
No material portion of the business of Insurance has been obtained from a single customer or small group of customers, and the loss of any one customer’s business or the business of a small group of customers by Insurance would not have a material adverse effect on the Insurance segment or on FNB.
Other
We also operate other non-banking subsidiaries which are not to be considered reportable segments of FNB. F.N.B. Capital Corporation, LLC (FNBCC) was formed as a merchant banking subsidiary to offer mezzanine financing options for small- to medium-sized businesses that need financial assistance beyond the parameters of typical commercial bank lending products. FNBCC ceased financing new portfolio companies in July 2013. FNBCC has a 21.5% funding commitment in Tecum Capital Partners, L.P. (formerly known as F.N.B. Capital Partners, L.P.) (Tecum), a Small Business Investment Company licensed by the U.S. Small Business Administration. Tecum is not an affiliate or a subsidiary of FNB. We have six companies that issued TPS to third-party investors: F.N.B. Statutory Trust II, Omega Financial Capital Trust I, Yadkin Valley Statutory Trust I, FNB Financial Services Capital Trust I, American Community Capital Trust II and Crescent Financial Capital Trust I, the last four of which were acquired in conjunction with the YDKN acquisition. FNB Financial Services, Inc. and FNB Consumer Financial Services, Inc. are subsidiaries of FNB and are the general partner and limited partner, respectively, of FNB Financial Services, LP, the company established to issue, administer and repay the subordinated notes. The proceeds received from the subordinated notes issuances are a general funding source for FNB. Certain financial information concerning these subsidiaries, along with the parent company and intercompany eliminations, are included in the “Parent and Other” category in Note 23, “Business Segments” in the Notes to Consolidated Financial Statements, which is included in Item 8 of this Report.
5
Market Area and Competition
We operate in seven states and the District of Columbia. Our market coverage spans several major metropolitan areas including: Pittsburgh, Pennsylvania; Baltimore, Maryland; Cleveland, Ohio; and Charlotte, Raleigh, Durham and the Piedmont Triad (Winston-Salem, Greensboro and High Point) in North Carolina.
We compete for loans, deposits and financial services business with a large number of bank and non-bank financial institutions and other lenders engaged in the business of extending credit, including financial technology companies and marketplace lenders. Competition for loans comes principally from commercial banks, savings banks, mortgage banking companies, credit unions, insurance companies and other financial services companies. The most direct competition for deposits comes from commercial banks, savings banks and credit unions. Additional competition for deposits comes from non-depositary competitors such as financial technology companies, mutual funds, securities and brokerage firms and insurance companies. In providing wealth and asset management services, as well as insurance brokerage services, our subsidiaries compete with many other financial services firms, brokerage firms, mutual fund complexes, investment management firms, trust and fiduciary service providers and insurance agencies. Competition for loans and deposits often is based on the rates of interest charged, the rates of interest paid to obtain funds and the availability of customer services.
The ability to deploy and use technology effectively is an important competitive factor in the financial services industry. Technology is not only important with respect to the delivery of financial services, risk management, regulatory compliance and security of customer information, but also in processing information. FNB and each of our subsidiaries must continually make technological investments to remain competitive in the financial services industry. FNBPA has executed several initiatives that have integrated and streamlined its physical branch and e-delivery channels.
Underwriting
Commercial Loans
Our commercial loan policy requires, among other things, that all commercial loans be underwritten to document the borrower’s financial capacity to support the cash flow required to repay the loan. The commercial loan policy also contains additional guidelines and requirements applicable to specific loan products or lines of business. We have developed a proprietary underwriting system for all corporate business loan relationships and utilize a third-party solution for small business loan relationships, with both platforms supporting consistency in underwriting across the entire footprint and credit decisions to be made at the local and regional level in accordance with approval policies. As part of this underwriting, we require clear and concise documentation of the borrower’s ability to repay the loan based on current financial statements and/or tax returns, plus pro-forma financial statements, as appropriate. Specific guidelines for loan terms and conditions are outlined in our Credit Policy. The guidelines also detail the collateral requirements for various loan types. It is our general practice to obtain personal guarantees, supported by current personal financial statements and/or tax returns, to reduce the credit risk, as appropriate.
For loans secured by commercial real estate, we obtain current and independent appraisals from licensed or certified appraisers to assess the value of the underlying collateral. Our general policy for commercial real estate loans is to limit the terms of the loans to not more than 20 years and to have loan-to-value ratios not exceeding 80% on owner-occupied and income producing properties, while land and development-secured projects have more stringent LTV requirements of 65% and 75%, respectively. For non-owner occupied commercial real estate loans, the loan terms are generally aligned with the property’s lease terms, and in many instances, these loans mature within 5 years. As it relates to non-real estate secured loans, our Credit Policy dictates similar guidelines for maximum terms and acceptable advance rates for loans that are not secured by real estate.
Consumer Loans
Our revolving home equity lines of credit are variable rate loans underwritten based on fully indexed rates. For home equity loans, our policy is to generally require an LTV ratio not in excess of 85% and FICO scores of not less than 660. In certain circumstances, we will extend credit to borrowers with an LTV ratio over 85% on a limited and closely monitored basis. Our underwriters evaluate a borrower’s debt service capacity on all line of credit applications by utilizing an interest shock rate of 3% over the prevailing variable interest rate at origination. The borrower’s debt-to-income ratio must remain within our guidelines under the shock rate repayment formula. FNB tightly limits the origination of non-QM loans (see discussion under the caption “
Consumer Protection Statutes and Regulations
”).
FNB’s policy for our indirect installment loans, which third parties (primarily auto dealers) within our approved dealer network originate, is to require a minimum FICO score of 640 for the borrower, the age of the vehicle not to exceed 8 years or 100,000
6
miles and an appropriate LTV ratio, not to exceed 115% inclusive of back-end added products, based on the year and make of the vehicle financed.
We structure our consumer loan products to meet the diverse credit needs of consumers in our market for personal and household purposes. These loan products are on a fixed amount or revolving basis depending on customer need and borrowing capacity. Our loans and lines of credit attempt to balance borrower budgeting sensitivities with realistic repayment maturities within a philosophy that encourages consumer financial responsibility, sound credit risk management and development of strong customer relationships.
Our consumer loan policies and procedures require prospective borrowers to provide appropriate and accurate financial information that will enable our loan underwriting personnel to make sound credit decisions. Specific information requirements vary based on loan type, risk profile and secondary investor requirements where applicable. FNB typically requires that we obtain evidence of capacity to repay as well as an independent credit report, both of which help assess the prospective borrower’s willingness and ability to repay the debt. If any information submitted by the prospective borrower raises reasonable doubts with respect to the willingness and ability of the borrower to repay the loan, FNB denies the credit.
We often take collateral to support an extension of credit and to provide additional protection should the primary source of repayment fail. Consequently, we limit unsecured extensions of credit in amount and only grant them to borrowers with adequate capacity and above-average credit profiles. We expressly discourage unsecured credit lines for debt consolidation, unless there is compelling evidence that the borrower has sufficient liquidity and net worth to repay the loan from alternative sources in the event of income disruption.
Our loan policy requires full independent appraisals of residential real estate collateral values on residential mortgage applications of $250,000 and greater. We may use algorithm-based valuation models for residential mortgages under $250,000. We recognize the limitations as well as the benefits of these valuation products. FNB’s policy is to be conservative in their use but fluid and flexible in interpreting reasonable collateral values when obtained.
We monitor consumer loans with exceptions to our policy including, but not limited to, LTV ratios, FICO scores and debt-to-income ratios. Management routinely evaluates the type, nature, trend and scope of these exceptions and reacts through policy changes, lender counseling, adjustment of loan authorities and similar prerogatives to assure that the retail assets generated meet acceptable credit quality standards. As an added precaution, our risk management personnel conduct periodic reviews of loan files.
Employees
As of January 31, 2019, FNB and our subsidiaries had 3,880 full-time and 540 part-time employees. Our management considers our relationship with our employees to be satisfactory.
Government Supervision and Regulation
The following summary sets forth certain material elements of the regulatory framework applicable to FNB, FNBPA and our subsidiaries and affiliates. The financial services industry is subject to extensive regulatory oversight and, in particular, bank holding companies, banks and their affiliates (depending upon charter and business activities) are subject to supervision, regulation and examination by the FRB, OCC, FDIC, CFPB, SEC, FINRA and various state regulatory agencies. The statutory and regulatory framework that governs FNB and its affiliates is generally intended to protect depositors and customers, the federal insurance fund, the U.S. banking and financial system, and financial markets as a whole; however, this framework is not specifically for the protection of security holders. Significant elements of the laws and regulations applicable to FNB and our affiliates are described in this section. To the extent that the following information describes statutory and regulatory provisions or governmental policies, such descriptions are qualified in their entirety by reference to the full text of the statutes, regulations and policies referenced herein. In addition, certain of FNB’s public disclosure, internal control environment, risk and capital management and corporate governance principles are subject to SOX, the Dodd-Frank Act, as modified by the Economic Growth Act, and related regulations and rules of the SEC under the Securities Act of 1933, as amended, and the Securities Exchange Act of 1934, as amended. Also, FNB is subject to the rules of the NYSE for listed companies.
Political, economic, industry events and other factors typically result in the banking laws, regulations and policies to be continually subject to review by Congress, state legislatures and federal and state regulatory agencies. In addition to laws and regulations, state and federal bank regulatory agencies may issue policy statements, interpretive letters and similar written guidance, which sometimes materially changes regulatory expectations. Any change in the statutes, regulations or regulatory
7
policies applicable to us, including changes in their interpretation, expectations or implementation, could have a material effect on our business or organization.
Both the scope of the laws and regulations, as well as expectations regarding risk management, and the intensity of the supervision to which we are subject have increased in recent years in response to the financial crisis, as well as other factors such as technological and market changes. Regulatory enforcement and fines have also significantly increased across the banking and financial services sector. Many of these changes have occurred as a result of the Dodd-Frank Act and its implementing regulations, most of which are now in place.
On May 24, 2018, President Donald Trump signed into law the Economic Growth Act, which repealed or modified several important provisions of the Dodd-Frank Act. Among other things, the Economic Growth Act raises the total asset thresholds to $250 billion for Dodd-Frank Act annual company-run stress testing, leverage limits, liquidity requirements, and resolution planning requirements for bank holding companies, subject to the ability of the FRB to apply such requirements to institutions with assets of $100 billion or more to address financial stability risks or safety and soundness concerns. On July 6, 2018, the FRB, the OCC and the FDIC issued a joint interagency statement regarding the impact of the Economic Growth Act. As a result of this statement and the Economic Growth Act, FNB and FNBPA are no longer subject to Dodd-Frank Act stress testing requirements, however we will continue to perform capital stress testing consistent with the safety and soundness expectations of our banking regulators. On December 18, 2018, the OCC published a notice of proposed rulemaking to amend the OCC’s stress testing rule and revise the stress testing asset threshold.
The Economic Growth Act also enacted several important changes in some technical compliance areas, for which the banking agencies issued certain corresponding proposed and interim final rules, including:
|
•
|
Prohibiting federal banking regulators from imposing higher capital standards on HVCRE exposures unless they are for ADC loans, and clarifying ADC status;
|
|
•
|
Requiring the federal banking agencies to amend the LCR Rule such that all qualifying investment-grade, liquid and readily-marketable municipal securities are treated as level 2B liquid assets, making them more attractive investment alternatives;
|
|
•
|
Exempting from appraisal requirements certain transactions involving real property in rural areas and valued at less than $400,000; and
|
|
•
|
Directing the CFPB to provide guidance on the applicability of the TILA-RESPA Integrated Disclosure rule to mortgage assumption transactions and construction-to-permanent home loans, as well the extent to which lenders can rely on model disclosures that do not reflect recent regulatory changes. (See discussion under Risk Factors - caption
“We could be adversely affected by changes in the law, especially changes in the regulation of the banking industry”).
|
GENERAL
FNB is a legal entity separate and distinct from our subsidiaries. As a financial holding company and a bank holding company, FNB is regulated under the BHC, as amended, and is subject to regulation, inspection, examination and supervision by the FRB.
Under the BHC Act, FRB is the “umbrella” regulator of a financial holding company. In addition, a financial holding company’s operating entities, meaning its subsidiary broker-dealers, investment managers, investment advisory companies, insurance companies and banks, as applicable, are subject to the jurisdiction of various federal and state “functional” regulators and self-regulatory organizations, such as FINRA.
Our subsidiary bank, FNBPA, and FNBPA’s subsidiary trust company, FNTC, are organized as national banking associations, which are subject to regulation, supervision and examination by the OCC, which is a bureau of the UST. FNBPA is also subject to certain regulatory requirements of the CFPB, the FDIC, the FRB and other federal and state regulatory agencies, including but not limited to requirements to maintain reserves against deposits, capital requirements, limitations regarding dividends, restrictions on the types and amounts of loans that may be granted and the interest that may be charged on loans, affiliate transactions, CRA, consumer compliance and anti-discrimination laws and unfair, deceptive or abusive acts and practices prohibitions, monitoring obligations under the federal bank secrecy act and anti-money laundering requirements, limitations on the types of investments that may be made, cyber security and consumer privacy requirements, activities that may be engaged in and types of services that may be offered. In addition to banking laws, regulations and regulatory agencies, FNB and our subsidiaries are subject to various other laws and regulations and supervision and examination by other regulatory agencies, all of which directly or indirectly affect the operations and management of FNB and our ability to make distributions to our stockholders. If we fail to comply with these or other applicable laws and regulations, we may be subject to civil monetary
8
penalties, imposition of cease and desist orders or other written directives, removal of management and, in certain cases, criminal penalties.
Pursuant to the GLB Act, bank holding companies such as FNB that have qualified as financial holding companies because they are “well-capitalized” and “well managed” have broad authority to engage in activities that are financial in nature or incidental to such financial activity, including insurance underwriting and brokerage, merchant banking, securities underwriting, dealing and market-making; and such additional activities as the FRB in consultation with the Secretary of the UST determines to be financial in nature, incidental thereto or complementary to a financial activity. As a result of the GLB Act, a bank holding company may engage in those activities directly or through subsidiaries by qualifying as a “financial holding company.” As a financial holding company, FNB may engage directly or indirectly in activities considered financial in nature, either de novo or by acquisition, provided the FNB continues such status and gives the FRB after-the-fact notice of the new activities. The GLB Act also permits national banks, such as FNBPA, to engage in activities considered financial in nature through a financial subsidiary, subject to certain conditions and limitations and with the approval of the OCC (see discussion under the caption,
“Financial Holding Company Status and Activities”
).
As a regulated financial holding company, FNB’s relationships and good standing with our regulators are of fundamental importance to the continuation and growth of our businesses. The FRB, OCC, FDIC, CFPB and SEC have broad enforcement powers and authority to approve, deny or refuse to act upon applications or notices of FNB or our subsidiaries to open new or close existing offices, conduct new activities, acquire or divest businesses or assets or reconfigure existing operations. In addition, FNB, FNBPA, FNTC and other affiliates are subject to examination by the various federal and state regulators, which involves periodic examinations and supervisory inquiries, the reports of which are not publicly available and can affect ratings that can impact the conduct and growth of our businesses. These examinations consider not only safety and soundness principles, but also compliance with applicable laws and regulations, including anti-money laundering requirements, loan quality and administration, capital levels, asset quality and risk management ability and performance, earnings, liquidity, consumer compliance, anti-discrimination laws, unfair, deceptive or abusive acts and practices prohibitions, community reinvestment, cyber security and consumer privacy requirements, and various other factors. The federal banking interagency Guidelines for Establishing Standards for Safety and Soundness set forth compliance considerations and guidance with respect to the following operations of banking organizations: (1) internal controls and information systems; (2) internal audit systems; (3) loan documentation; (4) credit underwriting; (5) interest rate exposure; (6) asset growth; (7) executive compensation, fees and benefits; (8) asset quality; and (9) earnings. Significant adverse findings reporting safety and soundness or violations of laws or regulations by any of FNB’s federal bank regulators could potentially result in the imposition of significant fines, penalties, reimbursements, enforcement actions as well as limitations and prohibitions on the activities and growth of FNB and our subsidiaries.
There are numerous laws, regulations and rules governing the activities of financial institutions - including non-bank financial institutions, such as financial technology companies and marketplace lenders, which provide products and services comparable to banking organizations - financial holding companies and bank holding companies. The following discussion is general in nature and seeks to highlight some of the more significant of these regulatory requirements, but does not purport to be complete or to describe all of the laws and regulations that apply to us and our subsidiaries.
Dodd-Frank Wall Street Reform and Consumer Protection Act of 2010
The Dodd-Frank Act continues to have a broad impact on the financial services industry by imposing significant regulatory and compliance requirements including, among other things:
|
•
|
enhanced authority over troubled and failing banks and their holding companies;
|
|
•
|
increased capital and liquidity requirements;
|
|
•
|
increased regulatory examination fees;
|
|
•
|
increased assessments banks must pay the FDIC for federal deposit insurance; and
|
|
•
|
specific provisions designed to improve supervision and oversight of bank safety and soundness and consumer practices, by imposing restrictions and limitations on the scope and type of banking and financial activities.
|
In addition, the Dodd-Frank Act established a new framework for systemic risk oversight within the financial system that is enforced by new and existing federal regulatory agencies and authorities, including the FSOC, FRB, OCC, FDIC and CFPB. The following description briefly summarizes certain impacts of the Dodd-Frank Act on the operations and activities, both currently and prospectively, of FNB, FNBPA, and our subsidiaries and affiliates.
Deposit Insurance.
The Dodd-Frank Act established a $250,000 deposit insurance limit for insured deposits. Amendments to the Federal Deposit Insurance Act also revised the assessment base against which an insured depository institution’s deposit
9
insurance premiums paid to the FDIC’s Deposit Insurance Fund are calculated. Under the amendments, the FDIC assessment base is no longer the institution’s deposit base, but rather its average consolidated total assets less its average tangible equity. The Dodd-Frank Act requires a phase-in of the minimum designated reserve ratio for the DIF, increasing it from 1.15% to 1.35% of the estimated amount of total insured deposits which was achieved as of the third quarter of 2018. FDIC regulations provide that, among other things, upon reaching the minimum, surcharges on insured depository institutions with total consolidated assets of $10 billion or more will cease. In addition, the Dodd-Frank Act eliminated the requirement of the FDIC to pay dividends to depository institutions when the reserve ratio exceeds certain thresholds. The FDIC has set the target designated reserve ratio at 2%. Through September 30, 2018, the FDIC collected a 4.5 basis point annualized premium surcharge assessed on assets over $10 billion of each institution assessment base. In 2018, the premium surcharge resulted in an additional expense of $6.6 million. Assessment rates are scheduled to decrease when the reserve ratio exceeds 2%.
In addition, TCJA, which was signed into law on December 22, 2017, disallows the deduction of FDIC deposit insurance premium payments for banking organizations with total consolidated assets of $50 billion or more. For banks with less than $50 billion in total consolidated assets, such as FNBPA, the premium deduction is phased-out based on the proportion of the bank’s assets exceeding $10 billion.
Interest on Demand Deposits.
Under the Dodd-Frank Act, depository institutions are permitted to pay interest on demand deposits. In accordance therewith, we pay interest on certain classes of commercial demand deposits.
Volcker Rule.
Section 619 of the Dodd-Frank Act (known as the Volcker Rule) prohibits insured depository institutions and their holding companies from engaging in proprietary trading, except under limited circumstances, and prohibits them from owning equity interests in excess of three percent (3%) of Tier 1 capital in private equity and hedge funds. In December 2013, the federal banking agencies adopted final rules implementing the Volcker Rule (the Volcker Implementing Rules). The Volcker Implementing Rules prohibit banking entities from (1) engaging in short-term proprietary trading for their own accounts, and (2) having certain ownership interests in and relationships with hedge funds or private equity funds, which are referred to as “covered funds.” The Volcker Implementing Rules are intended to provide greater clarity with respect to both the extent of those primary prohibitions and of the related exemptions and exclusions and require each regulated entity to establish an internal compliance program that is consistent with the extent to which it engages in activities covered by the Volcker Rule, which must include (for the largest entities) making regular reports about those activities to the entity’s regulators. Although the Volcker Implementing Rules provide for some tiering of compliance and reporting obligations based on the size of an institution, the fundamental prohibitions of the Volcker Rule apply to banking organizations of any size. The Volcker Implementing Rules became effective April 1, 2014, but the conformance period was extended from its statutory end date of July 21, 2014 until July 21, 2015. In addition, the FRB granted extensions until July 21, 2017 of the conformance period for banking entities to conform investments in and relationships with covered funds that were in place prior to December 31, 2013, and in December 2016 provided guidance allowing for additional extensions to the conformance period for certain illiquid funds. We have evaluated the requirements of the Volcker Implementing Rules with respect to our investments and we do not expect any material divestitures of such investments or other financial implications.
In addition, in August 2017 the OCC published a notice and request for comment on whether certain aspects of the Volcker Rule should be revised to better accomplish the purposes of the Dodd-Frank Act while decreasing the compliance burden on banking organizations and fostering economic growth. The request for comment invited input on ways in which to tailor the Volcker Rule’s requirements and clarify key provisions that define prohibited and permissible activities, as well as input on how the federal regulatory agencies could implement the existing Rule more effectively without revising the Volcker Implementing Rules. Specifically, the OCC requested comments on the scope of entities subject to the Volcker Rule, the proprietary trading prohibition, the covered funds prohibition, and the compliance program and metrics reporting requirements. On July 17, 2018, the OCC, FRB, FDIC, SEC and the Commodity Futures Trading Commission published a joint notice of proposed rulemaking designed to simplify and tailor compliance requirements relating to the Volcker Rule. The proposed changes are intended to streamline the rule by eliminating or modifying requirements that are not necessary to effectively implement the statute, while maintaining the core principles of the Volcker Rule, as well as the safety and soundness of banking entities. Specifically, the proposal requested comment on narrowing the definition of what is a covered fund that a bank cannot sponsor or invest in, and broadening the “Super 23A” exemptions to match those in the FRB’s Regulation W. We cannot assure you as to whether and to what extent the proposed regulations that would simplify compliance with the Volcker Rule will be adopted. If adopted, the regulations may affect us in the future by reducing some of our compliance costs, and expanding opportunities, but we may experience some transition costs in developing and implementing changes in conformance with the rules once finalized.
The Consumer Financial Protection Bureau.
The CFPB’s responsibility is to establish, implement and enforce laws, rules and regulations under certain federal consumer financial laws, as defined by the Dodd-Frank Act and interpreted by the CFPB, with respect to the conduct of both bank and non-bank providers of certain consumer financial products and services. The CFPB has rulemaking and enforcement authority over many of the statutes that govern products and services banks offer to consumers.
10
The CFPB has authority to prevent unfair, deceptive or abusive acts and practices in connection with the offering of consumer financial products and services. In addition, the Dodd-Frank Act permits states to adopt consumer protection laws and regulations that are more stringent than those regulations promulgated by the CFPB, and state attorneys general will have the authority to enforce consumer protection rules that the CFPB adopts against state-chartered institutions and against, with respect to certain non-preempted laws, national banks. Compliance with any such new regulation or other precedent established by the CFPB and/or states could reduce our revenue, increase our cost of operations and compliance, and limit, prevent, or make more costly, our ability to expand into certain products and services. Over the past several years, the CFPB has been active in bringing enforcement actions against banks and nonbank financial institutions to enforce federal consumer financial laws. Other federal financial regulatory agencies, including the OCC, as well as state attorneys general and state banking agencies and other state financial regulators also have been increasingly active in this area with respect to institutions over which they have jurisdiction. We have incurred and may in the future incur additional costs in complying with these requirements.
Debit Card Interchange Fees
.
The FRB, pursuant to its authority under the Dodd-Frank Act, has issued rules regarding interchange fees charged for electronic debit transactions by payment card issuers having assets over $10 billion, adopting a per-transaction interchange cap base of $0.21 plus 0.05% of the transaction total (and an additional one cent to account for fraud protection costs).
Transactions with Affiliates.
Pursuant to Sections 23A and 23B of the Federal Reserve Act, as implemented by Regulation W, banks are subject to restrictions that limit certain types of transactions between banks and their non-bank affiliates. In general, banks are subject to quantitative and qualitative limits on extensions of credit, purchases of assets and certain other transactions involving non-bank affiliates. Also, transactions between banks and their non-bank affiliates are required to be on arms-length terms and consistent with safe and sound banking practices. The Dodd-Frank Act enhances the requirements for certain transactions with affiliates under Sections 23A and 23B of the Federal Reserve Act, including an expansion of the definition of “covered transactions” to include the borrowing or lending of securities or derivative transactions, and an increase in the amount of time for which collateral requirements regarding covered transactions must be maintained. In addition, the provisions of the Volcker Rule apply similar restrictions on transactions between a bank and any “covered fund” that the bank advises or sponsors.
Transactions with Insiders.
The Dodd-Frank Act expands insider transaction limitations through the strengthening of loan restrictions to insiders and extending the types of transactions subject to the various requirements to include derivative transactions, repurchase agreements, reverse repurchase agreements and securities lending and borrowing transactions. The Dodd-Frank Act also places restrictions on certain asset sales to and from an insider of an institution, including requirements that such sales be on market terms and, in certain circumstances, receive the approval of the institution’s board of directors.
Enhanced Lending Limits.
Federal banking law limits a national bank’s ability to extend credit to one person or group of related persons to an amount that does not exceed certain thresholds. Among other things, the Dodd-Frank Act expanded the scope of these restrictions to include credit exposure arising from derivative transactions, repurchase agreements and securities lending and borrowing transactions.
The changes resulting from the Dodd-Frank Act continue to impact our profitability, including limitations on fee income opportunities, increased compliance costs, imposition of more stringent capital, liquidity and leverage requirements upon us or otherwise adversely affect our business. We cannot predict what effect any newly implemented, presently contemplated or future changes in the laws or regulations or their interpretations may have on us.
Capital and Operational Requirements
The FRB, OCC and FDIC issued substantially similar risk-based and leverage capital guidelines applicable to U.S. banking organizations. In addition, these regulatory agencies may from time to time require that a banking organization maintain capital above the minimum levels, due to its financial condition or actual or anticipated growth.
FNB, like other bank holding companies, through December 31, 2018 was required to maintain common equity tier 1, tier 1 and total capital (the sum of tier 1 and tier 2 capital) equal to at least 6.375%, 7.875% and 9.875%, respectively, of our total risk-weighted assets (including various off-balance sheet items). The risk-based capital standards are designed to make regulatory capital requirements more sensitive to differences in credit and market risk profiles among banks and financial holding companies, to account for off-balance sheet exposure, and to minimize disincentives for holding liquid assets. Assets and off-balance sheet items are assigned to broad risk categories, each with appropriate weights. The resulting capital ratios represent capital as a percentage of total risk-weighted assets and off-balance sheet items. At
December 31, 2018
, our CET1, tier 1 and
11
total capital ratios under these guidelines were
9.2%
,
9.6%
and
11.5%
, respectively. At
December 31, 2018
, we had $296.5 million of capital securities and subordinated debt that qualified as tier 2 capital.
In addition, the FRB has established minimum leverage ratio guidelines for bank holding companies. These guidelines currently provide for a minimum ratio of tier 1 capital to average total assets, less goodwill and certain other intangible assets (the leverage ratio), of 4.0% for bank holding companies that meet certain specified criteria, including the highest regulatory rating. The guidelines also provide that bank holding companies experiencing internal growth or making acquisitions will be expected to maintain strong capital positions substantially above the minimum supervisory levels without significant reliance on intangible assets. Our leverage ratio at
December 31, 2018
was
7.9%
.
Increased Capital Standards and Enhanced Supervision
The Dodd-Frank Act’s regulatory capital requirements are intended to ensure that “financial institutions hold sufficient capital to absorb losses during future periods of financial distress” and requires the federal banking agencies to establish minimum leverage and risk-based capital requirements on a consolidated basis for insured depository institutions, their holding companies and non-bank financial companies that have been determined to be systemically important by the FSOC.
Basel III Capital Rules
In July 2013, FNB’s and FNBPA’s primary federal regulator, the FRB, published Basel III establishing a new comprehensive capital framework for U.S. banking organizations. The rules implement the Basel Committee’s December 2010 framework for strengthening international capital standards as well as certain provisions of the Dodd-Frank Act. Basel III substantially revised the risk-based capital requirements applicable to bank holding companies and depository institutions, including FNB and FNBPA, compared to the then-existing U.S. risk-based capital rules. Basel III defines the components of capital and addresses other issues affecting the numerator in banking institutions’ regulatory capital ratios. Basel III also addresses risk weights and other issues affecting the denominator in a banking institution’s regulatory capital ratios.
Basel III, among other things, (i) introduces the concept of CET1, (ii) specifies that tier 1 capital consists of CET1 and “Additional Tier 1” capital instruments meeting specified requirements, (iii) defines CET1 narrowly by requiring that most deductions/adjustments to regulatory capital measures be made to CET1 and not to the other components of capital and (iv) expands the scope of the deductions/adjustments as compared to existing regulations.
As fully phased in as of January 1, 2019, Basel III requires FNB and FNBPA to maintain (i) a minimum ratio of CET1 to risk-weighted assets of at least 4.5%, plus a 2.5% “capital conservation buffer” (which is added to the 4.5% CET1 ratio as that buffer is phased in, effectively resulting in a minimum ratio of CET1 to risk-weighted assets of at least 7% upon full implementation), (ii) a minimum ratio of tier 1 capital to risk-weighted assets of at least 6.0%, plus the capital conservation buffer (which is added to the 6.0% tier 1 capital ratio as that buffer is phased in, effectively resulting in a minimum tier 1 capital ratio of 8.5% upon full implementation), (iii) a minimum ratio of total capital (that is, tier 1 plus tier 2) to risk-weighted assets of at least 8.0%, plus the capital conservation buffer (which is added to the 8.0% total capital ratio as that buffer is phased in, effectively resulting in a minimum total capital ratio of 10.5% upon full implementation) and (iv) a minimum leverage ratio of 4%, calculated as the ratio of tier 1 capital to average quarterly assets (as compared to a prior minimum leverage ratio of 3% for banking organizations that either have the highest supervisory rating or have implemented the appropriate federal regulatory authority’s risk-adjusted measure for market risk).
Under Basel III, the effects of certain accumulated other comprehensive items are not excluded; however, banking organizations which do not use the advanced approach, such as FNB and FNBPA, may make a one-time permanent election to continue to exclude these items. FNB and FNBPA made this election in order to avoid significant variations in the level of capital depending upon the impact of interest rate fluctuations on the fair value of FNB’s available-for-sale securities portfolio. Basel III also precludes certain hybrid securities, such as TPS, as tier 1 capital of bank holding companies, subject to phase-out. TPS no longer included in FNB’s tier 1 capital may nonetheless be included as a component of tier 2 capital on a permanent basis without phase-out.
With respect to FNBPA, Basel III also revises the “prompt corrective action” regulations pursuant to Section 38 of the Federal Deposit Insurance Act, as discussed below under the caption
“Prompt Corrective Action.”
Basel III prescribes a standardized approach for risk weightings that expands the risk-weighting categories from the four Basel I-derived categories (0%, 20%, 50% and 100%) to a much larger and more risk-sensitive number of categories, depending on the nature of the assets, generally ranging from 0% for U.S. government and agency securities, to 600% for certain equity exposures, and resulting in higher risk weights for a variety of asset categories.
12
In addition, Basel III provides more advantageous risk weights for derivatives and repurchase-style transactions cleared through a qualifying central counterparty and increases the scope of eligible guarantors and eligible collateral for purposes of credit risk mitigation. In November 2017, the federal banking agencies adopted a final rule to extend the regulatory capital treatment applicable during 2017 under Basel III for certain items, including regulatory capital deductions, risk weights, and certain minority interest limitations. The relief provided under the final rule applies to banking organizations that are not subject to the capital rules’ advanced approaches, such as FNB. Specifically, the final rule extends the current regulatory capital treatment of MSAs, DTAs arising from temporary differences that could not be realized through net operating loss carrybacks, significant investments in the capital of unconsolidated financial institutions in the form of common stock, non-significant investments in the capital of unconsolidated financial institutions, significant investments in the capital of unconsolidated financial institutions that are not in the form of common stock, and CET1 minority interest, tier 1 minority interest, and total capital minority interest exceeding applicable minority interest limitations. Management believes that, as of
December 31, 2018
, FNB and FNBPA meet all capital adequacy requirements under Basel III on a fully phased-in basis as if such requirements had been in effect.
In October 2017, the federal banking agencies issued a notice of proposed rulemaking on simplifications to Basel III, a majority of which would apply solely to banking organizations that are not subject to the advanced approaches capital rules. Under the proposed rulemaking, non-advanced approaches banking organizations, such as FNB and FNBPA, would apply a simpler regulatory capital treatment for MSAs; certain DTAs; investments in the capital of unconsolidated financial institutions; and capital issued by a consolidated subsidiary of a banking organization and held by third parties. Specifically, the proposed rulemaking would eliminate: (i) the 10 percent CET1 capital deduction threshold that applies individually to MSAs, temporary difference DTAs, and significant investments in the capital of unconsolidated financial institutions in the form of common stock; (ii) the aggregate 15 percent CET1 capital deduction threshold that subsequently applies on a collective basis across such items; (iii) the 10 percent CET1 capital deduction threshold for non-significant investments in the capital of unconsolidated financial institutions; and (iv) the deduction treatment for significant investments in the capital of unconsolidated financial institutions not in the form of common stock. Basel III would no longer have distinct treatments for significant and non-significant investments in the capital of unconsolidated financial institutions, but instead would require that non-advanced approaches banking organizations deduct from CET1 capital any amount of MSAs, temporary difference DTAs, and investments in the capital of unconsolidated financial institutions that individually exceeds 25 percent of CET1 capital. The proposed rulemaking also includes revisions to the treatment of certain acquisition, development, or construction exposures that are designed to address comments regarding the current definition of high volatility commercial real estate exposure under the capital rule’s standardized approach. If these are adopted as proposed, we anticipate a positive impact on our capital ratios.
In December 2017, the Basel Committee on Banking Supervision published the last version of the Basel III accord, generally referred to as “Basel IV.” The Basel Committee stated that a key objective of the revisions incorporated into the framework is to reduce excessive variability of risk-weighted assets, which will be accomplished by enhancing the robustness and risk sensitivity of the standardized approaches for credit risk and operational risk, which will facilitate the comparability of banks’ capital ratios; constraining the use of internally modelled approaches; and complementing the risk-weighted capital ratio with a finalized leverage ratio and a revised and robust capital floor. Leadership of the FRB, OCC, and FDIC, who are tasked with implementing Basel IV, supported the revisions. Although it is uncertain at this time, we anticipate some, if not all, of the Basel IV accord may be incorporated into the regulatory capital requirements framework applicable to FNB and FNBPA.
In June 2016, the FASB issued an accounting standard update, “Financial Instruments-Credit Losses (Topic 326), Measurement of Credit Losses on Financial Instruments,” which replaces the current “incurred loss” model for recognizing credit losses with an “expected loss” model referred to as the CECL model. Under the CECL model, we will be required to present certain financial assets carried at amortized cost, such as loans held for investment and held-to-maturity debt securities, at the net amount expected to be collected. The measurement of expected credit losses is to be based on information about past events, including historical experience, current conditions, and reasonable and supportable forecasts that affect the collectability of the reported amount. On December 21, 2018, the federal banking agencies approved a final rule modifying their regulatory capital rules and providing an option to phase in over a period of three years the day-one regulatory capital effects of the CECL model. The final rule also revises the agencies’ other rules to reflect the update to the accounting standards. The final rule will take effect April 1, 2019. The new CECL standard will become effective for us for fiscal years beginning after December 15, 2019 and for interim periods within those fiscal years. We are currently evaluating the impact the CECL model will have on our Consolidated Financial Statements, but we expect to recognize a one-time cumulative-effect adjustment to our allowance for credit losses as of the beginning of the first reporting period in which we adopt the new standard, consistent with regulatory expectations set forth in interagency guidance issued at the end of 2016. We also expect to incur both transition costs and ongoing costs in developing and implementing the CECL methodology, and that the methodology will result in increased capital costs upon initial adoption as well as over time.
13
Stress Testing
As
part of the regulatory relief provided by the Economic Growth Act, the asset threshold requiring insured depository institutions to conduct and report to their primary federal bank regulators annual company-run stress tests was raised from $10 billion to $250 billion in total consolidated assets and makes the requirement “periodic” rather than annual. The amendments also provide the FRB with discretion to subject bank holding companies with more than $100 billion in total assets to enhanced supervision. Notwithstanding these amendments, the federal banking agencies indicated through interagency guidance that the capital planning and risk management practices of institutions with total assets less than $100 billion would continue to be reviewed through the regular supervisory process. We will continue to monitor and stress test our capital consistent with the safety and soundness expectations of our banking regulators.
Prompt Corrective Action
FDICIA, among other things, classifies insured depository institutions into five capital categories (well-capitalized, adequately capitalized, undercapitalized, significantly undercapitalized and critically undercapitalized) and requires the respective federal regulatory agencies to implement systems for “prompt corrective action” for insured depository institutions that do not meet minimum capital requirements within such categories. FDICIA imposes progressively more restrictive constraints on operations, management and capital distributions, depending on the category in which an institution is classified. Failure to meet the capital guidelines could also subject a banking institution to capital-raising requirements, restrictions on its business and a variety of enforcement remedies, including the termination of deposit insurance by the FDIC, and in certain circumstances the appointment of a conservator or receiver. An “undercapitalized” bank must develop a capital restoration plan and its parent holding company must guarantee that bank’s compliance with the plan. The liability of the parent holding company under any such guarantee is limited to the lesser of five percent of the bank’s assets at the time it became ”undercapitalized” or the amount needed to comply with the plan. Furthermore, in the event of the bankruptcy of the parent holding company, the obligation under such guarantee would take priority over the parent’s general unsecured creditors. In addition, FDICIA requires the various regulatory agencies to prescribe certain non-capital standards for safety and soundness relating generally to operations and management, asset quality and executive compensation and permits regulatory action against a financial institution that does not meet such standards.
The various regulatory agencies have adopted substantially similar regulations that define the five capital categories identified by FDICIA, using the total risk-based capital, tier 1 risk-based capital, CET1 and leverage capital ratios as the relevant capital measures. Such regulations establish various degrees of corrective action to be taken when an institution is considered undercapitalized. Under the regulations, a “well-capitalized” institution must have a CET1 risk-based capital ratio of at least 6.5%, a tier 1 risk-based capital ratio of at least 8.0%, a total risk-based capital ratio of at least 10.0% and a leverage ratio of at least 5.0% and not be subject to a capital directive order. Under these guidelines, FNBPA was considered well-capitalized as of
December 31, 2018
.
When determining the adequacy of an institution’s capital, federal regulators must also take into consideration (a) concentrations of credit risk; (b) interest rate risk (when the interest rate sensitivity of an institution’s assets does not match the sensitivity of its liabilities or its off-balance sheet position) and (c) risks from non-traditional activities, as well as an institution’s ability to manage those risks. This evaluation is made as part of the institution’s regular safety and soundness examination. In addition, any bank with significant trading activity, must incorporate a measure for market risk in their regulatory capital calculations.
Community Reinvestment Act and Fair Lending
The CRA requires depository institutions to assist in meeting the credit needs of their market areas consistent with safe and sound banking practices. Under the CRA, each depository institution is required to help meet the credit needs of its market areas by, among other things, providing credit to and investments in low- and moderate-income individuals and communities. Depository institutions are periodically examined for compliance with the CRA and are assigned ratings. In order for a financial holding company to commence any new activity permitted by the BHC Act, or to acquire any company engaged in any new activity permitted by the BHC Act, each insured depository institution subsidiary of the financial holding company must have received a rating of at least “satisfactory” in its most recent examination under the CRA. In its most recent CRA examination, FNBPA received a “satisfactory” rating. Furthermore, banking regulators take into account CRA ratings when considering approval of a proposed transaction.
Fair lending laws prohibit discrimination in the provision of banking services, and the enforcement of these laws has been an increasing focus for the CFPB, HUD, and other regulators. Fair lending laws include the Equal Credit Opportunity Act and the Fair Housing Act, which outlaw discrimination in credit and residential real estate transactions on the basis of prohibited factors
14
including, among others, race, color, national origin, gender, and religion. A lender may be liable for policies that result in a disparate treatment of or have a disparate impact on a protected class of applicants or borrowers. If a pattern or practice of lending discrimination is alleged by a regulator, then that agency may refer the matter to the U.S. Department of Justice for investigation. In December 2012, the DOJ and CFPB entered into a Memorandum of Understanding under which the agencies have agreed to share information, coordinate investigations and have generally committed to strengthen their coordination efforts. Given recent changes in the enforcement policies and priorities of the DOJ and CFPB, the extent to which such coordination will continue to occur in the near term is uncertain. FNBPA is required to have a fair lending program that is of sufficient scope to monitor the inherent fair lending risk of the institution and that appropriately remediates issues which are identified.
Financial Privacy
In accordance with the GLB Act, federal banking regulators adopted rules that limit the ability of banks and other financial institutions to disclose non-public information about consumers to nonaffiliated third parties. These limitations require disclosure of privacy policies to consumers and, in some circumstances, allow consumers to prevent disclosure of certain personal information to a nonaffiliated third party. The privacy provisions of the GLB Act affect how consumer information is transmitted through diversified financial companies and conveyed to outside vendors.
Cyber Security
The federal banking agencies have adopted guidelines for establishing information security standards and cyber security programs for implementing safeguards under the supervision of a banking organization’s board of directors. These guidelines, along with related regulatory materials, increasingly focus on risk management, processes related to information technology and operational resiliency, and the use of third parties in the provision of financial services. In October 2016, the federal banking agencies issued an advance notice of proposed rulemaking on enhanced cyber security risk-management and resilience standards that would apply to large and interconnected banking organizations and to services provided by third parties to these firms. These enhanced standards would apply only to depository institutions and depository institution holding companies with total consolidated assets of $50 billion or more; however, it is possible that, if these enhanced standards are implemented, the OCC will consider them in connection with the examination and supervision of banks below the $50 billion threshold. The federal banking agencies have not yet taken further action on these proposed standards. The OCC, however, as part of its bank supervision operational plan has prioritized review of national bank’s information security, data protection and third-party risk management, including the extent to which national banks are positioned to assess the evolving cyber-threat environment and maintain resilient defenses against such threats.
In February 2018, the SEC announced interpretive guidance to assist public companies in preparing disclosures about cyber security risks and incidents. The guidance provides the SEC’s views about public companies’ disclosure obligations under existing law with respect to matters involving cyber security risk and incidents. It also addresses the importance of cyber security policies and procedures and the application of disclosure controls and procedures, insider trading prohibitions, and Regulation FD and selective disclosure prohibitions in the cyber security context. FNB has reviewed and assessed the SEC guidance in connection with its business operations.
Anti-Money Laundering Initiatives and the USA PATRIOT Act
A major focus of governmental policy on financial institutions in recent years has been aimed at combating money laundering and terrorist financing. The USA PATRIOT Act of 2001 (USA PATRIOT Act), which amended the Bank Secrecy Act of 1970, substantially broadened the scope of U.S. anti-money laundering laws and regulations by imposing significant new compliance and due diligence obligations, creating new crimes and penalties and expanding the extra-territorial jurisdiction of the U.S. The UST has issued a number of regulations that apply various requirements of the USA PATRIOT Act to financial institutions such as FNBPA. These regulations require financial institutions to maintain appropriate policies, procedures and controls to detect, prevent and report money laundering and terrorist financing and to verify the identity of their customers. In 2016, these regulations were amended, effective May 2018, to include express requirements regarding risk-based procedures for conducting ongoing customer due diligence. Such procedures require banks to take appropriate steps to understand the nature and purpose of customer relationships. In addition, absent an applicable exclusion, banks must identify and verify the identity of the beneficial owners of all legal entity customers at the time a new account is established. The failure of a financial institution to maintain and implement adequate programs to combat money laundering and terrorist financing, or to comply with all of the relevant laws or regulations, could have serious legal, including criminal law enforcement, and reputational consequences for the institution.
15
Office of Foreign Assets Control Regulation
The U.S. has instituted economic sanctions which affect transactions with designated foreign countries, nationals and others. These are typically known as the “OFAC rules” because they are administered by the UST Office of Foreign Assets Control (OFAC). The OFAC-administered sanctions target countries in various ways. Generally, however, they contain one or more of the following elements: (i) restrictions on trade with or investment in a sanctioned country, including prohibitions against direct or indirect imports from and exports to a sanctioned country, and prohibitions on “U.S. persons” engaging in financial transactions which relate to investments in, or providing investment-related advice or assistance to, a sanctioned country; and (ii) a blocking of assets in which the government or specially designated nationals of the sanctioned country have an interest, by prohibiting transfers of property subject to U.S. jurisdiction (including property in the possession or control of U.S. persons). Blocked assets (e.g., property and bank deposits) cannot be paid out, withdrawn, set off or transferred in any manner without a license from OFAC. Failure to comply with these sanctions could have serious legal and reputational consequences for the institution.
Consumer Protection Statutes and Regulations
In addition to the consumer regulations promulgated by the FRB, OCC and state agencies, and the regulations that may be issued by the CFPB pursuant to its authority under the Dodd-Frank Act, FNBPA is subject to various federal consumer protection statutes including the Truth in Lending Act, Truth in Savings Act, Equal Credit Opportunity Act, Fair Housing Act, Real Estate Settlement Procedures Act, Fair Debt Collection Practices Act, Fair Credit Reporting Act, Electronic Fund Transfer Act and Home Mortgage Disclosure Act, and regulations and guidance promulgated thereunder by the CFPB and the federal banking agencies. Among other things, these acts and regulations:
|
•
|
require banks to disclose credit terms in meaningful and consistent ways;
|
|
•
|
prohibit discrimination against an applicant in any consumer or business credit transaction;
|
|
•
|
prohibit discrimination in housing-related lending activities;
|
|
•
|
require banks to collect and report applicant and borrower data regarding loans for home purchases or improvement projects;
|
|
•
|
require lenders to provide borrowers with more detailed information regarding the nature and cost of real estate settlements;
|
|
•
|
prohibit certain lending practices and limit escrow account amounts with respect to real estate transactions;
|
|
•
|
prescribe possible penalties for violations of the requirements of consumer protection statutes and regulations;
|
|
•
|
require prescribed consumer disclosures and the adoption of error resolution procedures and other consumer protection protocols with respect to electronic fund transfers; and
|
|
•
|
prohibit unfair, deceptive or abusive acts and practices in connection with consumer loans, the collection of debt, and the provision of other consumer financial products and services.
|
The CFPB has implemented a series of final consumer protection and disclosure rules related to mortgage loan origination and mortgage loan servicing designed to address the Dodd-Frank Act mortgage lending protections. In particular, the CFPB issued a rule implementing the ability-to-repay and QM provisions of the Truth in Lending Act, as amended by the Dodd-Frank Act (the QM Rule). The ability-to-repay provision requires creditors to make reasonable, good faith determinations that borrowers are able to repay their mortgages before extending the credit based on a number of factors and consideration of financial information about the borrower from reasonably reliable third-party documents. Under the Dodd-Frank Act and the QM Rule, loans meeting the definition of QM are entitled to a presumption that the lender satisfied the ability-to-repay requirements. The presumption is a conclusive presumption/safe harbor for prime loans meeting the QM requirements, and a rebuttable presumption for higher-priced/subprime loans meeting the QM requirements. The definition of a “qualified mortgage” incorporates the statutory requirements, such as not allowing negative amortization or terms longer than 30 years. The QM Rule also adds an explicit maximum 43% debt-to-income ratio for borrowers if the loan is to meet the QM definition, though some mortgages that meet underwriting guidelines of U.S. GSEs, the Federal Housing Administration and the U.S. Department of Veteran Affairs may, for a period not to exceed seven years, meet the QM definition without being subject to the 43% debt-to-income limits. Additionally, regulations governing the servicing of residential mortgages have placed additional requirements on mortgage servicers that often lengthen the process for foreclosing on residential mortgages. The CFPB also adopted integrated disclosure requirements related to mortgage originations under RESPA and TILA and each statute’s implementing regulations. These disclosure requirements became effective in October 2015. The CFPB issued proposed amendments to the requirements in July 2016, which were finalized in July 2017. The CFPB also issued interpretive guidance and updated model disclosure forms in 2017.
As discussed, the CFPB has the authority to take supervisory and enforcement action against banks and other financial services companies under the agency’s jurisdiction that fail to comply with federal consumer financial laws. As an insured depository
16
institution with total assets of more than $10 billion, FNBPA is subject to the CFPB’s supervisory and enforcement authorities. The Dodd-Frank Act also permits states to adopt stricter consumer protection laws and state attorneys general to enforce consumer protection rules issued by the CFPB. We continuously evaluate the impact of the consumer rules issued by the CFPB to determine if they will have any long-term impact on our mortgage loan origination and servicing activities. Compliance with these rules will likely increase our overall regulatory compliance costs and decrease fee income opportunities. The CFPB has historically been active in bringing enforcement actions against banks and other financial institutions to enforce consumer financial laws. The federal financial regulatory agencies, including the OCC and state attorneys general, have also become increasingly active in this area with respect to institutions over which they have jurisdiction. We have incurred and may in the future incur additional costs in complying with these requirements.
Pursuant to the Dodd-Frank Act, the FDIC has backup enforcement authority over a depository institution holding company, such as FNB, if the conduct or threatened conduct (including any acts or omissions) of such holding company poses a risk to the DIF, although such authority may not be used if the holding company is in generally sound condition and does not pose a foreseeable and material risk to the DIF. The Dodd-Frank Act may have a material impact on FNB and FNBPA's operations, particularly through increased compliance costs resulting from possible future consumer and fair lending regulations.
Dividend Restrictions
Our primary source of funds for cash distributions to our stockholders, and funds used to pay principal and interest on our indebtedness, is dividends received from FNBPA. FNBPA is subject to federal laws and regulations governing its ability to pay dividends to FNB, including requirements to maintain capital above regulatory minimums. Under federal law, the amount of dividends that a national bank, such as FNBPA, may pay in a calendar year is dependent on the amount of its net income for the current year combined with its retained net income for the two preceding years. The OCC has the authority to prohibit the payment of dividends by a national bank on the bases that paying dividends that deplete a bank's capital base to an inadequate level would be an unsafe and unsound banking practice and that banking organizations should generally pay dividends only out of current operating earnings. In addition to dividends from FNBPA, other sources of parent company liquidity for FNB include cash and short-term investments, as well as dividends and loan repayments from other subsidiaries.
In addition, the ability of FNB and FNBPA to pay dividends may be affected by the various minimum capital requirements previously described in the
“Capital and Operational Requirements,” “Basel III Capital Rules” and “Stress Testing”
discussions herein, and the capital and non-capital standards established under FDICIA, as described above. The right of FNB, our stockholders and our creditors to participate in any distribution of the assets or earnings of our subsidiaries is further subject to the prior claims of creditors of the respective subsidiaries.
Source of Strength
According to the Dodd-Frank Act and FRB policy, a financial or bank holding company is expected to act as a source of financial strength to each of its subsidiary banks and to commit resources to support each such subsidiary. Consistent with the “source of strength” policy, the FRB has stated that, as a matter of prudent banking, a bank or financial holding company generally should not maintain a rate of cash dividends unless its net income has been sufficient to fully fund the dividends and the prospective rate of earnings retention appears to be consistent with our capital needs, asset quality and overall financial condition. This support may be required at times when the parent holding company may not be able to provide such support.
In addition, if FNBPA was no longer “well-capitalized” and “well-managed” within the meaning of the BHC Act and FRB rules (which take into consideration capital ratios, examination ratings and other factors), the expedited processing of certain types of FRB applications would not be available to us. Moreover, examination ratings of “3” or lower, “unsatisfactory” ratings, capital ratios below well-capitalized levels, regulatory concerns regarding management, controls, assets, operations or other factors can all potentially result in the loss of financial holding company status, practical limitations on the ability of a bank or bank (or financial) holding company to engage in new activities, grow, acquire new businesses, repurchase its stock or pay dividends or continue to conduct existing activities.
Financial Holding Company Status and Activities
Under the BHC Act, an eligible bank holding company may elect to be a “financial holding company” and thereafter may engage in a range of activities that are financial in nature and that were not previously permissible for banks and bank holding companies. FNB is a financial holding company under the BHC Act. The financial holding company may engage directly or through a subsidiary in certain statutorily authorized activities (subject to certain restrictions and limitations imposed by the Dodd-Frank Act). A financial holding company may also engage in any activity that has been determined by rule or order to be financial in nature, incidental to such financial activity, or (with prior FRB approval) complementary to a financial activity and
17
that does not pose substantial risk to the safety and soundness of an institution or to the financial system generally. In addition to these activities, a financial holding company may engage in those activities permissible for a bank holding company that has not elected to be treated as a financial holding company.
For a bank holding company to be eligible for financial holding company status, all of its subsidiary U.S. depository institutions must be “well-capitalized” and “well-managed.” The FRB generally must deny expanded authority to any bank holding company with a subsidiary insured depository institution that received less than a satisfactory rating on its most recent CRA review as of the time it submits its request for financial holding company status. If, after becoming a financial holding company and undertaking activities not permissible for a bank holding company under the BHC Act, the company fails to continue to meet any of the requirements for financial holding company status, the company must enter into an agreement with the FRB to comply with all applicable capital and management requirements. If the company does not return to compliance within 180 days, the FRB may order the company to divest its subsidiary banks or the company may discontinue or divest investments in companies engaged in activities permissible only for a bank holding company that has elected to be treated as a financial holding company.
Activities and Acquisitions
The BHC Act requires a bank or financial holding company to obtain the prior approval of the FRB before:
|
•
|
the company may acquire direct or indirect ownership or control of any voting shares of any bank or savings and loan association, if after such acquisition the bank holding company will directly or indirectly own or control more than five percent of any class of voting securities of the institution;
|
|
•
|
any of the company’s subsidiaries, other than a bank, may acquire all or substantially all of the assets of any bank or savings and loan association; or
|
|
•
|
the company may merge or consolidate with any other bank or financial holding company.
|
The Riegle-Neal Interstate Banking and Branching Efficiency Act of 1994 (Interstate Banking Act) generally permits bank holding companies to acquire banks in any state, and preempts all state laws restricting the ownership by a holding company of banks in more than one state. A bank is subject to any state requirement that the bank has been organized and operating for a minimum period of time and the requirement that the bank holding company, after the proposed transaction, controls no more than 10 percent of the total amount of deposits of insured depository institutions in the U.S. and no more than 30 percent or such lesser or greater amount set by the state law of such deposits in that state. The Interstate Banking Act also permits:
|
•
|
a bank to merge with an out-of-state bank and convert any offices into branches of the resulting bank;
|
|
•
|
a bank to acquire branches from an out-of-state bank; and
|
|
•
|
a bank to establish and operate de novo interstate branches whenever the host state permits de novo branching of its own state-chartered banks.
|
Bank or financial holding companies and banks seeking to engage in mergers authorized by the Interstate Banking Act must be at least adequately capitalized as of the date that the application is filed, and the resulting institution must be well-capitalized and managed upon consummation of the transaction.
Pursuant to the Dodd-Frank Act, national and state-chartered banks may open an initial branch in a state other than its home state (e.g., a host state) by establishing a
de novo
branch at any location in such host state at which a bank chartered in such host state could establish a branch. Applications to establish such branches must still be filed with the appropriate primary federal regulator.
The Change in Bank Control Act prohibits a person, entity or group of persons or entities acting in concert, from acquiring “control” of a bank holding company or bank unless the FRB has been given prior notice and has not objected to the transaction. Under FRB regulations, the acquisition of 10% or more (but less than 25%) of the voting stock of a corporation would, under the circumstances set forth in the regulations, create a rebuttable presumption of acquisition of control of the corporation.
Incentive Compensation
Guidelines adopted by the federal banking agencies pursuant to the Federal Deposit Insurance Act prohibit excessive compensation as an unsafe and unsound practice. The federal banking agencies jointly adopted the Guidance on Sound Incentive Compensation Policies intended to ensure that banking organizations do not undermine the safety and soundness of such organizations by encouraging excessive risk-taking. This guidance, which covers all employees that have the ability to
18
expose the organization to material amounts of risk, either individually or as part of a group, is based upon the key principles that a banking organization’s incentive compensation arrangements should (i) provide employee incentives that appropriately balance risk in a manner that does not encourage employees to expose their organizations to imprudent risk, (ii) be compatible with effective controls and risk management, and (iii) be supported by strong corporate governance, including active and effective oversight by the organization’s board of directors. Monitoring methods and processes used by a banking organization should be commensurate with the size and complexity of the organization and its use of incentive compensation. Any deficiencies in the compensation practices of FNB or its subsidiaries and affiliates could lead to supervisory or enforcement action.
Section 956 of the Dodd-Frank Act required the federal banking agencies and the SEC to establish joint regulations or guidelines prohibiting incentive-based payment arrangements at specified regulated entities, such as FNB, having at least $1 billion in total assets that encourage inappropriate risk-taking by providing an executive officer, employee, director or principal shareholder with excessive compensation, fees, or benefits or that could lead to material financial loss to the entity. In addition, these regulators were required to establish regulations or guidelines requiring enhanced disclosure to regulators of incentive-based compensation arrangements. The federal banking agencies proposed such regulations in April 2011 and issued a second proposed rule in June 2016. The second proposed rule would apply to all banks, among other institutions, with at least $1 billion in average total consolidated assets, for which it would go beyond the Guidance on Sound Incentive Compensation Policies discussed above to prohibit certain types and features of incentive-based compensation arrangements for senior executive officers, require incentive-based compensation arrangements to adhere to certain basic principles to avoid a presumption of encouraging inappropriate risk, require appropriate board or committee oversight, establish minimum recordkeeping and mandate disclosures to the appropriate agency. In addition, institutions with at least $50 billion in average total consolidated assets would be subject to additional compensation-related requirements and prohibitions. The prospects for continued consideration of these proposed rules by the SEC and federal banking agencies are uncertain, but implementation of any final rules is not expected in the near term. Nevertheless, incentive compensation and sales practices, particularly in connection with certain products and services that are viewed as high-risk from a supervisory perspective - such as cross-selling and overdraft services - continue to be priority issues on the examination and supervision agendas of the CFPB and the federal banking agencies.
Securities and Exchange Commission
FNBIA is registered with the SEC as an investment advisor and, therefore, is subject to the requirements of the Investment Advisers Act of 1940 and other applicable SEC regulations. The principal purpose of the regulations applicable to investment advisors is the protection of investment advisory clients and the securities markets, rather than the protection of creditors and stockholders of investment advisors. The regulations applicable to investment advisors cover all aspects of the investment advisory business, including limitations on the ability of investment advisors to charge performance-based or non-refundable fees to clients, record-keeping, operating, marketing and reporting requirements, disclosure requirements, limitations on principal transactions between an advisor or its affiliates and advisory clients, as well as other anti-fraud prohibitions. FNBIA also may be subject to certain state securities laws and regulations.
Additional legislation, changes in or new rules promulgated by the SEC and other federal and state regulatory authorities and self-regulatory organizations or changes in the interpretation or enforcement of existing laws and rules, may directly affect the method of operation and profitability of FNBIA. The profitability of FNBIA could also be affected by rules and regulations that impact the business and financial communities in general, including changes to the laws governing taxation, antitrust regulation, homeland security and electronic commerce.
Under various provisions of the federal and state securities laws, including in particular those applicable to broker-dealers, investment advisors and registered investment companies and their service providers, a determination by a court or regulatory agency that certain violations have occurred at a company or its affiliates can result in a limitation of permitted activities and disqualification to continue to conduct certain activities.
FNBIA also may be required to conduct its business in a manner that complies with rules and regulations promulgated by the U.S. Department of Labor (DOL) under the Employee Retirement Income Security Act of 1974, among others. The principal purpose of these regulations is the protection of clients and ERISA plan and individual retirement account assets and beneficiaries, rather than the protection of stockholders and creditors. Significantly, in June 2018, the U.S. Fifth Circuit Court of Appeals issued a mandate vacating the DOL's "fiduciary rule" and related prohibited transaction exemptions. As a result, although FNBPA may have taken certain measures to comply with the rule on a transitional basis, FNBPA's securities brokerage and investment advisory service and activities will no longer be affected.
19
Separately, in April 2018, pursuant to the study conducted by the SEC that was required by the Dodd-Frank Act, the SEC proposed Regulation Best Interest, which, among other things, requires a broker-dealer to act in the best interest of a retail consumer when making a recommendation of any securities transaction or investment strategy involving securities to such customer. We anticipate the adoption of any new rule by the SEC will require us to review and possibly modify our compliance activities, which may lead to additional costs. In addition, state laws that impose a fiduciary duty also may require monitoring, as well as require that we undertake additional compliance measures.
Standards for Safety and Soundness
The federal banking agencies have adopted the Interagency Guidelines for Establishing Standards for Safety and Soundness (the Guidelines). The Guidelines establish certain safety and soundness standards for all depository institutions. The operational and managerial standards in the Guidelines relate to the following: (1) internal controls and information systems; (2) internal audit systems; (3) loan documentation; (4) credit underwriting; (5) interest rate exposure; (6) asset growth; (7) compensation, fees and benefits; (8) asset quality; and (9) earnings. Rather than providing specific rules, the Guidelines set forth basic compliance considerations and guidance with respect to a depository institution. Failure to meet the standards in the Guidelines, however, could result in a request by the OCC to one of the nationally chartered banks to provide a written compliance plan to demonstrate its efforts to come into compliance with such Guidelines. Failure to provide a plan or to implement a provided plan requires the appropriate federal banking agency to issue an order to the institution requiring compliance.
Insurance Agencies
FNIA is subject to licensing requirements and extensive regulation under the laws of the Commonwealth of Pennsylvania and the various states in which FNIA conducts its insurance agency business. These laws and regulations are primarily for the protection of policyholders. In all jurisdictions, the applicable laws and regulations are subject to amendment or interpretation by regulatory authorities. Generally, those authorities are vested with relatively broad discretion to grant, renew and revoke licenses and approvals and to implement regulations. Licenses may be denied or revoked for various reasons, including for regulatory violations or upon conviction for certain crimes. Possible sanctions that may be imposed for violation of regulations include the suspension of individual employees, limitations on engaging in a particular business for a specified period of time, revocation of licenses, censures and fines.
Penn-Ohio is subject to examination by the Arizona Department of Insurance. Representatives of the Arizona Department of Insurance periodically determine whether Penn-Ohio has maintained required reserves, established adequate deposits under a reinsurance agreement and complied with reporting requirements under the applicable Arizona statutes.
Other Laws and Regulations Pertaining to Banks and Financial Services Companies
FNB, FNBPA and our subsidiaries and affiliates are also subject to a variety of other laws and regulations in addition to those already discussed herein with respect to the operation of our businesses, including but not limited to Expedited Funds Availability (and its implementing Regulation CC), Reserve Requirements (and its implementing Regulation D), Margin Stock Loans (and its implementing Regulation U), Right To Financial Privacy Act, Flood Disaster Protection Act, Homeowners Protection Act, Servicemembers Civil Relief Act, Telephone Consumer Protection Act, CAN-SPAM Act, Children’s Online Privacy Protection Act, and the John Warner National Defense Authorization Act.
In addition, SOX addresses, among other issues, corporate governance, auditing and accounting, executive compensation, and enhanced and timely disclosure of corporate information. As directed by SOX, our Chief Executive Officer and Chief Financial Officer are required to certify that our quarterly and annual reports do not contain any untrue statement of a material fact. The rules adopted by the SEC under SOX have several requirements, including having these officers certify that: they are responsible for establishing, maintaining and regularly evaluating the effectiveness of our internal control over financial reporting; they have made certain disclosures to our auditors and the audit committee of the Board of Directors about our internal control over financial reporting; and they have included information in our quarterly and annual reports about their evaluation and whether there have been changes in our internal control over financial reporting or in other factors that could materially affect internal control over financial reporting.
Governmental Policies
The operations of FNB and our subsidiaries are affected not only by general economic conditions, but also by the policies of various regulatory authorities. In particular, the FRB regulates monetary policy and interest rates in order to influence general
20
economic conditions. These policies have a significant influence on overall growth and distribution of loans, investments and deposits and affect interest rates charged on loans or paid for deposits. FRB monetary policies have had a significant effect on the operating results of all financial institutions in the past and may continue to do so in the future.
In view of changing conditions in the national economy and in money markets, as well as the effect of credit policies by monetary and fiscal authorities, including the FRB, it is difficult to predict the impact of possible future changes in interest rates, deposit levels and loan demand, or their effect on our business and earnings or on the financial condition of our various customers (see discussion under Risk Factors - caption “
We could be adversely affected by changes in the law, especially changes in the regulation of the banking industry
”).
Tax Cuts and Jobs Act of 2017
The TCJA includes a number of provisions that impact FNB, including the following:
Tax Rate
. The TCJA replaced the corporate tax rate of 35% applicable under prior law with a reduced 21% statutory tax rate. Although the reduced tax rate generally should be favorable to us by resulting in increased earnings and capital, it decreased the value of our then-existing DTAs. The effect of remeasuring deferred tax assets due to the reduction in the tax rate was a significant item impacting earnings but is generally not expected to have a substantial adverse impact on our core earnings or capital over the long term.
FDIC Insurance Premiums
. As discussed above, the TCJA prohibits taxpayers with consolidated assets over $50 billion from deducting any FDIC insurance premiums and prohibits taxpayers with consolidated assets between $10 and $50 billion from deducting the portion of their FDIC premiums equal to the ratio, expressed as a percentage, that (i) the taxpayer’s total consolidated assets over $10 billion, as of the close of the taxable year, bears to (ii) $40 billion. As a result, FNBPA’s ability to deduct its FDIC premiums is now limited.
Employee Compensation
. A “publicly held corporation” is not permitted to deduct compensation in excess of $1 million per year paid to certain employees. The TCJA eliminated certain exceptions applicable under prior law for performance-based compensation, such as equity grants and cash bonuses that are paid only on the attainment of performance goals. As a result, our ability to deduct certain compensation paid to our most highly compensated employees is now limited.
Business Asset Expensing
. The TCJA allows taxpayers immediately to expense the entire cost (instead of only 50%, as under prior law) of certain depreciable tangible property and real property improvements acquired and placed in service after September 27, 2017 and before January 1, 2023 (with an additional year for certain property). This 100% “bonus” depreciation is phased down proportionately for property placed in service on or after January 1, 2023 and before January 1, 2027 (with an additional year for certain property).
Interest Expense.
The TCJA limits a taxpayer’s annual deduction of business interest expense to the sum of (i) business interest income and (ii) 30% of “adjusted taxable income,” defined as a business’s taxable income without taking into account business interest income or expense, net operating losses, and, for 2018 through 2021, depreciation, amortization and depletion. Because we generate significant amounts of net interest income, we do not expect to be impacted by this limitation.
The foregoing description of the impact of the TCJA on us should be read in conjunction with our Notes to Consolidated Financial Statements, which is included in Item 8 of this report.
Available Information
We make available through our website at www.fnbcorporation.com, free of charge, our Annual Report on Form 10-K, Quarterly Reports on Form 10-Q and Current Reports on Form 8-K (and amendments to any of the foregoing) as soon as reasonably practicable after such reports are filed with or furnished to the SEC. Information on our website is not incorporated by reference into this document and should not be considered part of this Report. Our common stock is traded on the NYSE under the symbol “FNB”.
21
ITEM 1A. RISK FACTORS
FNB is subject to numerous risks, many of which are inherent to our business. As a financial services organization, we must balance revenue generation and profitability with the risks associated with our business activities. For information about how our risk oversight and management process operates, see Item 7 of this Report, “Management’s Discussion and Analysis of Financial Condition and Results of Operations – Risk Management.” The following discussion highlights specific risks that could affect us and our business, financial condition, results of operations and cash flows. Based on the information currently known, FNB believes that the following information identifies the material risk factors affecting us. The risks and uncertainties we face are not limited to those described below. Additional risks and uncertainties not presently known or that we currently believe to be immaterial may also adversely affect our business.
You should carefully consider each of the following risks and all of the other information set forth in this Report. If any of the following risks and uncertainties develop into actual events or if the circumstances described in the risks and uncertainties occur or continue to occur, these events or circumstances could have a material adverse effect on our business, financial condition, results of operations or cash flows. These events could also have a negative effect on the trading price of our securities.
If we are not able to continue our historical levels of growth, we may not be able to maintain our historical revenue trends.
To achieve our past levels of growth, we have focused on both organic growth and acquisitions. We may not be able to sustain our historical rate of growth or may not be able to grow at all. More specifically, we may not be able to obtain the financing necessary to fund additional growth. Various factors, such as economic conditions and competition, may impede or prohibit the opening of new retail branches. Further, we may be unable to attract and retain experienced bankers, which could adversely affect our internal growth. If we are not able to continue our historical levels of growth, we may not be able to maintain our historical revenue trends.
Our results of operations are significantly affected by the ability of our borrowers to repay their loans.
Lending money is an essential part of the banking business. However, for various reasons, borrowers do not always repay their loans. The risk of non-payment is affected by:
|
•
|
credit risks of a particular borrower;
|
|
•
|
changes in economic conditions that impact certain geographic markets or industries;
|
|
•
|
the duration of the loan; and
|
|
•
|
in the case of a collateralized loan, uncertainties as to the future value of the collateral.
|
Generally, commercial loans and leases present a greater risk of non-payment by a borrower than other types of loans. They typically involve larger loan balances and are particularly sensitive to economic conditions. The borrower’s ability to repay usually depends on the successful operation of its business and income stream. In addition, some of our commercial borrowers have more than one loan outstanding with us, which means that an adverse development with respect to one loan or one credit relationship can expose us to significantly greater risk of loss. In the case of commercial and industrial loans, collateral often consists of accounts receivable, inventory and equipment, which may not yield substantial recovery of principal losses incurred, and is susceptible to deterioration or other loss in advance of liquidation of such collateral. These types of loans, however, have historically driven the growth in our loan portfolio and we intend to continue our lending efforts for commercial and industrial products. At
December 31, 2018
, commercial loans and leases comprised
62.1%
of our loan portfolio and consumer loans comprised
37.9%
of our loan portfolio. Consumer loans typically have shorter terms and lower balances with higher yields compared to real estate mortgage loans, but generally carry higher risks of default. Consumer loan collections are dependent on the borrower’s continuing financial stability, and thus are more likely to be affected by adverse personal circumstances. Furthermore, the application of various federal and state laws, including bankruptcy and insolvency laws, may limit the amount that can be recovered on these loans. For additional information, see the Lending Activity section of “Management’s Discussion and Analysis of Financial Condition and Results of Operations”, which is included in Item 7 of this Report.
Our mortgage banking profitability could be significantly reduced if we are not able to originate and resell a high volume of mortgage loans.
Mortgage banking is generally considered a volatile source of income because it depends largely on the volume of loans we originate and sell in the secondary market. If our originations of mortgage loans decreases, resulting in fewer loans that are available to be sold to investors, this would result in a decrease in mortgage revenues and a corresponding decrease in non-interest income.
22
|
•
|
Mortgage loan production levels are sensitive to changes in economic conditions and activity, strengths or weaknesses in the housing market and interest rate fluctuations. Generally, any sustained period of decreased economic activity or higher interest rates could reduce demand for mortgage loans and refinancings. In addition, our results of operations are affected by the amount of non-interest expense associated with mortgage banking activities, such as salaries and employee benefits, occupancy, equipment and data processing expense and other operating costs. During periods of reduced loan demand, our results of operations may be adversely affected to the extent that we are unable to reduce expenses commensurate with the decline in loan originations.
|
|
•
|
Our ability to originate and resell mortgage loans readily is dependent upon the availability of an active secondary market. GSEs - FHLB, Fannie Mae, Freddie Mac and Ginnie Mae -- account for a substantial portion of the secondary market in residential mortgage loans. Any future changes in laws that significantly affect the activity of these GSEs could, in turn, adversely affect our mortgage banking business. In September 2008, the GSEs were placed into conservatorship by the U.S. government. We cannot predict if, when or how the conservatorship will end, or any associated changes to the business structure and operations of the GSEs that could result. Additionally, there are various proposals to reform the role of the GSEs in the U.S. housing finance market. The extent and timing of any such regulatory reform regarding the housing finance market and the GSEs are uncertain.
|
|
•
|
Future changes to our eligibility to participate in the programs offered by the GSEs and other secondary purchasers, or the loan criteria of the GSEs and other secondary purchasers could also result in a lower volume of corresponding loan originations.
|
Our financial condition and results of operations may be adversely affected by changes in tax rules and regulations, or interpretations.
Our income tax expense has differed from the tax computed at the U.S. federal statutory income tax rate due primarily to discrete items. Unanticipated changes in our tax rates could affect our future results of operations. Our future effective tax rates could be affected by changes in the tax rates in jurisdictions where our income is earned, by changes in or our interpretation of tax rules and regulations in the jurisdictions in which we do business, by unexpected negative changes in business and market conditions that could reduce certain tax benefits, or by changes in the valuation of our deferred tax assets and liabilities. Changes in statutory tax rates or deferred tax assets and liabilities may adversely affect our profitability.
Liquidity risk could impair our ability to fund operations and meet our obligations as they become due.
Our ability to implement our business strategy will depend on our liquidity and ability to obtain funding for loan originations, working capital and other general purposes. Liquidity is needed to fund various obligations, including credit commitments to borrowers, mortgage and other loan originations, withdrawals by depositors, repayment of borrowings, dividends to shareholders, operating expenses and capital expenditures. Liquidity risk is the potential that we will be unable to meet our obligations as they come due, capitalize on growth opportunities as they arise, or pay regular dividends on our common stock because of an inability to liquidate assets or obtain adequate funding on a timely basis, at a reasonable cost and within acceptable risk tolerances. Our preferred sources for funding are deposits and customer repurchase agreements, which are a low cost and stable sources of funding for us. We compete with commercial banks, savings banks and credit unions, as well as non-depository competitors such as mutual funds, securities and brokerage firms and insurance companies, for deposits and customer repurchase agreements. If we are unable to attract and maintain sufficient levels of deposits and customer repurchase agreements to fund our loan growth and liquidity objectives, we may be subject to paying higher funding costs by raising interest rates that are paid on deposits and customer repurchase agreements or cause us to source funds from third-party providers which may be higher cost funding.
Secondary sources of liquidity include principal and interest payments on loans; principal and interest payments on investment securities; sale, maturity and prepayment of investment securities; net cash provided from operations; Federal Home Loan Bank advances and subordinated notes issued through one of our subsidiaries, which are fully and unconditionally guaranteed by us.
Our liquidity and ability to fund and run our business could be materially adversely affected by a variety of conditions and factors, including financial and credit market disruptions and volatility or a lack of market or customer confidence in financial markets in general, which may result in a loss of customer deposits or outflows of cash or collateral and/or ability to access capital markets on favorable terms. Other conditions and factors that could materially adversely affect our liquidity and funding include a lack of market or customer confidence in, or negative news about, us or the financial services industry generally, which could result in a loss of deposits and negatively affect our ability to access the capital markets and to sell or securitize loans or other assets. If we are unable to continue to fund assets through deposits and customer repurchase agreements or access funding sources on favorable terms, or if we suffer an increase in borrowing costs or otherwise fail to manage liquidity effectively, our liquidity, operating margins, financial condition and results of operations may be materially adversely affected.
23
Our financial condition and results of operations could be adversely affected if we must further increase our provision for credit losses or if our allowance for credit losses is not sufficient to absorb actual losses.
There is no precise method of predicting loan losses. We can give no assurance that our allowance for credit losses will be sufficient to absorb actual loan losses. Excess loan losses could have a material adverse effect on our financial condition and results of operations. We attempt to maintain an appropriate allowance for credit losses to provide for estimated losses inherent in our loan portfolio as of the corresponding reporting date based on various assumptions and judgments about the collectability of the loan portfolio. We regularly determine the amount of our allowance for credit losses based upon consideration of several quantitative and qualitative factors including, but not limited to, the following:
|
•
|
a regular review of the quality, mix and size of the overall loan portfolio;
|
|
•
|
historical loan loss experience;
|
|
•
|
evaluation of non-performing loans;
|
|
•
|
geographic or industry concentrations;
|
|
•
|
assessment of economic conditions and their effects on FNB’s existing portfolio;
|
|
•
|
the amount and quality of collateral, including guarantees, securing loans; and
|
|
•
|
geographic or industry economic market conditions.
|
The level of the allowance for credit losses reflects the judgment and estimates of management regarding the amount and timing of future cash flows, current fair value of the underlying collateral and other qualitative risk factors that may affect the loan. Determination of the allowance is inherently subjective and is based on factors that are susceptible to significant change. Continuing deterioration in economic conditions affecting borrowers, new information regarding existing loans, identification of additional problem loans and other factors, both within and outside of our control, may require an increase in the allowance for credit losses. In addition, bank regulatory agencies periodically review our allowance and may require an increase in the provision for credit losses or the recognition of additional loan charge-offs, based on judgments different from those of management. In addition, if charge-offs in future periods exceed the allowance for credit losses, we will need additional provisions to increase the allowance. Any increases in the allowance will result in a decrease in net income and capital and may have a material adverse effect on our financial condition and results of operations. For additional discussion relating to this matter, refer to the Allowance and Provision for Credit Losses section of “Management’s Discussion and Analysis of Financial Condition and Results of Operations”, which is included in Item 7 of this Report.
Changes in economic conditions and the composition of our loan portfolio could lead to higher loan charge-offs or an increase in our provision for credit losses and may reduce our net income.
Changes in national and regional economic conditions, and in large metropolitan areas within our market, continue to impact our loan portfolios. For example, an increase in unemployment, a decrease in real estate values or changes in interest rates, as well as other factors, could weaken the economies of the communities we serve. Weakness in the market areas served by FNB could depress our earnings and consequently our financial condition because customers may not want or need our products or services; borrowers may not be able to repay their loans; the value of the collateral securing our loans to borrowers may decline; and the quality of our loan portfolio may decline. Any of the latter three scenarios could require us to charge-off a higher percentage of our loans and/or increase our provision for credit losses, which would reduce our net income.
Our business and financial performance is impacted significantly by market rates and changes in those rates. The monetary, tax and other policies of governmental agencies, including the UST and the FRB, have a direct impact on interest rates and overall financial market performance over which we have no control and which may not be able to be predicted with reasonable accuracy.
As a result of the high percentage of our assets and liabilities that are in the form of interest-bearing or interest-related instruments, changes in interest rates, in the shape of the yield curve or in spreads between different market interest rates can have a material effect on our business, profitability and the value of our financial assets and liabilities. Such scenarios may include the following:
|
•
|
changes in interest rates or interest rate spreads can affect the difference between the interest that FNBPA can earn on assets and the interest that FNBPA may pay on liabilities, which impacts FNBPA’s overall net interest income and profitability;
|
|
•
|
such changes can affect the ability of borrowers to meet obligations under variable or adjustable rate loans and other debt instruments and can, in turn, affect our loss rates on those assets;
|
|
•
|
such changes may decrease the demand for interest rate-based products or services, including bank loans and deposit products and the subordinated notes offered by our subsidiary, FNB Financial Services, LP;
|
24
|
•
|
such changes can also affect our ability to hedge various forms of market and interest rate risks and may decrease the profitability or increase the risk associated with such hedges; and
|
|
•
|
movements in interest rates also affect mortgage repayment speeds and could result in impairments of mortgage servicing assets or otherwise affect the profitability of such assets.
|
The monetary, tax and other policies of the U.S. Government and its agencies also have a significant impact on interest rates and overall financial market performance. An important function of the FRB is to regulate the national supply of bank credit and certain interest rates. The actions of the FRB influence the rates of interest that FNBPA may charge on loans and what FNBPA may pay on borrowings and interest-bearing deposits and can also affect the value of FNB’s and FNBPA’s on-balance sheet and off-balance sheet financial instruments. Principally due to the impact of rates and by controlling access to direct funding from the FRB, the FRB’s policies also influence to a significant extent, FNBPA’s cost of funding. We cannot predict the nature or timing of future changes in monetary, fiscal, tax and other policies or the effects that may be implemented by the new Administration and that they may have on FNBPA’s and other affiliates’ activities and financial results.
Interest rates on our outstanding financial instruments might be subject to change based on developments related to LIBOR, which could adversely affect revenue, expenses, and the value of those financial instruments
In July 2017, the United Kingdom’s Financial Conduct Authority (the authority that regulates LIBOR) announced it intends to stop compelling banks to submit rates for the calculation of LIBOR after 2021. The Alternative Reference Rates Committee (ARRC), a committee of U.S. financial market participants, has proposed the Secured Overnight Financing Rate (SOFR) as the rate that represents best practice as the alternative to LIBOR for use in derivatives and other financial contracts that are currently indexed to USD-LIBOR. ARRC has proposed a paced market transition plan to SOFR from LIBOR and organizations are currently working on industry-wide and company-specific transition plans as it relates to derivatives and cash markets exposed to LIBOR. We have a significant number of obligations, loans, deposits, derivatives, and other financial instrument contracts that are indexed to LIBOR and are actively monitoring this activity and evaluating the related risks. The market transition away from LIBOR to an alternative reference rate, including SOFR, is complex and could have a range of adverse effects on our business, financial condition and results of operations. In particular, any such transition could:
|
•
|
adversely affect the interest rates paid or received on, and the revenue and expenses associate with, our floating rate obligations, loans, deposits, derivatives, and other financial instruments tied to LIBOR rates, or other securities or financial arrangements given LIBOR’s role in determining market interest rates globally;
|
|
•
|
adversely affect the value of our floating rate obligations, loans, deposits, derivatives, and other financial instruments tied to LIBOR rates, or other securities or financial arrangements given LIBOR’s role in determining market interest rates globally;
|
|
•
|
prompt inquiries or other actions from regulators in respect of our preparation and readiness for the replacement of LIBOR with an alternative reference rate;
|
|
•
|
result in disputes, litigation or other actions with counterparties regarding the interpretation and enforceability of certain fallback language in LIBOR-based securities; and
|
|
•
|
require the transition to, or development of, appropriate systems and analytics to effectively transition our risk management processes from LIBOR-based products to those based on the applicable alternative pricing benchmark, such as SOFR.
|
The impact of this transition, as well as the effect of these developments on our funding costs, loan and investment securities portfolios, asset-liability management, and business, is uncertain.
The financial soundness of other financial institutions may adversely affect FNB, FNBPA and other affiliates.
Financial institutions are interrelated as a result of trading, clearing, counterparty and other relationships. FNB, FNBPA and other affiliates are exposed to many different industries and counterparties and they routinely execute transactions with counterparties in the financial services industry, including brokers and dealers, commercial banks, investment banks and other institutional clients. Many of these types of transactions expose FNB, FNBPA and other affiliates to credit risk in the event of default of the counterparty or client. In addition, FNBPA and other affiliates’ credit risks may be exacerbated when the collateral held by us cannot be realized or is liquidated at prices that are not sufficient to recover the full amount of the loan or derivative exposure that we are due.
There may be risks resulting from the extensive use of models in our business.
We rely on quantitative models to measure risks and to estimate certain financial values. Models may be used in such processes as determining the pricing of various products, developing presentations made to market analysts and others, creating loans and
25
extending credit, measuring interest rate and other market risks, predicting losses, assessing capital adequacy, testing, developing strategic planning initiatives, capital stress testing and calculating regulatory capital levels, as well as to estimate the value of financial instruments and Balance Sheet items. Poorly designed or implemented models present the risk that our business decisions based on information incorporating models will be adversely affected due to the inadequacy of such information. Also, information we provide to the public or to our regulators based on poorly designed or implemented models could be inaccurate or misleading. Certain decisions that the regulators make, including those related to capital distributions and dividends to our stockholders, could be adversely affected due to the regulator’s perception that the quality of the models used to generate our relevant information is insufficient.
Our asset valuations may include methodologies, estimations and assumptions that are subject to differing interpretations and this, along with market factors such as volatility in one or more markets or industries, could result in changes to asset valuations that may materially adversely affect our results of operations or financial condition.
We must use estimates, assumptions and judgments when assets are measured and reported at fair value. Assets carried at fair value inherently result in a higher degree of financial statement volatility. Because the assets are carried at fair value, a decline in their value may cause us to incur losses even if the assets in question present minimal risk. Fair values and information used to record valuation adjustments for certain assets and liabilities are based on quoted market prices and/or other observable inputs provided by independent third-party resources, when available. When such third-party information is not available, we estimate fair value primarily by using cash flow and other financial modeling techniques utilizing assumptions such as credit quality, liquidity, interest rates and other relative inputs. Changes in underlying factors or assumptions in any of the areas underlying these estimates could materially impact our future financial condition and results of operations.
During periods of market disruption, including periods of significantly rising or high interest rates, rapidly widening credit spreads or illiquidity, it may be more difficult to value certain assets if trading becomes less frequent and/or market data becomes less observable. There may be certain asset classes that were historically in active markets with significant observable data that rapidly become illiquid due to market volatility, a loss in market confidence or other factors. In such cases, valuations in certain asset classes may require more subjectivity and management discretion; valuations may include inputs and assumptions that are less observable or require greater estimation. Further, rapidly changing and unprecedented market conditions in any particular market (e.g., credit, equity, fixed income) could materially impact the valuation of assets as reported within our Consolidated Financial Statements, and the period-to-period changes in value could vary significantly.
We may be required to record future impairment charges if the declines in asset values are considered other-than-temporary. If the impairment charges are significant enough, they could affect the ability of FNBPA to pay dividends to FNB (which could have a material adverse effect on our liquidity and our ability to pay dividends to stockholders), and could also negatively impact our regulatory capital ratios and result in FNBPA not being classified as “well-capitalized” for regulatory purposes.
We are subject to operational risk that could damage our reputation and our business. We engage in a variety of businesses in diverse markets and rely on systems, employees, service providers and counterparties to properly process a high volume of transactions.
Like all businesses, we are subject to operational risk, which represents the risk of loss resulting from inadequate or failed internal processes in our systems, human error and external events. Operational risk also encompasses technology, compliance and legal risk, which is the risk of loss from violations of, or noncompliance with, rules, regulations, prescribed practices or ethical standards, as well as the risk of FNB’s and our subsidiaries’ noncompliance with contractual and other obligations. Many strategic initiatives, such as development of new products, product enhancements, use of technology, staffing reductions, changes in business processes and acquisitions of other financial services companies or their assets, could substantially increase operational risk. We are also exposed to operational risk through our outsourcing arrangements, and the effect the changes in circumstances or capabilities of FNB’s outsourcing vendors can have on our ability to continue to perform operational functions necessary to FNB’s business. We outsource certain data processing and online and mobile banking services to third-party providers. Those third-party providers could also be sources of operational and information security risk to FNB, including from breakdowns or failures of their own systems or capacity constraints. Although we take steps to mitigate operational risks through a system of internal controls which we review on a regular basis and update as required, no system of controls - however well designed and maintained - is infallible, and, to the extent the risks arise from the operations of third-party vendors or customers, we have limited ability to control those risks. Control weaknesses or failures or other operational risk could result in charges, increased operational costs, harm to our reputation, inability to secure insurance, civil litigation, regulatory intervention, including enforcement action and enhanced supervisory scrutiny, foregone business opportunities, the loss of customer business, especially if customers are discouraged from using our mobile bill pay, mobile banking and online banking services, or the unauthorized release, gathering, monitoring, misuse, loss or destruction of proprietary information.
26
Our business could be adversely affected by difficult economic conditions in the regions in which we operate.
We operate in seven states and the District of Columbia. Our market coverage spans several major metropolitan areas including: Pittsburgh, Pennsylvania; Baltimore, Maryland; Cleveland, Ohio; and Charlotte, Raleigh, Durham and the Piedmont Triad (Winston-Salem, Greensboro and High Point) in North Carolina. Most of our customers are individuals and small- and medium-sized businesses that are dependent upon their regional economies. The economic conditions in these local markets may be different from, and in some instances worse than, economic conditions in the United States as a whole. Difficult economic and employment conditions in the market areas FNB serves could result in the following consequences, any of which could have a material adverse effect on our business, financial condition and results of operations:
|
•
|
demand for our loans, deposits and services may decline;
|
|
•
|
loan delinquencies, problem assets and foreclosures may increase;
|
|
•
|
weak economic conditions could limit the demand for loans by creditworthy borrowers, limiting our capacity to leverage our retail deposits and maintain our net interest income;
|
|
•
|
collateral for our loans may decline in value; and
|
|
•
|
the amount of our low-cost or non-interest-bearing deposits may decrease.
|
Our financial condition and results of operations may be adversely affected by changes in accounting policies, standards and interpretations.
The FASB, regulatory agencies and other bodies that establish accounting standards periodically change the financial accounting and reporting standards governing the preparation of our financial statements. Additionally, those bodies that establish and interpret the accounting standards (such as the FASB, SEC and banking regulators) may change prior interpretations or positions on how these standards should be applied. Changes resulting from these new standards may result in materially different financial results and may require that we change how we process, analyze and report financial information and that we change financial reporting controls.
Significant guidance issued in 2016 was FASB ASU 2016-13,
Financial Instruments – Credit Losses (Topic 326)
, commonly referred to as “CECL,” which introduced new guidance for the accounting for credit losses on instruments within its scope. CECL requires loss estimates for the remaining estimated life of the financial asset using historical experience, current conditions, and reasonable and supportable forecasts. It also modifies the impairment model for debt securities AFS and provides for a simplified accounting model for purchased financial assets with credit deterioration since their origination. The impact of CECL will be dependent on the portfolio composition, credit quality and economic conditions at the time of adoption. For further information regarding new or updated standards, see Note 2, “New Accounting Standards” of the Notes to Consolidated Financial Statements.
Changes in the federal, state or local tax laws may negatively impact our financial performance.
We are subject to legislative tax rate changes that could increase our effective tax rates. Depending on enactment dates, these law changes may be retroactive to previous periods and as a result could negatively affect our current and future financial performance. For example, the TCJA resulted in a reduction in our corporate tax rate to 21% beginning in 2018, which has a favorable impact on our earnings and capital generation abilities. However, as a result of the lower corporate tax rate we recorded income tax provision of $54.0 million in the fourth quarter of 2017 as we were required under GAAP to remeasure our deferred tax assets and liabilities at the enacted rate. In addition, the TCJA also enacted limitations on certain deductions, such as the deduction of FDIC deposit insurance premiums, which will partially offset the anticipated increase in net earnings from the lower tax rate. The impact of the TCJA may differ from the foregoing, possibly materially, due to changes in interpretations or in assumptions that we have made, guidance or regulations that may be promulgated, and other actions that we may take as a result of the TCJA. Similarly, FNB’s customers are likely to experience varying effects from both the individual and business tax provisions of the TCJA and such effects, whether positive or negative, may have a corresponding impact on our business and the economy as a whole.
We could be adversely affected by changes in the law, especially changes in the regulation of the banking industry.
We operate in a highly regulated environment and our businesses are subject to supervision and regulation by several governmental agencies, including the SEC, FRB, OCC, CFPB, FDIC, FSOC, DOJ, UST, SEC, FINRA, HUD and state attorneys general and banking, financial services, and securities regulators. Regulations are generally intended to provide protection for depositors, borrowers and other customers, as well as the stability of the financial services industry, rather than for investors in our securities. We are subject to changes in federal and state law, regulations, governmental policies, agency supervisory and enforcement policies and priorities, and tax laws and accounting principles. Changes in regulations or the
27
regulatory environment could adversely affect the banking and financial services industry as a whole and could limit our growth and the return to investors by restricting such activities as, for example:
|
•
|
the payment of dividends and stock repurchases;
|
|
•
|
mergers with or acquisitions of other institutions or branches;
|
|
•
|
Balance Sheet growth;
|
|
•
|
investments;
|
|
•
|
loans and interest rates;
|
|
•
|
assessments of fees, such as overdraft and electronic transfer interchange fees;
|
|
•
|
the provision of securities, insurance, brokerage or trust services;
|
|
•
|
the types of non-deposit activities in which our subsidiaries may engage; and
|
|
•
|
offering of new products and services.
|
Under regulatory capital adequacy guidelines and other regulatory requirements, FNB and FNBPA must meet guidelines subject to qualitative judgments by regulators about components, risk weightings and other factors. From time to time, the regulators implement changes to those regulatory capital adequacy guidelines. Changes resulting from the Dodd-Frank Act and the regulatory accords on international banking institutions formulated by the Basel Committee on banking supervision and implemented by the FRB, when fully phased in, will likely require FNB to satisfy additional, more stringent and complex capital adequacy standards (see discussion under Business – Government Supervision and Regulation – caption “
Basel III Capital Rules”
). Changes to present capital and liquidity requirements could restrict our activities and require us to maintain additional capital. Compliance with heightened capital standards may reduce our ability to generate or originate revenue-producing assets and thereby restrict revenue generation from banking and non-banking operations. If we fail to meet these minimum capital guidelines and other regulatory requirements, our financial condition would be materially and adversely affected.
Although significant changes to existing laws, regulations and policies may be finalized by Congress and/or the federal banking agencies and the CFPB, it is difficult to predict with precision the changes that will be implemented into law and when such changes may occur. Accordingly, the impact of any legislative or regulatory changes on our competitors and on the financial services industry as a whole cannot be determined at this time. In any event, the laws and regulations to which we are subject are constantly under review by Congress, federal regulatory agencies, and state authorities. These laws and regulations could be changed drastically in the future, which could affect our profitability, our ability to compete effectively, or the composition of the financial services industry in which we compete.
The financial services industry is experiencing leadership changes at the federal banking agencies, which may impact regulations and government policies applicable to us.
As a result of the change of Administration and the current constitution and recent actions of Congress, it is possible that certain aspects of the existing banking and financial services regulatory framework, as amended by the Dodd-Frank Act, will be repealed or modified in the near-term. For example, the President, senior members of the Administration, and senior members of Congress have advocated for substantial changes to the Dodd-Frank Act and other federal banking laws and regulations. Moreover, the federal banking agencies are presently experiencing leadership changes which could impact the supervision, enforcement and rulemaking policies of such agencies. In 2017 and early 2018, Congress confirmed a new Chairman of the FRB, a new Comptroller of the Currency and a new Vice Chairman for Supervision at the FRB, a new Chairwoman of the FDIC and a new Director of the CFPB. Consistent with the views of the Administration and Congress, certain members of this new leadership group have advocated for a reduction in financial services regulation, supervision and enforcement. Moreover, the senior staffs of these agencies charged with carrying out agency policies and responsibilities have experienced significant turnover as a result of these changes. Consequently, certain new regulatory initiatives may be delayed or suspended and existing regulations may be re-evaluated, modified or repealed. At this time, however, the full impact of these and other pending leadership changes, as well as the potential impact to financial services regulation to result from such changes, is uncertain. It is also difficult to predict the impact that any legislative or regulatory changes will have on our competitors and on the financial services industry as a whole. Our results of operations also could be adversely affected by changes in the way in which existing statutes, regulations, and laws are interpreted or applied by courts and government agencies.
Increases in or required prepayments of FDIC insurance premiums may adversely affect our earnings.
In order to maintain a strong funding position and restore reserve ratios of the DIF, the FDIC has increased assessment rates of insured institutions. Pursuant to the Dodd-Frank Act, the minimum reserve ratio for the DIF was increased from 1.15% to 1.35% of estimated insured deposits, or the assessment base, and the FDIC was directed to take the steps needed to cause the reserve ratio of the DIF to reach 1.35% of estimated insured deposits by September 30, 2020. The DIF achieved this level in the
28
third quarter of 2018. As part of its long-range management plan to ensure that the DIF is able to maintain a positive balance despite banking crises and steady, moderate assessment rates despite economic and credit cycles, the FDIC set the DIF’s designated reserve ratio at 2% of estimated insured deposits. The FDIC is required to offset the effect of the increased minimum reserve ratio for banks with assets of less than $10 billion, so smaller community banks will be spared the cost of funding the increase in the minimum reserve ratio. Moreover, as a result of the TCJA’s disallowance of the deduction of FDIC deposit insurance premium payments for certain banking organizations, the after-tax cost of our deposit insurance premium payments is anticipated to increase.
We generally have limited ability to control the amount of premiums that we are required to pay for FDIC insurance. Any future increases in or required prepayments of FDIC insurance premiums may adversely affect our financial condition and results of operations. In light of our recent increase in the assessment rates, the potential for additional increases, and our status as a large bank, FNBPA may be required to pay additional amounts to the DIF, which could have an adverse effect on our earnings. If FNBPA’s deposit insurance premium assessment rate increases again, either because of our risk classification, a change in the concentration of our loan portfolio, emergency assessments, or because of another uniform increase, our earnings could be further adversely impacted.
An interruption in or breach in security of our information systems, or other cyber security risks, could result in a loss of customer business, increased compliance and remediation costs, civil litigation or governmental regulatory action, and have an adverse effect on our results of operations, financial condition and cash flows.
As part of our business, we collect, process and retain sensitive and confidential client and customer information in both paper and electronic form and rely heavily on communications and information systems for these functions. This information includes non-public, personally-identifiable information that is protected under applicable federal and state laws and regulations. Additionally, certain of these data processing functions are not handled by us directly, but are outsourced to third-party providers. We devote significant resources and management focus to ensuring the confidentiality, integrity and availability of our systems, including adoption of policies and procedures that involve our third-party providers to prevent, detect and deter cyber-related crimes intended to infiltrate our networks, capture sensitive client and customer information, deny service to customers, or harm electronic processing capabilities and be ready to respond, if necessary. Despite these efforts, our facilities and systems, and those of our third-party service providers, may be vulnerable to security breaches, acts of vandalism and other physical security threats, computer viruses or compromises, ransomware attacks, misplaced or lost data, programming and/or human errors or other similar events. Any security breach involving the misappropriation, loss or other unauthorized disclosure of our confidential business, employee or customer information, whether originating with us, our vendors or retail businesses, could severely damage our reputation, expose us to the risks of civil litigation and liability, require the payment of regulatory fines or penalties or undertaking of costly remediation efforts with respect to third parties affected by a security breach, disrupt our operations, and have a material adverse effect on our business, financial condition and results of operations.
The additional cost of our day-to-day cyber security monitoring and protection systems and controls includes the cost of hardware and software, third-party technology providers, consulting and forensic testing firms, insurance premium costs and legal fees, in addition to the incremental cost of our personnel who focus a substantial portion of their responsibilities on cyber security. We may also need to expend substantial resources to comply with the data security breach notification requirements adopted by banking regulators and the states, which have varying levels of individual, consumer, regulatory or law enforcement notification and remediation requirements in certain circumstances in the event of a security breach.
Cyber security risks appear to be growing and, as a result, the cyber-resilience of banking organizations is of increased importance to federal and state banking agencies and other regulators. New or revised laws and regulations may significantly impact our current and planned privacy, data protection and information security-related practices, the collection, use, sharing, retention and safeguarding of consumer and employee information, and current or planned business activities. Compliance with current or future privacy, data protection and information security laws to which we are subject could result in higher compliance and technology costs and could restrict our ability to provide certain products and services, which could materially and adversely affect our profitability.
In the last few years, there have been an increasing number of cyber incidents, including several well-publicized cyber-attacks that targeted other U.S. companies, including financial services companies much larger than us. These cyber incidents have been initiated from a variety of sources, including terrorist organizations and hostile foreign governments. As technology advances, the ability to initiate transactions and access data has also become more widely distributed among mobile devices, personal computers, automated teller machines, remote deposit capture sites and similar access points, some of which are not controlled or secured by FNB. It is possible that we could have exposure to liability and suffer losses as a result of a security breach or cyber-attack that occurred through no fault of FNB. Further, the probability of a successful cyber attack against us or
29
one of our third-party services providers cannot be predicted. Although we maintain specific “cyber” insurance coverage, which would apply in the event of various breach scenarios, the amount of coverage may not be adequate in any particular case. In addition, cyber threat scenarios are inherently difficult to predict and can take many forms, several of which may not be covered under our cyber insurance coverage. As cyber threats continue to evolve and increase, we may be required to spend significant additional resources to continue to modify or enhance our protective and preventative measures or to investigate and remediate any information security vulnerabilities.
The banking and financial services industry continually encounters technological change, especially in the systems that are used to deliver products to, and execute transactions on behalf of, customers, and if we fail to continue to invest in technological improvements as they become appropriate or necessary, our ability to compete effectively could be severely impaired.
The banking and financial services industry continually undergoes technological changes, with frequent introductions of new technology-driven products and services. The effective use of technology increases efficiency and enables financial institutions to better serve customers and reduce costs. Our future success will depend, in part, on our ability to address customer needs by using secure technology to provide products and services that will satisfy customer demands, as well as create additional efficiencies in our operations. Many of our competitors have greater resources to invest in technological improvements, and we may not effectively implement new technology-driven products and services or do so as quickly as our competitors. Failure to successfully keep pace with technological change affecting the banking and financial services industry could negatively affect our revenue and profitability.
Our day-to-day operations rely heavily on the proper functioning of products, information systems and services provided by third-party, external vendors.
We rely on certain external vendors to provide products, information systems and services necessary to maintain our day-to-day operations. These third parties provide key components of our business operations such as data processing, recording and monitoring transactions, online banking interfaces and services, Internet connections and network access. While we have selected these third-party vendors carefully and we oversee their provision of service to us in accordance with applicable enterprise risk management and third-party vendor risk management standards and in a manner consistent with the supervisory expectations of our regulators, we cannot control the actions of our third-party vendors entirely. Any complications caused by these third parties, including those resulting from disruptions in communication services provided by a vendor, failure of a vendor to handle current or higher volumes, cyber-attacks and security breaches at a vendor, failure of a vendor to comply with applicable laws and regulations or to conform to our internal controls and risk management procedures, and failure of a vendor to provide services for any reason or poor performance of services, could adversely affect our ability to deliver products and services to our customers and otherwise conduct our business. Financial or operational difficulties of a third-party vendor could also hurt our operations if those difficulties interfere with the vendor’s ability to provide services. Furthermore, our vendors could also be sources of operational and information security risk, including from breakdowns or failures of their own systems or capacity constraints. Replacing these third-party vendors could also create significant delay and expense. Problems caused by external vendors could be disruptive to our operations, which could have a material adverse impact on our business and, in turn, our financial condition and results of operations.
Our failure to continue to recruit and retain qualified banking professionals could adversely affect our ability to compete successfully and affect our profitability.
Our continued success and future growth depends heavily on our ability to attract and retain highly skilled and motivated banking professionals. We compete against many institutions with greater financial resources both within our industry and in other industries to attract these qualified individuals. Our failure to recruit and retain adequate talent could reduce our ability to compete successfully and adversely affect our business and profitability.
Hurricanes, excessive rainfall, droughts or other adverse weather events could negatively affect the local economies in the North Carolina and South Carolina markets, or disrupt our operations in those markets, which could have an adverse effect on our business or results of operations.
The economy of the coastal regions of North Carolina and South Carolina is affected, from time to time, by adverse weather events, particularly hurricanes. Following the completion of the YDKN acquisition, our market area includes the Outer Banks and other portions of coastal North Carolina. Agricultural interests are highly sensitive to excessive rainfall or droughts. We cannot predict whether, or to what extent, damage caused by future weather conditions will affect our operations, customers or the economies in our North Carolina and South Carolina markets. Weather events could cause a disruption in our day-to-day business activities in branches located in coastal communities, a decline in loan originations, destruction or decline in the value
30
of properties securing our loans, or an increase in the risks of delinquencies, foreclosures, and loan losses. Even if a hurricane does not cause any physical damage in our North Carolina and South Carolina market areas, a turbulent hurricane season could significantly affect the market value of all coastal property.
The Small Business Administration lending program is dependent upon the federal government, and we will have specific risks associated with originating SBA loans.
We are an SBA Preferred Lender, and as a result of the YDKN acquisition, we increased our participation in the SBA lending program, which is dependent upon the federal government. SBA Preferred Lenders enable their clients to obtain SBA loans without being subject to the potentially lengthy SBA approval process necessary for lenders that are not SBA Preferred Lenders. The SBA periodically reviews the lending operations of participating lenders to assess, among other things, whether the lender exhibits prudent risk management. When weaknesses are identified, the SBA may request corrective actions or impose enforcement actions, including revocation of the lender’s Preferred Lender status. If we lose our status as a Preferred Lender, we may lose our customers to lenders who are SBA Preferred Lenders, and as a result we could experience a material adverse effect to our financial results. Any changes to the SBA program, including changes to the level of guarantee provided by the federal government on SBA loans, may also have an adverse effect on our business.
Sales of the guaranteed portion of our SBA7(a) loans in the secondary market may earn premium income and/or create a stream of future servicing income. We have not previously operated an SBA lending program similar to YDKN’s. There can be no assurance that we will be able to continue originating these loans, that a secondary market will exist or that we will continue to realize premiums upon the sale of the guaranteed portion of these loans. When the guaranteed portion of our SBA 7(a) loans is sold, we will retain credit risk on the non-guaranteed portion of the loans. We also will share pro-rata with the SBA in any recoveries. If the SBA establishes that a loss on an SBA guaranteed loan is attributable to significant technical deficiencies in the manner in which the loan was originated, funded or serviced by us, the SBA may seek recovery of the principal loss related to the deficiency from us, which could materially adversely affect our results of operations. In certain situations, we may elect to repurchase previously sold portions of SBA 7(a) loans that are delinquent, which may result in higher levels of nonperforming loans.
We could experience significant difficulties and complications in connection with future growth through acquisitions.
We have grown significantly over the last few years, including through acquisitions, and may continue to seek growth by acquiring financial institutions and branches as well as non-depository entities engaged in permissible activities for our financial institution subsidiaries. However, the market for acquisitions is highly competitive. We may not be as successful as we anticipate in identifying financial institutions and branch acquisition candidates, integrating acquired institutions or preventing deposit erosion at acquired institutions or branches. Even if we are successful with this strategy, there can be no assurance that we will be able to manage this growth adequately and profitably. For example, acquiring any bank or non-bank entity will involve risks commonly associated with acquisitions, including:
|
•
|
potential exposure to unknown or contingent liabilities, including fraud, of banks and non-bank entities that we acquire;
|
|
•
|
exposure to potential asset quality issues of acquired banks and non-bank entities due to different underwriting standards that may have been employed by the predecessor entities;
|
|
•
|
potential disruption to our business;
|
|
•
|
potential diversion of the time and attention of our management;
|
|
•
|
the possible loss of key employees and customers of the banks and other businesses that we acquire; and
|
|
•
|
potential dilution of our current stockholders’ ownership to the extent that we issue additional shares of stock to pay for those acquisitions.
|
We may encounter unforeseen expenses, as well as difficulties and complications in integrating expanded operations and new employees without disruption to our overall operations. Following each acquisition, we must expend substantial resources to integrate the entities. The integration of non-banking entities often involves combining different industry cultures and business methodologies. The failure to integrate acquired entities successfully with our existing operations may adversely affect our results of operations and financial condition. As we grow, our regulatory costs also may become more significant.
In addition to acquisitions, we may expand into additional communities or attempt to strengthen our position in our current markets by undertaking additional de novo branch openings. Based on our experience, we believe that it generally takes up to three years for new banking facilities to achieve operational profitability due to the impact of organizational and overhead expenses and the start-up phase of generating loans and deposits. To the extent that we undertake additional de novo branch openings or branch acquisitions, we are likely to continue to experience the effects of higher operating expenses relative to
31
operating income from the new banking facilities, which may have an adverse effect on our net income, earnings per share, return on average stockholders’ equity and return on average assets.
Our growth may require us to raise additional capital in the future, but that capital may not be available when it is needed.
We are required by federal and state regulatory authorities to maintain adequate levels of capital to support our operations (see discussion under “Government Supervision and Regulation” included in Item 1 of this Report). As a financial holding company, we seek to maintain capital sufficient to meet the “well-capitalized” standard set by regulators. We anticipate that our current capital resources will satisfy our capital requirements for the foreseeable future. We may at some point, however, need to raise additional capital to support continued growth, whether such growth occurs organically or through acquisitions.
The availability of additional capital or financing will depend on a variety of factors, many of which are outside of our control, such as market conditions, the general availability of credit, the overall availability of credit to the financial services industry, our credit ratings and credit capacity, marketability of our stock, as well as the possibility that lenders could develop a negative perception of our long- or short-term financial prospects if we incur large credit losses or if the level of business activity decreases due to economic conditions. Accordingly, there can be no assurance of our ability to expand our operations through internal growth or acquisitions. As such, we may be forced to delay raising capital, issue shorter term securities than desired or bear an unattractive cost of capital, which could decrease profitability and significantly reduce financial flexibility. In addition, if we decide to raise additional equity capital, it could be dilutive to our existing stockholders.
Our key assets include our brand and reputation and our business may be affected by how we are perceived in the market place.
Our brand and our reputation are key assets of FNB. Our ability to attract and retain banking, insurance, consumer finance, wealth management and corporate clients and employees is highly dependent upon external perceptions of our level of service, security, trustworthiness, business practices and financial condition. Negative perceptions or publicity regarding these matters could damage our reputation among existing customers and corporate clients and employees, which could make it difficult for us to attract new clients and employees and retain existing ones. Adverse developments with respect to the financial services industry may also, by association, negatively impact our reputation, or result in greater regulatory or legislative scrutiny or litigation against us. Although we monitor developments for areas of potential risk to our reputation and brand, negative perceptions or publicity could materially and adversely affect our revenues and profitability.
We are dependent on dividends from our subsidiaries to meet our financial obligations and pay dividends to stockholders.
We are a holding company and conduct almost all of our operations through our subsidiaries. We do not have any significant assets other than cash and the stock of our subsidiaries. Accordingly, we depend on dividends from our subsidiaries to meet our financial obligations and to pay dividends to stockholders. Our right to participate in any distribution of earnings or assets of our subsidiaries is subject to the prior claims of creditors of such subsidiaries. Under federal law, the amount of dividends that a national bank, such as FNBPA, may pay in a calendar year is dependent on the amount of our net income for the current year combined with our retained net income for the two preceding years. The OCC has the authority to prohibit FNBPA from paying dividends if it determines such payment would be an unsafe and unsound banking practice. Likewise, FNB’s state-based entities are subject to state laws governing dividend practices and payments.
Regulatory authorities may restrict our ability to pay dividends on and repurchase our common stock.
Dividends on our common stock will be payable only if, when and as authorized and declared by our Board of Directors. In addition, banking laws and regulations and our banking regulators may limit our ability to pay dividends and make share repurchases. For example, our ability to make capital distributions, including our ability to pay dividends or repurchase shares of our common stock, is subject to the review and non-objection of our annual capital plan by the FRB. In certain circumstances, we will not be able to make a capital distribution unless the FRB has approved such distribution, including if the dividend could not be fully funded by our net income over the last four quarters (net of dividends paid), our prospective rate of earnings retention appears inconsistent with our capital needs, asset quality, and overall financial condition, or we will not be able to continue meeting minimum required capital ratios. As a bank holding company, we also are required to consult with the FRB before increasing dividends or redeeming or repurchasing capital instruments. Additionally, the FRB could prohibit or limit our payment of dividends if it determines that payment of the dividend would constitute an unsafe or unsound practice. There can be no assurance that we will declare and pay any dividends or repurchase any shares of our common stock in the future.
32
We have outstanding securities senior to the common stock which could limit our ability to pay dividends on our common stock.
We have outstanding TPS and Series E preferred stock that are senior to the common stock and could adversely affect our ability to declare or pay dividends or distributions on our common stock. The terms of the TPS prohibit us from declaring or paying dividends or making distributions on our junior capital stock, including the common stock, or purchasing, acquiring, or making a liquidation payment on any junior capital stock, if: (1) an event of default has occurred and is continuing under the junior subordinated debentures underlying the TPS, (2) we are in default with respect to a guarantee payment under the guarantee of the related TPS or (3) we have given notice of our election to defer interest payments, but the related deferral period has not yet commenced or a deferral period is continuing. We also would be prohibited from paying dividends on our common stock unless all full dividends for the latest dividend period have been declared and paid on all outstanding shares of the Series E preferred stock. If we experience a material deterioration in our financial condition, liquidity, capital, results of operations or risk profile, our regulators may not permit us to make future payments on our TPS or preferred stock, which would also prevent us from paying any dividends on our common stock.
Certain provisions of our Articles of Incorporation and By-laws and Pennsylvania law may discourage takeovers.
Our Articles of Incorporation and By-laws contain certain anti-takeover provisions that may discourage or may make more difficult or expensive a tender offer, change in control or takeover attempt that is opposed by our Board of Directors. In particular, our Articles of Incorporation and By-laws:
|
•
|
require shareholders to give us advance notice to nominate candidates for election to our Board of Directors or to make shareholder proposals at a shareholders’ meeting;
|
|
•
|
permit our Board of Directors to issue, without approval of our common shareholders unless otherwise required by law, preferred stock with such terms as our Board of Directors may determine;
|
|
•
|
require the vote of the holders of at least 75% of our voting shares for shareholder amendments to our By-laws;
|
|
•
|
in the case of a proposed business combination with a shareholder owning 10% or more of the voting shares of FNB, the vote of the holders of at least two-thirds of the voting shares not owned by such shareholder is required to approve the business combination, unless it is approved by a majority of FNB’s disinterested directors.
|
Under Pennsylvania law, only shareholders holding at least 25% of a corporation’s outstanding stock may call a special meeting for any purpose. In addition, Pennsylvania law provides that in discharging their duties, including in the context of a takeover attempt, the board of directors, committees of the board and individual directors may consider a broad range of factors as they deem pertinent, which may include but is not limited to shareholders’ interests, in considering the best interests of the corporation.
These provisions of our Articles of Incorporation and By-laws and of Pennsylvania law could discourage potential acquisition proposals and could delay or prevent a change in control, even though the holders of a majority of our stock may consider such proposals desirable. Such provisions could also make it more difficult for third parties to remove and replace members of our Board of Directors. Moreover, these provisions could diminish the opportunities for shareholders to participate in certain tender offers, including tender offers at prices above the then-current market price of our common stock, and may also inhibit increases in the trading price of our common stock that could result from takeover attempts.
ITEM 1B. UNRESOLVED STAFF COMMENTS
NONE.
ITEM 2. PROPERTIES
Our corporate headquarters are located in Pittsburgh, Pennsylvania. The Pittsburgh headquarters, which are leased, are also occupied by Community Banking, Wealth Management and Insurance employees, as well as customer support and operations personnel. We also lease office space for regional headquarters in the Cleveland, Ohio, Baltimore, Maryland, and Raleigh and Charlotte, North Carolina markets. In Hermitage, Pennsylvania, we continue to maintain administrative offices, as well as offices for Community Banking and Wealth Management personnel, in a six-story office building, and a data processing and technology center in a two-story office building, both of which are owned by us. Additionally, we lease other office space in Harrisburg and Hermitage, Pennsylvania, and in Raleigh, North Carolina which house various support departments.
The operating leases for the Community Banking branches/retail offices expire at various dates through the year 2037 and generally include options to renew. For additional information regarding the lease commitments, see Note 9, “Premises and Equipment” in the Notes to Consolidated Financial Statements, which is included in Item 8 of this Report.
33
Following is a table that shows the branches/retail offices, by state, and the branches/retail offices owned and leased for the Community Banking segment:
|
December 31, 2018
|
Community
Banking |
|
|
Pennsylvania
|
239
|
|
|
Ohio
|
31
|
|
|
Maryland
|
29
|
|
|
West Virginia
|
2
|
|
|
North Carolina
|
92
|
|
|
South Carolina
|
3
|
|
|
Total number of branches/retail offices
|
396
|
|
|
Total branches/retail offices owned
|
224
|
|
|
Total branches/retail offices leased
|
172
|
|
ITEM 3. LEGAL PROCEEDINGS
The Corporation is involved in various pending and threatened legal proceedings in which claims for monetary damages and other relief are asserted. These claims result from ordinary business activities relating to our current and/or former operations. Although the ultimate outcome for any asserted claim cannot be predicted with certainty, we believe that the Corporation has valid defenses for all asserted claims. In accordance with applicable accounting guidance, when a loss is considered probable and reasonably estimable, we, in conjunction with internal and outside counsel handling the matter, record a liability in the amount of our best estimate for the ultimate loss. We continue to monitor the matter for further developments that could affect the amount of the accrued liability that has previously been established.
Litigation expense represents a key area of judgement and is subject to uncertainty and factors outside of our control. Significant judgment is required in making these estimates and our financial liabilities may ultimately be more or less than the current estimate.
The information required by this Item is set forth in the “Other Legal Proceedings” discussion in Note 15, “Commitments, Credit Risk and Contingencies” in the Notes to the Consolidated Financial Statements, which is included in Item 8 of this Report, and which is incorporated herein by reference in response to this Item.
ITEM 4. MINE SAFETY DISCLOSURES
Not Applicable.
34
EXECUTIVE OFFICERS OF THE REGISTRANT
The name, age and principal occupation for each of our executive officers as of January 31, 2019 are set forth below:
|
Name
|
Age
|
Principal Occupation
|
||
|
Vincent J. Delie, Jr.
|
54
|
President and Chief Executive Officer of FNB;
Chief Executive Officer of FNBPA
|
||
|
Vincent J. Calabrese, Jr.
|
56
|
Chief Financial Officer of FNB;
Executive Vice President of FNBPA
|
||
|
Gary L. Guerrieri
|
58
|
Chief Credit Officer of FNB;
Executive Vice President of FNBPA
|
||
|
James G. Orie
|
60
|
Chief Legal Officer and Corporate Secretary of FNB;
Executive Vice President of FNBPA
|
||
|
James L. Dutey
|
45
|
Corporate Controller and Senior Vice President of FNB
|
||
|
Robert M. Moorehead
|
64
|
Chief Wholesale Banking Officer of FNBPA
|
||
|
Barry C. Robinson
|
55
|
Chief Consumer Banking Officer of FNBPA
|
||
There are no family relationships among any of the above executive officers, and there is no arrangement or understanding between any of the above executive officers and any other person pursuant to which he was selected as an officer. The executive officers are elected by our Board of Directors subject in certain cases to the terms of an employment agreement between the officer and us.
PART II.
ITEM 5. MARKET FOR REGISTRANT’S COMMON EQUITY, RELATED STOCKHOLDER MATTERS AND
ISSUER PURCHASES OF EQUITY SECURITIES
Our common stock is listed on the NYSE under the symbol “FNB.” As of January 31, 2019, there were
16,891
holders of record of our common stock.
The information required by this Item 5 with respect to securities authorized for issuance under equity compensation plans is set forth in Part III, Item 12 of this Report.
We did not purchase any of our own equity securities during the fourth quarter of
2018
.
35
STOCK PERFORMANCE GRAPH
Comparison of Total Return on F.N.B. Corporation’s Common Stock with Certain Averages
The following five-year performance graph compares the cumulative total shareholder return (assuming reinvestment of dividends) on our common stock (
t
), the S&P MidCap 400 Index (
n
), KBW NASDAQ Regional Banking Index (
p
), and the Russell 1000 Index (
l
). This stock performance graph assumes $100 was invested on
December 31, 2013
, and the cumulative return is measured as of each subsequent fiscal year end.
F.N.B. Corporation Five-Year Stock Performance
Total Return, Including Stock and Cash Dividends
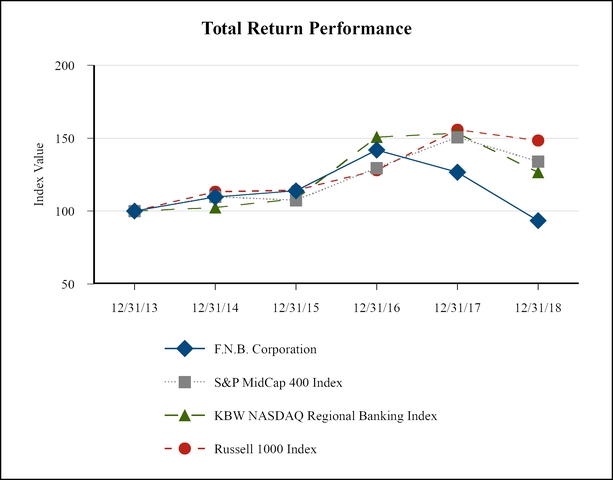
36
ITEM 6. SELECTED FINANCIAL DATA
|
(1)
|
(2)
|
(3)
|
(4)
|
(5)
|
|||||||||||||||
|
Year Ended December 31
|
2018
|
2017
|
2016
|
2015
|
2014
|
||||||||||||||
|
Dollars in millions, except per share data
|
|||||||||||||||||||
|
Total interest income
|
$
|
1,170
|
|
$
|
980
|
|
$
|
679
|
|
$
|
547
|
|
$
|
509
|
|
||||
|
Total interest expense
|
238
|
|
134
|
|
67
|
|
49
|
|
43
|
|
|||||||||
|
Net interest income
|
932
|
|
846
|
|
612
|
|
498
|
|
466
|
|
|||||||||
|
Provision for credit losses
|
61
|
|
61
|
|
56
|
|
40
|
|
39
|
|
|||||||||
|
Total non-interest income
|
276
|
|
252
|
|
201
|
|
162
|
|
158
|
|
|||||||||
|
Total non-interest expense
|
695
|
|
681
|
|
511
|
|
391
|
|
379
|
|
|||||||||
|
Net income
|
373
|
|
199
|
|
171
|
|
160
|
|
144
|
|
|||||||||
|
Net income available to common stockholders
|
365
|
|
191
|
|
163
|
|
152
|
|
136
|
|
|||||||||
|
At Year-End
|
|||||||||||||||||||
|
Total assets
|
$
|
33,102
|
|
$
|
31,418
|
|
$
|
21,845
|
|
$
|
17,558
|
|
$
|
16,127
|
|
||||
|
Net loans
|
21,973
|
|
20,823
|
|
14,739
|
|
12,048
|
|
11,121
|
|
|||||||||
|
Deposits
|
23,455
|
|
22,400
|
|
16,066
|
|
12,623
|
|
11,382
|
|
|||||||||
|
Short-term borrowings
|
4,129
|
|
3,678
|
|
2,503
|
|
2,049
|
|
2,042
|
|
|||||||||
|
Long-term borrowings
|
627
|
|
668
|
|
539
|
|
641
|
|
541
|
|
|||||||||
|
Total stockholders’ equity
|
4,608
|
|
4,409
|
|
2,572
|
|
2,096
|
|
2,021
|
|
|||||||||
|
Per Common Share
|
|||||||||||||||||||
|
Basic earnings per share
|
$
|
1.13
|
|
$
|
0.63
|
|
$
|
0.79
|
|
$
|
0.87
|
|
$
|
0.81
|
|
||||
|
Diluted earnings per share
|
1.12
|
|
0.63
|
|
0.78
|
|
0.86
|
|
0.80
|
|
|||||||||
|
Cash dividends declared
|
0.48
|
|
0.48
|
|
0.48
|
|
0.48
|
|
0.48
|
|
|||||||||
|
Book value
|
13.88
|
|
13.30
|
|
11.68
|
|
11.34
|
|
11.00
|
|
|||||||||
|
Tangible book value (non-GAAP)
(6)
|
6.68
|
|
6.06
|
|
6.53
|
|
6.38
|
|
5.99
|
|
|||||||||
|
Ratios
|
|||||||||||||||||||
|
Return on average assets
|
1.16
|
%
|
0.68
|
%
|
0.83
|
%
|
0.96
|
%
|
0.96
|
%
|
|||||||||
|
Return on average tangible assets (non-GAAP)
(6)
|
1.29
|
|
0.78
|
|
0.91
|
|
1.05
|
|
1.07
|
|
|||||||||
|
Return on average equity
|
8.30
|
|
4.89
|
|
6.84
|
|
7.70
|
|
7.50
|
|
|||||||||
|
Return on average tangible common equity (non-GAAP)
(6)
|
18.41
|
|
10.90
|
|
12.76
|
|
14.33
|
|
14.74
|
|
|||||||||
|
Equity to assets (period-end)
|
13.92
|
|
14.03
|
|
11.77
|
|
11.94
|
|
12.53
|
|
|||||||||
|
Tangible equity to tangible assets (period-end)
(non-GAAP) (6) |
7.39
|
|
7.11
|
|
7.16
|
|
7.35
|
|
7.53
|
|
|||||||||
|
Common equity to assets (period-end)
|
13.60
|
|
13.69
|
|
11.28
|
|
11.33
|
|
11.87
|
|
|||||||||
|
Tangible common equity to tangible assets (period-end) (non-GAAP)
(6)
|
7.05
|
|
6.74
|
|
6.64
|
|
6.71
|
|
6.83
|
|
|||||||||
|
Average equity to average assets
|
13.97
|
|
13.98
|
|
12.09
|
|
12.48
|
|
12.84
|
|
|||||||||
|
Dividend payout ratio
|
42.96
|
|
74.61
|
|
62.43
|
|
55.74
|
|
59.85
|
|
|||||||||
|
(1)
|
On August 31, 2018, we completed the sale of Regency.
|
|
(2)
|
On March 11, 2017, we completed our acquisition of YDKN.
|
|
(3)
|
On April 22, 2016 and February 13, 2016, we completed our purchase of 17 branch-banking locations and related consumer loans from Fifth Third and completed the acquisition of METR, respectively.
|
|
(4)
|
On September 18, 2015, we completed our purchase of five branch-banking locations from Bank of America. On June 22 and July 18, 2015, we, through our wholly owned subsidiary, FNIA, acquired certain insurance-related assets from Pittsburgh-area insurance companies.
|
|
(5)
|
On February 15, 2014 and September 19, 2014, we completed the acquisitions of BCSB and OBA, respectively.
|
|
(6)
|
Refer to the
Reconciliations of Non-GAAP Financial Measures and Key Performance Indicators to GAAP
section in Item 7, “Management’s Discussion and Analysis of Financial Condition and Results of Operations,” of this Report.
|
37
ITEM 7. MANAGEMENT’S DISCUSSION AND ANALYSIS OF FINANCIAL CONDITION AND RESULTS OF
OPERATIONS
MD&A represents an overview of our consolidated results of operations and financial condition. This MD&A should be read in conjunction with the Consolidated Financial Statements and Notes presented in Item 8 of this Report. Results of operations for the periods included in this review are not necessarily indicative of results to be obtained during any future period.
CAUTIONARY STATEMENT REGARDING FORWARD-LOOKING INFORMATION
A number of statements in this Report may contain forward-looking statements within the meaning of the Private Securities Litigation Reform Act of 1995 including our expectations relative to business and financial metrics, our outlook regarding revenues, expenses, earnings. liquidity, asset quality and statements regarding the impact of technology enhancements and customer and business process improvements.
Where we express an expectation or belief as to future events or results, such expectation or belief is expressed in good faith and believed to have a reasonable basis. However, our forward-looking statements are based on current expectations and assumptions that are subject to risk, uncertainties and unforeseen events which may cause actual results to differ materially from future results expressed, projected or implied by these forward-looking statements. All forward-looking statements speak only as of the date they are made and are based on information available at that time. We assume no obligation to update forward-looking statements to reflect circumstances or events that occur after the date the forward-looking statements were made or to reflect the occurrence of unanticipated events except as required by federal securities laws. Further, it is not possible to assess the effect of all risk factors on our business to the extent to which any one risk factor or compilation thereof may cause actual results to differ materially from those contained in any forward-looking statements. As forward-looking statements involve significant risks and uncertainties, caution should be exercised against placing undue reliance on such statements
.
Such forward-looking statements may be expressed in a variety of ways, including the use of future and present tense language expressing expectations or predictions of future financial or business performance or conditions based on current performance and trends. Forward-looking statements are typically identified by words such as, "believe," "plan," "expect," "anticipate," "intend," "outlook," "estimate," "forecast," "will," "should," "project," "goal," and other similar words and expressions. These forward-looking statements involve certain risks and uncertainties. In addition to factors previously disclosed in our reports filed with the SEC, the following factors among others, could cause actual results to differ materially from forward-looking statements or historical performance: changes in asset quality and credit risk; the inability to sustain revenue and earnings growth; changes in interest rates, deposit costs and capital markets; changes or errors in the methodologies, models, assumptions and estimates we use to prepare our financial statements, make business decisions and manage risks; inflation; inability to effectively grow and expand our customer bases; our ability to execute on key priorities, including successful completion of acquisitions and dispositions, business retention, expansion plans, strategic plans and attracting, developing and retaining key executives; potential difficulties encountered in operating in new and remote geographic markets; customer borrowing, repayment, investment and deposit practices; customer disintermediation; the introduction, withdrawal, success and timing of business and technology initiatives; economic conditions in the various regions in which we operate; competitive conditions, including increased competition through internet, mobile banking, fintech, and other non-traditional competitors; the inability to realize cost savings or revenues or to implement integration plans and other consequences associated with acquisitions and divestitures; the inability to originate and re-sell mortgage loans in accordance with business plans; our inability to effectively manage our economic exposure and GAAP earnings exposure to interest rate volatility, including availability of appropriate derivative financial investments needed for interest rate risk management purposes; economic conditions; interruption in or breach of security of our information systems; the failure of third parties and vendors to comply with their obligations to us, including related to care, control, and protection of such information; the evolution of various types of fraud or other criminal behavior to which we are exposed; integrity and functioning of products, information systems and services provided by third-party external vendors; changes in tax rules and regulations or interpretations including, but not limited to, the recently enacted TCJA;
changes in or anticipated impact of, accounting policies, standards and interpretations; ability to maintain adequate liquidity to fund our operations; changes in asset valuations;
the initiation of significant legal or regulatory proceedings against us and the outcome of any significant legal or regulatory proceeding including, but not limited to, actions by federal or state authorities and class action cases, new decisions that result in changes to previously settled law or regulation, and any unexpected court or regulatory rulings; and the impact, extent and timing of technological changes, capital management activities, and other actions of the OCC, the FRB, the CFPB, the FDIC and legislative and regulatory actions and reforms.
The risks identified here are not exclusive. Actual results may differ materially from those expressed or implied as a result of these risks and uncertainties, including, but not limited to, the risk factors and other uncertainties described in this Annual
38
Report on Form 10-K (including MD&A section), our subsequent
2019
Quarterly Reports on Form 10-Q's (including the risk factors and risk management discussions) and our other subsequent filings with the SEC, which are available on our corporate website at https://www.fnb-online.com/about-us/investor-relations-shareholder-services. We have included our web address as an inactive textual reference only. Information on our website is not part of this Report.
APPLICATION OF CRITICAL ACCOUNTING POLICIES
Our Consolidated Financial Statements are prepared in accordance with GAAP. Application of these principles requires management to make estimates, assumptions and judgments that affect the amounts reported in the Consolidated Financial Statements and accompanying Notes. These estimates, assumptions and judgments are based on information available as of the date of the Consolidated Financial Statements; accordingly, as this information changes, the Consolidated Financial Statements could reflect different estimates, assumptions and judgments. Certain policies inherently are based to a greater extent on estimates, assumptions and judgments of management and, as such, have a greater possibility of producing results that could be materially different than originally reported.
The most significant accounting policies followed by FNB are presented in Note 1, “Summary of Significant Accounting Policies” in the Notes to Consolidated Financial Statements, which is included in Item 8 of this Report. These policies, along with the disclosures presented in the Notes to Consolidated Financial Statements, provide information on how we value significant assets and liabilities in the Consolidated Financial Statements, how we determine those values and how we record transactions in the Consolidated Financial Statements.
Management views critical accounting policies to be those which are highly dependent on subjective or complex judgments, estimates and assumptions, and where changes in those estimates and assumptions could have a significant impact on the Consolidated Financial Statements. Management currently views the determination of the allowance for credit losses, accounting for loans acquired in a business combination, fair value of financial instruments, goodwill and other intangible assets, litigation, income taxes and deferred tax assets to be critical accounting policies.
Allowance for Credit Losses
The allowance for credit losses addresses credit losses inherent in the existing loan portfolio and in unfunded loan commitments and standby letters of credit at the Balance Sheet date and is presented as a reserve against loans and other liabilities, respectively, on the Consolidated Balance Sheets.
Management’s assessment of the appropriateness of the allowance for credit losses considers individual impaired loans, pools of homogeneous loans with similar risk characteristics and other risk factors concerning the economic environment. These analyses involve a high degree of judgment in estimating the amount of loss associated with specific impaired loans, including estimating the amount and timing of future cash flows, current fair value of the underlying collateral and other qualitative risk factors that may affect the loan, all of which may be susceptible to significant change. The evaluation of this component of the allowance for credit losses requires considerable judgment in order to reasonably estimate inherent loss exposures.
Loans with similar risk characteristics are categorized into pools based on loan type and by internal risk rating for commercial loans, or payment performance and credit score for consumer loans. There is considerable judgment involved in setting internal commercial risk ratings, including an evaluation of the borrower’s current financial condition and ability to repay the loan. Transition matrices are generated on a monthly basis to determine probabilities of default, while historical loss experience is used to generate loss given default results for the pools. Inherent but undetected losses may arise due to uncertainties in economic conditions, delays in obtaining information, including unfavorable information about a borrower’s financial condition, the difficulty in identifying triggering events that correlate to subsequent loss rates and risk factors that have not yet manifested themselves in loss allocation factors. Uncertainty surrounding the strength and timing of economic cycles also affects estimates of loss. The historical loss experience used in the transition matrices and historical loss experience analysis may not be representative of actual unrealized losses inherent in the portfolio.
Management evaluates the impact of various qualitative factors which pose additional risks that may not be adequately addressed in the analyses described above. Expected loss rates for each loan category may be adjusted for levels of and trends in loan volumes, net charge-offs, delinquency and non-performing loans. In addition, management takes into consideration the impact of changes to lending policies; the experience and depth of lending management and staff; the results of internal loan reviews; concentrations of credit; competition, legal and regulatory risk; market uncertainty and collateral illiquidity; national and local economic trends; or any other common risk factor that might affect loss experience across one or more components of the portfolio. Economic factors influencing management’s estimate of allowance for credit losses include, but are not limited to, uncertainty of the labor markets, industrial presence, commercial real estate activity and residential real estate values. The
39
determination of this qualitative component of the allowance for credit losses is particularly dependent on the judgment of management. To the extent actual outcomes differ from management estimates, additional provisions for credit losses could be required that may affect our earnings or financial position in future periods.
The Provision for Credit Losses section in the Results of Operations includes a discussion of the factors affecting changes in the allowance for credit losses during the current period. See Note 1, “Summary of Significant Accounting Policies” and Note 6, “Loans and Leases” in the Notes to Consolidated Financial Statements for further information on the allowance for credit losses.
Accounting for Loans Acquired in a Business Combination
All loans acquired in a business combination are initially measured at fair value at the date of acquisition. The fair value of loans acquired in a business combination is based on a discounted cash flow methodology that involves assumptions and judgments as to credit risk, default rates, loss severity, collateral values, discount rates, prepayment speeds, prepayment risk and liquidity risk. The measurement of fair value on loans acquired in a business combination prohibits the carryover or establishment of an allowance for loan losses at acquisition date.
Loans acquired in a business combination are considered impaired if there is evidence of credit deterioration since origination and if it is probable at time of acquisition that all contractually required payments will not be collected. The present value of any decreases in expected cash flows after the acquisition date will generally result in an impairment charge recorded as a provision for credit losses.
For acquired non-impaired loans, including revolving loans (lines of credit and credit card loans) and leases that are excluded from acquired impaired loan accounting, the difference between the acquisition date fair value and the contractual amounts due at the acquisition date represents the fair value adjustment. Fair value adjustments may be discounts (or premiums) to a loan’s cost basis and are accreted (or amortized) to interest income over the loan’s remaining life using the level yield method. Subsequent to the acquisition date, the methods utilized to estimate the required allowance for credit losses for these loans is similar to originated loans; however, we record a provision for credit losses only when the required allowance exceeds the remaining fair value adjustment.
These estimates are inherently subjective and can result in significant changes in the cash flow estimates over the life of the loan. To the extent actual outcomes differ from management estimates, the outcome may affect our earnings or financial position in future periods.
See Note 1, “Summary of Significant Accounting Policies” and Note 6, “Loans and Leases” in the Notes to Consolidated Financial Statements for further discussion of accounting for loans acquired in a business combination.
Fair Value of Financial Instruments
We use fair value measurements to record fair value adjustments to certain financial assets and liabilities and determine fair value disclosures. Additionally, from time to time we may be required to record at fair value other assets on a non-recurring basis, such as loans held for sale, certain impaired loans, OREO and certain other assets. The accounting guidance for fair value measurements includes a three-level hierarchy for disclosure of assets and liabilities recorded at fair value based on whether the inputs to the valuation methodology used for measurement are observable or unobservable. Judgement is required to determine which level of the three-level hierarchy certain assets or liabilities measured at fair value are classified.
Fair value represents the price that would be received to sell a financial asset or paid to transfer a financial liability in an orderly transaction between market participants at the measurement date. We use significant and complex estimates, assumptions and judgements when assets and liabilities are required to be recorded at, or adjusted to reflect, fair value. Where available, fair value and information used to record valuation adjustments for certain assets or liabilities is based on either quoted market prices or are provided by independent third-party sources, including appraisers and valuation specialists. When such third-party information is not available, we may estimate fair value by using cash flow and other financial modeling techniques. Our assumptions about what a market participant would use in pricing an asset or liability is developed based on the best information available in the circumstances. These estimates are inherently subjective and can result in significant changes in the fair value estimates over the life of the asset or liability. Assets and liabilities carried at fair value inherently result in a higher degree of financial statement volatility.
See Note 1, “Summary of Significant Accounting Policies” and Note 24, “Fair Value Measurements” in the Notes to Consolidated Financial Statements for further discussion of accounting for financial instruments.
40
Goodwill and Other Intangible Assets
As a result of acquisitions, we have recorded goodwill and other identifiable intangible assets on our Consolidated Balance Sheets. Goodwill represents the cost of acquired companies in excess of the fair value of net assets, including identifiable intangible assets, at the acquisition date. Our recorded goodwill relates to value inherent in our Community Banking, Wealth Management and Insurance segments.
The value of goodwill and other identifiable intangibles is dependent upon our ability to provide quality, cost-effective services in the face of competition. As such, these values are supported ultimately by revenue that is driven by the volume of business transacted. A decline in earnings as a result of a lack of growth or our inability to deliver cost-effective services over sustained periods can lead to impairment in value which could result in additional expense and adversely impact earnings in future periods.
Goodwill and other intangibles are subject to impairment testing at the reporting unit level, which must be conducted at least annually. We perform impairment testing during the fourth quarter of each year, or more frequently if impairment indicators exist. We also continue to monitor other intangibles for impairment and to evaluate carrying amounts, as necessary.
Determining fair values of each reporting unit, of its individual assets and liabilities, and also of other identifiable intangible assets requires considering market information that is publicly available as well as the use of significant estimates and assumptions. These estimates and assumptions could have a significant impact on whether or not an impairment charge is recognized and also the magnitude of any such charge. Inputs used in determining fair values where significant estimates and assumptions are necessary include discounted cash flow calculations, market comparisons and recent transactions, projected future cash flows, discount rates reflecting the risk inherent in future cash flows, long-term growth rates and determination and evaluation of appropriate market comparables.
See Note 1, “Summary of Significant Accounting Policies,” Note 2, “New Accounting Standards” and Note 10, “Goodwill and Other Intangible Assets” in the Notes to Consolidated Financial Statements for further discussion of accounting for goodwill and other intangible assets.
Income Taxes and Deferred Tax Assets
We are subject to the income tax laws of the U.S., the states and other jurisdictions where we conduct business. The laws are complex and subject to different interpretations by the taxpayer and various taxing authorities. In determining the provision for income taxes, management must make judgments and estimates about the application of these inherently complex tax statutes, related regulations and case law. In the process of preparing our tax returns, management attempts to make reasonable interpretations of the tax laws. These interpretations are subject to challenge by the taxing authorities or based on management’s ongoing assessment of the facts and evolving case law.
We determine deferred income taxes using the Balance Sheet method. Under this method, the net DTA or DTL is based on the tax effects of the differences between the book and tax bases of assets and liabilities, and recognizes the effect of enacted changes in tax rates and laws in the period in which they occur. That effect would be included in income from continuing operations in the reporting period that includes the enactment date of the change. See the Results of Operations, Income Taxes section later in this MD&A of Financial Condition for further tax-related discussion.
On a quarterly basis, management assesses the reasonableness of our effective tax rate based on management’s current best estimate of pretax earnings and the applicable taxes for the full year. DTAs and DTLs are assessed on an annual basis, or sooner, if business events or circumstances warrant. Deferred income taxes represent amounts available to reduce income taxes payable on taxable income in future years. Such assets arise because of temporary differences between the financial reporting and tax bases of assets and liabilities, and from operating loss and tax credit carryforwards. We evaluate the recoverability of these future tax deductions and credits by assessing the adequacy of future expected taxable income from all sources, including reversal of taxable temporary differences, forecasted operating earnings and available tax planning strategies.
We establish a valuation allowance when it is more likely than not that we will not be able to realize a benefit from our DTAs, or when future deductibility is uncertain. Periodically, the valuation allowance is reviewed and adjusted based on management’s assessments of realizable DTAs.
See Note 1, “Summary of Significant Accounting Policies” and Note 18, “Income Taxes” in the Notes to Consolidated Financial Statements for further discussion of accounting for income taxes.
41
Litigation Reserves
The Corporation is involved in various pending and threatened legal proceedings in which claims for monetary damages and other relief are asserted. These claims result from ordinary business activities relating to our current and/or former operations. Although the ultimate outcome for any asserted claim cannot be predicted with certainty, we believe that the Corporation has valid defenses for all asserted claims. In accordance with applicable accounting guidance, when a loss is considered probable and reasonably estimable, we, in conjunction with internal and outside counsel handling the matter, record a liability in the amount of our best estimate for the ultimate loss. We continue to monitor the matter for further developments that could affect the amount of the accrued liability that has previously been established.
Litigation expense represents a key area of judgement and is subject to uncertainty and factors outside of our control. Significant judgment is required in making these estimates and our financial liabilities may ultimately be more or less than the current estimate. See the Corporation’s policy on establishing accruals for litigation in Note 15, "Commitments, Credit Risk and Contingencies" in the Notes to Consolidated Financial Statements.
Recent Accounting Pronouncements and Developments
Note 2, “New Accounting Standards” in the Notes to Consolidated Financial Statements, which is included in Item 8 of this Report, discusses new accounting pronouncements adopted by us in
2018
and the expected impact of accounting pronouncements recently issued or proposed but not yet required to be adopted.
USE OF NON-GAAP FINANCIAL MEASURES AND KEY PERFORMANCE INDICATORS
To supplement our Consolidated Financial Statements presented in accordance with GAAP, we use certain non-GAAP financial measures, such as operating net income available to common stockholders, operating earnings per diluted common share, return on average tangible common equity, return on average tangible assets, tangible book value per common share, the ratio of tangible equity to tangible assets, the ratio of tangible common equity to tangible assets, efficiency ratio and net interest margin (FTE) to provide information useful to investors in understanding our operating performance and trends, and to facilitate comparisons with the performance of our peers. Management uses these measures internally to assess and better understand our underlying business performance and trends related to core business activities. The non-GAAP financial measures and key performance indicators we use may differ from the non-GAAP financial measures and key performance indicators other financial institutions use to assess their performance and trends.
These non-GAAP financial measures should be viewed as supplemental in nature, and not as a substitute for or superior to, our reported results prepared in accordance with GAAP. When non-GAAP financial measures are disclosed, the SEC's Regulation G requires: (i) the presentation of the most directly comparable financial measure calculated and presented in accordance with GAAP and (ii) a reconciliation of the differences between the non-GAAP financial measure presented and the most directly comparable financial measure calculated and presented in accordance with GAAP. Reconciliations of non-GAAP operating measures to the most directly comparable GAAP financial measures are included later in this report under the heading “Reconciliations of Non-GAAP Financial Measures and Key Performance Indicators to GAAP”.
Management believes charges such as merger expenses, branch consolidation costs and special one-time employee 401(k) contributions related to tax reform are not organic costs to run our operations and facilities. The merger expenses and branch consolidation charges principally represent expenses to satisfy contractual obligations of the acquired entity or closed branch without any useful ongoing benefit to us. These costs are specific to each individual transaction, and may vary significantly based on the size and complexity of the transaction. Similarly, gains derived from the sale of a business are not organic to our operations.
To provide more meaningful comparisons of net interest margin and efficiency ratio, we use net interest income on a taxable- equivalent basis in calculating net interest margin by increasing the interest income earned on tax-exempt assets (loans and investments) to make it fully equivalent to interest income earned on taxable investments (this adjustment is not permitted under GAAP). Taxable-equivalent amounts for the 2018 period were calculated using a federal statutory income tax rate of 21% provided under the TCJA (effective January 1, 2018). Amounts for the 2017 periods were calculated using the previously applicable statutory federal income tax rate of 35%.
42
OVERVIEW
FNB, headquartered in Pittsburgh, Pennsylvania, is a diversified financial services company operating in seven states and the District of Columbia. Our market coverage spans several major metropolitan areas including: Pittsburgh, Pennsylvania; Baltimore, Maryland; Cleveland, Ohio; and Charlotte, Raleigh, Durham and the Piedmont Triad (Winston-Salem, Greensboro and High Point) in North Carolina. As of
December 31, 2018
, we had
396
banking offices throughout Pennsylvania, Ohio, Maryland, West Virginia, North Carolina and South Carolina. We provide a full range of commercial banking, consumer banking, insurance and wealth management solutions through our subsidiary network which is led by our largest affiliate, FNBPA. Commercial banking solutions include corporate banking, small business banking, investment real estate financing, business credit, capital markets and lease financing. Consumer banking products and services include deposit products, mortgage lending, consumer lending and a complete suite of mobile and online banking services. Wealth management services include asset management, private banking and insurance.
FINANCIAL SUMMARY
For 2018, net income available to common stockholders was a record $364.8 million or $1.12 per diluted common share, compared to $191.2 million or $0.63 per diluted common share for 2017. During 2018, the $5.1 million gain from the sale of Regency, branch consolidation costs of $6.6 million and a $0.9 million discretionary 401(k) contribution following tax reform impacted pretax earnings. During 2018, we also had record revenue including the benefit of a full year in the Carolina markets. We delivered solid loan and deposit growth while maintaining our risk profile. In 2018, we continued to focus on expense management while investing in technology, infrastructure and our people.
The sale of Regency occurred on August 31, 2018. The sale was 100 percent of the issued and outstanding capital stock of Regency to Mariner Finance, LLC in exchange for cash consideration of $142 million. This transaction was completed to accomplish several strategic objectives, including enhancing the credit risk profile of the consumer loan portfolio, offering additional holding company liquidity and selling a non-strategic business segment that no longer fits with our core business. The transaction included a reduction of $131.9 million in direct installment consumer loans, a net charge-off of $7.1 million for the mark to fair value on the Regency loans prior to sale with no associated provision impact, a write-off of $1.8 million of goodwill, and a reduction of branch/retail properties leased by FNB. As a result of the sale, we recognized the aforementioned gain from the sale of $5.1 million.
Income Statement Highlights (
2018
compared to
2017
)
|
•
|
Net income was
$372.9 million
, compared to
$199.2 million
.
|
|
•
|
Operating net income (non-GAAP) was
$374.7 million
, compared to
$289.2 million
.
|
|
•
|
Earnings per diluted common share was
$1.12
, compared to
$0.63
.
|
|
•
|
Operating earnings per diluted common share (non-GAAP) was
$1.13
, compared to
$0.93
.
|
|
•
|
Total revenue
increased
9.9%
to
$1.2 billion
, reflecting a
10.2%
increase in net interest income and a
9.2%
increase in non-interest income.
|
|
•
|
Net interest income was
$932.5 million
, compared to
$846.4 million
.
|
|
•
|
Net interest margin (FTE) (non-GAAP) declined
4 basis points
to
3.39%
from
3.43%
, reflecting a
3
basis point decrease in the fully taxable equivalent adjustment related to the impact of tax reform. Regency contributed 8 basis points and 14 basis points, respectively.
|
|
•
|
Non-interest income was
$275.7 million
, compared to
$252.4 million
.
|
|
•
|
Non-interest expense, excluding merger-related costs, was
$694.5 million
, compared to
$625.0 million
.
|
|
•
|
Income tax expense
decreased
$77.5 million
or
49.4%
, primarily due to the lower tax rate in
2018
and renewable energy tax credits obtained via lease financing; 2017 was impacted by a reduction in the valuation of net deferred tax assets of $54.0 million due to the enactment of the TCJA and merger-related items.
|
|
•
|
The efficiency ratio (non-GAAP) was
54.8%
, compared to
54.2%
.
|
43
|
•
|
The net charge-offs to total average loans ratio increased slightly to
0.26%
, compared to
0.22%
. Included in 2018 was 3 basis points of net charge-offs from the mark to fair value on the Regency loans prior to the sale, with no associated provision expense.
|
Balance Sheet Highlights (period-end balances,
2018
compared to
2017
, unless otherwise indicated)
|
•
|
Total assets were
$33.1 billion
, compared to
$31.4 billion
, an increase of
$1.7 billion
, or
5.4%
.
|
|
•
|
Growth in total average loans was
$2.1 billion
, or
10.6%
, with average commercial loan growth of
$1.3 billion
, or
10.9%
, and average consumer loan growth of $737.2 million, or
10.0%
.
|
|
•
|
Total average deposits grew
$2.4 billion
, or
11.6%
, including an increase in average non-interest-bearing deposits of
$579.2 million
, or
11.0%
, and an increase in average time deposits of
$1.3 billion
, or
33.2%
.
|
|
•
|
The ratio of loans to deposits was
94.4%
, compared to
93.7%
.
|
|
•
|
Total stockholders’ equity was
$4.6 billion
, compared to
$4.4 billion
, an increase of
$0.2 billion
, or
4.5%
since
December 31, 2017
, primarily driven by an increase in earnings partially offset by a decline in AOCI. Additionally, the dividend payout ratio for 2018 was
42.96%
compared to
74.61%
.
|
|
•
|
There was a
24
basis point improvement in the delinquency ratio in the originated portfolio from
0.88%
to
0.64%
.
|
|
•
|
The ratio of the allowance for loan losses to total loans and leases was
0.81%
, compared to
0.84%
.
|
RESULTS OF OPERATIONS
Year Ended
December 31, 2018
Compared to Year Ended
December 31, 2017
Net income available to common stockholders for
2018
was
$364.8 million
or
$1.12
per diluted common share, compared to net income available to common stockholders for
2017
of
$191.2 million
or
$0.63
per diluted common share. Operating earnings per diluted common share (non-GAAP) was
$1.13
for
2018
compared to
$0.93
for
2017
. The results for
2018
included a $5.1 million gain recognized from the sale of Regency, the impact of $6.6 million of costs related to branch consolidations and the impact of a $0.9 million discretionary 401(k) contribution made following tax reform. In comparison, the results for
2017
included the impact of merger-related expenses of
$56.5 million
, the impact of merger-related net securities gains of $2.6 million and the impact of a reduction in the valuation of net DTAs of $54.0 million due to the enactment of the TCJA. Average diluted common shares outstanding increased
21.8 million
shares, or
7.2%
, to
325.6 million
shares for
2018
, primarily as a result of the March 2017 YDKN acquisition, for which we issued 111.6 million shares.
The major categories of the Consolidated Statements of Income and their respective impact to the increase (decrease) in net income are presented below:
TABLE 1
|
Year Ended
December 31
|
$
Change
|
%
Change
|
||||||||||||
|
(in thousands, except per share data)
|
2018
|
2017
|
||||||||||||
|
Net interest income
|
$
|
932,489
|
|
$
|
846,434
|
|
$
|
86,055
|
|
10.2
|
%
|
|||
|
Provision for credit losses
|
61,227
|
|
61,073
|
|
154
|
|
0.3
|
|
||||||
|
Non-interest income
|
275,651
|
|
252,449
|
|
23,202
|
|
9.2
|
|
||||||
|
Non-interest expense
|
694,532
|
|
681,541
|
|
12,991
|
|
1.9
|
|
||||||
|
Income taxes
|
79,523
|
|
157,065
|
|
(77,542
|
)
|
(49.4
|
)
|
||||||
|
Net income
|
372,858
|
|
199,204
|
|
173,654
|
|
87.2
|
|
||||||
|
Less: Preferred stock dividends
|
8,041
|
|
8,041
|
|
—
|
|
—
|
|
||||||
|
Net income available to common stockholders
|
$
|
364,817
|
|
$
|
191,163
|
|
$
|
173,654
|
|
90.8
|
%
|
|||
|
Earnings per common share – Basic
|
$
|
1.13
|
|
$
|
0.63
|
|
$
|
0.50
|
|
79.4
|
%
|
|||
|
Earnings per common share – Diluted
|
1.12
|
|
0.63
|
|
0.49
|
|
77.8
|
|
||||||
|
Cash dividends per common share
|
0.48
|
|
0.48
|
|
—
|
|
—
|
|
||||||
44
The following table presents selected financial ratios and other relevant data used to analyze our performance.
TABLE 2
|
Year Ended December 31
|
2018
|
2017
|
|||||
|
Return on average equity
|
8.30
|
%
|
4.89
|
%
|
|||
|
Return on average tangible common equity
(2)
|
18.41
|
%
|
10.90
|
%
|
|||
|
Return on average assets
|
1.16
|
%
|
0.68
|
%
|
|||
|
Return on average tangible assets
(2)
|
1.29
|
%
|
0.78
|
%
|
|||
|
Book value per common share
(1)
|
$
|
13.88
|
|
$
|
13.30
|
|
|
|
Tangible book value per common share
(1) (2)
|
$
|
6.68
|
|
$
|
6.06
|
|
|
|
Equity to assets
(1)
|
13.92
|
%
|
14.03
|
%
|
|||
|
Average equity to average assets
|
13.97
|
%
|
13.98
|
%
|
|||
|
Common equity to assets
(1)
|
13.60
|
%
|
13.69
|
%
|
|||
|
Tangible equity to tangible assets
(1) (2)
|
7.39
|
%
|
7.11
|
%
|
|||
|
Tangible common equity to tangible assets
(1) (2)
|
7.05
|
%
|
6.74
|
%
|
|||
|
Dividend payout ratio
|
42.96
|
%
|
74.61
|
%
|
|||
(1) Period-end
(2) Non-GAAP
45
The following table provides information regarding the average balances and yields earned on interest-earning assets (non-GAAP) and the average balances and rates paid on interest-bearing liabilities:
TABLE 3
|
Year Ended December 31
|
||||||||||||||||||||||||||||||||
|
(dollars in thousands)
|
2018
|
2017
|
2016
|
|||||||||||||||||||||||||||||
|
Assets
|
Average
Balance
|
Interest
Income/
Expense
|
Yield/
Rate
|
Average
Balance
|
Interest
Income/
Expense
|
Yield/
Rate
|
Average
Balance
|
Interest
Income/
Expense
|
Yield/
Rate
|
|||||||||||||||||||||||
|
Interest-earning assets:
|
||||||||||||||||||||||||||||||||
|
Interest-bearing deposits with banks
|
$
|
62,100
|
|
$
|
1,347
|
|
2.17
|
%
|
$
|
94,261
|
|
$
|
894
|
|
0.95
|
%
|
$
|
116,769
|
|
$
|
444
|
|
0.38
|
%
|
||||||||
|
Federal funds sold
|
—
|
|
—
|
|
—
|
|
1,129
|
|
8
|
|
0.72
|
|
—
|
|
—
|
|
—
|
|
||||||||||||||
|
Taxable investment securities
(1)
|
5,247,250
|
|
118,614
|
|
2.26
|
|
4,824,688
|
|
97,843
|
|
2.03
|
|
3,720,800
|
|
71,853
|
|
1.93
|
|
||||||||||||||
|
Tax-exempt investment securities
(1) (2)
|
1,008,944
|
|
35,438
|
|
3.51
|
|
720,039
|
|
30,056
|
|
4.17
|
|
319,836
|
|
13,815
|
|
4.32
|
|
||||||||||||||
|
Loans held for sale
|
47,761
|
|
2,841
|
|
5.95
|
|
89,558
|
|
5,672
|
|
6.33
|
|
16,525
|
|
726
|
|
4.39
|
|
||||||||||||||
|
Loans and leases
(2) (3)
|
21,581,629
|
|
1,025,229
|
|
4.75
|
|
19,520,234
|
|
864,619
|
|
4.43
|
|
14,265,032
|
|
603,373
|
|
4.23
|
|
||||||||||||||
|
Total interest-earning assets
(2)
|
27,947,684
|
|
1,183,469
|
|
4.23
|
|
25,249,909
|
|
999,092
|
|
3.96
|
|
18,438,962
|
|
690,211
|
|
3.74
|
|
||||||||||||||
|
Cash and due from banks
|
366,971
|
|
344,791
|
|
275,432
|
|
||||||||||||||||||||||||||
|
Allowance for credit losses
|
(181,019
|
)
|
(167,364
|
)
|
(152,751
|
)
|
||||||||||||||||||||||||||
|
Premises and equipment
|
329,151
|
|
324,092
|
|
219,192
|
|
||||||||||||||||||||||||||
|
Other assets
|
3,675,710
|
|
3,379,681
|
|
1,896,882
|
|
||||||||||||||||||||||||||
|
Total assets
|
$
|
32,138,497
|
|
$
|
29,131,109
|
|
$
|
20,677,717
|
|
|||||||||||||||||||||||
|
Liabilities
|
||||||||||||||||||||||||||||||||
|
Interest-bearing liabilities:
|
||||||||||||||||||||||||||||||||
|
Deposits:
|
||||||||||||||||||||||||||||||||
|
Interest-bearing demand
|
$
|
9,396,339
|
|
62,876
|
|
0.67
|
|
$
|
8,927,700
|
|
32,822
|
|
0.37
|
|
$
|
6,652,953
|
|
16,029
|
|
0.24
|
|
|||||||||||
|
Savings
|
2,558,370
|
|
6,007
|
|
0.23
|
|
2,477,644
|
|
2,796
|
|
0.11
|
|
2,237,020
|
|
1,712
|
|
0.08
|
|
||||||||||||||
|
Certificates and other time
|
5,022,607
|
|
73,341
|
|
1.46
|
|
3,770,172
|
|
35,964
|
|
0.95
|
|
2,600,340
|
|
23,498
|
|
0.90
|
|
||||||||||||||
|
Short-term borrowings
|
3,917,858
|
|
74,439
|
|
1.89
|
|
3,761,297
|
|
43,969
|
|
1.16
|
|
1,975,742
|
|
12,183
|
|
0.61
|
|
||||||||||||||
|
Long-term borrowings
|
641,379
|
|
21,047
|
|
3.28
|
|
634,107
|
|
18,341
|
|
2.89
|
|
616,283
|
|
14,029
|
|
2.28
|
|
||||||||||||||
|
Total interest-bearing liabilities
|
21,536,553
|
|
237,710
|
|
1.10
|
|
19,570,920
|
|
133,892
|
|
0.68
|
|
14,082,338
|
|
67,451
|
|
0.48
|
|
||||||||||||||
|
Non-interest-bearing demand
|
5,843,429
|
|
5,264,256
|
|
3,884,941
|
|
||||||||||||||||||||||||||
|
Other liabilities
|
267,682
|
|
222,233
|
|
210,462
|
|
||||||||||||||||||||||||||
|
Total liabilities
|
27,647,664
|
|
25,057,409
|
|
18,177,741
|
|
||||||||||||||||||||||||||
|
Stockholders’ equity
|
4,490,833
|
|
4,073,700
|
|
2,499,976
|
|
||||||||||||||||||||||||||
|
Total liabilities and stockholders’ equity
|
$
|
32,138,497
|
|
$
|
29,131,109
|
|
$
|
20,677,717
|
|
|||||||||||||||||||||||
|
Excess of interest-earning assets over interest-bearing liabilities
|
$
|
6,411,131
|
|
$
|
5,678,989
|
|
$
|
4,356,624
|
|
|||||||||||||||||||||||
|
Net interest income (FTE)
(2)
|
945,759
|
|
865,200
|
|
622,760
|
|
||||||||||||||||||||||||||
|
Tax-equivalent adjustment
|
(13,270
|
)
|
(18,766
|
)
|
(11,248
|
)
|
||||||||||||||||||||||||||
|
Net interest income
|
$
|
932,489
|
|
$
|
846,434
|
|
$
|
611,512
|
|
|||||||||||||||||||||||
|
Net interest spread
|
3.13
|
%
|
3.28
|
%
|
3.26
|
%
|
||||||||||||||||||||||||||
|
Net interest margin
(2)
|
3.39
|
%
|
3.43
|
%
|
3.38
|
%
|
||||||||||||||||||||||||||
|
(1)
|
The average balances and yields earned on securities are based on historical cost.
|
|
(2)
|
The interest income amounts are reflected on an FTE basis (non-GAAP), which adjusts for the tax benefit of income on certain tax-exempt loans and investments using the federal statutory tax rate of 21% in 2018 and 35% in 2017 and 2016. The yield on earning assets and the net interest margin are presented on an FTE basis. We believe this measure to be the preferred industry measurement of net interest income and provides relevant comparison between taxable and non-taxable amounts.
|
|
(3)
|
Average balances include non-accrual loans. Loans and leases consist of average total loans less average unearned income.
|
46
Net Interest Income
Net interest income on an FTE basis (non-GAAP) of
$945.8 million
for
2018
increased
$80.6 million
, or
9.3%
, from $865.2 million for
2017
. Average interest-earning assets
increased
$2.7 billion
, or
10.7%
, and average interest-bearing liabilities
increased
$2.0 billion
, or
10.0%
, from
2017
, due to organic growth in loans and deposits and our expanded banking footprint in our southeastern markets. Our net interest margin FTE (non-GAAP) was
3.39%
for
2018
, compared to
3.43%
for
2017
, reflecting a lower FTE adjustment due to the lower federal statutory tax rate. Higher yields on earning assets and higher incremental purchase accounting accretion were offset by higher rates paid on deposits and borrowings. Incremental purchase accounting accretion refers to the difference between total accretion and the estimated coupon interest income on loans acquired in a business combination. Additionally, Regency contributed $22.5 million of net interest income, or 0.08% to net interest margin in 2018, compared to $36.5 million or 0.14% in 2017. The FOMC has increased the target Fed Funds rate by 100 basis points between
December 31, 2017
and
December 31, 2018
.
The following table provides certain information regarding changes in net interest income on an FTE basis (non-GAAP) attributable to changes in the average volumes and yields earned on interest-earning assets and the average volume and rates paid for interest-bearing liabilities for the periods indicated:
TABLE 4
|
2018 vs 2017
|
2017 vs 2016
|
||||||||||||||||||||||
|
(in thousands)
|
Volume
|
Rate
|
Net
|
Volume
|
Rate
|
Net
|
|||||||||||||||||
|
Interest Income
(1)
|
|||||||||||||||||||||||
|
Interest-bearing deposits with banks
|
$
|
(305
|
)
|
$
|
758
|
|
$
|
453
|
|
$
|
(86
|
)
|
$
|
536
|
|
$
|
450
|
|
|||||
|
Federal funds sold
|
(4
|
)
|
(4
|
)
|
(8
|
)
|
4
|
|
4
|
|
8
|
|
|||||||||||
|
Securities
(2)
|
19,150
|
|
7,004
|
|
26,154
|
|
40,349
|
|
1,882
|
|
42,231
|
|
|||||||||||
|
Loans held for sale
|
(2,606
|
)
|
(226
|
)
|
(2,832
|
)
|
3,383
|
|
1,563
|
|
4,946
|
|
|||||||||||
|
Loans and leases
(2)
|
88,930
|
|
71,679
|
|
160,609
|
|
233,286
|
|
27,960
|
|
261,246
|
|
|||||||||||
|
Total interest income
(2)
|
105,165
|
|
79,211
|
|
184,376
|
|
276,936
|
|
31,945
|
|
308,881
|
|
|||||||||||
|
Interest Expense
(1)
|
|||||||||||||||||||||||
|
Deposits:
|
|||||||||||||||||||||||
|
Interest-bearing demand
|
2,524
|
|
27,530
|
|
30,054
|
|
6,766
|
|
10,027
|
|
16,793
|
|
|||||||||||
|
Savings
|
553
|
|
2,654
|
|
3,207
|
|
358
|
|
726
|
|
1,084
|
|
|||||||||||
|
Certificates and other time
|
15,034
|
|
22,348
|
|
37,382
|
|
10,752
|
|
1,714
|
|
12,466
|
|
|||||||||||
|
Short-term borrowings
|
2,162
|
|
28,306
|
|
30,468
|
|
20,461
|
|
11,325
|
|
31,786
|
|
|||||||||||
|
Long-term borrowings
|
349
|
|
2,357
|
|
2,706
|
|
958
|
|
3,354
|
|
4,312
|
|
|||||||||||
|
Total interest expense
|
20,622
|
|
83,195
|
|
103,817
|
|
39,295
|
|
27,146
|
|
66,441
|
|
|||||||||||
|
Net change
(2)
|
$
|
84,543
|
|
$
|
(3,984
|
)
|
$
|
80,559
|
|
$
|
237,641
|
|
$
|
4,799
|
|
$
|
242,440
|
|
|||||
|
(1)
|
The amount of change not solely due to rate or volume changes was allocated between the change due to rate and the change due to volume based on the net size of the rate and volume changes.
|
|
(2)
|
Interest income amounts are reflected on an FTE basis (non-GAAP) which adjusts for the tax benefit of income on certain tax-exempt loans and investments using the federal statutory tax rate of 21% in 2018 and 35.0% in 2017 and 2016. We believe this measure to be the preferred industry measurement of net interest income and provides relevant comparison between taxable and non-taxable amounts.
|
Interest income on an FTE basis (non-GAAP) of
$1.2 billion
for
2018
, increased
$184.4 million
or
18.5%
from
2017
, primarily due to increased interest-earning assets. During
2018
and
2017
, we recognized
$38.4 million
and
$21.5 million
, respectively, in incremental purchase accounting accretion and cash recoveries on loans acquired in business combinations; which included
$14.4 million
of higher incremental purchase accounting accretion and
$2.5 million
of higher cash recoveries. The increase in interest-earning assets was primarily driven by a
$2.1 billion
, or
10.6%
, increase in average loans and leases, which reflects the benefit of our expanded banking footprint and successful sales management, and includes $1.1 billion, or 5.4%, of organic growth. Additionally, average securities
increased
$0.7 billion
, or
12.8%
, primarily as a result of the securities portfolio acquired from YDKN and the subsequent repositioning of that portfolio. The yield on average interest-earning assets (non-GAAP) increased
27
basis points from
2017
to
4.23%
for
2018
. The
27
basis point increase in earning asset yields was driven by an increase in yields on both investments and loans including higher purchase accounting accretion and cash recoveries on loans acquired in business combinations. During the second quarter of 2018, we sold underperforming acquired and originated
47
small business loans with a carrying value of $42.5 million, which benefited our overall credit quality and sold a non-strategic pool of acquired serviced-by-others mortgages with a carrying value of $38.2 million. We recognized approximately $9.4 million in incremental purchase accounting accretion in the second quarter of 2018 related to the serviced-by-others mortgage loan sale.
Interest expense of
$237.7 million
for
2018
increased
$103.8 million
, or
77.5%
, from
2017
due to higher market rates and a change in the mix of interest-bearing liabilities, combined with growth in average interest-bearing liabilities, as interest-bearing deposits and borrowings increased over the same period of
2017
. Average interest-bearing deposits
increased
$1.8 billion
, or
11.9%
, reflecting the benefit of acquired balances and average organic growth of $1.4 billion, or 6.6%. Average short-term borrowings
increased
$0.2 billion
or
4.2%
, primarily as a result of increases of $125.6 million in federal funds purchased and $64.2 million in short-term FHLB borrowings, partially offset by a $25.8 million decrease in customer repurchase agreements. Average long-term borrowings
increased
$7.3 million
or
1.1%
, primarily as a result of increases of $12.4 million and $10.6 million in junior subordinated debt and subordinated debt, respectively, assumed in the YDKN transaction, partially offset by a decrease of $15.2 million in long-term FHLB advances. Subsequent to the close of the acquisition, we remixed the long–term position based on our funding needs. The rate paid on interest-bearing liabilities increased
42
basis points to
1.10%
for
2018
, in response to the FRB's FOMC interest rate increases and changes in the funding mix.
Provision for Credit Losses
The provision for credit losses is determined based on management’s estimates of the appropriate level of allowance for credit losses needed to absorb probable losses inherent in the loan and lease portfolio, after giving consideration to charge-offs and recoveries for the period. The following table presents information regarding the provision for credit losses and net charge-offs for the years
2016
through
2018
:
TABLE 5
|
2018 vs 2017
|
2017 vs 2016
|
||||||||||||||||||||||||
|
(dollars in thousands)
|
2018
|
2017
|
$
Change |
%
Change |
2016
|
$
Change |
%
Change |
||||||||||||||||||
|
Provision for credit losses:
|
|||||||||||||||||||||||||
|
Originated
|
$
|
55,782
|
|
$
|
64,559
|
|
$
|
(8,777
|
)
|
(13.6
|
)%
|
$
|
55,422
|
|
$
|
9,137
|
|
16.5
|
%
|
||||||
|
Acquired
|
5,445
|
|
(3,486
|
)
|
8,931
|
|
n/m
|
|
330
|
|
(3,816
|
)
|
n/m
|
|
|||||||||||
|
Total provision for credit losses
|
$
|
61,227
|
|
$
|
61,073
|
|
$
|
154
|
|
0.3
|
%
|
$
|
55,752
|
|
$
|
5,321
|
|
9.5
|
%
|
||||||
|
Net loan charge-offs:
|
|||||||||||||||||||||||||
|
Originated
|
$
|
51,097
|
|
$
|
46,668
|
|
$
|
4,429
|
|
9.5
|
%
|
$
|
39,916
|
|
$
|
6,752
|
|
16.9
|
%
|
||||||
|
Acquired
|
4,863
|
|
(2,916
|
)
|
7,779
|
|
n/m
|
|
(211
|
)
|
(2,705
|
)
|
n/m
|
|
|||||||||||
|
Total net loan charge-offs
|
$
|
55,960
|
|
$
|
43,752
|
|
$
|
12,208
|
|
27.9
|
%
|
$
|
39,705
|
|
$
|
4,047
|
|
10.2
|
%
|
||||||
|
Net loan charge-offs / total average loans and leases
|
0.26
|
%
|
0.22
|
%
|
0.28
|
%
|
|||||||||||||||||||
|
Net originated loan charge-offs / total average originated loans and leases
|
0.31
|
%
|
0.33
|
%
|
0.34
|
%
|
|||||||||||||||||||
|
n/m - not meaningful
|
|||||||||||||||||||||||||
The provision for credit losses of
$61.2 million
during
2018
increased
$0.2 million
from
2017
, primarily due to an increase of
$8.9 million
in the provision for the acquired portfolio, partially offset by a decrease of
$8.8 million
in the provision for the originated portfolio, which was primarily attributable to slightly lower organic loan growth, a lower level of non-performing loans and generally improved credit quality results in
2018
. Net loan charge-offs of
$56.0 million
for
2018
increased
$12.2 million
from
2017
, primarily due to $13.4 million, or 6 basis points, relating to both the sale of a small portfolio of non-performing loans in the second quarter of 2018 and the sale of Regency in the third quarter of 2018. Both actions had no associated provision expense. For additional information relating to the allowance and provision for credit losses, refer to the Allowance for Credit Losses section of this MD&A.
48
Non-Interest Income
The breakdown of non-interest income for the years
2016
through
2018
is presented in the following table:
TABLE 6
|
2018 vs 2017
|
2017 vs 2016
|
|||||||||||||||||||||||||
|
(dollars in thousands)
|
2018
|
2017
|
$
Change
|
%
Change
|
2016
|
$
Change
|
%
Change
|
|||||||||||||||||||
|
Service charges
|
$
|
125,476
|
|
$
|
120,432
|
|
$
|
5,044
|
|
4.2
|
%
|
$
|
96,824
|
|
$
|
23,608
|
|
24.4
|
%
|
|||||||
|
Trust services
|
25,818
|
|
23,121
|
|
2,697
|
|
11.7
|
|
21,173
|
|
1,948
|
|
9.2
|
|
||||||||||||
|
Insurance commissions and fees
|
18,312
|
|
19,063
|
|
(751
|
)
|
(3.9
|
)
|
18,328
|
|
735
|
|
4.0
|
|
||||||||||||
|
Securities commissions and fees
|
17,545
|
|
15,286
|
|
2,259
|
|
14.8
|
|
13,468
|
|
1,818
|
|
13.5
|
|
||||||||||||
|
Capital markets income
|
21,366
|
|
16,603
|
|
4,763
|
|
28.7
|
|
15,471
|
|
1,132
|
|
7.3
|
|
||||||||||||
|
Mortgage banking operations
|
21,940
|
|
19,977
|
|
1,963
|
|
9.8
|
|
12,106
|
|
7,871
|
|
65.0
|
|
||||||||||||
|
Dividends on non-marketable equity securities
|
15,553
|
|
9,222
|
|
6,331
|
|
68.7
|
|
4,094
|
|
5,128
|
|
125.3
|
|
||||||||||||
|
Bank owned life insurance
|
13,500
|
|
11,693
|
|
1,807
|
|
15.5
|
|
10,249
|
|
1,444
|
|
14.1
|
|
||||||||||||
|
Net securities gains
|
34
|
|
5,916
|
|
(5,882
|
)
|
n/m
|
712
|
|
5,204
|
|
n/m
|
||||||||||||||
|
Other
|
16,107
|
|
11,136
|
|
4,971
|
|
44.6
|
|
9,336
|
|
1,800
|
|
19.3
|
|
||||||||||||
|
Total non-interest income
|
$
|
275,651
|
|
$
|
252,449
|
|
$
|
23,202
|
|
9.2
|
%
|
$
|
201,761
|
|
$
|
50,688
|
|
25.1
|
%
|
|||||||
n/m - not meaningful
Total non-interest income of
$275.7 million
for
2018
increased
$23.2 million
, or
9.2%
, from
$252.4 million
in
2017
. The variances in significant individual non-interest income items are further explained in the following paragraphs. Excluding the $5.1 million gain on the sale of Regency and
$3.7 million
loss on fixed assets related to branch consolidations in
2018
and the
$2.6 million
merger-related net securities gains in
2017
, non-interest income increased
$24.4 million
, or
9.7%
, attributable to continued growth of our fee-based businesses of trust services, brokerage, capital markets and mortgage banking.
Service charges on loans and deposits of
$125.5 million
for
2018
increased
$5.0 million
, or
4.2%
, from
$120.4 million
in
2017
. The increase was driven by the expanded customer base in our southeastern markets, combined with organic growth in loans and deposit accounts.
Trust services of
$25.8 million
for
2018
increased
$2.7 million
, or
11.7%
, from the same period of
2017
, primarily driven by strong organic revenue production. The market value of assets under management increased $203.1 million, or 4.2%, to $5.1 billion at
December 31, 2018
, with the increase almost entirely attributable to organic growth in accounts and services.
Securities commissions and fees of
$17.5 million
for
2018
increased
14.8%
from the same period of
2017
. This increase reflects the benefit of expanded operations in our southeastern markets and increased brokerage activity in the Pittsburgh, Pennsylvania and North Carolina markets which each reflected increases of $1.0 million.
Insurance commissions and fees of
$18.3 million
for
2018
decreased
$0.8 million
, or
3.9%
, from
$19.1 million
in
2017
, primarily due to the divestiture of Regency, partially offset by an increase in revenues from new client acquisition and expanded product capabilities.
Capital markets income of
$21.4 million
for
2018
increased
$4.8 million
, or
28.7%
, from
$16.6 million
for
2017
, reflecting continued solid contributions from commercial swap activity across our footprint, combined with increased syndication fees and international banking activity.
Mortgage banking operations income of
$21.9 million
for
2018
increased
$2.0 million
, or
9.8%
, from
$20.0 million
for
2017
, primarily due to higher sold volume primarily due to expansion into new markets. During
2018
, we sold $1.2 billion of residential mortgage loans, compared to $1.0 billion for
2017
. Sold loan margins have increased by 15 basis points from 1.45% in
2017
to 1.60% in
2018
due to mix and higher retail gain on sale margins. In
2018
, retail volume was 44% of the total sold volume compared to 38% in
2017
and we benefited from an expansion in our retail margin of 30 basis points while correspondent margins have faced significant competitive pressure and declined 16 basis points in
2018
.
49
Dividends on non-marketable equity securities of
$15.6 million
for
2018
increased
$6.3 million
, or
68.7%
, from
$9.2 million
for
2017
, primarily due to holding a higher level of FHLB stock to support additional FHLB borrowings.
Income from BOLI of
$13.5 million
for
2018
increased
$1.8 million
, or
15.5%
, from
$11.7 million
in
2017
, due to investing in new policies during the third and fourth quarters of 2017 and death benefits received.
There were no net securities gains in
2018
and
$5.9 million
for
2017
. The gains in 2017 related to the sale of certain acquired YDKN securities after the closing of the acquisition to align their portfolio with our investment profile and the sale of certain amortizing HTM securities which were sold to improve operational efficiencies. The HTM securities had already returned more than 85% of their principal outstanding at the time we acquired the securities and could be sold without tainting the remaining HTM portfolio.
Other non-interest income was
$16.1 million
and
$11.1 million
for
2018
and
2017
, respectively. During
2018
, gains on an equity investment increased $1.9 million, gains on the sale of repossessed assets increased $1.7 million and SBA gain on sale and servicing-related income increased $1.1 million compared to the year-ago period. Additionally, we recognized a $5.1 million gain on the sale of Regency in 2018. These items were partially offset by a
$3.7 million
loss on fixed assets recorded in 2018 related to the branch consolidations.
The following table presents non-interest income excluding significant items:
TABLE 7
|
$
|
%
|
|||||||||||||
|
(dollars in thousands)
|
2018
|
2017
|
Change
|
Change
|
||||||||||
|
Total non-interest income, as reported
|
$
|
275,651
|
|
$
|
252,449
|
|
$
|
23,202
|
|
9.2
|
%
|
|||
|
Significant items:
|
||||||||||||||
|
Gain on sale of subsidiary
|
(5,135
|
)
|
—
|
|
(5,135
|
)
|
||||||||
|
Loss on fixed assets related to branch consolidations
|
3,677
|
|
—
|
|
3,677
|
|
||||||||
|
Merger-related net securities gains
|
—
|
|
(2,609
|
)
|
2,609
|
|
||||||||
|
Total non-interest income, excluding significant items
(1)
|
$
|
274,193
|
|
$
|
249,840
|
|
$
|
24,353
|
|
9.7
|
%
|
|||
(1) Non-GAAP
Non-Interest Expense
The breakdown of non-interest expense for the years
2016
through
2018
is presented in the following table:
TABLE 8
|
2018 vs 2017
|
2017 vs 2016
|
|||||||||||||||||||||||||
|
(dollars in thousands)
|
2018
|
2017
|
$
Change
|
%
Change
|
2016
|
$
Change
|
%
Change
|
|||||||||||||||||||
|
Salaries and employee benefits
|
$
|
369,630
|
|
$
|
326,893
|
|
$
|
42,737
|
|
13.1
|
%
|
$
|
239,798
|
|
$
|
87,095
|
|
36.3
|
%
|
|||||||
|
Net occupancy
|
59,679
|
|
53,787
|
|
5,892
|
|
11.0
|
|
40,086
|
|
13,701
|
|
34.2
|
|
||||||||||||
|
Equipment
|
55,430
|
|
49,361
|
|
6,069
|
|
12.3
|
|
38,046
|
|
11,315
|
|
29.7
|
|
||||||||||||
|
Amortization of intangibles
|
15,652
|
|
17,517
|
|
(1,865
|
)
|
(10.6
|
)
|
11,210
|
|
6,307
|
|
56.3
|
|
||||||||||||
|
Outside services
|
65,682
|
|
56,113
|
|
9,569
|
|
17.1
|
|
43,737
|
|
12,376
|
|
28.3
|
|
||||||||||||
|
FDIC insurance
|
32,959
|
|
32,902
|
|
57
|
|
0.2
|
|
19,203
|
|
13,699
|
|
71.3
|
|
||||||||||||
|
Bank shares and franchise taxes
|
11,929
|
|
10,256
|
|
1,673
|
|
16.3
|
|
8,940
|
|
1,316
|
|
14.7
|
|
||||||||||||
|
Merger-related
|
—
|
|
56,513
|
|
(56,513
|
)
|
n/m
|
37,439
|
|
19,074
|
|
50.9
|
|
|||||||||||||
|
Other
|
83,571
|
|
78,199
|
|
5,372
|
|
6.9
|
|
72,674
|
|
5,525
|
|
7.6
|
|
||||||||||||
|
Total non-interest expense
|
$
|
694,532
|
|
$
|
681,541
|
|
$
|
12,991
|
|
1.9
|
%
|
$
|
511,133
|
|
$
|
170,408
|
|
33.3
|
%
|
|||||||
n/m - not meaningful
50
Total non-interest expense of
$694.5 million
for
2018
increased
$13.0 million
, or
1.9%
, from
$681.5 million
in
2017
. The full year of
2018
included
$2.9 million
of branch consolidation expenses and a
$0.9 million
discretionary 401(k) contribution made in response to tax reform, while
2017
included
$56.5 million
of merger-related expenses. Excluding these expenses, total non-interest expense increased $65.7 million, or
10.5%
, with the increase primarily attributable to the expanded operations in North and South Carolina.
Salaries and employee benefits of
$369.6 million
for
2018
increased
$42.7 million
, or
13.1%
, from
$326.9 million
in
2017
. The increase was primarily due to employees added in our expanded operations in our southeastern markets and increasing the minimum wage for FNB hourly employees in response to tax reform, combined with 2018 normal merit increases and higher benefit costs including items such as a large medical insurance claim of $2.6 million, restricted stock awards, a $1.0 million payroll tax rate adjustment plus a discretionary 401(k) contribution of
$0.9 million
in response to tax reform in 2018. Our total full-time equivalent employees were 4,266 and 4,626 at
December 31, 2018
and
2017
, respectively. The decline in full-time equivalent employees primarily related to the sale of Regency.
Net occupancy and equipment expense of
$115.1 million
for
2018
increased
$12.0 million
, or
11.6%
, from
$103.1 million
in
2017
, primarily due to our expanded operations in our southeastern markets, branch consolidation costs of $1.6 million and our continued investment in new technology. The increased technology costs included upgrades to meet customer needs via the utilization of electronic delivery channels, such as online and mobile banking, investment in infrastructure to support our larger company and expenditures deemed necessary by management to maintain proficiency and compliance with regulatory requirements.
Amortization of intangibles expense of
$15.7 million
for
2018
decreased
$1.9 million
, or
10.6%
, from
$17.5 million
in
2017
, due to the completion of amortization for a core deposit intangible from a prior acquisition.
Outside services expense of
$65.7 million
for
2018
increased
$9.6 million
, or
17.1%
, from
$56.1 million
in
2017
, primarily due to increases of $4.0 million in legal expense, $1.6 million in data processing and information technology services and $1.2 million in consulting fees, combined with various other miscellaneous increases. These increases were driven primarily by the expanded operations in our southeastern markets.
Bank shares and franchise taxes expense of
$11.9 million
for
2018
increased
$1.7 million
, or
16.3%
, from
$10.3 million
in
2017
, primarily due to an increase in our capital base from the YDKN acquisition.
We recorded
$56.5 million
in merger-related costs in
2017
related to the YDKN acquisition. These costs are specific to each individual transaction and may vary significantly based on the size and complexity of the transaction. The costs for
2017
are summarized in the following table:
TABLE 9
|
Year ended December 31
|
2017
|
||
|
(in thousands)
|
|||
|
Professional services
|
$
|
26,161
|
|
|
Severance and other employee benefit costs
|
17,778
|
|
|
|
Charitable contributions
|
5,635
|
|
|
|
Data processing conversion costs
|
3,974
|
|
|
|
Marketing costs
|
1,546
|
|
|
|
Other expenses
|
1,419
|
|
|
|
Total merger-related costs
|
$
|
56,513
|
|
Other non-interest expense was
$83.6 million
and
$78.2 million
for
2018
and
2017
, respectively. During
2018
, loan-related expense increased by $3.0 million, OREO increased by
$1.9 million
and marketing expense increased by $1.3 million, combined with various other miscellaneous increases. These increases were primarily related to the expanded operations in North and South Carolina and branch consolidation activities.
51
The following table presents non-interest expense excluding significant items:
TABLE 10
|
$
|
%
|
|||||||||||||
|
(dollars in thousands)
|
2018
|
2017
|
Change
|
Change
|
||||||||||
|
Total non-interest expense, as reported
|
$
|
694,532
|
|
$
|
681,541
|
|
$
|
12,991
|
|
1.9
|
%
|
|||
|
Significant items:
|
||||||||||||||
|
Discretionary 401(k) contribution
|
(874
|
)
|
—
|
|
(874
|
)
|
||||||||
|
Branch consolidations - salaries and benefits
|
(45
|
)
|
—
|
|
(45
|
)
|
||||||||
|
Branch consolidations - occupancy and equipment
|
(1,609
|
)
|
—
|
|
(1,609
|
)
|
||||||||
|
Branch consolidations - other
|
(1,285
|
)
|
—
|
|
(1,285
|
)
|
||||||||
|
Merger-related
|
—
|
|
(56,513
|
)
|
56,513
|
|
||||||||
|
Total non-interest expense, excluding significant items
(1)
|
$
|
690,719
|
|
$
|
625,028
|
|
$
|
65,691
|
|
10.5
|
%
|
|||
(1) Non-GAAP
Income Taxes
On December 22, 2017, the U.S. federal government enacted a tax bill, the TCJA, which provided significant changes to the U.S. federal income tax laws, such as the reduction of the federal tax rate for corporations from 35% to 21%, effective January 1, 2018. The TCJA also included other provisions such as the acceleration of depreciation for certain assets placed into service after September 27, 2017.
On the same date, the SEC issued SAB No. 118, which provided guidance regarding the recognition of the effect of enacted changes in tax rates and laws in the period in which they occur when a registrant does not have the necessary information available, prepared or analyzed in reasonable detail to complete the accounting for certain income tax effects of the TCJA for the reporting period in which the TCJA was enacted. SAB No. 118 expresses the view that a company must first reflect the income tax effect of the TCJA in the period of enactment on items for which the accounting is complete (these completed amounts would not be provisional) and also report provisional amounts for certain income tax effects of the TCJA for which reasonable estimates can be determined. We recorded a provisional amount of $54.0 million at December 31, 2017 related to the remeasurement of deferred tax balances. Upon final analysis of available information and refinement of our calculations during
2018
, we decreased our provisional amount by $1.9 million which is included as a component of income tax expense from continuing operations. We consider the TCJA remeasurement of our deferred taxes to be complete.
The following table presents information regarding income tax expense and certain tax rates:
TABLE 11
|
Year ended December 31
|
2018
|
2017
|
2016
|
||||||||
|
(dollars in thousands)
|
|||||||||||
|
Income tax expense
|
$
|
79,523
|
|
$
|
157,065
|
|
$
|
75,497
|
|
||
|
Effective tax rate
|
17.6
|
%
|
44.1
|
%
|
30.6
|
%
|
|||||
|
Statutory federal tax rate
|
21.0
|
%
|
35.0
|
%
|
35.0
|
%
|
|||||
Our income tax expense for
2018
decreased
$77.5 million
or
49.4%
from
2017
, primarily due to the impact of a reduction in the valuation of net DTAs of $54.0 million due to the enactment of the TCJA in
2017
. The effective tax rate was
17.6%
for
2018
, compared to
44.1%
for
2017
. The effective tax rate of
17.6%
in
2018
was lower than the
21.0%
TCJA statutory federal tax rate due to tax-exempt income on investments and loans, tax credits and income from BOLI. The effective tax rate for
2017
was significantly higher at
44.1%
than the
35%
pre-TCJA statutory federal tax rate largely due to $54.0 million of income tax expense recorded from the revaluation of net deferred tax assets in connection with the TCJA in
2017
. The effective rate for
2016
was lower than the 35% federal statutory rate due to the tax benefits primarily resulting from tax-exempt income on investments and loans, tax credits and income from BOLI.
52
Year Ended
December 31, 2017
Compared to Year Ended
December 31, 2016
Refer to the previous section of this MD&A for tables which reflect a comparison of the years ended
2017
versus
2016
. Certain significant changes for the years ended
2017
versus
2016
are discussed in the paragraphs that follow.
Net income available to common stockholders for 2017 was $191.2 million, or $0.63, per diluted common share, compared to net income available to common stockholders for 2016 of $162.9 million, or $0.78, per diluted common share. Operating earnings per diluted common share (non-GAAP) was $0.93 for 2017 compared to $0.90 for 2016. The results for 2017 included $56.5 million, or $0.13 per diluted common share, in merger costs and reflect costs and benefits associated with the YDKN acquisition that closed on March 11, 2017. The results for 2016 included $37.4 million, or $0.12 per diluted common share, in merger costs and reflect costs and benefits associated with the METR acquisition that closed on February 13, 2016, combined with the Fifth Third branch purchase that closed on April 22, 2016. Average diluted common shares outstanding increased 96.1 million shares, or 46.2%, to 303.9 million shares for 2017, primarily as a result of the YDKN acquisition, for which we issued 111.6 million shares.
Net Interest Income
Net interest income on an FTE basis (non-GAAP) of $865.2 million for 2017 increased $242.4 million, or 38.9%, from $622.8 million for 2016. Average interest earning assets increased $6.8 billion, or 36.9%, and average interest-bearing liabilities increased $5.5 billion, or 39.0%, from 2016, primarily due to our acquisitions and organic growth in loans and deposits. Our net interest margin (non-GAAP) was 3.43% for 2017, compared to 3.38% for 2016, due to an extended low interest rate environment and a competitive landscape for earning assets, offset by higher purchase accounting accretion and FOMC interest rate increases.
Interest income on an FTE basis (non-GAAP) of $999.1 million for 2017, increased $308.9 million, or 44.8%, from 2016, primarily due to increased interest-earning assets, in addition to higher yields. During 2017 and 2016, we recognized $21.5 million and $13.1 million, respectively, in incremental purchase accounting accretion and cash recoveries on loans acquired in a business combination; which included $4.0 million of higher incremental purchase accounting accretion and $4.4 million of higher cash recoveries. The increase in interest-earning assets was primarily driven by a $5.3 billion, or 36.8%, increase in average loans and leases, which reflects the benefit of our expanded banking footprint resulting from the YDKN and METR acquisitions and successful sales management, and $918.1 million, or 6.3%, of organic growth. Loans added at closing of the YDKN acquisition were $5.1 billion. Additionally, average securities increased $1.5 billion, or 37.2%, primarily as a result of the securities portfolio acquired from YDKN and the subsequent repositioning of that portfolio. The yield on average interest-earning assets (non-GAAP) increased 22 basis points for 2016 to 3.96% for 2017, driven by an increase in yields in both investments and loans.
Interest expense of $133.9 million for 2017 increased $66.4 million, or 98.5%, from 2016 due to an increase in rates paid and growth in average interest-bearing liabilities, as all categories of interest-bearing liabilities increased over the same period of 2016. Average interest-bearing deposits increased $3.7 billion, or 32.1%, which reflects the benefit of our expanded banking footprint resulting from the YDKN and METR acquisitions, including $2.9 billion added at closing of the YDKN acquisition and organic growth in transaction deposits. Average short-term borrowings increased $1.8 billion, or 90.4%, primarily as a result of increases of $1.4 billion in short-term FHLB borrowings and $414.2 million in federal funds purchased. Average long-term borrowings increased $17.8 million, or 2.9%, primarily as a result of increases of $50.4 million and $49.0 million in subordinated debt and junior subordinated debt, respectively, assumed in the YDKN transaction, partially offset by a decrease of $84.8 million in long-term FHLB advances. Subsequent to the close of the acquisition, we remixed the long–term position based on our funding needs. The rate paid on interest-bearing liabilities increased 20 basis points to 0.68% for 2017, in response to the FRB's FOMC interest rate increases and changes in the funding mix. Given the relatively low level of interest rates and the current rates paid on the various deposit products, we believe there is limited opportunity for reductions in the overall rate paid on interest-bearing liabilities.
Provision for Credit Losses
The provision for credit losses of $61.1 million during 2017 increased $5.3 million from 2016, primarily due to an increase of $9.1 million in the provision for the originated portfolio, which was attributable to higher organic loan growth and higher net charge-offs in 2017. This was partially offset by a decrease of $3.8 million in the provision for the acquired portfolio due to generally favorable credit quality results and the resolution of certain non-performing assets. For additional information relating to the allowance and provision for credit losses, refer to the Allowance for Credit Losses section of this MD&A.
53
Non-Interest Income
Total non-interest income of $252.4 million for 2017 increased $50.7 million, or 25.1%, from $201.8 million in 2016. The variances in significant individual non-interest income items are further explained in the following paragraphs, with an overriding theme of the increases relating to expanded operations from the acquisition of YDKN in the first quarter of 2017 and the acquisition of METR and Fifth Third branches in the first half of 2016.
Service charges on loans and deposits of $120.4 million for 2017 increased $23.6 million, or 24.4%, from $96.8 million in 2016. The impact of the expanded customer base due to acquisitions, combined with organic growth in loans and deposit accounts, resulted in increases of $13.1 million, or 22.7%, in deposit-related service charges and $10.5 million, or 26.9%, in other service charges and fees over this same period.
Trust services of $23.1 million for 2017 increased $1.9 million, or 9.2%, from the same period of 2016, primarily driven by strong organic growth activity and improved market conditions. The market value of assets under management increased $818.2 million or 20.2% to $4.9 billion at December 31, 2017.
Insurance commissions and fees of $19.1 million for 2017 increased $0.7 million, or 4.0%, from $18.3 million in 2016, primarily due to revenues from new client acquisition and expanded product capabilities.
Capital markets income of $16.6 million for 2017 increased $1.1 million, or 7.3%, from $15.5 million for 2016, as we earned more in fees through our commercial loans interest rate swap program, reflecting stronger demand from commercial loan customers to swap floating-rate interest payments for fixed-rate interest payments enabling those customers to better manage their interest rate risk.
Mortgage banking operations income of $20.0 million for 2017 increased $7.9 million, or 65.0%, from $12.1 million for 2016, primarily due to growth in the servicing portfolio and higher sold volume due to acquisitions and expansion into new markets. During 2017, we sold $1.0 billion of residential mortgage loans, compared to $704.2 million for 2016.
Dividends on non-marketable equity securities of $9.2 million for 2017 increased $5.1 million from $4.1 million for 2016, as we have more shares of FHLB stock resulting from the YDKN acquisition.
Income from BOLI of $11.7 million for 2017 increased $1.4 million, or 14.1%, from $10.2 million in 2016, due to a combination of reinvesting into a higher yielding policy and death benefits received.
Net securities gains were $5.9 million for 2017, compared to $0.7 million for 2016. These gains in 2017 relate to the sale of certain acquired YDKN securities after the closing of the acquisition to align their portfolio with our investment profile and the sale of certain amortizing HTM securities which were sold to improve operational efficiencies. The HTM securities had already returned more than 85% of their principal outstanding at the time we acquired the securities and could be sold without tainting the remaining HTM portfolio.
Other non-interest income was $11.1 million and $9.3 million for 2017 and 2016, respectively. Net gains on sale of fixed assets increased $1.4 million during 2017. During 2016, we recognized a gain of $2.4 million relating to the $10.0 million redemption of TPS that was originally issued by a company that we acquired.
Non-Interest Expense
Total non-interest expense of $681.5 million for 2017 increased $170.4 million, or 33.3%, from $511.1 million in 2016. The variances in the individual non-interest expense items are further explained in the following paragraphs with an overriding theme of the increases for several line items related to the expanded operations due to the acquisition of YDKN in the first quarter of 2017 and the acquisition of METR and Fifth Third branches in the first half of 2016.
Salaries and employee benefits of $326.9 million for 2017 increased $87.1 million, or 36.3%, from $239.8 million in 2016, primarily due to employees added in conjunction with the aforementioned acquisitions, combined with merit increases and higher medical insurance costs in 2017. Our total full-time equivalent employees were 4,626 and 3,648 at December 31, 2017 and 2016, respectively.
Net occupancy and equipment expense of $103.1 million for 2017 increased $25.0 million, or 32.0%, from $78.1 million in 2016, primarily resulting from the aforementioned acquisitions, and our continued investment in new technology. The increased technology costs include upgrades to meet customer needs via the utilization of electronic delivery channels, such as online and
54
mobile banking, investment in infrastructure to support our larger company and expenditures deemed necessary by management to maintain proficiency and compliance with expanding regulatory requirements.
Amortization of intangibles expense of $17.5 million for 2017 increased $6.3 million, or 56.3%, from $11.2 million in 2016, due to the additional core deposit intangibles added as a result of the YDKN, METR and Fifth Third branches.
Outside services expense of $56.1 million for 2017 increased $12.4 million, or 28.3%, from $43.7 million in 2016, primarily due to increases of $6.8 million in data processing services, $1.8 million in information technology services, $0.5 million in armored car services and $3.0 million in other outsourced services, such as reporting, monitoring, shredding, printing, filing, security and legal expense. These increases were driven primarily by the aforementioned acquisitions.
FDIC insurance of $32.9 million for 2017 increased $13.7 million, or 71.3%, from $19.2 million in 2016, primarily due to a higher assessment base resulting from merger and acquisition activity combined with an increased rate due to YDKN's construction loan portfolio. Additionally, effective July 1, 2016, the FDIC assessment rate was increased to include a surcharge equal to 4.5 basis points on assets in excess of $10.0 billion.
Bank shares and franchise taxes expense of $10.3 million for 2017 increased $1.3 million, or 14.7%, from $8.9 million in 2016, primarily due to an increase in the bank shares tax rate from 0.89% to 0.95%, effective beginning January 1, 2017, and an increase in the capital base of the Pennsylvania bank shares tax, partially offset by apportionment dilution from increased activity in other states during the same reporting tax period.
We recorded $56.5 million and $37.4 million in merger-related costs in 2017 and 2016, respectively. The 2017 costs were related to the YDKN acquisition, while the 2016 costs were associated with the METR acquisition, the Fifth Third branch purchase and the 2017 YDKN acquisition. These costs are specific to each individual transaction, and may vary significantly based on the size and complexity of the transaction.
Other non-interest expense was $78.2 million and $72.7 million for 2017 and 2016, respectively. During 2017, we recorded $6.2 million more in expense relating to historic and other tax credit investments and $3.1 million more in business development costs. We also incurred $3.1 million more in telephone expense and $1.4 million more in marketing expense, as we recognized additional costs associated with recent acquisitions. Additionally, miscellaneous losses increased $2.0 million from 2016, primarily due to higher credit card disputes and fraud losses given our expanded size and geographic footprint. Partially offsetting these increases to expense, supplies expense decreased $2.5 million, primarily due to the reclassification of $5.3 million in software subscriptions to equipment expense, partially offset by additional costs associated with the recent acquisitions. Also, we recorded $0.7 million less in OREO expense, primarily due to lower property write-downs that were taken in 2017 as compared to the level of write-downs taken in 2016. During 2016, we incurred a $2.6 million impairment charge on acquired other assets relating to low-income housing projects.
Income Taxes
Our income tax expense for 2017 increased $81.6 million, or 108.0%, from 2016, primarily due to the impact of a reduction in the valuation of net DTAs of $54.0 million due to the enactment of the TCJA. The effective tax rate was 44.1% for 2017, compared to 30.6% for 2016. The effective tax rate for 2016 was lower than the 35% federal statutory tax rate due to the tax benefits primarily resulting from tax-exempt income on investments and loans, tax credits and income from BOLI. The variance between 2017 and 2016 in income tax expense and effective tax rate primarily relates to the aforementioned reduction in valuation of net DTAs, combined with increases in merger expenses and in the level of renewable energy, historic and LIHTCs recognized in 2017.
55
FINANCIAL CONDITION
The following table presents our condensed Consolidated Balance Sheets:
TABLE 12
|
December 31
|
$
Change
|
%
Change
|
||||||||||||
|
(dollars in millions)
|
2018
|
2017
|
||||||||||||
|
Assets
|
||||||||||||||
|
Cash and cash equivalents
|
$
|
488
|
|
$
|
479
|
|
$
|
9
|
|
1.9
|
%
|
|||
|
Securities
|
6,595
|
|
6,007
|
|
588
|
|
9.8
|
|
||||||
|
Loans held for sale
|
22
|
|
93
|
|
(71
|
)
|
(76.3
|
)
|
||||||
|
Loans and leases, net
|
21,973
|
|
20,824
|
|
1,149
|
|
5.5
|
|
||||||
|
Goodwill and other intangibles
|
2,334
|
|
2,341
|
|
(7
|
)
|
(0.3
|
)
|
||||||
|
Other assets
|
1,690
|
|
1,674
|
|
16
|
|
1.0
|
|
||||||
|
Total Assets
|
$
|
33,102
|
|
$
|
31,418
|
|
$
|
1,684
|
|
5.4
|
%
|
|||
|
Liabilities and Stockholders’ Equity
|
||||||||||||||
|
Deposits
|
$
|
23,455
|
|
$
|
22,400
|
|
$
|
1,055
|
|
4.7
|
%
|
|||
|
Borrowings
|
4,756
|
|
4,347
|
|
409
|
|
9.4
|
|
||||||
|
Other liabilities
|
283
|
|
262
|
|
21
|
|
8.0
|
|
||||||
|
Total liabilities
|
28,494
|
|
27,009
|
|
1,485
|
|
5.5
|
|
||||||
|
Stockholders’ equity
|
4,608
|
|
4,409
|
|
199
|
|
4.5
|
|
||||||
|
Total Liabilities and Stockholders’ Equity
|
$
|
33,102
|
|
$
|
31,418
|
|
$
|
1,684
|
|
5.4
|
%
|
|||
Lending Activity
The loan and lease portfolio consists principally of loans and leases to individuals and small- and medium-sized businesses within our primary market in seven states and the District of Columbia. Our market coverage spans several major metropolitan areas including: Pittsburgh, Pennsylvania; Baltimore, Maryland; Cleveland, Ohio; and Charlotte, Raleigh, Durham and the Piedmont Triad (Winston-Salem, Greensboro and High Point) in North Carolina.
Following is a summary of loans and leases:
TABLE 13
|
December 31
|
2018
|
2017
|
2016
|
2015
|
2014
|
||||||||||||||
|
(in millions)
|
|||||||||||||||||||
|
Commercial real estate
|
$
|
8,786
|
|
$
|
8,742
|
|
$
|
5,435
|
|
$
|
4,109
|
|
$
|
3,816
|
|
||||
|
Commercial and industrial
|
4,556
|
|
4,170
|
|
3,043
|
|
2,602
|
|
2,318
|
|
|||||||||
|
Commercial leases
|
373
|
|
267
|
|
197
|
|
204
|
|
178
|
|
|||||||||
|
Other
|
46
|
|
17
|
|
36
|
|
39
|
|
41
|
|
|||||||||
|
Total commercial loans and leases
|
13,761
|
|
13,196
|
|
8,711
|
|
6,954
|
|
6,353
|
|
|||||||||
|
Direct installment
|
1,764
|
|
1,906
|
|
1,844
|
|
1,706
|
|
1,645
|
|
|||||||||
|
Residential mortgages
|
3,113
|
|
2,703
|
|
1,845
|
|
1,396
|
|
1,263
|
|
|||||||||
|
Indirect installment
|
1,933
|
|
1,448
|
|
1,196
|
|
997
|
|
875
|
|
|||||||||
|
Consumer lines of credit
|
1,582
|
|
1,746
|
|
1,301
|
|
1,137
|
|
1,111
|
|
|||||||||
|
Total consumer loans
|
8,392
|
|
7,803
|
|
6,186
|
|
5,236
|
|
4,894
|
|
|||||||||
|
Total loans and leases
|
$
|
22,153
|
|
$
|
20,999
|
|
$
|
14,897
|
|
$
|
12,190
|
|
$
|
11,247
|
|
||||
The loans and leases portfolio categories are comprised of the following:
|
•
|
Commercial real estate includes both owner-occupied and non-owner-occupied loans secured by commercial properties.
|
|
•
|
Commercial and industrial includes loans to businesses that are not secured by real estate.
|
56
|
•
|
Commercial leases consist of leases for new or used equipment.
|
|
•
|
Other is comprised primarily of credit cards and mezzanine loans.
|
|
•
|
Direct installment is comprised of fixed-rate, closed-end consumer loans for personal, family or household use, such as home equity loans and automobile loans.
|
|
•
|
Residential mortgages consist of conventional and jumbo mortgage loans for 1-4 family properties.
|
|
•
|
Indirect installment is comprised of loans originated by approved third parties and underwritten by us, primarily automobile loans.
|
|
•
|
Consumer lines of credit include home equity lines of credit and consumer lines of credit that are either unsecured or secured by collateral other than home equity.
|
Additional information relating to originated loans and loans acquired in a business combination is provided in Note 6, “Loans and Leases” in the Notes to Consolidated Financial Statements, which is included in Item 8 of this Report.
Total loans and leases
increased
$1.2 billion
, or
5.5%
, to
$22.2 billion
at
December 31, 2018
, compared to
$21.0 billion
at
December 31, 2017
, led by strong commercial loan activity and continued growth in the equipment finance and asset-based lending businesses. Additionally, we experienced strong growth in our residential mortgage and indirect installment portfolios.
Total loans and leases
increased
$6.1 billion
, or
41.0%
, to
$21.0 billion
at
December 31, 2017
, compared to
$14.9 billion
at
December 31, 2016
, as we acquired $5.1 billion in loans from the YDKN acquisition. Additionally, organic growth resulted in an additional increase of $1.0 billion in total loans.
As of
December 31, 2018
,
35.1%
of the commercial real estate loans were owner-occupied, while the remaining
64.9%
were non-owner-occupied, compared to
35.3%
and
64.7%
, respectively, as of
December 31, 2017
. As of both
December 31, 2018
and
2017
, we had commercial construction loans of
$1.2 billion
, representing
5.2%
and
5.6%
of total loans and leases, respectively. Additionally, as of
December 31, 2018
and
2017
, we had residential construction loans of
$273.4 million
and
$248.3 million
, representing
1.2%
and
1.1%
of total loans and leases, respectively.
Within our primary lending footprint, certain industries are more predominant given the geographic location of these lending markets. We strive to maintain a diverse commercial loan portfolio by avoiding undue concentrations or exposures to any particular sector, and we actively monitor our commercial loan portfolio to ensure that our industry mix is appropriate and within targeted thresholds. Several factors are taken into consideration when determining these thresholds, including recent economic and market trends. As of
December 31, 2018
and
2017
, there were
no
concentrations of loans relating to any industry in excess of 10% of total loans.
Following is a summary of the maturity distribution of certain loan categories with fixed and floating interest rates as of
December 31, 2018
:
TABLE 14
|
(in millions)
|
Within
1 Year
|
1-5
Years
|
Over
5 Years
|
Total
|
|||||||||||
|
Commercial loans and leases
|
$
|
1,666
|
|
$
|
6,037
|
|
$
|
6,058
|
|
$
|
13,761
|
|
|||
|
Residential mortgages
|
10
|
|
41
|
|
3,062
|
|
3,113
|
|
|||||||
|
Total
|
$
|
1,676
|
|
$
|
6,078
|
|
$
|
9,120
|
|
$
|
16,874
|
|
|||
|
Interest rates for loans with maturities over one year:
|
|||||||||||||||
|
Fixed
|
$
|
2,416
|
|
$
|
2,896
|
|
$
|
5,312
|
|
||||||
|
Floating
|
3,662
|
|
6,224
|
|
9,886
|
|
|||||||||
For additional information relating to lending activity, see Note 6, “Loans and Leases” in the Notes to Consolidated Financial Statements, which is included in Item 8 of this Report.
Non-Performing Assets
Non-performing loans include non-accrual loans and non-performing TDRs. Past due loans are reviewed on a monthly basis to identify loans for non-accrual status. We place a loan on non-accrual status and discontinue interest accruals on originated loans generally when principal or interest is due and has remained unpaid for a certain number of days, unless the loan is both well secured and in the process of collection. Commercial loans are placed on non-accrual at 90 days, installment loans are placed
57
on non-accrual at 120 days and residential mortgages and consumer lines of credit are generally placed on non-accrual at 180 days. When a loan is placed on non-accrual status, all unpaid accrued interest is reversed. Non-accrual loans may not be restored to accrual status until all delinquent principal and interest have been paid and the ultimate ability to collect the remaining principal and interest is reasonably assured. TDRs are loans in which the borrower has been granted a concession on the interest rate or the original repayment terms due to financial distress.
During
2018
, non-performing assets
decreased
$3.2 million
. This reflects an increase of
$4.5 million
in non-accrual loans and decreases of
$2.2 million
in TDRs and
$5.6 million
in OREO. The increase in non-accrual loans is attributable to the migration of a few commercial loans, partially offset by the commercial note sale that occurred during the second quarter of 2018. The decrease in TDRs is related to the sale of Regency, which resulted in a decrease of $2.7 million in TDRs. The decrease in OREO was primarily attributable to the sale of two commercial properties totaling $2.4 million during
2018
.
During
2017
, non-performing loans and OREO
increased
$20.3 million. This reflects an increase of $9.2 million in non-accrual loans, $3.1 million and $8.1 million in TDRs and OREO, respectively. The increase in non-accrual loans was primarily attributable to the migration of a few borrowers in the commercial real estate portfolio, while the increase in TDRs was due largely to the modification of an acquired commercial credit. The increase in OREO was largely due to the addition of properties that were acquired from YDKN.
Following is a summary of non-performing loans and leases, by class:
TABLE 15
|
December 31
|
2018
|
2017
|
2016
|
2015
|
2014
|
||||||||||||||
|
(in millions)
|
|||||||||||||||||||
|
Commercial real estate
|
$
|
23
|
|
$
|
31
|
|
$
|
21
|
|
$
|
26
|
|
$
|
26
|
|
||||
|
Commercial and industrial
|
37
|
|
23
|
|
26
|
|
15
|
|
9
|
|
|||||||||
|
Commercial leases
|
2
|
|
2
|
|
4
|
|
1
|
|
1
|
|
|||||||||
|
Other
|
1
|
|
1
|
|
1
|
|
—
|
|
—
|
|
|||||||||
|
Total commercial loans and leases
|
63
|
|
57
|
|
52
|
|
42
|
|
36
|
|
|||||||||
|
Direct installment
|
14
|
|
17
|
|
15
|
|
14
|
|
16
|
|
|||||||||
|
Residential mortgages
|
14
|
|
16
|
|
13
|
|
13
|
|
14
|
|
|||||||||
|
Indirect installment
|
2
|
|
2
|
|
2
|
|
1
|
|
1
|
|
|||||||||
|
Consumer lines of credit
|
7
|
|
6
|
|
4
|
|
2
|
|
2
|
|
|||||||||
|
Total consumer loans
|
37
|
|
41
|
|
34
|
|
30
|
|
33
|
|
|||||||||
|
Total non-performing loans and leases
|
$
|
100
|
|
$
|
98
|
|
$
|
86
|
|
$
|
72
|
|
$
|
69
|
|
||||
Following is a summary of non-performing assets:
TABLE 16
|
December 31
|
2018
|
2017
|
2016
|
2015
|
2014
|
||||||||||||||
|
(dollars in millions)
|
|||||||||||||||||||
|
Non-accrual loans
|
$
|
79
|
|
$
|
75
|
|
$
|
66
|
|
$
|
50
|
|
$
|
45
|
|
||||
|
Troubled debt restructurings
|
21
|
|
23
|
|
20
|
|
22
|
|
24
|
|
|||||||||
|
Total non-performing loans
|
100
|
|
98
|
|
86
|
|
72
|
|
69
|
|
|||||||||
|
Other real estate owned
|
35
|
|
41
|
|
32
|
|
39
|
|
41
|
|
|||||||||
|
Total non-performing assets
|
$
|
135
|
|
$
|
139
|
|
$
|
118
|
|
$
|
111
|
|
$
|
110
|
|
||||
|
Non-performing loans / total loans and leases
|
0.45
|
%
|
0.47
|
%
|
0.58
|
%
|
0.59
|
%
|
0.61
|
%
|
|||||||||
|
Non-performing loans + OREO / total loans and leases + OREO
|
0.61
|
%
|
0.66
|
%
|
0.79
|
%
|
0.91
|
%
|
0.97
|
%
|
|||||||||
|
Non-performing assets / total assets
|
0.41
|
%
|
0.44
|
%
|
0.54
|
%
|
0.63
|
%
|
0.68
|
%
|
|||||||||
TDRs are loans whose contractual terms have been modified in a manner that grants a concession to a borrower experiencing financial difficulties. TDRs typically result from loss mitigation activities and could include the extension of a maturity date,
58
interest rate reduction, principal forgiveness, deferral or decrease in payments for a period of time and other actions intended to minimize the economic loss and to avoid foreclosure or repossession of collateral.
TDRs that are accruing and performing include loans for which we can reasonably estimate the timing and amount of the expected cash flows on such loans and for which we expect to fully collect the new carrying value of the loans. TDRs that are accruing and non-performing are comprised of loans that have not demonstrated a consistent repayment pattern on the modified terms for more than six months, however it is expected that we will collect all future principal and interest payments. TDRs that are on non-accrual are not placed on accruing status until all delinquent principal and interest have been paid and the ultimate ability to collect the remaining principal and interest is reasonably assured. Some loan modifications classified as TDRs may not ultimately result in the full collection of principal and interest, as modified, and may result in incremental losses which are factored into the allowance for credit losses estimate. Additional information related to our TDRs is included in Note 6, “Loans and Leases” in the Notes to Consolidated Financial Statements, which is included in Item 8 of this Report.
59
Following is a summary of performing, non-performing and non-accrual originated TDRs, by class:
TABLE 17
|
(in millions)
|
Performing
|
Non-
Performing
|
Non-Accrual
|
Total
|
|||||||||||
|
December 31, 2018
|
|||||||||||||||
|
Commercial real estate
|
$
|
—
|
|
$
|
—
|
|
$
|
2
|
|
$
|
2
|
|
|||
|
Commercial and industrial
|
—
|
|
1
|
|
—
|
|
1
|
|
|||||||
|
Total commercial loans
|
—
|
|
1
|
|
2
|
|
3
|
|
|||||||
|
Direct installment
|
11
|
|
6
|
|
4
|
|
21
|
|
|||||||
|
Residential mortgages
|
5
|
|
8
|
|
3
|
|
16
|
|
|||||||
|
Consumer lines of credit
|
2
|
|
2
|
|
—
|
|
4
|
|
|||||||
|
Total consumer loans
|
18
|
|
16
|
|
7
|
|
41
|
|
|||||||
|
Total
|
$
|
18
|
|
$
|
17
|
|
$
|
9
|
|
$
|
44
|
|
|||
|
December 31, 2017
|
|||||||||||||||
|
Commercial real estate
|
$
|
—
|
|
$
|
—
|
|
$
|
4
|
|
$
|
4
|
|
|||
|
Commercial and industrial
|
3
|
|
—
|
|
—
|
|
3
|
|
|||||||
|
Total commercial loans
|
3
|
|
—
|
|
4
|
|
7
|
|
|||||||
|
Direct installment
|
11
|
|
8
|
|
3
|
|
22
|
|
|||||||
|
Residential mortgages
|
4
|
|
11
|
|
2
|
|
17
|
|
|||||||
|
Consumer lines of credit
|
2
|
|
1
|
|
1
|
|
4
|
|
|||||||
|
Total consumer loans
|
17
|
|
20
|
|
6
|
|
43
|
|
|||||||
|
Total
|
$
|
20
|
|
$
|
20
|
|
$
|
10
|
|
$
|
50
|
|
|||
|
December 31, 2016
|
|||||||||||||||
|
Commercial real estate
|
$
|
—
|
|
$
|
—
|
|
$
|
4
|
|
$
|
4
|
|
|||
|
Commercial and industrial
|
—
|
|
—
|
|
2
|
|
2
|
|
|||||||
|
Total commercial loans
|
—
|
|
—
|
|
6
|
|
6
|
|
|||||||
|
Direct installment
|
10
|
|
9
|
|
2
|
|
21
|
|
|||||||
|
Residential mortgages
|
5
|
|
10
|
|
1
|
|
16
|
|
|||||||
|
Consumer lines of credit
|
2
|
|
1
|
|
—
|
|
3
|
|
|||||||
|
Total consumer loans
|
17
|
|
20
|
|
3
|
|
40
|
|
|||||||
|
Total
|
$
|
17
|
|
$
|
20
|
|
$
|
9
|
|
$
|
46
|
|
|||
|
December 31, 2015
|
|||||||||||||||
|
Commercial real estate
|
$
|
—
|
|
$
|
2
|
|
$
|
6
|
|
$
|
8
|
|
|||
|
Commercial and industrial
|
—
|
|
—
|
|
1
|
|
1
|
|
|||||||
|
Total commercial loans
|
—
|
|
2
|
|
7
|
|
9
|
|
|||||||
|
Direct installment
|
8
|
|
9
|
|
1
|
|
18
|
|
|||||||
|
Residential mortgages
|
5
|
|
10
|
|
1
|
|
16
|
|
|||||||
|
Consumer lines of credit
|
2
|
|
1
|
|
—
|
|
3
|
|
|||||||
|
Total consumer loans
|
15
|
|
20
|
|
2
|
|
37
|
|
|||||||
|
Total
|
$
|
15
|
|
$
|
22
|
|
$
|
9
|
|
$
|
46
|
|
|||
|
December 31, 2014
|
|||||||||||||||
|
Commercial real estate
|
$
|
—
|
|
$
|
2
|
|
$
|
6
|
|
$
|
8
|
|
|||
|
Commercial and industrial
|
1
|
|
1
|
|
—
|
|
2
|
|
|||||||
|
Total commercial loans
|
1
|
|
3
|
|
6
|
|
10
|
|
|||||||
|
Direct installment
|
5
|
|
9
|
|
1
|
|
15
|
|
|||||||
|
Residential mortgages
|
3
|
|
11
|
|
1
|
|
15
|
|
|||||||
|
Consumer lines of credit
|
—
|
|
1
|
|
—
|
|
1
|
|
|||||||
|
Total consumer loans
|
8
|
|
21
|
|
2
|
|
31
|
|
|||||||
|
Total
|
$
|
9
|
|
$
|
24
|
|
$
|
8
|
|
$
|
41
|
|
|||
60
Following is a summary of loans and leases 90 days or more past due on which interest accruals continue:
TABLE 18
|
December 31
|
2018
|
2017
|
2016
|
2015
|
2014
|
||||||||||||||
|
(dollars in millions)
|
|
|
|
|
|
|
|
|
|
|
|||||||||
|
Loans and leases 90 days or more past due:
|
|||||||||||||||||||
|
Originated loans and leases
|
$
|
5
|
|
$
|
9
|
|
$
|
9
|
|
$
|
7
|
|
$
|
9
|
|
||||
|
Loans acquired in a business combination
|
53
|
|
90
|
|
41
|
|
30
|
|
38
|
|
|||||||||
|
Total loans and leases 90 days or more past due
|
$
|
58
|
|
$
|
99
|
|
$
|
50
|
|
$
|
37
|
|
$
|
47
|
|
||||
|
As a percentage of total loans and leases
|
0.26
|
%
|
0.47
|
%
|
0.33
|
%
|
0.30
|
%
|
0.42
|
%
|
|||||||||
The increase in loans and leases 90 days or more past due and accruing in 2017 was primarily the result of the YDKN acquisition. Loans acquired in a business combination that are 90 days or more past due are considered to be accruing since we can reasonably estimate future cash flows and we expect to fully collect the carrying value of these loans. The loans acquired in a business combination were discounted and marked to fair value with interest income recognized via accretion in accordance with GAAP.
Following is a table showing the amounts of contractual interest income and actual interest income related to non-accrual loans and non-performing TDRs:
TABLE 19
|
December 31
|
2018
|
2017
|
2016
|
2015
|
2014
|
||||||||||||||
|
(in millions)
|
|||||||||||||||||||
|
Gross interest income:
|
|||||||||||||||||||
|
Per contractual terms
|
$
|
15
|
|
$
|
23
|
|
$
|
12
|
|
$
|
7
|
|
$
|
7
|
|
||||
|
Recorded during the year
|
1
|
|
1
|
|
1
|
|
1
|
|
1
|
|
|||||||||
Allowance for Credit Losses
The allowance for credit losses represents management’s estimate of probable loan losses inherent in the loan portfolio at a specific point in time. This estimate includes losses associated with specifically identified loans, as well as estimated probable credit losses inherent in the remainder of the loan portfolio. Additions are made to the allowance for credit losses through both periodic provisions charged to income and recoveries of losses previously recorded. Reductions to the allowance for credit losses occur as loans are charged off. Additional information related to our policy for our allowance for credit losses is included in the Application of Critical Accounting Policies section of this financial review and in Note 1, “Summary of Significant Accounting Policies” in the Notes to Consolidated Financial Statements, which is included in Item 8 of this Report.
61
Following is a summary of changes in the allowance for credit losses related to loans and leases:
TABLE 20
|
Year Ended December 31
|
2018
|
2017
|
2016
|
2015
|
2014
|
||||||||||||||
|
(dollars in millions)
|
|||||||||||||||||||
|
Balance at beginning of period
|
$
|
175
|
|
$
|
158
|
|
$
|
142
|
|
$
|
126
|
|
$
|
111
|
|
||||
|
Charge-offs:
|
|||||||||||||||||||
|
Commercial real estate
|
(7
|
)
|
(2
|
)
|
(7
|
)
|
(4
|
)
|
(7
|
)
|
|||||||||
|
Commercial and industrial
|
(20
|
)
|
(27
|
)
|
(19
|
)
|
(3
|
)
|
(4
|
)
|
|||||||||
|
Commercial leases
|
(3
|
)
|
(1
|
)
|
(1
|
)
|
(1
|
)
|
—
|
|
|||||||||
|
Other
|
(4
|
)
|
(4
|
)
|
(3
|
)
|
(2
|
)
|
(1
|
)
|
|||||||||
|
Commercial loans and leases
|
(34
|
)
|
(34
|
)
|
(30
|
)
|
(10
|
)
|
(12
|
)
|
|||||||||
|
Direct installment
|
(17
|
)
|
(12
|
)
|
(10
|
)
|
(11
|
)
|
(10
|
)
|
|||||||||
|
Residential mortgages
|
—
|
|
—
|
|
—
|
|
(1
|
)
|
(1
|
)
|
|||||||||
|
Indirect installment
|
(9
|
)
|
(10
|
)
|
(8
|
)
|
(6
|
)
|
(3
|
)
|
|||||||||
|
Consumer lines of credit
|
(3
|
)
|
(2
|
)
|
(2
|
)
|
(2
|
)
|
(1
|
)
|
|||||||||
|
Consumer loans
|
(29
|
)
|
(24
|
)
|
(20
|
)
|
(20
|
)
|
(15
|
)
|
|||||||||
|
Purchased impaired loans
|
—
|
|
(1
|
)
|
—
|
|
—
|
|
(3
|
)
|
|||||||||
|
Other loans acquired in a business combination
|
(7
|
)
|
(1
|
)
|
(1
|
)
|
(1
|
)
|
(1
|
)
|
|||||||||
|
Total charge-offs
|
(70
|
)
|
(60
|
)
|
(51
|
)
|
(31
|
)
|
(31
|
)
|
|||||||||
|
Recoveries:
|
|||||||||||||||||||
|
Commercial real estate
|
3
|
|
2
|
|
4
|
|
1
|
|
2
|
|
|||||||||
|
Commercial and industrial
|
2
|
|
2
|
|
2
|
|
2
|
|
2
|
|
|||||||||
|
Other
|
—
|
|
1
|
|
—
|
|
—
|
|
—
|
|
|||||||||
|
Commercial loans and leases
|
5
|
|
5
|
|
6
|
|
3
|
|
4
|
|
|||||||||
|
Direct installment
|
2
|
|
2
|
|
2
|
|
2
|
|
1
|
|
|||||||||
|
Indirect installment
|
4
|
|
4
|
|
2
|
|
1
|
|
1
|
|
|||||||||
|
Consumer lines of credit
|
—
|
|
—
|
|
—
|
|
—
|
|
—
|
|
|||||||||
|
Consumer loans
|
6
|
|
6
|
|
4
|
|
3
|
|
2
|
|
|||||||||
|
Other loans acquired in a business combination
|
3
|
|
5
|
|
1
|
|
1
|
|
1
|
|
|||||||||
|
Total recoveries
|
14
|
|
16
|
|
11
|
|
7
|
|
7
|
|
|||||||||
|
Net charge-offs
|
(56
|
)
|
(44
|
)
|
(40
|
)
|
(24
|
)
|
(24
|
)
|
|||||||||
|
Provision for credit losses
|
61
|
|
61
|
|
56
|
|
40
|
|
39
|
|
|||||||||
|
Balance at end of period
|
$
|
180
|
|
$
|
175
|
|
$
|
158
|
|
$
|
142
|
|
$
|
126
|
|
||||
|
Net loan charge-offs/average loans
|
0.26
|
%
|
0.22
|
%
|
0.28
|
%
|
0.21
|
%
|
0.23
|
%
|
|||||||||
|
Allowance for credit losses/total loans and leases
|
0.81
|
%
|
0.84
|
%
|
1.06
|
%
|
1.16
|
%
|
1.12
|
%
|
|||||||||
|
Allowance for credit losses/non-performing loans
|
180.37
|
%
|
178.75
|
%
|
183.99
|
%
|
197.44
|
%
|
183.69
|
%
|
|||||||||
The allowance for credit losses at
December 31, 2018
increased $4.3 million or 2.4% from December 31, 2017, in response to growth in originated loans and leases and a small increase in originated criticized commercial loans. The provision for credit losses during 2018 was $61.2 million, which covered net charge-offs and supported organic loan growth. The amount of provision expense that resulted from the small increase in originated criticized commercial loans was offset by a provision benefit received through a decline in the overall delinquency and non-performing loan level in 2018. Net charge-offs were $56.0 million, or 0.26% of average loans, compared to $43.8 million, or 0.22% of average loans, in 2017, with the increase primarily due to $13.4 million, or 6 basis points, relating to the sale of a small portfolio of non-performing loans in the second quarter of 2018 and the sale of Regency in the third quarter of 2018.
The allowance for credit losses at December 31, 2017 increased $17.3 million or 11.0% from December 31, 2016, primarily in support of organic loan growth and to a lesser extent, moderate credit migration in commercial and industrial. The provision
62
for credit losses for 2017 was $61.1 million, compared to $55.8 million in 2016. Net charge-offs totaled $43.8 million, or 0.22% of average loans, compared to $39.7 million, or 0.28% of average loans, in 2016.
The allowance for credit losses at December 31, 2016 increased $16.1 million, or 11.3%, from December 31, 2015, primarily in support of organic loan growth and credit migration. The provision for credit losses for 2016 was $55.8 million, due to organic loan growth and net charge-offs of $39.7 million, which included a $4.0 million charge-off from a single commercial relationship involving a borrower alleged to have falsified documents and financial information over an extended period of time, and credit migration.
The allowance for credit losses at December 31, 2015 increased $16.1 million, or 12.8%, from December 31, 2014, as the provision for credit losses for 2015 of $40.4 million exceeded net charge-offs of $24.4 million, with the remainder supporting loan growth in the originated portfolio and some credit migration within the commercial and industrial and indirect installment portfolios.
The allowance for credit losses at December 31, 2014 increased $15.1 million, or 13.7%, from December 31, 2013, as the provision for credit losses for 2014 of $38.6 million exceeded net charge-offs of $23.5 million, with the remainder supporting loan growth and incurred losses in the originated and acquired loan portfolios.
Following is a summary of the allocation of the allowance for credit losses and the percentage of loans in each category to total loans:
TABLE 21
|
December 31
|
2018
|
2017
|
2016
|
2015
|
2014
|
|||||||||||||||||||||||||||||
|
(dollars in millions)
|
Allowance
|
% of
Loans |
Allowance
|
% of
Loans |
Allowance
|
% of
Loans |
Allowance
|
% of
Loans |
Allowance
|
% of
Loans |
||||||||||||||||||||||||
|
Commercial real estate
|
$
|
55
|
|
28
|
%
|
$
|
50
|
|
25
|
%
|
$
|
47
|
|
28
|
%
|
$
|
42
|
|
29
|
%
|
$
|
37
|
|
27
|
%
|
|||||||||
|
Commercial and industrial
|
49
|
|
19
|
|
52
|
|
17
|
|
48
|
|
18
|
|
41
|
|
21
|
|
33
|
|
19
|
|
||||||||||||||
|
Commercial leases
|
8
|
|
2
|
|
5
|
|
1
|
|
3
|
|
1
|
|
2
|
|
1
|
|
2
|
|
2
|
|
||||||||||||||
|
Other
|
2
|
|
—
|
|
2
|
|
—
|
|
1
|
|
—
|
|
1
|
|
—
|
|
1
|
|
—
|
|
||||||||||||||
|
Commercial loans and leases
|
114
|
|
49
|
|
109
|
|
43
|
|
99
|
|
47
|
|
86
|
|
51
|
|
73
|
|
48
|
|
||||||||||||||
|
Direct installment
|
14
|
|
7
|
|
21
|
|
8
|
|
21
|
|
12
|
|
22
|
|
14
|
|
21
|
|
14
|
|
||||||||||||||
|
Residential mortgages
|
20
|
|
12
|
|
16
|
|
10
|
|
10
|
|
10
|
|
8
|
|
9
|
|
8
|
|
7
|
|
||||||||||||||
|
Indirect installment
|
15
|
|
9
|
|
12
|
|
7
|
|
11
|
|
8
|
|
10
|
|
8
|
|
8
|
|
8
|
|
||||||||||||||
|
Consumer lines of credit
|
10
|
|
5
|
|
10
|
|
5
|
|
10
|
|
7
|
|
9
|
|
8
|
|
8
|
|
9
|
|
||||||||||||||
|
Consumer loans
|
59
|
|
33
|
|
59
|
|
30
|
|
52
|
|
37
|
|
49
|
|
39
|
|
45
|
|
38
|
|
||||||||||||||
|
Total originated loans
|
173
|
|
82
|
|
168
|
|
73
|
|
151
|
|
84
|
|
135
|
|
90
|
|
118
|
|
86
|
|
||||||||||||||
|
Purchased credit- impaired loans
|
1
|
|
—
|
|
1
|
|
—
|
|
1
|
|
—
|
|
1
|
|
—
|
|
1
|
|
—
|
|
||||||||||||||
|
Other loans acquired in a business combination
|
6
|
|
18
|
|
6
|
|
27
|
|
6
|
|
16
|
|
6
|
|
10
|
|
7
|
|
14
|
|
||||||||||||||
|
Total
|
$
|
180
|
|
100
|
%
|
$
|
175
|
|
100
|
%
|
$
|
158
|
|
100
|
%
|
$
|
142
|
|
100
|
%
|
$
|
126
|
|
100
|
%
|
|||||||||
During 2018, the allowance for credit losses allocated to commercial real estate, commercial and industrial, commercial leases, residential mortgages and indirect installment loans all increased to support organic loan growth. The allowance for credit losses allocated to direct installment loans decreased as a result of the sale of Regency. The allowance for credit losses allocated to other loans acquired in a business combination decreased due to improved credit quality.
During 2017, the allowance for credit losses allocated to commercial real estate, residential mortgages and indirect loans all increased to support organic loan growth. The allowance for credit losses allocated to commercial and industrial increased to support organic growth and moderate credit migration.
During 2016, the allowance for credit losses allocated to commercial loans increased to support organic loan growth, as well as migration within the commercial and industrial portfolio, which was impacted by the continued softness in the commodity industries, that adversely impacted certain borrowers operating in this area. The allowance for credit losses allocated to residential mortgages increased during 2016 largely due to organic growth within that portfolio.
63
During 2015, the allowance for credit losses allocated to commercial loans and consumer loans increased to support organic loan growth, while a portion of the allocated commercial and industrial and indirect installment allowance for credit losses also supported some limited credit migration within those portfolios. The allowance for credit losses allocated to residential mortgages decreased slightly during this same period, which was the result of growth-related reserves being more than offset by general improvements in asset quality within that portfolio. The allowance for credit losses allocated to loans acquired in a business combination decreased during the year as a result of favorable quarterly cash flow re-estimation results and problem credit resolution, with the PVF Capital Corp., ANNB, and Comm Bancorp, Inc. portfolios driving the decrease.
During 2014, the allowance for credit losses allocated to commercial loans, consumer loans and residential mortgages increased to support organic loan growth. The allowance for credit losses increased as a result of the growth in each of the loan portfolios noted above and was partially offset by allowance declines as a result of the general improvement in asset quality and charge-offs throughout 2014, particularly in the commercial loan portfolios. Furthermore, we expanded the number of modeling segments in 2014, which allowed for a more precise allowance calculation and moderately offset the required allowance as a result of organic loan growth. The allowance for credit losses allocated to loans acquired in a business combination increased during the year as a result of the quarterly cash flow re-estimation process, moderate builds in a few loan pools and, to a lesser extent, the addition of the BCSB and OBA portfolios.
Investment Activity
Investment activities serve to enhance net interest income while supporting interest rate sensitivity and liquidity positions. Securities purchased with the intent and ability to hold until maturity are categorized as securities HTM and carried at amortized cost. All other securities are categorized as securities AFS and are recorded at fair value. Securities, like loans, are subject to similar interest rate and credit risk. In addition, by their nature, securities classified as AFS are also subject to fair value risks that could negatively affect the level of liquidity available to us, as well as stockholders’ equity. A change in the value of securities HTM could also negatively affect the level of stockholders’ equity if there was a decline in the underlying creditworthiness of the issuers and an OTTI is deemed to have occurred or if there was a change in our intent and ability to hold the securities to maturity.
As of
December 31, 2018
, debt securities classified as AFS and HTM each totaled
$3.3 billion
. During
2018
, debt securities AFS
increased
by
$576.9 million
and debt securities HTM
increased
by
$11.7 million
from
December 31, 2017
. As of
December 31, 2018
and
2017
, we did not hold any trading securities.
64
The following table indicates the respective maturities and weighted-average yields of debt securities as of
December 31, 2018
:
TABLE 22
|
(dollars in millions)
|
Amount
|
Weighted
Average
Yield
|
||||
|
Obligations of U.S. Treasury:
|
||||||
|
Maturing after ten years
|
$
|
1
|
|
5.25
|
%
|
|
|
Obligations of U.S. government agencies:
|
||||||
|
Maturing after one year but within five years
|
2
|
|
3.60
|
|
||
|
Maturing after five years but within ten years
|
60
|
|
3.11
|
|
||
|
Maturing after ten years
|
127
|
|
2.79
|
|
||
|
Obligations of U.S. government-sponsored entities:
|
||||||
|
Maturing within one year
|
131
|
|
1.65
|
|
||
|
Maturing after one year but within five years
|
397
|
|
1.73
|
|
||
|
States of the U.S. and political subdivisions:
|
||||||
|
Maturing within one year
|
5
|
|
2.34
|
|
||
|
Maturing after one year but within five years
|
22
|
|
2.47
|
|
||
|
Maturing after five years but within ten years
|
121
|
|
3.44
|
|
||
|
Maturing after ten years
|
953
|
|
3.67
|
|
||
|
Other debt securities:
|
||||||
|
Maturing after five years but within ten years
|
2
|
|
3.38
|
|
||
|
Residential mortgage-backed securities:
|
||||||
|
Agency mortgage-backed securities
|
2,465
|
|
2.22
|
|
||
|
Agency collateralized mortgage obligations
|
1,955
|
|
2.54
|
|
||
|
Commercial mortgage-backed securities
|
354
|
|
3.38
|
|
||
|
Total
|
$
|
6,595
|
|
2.58
|
|
|
The weighted average yields for tax-exempt debt securities are computed on an FTE basis using the federal statutory tax rate of 21.0%. The weighted average yields for debt securities AFS are based on amortized cost.
65
The amortized cost of AFS and HTM securities are summarized in the following table:
TABLE 23
|
December 31
|
2018
|
2017
|
2016
|
||||||||
|
(in millions)
|
|||||||||||
|
Securities Available for Sale:
|
|||||||||||
|
U.S. Treasury
|
$
|
—
|
|
$
|
—
|
|
$
|
30
|
|
||
|
U.S. government agencies
|
188
|
|
—
|
|
—
|
|
|||||
|
U.S. government-sponsored entities
|
317
|
|
348
|
|
368
|
|
|||||
|
Residential mortgage-backed securities:
|
|||||||||||
|
Agency mortgage-backed securities
|
1,465
|
|
1,615
|
|
1,267
|
|
|||||
|
Agency collateralized mortgage obligations
|
1,179
|
|
813
|
|
547
|
|
|||||
|
Non-agency collateralized mortgage obligations
|
—
|
|
—
|
|
1
|
|
|||||
|
Commercial mortgage-backed securities
|
229
|
|
—
|
|
1
|
|
|||||
|
States of the U.S. and political subdivisions
|
21
|
|
21
|
|
36
|
|
|||||
|
Other debt securities
|
2
|
|
5
|
|
10
|
|
|||||
|
Total debt securities
|
3,401
|
|
2,802
|
|
2,260
|
|
|||||
|
Equity securities
|
—
|
|
1
|
|
—
|
|
|||||
|
Total securities available for sale
|
$
|
3,401
|
|
$
|
2,803
|
|
$
|
2,260
|
|
||
|
Debt Securities Held to Maturity:
|
|||||||||||
|
U.S. Treasury
|
$
|
1
|
|
$
|
1
|
|
$
|
1
|
|
||
|
U.S. government agencies
|
2
|
|
—
|
|
—
|
|
|||||
|
U.S. government-sponsored entities
|
215
|
|
247
|
|
272
|
|
|||||
|
Residential mortgage-backed securities:
|
|||||||||||
|
Agency mortgage-backed securities
|
1,036
|
|
1,220
|
|
852
|
|
|||||
|
Agency collateralized mortgage obligations
|
794
|
|
777
|
|
743
|
|
|||||
|
Non-agency collateralized mortgage obligations
|
—
|
|
—
|
|
2
|
|
|||||
|
Commercial mortgage-backed securities
|
126
|
|
80
|
|
50
|
|
|||||
|
States of the U.S. and political subdivisions
|
1,080
|
|
917
|
|
417
|
|
|||||
|
Total debt securities held to maturity
|
$
|
3,254
|
|
$
|
3,242
|
|
$
|
2,337
|
|
||
For additional information relating to investment activity, see Note 4, “Securities” in the Notes to Consolidated Financial Statements, which is included in Item 8 of this Report.
Deposits
As a bank holding company, our primary source of funds is deposits. These deposits are provided by businesses, municipalities and individuals located within the markets served by our Community Banking subsidiary.
Following is a summary of deposits:
TABLE 24
|
December 31
|
2018
|
2017
|
$
Change
|
%
Change
|
||||||||||
|
(in millions)
|
||||||||||||||
|
Non-interest-bearing demand
|
$
|
6,000
|
|
$
|
5,720
|
|
$
|
280
|
|
4.9
|
%
|
|||
|
Interest-bearing demand
|
9,660
|
|
9,571
|
|
89
|
|
0.9
|
|
||||||
|
Savings
|
2,526
|
|
2,488
|
|
38
|
|
1.5
|
|
||||||
|
Certificates and other time deposits
|
5,269
|
|
4,621
|
|
648
|
|
14.0
|
|
||||||
|
Total deposits
|
$
|
23,455
|
|
$
|
22,400
|
|
$
|
1,055
|
|
4.7
|
%
|
|||
66
Total deposits
increased
during
2018
, primarily as a result of growth in non-interest-bearing demand balances and certificates and other time deposits. The growth reflects heightened deposit-gathering efforts during
2018
focused on attracting new customer relationships through targeted promotional interest rates on 13-month, 19-month and 25-month certificates of deposit, combined with deepening relationships with existing customers through internal lead generation efforts. Relationship-based transaction deposits, which are comprised of demand (non-interest-bearing and interest-bearing) and savings accounts (including money market savings), also increased over this period. Generating growth in relationship-based transaction deposits remains a key focus for us and will help us manage to lower levels of short-term borrowings.
Following is a summary of time deposits of $100,000 or more by remaining maturity at
December 31, 2018
:
TABLE 25
|
(in millions)
|
Certificates
of Deposit
|
Other
Time
Deposits
|
Total
|
||||||||
|
Three months or less
|
$
|
293
|
|
$
|
12
|
|
$
|
305
|
|
||
|
Three to six months
|
334
|
|
17
|
|
351
|
|
|||||
|
Six to twelve months
|
725
|
|
32
|
|
757
|
|
|||||
|
Over twelve months
|
886
|
|
154
|
|
1,040
|
|
|||||
|
Total
|
$
|
2,238
|
|
$
|
215
|
|
$
|
2,453
|
|
||
Short-Term Borrowings
Borrowings with original maturities of one year or less are classified as short-term. Short-term borrowings, made up of customer repurchase agreements (also referred to as securities sold under repurchase agreements), FHLB advances, federal funds purchased and subordinated notes,
increased
to
$4.1 billion
at
December 31, 2018
from
$3.7 billion
at
December 31, 2017
, primarily due to an increase of $0.5 billion in federal funds purchased.
Following is a summary of selected information relating to certain components of short-term borrowings:
TABLE 26
|
At or for the Year Ended December 31
|
2018
|
2017
|
2016
|
||||||||
|
(dollars in millions)
|
|||||||||||
|
FHLB Advances (Short-term)
|
|||||||||||
|
Balance at year-end
|
$
|
2,230
|
|
$
|
2,285
|
|
$
|
1,025
|
|
||
|
Maximum month-end balance
|
2,800
|
|
2,780
|
|
1,075
|
|
|||||
|
Average balance during year
|
1,932
|
|
1,868
|
|
491
|
|
|||||
|
Weighted average interest rates:
|
|||||||||||
|
At year-end
|
2.64
|
%
|
1.53
|
%
|
0.73
|
%
|
|||||
|
During the year
|
2.14
|
%
|
1.20
|
%
|
0.59
|
%
|
|||||
|
Federal Funds Purchased
|
|||||||||||
|
Balance at year-end
|
$
|
1,535
|
|
$
|
1,000
|
|
$
|
1,037
|
|
||
|
Maximum month-end balance
|
1,830
|
|
1,607
|
|
1,238
|
|
|||||
|
Average balance during year
|
1,585
|
|
1,460
|
|
1,045
|
|
|||||
|
Weighted average interest rates:
|
|||||||||||
|
At year-end
|
2.51
|
%
|
1.38
|
%
|
0.62
|
%
|
|||||
|
During the year
|
1.93
|
%
|
1.10
|
%
|
0.49
|
%
|
|||||
For additional information relating to deposits and short-term borrowings, see Note 11, “Deposits” and Note 12, “Short-Term Borrowings” in the Notes to Consolidated Financial Statements, which is included in Item 8 of this Report.
67
Capital Resources
The access to, and cost of, funding for new business initiatives, including acquisitions, the ability to engage in expanded business activities, the ability to pay dividends and the level and nature of regulatory oversight depend, in part, on our capital position.
The assessment of capital adequacy depends on a number of factors such as expected organic growth in the Consolidated Balance Sheet, asset quality, liquidity, earnings performance, changing competitive conditions and economic forces. We seek to maintain a strong capital base to support our growth and expansion activities, to provide stability to current operations and to promote public confidence.
In accordance with the terms of our mergers with YDKN and METR, we issued common stock of 111,619,622 shares on March 11, 2017 and 34,041,181 shares on February 13, 2016, respectively.
We have an effective shelf registration statement filed with the SEC. Pursuant to this registration statement, we may, from time to time, issue and sell in one or more offerings any combination of common stock, preferred stock, debt securities, depositary shares, warrants, stock purchase contracts or units. Subsequent to year-end 2018, we completed an offering of $120.0 million aggregate principal amount of 4.950% fixed-to-floating subordinated notes due in 2029 under this registration statement. The subordinated notes are treated as tier 2 capital for regulatory capital purposes. The net proceeds of the debt offering after deducting underwriting discounts and commissions and offering expenses were approximately $118.3 million. We intend to use the net proceeds from the sale of the subordinated notes for general corporate purposes, which may include investments at the holding company level, providing capital to support the growth of FNBPA and our business, repurchases of our common shares, repayment of recurring obligations and refinancing of outstanding indebtedness and the payment of the cash consideration components of future acquisitions.
Capital management is a continuous process with capital plans and stress testing for FNB and FNBPA updated at least annually. These capital plans include assessing the adequacy of expected capital levels assuming various scenarios by projecting capital needs for a forecast period of 2-3 years beyond the current year. Both FNB and FNBPA are subject to various regulatory capital requirements administered by federal banking agencies. For additional information, see Note 21, “Regulatory Matters” in the Notes to the Consolidated Financial Statements, which is included in Item 8 of this Report. From time to time, we issue shares initially acquired by us as treasury stock under our various benefit plans. We may continue to grow through acquisitions, which can potentially impact our capital position. We may issue additional preferred or common stock in order to maintain our well-capitalized status.
CONTRACTUAL OBLIGATIONS, COMMITMENTS AND OFF-BALANCE SHEET ARRANGEMENTS
The following table sets forth contractual obligations of principal that represent required and potential cash outflows as of
December 31, 2018
:
TABLE 27
|
(in millions)
|
Within
1 Year |
1-3
Years |
3-5
Years |
After
5 Years |
Total
|
||||||||||||||
|
Deposits without a stated maturity
|
$
|
18,186
|
|
$
|
—
|
|
$
|
—
|
|
$
|
—
|
|
$
|
18,186
|
|
||||
|
Certificates and other time deposits
|
3,255
|
|
1,531
|
|
352
|
|
131
|
|
5,269
|
|
|||||||||
|
Operating leases
|
25
|
|
39
|
|
23
|
|
49
|
|
136
|
|
|||||||||
|
Long-term debt
|
158
|
|
172
|
|
10
|
|
287
|
|
627
|
|
|||||||||
|
Total
|
$
|
21,624
|
|
$
|
1,742
|
|
$
|
385
|
|
$
|
467
|
|
$
|
24,218
|
|
||||
68
The following table sets forth the amounts and expected maturities of commitments to extend credit and standby letters of credit as of
December 31, 2018
:
TABLE 28
|
(in millions)
|
Within
1 Year |
1-3
Years |
3-5
Years |
After
5 Years |
Total
|
||||||||||||||
|
Commitments to extend credit
|
$
|
4,864
|
|
$
|
1,384
|
|
$
|
613
|
|
$
|
517
|
|
$
|
7,378
|
|
||||
|
Standby letters of credit
|
122
|
|
4
|
|
—
|
|
—
|
|
126
|
|
|||||||||
|
Total
|
$
|
4,986
|
|
$
|
1,388
|
|
$
|
613
|
|
$
|
517
|
|
$
|
7,504
|
|
||||
Commitments to extend credit and standby letters of credit do not necessarily represent future cash requirements because while the borrower has the ability to draw upon these commitments at any time, these commitments often expire without being drawn upon. Additionally, a significant portion of these commitments can be terminated by FNB. For additional information relating to commitments to extend credit and standby letters of credit, see Note 15, “Commitments, Credit Risk and Contingencies” in the Notes to Consolidated Financial Statements, which is included in Item 8 of this Report.
LIQUIDITY
Our goal in liquidity management is to satisfy the cash flow requirements of customers and the operating cash needs of FNB with cost-effective funding. Our Board of Directors has established an Asset/Liability Management Policy to guide management in achieving and maintaining earnings performance consistent with long-term goals, while maintaining acceptable levels of interest rate risk, a “well-capitalized” Balance Sheet and adequate levels of liquidity. Our Board of Directors has also established a Contingency Funding Policy to guide management in addressing stressed liquidity conditions. These policies designate our Asset/Liability Committee as the body responsible for meeting these objectives. The ALCO, which is comprised of members of executive management, reviews liquidity on a continuous basis and approves significant changes in strategies that affect Balance Sheet or cash flow positions. Liquidity is centrally managed daily by our Treasury Department.
FNBPA generates liquidity from its normal business operations. Liquidity sources from assets include payments from loans and investments, as well as the ability to securitize, pledge or sell loans, investment securities and other assets. Liquidity sources from liabilities are generated primarily through the banking offices of FNBPA in the form of deposits and customer repurchase agreements. FNB also has access to reliable and cost-effective wholesale sources of liquidity. Short- and long-term funds can be acquired to help fund normal business operations, as well as to serve as contingency funding if we would be faced with a liquidity crisis.
The principal sources of the parent company’s liquidity are its strong existing cash resources plus dividends it receives from its subsidiaries. These dividends may be impacted by the parent’s or its subsidiaries’ capital needs, statutory laws and regulations, corporate policies, contractual restrictions, profitability and other factors. In addition, through one of our subsidiaries, we regularly issue subordinated notes, which are guaranteed by FNB. Cash on hand at the parent has been managed by various strategies over the last few years. One significant management strategy resulted in the sale of 100 percent of the issued and outstanding capital stock of Regency to Mariner Finance, LLC in exchange for cash consideration of $142 million. This transaction closed on August 31, 2018 and was the primary driver of the parent’s cash position increasing by
$88.7 million
from
$165.7 million
at
December 31, 2017
to
$254.4 million
at
December 31, 2018
. This transaction accomplished several strategic objectives, including offering additional liquidity. Other potential strategies that management employs include strong earnings, increasing earnings retention rate and capital actions.
Management believes our cash levels are appropriate given the current environment. Two metrics that are used to gauge the adequacy of the parent company’s cash position are the LCR and MCH. The LCR is defined as the sum of cash on hand plus projected cash inflows over the next 12 months divided by projected cash outflows over the next 12 months. The MCH is defined as the number of months of corporate expenses and dividends that can be covered by the cash on hand and was impacted by the sale of Regency and the YDKN acquisition.
69
The LCR and MCH ratios are presented in the following table:
TABLE 29
|
December 31
|
2018
|
2017
|
Internal
Limit
|
||
|
Liquidity coverage ratio
|
2.1 times
|
|
1.8 times
|
|
> 1 time
|
|
Months of cash on hand
|
14.4 months
|
|
10.2 months
|
|
> 12 months
|
The sale of Regency has resulted in MCH and LCR ratios that are in compliance with our Policy. The MCH ratio had fallen below our internal limit due to the YDKN acquisition in March 2017, as YDKN did not manage to a similar ratio and held only a minimal amount of cash on hand at their holding company.
Our liquidity position has been positively impacted by our ability to generate growth in relationship-based accounts. Organic growth in low-cost transaction deposits was complemented by management’s strategy of heightened deposit gathering efforts focused on attracting new customer relationships and deepening relationships with existing customers, in part through internal lead generation efforts leveraging data analytics capabilities. Total deposits were
$23.5 billion
at
December 31, 2018
, an increase of
$1.1 billion
, or
4.7%
, from
December 31, 2017
. Total non-interest-bearing demand deposit accounts grew by
$280.0 million
, or
4.9%
, total interest-bearing demand deposit accounts grew by
$89.0 million
, or
0.9%
,
savings accounts grew by
$37.5 million
, or
1.5%
, and time deposits grew by
$648.5 million
, or
14.0%
.
FNBPA has significant unused wholesale credit availability sources that include the availability to borrow from the FHLB, the FRB, correspondent bank lines, access to brokered deposits and multiple other channels. In addition to credit availability, FNBPA also possesses salable unpledged government and agency securities that could be utilized to meet funding needs. The ALCO Policy minimum guideline level for salable unpledged government and agency securities is 3.0%.
The following table presents certain information relating to FNBPA's credit availability and salable unpledged securities:
TABLE 30
|
December 31
|
2018
|
2017
|
|||||
|
(dollars in millions)
|
|||||||
|
Unused wholesale credit availability
|
$
|
9,659
|
|
$
|
8,189
|
|
|
|
Unused wholesale credit availability as a % of FNBPA assets
|
29.2
|
%
|
26.3
|
%
|
|||
|
Salable unpledged government and agency securities
|
$
|
2,424
|
|
$
|
2,232
|
|
|
|
Salable unpledged government and agency securities as a % of FNBPA assets
|
7.3
|
%
|
7.2
|
%
|
|||
Another metric for measuring liquidity risk is the liquidity gap analysis. The following liquidity gap analysis as of
December 31, 2018
compares the difference between our cash flows from existing earning assets and interest-bearing liabilities over future time intervals. Management seeks to limit the size of the liquidity gaps so that sources and uses of funds are reasonably matched in the normal course of business. A reasonably matched position lays a better foundation for dealing with additional funding needs during a potential liquidity crisis. The twelve-month cumulative gap to total assets ratio was
(7.1)%
and (5.8)% as of
December 31, 2018
and
2017
, respectively. Management calculates this ratio at least quarterly and it is reviewed monthly by ALCO.
70
TABLE 31
|
(dollars in millions)
|
Within
1 Month
|
2-3
Months
|
4-6
Months
|
7-12
Months
|
Total
1 Year
|
||||||||||||||
|
Assets
|
|||||||||||||||||||
|
Loans
|
$
|
473
|
|
$
|
890
|
|
$
|
1,307
|
|
$
|
2,365
|
|
$
|
5,035
|
|
||||
|
Investments
|
109
|
|
179
|
|
233
|
|
522
|
|
1,043
|
|
|||||||||
|
582
|
|
1,069
|
|
1,540
|
|
2,887
|
|
6,078
|
|
||||||||||
|
Liabilities
|
|||||||||||||||||||
|
Non-maturity deposits
|
178
|
|
356
|
|
534
|
|
1,067
|
|
2,135
|
|
|||||||||
|
Time deposits
|
579
|
|
606
|
|
702
|
|
1,369
|
|
3,256
|
|
|||||||||
|
Borrowings
|
2,853
|
|
131
|
|
25
|
|
42
|
|
3,051
|
|
|||||||||
|
3,610
|
|
1,093
|
|
1,261
|
|
2,478
|
|
8,442
|
|
||||||||||
|
Period Gap (Assets - Liabilities)
|
$
|
(3,028
|
)
|
$
|
(24
|
)
|
$
|
279
|
|
$
|
409
|
|
$
|
(2,364
|
)
|
||||
|
Cumulative Gap
|
$
|
(3,028
|
)
|
$
|
(3,052
|
)
|
$
|
(2,773
|
)
|
$
|
(2,364
|
)
|
|||||||
|
Cumulative Gap to Total Assets
|
(9.1
|
)%
|
(9.2
|
)%
|
(8.4
|
)%
|
(7.1
|
)%
|
|||||||||||
In addition, the ALCO regularly monitors various liquidity ratios and stress scenarios of our liquidity position. The stress scenarios forecast that adequate funding will be available even under severe conditions. Management believes we have sufficient liquidity available to meet our normal operating and contingency funding cash needs.
MARKET RISK
Market risk refers to potential losses arising from changes in interest rates, foreign exchange rates, equity prices and commodity prices. We are primarily exposed to interest rate risk inherent in our lending and deposit-taking activities as a financial intermediary. To succeed in this capacity, we offer an extensive variety of financial products to meet the diverse needs of our customers. These products sometimes contribute to interest rate risk for us when product groups do not complement one another. For example, depositors may want short-term deposits while borrowers desire long-term loans.
Changes in market interest rates may result in changes in the fair value of our financial instruments, cash flows and net interest income. The ALCO is responsible for market risk management which involves devising policy guidelines, risk measures and limits, and managing the amount of interest rate risk and its effect on net interest income and capital. We use derivative financial instruments for interest rate risk management purposes and not for trading or speculative purposes.
Interest rate risk is comprised of repricing risk, basis risk, yield curve risk and options risk. Repricing risk arises from differences in the cash flow or repricing between asset and liability portfolios. Basis risk arises when asset and liability portfolios are related to different market rate indexes, which do not always change by the same amount. Yield curve risk arises when asset and liability portfolios are related to different maturities on a given yield curve; when the yield curve changes shape, the risk position is altered. Options risk arises from “embedded options” within asset and liability products as certain borrowers have the option to prepay their loans when rates fall, while certain depositors can redeem their certificates of deposit early when rates rise.
We use an asset/liability model to measure our interest rate risk. Interest rate risk measures we utilize include earnings simulation, EVE and gap analysis. Gap analysis and EVE are static measures that do not incorporate assumptions regarding future business. Gap analysis, while a helpful diagnostic tool, displays cash flows for only a single rate environment. EVE’s long-term horizon helps identify changes in optionality and longer-term positions. However, EVE’s liquidation perspective does not translate into the earnings-based measures that are the focus of managing and valuing a going concern. Net interest income simulations explicitly measure the exposure to earnings from changes in market rates of interest. In these simulations, our current financial position is combined with assumptions regarding future business to calculate net interest income under various hypothetical rate scenarios. The ALCO reviews earnings simulations over multiple years under various interest rate scenarios on a periodic basis. Reviewing these various measures provides us with a comprehensive view of our interest rate risk profile.
71
The following repricing gap analysis as of
December 31, 2018
compares the difference between the amount of interest-earning assets and interest-bearing liabilities subject to repricing over a period of time. Management utilizes the repricing gap analysis as a diagnostic tool in managing net interest income and EVE risk measures.
TABLE 32
|
(dollars in millions)
|
Within
1 Month
|
2-3
Months
|
4-6
Months
|
7-12
Months
|
Total
1 Year
|
||||||||||||||
|
Assets
|
|||||||||||||||||||
|
Loans
|
$
|
9,872
|
|
$
|
741
|
|
$
|
856
|
|
$
|
1,530
|
|
$
|
12,999
|
|
||||
|
Investments
|
117
|
|
189
|
|
400
|
|
513
|
|
1,219
|
|
|||||||||
|
9,989
|
|
930
|
|
1,256
|
|
2,043
|
|
14,218
|
|
||||||||||
|
Liabilities
|
|||||||||||||||||||
|
Non-maturity deposits
|
6,365
|
|
—
|
|
—
|
|
—
|
|
6,365
|
|
|||||||||
|
Time deposits
|
668
|
|
606
|
|
700
|
|
1,365
|
|
3,339
|
|
|||||||||
|
Borrowings
|
3,269
|
|
1,057
|
|
10
|
|
12
|
|
4,348
|
|
|||||||||
|
10,302
|
|
1,663
|
|
710
|
|
1,377
|
|
14,052
|
|
||||||||||
|
Off-balance sheet
|
(100
|
)
|
855
|
|
—
|
|
—
|
|
755
|
|
|||||||||
|
Period Gap (assets - liabilities + off-balance sheet)
|
$
|
(413
|
)
|
$
|
122
|
|
$
|
546
|
|
$
|
666
|
|
$
|
921
|
|
||||
|
Cumulative Gap
|
$
|
(413
|
)
|
$
|
(291
|
)
|
$
|
255
|
|
$
|
921
|
|
|||||||
|
Cumulative Gap to Assets
|
(1.4
|
)%
|
(1.0
|
)%
|
0.9
|
%
|
3.2
|
%
|
|||||||||||
The twelve-month cumulative repricing gap to total assets was
3.2%
and 3.0% as of
December 31, 2018
and
2017
, respectively. The positive cumulative gap positions indicate that we have a greater amount of repricing earning assets than repricing interest-bearing liabilities over the subsequent twelve months. If interest rates increase then net interest income will increase and, conversely, if interest rates decrease then net interest income will decrease. The slight change in the cumulative repricing gap at
December 31, 2018
compared to
December 31, 2017
, is primarily related to growth and changes in the mix of loans, deposits and borrowings. The growth in the certificates of deposit portfolio was offset with the increased repricing of adjustable loans, the increased cash flow of the indirect portfolio, the funding of long-term FHLB advances and the use of interest rate swaps.
The allocation of non-maturity deposits and customer repurchase agreements to the one-month maturity category above is based on the estimated sensitivity of each product to changes in market rates. For example, if a product’s rate is estimated to increase by 50% as much as the market rates, then 50% of the account balance was placed in this category.
Utilizing net interest income simulations, the following net interest income metrics were calculated using rate shocks which move market rates in an immediate and parallel fashion. The variance percentages represent the change between the net interest income and EVE calculated under the particular rate scenario versus the net interest income and EVE that was calculated assuming market rates as of
December 31, 2018
. Using a static Balance Sheet structure, the measures do not reflect all of management's potential counteractions.
72
The following table presents an analysis of the potential sensitivity of our net interest income and EVE to changes in interest rates using rate shocks:
TABLE 33
|
December 31,
|
2018
|
2017
|
ALCO
Limits
|
|||||
|
Net interest income change (12 months):
|
||||||||
|
+ 300 basis points
|
3.5
|
%
|
3.0
|
%
|
n/a
|
|
||
|
+ 200 basis points
|
2.5
|
%
|
2.3
|
%
|
(5.0
|
)%
|
||
|
+ 100 basis points
|
1.4
|
%
|
1.3
|
%
|
(5.0
|
)%
|
||
|
– 100 basis points
|
(3.1
|
)%
|
(3.9
|
)%
|
(5.0
|
)%
|
||
|
Economic value of equity:
|
||||||||
|
+ 300 basis points
|
(8.0
|
)%
|
(5.9
|
)%
|
(25.0
|
)%
|
||
|
+ 200 basis points
|
(5.2
|
)%
|
(3.7
|
)%
|
(15.0
|
)%
|
||
|
+ 100 basis points
|
(2.0
|
)%
|
(1.2
|
)%
|
(10.0
|
)%
|
||
|
– 100 basis points
|
(1.0
|
)%
|
(2.6
|
)%
|
(10.0
|
)%
|
||
We also model rate scenarios which move all rates gradually over twelve months (Rate Ramps) and model scenarios that gradually change the shape of the yield curve. Assuming a static Balance Sheet, a +300 basis point Rate Ramp increases net interest income (12 months) by
2.7%
and
2.0%
at
December 31, 2018
and
2017
, respectively.
Our strategy is generally to manage to a neutral interest rate risk position. However, given the current interest rate environment, the interest rate risk position has been managed to a modestly asset-sensitive position. Currently, rising rates are expected to have a modest, positive effect on net interest income versus net interest income if rates remained unchanged.
The ALCO utilizes several tactics to manage our interest rate risk position. As mentioned earlier, the growth in transaction deposits provides funding that is less interest rate-sensitive than short-term time deposits and wholesale borrowings. On the lending side, we regularly sell long-term fixed-rate residential mortgages to the secondary market and have been successful in the origination of consumer and commercial loans with short-term repricing characteristics. Total variable and adjustable-rate loans were
57.4%
and
56.6%
of total loans as of
December 31, 2018
and
2017
, respectively. As of
December 31, 2018
,
78.5%
of these loans, or
45.0%
of total loans, are tied to the Prime or one-month LIBOR rates. The investment portfolio is used, in part, to manage our interest rate risk position. Finally, we have made use of interest rate swaps to commercial borrowers (commercial swaps) to manage our interest rate risk position as the commercial swaps effectively increase adjustable-rate loans. As of
December 31, 2018
, the commercial swaps totaled
$2.7 billion
of notional principal, with
$814.6 million
in notional swap principal originated during
2018
. The success of the aforementioned tactics has resulted in a moderately asset-sensitive position. For additional information regarding interest rate swaps, see Note 14, “Derivative and Hedging Activities” to the financial statements in this Report.
We desired to remain modestly asset-sensitive during
2018
. A number of management actions and market occurrences resulted in the slight decrease in the asset sensitivity of our interest rate risk position during the period. The increase was primarily due to management's actions with the timing of funding loan and investment growth, as well as successful efforts to extend maturities in certificate of deposit activity and continued strong commercial loan interest rate swap activity.
We recognize that all asset/liability models have some inherent shortcomings. Asset/liability models require certain assumptions to be made, such as prepayment rates on interest-earning assets and repricing impact on non-maturity deposits, which may differ from actual experience. These business assumptions are based upon our experience, business plans, economic and market trends and available industry data. While management believes that its methodology for developing such assumptions is reasonable, there can be no assurance that modeled results will be achieved.
Furthermore, the metrics are based upon the Balance Sheet structure as of the valuation date and do not reflect the planned growth or management actions that could be taken.
73
RISK MANAGEMENT
As a financial institution, we take on a certain amount of risk in every business decision, transaction and activity. Our Board of Directors and senior management have identified seven major categories of risk: credit risk, market risk, liquidity risk, reputational risk, operational risk, legal and compliance risk and strategic risk. In its oversight role of our risk management function, the Board of Directors focuses on the strategies, analyses and conclusions of management relating to identifying, understanding and managing risks so as to optimize total stockholder value, while balancing prudent business and safety and soundness considerations.
The Board of Directors adopted a risk appetite statement that defines acceptable risk levels and limits under which we seek to operate in order to optimize returns. As such, the board monitors a series of KRIs, or Key Risk Indicators, for various business lines, operational units, and risk categories, providing insight into how our performance aligns with our stated risk appetite. These results are reviewed periodically by the Board of Directors and senior management to ensure adherence to our risk appetite statement, and where appropriate, adjustments are made to applicable business strategies and tactics where risks are approaching stated tolerances or for emerging risks.
We support our risk management process through a governance structure involving our Board of Directors and senior management. The joint Risk Committee of our Board of Directors and the FNBPA Board of Directors helps ensure that business decisions are executed within appropriate risk tolerances. The Risk Committee has oversight responsibilities with respect to the following:
|
•
|
identification, measurement, assessment and monitoring of enterprise-wide risk;
|
|
•
|
development of appropriate and meaningful risk metrics to use in connection with the oversight of our businesses and strategies;
|
|
•
|
review and assessment of our policies and practices to manage our credit, market, liquidity, legal, regulatory and operating risk (including technology, operational, compliance and fiduciary risks); and
|
|
•
|
identification and implementation of risk management best practices.
|
The Risk Committee serves as the primary point of contact between our Board of Directors and the Risk Management Council, which is the senior management level committee responsible for risk management. Risk appetite is an integral element of our business and capital planning processes through our Board Risk Committee and Risk Management Council. We use our risk appetite processes to promote appropriate alignment of risk, capital and performance tactics, while also considering risk capacity and appetite constraints from both financial and non-financial risks. Our top-down risk appetite process serves as a limit for undue risk-taking for bottom-up planning from our various business functions. Our Board Risk Committee, in collaboration with our Risk Management Council, approves our risk appetite on an annual basis, or more frequently, as needed to reflect changes in the risk environment, with the goal of ensuring that our risk appetite remains consistent with our strategic plans and business operations, regulatory environment and our shareholders' expectations. Reports relating to our risk appetite and strategic plans, and our ongoing monitoring thereof, are regularly presented to our various management level risk oversight and planning committees and periodically reported up through our Board Risk Committee.
As noted above, we have a Risk Management Council comprised of senior management. The purpose of this committee is to provide regular oversight of specific areas of risk with respect to the level of risk and risk management structure. Management has also established an Operational Risk Committee that is responsible for identifying, evaluating and monitoring operational risks across FNB, evaluating and approving appropriate remediation efforts to address identified operational risks and providing periodic reports concerning operational risks to the Risk Management Council. The Risk Management Council reports on a regular basis to the Risk Committee of our Board of Directors regarding our enterprise-wide risk profile and other significant risk management issues. Our Chief Risk Officer is responsible for the design and implementation of our enterprise-wide risk management strategy and framework through the Compliance Department and the Information and Cyber Security Department, both of which report to the Chief Risk Officer, and ensures the coordinated and consistent implementation of risk management initiatives and strategies on a day-to-day basis. Our Compliance Department, which reports to the Chief Risk Officer, is responsible for developing policies and procedures and monitoring compliance with applicable laws and regulations. Our Information and Cyber Security Department is responsible for maintaining a risk assessment of our information and cyber security risks and ensuring appropriate controls are in place to manage and control such risks, through the use of the National Institute of Standards and Technology framework for improving critical infrastructure by measuring and evaluating the effectiveness of information and cyber security controls. Further, our audit function performs an independent assessment of our internal controls environment and plays an integral role in testing the operation of the internal controls systems and reporting findings to management and our Audit Committee. Both the Risk Committee and Audit Committee of our Board of Directors regularly report on risk-related matters to the full Board of Directors. In addition, both the Risk Committee of our Board of
74
Directors and our Risk Management Council regularly assess our enterprise-wide risk profile and provide guidance on actions needed to address key and emerging risk issues.
The Board of Directors believes that our enterprise-wide risk management process is effective and enables the Board of Directors to:
|
•
|
assess the quality of the information we receive;
|
|
•
|
understand the businesses, investments and financial, accounting, legal, regulatory and strategic considerations, and the risks that we face;
|
|
•
|
oversee and assess how senior management evaluates risk; and
|
|
•
|
assess appropriately the quality of our enterprise-wide risk management process.
|
RECONCILIATIONS OF NON-GAAP FINANCIAL MEASURES AND KEY PERFORMANCE INDICATORS TO GAAP
Reconciliations of non-GAAP operating measures and key performance indicators discussed in this Report to the most directly comparable GAAP financial measures are included in the following tables.
TABLE 34
Operating Net Income Available to Common Stockholders
|
Year Ended December 31
|
2018
|
2017
|
2016
|
2015
|
2014
|
|||||||||||||||
|
(in thousands)
|
||||||||||||||||||||
|
Net income available to common stockholders
|
$
|
364,817
|
|
$
|
191,163
|
|
$
|
162,850
|
|
$
|
151,608
|
|
$
|
135,698
|
|
|||||
|
Merger-related expense
|
—
|
|
56,513
|
|
37,439
|
|
3,033
|
|
9,611
|
|
||||||||||
|
Tax benefit of merger-related expense
|
—
|
|
(18,846
|
)
|
(12,550
|
)
|
(949
|
)
|
(1,714
|
)
|
||||||||||
|
Merger-related net securities gains
|
—
|
|
(2,609
|
)
|
—
|
|
—
|
|
—
|
|
||||||||||
|
Tax expense of merger-related net securities gains
|
—
|
|
913
|
|
—
|
|
—
|
|
—
|
|
||||||||||
|
Reduction in valuation of deferred tax assets
|
—
|
|
54,042
|
|
—
|
|
—
|
|
—
|
|
||||||||||
|
Discretionary 401(k) contribution
|
874
|
|
—
|
|
—
|
|
—
|
|
—
|
|
—
|
|
||||||||
|
Tax benefit of discretionary 401(k) contribution
|
(184
|
)
|
—
|
|
—
|
|
—
|
|
—
|
|
||||||||||
|
Gain on sale of subsidiary
|
(5,135
|
)
|
—
|
|
—
|
|
—
|
|
—
|
|
||||||||||
|
Tax expense of gain on sale of subsidiary
|
1,078
|
|
—
|
|
—
|
|
—
|
|
—
|
|
||||||||||
|
Branch consolidation costs
|
6,616
|
|
—
|
|
—
|
|
—
|
|
—
|
|
||||||||||
|
Tax benefit of branch consolidation costs
|
(1,389
|
)
|
—
|
|
—
|
|
—
|
|
—
|
|
||||||||||
|
Operating net income available to common stockholders (non-GAAP)
|
$
|
366,677
|
|
$
|
281,176
|
|
$
|
187,739
|
|
$
|
153,692
|
|
$
|
143,595
|
|
|||||
The table above shows how operating net income available to common stockholders (non-GAAP) is derived from amounts reported in our financial statements. We believe charges such as merger expenses, branch consolidation costs and special one-time employee 401(k) contributions related to tax reform are not organic costs to run our operations and facilities. The merger expenses and branch consolidation charges principally represent expenses to satisfy contractual obligations of the acquired entity or closed branch without any useful ongoing benefit to us. These costs are specific to each individual transaction and may vary significantly based on the size and complexity of the transaction. Similarly, gains derived from the sale of a business are not organic to our operations.
75
TABLE 35
Operating Earnings per Diluted Common Share
|
Year Ended December 31
|
2018
|
2017
|
2016
|
2015
|
2014
|
||||||||||||||
|
Net income per diluted common share
|
$
|
1.12
|
|
$
|
0.63
|
|
$
|
0.78
|
|
$
|
0.86
|
|
$
|
0.80
|
|
||||
|
Merger-related expense
|
—
|
|
0.19
|
|
0.18
|
|
0.02
|
|
0.06
|
|
|||||||||
|
Tax benefit of merger-related expense
|
—
|
|
(0.06
|
)
|
(0.06
|
)
|
(0.01
|
)
|
(0.01
|
)
|
|||||||||
|
Merger-related net securities gains
|
—
|
|
(0.01
|
)
|
—
|
|
—
|
|
—
|
|
|||||||||
|
Tax expense of merger-related net securities gains
|
—
|
|
—
|
|
—
|
|
—
|
|
—
|
|
|||||||||
|
Reduction in valuation of deferred tax assets
|
—
|
|
0.18
|
|
—
|
|
—
|
|
—
|
|
|||||||||
|
Discretionary 401(k) contribution
|
—
|
|
—
|
|
—
|
|
—
|
|
—
|
|
|||||||||
|
Tax benefit of discretionary 401(k) contribution
|
—
|
|
—
|
|
—
|
|
—
|
|
—
|
|
|||||||||
|
Gain on sale of subsidiary
|
(0.01
|
)
|
—
|
|
—
|
|
—
|
|
—
|
|
|||||||||
|
Tax expense of gain on sale of subsidiary
|
0.01
|
|
—
|
|
—
|
|
—
|
|
—
|
|
|||||||||
|
Branch consolidation costs
|
0.02
|
|
—
|
|
—
|
|
—
|
|
—
|
|
|||||||||
|
Tax benefit of branch consolidation costs
|
(0.01
|
)
|
—
|
|
—
|
|
—
|
|
—
|
|
|||||||||
|
Operating earnings per diluted common share (non-GAAP)
|
$
|
1.13
|
|
$
|
0.93
|
|
$
|
0.90
|
|
$
|
0.87
|
|
$
|
0.85
|
|
||||
TABLE 36
Return on Average Tangible Common Equity
|
Year Ended December 31
|
2018
|
2017
|
2016
|
||||||||
|
(dollars in thousands)
|
|||||||||||
|
Net income available to common stockholders
|
$
|
364,817
|
|
$
|
191,163
|
|
$
|
162,850
|
|
||
|
Amortization of intangibles, net of tax
|
12,365
|
|
11,386
|
|
7,287
|
|
|||||
|
Tangible net income available to common stockholders (non-GAAP)
|
$
|
377,182
|
|
$
|
202,549
|
|
$
|
170,137
|
|
||
|
Average total stockholders’ equity
|
$
|
4,490,833
|
|
$
|
4,073,700
|
|
$
|
2,499,976
|
|
||
|
Less: Average preferred stockholders’ equity
|
(106,882
|
)
|
(106,882
|
)
|
(106,882
|
)
|
|||||
|
Less: Average intangibles
(1)
|
(2,334,727
|
)
|
(2,108,102
|
)
|
(1,059,856
|
)
|
|||||
|
Average tangible common equity (non-GAAP)
|
$
|
2,049,224
|
|
$
|
1,858,716
|
|
$
|
1,333,238
|
|
||
|
Return on average tangible common equity (non-GAAP)
|
18.41
|
%
|
10.90
|
%
|
12.76
|
%
|
|||||
(1) Excludes loan servicing rights.
76
TABLE 37
Return on Average Tangible Assets
|
Year Ended December 31
|
2018
|
2017
|
2016
|
||||||||
|
(dollars in thousands)
|
|||||||||||
|
Net income
|
$
|
372,858
|
|
$
|
199,204
|
|
$
|
170,891
|
|
||
|
Amortization of intangibles, net of tax
|
12,365
|
|
11,386
|
|
7,287
|
|
|||||
|
Tangible net income (non-GAAP)
|
$
|
385,223
|
|
$
|
210,590
|
|
$
|
178,178
|
|
||
|
Average total assets
|
$
|
32,138,497
|
|
$
|
29,131,109
|
|
$
|
20,677,717
|
|
||
|
Less: Average intangibles
(1)
|
(2,334,727
|
)
|
(2,108,102
|
)
|
(1,059,856
|
)
|
|||||
|
Average tangible assets (non-GAAP)
|
$
|
29,803,770
|
|
$
|
27,023,007
|
|
$
|
19,617,861
|
|
||
|
Return on average tangible assets (non-GAAP)
|
1.29
|
%
|
0.78
|
%
|
0.91
|
%
|
|||||
(1) Excludes loan servicing rights.
TABLE 38
Tangible Book Value per Common Share
|
December 31
|
2018
|
2017
|
2016
|
||||||||
|
(in thousands, except per share data)
|
|||||||||||
|
Total stockholders’ equity
|
$
|
4,608,285
|
|
$
|
4,409,194
|
|
$
|
2,571,617
|
|
||
|
Less: Preferred stockholders’ equity
|
(106,882
|
)
|
(106,882
|
)
|
(106,882
|
)
|
|||||
|
Less: Intangibles
(1)
|
(2,333,375
|
)
|
(2,341,263
|
)
|
(1,085,935
|
)
|
|||||
|
Tangible common equity (non-GAAP)
|
$
|
2,168,028
|
|
$
|
1,961,049
|
|
$
|
1,378,800
|
|
||
|
Ending common shares outstanding
|
324,314,529
|
|
323,465,140
|
|
211,059,547
|
|
|||||
|
Tangible book value per common share (non-GAAP)
|
$
|
6.68
|
|
$
|
6.06
|
|
$
|
6.53
|
|
||
(1) Excludes loan servicing rights.
TABLE 39
Tangible equity to tangible assets (period-end)
|
December 31
|
2018
|
2017
|
2016
|
||||||||
|
(dollars in thousands)
|
|||||||||||
|
Total stockholders' equity
|
$
|
4,608,285
|
|
$
|
4,409,194
|
|
$
|
2,571,617
|
|
||
|
Less: Intangibles
(1)
|
(2,333,375
|
)
|
(2,341,263
|
)
|
(1,085,935
|
)
|
|||||
|
Tangible equity (non-GAAP)
|
$
|
2,274,910
|
|
$
|
2,067,931
|
|
$
|
1,485,682
|
|
||
|
Total assets
|
$
|
33,101,840
|
|
$
|
31,417,635
|
|
$
|
21,844,817
|
|
||
|
Less: Intangibles
(1)
|
(2,333,375
|
)
|
(2,341,263
|
)
|
(1,085,935
|
)
|
|||||
|
Tangible assets (non-GAAP)
|
$
|
30,768,465
|
|
$
|
29,076,372
|
|
$
|
20,758,882
|
|
||
|
Tangible equity / tangible assets (period-end) (non-GAAP)
|
7.39
|
%
|
7.11
|
%
|
7.16
|
%
|
|||||
(1) Excludes loan servicing rights.
77
TABLE 40
Tangible common equity / tangible assets (period-end)
|
December 31
|
2018
|
2017
|
2016
|
||||||||
|
(dollars in thousands)
|
|||||||||||
|
Total stockholders' equity
|
$
|
4,608,285
|
|
$
|
4,409,194
|
|
$
|
2,571,617
|
|
||
|
Less: Preferred stockholders' equity
|
(106,882
|
)
|
(106,882
|
)
|
(106,882
|
)
|
|||||
|
Less: Intangibles
(1)
|
(2,333,375
|
)
|
(2,341,263
|
)
|
(1,085,935
|
)
|
|||||
|
Tangible common equity (non-GAAP)
|
$
|
2,168,028
|
|
$
|
1,961,049
|
|
$
|
1,378,800
|
|
||
|
Total assets
|
$
|
33,101,840
|
|
$
|
31,417,635
|
|
$
|
21,844,817
|
|
||
|
Less: Intangibles
(1)
|
(2,333,375
|
)
|
(2,341,263
|
)
|
(1,085,935
|
)
|
|||||
|
Tangible assets (non-GAAP)
|
$
|
30,768,465
|
|
$
|
29,076,372
|
|
$
|
20,758,882
|
|
||
|
Tangible common equity / tangible assets (period-end) (non-GAAP)
|
7.05
|
%
|
6.74
|
%
|
6.64
|
%
|
|||||
(1) Excludes loan servicing rights.
TABLE 41
Efficiency Ratio
|
Year Ended December 31
|
2018
|
2017
|
2016
|
||||||||
|
(dollars in thousands)
|
|
|
|
||||||||
|
Non-interest expense
|
$
|
694,532
|
|
$
|
681,541
|
|
$
|
511,133
|
|
||
|
Less: Amortization of intangibles
|
(15,652
|
)
|
(17,517
|
)
|
(11,210
|
)
|
|||||
|
Less: OREO expense
|
(6,359
|
)
|
(4,438
|
)
|
(5,153
|
)
|
|||||
|
Less: Merger-related expense
|
—
|
|
(56,513
|
)
|
(37,439
|
)
|
|||||
|
Less: Impairment charge on other assets
|
—
|
|
—
|
|
(2,585
|
)
|
|||||
|
Less: Discretionary 401(k) contribution
|
(874
|
)
|
—
|
|
—
|
|
|||||
|
Less: Branch consolidation costs
|
(2,939
|
)
|
—
|
|
—
|
|
|||||
|
Adjusted non-interest expense
|
$
|
668,708
|
|
$
|
603,073
|
|
$
|
454,746
|
|
||
|
Net interest income
|
$
|
932,489
|
|
$
|
846,434
|
|
$
|
611,512
|
|
||
|
Taxable equivalent adjustment
|
13,270
|
|
18,766
|
|
11,248
|
|
|||||
|
Non-interest income
|
275,651
|
|
252,449
|
|
201,761
|
|
|||||
|
Less: Net securities gains
|
(34
|
)
|
(5,916
|
)
|
(712
|
)
|
|||||
|
Less: Gain on redemption of TPS
|
—
|
|
—
|
|
(2,422
|
)
|
|||||
|
Less: Gain on sale of subsidiary
|
(5,135
|
)
|
—
|
|
—
|
|
|||||
|
Less: Branch consolidation costs
|
3,677
|
|
—
|
|
—
|
|
|||||
|
Adjusted net interest income (FTE) + non-interest income
|
$
|
1,219,918
|
|
$
|
1,111,733
|
|
$
|
821,387
|
|
||
|
Efficiency ratio (FTE) (non-GAAP)
|
54.82
|
%
|
54.25
|
%
|
55.36
|
%
|
|||||
ITEM 7A. QUANTITATIVE AND QUALITATIVE DISCLOSURES ABOUT MARKET RISK
The information called for by this item is provided in the Market Risk section of “Management’s Discussion and Analysis of Financial Condition and Results of Operations,” which is included in Item 7 of this Report, and is incorporated herein by reference.
78
ITEM 8. FINANCIAL STATEMENTS AND SUPPLEMENTARY DATA
Report of Management on F.N.B. Corporation’s Internal Control Over Financial Reporting
February 26, 2019
F.N.B. Corporation’s internal control over financial reporting is a process effected by the Board of Directors, management, and other personnel, designed to provide reasonable assurance regarding the preparation of reliable financial statements in accordance with U.S. generally accepted accounting principles. An entity’s internal control over financial reporting includes those policies and procedures that (1) pertain to the maintenance of records that, in reasonable detail, accurately and fairly reflect the transactions and dispositions of the assets of the entity; (2) provide reasonable assurance that transactions are recorded as necessary to permit preparation of financial statements in accordance with generally accepted accounting principles, and that receipts and expenditures of the entity are being made only in accordance with authorizations of management and the Board of Directors; and (3) provide reasonable assurance regarding prevention, or timely detection of unauthorized acquisition, use, or disposition of the entity’s assets that could have a material effect on the financial statements.
Management is responsible for establishing and maintaining adequate internal control over financial reporting. Management assessed the effectiveness of our internal control over financial reporting as of
December 31, 2018
based on the framework set forth by the Committee of Sponsoring Organizations of the Treadway Commission in
Internal Control – Integrated Framework
(2013 framework). Based on that assessment, management concluded that, as of
December 31, 2018
, our internal control over financial reporting is effective based on the criteria established in
Internal Control – Integrated Framework
(2013 framework). Ernst & Young LLP, independent registered public accounting firm, has issued an attestation report on our internal control over financial reporting.
F.N.B. Corporation
|
/s/ Vincent J. Delie, Jr.
|
|
By: Vincent J. Delie, Jr.
|
|
Chairman, President and Chief Executive Officer
|
|
/s/ Vincent J. Calabrese, Jr.
|
|
By: Vincent J. Calabrese, Jr.
|
|
Chief Financial Officer
|
79
Report of Independent Registered Public Accounting Firm
The Board of Directors and Stockholders
F.N.B. Corporation
Opinion on the Financial Statements
We have audited the accompanying consolidated balance sheets of F.N.B. Corporation and subsidiaries (the Company) as of December 31, 2018 and 2017, the related consolidated statements of income, comprehensive income, stockholders' equity, and cash flows for each of the three years in the period ended December 31, 2018, and the related notes (collectively referred to as the “consolidated financial statements”). In our opinion, the consolidated financial statements present fairly, in all material respects, the financial position of the Company at December 31, 2018 and 2017, and the results of its operations and its cash flows for each of the three years in the period ended December 31, 2018, in conformity with U.S. generally accepted accounting principles.
We also have audited, in accordance with the standards of the Public Company Accounting Oversight Board (United States) (PCAOB), the Company’s internal control over financial reporting as of December 31, 2018, based on criteria established in Internal Control-Integrated Framework issued by the Committee of Sponsoring Organizations of the Treadway Commission (2013 framework) and our report dated February 26, 2019 expressed an unqualified opinion thereon.
Basis for Opinion
These financial statements are the responsibility of the Company's management. Our responsibility is to express an opinion on the Company’s financial statements based on our audits. We are a public accounting firm registered with the PCAOB and are required to be independent with respect to the Company in accordance with the U.S. federal securities laws and the applicable rules and regulations of the Securities and Exchange Commission and the PCAOB.
We conducted our audits in accordance with the standards of the PCAOB. Those standards require that we plan and perform the audit to obtain reasonable assurance about whether the financial statements are free of material misstatement, whether due to error or fraud. Our audits included performing procedures to assess the risks of material misstatement of the financial statements, whether due to error or fraud, and performing procedures that respond to those risks. Such procedures included examining, on a test basis, evidence regarding the amounts and disclosures in the financial statements. Our audits also included evaluating the accounting principles used and significant estimates made by management, as well as evaluating the overall presentation of the financial statements. We believe that our audits provide a reasonable basis for our opinion.
/s/ Ernst & Young LLP
We have served as the Company’s auditor since 1993.
Pittsburgh, Pennsylvania
February 26, 2019
80
Report of Independent Registered Public Accounting Firm
The Board of Directors and Stockholders
F.N.B. Corporation
Opinion on Internal Control over Financial Reporting
We have audited F.N.B. Corporation’s internal control over financial reporting as of December 31, 2018, based on criteria established in
Internal Control - Integrated Framework
issued by the Committee of Sponsoring Organizations of the Treadway Commission (2013 framework) (the COSO criteria). In our opinion, F.N.B. Corporation (the Company) maintained, in all material respects, effective internal control over financial reporting as of December 31, 2018, based on the COSO criteria.
We also have audited, in accordance with the standards of the Public Company Accounting Oversight Board (United States) (PCAOB), the consolidated balance sheets of the Company as of December 31, 2018 and 2017, the related consolidated statements of income, comprehensive income, stockholders’ equity and cash flows for each of the three years in the period ended December 31, 2018 and the related notes and our report dated February 26, 2019 expressed an unqualified opinion thereon.
Basis for Opinion
The Company’s management is responsible for maintaining effective internal control over financial reporting and for its assessment of the effectiveness of internal control over financial reporting included in the accompanying
Report of Management on F.N.B. Corporation’s Internal Control Over Financial Reporting
. Our responsibility is to express an opinion on the Company’s internal control over financial reporting based on our audit. We are a public accounting firm registered with the PCAOB and are required to be independent with respect to the Company in accordance with the U.S. federal securities laws and the applicable rules and regulations of the Securities and Exchange Commission and the PCAOB.
We conducted our audit in accordance with the standards of the PCAOB. Those standards require that we plan and perform the audit to obtain reasonable assurance about whether effective internal control over financial reporting was maintained in all material respects.
Our audit included obtaining an understanding of internal control over financial reporting, assessing the risk that a material weakness exists, testing and evaluating the design and operating effectiveness of internal control based on the assessed risk, and performing such other procedures as we considered necessary in the circumstances. We believe that our audit provides a reasonable basis for our opinion.
Definition and Limitations of Internal Control over Financial Reporting
A company’s internal control over financial reporting is a process designed to provide reasonable assurance regarding the reliability of financial reporting and the preparation of financial statements for external purposes in accordance with generally accepted accounting principles. A company’s internal control over financial reporting includes those policies and procedures that (1) pertain to the maintenance of records that, in reasonable detail, accurately and fairly reflect the transactions and dispositions of the assets of the company; (2) provide reasonable assurance that transactions are recorded as necessary to permit preparation of financial statements in accordance with generally accepted accounting principles, and that receipts and expenditures of the company are being made only in accordance with authorizations of management and directors of the company; and (3) provide reasonable assurance regarding prevention or timely detection of unauthorized acquisition, use, or disposition of the company’s assets that could have a material effect on the financial statements.
Because of its inherent limitations, internal control over financial reporting may not prevent or detect misstatements. Also, projections of any evaluation of effectiveness to future periods are subject to the risk that controls may become inadequate because of changes in conditions, or that the degree of compliance with the policies or procedures may deteriorate.
/s/ Ernst & Young LLP
Pittsburgh, Pennsylvania
February 26, 2019
81
F.N.B. CORPORATION AND SUBSIDIARIES
CONSOLIDATED BALANCE SHEETS
Dollars in millions, except share and per share data
|
December 31
|
|||||||
|
2018
|
2017
|
||||||
|
Assets
|
|||||||
|
Cash and due from banks
|
$
|
451
|
|
$
|
408
|
|
|
|
Interest-bearing deposits with banks
|
37
|
|
71
|
|
|||
|
Cash and Cash Equivalents
|
488
|
|
479
|
|
|||
|
Securities available for sale
|
3,341
|
|
2,765
|
|
|||
|
Debt securities held to maturity (fair value of
$3,155
and
$3,218
)
|
3,254
|
|
3,242
|
|
|||
|
Loans held for sale (includes
$14
and
$56
measured at fair value)
(1)
|
22
|
|
93
|
|
|||
|
Loans and leases, net of unearned income of
$3
and
$51
|
22,153
|
|
20,999
|
|
|||
|
Allowance for credit losses
|
(180
|
)
|
(175
|
)
|
|||
|
Net Loans and Leases
|
21,973
|
|
20,824
|
|
|||
|
Premises and equipment, net
|
330
|
|
337
|
|
|||
|
Goodwill
|
2,255
|
|
2,249
|
|
|||
|
Core deposit and other intangible assets, net
|
79
|
|
92
|
|
|||
|
Bank owned life insurance
|
537
|
|
527
|
|
|||
|
Other assets
|
823
|
|
810
|
|
|||
|
Total Assets
|
$
|
33,102
|
|
$
|
31,418
|
|
|
|
Liabilities
|
|||||||
|
Deposits:
|
|||||||
|
Non-interest-bearing demand
|
$
|
6,000
|
|
$
|
5,720
|
|
|
|
Interest-bearing demand
|
9,660
|
|
9,571
|
|
|||
|
Savings
|
2,526
|
|
2,488
|
|
|||
|
Certificates and other time deposits
|
5,269
|
|
4,621
|
|
|||
|
Total Deposits
|
23,455
|
|
22,400
|
|
|||
|
Short-term borrowings
|
4,129
|
|
3,679
|
|
|||
|
Long-term borrowings
|
627
|
|
668
|
|
|||
|
Other liabilities
|
283
|
|
262
|
|
|||
|
Total Liabilities
|
28,494
|
|
27,009
|
|
|||
|
Stockholders’ Equity
|
|||||||
|
Preferred stock - $
0.01
par value; liquidation preference of $
1,000
per share
|
|||||||
|
Authorized –
20,000,000
shares
|
|||||||
|
Issued –
110,877
shares
|
107
|
|
107
|
|
|||
|
Common stock -
$0.01
par value
|
|||||||
|
Authorized –
500,000,000
shares
|
|||||||
|
Issued –
326,120,832
and
325,095,055
shares
|
3
|
|
3
|
|
|||
|
Additional paid-in capital
|
4,049
|
|
4,033
|
|
|||
|
Retained earnings
|
576
|
|
368
|
|
|||
|
Accumulated other comprehensive loss
|
(106
|
)
|
(83
|
)
|
|||
|
Treasury stock
–
1,806,303
and
1,629,915
shares at cost
|
(21
|
)
|
(19
|
)
|
|||
|
Total Stockholders’ Equity
|
4,608
|
|
4,409
|
|
|||
|
Total Liabilities and Stockholders’ Equity
|
$
|
33,102
|
|
$
|
31,418
|
|
|
(1)
Amount represents loans for which we have elected the fair value option. See Note 24.
See accompanying Notes to Consolidated Financial Statements
82
F.N.B. CORPORATION AND SUBSIDIARIES
CONSOLIDATED STATEMENTS OF INCOME
Dollars in millions, except per share data
|
Year Ended December 31
|
|||||||||||
|
2018
|
2017
|
2016
|
|||||||||
|
Interest Income
|
|||||||||||
|
Loans and leases, including fees
|
$
|
1,022
|
|
$
|
862
|
|
$
|
598
|
|
||
|
Securities:
|
|||||||||||
|
Taxable
|
119
|
|
97
|
|
72
|
|
|||||
|
Tax-exempt
|
28
|
|
20
|
|
9
|
|
|||||
|
Other
|
1
|
|
1
|
|
—
|
|
|||||
|
Total Interest Income
|
1,170
|
|
980
|
|
679
|
|
|||||
|
Interest Expense
|
|||||||||||
|
Deposits
|
142
|
|
72
|
|
41
|
|
|||||
|
Short-term borrowings
|
75
|
|
44
|
|
12
|
|
|||||
|
Long-term borrowings
|
21
|
|
18
|
|
14
|
|
|||||
|
Total Interest Expense
|
238
|
|
134
|
|
67
|
|
|||||
|
Net Interest Income
|
932
|
|
846
|
|
612
|
|
|||||
|
Provision for credit losses
|
61
|
|
61
|
|
56
|
|
|||||
|
Net Interest Income After Provision for Credit Losses
|
871
|
|
785
|
|
556
|
|
|||||
|
Non-Interest Income
|
|||||||||||
|
Service charges
|
126
|
|
120
|
|
97
|
|
|||||
|
Trust services
|
26
|
|
23
|
|
21
|
|
|||||
|
Insurance commissions and fees
|
18
|
|
19
|
|
18
|
|
|||||
|
Securities commissions and fees
|
18
|
|
15
|
|
13
|
|
|||||
|
Capital markets income
|
21
|
|
17
|
|
16
|
|
|||||
|
Mortgage banking operations
|
22
|
|
20
|
|
12
|
|
|||||
|
Dividends on non-marketable equity securities
|
16
|
|
9
|
|
4
|
|
|||||
|
Bank owned life insurance
|
13
|
|
12
|
|
10
|
|
|||||
|
Net securities gains
|
—
|
|
6
|
|
1
|
|
|||||
|
Other
|
16
|
|
11
|
|
9
|
|
|||||
|
Total Non-Interest Income
|
276
|
|
252
|
|
201
|
|
|||||
|
Non-Interest Expense
|
|||||||||||
|
Salaries and employee benefits
|
370
|
|
327
|
|
240
|
|
|||||
|
Net occupancy
|
60
|
|
54
|
|
40
|
|
|||||
|
Equipment
|
55
|
|
49
|
|
38
|
|
|||||
|
Amortization of intangibles
|
16
|
|
18
|
|
11
|
|
|||||
|
Outside services
|
66
|
|
56
|
|
44
|
|
|||||
|
FDIC insurance
|
33
|
|
33
|
|
19
|
|
|||||
|
Bank shares and franchise taxes
|
12
|
|
10
|
|
9
|
|
|||||
|
Merger-related
|
—
|
|
57
|
|
37
|
|
|||||
|
Other
|
83
|
|
77
|
|
73
|
|
|||||
|
Total Non-Interest Expense
|
695
|
|
681
|
|
511
|
|
|||||
|
Income Before Income Taxes
|
452
|
|
356
|
|
246
|
|
|||||
|
Income taxes
|
79
|
|
157
|
|
75
|
|
|||||
|
Net Income
|
373
|
|
199
|
|
171
|
|
|||||
|
Preferred stock dividends
|
8
|
|
8
|
|
8
|
|
|||||
|
Net Income Available to Common Stockholders
|
$
|
365
|
|
$
|
191
|
|
$
|
163
|
|
||
|
Earnings per Common Share
|
|||||||||||
|
Basic
|
$
|
1.13
|
|
$
|
0.63
|
|
$
|
0.79
|
|
||
|
Diluted
|
$
|
1.12
|
|
$
|
0.63
|
|
$
|
0.78
|
|
||
|
Cash Dividends per Common Share
|
$
|
0.48
|
|
$
|
0.48
|
|
$
|
0.48
|
|
||
See accompanying Notes to Consolidated Financial Statements
83
F.N.B. CORPORATION AND SUBSIDIARIES
CONSOLIDATED STATEMENTS OF COMPREHENSIVE INCOME
Dollars in millions
|
Year Ended December 31
|
|||||||||||
|
2018
|
2017
|
2016
|
|||||||||
|
Net income
|
$
|
373
|
|
$
|
199
|
|
$
|
171
|
|
||
|
Other comprehensive income (loss):
|
|||||||||||
|
Securities available for sale:
|
|||||||||||
|
Unrealized (losses) gains arising during the period, net of tax (benefit) expense of
$5,
$3 and $7
|
(17
|
)
|
(6
|
)
|
(14
|
)
|
|||||
|
Reclassification adjustment for gains included in net income, net of tax expense of
$0,
$0 and $0
|
—
|
|
—
|
|
—
|
|
|||||
|
Derivative instruments:
|
|||||||||||
|
Unrealized gains (losses) arising during the period, net of tax expense (benefit) of
$(1),
$0
and
$3
|
(2
|
)
|
(1
|
)
|
5
|
|
|||||
|
Reclassification adjustment for (gains) losses included in net income, net of tax expense (benefit) of
$0,
$0
and
$1
|
(2
|
)
|
—
|
|
(1
|
)
|
|||||
|
Pension and postretirement benefit obligations:
|
|||||||||||
|
Unrealized gains (losses) arising during the period, net of tax expense (benefit) of
$1,
$0
and
$0
|
(2
|
)
|
—
|
|
—
|
|
|||||
|
Other Comprehensive (Loss) Income
|
(23
|
)
|
(7
|
)
|
(10
|
)
|
|||||
|
Comprehensive Income
|
$
|
350
|
|
$
|
192
|
|
$
|
161
|
|
||
See accompanying Notes to Consolidated Financial Statements
84
F.N.B. CORPORATION AND SUBSIDIARIES
CONSOLIDATED STATEMENTS OF STOCKHOLDERS’ EQUITY
Dollars in millions, except per share data
|
Preferred
Stock
|
Common
Stock
|
Additional
Paid-In
Capital
|
Retained
Earnings
|
Accumulated
Other
Comprehensive
Income (Loss)
|
Treasury
Stock
|
Total
|
|||||||||||||||||||||
|
Balance at January 1, 2016
|
$
|
107
|
|
$
|
2
|
|
$
|
1,808
|
|
$
|
243
|
|
$
|
(51
|
)
|
$
|
(13
|
)
|
$
|
2,096
|
|
||||||
|
Comprehensive income (loss)
|
171
|
|
(10
|
)
|
161
|
|
|||||||||||||||||||||
|
Dividends declared:
|
|||||||||||||||||||||||||||
|
Preferred stock
|
(8
|
)
|
(8
|
)
|
|||||||||||||||||||||||
|
Common stock: $
0.48
/share
|
(102
|
)
|
(102
|
)
|
|||||||||||||||||||||||
|
Issuance of common stock
|
—
|
|
14
|
|
(2
|
)
|
12
|
|
|||||||||||||||||||
|
Issuance of common stock – acquisitions
|
—
|
|
404
|
|
404
|
|
|||||||||||||||||||||
|
Restricted stock compensation
|
7
|
|
7
|
|
|||||||||||||||||||||||
|
Tax benefit of stock-based compensation
|
2
|
|
2
|
|
|||||||||||||||||||||||
|
Balance at December 31, 2016
|
107
|
|
2
|
|
2,235
|
|
304
|
|
(61
|
)
|
(15
|
)
|
2,572
|
|
|||||||||||||
|
Comprehensive income (loss)
|
199
|
|
(7
|
)
|
192
|
|
|||||||||||||||||||||
|
Dividends declared:
|
|||||||||||||||||||||||||||
|
Preferred stock
|
(8
|
)
|
(8
|
)
|
|||||||||||||||||||||||
|
Common stock:
$0.48
/share
|
(142
|
)
|
(142
|
)
|
|||||||||||||||||||||||
|
Issuance of common stock
|
—
|
|
7
|
|
(4
|
)
|
3
|
|
|||||||||||||||||||
|
Issuance of common stock – acquisitions
|
1
|
|
1,782
|
|
1,783
|
|
|||||||||||||||||||||
|
Assumption of warrant due to acquisition
|
1
|
|
1
|
|
|||||||||||||||||||||||
|
Restricted stock compensation
|
8
|
|
8
|
|
|||||||||||||||||||||||
|
Reclassification due to tax reform
|
15
|
|
(15
|
)
|
—
|
|
|||||||||||||||||||||
|
Balance at December 31, 2017
|
107
|
|
3
|
|
4,033
|
|
368
|
|
(83
|
)
|
(19
|
)
|
4,409
|
|
|||||||||||||
|
Comprehensive income (loss)
|
373
|
|
(23
|
)
|
350
|
|
|||||||||||||||||||||
|
Dividends declared:
|
|||||||||||||||||||||||||||
|
Preferred stock
|
(8
|
)
|
(8
|
)
|
|||||||||||||||||||||||
|
Common stock:
$0.48
/share
|
(157
|
)
|
(157
|
)
|
|||||||||||||||||||||||
|
Issuance of common stock
|
—
|
|
6
|
|
(2
|
)
|
4
|
|
|||||||||||||||||||
|
Restricted stock compensation
|
10
|
|
10
|
|
|||||||||||||||||||||||
|
Balance at December 31, 2018
|
$
|
107
|
|
$
|
3
|
|
$
|
4,049
|
|
$
|
576
|
|
$
|
(106
|
)
|
$
|
(21
|
)
|
$
|
4,608
|
|
||||||
See accompanying Notes to Consolidated Financial Statements
85
F.N.B. CORPORATION AND SUBSIDIARIES
CONSOLIDATED STATEMENTS OF CASH FLOWS
Dollars in millions
|
Year Ended December 31
|
|||||||||||
|
2018
|
2017
|
2016
|
|||||||||
|
Operating Activities
|
|||||||||||
|
Net income
|
$
|
373
|
|
$
|
199
|
|
$
|
171
|
|
||
|
Adjustments to reconcile net income to net cash flows provided by operating activities:
|
|||||||||||
|
Depreciation, amortization and accretion
|
109
|
|
89
|
|
61
|
|
|||||
|
Provision for credit losses
|
61
|
|
61
|
|
56
|
|
|||||
|
Deferred tax expense
|
33
|
|
129
|
|
15
|
|
|||||
|
Net securities gains
|
—
|
|
(6
|
)
|
(1
|
)
|
|||||
|
Tax benefit of stock-based compensation
|
—
|
|
(1
|
)
|
(2
|
)
|
|||||
|
Loans originated for sale
|
(1,117
|
)
|
(1,098
|
)
|
(713
|
)
|
|||||
|
Loans sold
|
1,210
|
|
1,047
|
|
717
|
|
|||||
|
Net gain on sale of loans
|
(22
|
)
|
(17
|
)
|
(11
|
)
|
|||||
|
Net change in:
|
|||||||||||
|
Interest receivable
|
(6
|
)
|
(18
|
)
|
(5
|
)
|
|||||
|
Interest payable
|
7
|
|
2
|
|
—
|
|
|||||
|
Bank owned life insurance
|
(10
|
)
|
(11
|
)
|
(5
|
)
|
|||||
|
Other, net
|
(27
|
)
|
(97
|
)
|
10
|
|
|||||
|
Net cash flows provided by operating activities
|
611
|
|
279
|
|
293
|
|
|||||
|
Investing Activities
|
|||||||||||
|
Net change in loans and leases
|
(1,394
|
)
|
(1,100
|
)
|
(816
|
)
|
|||||
|
Securities available for sale:
|
|||||||||||
|
Purchases
|
(1,200
|
)
|
(1,142
|
)
|
(1,066
|
)
|
|||||
|
Sales
|
—
|
|
787
|
|
615
|
|
|||||
|
Maturities
|
592
|
|
570
|
|
544
|
|
|||||
|
Debt securities held to maturity:
|
|||||||||||
|
Purchases
|
(387
|
)
|
(1,186
|
)
|
(1,063
|
)
|
|||||
|
Sales
|
—
|
|
57
|
|
—
|
|
|||||
|
Maturities
|
370
|
|
395
|
|
357
|
|
|||||
|
Purchase of bank owned life insurance
|
—
|
|
(50
|
)
|
(17
|
)
|
|||||
|
Increase in premises and equipment
|
(35
|
)
|
(57
|
)
|
(60
|
)
|
|||||
|
Net cash received in business combinations and divestitures
|
134
|
|
197
|
|
246
|
|
|||||
|
Net cash flows used in investing activities
|
(1,920
|
)
|
(1,529
|
)
|
(1,260
|
)
|
|||||
|
Financing Activities
|
|||||||||||
|
Net change in:
|
|||||||||||
|
Demand (non-interest-bearing and interest-bearing) and savings accounts
|
406
|
|
406
|
|
934
|
|
|||||
|
Time deposits
|
653
|
|
757
|
|
(120
|
)
|
|||||
|
Short-term borrowings
|
450
|
|
379
|
|
252
|
|
|||||
|
Proceeds from issuance of long-term borrowings
|
37
|
|
155
|
|
46
|
|
|||||
|
Repayment of long-term borrowings
|
(77
|
)
|
(199
|
)
|
(173
|
)
|
|||||
|
Net proceeds from issuance of common stock
|
14
|
|
11
|
|
18
|
|
|||||
|
Tax benefit of stock-based compensation
|
—
|
|
—
|
|
2
|
|
|||||
|
Cash dividends paid:
|
|||||||||||
|
Preferred stock
|
(8
|
)
|
(8
|
)
|
(8
|
)
|
|||||
|
Common stock
|
(157
|
)
|
(143
|
)
|
(102
|
)
|
|||||
|
Net cash flows provided by financing activities
|
1,318
|
|
1,358
|
|
849
|
|
|||||
|
Net Increase (Decrease) in Cash and Cash Equivalents
|
9
|
|
108
|
|
(118
|
)
|
|||||
|
Cash and cash equivalents at beginning of year
|
479
|
|
371
|
|
489
|
|
|||||
|
Cash and Cash Equivalents at End of Year
|
$
|
488
|
|
$
|
479
|
|
$
|
371
|
|
||
See accompanying Notes to Consolidated Financial Statements
86
F.N.B. CORPORATION AND SUBSIDIARIES
NOTES TO CONSOLIDATED FINANCIAL STATEMENTS
The terms “FNB,” “the Corporation,” “we,” “us” and “our” throughout this Report mean F.N.B. Corporation and our consolidated subsidiaries, unless the context indicates that we refer only to the parent company, F.N.B. Corporation. When we refer to "FNBPA" in this Report, we mean our only bank subsidiary, First National Bank of Pennsylvania, and its subsidiaries.
NATURE OF OPERATIONS
F.N.B. Corporation, headquartered in Pittsburgh, Pennsylvania, is a diversified financial services company operating in
seven
states and the District of Columbia. Our market coverage spans several major metropolitan areas including: Pittsburgh, Pennsylvania; Baltimore, Maryland; Cleveland, Ohio; and Charlotte, Raleigh, Durham and the Piedmont Triad (Winston-Salem, Greensboro and High Point) in North Carolina. As of
December 31, 2018
, we had
396
banking offices throughout Pennsylvania, Ohio, Maryland, West Virginia, North Carolina and South Carolina.
We provide a full range of commercial banking, consumer banking, and wealth management solutions through our subsidiary network which is led by our largest affiliate, FNBPA, founded in 1864. Commercial banking solutions include corporate banking, small business banking, investment real estate financing, business credit, capital markets and lease financing. Consumer banking provides a full line of consumer banking products and services including deposit products, mortgage lending, consumer lending and a complete suite of mobile and online banking services. Wealth management services include fiduciary and brokerage services, asset management, private banking and insurance.
NOTE 1. SUMMARY OF SIGNIFICANT ACCOUNTING POLICIES
Basis of Presentation
Our accompanying Consolidated Financial Statements and these Notes to Consolidated Financial Statements include subsidiaries in which we have a controlling financial interest. We own and operate FNBPA, FNTC, First National Investment Services Company, LLC, FNBIA, FNIA, Bank Capital Services, LLC, and F.N.B. Capital Corporation, LLC, and include results for each of these entities in the accompanying Consolidated Financial Statements.
Companies in which we hold more than a 50% voting equity interest, or a controlling financial interest, or are a variable interest entity (VIE) in which we have the power to direct the activities of an entity that most significantly impact the entity’s economic performance and has an obligation to absorb losses or the right to receive benefits from the VIE which could potentially be significant to the VIE are consolidated. VIEs in which we do not hold the power to direct the activities of the entity that most significantly impact the entity’s economic performance or does not have an obligation to absorb losses or the right to receive benefits from the VIE which could potentially be significant to the VIE are not consolidated. Investments in companies that are not consolidated are accounted for using the equity method when we have the ability to exert significant influence. Investments in private investment partnerships that are accounted for under the equity method or the cost method are included in other assets and our proportional interest in the equity investments’ earnings are included in other non-interest income. Investment interests accounted for under the cost and equity methods are periodically evaluated for impairment.
The accompanying Consolidated Financial Statements include all adjustments that are necessary, in the opinion of management, to fairly reflect our financial position and results of operations in accordance with GAAP. All significant intercompany balances and transactions have been eliminated. Certain prior period amounts have been reclassified to conform to the current period presentation. Such reclassifications had no impact on our net income and stockholders’ equity. Events occurring subsequent to
December 31, 2018
have been evaluated for potential recognition or disclosure in the Consolidated Financial Statements through the date of the filing of the Consolidated Financial Statements with the Securities and Exchange Commission.
Use of Estimates
Our accounting and reporting policies conform with GAAP. The preparation of financial statements in conformity with GAAP requires us to make estimates and assumptions that affect the amounts reported in the Consolidated Financial Statements and accompanying Notes to Consolidated Financial Statements. Actual results could materially differ from those estimates. Material estimates that are particularly susceptible to significant changes include the allowance for credit losses, accounting for loans acquired in a business combination, fair value of financial instruments, goodwill and other intangible assets, litigation, income taxes and deferred tax assets.
87
Revenue from Contracts with Customers
We earn certain revenues from contracts with customers. These revenues are recognized when control of the promised services is transferred to the customers in an amount that reflects the consideration we expect to be entitled to in an exchange for those services.
In determining the appropriate revenue recognition for our contracts with customers, we consider whether the contract has commercial substance and is approved by both parties with identifiable contractual rights, payment terms, and the collectability of consideration is probable. Generally, we satisfy our performance obligations upon the completion of services at the amount to which we have the right to invoice or charge under contracts with an original expected duration of one year or less. We apply this guidance on a portfolio basis to contracts with similar characteristics and for which we believe the results would not differ materially from applying this guidance to individual contracts.
Our services provided under contracts with customers are transferred at the point in time when the services are rendered. Generally, we do not defer incremental direct costs to obtain contracts with customers that would be amortized in one year or less under the practical expedient. These costs are recognized as expense, primarily salary and benefit expense, in the period incurred.
Deposit Services
.
We recognize revenue on deposit services based on published fees for services provided. Demand and savings deposit customers have the right to cancel their depository arrangements and withdraw their deposited funds at any time without prior notice. When services involve deposited funds that can be retrieved by customers without penalties, we consider the service contract term to be day-to-day, where each day represents the renewal of the contract. The contract does not extend beyond the services performed and revenue is recognized at the end of the contract term (daily) as the performance obligation is satisfied.
No deposit services fees exist for long-term deposit products beyond early withdrawal penalties, which are earned on these products at the time of early termination.
Revenue from deposit services fees are reduced where we have a history of waived or reduced fees by customer request or due to a customer service issue, by historical experience, or another acceptable method in the same period as the related revenues. Revenues from deposit services are reported in the Consolidated Statements of Income as service charges and in the Community Banking segment as non-interest income.
Wealth Management Services.
Wealth advisory and trust services are provided on a month-to-month basis and invoiced as services are rendered. Fees are based on a fixed amount or a scale based on the level of services provided or assets under management. The customer has the right to terminate their services agreement at any time. We determine the value of services performed based on the fee schedule in effect at the time the services are performed. Revenues from wealth advisory and trust services are reported in the Consolidated Statements of Income as trust services and securities commissions and fees, and in the Wealth segment as non-interest income.
Insurance Services.
Insurance services include full-service insurance brokerage services offering numerous lines of commercial and personal insurance through major carriers to businesses and individuals within our geographic markets. We recognize revenue on insurance contracts in effect based on contractually specified commission payments on premiums that are paid by the customer to the insurance carrier. Contracts are cancellable at any time and we have no performance obligation to the customers beyond the time the insurance is placed into effect. Revenues from insurance services are reported in the Consolidated Statements of Income as insurance commissions and fees, and in the Insurance segment as non-interest income.
Business Combinations
Business combinations are accounted for by applying the acquisition method
.
Under the acquisition method, identifiable assets acquired and liabilities assumed, and any non-controlling interest in the acquiree at the acquisition date are measured at their fair values as of that date, and are recognized separately from goodwill. Results of operations of the acquired entities are included in the Consolidated Statements of Income from the date of acquisition.
Cash and Cash Equivalents
Cash and cash equivalents include cash on hand, cash items in transit and amounts due from the Federal Reserve Bank and other depository institutions (including interest-bearing deposits).
88
Debt Securities
Debt securities comprise a significant portion of our Consolidated Balance Sheets. Such securities can be classified as trading, HTM or AFS. As of
December 31, 2018
and
2017
, we did not hold any trading debt securities.
Debt securities HTM are the securities that management has the positive intent and ability to hold until their maturity. Such securities are carried at cost, adjusted for related amortization of premiums and accretion of discounts through interest income from securities, and subject to evaluation for OTTI.
Debt securities that are not classified as trading or HTM are classified as AFS. Such securities are carried at fair value with net unrealized gains and losses deemed to be temporary and OTTI attributable to non-credit factors reported separately as a component of other comprehensive income, net of tax.
We evaluate our debt securities in a loss position for OTTI on a quarterly basis at the individual security level based on our intent to sell.
If we intend to sell the debt security or it is more likely than not we will be required to sell the security before recovery of its amortized cost basis, OTTI must be recognized in earnings equal to the entire difference between the investments’ amortized cost basis and its fair value. If we do not intend to sell the debt security and it is not more likely than not that we will be required to sell the security before recovery of its amortized cost basis, OTTI must be separated into the amount representing credit loss and the amount related to all other market factors. The amount related to credit loss will be recognized in earnings. The amount related to other market factors will be recognized in other comprehensive income, net of applicable taxes.
We perform our OTTI evaluation process in a consistent and systematic manner and include an evaluation of all available evidence. This process considers factors such as length of time and anticipated recovery period of the impairment, recent events specific to the issuer and recent experience regarding principal and interest payments.
Securities Sold Under Agreements to Repurchase
Securities sold under agreements to repurchase are accounted for as collateralized financing transactions and are recorded at the amounts at which the securities were sold plus accrued interest. Securities, generally U.S. government and federal agency securities, pledged as collateral under these financing arrangements cannot be sold or repledged by the secured party. The fair value of collateral either received from or provided to a third party is continually monitored and additional collateral is obtained or is requested to be returned to us as deemed appropriate.
Derivative Instruments and Hedging Activities
From time to time, we may enter into derivative transactions principally to protect against the risk of adverse price or interest rate movements on the value of certain assets and liabilities and on future cash flows. All derivative instruments are carried at fair value on the Consolidated Balance Sheets as either an asset or liability. Accounting for the changes in fair value of a derivative is dependent upon whether or not it has been designated in a formal, qualifying hedging relationship. For derivatives in qualifying hedging relationships, we formally document all relationships between hedging instruments and hedged items, as well as our risk management objective and strategy for undertaking each hedge transaction.
Changes in fair value of a derivative instrument that has been designated and qualifies as a cash flow hedge are recorded in accumulated other comprehensive income, net of tax. Amounts are reclassified from AOCI to the consolidated statements of income in the period or periods in which the hedged transaction affects earnings.
At the hedge’s inception and at least quarterly thereafter, a formal assessment is performed to determine whether changes in the fair values or cash flows of the derivative instruments have been highly effective in offsetting changes in fair values or cash flows of the hedged items and whether they are expected to be highly effective in the future. If it is determined a derivative instrument has not been or will not continue to be highly effective as a hedge, hedge accounting is discontinued. Derivative gains and losses under cash flow hedges not effective in hedging the change in fair value or expected cash flows of the hedged item are recognized immediately in the consolidated statements of income.
In addition, we enter into interest rate swap agreements to meet the financing, interest rate and equity risk management needs of qualifying commercial loan customers. These agreements provide the customer the ability to convert from variable to fixed interest rates. We then enter into positions with a derivative counterparty in order to offset our exposure on the fixed components of the customer agreements. The credit risk associated with derivatives executed with customers is essentially the
89
same as that involved in extending loans and is subject to normal credit policies and monitoring. We seek to minimize counterparty credit risk by entering into transactions with only high-quality institutions. These arrangements meet the definition of derivatives, but are not designated as qualifying hedging relationships. The interest rate swap agreement with the loan customer and with the counterparty are reported at fair value in other assets and other liabilities on the Consolidated Balance Sheets with any resulting gain or loss recorded in current period earnings as other income.
Loans Held for Sale and Loan Commitments
Certain of our residential mortgage loans are originated or purchased for sale in the secondary mortgage loan market. Effective January 1, 2017, we made an automatic election to account for all future originated or purchased residential mortgage loans held for sale under the FVO. The FVO election is intended to better reflect the underlying economics and better facilitate the economic hedging of the loans. The FVO is applied on an instrument by instrument basis and is an irrevocable election. Additionally, with the election of the FVO, fees and costs associated with the origination and acquisition of residential mortgage loans held for sale are expensed as incurred, rather than deferred. Changes in fair value under the FVO are recorded in mortgage banking operations non-interest income on the consolidated statements of income. Fair value is determined on the basis of rates obtained in the respective secondary market for the type of loan held for sale. Prior to the FVO election, loans were generally sold at a premium or discount from the carrying amount of the loan which represented the lower of cost or fair value. Gain or loss on the sale of loans is recorded in mortgage banking operations non-interest income. Interest income on loans held for sale is recorded in interest income.
We routinely issue interest rate lock commitments for residential mortgage loans that we intend to sell. These interest rate lock commitments are considered derivatives. We also enter into loan sale commitments to sell these loans when funded to mitigate the risk that the market value of residential mortgage loans may decline between the time the rate commitment is issued to the customer and the time we sell the loan. These loan sale commitments are also derivatives. Both types of derivatives are recorded at fair value on the Consolidated Balance Sheets with changes in fair value recorded in mortgage banking operations non-interest income.
We also originate loans guaranteed by the SBA for the purchase of businesses, business startups, business expansion, equipment, and working capital. All SBA loans are underwritten and documented as prescribed by the SBA. The guaranteed portion of SBA loans originated with the intention to sell on the secondary market is classified as held for sale and carried at the lower of cost or fair value. At the time of the sale, we allocate the carrying value of the entire loan between the guaranteed portion sold and the unguaranteed portion retained based on their relative fair value which results in a discount recorded on the retained portion of the loan. The guaranteed portion is typically sold at a premium and the gain is recognized in other income for any net premium received in excess of the relative fair value of the portion of the loan transferred. The net carrying value of the retained portion of the loans is included in the appropriate commercial loan classification for disclosure purposes.
Loans (Excluding Loans Acquired in a Business Combination)
Loans we intend to hold for the foreseeable future or until maturity or payoff are reported at their outstanding principal balances, net of any unearned income, deferred origination fees or costs, or premium or discounts on purchased loans. Interest income on loans is computed over the term of the loans using the effective interest method. Loan origination fees or costs and premiums or discounts are deferred and amortized over the term of the loan or loan commitment period as an adjustment to the related loan yield.
Non-performing Loans
Interest is not accrued on loans where collectability is uncertain. We discontinue interest accruals on loans generally when principal or interest is due and has remained unpaid for a certain number of days unless the loan is both well secured and in the process of collection. Commercial loans are placed on non-accrual at
90
days, installment loans are placed on non-accrual at
120
days and residential mortgages and consumer lines of credit are generally placed on non-accrual at
180
days. Past due status is based on the contractual terms of the loan.
When a loan is placed on non-accrual status, all unpaid interest is reversed against interest income and the amortization of deferred fees and costs is suspended. Payments subsequently received are generally applied to either principal or interest or both, depending on management’s evaluation of collectability. A loan is returned to accrual status when principal and interest are no longer past due and collectability is probable. This generally requires a sustained period of timely principal and interest payments.
90
Loans are generally written off when deemed uncollectible or when they reach a predetermined number of days past due depending upon loan product, terms, and other factors. Recoveries of amounts previously charged off are credited to the allowance for credit losses.
We consider a loan impaired when, based on current information and events, it is probable that we will be unable to collect the scheduled payments of principal or interest when due according to the contractual terms of the loan agreement. Factors considered in determining impairment include payment status, collateral value and the probability of collecting scheduled principal and interest payments when due. The impairment loss is measured by either the present value of expected future cash flows discounted at the loan’s effective interest rate, the loan’s obtainable market price, or the fair value of the collateral, less estimated selling costs, if the loan is collateral dependent. Purchased credit impaired loans are not classified as non-performing assets as the loans are considered to be performing.
Restructured loans are those in which concessions of terms have been made as a result of deterioration in a borrower’s financial condition. In general, the modification or restructuring of a debt constitutes a TDR if we for economic or legal reasons related to the borrower’s financial difficulties grant a concession to the borrower that we would not otherwise consider under current market conditions. Debt restructurings or loan modifications for a borrower occur in the normal course of business and do not necessarily constitute TDRs. To designate a loan as a TDR, the presence of both borrower financial distress and a concession of terms must exist. Additionally, a loan designated as a TDR does not necessarily result in the automatic placement of the loan on non-accrual status. When the full collection of principal and interest is reasonably assured on a loan designated as a TDR and the borrower does not otherwise meet the criteria for non-accrual status, we will continue to accrue interest on the loan. A restructured acquired loan that is accounted for as a component of a pool is not considered a TDR.
Allowance for Credit Losses
The allowance for credit losses is established as losses are estimated to have occurred through a provision charged to earnings. Loan losses are charged against the allowance for credit losses when management believes the uncollectability of a loan balance is confirmed. Subsequent recoveries, if any, are credited to the allowance for credit losses. Allowances for impaired commercial loans over
$1.0 million
are generally determined based on collateral values or the present value of estimated cash flows. All other impaired loans are evaluated in the aggregate based on loan segment loss given default. Changes in the allowance for credit losses related to impaired loans are charged or credited to the provision for credit losses.
The allowance for credit losses is maintained at a level that, in management’s judgment, is believed appropriate to absorb probable losses associated with specifically identified loans, as well as estimated probable credit losses inherent in the remainder of the loan portfolio. The appropriateness of the allowance for credit losses is based on management’s evaluation of potential loan losses in the loan portfolio, which includes an assessment of past experience, current economic conditions in specific industries and geographic areas, general economic conditions, known and inherent risks in the loan portfolio, the estimated value of underlying collateral and residuals and changes in the composition of the loan portfolio. Determination of the allowance for credit losses is inherently subjective as it requires significant estimates, including the amounts and timing of expected future cash flows on impaired loans, estimated losses on pools of homogeneous loans based on transition matrices with predefined loss emergence and lookback periods, and consideration of qualitative factors, all of which are susceptible to significant change.
Loans Acquired in a Business Combination
Loans acquired in a business combination (impaired and non-impaired) are initially recorded at their acquisition-date fair values. Fair values are based on a discounted cash flow methodology that involves assumptions and judgments as to credit risk, default rates, loss severity, collateral values, discount rates, payment speeds, prepayment risk, and liquidity risk.
The carryover of allowance for credit losses related to loans acquired in a business combination is prohibited as any credit losses in the loans are included in the determination of the fair value of the loans at the acquisition date. The allowance for credit losses on loans acquired in a business combination reflects only those losses incurred after acquisition and represents the present value of cash flows expected at acquisition that is no longer expected to be collected.
At acquisition, we consider the following factors as indicators that an acquired loan has evidence of deterioration in credit quality and is therefore impaired and in the scope of ASC 310-30:
|
•
|
loans that were 90 days or more past due;
|
|
•
|
loans that had an internal risk rating of substandard or worse. Substandard is consistent with regulatory definitions and is defined as having a well-defined weakness that jeopardizes liquidation of the loan;
|
91
|
•
|
loans that were classified as non-accrual by the acquired bank at the time of acquisition; or
|
|
•
|
loans that had been previously modified in a TDR.
|
Any loans acquired in a business combination that were not individually in the scope of ASC 310-30 because they didn’t meet the criteria above were pooled into groups of similar loans based on various factors including borrower type, loan purpose, and collateral type. For these pools, we used certain loan information, including outstanding principal balance, estimated expected losses, weighted average maturity, weighted average margin, and weighted average interest rate along with estimated prepayment rates, probability of default and loss given default to estimate the expected cash flow for each loan pool. We believe analogizing to ASC 310-30 is the more appropriate option to follow in accounting for discount accretion on non-impaired loans acquired in a business combination other than revolving loans and therefore account for such loans in accordance with ASC 310-30. ASC 310-30 guidance does not apply to revolving loans. Consequently, discount accretion on revolving loans acquired is accounted for using the ASC 310-20 approach.
The excess of cash flows expected to be collected at acquisition over recorded fair value is referred to as the accretable yield. The accretable yield is recognized into income over the remaining life of the loan, or pool of loans, using an effective yield method, if the timing and/or amount of cash flows expected to be collected can be reasonably estimated (the accretion model). If the timing and/or amount of cash flows expected to be collected cannot be reasonably estimated, the cost recovery method of income recognition must be used. The difference between the loan’s total scheduled principal and interest payments over all cash flows expected at acquisition is referred to as the non-accretable difference. The non-accretable difference represents contractually required principal and interest payments which we do not expect to collect.
Over the life of the acquired loan, we continue to estimate cash flows expected to be collected. Decreases in expected cash flows, other than from prepayments or rate adjustments, are recognized as impairments through a charge to the provision for credit losses resulting in an increase in the allowance for credit losses. Subsequent improvements in cash flows result in first, reversal of existing valuation allowances recognized subsequent to acquisition, if any, and next, an increase in the amount of accretable yield to be subsequently recognized on a prospective basis over the loan’s remaining life.
Loans acquired in a business combination that met the criteria for non-accrual of interest prior to acquisition are considered performing upon acquisition, regardless of whether the customer is contractually delinquent, if we can reasonably estimate the timing and amount of expected cash flows on such loans. Accordingly, we do not consider contractually delinquent purchased credit impaired loans to be non-accrual or non-performing and continue to recognize interest income on these loans using the accretion model.
Premises and Equipment
Premises and equipment are stated at cost less accumulated depreciation. Depreciation is computed using the straight-line method over the asset’s estimated useful life. Leasehold improvements are expensed over the lesser of the asset’s estimated useful life or the term of the lease including renewal periods when reasonably assured. Useful lives are dependent upon the nature and condition of the asset and range from
3
to
40
years. Maintenance and repairs are charged to expense as incurred, while major improvements are capitalized and amortized to expense over the identified useful life.
Premises and equipment are reviewed for impairment whenever events or changes in circumstances indicate that the carrying value may not be recoverable.
Cloud Computing Arrangements
W
e evaluate fees paid for cloud computing arrangements to determine if those arrangements include the purchase of or license to use software that should be accounted for separately as internal-use software. If a contract includes the purchase or license to use software that should be accounted for separately as internal-use software, the contract is amortized over the software’s identified useful life in amortization of intangibles. For contracts that do not include a software license, the contract is accounted for as a service contract with fees paid recorded in other non-interest expense.
In the third quarter of 2018, we early adopted, on a prospective basis, ASU 2018-15 (See Note 2) which allows for implementation costs for activities performed in cloud computing arrangements that are a service contract to be accounted for under the internal-use software guidance which allows for certain implementation costs to be capitalized depending on the nature of the costs and the project stage. Prior to the adoption of ASU 2018-15 all implementation costs for cloud computing arrangements that were a service contract were expensed as incurred.
92
Other Real Estate Owned
OREO is comprised principally of commercial and residential real estate properties obtained in partial or total satisfaction of loan obligations. OREO acquired in settlement of indebtedness is included in other assets initially at the lower of estimated fair value of the asset less estimated selling costs or the carrying amount of the loan. Changes to the value subsequent to transfer are recorded in non-interest expense along with direct operating expenses. Gains or losses not previously recognized resulting from sales of OREO are recognized in non-interest income on the date of sale.
Goodwill and Other Intangible Assets
Goodwill represents the excess of the cost of an acquisition over the fair value of the net assets acquired. Other intangible assets represent purchased assets that lack physical substance but can be distinguished from goodwill because of contractual or other legal rights. Intangible assets that have finite lives, such as core deposit intangibles, customer relationship intangibles and renewal lists, are amortized over their estimated useful lives and subject to periodic impairment testing. Core deposit intangibles are primarily amortized over
ten years
using accelerated methods. Customer renewal lists are amortized over their estimated useful lives which range from
eight
to
thirteen years
.
Goodwill and other intangibles are subject to impairment testing at the reporting unit level, which must be conducted at least annually. We perform impairment testing during the fourth quarter of each year, or more frequently if impairment indicators exist. We also continue to monitor other intangibles for impairment and to evaluate carrying amounts, as necessary.
Determining the fair value of a reporting unit under the goodwill impairment test is judgmental and often involves the use of significant estimates and assumptions. Similarly, estimates and assumptions are used in determining the fair value of other intangible assets. Estimates of fair value are primarily determined using discounted cash flows, market comparisons and recent transactions. These approaches use significant estimates and assumptions including projected future cash flows, discount rates reflecting the market rate of return, projected growth rates and determination and evaluation of appropriate market comparables. However, future events could cause us to conclude that goodwill or other intangibles have become impaired, which would result in recording an impairment loss. Any resulting impairment loss could have a material adverse impact on our financial condition and results of operations.
Loan Servicing Rights
We have two primary classes of servicing rights, residential mortgage loan servicing and SBA-guaranteed loan servicing. We recognize the right to service residential mortgage loans and SBA-guaranteed loans for others as an asset whether we purchase the servicing rights or as a result from a sale of loans that we originated or purchased when the servicing is contractually separated from the underlying loan and retained by us.
We initially record servicing rights at fair value in other assets, on the Consolidated Balance Sheets. Subsequently, servicing rights are measured at the lower of cost or fair value. Servicing rights are amortized in proportion to, and over the period of, estimated net servicing income in mortgage banking operations income for residential mortgage loans and non-interest income for SBA-guaranteed loans. The amount and timing of estimated future net cash flows are updated based on actual results and updated projections.
Mortgage servicing rights are separated into pools based on common risk characteristics of the underlying loans and evaluated for impairment at least quarterly. SBA-guaranteed servicing rights are evaluated for impairment at least quarterly on an aggregate basis. Impairment, if any, is recognized when carrying value exceeds the fair value as determined by calculating the present value of expected net future cash flows. If impairment exists at the pool level for residential mortgage loans or on an aggregate basis for SBA-guaranteed loans, the servicing right is written down through a valuation allowance and is charged against mortgage banking operations income or other non-interest income, respectively.
Bank Owned Life Insurance
We have purchased life insurance policies on certain current and former directors, officers and employees for which the Corporation is the owner and beneficiary. These policies are recorded in the Consolidated Balance Sheets at their cash surrender value, or the amount that could be realized by surrendering the policies. Tax-exempt income from death benefits and changes in the net cash surrender value are recorded in bank owned life insurance income.
93
Low Income Housing Tax Credit Partnerships
We invest in various affordable housing projects that qualify for LIHTCs. The net investments are recorded in other assets on the Consolidated Balance Sheets. These investments generate a return through the realization of federal tax credits. We use the proportional amortization method to account for a majority of our investments in these entities. LIHTCs that do not meet the requirements of the proportional amortization method are recognized using the equity method. Our net investment in LIHTCs was
$43.7 million
and
$20.9 million
at
December 31, 2018
and
December 31, 2017
, respectively. Our unfunded commitments in LIHTCs were
$57.0 million
and
$67.2 million
at
December 31, 2018
and
December 31, 2017
, respectively.
Income Taxes
We file a consolidated federal income tax return. The provision for federal and state income taxes is based on income reported on the Consolidated Financial Statements, rather than the amounts reported on the respective income tax returns. DTAs and DTLs are computed using tax rates expected to apply to taxable income in the years in which those assets and liabilities are expected to be realized. The effect on DTAs and DTLs resulting from a change in tax rates is recognized as income or expense in the period that the change in tax rates is enacted. Beginning in the fourth quarter of 2017, we made an accounting policy election to reclassify the stranded tax effects that relate to a change in the federal tax rate from AOCI to retained earnings in accordance with newly adopted accounting guidance. We believe this change in accounting policy reduces the cost and complexity of accounting for stranded tax effects due to a change in federal tax rates.
We make certain estimates and judgments in determining income tax expense for financial statement purposes. These estimates and judgments are applied in the calculation of certain tax credits and in the calculation of the deferred income tax expense or benefit associated with certain deferred tax assets and liabilities. Significant changes to these estimates may result in an increase or decrease to our tax provision in a subsequent period. We recognize interest and/or penalties related to income tax matters in income tax expense.
We assess the likelihood that we will be able to recover our DTAs. If recovery is not likely, we will increase our provision for income taxes by recording a valuation allowance against the DTAs that are unlikely to be recovered. We believe that we will ultimately recover the DTAs recorded on our Consolidated Balance Sheets. However, should there be a change in our ability to recover our DTAs, the effect of this change would be recorded through the provision for income taxes in the period during which such change occurs.
We periodically review the tax positions we take on our tax return and apply a more likely than not recognition threshold for all tax positions that are uncertain. The amount recognized in the Consolidated Financial Statements is the largest amount of tax benefit that is greater than 50% likely of being realized on examination. For tax positions not meeting the more likely than not test, no tax benefit is recorded.
Marketing Costs
Marketing costs are generally expensed as incurred.
Per Share Amounts
Earnings per common share is computed using net income available to common stockholders, which is net income adjusted for preferred stock dividends.
Basic earnings per common share is calculated by dividing net income available to common stockholders by the weighted average number of shares of common stock outstanding, net of unvested shares of restricted stock.
Diluted earnings per common share is calculated by dividing net income available to common stockholders by the weighted average number of shares of common stock outstanding, adjusted for the dilutive effect of potential common shares issuable for stock options, warrants and restricted shares, as calculated using the treasury stock method. Adjustments to net income available to common stockholders and the weighted average number of shares of common stock outstanding are made only when such adjustments dilute earnings per common share.
Beginning in 2017, the assumed proceeds from applying the treasury stock method when computing diluted earnings per share excludes the amount of excess tax benefits that would have been recognized in accumulated paid-in capital in accordance with newly adopted accounting guidance.
94
Retirement Plans
FNB sponsors retirement plans for our employees. The calculation of the obligations and related expenses under these plans requires use of actuarial valuation methods and assumptions. The plans utilize assumptions and methods including reflecting trust assets at their fair value for the qualified pension plans and recognizing the overfunded and underfunded status of the plans on our Consolidated Balance Sheets. Gains and losses, prior service costs and credits are recognized in AOCI, net of tax, until they are amortized, or immediately upon curtailment.
Stock-Based Compensation
Our stock-based compensation awards require the measurement and recognition of compensation expense, based on estimated fair values, for all stock-based awards, including stock options and restricted stock units, made to employees and stock awards made to directors. Generally, these restricted stock unit awards to employees vest over a
three
-year service period and the stock awards made to directors vest immediately.
We are required to estimate the fair value of stock-based awards on the date of grant. For time-based awards, the value of the award is recognized as expense in our Consolidated Statements of Income over the shorter of requisite service periods or the period through the date that the employee first becomes eligible to retire.
Prior to 2018, we granted performance-based restricted stock unit awards that had market-based performance conditions. Compensation cost for awards with market-based performance targets is recognized based on the award’s grant date fair value.
Beginning in 2018, we granted multiple-condition performance-based restricted stock unit awards. These awards were accounted for by considering the market condition in the grant date fair value and recognizing compensation expense over the service period based on the grant date fair value and the probability that the non-market based performance condition will be met.
Prior to 2017, because stock-based compensation expense was based on awards that are ultimately expected to vest, stock-based compensation expense was reduced to account for estimated forfeitures. Beginning in 2017, we elected to change our accounting policy to account for forfeitures as they occur. The estimate for forfeitures prior to this election was immaterial to our Consolidated Financial Statements. We believe this change in accounting policy reduces the cost and complexity of accounting for stock-based compensation and is preferable to estimating forfeitures at the time of grant.
NOTE 2. NEW ACCOUNTING STANDARDS
The following table summarizes accounting pronouncements issued by the FASB that we recently adopted or will be adopting in the future.
TABLE 2.1
|
Standard
|
Description
|
Required Date of Adoption
|
Financial Statements Impact
|
|||
|
Cloud Computing Arrangement
|
||||||
|
ASU 2018-15,
Intangibles -
Goodwill and Other - Internal-Use Software (Subtopic 350-40): Customer’s Accounting for Implementation Costs Incurred in a Cloud Computing Arrangement That Is a Service Contract
|
This Update aligns the requirements for capitalizing implementation costs of a hosting arrangement that is a service contract with that of internal-use software.
|
January 1, 2020
Early adoption is permitted.
|
We early adopted this Update in the third quarter of 2018 by a prospective application method. The adoption of this Update did not have a material effect on our Consolidated Financial Statements.
|
|||
95
|
Standard
|
Description
|
Required Date of Adoption
|
Financial Statements Impact
|
|||
|
Derivative and Hedging Activities
|
||||||
|
ASU 2017-12,
Derivatives and Hedging (Topic 815): Targeted Improvements to Accounting for Hedging Activities
|
This Update improves the financial reporting of hedging to better align with a company’s risk management activities. In addition, this Update makes certain targeted improvements to simplify the application of the current hedge accounting guidance.
|
January 1, 2019
Early adoption is permitted.
|
This Update is to be applied using a modified retrospective method. The presentation and disclosure guidance are applied prospectively. The adoption of this Update is not expected to have a material effect on our Consolidated Financial Statements.
|
|||
|
Securities
|
||||||
|
ASU 2017-08,
Receivables-Nonrefundable Fees and Other Costs (Subtopic 310-20): Premium Amortization on Purchased Callable Debt Securities
|
This Update shortens the amortization period for the premium on certain purchased callable securities to the earliest call date. The accounting for purchased callable debt securities held at a discount does not change.
|
January 1, 2019
Early adoption is permitted.
|
This Update is to be applied using a modified retrospective transition method. The adoption of this Update is not expected to have a material effect on our Consolidated Financial Statements.
|
|||
|
Retirement Benefits
|
||||||
|
ASU 2017-07,
Compensation - Retirement Benefits (Topic 715): Improving the Presentation of Net Periodic Pension Cost and Net Periodic Postretirement Benefit Cost
|
This Update requires that an employer disaggregate the service cost component from the other components of net benefit cost. The amendments also provide explicit guidance on how to present the service cost component and the other components of net benefit cost in the Consolidated Statements of Income and allows only the service cost component of net benefit cost to be eligible for capitalization.
|
January 1, 2018
|
We adopted this Update in the first quarter of 2018 by a retrospective transition method. The adoption of this Update did not have a material effect on our Consolidated Financial Statements.
|
|||
|
Statement of Cash Flows
|
||||||
|
ASU 2016-15,
Statement of Cash Flows (Topic 230): Classification of Certain Cash Receipts and Cash Payments (a consensus of the Emerging Issues Task Force)
|
This Update adds or clarifies guidance on eight cash flow issues.
|
January 1, 2018
|
We adopted this Update in the first quarter of 2018 by retrospective application. The adoption of this Update did not have a material effect on our Consolidated Financial Statements.
|
|||
96
|
Standard
|
Description
|
Required Date of Adoption
|
Financial Statements Impact
|
|||
|
Credit Losses
|
||||||
|
ASU 2016-13
, Financial Instruments - Credit Losses (Topic 326): Measurement of Credit Losses on Financial Instruments
ASU 2018-19,
Codification Improvements to Topic 326, Financial Instruments - Credit Losses
|
These Updates replace the current incurred loss impairment methodology with a methodology that reflects current expected credit losses (commonly referred to as CECL) for most financial assets measured at amortized cost and certain other instruments, including loans, HTM debt securities, net investments in leases and off-balance sheet credit exposures. CECL requires loss estimates for the remaining life of the financial asset at the time the asset is originated or acquired, considering historical experience, current conditions and reasonable and supportable forecasts. In addition, the Update will require the use of a modified AFS debt security impairment model and eliminate the current accounting for purchased credit impaired loans and debt securities.
|
January 1, 2020
Early adoption is permitted for fiscal years beginning after December 15, 2018
|
These Updates are to be applied using a cumulative-effect adjustment to retained earnings. The CECL model is a significant change from existing GAAP and may result in a material change to our accounting for financial instruments and regulatory capital. We have created a cross-functional steering committee to govern implementation. We are in the process of implementing a new modeling platform and integrating other auxiliary models to support a calculation of expected credit losses under CECL. We have made preliminary decisions on segmentation and are finalizing other inputs necessary to execute parallel runs beginning in the second quarter of 2019 to ensure we are ready to calculate, review and report on our CECL allowance for credit losses for the first quarter of 2020. The impact of this Update will be dependent on the portfolio composition, credit quality and forecasts of economic conditions at the time of adoption.
|
|||
|
Extinguishments of Liabilities
|
||||||
|
ASU 2016-04,
Liabilities - Extinguishments of Liabilities (Subtopic 405-20): Recognition of Breakage for Certain Prepaid Stored-Value Products (a consensus of the Emerging Issues Task Force)
|
This Update requires entities that sell prepaid stored-value products redeemable for goods, services or cash at third-party merchants to recognize breakage.
|
January 1, 2018
|
We adopted this Update in the first quarter of 2018. The adoption of this Update did not have a material effect on our Consolidated Financial Statements.
|
|||
|
Leases
|
||||||
|
ASU 2016-02,
Leases (Topic 842)
ASU 2018-10, Codification Improvements to Topic 842,
Leases
ASU 2018-11,
Leases
(Topic 842), Targeted Improvements
ASU 2018-20,
Leases (Topic 842), Narrow-Scope Improvements for Lessors
|
These Updates
require lessees to put most leases on the Consolidated Balance Sheets but recognize expenses in the Consolidated Statements of Income similar to current accounting. In addition, the Update changes the guidance for sale-leaseback transactions, initial direct costs and lease executory costs for most entities. All entities will classify leases to determine how to recognize lease related revenue and expense.
|
January 1, 2019
Early adoption is permitted.
|
These Updates are to be applied using a modified retrospective application including a number of optional practical expedients. The adoption of these Updates will result in the recording of approximately $120 million in net right-of-use assets and corresponding lease liabilities of approximately $130 million for operating leases on our Consolidated Balance Sheets with no impact on our consolidated net income.
|
|||
97
|
Standard
|
Description
|
Required Date of Adoption
|
Financial Statements Impact
|
|||
|
Financial Instruments – Recognition and Measurement
|
||||||
|
ASU 2016-01,
Financial Instruments - Overall (Subtopic 825-10): Recognition and Measurement of Financial Assets and Financial Liabilities
|
This Update amends the presentation and accounting for certain financial instruments, including liabilities measured at fair value under the FVO, and equity investments. The guidance also updates fair value presentation and disclosure requirements for financial instruments measured at amortized cost.
|
January 1, 2018
|
We adopted this Update in the first quarter of 2018 by a cumulative-effect adjustment. The adoption of this Update did not have a material effect on our Consolidated Financial Statements. During the first quarter of 2018, we transferred marketable equity securities totaling $1.1 million from securities AFS to other assets.
|
|||
|
Revenue Recognition
|
||||||
|
ASU 2014-09,
Revenue from Contracts with Customers (Topic 606)
|
This Update, as amended, modifies the guidance used to recognize revenue from contracts with customers for transfers of goods and services and transfers of nonfinancial assets, unless those contracts are within the scope of other guidance. The guidance also requires new qualitative and quantitative disclosures about contract balances and performance obligations.
|
January 1, 2018
|
We adopted these Updates in the first quarter of 2018 under the modified retrospective method. The adoption of this Update did not have a material effect on our Consolidated Financial Statements.
|
|||
NOTE 3. MERGERS AND ACQUISITIONS
Yadkin Financial Corporation
On March 11, 2017, we completed our acquisition of YDKN, a bank holding company based in Raleigh, North Carolina. YDKN’s banking affiliate, Yadkin Bank, was also merged into FNBPA on March 11, 2017. YDKN’s results of operations have been included in our Consolidated Statements of Income since that date. The acquisition enabled us to enter several southeastern markets, including Raleigh, Charlotte and the Piedmont Triad, which is comprised of Winston-Salem, Greensboro and High Point. We also completed the core systems conversion activities during the first quarter of 2017.
On the acquisition date, the fair values of YDKN included
$6.8 billion
in assets, of which there was
$5.1 billion
in loans and
$5.2 billion
in deposits. The acquisition was valued at
$1.8 billion
based on the acquisition-date FNB common stock closing price of
$15.97
and resulted in FNB issuing
111,619,622
shares of our common stock in exchange for
51,677,565
shares of YDKN common stock. Under the terms of the merger agreement, shareholders of YDKN received
2.16
shares of FNB common stock for each share of YDKN common stock and cash in lieu of fractional shares. YDKN’s fully vested and outstanding stock options were converted into options to purchase and receive FNB common stock. In conjunction with the acquisition, we assumed a warrant that was issued by YDKN to the UST under the CPP. Based on the exchange ratio, this warrant, which expires in 2019, was converted into a warrant to purchase up to
207,320
shares of FNB common stock with an exercise price of
$9.63
.
The acquisition of YDKN constituted a business combination and has been accounted for using the acquisition method of accounting, and accordingly, assets acquired, liabilities assumed and consideration exchanged were recorded at estimated fair value on the acquisition date. The determination of estimated fair values required management to make certain estimates about discount rates, future expected cash flows, market conditions, and other future events that are highly subjective in nature and may require adjustments, which can be updated for up to a year following the acquisition. Any adjustments to fair values and related adjustments to goodwill were recorded within the 12-month period. Based on the purchase price allocation, we recorded
$1.2 billion
in goodwill and
$70.0 million
in core deposit intangibles as a result of the acquisition. None of the goodwill is deductible for income tax purposes as the acquisition is accounted for as a tax-free exchange for tax purposes.
98
In connection with the YDKN acquisition, we incurred expenses related to systems conversions and other costs of integrating and conforming acquired operations with and into FNB. These merger-related expenses, that were expensed as incurred, amounted to
$56.2 million
for the year ended
December 31, 2017
. Contract terminations and severance costs comprised
30.9%
and
24.3%
, respectively, of the merger-related expenses, with the remainder consisting of other non-interest expenses, including professional services, marketing and advertising, technology and communications, occupancy and equipment, and charitable contributions. We also incurred issuance costs of
$0.6 million
which were charged to additional paid-in capital.
Branch Purchase – Fifth Third Bank
On April 22, 2016, we completed our purchase of
17
branch-banking locations and certain consumer loans in the Pittsburgh, Pennsylvania metropolitan area from Fifth Third. The fair value of the acquired assets totaled
$312.4 million
, including
$198.9 million
in cash,
$95.4 million
in loans and
$14.1 million
in fixed and other assets. We also assumed
$302.5 million
in deposits, for which we paid a deposit premium of
1.97%
, as part of the transaction. The assets and liabilities relating to these purchased branches were recorded on our Consolidated Balance Sheet at their fair values as of April 22, 2016, and the related results of operations for these branches have been included in our Consolidated Statements of Income since that date. We recorded
$14.1 million
in goodwill and
$4.1 million
in core deposit intangibles as a result of the purchase transaction. The goodwill for this transaction is deductible for income tax purposes.
Metro Bancorp, Inc.
On February 13, 2016, we completed our acquisition of METR, a bank holding company based in Harrisburg, Pennsylvania. The acquisition enhanced our distribution and scale across Central Pennsylvania and allowed us to leverage the significant infrastructure investments made in connection with the expansion of our product offerings and risk management systems. On the acquisition date, the fair values of METR included
$2.8 billion
in assets, of which there was
$1.9 billion
in loans and
$2.3 billion
in deposits.
The acquisition was valued at
$404.2 million
and resulted in FNB issuing
34,041,181
shares of common stock in exchange for
14,345,319
shares of METR common stock. We also acquired the fully vested outstanding stock options of METR. The assets and liabilities of METR were recorded on our Consolidated Balance Sheet at their fair values as of the acquisition date, and METR’s results of operations have been included in our Consolidated Statements of Income since that date. METR’s banking affiliate, Metro Bank, was merged into FNBPA on February 13, 2016. Based on the purchase price allocation, we recorded
$185.1 million
in goodwill and
$24.2 million
in core deposit intangibles as a result of the acquisition. None of the goodwill is deductible for income tax purposes as the acquisition is accounted for as a tax-free exchange for tax purposes.
99
The following table summarizes the amounts recorded on the Consolidated Balance Sheets as of each of the acquisition dates in conjunction with the acquisitions discussed above:
TABLE 3.1
|
(in millions)
|
YDKN
|
Fifth Third
Branches
|
METR
|
||||||||
|
Fair value of consideration paid
|
$
|
1,785
|
|
$
|
—
|
|
$
|
404
|
|
||
|
Fair value of identifiable assets acquired:
|
|||||||||||
|
Cash and cash equivalents
|
197
|
|
199
|
|
47
|
|
|||||
|
Securities
|
940
|
|
—
|
|
723
|
|
|||||
|
Loans
|
5,114
|
|
95
|
|
1,863
|
|
|||||
|
Core deposit and other intangible assets
|
70
|
|
4
|
|
24
|
|
|||||
|
Fixed and other assets
|
459
|
|
14
|
|
127
|
|
|||||
|
Total identifiable assets acquired
|
6,780
|
|
312
|
|
2,784
|
|
|||||
|
Fair value of liabilities assumed:
|
|||||||||||
|
Deposits
|
5,177
|
|
302
|
|
2,328
|
|
|||||
|
Borrowings
|
969
|
|
—
|
|
228
|
|
|||||
|
Other liabilities
|
68
|
|
24
|
|
9
|
|
|||||
|
Total liabilities assumed
|
6,214
|
|
326
|
|
2,565
|
|
|||||
|
Fair value of net identifiable assets acquired
|
566
|
|
(14
|
)
|
219
|
|
|||||
|
Goodwill recognized
(1)
|
$
|
1,219
|
|
$
|
14
|
|
$
|
185
|
|
||
|
(1)
|
All of the goodwill for these transactions has been recorded in the Community Banking segment.
|
100
NOTE 4. SECURITIES
The amortized cost and fair value of securities are as follows:
TABLE 4.1
|
(in millions)
|
Amortized
Cost |
Gross
Unrealized
Gains
|
Gross
Unrealized
Losses
|
Fair
Value
|
|||||||||||
|
Securities Available for Sale:
|
|||||||||||||||
|
December 31, 2018
|
|||||||||||||||
|
U.S. government agencies
|
$
|
188
|
|
$
|
—
|
|
$
|
(1
|
)
|
$
|
187
|
|
|||
|
U.S. government-sponsored entities
|
317
|
|
—
|
|
(4
|
)
|
313
|
|
|||||||
|
Residential mortgage-backed securities:
|
|||||||||||||||
|
Agency mortgage-backed securities
|
1,465
|
|
—
|
|
(36
|
)
|
1,429
|
|
|||||||
|
Agency collateralized mortgage obligations
|
1,179
|
|
5
|
|
(23
|
)
|
1,161
|
|
|||||||
|
Commercial mortgage-backed securities
|
229
|
|
—
|
|
(1
|
)
|
228
|
|
|||||||
|
States of the U.S. and political subdivisions
|
21
|
|
—
|
|
—
|
|
21
|
|
|||||||
|
Other debt securities
|
2
|
|
—
|
|
—
|
|
2
|
|
|||||||
|
Total debt securities available for sale
|
$
|
3,401
|
|
$
|
5
|
|
$
|
(65
|
)
|
$
|
3,341
|
|
|||
|
December 31, 2017
|
|||||||||||||||
|
U.S. government-sponsored entities
|
$
|
348
|
|
$
|
—
|
|
$
|
(4
|
)
|
$
|
344
|
|
|||
|
Residential mortgage-backed securities:
|
|||||||||||||||
|
Agency mortgage-backed securities
|
1,615
|
|
1
|
|
(17
|
)
|
1,599
|
|
|||||||
|
Agency collateralized mortgage obligations
|
813
|
|
—
|
|
(18
|
)
|
795
|
|
|||||||
|
States of the U.S. and political subdivisions
|
21
|
|
—
|
|
—
|
|
21
|
|
|||||||
|
Other debt securities
|
5
|
|
—
|
|
—
|
|
5
|
|
|||||||
|
Total debt securities available for sale
|
2,802
|
|
1
|
|
(39
|
)
|
2,764
|
|
|||||||
|
Equity securities
|
1
|
|
—
|
|
—
|
|
1
|
|
|||||||
|
Total securities available for sale
|
$
|
2,803
|
|
$
|
1
|
|
$
|
(39
|
)
|
$
|
2,765
|
|
|||
101
|
(in millions)
|
Amortized
Cost
|
Gross
Unrealized
Gains
|
Gross
Unrealized
Losses
|
Fair
Value
|
|||||||||||
|
Debt Securities Held to Maturity:
|
|||||||||||||||
|
December 31, 2018
|
|||||||||||||||
|
U.S. Treasury
|
$
|
1
|
|
$
|
—
|
|
$
|
—
|
|
$
|
1
|
|
|||
|
U.S. government agencies
|
2
|
|
—
|
|
—
|
|
2
|
|
|||||||
|
U.S. government-sponsored entities
|
215
|
|
—
|
|
(4
|
)
|
211
|
|
|||||||
|
Residential mortgage-backed securities:
|
|||||||||||||||
|
Agency mortgage-backed securities
|
1,036
|
|
—
|
|
(26
|
)
|
1,010
|
|
|||||||
|
Agency collateralized mortgage obligations
|
794
|
|
1
|
|
(24
|
)
|
771
|
|
|||||||
|
Commercial mortgage-backed securities
|
126
|
|
1
|
|
(1
|
)
|
126
|
|
|||||||
|
States of the U.S. and political subdivisions
|
1,080
|
|
3
|
|
(49
|
)
|
1,034
|
|
|||||||
|
Total debt securities held to maturity
|
$
|
3,254
|
|
$
|
5
|
|
$
|
(104
|
)
|
$
|
3,155
|
|
|||
|
December 31, 2017
|
|||||||||||||||
|
U.S. Treasury
|
$
|
1
|
|
$
|
—
|
|
$
|
—
|
|
$
|
1
|
|
|||
|
U.S. government-sponsored entities
|
247
|
|
—
|
|
(4
|
)
|
243
|
|
|||||||
|
Residential mortgage-backed securities:
|
|||||||||||||||
|
Agency mortgage-backed securities
|
1,220
|
|
3
|
|
(9
|
)
|
1,214
|
|
|||||||
|
Agency collateralized mortgage obligations
|
777
|
|
—
|
|
(20
|
)
|
757
|
|
|||||||
|
Commercial mortgage-backed securities
|
80
|
|
1
|
|
(1
|
)
|
80
|
|
|||||||
|
States of the U.S. and political subdivisions
|
917
|
|
13
|
|
(7
|
)
|
923
|
|
|||||||
|
Total debt securities held to maturity
|
$
|
3,242
|
|
$
|
17
|
|
$
|
(41
|
)
|
$
|
3,218
|
|
|||
During
2017
,
we received proceeds of
$786.8 million
from sales of AFS debt securities and realized a net gain of
$3.7 million
(gross gains of
$4.7 million
and gross losses of
$1.0 million
). We also received proceeds of
$57.1 million
from sales of HTM debt securities with a net carrying value of
$54.9 million
and realized a net gain of
$2.2 million
(gross gains of
$2.2 million
and
$4,000
immaterial gross losses). The HTM debt securities that were sold represented amortizing securities that had already returned more than
85%
of their principal outstanding at the time we acquired the securities and could be sold without tainting the remaining HTM portfolio. We did not have any sales during
2018
.
Gross gains and gross losses were realized on securities as follows:
TABLE 4.2
|
Year Ended December 31
|
2018
|
2017
|
2016
|
||||||||
|
(in millions)
|
|||||||||||
|
Gross gains
|
$
|
—
|
|
$
|
7
|
|
$
|
1
|
|
||
|
Gross losses
|
—
|
|
(1
|
)
|
—
|
|
|||||
|
Net gains
|
$
|
—
|
|
$
|
6
|
|
$
|
1
|
|
||
102
As of
December 31, 2018
, the amortized cost and fair value of debt securities, by contractual maturities, were as follows:
TABLE 4.3
|
Available for Sale
|
Held to Maturity
|
||||||||||||||
|
(in millions)
|
Amortized
Cost
|
Fair
Value
|
Amortized
Cost
|
Fair
Value
|
|||||||||||
|
Due in one year or less
|
$
|
95
|
|
$
|
94
|
|
$
|
42
|
|
$
|
41
|
|
|||
|
Due after one year but within five years
|
239
|
|
236
|
|
185
|
|
181
|
|
|||||||
|
Due after five years but within ten years
|
68
|
|
68
|
|
116
|
|
116
|
|
|||||||
|
Due after ten years
|
126
|
|
125
|
|
955
|
|
910
|
|
|||||||
|
528
|
|
523
|
|
1,298
|
|
1,248
|
|
||||||||
|
Residential mortgage-backed securities:
|
|||||||||||||||
|
Agency mortgage-backed securities
|
1,465
|
|
1,429
|
|
1,036
|
|
1,010
|
|
|||||||
|
Agency collateralized mortgage obligations
|
1,179
|
|
1,161
|
|
794
|
|
771
|
|
|||||||
|
Commercial mortgage-backed securities
|
229
|
|
228
|
|
126
|
|
126
|
|
|||||||
|
Total debt securities
|
$
|
3,401
|
|
$
|
3,341
|
|
$
|
3,254
|
|
$
|
3,155
|
|
|||
Maturities may differ from contractual terms because borrowers may have the right to call or prepay obligations with or without penalties. Periodic payments are received on residential mortgage-backed securities based on the payment patterns of the underlying collateral.
Following is information relating to securities pledged:
TABLE 4.4
|
December 31
|
2018
|
2017
|
|||||
|
(dollars in millions)
|
|||||||
|
Securities pledged (carrying value):
|
|||||||
|
To secure public deposits, trust deposits and for other purposes as required by law
|
$
|
3,874
|
|
$
|
3,492
|
|
|
|
As collateral for short-term borrowings
|
279
|
|
264
|
|
|||
|
Securities pledged as a percent of total securities
|
63.0
|
%
|
62.5
|
%
|
|||
103
Following are summaries of the fair values and unrealized losses of temporarily impaired debt securities, segregated by length of impairment. The unrealized losses reported below are generally due to the higher interest rate environment.
TABLE 4.5
|
Less than 12 Months
|
12 Months or More
|
Total
|
||||||||||||||||||||||||||||||
|
(dollars in millions)
|
#
|
Fair
Value
|
Unrealized
Losses
|
#
|
Fair
Value
|
Unrealized
Losses
|
#
|
Fair
Value
|
Unrealized
Losses
|
|||||||||||||||||||||||
|
Debt Securities Available for Sale:
|
||||||||||||||||||||||||||||||||
|
December 31, 2018
|
||||||||||||||||||||||||||||||||
|
U.S. government agencies
|
20
|
|
$
|
145
|
|
$
|
(1
|
)
|
—
|
|
$
|
—
|
|
$
|
—
|
|
20
|
|
$
|
145
|
|
$
|
(1
|
)
|
||||||||
|
U.S. government-sponsored entities
|
1
|
|
36
|
|
—
|
|
11
|
|
227
|
|
(4
|
)
|
12
|
|
263
|
|
(4
|
)
|
||||||||||||||
|
Residential mortgage-backed securities:
|
||||||||||||||||||||||||||||||||
|
Agency mortgage-backed securities
|
16
|
|
259
|
|
(4
|
)
|
71
|
|
1,159
|
|
(32
|
)
|
87
|
|
1,418
|
|
(36
|
)
|
||||||||||||||
|
Agency collateralized mortgage obligations
|
2
|
|
82
|
|
(1
|
)
|
47
|
|
590
|
|
(22
|
)
|
49
|
|
672
|
|
(23
|
)
|
||||||||||||||
|
Non-agency collateralized mortgage obligations
|
1
|
|
—
|
|
—
|
|
—
|
|
—
|
|
—
|
|
1
|
|
—
|
|
—
|
|
||||||||||||||
|
Commercial mortgage-backed securities
|
4
|
|
155
|
|
(1
|
)
|
—
|
|
—
|
|
—
|
|
4
|
|
155
|
|
(1
|
)
|
||||||||||||||
|
States of the U.S. and political subdivisions
|
2
|
|
2
|
|
—
|
|
6
|
|
10
|
|
—
|
|
8
|
|
12
|
|
—
|
|
||||||||||||||
|
Other debt securities
|
—
|
|
—
|
|
—
|
|
1
|
|
2
|
|
—
|
|
1
|
|
2
|
|
—
|
|
||||||||||||||
|
Total temporarily impaired debt securities AFS
|
46
|
|
$
|
679
|
|
$
|
(7
|
)
|
136
|
|
$
|
1,988
|
|
$
|
(58
|
)
|
182
|
|
$
|
2,667
|
|
$
|
(65
|
)
|
||||||||
|
December 31, 2017
|
||||||||||||||||||||||||||||||||
|
U.S. government-sponsored entities
|
7
|
|
$
|
107
|
|
$
|
—
|
|
10
|
|
$
|
201
|
|
$
|
(4
|
)
|
17
|
|
$
|
308
|
|
$
|
(4
|
)
|
||||||||
|
Residential mortgage-backed securities:
|
||||||||||||||||||||||||||||||||
|
Agency mortgage-backed securities
|
43
|
|
977
|
|
(8
|
)
|
28
|
|
473
|
|
(10
|
)
|
71
|
|
1,450
|
|
(18
|
)
|
||||||||||||||
|
Agency collateralized mortgage obligations
|
14
|
|
409
|
|
(6
|
)
|
33
|
|
336
|
|
(12
|
)
|
47
|
|
745
|
|
(18
|
)
|
||||||||||||||
|
States of the U.S. and political subdivisions
|
7
|
|
11
|
|
—
|
|
1
|
|
1
|
|
—
|
|
8
|
|
12
|
|
—
|
|
||||||||||||||
|
Other debt securities
|
—
|
|
—
|
|
—
|
|
3
|
|
5
|
|
—
|
|
3
|
|
5
|
|
—
|
|
||||||||||||||
|
Total temporarily impaired debt securities AFS
|
71
|
|
$
|
1,504
|
|
$
|
(14
|
)
|
75
|
|
$
|
1,016
|
|
$
|
(26
|
)
|
146
|
|
$
|
2,520
|
|
$
|
(40
|
)
|
||||||||
104
|
Less than 12 Months
|
12 Months or More
|
Total
|
||||||||||||||||||||||||||||||
|
(dollars in millions)
|
#
|
Fair
Value
|
Unrealized
Losses
|
#
|
Fair
Value
|
Unrealized
Losses
|
#
|
Fair
Value
|
Unrealized
Losses
|
|||||||||||||||||||||||
|
Debt Securities Held to Maturity:
|
||||||||||||||||||||||||||||||||
|
December 31, 2018
|
||||||||||||||||||||||||||||||||
|
U.S. government-sponsored entities
|
—
|
|
$
|
—
|
|
$
|
—
|
|
12
|
|
$
|
211
|
|
$
|
(4
|
)
|
12
|
|
$
|
211
|
|
$
|
(4
|
)
|
||||||||
|
Residential mortgage-backed securities:
|
||||||||||||||||||||||||||||||||
|
Agency mortgage-backed securities
|
43
|
|
294
|
|
(4
|
)
|
47
|
|
694
|
|
(22
|
)
|
90
|
|
988
|
|
(26
|
)
|
||||||||||||||
|
Agency collateralized mortgage obligations
|
3
|
|
42
|
|
—
|
|
49
|
|
611
|
|
(24
|
)
|
52
|
|
653
|
|
(24
|
)
|
||||||||||||||
|
Commercial mortgage-backed securities
|
5
|
|
26
|
|
—
|
|
4
|
|
43
|
|
(1
|
)
|
9
|
|
69
|
|
(1
|
)
|
||||||||||||||
|
States of the U.S. and political subdivisions
|
159
|
|
590
|
|
(27
|
)
|
51
|
|
161
|
|
(22
|
)
|
210
|
|
751
|
|
(49
|
)
|
||||||||||||||
|
Total temporarily impaired debt securities HTM
|
210
|
|
$
|
952
|
|
$
|
(31
|
)
|
163
|
|
$
|
1,720
|
|
$
|
(73
|
)
|
373
|
|
$
|
2,672
|
|
$
|
(104
|
)
|
||||||||
|
December 31, 2017
|
||||||||||||||||||||||||||||||||
|
U.S. government-sponsored entities
|
4
|
|
$
|
55
|
|
$
|
—
|
|
10
|
|
$
|
186
|
|
$
|
(4
|
)
|
14
|
|
$
|
241
|
|
$
|
(4
|
)
|
||||||||
|
Residential mortgage-backed securities:
|
||||||||||||||||||||||||||||||||
|
Agency mortgage-backed securities
|
36
|
|
648
|
|
(5
|
)
|
11
|
|
184
|
|
(4
|
)
|
47
|
|
832
|
|
(9
|
)
|
||||||||||||||
|
Agency collateralized mortgage obligations
|
14
|
|
276
|
|
(2
|
)
|
35
|
|
473
|
|
(18
|
)
|
49
|
|
749
|
|
(20
|
)
|
||||||||||||||
|
Commercial mortgage-backed securities
|
3
|
|
26
|
|
—
|
|
2
|
|
20
|
|
(1
|
)
|
5
|
|
46
|
|
(1
|
)
|
||||||||||||||
|
States of the U.S. and political subdivisions
|
16
|
|
57
|
|
(1
|
)
|
37
|
|
121
|
|
(6
|
)
|
53
|
|
178
|
|
(7
|
)
|
||||||||||||||
|
Total temporarily impaired debt securities HTM
|
73
|
|
$
|
1,062
|
|
$
|
(8
|
)
|
95
|
|
$
|
984
|
|
$
|
(33
|
)
|
168
|
|
$
|
2,046
|
|
$
|
(41
|
)
|
||||||||
We do not intend to sell the debt securities and it is not more likely than not that we will be required to sell the securities before recovery of their amortized cost basis.
Other-Than-Temporary Impairment
We evaluate our investment securities portfolio for OTTI on a quarterly basis. Impairment is assessed at the individual security level. We consider an investment security impaired if the fair value of the security is less than its cost or amortized cost basis. We did not recognize any OTTI losses on securities for the years ended
December 31, 2018
,
2017
and
2016
.
States of the U.S. and Political Subdivisions
Our municipal bond portfolio with a carrying amount of
$1.1 billion
as of
December 31, 2018
is highly rated with an average rating of AA and
100%
of the portfolio rated A or better, while
99%
have stand-alone ratings of A or better. All of the securities in the municipal portfolio are general obligation bonds. Geographically, municipal bonds support our primary footprint as
65%
of the securities are from municipalities located throughout Pennsylvania, Ohio, Maryland, North Carolina and South Carolina. The average holding size of the securities in the municipal bond portfolio is
$3.1 million
. In addition to the strong stand-alone ratings,
63%
of the municipalities have some formal credit enhancement insurance that strengthens the creditworthiness of their issue. Management reviews the credit profile of each issuer on a quarterly basis.
105
NOTE 5. OTHER SECURITIES
Following is a summary of non-marketable equity securities:
TABLE 5.1
|
December 31
|
2018
|
2017
|
|||||
|
(in millions)
|
|||||||
|
Federal Home Loan Bank stock
|
$
|
209
|
|
$
|
160
|
|
|
|
Federal Reserve Bank stock
|
122
|
|
122
|
|
|||
|
Other non-marketable equity securities
|
1
|
|
1
|
|
|||
|
Total non-marketable equity securities
|
$
|
332
|
|
$
|
283
|
|
|
We are a member of the FHLB of Pittsburgh and the FRB of Cleveland. Both institutions require members to purchase and hold a specified minimum level of stock based upon their membership, level of borrowings, collateral balances or participation in other programs. The FHLB and FRB stock is restricted in that they can only be sold back to the respective institutions. These non-marketable equity securities are included in other assets on the Consolidated Balance Sheets. The investments are carried at cost and evaluated for impairment periodically based on the ultimate recoverability of the par value. We determined there was
no
impairment at
December 31, 2018
and
2017
.
106
NOTE 6. LOANS AND LEASES
Following is a summary of loans and leases, net of unearned income:
TABLE 6.1
|
(in millions)
|
Originated
Loans and
Leases
|
Loans Acquired in a Business Combination
|
Total
Loans and
Leases
|
||||||||
|
December 31, 2018
|
|||||||||||
|
Commercial real estate
|
$
|
6,171
|
|
$
|
2,615
|
|
$
|
8,786
|
|
||
|
Commercial and industrial
|
4,140
|
|
416
|
|
4,556
|
|
|||||
|
Commercial leases
|
373
|
|
—
|
|
373
|
|
|||||
|
Other
|
46
|
|
—
|
|
46
|
|
|||||
|
Total commercial loans and leases
|
10,730
|
|
3,031
|
|
13,761
|
|
|||||
|
Direct installment
|
1,668
|
|
96
|
|
1,764
|
|
|||||
|
Residential mortgages
|
2,612
|
|
501
|
|
3,113
|
|
|||||
|
Indirect installment
|
1,933
|
|
—
|
|
1,933
|
|
|||||
|
Consumer lines of credit
|
1,119
|
|
463
|
|
1,582
|
|
|||||
|
Total consumer loans
|
7,332
|
|
1,060
|
|
8,392
|
|
|||||
|
Total loans and leases, net of unearned income
|
$
|
18,062
|
|
$
|
4,091
|
|
$
|
22,153
|
|
||
|
December 31, 2017
|
|||||||||||
|
Commercial real estate
|
$
|
5,175
|
|
$
|
3,567
|
|
$
|
8,742
|
|
||
|
Commercial and industrial
|
3,495
|
|
675
|
|
4,170
|
|
|||||
|
Commercial leases
|
267
|
|
—
|
|
267
|
|
|||||
|
Other
|
17
|
|
—
|
|
17
|
|
|||||
|
Total commercial loans and leases
|
8,954
|
|
4,242
|
|
13,196
|
|
|||||
|
Direct installment
|
1,756
|
|
150
|
|
1,906
|
|
|||||
|
Residential mortgages
|
2,036
|
|
667
|
|
2,703
|
|
|||||
|
Indirect installment
|
1,448
|
|
—
|
|
1,448
|
|
|||||
|
Consumer lines of credit
|
1,152
|
|
594
|
|
1,746
|
|
|||||
|
Total consumer loans
|
6,392
|
|
1,411
|
|
7,803
|
|
|||||
|
Total loans and leases, net of unearned income
|
$
|
15,346
|
|
$
|
5,653
|
|
$
|
20,999
|
|
||
The loans and leases portfolio categories are comprised of the following:
|
•
|
Commercial real estate includes both owner-occupied and non-owner-occupied loans secured by commercial properties;
|
|
•
|
Commercial and industrial includes loans to businesses that are not secured by real estate;
|
|
•
|
Commercial leases consist of leases for new or used equipment;
|
|
•
|
Other is comprised primarily of credit cards and mezzanine loans;
|
|
•
|
Direct installment is comprised of fixed-rate, closed-end consumer loans for personal, family or household use, such as home equity loans and automobile loans;
|
|
•
|
Residential mortgages consist of conventional and jumbo mortgage loans for 1-4 family properties;
|
|
•
|
Indirect installment is comprised of loans originated by approved third parties and underwritten by us, primarily automobile loans; and
|
|
•
|
Consumer lines of credit include home equity lines of credit and consumer lines of credit that are either unsecured or secured by collateral other than home equity.
|
107
The loans and leases portfolio consists principally of loans to individuals and small- and medium-sized businesses within our primary market in seven states and the District of Columbia. Our market coverage spans several major metropolitan areas including: Pittsburgh, Pennsylvania; Baltimore, Maryland; Cleveland, Ohio; and Charlotte, Raleigh, Durham and the Piedmont Triad (Winston-Salem, Greensboro and High Point) in North Carolina.
The following table shows certain information relating to commercial real estate loans:
TABLE 6.2
|
December 31
|
2018
|
2017
|
|||||
|
(dollars in millions)
|
|||||||
|
Commercial construction, acquisition and development loans
|
$
|
1,152
|
|
$
|
1,170
|
|
|
|
Percent of total loans and leases
|
5.2
|
%
|
5.6
|
%
|
|||
|
Commercial real estate:
|
|||||||
|
Percent owner-occupied
|
35.1
|
%
|
35.3
|
%
|
|||
|
Percent non-owner-occupied
|
64.9
|
%
|
64.7
|
%
|
|||
As of
December 31, 2018
and
2017
, we had residential construction loans of
$273.4 million
and
$248.3 million
, representing
1.2%
and
1.1%
of total loans and leases, respectively.
We have extended credit to certain directors and executive officers and their related interests. These related-party loans were made in the ordinary course of business under normal credit terms and do not involve more than a normal risk of collection. Following is a summary of the activity for these loans to related parties during
2018
:
TABLE 6.3
|
(in millions)
|
|||
|
Balance at beginning of period
|
$
|
20
|
|
|
New loans
|
1
|
|
|
|
Repayments
|
(4
|
)
|
|
|
Other
|
(1
|
)
|
|
|
Balance at end of period
|
$
|
16
|
|
Other represents the net change in loan balances resulting from changes in related parties during
2018
.
108
Loans Acquired in a Business Combination
All loans acquired in a business combination were initially recorded at fair value at the acquisition date. Refer to the Loans Acquired in a Business Combination section in Note 1, “Summary of Significant Accounting Policies,” for a discussion of ASC 310-20 and ASC 310-30 loans. The outstanding balance and the carrying amount of loans acquired in a business combination included in the Consolidated Balance Sheets are as follows:
TABLE 6.4
|
December 31
|
2018
|
2017
|
|||||
|
(in millions)
|
|||||||
|
Accounted for under ASC 310-30:
|
|||||||
|
Outstanding balance
|
$
|
3,768
|
|
$
|
5,176
|
|
|
|
Carrying amount
|
3,570
|
|
4,834
|
|
|||
|
Accounted for under ASC 310-20:
|
|||||||
|
Outstanding balance
|
602
|
|
835
|
|
|||
|
Carrying amount
|
513
|
|
813
|
|
|||
|
Total loans acquired in a business combination:
|
|||||||
|
Outstanding balance
|
4,370
|
|
6,011
|
|
|||
|
Carrying amount
|
4,083
|
|
5,647
|
|
|||
The outstanding balance is the undiscounted sum of all amounts owed under the loan, including amounts deemed principal, interest, fees, penalties and other, whether or not currently due and whether or not any such amounts have been written or charged-off.
The carrying amount of purchased credit impaired loans included in the table above totaled
$1.7 million
at
December 31, 2018
and
$1.9 million
at
December 31, 2017
, representing
0.04%
and
0.03%
, respectively, of the carrying amount of total loans acquired in a business combination as of each date.
The following table provides changes in accretable yield for all loans acquired in business combinations that are accounted for under ASC 310-30. Loans accounted for under ASC 310-20 are not included in this table.
TABLE 6.5
|
Year Ended December 31
|
2018
|
2017
|
|||||
|
(in millions)
|
|||||||
|
Balance at beginning of period
|
$
|
708
|
|
$
|
467
|
|
|
|
Acquisitions
|
—
|
|
445
|
|
|||
|
Reduction due to unexpected early payoffs
|
(146
|
)
|
(128
|
)
|
|||
|
Reclass from non-accretable difference
|
267
|
|
156
|
|
|||
|
Disposals/transfers
|
(1
|
)
|
(4
|
)
|
|||
|
Other
|
(1
|
)
|
(1
|
)
|
|||
|
Accretion
|
(222
|
)
|
(227
|
)
|
|||
|
Balance at end of period
|
$
|
605
|
|
$
|
708
|
|
|
Cash flows expected to be collected on loans acquired in business combinations are estimated quarterly by incorporating several key assumptions similar to the initial estimate of fair value. These key assumptions include probability of default and the amount of actual prepayments after the acquisition date. Prepayments affect the estimated life of the loans and could change the amount of interest income, and possibly principal expected to be collected. In reforecasting future estimated cash flows, credit loss expectations are adjusted as necessary. Improved cash flow expectations for loans or pools are recorded first as a reversal of previously recorded impairment, if any, and then as an increase in prospective yield when all previously recorded impairment has been recaptured. Decreases in expected cash flows are recognized as impairment through a charge to the provision for credit losses and credit to the allowance for credit losses.
109
The excess of cash flows expected to be collected at acquisition over recorded fair value is referred to as the accretable yield. The accretable yield is recognized into income over the remaining life of the loan, or pool of loans, using an effective yield
method, since the timing and/or amount of cash flows expected to be collected can be reasonably estimated (the accretion model). The difference between the loan’s total scheduled principal and interest payments over all cash flows expected at acquisition is referred to as the non-accretable difference. The non-accretable difference represents contractually required principal and interest payments which we do not expect to collect.
During
2018
, there was an overall improvement in cash flow expectations which resulted in a net reclassification of
$266.5 million
from the non-accretable difference to accretable yield primarily driven by overall improvement in the primary credit quality indicators of the majority of the acquired loan pools as well as increases to variable/adjustable interest rates throughout the year. This reclassification was
$155.8 million
for
2017
. The reclassification from the non-accretable difference to the accretable yield results in prospective yield adjustments on the loan pools and was also positively impacted by the sale of
$56.5 million
of acquired residential mortgage loans in the second quarter of 2018.
Credit Quality
Management monitors the credit quality of our loan portfolio using several performance measures to do so based on payment activity and borrower performance.
Non-performing loans include non-accrual loans and non-performing TDRs. Past due loans are reviewed on a monthly basis to identify loans for non-accrual status. We place loans on non-accrual status and discontinue interest accruals on loans generally when principal or interest is due and has remained unpaid for a certain number of days, or when the full amount of principal and interest is due and has remained unpaid for a certain number of days, unless the loan is both well secured and in the process of collection. Commercial loans and leases are placed on non-accrual at
90
days, installment loans are placed on non-accrual at
120
days and residential mortgages and consumer lines of credit are placed on non-accrual at
180
days, though we may place a loan on non-accrual prior to these past due thresholds as warranted. When a loan is placed on non-accrual status, all unpaid accrued interest is reversed. Non-accrual loans may not be restored to accrual status until all delinquent principal and interest have been paid and the ultimate ability to collect the remaining principal and interest is reasonably assured. The majority of TDRs are loans in which we have granted a concession on the interest rate or the original repayment terms due to the borrower’s financial distress.
Following is a summary of non-performing assets:
TABLE 6.6
|
December 31
|
2018
|
2017
|
|||||
|
(dollars in millions)
|
|||||||
|
Non-accrual loans
|
$
|
79
|
|
$
|
75
|
|
|
|
Troubled debt restructurings
|
21
|
|
23
|
|
|||
|
Total non-performing loans
|
100
|
|
98
|
|
|||
|
Other real estate owned
|
35
|
|
41
|
|
|||
|
Total non-performing assets
|
$
|
135
|
|
$
|
139
|
|
|
|
Asset quality ratios:
|
|||||||
|
Non-performing loans / total loans and leases
|
0.45
|
%
|
0.47
|
%
|
|||
|
Non-performing loans + OREO / total loans and leases + OREO
|
0.61
|
%
|
0.66
|
%
|
|||
|
Non-performing assets / total assets
|
0.41
|
%
|
0.44
|
%
|
|||
The carrying value of residential other real estate owned held as a result of obtaining physical possession upon completion of a foreclosure or through completion of a deed in lieu of foreclosure amounted to
$6.3 million
at
December 31, 2018
and
$3.6 million
at
December 31, 2017
. The recorded investment of consumer mortgage loans secured by residential real estate properties for which formal foreclosure proceedings are in process at
December 31, 2018
and
December 31, 2017
totaled
$8.9 million
and
$15.2 million
, respectively.
110
The following tables provide an analysis of the aging of loans by class segregated by loans and leases originated and loans acquired:
TABLE 6.7
|
(in millions)
|
30-89 Days
Past Due
|
≥ 90 Days
Past Due
and Still
Accruing
|
Non-
Accrual
|
Total
Past Due (1)
|
Current
|
Total
Loans and
Leases
|
|||||||||||||||||
|
Originated Loans and Leases
|
|||||||||||||||||||||||
|
December 31, 2018
|
|||||||||||||||||||||||
|
Commercial real estate
|
$
|
7
|
|
$
|
—
|
|
$
|
17
|
|
$
|
24
|
|
$
|
6,147
|
|
$
|
6,171
|
|
|||||
|
Commercial and industrial
|
5
|
|
—
|
|
19
|
|
24
|
|
4,116
|
|
4,140
|
|
|||||||||||
|
Commercial leases
|
1
|
|
—
|
|
2
|
|
3
|
|
370
|
|
373
|
|
|||||||||||
|
Other
|
—
|
|
—
|
|
1
|
|
1
|
|
45
|
|
46
|
|
|||||||||||
|
Total commercial loans and leases
|
13
|
|
—
|
|
39
|
|
52
|
|
10,678
|
|
10,730
|
|
|||||||||||
|
Direct installment
|
8
|
|
—
|
|
8
|
|
16
|
|
1,652
|
|
1,668
|
|
|||||||||||
|
Residential mortgages
|
16
|
|
3
|
|
6
|
|
25
|
|
2,587
|
|
2,612
|
|
|||||||||||
|
Indirect installment
|
11
|
|
1
|
|
2
|
|
14
|
|
1,919
|
|
1,933
|
|
|||||||||||
|
Consumer lines of credit
|
5
|
|
1
|
|
3
|
|
9
|
|
1,110
|
|
1,119
|
|
|||||||||||
|
Total consumer loans
|
40
|
|
5
|
|
19
|
|
64
|
|
7,268
|
|
7,332
|
|
|||||||||||
|
Total originated loans and leases
|
$
|
53
|
|
$
|
5
|
|
$
|
58
|
|
$
|
116
|
|
$
|
17,946
|
|
$
|
18,062
|
|
|||||
|
December 31, 2017
|
|||||||||||||||||||||||
|
Commercial real estate
|
$
|
9
|
|
$
|
—
|
|
$
|
25
|
|
$
|
34
|
|
$
|
5,141
|
|
$
|
5,175
|
|
|||||
|
Commercial and industrial
|
9
|
|
—
|
|
17
|
|
26
|
|
3,469
|
|
3,495
|
|
|||||||||||
|
Commercial leases
|
1
|
|
—
|
|
2
|
|
3
|
|
264
|
|
267
|
|
|||||||||||
|
Other
|
—
|
|
—
|
|
1
|
|
1
|
|
16
|
|
17
|
|
|||||||||||
|
Total commercial loans and leases
|
19
|
|
—
|
|
45
|
|
64
|
|
8,890
|
|
8,954
|
|
|||||||||||
|
Direct installment
|
13
|
|
5
|
|
9
|
|
27
|
|
1,729
|
|
1,756
|
|
|||||||||||
|
Residential mortgages
|
14
|
|
3
|
|
5
|
|
22
|
|
2,014
|
|
2,036
|
|
|||||||||||
|
Indirect installment
|
10
|
|
1
|
|
2
|
|
13
|
|
1,435
|
|
1,448
|
|
|||||||||||
|
Consumer lines of credit
|
6
|
|
1
|
|
2
|
|
9
|
|
1,143
|
|
1,152
|
|
|||||||||||
|
Total consumer loans
|
43
|
|
10
|
|
18
|
|
71
|
|
6,321
|
|
6,392
|
|
|||||||||||
|
Total originated loans and leases
|
$
|
62
|
|
$
|
10
|
|
$
|
63
|
|
$
|
135
|
|
$
|
15,211
|
|
$
|
15,346
|
|
|||||
111
|
(in millions)
|
30-89 Days
Past Due
|
≥ 90 Days
Past Due
and Still
Accruing
|
Non-
Accrual
|
Total
Past Due
(2) (3) (4)
|
Current
|
(Discount)/
Premium
|
Total
Loans
|
||||||||||||||||||||
|
Loans Acquired in a Business Combination
|
|||||||||||||||||||||||||||
|
December 31, 2018
|
|||||||||||||||||||||||||||
|
Commercial real estate
|
$
|
19
|
|
$
|
38
|
|
$
|
3
|
|
$
|
60
|
|
$
|
2,723
|
|
$
|
(168
|
)
|
$
|
2,615
|
|
||||||
|
Commercial and industrial
|
3
|
|
4
|
|
17
|
|
24
|
|
420
|
|
(28
|
)
|
416
|
|
|||||||||||||
|
Total commercial loans
|
22
|
|
42
|
|
20
|
|
84
|
|
3,143
|
|
(196
|
)
|
3,031
|
|
|||||||||||||
|
Direct installment
|
3
|
|
2
|
|
—
|
|
5
|
|
91
|
|
—
|
|
96
|
|
|||||||||||||
|
Residential mortgages
|
13
|
|
6
|
|
—
|
|
19
|
|
498
|
|
(16
|
)
|
501
|
|
|||||||||||||
|
Consumer lines of credit
|
8
|
|
3
|
|
1
|
|
12
|
|
461
|
|
(10
|
)
|
463
|
|
|||||||||||||
|
Total consumer loans
|
24
|
|
11
|
|
1
|
|
36
|
|
1,050
|
|
(26
|
)
|
1,060
|
|
|||||||||||||
|
Total loans acquired in a business combination
|
$
|
46
|
|
$
|
53
|
|
$
|
21
|
|
$
|
120
|
|
$
|
4,193
|
|
$
|
(222
|
)
|
$
|
4,091
|
|
||||||
|
December 31, 2017
|
|||||||||||||||||||||||||||
|
Commercial real estate
|
$
|
35
|
|
$
|
63
|
|
$
|
4
|
|
$
|
102
|
|
$
|
3,657
|
|
$
|
(192
|
)
|
$
|
3,567
|
|
||||||
|
Commercial and industrial
|
3
|
|
7
|
|
6
|
|
16
|
|
698
|
|
(39
|
)
|
675
|
|
|||||||||||||
|
Total commercial loans
|
38
|
|
70
|
|
10
|
|
118
|
|
4,355
|
|
(231
|
)
|
4,242
|
|
|||||||||||||
|
Direct installment
|
5
|
|
2
|
|
—
|
|
7
|
|
142
|
|
1
|
|
150
|
|
|||||||||||||
|
Residential mortgages
|
17
|
|
15
|
|
—
|
|
32
|
|
676
|
|
(41
|
)
|
667
|
|
|||||||||||||
|
Consumer lines of credit
|
7
|
|
3
|
|
1
|
|
11
|
|
596
|
|
(13
|
)
|
594
|
|
|||||||||||||
|
Total consumer loans
|
29
|
|
20
|
|
1
|
|
50
|
|
1,414
|
|
(53
|
)
|
1,411
|
|
|||||||||||||
|
Total loans acquired in a business combination
|
$
|
67
|
|
$
|
90
|
|
$
|
11
|
|
$
|
168
|
|
$
|
5,769
|
|
$
|
(284
|
)
|
$
|
5,653
|
|
||||||
|
(1)
|
Approximately
$14.7 million
of originated past-due or non-accrual loans were sold during the second quarter of 2018.
|
|
(2)
|
Past due information for loans acquired in a business combination is based on the contractual balance outstanding at
December 31, 2018
and
2017
.
|
|
(3)
|
Loans acquired in a business combination are considered performing upon acquisition, regardless of whether the customer is contractually delinquent, if we can reasonably estimate the timing and amount of expected cash flows on such loans. In these instances, we do not consider acquired contractually delinquent loans to be non-accrual or non-performing and continue to recognize interest income on these loans using the accretion method. Loans acquired in a business combination are considered non-accrual or non-performing when, due to credit deterioration or other factors, we determine we are no longer able to reasonably estimate the timing and amount of expected cash flows on such loans. We do not recognize interest income on loans acquired in a business combination considered non-accrual or non-performing.
|
|
(4)
|
Approximately
$28.5 million
of acquired past-due or non-accrual loans were sold during the second quarter of 2018.
|
We utilize the following categories to monitor credit quality within our commercial loan and lease portfolio:
TABLE 6.8
|
Rating
Category
|
Definition
|
|
|
Pass
|
in general, the condition of the borrower and the performance of the loan is satisfactory or better
|
|
|
Special Mention
|
in general, the condition of the borrower has deteriorated, requiring an increased level of monitoring
|
|
|
Substandard
|
in general, the condition of the borrower has significantly deteriorated and the performance of the loan could further deteriorate if deficiencies are not corrected
|
|
|
Doubtful
|
in general, the condition of the borrower has significantly deteriorated and the collection in full of both principal and interest is highly questionable or improbable
|
|
112
The use of these internally assigned credit quality categories within the commercial loan and lease portfolio permits management’s use of transition matrices to estimate a quantitative portion of credit risk. Our internal credit risk grading system is based on past experiences with similarly graded loans and leases and conforms with regulatory categories. In general, loan and lease risk ratings within each category are reviewed on an ongoing basis according to our policy for each class of loans and leases. Each quarter, management analyzes the resulting ratings, as well as other external statistics and factors such as delinquency, to track the migration performance of the commercial loan and lease portfolio. Loans and leases within the Pass credit category or that migrate toward the Pass credit category generally have a lower risk of loss compared to loans and leases that migrate toward the Substandard or Doubtful credit categories. Accordingly, management applies higher risk factors to Substandard and Doubtful credit categories.
The following tables present a summary of our commercial loans and leases by credit quality category segregated by loans and leases originated and loans acquired:
TABLE 6.9
|
Commercial Loan and Lease Credit Quality Categories
|
|||||||||||||||||||
|
(in millions)
|
Pass
|
Special
Mention
|
Substandard
|
Doubtful
|
Total
|
||||||||||||||
|
Originated Loans and Leases
|
|||||||||||||||||||
|
December 31, 2018
|
|||||||||||||||||||
|
Commercial real estate
|
$
|
5,883
|
|
$
|
163
|
|
$
|
125
|
|
$
|
—
|
|
$
|
6,171
|
|
||||
|
Commercial and industrial
|
3,879
|
|
180
|
|
81
|
|
—
|
|
4,140
|
|
|||||||||
|
Commercial leases
|
366
|
|
1
|
|
6
|
|
—
|
|
373
|
|
|||||||||
|
Other
|
45
|
|
—
|
|
1
|
|
—
|
|
46
|
|
|||||||||
|
Total originated commercial loans and leases
|
$
|
10,173
|
|
$
|
344
|
|
$
|
213
|
|
$
|
—
|
|
$
|
10,730
|
|
||||
|
December 31, 2017
|
|||||||||||||||||||
|
Commercial real estate
|
$
|
4,923
|
|
$
|
152
|
|
$
|
99
|
|
$
|
1
|
|
$
|
5,175
|
|
||||
|
Commercial and industrial
|
3,267
|
|
133
|
|
92
|
|
3
|
|
3,495
|
|
|||||||||
|
Commercial leases
|
260
|
|
5
|
|
2
|
|
—
|
|
267
|
|
|||||||||
|
Other
|
16
|
|
—
|
|
1
|
|
—
|
|
17
|
|
|||||||||
|
Total originated commercial loans and leases
|
$
|
8,466
|
|
$
|
290
|
|
$
|
194
|
|
$
|
4
|
|
$
|
8,954
|
|
||||
|
Loans Acquired in a Business Combination
|
|||||||||||||||||||
|
December 31, 2018
|
|||||||||||||||||||
|
Commercial real estate
|
$
|
2,256
|
|
$
|
168
|
|
$
|
191
|
|
$
|
—
|
|
$
|
2,615
|
|
||||
|
Commercial and industrial
|
355
|
|
18
|
|
43
|
|
—
|
|
416
|
|
|||||||||
|
Total commercial loans acquired in a business combination
|
$
|
2,611
|
|
$
|
186
|
|
$
|
234
|
|
$
|
—
|
|
$
|
3,031
|
|
||||
|
December 31, 2017
|
|||||||||||||||||||
|
Commercial real estate
|
$
|
3,103
|
|
$
|
251
|
|
$
|
213
|
|
$
|
—
|
|
$
|
3,567
|
|
||||
|
Commercial and industrial
|
604
|
|
26
|
|
45
|
|
—
|
|
675
|
|
|||||||||
|
Total commercial loans acquired in a business combination
|
$
|
3,707
|
|
$
|
277
|
|
$
|
258
|
|
$
|
—
|
|
$
|
4,242
|
|
||||
Credit quality information for loans acquired in a business combination is based on the contractual balance outstanding at
December 31, 2018
and
2017
.
We use delinquency transition matrices within the consumer and other loan classes to enable management to estimate a quantitative portion of credit risk. Each month, management analyzes payment and volume activity, FICO scores and other external factors such as unemployment, to determine how consumer loans are performing.
113
Following is a table showing consumer loans by payment status:
TABLE 6.10
|
|
Consumer Loan Credit Quality by Payment Status
|
||||||||||
|
(in millions)
|
Performing
|
Non-Performing
|
Total
|
||||||||
|
Originated Loans
|
|||||||||||
|
December 31, 2018
|
|||||||||||
|
Direct installment
|
$
|
1,654
|
|
$
|
14
|
|
$
|
1,668
|
|
||
|
Residential mortgages
|
2,598
|
|
14
|
|
2,612
|
|
|||||
|
Indirect installment
|
1,931
|
|
2
|
|
1,933
|
|
|||||
|
Consumer lines of credit
|
1,114
|
|
5
|
|
1,119
|
|
|||||
|
Total originated consumer loans
|
$
|
7,297
|
|
$
|
35
|
|
$
|
7,332
|
|
||
|
December 31, 2017
|
|||||||||||
|
Direct installment
|
$
|
1,739
|
|
$
|
17
|
|
$
|
1,756
|
|
||
|
Residential mortgages
|
2,020
|
|
16
|
|
2,036
|
|
|||||
|
Indirect installment
|
1,446
|
|
2
|
|
1,448
|
|
|||||
|
Consumer lines of credit
|
1,148
|
|
4
|
|
1,152
|
|
|||||
|
Total originated consumer loans
|
$
|
6,353
|
|
$
|
39
|
|
$
|
6,392
|
|
||
|
Loans Acquired in a Business Combination
|
|||||||||||
|
December 31, 2018
|
|||||||||||
|
Direct installment
|
$
|
96
|
|
$
|
—
|
|
$
|
96
|
|
||
|
Residential mortgages
|
501
|
|
—
|
|
501
|
|
|||||
|
Indirect installment
|
—
|
|
—
|
|
—
|
|
|||||
|
Consumer lines of credit
|
462
|
|
1
|
|
463
|
|
|||||
|
Total consumer loans acquired in a business combination
|
$
|
1,059
|
|
$
|
1
|
|
$
|
1,060
|
|
||
|
December 31, 2017
|
|||||||||||
|
Direct installment
|
$
|
150
|
|
$
|
—
|
|
$
|
150
|
|
||
|
Residential mortgages
|
667
|
|
—
|
|
667
|
|
|||||
|
Consumer lines of credit
|
592
|
|
2
|
|
594
|
|
|||||
|
Total consumer loans acquired in a business combination
|
$
|
1,409
|
|
$
|
2
|
|
$
|
1,411
|
|
||
Loans are designated as impaired when, in the opinion of management, based on current information and events, the collection of principal and interest in accordance with the loan and lease contract is doubtful. Typically, we do not consider loans for impairment unless a sustained period of delinquency (i.e.,
90
-plus days) is noted or there are subsequent events that impact repayment probability (i.e., negative financial trends, bankruptcy filings, imminent foreclosure proceedings, etc.). Effective July 1, 2018, we changed our threshold for measuring impairment on a collective basis. Impairment is evaluated in the aggregate for newly impaired commercial loan relationships less than
$1.0 million
based on loan segment loss given default. Impairment is evaluated in the aggregate for consumer installment loans, residential mortgages, consumer lines of credit and commercial loan relationships less than
$1.0 million
based on loan segment loss given default. For commercial loan relationships greater than or equal to
$1.0 million
, a specific valuation allowance is allocated, if necessary, so that the loan is reported net, at the present value of estimated future cash flows using a market interest rate or at the fair value of collateral if repayment is expected solely from the sale of the collateral. Consistent with our existing method of income recognition for loans, interest income on impaired loans, except those classified as non-accrual, is recognized using the accrual method. Impaired loans, or portions thereof, are charged off when deemed uncollectible.
114
Following is a summary of information pertaining to loans and leases considered to be impaired, by class of loan and lease:
TABLE 6.11
|
(in millions)
|
Unpaid
Contractual
Principal
Balance
|
Recorded
Investment
With No
Specific
Reserve
|
Recorded
Investment
With
Specific
Reserve
|
Total
Recorded
Investment
|
Specific
Reserve
|
Average
Recorded
Investment
|
|||||||||||||||||
|
At or for the Year Ended
December 31, 2018 |
|||||||||||||||||||||||
|
Commercial real estate
|
$
|
20
|
|
$
|
16
|
|
$
|
1
|
|
$
|
17
|
|
$
|
—
|
|
$
|
18
|
|
|||||
|
Commercial and industrial
|
46
|
|
20
|
|
13
|
|
33
|
|
4
|
|
32
|
|
|||||||||||
|
Commercial leases
|
2
|
|
2
|
|
—
|
|
2
|
|
—
|
|
4
|
|
|||||||||||
|
Other
|
—
|
|
—
|
|
—
|
|
—
|
|
—
|
|
—
|
|
|||||||||||
|
Total commercial loans and leases
|
68
|
|
38
|
|
14
|
|
52
|
|
4
|
|
54
|
|
|||||||||||
|
Direct installment
|
17
|
|
14
|
|
—
|
|
14
|
|
—
|
|
14
|
|
|||||||||||
|
Residential mortgages
|
16
|
|
14
|
|
—
|
|
14
|
|
—
|
|
15
|
|
|||||||||||
|
Indirect installment
|
5
|
|
2
|
|
—
|
|
2
|
|
—
|
|
2
|
|
|||||||||||
|
Consumer lines of credit
|
7
|
|
5
|
|
—
|
|
5
|
|
—
|
|
5
|
|
|||||||||||
|
Total consumer loans
|
45
|
|
35
|
|
—
|
|
35
|
|
—
|
|
36
|
|
|||||||||||
|
Total
|
$
|
113
|
|
$
|
73
|
|
$
|
14
|
|
$
|
87
|
|
$
|
4
|
|
$
|
90
|
|
|||||
|
At or for the Year Ended
December 31, 2017 |
|||||||||||||||||||||||
|
Commercial real estate
|
$
|
27
|
|
$
|
22
|
|
$
|
3
|
|
$
|
25
|
|
$
|
1
|
|
$
|
25
|
|
|||||
|
Commercial and industrial
|
29
|
|
11
|
|
4
|
|
15
|
|
3
|
|
24
|
|
|||||||||||
|
Commercial leases
|
2
|
|
2
|
|
—
|
|
2
|
|
—
|
|
1
|
|
|||||||||||
|
Total commercial loans and leases
|
58
|
|
35
|
|
7
|
|
42
|
|
4
|
|
50
|
|
|||||||||||
|
Direct installment
|
19
|
|
17
|
|
—
|
|
17
|
|
—
|
|
17
|
|
|||||||||||
|
Residential mortgages
|
18
|
|
16
|
|
—
|
|
16
|
|
—
|
|
16
|
|
|||||||||||
|
Indirect installment
|
6
|
|
2
|
|
—
|
|
2
|
|
—
|
|
2
|
|
|||||||||||
|
Consumer lines of credit
|
5
|
|
4
|
|
—
|
|
4
|
|
—
|
|
4
|
|
|||||||||||
|
Total consumer loans
|
48
|
|
39
|
|
—
|
|
39
|
|
—
|
|
39
|
|
|||||||||||
|
Total
|
$
|
106
|
|
$
|
74
|
|
$
|
7
|
|
$
|
81
|
|
$
|
4
|
|
$
|
89
|
|
|||||
115
Interest income continued to accrue on certain impaired loans and totaled approximately
$5.9 million
,
$6.1 million
and
$4.6 million
during
2018
,
2017
and
2016
, respectively. The above tables include one loan acquired in a business combination with a specific reserve at
December 31, 2018
.
Following is a summary of the allowance for credit losses required for loans acquired in a business combination due to changes in credit quality subsequent to the acquisition date:
TABLE 6.12
|
December 31
|
2018
|
2017
|
|||||
|
(in millions)
|
|||||||
|
Commercial real estate
|
$
|
2
|
|
$
|
5
|
|
|
|
Commercial and industrial
|
4
|
|
—
|
|
|||
|
Total commercial loans
|
6
|
|
5
|
|
|||
|
Direct installment
|
1
|
|
2
|
|
|||
|
Total consumer loans
|
1
|
|
2
|
|
|||
|
Total allowance on loans acquired in a business combination
|
$
|
7
|
|
$
|
7
|
|
|
Troubled Debt Restructurings
TDRs are loans whose contractual terms have been modified in a manner that grants a concession to a borrower experiencing financial difficulties. TDRs typically result from loss mitigation activities and could include the extension of a maturity date, interest rate reduction, principal forgiveness, deferral or decrease in payments for a period of time and other actions intended to minimize the economic loss and to avoid foreclosure or repossession of collateral.
Following is a summary of the composition of total TDRs:
TABLE 6.13
|
(in millions)
|
Originated
|
Acquired
|
Total
|
||||||||
|
December 31, 2018
|
|||||||||||
|
Accruing:
|
|||||||||||
|
Performing
|
$
|
18
|
|
$
|
—
|
|
$
|
18
|
|
||
|
Non-performing
|
17
|
|
4
|
|
21
|
|
|||||
|
Non-accrual
|
9
|
|
—
|
|
9
|
|
|||||
|
Total TDRs
|
$
|
44
|
|
$
|
4
|
|
$
|
48
|
|
||
|
December 31, 2017
|
|||||||||||
|
Accruing:
|
|||||||||||
|
Performing
|
$
|
20
|
|
$
|
—
|
|
$
|
20
|
|
||
|
Non-performing
|
20
|
|
3
|
|
23
|
|
|||||
|
Non-accrual
|
10
|
|
—
|
|
10
|
|
|||||
|
Total TDRs
|
$
|
50
|
|
$
|
3
|
|
$
|
53
|
|
||
TDRs that are accruing and performing include loans that met the criteria for non-accrual of interest prior to restructuring for which we can reasonably estimate the timing and amount of the expected cash flows on such loans and for which we expect to fully collect the new carrying value of the loans. During
2018
, we returned to performing status
$4.0 million
in restructured residential mortgage loans that have consistently met their modified obligations for more than six months. TDRs that are accruing and non-performing are comprised of consumer loans that have not demonstrated a consistent repayment pattern on the modified terms for more than six months, however it is expected that we will collect all future principal and interest payments. TDRs that are on non-accrual are not placed on accruing status until all delinquent principal and interest have been paid and the ultimate collectability of the remaining principal and interest is reasonably assured. Some loan modifications classified as TDRs may not ultimately result in the full collection of principal and interest, as modified, and may result in potential incremental losses which are factored into the allowance for credit losses.
116
Excluding purchased credit impaired loans, commercial loans over
$1.0 million
whose terms have been modified in a TDR are generally placed on non-accrual, individually analyzed and measured for estimated impairment based on the fair value of the underlying collateral. Our allowance for credit losses included specific reserves for commercial TDRs and pooled reserves for individually impaired loans under
$1.0 million
based on loan segment loss given default. Our allowance for loan losses includes specific reserves for commercial TDRs of
less than $0.5 million
at
December 31, 2018
and
2017
, respectively, and pooled reserves for individual loans of
$0.5 million
for those same respective periods, based on loan segment loss given default. Upon default, the amount of the recorded investment in the TDR in excess of the fair value of the collateral, less estimated selling costs, is generally considered a confirmed loss and is charged-off against the allowance for credit losses.
All other classes of loans whose terms have been modified in a TDR are pooled and measured for estimated impairment based on the expected net present value of the estimated future cash flows of the pool. Our allowance for credit losses included pooled reserves for these classes of loans of
$4.0 million
at
December 31, 2018
and
2017
, respectively. Upon default of an individual loan, our charge-off policy is followed for that class of loan.
Following is a summary of TDR loans, by class:
TABLE 6.14
|
Year Ended December 31
|
2018
|
2017
|
|||||||||||||||||||
|
(dollars in millions)
|
Number
of
Contracts
|
Pre-Modification
Outstanding
Recorded
Investment
|
Post-
Modification
Outstanding
Recorded
Investment
|
Number
of
Contracts
|
Pre-Modification
Outstanding
Recorded
Investment
|
Post-
Modification
Outstanding
Recorded
Investment
|
|||||||||||||||
|
Commercial real estate
|
4
|
|
$
|
1
|
|
$
|
1
|
|
3
|
|
$
|
2
|
|
$
|
2
|
|
|||||
|
Commercial and industrial
|
10
|
|
—
|
|
—
|
|
3
|
|
3
|
|
3
|
|
|||||||||
|
Total commercial loans
|
14
|
|
1
|
|
1
|
|
6
|
|
5
|
|
5
|
|
|||||||||
|
Direct installment
|
80
|
|
4
|
|
4
|
|
641
|
|
5
|
|
5
|
|
|||||||||
|
Residential mortgages
|
15
|
|
1
|
|
1
|
|
43
|
|
3
|
|
2
|
|
|||||||||
|
Indirect installment
|
—
|
|
—
|
|
—
|
|
18
|
|
—
|
|
—
|
|
|||||||||
|
Consumer lines of credit
|
26
|
|
1
|
|
1
|
|
64
|
|
1
|
|
1
|
|
|||||||||
|
Total consumer loans
|
121
|
|
6
|
|
6
|
|
766
|
|
9
|
|
8
|
|
|||||||||
|
Total
|
135
|
|
$
|
7
|
|
$
|
7
|
|
772
|
|
$
|
14
|
|
$
|
13
|
|
|||||
The items in the above tables have been adjusted for loans that have been paid off and/or sold.
117
Following is a summary of originated TDRs, by class, for which there was a payment default, excluding loans that have been paid off and/or sold. Default occurs when a loan is
90
days or more past due and is within 12 months of restructuring.
TABLE 6.15
|
Year Ended December 31
|
2018
|
2017
|
|||||||||||
|
(dollars in millions)
|
Number
of
Contracts
|
Recorded
Investment
|
Number
of
Contracts
|
Recorded
Investment
|
|||||||||
|
Commercial real estate
|
3
|
|
$
|
1
|
|
1
|
|
$
|
—
|
|
|||
|
Commercial and industrial
|
1
|
|
—
|
|
—
|
|
—
|
|
|||||
|
Total commercial loans
|
4
|
|
1
|
|
1
|
|
—
|
|
|||||
|
Direct installment
|
7
|
|
1
|
|
131
|
|
1
|
|
|||||
|
Residential mortgages
|
4
|
|
—
|
|
6
|
|
—
|
|
|||||
|
Indirect installment
|
—
|
|
—
|
|
17
|
|
—
|
|
|||||
|
Consumer lines of credit
|
3
|
|
—
|
|
5
|
|
—
|
|
|||||
|
Total consumer loans
|
14
|
|
1
|
|
159
|
|
1
|
|
|||||
|
Total
|
18
|
|
$
|
2
|
|
160
|
|
$
|
1
|
|
|||
NOTE 7. ALLOWANCE FOR CREDIT LOSSES
Following is a summary of changes in the allowance for credit losses, by loan and lease class:
TABLE 7.1
|
(in millions)
|
Balance at
Beginning
of Year
|
Charge-
Offs
|
Recoveries
|
Net
Charge-
Offs
|
Provision
for Credit
Losses
|
Balance at
End of
Year
|
|||||||||||||||||
|
Year Ended December 31, 2018
|
|||||||||||||||||||||||
|
Commercial real estate
|
$
|
50
|
|
$
|
(7
|
)
|
$
|
3
|
|
$
|
(4
|
)
|
$
|
9
|
|
$
|
55
|
|
|||||
|
Commercial and industrial
|
52
|
|
(20
|
)
|
2
|
|
(18
|
)
|
15
|
|
49
|
|
|||||||||||
|
Commercial leases
|
5
|
|
(3
|
)
|
—
|
|
(3
|
)
|
6
|
|
8
|
|
|||||||||||
|
Other
|
2
|
|
(4
|
)
|
—
|
|
(4
|
)
|
4
|
|
2
|
|
|||||||||||
|
Total commercial loans and leases
|
109
|
|
(34
|
)
|
5
|
|
(29
|
)
|
34
|
|
114
|
|
|||||||||||
|
Direct installment
|
21
|
|
(17
|
)
|
2
|
|
(15
|
)
|
8
|
|
14
|
|
|||||||||||
|
Residential mortgages
|
16
|
|
—
|
|
—
|
|
—
|
|
4
|
|
20
|
|
|||||||||||
|
Indirect installment
|
12
|
|
(9
|
)
|
4
|
|
(5
|
)
|
8
|
|
15
|
|
|||||||||||
|
Consumer lines of credit
|
10
|
|
(3
|
)
|
—
|
|
(3
|
)
|
3
|
|
10
|
|
|||||||||||
|
Total consumer loans
|
59
|
|
(29
|
)
|
6
|
|
(23
|
)
|
23
|
|
59
|
|
|||||||||||
|
Total allowance on originated loans
|
168
|
|
(63
|
)
|
11
|
|
(52
|
)
|
57
|
|
173
|
|
|||||||||||
|
Purchased credit-impaired loans
|
1
|
|
—
|
|
—
|
|
—
|
|
—
|
|
1
|
|
|||||||||||
|
Other loans acquired in a business combination
|
6
|
|
(7
|
)
|
3
|
|
(4
|
)
|
4
|
|
6
|
|
|||||||||||
|
Total allowance on loans acquired in a business combination
|
7
|
|
(7
|
)
|
3
|
|
(4
|
)
|
4
|
|
7
|
|
|||||||||||
|
Total allowance for credit losses
|
$
|
175
|
|
$
|
(70
|
)
|
$
|
14
|
|
$
|
(56
|
)
|
$
|
61
|
|
$
|
180
|
|
|||||
118
|
(in millions)
|
Balance at
Beginning
of Year
|
Charge-
Offs
|
Recoveries
|
Net
Charge-
Offs
|
Provision
for Credit
Losses
|
Balance at
End of
Year
|
|||||||||||||||||
|
Year Ended December 31, 2017
|
|||||||||||||||||||||||
|
Commercial real estate
|
$
|
47
|
|
$
|
(2
|
)
|
$
|
2
|
|
$
|
—
|
|
$
|
3
|
|
$
|
50
|
|
|||||
|
Commercial and industrial
|
48
|
|
(27
|
)
|
2
|
|
(25
|
)
|
29
|
|
52
|
|
|||||||||||
|
Commercial leases
|
3
|
|
(1
|
)
|
—
|
|
(1
|
)
|
3
|
|
5
|
|
|||||||||||
|
Other
|
1
|
|
(4
|
)
|
1
|
|
(3
|
)
|
4
|
|
2
|
|
|||||||||||
|
Total commercial loans and leases
|
99
|
|
(34
|
)
|
5
|
|
(29
|
)
|
39
|
|
109
|
|
|||||||||||
|
Direct installment
|
21
|
|
(12
|
)
|
2
|
|
(10
|
)
|
10
|
|
21
|
|
|||||||||||
|
Residential mortgages
|
10
|
|
—
|
|
—
|
|
—
|
|
6
|
|
16
|
|
|||||||||||
|
Indirect installment
|
11
|
|
(10
|
)
|
4
|
|
(6
|
)
|
7
|
|
12
|
|
|||||||||||
|
Consumer lines of credit
|
10
|
|
(2
|
)
|
—
|
|
(2
|
)
|
2
|
|
10
|
|
|||||||||||
|
Total consumer loans
|
52
|
|
(24
|
)
|
6
|
|
(18
|
)
|
25
|
|
59
|
|
|||||||||||
|
Total allowance on originated loans
|
151
|
|
(58
|
)
|
11
|
|
(47
|
)
|
64
|
|
168
|
|
|||||||||||
|
Purchased credit-impaired loans
|
1
|
|
(1
|
)
|
—
|
|
(1
|
)
|
1
|
|
1
|
|
|||||||||||
|
Other loans acquired in a business combination
|
6
|
|
(1
|
)
|
5
|
|
4
|
|
(4
|
)
|
6
|
|
|||||||||||
|
Total allowance on loans acquired in a business combination
|
7
|
|
(2
|
)
|
5
|
|
3
|
|
(3
|
)
|
7
|
|
|||||||||||
|
Total allowance for credit losses
|
$
|
158
|
|
$
|
(60
|
)
|
$
|
16
|
|
$
|
(44
|
)
|
$
|
61
|
|
$
|
175
|
|
|||||
|
Year Ended December 31, 2016
|
|||||||||||||||||||||||
|
Commercial real estate
|
$
|
42
|
|
$
|
(7
|
)
|
$
|
4
|
|
$
|
(3
|
)
|
$
|
8
|
|
$
|
47
|
|
|||||
|
Commercial and industrial
|
41
|
|
(19
|
)
|
2
|
|
(17
|
)
|
24
|
|
48
|
|
|||||||||||
|
Commercial leases
|
2
|
|
(1
|
)
|
—
|
|
(1
|
)
|
2
|
|
3
|
|
|||||||||||
|
Other
|
1
|
|
(3
|
)
|
—
|
|
(3
|
)
|
3
|
|
1
|
|
|||||||||||
|
Total commercial loans and leases
|
86
|
|
(30
|
)
|
6
|
|
(24
|
)
|
37
|
|
99
|
|
|||||||||||
|
Direct installment
|
21
|
|
(10
|
)
|
2
|
|
(8
|
)
|
8
|
|
21
|
|
|||||||||||
|
Residential mortgages
|
8
|
|
—
|
|
—
|
|
—
|
|
2
|
|
10
|
|
|||||||||||
|
Indirect installment
|
10
|
|
(8
|
)
|
2
|
|
(6
|
)
|
7
|
|
11
|
|
|||||||||||
|
Consumer lines of credit
|
10
|
|
(2
|
)
|
—
|
|
(2
|
)
|
2
|
|
10
|
|
|||||||||||
|
Total consumer loans
|
49
|
|
(20
|
)
|
4
|
|
(16
|
)
|
19
|
|
52
|
|
|||||||||||
|
Total allowance on originated loans
|
135
|
|
(50
|
)
|
10
|
|
(40
|
)
|
56
|
|
151
|
|
|||||||||||
|
Purchased credit-impaired loans
|
1
|
|
—
|
|
—
|
|
—
|
|
—
|
|
1
|
|
|||||||||||
|
Other loans acquired in a business combination
|
6
|
|
(1
|
)
|
1
|
|
—
|
|
—
|
|
6
|
|
|||||||||||
|
Total allowance on loans acquired in a business combination
|
7
|
|
(1
|
)
|
1
|
|
—
|
|
—
|
|
7
|
|
|||||||||||
|
Total allowance for credit losses
|
$
|
142
|
|
$
|
(51
|
)
|
$
|
11
|
|
$
|
(40
|
)
|
$
|
56
|
|
$
|
158
|
|
|||||
119
Following is a summary of the individual and collective allowance for credit losses and corresponding loan and lease balances by class:
TABLE 7.2
|
Allowance
|
Loans and Leases Outstanding
|
||||||||||||||||||
|
(in millions)
|
Individually
Evaluated
for
Impairment
|
Collectively
Evaluated
for
Impairment
|
Loans and
Leases
|
Individually
Evaluated
for
Impairment
|
Collectively
Evaluated
for
Impairment
|
||||||||||||||
|
December 31, 2018
|
|||||||||||||||||||
|
Commercial real estate
|
$
|
—
|
|
$
|
55
|
|
$
|
6,171
|
|
$
|
7
|
|
$
|
6,164
|
|
||||
|
Commercial and industrial
|
4
|
|
49
|
|
4,140
|
|
11
|
|
4,129
|
|
|||||||||
|
Commercial leases
|
—
|
|
9
|
|
373
|
|
—
|
|
373
|
|
|||||||||
|
Other
|
—
|
|
2
|
|
46
|
|
—
|
|
46
|
|
|||||||||
|
Total commercial loans and leases
|
4
|
|
115
|
|
10,730
|
|
18
|
|
10,712
|
|
|||||||||
|
Direct installment
|
—
|
|
14
|
|
1,668
|
|
—
|
|
1,668
|
|
|||||||||
|
Residential mortgages
|
—
|
|
19
|
|
2,612
|
|
—
|
|
2,612
|
|
|||||||||
|
Indirect installment
|
—
|
|
15
|
|
1,933
|
|
—
|
|
1,933
|
|
|||||||||
|
Consumer lines of credit
|
—
|
|
10
|
|
1,119
|
|
—
|
|
1,119
|
|
|||||||||
|
Total consumer loans
|
—
|
|
58
|
|
7,332
|
|
—
|
|
7,332
|
|
|||||||||
|
Total
|
$
|
4
|
|
$
|
173
|
|
$
|
18,062
|
|
$
|
18
|
|
$
|
18,044
|
|
||||
|
December 31, 2017
|
|||||||||||||||||||
|
Commercial real estate
|
$
|
1
|
|
$
|
50
|
|
$
|
5,175
|
|
$
|
11
|
|
$
|
5,164
|
|
||||
|
Commercial and industrial
|
3
|
|
49
|
|
3,495
|
|
10
|
|
3,485
|
|
|||||||||
|
Commercial leases
|
—
|
|
5
|
|
267
|
|
—
|
|
267
|
|
|||||||||
|
Other
|
—
|
|
2
|
|
17
|
|
—
|
|
17
|
|
|||||||||
|
Total commercial loans and leases
|
4
|
|
106
|
|
8,954
|
|
21
|
|
8,933
|
|
|||||||||
|
Direct installment
|
—
|
|
21
|
|
1,756
|
|
—
|
|
1,756
|
|
|||||||||
|
Residential mortgages
|
—
|
|
16
|
|
2,036
|
|
—
|
|
2,036
|
|
|||||||||
|
Indirect installment
|
—
|
|
12
|
|
1,448
|
|
—
|
|
1,448
|
|
|||||||||
|
Consumer lines of credit
|
—
|
|
10
|
|
1,152
|
|
—
|
|
1,152
|
|
|||||||||
|
Total consumer loans
|
—
|
|
59
|
|
6,392
|
|
—
|
|
6,392
|
|
|||||||||
|
Total
|
$
|
4
|
|
$
|
165
|
|
$
|
15,346
|
|
$
|
21
|
|
$
|
15,325
|
|
||||
The above table excludes loans acquired in a business combination that were pooled into groups of loans for evaluating impairment.
NOTE 8. LOAN SERVICING
Mortgage Loan Servicing
We retain the servicing rights on certain mortgage loans sold. The unpaid principal balance of mortgage loans serviced for others, as of
December 31, 2018
and
2017
, is listed below:
TABLE 8.1
|
December 31
|
2018
|
|
2017
|
||||
|
(in millions)
|
|||||||
|
Mortgage loans sold with servicing retained
|
$
|
3,968
|
|
$
|
3,257
|
|
|
120
The following table summarizes activity relating to mortgage loans sold with servicing retained:
TABLE 8.2
|
Year Ended December 31
|
2018
|
2017
|
2016
|
||||||||
|
(in millions)
|
|||||||||||
|
Mortgage loans sold with servicing retained
|
$
|
1,060
|
|
$
|
1,769
|
|
$
|
673
|
|
||
|
Pretax gains resulting from above loan sales
(1)
|
19
|
|
22
|
|
13
|
|
|||||
|
Mortgage servicing fees
(1)
|
9
|
|
8
|
|
4
|
|
|||||
(1) Recorded in mortgage banking operations on the Consolidated Statements of Income.
Following is a summary of the MSR activity:
TABLE 8.3
|
Year Ended December 31
|
2018
|
2017
|
2016
|
||||||||
|
(in millions)
|
|||||||||||
|
Balance at beginning of period
|
$
|
29
|
|
$
|
14
|
|
$
|
9
|
|
||
|
Fair value of MSRs acquired
|
—
|
|
8
|
|
—
|
|
|||||
|
Additions
|
13
|
|
11
|
|
7
|
|
|||||
|
Payoffs and curtailments
|
(2
|
)
|
(2
|
)
|
(1
|
)
|
|||||
|
Impairment charge
|
(1
|
)
|
—
|
|
—
|
|
|||||
|
Amortization
|
(2
|
)
|
(2
|
)
|
(1
|
)
|
|||||
|
Balance at end of period
|
$
|
37
|
|
$
|
29
|
|
$
|
14
|
|
||
|
Fair value, beginning of period
|
$
|
32
|
|
$
|
18
|
|
$
|
12
|
|
||
|
Fair value, end of period
|
41
|
|
32
|
|
18
|
|
|||||
The fair value of MSRs is highly sensitive to changes in assumptions and is determined by estimating the present value of the asset’s future cash flows utilizing market-based prepayment rates, discount rates and other assumptions validated through comparison to trade information, industry surveys and with the use of independent third-party valuations. Changes in prepayment speed assumptions have the most significant impact on the fair value of MSRs. Generally, as interest rates decline, mortgage loan prepayments accelerate due to increased refinance activity, which results in a decrease in the fair value of the MSR and as interest rates increase, mortgage loan prepayments decline, which results in an increase in the fair value of the MSR. Measurement of fair value is limited to the conditions existing and the assumptions utilized as of a particular point in time, and those assumptions may not be appropriate if they are applied at a different time.
121
Following is a summary of the sensitivity of the fair value of MSRs to changes in key assumptions:
TABLE 8.4
|
December 31
|
2018
|
2017
|
|||||
|
(dollars in millions)
|
|||||||
|
Weighted average life (months)
|
82.2
|
|
80.4
|
|
|||
|
Constant prepayment rate (annualized)
|
10.1
|
%
|
9.9
|
%
|
|||
|
Discount rate
|
9.7
|
%
|
9.9
|
%
|
|||
|
Effect on fair value due to change in interest rates:
|
|||||||
|
+0.25%
|
$
|
3
|
|
$
|
2
|
|
|
|
+0.50%
|
5
|
|
3
|
|
|||
|
-0.25%
|
(3
|
)
|
(2
|
)
|
|||
|
-0.50%
|
(6
|
)
|
(4
|
)
|
|||
The sensitivity calculations above are hypothetical and should not be considered to be predictive of future performance. Changes in fair value based on adverse changes in assumptions generally cannot be extrapolated because the relationship of the changes in assumptions to fair value may not be linear. Also, in this table, the effects of an adverse variation in a particular assumption on the fair value of the MSRs is calculated without changing any other assumptions, while in reality, changes in one factor may result in changing another, which may magnify or contract the effect of the change. We had a
$0.5 million
valuation allowance for MSRs as of
December 31, 2018
.
SBA-Guaranteed Loan Servicing
We retain the servicing rights on SBA-guaranteed loans sold to investors. The standard sale structure under the SBA Secondary Participation Guaranty Agreement provides for us to retain a portion of the cash flow from the interest payment received on the loan, which is commonly known as a servicing spread. The unpaid principal balance of SBA-guaranteed loans serviced for investors, as of
December 31, 2018
and
December 31, 2017
, was as follows:
TABLE 8.5
|
December 31
|
2018
|
2017
|
|||||
|
(in millions)
|
|||||||
|
SBA loans sold to investors with servicing retained
|
$
|
283
|
|
$
|
306
|
|
|
The following table summarizes activity relating to SBA loans sold with servicing retained:
TABLE 8.6
|
Year Ended December 31
|
2018
|
2017
|
|||||
|
(in millions)
|
|||||||
|
SBA loans sold with servicing retained
|
$
|
41
|
|
$
|
54
|
|
|
|
Pretax gains resulting from above loan sales
(1)
|
4
|
|
2
|
|
|||
|
SBA servicing fees
(1)
|
3
|
|
2
|
|
|||
122
Following is a summary of the activity in SBA servicing rights:
TABLE 8.7
|
Year Ended December 31
|
2018
|
2017
|
|||||
|
(in millions)
|
|||||||
|
Balance at beginning of period
|
$
|
5
|
|
$
|
—
|
|
|
|
Fair value of servicing rights acquired
|
—
|
|
5
|
|
|||
|
Additions
|
1
|
|
1
|
|
|||
|
Payoffs, curtailments and amortization
|
(1
|
)
|
(1
|
)
|
|||
|
Impairment (charge) / recovery
|
(1
|
)
|
—
|
|
|||
|
Balance at end of period
|
$
|
4
|
|
$
|
5
|
|
|
|
Fair value, beginning of period
|
$
|
5
|
|
$
|
—
|
|
|
|
Fair value, end of period
|
4
|
|
5
|
|
|||
Following is a summary of key assumptions and the sensitivity of the SBA servicing rights to changes in these assumptions. The declines in fair values were immaterial in the scenarios presented.
TABLE 8.8
|
December 31
|
2018
|
2017
|
|||||||||||||||||||||||||||||||||||
|
Decline in fair value due to
|
Decline in fair value due to
|
||||||||||||||||||||||||||||||||||||
|
(dollars in millions)
|
Actual
|
10% adverse change
|
20% adverse change
|
1% adverse change
|
2% adverse change
|
Actual
|
10% adverse change
|
20% adverse change
|
1% adverse change
|
2% adverse change
|
|||||||||||||||||||||||||||
|
Weighted-average life (months)
|
52.2
|
|
63.5
|
|
|||||||||||||||||||||||||||||||||
|
Constant prepayment rate
|
12.5
|
%
|
$
|
—
|
|
$
|
—
|
|
$
|
—
|
|
$
|
—
|
|
9.3
|
%
|
$
|
—
|
|
$
|
—
|
|
$
|
—
|
|
$
|
—
|
|
|||||||||
|
Discount rate
|
19.4
|
|
—
|
|
—
|
|
—
|
|
—
|
|
14.9
|
|
—
|
|
—
|
|
—
|
|
—
|
|
|||||||||||||||||
The fair value of the SBA servicing rights is compared to the amortized basis. If the amortized basis exceeds the fair value, the asset is considered impaired and is written down to fair value through a valuation allowance on the asset and a charge against SBA income. We had a
$0.8 million
valuation allowance for SBA servicing rights as of
December 31, 2018
.
NOTE 9. PREMISES AND EQUIPMENT
Following is a summary of premises and equipment:
TABLE 9.1
|
December 31
|
2018
|
2017
|
|||||
|
(in millions)
|
|
|
|||||
|
Land
|
$
|
64
|
|
$
|
67
|
|
|
|
Premises
|
238
|
|
240
|
|
|||
|
Equipment
|
236
|
|
213
|
|
|||
|
538
|
|
520
|
|
||||
|
Accumulated depreciation
|
(208
|
)
|
(183
|
)
|
|||
|
Total premises and equipment, net
|
$
|
330
|
|
$
|
337
|
|
|
123
Depreciation expense for premises and equipment is presented in the following table:
TABLE 9.2
|
December 31
|
2018
|
2017
|
2016
|
||||||||
|
(in millions)
|
|||||||||||
|
Depreciation expense for premises and equipment
|
$
|
39
|
|
$
|
34
|
|
$
|
23
|
|
||
We have operating leases extending to
2046
for certain land, office locations and equipment, many of which have renewal options. Leases that expire are generally expected to be replaced by other leases. Lease costs are expensed in accordance with ASC 840,
Leases
, taking into account escalation clauses. Rental expense is presented in the following table:
TABLE 9.3
|
December 31
|
2018
|
2017
|
2016
|
||||||||
|
(in millions)
|
|||||||||||
|
Rental expense
|
$
|
33
|
|
$
|
29
|
|
$
|
21
|
|
||
Following is a summary of future minimum lease payments for years following
December 31, 2018
:
TABLE 9.4
|
(in millions)
|
|||
|
2019
|
$
|
25
|
|
|
2020
|
21
|
|
|
|
2021
|
18
|
|
|
|
2022
|
13
|
|
|
|
2023
|
10
|
|
|
|
Later years
|
49
|
|
|
|
Total minimum rental commitment under leases
|
$
|
136
|
|
NOTE 10. GOODWILL AND OTHER INTANGIBLE ASSETS
The following table shows a rollforward of goodwill by line of business:
TABLE 10.1
|
(in millions)
|
Community
Banking
|
Wealth
Manage-
ment
|
Insurance
|
Consumer
Finance
|
Total
|
||||||||||||||
|
Balance at January 1, 2017
|
$
|
1,011
|
|
$
|
8
|
|
$
|
11
|
|
$
|
2
|
|
$
|
1,032
|
|
||||
|
Goodwill (deductions) additions
|
1,217
|
|
—
|
|
—
|
|
—
|
|
1,217
|
|
|||||||||
|
Balance at December 31, 2017
|
2,228
|
|
8
|
|
11
|
|
2
|
|
2,249
|
|
|||||||||
|
Goodwill (deductions) additions
|
3
|
|
—
|
|
5
|
|
(2
|
)
|
6
|
|
|||||||||
|
Balance at December 31, 2018
|
$
|
2,231
|
|
$
|
8
|
|
$
|
16
|
|
$
|
—
|
|
$
|
2,255
|
|
||||
We recorded goodwill in the Community Banking segment during
2017
and
2018
as a result of the purchase accounting adjustments relating to the various acquisitions described in Note 3, “Mergers and Acquisitions.” The addition of goodwill for the Insurance segment in
2018
was the result of the FNIA acquisition of a Maryland-based insurance agency on December 17, 2018. The deduction of goodwill for the Consumer Finance segment in
2018
was the result of the sale of Regency to Mariner Finance, LLC on August 31, 2018, as part of our strategy to enhance the overall positioning of our consumer banking operations.
124
The following table shows a summary of core deposit intangibles and customer renewal lists:
TABLE 10.2
|
(in millions)
|
Core
Deposit
Intangibles
|
Customer
Renewal
Lists
|
Total
|
||||||||
|
December 31, 2018
|
|||||||||||
|
Gross carrying amount
|
$
|
196
|
|
$
|
15
|
|
$
|
211
|
|
||
|
Accumulated amortization
|
(122
|
)
|
(10
|
)
|
(132
|
)
|
|||||
|
Net carrying amount
|
$
|
74
|
|
$
|
5
|
|
$
|
79
|
|
||
|
December 31, 2017
|
|||||||||||
|
Gross carrying amount
|
$
|
196
|
|
$
|
12
|
|
$
|
208
|
|
||
|
Accumulated amortization
|
(107
|
)
|
(9
|
)
|
(116
|
)
|
|||||
|
Net carrying amount
|
$
|
89
|
|
$
|
3
|
|
$
|
92
|
|
||
Core deposit intangibles are being amortized primarily over
10
years using accelerated methods. Customer renewal lists are being amortized over their estimated useful lives, which range from
eight
to
thirteen
years.
The following table summarizes amortization expense recognized:
TABLE 10.3
|
December 31
|
2018
|
2017
|
2016
|
||||||||
|
(in millions)
|
|||||||||||
|
Amortization expense
|
$
|
16
|
|
$
|
18
|
|
$
|
11
|
|
||
Following is a summary of the expected amortization expense on finite-lived intangible assets, assuming no new additions, for each of the five years following
December 31, 2018
:
TABLE 10.4
|
(in millions)
|
|
||
|
2019
|
$
|
14
|
|
|
2020
|
13
|
|
|
|
2021
|
11
|
|
|
|
2022
|
10
|
|
|
|
2023
|
9
|
|
|
|
Total
|
$
|
57
|
|
Goodwill and other intangible assets are tested annually for impairment, and more frequently if events or changes in circumstances indicate the carrying value may not be recoverable. We completed this test in
2018
and
2017
and determined that our intangible assets are not impaired.
125
NOTE 11. DEPOSITS
Following is a summary of deposits:
TABLE 11.1
|
December 31
|
2018
|
2017
|
|||||
|
(in millions)
|
|||||||
|
Non-interest-bearing demand
|
$
|
6,000
|
|
$
|
5,720
|
|
|
|
Interest-bearing demand
|
9,660
|
|
9,571
|
|
|||
|
Savings
|
2,526
|
|
2,488
|
|
|||
|
Certificates and other time deposits:
|
|||||||
|
Less than $100,000
|
2,816
|
|
2,461
|
|
|||
|
$100,000 through $250,000
|
1,478
|
|
1,327
|
|
|||
|
Greater than $250,000
|
975
|
|
833
|
|
|||
|
Total certificates and other time deposits
|
5,269
|
|
4,621
|
|
|||
|
Total deposits
|
$
|
23,455
|
|
$
|
22,400
|
|
|
Following is a summary of the scheduled maturities of certificates and other time deposits for the years following
December 31, 2018
:
TABLE 11.2
|
(in millions)
|
|||
|
2019
|
$
|
3,255
|
|
|
2020
|
1,309
|
|
|
|
2021
|
222
|
|
|
|
2022
|
143
|
|
|
|
2023
|
209
|
|
|
|
Later years
|
131
|
|
|
|
Total
|
$
|
5,269
|
|
NOTE 12. SHORT-TERM BORROWINGS
Following is a summary of short-term borrowings:
TABLE 12.1
|
December 31
|
2018
|
2017
|
|||||
|
(in millions)
|
|
|
|||||
|
Securities sold under repurchase agreements
|
$
|
251
|
|
$
|
256
|
|
|
|
Federal Home Loan Bank advances
|
2,230
|
|
2,285
|
|
|||
|
Federal funds purchased
|
1,535
|
|
1,000
|
|
|||
|
Subordinated notes
|
113
|
|
138
|
|
|||
|
Total short-term borrowings
|
$
|
4,129
|
|
$
|
3,679
|
|
|
Borrowings with original maturities of one year or less are classified as short-term. Securities sold under repurchase agreements are comprised of customer repurchase agreements, which are sweep accounts with next-day maturities utilized by larger commercial customers to earn interest on their funds. Securities are pledged to these customers in an amount equal to the outstanding balance. Of the total short-term FHLB advances,
57.2%
and
75.7%
had overnight maturities as of
December 31, 2018
and
December 31, 2017
, respectively.
126
The following represents weighted average interest rates on short-term borrowings:
TABLE 12.2
|
December 31
|
2018
|
2017
|
2016
|
|||||
|
Year-to-date average
|
1.89
|
%
|
1.16
|
%
|
0.61
|
%
|
||
|
Period-end
|
2.49
|
%
|
1.44
|
%
|
0.69
|
%
|
||
NOTE 13. LONG-TERM BORROWINGS
Following is a summary of long-term borrowings:
TABLE 13.1
|
December 31
|
2018
|
2017
|
|||||
|
(in millions)
|
|||||||
|
Federal Home Loan Bank advances
|
$
|
270
|
|
$
|
310
|
|
|
|
Subordinated notes
|
87
|
|
88
|
|
|||
|
Junior subordinated debt
|
111
|
|
110
|
|
|||
|
Other subordinated debt
|
159
|
|
160
|
|
|||
|
Total long-term borrowings
|
$
|
627
|
|
$
|
668
|
|
|
Scheduled annual maturities for the long-term borrowings for the years following
December 31, 2018
are as follows:
TABLE 13.2
|
(in millions)
|
|||
|
2019
|
$
|
158
|
|
|
2020
|
116
|
|
|
|
2021
|
56
|
|
|
|
2022
|
8
|
|
|
|
2023
|
40
|
|
|
|
Later years
|
249
|
|
|
|
Total
|
$
|
627
|
|
Federal Home Loan Bank advances
Our banking affiliate has available credit with the FHLB of
$7.4 billion
, of which
$2.5 billion
was utilized as of
December 31, 2018
. These advances are secured by loans collateralized by residential mortgages, home equity lines of credit, commercial real estate and FHLB stock and are scheduled to mature in various amounts periodically through the year
2021
. Effective interest rates paid on the long-term advances ranged from
1.39%
to
4.19%
for the year ended
December 31, 2018
and
1.11%
to
4.19%
for the year ended
December 31, 2017
.
127
Subordinated notes
Subordinated notes are unsecured and subordinated to our other indebtedness. The subordinated notes mature in various amounts periodically through the year 2028. At
December 31, 2018
, all of the subordinated notes are redeemable by the holders prior to maturity at a discount equal to
three
to
12
months of interest, depending on the term of the note. We may require the holder to give
30
days prior written notice. No sinking fund is required and none has been established to retire the notes. The weighted average interest rate on the subordinated notes are presented in the following table:
TABLE 13.3
|
December 31
|
2018
|
2017
|
2016
|
|||||
|
Subordinated notes weighted average interest rate
|
3.08
|
%
|
2.85
|
%
|
2.71
|
%
|
||
Junior subordinated debt
The junior subordinated debt is comprised of the debt securities issued by FNB in relation to our
six
unconsolidated subsidiary trusts (collectively, the Trusts), which are unconsolidated variable interest entities and are included on the Consolidated Balance Sheets in long-term borrowings.
One hundred percent
of the common equity of each Trust is owned by FNB. The Trusts were formed for the purpose of issuing FNB-obligated mandatorily redeemable capital securities, or TPS to third-party investors. The proceeds from the sale of TPS and the issuance of common equity by the Trusts were invested in junior subordinated debt securities issued by FNB, which are the sole assets of each Trust. Since third-party investors are the primary beneficiaries, the Trusts are not consolidated in our Financial Statements. The Trusts pay dividends on the TPS at the same rate as the distributions paid by us on the junior subordinated debt held by the Trusts. F.N.B. Statutory Trust II was formed by us, and the other five statutory trusts were assumed through acquisitions. The acquired statutory trusts were adjusted to fair value in conjunction with the various acquisitions.
We record the distributions on the junior subordinated debt issued to the Trusts as interest expense. The TPS are subject to mandatory redemption, in whole or in part, upon repayment of the junior subordinated debt. The TPS are eligible for redemption, at any time, at our discretion. Under capital guidelines, the junior subordinated debt, net of our investments in the Trusts, is included in tier 2 capital. We have entered into agreements which, when taken collectively, fully and unconditionally guarantee the obligations under the TPS subject to the terms of each of the guarantees.
The following table provides information relating to the Trusts as of
December 31, 2018
:
TABLE 13.4
|
(dollars in millions)
|
Trust
Preferred
Securities
|
Common
Securities
|
Junior
Subordinated
Debt
|
Stated
Maturity
Date
|
Interest
Rate
|
Rate Reset Factor
|
||||||||||||
|
F.N.B. Statutory Trust II
|
$
|
22
|
|
$
|
1
|
|
$
|
22
|
|
6/15/2036
|
4.44
|
%
|
LIBOR + 165 basis points (bps)
|
|||||
|
Omega Financial Capital Trust I
|
26
|
|
1
|
|
27
|
|
10/18/2034
|
4.63
|
%
|
LIBOR + 219 bps
|
||||||||
|
Yadkin Valley Statutory Trust I
|
25
|
|
1
|
|
21
|
|
12/15/2037
|
4.11
|
%
|
LIBOR + 132 bps
|
||||||||
|
FNB Financial Services Capital Trust I
|
25
|
|
1
|
|
22
|
|
9/30/2035
|
4.26
|
%
|
LIBOR + 146 bps
|
||||||||
|
American Community Capital Trust II
|
10
|
|
—
|
|
10
|
|
12/15/2033
|
5.19
|
%
|
LIBOR + 280 bps
|
||||||||
|
Crescent Financial Capital Trust I
|
8
|
|
—
|
|
9
|
|
10/7/2033
|
5.54
|
%
|
LIBOR + 310 bps
|
||||||||
|
Total
|
$
|
116
|
|
$
|
4
|
|
$
|
111
|
|
|||||||||
Other subordinated debt
Subordinated Debt Due 2025.
In an October 2015 debt offering, we issued
$100.0 million
aggregate principal amount of
4.875%
subordinated notes due in October 2025. The net proceeds of the debt offering after deducting underwriting discounts and commissions and offering costs were
$98.4 million
, and as of
December 31, 2018
, the carrying value was
$98.9 million
. These subordinated notes are eligible for treatment as tier 2 capital for regulatory capital purposes.
128
Subordinated Debt Due 2024.
In conjunction with the YDKN acquisition, we assumed
$15.5 million
aggregate principal amount of
7.25%
subordinated notes due in March 2024. These subordinated notes, which are eligible for treatment as tier 2 capital for regulatory capital purposes, were adjusted to fair value at the time of acquisition, and as of
December 31, 2018
, the carrying value was
$16.6 million
.
Subordinated Debt Due 2023.
In conjunction with the YDKN acquisition, we assumed
$38.1 million
aggregate principal amount of
7.625%
subordinated notes due in August 2023. These subordinated notes, which are eligible for treatment as tier 2 capital for regulatory capital purposes, were adjusted to fair value at the time of acquisition, and as of
December 31, 2018
, the carrying value was
$43.4 million
.
Additionally, on May 1, 2017, we repaid
$7.5 million
in other subordinated debt that we acquired from YDKN.
NOTE 14. DERIVATIVE INSTRUMENTS AND HEDGING ACTIVITIES
We are exposed to certain risks arising from both our business operations and economic conditions. We principally manage our exposures to a wide variety of business and operational risks through management of our core business activities. We manage economic risks, including interest rate risk, primarily by managing the amount, source, and duration of our assets and liabilities, and through the use of derivative instruments. Derivative instruments are used to reduce the effects that changes in interest rates may have on net income and cash flows. We also use derivative instruments to facilitate transactions on behalf of our customers.
All derivatives are carried on the Consolidated Balance Sheets at fair value and do not take into account the effects of master netting arrangements we have with other financial institutions. Credit risk is included in the determination of the estimated fair value of derivatives. Derivative assets are reported in the Consolidated Balance Sheets in other assets and derivative liabilities are reported in the Consolidated Balance Sheets in other liabilities. Changes in fair value are recognized in earnings except for certain changes related to derivative instruments designated as part of a cash flow hedging relationship.
The following table presents notional amounts and gross fair values of our derivative assets and derivative liabilities which are not offset in the Consolidated Balance Sheets.
TABLE 14.1
|
December 31
|
2018
|
2017
|
|||||||||||||||||||||
|
Notional
Amount
|
Fair Value
|
Notional
Amount
|
Fair Value
|
||||||||||||||||||||
|
(in millions)
|
Asset
|
Liability
|
Asset
|
Liability
|
|||||||||||||||||||
|
Gross Derivatives
|
|||||||||||||||||||||||
|
Subject to master netting arrangements:
|
|||||||||||||||||||||||
|
Interest rate contracts – designated
|
$
|
1,155
|
|
$
|
—
|
|
$
|
3
|
|
$
|
705
|
|
$
|
—
|
|
$
|
2
|
|
|||||
|
Interest rate swaps – not designated
|
2,740
|
|
2
|
|
10
|
|
2,246
|
|
1
|
|
12
|
|
|||||||||||
|
Equity contracts – not designated
|
1
|
|
—
|
|
—
|
|
1
|
|
—
|
|
—
|
|
|||||||||||
|
Total subject to master netting arrangements
|
3,896
|
|
2
|
|
13
|
|
2,952
|
|
1
|
|
14
|
|
|||||||||||
|
Not subject to master netting arrangements:
|
|||||||||||||||||||||||
|
Interest rate swaps – not designated
|
2,740
|
|
40
|
|
26
|
|
2,245
|
|
28
|
|
15
|
|
|||||||||||
|
Interest rate lock commitments – not designated
|
47
|
|
1
|
|
—
|
|
88
|
|
2
|
|
—
|
|
|||||||||||
|
Forward delivery commitments – not designated
|
55
|
|
—
|
|
—
|
|
107
|
|
—
|
|
—
|
|
|||||||||||
|
Credit risk contracts – not designated
|
203
|
|
—
|
|
—
|
|
235
|
|
—
|
|
—
|
|
|||||||||||
|
Equity contracts – not designated
|
1
|
|
—
|
|
—
|
|
1
|
|
—
|
|
—
|
|
|||||||||||
|
Total not subject to master netting arrangements
|
3,046
|
|
41
|
|
26
|
|
2,676
|
|
30
|
|
15
|
|
|||||||||||
|
Total
|
$
|
6,942
|
|
$
|
43
|
|
$
|
39
|
|
$
|
5,628
|
|
$
|
31
|
|
$
|
29
|
|
|||||
129
Certain derivative exchanges have enacted a rule change which in effect results in the legal characterization of variation margin payments for certain derivative contracts as settlement of the derivatives mark-to-market exposure and not collateral. Accordingly, we have changed our reporting of certain derivatives to record variation margin on trades cleared through exchanges that have adopted the rule change as settled where we had previously recorded cash collateral. The daily settlement of the derivative exposure does not change or reset the contractual terms of the instrument.
Derivatives Designated as Hedging Instruments under GAAP
Interest Rate Contracts.
We entered into interest rate derivative agreements to modify the interest rate characteristics of certain commercial loans and certain of our FHLB advances from variable rate to fixed rate in order to reduce the impact of changes in future cash flows due to market interest rate changes. These agreements are designated as cash flow hedges (i.e., hedging the exposure to variability in expected future cash flows). The effective portion of the derivative’s gain or loss is initially reported as a component of other comprehensive income and subsequently reclassified into earnings in the same line item associated with the forecasted transaction when the forecasted transaction affects earnings. Any ineffective portion of the gain or loss is reported in earnings immediately.
Following is a summary of key data related to interest rate contracts:
TABLE 14.2
|
December 31
|
2018
|
2017
|
|||||
|
(in millions)
|
|||||||
|
Notional amount
|
$
|
1,155
|
|
$
|
705
|
|
|
|
Fair value included in other assets
|
—
|
|
—
|
|
|||
|
Fair value included in other liabilities
|
3
|
|
2
|
|
|||
The following table shows amounts reclassified from accumulated other comprehensive income:
TABLE 14.3
|
December 31
|
2018
|
2017
|
|||||||||||||
|
(in millions)
|
Total
|
Net of
Tax
|
Total
|
Net of
Tax
|
|||||||||||
|
Reclassified from AOCI to interest income
|
$
|
—
|
|
$
|
—
|
|
$
|
1
|
|
$
|
1
|
|
|||
|
Reclassified from AOCI to interest expense
|
(3
|
)
|
(2
|
)
|
1
|
|
1
|
|
|||||||
As of
December 31, 2018
, the maximum length of time over which forecasted interest cash flows are hedged is
six
years. In the
twelve
months that follow
December 31, 2018
, we expect to reclassify from the amount currently reported in AOCI net derivative gains of
$3.4 million
(
$2.7 million
net of tax), in association with interest on the hedged loans and FHLB advances. This amount could differ from amounts actually recognized due to changes in interest rates, hedge de-designations, and the addition of other hedges subsequent to
December 31, 2018
.
There were
no
components of derivative gains or losses excluded from the assessment of hedge effectiveness related to these cash flow hedges. For the years ended
December 31, 2018
and
2017
, there was
no
hedge ineffectiveness. Also, during the years ended
December 31, 2018
and
2017
, there were
no
gains or losses from cash flow hedge derivatives reclassified to earnings because it became probable that the original forecasted transactions would not occur.
Derivatives Not Designated as Hedging Instruments under GAAP
Interest Rate Swaps.
We enter into interest rate swap agreements to meet the financing, interest rate and equity risk management needs of qualifying commercial loan customers. These agreements provide the customer the ability to convert from variable to fixed interest rates. The credit risk associated with derivatives executed with customers is essentially the same as that involved in extending loans and is subject to normal credit policies and monitoring. Swap derivative transactions with customers are not subject to enforceable master netting arrangements and are generally secured by rights to non-financial collateral, such as real and personal property.
130
We enter into positions with a derivative counterparty in order to offset our exposure on the fixed components of the customer interest rate swap agreements. We seek to minimize counterparty credit risk by entering into transactions only with high-quality financial dealer institutions.
Following is a summary of key data related to interest rate swaps:
TABLE 14.4
|
December 31
|
2018
|
2017
|
|||||
|
(in millions)
|
|||||||
|
Notional amount
|
$
|
5,480
|
|
$
|
4,491
|
|
|
|
Fair value included in other assets
|
42
|
|
29
|
|
|||
|
Fair value included in other liabilities
|
36
|
|
27
|
|
|||
The interest rate swap agreement with the loan customer and with the counterparty is reported at fair value in other assets and other liabilities on the Consolidated Balance Sheets with any resulting gain or loss recorded in current period earnings as other income or other expense.
Interest Rate Lock Commitments
.
Interest rate lock commitments represent an agreement to extend credit to a mortgage loan borrower, or an agreement to purchase a loan from a third-party originator, whereby the interest rate on the loan is set prior to funding. We are bound to fund the loan at a specified rate, regardless of whether interest rates have changed between the commitment date and the loan funding date, subject to the loan approval process. The borrower is not obligated to perform under the commitment. As such, outstanding IRLCs subject us to interest rate risk and related price risk during the period from the commitment to the borrower through the loan funding date, or commitment expiration. The IRLCs generally range between
30
to
270
days. The IRLCs are reported at fair value in other assets and other liabilities on the Consolidated Balance Sheets with any resulting gain or loss recorded in current period earnings as mortgage banking operations income.
Forward Delivery Commitments
.
Forward delivery commitments on mortgage-backed securities are used to manage the interest rate and price risk of our IRLCs and mortgage loan held for sale inventory by fixing the forward sale price that will be realized upon sale of the mortgage loans into the secondary market. Historical commitment-to-closing ratios are considered to estimate the quantity of mortgage loans that will fund within the terms of the IRLCs. The forward delivery contracts are reported at fair value in other assets and other liabilities on the Consolidated Balance Sheets with any resulting gain or loss recorded in current period earnings as mortgage banking operations income.
Credit Risk Contracts.
We purchase and sell credit protection under risk participation agreements to share with other counterparties some of the credit exposure related to interest rate derivative contracts or to take on credit exposure to generate revenue. We will make/receive payments under these agreements if a customer defaults on their obligation to perform under certain derivative swap contracts.
Risk participation agreements sold with notional amounts totaling
$140.6 million
as of
December 31, 2018
have remaining terms ranging from
nine
months to
ten
years. Under these agreements, our maximum exposure assuming a customer defaults on their obligation to perform under certain derivative swap contracts with third parties would be
$0.1 million
at both
December 31, 2018
and
2017
. The fair values of risk participation agreements purchased and sold were
$0.05 million
and
$(0.11) million
, respectively, at
December 31, 2018
and
$0.04 million
and
$(0.1) million
, respectively at
December 31, 2017
.
Counterparty Credit Risk
We are party to master netting arrangements with most of our swap derivative dealer counterparties. Collateral, usually marketable securities and/or cash, is exchanged between FNB and our counterparties, and is generally subject to thresholds and transfer minimums. For swap transactions that require central clearing, we post cash to our clearing agency. Collateral positions are settled or valued daily, and adjustments to amounts received and pledged by us are made as appropriate to maintain proper collateralization for these transactions.
Certain master netting agreements contain provisions that, if violated, could cause the counterparties to request immediate settlement or demand full collateralization under the derivative instrument. If we had breached our agreements with our derivative counterparties we would be required to settle our obligations under the agreements at the termination value and
131
would be required to pay an additional
$0.7 million
and
$0.9 million
as of
December 31, 2018
and
2017
, respectively, in excess of amounts previously posted as collateral with the respective counterparty.
The following table presents a reconciliation of the net amounts of derivative assets and derivative liabilities presented in the Consolidated Balance Sheets to the net amounts that would result in the event of offset:
TABLE 14.5
|
Amount Not Offset in the
Consolidated Balance Sheets |
|||||||||||||||
|
(in millions)
|
Net Amount
Presented in the Consolidated Balance Sheets |
Financial
Instruments |
Cash
Collateral |
Net
Amount |
|||||||||||
|
December 31, 2018
|
|||||||||||||||
|
Derivative Assets
|
|||||||||||||||
|
Interest rate contracts:
|
|||||||||||||||
|
Not designated
|
$
|
2
|
|
$
|
2
|
|
$
|
—
|
|
$
|
—
|
|
|||
|
Total
|
$
|
2
|
|
$
|
2
|
|
$
|
—
|
|
$
|
—
|
|
|||
|
Derivative Liabilities
|
|||||||||||||||
|
Interest rate contracts:
|
|||||||||||||||
|
Designated
|
$
|
3
|
|
$
|
3
|
|
$
|
—
|
|
$
|
—
|
|
|||
|
Not designated
|
10
|
|
9
|
|
—
|
|
1
|
|
|||||||
|
Total
|
$
|
13
|
|
$
|
12
|
|
$
|
—
|
|
$
|
1
|
|
|||
|
December 31, 2017
|
|||||||||||||||
|
Derivative Assets
|
|||||||||||||||
|
Interest rate contracts:
|
|||||||||||||||
|
Not designated
|
$
|
1
|
|
$
|
1
|
|
$
|
—
|
|
$
|
—
|
|
|||
|
Total
|
$
|
1
|
|
$
|
1
|
|
$
|
—
|
|
$
|
—
|
|
|||
|
Derivative Liabilities
|
|||||||||||||||
|
Interest rate contracts:
|
|||||||||||||||
|
Designated
|
$
|
2
|
|
$
|
2
|
|
$
|
—
|
|
$
|
—
|
|
|||
|
Not designated
|
12
|
|
11
|
|
—
|
|
1
|
|
|||||||
|
Total
|
$
|
14
|
|
$
|
13
|
|
$
|
—
|
|
$
|
1
|
|
|||
The following table presents the effect of certain derivative financial instruments on the Consolidated Statements of Income:
TABLE 14.6
|
Year Ended
December 31,
|
|||||||||
|
(in millions)
|
Consolidated Statements of Income Location
|
2018
|
2017
|
||||||
|
Interest Rate Contracts
|
Interest income – loans and leases
|
$
|
—
|
|
$
|
1
|
|
||
|
Interest Rate Contracts
|
Interest expense – short-term borrowings
|
(2
|
)
|
1
|
|
||||
|
Interest Rate Swaps
|
Other income
|
1
|
|
(1
|
)
|
||||
|
Credit Risk Contracts
|
Other income
|
—
|
|
—
|
|
||||
132
NOTE 15. COMMITMENTS, CREDIT RISK AND CONTINGENCIES
We have commitments to extend credit and standby letters of credit that involve certain elements of credit risk in excess of the amount stated in the Consolidated Balance Sheets. Our exposure to credit loss in the event of non-performance by the customer is represented by the contractual amount of those instruments. The credit risk associated with commitments to extend credit and standby letters of credit is essentially the same as that involved in extending loans and leases to customers and is subject to normal credit policies. Since many of these commitments expire without being drawn upon, the total commitment amounts do not necessarily represent future cash flow requirements.
Following is a summary of off-balance sheet credit risk information:
TABLE 15.1
|
December 31
|
2018
|
2017
|
|||||
|
(in millions)
|
|||||||
|
Commitments to extend credit
|
$
|
7,378
|
|
$
|
6,958
|
|
|
|
Standby letters of credit
|
126
|
|
133
|
|
|||
At
December 31, 2018
, funding of
77.6%
of the commitments to extend credit was dependent on the financial condition of the customer. We have the ability to withdraw such commitments at our discretion. Commitments generally have fixed expiration dates or other termination clauses and may require payment of a fee. Based on management’s credit evaluation of the customer, collateral may be deemed necessary. Collateral requirements vary and may include accounts receivable, inventory, property, plant and equipment and income-producing commercial properties.
Standby letters of credit are conditional commitments issued by us that may require payment at a future date. The credit risk involved in issuing letters of credit is actively monitored through review of the historical performance of our portfolios.
In addition to the above commitments, subordinated notes issued by FNB Financial Services, LP, a wholly-owned finance subsidiary, are fully and unconditionally guaranteed by FNB. These subordinated notes are included in the summaries of short-term borrowings and long-term borrowings in Notes 12 and 13.
Other Legal Proceedings
In the ordinary course of business, we are routinely named as defendants in, or made parties to, pending and potential legal actions. Also, as regulated entities, we are subject to governmental and regulatory examinations, information-gathering requests, and may be subject to investigations and proceedings (both formal and informal). Such threatened claims, litigation, investigations, regulatory and administrative proceedings typically entail matters that are considered incidental to the normal conduct of business. Claims for significant monetary damages may be asserted in many of these types of legal actions, while claims for disgorgement, restitution, penalties and/or other remedial actions or sanctions may be sought in regulatory matters. In these instances, if we determine that we have meritorious defenses, we will engage in an aggressive defense. However, if management determines, in consultation with counsel, that settlement of a matter is in the best interest of our Company and our shareholders, we may do so. It is inherently difficult to predict the eventual outcomes of such matters given their complexity and the particular facts and circumstances at issue in each of these matters. However, on the basis of current knowledge and understanding, and advice of counsel, we do not believe that judgments, sanctions, settlements or orders, if any, that may arise from these matters (either individually or in the aggregate, after giving effect to applicable reserves and insurance coverage) will have a material adverse effect on our financial position or liquidity, although they could have a material effect on net income in a given period.
In view of the inherent unpredictability of outcomes in litigation and governmental and regulatory matters, particularly where (i) the damages sought are indeterminate, (ii) the proceedings are in the early stages, or (iii) the matters involve novel legal theories or a large number of parties, as a matter of course, there is considerable uncertainty surrounding the timing or ultimate resolution of litigation and governmental and regulatory matters, including a possible eventual loss, fine, penalty, business or adverse reputational impact, if any, associated with each such matter. In accordance with applicable accounting guidance, we establish accruals for litigation and governmental and regulatory matters when those matters proceed to a stage where they present loss contingencies that are both probable and reasonably estimable. In such cases, there may be a possible exposure to loss in excess of any amounts accrued. We will continue to monitor such matters for developments that could affect the amount of the accrual, and will adjust the accrual amount as appropriate. If the loss contingency in question is not both probable and
133
reasonably estimable, we do not establish an accrual and the matter will continue to be monitored for any developments that would make the loss contingency both probable and reasonably estimable. We believe that our accruals for legal proceedings are appropriate and, in the aggregate, are not material to our consolidated financial position, although future accruals could have a material effect on net income in a given period.
NOTE 16. STOCK INCENTIVE PLANS
Restricted Stock
We issue restricted stock awards to key employees under our Incentive Compensation Plan (Plan). We issue time-based awards and performance-based awards under this Plan, both of which are based on a
three
-year vesting period. The grant date fair value of the time-based awards is equal to the price of our common stock on the grant date. The fair value of the performance-based awards is based on a Monte-Carlo simulation valuation of our common stock as of the grant date. The assumptions used for this valuation include stock price volatility, risk-free interest rate and dividend yield. We issued
283,037
and
251,379
performance-based restricted stock units in
2018
and
2017
, respectively. As of
December 31, 2018
, we had available up to
2,332,770
shares of common stock to issue under this Plan.
The following table details our issuance of restricted stock units and the aggregate weighted average grant date fair values under these plans for the years indicated.
TABLE 16.1
|
(dollars in millions)
|
2018
|
2017
|
2016
|
||||||||
|
Restricted stock units
|
962,799
|
|
713,998
|
|
574,125
|
|
|||||
|
Weighted average grant date fair values
|
$
|
13
|
|
$
|
10
|
|
$
|
7
|
|
||
The unvested restricted stock unit awards are eligible to receive cash dividends or dividend equivalents which are ultimately used to purchase additional shares of stock and are subject to forfeiture if the requisite service period is not completed or the specified performance criteria are not met. These awards are subject to certain accelerated vesting provisions upon retirement, death, disability or in the event of a change of control as defined in the award agreements.
The following table summarizes the activity relating to restricted stock units during the periods indicated:
TABLE 16.2
|
2018
|
2017
|
2016
|
||||||||||||||||||
|
Units
|
Weighted
Average
Grant
Price per
Share
|
Units
|
Weighted
Average
Grant
Price per
Share
|
Units
|
Weighted
Average
Grant
Price per
Share
|
|||||||||||||||
|
Unvested units outstanding at beginning of year
|
1,975,862
|
|
$
|
13.64
|
|
1,836,363
|
|
$
|
12.97
|
|
1,548,444
|
|
$
|
12.85
|
|
|||||
|
Granted
|
962,799
|
|
13.21
|
|
713,998
|
|
14.67
|
|
574,125
|
|
12.86
|
|
||||||||
|
Net adjustment due to performance
|
—
|
|
—
|
|
(64,861
|
)
|
13.85
|
|
72,070
|
|
11.79
|
|
||||||||
|
Vested
|
(258,031
|
)
|
13.19
|
|
(542,580
|
)
|
12.71
|
|
(384,704
|
)
|
12.11
|
|
||||||||
|
Forfeited/expired
|
(214,743
|
)
|
13.39
|
|
(31,018
|
)
|
14.03
|
|
(31,394
|
)
|
13.02
|
|
||||||||
|
Dividend reinvestment
|
90,287
|
|
12.61
|
|
63,960
|
|
13.80
|
|
57,822
|
|
13.08
|
|
||||||||
|
Unvested units outstanding at end of year
|
2,556,174
|
|
13.51
|
|
1,975,862
|
|
13.64
|
|
1,836,363
|
|
12.97
|
|
||||||||
134
The following table provides certain information related to restricted stock units:
TABLE 16.3
|
Year Ended December 31
|
2018
|
2017
|
2016
|
||||||||
|
(in millions)
|
|||||||||||
|
Stock-based compensation expense
|
$
|
10
|
|
$
|
8
|
|
$
|
7
|
|
||
|
Tax benefit related to stock-based compensation expense
|
2
|
|
3
|
|
2
|
|
|||||
|
Fair value of units vested
|
3
|
|
8
|
|
5
|
|
|||||
As of
December 31, 2018
, there was
$13.6 million
of unrecognized compensation cost related to unvested restricted stock units including
$0.8 million
that is subject to accelerated vesting under the Plan’s immediate vesting upon retirement. The components of the restricted stock units as of
December 31, 2018
are as follows:
TABLE 16.4
|
(dollars in millions)
|
Service-
Based
Units
|
Performance-
Based
Units
|
Total
|
||||||||
|
Unvested restricted stock units
|
1,470,720
|
|
1,085,454
|
|
2,556,174
|
|
|||||
|
Unrecognized compensation expense
|
$
|
9
|
|
$
|
5
|
|
$
|
14
|
|
||
|
Intrinsic value
|
$
|
14
|
|
$
|
11
|
|
$
|
25
|
|
||
|
Weighted average remaining life (in years)
|
1.90
|
|
1.83
|
|
1.87
|
|
|||||
Stock Options
All outstanding stock options were assumed from acquisitions and are fully vested. Upon consummation of our acquisitions, all outstanding stock options issued by the acquired companies were converted into equivalent FNB stock options. We issue shares of treasury stock or authorized but unissued shares to satisfy stock options exercised.
The following table summarizes the activity relating to stock options during the periods indicated:
TABLE 16.5
|
2018
|
Weighted
Average Exercise
Price per
Share
|
2017
|
Weighted
Average Exercise
Price per
Share
|
2016
|
Weighted
Average Exercise
Price per
Share
|
|||||||||||||||
|
Options outstanding at beginning of year
|
722,650
|
|
$
|
7.96
|
|
892,532
|
|
$
|
8.95
|
|
435,340
|
|
$
|
8.86
|
|
|||||
|
Assumed from acquisitions
|
—
|
|
—
|
|
207,645
|
|
8.92
|
|
1,707,036
|
|
7.83
|
|
||||||||
|
Exercised
|
(253,899
|
)
|
7.77
|
|
(255,503
|
)
|
10.21
|
|
(1,128,075
|
)
|
7.18
|
|
||||||||
|
Forfeited/expired
|
(10,397
|
)
|
11.98
|
|
(122,024
|
)
|
12.12
|
|
(121,769
|
)
|
9.33
|
|
||||||||
|
Options outstanding and exercisable at end of year
|
458,354
|
|
7.99
|
|
722,650
|
|
7.96
|
|
892,532
|
|
8.95
|
|
||||||||
135
The following table summarizes information about stock options outstanding at
December 31, 2018
:
TABLE 16.6
|
Range of Exercise Prices
|
Options
Outstanding
and Exercisable
|
Weighted Average
Remaining
Contractual Years
|
Weighted Average
Exercise Price
|
||||||
|
$3.45 - $5.18
|
81,219
|
|
2.14
|
$
|
4.80
|
|
|||
|
$5.19 - $7.78
|
66,055
|
|
3.22
|
6.85
|
|
||||
|
$7.79 - $11.37
|
311,080
|
|
3.41
|
9.07
|
|
||||
|
458,354
|
|
||||||||
The intrinsic value of outstanding and exercisable stock options at
December 31, 2018
was
$0.9 million
.
The aggregate intrinsic value represents the amount by which the fair value of underlying stock exceeds the option exercise price.
The following table summarizes certain information relating to stock options exercised:
TABLE 16.7
|
Year Ended December 31
|
2018
|
2017
|
2016
|
||||||||
|
(in millions)
|
|||||||||||
|
Proceeds from stock options exercised
|
$
|
2
|
|
$
|
2
|
|
$
|
8
|
|
||
|
Tax benefit recognized from stock options exercised
|
—
|
|
—
|
|
2
|
|
|||||
|
Intrinsic value of stock options exercised
|
1
|
|
1
|
|
7
|
|
|||||
Warrants
In conjunction with our participation in the UST’s CPP, we issued to the UST a warrant to purchase up to
1,302,083
shares of our common stock. Pursuant to Section 13(H) of the Warrant to Purchase Common Stock, the number of shares of common stock issuable upon exercise of the warrant was reduced in half to
651,042
shares on June 16, 2009, the date we completed a public offering. The warrant, which expired in January 2019 without being exercised, was sold at auction by the UST and had an exercise price of
$11.52
per share.
In conjunction with the ANNB acquisition on April 6, 2013, the warrant issued by ANNB to the UST under the CPP has been converted into a warrant to purchase up to
342,564
shares of our common stock at an exercise price of
$3.57
per share. Subsequent adjustments related to actual dividends paid by us have increased the share amount of these warrants to
405,489
, with a resulting lower exercise price of
$3.02
per share as of March 31, 2018, prior to being exercised in May 2018.
In conjunction with the YDKN acquisition on March 11, 2017, the warrant issued by YDKN to the UST under the CPP has been converted into a warrant to purchase up to
207,320
shares of our common stock at an exercise price of
$9.63
per share. Subsequent adjustments related to actual dividends paid by us have increased the share amount of these warrants to
213,986
, with a resulting lower exercise price of
$9.33
per share as of
December 31, 2018
. The warrant, which was recorded at its fair value on March 11, 2017, was sold at auction by the UST and expires in 2019.
NOTE 17. RETIREMENT PLANS
We sponsor the Retirement Income Plan (RIP), a qualified noncontributory defined benefit pension plan that has been frozen. The RIP covered employees who satisfied minimum age and length of service requirements. Although not required, during
2018
, we made a
$4.0 million
contribution to the RIP.
We also sponsor
two
supplemental non-qualified retirement plans that have been frozen. The ERISA Excess Retirement Plan provides retirement benefits equal to the difference, if any, between the maximum benefit allowable under the Internal Revenue Code and the amount that would be provided under the RIP, if no limits were applied. The Basic Retirement Plan (BRP) is applicable to certain officers whom the Board of Directors designates. Officers participating in the BRP receive a benefit based
136
on a target benefit percentage based on years of service at retirement and a designated tier as determined by the Board of Directors. When a participant retires, the benefit under the BRP is a monthly benefit equal to the participant's aggregate target benefit percentage multiplied by the participant’s highest average monthly cash compensation, including bonuses, during
five
consecutive calendar years within the last
ten
calendar years of employment before 2009. This monthly benefit is reduced by the monthly benefit the participant receives from the Social Security Administration, the RIP, the ERISA Excess Retirement Plan and the annuity equivalent of the automatic contributions paid to participants under the qualified 401(k) defined contribution plan and the ERISA Excess Lost Match Plan.
The following tables provide information relating to the accumulated benefit obligation, change in benefit obligation, change in plan assets, the plans’ funded status and the amount included in the Consolidated Balance Sheets for the qualified and non-qualified plans described above (collectively, the Plans):
TABLE 17.1
|
December 31
|
2018
|
2017
|
|||||||||||||||||||||
|
Qualified
|
Non-Qualified
|
Total
|
Qualified
|
Non-Qualified
|
Total
|
||||||||||||||||||
|
(in millions)
|
|||||||||||||||||||||||
|
Accumulated benefit obligation
|
$
|
145
|
|
$
|
18
|
|
$
|
163
|
|
$
|
161
|
|
$
|
20
|
|
$
|
181
|
|
|||||
|
Projected benefit obligation at beginning of year
|
$
|
162
|
|
$
|
20
|
|
$
|
182
|
|
$
|
133
|
|
$
|
20
|
|
$
|
153
|
|
|||||
|
Acquisition
|
—
|
|
—
|
|
—
|
|
30
|
|
—
|
|
30
|
|
|||||||||||
|
Interest cost
|
6
|
|
—
|
|
6
|
|
6
|
|
1
|
|
7
|
|
|||||||||||
|
Actuarial loss
|
(12
|
)
|
(1
|
)
|
(13
|
)
|
9
|
|
—
|
|
9
|
|
|||||||||||
|
Benefits paid
|
(11
|
)
|
(1
|
)
|
(12
|
)
|
(9
|
)
|
(1
|
)
|
(10
|
)
|
|||||||||||
|
Settlement
|
—
|
|
—
|
|
—
|
|
(7
|
)
|
—
|
|
(7
|
)
|
|||||||||||
|
Projected benefit obligation at end of year
|
$
|
145
|
|
$
|
18
|
|
$
|
163
|
|
$
|
162
|
|
$
|
20
|
|
$
|
182
|
|
|||||
|
Fair value of plan assets at beginning of year
|
$
|
164
|
|
$
|
—
|
|
$
|
164
|
|
$
|
137
|
|
$
|
—
|
|
$
|
137
|
|
|||||
|
Acquisition
|
—
|
|
—
|
|
—
|
|
25
|
|
—
|
|
25
|
|
|||||||||||
|
Actual return on plan assets
|
(7
|
)
|
—
|
|
(7
|
)
|
18
|
|
—
|
|
18
|
|
|||||||||||
|
Corporation contribution
|
4
|
|
1
|
|
5
|
|
—
|
|
1
|
|
1
|
|
|||||||||||
|
Benefits paid
|
(11
|
)
|
(1
|
)
|
(12
|
)
|
(9
|
)
|
(1
|
)
|
(10
|
)
|
|||||||||||
|
Settlement
|
—
|
|
—
|
|
—
|
|
(7
|
)
|
—
|
|
(7
|
)
|
|||||||||||
|
Fair value of plan assets at end of year
|
$
|
150
|
|
$
|
—
|
|
$
|
150
|
|
$
|
164
|
|
$
|
—
|
|
$
|
164
|
|
|||||
|
Funded status of plans
|
$
|
5
|
|
$
|
(18
|
)
|
$
|
(13
|
)
|
$
|
2
|
|
$
|
(20
|
)
|
$
|
(18
|
)
|
|||||
The unrecognized actuarial loss, prior service cost and net transition obligation are required to be recognized into earnings over the average remaining participant life due to the freezing of the RIP, which may, on a net basis reduce future earnings.
Actuarial assumptions used in the determination of the projected benefit obligation in the Plans are as follows:
TABLE 17.2
|
Assumptions at December 31
|
2018
|
2017
|
|||
|
Weighted average discount rate
|
4.18
|
%
|
3.53
|
%
|
|
|
Rates of average increase in compensation levels
|
3.50
|
|
3.50
|
|
|
The discount rate assumption at
December 31, 2018
and
2017
was determined using a yield-curve based approach.
A yield curve was produced for a universe containing the majority of U.S.-issued Aa-graded corporate bonds, all of which were non-callable (or callable with make-whole provisions), and after excluding the 10% of the bonds with the highest and lowest yields.
The discount rate was developed as the level equivalent rate that would produce the same present value as that using spot rates aligned with the projected benefit payments.
137
The net periodic pension cost and other comprehensive income for the Plans included the following components:
TABLE 17.3
|
Year Ended December 31
|
2018
|
2017
|
2016
|
||||||||
|
(in millions)
|
|||||||||||
|
Interest cost
|
$
|
6
|
|
$
|
7
|
|
$
|
6
|
|
||
|
Expected return on plan assets
|
(11
|
)
|
(11
|
)
|
(9
|
)
|
|||||
|
Actuarial loss amortization
|
2
|
|
2
|
|
2
|
|
|||||
|
Total pension income
|
(3
|
)
|
(2
|
)
|
(1
|
)
|
|||||
|
Other changes in plan assets and benefit obligations recognized in other comprehensive income:
|
|||||||||||
|
Current year actuarial loss
|
6
|
|
3
|
|
2
|
|
|||||
|
Amortization of actuarial loss
|
(2
|
)
|
(2
|
)
|
(2
|
)
|
|||||
|
Total amount recognized in other comprehensive income
|
4
|
|
1
|
|
—
|
|
|||||
|
Total amount recognized in net periodic benefit cost and other comprehensive income
|
$
|
1
|
|
$
|
(1
|
)
|
$
|
(1
|
)
|
||
The plans have an actuarial measurement date of December 31. Actuarial assumptions used in the determination of the net periodic pension cost in the Plans are as follows:
TABLE 17.4
|
Assumptions for the Year Ended December 31
|
2018
|
2017
|
2016
|
|||||
|
Weighted average discount rate
|
4.19
|
%
|
3.96
|
%
|
4.19
|
%
|
||
|
Rates of increase in compensation levels
|
3.50
|
|
3.50
|
|
3.50
|
|
||
|
Expected long-term rate of return on assets
|
7.25
|
|
7.25
|
|
7.25
|
|
||
The expected long-term rate of return on plan assets has been established by considering historical and anticipated expected returns on the asset classes invested in by the pension trust and the allocation strategy currently in place among those classes.
The change in plan assets reflects benefits paid from the qualified pension plans of
$10.1 million
and
$8.4 million
for
2018
and
2017
, respectively. As stated above, we made a
$4.0 million
contribution to the RIP during
2018
. We did not make any contributions to the qualified pension plans during
2017
. For the non-qualified pension plans, the change in plan assets reflects benefits paid from and contributions made to the plans in the same amount. This amount represents the actual benefit payments paid from general assets of
$1.4 million
for
2018
and
$1.3 million
for
2017
.
The impact of changes in the discount rate and expected long-term rate of return on plan assets would have had the following effects on
2018
pension expense:
TABLE 17.5
|
(in millions)
|
Estimated
Effect on
Pension
Expense
|
||
|
0.5% decrease in the discount rate
|
$
|
—
|
|
|
0.5% decrease in the expected long-term rate of return on plan assets
|
1
|
|
|
138
The following table provides information regarding estimated future cash flows relating to the Plans at
December 31, 2018
:
TABLE 17.6
|
(in millions)
|
|||||
|
Expected employer contributions:
|
2019
|
$
|
1
|
|
|
|
Expected benefit payments:
|
2019
|
10
|
|
||
|
2020
|
10
|
|
|||
|
2021
|
10
|
|
|||
|
2022
|
10
|
|
|||
|
2023
|
11
|
|
|||
|
2024 – 2028
|
53
|
|
|||
The qualified pension plan contributions are deposited into a trust and the qualified benefit payments are made from trust assets. For the non-qualified plans, the contributions and the benefit payments are the same and reflect expected benefit amounts, which we pay from general assets.
Our subsidiaries participate in a qualified 401(k) defined contribution plan under which employees may contribute a percentage of their salary. Employees are eligible to participate upon their first day of employment. Under this plan, we match
100%
of the first
6%
that the employee defers. During the second quarter of 2018, we made a one-time discretionary contribution of
$0.9 million
to the vast majority of our employees following the tax reform that was enacted in December 2017. Additionally, we may provide a performance-based company contribution of up to
3%
if we exceed annual financial goals. Our contribution expense is presented in the following table:
TABLE 17.7
|
Year Ended December 31
|
2018
|
2017
|
2016
|
||||||||
|
(in millions)
|
|||||||||||
|
401(k) contribution expense
|
$
|
15
|
|
$
|
12
|
|
$
|
9
|
|
||
We also sponsor an ERISA Excess Lost Match Plan for certain officers. This plan provides retirement benefits equal to the difference, if any, between the maximum benefit allowable under the Internal Revenue Code and the amount that would have been provided under the qualified 401(k) defined contribution plan, if no limits were applied.
Pension Plan Investment Policy and Strategy
Our investment strategy for the RIP is to diversify plan assets between a wide mix of securities within the equity and debt markets to allow the account the opportunity to meet the expected long-term rate of return requirements while minimizing short-term volatility. In this regard, the plan has targeted allocations within the
equity securities
category for domestic large cap, domestic mid cap, domestic small cap, real estate investment trusts, emerging market and international securities. Within the debt securities category, the plan has targeted allocation levels for U.S. Treasury, U.S. agency, domestic investment-grade bonds, high-yield bonds, inflation-protected securities and international bonds.
139
The following table presents asset allocations for our pension plans as of
December 31, 2018
and
2017
, and the target allocation for
2019
, by asset category:
TABLE 17.8
|
Target
Allocation
|
Percentage of Plan Assets
|
||||||
|
December 31
|
2019
|
2018
|
2017
|
||||
|
Asset Category
|
|||||||
|
Equity securities
|
45 - 65
|
55
|
%
|
64
|
%
|
||
|
Debt securities
|
30 - 50
|
41
|
|
33
|
|
||
|
Cash equivalents
|
0 - 10
|
4
|
|
3
|
|
||
At
December 31, 2018
and
2017
, equity securities included
585,000
and
575,128
shares, respectively, of our common stock, representing
4.0%
and
4.9%
of total plan assets at
December 31, 2018
and
2017
, respectively. Dividends received on our common stock held by the Plan were
$0.3 million
for both
2018
and
2017
.
The fair values of our pension plan assets by asset category are as follows:
TABLE 17.9
|
(in millions)
|
Level 1
|
Level 2
|
Level 3
|
Total
|
|||||||||||
|
December 31, 2018
|
|||||||||||||||
|
Asset Class
|
|||||||||||||||
|
Cash
|
$
|
6
|
|
$
|
—
|
|
$
|
—
|
|
$
|
6
|
|
|||
|
Equity securities:
|
|||||||||||||||
|
F.N.B. Corporation
|
6
|
|
—
|
|
—
|
|
6
|
|
|||||||
|
Other large-cap U.S. financial services companies
|
3
|
|
—
|
|
—
|
|
3
|
|
|||||||
|
Other large-cap U.S. companies
|
43
|
|
—
|
|
—
|
|
43
|
|
|||||||
|
International companies
|
1
|
|
—
|
|
—
|
|
1
|
|
|||||||
|
Mutual fund equity investments:
|
|||||||||||||||
|
U.S. equity index funds:
|
|||||||||||||||
|
U.S. small-cap equity index funds
|
3
|
|
—
|
|
—
|
|
3
|
|
|||||||
|
U.S. mid-cap equity index funds
|
4
|
|
—
|
|
—
|
|
4
|
|
|||||||
|
Non-U.S. equities growth fund
|
6
|
|
—
|
|
—
|
|
6
|
|
|||||||
|
U.S. equity funds:
|
|||||||||||||||
|
U.S. mid-cap
|
9
|
|
—
|
|
—
|
|
9
|
|
|||||||
|
U.S. small-cap
|
3
|
|
—
|
|
—
|
|
3
|
|
|||||||
|
Other
|
4
|
|
—
|
|
—
|
|
4
|
|
|||||||
|
Fixed income securities:
|
|||||||||||||||
|
U.S. government agencies
|
—
|
|
49
|
|
—
|
|
49
|
|
|||||||
|
Corporate bonds
|
—
|
|
2
|
|
—
|
|
2
|
|
|||||||
|
Fixed income mutual funds:
|
|||||||||||||||
|
U.S. investment-grade fixed income securities
|
11
|
|
—
|
|
—
|
|
11
|
|
|||||||
|
Total
|
$
|
99
|
|
$
|
51
|
|
$
|
—
|
|
$
|
150
|
|
|||
140
|
(in millions)
|
Level 1
|
Level 2
|
Level 3
|
Total
|
|||||||||||
|
December 31, 2017
|
|||||||||||||||
|
Asset Class
|
|||||||||||||||
|
Cash
|
$
|
6
|
|
$
|
—
|
|
$
|
—
|
|
$
|
6
|
|
|||
|
Equity securities:
|
|||||||||||||||
|
F.N.B. Corporation
|
8
|
|
—
|
|
—
|
|
8
|
|
|||||||
|
Other large-cap U.S. financial services companies
|
4
|
|
—
|
|
—
|
|
4
|
|
|||||||
|
Other large-cap U.S. companies
|
46
|
|
—
|
|
—
|
|
46
|
|
|||||||
|
International companies
|
1
|
|
—
|
|
—
|
|
1
|
|
|||||||
|
Other equity
|
1
|
|
—
|
|
—
|
|
1
|
|
|||||||
|
Mutual fund equity investments:
|
|||||||||||||||
|
U.S. equity index funds:
|
|||||||||||||||
|
U.S. large-cap equity index funds
|
3
|
|
—
|
|
—
|
|
3
|
|
|||||||
|
U.S. small-cap equity index funds
|
4
|
|
—
|
|
—
|
|
4
|
|
|||||||
|
U.S. mid-cap equity index funds
|
5
|
|
—
|
|
—
|
|
5
|
|
|||||||
|
Non-U.S. equities growth fund
|
14
|
|
—
|
|
—
|
|
14
|
|
|||||||
|
U.S. equity funds:
|
|||||||||||||||
|
U.S. mid-cap
|
9
|
|
—
|
|
—
|
|
9
|
|
|||||||
|
U.S. small-cap
|
3
|
|
—
|
|
—
|
|
3
|
|
|||||||
|
Other
|
6
|
|
—
|
|
—
|
|
6
|
|
|||||||
|
Fixed income securities:
|
|||||||||||||||
|
U.S. government agencies
|
—
|
|
37
|
|
—
|
|
37
|
|
|||||||
|
Corporate bonds
|
—
|
|
6
|
|
—
|
|
6
|
|
|||||||
|
Fixed income mutual funds:
|
|||||||||||||||
|
U.S. investment-grade fixed income securities
|
11
|
|
—
|
|
—
|
|
11
|
|
|||||||
|
Total
|
$
|
121
|
|
$
|
43
|
|
$
|
—
|
|
$
|
164
|
|
|||
The classifications for Level 1, Level 2 and Level 3 are discussed in Note 24, “Fair Value Measurements.”
NOTE 18. INCOME TAXES
The TCJA included several changes to existing U.S. tax laws that impact us, most notably a reduction of the U.S. corporate income tax rate from
35%
to
21%
, which became effective January 1, 2018. We recognized the initial income tax effects of the TCJA in our 2017 Consolidated Financial Statements in accordance with SAB No. 118, which provides SEC staff guidance for the application of ASC 740, Income Taxes, in the reporting period in which the TCJA was signed into law. We recorded a provisional amount of
$54.0 million
at December 31, 2017 related to the remeasurement of deferred tax balances. Upon final analysis of available information and refinement of our calculations during 2018, we decreased our provisional amount by
$1.9 million
which is included as a component of income tax expense from continuing operations. We consider the TCJA remeasurement of our deferred taxes to be complete.
The effects of changes in tax rates on deferred tax balances are applicable even in situations in which the related income tax effects of such items were originally recognized in other comprehensive income. This results in stranded tax effects for items that were recorded in AOCI rather than in income from continuing operations. In the fourth quarter of 2017, we elected to change our accounting policy to reclassify the income tax effects related to the TCJA of approximately
$14.7 million
from AOCI to retained earnings. This change in accounting policy results in the appropriate tax rate being recognized in AOCI for debt and equity investments, certain derivative transactions, and pension and other post-retirement benefit plans.
141
Income Tax Expense
Federal and state income tax expense consist of the following:
TABLE 18.1
|
Year Ended December 31
|
2018
|
2017
|
2016
|
||||||||
|
(in millions)
|
|||||||||||
|
Current income taxes:
|
|||||||||||
|
Federal taxes
|
$
|
41
|
|
$
|
26
|
|
$
|
58
|
|
||
|
State taxes
|
6
|
|
2
|
|
2
|
|
|||||
|
Total current income taxes
|
47
|
|
28
|
|
60
|
|
|||||
|
Deferred income taxes:
|
|||||||||||
|
Federal taxes
|
32
|
|
128
|
|
15
|
|
|||||
|
State taxes
|
—
|
|
1
|
|
—
|
|
|||||
|
Total deferred income taxes
|
32
|
|
129
|
|
15
|
|
|||||
|
Total income taxes
|
$
|
79
|
|
$
|
157
|
|
$
|
75
|
|
||
The following table provides a reconciliation between the statutory tax rate and the actual effective tax rate:
TABLE 18.2
|
Year Ended December 31
|
2018
|
2017
|
2016
|
|||||
|
Statutory federal tax rate
|
21.0
|
%
|
35.0
|
%
|
35.0
|
%
|
||
|
State taxes, net of federal benefit
|
1.1
|
|
0.5
|
|
0.7
|
|
||
|
Tax-exempt interest
|
(2.1
|
)
|
(3.3
|
)
|
(2.9
|
)
|
||
|
Cash surrender value on BOLI
|
(0.5
|
)
|
(1.1
|
)
|
(1.5
|
)
|
||
|
Tax credits
|
(2.8
|
)
|
(2.6
|
)
|
(0.9
|
)
|
||
|
Affordable housing cost amortization, net of tax benefits
|
0.7
|
|
0.2
|
|
—
|
|
||
|
Tax Cuts and Jobs Act revaluation of net deferred tax assets
|
(0.4
|
)
|
15.2
|
|
—
|
|
||
|
Other items
|
0.6
|
|
0.2
|
|
0.2
|
|
||
|
Actual effective tax rate
|
17.6
|
%
|
44.1
|
%
|
30.6
|
%
|
||
The effective tax rate for
2018
was
17.6%
, as compared to
44.1%
in
2017
. The effective tax rate of
17.6%
in
2018
was lower than the
21%
TCJA statutory federal tax rate due to tax-exempt income on investments and loans, tax credits and income from BOLI. The effective tax rate for
2017
was significantly higher at
44.1%
than the
35%
pre-TCJA statutory federal tax rate largely due to
$54.0 million
of income tax expense recorded from the revaluation of net DTAs in connection with the TCJA in
2017
.
Income tax expense related to gains on the sale of securities is presented in the following table:
TABLE 18.3
|
Year Ended December 31
|
2018
|
2017
|
2016
|
||||||||
|
(in millions)
|
|||||||||||
|
Income tax expense related to gains on sale of securities
|
$
|
—
|
|
$
|
2
|
|
$
|
—
|
|
||
142
Deferred Income Taxes
Deferred income taxes reflect the net tax effects of temporary differences between the carrying amounts of assets and liabilities for financial reporting purposes and tax purposes. DTAs and DTLs are measured based on the enacted tax rates that will apply in the years in which the temporary differences are expected to be recovered or paid. As such, during December 2017, we remeasured our DTAs and DTLs as a result of the passage of the TCJA. The primary impact of this remeasurement was a reduction in DTAs and DTLs in connection with the reduction of the U.S. corporate income tax rate from
35%
to
21%
.
The following table presents the tax effects of significant temporary differences that give rise to federal and state DTAs and DTLs:
TABLE 18.4
|
December 31
|
2018
|
2017
|
|||||
|
(in millions)
|
|||||||
|
Deferred tax assets:
|
|||||||
|
Allowance for credit losses
|
$
|
40
|
|
$
|
39
|
|
|
|
Discounts on loans acquired in a business combination
|
51
|
|
64
|
|
|||
|
Net operating loss/tax credit carryforwards
|
43
|
|
47
|
|
|||
|
Deferred compensation
|
10
|
|
9
|
|
|||
|
Securities impairments
|
1
|
|
1
|
|
|||
|
Pension and other defined benefit plans
|
5
|
|
7
|
|
|||
|
Net unrealized securities losses
|
12
|
|
7
|
|
|||
|
Other
|
9
|
|
8
|
|
|||
|
Total
|
171
|
|
182
|
|
|||
|
Valuation allowance
|
(26
|
)
|
(27
|
)
|
|||
|
Total deferred tax assets
|
145
|
|
155
|
|
|||
|
Deferred tax liabilities:
|
|||||||
|
Loan costs
|
(14
|
)
|
(7
|
)
|
|||
|
Depreciation
|
(17
|
)
|
(12
|
)
|
|||
|
Prepaid expenses
|
(1
|
)
|
(4
|
)
|
|||
|
Amortizable intangibles
|
(16
|
)
|
(18
|
)
|
|||
|
Lease financing
|
(18
|
)
|
(10
|
)
|
|||
|
Mortgage servicing rights
|
(8
|
)
|
(6
|
)
|
|||
|
Other
|
(4
|
)
|
(2
|
)
|
|||
|
Total deferred tax liabilities
|
(78
|
)
|
(59
|
)
|
|||
|
Net deferred tax assets
|
$
|
67
|
|
$
|
96
|
|
|
We establish a valuation allowance when it is more likely than not that we will not be able to realize the benefit of the DTAs or when future deductibility is uncertain. Periodically, the valuation allowance is reviewed and adjusted based on management’s assessment of realizable DTAs. As of
December 31, 2018
, the valuation allowance primarily relates to unused federal and state net operating loss carryforwards expiring from
2019
to
2038
. We anticipate that neither the state net operating loss carryforwards nor the other net DTAs at certain of our subsidiaries will be utilized and, as such, have recorded a valuation allowance against the DTAs related to these items.
As of
December 31, 2018
, we had approximately
$45.0 million
of federal net operating loss and built-in loss carryforwards,
$3.0 million
of federal tax credit carryforwards, and
$10.3 million
of state net operating loss carryforwards to which we succeeded as a result of the YDKN acquisition. The utilization of these tax attributes is subject to annual limitations under Section 382 of the Internal Revenue Code, or a similar state-level statute, which will cause the utilization of these attributes to be deferred over a number of years, not to exceed beyond
2036
. We have determined that we will likely have sufficient taxable income in the years during which these tax attributes are available to be utilized and, consequently, have determined that no valuation allowance against the recorded DTA is warranted.
143
Uncertain Tax Positions
We account for uncertainties in income taxes in accordance with ASC 740, Income Taxes. At
December 31, 2018
and
2017
, we have approximately
$0.9 million
and
$0.7 million
, respectively, of unrecognized tax benefits related to uncertain tax positions. As of
December 31, 2018
,
$0.7 million
of these tax benefits would affect the effective tax rate if recognized. We recognize potential accrued interest and penalties related to unrecognized tax benefits in income tax expense. To the extent interest is not assessed with respect to uncertain tax positions, amounts accrued will be reduced and reflected as a reduction of the overall income tax provision. A tabular reconciliation of the unrecognized tax benefits is not presented as the impact of changes to uncertain tax positions on our income tax expense was immaterial.
We file numerous income tax returns in the U.S. federal jurisdiction and in several state jurisdictions. We are no longer subject to U.S. federal income tax examinations for years prior to
2015
. With limited exception, we are no longer subject to state income tax examinations for years prior to
2015
. We anticipate that a reduction in the unrecognized tax benefit of up to
$0.07 million
may occur in the next twelve months from the expiration of statutes of limitations which would result in a reduction in income taxes.
NOTE 19. OTHER COMPREHENSIVE INCOME
The following table presents changes in AOCI, net of tax, by component:
TABLE 19.1
|
(in millions)
|
Unrealized
Net Gains
(Losses) on
Debt Securities
Available
for Sale
|
Unrealized Net
Gains (Losses) on
Derivative
Instruments
|
Unrecognized
Pension and
Postretirement
Obligations
|
Total
|
|||||||||||
|
Year Ended December 31, 2018
|
|||||||||||||||
|
Balance at beginning of period
|
$
|
(29
|
)
|
$
|
5
|
|
$
|
(59
|
)
|
$
|
(83
|
)
|
|||
|
Other comprehensive (loss) income before reclassifications
|
(17
|
)
|
(2
|
)
|
(2
|
)
|
(21
|
)
|
|||||||
|
Amounts reclassified from AOCI
|
—
|
|
(2
|
)
|
—
|
|
(2
|
)
|
|||||||
|
Net current period other comprehensive (loss) income
|
(17
|
)
|
(4
|
)
|
(2
|
)
|
(23
|
)
|
|||||||
|
Balance at end of period
|
$
|
(46
|
)
|
$
|
1
|
|
$
|
(61
|
)
|
$
|
(106
|
)
|
|||
The amounts reclassified from AOCI related to debt securities AFS are included in net securities gains on the Consolidated Statements of Income, while the amounts reclassified from AOCI related to derivative instruments are included in interest income on loans and leases on the Consolidated Statements of Income.
The tax (benefit) expense amounts reclassified from AOCI in connection with the debt securities AFS and derivative instruments reclassifications are included in income taxes on the Consolidated Statements of Income.
144
NOTE 20. EARNINGS PER COMMON SHARE
The following table sets forth the computation of basic and diluted earnings per common share:
TABLE 20.1
|
Year Ended December 31
|
2018
|
2017
|
2016
|
||||||||
|
(dollars in millions, except per share data)
|
|||||||||||
|
Net income
|
$
|
373
|
|
$
|
199
|
|
$
|
171
|
|
||
|
Less: Preferred stock dividends
|
8
|
|
8
|
|
8
|
|
|||||
|
Net income available to common stockholders
|
$
|
365
|
|
$
|
191
|
|
$
|
163
|
|
||
|
Basic weighted average common shares outstanding
|
324,207,198
|
|
302,195,295
|
|
206,244,498
|
|
|||||
|
Net effect of dilutive stock options, warrants and restricted stock
|
1,416,405
|
|
1,662,681
|
|
1,524,111
|
|
|||||
|
Diluted weighted average common shares outstanding
|
325,623,603
|
|
303,857,976
|
|
207,768,609
|
|
|||||
|
Earnings per common share:
|
|||||||||||
|
Basic
|
$
|
1.13
|
|
$
|
0.63
|
|
$
|
0.79
|
|
||
|
Diluted
|
$
|
1.12
|
|
$
|
0.63
|
|
$
|
0.78
|
|
||
The following table shows the average shares excluded from the above calculation as their effect would have been anti-dilutive:
TABLE 20.2
|
Year Ended December 31
|
2018
|
2017
|
2016
|
|||||
|
Average shares excluded from the diluted earnings per common share calculation
|
81
|
|
910
|
|
9,980
|
|
||
NOTE 21. REGULATORY MATTERS
FNB and FNBPA are subject to various regulatory capital requirements administered by the federal banking agencies. Quantitative measures established by regulators to ensure capital adequacy require FNB and FNBPA to maintain minimum amounts and ratios of total, tier 1 and common equity tier 1 capital (as defined in the regulations) to risk-weighted assets (as defined) and of leverage ratio (as defined). Failure to meet minimum capital requirements could lead to initiation of certain mandatory, and possibly additional discretionary actions by regulators that, if undertaken, could have a direct material effect on our Consolidated Financial Statements, dividends and future merger and acquisition activity. Under capital adequacy guidelines and the regulatory framework for prompt corrective action, FNB and FNBPA must meet specific capital guidelines that involve quantitative measures of assets, liabilities and certain off-balance sheet items as calculated under regulatory accounting practices. FNB’s and FNBPA’s capital amounts and classifications are also subject to qualitative judgments by the regulators about components, risk weightings and other factors.
As of
December 31, 2018
, the most recent notification from the federal banking agencies categorized FNB and FNBPA as “well-capitalized” under the regulatory framework for prompt corrective action. There are no conditions or events since the notification which management believes have changed this categorization.
145
Following are the capital ratios for FNB and FNBPA:
TABLE 21.1
|
Actual
|
Well-Capitalized
Requirements
|
Minimum Capital
Requirements plus Capital Conservation Buffer
|
||||||||||||||||||
|
(dollars in millions)
|
Amount
|
Ratio
|
Amount
|
Ratio
|
Amount
|
Ratio
|
||||||||||||||
|
As of December 31, 2018
|
||||||||||||||||||||
|
F.N.B. Corporation:
|
||||||||||||||||||||
|
Total capital
|
$
|
2,875
|
|
11.54
|
%
|
$
|
2,490
|
|
10.00
|
%
|
$
|
2,459
|
|
9.88
|
%
|
|||||
|
Tier 1 capital
|
2,395
|
|
9.62
|
|
1,992
|
|
8.00
|
|
1,961
|
|
7.88
|
|
||||||||
|
Common equity tier 1
|
2,289
|
|
9.19
|
|
1,619
|
|
6.50
|
|
1,588
|
|
6.38
|
|
||||||||
|
Leverage
|
2,395
|
|
7.87
|
|
1,523
|
|
5.00
|
|
1,218
|
|
4.00
|
|
||||||||
|
Risk-weighted assets
|
24,900
|
|
||||||||||||||||||
|
FNBPA:
|
||||||||||||||||||||
|
Total capital
|
2,735
|
|
10.99
|
|
2,489
|
|
10.00
|
|
2,458
|
|
9.88
|
|
||||||||
|
Tier 1 capital
|
2,553
|
|
10.26
|
|
1,992
|
|
8.00
|
|
1,960
|
|
7.88
|
|
||||||||
|
Common equity tier 1
|
2,473
|
|
9.94
|
|
1,618
|
|
6.50
|
|
1,587
|
|
6.38
|
|
||||||||
|
Leverage
|
2,553
|
|
8.39
|
|
1,521
|
|
5.00
|
|
1,217
|
|
4.00
|
|
||||||||
|
Risk-weighted assets
|
24,894
|
|
||||||||||||||||||
|
As of December 31, 2017
|
||||||||||||||||||||
|
F.N.B. Corporation:
|
||||||||||||||||||||
|
Total capital
|
$
|
2,666
|
|
11.39
|
%
|
$
|
2,340
|
|
10.00
|
%
|
$
|
2,165
|
|
9.25
|
%
|
|||||
|
Tier 1 capital
|
2,185
|
|
9.33
|
|
1,872
|
|
8.00
|
|
1,697
|
|
7.25
|
|
||||||||
|
Common equity tier 1
|
2,078
|
|
8.88
|
|
1,521
|
|
6.50
|
|
1,346
|
|
5.75
|
|
||||||||
|
Leverage
|
2,185
|
|
7.58
|
|
1,441
|
|
5.00
|
|
1,153
|
|
4.00
|
|
||||||||
|
Risk-weighted assets
|
23,404
|
|
||||||||||||||||||
|
FNBPA:
|
||||||||||||||||||||
|
Total capital
|
2,504
|
|
10.74
|
|
2,333
|
|
10.00
|
|
2,158
|
|
9.25
|
|
||||||||
|
Tier 1 capital
|
2,333
|
|
10.00
|
|
1,866
|
|
8.00
|
|
1,691
|
|
7.25
|
|
||||||||
|
Common equity tier 1
|
2,253
|
|
9.66
|
|
1,516
|
|
6.50
|
|
1,341
|
|
5.75
|
|
||||||||
|
Leverage
|
2,333
|
|
8.14
|
|
1,433
|
|
5.00
|
|
1,146
|
|
4.00
|
|
||||||||
|
Risk-weighted assets
|
23,326
|
|
||||||||||||||||||
In accordance with Basel III standards, the implementation of capital requirements is transitional and phases-in from January 1, 2015 through January 1, 2019. The minimum capital requirements for each period above are based on the requirements that were in effect at that time. Our management believes that FNB and FNBPA will continue to meet all "well-capitalized" requirements after Basel III is completely phased-in.
Due to usable vault cash, the aggregate cash reserves FNBPA was required to maintain with the FRB amounted
to less than $1 million
at
December 31, 2018
. We also maintain deposits for various services such as check clearing. Certain limitations exist under applicable law and regulations by regulatory agencies regarding dividend distributions to a parent by our subsidiaries. As of
December 31, 2018
, our subsidiaries had
$356.1 million
of retained earnings available for distribution to us without prior regulatory approval.
Under current FRB regulations, FNBPA is limited in the amount it may lend to non-bank affiliates, including FNB. Such loans must be secured by specified collateral. In addition, any such loans to a non-bank affiliate may not exceed 10% of FNBPA’s capital and surplus and the aggregate of loans to all such affiliates may not exceed 20% of FNBPA’s capital and surplus. The maximum amount that may be borrowed by FNB affiliates under these provisions was
$537.1 million
at
December 31, 2018
.
146
NOTE 22. CASH FLOW INFORMATION
Following is a summary of supplemental cash flow information:
TABLE 22.1
|
Year Ended December 31
|
2018
|
2017
|
2016
|
||||||||
|
(in millions)
|
|||||||||||
|
Interest paid on deposits and other borrowings
|
$
|
230
|
|
$
|
129
|
|
$
|
67
|
|
||
|
Income taxes paid
|
19
|
|
53
|
|
60
|
|
|||||
|
Transfers of loans to other real estate owned
|
12
|
|
35
|
|
15
|
|
|||||
NOTE 23. BUSINESS SEGMENTS
We operate in
three
reportable segments: Community Banking, Wealth Management and Insurance.
|
•
|
The Community Banking segment provides commercial and consumer banking services. Commercial banking solutions include corporate banking, small business banking, investment real estate financing, business credit, capital markets and lease financing. Consumer banking products and services include deposit products, mortgage lending, consumer lending and a complete suite of mobile and online banking services.
|
|
•
|
The Wealth Management segment provides a broad range of personal and corporate fiduciary services including the administration of decedent and trust estates. In addition, it offers various alternative products, including securities brokerage and investment advisory services, mutual funds and annuities.
|
|
•
|
The Insurance segment includes a full-service insurance agency offering all lines of commercial and personal insurance through major carriers. The Insurance segment also includes a reinsurer.
|
|
•
|
We also previously operated a Consumer Finance segment, which is no longer a reportable segment. This segment primarily made installment loans to individuals and purchased installment sales finance contracts from retail merchants. On August 31, 2018, as part of our strategy to enhance the overall positioning of our consumer banking operations, we sold
100 percent
of the issued and outstanding capital stock of Regency to Mariner Finance, LLC. This transaction was completed to accomplish several strategic objectives, including enhancing the credit risk profile of the consumer loan portfolio, offering additional liquidity and selling a non-strategic business segment that no longer fits with our core business. The Consumer Finance segment is shown in the following tables to include Regency's financial information through August 31, 2018.
|
147
The following tables provide financial information for these segments of FNB. The information provided under the caption “Parent and Other” represents operations not considered to be reportable segments and/or general operating expenses of FNB, and includes the parent company, other non-bank subsidiaries and eliminations and adjustments to reconcile to the Consolidated Financial Statements.
TABLE 23.1
|
(in millions)
|
Community
Banking
|
Wealth
Manage-
ment
|
Insurance
|
Consumer
Finance
|
Parent
and
Other
|
Consolidated
|
|||||||||||||||||
|
At or for the Year Ended December 31, 2018
|
|||||||||||||||||||||||
|
Interest income
|
$
|
1,145
|
|
$
|
—
|
|
$
|
—
|
|
$
|
25
|
|
$
|
—
|
|
$
|
1,170
|
|
|||||
|
Interest expense
|
219
|
|
—
|
|
—
|
|
2
|
|
17
|
|
238
|
|
|||||||||||
|
Net interest income
|
926
|
|
—
|
|
—
|
|
23
|
|
(17
|
)
|
932
|
|
|||||||||||
|
Provision for credit losses
|
54
|
|
—
|
|
—
|
|
6
|
|
1
|
|
61
|
|
|||||||||||
|
Non-interest income
|
213
|
|
44
|
|
16
|
|
2
|
|
1
|
|
276
|
|
|||||||||||
|
Non-interest expense
(1)
|
609
|
|
33
|
|
17
|
|
15
|
|
5
|
|
679
|
|
|||||||||||
|
Amortization of intangibles
|
15
|
|
1
|
|
—
|
|
—
|
|
—
|
|
16
|
|
|||||||||||
|
Income tax expense (benefit)
|
82
|
|
2
|
|
—
|
|
1
|
|
(6
|
)
|
79
|
|
|||||||||||
|
Net income (loss)
|
379
|
|
8
|
|
(1
|
)
|
3
|
|
(16
|
)
|
373
|
|
|||||||||||
|
Total assets
|
32,997
|
|
26
|
|
25
|
|
—
|
|
54
|
|
33,102
|
|
|||||||||||
|
Total intangibles
|
2,304
|
|
10
|
|
20
|
|
—
|
|
—
|
|
2,334
|
|
|||||||||||
|
At or for the Year Ended
December 31, 2017 |
|||||||||||||||||||||||
|
Interest income
|
$
|
944
|
|
$
|
—
|
|
$
|
—
|
|
$
|
40
|
|
$
|
(4
|
)
|
$
|
980
|
|
|||||
|
Interest expense
|
118
|
|
—
|
|
—
|
|
4
|
|
12
|
|
134
|
|
|||||||||||
|
Net interest income
|
826
|
|
—
|
|
—
|
|
36
|
|
(16
|
)
|
846
|
|
|||||||||||
|
Provision for credit losses
|
53
|
|
—
|
|
—
|
|
8
|
|
—
|
|
61
|
|
|||||||||||
|
Non-interest income
|
197
|
|
39
|
|
16
|
|
3
|
|
(3
|
)
|
252
|
|
|||||||||||
|
Non-interest expense
(1)
|
597
|
|
30
|
|
15
|
|
21
|
|
—
|
|
663
|
|
|||||||||||
|
Amortization of intangibles
|
17
|
|
1
|
|
—
|
|
—
|
|
—
|
|
18
|
|
|||||||||||
|
Income tax expense (benefit)
|
153
|
|
3
|
|
—
|
|
5
|
|
(4
|
)
|
157
|
|
|||||||||||
|
Net income (loss)
|
203
|
|
5
|
|
1
|
|
5
|
|
(15
|
)
|
199
|
|
|||||||||||
|
Total assets
|
31,156
|
|
24
|
|
21
|
|
181
|
|
36
|
|
31,418
|
|
|||||||||||
|
Total intangibles
|
2,317
|
|
10
|
|
12
|
|
2
|
|
—
|
|
2,341
|
|
|||||||||||
|
At or for the Year Ended
December 31, 2016 |
|||||||||||||||||||||||
|
Interest income
|
$
|
641
|
|
$
|
—
|
|
$
|
—
|
|
$
|
41
|
|
$
|
(3
|
)
|
$
|
679
|
|
|||||
|
Interest expense
|
56
|
|
—
|
|
—
|
|
4
|
|
7
|
|
67
|
|
|||||||||||
|
Net interest income
|
585
|
|
—
|
|
—
|
|
37
|
|
(10
|
)
|
612
|
|
|||||||||||
|
Provision for credit losses
|
49
|
|
—
|
|
—
|
|
7
|
|
—
|
|
56
|
|
|||||||||||
|
Non-interest income
|
149
|
|
35
|
|
15
|
|
3
|
|
(1
|
)
|
201
|
|
|||||||||||
|
Non-interest expense
(1)
|
437
|
|
27
|
|
13
|
|
22
|
|
1
|
|
500
|
|
|||||||||||
|
Amortization of intangibles
|
11
|
|
—
|
|
—
|
|
—
|
|
—
|
|
11
|
|
|||||||||||
|
Income tax expense (benefit)
|
72
|
|
3
|
|
1
|
|
4
|
|
(5
|
)
|
75
|
|
|||||||||||
|
Net income (loss)
|
165
|
|
5
|
|
1
|
|
7
|
|
(7
|
)
|
171
|
|
|||||||||||
|
Total assets
|
21,629
|
|
20
|
|
22
|
|
193
|
|
(19
|
)
|
21,845
|
|
|||||||||||
|
Total intangibles
|
1,062
|
|
10
|
|
12
|
|
2
|
|
—
|
|
1,086
|
|
|||||||||||
|
(1)
|
Excludes amortization of intangibles, which is presented separately.
|
148
NOTE 24. FAIR VALUE MEASUREMENTS
We use fair value measurements to record fair value adjustments to certain financial assets and liabilities and to determine fair value disclosures. Securities AFS, mortgage loans held for sale accounted for under FVO and derivatives are recorded at fair value on a recurring basis. Additionally, from time to time, we may be required to record at fair value other assets on a non-recurring basis, such as certain impaired loans, OREO and certain other assets.
Fair value is defined as an exit price, representing the price that would be received to sell an asset or paid to transfer a liability in an orderly transaction between market participants at the measurement date. Fair value measurements are not adjusted for transaction costs. Fair value is a market-based measure considered from the perspective of a market participant who holds the asset or owes the liability rather than an entity-specific measure.
In determining fair value, we use various valuation approaches, including market, income and cost approaches. ASC 820,
Fair Value Measurements and Disclosures
, establishes a hierarchy for inputs used in measuring fair value that maximizes the use of observable inputs and minimizes the use of unobservable inputs by requiring that observable inputs be used when available. Observable inputs are inputs that market participants would use in pricing the asset or liability, which are developed based on market data obtained from independent sources. Unobservable inputs reflect our assumptions about the assumptions that market participants would use in pricing an asset or liability, which are developed based on the best information available in the circumstances.
The fair value hierarchy gives the highest priority to unadjusted quoted market prices in active markets for identical assets or liabilities (Level 1 measurement) and the lowest priority to unobservable inputs (Level 3 measurement). The fair value hierarchy is broken down into three levels based on the reliability of inputs as follows:
TABLE 24.1
|
Measurement
Category
|
Definition
|
|
|
Level 1
|
valuation is based upon unadjusted quoted market prices for identical instruments traded in active markets.
|
|
|
Level 2
|
valuation is based upon quoted market prices for similar instruments traded in active markets,
quoted market prices for identical or similar instruments traded in markets that are not active
and model-based valuation techniques for which all significant assumptions are observable in
the market or can be corroborated by market data.
|
|
|
Level 3
|
valuation is derived from other valuation methodologies including discounted cash flow models
and similar techniques that use significant assumptions not observable in the market. These
unobservable assumptions reflect estimates of assumptions that market participants would
use in determining fair value.
|
|
A financial instrument’s level within the fair value hierarchy is based on the lowest level of input that is significant to the fair value measurement.
Following is a description of the valuation methodologies we use for financial instruments recorded at fair value on either a recurring or non-recurring basis:
Securities Available For Sale
These securities are recorded at fair value on a recurring basis. At
December 31, 2018
,
100.0%
of these securities used valuation methodologies involving market-based or market-derived information, collectively Level 1 and Level 2 measurements, to measure fair value.
We closely monitor market conditions involving assets that have become less actively traded. If the fair value measurement is based upon recent observable market activity of such assets or comparable assets (other than forced or distressed transactions) that occur in sufficient volume, and do not require significant adjustment using unobservable inputs, those assets are classified as Level 1 or Level 2; if not, they are classified as Level 3. Making this assessment requires significant judgment.
We use prices from independent pricing services and, to a lesser extent, indicative (non-binding) quotes from independent brokers, to measure the fair value of investment securities. We validate prices received from pricing services or brokers using a
149
variety of methods, including, but not limited to, comparison to secondary pricing services, corroboration of pricing by reference to other independent market data such as secondary broker quotes and relevant benchmark indices, and review of pricing information by corporate personnel familiar with market liquidity and other market-related conditions.
Derivative Financial Instruments
We determine fair value for derivatives using widely accepted valuation techniques including discounted cash flow analysis on the expected cash flows of each derivative. This analysis reflects contractual terms of the derivative, including the period to maturity and uses observable market based inputs, including interest rate curves and implied volatilities.
We incorporate credit valuation adjustments to appropriately reflect both our own non-performance risk and the respective counterparty’s non-performance risk in the fair value measurements. In adjusting the fair value of our derivative contracts for the effect of non-performance risk, we consider the impact of netting and any applicable credit enhancements, such as collateral postings, thresholds, mutual puts and guarantees.
Although we have determined that the majority of the inputs used to value our derivatives fall within Level 2 of the fair value hierarchy, the credit valuation adjustments associated with our derivatives and IRLCs utilize Level 3 inputs. Credit valuation estimates of current credit spreads are used to evaluate the likelihood of our default and the default of our counterparties. However, as of
December 31, 2018
and
2017
, we have assessed the significance of the impact of the credit valuation adjustments on the overall valuation of our non-IRLC derivative positions and have determined that the credit valuation adjustments are not significant to the overall valuation of our derivatives. As a result, we have determined that our derivative valuations in their entirety are classified in Level 2 of the fair value hierarchy. The fair value of IRLCs is based upon the estimated fair value of the underlying mortgage loan, including the expected cash flows related to the MSRs and the estimated percentage of IRLCs that will result in a closed mortgage loan, and classified as Level 3.
Loans Held For Sale
Residential mortgage loans held for sale are carried at fair value under the FVO. Prior to 2017, residential mortgage loans held for sale were carried at the lower of cost or fair value accounting, under which, periodically, it may have been necessary to record non-recurring fair value adjustments. Fair value for residential mortgage loans held for sale, when recorded, is based on independent quoted market prices and is classified as Level 2.
SBA loans held for sale are carried under lower of cost or fair value, for which, periodically, it may be necessary to record non-recurring fair value adjustments. Fair value for SBA loans held for sale, when recorded, is based on independent quoted market prices and is classified as Level 2.
Impaired Loans
We reserve for commercial loan relationships greater than or equal to
$1.0 million
that we consider impaired as defined in ASC 310 at the time we identify the loan as impaired based upon the present value of expected future cash flows available to pay the loan, or based upon the fair value of the collateral less estimated selling costs where a loan is collateral dependent. Collateral may be real estate and/or business assets including equipment, inventory and accounts receivable.
We determine the fair value of real estate based on appraisals by licensed or certified appraisers. The value of business assets is generally based on amounts reported on the business’ financial statements. Management must rely on the financial statements prepared and certified by the borrower or their accountants in determining the value of these business assets on an ongoing basis, which may be subject to significant change over time. Based on the quality of information or statements provided, management may require the use of business asset appraisals and site-inspections to better value these assets. We may discount appraised and reported values based on management’s historical knowledge, changes in market conditions from the time of valuation or management’s knowledge of the borrower and the borrower’s business. Since not all valuation inputs are observable, we classify these non-recurring fair value determinations as Level 2 or Level 3 based on the lowest level of input that is significant to the fair value measurement.
We review and evaluate impaired loans no less frequently than quarterly for additional impairment based on the same factors identified above.
150
Other Real Estate Owned
OREO is comprised principally of commercial and residential real estate properties obtained in partial or total satisfaction of loan obligations. OREO acquired in settlement of indebtedness is recorded at the lower of carrying amount of the loan or fair value less costs to sell. Subsequently, these assets are carried at the lower of carrying value or fair value less costs to sell. Accordingly, it may be necessary to record non-recurring fair value adjustments. Fair value is generally based upon appraisals by licensed or certified appraisers and other market information and is classified as Level 2 or Level 3.
The following table presents the balances of assets and liabilities measured at fair value on a recurring basis:
TABLE 24.2
|
(in millions)
|
Level 1
|
Level 2
|
Level 3
|
Total
|
|||||||||||
|
December 31, 2018
|
|||||||||||||||
|
Assets Measured at Fair Value
|
|||||||||||||||
|
Debt securities available for sale
|
|||||||||||||||
|
U.S. government agencies
|
$
|
—
|
|
$
|
187
|
|
$
|
—
|
|
$
|
187
|
|
|||
|
U.S. government-sponsored entities
|
—
|
|
313
|
|
—
|
|
313
|
|
|||||||
|
Residential mortgage-backed securities
|
|||||||||||||||
|
Agency mortgage-backed securities
|
—
|
|
1,429
|
|
—
|
|
1,429
|
|
|||||||
|
Agency collateralized mortgage obligations
|
—
|
|
1,161
|
|
—
|
|
1,161
|
|
|||||||
|
Commercial mortgage-backed securities
|
—
|
|
228
|
|
—
|
|
228
|
|
|||||||
|
States of the U.S. and political subdivisions
|
—
|
|
21
|
|
—
|
|
21
|
|
|||||||
|
Other debt securities
|
—
|
|
2
|
|
—
|
|
2
|
|
|||||||
|
Total debt securities available for sale
|
—
|
|
3,341
|
|
—
|
|
3,341
|
|
|||||||
|
Loans held for sale
|
—
|
|
14
|
|
—
|
|
14
|
|
|||||||
|
Derivative financial instruments
|
|||||||||||||||
|
Trading
|
—
|
|
42
|
|
1
|
|
43
|
|
|||||||
|
Total derivative financial instruments
|
—
|
|
42
|
|
1
|
|
43
|
|
|||||||
|
Total assets measured at fair value on a recurring basis
|
$
|
—
|
|
$
|
3,397
|
|
$
|
1
|
|
$
|
3,398
|
|
|||
|
Liabilities Measured at Fair Value
|
|||||||||||||||
|
Derivative financial instruments
|
|||||||||||||||
|
Trading
|
$
|
—
|
|
$
|
36
|
|
$
|
—
|
|
$
|
36
|
|
|||
|
Not for trading
|
—
|
|
3
|
|
—
|
|
3
|
|
|||||||
|
Total derivative financial instruments
|
—
|
|
39
|
|
—
|
|
39
|
|
|||||||
|
Total liabilities measured at fair value on a recurring basis
|
$
|
—
|
|
$
|
39
|
|
$
|
—
|
|
$
|
39
|
|
|||
151
|
(in millions)
|
Level 1
|
Level 2
|
Level 3
|
Total
|
|||||||||||
|
December 31, 2017
|
|||||||||||||||
|
Assets Measured at Fair Value
|
|||||||||||||||
|
Debt securities available for sale
|
|||||||||||||||
|
U.S. government-sponsored entities
|
$
|
—
|
|
$
|
344
|
|
$
|
—
|
|
$
|
344
|
|
|||
|
Residential mortgage-backed securities
|
|||||||||||||||
|
Agency mortgage-backed securities
|
—
|
|
1,599
|
|
—
|
|
1,599
|
|
|||||||
|
Agency collateralized mortgage obligations
|
—
|
|
795
|
|
—
|
|
795
|
|
|||||||
|
States of the U.S. and political subdivisions
|
—
|
|
21
|
|
—
|
|
21
|
|
|||||||
|
Other debt securities
|
—
|
|
5
|
|
—
|
|
5
|
|
|||||||
|
Total debt securities available for sale
|
—
|
|
2,764
|
|
—
|
|
2,764
|
|
|||||||
|
Equity securities available for sale
|
|||||||||||||||
|
Financial services industry
|
—
|
|
1
|
|
—
|
|
1
|
|
|||||||
|
Total equity securities available for sale
|
—
|
|
1
|
|
—
|
|
1
|
|
|||||||
|
Total securities available for sale
|
—
|
|
2,765
|
|
—
|
|
2,765
|
|
|||||||
|
Loans held for sale
|
—
|
|
56
|
|
—
|
|
56
|
|
|||||||
|
Derivative financial instruments
|
|||||||||||||||
|
Trading
|
—
|
|
28
|
|
—
|
|
28
|
|
|||||||
|
Not for trading
|
—
|
|
1
|
|
2
|
|
3
|
|
|||||||
|
Total derivative financial instruments
|
—
|
|
29
|
|
2
|
|
31
|
|
|||||||
|
Total assets measured at fair value on a recurring basis
|
$
|
—
|
|
$
|
2,850
|
|
$
|
2
|
|
$
|
2,852
|
|
|||
|
Liabilities Measured at Fair Value
|
|||||||||||||||
|
Derivative financial instruments
|
|||||||||||||||
|
Trading
|
$
|
—
|
|
$
|
27
|
|
$
|
—
|
|
$
|
27
|
|
|||
|
Not for trading
|
—
|
|
2
|
|
—
|
|
2
|
|
|||||||
|
Total derivative financial instruments
|
—
|
|
29
|
|
—
|
|
29
|
|
|||||||
|
Total liabilities measured at fair value on a recurring basis
|
$
|
—
|
|
$
|
29
|
|
$
|
—
|
|
$
|
29
|
|
|||
152
The following table presents additional information about assets measured at fair value on a recurring basis and for which we have utilized Level 3 inputs to determine fair value:
TABLE 24.3
|
(in millions)
|
Other
Debt Securities |
Equity
Securities
|
Residential
Non-Agency
Collateralized
Mortgage
Obligations
|
Interest
Rate Lock Commitments |
Total
|
||||||||||||||
|
Year Ended December 31, 2018
|
|||||||||||||||||||
|
Balance at beginning of period
|
$
|
—
|
|
$
|
—
|
|
$
|
—
|
|
$
|
2
|
|
$
|
2
|
|
||||
|
Purchases, issuances, sales and settlements:
|
|||||||||||||||||||
|
Purchases
|
—
|
|
—
|
|
—
|
|
5
|
|
5
|
|
|||||||||
|
Settlements
|
—
|
|
—
|
|
—
|
|
(6
|
)
|
(6
|
)
|
|||||||||
|
Balance at end of period
|
$
|
—
|
|
$
|
—
|
|
$
|
—
|
|
$
|
1
|
|
$
|
1
|
|
||||
|
Year Ended December 31, 2017
|
|||||||||||||||||||
|
Balance at beginning of period
|
$
|
—
|
|
$
|
1
|
|
$
|
1
|
|
$
|
—
|
|
$
|
2
|
|
||||
|
Purchases, issuances, sales and settlements:
|
|||||||||||||||||||
|
Purchases
|
12
|
|
—
|
|
—
|
|
2
|
|
14
|
|
|||||||||
|
Sales/redemptions
|
(12
|
)
|
—
|
|
(1
|
)
|
—
|
|
(13
|
)
|
|||||||||
|
Settlements
|
—
|
|
—
|
|
—
|
|
(5
|
)
|
(5
|
)
|
|||||||||
|
Transfers from Level 3
|
—
|
|
(1
|
)
|
—
|
|
—
|
|
(1
|
)
|
|||||||||
|
Transfers into Level 3
|
—
|
|
—
|
|
—
|
|
5
|
|
5
|
|
|||||||||
|
Balance at end of period
|
$
|
—
|
|
$
|
—
|
|
$
|
—
|
|
$
|
2
|
|
$
|
2
|
|
||||
We review fair value hierarchy classifications on a quarterly basis. Changes in the observability of the valuation attributes may result in reclassification of certain financial assets or liabilities. Such reclassifications are reported as transfers in/out of Level 3 at fair value at the beginning of the period in which the changes occur. See the “Securities Available for Sale” discussion within this footnote for information relating to determining Level 3 fair values. There were
no
transfers of assets or liabilities between the hierarchy levels during
2018
. During
2017
, we acquired
$12.0 million
in other debt securities from YDKN that are measured at Level 3. These securities were sold during the second quarter of 2017. During
2017
, we transferred equity securities totaling
$0.6 million
from Level 3 to Level 2, as a result of increased trading activity relating to these securities.
For the year ended
December 31, 2018
, we recorded in earnings
$0.6 million
of unrealized gains relating to the adoption of ASU 2016-01 and market value adjustments on marketable equity securities. These unrealized gains included in earnings are in the other non-interest income line item in the Consolidated Statement of Income. For the year ended
December 31, 2017
, there were
no
gains or losses included in earnings attributable to the change in unrealized gains or losses relating to assets still held as of those dates. The total realized net securities gains included in earnings are in the net securities gains line item in the Consolidated Statements of Income.
153
In accordance with GAAP, from time to time, we measure certain assets at fair value on a non-recurring basis. These adjustments to fair value usually result from the application of the lower of cost or fair value accounting or write-downs of individual assets. Valuation methodologies used to measure these fair value adjustments were previously described. For assets measured at fair value on a non-recurring basis still held at the Balance Sheet date, the following table provides the hierarchy level and the fair value of the related assets or portfolios:
TABLE 24.4
|
(in millions)
|
Level 1
|
Level 2
|
Level 3
|
Total
|
|||||||||||
|
December 31, 2018
|
|||||||||||||||
|
Impaired loans
|
$
|
—
|
|
$
|
—
|
|
$
|
15
|
|
$
|
15
|
|
|||
|
Other real estate owned
|
—
|
|
—
|
|
5
|
|
5
|
|
|||||||
|
Other assets - SBA servicing asset
|
—
|
|
—
|
|
4
|
|
4
|
|
|||||||
|
December 31, 2017
|
|||||||||||||||
|
Impaired loans
|
$
|
—
|
|
$
|
3
|
|
$
|
1
|
|
$
|
4
|
|
|||
|
Other real estate owned
|
—
|
|
10
|
|
11
|
|
21
|
|
|||||||
|
Loans held for sale - SBA
|
—
|
|
—
|
|
36
|
|
36
|
|
|||||||
|
Other assets - SBA servicing asset
|
—
|
|
—
|
|
5
|
|
5
|
|
|||||||
Substantially all of the fair value amounts in the table above were estimated at a date during the twelve months ended
December 31, 2018
and
2017
. Consequently, the fair value information presented is not necessarily as of the period’s end.
Impaired loans measured or re-measured at fair value on a non-recurring basis during
2018
had a carrying amount of
$15.4 million
which includes an allocated allowance for credit losses of
$4.2 million
. The allowance for credit losses includes a provision applicable to the current period fair value measurements of
$6.9 million
, which was included in the provision for credit losses for
2018
.
OREO with a carrying amount of
$8.6 million
was written down to
$5.0 million
, resulting in a loss of
$3.6 million
, which was included in earnings for
2018
.
Fair Value of Financial Instruments
The following methods and assumptions were used to estimate the fair value of each financial instrument:
Cash and Cash Equivalents, Accrued Interest Receivable and Accrued Interest Payable.
For these short-term instruments, the carrying amount is a reasonable estimate of fair value.
Securities.
For both securities AFS and securities HTM, fair value equals the quoted market price from an active market, if available, and is classified within Level 1. If a quoted market price is not available, fair value is estimated using quoted market prices for similar securities or pricing models, and is classified as Level 2. Where there is limited market activity or significant valuation inputs are unobservable, securities are classified within Level 3. Under current market conditions, assumptions used to determine the fair value of Level 3 securities have greater subjectivity due to the lack of observable market transactions.
Loans and Leases.
The fair value of fixed rate loans and leases is estimated by discounting the future cash flows using the current rates at which similar loans and leases would be made to borrowers with similar credit ratings and for the same remaining maturities less an illiquidity discount, as the fair value measurement represents an exit price from a market participants' viewpoint. The fair value of variable and adjustable rate loans and leases approximates the carrying amount. Due to the significant judgment involved in evaluating credit quality, loans and leases are classified within Level 3 of the fair value hierarchy.
Loan Servicing Rights
. For both MSRs and SBA servicing rights, both classified as Level 3 assets, fair value is determined using a discounted cash flow valuation method. These models use significant unobservable inputs including discount rates, prepayment rates and cost to service which have greater subjectivity due to the lack of observable market transactions.
Derivative Assets and Liabilities.
See the “Derivative Financial Instruments” discussion included within this footnote
.
154
Deposits.
The estimated fair value of demand deposits, savings accounts and certain money market deposits is the amount payable on demand at the reporting date because of the customers’ ability to withdraw funds immediately. The fair value of fixed-maturity deposits is estimated by discounting future cash flows using rates currently offered for deposits of similar remaining maturities.
Short-Term Borrowings.
The carrying amounts for short-term borrowings approximate fair value for amounts that mature in
90 days
or less. The fair value of subordinated notes is estimated by discounting future cash flows using rates currently offered.
Long-Term Borrowings.
The fair value of long-term borrowings is estimated by discounting future cash flows based on the market prices for the same or similar issues or on the current rates offered to us for debt of the same remaining maturities.
Loan Commitments and Standby Letters of Credit.
Estimates of the fair value of these off-balance sheet items were not made because of the short-term nature of these arrangements and the credit standing of the counterparties. Also, unfunded loan commitments relate principally to variable rate commercial loans, typically are non-binding, and fees are not normally assessed on these balances.
Nature of Estimates
. Many of the estimates presented herein are based upon the use of highly subjective information and assumptions and, accordingly, the results may not be precise. Management believes that fair value estimates may not be comparable to other financial institutions due to the wide range of permitted valuation techniques and numerous estimates which must be made. Further, because the disclosed fair value amounts were estimated as of the Balance Sheet date, the amounts actually realized or paid upon maturity or settlement of the various financial instruments could be significantly different.
155
The fair values of our financial instruments are as follows:
TABLE 24.5
|
|
|
Fair Value Measurements
|
|||||||||||||||||
|
(in millions)
|
Carrying
Amount
|
Fair
Value
|
Level 1
|
Level 2
|
Level 3
|
||||||||||||||
|
December 31, 2018
|
|||||||||||||||||||
|
Financial Assets
|
|||||||||||||||||||
|
Cash and cash equivalents
|
$
|
488
|
|
$
|
488
|
|
$
|
488
|
|
$
|
—
|
|
$
|
—
|
|
||||
|
Debt securities available for sale
|
3,341
|
|
3,341
|
|
—
|
|
3,341
|
|
—
|
|
|||||||||
|
Debt securities held to maturity
|
3,254
|
|
3,155
|
|
—
|
|
3,155
|
|
—
|
|
|||||||||
|
Net loans and leases, including loans held for sale
|
21,995
|
|
21,742
|
|
—
|
|
14
|
|
21,728
|
|
|||||||||
|
Loan servicing rights
|
41
|
|
45
|
|
—
|
|
—
|
|
45
|
|
|||||||||
|
Derivative assets
|
43
|
|
43
|
|
—
|
|
42
|
|
1
|
|
|||||||||
|
Accrued interest receivable
|
101
|
|
101
|
|
101
|
|
—
|
|
—
|
|
|||||||||
|
Financial Liabilities
|
|||||||||||||||||||
|
Deposits
|
23,455
|
|
23,411
|
|
18,142
|
|
5,269
|
|
—
|
|
|||||||||
|
Short-term borrowings
|
4,129
|
|
4,130
|
|
4,130
|
|
—
|
|
—
|
|
|||||||||
|
Long-term borrowings
|
627
|
|
618
|
|
—
|
|
—
|
|
618
|
|
|||||||||
|
Derivative liabilities
|
39
|
|
39
|
|
—
|
|
39
|
|
—
|
|
|||||||||
|
Accrued interest payable
|
20
|
|
20
|
|
20
|
|
—
|
|
—
|
|
|||||||||
|
December 31, 2017
|
|||||||||||||||||||
|
Financial Assets
|
|||||||||||||||||||
|
Cash and cash equivalents
|
$
|
479
|
|
$
|
479
|
|
$
|
479
|
|
$
|
—
|
|
$
|
—
|
|
||||
|
Securities available for sale
|
2,765
|
|
2,765
|
|
—
|
|
2,765
|
|
—
|
|
|||||||||
|
Debt securities held to maturity
|
3,242
|
|
3,218
|
|
—
|
|
3,218
|
|
—
|
|
|||||||||
|
Net loans and leases, including loans held for sale
|
20,917
|
|
20,661
|
|
—
|
|
56
|
|
20,605
|
|
|||||||||
|
Loan servicing rights
|
34
|
|
38
|
|
—
|
|
—
|
|
38
|
|
|||||||||
|
Derivative assets
|
31
|
|
31
|
|
—
|
|
29
|
|
2
|
|
|||||||||
|
Accrued interest receivable
|
94
|
|
94
|
|
94
|
|
—
|
|
—
|
|
|||||||||
|
Financial Liabilities
|
|||||||||||||||||||
|
Deposits
|
22,400
|
|
22,359
|
|
17,779
|
|
4,580
|
|
—
|
|
|||||||||
|
Short-term borrowings
|
3,679
|
|
3,679
|
|
3,679
|
|
—
|
|
—
|
|
|||||||||
|
Long-term borrowings
|
668
|
|
675
|
|
—
|
|
—
|
|
675
|
|
|||||||||
|
Derivative liabilities
|
29
|
|
29
|
|
—
|
|
29
|
|
—
|
|
|||||||||
|
Accrued interest payable
|
12
|
|
12
|
|
12
|
|
—
|
|
—
|
|
|||||||||
156
NOTE 25. PARENT COMPANY FINANCIAL STATEMENTS
The following is condensed financial information of F.N.B. Corporation (parent company only). In this information, the parent company’s investments in subsidiaries are stated at cost plus equity in undistributed earnings of subsidiaries since acquisition. This information should be read in conjunction with the Consolidated Financial Statements.
TABLE 25.1
|
Balance Sheets
(in millions)
December 31
|
2018
|
2017
|
|||||
|
Assets
|
|||||||
|
Cash and cash equivalents
|
$
|
254
|
|
$
|
166
|
|
|
|
Securities available for sale
|
—
|
|
1
|
|
|||
|
Other assets
|
19
|
|
22
|
|
|||
|
Investment in bank subsidiary
|
4,754
|
|
4,554
|
|
|||
|
Investments in and advances to non-bank subsidiaries
|
97
|
|
294
|
|
|||
|
Total Assets
|
$
|
5,124
|
|
$
|
5,037
|
|
|
|
Liabilities
|
|||||||
|
Other liabilities
|
$
|
32
|
|
$
|
33
|
|
|
|
Advances from affiliates
|
197
|
|
306
|
|
|||
|
Long-term borrowings
|
279
|
|
280
|
|
|||
|
Subordinated notes:
|
|||||||
|
Short-term
|
7
|
|
8
|
|
|||
|
Long-term
|
1
|
|
1
|
|
|||
|
Total Liabilities
|
516
|
|
628
|
|
|||
|
Stockholders’ Equity
|
4,608
|
|
4,409
|
|
|||
|
Total Liabilities and Stockholders’ Equity
|
$
|
5,124
|
|
$
|
5,037
|
|
|
157
TABLE 25.2
|
Statements of Income
(in millions)
Year Ended December 31
|
2018
|
2017
|
2016
|
||||||||
|
Income
|
|||||||||||
|
Dividend income from subsidiaries:
|
|||||||||||
|
Bank
|
$
|
162
|
|
$
|
149
|
|
$
|
109
|
|
||
|
Non-bank
|
8
|
|
9
|
|
9
|
|
|||||
|
170
|
|
158
|
|
118
|
|
||||||
|
Interest income
|
4
|
|
5
|
|
5
|
|
|||||
|
Other income
|
5
|
|
—
|
|
3
|
|
|||||
|
Total Income
|
179
|
|
163
|
|
126
|
|
|||||
|
Expenses
|
|||||||||||
|
Interest expense
|
20
|
|
18
|
|
14
|
|
|||||
|
Other expenses
|
15
|
|
10
|
|
10
|
|
|||||
|
Total Expenses
|
35
|
|
28
|
|
24
|
|
|||||
|
Income Before Taxes and Equity in Undistributed Income of Subsidiaries
|
144
|
|
135
|
|
102
|
|
|||||
|
Income tax benefit
|
6
|
|
3
|
|
6
|
|
|||||
|
150
|
|
138
|
|
108
|
|
||||||
|
Equity in undistributed income (loss) of subsidiaries:
|
|||||||||||
|
Bank
|
225
|
|
60
|
|
61
|
|
|||||
|
Non-bank
|
(2
|
)
|
1
|
|
2
|
|
|||||
|
Net Income
|
$
|
373
|
|
$
|
199
|
|
$
|
171
|
|
||
158
TABLE 25.3
|
Statements of Cash Flows
(in millions)
Year Ended December 31
|
2018
|
2017
|
2016
|
||||||||
|
Operating Activities
|
|||||||||||
|
Net income
|
$
|
373
|
|
$
|
199
|
|
$
|
171
|
|
||
|
Adjustments to reconcile net income to net cash flows from operating activities:
|
|||||||||||
|
Undistributed earnings from subsidiaries
|
(222
|
)
|
(61
|
)
|
(63
|
)
|
|||||
|
Other, net
|
(13
|
)
|
6
|
|
(3
|
)
|
|||||
|
Net cash flows provided by operating activities
|
138
|
|
144
|
|
105
|
|
|||||
|
Investing Activities
|
|||||||||||
|
Proceeds from sale of securities available for sale
|
1
|
|
—
|
|
1
|
|
|||||
|
Net (increase) decrease in advances to subsidiaries
|
20
|
|
(10
|
)
|
(6
|
)
|
|||||
|
Payment for further investment in subsidiaries
|
(22
|
)
|
(4
|
)
|
(71
|
)
|
|||||
|
Net cash received in business combinations
|
123
|
|
3
|
|
1
|
|
|||||
|
Net cash flows (used in) provided by investing activities
|
122
|
|
(11
|
)
|
(75
|
)
|
|||||
|
Financing Activities
|
|||||||||||
|
Net decrease in advance from affiliate
|
(19
|
)
|
10
|
|
6
|
|
|||||
|
Net decrease in short-term borrowings
|
(1
|
)
|
—
|
|
—
|
|
|||||
|
Decrease in long-term debt
|
(2
|
)
|
(2
|
)
|
(10
|
)
|
|||||
|
Increase in long-term debt
|
1
|
|
1
|
|
—
|
|
|||||
|
Net proceeds from issuance of common stock
|
14
|
|
11
|
|
18
|
|
|||||
|
Tax benefit of stock-based compensation
|
—
|
|
—
|
|
2
|
|
|||||
|
Cash dividends paid:
|
|||||||||||
|
Preferred stock
|
(8
|
)
|
(8
|
)
|
(8
|
)
|
|||||
|
Common stock
|
(157
|
)
|
(143
|
)
|
(102
|
)
|
|||||
|
Net cash flows (used in) provided by financing activities
|
(172
|
)
|
(131
|
)
|
(94
|
)
|
|||||
|
Net (Decrease) Increase in Cash and Cash Equivalents
|
88
|
|
2
|
|
(64
|
)
|
|||||
|
Cash and cash equivalents at beginning of year
|
166
|
|
164
|
|
228
|
|
|||||
|
Cash and Cash Equivalents at End of Year
|
$
|
254
|
|
$
|
166
|
|
$
|
164
|
|
||
|
Cash paid during the year for:
|
|||||||||||
|
Interest
|
$
|
17
|
|
$
|
16
|
|
$
|
14
|
|
||
159
NOTE 26. QUARTERLY EARNINGS SUMMARY (UNAUDITED)
TABLE 26.1
|
Dollars in millions, except per share data
|
|||||||||||||||
|
Quarter Ended
2018
|
Dec. 31
|
Sept. 30
|
June 30
|
Mar. 31
|
|||||||||||
|
Total interest income
|
$
|
305
|
|
$
|
298
|
|
$
|
294
|
|
$
|
273
|
|
|||
|
Total interest expense
|
73
|
|
63
|
|
55
|
|
47
|
|
|||||||
|
Net interest income
|
232
|
|
235
|
|
239
|
|
226
|
|
|||||||
|
Provision for credit losses
|
15
|
|
16
|
|
16
|
|
14
|
|
|||||||
|
Total non-interest income
|
68
|
|
75
|
|
65
|
|
68
|
|
|||||||
|
Total non-interest expense
|
170
|
|
171
|
|
183
|
|
171
|
|
|||||||
|
Net income
|
100
|
|
101
|
|
85
|
|
87
|
|
|||||||
|
Net income available to common stockholders
|
98
|
|
99
|
|
83
|
|
85
|
|
|||||||
|
Per Common Share
|
|||||||||||||||
|
Basic earnings per share
|
$
|
0.30
|
|
$
|
0.30
|
|
$
|
0.26
|
|
$
|
0.26
|
|
|||
|
Diluted earnings per share
|
0.30
|
|
0.30
|
|
0.26
|
|
0.26
|
|
|||||||
|
Cash dividends declared
|
0.12
|
|
0.12
|
|
0.12
|
|
0.12
|
|
|||||||
|
Quarter Ended
2017
|
|||||||||||||||
|
Total interest income
|
$
|
271
|
|
$
|
263
|
|
$
|
251
|
|
$
|
195
|
|
|||
|
Total interest expense
|
41
|
|
38
|
|
33
|
|
22
|
|
|||||||
|
Net interest income
|
230
|
|
225
|
|
218
|
|
173
|
|
|||||||
|
Provision for credit losses
|
16
|
|
17
|
|
17
|
|
11
|
|
|||||||
|
Net securities gains
|
—
|
|
3
|
|
—
|
|
3
|
|
|||||||
|
Other non-interest income
|
65
|
|
63
|
|
66
|
|
52
|
|
|||||||
|
Total non-interest expense
|
166
|
|
164
|
|
164
|
|
187
|
|
|||||||
|
Net income
|
24
|
|
78
|
|
74
|
|
23
|
|
|||||||
|
Net income available to common stockholders
|
22
|
|
76
|
|
72
|
|
21
|
|
|||||||
|
Per Common Share
|
|||||||||||||||
|
Basic earnings per share
|
$
|
0.07
|
|
$
|
0.23
|
|
$
|
0.22
|
|
$
|
0.09
|
|
|||
|
Diluted earnings per share
|
0.07
|
|
0.23
|
|
0.22
|
|
0.09
|
|
|||||||
|
Cash dividends declared
|
0.12
|
|
0.12
|
|
0.12
|
|
0.12
|
|
|||||||
160
ITEM 9. CHANGES IN AND DISAGREEMENTS WITH ACCOUNTANTS ON ACCOUNTING AND FINANCIAL
DISCLOSURE
NONE.
ITEM 9A. CONTROLS AND PROCEDURES
DISCLOSURE CONTROLS AND PROCEDURES. We maintain disclosure controls and procedures designed to ensure that the information required to be disclosed in the reports that we file or submit under the Securities Exchange Act of 1934, as amended, is recorded, processed, summarized and reported within the time periods specified in the SEC’s rules and forms. Disclosure controls and procedures include, without limitation, controls and procedures designed to ensure that information required to be disclosed by an issuer in the reports that it files or submits under the Securities Exchange Act of 1934 is accumulated and communicated to the issuer’s management, including its principal executive and principal financial officers, or persons performing similar functions, as appropriate to allow timely decisions regarding required disclosure. FNB’s management, with the participation of our Chief Executive Officer and Chief Financial Officer, evaluated the effectiveness of FNB’s disclosure controls and procedures (as defined in Rules 13a-15(e) and 15d-15(e) under the Securities Exchange Act of 1934) as of the end of the period covered by this Report. Based upon such evaluation, our Chief Executive Officer and Chief Financial Officer have concluded that, as of the end of such period, FNB’s disclosure controls and procedures were effective.
INTERNAL CONTROL OVER FINANCIAL REPORTING. Information required by this item is set forth in “Report of Management on F.N.B. Corporation’s Internal Control Over Financial Reporting” and “Report of Independent Registered Public Accounting Firm.”
CHANGES IN INTERNAL CONTROL OVER FINANCIAL REPORTING. There have not been any changes in our internal control over financial reporting (as such term is defined in Rules 13a – 15(f) and 15d –15(f) under the Securities Exchange Act of 1934) during the quarter ended
December 31, 2018
to which this report relates that have materially affected, or are reasonably likely to materially affect, internal control over financial reporting.
ITEM 9B. OTHER INFORMATION
NONE.
PART III
ITEM 10. DIRECTORS, EXECUTIVES OFFICERS AND CORPORATE GOVERNANCE
Information relating to this item is provided in our definitive proxy statement to be filed with the SEC in connection with our annual meeting of stockholders to be held
May 15, 2019
. Such information is incorporated herein by reference. Certain information regarding executive officers is included under the caption “Executive Officers of the Registrant” after Part I, Item 4, of this Report.
ITEM 11. EXECUTIVE COMPENSATION
Information relating to this item is provided in FNB’s definitive proxy statement to be filed with the SEC in connection with our annual meeting of stockholders to be held
May 15, 2019
. Such information is incorporated herein by reference. Neither the Report of the Compensation Committee nor the Report of the Audit Committee shall be deemed filed with the SEC, but shall be deemed furnished to the SEC in this Report, and will not be deemed to be incorporated by reference into any filing under the Securities Act of 1933 or the Exchange Act of 1934, except to the extent that FNB specifically incorporates it by reference.
161
ITEM 12. SECURITY OWNERSHIP OF CERTAIN BENEFICIAL OWNERS AND MANAGEMENT AND
RELATED STOCKHOLDER MATTERS
With the exception of the equity compensation plan information provided below, the information relating to this item is provided in our definitive proxy statement to be filed with the SEC in connection with our annual meeting of stockholders to be held
May 15, 2019
. Such information is incorporated herein by reference.
The following table provides information related to equity compensation plans as of
December 31, 2018
:
|
Plan Category
|
Number of
Securities to be
Issued Upon
Exercise of
Outstanding
Stock Options,
Warrants and
Rights
|
Weighted
Average Exercise
Price of Outstanding
Stock Options,
Warrants and
Rights
|
Number of
Securities
Remaining for
Future Issuance
Under Equity
Compensation Plans
(excluding securities
reflected in column (a))
|
||||||||
|
(a)
|
(b)
|
(c)
|
|||||||||
|
Equity compensation plans approved by security holders
|
2,556,174
|
|
(1)
|
n/a
|
|
2,332,770
|
|
(2)
|
|||
|
Equity compensation plans not approved by security holders
|
458,354
|
|
(3)
|
$
|
7.99
|
|
n/a
|
|
|||
|
(1)
|
Restricted common stock awards subject to forfeiture. The shares of restricted stock vest over periods ranging from three to five years from the award date.
|
|
(2)
|
Represents shares of common stock registered with the SEC which are eligible for issuance pursuant to stock option or restricted stock awards granted under various plans.
|
|
(3)
|
Represents the securities to be issued upon exercise of stock options that we assumed in various acquisitions. We do not intend to grant any new awards under these plans.
|
ITEM 13. CERTAIN RELATIONSHIPS AND RELATED TRANSACTIONS, AND DIRECTOR INDEPENDENCE
Information relating to this item is provided in our definitive proxy statement to be filed with the SEC in connection with our annual meeting of stockholders to be held
May 15, 2019
. Such information is incorporated herein by reference.
ITEM 14. PRINCIPAL ACCOUNTING FEES AND SERVICES
Information relating to this item is provided in our definitive proxy statement to be filed with the SEC in connection with our annual meeting of stockholders to be held
May 15, 2019
. Such information is incorporated herein by reference.
162
PART IV
ITEM 15.
EXHIBITS, FINANCIAL STATEMENT SCHEDULES
|
(a)
|
FINANCIAL STATEMENTS
|
The Consolidated Financial Statements of F.N.B. Corporation and subsidiaries required in response to this item are incorporated by reference to Item 8 of this Report.
|
(b)
|
EXHIBITS
|
The following exhibits are filed or incorporated by reference as part of this report:
|
Exhibit Number
|
Description
|
|
|
2.1.
|
||
|
2.2.
|
||
|
2.3.
|
||
|
2.4.
|
||
|
3.1.
|
||
|
3.2.
|
||
|
4.1.
|
||
|
4.2.
|
||
|
4.3.
|
||
|
4.4.
|
||
|
4.5.
|
||
|
4.6.
|
||
|
4.7.
|
||
|
4.8.
|
There are no instruments with respect to long-term debt of FNB and its subsidiaries that involve securities authorized under the instrument in an amount exceeding 10 percent of the total assets of FNB and its subsidiaries on a consolidated basis. FNB agrees to provide the SEC with a copy of instruments defining the rights of holders of long-term debt of FNB and its subsidiaries upon request.
|
|
163
|
Exhibit Number
|
Description
|
|
|
10.1. (P)
|
Form of Deferred Compensation Agreement by and between First National Bank of Pennsylvania and four of our executive officers. (Incorporated by reference to Exhibit 10.3. of FNB’s Annual Report on Form 10-K for the fiscal year ended December 31, 1993 (File No. 000-08144)). *
|
|
|
10.2.
|
||
|
10.3.
|
||
|
10.4. (P)
|
Basic Retirement Plan (formerly the Supplemental Executive Retirement Plan) of F.N.B. Corporation effective January 1, 1992. (Incorporated by reference to Exhibit 10.9. of FNB’s Annual Report on Form 10-K for the fiscal year ended December 31, 1993 (File No. 000-08144)). *
|
|
|
10.5.
|
||
|
10.6.
|
||
|
10.7.
|
||
|
10.8.
|
||
|
10.9.
|
||
|
10.10.
|
||
|
10.11.
|
||
|
10.12.
|
||
|
10.13.
|
||
|
10.14.
|
||
|
10.15.
|
||
|
10.16.
|
||
|
14.
|
||
|
21.
|
||
|
23.
|
||
|
31.1.
|
||
|
31.2.
|
||
|
32.1.
|
||
|
32.2.
|
||
164
|
Exhibit Number
|
Description
|
|
|
101.
|
The following materials from F.N.B. Corporation’s Annual Report on Form 10-K for the period ended December 31, 2018, formatted in XBRL: (i) the Consolidated Balance Sheets, (ii) the Consolidated Statements of Income, (iii) the Consolidated Statements of Comprehensive Income, (iv) the Consolidated Statements of Stockholders’ Equity, (v) the Consolidated Statements of Cash Flows and (vi) the Notes to Consolidated Financial Statements. (filed herewith).
|
|
|
*
|
Management contracts and compensatory plans or arrangements required to be filed as exhibits pursuant to Item 15(a)(3) of this Report.
|
|
|
(c)
|
SCHEDULES
|
No financial statement schedules are being filed because of the absence of conditions under which they are required or because the required information is included in the Consolidated Financial Statements and related notes thereto.
ITEM 16.
FORM 10-K SUMMARY
Not Applicable.
165
SIGNATURES
Pursuant to the requirements of Section 13 or 15(d) of the Securities Exchange Act of 1934, the registrant has duly caused this report to be signed on its behalf by the undersigned, thereunto duly authorized.
|
|
F.N.B. CORPORATION
|
|
|
By
|
/s/ Vincent J. Delie, Jr.
|
|
|
Vincent J. Delie, Jr.
|
||
|
Chairman, President and Chief Executive Officer
|
||
Pursuant to the requirements of the Securities Exchange Act of 1934, this report has been signed below by the following persons on behalf of the registrant and in the capacities and on the dates indicated.
|
/s/ Vincent J. Delie, Jr.
|
Chairman, President and Chief Executive Officer
|
February 26, 2019
|
|
Vincent J. Delie, Jr.
|
(Principal Executive Officer)
|
|
|
/s/ Vincent J. Calabrese, Jr.
|
Chief Financial Officer
|
February 26, 2019
|
|
Vincent J. Calabrese, Jr.
|
(Principal Financial Officer)
|
|
|
/s/ James L. Dutey
|
Corporate Controller and Senior Vice President
|
February 26, 2019
|
|
James L. Dutey
|
(Principal Accounting Officer)
|
|
|
/s/ Pamela A. Bena
|
Director
|
February 26, 2019
|
|
Pamela A. Bena
|
||
|
/s/ William B. Campbell
|
Director
|
February 26, 2019
|
|
William B. Campbell
|
||
|
/s/ James D. Chiafullo
|
Director
|
February 26, 2019
|
|
James D. Chiafullo
|
||
|
/s/ Mary Jo Dively
|
Director
|
February 26, 2019
|
|
Mary Jo Dively
|
||
|
/s/ Stephen J. Gurgovits
|
Director
|
February 26, 2019
|
|
Stephen J. Gurgovits
|
||
|
/s/ Robert A. Hormell
|
Director
|
February 26, 2019
|
|
Robert A. Hormell
|
||
|
/s/ David J. Malone
|
Director
|
February 26, 2019
|
|
David J. Malone
|
||
|
/s/ Frank C. Mencini
|
Director
|
February 26, 2019
|
|
Frank C. Mencini
|
||
166
|
/s/ David L. Motley
|
Director
|
February 26, 2019
|
|
David L. Motley
|
||
|
/s/ Heidi A. Nicholas
|
Director
|
February 26, 2019
|
|
Heidi A. Nicholas
|
||
|
/s/ John S. Stanik
|
Director
|
February 26, 2019
|
|
John S. Stanik
|
||
|
/s/ William J. Strimbu
|
Director
|
February 26, 2019
|
|
William J. Strimbu
|
||
167
TABLE OF CONTENTS
Part IItem 1. BusinessItem 1A. Risk FactorsItem 1B. Unresolved Staff CommentsItem 2. PropertiesItem 3. Legal ProceedingsItem 4. Mine Safety DisclosuresPart IIItem 5. Market For Registrant S Common Equity, Related Stockholder Matters andItem 6. Selected Financial DataItem 7. Management S Discussion and Analysis Of Financial Condition and Results OfItem 7A. Quantitative and Qualitative Disclosures About Market RiskItem 8. Financial Statements and Supplementary DataNote 1. Summary Of Significant Accounting PoliciesNote 2. New Accounting StandardsNote 3. Mergers and AcquisitionsNote 4. SecuritiesNote 5. Other SecuritiesNote 6. Loans and LeasesNote 7. Allowance For Credit LossesNote 8. Loan ServicingNote 9. Premises and EquipmentNote 10. Goodwill and Other Intangible AssetsNote 11. DepositsNote 12. Short-term BorrowingsNote 13. Long-term BorrowingsNote 14. Derivative Instruments and Hedging ActivitiesNote 15. Commitments, Credit Risk and ContingenciesNote 16. Stock Incentive PlansNote 17. Retirement PlansNote 18. Income TaxesNote 19. Other Comprehensive IncomeNote 20. Earnings Per Common ShareNote 21. Regulatory MattersNote 22. Cash Flow InformationNote 23. Business SegmentsNote 24. Fair Value MeasurementsNote 25. Parent Company Financial StatementsNote 26. Quarterly Earnings Summary (unaudited)Item 9. Changes in and Disagreements with Accountants on Accounting and FinancialItem 9A. Controls and ProceduresItem 9B. Other InformationPart IIIItem 10. Directors, Executives Officers and Corporate GovernanceItem 11. Executive CompensationItem 12. Security Ownership Of Certain Beneficial Owners and Management andItem 13. Certain Relationships and Related Transactions, and Director IndependenceItem 14. Principal Accounting Fees and ServicesPart IVItem 15. Exhibits, Financial Statement SchedulesItem 16. Form 10-k Summary