FIRST BANCORP, INC /ME/
10-Ks and 10-Qs
|
|
|
|
|
|
|
|
|
|
|
|
|
|
|
|
|
|
|
|
|
|
|
|
|
|
|
|
|
|
|
|
|
|
|
|
|
|
|
|
|
|
|
|
|
|
|
|
|
|
|
|
|
|
|
|
|
|
|
UNITED STATES SECURITIES AND EXCHANGE COMMISSION
WASHINGTON, DC 20549
FORM 10-K
[X] Annual Report Pursuant to Section 13 or 15(d) of The Securities Exchange Act of 1934
For the Fiscal Year ended December 31, 2010
Commission File Number 0-26589
THE FIRST BANCORP, INC.
(Exact name of Registrant as specified in its charter)
|
MAINE
|
01-0404322
|
|
(State or other jurisdiction of incorporation or organization)
|
(I.R.S. Employer Identification No.)
|
|
MAIN STREET, DAMARISCOTTA, MAINE
|
04543
|
|
(Address of principal executive offices)
|
(Zip code)
|
(207) 563-3195
Registrant’s telephone number, including area code
Securities registered pursuant to Section 12(g) of the Act:
Common Stock
Indicate by check mark if the registrant is a well-known seasoned issuer, as defined in Rule 405 of the Securities Act.
Yes [_] No [X]
Indicate by check mark if the registrant is not required to file reports pursuant to Section 13 or Section 15(d) of the Act.
Yes [_] No [X]
Indicate by check mark whether the registrant (1) has filed all reports required to be filed by Section 13 or 15(d) of the Securities Exchange Act of 1934 during the preceding 12 months (or for such shorter period that the registrant was required to file such reports), and (2) has been subject to such filing requirements for the past 90 days.
Yes [X] No[_]
Indicate by check mark if disclosure of delinquent filers pursuant to Item 405 of Regulation S-K (§ 229.405 of this chapter) is not contained herein, and will not be contained, to the best of registrant’s knowledge, in definitive proxy or information statements incorporated by reference in Part III of this Form 10-K or any amendment to this Form 10-K.
[_]
Indicate by check mark whether the registrant is a large accelerated filer, an accelerated filer, or a non-accelerated filer. See definition of “accelerated filer and large accelerated filer” in Rule 12b-2 of the Exchange Act. (Check one):
Large accelerated filer [_] Accelerated filer [X] Non-accelerated filer [_]
Indicate by check mark whether the registrant is a shell company (as defined in Rule 12b-2 of the Act).
Yes [_] No [X]
State the aggregate market value of the voting and non-voting common equity held by non-affiliates computed by reference to the price at which the common equity was last sold, or the average bid and asked price of such common equity, as of the last business day of the registrant’s most recently completed second fiscal quarter.
Common Stock: $115,823,000
Indicate the number of shares outstanding of each of the registrant’s classes of common stock as of March 9, 2011
Common Stock: 9,786,300 shares
Table of Contents
|
1
|
|
|
8
|
|
|
15
|
|
|
15
|
|
|
15
|
|
|
15
|
|
|
16
|
|
|
18
|
|
|
19
|
|
|
45
|
|
|
47
|
|
|
87
|
|
|
87
|
|
|
88
|
|
|
88
|
|
|
88
|
|
|
88
|
|
|
88
|
|
|
89
|
|
|
89
|
|
|
91
|
|
The First Bancorp, Inc. (the “Company”) was incorporated under the laws of the State of Maine on January 15, 1985, for the purpose of becoming the parent holding company of The First National Bank of Damariscotta, which was chartered as a national bank under the laws of the United States on May 30, 1864. At the Company’s Annual Meeting of Shareholders on April 30, 2008, the Company’s name was changed from First National Lincoln Corporation to The First Bancorp, Inc. On January 14, 2005, the acquisition of FNB Bankshares (“FNB”) of Bar Harbor, Maine, was completed, adding seven banking offices and one investment management office in Hancock and Washington counties of Maine. FNB’s subsidiary, The First National Bank of Bar Harbor, was merged into The First National Bank of Damariscotta at closing, and since January 31, 2005, the combined banks have operated under a new name: The First, N.A. (the “Bank”).
As of December 31, 2010, the Company’s securities consisted of one class of common stock, one class of preferred stock, and warrants to purchase common stock. At that date, there were 9,773,025 shares of common stock outstanding. In addition, there were 25,000 shares of cumulative perpetual preferred stock outstanding with a preference value of $1,000 per share, all of which were issued to the U.S. Treasury under its Capital Purchase Program (the “CPP Shares”). Incident to the issuance of the CPP Shares, the Company issued to the U.S. Treasury warrants to purchase up to 225,904 shares of the Company’s common stock at a price per share of $16.60 (the “Warrants”). The CPP Shares and the Warrants (and any shares of common stock issuable pursuant to the Warrants) are freely transferable by the U.S. Treasury to third parties and the Company has filed a registration statement with the Securities and Exchange Commission to allow for possible resale of such securities.
The common stock and preferred stock of the Bank are the principal assets of the Company, which has no other subsidiaries. The Bank’s capital stock consists of one class of common stock of which 120,000 shares, par value $2.50 per share, are authorized and outstanding, and one class of non-cumulative perpetual preferred stock, $1,000 preference value, of which 25,000 shares are authorized and outstanding. All of the Bank’s common stock and preferred stock is owned by the Company.
The Bank emphasizes personal service, and customers are primarily small businesses and individuals for whom the Bank offers a wide variety of services, including deposit accounts, consumer and commercial and mortgage loans. The Bank has not made any material changes in its mode of conducting business during the past five years. The banking business in the Bank’s market area is seasonal with lower deposits in the winter and spring and higher deposits in the summer and fall. This swing is predictable and has not had a materially adverse effect on the Bank.
In addition to traditional banking services, the Company provides investment management and private banking services through First Advisors, which is an operating division of the Bank. First Advisors is focused on taking advantage of opportunities created as the larger banks have altered their personal service commitment to clients not meeting established account criteria. First Advisors is able to offer a comprehensive array of private banking, financial planning, investment management and trust services to individuals, businesses, non-profit organizations and municipalities of varying asset size, and to provide the highest level of personal service. The staff includes investment and trust professionals with extensive experience.
The financial services landscape has changed considerably over the past five years in the Bank’s primary market area. Two large out-of-state banks have continued to experience local change as a result of mergers and acquisitions at the regional and national level. Credit unions have continued to expand their membership and the scope of banking services offered. Non-banking entities such as brokerage houses, mortgage companies and insurance companies are offering very competitive products. Many of these entities and institutions have resources substantially greater than those available to the Bank and are not subject to the same regulatory restrictions as the Company and the Bank.
The Company believes that there will continue to be a need for a bank in the Bank’s primary market area with local management having decision-making power and emphasizing loans to small and medium-sized businesses and to individuals. The Bank has concentrated on extending business loans to such customers in the Bank’s primary market area and to extending investment and trust services to clients with accounts of all sizes. The Bank’s Management also makes decisions based upon, among other things, the knowledge of the Bank’s employees regarding the communities and customers in the Bank’s primary market area. The individuals employed by the Bank, to a large extent, reside near
the branch offices and thus are generally familiar with their communities and customers. This is important in local decision-making and allows the Bank to respond to customer questions and concerns on a timely basis and fosters quality customer service.
The Bank has worked and will continue to work to position itself to be competitive in its market area. The Bank’s ability to make decisions close to the marketplace, Management’s commitment to providing quality banking products, the caliber of the professional staff, and the community involvement of the Bank’s employees are all factors affecting the Bank’s ability to be competitive.
The First Bancorp 2010 Form 10-K
Page 1
Supervision and Regulation
The Company is a financial holding company within the meaning of the Bank Holding Company Act of 1956, as amended (the “Act”), and section 225.82 of Regulation Y issued by the Board of Governors of the Federal Reserve System (the “Federal Reserve Board”), and is required to file with the Federal Reserve Board an annual report and other information required pursuant to the Act. The Company is subject to examination by the Federal Reserve Board.
The Act requires the prior approval of the Federal Reserve Board for a financial holding company to acquire or hold more than a 5% voting interest in any bank, and controls interstate banking activities. The Act restricts The First Bancorp’s non-banking activities to those which are determined by the Federal Reserve Board to be closely related to banking. The Act does not place territorial restrictions on the activities of non-bank subsidiaries of financial holding companies. Virtually all of the Company’s cash revenues are generally derived from dividends paid to the Company by the Bank. These dividends are subject to various legal and regulatory restrictions which are summarized in Note 17 to the accompanying financial statements. The Bank is regulated by the Office of the Comptroller of the Currency (“OCC”) and is subject to the provisions of the National Bank Act. As a result, it must meet certain liquidity and capital requirements, which are discussed in the following sections.
Dodd-Frank Wall Street Reform and Consumer Protection Act
The Dodd-Frank Wall Street Reform and Consumer Protection Act of 2010 (the “Act”) was enacted on July 21, 2010. The Act creates a new Consumer Financial Protection Bureau with power to promulgate and enforce consumer protection laws. Smaller institutions, those with $10 billion or less in assets, will be subject to the Consumer Financial Protection Bureau’s rule-writing authority, and existing depository institution regulatory agencies will retain examination and enforcement authority for such institutions. The Act also establishes a Financial Stability Oversight Council chaired by the Secretary of the Treasury with authority to identify institutions and practices that might pose a systemic risk and, among other things, includes provisions affecting (1) corporate governance and executive compensation of all companies whose securities are registered with the SEC, (2) FDIC insurance assessments, (3) interchange fees for debit cards, which would be set by the Federal Reserve under a restrictive “reasonable and proportional cost” per transaction standard, (4) minimum capital levels for bank holding companies, subject to a grandfather clause for financial institutions with less than $15 billion in assets, (5) derivative and proprietary trading by financial institutions, and (6) the resolution of large financial institutions. At this time, it is difficult to predict the extent to which the Act or the resulting regulations may adversely impact us. However, compliance with these new laws and regulations may increase our costs, limit our ability to pursue attractive business opportunities, cause us to modify our strategies and business operations and increase our capital requirements and constraints, any of which may have a material adverse impact on our business, financial condition, liquidity or results of operations.
Customer Information Security
The Federal Deposit Insurance Corporation (“FDIC”), the OCC and other bank regulatory agencies have published guidelines (the “Guidelines”) establishing standards for safeguarding nonpublic personal information about customers that implement provisions of the Graham-Leach-Bliley Act (the “GLBA”). Among other things, the Guidelines require each financial institution, under the supervision and ongoing oversight of its Board of Directors or an appropriate committee thereof, to develop, implement and maintain a comprehensive written information security program designed to ensure the security and confidentiality of customer information, to protect against any anticipated threats or hazards to the security or integrity of such information, and to protect against unauthorized access to or use of such information that could result in substantial harm or inconvenience to any customer.
Privacy
The FDIC, the OCC and other regulatory agencies have published privacy rules pursuant to provisions of the GLBA (“Privacy Rules”). The Privacy Rules, which govern the treatment of nonpublic personal information about consumers by financial institutions, require a financial institution to provide notice to customers (and other consumers in some circumstances) about its privacy policies and practices, describe the conditions under which a financial institution may disclose nonpublic personal information to nonaffiliated third parties, and provide a method for consumers to prevent a financial institution from disclosing that information to most nonaffiliated third parties by “opting-out” of that disclosure, subject to certain exceptions.
The First Bancorp 2010 Form 10-K
Page 2
USA Patriot Act
The USA Patriot Act of 2001, designed to deny terrorists and others the ability to obtain anonymous access to the U.S. financial system, has significant implications for depository institutions, broker-dealers and other businesses involved in the transfer of money. The USA Patriot Act, together with the implementing regulations of various federal regulatory agencies, have caused financial institutions, including the Bank, to adopt and implement additional or amend existing policies and procedures with respect to, among other things, anti-money laundering compliance, suspicious activity and currency transaction reporting, customer identity verification and customer risk analysis. The statute and its underlying regulations also permit information sharing for counter-terrorist purposes between federal law enforcement agencies and financial institutions, as well as among financial institutions, subject to certain conditions, and require the Federal Reserve Board (and other federal banking agencies) to evaluate the effectiveness of an applicant in combating money laundering activities when considering applications filed under Section 3 of the Act or under the Bank Merger Act.
The Sarbanes-Oxley Act
The Sarbanes-Oxley Act of 2002 (“SOX”) implements a broad range of corporate governance and accounting measures for public companies (including publicly-held bank holding companies such as the Company) designed to promote honesty and transparency in corporate America and better protect investors from the type of corporate wrongdoings that occurred at Enron and WorldCom, among other companies. SOX’s principal provisions, many of which have been implemented through regulations released and policies and rules adopted by the securities exchanges in 2003 and 2004, provide for and include, among other things:
|
·
|
The creation of an independent accounting oversight board;
|
|
·
|
Auditor independence provisions which restrict non-audit services that accountants may provide to clients;
|
|
·
|
Additional corporate governance and responsibility measures, including the requirement that the chief executive officer and chief financial officer of a public company certify financial statements;
|
|
·
|
The forfeiture of bonuses or other incentive-based compensation and profits from the sale of an issuer’s securities by directors and senior officers in the twelve-month period following initial publication of any financial statements that later require restatement;
|
|
·
|
An increase in the oversight of, and enhancement of certain requirements relating to, audit committees of public companies and how they interact with the public company’s independent auditors;
|
|
·
|
Requirements that audit committee members must be independent and are barred from accepting consulting, advisory or other compensatory fees from the issuer;
|
|
·
|
Requirements that companies disclose whether at least one member of the audit committee is a ‘financial expert’ (as such term is defined by the Securities and Exchange Commission (“SEC”) ) and if not, why not;
|
|
·
|
Expanded disclosure requirements for corporate insiders, including accelerated reporting of stock transactions by insiders and a prohibition on insider trading during pension blackout periods;
|
|
·
|
A prohibition on personal loans to directors and officers, except certain loans made by insured financial institutions, such as the Bank, on nonpreferential terms and in compliance with bank regulatory requirements;
|
|
·
|
Disclosure of a code of ethics and filing a Form 8-K in the event of a change or waiver of such code; and
|
|
·
|
A range of enhanced penalties for fraud and other violations.
|
The Company complies with the provisions of SOX and its underlying regulations. Management believes that such compliance efforts have strengthened the Company’s overall corporate governance structure and does not expect that such compliance has to date had, or will in the future have, a material impact on the Company’s results of operations or financial condition.
Capital Requirements
The OCC has established guidelines with respect to the maintenance of appropriate levels of capital by FDIC-insured banks. The Federal Reserve Board has established substantially identical guidelines with respect to the maintenance of appropriate levels of capital, on a consolidated basis, by bank holding companies. If a banking organization’s capital levels fall below the minimum requirements established by such guidelines, a bank or bank holding company will be expected to develop and implement a plan acceptable to the FDIC or the Federal Reserve Board, respectively, to achieve adequate levels of capital within a reasonable period, and may be denied approval to acquire or establish additional banks or non-bank businesses, merge with other institutions or open branch facilities until such capital levels are achieved. Federal regulations require federal bank regulators to take “prompt corrective action” with respect to insured depository institutions that fail to satisfy minimum capital requirements and imposes significant restrictions on such institutions. See “Prompt Corrective Action” below.
The First Bancorp 2010 Form 10-K
Page 3
Leverage Capital Ratio
The regulations of the OCC require national banks to maintain a minimum “Leverage Capital Ratio” or “Tier 1 Capital” (as defined in the Risk-Based Capital Guidelines discussed in the following paragraphs) to Total Assets of 4.0%. Any bank experiencing or anticipating significant growth is expected to maintain capital well above the minimum levels. The Federal Reserve Board’s guidelines impose substantially similar leverage capital requirements on bank holding companies on a consolidated basis. It is possible that banking regulators may increase minimum capital requirements for banks should the current economic situation persist or worsen.
Risk-Based Capital Requirements
OCC regulations also require national banks to maintain minimum capital levels as a percentage of a bank’s risk-adjusted assets. A bank’s qualifying total capital (“Total Capital”) for this purpose may include two components: “Core” (Tier 1) Capital and “Supplementary” (Tier 2) Capital. Core Capital consists primarily of common stockholders’ equity, which generally includes common stock, related surplus and retained earnings, certain non-cumulative perpetual preferred stock and related surplus, and minority interests in the equity accounts of consolidated subsidiaries, and (subject to certain limitations) mortgage servicing rights and purchased credit card relationships, less all other intangible assets (primarily goodwill). Supplementary Capital elements include, subject to certain limitations, a portion of the allowance for loan losses, perpetual preferred stock that does not qualify for inclusion in Tier 1 capital, long-term preferred stock with an original maturity of at least 20 years and related surplus, certain forms of perpetual debt and mandatory convertible securities, and certain forms of subordinated debt and intermediate-term preferred stock.
The risk-based capital rules assign a bank’s balance sheet assets and the credit equivalent amounts of the bank’s off-balance sheet obligations to one of four risk categories, weighted at 0%, 20%, 50% or 100%, as applicable. Applying these risk-weights to each category of the bank’s balance sheet assets and to the credit equivalent amounts of the bank’s off-balance sheet obligations and summing the totals results in the amount of the bank’s total Risk-Adjusted Assets for purposes of the risk-based capital requirements. Risk-Adjusted Assets can either exceed or be less than reported balance sheet assets, depending on the risk profile of the banking organization. Risk-Adjusted Assets for institutions such as the Bank will generally be less than reported balance sheet assets because its retail banking activities include proportionally more residential mortgage loans, many of its investment securities have a low risk weighting and there is a relatively small volume of off-balance sheet obligations.
The risk-based capital regulations require all banks to maintain a minimum ratio of Total Capital to Risk-Adjusted Assets of 8.0%, of which at least one-half (4.0%) must be Core (Tier 1) Capital. For the purpose of calculating these ratios: (i) a banking organization’s Supplementary Capital eligible for inclusion in Total Capital is limited to no more than 100% of Core Capital; and (ii) the aggregate amount of certain types of Supplementary Capital eligible for inclusion in Total Capital is further limited. For example, the regulations limit the portion of the allowance for loan losses eligible for inclusion in Total Capital to 1.25% of Risk-Adjusted Assets. The Federal Reserve Board has established substantially identical risk-based capital requirements, which are applied to bank holding companies on a consolidated basis. The risk-based capital regulations explicitly provide for the consideration of interest rate risk in the overall evaluation of a bank’s capital adequacy to ensure that banks effectively measure and monitor their interest rate risk, and that they maintain capital adequate for that risk. A bank deemed by its federal banking regulator to have excessive interest rate risk exposure may be required to maintain additional capital (that is, capital in excess of the minimum ratios discussed above). The Bank believes, based on its level of interest rate risk exposure, that this provision will not have a material adverse effect on it.
On January 9, 2009, the Company received $25 million from the issuance of the CPP Shares at a purchase price of $1,000 per share. The CPP Shares call for cumulative dividends at a rate of 5.0% per year for the first five years, and at a rate of 9.0% per year in following years, payable quarterly in arrears on February 15, May 15, August 15 and November 15 of each year. Incident to such issuance, the Company issued to the U.S. Treasury warrants to purchase up to 225,904 shares of the Company’s common stock at a price per share of $16.60 (subject to adjustment). The CPP Shares and the related Warrants (and any shares of common stock issuable pursuant to the Warrants) are freely transferable by the U.S. Treasury to third parties and the Company has filed a registration statement with the SEC to allow for possible resale of such securities. The CPP Shares qualify as Tier 1 capital on the Company’s books for regulatory purposes and rank senior to the Company’s common stock and senior or at an equal level in the Company’s capital structure to any other shares of preferred stock the Company may issue in the future. The Company may redeem the CPP Shares at any time using any funds available to the Company, and any redemption would be subject to the prior approval of the Federal Reserve Bank of Boston. The minimum amount that may be redeemed is 25% of the original CPP investment. The CPP Shares are “perpetual” preferred stock, which means that neither the U.S. Treasury nor any subsequent holder would have a right to require that the Company redeem any of the shares.
On December 31, 2010, the Company’s consolidated Total and Tier 1 Risk-Based Capital Ratios were 16.23% and 14.97%, respectively, and its Leverage Capital Ratio was 9.30%. Based on the above figures and accompanying discussion, the Company exceeds all regulatory capital requirements and is considered well capitalized.
The First Bancorp 2010 Form 10-K
Page 4
Prompt Corrective Action
The Federal Deposit Insurance Corporation Improvement Act of 1991 (“FDICIA”) requires, among other things, that the federal banking regulators take “prompt corrective action” with respect to, and imposes significant restrictions on, any bank that fails to satisfy its applicable minimum capital requirements. FDICIA establishes five capital categories consisting of “well capitalized,” “adequately capitalized,” “undercapitalized,” “significantly undercapitalized” and “critically undercapitalized.” Under applicable regulations, a bank that has a Total Risk-Based Capital Ratio of 10.0% or greater, a Tier 1 Risk-Based Capital Ratio of 6.0% or greater and a Leverage Capital Ratio of 5.0% or greater, and is not subject to any written agreement, order, capital directive or prompt corrective action directive to meet and maintain a specific capital level for any capital measure is deemed to be “well capitalized.” A bank that has a Total Risk-Based Capital Ratio of 8.0% or greater, a Tier 1 Risk-Based Capital Ratio of 4.0% or greater and a Leverage Capital Ratio of 4.0% (or 3% for banks with the highest regulatory examination rating that are not experiencing or anticipating
significant growth or expansion) or greater and does not meet the definition of a well-capitalized bank is considered to
be “adequately capitalized.” A bank that has a Total Risk-Based Capital Ratio of less than 8.0% or has a Tier 1 Risk-Based Capital Ratio that is less than 4.0%, except as noted above, or a Leverage Capital Ratio of less than 4.0% is considered “undercapitalized.” A bank that has a Total Risk-Based Capital Ratio of less than 6.0%, or a Tier 1 Risk-Based Capital Ratio that is less than 3.0% or a Leverage Capital Ratio that is less than 3.0% is considered to be “significantly undercapitalized,” and a bank that has a ratio of tangible equity to total assets equal to or less than 2% is deemed to be “critically undercapitalized.” A bank may be deemed to be in a capital category lower than is indicated by its actual capital position if it is determined to be in an unsafe or unsound condition or receives an unsatisfactory examination rating. FDICIA generally prohibits a bank from making capital distributions (including payment of dividends) or paying management fees to controlling stockholders or their affiliates if, after such payment, the bank would be undercapitalized.
Under FDICIA and the applicable implementing regulations, an undercapitalized bank will be (i) subject to increased monitoring by its primary federal banking regulator; (ii) required to submit to its primary federal banking regulator an acceptable capital restoration plan (guaranteed, subject to certain limits, by the bank’s holding company) within 45 days of being classified as undercapitalized; (iii) subject to strict asset growth limitations; and (iv) required to obtain prior regulatory approval for certain acquisitions, transactions not in the ordinary course of business, and entries into new lines of business. In addition to the foregoing, the primary federal banking regulator may issue a “prompt corrective action directive” to any undercapitalized institution. Such a directive may (i) require sale or re-capitalization of the bank, (ii) impose additional restrictions on transactions between the bank and its affiliates, (iii) limit interest rates paid by the bank on deposits, (iv) limit asset growth and other activities, (v) require divestiture of subsidiaries, (vi) require replacement of directors and officers, and (vii) restrict capital distributions by the bank’s parent holding company. In addition to the foregoing, a significantly undercapitalized institution may not award bonuses or increases in compensation to its senior executive officers until it has submitted an acceptable capital restoration plan and received approval from its primary federal banking regulator.
No later than 90 days after an institution becomes critically undercapitalized, the primary federal banking regulator for the institution must appoint a receiver or, with the concurrence of the FDIC, a conservator, unless the agency, with the concurrence of the FDIC, determines that the purpose of the prompt corrective action provisions would be better served by another course of action. FDICIA requires that any alternative determination be “documented” and reassessed on a periodic basis. Notwithstanding the foregoing, a receiver must be appointed after 270 days unless the appropriate federal banking agency and the FDIC certify that the institution is viable and not expected to fail.
Deposit Insurance Assessments
The Bank’s deposits are insured by the Bank Insurance Fund of the FDIC to the current legal maximum of $250,000 generally for each insured depositor. Non-interest bearing checking accounts have unlimited coverage. The Federal Deposit Insurance Act, as amended by the Federal Deposit Insurance Reform Act of 2005, provides that the FDIC shall set deposit insurance assessment rates. In 2006, the former Bank Insurance Fund merged with the Savings Association Insurance Fund to create the Deposit Insurance Fund, or DIF. The Act eliminated the requirement that the FDIC set deposit insurance assessment rates on a semi-annual basis at a level sufficient to increase the ratio of BIF reserves to BIF-insured deposits to at least 1.25%. Under the Act, the FDIC annually sets the designated reserve ratio (DRR) of DIF reserves to DIF-insured deposits between 1.15% and 1.50%, subject to public comment, based on appropriate considerations including risk of losses and economic conditions such that the ratio would increase during favorable economic conditions and decrease during less favorable conditions, thus avoiding sharp swings in assessment rates.
Past bank failures and reserves against future failures lowered the FDIC insurance fund. To keep the fund from falling to a level that could undermine public confidence, there was a one-time special insurance premium charged to all FDIC-insured banks of 0.05% on each insured depository institution’s total assets minus Tier 1 capital as of June 30, 2009. To ensure that the reserve ratio returns to target levels within the statutorily mandated period of time, in 2009 the FDIC Board took the following steps:
The First Bancorp 2010 Form 10-K
Page 5
|
·
|
Extend to eight years the Amended Restoration Plan to raise the Deposit Insurance Fund reserve ratio to 1.15 percent.
|
|
·
|
Require all institutions to prepay, on December 30, 2009, their estimated risk-based assessments for the fourth quarter of 2009 and for all of 2010, 2011, and 2012, at the same time that institutions pay their regular quarterly deposit insurance assessments for the third quarter of 2009. An institution would initially account for the prepaid assessments as a prepaid expense and amortize this amount over a three-year period.
|
In December 2010, the FDIC Board adopted a final rule establishing the long-term Designated Reserve Ratio at 2.00% of insured deposits. In February 2011, the FDIC Board approved a final rule that changed the assessment base from domestic deposits to average assets minus average tangible equity, adopted a new large-bank pricing assessment scheme, and set a target size for the Deposit Insurance Fund. The changes will go into effect beginning with the second quarter of 2011 and will be payable at the end of September of 2011.
The rule also implements a lower assessment rate schedule when the fund reaches 1.15 percent (so that the average rate over time should be about 8.5 basis points) and, in lieu of dividends, provides for a lower rate schedule when the reserve ratio reaches 2 percent and 2.5 percent. The rule defines tangible equity as Tier 1 capital. The rule requires banks under $1 billion in assets to report average weekly balances during the calendar quarter, unless they elect to report daily averages.
The rule lowers overall assessment rates in order to generate the same approximate amount of revenue under the new larger base as was raised under the old base. The assessment rates in total would be between 2.5 and 9 basis points on the broader base for banks in the lowest risk category, and 30 to 45 basis points for banks in the highest risk category. The FDIC noted that while the rule is overall revenue neutral, it would, in aggregate, increase the share of assessments paid by large institutions, consistent with the express intent of Congress. Based on September 30, 2010, data, the FDIC said that the share of overall dollar assessments paid to FDIC would increase from 70 to 79 percent for banks over $10 billion and from 48 percent to 57 percent for banks over with assets over $100 billion. The FDIC also acknowledged that “many large institutions would experience a significant change in their overall assessment.” The FDIC reported that, under the combined effect of both the assessment base change and the new large bank risk-based formula, 51 banks with assets over $10 billion would pay more and 59 would pay less. The FDIC also noted that only 84 banks with assets under $10 billion would pay higher assessments.
The final rule also creates a scorecard-based assessment system for banks with more than $10 billion in assets. The scorecards include financial measures that the FDIC believes are predictive of long-term performance. In a change from the earlier proposals, the brokered deposit adjustment will not apply to banks over $10 billion that are well-capitalized and CAMELS 1 or 2, consistent with the treatment for smaller banks. Also, the “noncore funding to total liabilities” ratio is eliminated from the loss severity score and the liability run-off rates have been recalibrated. The FDIC will consider changes in the brokered deposit adjustment after completing a study on brokered deposits due in July 2011, as mandated by Dodd-Frank.
Brokered Deposits and Pass-Through Deposit Insurance Limitations
Under FDICIA, a bank cannot accept brokered deposits unless it either (i) is “Well Capitalized” or (ii) is “Adequately Capitalized” and has received a written waiver from its primary federal banking regulator. For this purpose, “Well Capitalized” and “Adequately Capitalized” have the same definitions as in the Prompt Corrective Action regulations. See “Prompt Corrective Action” above. Banks that are not in the “Well Capitalized” category are subject to certain limits on the rates of interest they may offer on any deposits (whether or not obtained through a third-party deposit broker). Pass-through insurance coverage is not available in banks that do not satisfy the requirements for acceptance of brokered deposits, except that pass-through insurance coverage will be provided for employee benefit plan deposits in institutions which at the time of acceptance of the deposit meet all applicable regulatory capital requirements and send written notice to their depositors that their funds are eligible for pass-through deposit insurance. The Bank currently accepts brokered deposits.
Real Estate Lending Standards
FDICIA requires the federal bank regulatory agencies to adopt uniform real estate lending standards. The FDIC and the OCC have adopted regulations which establish supervisory limitations on Loan-to-Value (“LTV”) ratios in real estate loans by FDIC-insured banks, including national banks. The regulations require banks to establish LTV ratio limitations within or below the prescribed uniform range of supervisory limits.
Standards for Safety and Soundness
Pursuant to FDICIA the federal bank regulatory agencies have prescribed, by regulation, standards and guidelines for all insured depository institutions and depository institution holding companies relating to: (i) internal controls, information systems and internal audit systems; (ii) loan documentation; (iii) credit underwriting; (iv) interest rate risk exposure; (v)
The First Bancorp 2010 Form 10-K
Page 6
asset growth; and (vi) compensation, fees and benefits. The compensation standards prohibit employment contracts, compensation or benefit arrangements, stock option plans, fee arrangements or other compensatory arrangements that would provide “excessive” compensation, fees or benefits, or that could lead to material financial loss. In addition, the federal bank regulatory agencies are required by FDICIA to prescribe standards specifying: (i) maximum classified assets to capital ratios; (ii) minimum earnings sufficient to absorb losses without impairing capital; and (iii) to the extent feasible, a minimum ratio of market value to book value for publicly-traded shares of depository institutions and depository institution holding companies.
Consumer Protection Provisions
FDICIA also includes provisions requiring advance notice to regulators and customers for any proposed branch closing and authorizing (subject to future appropriation of the necessary funds) reduced insurance assessments for institutions offering “lifeline” banking accounts or engaged in lending in distressed communities. FDICIA also includes provisions requiring depository institutions to make additional and uniform disclosures to depositors with respect to the rates of interest, fees and other terms applicable to consumer deposit accounts.
FDIC Waiver of Certain Regulatory Requirements
The FDIC issued a rule, effective on September 22, 2003, that includes a waiver provision which grants the FDIC Board of Directors extremely broad discretionary authority to waive FDIC regulatory provisions that are not specifically mandated by statute or by a separate regulation.
Impact of Monetary Policy
The monetary policies of regulatory authorities, including the Federal Reserve Board, have a significant effect on the operating results of banks and bank holding companies. Through open market securities transactions and changes in its discount rate and reserve requirements, the Board of Governors exerts considerable influence over the cost and availability of funds for lending and investment. The nature of future monetary policies and the effect of such policies on the future business and earnings of the Company and the Bank cannot be predicted. See Item 7 - Management’s Discussion and Analysis of Financial Condition and Results of Operations, regarding the Bank’s net interest margin and the effect of interest-rate volatility on future earnings.
Employees
At December 31, 2010, the Company had 212 employees and full-time equivalency of 207 employees. The Company enjoys good relations with its employees. A variety of employee benefits, including health, group life and disability income, a defined contribution retirement plan, and an incentive bonus plan, are available to qualifying officers and other employees.
Company Website
The Company maintains a website at www.thefirstbancorp.com where it makes available, free of charge, its annual report on Form 10-K, quarterly reports on Form 10-Q, current reports on Form 8-K, and amendments to those reports filed or furnished pursuant to Section 13(a) or 15(d) of the Securities Exchange Act of 1934, as amended, as well as all Section 16 reports on Forms 3, 4, and 5, as soon as reasonably practicable after such reports are electronically filed with, or furnished to, the SEC. The Company’s reports filed with, or furnished to, the SEC are also available at the SEC’s website at www.sec.gov. Information contained on the Company’s website does not constitute a part of this report. Interactive Reports for our 10-K and 10-Q filings are available in XBRL format at the Company’s website.
The First Bancorp 2010 Form 10-K
Page 7
The risks and uncertainties described below are not the only ones the Company faces. Additional risks and uncertainties that we are unaware of, or that we currently deem immaterial, also may become important factors that affect us and our business. If any of these risks were to occur, our business, financial condition or results of operations could be materially and adversely affected.
The Dodd-Frank Act and related regulations may adversely affect our business, financial condition, liquidity or results of operations.
The Dodd-Frank Wall Street Reform and Consumer Protection Act of 2010 (the “Act”) was enacted on July 21, 2010. The Act creates a new Consumer Financial Protection Bureau with power to promulgate and enforce consumer protection laws. Smaller institutions, those with $10 billion or less in assets (such as the Company), will be subject to the Consumer Financial Protection Bureau’s rule-writing authority, and existing depository institution regulatory agencies will retain examination and enforcement authority for such institutions. The Act also establishes a Financial Stability Oversight Council chaired by the Secretary of the Treasury with authority to identify institutions and practices that might pose a systemic risk and, among other things, includes provisions affecting (1) corporate governance and executive compensation of all companies whose securities are registered with the SEC, (2) FDIC insurance assessments, (3) interchange fees for debit cards, which would be set by the Federal Reserve under a restrictive “reasonable and proportional cost” per transaction standard, (4) minimum capital levels for bank holding companies, subject to a grandfather clause for financial institutions (such as the Company) with less than $15 billion in assets, (5) derivative and proprietary trading by financial institutions, and (6) the resolution of large financial institutions crisis.
Financial Stability
– addresses the core purpose of the bill by creating a new oversight regulator, the Financial Stability Oversight Council. This council of regulators will monitor the financial system for “systemic risk” and will determine which entities pose significant systemic risk. Generally speaking, it will make recommendations to regulators for the implementation of the increased risk standards, also known as prudential regulation, to be applied to bank-holding companies with total consolidated assets of $50 billion or more and to designated nonbanks. The Act grandfathers trust preferred securities issued before May 19, 2010 by bank holding companies with less than $15 billion in total assets.
Orderly Liquidation Authority
–establishes a framework for the liquidation by the Federal Deposit Insurance Corporation (“FDIC”) of large institutions that pose systemic risk. The Treasury supplies liquidity for the liquidation that must be paid back in 60 months.
Enhancing Financial Institution Safety and Soundness
– merges the Office of Thrift Supervision (“OTS”) into the Office of the Comptroller of the Currency (“OCC”), the Bank’s primary regulator. The OTS regulatory responsibilities will be spread among other regulators. The Federal Reserve will regulate savings and loan holding companies, the OCC will regulate federal savings associations, and the FDIC will regulate state-chartered savings associations. The transfer of functions is to occur on the date one year from the date of enactment but may be extended for up to eighteen months from the date of enactment. The regulators are required to issue regulations for the entities that are newly under their regulatory umbrella no later than the date of the transfer of the functions. Ninety days after the transfer, the OTS will go out of existence and its employees will become employees of the OCC or the FDIC. For the Bank, a key provision in this title changes the assessment base for deposit insurance. Before, the base was domestic deposits less tangible equity. The new base will be average consolidated total assets minus average tangible equity. The result is that larger financial institutions, which have more non-deposit liabilities, will pay a greater percentage of the aggregate insurance assessment and smaller banks (such as the Bank) will pay less than they would have, perhaps as much as $4.5 billion less over the next three years. Another key provision for the Bank is the permanent increase in FDIC deposit insurance per depositor in the aggregate from $100,000 to $250,000, and the extension of the unlimited deposit coverage for non-interest bearing transaction accounts for two years. HR 4173 increases the minimum reserve ratio for the Deposit Insurance Fund from 1.15 percent to 1.35 percent, but exempts institutions (such as the Bank) with assets of less than $10 billion from the cost of the increase.
Improvements to Regulation of Bank and Savings Association Holding Companies and Depository Institutions
–implements the so-called modified Volcker Rule. The rule limits the ability of certain bank and bank-related entities to engage in proprietary trading or investing in hedge funds and private equity funds to 3 percent of the entity’s Tier 1 capital, among other restrictions. “Proprietary trading” is defined to include the purchase or sale of any security, any derivative, any contract for the sale of a commodity for future delivery, or option on such instrument. The key
The First Bancorp 2010 Form 10-K
Page 8
provisions in this title are a moratorium on deposit insurance applications for three years for new credit card banks, industrial loan companies and trust banks owned by commercial companies, the expansion of the definition of affiliate transactions to cover certain kinds of security transactions such as repurchase agreement, derivative transaction and securities borrowing; and the codification of the source of strength doctrine, the long-time view of the Federal Reserve that a holding company should serve as a source of financial strength for its subsidiary banks.
Regulation of Over-the-Counter Swaps Markets
– imposes exchange trading for derivatives contracts and imposes new capital and margin requirements and various reporting obligations on Over The Counter (“OTC”) swap dealers and major OTC swap participants. For the Bank, the most important provision in this title levels the competitive playing field by prohibiting the Federal Reserve or the FDIC from providing assistance to insured depository institutions involved in the swaps markets, with certain exceptions.
Payment, Clearing, and Settlement Supervision
– allows for a systemic approach to certain financial market payment, payment, clearing and settlement systems. Designation of a large financial institution as “systemically important” will require two-thirds of the Financial Stability Oversight Council.
Investor Protections and Improvements to the Regulation of Securities
– has a number of provisions intended to protect investors, including for example: risk retention requirements for certain asset-backed securities; reforms to regulation of credit rating agencies; establishing an Investor Advisory Committee and an Office of Investor Advocate, and requiring the SEC to study whether a fiduciary duty standard of care for broker-dealers providing personalized investment advice to a retail customer should be created. For the Bank, the most important section of this Title establishes a number of changes to corporate governance procedures for public companies that ultimately, and perhaps quickly, will become the “best practices” (if not the expected practices) for all corporations large and small. The most important of these are: proxy access requirements for shareholders; disclosures about the failure to separate the role of the chair of board and chief executive officer; non-binding shareholder voting on executive compensation; the establishment of an independent compensation committee; executive compensation disclosures and clawbacks. In addition, the Federal Reserve is required to issue regulations regarding incentive-based pay practices within nine months of the effective date of the Act; these regulations will apply to institutions (such as the Bank) with more than $1 billion in assets.
Bureau of Consumer Financial Protection
– the most important title in the Act for the Bank. It will alter in dramatic fashion the way consumer credit is regulated, moving from the current framework of the federal regulation of disclosure and the state law regulation of fairness and suitability, to an overall, nationwide federal suitability framework. It establishes the Bureau of Consumer Financial Protection, an independent entity housed within the Federal Reserve in order to provide a source of funding (initially $500 million) and gives the Bureau the authority to prohibit practices that it finds to be “unfair,” “deceptive,” or “abusive” in addition to requiring certain disclosures. The words “unfair” and “deceptive” appear to reference and incorporate similar words in the enabling legislation of the Federal Trade Commission and some state consumer legislation. The “abusive” addition to this grant of regulatory scope is new and it is likely that defining the meaning of this term in this context will produce additional regulation and litigation. The Bureau may also prohibit mandatory consumer arbitration provisions and it will oversee mortgage reform. For the Bank, in addition to creation of the Bureau, this Title also contains a number of other important provisions. It limits interchange fees for debit card transactions (including those involved with certain prepaid card products) to an amount established as reasonable under regulations to be issued by the Federal Reserve. Cards issued by banks with less than $10 billion in assets are exempt from this requirement although this exemption has been criticized as being ineffective because small banks may be forced by market dynamics to match the rates being offered by their larger competitors. The Bank has estimated this provision will result in the loss of several hundred thousand dollars in revenue per year. Another key change for the Bank is the Act’s treatment of preemption. Essentially, the Act will undo recent court decisions and OCC guidance that expanded the application of preemption to subsidiaries of national banks. The standard for the preemption of state law is to return to the one enunciated in a well-known court decision, Barnet Bank v. Nelson: “irreconcilable conflict” and “stand as an obstacle to the accomplishment” of the purpose of the federal law. The Act also codified the result in a recent U.S. Supreme Court decision that the visitorial powers provisions of the National Bank Act do not limit the authority of state attorneys general to bring actions against national banks to enforce state consumer protection laws.
Federal Reserve System Revisions
– gives the Government Accountability Office authority to conduct a one-time audit of the Federal Reserve’s emergency lending during the credit crisis and gives the GAO other auditing responsibilities over the Federal Reserve. The title also tightens the conditions under which the Fed may provide emergency assistance to institutions and authorizes the FDIC to guarantee debts of banks and bank holding companies.
The First Bancorp 2010 Form 10-K
Page 9
Improving Access to Mainstream Financial Institutions
– is intended to provide alternatives to payday loans. This title is intended to encourage low-and moderate-income individuals to create accounts in insured depository institutions and it creates a program to provide low-cost loans of $2,500 or less.
Pay It Back Act
– a largely technical section dealing with previous programs for emergency assistance to insured financial institutions. It decreases the Troubled Asset Relief Program (“TARP”) funds authorized by under the Emergency Economic Stabilization Act of 2008 from $700 billion to $475 billion.
Mortgage Reform and Anti-Predatory Lending Act
– places new regulations on mortgage originators and imposes new disclosure requirements and appraisal reforms, the most important of which are: the creation of a mortgage originator duty of care, the establishment of certain underwriting requirements so that at the time of origination the consumer has a reasonable ability to repay the loan; the creation of document requirements intended to eliminate “no document” and “low document” loans, the prohibition of steering incentives for mortgage originators; a prohibition on yield spread premiums, and prepayment penalties in many cases; and a provision that allows borrowers to assert as a foreclosure defense a contention that the lender violated the anti-steering restrictions or the reasonable repayment requirements.
For the Bank, the key in the immediate future is watching the regulatory implementation of HR 4173. There are tens, if not hundreds, of new regulatory initiatives arising from the Act. Although most should have little impact on the Bank, some will be critical. The most critical ones for the Bank will be those concerning capital requirements and consumer lending.
Recent negative developments in the financial services industry and U.S. and global credit markets may adversely impact our operations and results.
Negative developments between 2007 and 2010 in the capital markets have resulted in uncertainty in the financial markets in general with the expectation of the general economic downturn continuing in 2011 and perhaps beyond 2011. The impact of this situation, together with concerns regarding the financial strength of financial institutions, has led to distress in credit markets and issues relating to liquidity among financial institutions. Some financial institutions around the world and the United States have failed; others have been forced to seek acquisition partners. Loan portfolio value has deteriorated at many institutions resulting from, amongst other factors, a weak economy and a decline in the value of the collateral supporting their loans. The competition for our deposits has increased significantly due to liquidity concerns at many of these same institutions. Stock prices of bank holding companies, like ours, have been negatively affected by the current condition of the financial markets, as has our ability, if needed, to raise capital or borrow in the debt markets compared to recent years. The United States and other governments have taken unprecedented steps to try to stabilize the financial system, including investing in financial institutions. Our business and our financial condition and results of operations could be adversely affected by (1) continued or accelerated disruption and volatility in financial markets, (2) continued capital and liquidity concerns regarding financial institutions generally and our counterparties specifically, (3) recessionary conditions that are deeper or last longer than currently anticipated, or (4) new federal or state laws and regulations regarding lending and funding practices and liquidity standards, and the likelihood that financial institution regulatory agencies will be very aggressive in responding to concerns and trends identified in examinations, including the expected issuance of formal enforcement actions. Negative developments in the financial services industry and the impact of new legislation in response to those developments could negatively impact our operations by restricting our business operations, including our ability to originate or sell loans, and adversely impact our financial performance.
There can be no assurance that the Emergency Economic Stabilization Act (“EESA”), the American Recovery and Reinvestment Act of 2009, and other initiatives undertaken by the United States government to restore liquidity and stability to the U.S. financial system will help stabilize and stimulate the U.S. financial system.
The purpose of these legislative and regulatory actions is to stabilize the U.S. banking system. The EESA and the other regulatory initiatives described above may not have their desired effects. If the volatility in the markets continues and economic conditions fail to improve or worsen, our business, financial condition and results of operations could be materially and adversely affected. There can be no assurance regarding the actual impact that the EESA or the American Recovery and Reinvestment Act of 2009, or other programs and other initiatives undertaken by the U.S. government, will have on the financial markets; the extreme levels of volatility and limited credit availability currently being experienced may persist. The failure of the EESA or other government programs to help stabilize the financial markets and a continuation or worsening of current financial market conditions could have a material adverse effect on the Company. In the event turmoil in the financial markets continues, we may experience a material adverse effect from (1) continued or accelerated disruption and volatility in financial markets, (2) continued capital and liquidity concerns
The First Bancorp 2010 Form 10-K
Page 10
regarding financial institutions generally and our transaction counterparties specifically, (3) limitations resulting from further governmental action to stabilize or provide additional regulation of the financial system, or (4) recessionary conditions that are deeper or last longer than currently anticipated.
The soundness of other financial services institutions may adversely affect our credit risk.
We rely on other financial services institutions through trading, clearing, counterparty, and other relationships. We maintain limits and monitor concentration levels of our counterparties as specified in our internal policies. Our reliance on other financial services institutions exposes us to credit risk in the event of default by these institutions or counterparties. These losses could adversely affect our results of operations and financial condition.
Declines in value may adversely impact the investment portfolio.
As of December 31, 2010, we had $293.2 million and $107.4 million in available for sale and held to maturity investment securities, respectively. We may be required to record impairment charges on our investment securities if they suffer a decline in value that is considered other-than-temporary. Numerous factors, including lack of liquidity for re-sales of certain investment securities, absence of reliable pricing information for investment securities, adverse changes in business climate, adverse actions by regulators, or unanticipated changes in the competitive environment could have a negative effect on our investment portfolio in future periods. If an impairment charge is significant enough it could affect the ability of the Bank to renew funding. This could have a material adverse effect on our liquidity and our ability to upstream dividends to the Company and for the Company to then pay dividends to shareholders. It could also negatively impact our regulatory capital ratios and result in our not being classified as “well-capitalized” for regulatory purposes.
Regulation.
Bank holding companies and nationally chartered banks operate in a highly regulated environment and are subject to supervision and examination by various regulatory agencies. The Company is subject to the Bank Holding Company Act of 1956, as amended, and to regulation and supervision by the Federal Reserve Board. The Bank is subject to regulation and supervision by the Office of the Comptroller of the Currency, or the OCC. The cost of compliance with regulatory requirements may adversely affect our results of operations or financial condition. Federal and state laws and regulations govern numerous matters including: changes in the ownership or control of banks and bank holding companies; maintenance of adequate capital and the financial condition of a financial institution; permissible types, amounts and terms of extensions of credit and investments; permissible non-banking activities; the level of reserves against deposits; and restrictions on dividend payments. The OCC possesses cease and desist powers to prevent or remedy unsafe or unsound practices or violations of law by banks subject to their regulation, and the Federal Reserve Board possesses similar powers with respect to bank holding companies. These and other restrictions limit the manner in which we may conduct our business and obtain financing.
Under regulatory capital adequacy guidelines and other regulatory requirements, we must meet guidelines that include quantitative measures of assets, liabilities, and certain off-balance sheet items, subject to qualitative judgments by regulators about components, risk weightings and other factors. If we fail to meet these minimum capital guidelines and other regulatory requirements, our financial condition would be materially and adversely affected. Our failure to maintain the status of “well-capitalized” under our regulatory framework could affect the confidence of our customers in us, thus compromising our competitive position.
Interest rate risk.
Our main source of income is net interest income, which is equal to the difference between the interest income received on loans, investment securities and other interest-bearing assets and the interest expense incurred in connection with deposits, borrowings and other interest-bearing liabilities. As a result, our net interest income can be affected by changes in market interest rates. These rates are highly sensitive to many factors beyond our control, including general economic conditions, both domestic and foreign, and the monetary and fiscal policies of various governmental and regulatory authorities. We have asset and liability management policies that attempt to minimize the potential adverse effects of changes in interest rates on our net interest income, primarily by altering the mix and maturity of loans, investments and funding sources. However, even with these policies in place, we cannot provide assurance that changes in interest rates will not negatively impact our operating results. For a further discussion on the Company’s exposure to interest rate risk, see Item 7A: Quantitative and Qualitative Disclosures about Market Risk.
Furthermore, our banking business is affected not only by general economic conditions, but also by the monetary policies of the Federal Reserve Board. Changes in monetary or legislative policies may affect the interest rates we must offer to attract deposits and the interest rates we can charge on our loans, as well as the manner in which we offer deposits and make loans. These monetary policies have had, and are expected to continue to have, significant effects on the operating results of depository institutions, including the Bank. Increases in interest rates also may reduce the
The First Bancorp 2010 Form 10-K
Page 11
demand for loans and, as a result, the amount of loan and commitment fees the Bank receives.
Credit risk.
A number of factors can impact the ability of borrowers to repay their current loan obligations, which could not only result in increased loan defaults, foreclosures and write-offs, but also necessitate further increases to our allowance for loan losses. If customers default on the repayment of their loans, our profitability could be adversely affected. A borrower’s default on its obligations under one or more of our loans may result in lost principal and interest income and increased operating expenses as a result of the allocation of Management time and resources to the collection and work-out of the loans. If collection efforts are unsuccessful or acceptable workout arrangements cannot be reached, we may have to write-off the loans in whole or in part. Although we may acquire real estate or other assets that secure the defaulted loans through foreclosure or other similar remedies, the amount owed under the defaulted loans may exceed the value of the assets acquired.
Management periodically makes a determination of our allowance for loan losses based on available information, including the quality of our loan portfolio, economic conditions, the value of the underlying collateral and the level of our non-accruing loans. If assumptions prove to be incorrect, our allowance may not be sufficient. Increases in this allowance will result in an expense for the period. If, as a result of general economic conditions or an increase in non-performing loans, Management determines that an increase in our allowance for loan losses is necessary, we may incur additional expenses.
As an integral part of their examination processes, bank regulatory agencies periodically review our allowance for loan losses and the value we attribute to real estate acquired through foreclosure or other similar remedies. These regulatory agencies may require us to adjust our determination of the value of these items. These adjustments could negatively impact our results of operations or financial condition.
Because we serve primarily individuals and smaller businesses located in coastal Maine, the ability of customers to repay their loans is impacted by the economic conditions in this area. In addition, our ability to continue to originate loans consistent with our credit criteria may be impaired by adverse changes in local and regional economic conditions. These events also could have an adverse effect on the value of our collateral and our financial condition.
In the course of business, we may acquire, through foreclosure, properties securing loans that are in default. In commercial real estate lending, there is a risk that hazardous substances could be discovered on these properties. In this event, we might be required to remove these substances from the affected properties at our sole cost and expense. The cost of this removal could exceed the value of the affected properties. We may not have adequate remedies against the prior owners or other responsible parties and could find it difficult or impossible to sell the affected properties. The occurrence of one or more of these events could adversely affect our financial condition or operating results.
Liquidity and funding.
We have traditionally obtained funds principally through deposits and borrowings. As a general matter, deposits are a lower-cost source of funds than borrowings, because interest rates paid for deposits are typically less than interest rates charged for borrowings. If, as a result of competitive pressures, market interest rates, general economic conditions or other events, the balance of our deposits decreases relative to our overall banking operations, we may have to rely more heavily on borrowings as a source of funds in the future. Such an increased reliance on borrowings could have a negative impact on our results of operations or financial condition. In addition, fluctuations in interest rates may result in disintermediation, which is the flow of funds away from depository institutions into direct investments that pay higher rates of return, and may affect the value of our investment securities and other interest-earning assets.
Our access to funding sources in amounts adequate to finance our activities could be impaired by factors that affect us specifically or the financial services industry in general. Factors that could detrimentally impact our access to liquidity sources include a decrease in the level of our business activity due to a market downturn or adverse regulatory action against us. Our ability to borrow could also be impaired by factors that are not specific to us, such as a severe disruption of the financial markets or negative views and expectations about the prospects for the financial services industry as a whole should the recent turmoil faced by banking organizations in the domestic and worldwide credit markets continue or worsen.
Loss of lower-cost funding sources.
Checking and savings, NOW, and money market deposit account balances and other forms of customer deposits can decrease when customers perceive alternative investments, such as the stock market, as providing a better risk/return tradeoff. If customers move money out of bank deposits and into other investments, we could lose a relatively low-cost source of funds, increasing our funding costs and reducing our net interest income and net income. Advances from the Federal Home Loan Bank of Boston (“FHLB”) are currently a relatively low-cost source of funding. The availability of qualified collateral on the Bank’s balance sheet determines the level of advances available from FHLB and a deterioration in quality in the Bank’s loan portfolio can adversely impact the availability of this source of funding.
The First Bancorp 2010 Form 10-K
Page 12
Competition in the financial services industry.
We face substantial competition in all areas of our operations from a variety of different competitors, many of which are larger and may have more financial resources than we do. We compete with other providers of financial services such as commercial and savings banks, savings and loan associations, credit unions, money market and mutual funds, mortgage companies, asset managers, insurance companies and a wide array of other local, regional and national institutions which offer financial services. Mergers between financial institutions within Maine and in neighboring states have added competitive pressure. If we are unable to compete effectively, we will lose market share and our income generated from loans, deposits, and other financial products will decline.
Allowance for loan losses may be insufficient.
The Bank maintains an allowance for loan losses based on, among other things, national and regional economic conditions, historical loss experience and delinquency trends. We make various assumptions and judgments about the collectability of our loan portfolio, including the creditworthiness of borrowers and the value of the real estate and other assets serving as collateral for the repayment of loans. In determining the size of the allowance for loan losses, we rely on our experience and our evaluation of economic conditions. However, we cannot predict loan losses with certainty, and we cannot provide assurance that charge-offs in future periods will not exceed the allowance for loan losses. During 2010, the Bank experienced incremental increases in both non-performing loans and net loan charge-offs, as compared to prior periods. No assurance can be given that the relevant economic and market conditions will improve or will not further deteriorate. Hence, the persistence or worsening of such conditions could result in an increase in delinquencies, could cause a decrease in our interest income, or could continue to have an adverse impact on our loan loss experience, which, in turn, may necessitate increases to our allowance for loan losses. If net charge-offs exceed the Bank’s allowance, its earnings would decrease. In addition, regulatory agencies review the Bank’s allowance for loan losses and may require additions to the allowance based on their judgment about information available to them at the time of their examination. Management could also decide that the allowance for loan losses should be increased. An increase in the Bank’s allowance for loan losses could reduce its earnings.
Changes in primary market area could adversely impact results of operations and financial condition.
Most of the Bank’s lending is in Mid-Coast and Down East Maine. As a result of this geographic concentration, a significant broad-based deterioration in economic conditions in this area or Northern New England could have a material adverse impact on the quality of the Bank’s loan portfolio, and accordingly, our results of operations. Such a decline in economic conditions could impair borrowers’ ability to pay outstanding principal and interest on loans when due and, consequently, adversely affect the cash flows of our business.
The Bank’s loan portfolio is largely secured by real estate collateral. A substantial portion of the real and personal property securing the loans in the Bank’s portfolio is located in Mid-Coast and Down East Maine. Conditions in the real estate market in which the collateral for the Bank’s loans is located strongly influence the level of the Bank’s non-performing loans and results of operations. The recent decline in the Mid-Coast and Down East Maine area real estate values, as well as other external factors, could adversely affect the Bank’s loan portfolio.
Operational risk and dependence on key personnel.
We face the risk that the design of our controls and procedures, including those to mitigate the risk of fraud by employees or outsiders, may prove to be inadequate or are circumvented, thereby causing delays in detection of errors or inaccuracies in data and information. Management regularly reviews and updates our internal controls, disclosure controls and procedures, and corporate governance policies and procedures. Any system of controls, however well designed and operated, is based in part on certain assumptions and can provide only reasonable, not absolute, assurances that the objectives of the system are met. Any failure or circumvention of our controls and procedures or failure to comply with regulations related to controls and procedures could have a material adverse effect on our business, results of operations and financial condition.
We may also be subject to disruptions of our systems arising from events that are wholly or partially beyond our control (including, for example, computer viruses or electrical or telecommunications outages), which may give rise to losses in service to customers and to financial loss or liability. We are further exposed to the risk that our external vendors may be unable to fulfill their contractual obligations (or will be subject to the same risk of fraud or operational errors by their respective employees as are we) and to the risk that our (or our vendors’) business continuity and data security systems prove to be inadequate.
Our performance is largely dependent on the talents and efforts of highly skilled individuals. There is intense competition in the financial services industry for qualified employees. In addition, we face increasing competition with businesses outside the financial services industry for the most highly skilled individuals. Our business operations could be adversely affected if we were unable to attract new employees and retain and motivate our existing employees.
The First Bancorp 2010 Form 10-K
Page 13
Claims and litigation pertaining to fiduciary responsibility or lender liability.
From time to time as part of our normal course of business, customers make claims and take legal action against the Bank based on actions or inactions of the Bank. If such claims and legal actions are not resolved in a manner favorable to us, they may result in financial liability and/or adversely affect the market perception of the Company and its products and services. This may also impact customer demand for the Company’s products and services. Any financial liability or reputation damage could have a material adverse effect on our business, which, in turn, could have a material adverse effect on our financial condition and results of operations.
There may not be a robust trading market for the common stock.
Although our common stock is traded on the NASDAQ Global Select market, the trading volume of the common stock has historically not been substantial. Over the five-year period ending December 31, 2010, for example, the average monthly trading volume of our common stock has been 207,029 shares or approximately 2.12% of the outstanding common stock. Due to the limited trading volume in our common stock, the intraday spread between bid and ask prices of the shares can be quite high. There can be no assurance that a more robust, active or economical trading market for our common stock will develop. The market value and liquidity of our common stock may, as a result, be adversely affected.
The price of our common stock may fluctuate.
The price of our common stock on the NASDAQ Global Select Market constantly changes and recently, given the uncertainty in the financial markets, has fluctuated widely. We expect the market price of our common stock will continue to fluctuate. Holders of our common stock will be subject to the risk of volatility and changes in prices. Our common stock price can fluctuate as a result of many factors which are beyond our control, including:
|
·
|
quarterly fluctuations in our operating and financial results;
|
|
·
|
operating results that vary from the expectations of Management, securities analysts and investors;
|
|
·
|
changes in expectations as to our future financial performance, including financial estimates by securities analysts;
|
|
·
|
events negatively impacting the financial services industry which result in a general decline for the industry;
|
|
·
|
announcements of material developments affecting our operations or our dividend policy;
|
|
·
|
future sales of our equity securities;
|
|
·
|
new laws or regulations or new interpretations of existing laws or regulations applicable to our business;
|
|
·
|
changes in accounting standards, policies, guidance, interpretations or principles; and
|
|
·
|
general domestic economic and market conditions.
|
In addition, recently the stock market generally has experienced extreme price and volume fluctuations, and industry factors and general economic and political conditions and events, such as economic slowdowns or recessions, interest rate changes or credit loss trends, could also cause our stock price to decrease regardless of our operating results.
Future offerings of debt or other securities may adversely affect the market price of our stock.
In the future, we may attempt to increase our capital resources or, if our or the Bank’s capital ratios approach or fall below the required minimums, we or the Bank could be forced to raise additional capital by making additional offerings of debt or preferred equity securities, including medium-term notes, trust preferred securities, senior or subordinated notes and preferred stock. Upon liquidation, holders of our debt securities and shares of preferred stock and lenders with respect to other borrowings will receive distributions of our available assets prior to the holders of our common stock. Additional equity offerings may dilute the value for existing Shareholders or reduce the market price of our common stock, or both. Holders of our common stock are not entitled to preemptive rights or other protections against dilution.
The First Bancorp 2010 Form 10-K
Page 14
None
The principal office of the Company and the Bank is located in Damariscotta, Maine. The Bank operates 14 full-service banking offices in four counties in the Mid-Coast and Down East regions of Maine:
|
Lincoln County
|
Knox County
|
Hancock County
|
Washington County
|
|
Boothbay Harbor
|
Camden
|
Bar Harbor
|
Eastport
|
|
Damariscotta
|
Rockland
|
Blue Hill
|
Calais
|
|
Waldoboro
|
Rockport
|
Ellsworth
|
|
|
Wiscasset
|
Northeast Harbor
|
||
|
Southwest Harbor
|
First Advisors, the investment management and trust division of the Bank, operates from two offices in Bar Harbor and Damariscotta. The Bank also maintains an Operations Center in Damariscotta. The Company owns all of its facilities except for the land on which the Ellsworth branch is located, and except for the Camden and Northeast Harbor offices and the Southwest Harbor drive-up facility, for which the Bank has entered into long-term leases. Management believes that the Bank’s current facilities are suitable and adequate in light of its current needs and its anticipated needs over the near term.
There are no material pending legal proceedings to which the Company or the Bank is a party or to which any of its property is subject, other than routine litigation incidental to the business of the Bank. None of these proceedings is expected to have a material effect on the financial condition of the Company or of the Bank.
None.
The First Bancorp 2010 Form 10-K
Page 15
The common stock of The First Bancorp (ticker symbol FNLC) trades on the NASDAQ Global Select Market System. As of December 31, 2010, there were 9,773,025 shares outstanding and held of record by approximately 3,646 shareholders. The following table reflects the high and low prices of actual sales in each quarter of 2010 and 2009. Such quotations do not reflect retail mark-ups, mark-downs or brokers’ commissions.
|
2010
|
2009
|
|||||||||||||||
|
High
|
Low
|
High
|
Low
|
|||||||||||||
|
1st Quarter
|
$ | 16.26 | $ | 13.11 | $ | 20.29 | $ | 10.77 | ||||||||
|
2nd Quarter
|
16.37 | 13.07 | 21.80 | 14.49 | ||||||||||||
|
3rd Quarter
|
14.48 | 12.27 | 20.50 | 17.29 | ||||||||||||
|
4th Quarter
|
16.00 | 13.40 | 19.00 | 14.65 | ||||||||||||
The last transaction in the Company’s stock on NASDAQ during 2010 was on December 31 at $15.79 per share. There are no warrants outstanding with respect to the Company’s common stock other than warrants to purchase up to 225,904 shares of its common stock (subject to adjustment) at $16.60 per share issued to the U.S. Treasury incident to the Company’s participation in the CPP program. The Company has no securities outstanding which are convertible into common equity.
The ability of the Company to pay cash dividends depends on receipt of dividends from the Bank. While the Company’s preferred stock issued under the CPP Program remains outstanding, the Company may not increase the dividend paid on its common stock without U.S. Treasury approval during the first three years (through January 9, 2012). Dividends may be declared by the Bank out of its net profits as the directors deem appropriate, subject to the limitation that the total of all dividends declared by the Bank in any calendar year may not exceed the total of its net profits of that year plus retained net profits of the preceding two years. The amount available for dividends in 2011 will be that year’s net income plus $8.1 million. The payment of dividends from the Bank to the Company may be additionally restricted if the payment of such dividends resulted in the Bank failing to meet regulatory capital requirements. The Bank is also required to maintain minimum amounts of capital-to-total-risk-weighted-assets, as defined by banking regulators. At December 31, 2010, the Bank was required to have minimum Tier 1 and Tier 2 risk-based capital ratios of 4.00% and 8.00%, respectively. The Bank’s actual ratios were 14.86% and 16.11%, respectively, as of December 31, 2010. The table below sets forth the cash dividends declared in the last two fiscal years:
|
Date Declared
|
Amount Per Share
|
Date Payable
|
|||
|
March 18, 2009
|
$ | 0.195 |
April 30, 2009
|
||
|
June 18, 2009
|
$ | 0.195 |
July 31, 2009
|
||
|
September 17, 2009
|
$ | 0.195 |
October 30, 2009
|
||
|
December 17, 2009
|
$ | 0.195 |
January 29, 2010
|
||
|
March 18, 2010
|
$ | 0.195 |
April 30, 2010
|
||
|
June 17, 2010
|
$ | 0.195 |
July 30, 2010
|
||
|
September 16, 2010
|
$ | 0.195 |
October 29, 2010
|
||
|
December 16, 2010
|
$ | 0.195 |
January 28, 2011
|
||
Repurchase of Shares and Use of Proceeds
As a consequence of the Company’s issuance of securities under the U.S. Treasury’s CPP program, its ability to repurchase stock while such securities remain outstanding is restricted to purchases from employee benefit plans. During the year ended December 31, 2010, the Company repurchased fractional shares from employee benefit plans totaling five shares.
Unregistered Sales of Equity Securities
The Company had no unregistered sales of equity securities in 2010.
The First Bancorp 2010 Form 10-K
Page 16
The following table lists the amount and weighted-average exercise price of securities authorized for issuance under equity compensation plans:
|
Number of securities to be issued upon exercise of outstanding options, warrants and rights
|
Weighted-average exercise price of outstanding options, warrants and rights
|
Number of securities remaining available for future issuance under equity compensation plans (excluding securities reflected in column (a))
|
||||||||||
|
Plan category
|
(a)
|
(b)
|
(c)
|
|||||||||
|
Equity compensation plans approved by security holders
|
55,500 | $ | 15.89 | - | ||||||||
|
Equity compensation plans not approved by security holders
|
- | $ | - | - | ||||||||
|
Total
|
55,500 | $ | 15.89 | - | ||||||||
Performance Graph
Set forth below is a line graph comparing the five-year cumulative total return of $100.00 invested in the Company’s common stock (“FNLC”), assuming reinvestment of all cash dividends and retention of all stock dividends, with a comparable amount invested in the Standard & Poor’s 500 Index (“S&P 500”) and the NASDAQ Combined Bank Index (“NASD Bank”). The NASD Bank index is a capitalization-weighted index designed to measure the performance of all NASDAQ stocks in the banking sector.
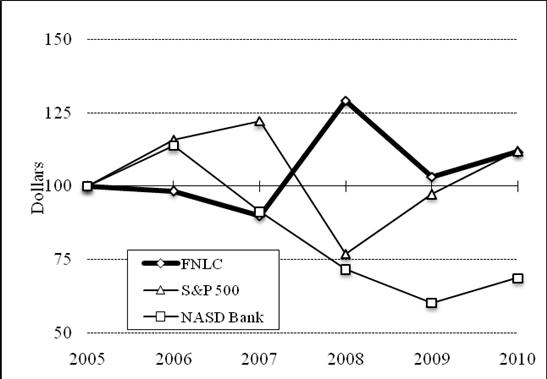 [Missing Graphic Reference]
|
2005
|
2006
|
2007
|
2008
|
2009
|
2010
|
|
|
FNLC
|
100.00
|
98.37
|
89.82
|
129.07
|
103.26
|
111.65
|
|
S&P 500
|
100.00
|
115.79
|
122.12
|
76.94
|
97.30
|
111.95
|
|
NASD Bank
|
100.00
|
113.82
|
91.27
|
71.66
|
60.17
|
68.68
|
The First Bancorp 2010 Form 10-K
Page 17
The First Bancorp, Inc. and Subsidiary
|
Years ended December 31,
|
||||||||||||||||||||
|
Dollars in thousands,
except for per share amounts
|
2010
|
2009
|
2008
|
2007
|
2006
|
|||||||||||||||
|
Summary of Operations
|
||||||||||||||||||||
|
Interest Income
|
$ | 57,260 | $ | 62,569 | $ | 71,372 | $ | 71,721 | $ | 64,204 | ||||||||||
|
Interest Expense
|
16,671 | 18,916 | 33,669 | 39,885 | 33,589 | |||||||||||||||
|
Net Interest Income
|
40,589 | 43,653 | 37,703 | 31,836 | 30,615 | |||||||||||||||
|
Provision for Loan Losses
|
8,400 | 12,160 | 4,700 | 1,432 | 1,325 | |||||||||||||||
|
Non-Interest Income
|
9,135 | 12,754 | 9,646 | 10,145 | 10,306 | |||||||||||||||
|
Non-Interest Expense
|
25,130 | 26,658 | 22,994 | 22,183 | 22,439 | |||||||||||||||
|
Net Income
|
12,116 | 13,042 | 14,034 | 13,101 | 12,295 | |||||||||||||||
|
Per Common Share Data
|
||||||||||||||||||||
|
Net Income
|
||||||||||||||||||||
|
Basic
|
$ | 1.10 | $ | 1.22 | $ | 1.45 | $ | 1.34 | $ | 1.25 | ||||||||||
|
Diluted
|
1.10 | 1.22 | 1.44 | 1.34 | 1.25 | |||||||||||||||
|
Cash Dividends (Declared)
|
0.780 | 0.780 | 0.765 | 0.690 | 0.610 | |||||||||||||||
|
Book Value
|
12.80 | 12.66 | 12.09 | 11.58 | 10.98 | |||||||||||||||
|
Market Value
|
15.79 | 15.42 | 19.89 | 14.64 | 16.72 | |||||||||||||||
|
Financial Ratios
|
||||||||||||||||||||
|
Return on Average Equity
|
9.53 | % | 10.66 | % | 12.02 | % | 11.89 | % | 11.63 | % | ||||||||||
|
Return on Average Tangible Common Equity
|
10.83 | 12.54 | 15.75 | 15.89 | 15.75 | |||||||||||||||
|
Return on Average Assets
|
0.89 | 0.96 | 1.10 | 1.13 | 1.14 | |||||||||||||||
|
Average Equity to Average Assets
|
11.20 | 10.85 | 9.14 | 9.53 | 9.81 | |||||||||||||||
|
Average Tangible Equity to Average Assets
|
9.15 | 8.80 | 6.98 | 7.13 | 7.24 | |||||||||||||||
|
Net Interest Margin (Tax-Equivalent)
|
3.38 | 3.66 | 3.33 | 3.13 | 3.24 | |||||||||||||||
|
Dividend Payout Ratio (Declared)
|
70.91 | 63.93 | 52.76 | 51.49 | 48.80 | |||||||||||||||
|
Allowance for Loan Losses/Total Loans
|
1.50 | 1.43 | 0.90 | 0.74 | 0.76 | |||||||||||||||
|
Non-Performing Loans to Total Loans
|
2.39 | 1.95 | 1.27 | 0.31 | 0.42 | |||||||||||||||
|
Non-Performing Assets to Total Assets
|
1.87 | 1.80 | 1.31 | 0.56 | 0.32 | |||||||||||||||
|
Efficiency Ratio (Tax-equivalent)
|
48.15 | 43.39 | 46.07 | 50.16 | 52.12 | |||||||||||||||
|
At Year End
|
||||||||||||||||||||
|
Total Assets
|
$ | 1,393,802 | $ | 1,331,394 | $ | 1,325,744 | $ | 1,223,250 | $ | 1,104,869 | ||||||||||
|
Total Loans
|
887,596 | 952,492 | 979,273 | 920,164 | 838,145 | |||||||||||||||
|
Total Investment Securities
|
416,052 | 287,818 | 247,839 | 208,585 | 172,301 | |||||||||||||||
|
Total Deposits
|
974,518 | 922,667 | 925,736 | 781,280 | 805,235 | |||||||||||||||
|
Total Borrowings
|
257,330 | 249,778 | 272,074 | 316,719 | 179,862 | |||||||||||||||
|
Total Shareholders’ Equity
|
149,848 | 147,938 | 117,181 | 112,453 | 107,327 | |||||||||||||||
|
High
|
Low
|
|||||||||||||||||||
|
Market price per common share of stock during 2010
|
$ | 16.37 | $ | 12.27 | ||||||||||||||||
The First Bancorp 2010 Form 10-K
Page 18
The First Bancorp, Inc. (the “Company”) was incorporated in the State of Maine on January 15, 1985, and is the parent holding company of The First, N.A. (the “Bank”). At the Company’s Annual Meeting of Shareholders on April 30, 2008, the Company’s name was changed to The First Bancorp, Inc. from First National Lincoln Corporation.
The Company generates almost all of its revenues from the Bank, which was chartered as a national bank under the laws of the United States on May 30, 1864. The Bank, which has fourteen offices along coastal Maine, emphasizes personal service to the communities it serves, concentrating primarily on small businesses and individuals.
The Bank offers a wide variety of traditional banking services and derives the majority of its revenues from net interest income – the spread between what it earns on loans and investments and what it pays for deposits and borrowed funds. While net interest income typically increases as earning assets grow, the spread can vary up or down depending on the level and direction of movements in interest rates. Management believes the Bank has modest exposure to changes in interest rates, as discussed in “Interest Rate Risk Management” elsewhere in Management’s Discussion. The banking business in the Bank’s market area historically has been seasonal with lower deposits in the winter and spring and higher deposits in the summer and fall. This seasonal swing is fairly predictable and has not had a materially adverse effect on the Bank.
Non-interest income is the Bank’s secondary source of revenue and includes fees and service charges on deposit accounts, fees for processing merchant credit card receipts, income from the sale and servicing of mortgage loans, and income from investment management and private banking services through First Advisors, a division of the Bank.
Forward-Looking Statements
This report contains statements that are “forward-looking statements.” We may also make written or oral forward-looking statements in other documents we file with the SEC, in our annual reports to Shareholders, in press releases and other written materials, and in oral statements made by our officers, directors or employees. You can identify forward-looking statements by the use of the words “believe”, “expect”, “anticipate”, “intend”, “estimate”, “assume”, “outlook”, “will”, “should”, “may”, “might, “could”, and other expressions that predict or indicate future events or trends and which do not relate to historical matters. You should not rely on forward-looking statements, because they involve known and unknown risks, uncertainties and other factors, some of which are beyond the control of the Company. These risks, uncertainties and other factors may cause the actual results, performance or achievements of the Company to be materially different from the anticipated future results, performance or achievements expressed or implied by the forward-looking statements.
Some of the factors that might cause these differences include the following: changes in general national, regional or international economic conditions or conditions affecting the banking or financial services industries or financial capital markets, volatility and disruption in national and international financial markets, government intervention in the U.S. financial system, reductions in net interest income resulting from interest rate volatility as well as changes in the balance and mix of loans and deposits, reductions in the market value of wealth management assets under administration, changes in the value of securities and other assets, reductions in loan demand, changes in loan collectibility, default and charge-off rates, changes in the size and nature of the Company’s competition, changes in legislation or regulation and accounting principles, policies and guidelines, and changes in the assumptions used in making such forward-looking statements. In addition, the factors described under “Risk Factors” in Item 1A of this Annual Report on Form 10-K, may result in these differences. You should carefully review all of these factors, and you should be aware that there may be other factors that could cause these differences. These forward-looking statements were based on information, plans and estimates at the date of this annual report, and we assume no obligation to update any forward-looking statements to reflect changes in underlying assumptions or factors, new information, future events or other changes.
Although the Company believes that the expectations reflected in such forward-looking statements are reasonable, actual results may differ materially from the results discussed in these forward-looking statements. Readers are cautioned not to place undue reliance on these forward-looking statements, which speak only as of the date hereof. The Company undertakes no obligation to republish revised forward-looking statements to reflect events or circumstances after the date hereof or to reflect the occurrence of unanticipated events. Readers are also urged to carefully review and consider the various disclosures made by the Company, which attempt to advise interested parties of the factors that affect the Company’s business.
The First Bancorp 2010 Form 10-K
Page 19
Critical Accounting Policies
Management’s discussion and analysis of the Company’s financial condition is based on the consolidated financial statements which are prepared in accordance with accounting principles generally accepted in the United States of America. The preparation of such financial statements requires Management to make estimates and assumptions that affect the reported amounts of assets, liabilities, revenues and expenses and related disclosure of contingent assets and liabilities. On an ongoing basis, Management evaluates its estimates, including those related to the allowance for loan losses, goodwill, the valuation of mortgage servicing rights, and other-than-temporary impairment on securities. Management bases its estimates on historical experience and on various other assumptions that are believed to be reasonable under the circumstances, the results of which form the basis in making judgments about the carrying values of assets that are not readily apparent from other sources. Actual results could differ from the amount derived from Management’s estimates and assumptions under different assumptions or conditions.
Allowance for Loan Losses.
Management believes the allowance for loan losses requires the most significant estimates and assumptions used in the preparation of the consolidated financial statements. The allowance for loan losses is based on Management’s evaluation of the level of the allowance required in relation to the estimated loss exposure in the loan portfolio. Management believes the allowance for loan losses is a significant estimate and therefore regularly evaluates it for adequacy by taking into consideration factors such as prior loan loss experience, the character and size of the loan portfolio, business and economic conditions and Management’s estimation of potential losses. The use of different estimates or assumptions could produce different provisions for loan losses.
Goodwill.
Management utilizes numerous techniques to estimate the value of various assets held by the Company, including methods to determine the appropriate carrying value of goodwill as required under Financial Accounting Standards Board (“FASB”) Accounting Standards Codification (“ASC”) Topic 350 “Intangibles – Goodwill and Other.” In addition, goodwill from a purchase acquisition is subject to ongoing periodic impairment tests, which include an evaluation of the ongoing assets, liabilities and revenues from the acquisition and an estimation of the impact of business conditions.
Mortgage Servicing Rights.
The valuation of mortgage servicing rights is a critical accounting policy which requires significant estimates and assumptions. The Bank often sells mortgage loans it originates and retains the ongoing servicing of such loans, receiving a fee for these services, generally 0.25% of the outstanding balance of the loan per annum. Mortgage servicing rights are recognized when they are acquired through the sale of loans, and are reported in other assets. They are amortized into non-interest income in proportion to, and over the period of, the estimated future net servicing income of the underlying financial assets. Management uses an independent firm which specializes in the valuation of mortgage servicing rights to determine the fair value which is recorded on the balance sheet. The most important assumption is the anticipated loan prepayment rate, and increases in prepayment speed results in lower valuations of mortgage servicing rights. The valuation also includes an evaluation for impairment based upon the fair value of the rights, which can vary depending upon current interest rates and prepayment expectations, as compared to amortized cost. Impairment is determined by stratifying rights by predominant characteristics, such as interest rates and terms. The use of different assumptions could produce a different valuation. All of the assumptions are based on standards the Company believes would be utilized by market participants in valuing mortgage servicing rights and are consistently derived and/or benchmarked against independent public sources.
Other-Than-Temporary Impairment on Securities.
One of the significant estimates related to investment securities is the evaluation of other-than-temporary impairments. The evaluation of securities for other-than-temporary impairments is a quantitative and qualitative process, which is subject to risks and uncertainties and is intended to determine whether declines in the fair value of investments should be recognized in current period earnings. The risks and uncertainties include changes in general economic conditions, the issuer’s financial condition and/or future prospects, the effects of changes in interest rates or credit spreads and the expected recovery period of unrealized losses. Securities that are in an unrealized loss position are reviewed at least quarterly to determine if other-than-temporary impairment is present based on certain quantitative and qualitative factors and measures. The primary factors considered in evaluating whether a decline in value of securities is other-than-temporary include: (a) the length of time and extent to which the fair value has been less than cost or amortized cost and the expected recovery period of the security, (b) the financial condition, credit rating and future prospects of the issuer, (c) whether the debtor is current on contractually obligated interest and principal payments, (d) the volatility of the securities’ market price, (e) the intent and ability of the Company to retain the investment for a period of time sufficient to allow for recovery, which may be at maturity and (f) any other information and observable data considered relevant in determining whether other-than-temporary impairment has occurred, including the expectation of receipt of all principal and interest when due.
The First Bancorp 2010 Form 10-K
Page 20
Use of Non-GAAP Financial Measures
Certain information in Management’s Discussion and Analysis of Financial Condition and Results of Operations and elsewhere in this Report contains financial information determined by methods other than in accordance with accounting principles generally accepted in the United States of America ("GAAP"). Management uses these “non-GAAP” measures in its analysis of the Company’s performance and believes that these non-GAAP financial measures provide a greater understanding of ongoing operations and enhance comparability of results with prior periods as well as demonstrating the effects of significant gains and charges in the current period. The Company believes that a meaningful analysis of its financial performance requires an understanding of the factors underlying that performance. Management believes that investors may use these non-GAAP financial measures to analyze financial performance without the impact of unusual items that may obscure trends in the Company’s underlying performance. These disclosures should not be viewed as a substitute for operating results determined in accordance with GAAP, nor are they necessarily comparable to non-GAAP performance measures that may be presented by other companies.
In several places in this report, net interest income is presented on a fully taxable equivalent basis. Specifically included in interest income was tax-exempt interest income from certain investment securities and loans. An amount equal to the tax benefit derived from this tax exempt income has been added back to the interest income total, which adjustments increased net interest income accordingly. Management believes the disclosure of tax-equivalent net interest income information improves the clarity of financial analysis, and is particularly useful to investors in understanding and evaluating the changes and trends in the Company’s results of operations. Other financial institutions commonly present net interest income on a tax-equivalent basis. This adjustment is considered helpful in the comparison of one financial institution’s net interest income to that of another institution, as each will have a different proportion of tax-exempt interest from its earning assets. Moreover, net interest income is a component of a second financial measure commonly used by financial institutions, net interest margin, which is the ratio of net interest income to average earning assets. For purposes of this measure as well, other financial institutions generally use tax-equivalent net interest income to provide a better basis of comparison from institution to institution. The Company follows these practices. The following table provides a reconciliation of tax-equivalent financial information to the Company’s consolidated financial statements, which have been prepared in accordance with GAAP. A 35.0% tax rate was used in 2010, 2009 and 2008.
|
Years ended December 31,
|
||||||||||||
|
Dollars in thousands
|
2010
|
2009
|
2008
|
|||||||||
|
Net interest income as presented
|
$ | 40,589 | $ | 43,653 | $ | 37,703 | ||||||
|
Effect of tax-exempt income
|
2,281 | 2,395 | 2,187 | |||||||||
|
Net interest income, tax equivalent
|
$ | 42,870 | $ | 46,048 | $ | 39,890 | ||||||
The Company presents its efficiency ratio using non-GAAP information. The GAAP-based efficiency ratio is noninterest expenses divided by net interest income plus noninterest income from the Consolidated Statements of Income. The non-GAAP efficiency ratio excludes securities losses and other-than-temporary impairment charges from noninterest expenses, excludes securities gains from noninterest income, and adds the tax-equivalent adjustment to net interest income. The following table provides a reconciliation of between the GAAP and non-GAAP efficiency ratio:
The First Bancorp 2010 Form 10-K
Page 21
|
Years ended December 31,
|
||||||||||||
|
In thousands of dollars
|
2010
|
2009
|
2008
|
|||||||||
|
Non-interest expense, as presented
|
$ | 25,130 | $ | 26,658 | $ | 22,994 | ||||||
|
Net securities losses
|
- | (150 | ) | (89 | ) | |||||||
|
Other than temporary impairment charge
|
- | (916 | ) | - | ||||||||
|
Adjusted non-interest expense
|
25,130 | 25,592 | 22,905 | |||||||||
|
Net interest income, as presented
|
40,589 | 43,653 | 37,703 | |||||||||
|
Effect of tax-exempt income
|
2,281 | 2,395 | 2,187 | |||||||||
|
Non-interest income, as presented
|
9,135 | 12,754 | 9,646 | |||||||||
|
Effect of non-interest tax-exempt income
|
189 | 185 | 186 | |||||||||
|
Net securities gains
|
2 | - | - | |||||||||
|
Adjusted net interest income plus non-interest income
|
$ | 52,196 | $ | 58,987 | $ | 49,722 | ||||||
|
Non-GAAP efficiency ratio
|
48.15 | % | 43.39 | % | 46.07 | % | ||||||
|
GAAP efficiency ratio
|
50.54 | % | 47.26 | % | 48.56 | % | ||||||
The Company presents certain information based upon average tangible common shareholders’ equity instead of total average shareholders’ equity. The difference between these two measures is the Company’s intangible assets, specifically goodwill from prior acquisitions, and preferred stock. Management, banking regulators and many stock analysts use the tangible common equity ratio and the tangible book value per common share in conjunction with more traditional bank capital ratios to compare the capital adequacy of banking organizations with significant amounts of goodwill or other intangible assets, typically stemming from the use of the purchase accounting method in accounting for mergers and acquisitions. The following table provides a reconciliation of tangible average shareholders’ equity to the Company’s consolidated financial statements, which have been prepared in accordance with GAAP:
|
Years ended December 31,
|
||||||||||||
|
In thousands of dollars
|
2010
|
2009
|
2008
|
|||||||||
|
Average shareholders’ equity as presented
|
$ | 151,739 | $ | 146,854 | $ | 116,448 | ||||||
|
Less preferred stock (average)
|
(24,606 | ) | (24,452 | ) | - | |||||||
|
Less intangible assets
|
(27,684 | ) | (27,684 | ) | (27,684 | ) | ||||||
|
Average tangible common shareholders’ equity
|
$ | 99,449 | $ | 94,718 | $ | 88,764 | ||||||
The First Bancorp 2010 Form 10-K
Page 22
Executive Summary
Net income for the year ended December 31, 2010 was $12.1 million, down $926,000 or 7.1% from the $13.0 million posted for the year ended December 31, 2009. Earnings per common share on a fully diluted basis were $1.10 for the year ended December 31, 2010, down $0.12 or 9.8% from the $1.22 posted for the year ended December 31, 2009. Net interest income on a tax-equivalent basis was down $3.1 million for the year ended December 31, 2010 compared to the year ended December 31, 2009, with the variance coming from the net interest margin dropping from 3.66% to 3.38%. Margin compression was responsible for approximately $1.1 million of this change while $2.0 million was attributable to lengthening the maturity of our liabilities to reduce interest rate risk.
While we continue to be in the longest and worst economic downturn since the Great Depression of the 1930’s, the Company feels that the deteriorating trend in credit quality experienced during the past three years somewhat stabilized in 2010. Non-performing loans stood at 2.39% of total loans on December 31, 2010 compared to 2.36% of total loans on September 30, 2010 and 1.95% on December 31, 2009. This compares favorably to nonperforming loans at 3.39% for our Uniform Bank Performance Report peer group (“UBPR peer group”) as of December 31, 2010. Net chargeoffs were $8.7 million or 0.94% of average loans in 2010 compared to net charge offs of $7.3 million or 0.75% of average loans in 2009. Net charge offs for the UBPR peer group in 2010 were 1.28% of average loans.
The slump in the housing market is continuing and the national unemployment rate was 9.4% at December 31, 2010. Fortunately, the unemployment rate in Maine, at 7.3%, was much better than the national average and ranks as the fourteenth-best state in the country. Unemployment numbers, however, do not reflect the number of people experiencing reduced incomes from wage cutbacks and loss of overtime. We provisioned $8.4 million for loan losses in 2010, down $3.8 million from the $12.2 million provision made during 2009. Although the allowance for loan losses decreased $321,000 during the year, it stands at 1.50% of outstanding loans at December 31, 2010 compared to 1.43% of outstanding loans at December 31, 2009.
During 2010, total assets increased $62.4 million or 4.7%. The loan portfolio was down $64.9 million or 6.8%, with a drop due to refinancing of mortgages to very low fixed rates that have been sold to the secondary market. The investment portfolio is up $128.2 million or 44.6% for the year. On the liability side of the balance sheet, low-cost deposits have increased $22.6 million or 8.3% for the year, and local certificates of deposit are up $8.2 million or 3.6%.
Remaining well capitalized remains a top priority for The First Bancorp. In the past two years, the Company’s total risk-based capital has increased from 11.13% to 16.23%, well above the well-capitalized threshold of 10.0% set by the FDIC. In Management’s view, participating in the U.S. Treasury Capital Purchase Program was the right decision for The First Bancorp. The Company obtained additional capital at a relatively low cost and it provides us with greater ability to ride out the current economic storm and allows us more flexibility to work with individuals and businesses as they too struggle through these adverse economic conditions.
The Company’s operating ratios remain good, with a return on average tangible common equity of 10.83% for the year ended December 31, 2010 compared to 12.54% for the year ended December 31, 2009. Our return on average equity was in the top 30% of all banks in the UBPR peer group, which had an average return of 3.12% for the year. Our efficiency ratio continues to be an important component in our overall performance; it slipped to 48.15% in 2010 compared to 43.39% in 2009. This was the result of lower revenues and not due to a significant increase in operating expenses. As of December 31, 2010, the average efficiency ratio for our UBPR peer group was 67.23%, which put us in the top 9% of all banks in the UBPR peer group.
Results of Operations
Net Interest Income
Net interest income decreased 7.0% or $3.1 million to $40.6 million for the year ended December 31, 2010 from the $43.7 million reported for the year ended December 31, 2009. Margin compression was responsible for approximately $1.1 million of this change while $2.0 million was attributable to lengthening the maturity of our liabilities to reduce interest rate risk, which led to the Company’s net interest margin on a tax-equivalent basis decreasing from 3.66% in 2009 to 3.38% in 2010.
Total interest income in 2010 was $57.3 million, a decrease of $5.3 million or 8.5% from the $62.6 million posted by the Company in 2009. Total interest expense in 2010 was $16.7 million, a decrease of $2.2 million or 11.9% from the $18.9 million posted by the Company in 2009. The decrease in both interest income and interest expense was attributable to lower interest rates. Tax-exempt interest income amounted to $4.2 million for the year ended December 31, 2010, $4.4 million for the year ended December 31, 2009 and $4.1 million for the year ended December 31, 2008.
The First Bancorp 2010 Form 10-K
Page 23
The following tables present changes in interest income and expense attributable to changes in interest rates, volume, and rate/volume
1
for interest-earning assets and interest-bearing liabilities. Tax-exempt income is calculated on a tax-equivalent basis, using a 35.0% tax rate.
|
Year ended December 31, 2010 compared to 2009
|
||||||||||||||||
|
Dollars in thousands
|
Volume
|
Rate
|
Rate/Volume
1
|
Total
|
||||||||||||
|
Interest on earning assets
|
||||||||||||||||
|
Interest-bearing deposits
|
$ | (1 | ) | $ | (1 | ) | $ | 1 | $ | (1 | ) | |||||
|
Investment securities
|
3,420 | (2,555 | ) | (587 | ) | 278 | ||||||||||
|
Loans held for sale
|
33 | (7 | ) | (1 | ) | 25 | ||||||||||
|
Loans
|
(2,813 | ) | (3,086 | ) | 174 | (5,725 | ) | |||||||||
|
Total interest income
|
639 | (5,649 | ) | (413 | ) | (5,423 | ) | |||||||||
|
Interest expense
|
||||||||||||||||
|
Deposits
|
129 | (1,685 | ) | (19 | ) | (1,575 | ) | |||||||||
|
Borrowings
|
(492 | ) | (191 | ) | 13 | (670 | ) | |||||||||
|
Total interest expense
|
(363 | ) | (1,876 | ) | (6 | ) | (2,245 | ) | ||||||||
|
Change in net interest income
|
$ | 1,002 | $ | (3,773 | ) | $ | (407 | ) | $ | (3,178 | ) | |||||
|
Year ended December 31, 2009 compared to 2008
|
||||||||||||||||
|
Dollars in thousands
|
Volume
|
Rate
|
Rate/Volume
1
|
Total
|
||||||||||||
|
Interest on earning assets
|
||||||||||||||||
|
Interest-bearing deposits
|
$ | 4 | $ | (3 | ) | $ | (3 | ) | $ | (2 | ) | |||||
|
Investment securities
|
3,002 | (2,424 | ) | (491 | ) | 87 | ||||||||||
|
Loans held for sale
|
30 | (4 | ) | (1 | ) | 25 | ||||||||||
|
Loans
|
2,008 | (10,359 | ) | (355 | ) | (8,706 | ) | |||||||||
|
Total interest income
|
5,044 | (12,790 | ) | (850 | ) | (8,596 | ) | |||||||||
|
Interest expense
|
||||||||||||||||
|
Deposits
|
2,694 | (12,373 | ) | (1,449 | ) | (11,128 | ) | |||||||||
|
Borrowings
|
(1,651 | ) | (2,335 | ) | 361 | (3,625 | ) | |||||||||
|
Total interest expense
|
1,043 | (14,708 | ) | (1,088 | ) | (14,753 | ) | |||||||||
|
Change in net interest income
|
$ | 4,001 | $ | 1,918 | $ | 238 | $ | 6,157 | ||||||||
1
Represents the change attributable to a combination of change in rate and change in volume.
The First Bancorp 2010 Form 10-K
Page 24
The following table presents, for the years ended December 31, 2010, 2009, and 2008, the interest earned on or paid for each major asset and liability category, respectively, the average yield for each major asset and liability category, and the net yield between assets and liabilities. Tax-exempt income has been calculated on a tax-equivalent basis using a 35% rate. Unrecognized interest on non-accrual loans is not included in the amount presented, but the average balance of non-accrual loans is included in the denominator when calculating yields.
|
2010
|
2009
|
2008
|
||||||||||||||||||||||
|
Dollars in thousands
|
Amount of interest
|
Average Yield/Rate
|
Amount of interest
|
Average Yield/Rate
|
Amount of interest
|
Average Yield/Rate
|
||||||||||||||||||
|
Interest on earning assets
|
||||||||||||||||||||||||
|
Interest-bearing deposits
|
$ | 1 | 0.25 | % | $ | 1 | 0.25 | % | $ | 3 | 1.65 | % | ||||||||||||
|
Investment securities
|
15,170 | 4.49 | % | 14,893 | 5.42 | % | 14,806 | 6.07 | % | |||||||||||||||
|
Loans held for sale
|
150 | 4.73 | % | 125 | 4.99 | % | 78 | 4.05 | % | |||||||||||||||
|
Loans
|
44,220 | 4.77 | % | 49,945 | 5.09 | % | 58,672 | 6.16 | % | |||||||||||||||
|
Total interest-earning assets
|
59,541 | 4.70 | % | 64,964 | 5.16 | % | 73,559 | 6.14 | % | |||||||||||||||
|
Interest-bearing liabilities
|
||||||||||||||||||||||||
|
Deposits
|
10,297 | 1.15 | % | 11,872 | 1.35 | % | 23,000 | 2.90 | % | |||||||||||||||
|
Borrowings
|
6,374 | 2.76 | % | 7,044 | 2.84 | % | 10,669 | 3.62 | % | |||||||||||||||
|
Total interest-bearing liabilities
|
16,671 | 1.48 | % | 18,916 | 1.67 | % | 33,669 | 3.10 | % | |||||||||||||||
|
Net interest income
|
$ | 42,870 | $ | 46,048 | $ | 39,890 | ||||||||||||||||||
|
Interest rate spread
|
3.22 | % | 3.49 | % | 3.04 | % | ||||||||||||||||||
|
Net interest margin
|
3.38 | % | 3.66 | % | 3.33 | % | ||||||||||||||||||
The First Bancorp 2010 Form 10-K
Page 25
Average Daily Balance Sheets
The following table shows the Company’s average daily balance sheets for the years ended December 31, 2010, 2009 and 2008.
|
Years ended December 31,
|
||||||||||||
|
In thousands of dollars
|
2010
|
2009
|
2008
|
|||||||||
|
Assets
|
||||||||||||
|
Cash and due from banks
|
$ | 15,722 | $ | 14,288 | $ | 16,281 | ||||||
|
Overnight funds sold
|
88 | 407 | 181 | |||||||||
|
Securities available for sale
|
178,116 | 29,040 | 22,865 | |||||||||
|
Securities to be held to maturity
|
144,601 | 245,972 | 205,783 | |||||||||
|
Federal Reserve Bank stock, at cost
|
1,412 | 783 | 610 | |||||||||
|
Federal Home Loan Bank Stock, at cost
|
14,031 | 14,031 | 14,031 | |||||||||
|
Loans held for sale (fair value approximates cost)
|
3,173 | 2,506 | 1,923 | |||||||||
|
Loans
|
926,338 | 981,628 | 949,135 | |||||||||
|
Allowance for loan losses
|
(14,393 | ) | (11,277 | ) | (7,607 | ) | ||||||
|
Net loans
|
911,945 | 970,351 | 941,528 | |||||||||
|
Accrued interest receivable
|
5,397 | 6,027 | 6,846 | |||||||||
|
Premises and equipment, net of accumulated depreciation
|
18,463 | 18,024 | 16,228 | |||||||||
|
Other real estate owned
|
5,276 | 2,652 | 1,736 | |||||||||
|
Goodwill
|
27,684 | 27,684 | 27,684 | |||||||||
|
Other assets
|
29,159 | 21,752 | 17,737 | |||||||||
|
Total Assets
|
$ | 1,355,067 | $ | 1,353,517 | $ | 1,273,433 | ||||||
|
Liabilities & Shareholders' Equity
|
||||||||||||
|
Demand deposits
|
$ | 69,260 | $ | 65,567 | $ | 63,495 | ||||||
|
NOW deposits
|
118,400 | 106,895 | 105,689 | |||||||||
|
Money market deposits
|
78,155 | 108,922 | 123,699 | |||||||||
|
Savings deposits
|
97,484 | 87,921 | 86,018 | |||||||||
|
Certificates of deposit
|
597,982 | 578,713 | 474,517 | |||||||||
|
Total deposits
|
961,281 | 948,018 | 853,418 | |||||||||
|
Borrowed funds – short term
|
127,160 | 149,601 | 131,890 | |||||||||
|
Borrowed funds – long term
|
103,775 | 98,690 | 161,855 | |||||||||
|
Dividends payable
|
989 | 953 | 850 | |||||||||
|
Other liabilities
|
10,123 | 9,401 | 8,972 | |||||||||
|
Total Liabilities
|
1,203,328 | 1,206,663 | 1,156,985 | |||||||||
|
Shareholders' Equity:
|
||||||||||||
|
Preferred Stock
|
24,606 | 24,452 | - | |||||||||
|
Common stock
|
97 | 97 | 97 | |||||||||
|
Additional paid-in capital
|
45,187 | 44,807 | 44,214 | |||||||||
|
Retained earnings
|
81,288 | 78,072 | 72,492 | |||||||||
|
Accumulated other comprehensive income (loss)
|
||||||||||||
|
Net unrealized gains (losses) on available-for-sale securities
|
762 | (310 | ) | (87 | ) | |||||||
|
Net unrealized loss on post-retirement benefit costs
|
(201 | ) | (264 | ) | (268 | ) | ||||||
|
Total Shareholders' Equity
|
151,739 | 146,854 | 116,448 | |||||||||
|
Total Liabilities & Shareholders' Equity
|
$ | 1,355,067 | $ | 1,353,517 | $ | 1,273,433 | ||||||
The First Bancorp 2010 Form 10-K
Page 26
Non-Interest Income
Non-interest income in 2010 was $9.1 million, a decrease of 28.4% from the $12.8 million reported in 2009. This decrease was partly attributable to mortgage origination and servicing income, which decreased $0.5 million or 23.3% as a result of a lower volume of residential mortgages refinancing and a portion of these loans being sold to the secondary market. It was also impacted by the sale of the merchant credit card servicing portfolio in December of 2009. As a result of this sale, $2.3 million in revenues which were recognized in 2009 were not repeated in 2010.
Non-interest expense in 2010 was $25.1 million, a decrease of 5.7% from the $26.7 million reported in 2009. This decrease was partly attributable to an other-than-temporary impairment charge of $0.9 million recorded during the first quarter of 2009 that did not recur in 2010. It was also impacted by the sale of the merchant credit card servicing portfolio in December of 2009. As a result of this sale, $2.2 million in expense that was recognized during 2009 was not repeated in 2010.
Provision to the Allowance for Loan Losses
The Company’s provision to the allowance for loan losses was $8.4 million in 2010 compared to $12.2 million in 2009. This was 0.62% of average assets in 2010, compared to 0.95% of average assets for our peer group. The level of provision in 2010 was to maintain the allowance for loan losses at an adequate level given the size of our loan portfolio and our overall asset quality. While our allowance for loan losses decreased by $321,000 in 2010 from the 2009 level, the allowance for loan losses stands at 1.50% of outstanding loans at December 31, 2010 compared to 1.43% of outstanding loans at December 31, 2009. Given the number of economic uncertainties at this time, Management believes it is prudent to continue to provision for loan losses and that the current level is directionally consistent with the credit quality seen in the portfolio. A further discussion of asset and credit quality can be found in “Assets and Asset Quality”.
Net Income
Net income for 2010 was $12.1 million – a 7.1% or $926,000 decrease from net income of $13.0 million that was posted in 2009. Earnings per share on a fully diluted basis were $1.10, down $0.12 or 9.8% from the $1.22 reported for the year ended December 31, 2009.
Key Ratios
Return on average assets in 2010 was 0.89%, down from the 0.96% posted in 2009. Return on average tangible common equity was 10.83% in 2010, compared to 12.54% in 2009 and 15.75% in 2008. In 2010, the Company’s dividend payout ratio (dividends declared per share divided by earnings per share) was 70.91%, compared to 63.93% in 2009 and 52.76% in 2008. The Company’s efficiency ratio – a benchmark measure of the amount spent to generate a dollar of income – was 48.15% in 2010 compared to 67.23% for the Bank’s peer group, on average. In 2009, the Bank’s efficiency ratio was 43.39% compared to 74.23% for the Bank’s peer group, on average. The rise in the efficiency for 2010 was the result of lower revenues and not due to a significant increase in operating expenses.
Investment Management and Fiduciary Activities
As of December 31, 2010, First Advisors, the Bank’s private banking and investment management division, had assets under management with a market value of $562.6 million, consisting of 674 trust accounts, estate accounts, agency accounts, and self-directed individual retirement accounts. This compares to December 31, 2009, when 918 accounts with a market value of $205.2 million were under management. The significant increase in assets under management in 2010 was the result of First Advisors assuming responsibility for managing the Bank’s investment portfolio. Without the addition of the Bank’s investment portfolio, assets under management would have declined to $185.4 million.
The First Bancorp 2010 Form 10-K
Page 27
Assets and Asset Quality
Total assets increased in 2010, with the investment portfolio providing all the growth, increasing $128.2 million or 44.6% over December 31, 2009, while the loan portfolio decreased $64.9 million or 6.8%. Total assets increased 4.7% or $62.4 million from $1.331 billion at December 31, 2009, to $1.394 billion at December 31, 2010.
While the weaknesses in the national and global economies have not impacted coastal Maine as much as some other parts of the country, we nevertheless experienced a deterioration in asset quality in our loan portfolio, although it has been relatively stable for the past year. Non-performing assets to total assets stood at 1.87% at December 31, 2010, a slight increase over 1.80% at December 31, 2009. This increase is attributable to the impact that the weakened economy is having on our borrowers. Small businesses are seeing revenue/sales decreases and some are struggling to meet their obligations with a declining revenue base. A number of consumers have lost their jobs or seen a reduction in hours worked and/or overtime, thereby creating strained finances resulting in payment issues on their loans. In Management’s opinion, the Company’s long-standing approach to working with borrowers and ethical loan underwriting standards helps alleviate some of the payment problems on customers’ loans and in the end minimizes actual loan losses.
Net charge offs in 2010 were $8.7 million or 0.94% of average loans outstanding compared to $7.3 million or 0.75% of average loans outstanding in 2009. Despite the increase, this is relatively low compared to most banks in the country and our UBPR peer group, which had net charge offs of 1.28% of average loans outstanding in 2010. We manage our loan portfolio to minimize losses and have shown an excellent track record for the past 20 years with annual average charge offs of 0.26% of average loans outstanding.
Residential real estate term loans represent 38.1% of the total loan portfolio, and this loan category generally has a lower level of losses in comparison to other loan types. In 2010, the loss ratio for residential mortgages was 0.12% compared to 0.94% for the entire loan portfolio. The Company does not have a credit card portfolio or offer dealer consumer loans which generally carry more risk and therefore higher losses.
The allowance for loan losses ended the year at $13.3 million and stood at 1.50% of total loans outstanding compared to $13.6 million and 1.43% of total loans outstanding at December 31, 2009. An $8.4 million provision for losses was made in 2010 and net charge offs totaled $8.7 million, resulting in the allowance for loan losses decreasing $321,000 or 2.4% from December 31, 2009.
Management believes the allowance for loan losses is adequate as of December 31, 2010. In Management’s opinion, the level of the provision for loan losses is directionally consistent with the overall credit quality of our loan portfolio and corresponding levels of nonperforming loans and unallocated reserves, as well as with the performance of the national and local economies, higher levels of unemployment and the outlook for economic weakness continuing for some time to come.
Investment Activities
During 2010, the investment portfolio increased 44.6% to end the year at $416.1 million compared to $287.8 million at December 31, 2009. This increase is primarily due to the purchase of GNMA mortgage-backed securities, which have no credit risk since they are fully backed by the U.S. Government. The Company’s investment securities are classified into two categories: securities available for sale and securities to be held to maturity. Securities available for sale consist primarily of debt securities which Management intends to hold for indefinite periods of time. They may be used as part of the Company’s funds management strategy, and may be sold in response to changes in interest rates, prepayment risk and liquidity needs, to increase capital ratios, or for other similar reasons. Securities to be held to maturity consist primarily of debt securities that the Company has acquired solely for long-term investment purposes, rather than for trading or future sale. For securities to be categorized as held to maturity, Management must have the intent and the Company must have the ability to hold such investments until their respective maturity dates. The Company does not hold trading account securities.
All investment securities are managed in accordance with a written investment policy adopted by the Board of Directors. It is the Company’s general policy that investments for either portfolio be limited to government debt obligations, time deposits, and corporate bonds or commercial paper with one of the three highest ratings given by a nationally recognized rating agency. The portfolio is currently invested primarily in U.S. Government agency securities and tax-exempt obligations of states and political subdivisions. The individual securities have been selected to enhance the portfolio’s overall yield while not materially adding to the Company’s level of interest rate risk.
The following table sets forth the Company’s investment securities at their carrying amounts as of December 31, 2010, 2009, and 2008.
The First Bancorp 2010 Form 10-K
Page 28
|
Dollars in thousands
|
2010
|
2009
|
2008
|
|||||||||
|
Securities available for sale
|
||||||||||||
|
U.S. Treasury and agency
|
$ | 16,045 | $ | 30,959 | $ | - | ||||||
|
Mortgage-backed securities
|
234,414 | 31,148 | 922 | |||||||||
|
State and political subdivisions
|
41,524 | 18,514 | 8,910 | |||||||||
|
Corporate securities
|
866 | 818 | 2,977 | |||||||||
|
Other equity securities
|
380 | 399 | 263 | |||||||||
| 293,229 | 81,838 | 13,072 | ||||||||||
|
Securities to be held to maturity
|
||||||||||||
|
U.S. Treasury and agency
|
2,190 | 39,099 | 110,513 | |||||||||
|
Mortgage-backed securities
|
55,710 | 90,193 | 60,774 | |||||||||
|
State and political subdivisions
|
49,330 | 61,095 | 62,330 | |||||||||
|
Corporate securities
|
150 | 150 | 1,150 | |||||||||
| 107,380 | 190,537 | 234,767 | ||||||||||
|
Non-marketable Securities
|
||||||||||||
|
Federal Reserve Bank Stock
|
1,412 | 1,412 | 662 | |||||||||
|
Federal Home Loan Bank Stock
|
14,031 | 14,031 | 14,031 | |||||||||
| 15,443 | 15,443 | 14,693 | ||||||||||
|
Total securities
|
$ | 416,052 | $ | 287,818 | $ | 262,532 | ||||||
The following table sets forth information on the yields and expected maturities of the Company’s investment securities as of December 31, 2010. Yields on tax-exempt securities have been computed on a tax-equivalent basis using a tax rate of 35%. Mortgage-backed securities are presented according to their contractual maturity date, while the yield takes into effect intermediate cashflows from repayment of principal which results in a much shorter average life.
|
Available For Sale
|
Held to Maturity
|
|||||||||||||||
|
Dollars in thousands
|
Fair Value
|
Yield to maturity
|
Amortized Cost
|
Yield to maturity
|
||||||||||||
|
U.S. Treasury & Agency
|
||||||||||||||||
|
Due in 1 year or less
|
$ | - | 0.00 | % | $ | - | 0.00 | % | ||||||||
|
Due in 1 to 5 years
|
- | 0.00 | % | - | 0.00 | % | ||||||||||
|
Due in 5 to 10 years
|
- | 0.00 | % | - | 0.00 | % | ||||||||||
|
Due after 10 years
|
16,045 | 5.34 | % | 2,190 | 6.50 | % | ||||||||||
|
Total
|
16,045 | 5.34 | % | 2,190 | 6.50 | % | ||||||||||
|
Mortgage-Backed Securities
|
||||||||||||||||
|
Due in 1 year or less
|
- | 0.00 | % | - | 6.12 | % | ||||||||||
|
Due in 1 to 5 years
|
28 | 5.71 | % | 968 | 4.16 | % | ||||||||||
|
Due in 5 to 10 years
|
76 | 8.50 | % | 954 | 5.97 | % | ||||||||||
|
Due after 10 years
|
234,310 | 4.06 | % | 53,788 | 4.10 | % | ||||||||||
|
Total
|
234,414 | 4.06 | % | 55,710 | 4.13 | % | ||||||||||
|
State & Political Subdivisions
|
||||||||||||||||
|
Due in 1 year or less
|
- | 0.00 | % | 1,045 | 7.44 | % | ||||||||||
|
Due in 1 to 5 years
|
3,071 | 7.07 | % | 4,507 | 6.23 | % | ||||||||||
|
Due in 5 to 10 years
|
2,328 | 7.37 | % | 12,884 | 6.51 | % | ||||||||||
|
Due after 10 years
|
36,125 | 6.54 | % | 30,894 | 6.32 | % | ||||||||||
|
Total
|
41,524 | 6.63 | % | 49,330 | 6.38 | % | ||||||||||
|
Corporate Securities
|
||||||||||||||||
|
Due in 1 year or less
|
- | 0.00 | % | 150 | 1.50 | % | ||||||||||
|
Due in 1 to 5 years
|
- | 0.00 | % | - | 0.00 | % | ||||||||||
|
Due in 5 to 10 years
|
- | 0.00 | % | - | 0.00 | % | ||||||||||
|
Due after 10 years
|
866 | 1.37 | % | - | 0.00 | % | ||||||||||
|
Total
|
866 | 1.37 | % | 150 | 1.50 | % | ||||||||||
|
Equity Securities
|
380 | 3.03 | % | - | 0.00 | % | ||||||||||
| $ | 293,229 | 4.48 | % | $ | 107,380 | 5.21 | % | |||||||||
Page 29
Impaired Securities
The securities portfolio contains certain securities, the amortized cost of which exceeds fair value, which at December 31, 2010 amounted to an excess of $5.9 million, or 1.45% of the amortized cost of the total securities portfolio. At December 31, 2009 this amount represented an excess of $2.1 million, or 0.8% of the total securities portfolio. As a part of the Company’s ongoing security monitoring process, the Company identifies securities in an unrealized loss position that could potentially be other-than-temporarily impaired. If a decline in the fair value of an available-for-sale security is judged to be other-than-temporary, a charge is recorded in net realized securities losses equal to the difference between the fair value and cost or amortized cost basis of the security.
The Company’s evaluation of securities for impairments is a quantitative and qualitative process intended to determine whether declines in the fair value of investment securities should be recognized in current period earnings. The primary factors considered in evaluating whether a decline in the fair value of securities is other-than-temporary include: (a) the length of time and extent to which the fair value has been less than cost or amortized cost and the expected recovery period of the security, (b) the financial condition, credit rating and future prospects of the issuer, (c) whether the debtor is current on contractually obligated interest and principal payments, (d) the volatility of the securities market price, (e) the intent and ability of the Company to retain the investment for a period of time sufficient to allow for recovery, which may be at maturity, and (f) any other information and observable data considered relevant in determining whether other-than-temporary impairment has occurred.
The Company’s best estimate of cash flows uses severe economic recession assumptions due to market uncertainty. The Company’s assumptions include but are not limited to delinquencies, foreclosure levels and constant default rates on the underlying collateral, loss severity ratios, and constant prepayment rates. If the Company does not expect to receive 100% of future contractual principal and interest, an other-than-temporary impairment charge is recognized. Estimating future cash flows is a quantitative and qualitative process that incorporates information received from third party sources along with certain internal assumptions and judgments regarding the future performance of the underlying collateral.
Based on the foregoing evaluation criteria, the Company has one available-for-sale corporate security with an amortized cost of $1.0 million that is other-than-temporarily impaired because the Company could no longer conclude that it is probable that it will recover 100% of the investment. Accordingly, the Company recorded a $916,000 charge for other-than-temporary impairment of this security in the first quarter of 2009. While recording this impairment charge is consistent with GAAP, Management estimates that the ultimate economic losses that may be realized for other securities in the portfolio may be meaningfully less than the current “mark-to-market” losses. Management believes that the difference between the expected losses and current “mark-to-market” losses is largely attributable to current market illiquidity conditions, de-leveraging, and the historical disruption in the financial markets in general. In Management’s opinion, no additional write-down for other-than-temporary impairment is required.
As of December 31, 2010, the Company had temporarily impaired securities with a fair value of $212.9 million and unrealized losses of $5.9 million, as identified in the table below. Securities in a continuous unrealized loss position more than twelve-months amounted to $7.6 million as of December 31, 2010, compared with $2.2 million at December 31, 2009. The Company has concluded that these securities were not other-than-temporarily impaired. This conclusion was based on the issuers’ continued satisfaction of their obligations in accordance with their contractual terms and the expectation that the issuers will continue to do so, Management’s intent and ability to hold these securities for a period of time sufficient to allow for any anticipated recovery in fair value which may be at maturity, the expectation that the Company will receive 100% of future contractual cash flows, as well as the evaluation of the fundamentals of the issuers’ financial condition and other objective evidence. The following table summarizes temporarily impaired securities and their approximate fair values at December 31, 2010.
|
Less than 12 months
|
12 months or more
|
Total
|
||||||||||||||||||||||
|
Fair
|
Unrealized
|
Fair
|
Unrealized
|
Fair
|
Unrealized
|
|||||||||||||||||||
|
In thousands of dollars
|
Value
|
Losses
|
Value
|
Losses
|
Value
|
Losses
|
||||||||||||||||||
|
U.S. Treasury and agency
|
$ | - | $ | - | $ | - | $ | - | $ | - | $ | - | ||||||||||||
|
Mortgage-backed securities
|
160,767 | (2,654 | ) | 5,348 | (226 | ) | 166,115 | (2,880 | ) | |||||||||||||||
|
State and political subdivisions
|
44,513 | (2,307 | ) | 1,355 | (407 | ) | 45,868 | (2,714 | ) | |||||||||||||||
|
Corporate securities
|
- | - | 866 | (247 | ) | 866 | (247 | ) | ||||||||||||||||
|
Other equity securities
|
- | - | 56 | (10 | ) | 56 | (10 | ) | ||||||||||||||||
| $ | 205,280 | $ | (4,961 | ) | $ | 7,625 | $ | (890 | ) | $ | 212,905 | $ | (5,851 | ) | ||||||||||
The First Bancorp 2010 Form 10-K
Page 30
For securities with unrealized losses, the following information was considered in determining that the securities were not other-than-temporarily impaired:
Securities issued by the U.S. Treasury and U.S. Government-sponsored agencies and enterprises.
As of December 31, 2010 there were no unrealized losses on these securities, compared with $707,000 at December 31, 2009.
Mortgage-backed securities issued by U.S. Government agencies and U.S. Government-sponsored enterprises.
As of December 31, 2010, the total unrealized losses on these securities amounted to $2.9 million, compared with $602,000 at December 31, 2009. All of these securities were credit rated “AAA” by the major credit rating agencies. Management believes that securities issued by U.S. Government agencies bear no credit risk because they are backed by the full faith and credit of the United States and that securities issued by U.S. Government-sponsored enterprises have minimal credit risk, as these agencies enterprises play a vital role in the nation’s financial markets. Management believes that the unrealized losses at December 31, 2010 were attributable to changes in current market yields and spreads since the date the underlying securities were purchased, and does not consider these securities to be other-than-temporarily impaired at December 31, 2010. The Company also has the ability and intent to hold these securities until a recovery of their amortized cost, which may be at maturity.
Obligations of state and political subdivisions.
As of December 31, 2010, the total unrealized losses on municipal securities amounted to $2.7 million, compared with $485,000 at December 31, 2009. Municipal securities are supported by the general taxing authority of the municipality and, in the cases of school districts, are supported by state aid. At December 31, 2010 all municipal bond issuers were current on contractually obligated interest and principal payments. The Company attributes the unrealized losses at December 31, 2010 to changes in prevailing market yields and pricing spreads since the dates the underlying securities were purchased, combined with current market liquidity conditions and the disruption in the financial markets in general. Accordingly, the Company does not consider these municipal securities to be other-than-temporarily impaired at December 31, 2010. The Company also has the ability and intent to hold these securities until a recovery of their amortized cost, which may be at maturity.
Corporate securities.
As of December 31, 2010, the total unrealized losses on corporate securities amounted to $247,000, compared with $302,000 at December 31, 2009. Corporate securities are dependent on the operating performance of the issuers. At December 31, 2010 all corporate bond issuers were current on contractually obligated interest and principal payments. The Company attributes the unrealized losses at December 31, 2010 to changes in prevailing market yields and pricing spreads since the dates the underlying securities were purchased, combined with current market liquidity conditions and the disruption in the financial markets in general. Accordingly, the Company does not consider these corporate securities to be other-than-temporarily impaired at December 31, 2010. The Company also has the ability and intent to hold these securities until a recovery of their amortized cost, which may be at maturity.
Federal Home Loan Bank Stock
The Bank is a member of the Federal Home Loan Bank (“FHLB”) of Boston. The FHLB is a cooperatively owned wholesale bank for housing and finance in the six New England States. Its mission is to support the residential mortgage and community-development lending activities of its members, which include over 450 financial institutions across New England. As a requirement of membership in the FHLB, the Bank must own a minimum required amount of FHLB stock, calculated periodically based primarily on its level of borrowings from the FHLB. The Company uses the FHLB for much of its wholesale funding needs. As of December 31, 2010 and December 31, 2009, the Company’s investment in FHLB stock totaled $14.0 million.
FHLB stock is a non-marketable equity security and therefore is reported at cost, which equals par value. Shares held in excess of the minimum required amount are generally redeemable at par value. However, in the first quarter of 2009 the FHLB announced a moratorium on such redemptions in order to preserve its capital in response to current
market conditions and declining retained earnings. The minimum required shares are redeemable, subject to certain limitations, five years following termination of FHLB membership. The Bank has no intention of terminating its FHLB membership. The Company had no dividend income on its FHLB stock in 2010.
For the year ended December 31, 2010, FHLB’s net income was $106.6 million, compared with a net loss of $186.8 million for 2009. Although the Company had no dividend income on its FHLB stock in 2010, in February 2011 FHLB’s board of directors declared a dividend equal to an annual yield of 0.30 percent, based on average stock outstanding for the fourth quarter of 2010, to be paid on March 2, 2011. FHLB’s board of directors anticipates that it will continue to declare modest cash dividends through 2011, but cautioned that adverse events such as a negative trend in credit losses on the FHLB’s private-label mortgage-backed securities or mortgage portfolio, a meaningful decline in income, or regulatory disapproval could lead to reconsideration of this plan.
The First Bancorp 2010 Form 10-K
Page 31
The Company periodically evaluates its investment in FHLB stock for impairment based on, among other factors, the capital adequacy of the FHLB and its overall financial condition. No impairment losses have been recorded through December 31, 2009. The Bank will continue to monitor its investment in FHLB stock.
Lending Activities
The loan portfolio declined $64.9 million or 6.8% in 2010, with total loans at $887.6 million at December 31, 2010, compared to $952.5 million at December 31, 2009. Commercial loans decreased $14.5 million or 3.6% between December 31, 2009 and December 31, 2010, residential term loans decreased by $29.3 million or 8.0% during the same period as a result of borrowers refinancing home mortgage loans which were sold by the Bank to the secondary market. At the same time, municipal loans decreased by $24.1 million or 52.5%.
Commercial loans are comprised of three categories: commercial real estate loans, commercial construction loans and other commercial loans. Commercial real estate is primarily comprised of loans to small businesses collateralized by owner-occupied real estate, while other commercial is primarily comprised of loans to small businesses collateralized by plant and equipment, commercial fishing vessels and gear, and limited inventory-based lending. Commercial real estate loans typically have a maximum loan-to-value ratio of 75% based upon current appraisal information at the time the loan is made. Commercial construction loans comprise a very small portion of the portfolio, and at 31.8% of capital are well under the regulatory guidance of 100.0% of total risk-based capital. Construction and non-owner-occupied commercial real estate loans are at 98.5% of total capital, well under regulatory guidance of 300.0% of capital. Municipal loans are comprised of loans to municipalities in the State of Maine for capitalized expenditures, construction projects or tax-anticipation notes. All municipal loans are considered general obligations of the municipality and as such are collateralized by the taxing ability of the municipality for repayment of debt.
Residential loans are also comprised of two categories, term loans, which include traditional amortizing home mortgages, and construction loans, which include loans for owner-occupied residential construction. Residential loans typically have a 75% to 80% loan to value based upon current appraisal information at the time the loan is made. Home equity loans and lines of credit are generally underwritten to the same standards. Consumer loans are primarily short-term amortizing loans to individuals collateralized by automobiles, pleasure craft and recreation vehicles, with a maximum loan to value ratio of 80%-90% of the purchase price of the collateral. Consumer loans also include a small amount of unsecured short-term time notes to individuals.
The following table summarizes the loan portfolio as of December 31, 2010, 2009, 2008, 2007 and 2006.
|
As of December 31,
|
||||||||||||||||||||||||||||||||||||||||
|
In thousands
of dollars
|
2010
|
2009
|
2008
|
2007
|
2006
|
|||||||||||||||||||||||||||||||||||
|
Commercial
|
||||||||||||||||||||||||||||||||||||||||
|
Real estate
|
$ | 245,540 | 27.7 | % | $ | 240,178 | 25.2 | % | $ | 219,057 | 22.3 | % | $ | 202,301 | 22.0 | % | $ | 140,626 | 16.8 | % | ||||||||||||||||||||
|
Construction
|
41,869 | 4.7 | % | 48,714 | 5.1 | % | 48,182 | 4.9 | % | - | 0.0 | % | - | 0.0 | % | |||||||||||||||||||||||||
|
Other
|
101,462 | 11.4 | % | 114,486 | 12.0 | % | 118,109 | 12.1 | % | 109,954 | 11.9 | % | 189,908 | 22.7 | % | |||||||||||||||||||||||||
|
Municipal
|
21,833 | 2.5 | % | 45,952 | 4.8 | % | 34,832 | 3.6 | % | 34,425 | 3.7 | % | 23,724 | 2.8 | % | |||||||||||||||||||||||||
|
Residential
|
||||||||||||||||||||||||||||||||||||||||
|
Term
|
337,927 | 38.1 | % | 367,267 | 38.7 | % | 431,520 | 44.0 | % | 431,237 | 46.9 | % | 371,242 | 44.3 | % | |||||||||||||||||||||||||
|
Construction
|
15,512 | 1.7 | % | 17,361 | 1.8 | % | 26,235 | 2.7 | % | 45,942 | 5.0 | % | 20,258 | 2.4 | % | |||||||||||||||||||||||||
|
Home equity
line of credit
|
105,297 | 11.9 | % | 94,324 | 9.9 | % | 77,206 | 7.9 | % | 74,199 | 8.1 | % | 73,453 | 8.8 | % | |||||||||||||||||||||||||
|
Consumer
|
18,156 | 2.0 | % | 24,210 | 2.5 | % | 24,132 | 2.5 | % | 22,106 | 2.4 | % | 18,934 | 2.3 | % | |||||||||||||||||||||||||
|
Total loans
|
$ | 887,596 | 100.0 | % | $ | 952,492 | 100.0 | % | $ | 979,273 | 100.0 | % | $ | 920,164 | 100.0 | % | $ | 838,145 | 100.0 | % | ||||||||||||||||||||
The First Bancorp 2010 Form 10-K
Page 32
The following table sets forth certain information regarding the contractual maturities of the Bank’s loan portfolio as of December 31, 2010:
|
In thousands of dollars
|
< 1 Year
|
1 - 5 Years
|
5 - 10 Years
|
> 10 Years
|
Total
|
|||||||||||||||
|
Commercial
|
||||||||||||||||||||
|
Real estate
|
$ | 8,691 | $ | 16,566 | $ | 19,070 | $ | 201,213 | $ | 245,540 | ||||||||||
|
Construction
|
9,184 | 8,059 | 354 | 24,272 | 41,869 | |||||||||||||||
|
Other
|
15,963 | 22,589 | 30,487 | 32,423 | 101,462 | |||||||||||||||
|
Municipal
|
4,061 | 2,558 | 8,760 | 6,454 | 21,833 | |||||||||||||||
|
Residential
|
||||||||||||||||||||
|
Term
|
5,522 | 12,250 | 24,982 | 295,173 | 337,927 | |||||||||||||||
|
Construction
|
6,976 | 1,269 | 301 | 6,966 | 15,512 | |||||||||||||||
|
Home equity line of credit
|
1,258 | 1,919 | 661 | 101,459 | 105,297 | |||||||||||||||
|
Consumer
|
6,855 | 7,522 | 1,250 | 2,529 | 18,156 | |||||||||||||||
|
Total loans
|
$ | 58,510 | $ | 72,732 | $ | 85,865 | $ | 670,489 | $ | 887,596 | ||||||||||
The following table provides a listing of loans by category, excluding loans held for sale, between variable and fixed rates as of December 31, 2010.
|
Fixed-Rate
|
Adjustable-Rate
|
Total
|
||||||||||||||||||||||
|
In thousands of dollars
|
Amount
|
% of total
|
Amount
|
% of total
|
Amount
|
% of total
|
||||||||||||||||||
|
Commercial
|
||||||||||||||||||||||||
|
Real estate
|
$ | 42,167 | 4.8 | % | $ | 203,373 | 22.9 | % | $ | 245,540 | 27.7 | % | ||||||||||||
|
Construction
|
5,770 | 0.7 | % | 36,099 | 4.0 | % | 41,869 | 4.7 | % | |||||||||||||||
|
Other
|
46,141 | 5.2 | % | 55,321 | 6.2 | % | 101,462 | 11.4 | % | |||||||||||||||
|
Municipal
|
18,257 | 2.1 | % | 3,576 | 0.4 | % | 21,833 | 2.5 | % | |||||||||||||||
|
Residential
|
||||||||||||||||||||||||
|
Term
|
116,368 | 13.1 | % | 221,559 | 25.0 | % | 337,927 | 38.1 | % | |||||||||||||||
|
Construction
|
5,304 | 0.6 | % | 10,208 | 1.1 | % | 15,512 | 1.7 | % | |||||||||||||||
|
Home equity line of credit
|
3,754 | 0.4 | % | 101,543 | 11.5 | % | 105,297 | 11.9 | % | |||||||||||||||
|
Consumer
|
14,812 | 1.6 | % | 3,344 | 0.4 | % | 18,156 | 2.0 | % | |||||||||||||||
|
Total loans
|
$ | 252,573 | 28.5 | % | $ | 635,023 | 71.5 | % | $ | 887,596 | 100.0 | % | ||||||||||||
Loan Concentrations
As of December 31, 2010, the Bank did not have any concentration of loans in one particular industry that exceeded 10% of its total loan portfolio.
Loans Held for Sale
Loans held for sale are carried at the lower of cost or market value, with a balance of $2.8 million at December 31, 2010 compared with $2.9 million at December 31, 2009. No recourse obligations have been incurred in connection with the sale of loans.
Credit Risk Management and Allowance for Loan Losses
Credit risk is the risk of loss arising from the inability of a borrower to meet its obligations. We manage credit risk by evaluating the risk profile of the borrower, repayment sources, the nature of the underlying collateral, and other support given current events, conditions, and expectations. We attempt to manage the risk characteristics of our loan portfolio through various control processes, such as credit evaluation of borrowers, establishment of lending limits, and application of lending procedures, including the holding of adequate collateral and the maintenance of compensating balances. However, we seek to rely primarily on the cash flow of our borrowers as the principal source of repayment. Although credit policies and evaluation processes are designed to minimize our risk, Management recognizes that loan losses will occur and the amount of these losses will fluctuate depending on the risk characteristics of our loan portfolio,
The First Bancorp 2010 Form 10-K
Page 33
as well as general and regional economic conditions.
We provide for loan losses through the establishment of an allowance for loan losses which represents an
estimated reserve for existing losses in the loan portfolio. We deploy a systematic methodology for determining our allowance that includes a quarterly review process, risk rating, and adjustment to our allowance. We classify our portfolios as either residential and consumer or commercial and monitor credit risk separately as discussed below. We evaluate the adequacy of our allowance continually based on a review of significant loans, with a particular emphasis on nonaccruing, past due, and other loans that we believe require special attention.
The allowance consists of four elements: (1) specific reserves for loans evaluated individually for impairment; (2) general reserves for types or portfolios of loans based on historical loan loss experience, (3) qualitative reserves judgmentally adjusted for local and national economic conditions, concentrations, portfolio composition, volume and severity of delinquencies and nonaccrual loans, trends of criticized and classified loans, changes in credit policies, and underwriting standards, credit administration practices, and other factors as applicable; and (4) unallocated reserves. All outstanding loans are considered in evaluating the adequacy of the allowance.
Adequacy of the allowance for loan losses is determined using a consistent, systematic methodology, which analyzes the risk inherent in the loan portfolio. In addition to evaluating the collectability of specific loans when determining the adequacy of the allowance for loan losses, Management also takes into consideration other factors such as changes in the mix and size of the loan portfolio, historical loss experience, the amount of delinquencies and loans adversely classified, economic trends, changes in credit policies, and experience, ability and depth of lending management. The adequacy of the allowance for loan losses is assessed by an allocation process whereby specific loss allocations are made against certain adversely classified loans, and general loss allocations are made against segments of the loan portfolio which have similar attributes. The Company’s historical loss experience, industry trends, and the impact of the local and regional economy on the Company’s borrowers, are considered by Management in determining the adequacy of the allowance for loan losses.
The allowance for loan losses is increased by provisions charged against current earnings. Loan losses are charged against the allowance when Management believes that the collectability of the loan principal is unlikely. Recoveries on loans previously charged off are credited to the allowance. While Management uses available information to assess possible losses on loans, future additions to the allowance may be necessary based on increases in non-performing loans, changes in economic conditions, growth in loan portfolios, or for other reasons. Any future additions to the allowance would be recognized in the period in which they were determined to be necessary. In addition, various regulatory agencies periodically review the Company’s allowance for loan losses as an integral part of their examination process. Such agencies may require the Company to record additions to the allowance based on judgments different from those of Management.
Commercial
Our commercial portfolio includes all secured and unsecured loans to borrowers for commercial purposes, including commercial lines of credit and commercial real estate. Our process for evaluating commercial loans includes performing updates on loans that we have rated for risk. Our non-performing commercial loans are generally reviewed individually to determine impairment, accrual status, and the need for specific reserves. Our methodology incorporates a variety of risk considerations, both qualitative and quantitative. Quantitative factors include our historical loss experience by loan type, collateral values, financial condition of borrowers, and other factors. Qualitative factors include judgments concerning general economic conditions that may affect credit quality, credit concentrations, the pace of portfolio growth, and delinquency levels. These qualitative factors are also considered in connection with our unallocated portion of our allowance for loan losses.
The process of establishing the allowance with respect to our commercial loan portfolio begins when a loan officer initially assigns each loan a risk rating, using established credit criteria. Approximately 50% of our outstanding loans and commitments are subject to review and validation annually by an independent consulting firm, as well as periodically by our internal credit review function. The methodology employs Management’s judgment as to the level of losses on existing loans based on our internal review of the loan portfolio, including an analysis of a borrower’s current financial position, and the consideration of current and anticipated economic conditions and their potential effects on specific borrowers and lines of business. In determining our ability to collect certain loans, we also consider the fair value of underlying collateral. We also evaluate credit risk concentrations, including trends in large dollar exposures to related borrowers, industry and geographic concentrations, and economic and environmental factors.
Residential and Consumer
Consumer and residential mortgage loans are generally segregated into homogeneous pools with similar risk characteristics. Trends and current conditions in consumer and residential mortgage pools are analyzed and historical
The First Bancorp 2010 Form 10-K
Page 34
loss experience is adjusted accordingly. Quantitative and qualitative adjustment factors for the consumer and
residential mortgage portfolios are consistent with those for the commercial portfolios. Certain loans in the consumer and residential portfolios identified as having the potential for further deterioration are analyzed individually to confirm the appropriate risk classification and accrual status, and to determine the need for a specific reserve. Consumer loans greater than 120 days past due are generally charged off. Residential loans 90 days or more past due are placed on non-accrual status unless the loans are both well secured and in the process of collection.
Unallocated
The unallocated portion of the allowance is intended to provide for losses that are not identified when establishing the specific and general portions of the allowance and is based upon Management’s evaluation of various conditions that are not directly measured in the determination of the portfolio and loan specific allowances. Such conditions include general economic and business conditions affecting our lending area, credit quality trends (including trends in delinquencies and nonperforming loans expected to result from existing conditions), loan volumes and concentrations, specific industry conditions within portfolio categories, recent loss experience in particular loan categories, duration of the current business cycle, bank regulatory examination results, findings of external loan review examiners, and Management’s judgment with respect to various other conditions including loan administration and management and the quality of risk identification systems. Management reviews these conditions quarterly. We have risk management practices designed to ensure timely identification of changes in loan risk profiles; however, undetected losses may exist inherently within the loan portfolio. The judgmental aspects involved in applying the risk grading criteria, analyzing the quality of individual loans, and assessing collateral values can also contribute to undetected, but probable, losses.
The allowance for loan losses includes reserve amounts to assigned individual loans on the basis of loan impairment. Certain loans are evaluated individually and are judged to be impaired when Management believes it is probable that the Company will not collect all of the contractual interest and principal payments as scheduled in the loan agreement. Under this method, loans are selected for evaluation based on internal risk ratings or non-accrual status. A specific reserve is allocated to an individual loan when that loan has been deemed impaired and when the amount of a probable loss is estimable on the basis of its collateral value, the present value of anticipated future cash flows, or its net realizable value. At December 31, 2010, impaired loans with specific reserves totaled $9.5 million and the amount of such reserves was $1.3 million. This compares to impaired loans with specific reserves of $12.2 million at December 31, 2009 and the amount of such reserves was $2.2 million.
All of these analyses are reviewed and discussed by the Directors’ Loan Committee, and recommendations from these processes provide Management and the Board of Directors with independent information on loan portfolio condition. Our total allowance at December 31, 2010 is considered by Management to be adequate to address the credit losses inherent in the loan portfolio at that date. Management views the level of the allowance for loan losses as
adequate. However, our determination of the appropriate allowance level is based upon a number of assumptions we make about future events, which we believe are reasonable, but which may or may not prove valid. Thus, there can be no assurance that our charge offs in future periods will not exceed our allowance for loan losses or that we will not need to make additional increases in our allowance for loan losses.
The following table summarizes our allocation of allowance by loan type as of December 31, 2010, 2009, 2008, 2007 and 2006. The percentages are the portion of each loan type to total loans.
The First Bancorp 2010 Form 10-K
Page 35
|
Dollars in
|
As of December 31,
|
|||||||||||||||||||||||||||||||||||||||
|
thousands
|
2010
|
2009
|
2008
|
2007
|
2006
|
|||||||||||||||||||||||||||||||||||
|
Commercial
|
||||||||||||||||||||||||||||||||||||||||
|
Real estate
|
$ | 5,260 | 27.7 | % | $ | 5,297 | 25.2 | % | $ | 2,958 | 22.3 | % | $ | 3,020 | 22.0 | % | $ | 1,905 | 16.8 | % | ||||||||||||||||||||
|
Construction
|
1,012 | 4.7 | % | 896 | 5.1 | % | 650 | 4.9 | % | - | 0.0 | % | - | 0.0 | % | |||||||||||||||||||||||||
|
Other
|
2,377 | 11.4 | % | 3,095 | 12.0 | % | 2,595 | 12.1 | % | 1,633 | 11.9 | % | 2,573 | 22.7 | % | |||||||||||||||||||||||||
|
Municipal
|
19 | 2.5 | % | 23 | 4.8 | % | 20 | 3.6 | % | 25 | 3.7 | % | 25 | 2.8 | % | |||||||||||||||||||||||||
|
Residential
|
||||||||||||||||||||||||||||||||||||||||
|
Term
|
1,408 | 38.1 | % | 1,197 | 38.7 | % | 713 | 44.0 | % | 706 | 46.9 | % | 711 | 44.3 | % | |||||||||||||||||||||||||
|
Construction
|
44 | 1.7 | % | 43 | 1.8 | % | 44 | 2.7 | % | 75 | 5.0 | % | 38 | 2.4 | % | |||||||||||||||||||||||||
|
Home equity
line of credit
|
670 | 11.9 | % | 515 | 9.9 | % | 482 | 7.9 | % | 491 | 8.1 | % | 470 | 8.7 | % | |||||||||||||||||||||||||
|
Consumer
|
646 | 2.0 | % | 716 | 2.5 | % | 662 | 2.5 | % | 606 | 2.4 | % | 537 | 2.3 | % | |||||||||||||||||||||||||
|
Unallocated
|
1,880 | 0.0 | % | 1,855 | 0.0 | % | 676 | 0.0 | % | 244 | 0.0 | % | 105 | 0.0 | % | |||||||||||||||||||||||||
|
Total
|
$ | 13,316 | 100.0 | % | $ | 13,637 | 100.0 | % | $ | 8,800 | 100.0 | % | $ | 6,800 | 100.0 | % | $ | 6,364 | 100.0 | % | ||||||||||||||||||||
The allowance for loan losses totaled $13.3 million at December 31, 2010, compared to $13.6 million at December 31, 2009. Management’s ongoing application of methodologies to establish the allowance include an evaluation of non-accrual loans and troubled debt restructured for specific reserves. These specific reserves decreased $0.9 million in 2010 from $2.2 million at December 31, 2009 to $1.3 million at December 31, 2010. The specific loans that make up those categories change from period to period. The portion of the reserve based upon homogeneous pools of loans decreased by $940,000 in 2010. The portion of the reserve based on qualitative factors increased by $593,000 during 2010 due to increased uncertainty with real estate appraisal values. Despite the shifts in specific, pooled and qualitative reserves, Management feels that market trends and other internal factors justified the minimal increase in unallocated reserves during 2010.
A breakdown of the allowance for loan losses as of December 31, 2010, by loan segment and allowance element, is presented in the following table:
|
Specific Reserves Evaluated Individually for Impairment
|
General Reserves Based on Historical Loss Experience
|
Reserves for Qualitative Factors
|
Unallocated Reserves
|
Total Reserves
|
||||||||||||||||
|
Commercial
|
||||||||||||||||||||
|
Real estate
|
$ | 192,000 | $ | 2,183,000 | $ | 2,885,000 | $ | - | $ | 5,260,000 | ||||||||||
|
Construction
|
152,000 | 370,000 | 490,000 | - | 1,012,000 | |||||||||||||||
|
Other
|
291,000 | 899,000 | 1,187,000 | - | 2,377,000 | |||||||||||||||
|
Municipal
|
- | - | 19,000 | - | 19,000 | |||||||||||||||
|
Residential
|
||||||||||||||||||||
|
Term
|
432,000 | 401,000 | 575,000 | - | 1,408,000 | |||||||||||||||
|
Construction
|
- | 18,000 | 26,000 | - | 44,000 | |||||||||||||||
|
Home Equity Line of Credit
|
122,000 | 72,000 | 476,000 | - | 670,000 | |||||||||||||||
|
Consumer
|
67,000 | 324,000 | 255,000 | - | 646,000 | |||||||||||||||
|
Unallocated
|
- | - | - | 1,880,000 | 1,880,000 | |||||||||||||||
| $ | 1,256,000 | $ | 4,267,000 | $ | 5,913,000 | $ | 1,880,000 | $ | 13,316,000 | |||||||||||
Based upon Management’s evaluation, provisions are made to maintain the allowance as a best estimate of inherent losses within the portfolio. The provision for loan losses to maintain the allowance was $8.4 million in 2010 compared to $12.2 million in 2009. Net charge offs were $8.7 million in 2010 compared to net charge offs of $7.3 million in 2009. Our allowance as a percentage of outstanding loans has increased from 1.43% as of December 31, 2009 to 1.50% as of December 31, 2010, reflecting the changes in our loss estimates and the increases resulting from the application of our loss estimate methodology.
The First Bancorp 2010 Form 10-K
Page 36
The following table summarizes the activities in our allowance for loan losses as of December 31, 2010, 2009, 2008, 2007 and 2006:
|
As of December 31,
|
||||||||||||||||||||
|
Dollars in thousands
|
2010
|
2009
|
2008
|
2007
|
2006
|
|||||||||||||||
|
Balance at beginning of year
|
$ | 13,637 | $ | 8,800 | $ | 6,800 | $ | 6,364 | $ | 6,086 | ||||||||||
|
Loans charged off:
|
||||||||||||||||||||
|
Commercial
|
||||||||||||||||||||
|
Real estate
|
4,005 | 2,430 | 3 | 27 | 2 | |||||||||||||||
|
Construction
|
175 | - | - | - | - | |||||||||||||||
|
Other
|
1,125 | 2,329 | 1,997 | 477 | 854 | |||||||||||||||
|
Municipal
|
- | - | - | - | - | |||||||||||||||
|
Residential
|
||||||||||||||||||||
|
Term
|
392 | 1,767 | 113 | 13 | 42 | |||||||||||||||
|
Construction
|
2,361 | 47 | - | - | - | |||||||||||||||
|
Home equity line of credit
|
8 | 177 | 83 | 50 | 21 | |||||||||||||||
|
Consumer
|
951 | 826 | 745 | 770 | 394 | |||||||||||||||
|
Total
|
9,017 | 7,576 | 2,941 | 1,337 | 1,313 | |||||||||||||||
|
Recoveries on loans previously charged off
|
||||||||||||||||||||
|
Commercial
|
||||||||||||||||||||
|
Real estate
|
4 | - | - | - | 30 | |||||||||||||||
|
Construction
|
- | - | - | - | - | |||||||||||||||
|
Other
|
69 | 79 | 32 | 142 | 60 | |||||||||||||||
|
Municipal
|
- | - | - | - | - | |||||||||||||||
|
Residential
|
||||||||||||||||||||
|
Term
|
4 | 59 | 5 | 4 | 16 | |||||||||||||||
|
Construction
|
- | - | - | - | - | |||||||||||||||
|
Home equity line of credit
|
- | 1 | - | 21 | - | |||||||||||||||
|
Consumer
|
219 | 114 | 204 | 174 | 160 | |||||||||||||||
|
Total
|
296 | 253 | 241 | 341 | 266 | |||||||||||||||
|
Net loans charged off
|
8,721 | 7,323 | 2,700 | 996 | 1,047 | |||||||||||||||
|
Provision for loan losses
|
8,400 | 12,160 | 4,700 | 1,432 | 1,325 | |||||||||||||||
|
Balance at end of period
|
$ | 13,316 | $ | 13,637 | $ | 8,800 | $ | 6,800 | $ | 6,364 | ||||||||||
|
Ratio of net loans charged off to average loans outstanding
|
0.94 | % | 0.75 | % | 0.28 | % | 0.11 | % | 0.13 | % | ||||||||||
|
Ratio of allowance for loan losses to total loans outstanding
|
1.50 | % | 1.43 | % | 0.90 | % | 0.74 | % | 0.76 | % | ||||||||||
Management believes the allowance for loan losses is adequate as of December 31, 2010. In Management’s opinion, the level of provision for loan losses and the corresponding increase in the allowance for loan losses is directionally consistent with the overall credit quality of our loan portfolio and corresponding levels of specific reserves and unallocated reserves, as well as with the performance of the national and local economies, higher levels of unemployment and the outlook for the difficult economic conditions continuing for some time to come.
The First Bancorp 2010 Form 10-K
Page 37
Nonperforming Loans
Nonperforming loans are comprised of loans, for which based on current information and events, it is probable that we will be unable to collect all amounts due according to the contractual terms of the loan agreement or when principal and interest is 90 days or more past due unless the loan is both well secured and in the process of collection (in which case the loan may continue to accrue interest in spite of its past due status). A loan is "well secured" if it is secured (1) by collateral in the form of liens on or pledges of real or personal property, including securities, that have a realizable value sufficient to discharge the debt (including accrued interest) in full, or (2) by the guarantee of a financially responsible party. A loan is "in the process of collection" if collection of the loan is proceeding in due course either (1) through legal action, including judgment enforcement procedures, or, (2) in appropriate circumstances, through collection efforts not involving legal action which are reasonably expected to result in repayment of the debt or in its restoration to a current status in the near future.
A loan is not considered impaired during a minimal period of delay in payment if we expect to collect all amounts due, including past-due interest. When a loan becomes nonperforming (generally 90 days past due), it is evaluated for collateral dependency based upon the most recent appraisal or other evaluation method. If the collateral value is lower than the outstanding loan balance plus accrued interest and estimated selling costs, the loan is placed on non-accrual status, all accrued interest is reversed from interest income, and a specific reserve is established for the difference between the loan balance and the collateral value less selling costs. At the same time, and if secured by real estate, a new independent, third-party appraisal may be ordered, based on the currency of the most recent appraisal and the size of the loan, and upon receipt of the new appraisal – typically 30 days for residential loans and 60-90 days for commercial loans – the loan may have an additional specific reserve or write down based upon the new appraisal information.
On an ongoing basis, if a non-performing loan is collateral dependent as its source of repayment, we may have an independent appraisal done periodically, based on the currency of the most recent appraisal and the size of the loan, and an additional specific reserve or write down based upon the new appraisal information will be made if appropriate. Once a loan is placed on nonaccrual, it remains in nonaccrual status until the loan is current as to payment of both principal and interest and the borrower demonstrates the ability to pay and remain current. All payments made on nonaccrual loans are applied to the principal balance of the loan.
Nonperforming loans, expressed as a percentage of total loans, totaled 2.39% at December 31, 2010 compared to 1.95% at December 31, 2009. The following table shows the distribution of nonperforming assets and loans greater than 90 days past due as of December 31, 2010, 2009, 2008, 2007 and 2006:
|
As of December 31,
|
||||||||||||||||||||
|
Dollars in thousands
|
2010
|
2009
|
2008
|
2007
|
2006
|
|||||||||||||||
|
Commercial
|
||||||||||||||||||||
|
Real estate
|
$ | 5,946 | $ | 6,589 | $ | 7,477 | $ | 734 | $ | 1,105 | ||||||||||
|
Construction
|
937 | 458 | - | - | - | |||||||||||||||
|
Other
|
2,277 | 2,735 | 2,908 | 2,011 | 2,285 | |||||||||||||||
|
Municipal
|
- | - | - | - | - | |||||||||||||||
|
Residential
|
||||||||||||||||||||
|
Term
|
8,932 | 6,322 | 6,594 | 2,109 | 606 | |||||||||||||||
|
Construction
|
3,567 | 3,182 | - | - | - | |||||||||||||||
|
Home equity line of credit
|
519 | 143 | 313 | 299 | 190 | |||||||||||||||
|
Consumer
|
113 | 309 | 137 | 1 | 46 | |||||||||||||||
|
Total loans 90 or more days past due
|
$ | 22,291 | $ | 19,738 | $ | 17,429 | $ | 5,154 | $ | 4,232 | ||||||||||
|
Non-accrual loans included in above total
|
$ | 21,175 | $ | 18,562 | $ | 12,449 | $ | 2,867 | $ | 3,485 | ||||||||||
Total nonperforming loans does not include loans 90 or more days past due and still accruing interest. These are loans in which we expect to collect all amounts due, including past-due interest. As of December 31, 2010, loans 90 or more days past due and still accruing interest totaled $1.1 million, compared to $1.2 million at December 31, 2009.
The First Bancorp 2010 Form 10-K
Page 38
A restructuring of debt constitutes a troubled debt restructuring (“TDR”) if the Bank, for economic or legal reasons related to the borrower’s financial difficulties, grants a concession to the borrower that it would not otherwise consider. To determine whether or not a loan should be classified as a TDR, Management evaluates a loan based upon the following criteria:
|
·
|
The borrower demonstrates financial difficulty; common indicators include past due status with bank obligations, substandard credit bureau reports, or an inability to refinance with another lender, and
|
|
·
|
The Bank has granted a concession; common concession types include maturity date extension, interest rate adjustments to below market pricing, and deferment of payments.
|
As of December 31, 2010 we had 32 loans with a value of $5.5 million that have been restructured due to the borrower’s inability to maintain a current status on the loan that were classified as TDRs. This compares to 52 loans with a value of $8.4 million as of December 31, 2009. As of both dates, all TDRs were for residential term loans. As of December 31, 2010, nine of the loans classified as TDRs with a total balance of $1.3 million were greater than 30 days past due and three loans with a balance of $483,000 were in the process of foreclosure.
Impaired Loans
Impaired loans include restructured loans and loans placed on non-accrual status when, based on current information and events, it is probable that we will be unable to collect all amounts due according to the contractual terms of the loan agreement. These loans are measured at the present value of expected future cash flows discounted at the loan’s effective interest rate or at the fair value of the collateral if the loan is collateral dependent. If the measure of an impaired loan is lower than the recorded investment in the loan and estimated selling costs, a specific reserve is established for the difference. Impaired loans totaled $25.3 million at December, 2010, and have decreased $559,000 from December 31, 2009. The number of loans decreased by eight loans from 183 to 175 during the same period. Impaired commercial loans decreased $658,000 from December 31, 2009 to December 31, 2010. The specific allowance for impaired commercial loans decreased from $1.7 million at December 31, 2009 to $635,000 as of December 31, 2010, which represented the fair value deficiencies for those loans for which the net fair value of the collateral was estimated at less than our carrying amount of the loan. From December 31, 2009 to December 31, 2010, impaired residential loans decreased $308,000, impaired home equity lines of credit increased $376,000, and impaired consumer loans increased $31,000.
The following table sets forth impaired loans as of December 31, 2010, 2009, 2008, 2007 and 2006:
|
As of December 31,
|
||||||||||||||||||||
|
Dollars in thousands
|
2010
|
2009
|
2008
|
2007
|
2006
|
|||||||||||||||
|
Commercial
|
||||||||||||||||||||
|
Real estate
|
$ | 5,946 | $ | 6,198 | $ | 7,477 | $ | 1,105 | $ | 744 | ||||||||||
|
Construction
|
937 | 458 | - | - | - | |||||||||||||||
|
Other
|
1,753 | 2,638 | 2,742 | 2,281 | 1,697 | |||||||||||||||
|
Municipal
|
- | - | - | - | - | |||||||||||||||
|
Residential
|
||||||||||||||||||||
|
Term
|
12,455 | 13,149 | 2,163 | 86 | 637 | |||||||||||||||
|
Construction
|
3,567 | 3,182 | - | - | - | |||||||||||||||
|
Home Equity Line of Credit
|
519 | 143 | 67 | - | - | |||||||||||||||
|
Consumer
|
106 | 75 | - | 13 | 17 | |||||||||||||||
|
Total
|
$ | 25,283 | $ | 25,843 | $ | 12,449 | $ | 3,485 | $ | 3,095 | ||||||||||
The First Bancorp 2010 Form 10-K
Page 39
Past Due Loans
The Bank’s overall loan delinquency ratio was 3.15% at December 31, 2010, versus 3.14% at December 31, 2009. Loans 90 days delinquent and accruing decreased slightly from $1.2 million at December 31, 2009 to $1.1 million as of December 31, 2010. This total is made up of 11 loans, with the largest loan totaling $366,000. We expect to collect all amounts due on these loans, including interest.
The following table sets forth loan delinquencies as of December 31, 2010, 2009, 2008, 2007 and 2006:
|
As of December 31,
|
||||||||||||||||||||
|
Dollars in thousands
|
2010
|
2009
|
2008
|
2007
|
2006
|
|||||||||||||||
|
Commercial
|
||||||||||||||||||||
|
Real estate
|
$ | 6,055 | $ | 9,443 | $ | 10,446 | $ | 2,607 | $ | 2,326 | ||||||||||
|
Construction
|
1,057 | 458 | 584 | 325 | 9 | |||||||||||||||
|
Other
|
4,440 | 3,607 | 4,713 | 8,393 | 5,575 | |||||||||||||||
|
Municipal
|
- | - | - | - | - | |||||||||||||||
|
Residential
|
||||||||||||||||||||
|
Term
|
12,231 | 11,747 | 11,526 | 8,803 | 4,067 | |||||||||||||||
|
Construction
|
1,828 | 3,182 | - | - | - | |||||||||||||||
|
Home equity line of credit
|
2,038 | 682 | 1,423 | 872 | 627 | |||||||||||||||
|
Consumer
|
266 | 775 | 609 | 496 | 312 | |||||||||||||||
|
Total
|
$ | 27,915 | $ | 29,894 | $ | 29,301 | $ | 21,496 | $ | 12,916 | ||||||||||
|
Loans 30-89 days past due to total loans
|
1.32 | % | 1.26 | % | 1.21 | % | 1.78 | % | 1.04 | % | ||||||||||
|
Loans 90+ days past due and accruing to total loans
|
0.13 | % | 0.12 | % | 0.51 | % | 0.25 | % | 0.09 | % | ||||||||||
|
Loans 90+ days past due on non-accrual to total loans
|
1.70 | % | 1.76 | % | 1.27 | % | 0.31 | % | 0.42 | % | ||||||||||
|
Total past due loans to total loans
|
3.15 | % | 3.14 | % | 2.99 | % | 2.34 | % | 1.54 | % | ||||||||||
As of December 31, 2010, the UBPR peer group had loans 30-89 days past due of 1.04% and loans 90+ days past due on non-accrual of 3.39%.
Potential problem loans consist of classified accruing commercial and commercial real estate loans that were between 30 and 89 days past due. Such loans are characterized by weaknesses in the financial condition of borrowers or collateral deficiencies. Based on historical experience, the credit quality of some of these loans may improve due to changes in collateral values or the financial condition of the borrowers, while the credit quality of other loans may deteriorate, resulting in some amount of loss. These loans are not included in the analysis of non-accrual loans. At December 31, 2010, there were 32 potential problem loans with a balance of $3.9 million or 0.4% of total loans. This compares to 28 loans with a balance of $8.7 million or 0.9% of total loans at December 31, 2009.
As of December 30, 2010, there were 33 loans in the process of foreclosure with a total balance of $12.3 million. The Bank’s foreclosure process begins when a loan becomes 45 days past due at which time a preliminary foreclosure letter is sent to the borrower. If the loan becomes 80 days past due, copies of the promissory note and mortgage deed are forwarded to the Bank’s attorney for review and an affidavit for a Motion for Summary Judgment is then prepared. An authorized Bank officer signs the affidavit certifying the validity of the documents and verification of the past due amount which is then forwarded to the court. Once a Motion for Summary Judgment is granted, a Period of Redemption (POR) begins which gives the customer 90 days to cure the default. A foreclosure auction date is then set 30 days from the POR expiration date if the default is not cured.
In October 2010, the Bank conducted a self-audit of its loans in foreclosure and its foreclosure process and found there were no deficiencies or areas to improve.
For loans sold to the secondary market on which servicing is retained, the Bank follows Freddie Mac’s and Fannie Mae’s published guidelines and regularly reviews these guidelines for updates and changes to process. All secondary market loans have been sold without recourse in a non-securitized, one-on-one basis. As a result, the Bank has no liability for these loans in the event of a foreclosure.
The First Bancorp 2010 Form 10-K
Page 40
Other Real Estate Owned
Other real estate owned and repossessed assets (“OREO”) are comprised of properties or other assets acquired through a foreclosure proceeding, or acceptance of a deed or title in lieu of foreclosure. Real estate acquired through foreclosure is carried at the lower of cost or fair value less estimated cost to sell. At December 31, 2010, there were 18 properties owned with a net OREO balance of $4.9 million, net of an allowance for losses of $0.1 million, compared to December 31, 2009 when there were 18 properties owned with a net OREO balance of $5.3 million, net of an allowance for losses of $0.6 million. The following table presents the composition of other real estate owned as of December 31, 2010, 2009, 2008, 2007 and 2006:
|
As of December 31,
|
||||||||||||||||||||
|
Dollars in thousands
|
2010
|
2009
|
2008
|
2007
|
2006
|
|||||||||||||||
|
Carrying Value
|
||||||||||||||||||||
|
Commercial
|
||||||||||||||||||||
|
Real estate
|
$ | - | $ | - | $ | - | $ | - | $ | - | ||||||||||
|
Construction
|
424 | 1,182 | 1,172 | 1,152 | 950 | |||||||||||||||
|
Other
|
1,795 | 1,920 | 731 | - | 463 | |||||||||||||||
|
Municipal
|
- | - | - | - | - | |||||||||||||||
|
Residential
|
||||||||||||||||||||
|
Term
|
2,842 | 2,826 | 849 | - | - | |||||||||||||||
|
Construction
|
- | - | - | - | - | |||||||||||||||
|
Home equity line of credit
|
- | - | - | - | - | |||||||||||||||
|
Consumer
|
- | - | - | - | - | |||||||||||||||
|
Total
|
$ | 5,061 | $ | 5,928 | $ | 2,752 | $ | 1,152 | $ | 1,413 | ||||||||||
|
Related Allowance
|
||||||||||||||||||||
|
Commercial
|
||||||||||||||||||||
|
Real estate
|
$ | - | $ | - | $ | - | $ | - | $ | - | ||||||||||
|
Construction
|
- | 476 | 325 | 325 | 250 | |||||||||||||||
|
Other
|
66 | - | - | - | 19 | |||||||||||||||
|
Municipal
|
- | - | - | - | - | |||||||||||||||
|
Residential
|
||||||||||||||||||||
|
Term
|
66 | 107 | - | - | - | |||||||||||||||
|
Construction
|
- | - | - | - | - | |||||||||||||||
|
Home equity line of credit
|
- | - | - | - | - | |||||||||||||||
|
Consumer
|
- | - | - | - | - | |||||||||||||||
|
Total
|
$ | 132 | $ | 583 | $ | 325 | $ | 325 | $ | 269 | ||||||||||
|
Net Value
|
||||||||||||||||||||
|
Commercial
|
||||||||||||||||||||
|
Real estate
|
$ | - | $ | - | $ | - | $ | - | $ | - | ||||||||||
|
Construction
|
424 | 706 | 848 | 827 | 700 | |||||||||||||||
|
Other
|
1,729 | 1,920 | 731 | - | 444 | |||||||||||||||
|
Municipal
|
- | - | - | - | - | |||||||||||||||
|
Residential
|
||||||||||||||||||||
|
Term
|
2,776 | 2,719 | 849 | - | - | |||||||||||||||
|
Construction
|
- | - | - | - | - | |||||||||||||||
|
Home equity line of credit
|
- | - | - | - | - | |||||||||||||||
|
Consumer
|
- | - | - | - | - | |||||||||||||||
|
Total
|
$ | 4,929 | $ | 5,345 | $ | 2,428 | $ | 827 | $ | 1,144 | ||||||||||
The First Bancorp 2010 Form 10-K
Page 41
Funding, Liquidity and Capital Resources
As of December 31, 2010, the Bank had primary sources of liquidity of $259.7 million or 19.03% of assets. It is Management’s opinion that this is adequate. In addition, the Bank has an additional $116.1 million in borrowing capacity under the Federal Reserve Bank of Boston’s Borrower in Custody program, $18.0 million in credit lines with correspondent banks, and $52.9 million in unencumbered securities available as collateral for borrowing. These bring the Bank’s primary sources of liquidity to $446.7 million or 32.66% of assets. The Asset/Liability Committee (“ALCO”) establishes guidelines for liquidity in its Asset/Liability policy and monitors internal liquidity measures to manage liquidity exposure. Based on its assessment of the liquidity considerations described above, Management believes the Company’s sources of funding will meet anticipated funding needs.
Liquidity is the ability of a financial institution to meet maturing liability obligations and customer loan demand. The Bank’s primary source of liquidity is deposits, which funded 70.9% of total average assets in 2010. While the generally preferred funding strategy is to attract and retain low cost deposits, the ability to do so is affected by competitive interest rates and terms in the marketplace. Other sources of funding include discretionary use of purchased liabilities (e.g., FHLB term advances and other borrowings), cash flows from the securities portfolios and loan repayments. Securities designated as available for sale may also be sold in response to short-term or long-term liquidity needs although Management has no intention to do so at this time.
The Bank has a detailed liquidity funding policy and a contingency funding plan that provide for the prompt and comprehensive response to unexpected demands for liquidity. Management has developed quantitative models to estimate needs for contingent funding that could result from unexpected outflows of funds in excess of “business as usual” cash flows. In Management’s estimation, risks are concentrated in two major categories: runoff of in-market deposit balances and the inability to renew wholesale sources of funding. Of the two categories, potential runoff of deposit balances would have the most significant impact on contingent liquidity. Our modeling attempts to quantify deposits at risk over selected time horizons. In addition to these unexpected outflow risks, several other “business as usual” factors enter into the calculation of the adequacy of contingent liquidity including payment proceeds from loans and investment securities, maturing debt obligations and maturing time deposits. The Bank has established collateralized borrowing capacity with the Federal Reserve Bank of Boston and also maintains additional collateralized borrowing capacity with the FHLB in excess of levels used in the ordinary course of business as well as Fed Funds lines with two correspondent banks.
Deposits
During 2010, total deposits increased by $51.9 million or 5.6%, ending the year at $974.5 million compared to $922.7 million at December 31, 2009. Low-cost deposits (demand, NOW, and savings accounts) increased by $22.6 million or 8.3% during the year, money market deposits declined $22.8 million or 24.2%, and certificates of deposit increased $52.1 million or 9.4%. The majority of the change in certificates of deposit year-to-date was primarily from wholesale and brokered sources, resulting from a shift in funding between borrowed funds and certificates of deposit. The increase in low-cost deposits is higher than the usual seasonal flow we experience each year in our marketplace. Average deposits increased $13.3 million in 2010, as shown in the following table which sets forth the average daily balance for the Bank’s principal deposit categories for each period:
|
Years ended December 31,
|
% change
|
|||||||||||||||
|
Dollars in thousands
|
2010
|
2009
|
2008
|
2010 vs. 2009
|
||||||||||||
|
Demand deposits
|
$ | 69,260 | $ | 65,567 | $ | 63,495 | 5.63 | % | ||||||||
|
NOW accounts
|
118,400 | 106,895 | 105,689 | 10.76 | % | |||||||||||
|
Money market accounts
|
78,155 | 108,922 | 123,699 | -28.25 | % | |||||||||||
|
Savings
|
97,484 | 87,921 | 86,018 | 10.88 | % | |||||||||||
|
Certificates of deposit
|
597,982 | 578,713 | 474,517 | 3.33 | % | |||||||||||
|
Total deposits
|
$ | 961,281 | $ | 948,018 | $ | 853,418 | 1.40 | % | ||||||||
The First Bancorp 2010 Form 10-K
Page 42
The average cost of deposits (including non-interest-bearing accounts) was 1.07% for the year ended December 31, 2010, compared to 1.25% for the year ended December 31, 2009 and 2.69% for the year ended December 31, 2008. The following table sets forth the average cost of each category of interest-bearing deposits for the periods indicated.
|
Years ended December 31,
|
|||
|
2010
|
2009
|
2008
|
|
|
NOW
|
0.33%
|
0.35%
|
0.63%
|
|
Money market
|
0.69%
|
1.07%
|
2.88%
|
|
Savings
|
0.60%
|
0.62%
|
0.97%
|
|
Certificates of deposit
|
1.47%
|
1.75%
|
3.78%
|
|
Total interest-bearing deposits
|
1.15%
|
1.35%
|
2.90%
|
Of all certificates of deposit, $374.1 million or 61.5% will mature by December 31, 2011. As of December 31, 2010, the Bank held a total of $376.2 million in certificate of deposit accounts with balances in excess of $100,000. The following table summarizes the time remaining to maturity for these certificates of deposit:
|
As of December 31,
|
||||||||
|
Dollars in thousands
|
2010
|
2009
|
||||||
|
Within 3 Months
|
$ | 215,112 | $ | 184,574 | ||||
|
3 Months through 6 months
|
35,700 | 94,778 | ||||||
|
6 months through 12 months
|
26,687 | 27,709 | ||||||
|
Over 12 months
|
98,745 | 36,143 | ||||||
|
Total
|
$ | 376,244 | $ | 343,204 | ||||
Borrowed Funds
Borrowed funds consists mainly of advances from the Federal Home Loan Bank of Boston (FHLB) which are secured by FHLB stock, funds on deposit with FHLB, U.S. Treasury and Agency notes and mortgage-backed securities and qualifying first mortgage loans. As of December 31, 2010, the Bank’s total FHLB borrowing capacity, based upon the Bank’s holding of FHLB stock, was $266.9 million, of which $68.3 million was unused. As of December 31, 2010, advances totaled $198.6 million, with a weighted average interest rate of 2.09% and remaining maturities ranging from three days to 10 years. This compares to advances totaling $199.4 million, with a weighted average interest rate of 2.90% and remaining maturities ranging from three days to 15 years, as of December 31, 2009. The decrease in the weighted average rate paid on borrowed funds in 2010 compared to 2009 is consistent with the interest rate policy and actions of the FOMC.
The Bank offers securities repurchase agreements to municipal and corporate customers as an alternative to deposits. The balance of these agreements as of December 31, 2010 was $57.3 million, compared to $49.7 million on December 31, 2009, and $48.8 million on December 31, 2008. The weighted average rates of these agreements were 1.16% as of December 31, 2010, compared to 1.57% as of December 31, 2009 and 2.12% as of December 31, 2008.
The Bank participates in the Note Option Depository which is offered by the U.S. Treasury Department. Under the Treasury Tax and Loan Note program, the Bank accumulates tax deposits made by its customers and is eligible to receive additional Treasury Direct investments up to an established maximum balance of $5.0 million. The balances invested by the Treasury are increased and decreased at the discretion of the Treasury. The deposits are generally made at interest rates that are favorable in comparison to other borrowings. The balances on the Treasury Tax and Loan note at December 31, 2010, 2009, and 2008 were $1.4 million, $0.6 million, and $2.9 million, respectively.
The maximum amount of borrowed funds outstanding at any month-end during each of the last three years was $257.3 million at the end of December in 2010, $306.5 million at the end of February in 2009, and $331.7 million at the end of January in 2008. The average amount outstanding during 2010 was $230.9 million with a weighted average interest rate of 2.76%. This compares to an average outstanding amount of $248.3 million with a weighted average interest rate of 2.84% in 2009, and an average outstanding amount of $293.7 million with a weighted average interest rate of 3.62% in 2008. The decline in average cost realized during 2010 is consistent with the interest rate policy and actions of the FOMC.
The First Bancorp 2010 Form 10-K
Page 43
Capital Resources
Shareholders’ equity as of December 31, 2010 was $149.8 million, compared to $147.9 million as of December 31, 2009. The Company’s earnings for 2010, net of dividends paid, added to shareholders’ equity. The net unrealized loss on available-for-sale securities, presented in accordance with FASB ASC Topic 740 “Investments – Debt and Equity Securities”, increased by $1.9 million from December 31, 2009.
Capital at December 31, 2010 was sufficient to meet the requirements of regulatory authorities. Leverage capital of the Company, or total shareholders’ equity divided by average total assets for the current quarter less goodwill and any net unrealized gain or loss on securities available for sale and postretirement benefits, stood at 9.30% on December 31, 2010 and 9.44% at December 31, 2009. To be rated “well-capitalized”, regulatory requirements call for a minimum leverage capital ratio of 5.00%. At December 31, 2010, the Company had tier-one risk-based capital of 14.97% and tier-two risk-based capital of 16.23%, versus 13.70% and 14.96%, respectively, at December 31, 2009. To be rated “well-capitalized”, regulatory requirements call for minimum tier-one and tier-two risk-based capital ratios of 6.00% and 10.00%, respectively. The Company’s actual levels of capitalization were comfortably above the standards to be rated “well-capitalized” by regulatory authorities.
On November 21, 2008, the Company received approval for a $25.0 million preferred stock investment by the U.S. Treasury under the Capital Purchase Program (“CPP”). The Company completed the CPP investment transaction on January 9, 2009. The CPP Shares call for cumulative dividends at a rate of 5.0% per year for the first five years, and at a rate of 9.0% per year in following years. The CPP Shares qualify as Tier 1 capital on the Company’s books for regulatory purposes and rank senior to the Company’s common stock and will rank senior or at an equal level in the Company’s capital structure to any other shares of preferred stock the Company may issue in the future.
During 2010, the Company declared cash dividends of $0.195 per share in each quarter or $0.78 per share for the year. The Company’s dividend payout ratio (dividends declared per share divided by earnings per share) was 70.91% of earnings in 2010 compared to 63.93% in 2009 and 52.76% in 2008. The ability of the Company to pay cash dividends to its Shareholders depends on receipt of dividends from its subsidiary, the Bank. A total of $8.9 million in dividends was declared in 2010 from the Bank to the Company.
In determining future dividend payout levels, the Board of Directors carefully analyzes capital requirements and earnings retention, as set forth in the Company’s Dividend Policy. The Bank may pay dividends to the Company out of so much of its net profits as the Bank’s directors deem appropriate, subject to the limitation that the total of all dividends declared by the Bank in any calendar year may not exceed the total of its net profits of that year combined with its retained net profits of the preceding two years. Based upon this restriction, the amount available for dividends in 2011 will be that year’s net income plus $8.1 million. The payment of dividends from the Bank to the Company may be additionally restricted if the payment of such dividends resulted in the Bank failing to meet regulatory capital requirements. Also, pursuant to restrictions applicable to the Company as a consequence of its participation in the CPP program discussed below, the Company may not increase its quarterly dividend above $0.195 per share during the first three years that the CPP shares are outstanding (through January 9, 2012) without the consent of the U.S. Treasury.
As a consequence of the Company’s issuance of securities under the U.S. Treasury’s CPP program, its ability to repurchase stock while such securities remain outstanding is restricted to purchases from employee benefit plans. During the year ended December 31, 2010, the Company repurchased fractional shares from employee benefit plans.
In 2010, 28,855 shares, net of five fractional shares repurchased from employee benefit plans, were issued via employee stock programs and the dividend reinvestment plan for consideration totaling $416,000. No shares of common stock were issued in conjunction with the exercise of stock options.
Except as identified in Item 1A, “Risk Factors”, Management knows of no present trends, events or uncertainties that will have, or are reasonably likely to have, a material effect on capital resources, liquidity, or results of operations.
The First Bancorp 2010 Form 10-K
Page 44
Goodwill
On January 14, 2005, the Company completed the acquisition of FNB Bankshares of Bar Harbor, Maine, and its subsidiary, The First National Bank of Bar Harbor, which was merged into the Bank. The total value of the transaction was $48.0 million, and all of the voting equity interest of FNB Bankshares was acquired in the transaction. As of December 31, 2010, the Company completed its annual review of goodwill and determined there has been no impairment.
Contractual Obligations
The following table sets forth the contractual obligations and commitments to extend credit of the Company as of December 31, 2010:
|
Dollars in thousands
|
Total
|
Less than
1 year
|
1-3 years
|
3-5 years
|
More than 5 years
|
|||||||||||||||
|
Borrowed funds
|
$ | 257,330 | $ | 127,160 | $ | 20,000 | $ | 60,000 | $ | 50,170 | ||||||||||
|
Operating leases
|
726 | 97 | 289 | 109 | 231 | |||||||||||||||
|
Certificates of deposit
|
608,189 | 374,131 | 85,264 | 148,794 | - | |||||||||||||||
|
Total
|
$ | 866,245 | $ | 501,388 | $ | 105,553 | $ | 208,903 | $ | 50,401 | ||||||||||
|
Unused lines, collateralized by residential real estate
|
$ | 62,765 | $ | 62,765 | $ | - | $ | - | $ | - | ||||||||||
|
Other unused commitments
|
50,179 | 50,179 | - | - | - | |||||||||||||||
|
Standby letters of credit
|
2,792 | 2,792 | - | - | - | |||||||||||||||
|
Commitments to extend credit
|
9,222 | 9,222 | - | - | - | |||||||||||||||
|
Total loan commitments and unused lines of credit
|
$ | 124,958 | $ | 124,958 | $ | - | $ | - | $ | - | ||||||||||
The Company is party to financial instruments with off-balance sheet risk in the normal course of business to meet the financing needs of its customers. These include commitments to originate loans, commitments for unused lines of credit, and standby letters of credit. The instruments involve, to varying degrees, elements of credit risk in excess of the amount recognized in the consolidated balance sheets. Commitments for unused lines are agreements to lend to a customer provided there is no violation of any condition established in the contract and generally have fixed expiration dates. Standby letters of credit are conditional commitments issued by the Bank to guarantee a customer’s performance to a third party. The credit risk involved in issuing letters of credit is essentially the same as that involved in extending loans to customers. As of December 31, 2010, the Company’s off-balance-sheet activities consisted entirely of commitments to extend credit.
Off-Balance Sheet Financial Instruments
No material off-balance sheet risk exists that requires a separate liability presentation.
Capital Purchases
In 2010, the Company made capital purchases totaling $2.0 million. This cost will be amortized over an average of seven years, adding approximately $292,000 to pre-tax operating costs per year. The capital purchases included real estate improvements for branch premises and equipment related to technology.
Effect of Future Interest Rates on Post-retirement Benefit Liabilities
In evaluating the Company’s post-retirement benefit liabilities, Management believes changes in discount rates which have occurred pursuant to newly enacted Federal legislation will not have a significant impact on the Company’s future operating results or financial condition.
The First Bancorp 2010 Form 10-K
Page 45
Market risk is the risk of loss arising from adverse changes in the fair value of financial instruments due to changes in interest rates, and the Company’s market risk is composed primarily of interest rate risk. The Bank’s Asset/Liability Committee (ALCO) is responsible for reviewing the interest rate sensitivity position of the Company and establishing policies to monitor and limit exposure to interest rate risk. All guidelines and policies established by ALCO have been approved by the Board of Directors.
Asset/Liability Management
The primary goal of asset/liability management is to maximize net interest income within the interest rate risk limits set by ALCO. Interest rate risk is monitored through the use of two complementary measures: static gap analysis and earnings simulation modeling. While each measurement has limitations, taken together they present a reasonably comprehensive view of the magnitude of interest rate risk in the Company, the level of risk through time, and the amount of exposure to changes in certain interest rate relationships.
Static gap analysis measures the amount of repricing risk embedded in the balance sheet at a point in time. It does so by comparing the differences in the repricing characteristics of assets and liabilities. A gap is defined as the difference between the principal amount of assets and liabilities which reprice within a specified time period. The cumulative one-year gap, at December 31, 2010, was +2.14% of total assets, which compares to +0.72% of assets at December 31, 2009. ALCO’s policy limit for the one-year gap is plus or minus 20% of total assets. Core deposits with non-contractual maturities are presented based upon historical patterns of balance attrition which are reviewed at least annually.
The gap repricing distributions include principal cash flows from residential mortgage loans and mortgage-backed securities in the time frames in which they are expected to be received. Mortgage prepayments are estimated by applying industry median projections of prepayment speeds to portfolio segments based on coupon range and loan age.
The Company’s summarized static gap, as of December 31, 2010, is presented in the following table:
| 0-90 | 90-365 | 1-5 | 5 | + | ||||||||||||
|
Dollars in thousands
|
Days
|
Days
|
Years
|
Years
|
||||||||||||
|
Investment securities at amortized cost
|
$ | 15,290 | $ | 33,388 | $ | 142,739 | $ | 209,192 | ||||||||
|
Federal Home Loan Bank and Federal Reserve Bank Stock, at cost
|
- | - | 14,031 | 1,412 | ||||||||||||
|
Loans held for sale
|
- | - | - | 2,806 | ||||||||||||
|
Loans
|
422,940 | 139,952 | 220,603 | 104,101 | ||||||||||||
|
Other interest-earning assets
|
- | 9,842 | - | - | ||||||||||||
|
Non-rate-sensitive assets
|
8,494 | - | 100 | 68,912 | ||||||||||||
|
Total assets
|
446,724 | 183,182 | 377,473 | 386,423 | ||||||||||||
|
Interest-bearing deposits
|
328,720 | 136,537 | 214,771 | 220,458 | ||||||||||||
|
Borrowed funds
|
127,163 | 9 | 80,048 | 50,110 | ||||||||||||
|
Non-rate-sensitive liabilities and equity
|
1,850 | 5,850 | 38,800 | 189,486 | ||||||||||||
|
Total liabilities and equity
|
457,733 | 142,396 | 333,619 | 460,054 | ||||||||||||
|
Period gap
|
$ | (11,009 | ) | $ | 40,786 | $ | 43,854 | $ | (73,631 | ) | ||||||
|
Percent of total assets
|
-0.79 | % | 2.93 | % | 3.15 | % | -5.28 | % | ||||||||
|
Cumulative gap (current)
|
(11,009 | ) | 29,777 | 73,631 | - | |||||||||||
|
Percent of total assets
|
-0.79 | % | 2.14 | % | 5.28 | % | 0.00 | % | ||||||||
The earnings simulation model forecasts capture the impact of changing interest rates on one-year and two-year net interest income. The modeling process calculates changes in interest income received and interest expense paid on all interest-earning assets and interest-bearing liabilities reflected on the Company’s balance sheet. None of the assets used in the simulation are held for trading purposes. The modeling is done for a variety of scenarios that incorporate changes in the absolute level of interest rates as well as basis risk, as represented by changes in the shape of the yield curve and changes in interest rate relationships. Management evaluates the effects on income of alternative interest rate
The First Bancorp 2010 Form 10-K
Page 46
scenarios against earnings in a stable interest rate environment. This analysis is also most useful in determining the short-run earnings exposures to changes in customer behavior involving loan payments and deposit additions and withdrawals.
The Company’s most recent simulation model projects net interest income would increase by approximately 0.6% of stable-rate net interest income if short-term rates affected by Federal Open Market Committee actions fall gradually by one percentage point over the next year, and decrease by approximately 1.5% if rates rise gradually by two percentage points. Both scenarios are well within ALCO’s policy limit of a decrease in net interest income of no more than 10.0% given a 2.0% move in interest rates, up or down. Management believes this reflects a reasonable interest rate risk position. In year two, and assuming no additional movement in rates, the model forecasts that net interest income would be lower than that earned in a stable rate environment by 2.2% in a falling-rate scenario, and lower than that earned in a stable rate environment by 4.7% in a rising rate scenario, when compared to the year-one base scenario. A summary of the Bank’s interest rate risk simulation modeling, as of December 31, 2010 and 2009 is presented in the following table:
|
Changes in Net Interest Income
|
2010
|
2009
|
|
Year 1
|
||
|
Projected changes if rates decrease by 1.0%
|
+0.6%
|
-0.1%
|
|
Projected change if rates increase by 2.0%
|
-1.5%
|
-1.0%
|
|
Year 2
|
||
|
Projected changes if rates decrease by 1.0%
|
-2.2%
|
-0.8%
|
|
Projected change if rates increase by 2.0%
|
-4.7%
|
-4.4%
|
This dynamic simulation model includes assumptions about how the balance sheet is likely to evolve through time and in different interest rate environments. Loans and deposits are projected to maintain stable balances. All maturities, calls and prepayments in the securities portfolio are assumed to be reinvested in similar assets. Mortgage loan prepayment assumptions are developed from industry median estimates of prepayment speeds for portfolios with similar coupon ranges and seasoning. Non-contractual deposit volatility and pricing are assumed to follow historical patterns. The sensitivities of key assumptions are analyzed annually and reviewed by ALCO.
This sensitivity analysis does not represent a Company forecast and should not be relied upon as being indicative of expected operating results. These hypothetical estimates are based upon numerous assumptions including, among others, the nature and timing of interest rate levels, yield curve shape, prepayments on loans and securities, pricing decisions on loans and deposits, and reinvestment/ replacement of asset and liability cash flows. While assumptions are developed based upon current economic and local market conditions, the Company cannot make any assurances as to the predictive ability of these assumptions, including how customer preferences or competitor influences might change.
Interest Rate Risk Management
A variety of financial instruments can be used to manage interest rate sensitivity. These may include investment securities, interest rate swaps, and interest rate caps and floors. Frequently called interest rate derivatives, interest rate swaps, caps and floors have characteristics similar to securities but possess the advantages of customization of the risk-reward profile of the instrument, minimization of balance sheet leverage and improvement of liquidity. As of December 31, 2010, the Company was using no interest rate derivatives for interest rate risk management.
The Company engages an independent consultant to periodically review its interest rate risk position, as well as the effectiveness of simulation modeling and reasonableness of assumptions used. As of December 31, 2010, there were no significant differences between the views of the independent consultant and Management regarding the Company’s interest rate risk exposure. Management expects interest rates will remain stable in the next two-to-four quarters and believes that the current level of interest rate risk is acceptable.
The First Bancorp 2010 Form 10-K
Page 47
The First Bancorp, Inc. and Subsidiary
|
As of December 31,
|
2010
|
2009
|
||||||
|
Assets
|
||||||||
|
Cash and cash equivalents
|
$ | 13,838,000 | $ | 15,332,000 | ||||
|
Time deposits in other banks
|
100,000 | - | ||||||
|
Securities available for sale
|
293,229,000 | 81,838,000 | ||||||
|
Securities to be held to maturity, fair value of $110,366,000
at December 31, 2010, and $192,838,000 at December 31, 2009
|
107,380,000 | 190,537,000 | ||||||
|
Federal Reserve Bank stock, at cost
|
1,412,000 | 1,412,000 | ||||||
|
Federal Home Loan Bank stock, at cost
|
14,031,000 | 14,031,000 | ||||||
|
Loans held for sale
|
2,806,000 | 2,876,000 | ||||||
|
Loans
|
887,596,000 | 952,492,000 | ||||||
|
Less allowance for loan losses
|
13,316,000 | 13,637,000 | ||||||
|
Net loans
|
874,280,000 | 938,855,000 | ||||||
|
Accrued interest receivable
|
5,263,000 | 4,889,000 | ||||||
|
Premises and equipment, net
|
18,980,000 | 18,331,000 | ||||||
|
Other real estate owned
|
4,929,000 | 5,345,000 | ||||||
|
Goodwill
|
27,684,000 | 27,684,000 | ||||||
|
Other assets
|
29,870,000 | 30,264,000 | ||||||
|
Total assets
|
$ | 1,393,802,000 | $ | 1,331,394,000 | ||||
|
Liabilities
|
||||||||
|
Demand deposits
|
$ | 74,032,000 | $ | 66,317,000 | ||||
|
NOW deposits
|
119,823,000 | 114,955,000 | ||||||
|
Money market deposits
|
71,604,000 | 94,425,000 | ||||||
|
Savings deposits
|
100,870,000 | 90,873,000 | ||||||
|
Certificates of deposit
|
608,189,000 | 556,097,000 | ||||||
|
Total deposits
|
974,518,000 | 922,667,000 | ||||||
|
Borrowed funds – short term
|
127,160,000 | 100,177,000 | ||||||
|
Borrowed funds – long term
|
130,170,000 | 149,601,000 | ||||||
|
Other liabilities
|
12,106,000 | 11,011,000 | ||||||
|
Total liabilities
|
1,243,954,000 | 1,183,456,000 | ||||||
|
Commitments and contingent liabilities (notes 13, 17, 18 and 21)
|
||||||||
|
Shareholders’ equity
|
||||||||
|
Preferred stock, $1,000 preference value per share
|
24,705,000 | 24,606,000 | ||||||
|
Common stock, one cent par value per share
|
98,000 | 97,000 | ||||||
|
Additional paid-in capital
|
45,474,000 | 45,121,000 | ||||||
|
Retained earnings
|
81,701,000 | 78,450,000 | ||||||
|
Accumulated other comprehensive loss
|
||||||||
|
Net unrealized loss on securities available for sale, net of
tax benefit of $1,108,000 in 2010 and $67,000 in 2009
|
(2,057,000 | ) | (125,000 | ) | ||||
|
Net unrealized loss on post-retirement benefit costs,
net of tax benefit of $39,000 in 2010 and $114,000 in 2009
|
(73,000 | ) | (211,000 | ) | ||||
|
Total shareholders’ equity
|
149,848,000 | 147,938,000 | ||||||
|
Total liabilities and shareholders’ equity
|
$ | 1,393,802,000 | $ | 1,331,394,000 | ||||
|
Common stock
|
||||||||
|
Number of shares authorized
|
18,000,000 | 18,000,000 | ||||||
|
Number of shares issued and outstanding
|
9,773,025 | 9,744,170 | ||||||
|
Book value per share
|
$ | 12.80 | $ | 12.66 | ||||
|
The accompanying notes are an integral part of these consolidated financial statements
|
||||||||
The First Bancorp 2010 Form 10-K
Page 48
The First Bancorp, Inc. and Subsidiary
|
Years ended December 31,
|
2010
|
2009
|
2008
|
|||||||||
|
Interest and dividend income
|
||||||||||||
|
Interest and fees on loans (includes tax-exempt income of
$868,000 in 2010, $1,472,000 in 2009, and $1,245,000 in 2008)
|
$ | 43,903,000 | $ | 49,277,000 | $ | 58,079,000 | ||||||
|
Interest on deposits with other banks
|
6,000 | 1,000 | 3,000 | |||||||||
|
Interest and dividends on investments (includes tax-exempt income of $3,373,000 in 2010, $2,980,000 in 2009, and $2,820,000 in 2008)
|
13,351,000 | 13,291,000 | 13,290,000 | |||||||||
|
Total interest and dividend income
|
57,260,000 | 62,569,000 | 71,372,000 | |||||||||
|
Interest expense
|
||||||||||||
|
Interest on deposits
|
10,297,000 | 11,872,000 | 23,000,000 | |||||||||
|
Interest on borrowed funds
|
6,374,000 | 7,044,000 | 10,669,000 | |||||||||
|
Total interest expense
|
16,671,000 | 18,916,000 | 33,669,000 | |||||||||
|
Net interest income
|
40,589,000 | 43,653,000 | 37,703,000 | |||||||||
|
Provision for loan losses
|
8,400,000 | 12,160,000 | 4,700,000 | |||||||||
|
Net interest income after provision for loan losses
|
32,189,000 | 31,493,000 | 33,003,000 | |||||||||
|
Non-interest income
|
||||||||||||
|
Fiduciary and investment management income
|
1,455,000 | 1,331,000 | 1,475,000 | |||||||||
|
Service charges on deposit accounts
|
2,838,000 | 2,516,000 | 2,837,000 | |||||||||
|
Net securities gains
|
2,000 | - | - | |||||||||
|
Mortgage origination and servicing income
|
1,796,000 | 2,341,000 | 145,000 | |||||||||
|
Other operating income
|
3,044,000 | 6,566,000 | 5,189,000 | |||||||||
|
Total non-interest income
|
9,135,000 | 12,754,000 | 9,646,000 | |||||||||
|
Non-interest expense
|
||||||||||||
|
Salaries and employee benefits
|
11,927,000 | 10,935,000 | 11,333,000 | |||||||||
|
Occupancy expense
|
1,536,000 | 1,580,000 | 1,518,000 | |||||||||
|
Furniture and equipment expense
|
2,209,000 | 2,273,000 | 2,005,000 | |||||||||
|
FDIC insurance premiums
|
1,931,000 | 1,666,000 | 402,000 | |||||||||
|
Net securities losses
|
- | 150,000 | 89,000 | |||||||||
|
Other-than-temporary impairment charge
|
- | 916,000 | - | |||||||||
|
Amortization of core deposit intangible
|
283,000 | 283,000 | 283,000 | |||||||||
|
Other operating expenses
|
7,244,000 | 8,855,000 | 7,364,000 | |||||||||
|
Total non-interest expense
|
25,130,000 | 26,658,000 | 22,994,000 | |||||||||
|
Income before income taxes
|
16,194,000 | 17,589,000 | 19,655,000 | |||||||||
|
Income tax expense
|
4,078,000 | 4,547,000 | 5,621,000 | |||||||||
|
Net income
|
$ | 12,116,000 | $ | 13,042,000 | $ | 14,034,000 | ||||||
|
Less dividends and amortization of premium on preferred stock
|
1,348,000 | 1,161,000 | - | |||||||||
|
Net income available to common shareholders
|
$ | 10,768,000 | $ | 11,881,000 | $ | 14,034,000 | ||||||
|
Earnings per common share
|
||||||||||||
|
Basic earnings per share
|
$ | 1.10 | $ | 1.22 | $ | 1.45 | ||||||
|
Diluted earnings per share
|
1.10 | 1.22 | 1.44 | |||||||||
|
Cash dividends declared per share
|
0.780 | 0.780 | 0.765 | |||||||||
|
Weighted average number of shares outstanding
|
9,760,760 | 9,721,172 | 9,701,379 | |||||||||
|
Incremental shares
|
4,726 | 12,072 | 18,952 | |||||||||
|
The accompanying notes are an integral part of these consolidated financial statements
|
||||||||||||
The First Bancorp 2010 Form 10-K
Page 49
Consolidated Statements of Changes in Shareholders’ Equity
The First Bancorp, Inc. and Subsidiary
|
Common stock and
|
Accumulated other
|
Total
|
||||||||||||||||||||||
|
Preferred
|
additional paid-in capital
|
Retained
|
comprehensive
|
shareholders’
|
||||||||||||||||||||
|
stock
|
Shares
|
Amount
|
earnings
|
income (loss)
|
equity
|
|||||||||||||||||||
|
Balance at December 31, 2007
|
$ | - | 9,732,493 | $ | 44,859,000 | $ | 67,432,000 | $ | 162,000 | $ | 112,453,000 | |||||||||||||
|
Net income
|
- | - | - | 14,034,000 | - | 14,034,000 | ||||||||||||||||||
|
Net unrealized loss on securities available for sale, net of tax benefit of $675,000
|
- | - | - | - | (1,255,000 | ) | (1,255,000 | ) | ||||||||||||||||
|
Unrecognized actuarial gain
for post-retirement benefits,
net of taxes of $1,000
|
- | - | - | - | 3,000 | 3,000 | ||||||||||||||||||
|
Comprehensive income
|
- | - | - | 14,034,000 | (1,252,000 | ) | 12,782,000 | |||||||||||||||||
|
Cash dividends declared
|
- | - | - | (7,416,000 | ) | - | (7,416,000 | ) | ||||||||||||||||
|
Equity compensation expense
|
- | - | 37,000 | - | - | 37,000 | ||||||||||||||||||
|
Payment to repurchase common stock
|
- | (88,764 | ) | (1,414,000 | ) | - | - | (1,414,000 | ) | |||||||||||||||
|
Proceeds from sale of common stock
|
- | 52,668 | 732,000 | - | - | 732,000 | ||||||||||||||||||
|
Tax benefit of disqualifying disposition of stock option shares
|
- | - | - | 7,000 | - | 7,000 | ||||||||||||||||||
|
Balance at December 31, 2008
|
$ | - | 9,696,397 | $ | 44,214,000 | $ | 74,057,000 | $ | (1,090,000 | ) | $ | 117,181,000 | ||||||||||||
|
Net income
|
- | - | - | 13,042,000 | - | 13,042,000 | ||||||||||||||||||
|
Net unrealized gain on securities available for sale, net of taxes
of $374,000
|
- | - | - | - | 694,000 | 694,000 | ||||||||||||||||||
|
Unrecognized actuarial gain
for post-retirement benefits, net of taxes of $32,000
|
- | - | - | - | 60,000 | 60,000 | ||||||||||||||||||
|
Comprehensive income
|
- | - | - | 13,042,000 | 754,000 | 13,796,000 | ||||||||||||||||||
|
Cash dividends declared
|
- | - | - | (8,649,000 | ) | - | (8,649,000 | ) | ||||||||||||||||
|
Equity compensation expense
|
- | - | 37,000 | - | - | 37,000 | ||||||||||||||||||
|
Proceeds from sale of preferred stock
|
25,000,000 | - | - | - | - | 25,000,000 | ||||||||||||||||||
|
Discount on preferred stock issuance
|
(493,000 | ) | - | 493,000 | - | - | - | |||||||||||||||||
|
Amortization of discount on preferred stock
|
99,000 | - | (99,000 | ) | - | - | - | |||||||||||||||||
|
Payment to repurchase common stock
|
- | (15,925 | ) | (263,000 | ) | - | - | (263,000 | ) | |||||||||||||||
|
Proceeds from sale of common stock
|
- | 63,698 | 836,000 | - | - | 836,000 | ||||||||||||||||||
|
Balance at December 31, 2009
|
$ | 24,606,000 | 9,744,170 | $ | 45,218,000 | $ | 78,450,000 | $ | (336,000 | ) | $ | 147,938,000 | ||||||||||||
The First Bancorp 2010 Form 10-K
Page 50
|
Common stock and
|
Accumulated other
|
Total
|
||||||||||||||||||||||
|
Preferred
|
additional paid-in capital
|
Retained
|
comprehensive
|
shareholders’
|
||||||||||||||||||||
|
stock
|
Shares
|
Amount
|
earnings
|
income (loss)
|
equity
|
|||||||||||||||||||
|
Balance at December 31, 2009
|
$ | 24,606,000 | 9,744,170 | $ | 45,218,000 | $ | 78,450,000 | $ | (336,000 | ) | $ | 147,938,000 | ||||||||||||
|
Net income
|
- | - | - | 12,116,000 | - | 12,116,000 | ||||||||||||||||||
|
Net unrealized loss on securities available for sale, net of tax benefit of $1,041,000
|
- | - | - | - | (1,932,000 | ) | (1,932,000 | ) | ||||||||||||||||
|
Unrecognized actuarial gain for post-retirement benefits, net of taxes of $75,000
|
- | - | - | - | 138,000 | 138,000 | ||||||||||||||||||
|
Comprehensive income
|
- | - | - | 12,116,000 | (1,794,000 | ) | 10,322,000 | |||||||||||||||||
|
Cash dividends declared
|
- | - | - | (8,865,000 | ) | - | (8,865,000 | ) | ||||||||||||||||
|
Equity compensation expense
|
- | - | 37,000 | - | - | 37,000 | ||||||||||||||||||
|
Amortization of discount for preferred stock issuance
|
99,000 | - | (99,000 | ) | - | - | - | |||||||||||||||||
|
Proceeds from sale of common stock
|
- | 28,855 | 416,000 | - | - | 416,000 | ||||||||||||||||||
|
Balance at December 31, 2010
|
$ | 24,705,000 | 9,773,025 | $ | 45,572,000 | $ | 81,701,000 | $ | (2,130,000 | ) | $ | 149,848,000 | ||||||||||||
|
The accompanying notes are an integral part of these consolidated financial statements
|
||||||||||||||||||||||||
The First Bancorp 2010 Form 10-K
Page 51
The First Bancorp, Inc. and Subsidiary
|
For the years ended December 31,
|
2010
|
2009
|
2008
|
|||||||||
|
Cash flows from operating activities
|
||||||||||||
|
Net income
|
$ | 12,116,000 | $ | 13,042,000 | $ | 14,034,000 | ||||||
|
Adjustments to reconcile net income to net cash provided by operating activities:
|
||||||||||||
|
Depreciation
|
1,394,000 | 1,483,000 | 1,232,000 | |||||||||
|
Change in deferred income taxes
|
395,000 | (1,210,000 | ) | (1,039,000 | ) | |||||||
|
Provision for loan losses
|
8,400,000 | 12,160,000 | 4,700,000 | |||||||||
|
Loans originated for resale
|
(65,726,000 | ) | (117,282,000 | ) | (19,199,000 | ) | ||||||
|
Proceeds from sales of loans
|
65,796,000 | 115,704,000 | 19,718,000 | |||||||||
|
Net (gain) loss on sale or call of securities
|
(2,000 | ) | 150,000 | 89,000 | ||||||||
|
Write-down of securities available for sale
|
- | 916,000 | - | |||||||||
|
Net amortization (accretion) of premiums and discounts on investments
|
899,000 | (2,774,000 | ) | (5,475,000 | ) | |||||||
|
Net loss on sale of other real estate owned
|
122,000 | 223,000 | - | |||||||||
|
Provision for losses on other real estate owned
|
352,000 | 481,000 | - | |||||||||
|
Equity compensation expense
|
37,000 | 37,000 | 37,000 | |||||||||
|
Net change in other assets and accrued interest receivable
|
177,000 | (4,013,000 | ) | (1,627,000 | ) | |||||||
|
Net change in other liabilities
|
1,139,000 | (728,000 | ) | (1,933,000 | ) | |||||||
|
Net loss on sale of premises and equipment
|
- | 11,000 | 17,000 | |||||||||
|
Amortization of investments in limited partnerships
|
300,000 | 275,000 | 84,000 | |||||||||
|
Net acquisition amortization
|
251,000 | 260,000 | 239,000 | |||||||||
|
Net cash provided by operating activities
|
25,650,000 | 18,735,000 | 10,877,000 | |||||||||
|
Cash flows from investing activities
|
||||||||||||
|
Purchase of time deposits in other banks
|
(100,000 | ) | - | - | ||||||||
|
Proceeds from sales of securities available for sale
|
202,000 | 4,051,000 | 14,192,000 | |||||||||
|
Proceeds from maturities, payments, calls of securities available for sale
|
101,223,000 | 10,255,000 | 3,551,000 | |||||||||
|
Proceeds from maturities, payments, calls of securities held to maturity
|
84,287,000 | 183,973,000 | 106,450,000 | |||||||||
|
Proceeds from sales of other real estate owned
|
3,722,000 | 820,000 | - | |||||||||
|
Purchases of securities available for sale
|
(316,453,000 | ) | (81,853,000 | ) | (5,373,000 | ) | ||||||
|
Investments in limited partnerships
|
- | (1,371,000 | ) | (1,700,000 | ) | |||||||
|
Purchases of securities to be held to maturity
|
(1,363,000 | ) | (138,186,000 | ) | (154,618,000 | ) | ||||||
|
Purchases of Federal Home Loan Bank stock
|
- | - | (1,463,000 | ) | ||||||||
|
Purchases of Federal Reserve Bank stock
|
- | (750,000 | ) | - | ||||||||
|
Net (increase) decrease in loans
|
52,395,000 | 15,017,000 | (63,410,000 | ) | ||||||||
|
Capital expenditures
|
(2,043,000 | ) | (3,798,000 | ) | (796,000 | ) | ||||||
|
Proceeds from sale of premises and equipment
|
- | 1,000 | - | |||||||||
|
Net cash used in investing activities
|
(78,130,000 | ) | (11,841,000 | ) | (103,167,000 | ) | ||||||
|
Cash flows from financing activities
|
||||||||||||
|
Net increase (decrease) in transaction and savings accounts
|
(241,000 | ) | (22,217,000 | ) | 15,826,000 | |||||||
|
Net increase in certificates of deposit
|
52,124,000 | 19,164,000 | 128,651,000 | |||||||||
|
Advances on long-term borrowings
|
30,000,000 | 10,000,000 | 50,000,000 | |||||||||
|
Repayments on long-term borrowings
|
(50,000,000 | ) | (27,000,000 | ) | - | |||||||
|
Net increase (decrease) in short-term borrowings
|
27,552,000 | (5,289,000 | ) | (94,622,000 | ) | |||||||
|
Proceeds from issuance of preferred stock
|
- | 25,000,000 | - | |||||||||
|
Payments to repurchase common stock
|
- | (263,000 | ) | (1,414,000 | ) | |||||||
|
Proceeds from sale of common stock
|
416,000 | 836,000 | 732,000 | |||||||||
|
Dividends paid
|
(8,865,000 | ) | (8,649,000 | ) | (7,281,000 | ) | ||||||
|
Net cash provided (used) by financing activities
|
50,986,000 | (8,418,000 | ) | 91,892,000 | ||||||||
|
Net decrease in cash and cash equivalents
|
(1,494,000 | ) | (1,524,000 | ) | (398,000 | ) | ||||||
|
Cash and cash equivalents at beginning of year
|
15,332,000 | 16,856,000 | 17,254,000 | |||||||||
|
Cash and cash equivalents at end of year
|
$ | 13,838,000 | $ | 15,332,000 | $ | 16,856,000 | ||||||
|
Interest paid
|
$ | 16,824,000 | $ | 19,160,000 | $ | 34,558,000 | ||||||
|
Income taxes paid
|
3,317,000 | 5,859,000 | 7,111,000 | |||||||||
|
Non-cash transactions:
|
||||||||||||
|
Transfer from loans to other real estate owned
|
3,780,000 | 4,441,000 | 1,601,000 | |||||||||
The accompanying notes are an integral part of these consolidated financial statements
The First Bancorp 2010 Form 10-K
Page 52
Notes to Consolidated Financial Statements
Nature of Operations
The First Bancorp, Inc. (the “Company”) through its wholly-owned subsidiary, The First, N.A. (“the Bank”), provides a full range of banking services to individual and corporate customers from fourteen offices in coastal Maine. First Advisors, a division of the Bank, provides investment management, private banking and financial planning services. At the Company’s Annual Meeting of Shareholders on April 30, 2008, the Company’s name was changed to The First Bancorp, Inc. from First National Lincoln Corporation.
Principles of Consolidation
The consolidated financial statements include the accounts of the Company and the Bank. All intercompany accounts and transactions have been eliminated in consolidation.
Subsequent Events
Events occurring subsequent to December 31, 2010, have been evaluated as to their potential impact to the financial statements.
Use of Estimates in Preparation of Financial Statements
In preparing the financial statements in accordance with accounting principles generally accepted in the United States of America, Management is required to make estimates and assumptions that affect the reported amounts of assets and liabilities and disclosures of contingent assets and liabilities as of the date of the balance sheet and revenues and expenses for the reporting period. Actual results could differ significantly from those estimates. Material estimates that are particularly susceptible to significant change in the near-term relate to the determination of the allowance for loan losses, the valuation of mortgage servicing rights, and goodwill.
Investment Securities
Investment securities are classified as available for sale or held to maturity when purchased. There are no trading account securities. Securities available for sale consist primarily of debt securities which Management intends to hold for indefinite periods of time. They may be used as part of the Bank’s funds management strategy, and may be sold in response to changes in interest rates or prepayment risk, changes in liquidity needs, or for other reasons. They are accounted for at fair value, with unrealized gains or losses adjusted through shareholders’ equity, net of related income taxes. Securities to be held to maturity consist primarily of debt securities which Management has acquired solely for long-term investment purposes, rather than for purposes of trading or future sale. For securities to be held to maturity, Management has the intent and the Bank has the ability to hold such securities until their respective maturity dates. Such securities are carried at cost adjusted for the amortization of premiums and accretion of discounts. Investment securities transactions are accounted for on a settlement date basis; reported amounts would not be materially different from those accounted for on a trade date basis. Gains and losses on the sales of investment securities are determined using the amortized cost of the security. For declines in the fair value of individual debt securities available for sale below their cost that are deemed to be other than temporary, where the Company does not intend to sell the security and it is more likely than not that the Company will not be required to sell the security before recovery of its amortized cost basis, the other-than-temporary decline in the fair value of the debt security related to 1) credit loss is recognized in earnings and 2) other factors is recognized in other comprehensive income or loss. Credit loss is deemed to exist if the present value of expected future cash flows using the effective rate at acquisition is less than the amortized cost basis of the debt security. For individual debt securities where the Company intends to sell the security or more likely than not will be required to sell the security before recovery of its amortized cost, the other-than-temporary impairment is recognized in earnings equal to the entire difference between the security’s cost basis and its fair value at the balance sheet date.
Loans Held for Sale
Loans held for sale consist of residential real estate mortgage loans and are carried at the lower of aggregate cost or market value, as determined by current investor yield requirements.
Loans
Loans are generally reported at their outstanding principal balances, adjusted for chargeoffs, the allowance for loan losses and any deferred fees or costs to originate loans. Loan commitments are recorded when funded.
The First Bancorp 2010 Form 10-K
Page 53
Loan Fees and Costs
Loan origination fees and certain direct loan origination costs are deferred and recognized in interest income as an adjustment to the loan yield over the life of the related loans. The unamortized net deferred fees and costs are included on the balance sheets with the related loan balances, and the amortization is included with the related interest income.
Allowance for Loan Losses
Loans considered to be uncollectible are charged against the allowance for loan losses. The allowance for loan losses is maintained at a level determined by Management to be adequate to absorb probable losses. This allowance is increased by provisions charged to operating expenses and recoveries on loans previously charged off. Arriving at an appropriate level of allowance for loan losses necessarily involves a high degree of judgment. In determining the appropriate level of allowance for loan losses, Management takes into consideration several factors, including reviews of individual non-performing loans and performing loans listed on the watch report requiring periodic evaluation, loan portfolio size by category, recent loss experience, delinquency trends and current economic conditions. Loans over 30 days past due are considered delinquent. Impaired loans include restructured loans and loans placed on non-accrual status when, based on current information and events, it is probable that we will be unable to collect all amounts due according to the contractual terms of the loan agreement. These loans are measured at the present value of expected future cash flows discounted at the loan’s effective interest rate or at the fair value of the collateral if the loan is collateral dependent. Management takes into consideration impaired loans in addition to the above mentioned factors in determining the appropriate level of allowance for loan losses.
Goodwill and Identified Intangible Assets
Intangible assets include the excess of the purchase price over the fair value of net assets acquired (goodwill) from the acquisition of FNB Bankshares in 2005 as well as the core deposit intangible related to the same acquisition. The core deposit intangible is amortized on a straight-line basis over ten years. Amortization expense for 2010, 2009 and 2008 was $283,000 and the amortization expense for each year until fully amortized will be $283,000. The straight-line basis is used because the Company does not expect significant run off in the core deposits acquired. The Company annually evaluates goodwill, and periodically evaluates other intangible assets for impairment on the basis of whether these assets are fully recoverable from projected, undiscounted net cash flows of the acquired company. At December 31, 2010, the Company determined goodwill and other intangible assets were not impaired.
Income Taxes
Deferred tax assets and liabilities are recognized for the future tax consequences attributable to differences between financial statement carrying amounts of assets and liabilities and their respective tax bases. Deferred tax assets and liabilities are measured using enacted tax rates expected to apply to taxable income in the years in which those temporary differences are expected to be recovered or settled. The effect of a change in tax rates on deferred tax assets and liabilities is recognized in income in the period the change is enacted.
Accrual of Interest Income and Expense
Interest on loans and investment securities is taken into income using methods which relate the income earned to the balances of loans and investment securities outstanding. Interest expense on liabilities is derived by applying applicable interest rates to principal amounts outstanding. Recording of interest income on problem loans, which includes impaired loans, ceases when collectibility of principal and interest within a reasonable period of time becomes doubtful. Cash payments received on non-accrual loans, which includes impaired loans, are applied to reduce the loan’s principal balance until the remaining principal balance is deemed collectible, after which interest is recognized when collected. As a general rule, a loan may be restored to accrual status when payments are current and repayment of the remaining contractual amounts is expected or when it otherwise becomes well secured and in the process of collection.
Premises and Equipment
Premises, furniture and equipment are stated at cost, less accumulated depreciation. Depreciation expense is computed by straight-line and accelerated methods over the asset’s estimated useful life.
Other Real Estate Owned (OREO)
Real estate acquired by foreclosure or deed in lieu of foreclosure is transferred to OREO and recorded at fair value, less estimated costs to sell, based on appraised value at the date actually or constructively received. Loan losses arising from the acquisition of such property are charged against the allowance for loan losses. Subsequent provisions to reduce the carrying value of a property are recorded to the allowance for OREO losses and a charge to operations on a specific property basis.
The First Bancorp 2010 Form 10-K
Page 54
Earnings Per Share
Basic earnings per share data are based on the weighted average number of common shares outstanding during each year. Diluted earnings per share gives effect to the stock options and warrants outstanding, determined by the treasury stock method.
Post-Retirement Benefits
The cost of providing post-retirement benefits is accrued during the active service period of the employee or director.
Comprehensive Income
Comprehensive income includes net income and other comprehensive income (loss), which is comprised of the change in unrealized gains and losses on securities available for sale, net of tax, and unrealized gains and loss related to post-retirement benefit costs, net of tax, is disclosed in the consolidated statements of changes in shareholders’ equity.
Segments
The First Bancorp, Inc., through the branches of its subsidiary, The First, N.A., provides a broad range of financial services to individuals and companies in coastal Maine. These services include demand, time, and savings deposits; lending; ATM processing; and investment management and trust services. Operations are managed and financial performance is evaluated on a corporate-wide basis. Accordingly, all of the Company’s banking operations are considered by Management to be aggregated in one reportable operating segment.
Loan Servicing
Servicing rights are recognized when they are acquired through sale of loans. Capitalized servicing rights are reported in other assets and are amortized into non-interest income in proportion to, and over the period of, the estimated future net servicing income of the underlying financial assets. Servicing rights are evaluated for impairment based upon the fair value of the rights as compared to amortized cost. Impairment is determined by stratifying rights by predominant characteristics, such as interest rates and terms. Impairment is recognized through a valuation allowance for an individual stratum, to the extent that fair value is less than the capitalized amount for the stratum.
For the purposes of reporting consolidated cash flows, cash and cash equivalents include cash on hand, amounts due from banks and federal funds sold. At December 31, 2010 the Company had a contractual clearing balance of $500,000 and a reserve balance requirement of $672,000 at the Federal Reserve Bank, which are satisfied by both cash on hand at branches and balances held at the Federal Reserve Bank of Boston. The Company maintains a portion of its cash in bank deposit accounts which, at times, may exceed federally insured limits. The Company has not experienced any losses in such accounts. The Company believes it is not exposed to any significant risk with respect to these accounts.
The First Bancorp 2010 Form 10-K
Page 55
The following tables summarize the amortized cost and estimated fair value of investment securities at December 31, 2010 and 2009:
|
Amortized
|
Unrealized
|
Unrealized
|
Fair Value
|
|||||||||||||
|
As of December 31, 2010
|
Cost
|
Gains
|
Losses
|
(Estimated)
|
||||||||||||
|
Securities available for sale
|
||||||||||||||||
|
U.S. Treasury and agency
|
$ | 15,380,000 | $ | 665,000 | $ | - | $ | 16,045,000 | ||||||||
|
Mortgage-backed securities
|
236,126,000 | 1,024,000 | (2,736,000 | ) | 234,414,000 | |||||||||||
|
State and political subdivisions
|
43,404,000 | 171,000 | (2,051,000 | ) | 41,524,000 | |||||||||||
|
Corporate securities
|
1,113,000 | - | (247,000 | ) | 866,000 | |||||||||||
|
Other equity securities
|
371,000 | 19,000 | (10,000 | ) | 380,000 | |||||||||||
| $ | 296,394,000 | $ | 1,879,000 | $ | (5,044,000 | ) | $ | 293,229,000 | ||||||||
|
Securities to be held to maturity
|
||||||||||||||||
|
U.S. Treasury and agency
|
2,190,000 | 35,000 | - | 2,225,000 | ||||||||||||
|
Mortgage-backed securities
|
55,710,000 | 2,656,000 | (144,000 | ) | 58,222,000 | |||||||||||
|
State and political subdivisions
|
49,330,000 | 1,102,000 | (663,000 | ) | 49,769,000 | |||||||||||
|
Corporate securities
|
150,000 | - | - | 150,000 | ||||||||||||
| $ | 107,380,000 | $ | 3,793,000 | $ | (807,000 | ) | $ | 110,366,000 | ||||||||
|
Non-marketable securities
|
||||||||||||||||
|
Federal Home Loan Bank Stock
|
14,031,000 | - | - | 14,031,000 | ||||||||||||
|
Federal Reserve Bank Stock
|
1,412,000 | - | - | 1,412,000 | ||||||||||||
| $ | 15,443,000 | $ | - | $ | - | $ | 15,443,000 | |||||||||
|
Amortized
|
Unrealized
|
Unrealized
|
Fair Value
|
|||||||||||||
|
As of December 31, 2009
|
Cost
|
Gains
|
Losses
|
(Estimated)
|
||||||||||||
|
Securities available for sale
|
||||||||||||||||
|
U.S. Treasury and agency
|
$ | 31,022,000 | $ | 90,000 | $ | (153,000 | ) | $ | 30,959,000 | |||||||
|
Mortgage-backed securities
|
31,254,000 | 133,000 | (239,000 | ) | 31,148,000 | |||||||||||
|
State and political subdivisions
|
18,219,000 | 414,000 | (119,000 | ) | 18,514,000 | |||||||||||
|
Corporate securities
|
1,120,000 | - | (302,000 | ) | 818,000 | |||||||||||
|
Other equity securities
|
414,000 | 6,000 | (21,000 | ) | 399,000 | |||||||||||
| $ | 82,029,000 | $ | 643,000 | $ | (834,000 | ) | $ | 81,838,000 | ||||||||
|
Securities to be held to maturity
|
||||||||||||||||
|
U.S. Treasury and agency
|
39,099,000 | 142,000 | (554,000 | ) | 38,687,000 | |||||||||||
|
Mortgage-backed securities
|
90,193,000 | 1,839,000 | (363,000 | ) | 91,669,000 | |||||||||||
|
State and political subdivisions
|
61,095,000 | 1,603,000 | (366,000 | ) | 62,332,000 | |||||||||||
|
Corporate securities
|
150,000 | - | - | 150,000 | ||||||||||||
| $ | 190,537,000 | $ | 3,584,000 | $ | (1,283,000 | ) | $ | 192,838,000 | ||||||||
|
Non-marketable securities
|
||||||||||||||||
|
Federal Home Loan Bank Stock
|
14,031,000 | - | - | 14,031,000 | ||||||||||||
|
Federal Reserve Bank Stock
|
1,412,000 | - | - | 1,412,000 | ||||||||||||
| $ | 15,443,000 | $ | - | $ | - | $ | 15,443,000 | |||||||||
The following table summarizes the contractual maturities of investment securities at December 31, 2010:
The First Bancorp 2010 Form 10-K
Page 56
|
Securities available for sale
|
Securities to be held to maturity
|
|||||||||||||||
|
Amortized Cost
|
Fair Value (Estimated)
|
Amortized Cost
|
Fair Value (Estimated)
|
|||||||||||||
|
Due in 1 year or less
|
$ | - | $ | - | $ | 1,195,000 | $ | 1,203,000 | ||||||||
|
Due in 1 to 5 years
|
2,950,000 | 3,099,000 | 5,475,000 | 5,749,000 | ||||||||||||
|
Due in 5 to 10 years
|
2,385,000 | 2,404,000 | 13,838,000 | 14,435,000 | ||||||||||||
|
Due after 10 years
|
290,688,000 | 287,346,000 | 86,872,000 | 88,979,000 | ||||||||||||
|
Equity securities
|
371,000 | 380,000 | - | - | ||||||||||||
| $ | 296,394,000 | $ | 293,229,000 | $ | 107,380,000 | $ | 110,366,000 | |||||||||
The following table summarizes the contractual maturities of investment securities at December 31, 2009:
|
Securities available for sale
|
Securities to be held to maturity
|
|||||||||||||||
|
In thousands of dollars
|
Amortized
Cost
|
Fair Value (Estimated)
|
Amortized
Cost
|
Fair Value (Estimated)
|
||||||||||||
|
Due in 1 year or less
|
$ | - | $ | - | $ | 330,000 | $ | 335,000 | ||||||||
|
Due in 1 to 5 years
|
18,144,000 | 18,381,000 | 7,934,000 | 8,245,000 | ||||||||||||
|
Due in 5 to 10 years
|
3,671,000 | 3,783,000 | 15,020,000 | 15,591,000 | ||||||||||||
|
Due after 10 years
|
59,800,000 | 59,275,000 | 167,253,000 | 168,667,000 | ||||||||||||
|
Equity securities
|
414,000 | 399,000 | - | - | ||||||||||||
| $ | 82,029,000 | $ | 81,838,000 | $ | 190,537,000 | $ | 192,838,000 | |||||||||
At December 31, 2010, securities with a fair value of $113,023,000 were pledged to secure borrowings from the Federal Home Loan Bank of Boston, public deposits, repurchase agreements, and for other purposes as required by law. This compares to securities with a fair value of $154,034,000, as of December 31, 2009 pledged for the same purpose.
Gains and losses on the sale of securities available for sale are computed by subtracting the amortized cost at the time of sale from the security’s selling price, net of accrued interest to be received. The following table shows securities gains and losses for 2010, 2009 and 2008:
|
2010
|
2009
|
2008
|
||||||||||
|
Proceeds from sales
|
$ | 202,000 | $ | 4,051,000 | $ | 14,192,000 | ||||||
|
Gross gains
|
2,000 | 20,000 | 123,000 | |||||||||
|
Gross losses
|
- | (170,000 | ) | (212,000 | ) | |||||||
|
Net gain (loss)
|
$ | 2,000 | $ | (150,000 | ) | $ | (89,000 | ) | ||||
|
Related income taxes
|
$ | 1,000 | $ | (52,000 | ) | $ | (31,000 | ) | ||||
As of December 31, 2010, there were 136 securities with unrealized losses held in the Company’s portfolio. These securities were temporarily impaired as a result of changes in interest rates reducing their fair value, of which 13 had been temporarily impaired for 12 months or more. At the present time, there have been no material changes in the credit quality of these securities resulting in other than temporary impairment, and in Management’s opinion, no additional write-down for other-than-temporary impairment is warranted. Information regarding securities temporarily impaired as of December 31, 2010 is summarized below:
The First Bancorp 2010 Form 10-K
Page 57
|
Less than 12 months
|
12 months or more
|
Total
|
||||||||||||||||||||||
|
Fair
|
Unrealized
|
Fair
|
Unrealized
|
Fair
|
Unrealized
|
|||||||||||||||||||
|
As of December 31, 2010
|
Value
|
Losses
|
Value
|
Losses
|
Value
|
Losses
|
||||||||||||||||||
|
U.S. Treasury and agency
|
$ | - | $ | - | $ | - | $ | - | $ | - | $ | - | ||||||||||||
|
Mortgage-backed securities
|
160,767,000 | (2,654,000 | ) | 5,348,000 | (226,000 | ) | 166,115,000 | (2,880,000 | ) | |||||||||||||||
|
State and political subdivisions
|
44,513,000 | (2,307,000 | ) | 1,355,000 | (407,000 | ) | 45,868,000 | (2,714,000 | ) | |||||||||||||||
|
Corporate securities
|
- | - | 866,000 | (247,000 | ) | 866,000 | (247,000 | ) | ||||||||||||||||
|
Other equity securities
|
- | - | 56,000 | (10,000 | ) | 56,000 | (10,000 | ) | ||||||||||||||||
| $ | 205,280,000 | $ | (4,961,000 | ) | $ | 7,625,000 | $ | (890,000 | ) | $ | 212,905,000 | $ | (5,851,000 | ) | ||||||||||
During the first quarter of 2009, the Company took an after-tax charge of $596,000 for other-than-temporary impairment related to one automotive company corporate security in the investment portfolio. As of December 31, 2009, there were 45 securities with unrealized losses held in the Company’s portfolio. These securities were temporarily impaired as a result of changes in interest rates reducing their fair market value, of which eight had been temporarily impaired for 12 months or more. Information regarding securities temporarily impaired as of December 31, 2009 is summarized below:
|
Less than 12 months
|
12 months or more
|
Total
|
||||||||||||||||||||||
|
Fair
|
Unrealized
|
Fair
|
Unrealized
|
Fair
|
Unrealized
|
|||||||||||||||||||
|
As of December 31, 2009
|
Value
|
Losses
|
Value
|
Losses
|
Value
|
Losses
|
||||||||||||||||||
|
U.S. Treasury and agency
|
$ | 19,999,000 | $ | (707,000 | ) | $ | - | $ | - | $ | 19,999,000 | $ | (707,000 | ) | ||||||||||
|
Mortgage-backed securities
|
47,509,000 | (602,000 | ) | - | - | 47,509,000 | (602,000 | ) | ||||||||||||||||
|
State and political subdivisions
|
9,396,000 | (147,000 | ) | 1,350,000 | (338,000 | ) | 10,746,000 | (485,000 | ) | |||||||||||||||
|
Corporate securities
|
- | - | 818,000 | (302,000 | ) | 818,000 | (302,000 | ) | ||||||||||||||||
|
Other equity securities
|
- | - | 44,000 | (21,000 | ) | 44,000 | (21,000 | ) | ||||||||||||||||
| $ | 76,904,000 | $ | (1,456,000 | ) | $ | 2,212,000 | $ | (661,000 | ) | $ | 79,116,000 | $ | (2,117,000 | ) | ||||||||||
Federal Home Loan Bank stock and Federal Reserve Bank stock have also been evaluated for impairment. The Bank is a member of the Federal Home Loan Bank (“FHLB”) of Boston. The FHLB is a cooperatively owned wholesale bank for housing and finance in the six New England States. Its mission is to support the residential mortgage and community-development lending activities of its members, which include over 450 financial institutions across New England. As a requirement of membership in the FHLB, the Bank must own a minimum required amount of
FHLB stock, calculated periodically based primarily on the Bank’s level of borrowings from the FHLB. The Company uses the FHLB for much of its wholesale funding needs. As of December 31, 2010 and 2009, the Company’s investment in FHLB stock totaled $14.0 million.
FHLB stock is a non-marketable equity security and therefore is reported at cost, which equals par value. Shares held in excess of the minimum required amount are generally redeemable at par value. However, in the first quarter of 2009 the FHLB announced a moratorium on such redemptions in order to preserve its capital in response to current market conditions and declining retained earnings. The minimum required shares are redeemable, subject to certain limitations, five years following termination of FHLB membership. The Bank has no intention of terminating its FHLB membership.
For the year ended December 31, 2010, FHLB’s net income was $106.6 million, compared with a net loss of $186.8 million for 2009. Although the Company had no dividend income on its FHLB stock in 2010, in February 2011 FHLB’s board of directors declared a dividend equal to an annual yield of 0.30 percent, based on average stock outstanding for the fourth quarter of 2010, to be paid on March 2, 2011. FHLB’s board of directors anticipates that it will continue to declare modest cash dividends through 2011, but cautioned that adverse events such as a negative trend in credit losses on the FHLB’s private-label mortgage-backed securities or mortgage portfolio, a meaningful decline in income, or regulatory disapproval could lead to reconsideration of this plan.
The Company periodically evaluates its investment in FHLB stock for impairment based on, among other factors, the capital adequacy of the FHLB and its overall financial condition. No impairment losses have been recorded through December 31, 2010. The Bank will continue to monitor its investment in FHLB stock.
The First Bancorp 2010 Form 10-K
Page 58
At December 31, 2010 and 2009, the Bank serviced loans for others totaling $248,872,000 and $223,837,000, respectively. Net gains from the sale of loans totaled $977,000 in 2010, $962,000 in 2009, and $249,000 in 2008. In 2010, mortgage servicing rights of $646,000 were capitalized and amortization for the year totaled $450,000. At December 31, 2010, mortgage servicing rights had a fair value of $1,684,000. In 2009, mortgage servicing rights of $1,133,000 were capitalized and amortization for the year totaled $539,000. At December 31, 2009, mortgage servicing rights had a fair value of $1,422,000. Mortgage servicing rights are included in other assets.
The Financial Accounting Standards Board (“FASB”) Accounting Standards Codification (the “Codification” or “ASC”) Topic 860, “Transfers and Servicing”, requires all separately recognized servicing assets and servicing liabilities to be initially measured at fair value, if practicable. Servicing assets and servicing liabilities are reported using the amortization method or the fair value measurement method. In evaluating the carrying values of mortgage servicing rights, the Company obtains third party valuations based on loan level data including note rate, type and term of the underlying loans. The model utilizes several assumptions, the most significant of which is loan prepayments, calculated using a three-month moving average of weekly prepayment data published by the Public Securities Association (PSA) and modeled against the serviced loan portfolio, and the discount rate to discount future cash flows. As of December 31, 2010, the prepayment assumption using the PSA model was 236, which translates into an anticipated prepayment rate of 14.16%. The discount rate is the quarterly average ten-year U.S. Treasury interest rate plus 4.22%. Other assumptions include delinquency rates, foreclosure rates, servicing cost inflation, and annual unit loan cost. All assumptions are adjusted periodically to reflect current circumstances. Amortization of mortgage servicing rights, as well as write-offs due to prepayments of the related mortgage loans, are recorded as a charge against mortgage servicing fee income. Mortgage servicing rights are included in other assets and detailed in the following table:
|
As of December 31,
|
2010
|
2009
|
||||||
|
Mortgage servicing rights
|
$ | 5,732,000 | $ | 5,086,000 | ||||
|
Accumulated amortization
|
(4,265,000 | ) | (3,814,000 | ) | ||||
|
Impairment reserve
|
(23,000 | ) | (73,000 | ) | ||||
| $ | 1,444,000 | $ | 1,199,000 | |||||
The following table shows the composition of the Company’s loan portfolio as of December 31, 2010 and 2009:
|
December 31, 2010
|
December 31, 2009
|
|||||||||||||||
|
Commercial
|
||||||||||||||||
|
Real estate
|
$ | 245,540,000 | 27.7 | % | $ | 240,178,000 | 25.2 | % | ||||||||
|
Construction
|
41,869,000 | 4.7 | % | 48,714,000 | 5.1 | % | ||||||||||
|
Other
|
101,462,000 | 11.4 | % | 114,486,000 | 12.0 | % | ||||||||||
|
Municipal
|
21,833,000 | 2.5 | % | 45,952,000 | 4.8 | % | ||||||||||
|
Residential
|
||||||||||||||||
|
Term
|
337,927,000 | 38.1 | % | 367,267,000 | 38.7 | % | ||||||||||
|
Construction
|
15,512,000 | 1.7 | % | 17,361,000 | 1.8 | % | ||||||||||
|
Home equity line of credit
|
105,297,000 | 11.9 | % | 94,324,000 | 9.9 | % | ||||||||||
|
Consumer
|
18,156,000 | 2.0 | % | 24,210,000 | 2.5 | % | ||||||||||
|
Total loans
|
$ | 887,596,000 | 100.0 | % | $ | 952,492,000 | 100.0 | % | ||||||||
Loan balances include net deferred loan costs of $1,341,000 in 2010 and $1,352,000 in 2009. Pursuant to collateral agreements, qualifying first mortgage loans, which were valued at $192,911,000 and $295,119,000 at December 31, 2010 and 2009, respectively, were used to collateralize borrowings from the Federal Home Loan Bank of Boston. In addition, commercial, construction and home equity loans totaling $342,893,000 at December 31, 2010 were used to collateralize a standby line of credit at the Federal Reserve Bank of Boston that is currently unused.
At December 31, 2010 and 2009, non-accrual loans were $21,175,000 and $18,562,000, respectively. As of December 31, 2010, 2009 and 2008, interest income which would have been recognized on these loans, if interest had been accrued, was $1,334,000, $1,297,000, and $489,000, respectively. Loans more than 90 days past due accruing interest totaled $1,116,000 at December 31, 2010 and $1,176,000 at December 31, 2009. The Company continues to
The First Bancorp 2010 Form 10-K
Page 59
accrue interest on these loans because it believes collection of principal and interest is reasonably assured.
Loans to directors, officers and employees totaled $40,015,000 at December 31, 2010 and $38,952,000 at December 31, 2009. A summary of loans to directors and executive officers, which in the aggregate exceed $60,000, is as follows:
|
For the years ended December 31,
|
2010
|
2009
|
||||||
|
Balance at beginning of year
|
$ | 25,375,000 | $ | 23,896,000 | ||||
|
New loans
|
934,000 | 3,820,000 | ||||||
|
Repayments
|
(784,000 | ) | (2,341,000 | ) | ||||
|
Balance at end of year
|
$ | 25,525,000 | $ | 25,375,000 | ||||
Information on the past-due status of loans as of December 31, 2010, is presented in the following table:
|
30-89 Days
Past Due
|
90+ Days
Past Due
|
All
Past Due
|
Current
|
Total
|
90+ Days & Accruing
|
|||||||||||||||||||
|
Commercial
|
||||||||||||||||||||||||
|
Real estate
|
$ | 2,055,000 | $ | 4,000,000 | $ | 6,055,000 | $ | 239,485,000 | $ | 245,540,000 | $ | - | ||||||||||||
|
Construction
|
120,000 | 937,000 | 1,057,000 | 40,812,000 | 41,869,000 | - | ||||||||||||||||||
|
Other
|
3,070,000 | 1,370,000 | 4,440,000 | 97,022,000 | 101,462,000 | 524,000 | ||||||||||||||||||
|
Municipal
|
- | - | - | 21,833,000 | 21,833,000 | - | ||||||||||||||||||
|
Residential
|
||||||||||||||||||||||||
|
Term
|
4,535,000 | 7,696,000 | 12,231,000 | 325,696,000 | 337,927,000 | 585,000 | ||||||||||||||||||
|
Construction
|
104,000 | 1,724,000 | 1,828,000 | 13,684,000 | 15,512,000 | - | ||||||||||||||||||
|
Home Equity Line of Credit
|
1,564,000 | 474,000 | 2,038,000 | 103,259,000 | 105,297,000 | - | ||||||||||||||||||
|
Consumer
|
259,000 | 7,000 | 266,000 | 17,890,000 | 18,156,000 | 7,000 | ||||||||||||||||||
|
Total
|
$ | 11,707,000 | $ | 16,208,000 | $ | 27,915,000 | $ | 859,681,000 | $ | 887,596,000 | $ | 1,116,000 | ||||||||||||
Information on the past-due status of loans as of December 31, 2009, is presented in the following table:
|
30-89 Days
Past Due
|
90+ Days
Past Due
|
All
Past Due
|
Current
|
Total
|
90+ Days & Accruing
|
|||||||||||||||||||
|
Commercial
|
||||||||||||||||||||||||
|
Real estate
|
$ | 2,985,000 | $ | 6,458,000 | $ | 9,443,000 | $ | 230,735,000 | $ | 240,178,000 | $ | 391,000 | ||||||||||||
|
Construction
|
- | 458,000 | 458,000 | 48,256,000 | 48,714,000 | - | ||||||||||||||||||
|
Other
|
1,624,000 | 1,983,000 | 3,607,000 | 110,879,000 | 114,486,000 | 97,000 | ||||||||||||||||||
|
Municipal
|
- | - | - | 45,952,000 | 45,952,000 | - | ||||||||||||||||||
|
Residential
|
||||||||||||||||||||||||
|
Term
|
6,299,000 | 5,448,000 | 11,747,000 | 355,520,000 | 367,267,000 | 454,000 | ||||||||||||||||||
|
Construction
|
- | 3,182,000 | 3,182,000 | 14,179,000 | 17,361,000 | - | ||||||||||||||||||
|
Home Equity Line of Credit
|
549,000 | 133,000 | 682,000 | 93,642,000 | 94,324,000 | - | ||||||||||||||||||
|
Consumer
|
536,000 | 239,000 | 775,000 | 23,435,000 | 24,210,000 | 234,000 | ||||||||||||||||||
|
Total
|
$ | 11,993,000 | $ | 17,901,000 | $ | 29,894,000 | $ | 922,598,000 | $ | 952,492,000 | $ | 1,176,000 | ||||||||||||
Loans are placed on non-accrual status when, based on current information and events, it is probable that we will be unable to collect all amounts due according to the contractual terms of the loan agreement or when principal and interest is 90 days or more past due unless the loan is both well secured and in the process of collection (in which case the loan may continue to accrue interest in spite of its past due status). A loan is "well secured" if it is secured (1) by collateral in the form of liens on or pledges of real or personal property, including securities, that have a realizable value sufficient to discharge the debt (including accrued interest) in full, or (2) by the guarantee of a financially responsible party. A loan is "in the process of collection" if collection of the loan is proceeding in due course either (1) through legal action, including judgment enforcement procedures, or, (2) in appropriate circumstances, through collection efforts not involving legal action which are reasonably expected to result in repayment of the debt or in its restoration to a current status in the near future.
The First Bancorp 2010 Form 10-K
Page 60
Information on nonaccrual loans as of December 31, 2010 and 2009 is presented in the following table:
|
As of December 31
|
||||||||
|
2010
|
2009
|
|||||||
|
Commercial
|
||||||||
|
Real estate
|
$ | 5,946,000 | $ | 6,198,000 | ||||
|
Construction
|
937,000 | 458,000 | ||||||
|
Other
|
1,753,000 | 2,638,000 | ||||||
|
Municipal
|
- | - | ||||||
|
Residential
|
||||||||
|
Term
|
8,347,000 | 5,868,000 | ||||||
|
Construction
|
3,567,000 | 3,182,000 | ||||||
|
Home Equity Line of Credit
|
519,000 | 143,000 | ||||||
|
Consumer
|
106,000 | 75,000 | ||||||
|
Total
|
$ | 21,175,000 | $ | 18,562,000 | ||||
Information regarding impaired loans is as follows:
|
For the years ended December 31,
|
2010
|
2009
|
2008
|
|||||||||
|
Average investment in impaired loans
|
$ | 25,836,000 | $ | 16,263,000 | $ | 6,199,000 | ||||||
|
Interest income recognized on impaired loans, all on cash basis
|
227,000 | 70,000 | 24,000 | |||||||||
|
As of December 31,
|
2010
|
2009
|
||||||
|
Balance of impaired loans
|
$ | 25,283,000 | $ | 25,843,000 | ||||
|
Less portion for which no allowance for loan losses is allocated
|
(15,773,000 | ) | (13,682,000 | ) | ||||
|
Portion of impaired loan balance for which an allowance for loan losses is allocated
|
$ | 9,510,000 | $ | 12,161,000 | ||||
|
Portion of allowance for loan losses allocated to the impaired loan balance
|
$ | 1,256,000 | $ | 2,196,000 | ||||
Impaired loans include restructured loans and loans placed on non-accrual status when, based on current information and events, it is probable that we will be unable to collect all amounts due according to the contractual terms of the loan agreement. These loans are measured at the present value of expected future cash flows discounted at the loan’s effective interest rate or at the fair value of the collateral if the loan is collateral dependent. If the measure of an impaired loan is lower than the recorded investment in the loan and estimated selling costs, a specific reserve is established for the difference.
The First Bancorp 2010 Form 10-K
Page 61
A breakdown of impaired loans by category as of December 31, 2010, is presented in the following table:
|
Recorded Investment
|
Unpaid
Principal Balance
|
Related Allowance
|
Average
Recorded Investment
|
Unrecognized Interest
Income
|
||||||||||||||||
|
With No Related Allowance
|
||||||||||||||||||||
|
Commercial
|
||||||||||||||||||||
|
Real estate
|
$ | 3,531,000 | $ | 3,531,000 | $ | - | $ | 3,967,000 | $ | 232,000 | ||||||||||
|
Construction
|
257,000 | 257,000 | - | 271,000 | 20,000 | |||||||||||||||
|
Other
|
1,256,000 | 1,256,000 | - | 1,484,000 | 104,000 | |||||||||||||||
|
Municipal
|
- | - | - | - | - | |||||||||||||||
|
Residential
|
||||||||||||||||||||
|
Term
|
6,804,000 | 6,804,000 | - | 7,814,000 | 436,000 | |||||||||||||||
|
Construction
|
3,567,000 | 3,567,000 | - | 2,573,000 | 134,000 | |||||||||||||||
|
Home Equity Line of Credit
|
319,000 | 319,000 | - | 196,000 | 6,000 | |||||||||||||||
|
Consumer
|
39,000 | 39,000 | - | 20,000 | 3,000 | |||||||||||||||
| $ | 15,773,000 | $ | 15,773,000 | $ | - | $ | 16,325,000 | $ | 935,000 | |||||||||||
|
With an Allowance Recorded
|
||||||||||||||||||||
|
Commercial
|
||||||||||||||||||||
|
Real estate
|
$ | 2,415,000 | $ | 2,415,000 | $ | 192,000 | $ | 2,925,000 | $ | 157,000 | ||||||||||
|
Construction
|
680,000 | 680,000 | 152,000 | 305,000 | 22,000 | |||||||||||||||
|
Other
|
497,000 | 497,000 | 291,000 | 912,000 | 60,000 | |||||||||||||||
|
Municipal
|
- | - | - | - | - | |||||||||||||||
|
Residential
|
||||||||||||||||||||
|
Term
|
5,651,000 | 5,651,000 | 432,000 | 4,869,000 | 134,000 | |||||||||||||||
|
Construction
|
- | - | - | 281,000 | 14,000 | |||||||||||||||
|
Home Equity Line of Credit
|
200,000 | 200,000 | 122,000 | 87,000 | 3,000 | |||||||||||||||
|
Consumer
|
67,000 | 67,000 | 67,000 | 132,000 | 9,000 | |||||||||||||||
| $ | 9,510,000 | $ | 9,510,000 | $ | 1,256,000 | $ | 9,511,000 | $ | 399,000 | |||||||||||
|
Total
|
||||||||||||||||||||
|
Commercial
|
||||||||||||||||||||
|
Real estate
|
$ | 5,946,000 | $ | 5,946,000 | $ | 192,000 | $ | 6,892,000 | $ | 389,000 | ||||||||||
|
Construction
|
937,000 | 937,000 | 152,000 | 576,000 | 42,000 | |||||||||||||||
|
Other
|
1,753,000 | 1,753,000 | 291,000 | 2,396,000 | 164,000 | |||||||||||||||
|
Municipal
|
- | - | - | - | - | |||||||||||||||
|
Residential
|
||||||||||||||||||||
|
Term
|
12,455,000 | 12,455,000 | 432,000 | 12,683,000 | 570,000 | |||||||||||||||
|
Construction
|
3,567,000 | 3,567,000 | - | 2,854,000 | 148,000 | |||||||||||||||
|
Home Equity Line of Credit
|
519,000 | 519,000 | 122,000 | 283,000 | 9,000 | |||||||||||||||
|
Consumer
|
106,000 | 106,000 | 67,000 | 152,000 | 12,000 | |||||||||||||||
| $ | 25,283,000 | $ | 25,283,000 | $ | 1,256,000 | $ | 25,836,000 | $ | 1,334,000 | |||||||||||
The First Bancorp 2010 Form 10-K
Page 62
The Company provides for loan losses through the establishment of an allowance for loan losses which represents an
estimated reserve for existing losses in the loan portfolio. A systematic methodology is used for determining the allowance that includes a quarterly review process, risk rating changes, and adjustments to the allowance. The loan portfolio is classified in eight segments and credit risk is evaluated separately in each segment. The adequacy of the allowance is evaluated continually based on a review of significant loans, with a particular emphasis on nonaccruing, past due, and other loans that may require special attention. Other factors evaluated on a continual basis include general conditions in local and national economies; loan portfolio composition and asset quality indicators; and internal factors such as changes in underwriting policies, credit administration practices, experience, ability and depth of lending management, among others. The following table summarizes the composition of the allowance for loan losses, by loan portfolio segment, as of December 31, 2010 and 2009:
|
As of December 31,
|
2010
|
2009
|
||||||
|
Allowance for Loans Evaluated Individually for Impairment
|
||||||||
|
Commercial
|
||||||||
|
Real estate
|
$ | 192,000 | $ | 701,000 | ||||
|
Construction
|
152,000 | 36,000 | ||||||
|
Other
|
291,000 | 987,000 | ||||||
|
Municipal
|
- | - | ||||||
|
Residential
|
||||||||
|
Term
|
432,000 | 271,000 | ||||||
|
Construction
|
- | 125,000 | ||||||
|
Home Equity Line of Credit
|
122,000 | - | ||||||
|
Consumer
|
67,000 | 76,000 | ||||||
|
Total
|
$ | 1,256,000 | $ | 2,196,000 | ||||
|
Allowance for Loans Evaluated Collectively for Impairment
|
||||||||
|
Commercial
|
||||||||
|
Real estate
|
$ | 5,068,000 | $ | 4,285,000 | ||||
|
Construction
|
860,000 | 771,000 | ||||||
|
Other
|
2,086,000 | 2,376,000 | ||||||
|
Municipal
|
19,000 | 23,000 | ||||||
|
Residential
|
||||||||
|
Term
|
976,000 | 927,000 | ||||||
|
Construction
|
44,000 | 49,000 | ||||||
|
Home Equity Line of Credit
|
548,000 | 515,000 | ||||||
|
Consumer
|
579,000 | 641,000 | ||||||
|
Unallocated
|
1,880,000 | 1,854,000 | ||||||
|
Total
|
$ | 12,060,000 | $ | 11,441,000 | ||||
|
Total Allowance for Loan Losses
|
||||||||
|
Commercial
|
||||||||
|
Real estate
|
$ | 5,260,000 | $ | 4,986,000 | ||||
|
Construction
|
1,012,000 | 807,000 | ||||||
|
Other
|
2,377,000 | 3,363,000 | ||||||
|
Municipal
|
19,000 | 23,000 | ||||||
|
Residential
|
||||||||
|
Term
|
1,408,000 | 1,198,000 | ||||||
|
Construction
|
44,000 | 174,000 | ||||||
|
Home Equity Line of Credit
|
670,000 | 515,000 | ||||||
|
Consumer
|
646,000 | 717,000 | ||||||
|
Unallocated
|
1,880,000 | 1,854,000 | ||||||
|
Total
|
$ | 13,316,000 | $ | 13,637,000 | ||||
The First Bancorp 2010 Form 10-K
Page 63
The allowance consists of four elements: (1) specific reserves for loans evaluated individually for impairment; (2) general reserves for types or portfolios of loans based on historical loan loss experience, (3) qualitative reserves judgmentally adjusted for local and national economic conditions, concentrations, portfolio composition, volume and severity of delinquencies and nonaccrual loans, trends of criticized and classified loans, changes in credit policies, and underwriting standards, credit administration practices, and other factors as applicable; and (4) unallocated reserves. All outstanding loans are considered in evaluating the adequacy of the allowance. A breakdown of the allowance for loan losses as of December 31, 2010, by loan segment and allowance element, is presented in the following table:
|
Specific Reserves Evaluated Individually for Impairment
|
General Reserves Based on Historical Loss Experience
|
Reserves for Qualitative Factors
|
Unallocated Reserves
|
Total Reserves
|
||||||||||||||||
|
Commercial
|
||||||||||||||||||||
|
Real estate
|
$ | 192,000 | $ | 2,183,000 | $ | 2,885,000 | $ | - | $ | 5,260,000 | ||||||||||
|
Construction
|
152,000 | 370,000 | 490,000 | - | 1,012,000 | |||||||||||||||
|
Other
|
291,000 | 899,000 | 1,187,000 | - | 2,377,000 | |||||||||||||||
|
Municipal
|
- | - | 19,000 | - | 19,000 | |||||||||||||||
|
Residential
|
||||||||||||||||||||
|
Term
|
432,000 | 401,000 | 575,000 | - | 1,408,000 | |||||||||||||||
|
Construction
|
- | 18,000 | 26,000 | - | 44,000 | |||||||||||||||
|
Home Equity Line of Credit
|
122,000 | 72,000 | 476,000 | - | 670,000 | |||||||||||||||
|
Consumer
|
67,000 | 324,000 | 255,000 | - | 646,000 | |||||||||||||||
|
Unallocated
|
- | - | - | 1,880,000 | 1,880,000 | |||||||||||||||
| $ | 1,256,000 | $ | 4,267,000 | $ | 5,913,000 | $ | 1,880,000 | $ | 13,316,000 | |||||||||||
Commercial loans are comprised of three major categories, commercial real estate loans, commercial construction loans and other commercial loans. Commercial real estate is primarily comprised of loans to small businesses collateralized by owner-occupied real estate, while other commercial is primarily comprised of loans to small businesses collateralized by plant and equipment, commercial fishing vessels and gear, and limited inventory-based lending. Commercial real estate loans typically have a maximum loan-to-value of 75% based upon current appraisal information at the time the loan is made. Construction loans comprise a very small portion of the portfolio, and at 44.6% of capital are well under the regulatory guidance of 100.0% of capital. Construction and non-owner-occupied commercial real estate loans are at 98.5% of total capital, well under regulatory guidance of 300.0% of capital. Municipal loans are comprised of loans to municipalities in Maine for capitalized expenditures, construction projects or tax-anticipation notes. All municipal loans are considered general obligations of the municipality and as such are collateralized by the taxing ability of the municipality for repayment of debt.
The process of establishing the allowance with respect to our commercial loan portfolio begins when a loan officer initially assigns each loan a risk rating, using established credit criteria. Approximately 50% of our outstanding loans and commitments are subject to review and validation annually by an independent consulting firm, as well as periodically by our internal credit review function. The methodology employs Management’s judgment as to the level of losses on existing loans based on our internal review of the loan portfolio, including an analysis of a borrowers’ current financial position, and the consideration of current and anticipated economic conditions and their potential effects on specific borrowers and or lines of business. In determining our ability to collect certain loans, we also consider the fair value of underlying collateral. The risk rating system has nine levels, defined as follows:
1 Strong
Credits rated "1" are characterized by borrowers fully responsible for the credit with excellent capacity to pay principal and interest. Loans rated “1” may be secured with acceptable forms of liquid collateral.
2 Above Average
Credits rated “2” are characterized by borrowers that have better than average liquidity, capitalization, earnings and/or cash flow with a consistent record of solid financial performance.
3 Satisfactory
Credits rated “3” are characterized by borrowers with favorable liquidity, profitability and financial condition with adequate cash flow to pay debt service.
The First Bancorp 2010 Form 10-K
Page 64
4 Average
Credits rated “4” are characterized by borrowers that present risk more than 1, 2 and 3 rated loans and merit an ordinary level of ongoing monitoring. Financial condition is on par or somewhat below industry averages while cash flow is generally adequate to meet debt service requirements.
5 Watch
Credits rated “5” are characterized by borrowers that warrant greater monitoring due to financial condition or unresolved and identified risk factors.
6 Other Assets Especially Mentioned (OAEM)
Loans in this category are currently protected but are potentially weak and constitute an undue and unwarranted credit risk, but not to the point of justifying a classification of substandard. OAEM have potential weaknesses which may, if not checked or corrected, weaken the asset or inadequately protect the Bank's credit position at some future date.
7 Substandard
Loans in this category are inadequately protected by the current sound worth and paying capacity of the borrower or of the collateral pledged, if any. Loans so classified have a well-defined weakness or weaknesses that jeopardize the liquidation of the debt. Substandard loans are characterized by the distinct possibility that the Bank may sustain some loss if the deficiencies are not corrected.
8 Doubtful
Loans classified "Doubtful" have the same weaknesses as those classified substandard with the added characteristic that the weaknesses make collection or liquidation in full, based on currently existing facts, conditions, and values, highly questionable and improbable. The possibility of loss is high, but because of certain important and reasonably specific pending factors which may work to the advantage and strengthening of the asset, its classification as an estimated loss is deferred until its more exact status may be determined.
9 Loss
Loans classified "Loss" are considered uncollectable and of such little value that their continuance as bankable assets is not warranted.
The following table summarizes the risk ratings for the Company’s commercial construction, commercial real estate, commercial other, and municipal loans as of December 31, 2010:
|
Commercial
Real Estate
|
Commercial
Construction
|
Commercial
Other
|
Municipal
Loans
|
All Risk-
Rated Loans
|
||||||||||||||||
|
1 Strong
|
$ | 48,000 | $ | - | $ | 395,000 | $ | 2,481,000 | $ | 2,924,000 | ||||||||||
|
2 Above Average
|
20,365,000 | 10,000 | 4,483,000 | 11,453,000 | 36,311,000 | |||||||||||||||
|
3 Satisfactory
|
42,600,000 | 4,694,000 | 16,052,000 | 4,900,000 | 68,246,000 | |||||||||||||||
|
4 Average
|
107,167,000 | 22,177,000 | 41,972,000 | 2,999,000 | 174,315,000 | |||||||||||||||
|
5 Watch
|
27,898,000 | 6,347,000 | 12,203,000 | - | 46,448,000 | |||||||||||||||
|
6 OAEM
|
19,496,000 | 3,715,000 | 6,463,000 | - | 29,674,000 | |||||||||||||||
|
7 Substandard
|
27,966,000 | 4,926,000 | 19,894,000 | - | 52,786,000 | |||||||||||||||
|
8 Doubtful
|
- | - | - | - | - | |||||||||||||||
|
9 Loss
|
- | - | - | - | - | |||||||||||||||
|
Total
|
$ | 245,540,000 | $ | 41,869,000 | $ | 101,462,000 | $ | 21,833,000 | $ | 410,704,000 | ||||||||||
Residential loans are comprised of two categories: term loans, which include traditional amortizing home mortgages, and construction loans, which include loans for owner-occupied residential construction. Residential loans typically have a 75% to 80% loan to value based upon current appraisal information at the time the loan is made. Home equity loans and lines of credit, are typically written to the same underwriting standards. Consumer loans are primarily amortizing loans to individuals collateralized by automobiles, pleasure craft and recreation vehicles, with a maximum loan to value of 80%-90% of the purchase price of the collateral. Consumer loans also include a small amount of unsecured short-term time notes to individuals.
Residential loans, consumer loans and home equity lines of credit are segregated into homogeneous pools with similar risk characteristics. Trends and current conditions are analyzed and historical loss experience is adjusted accordingly. Quantitative and qualitative adjustment factors for these segments are consistent with those for the commercial and municipal segments. Certain loans in the residential, home equity lines of credit and consumer segments identified as having the potential for further deterioration are analyzed individually to confirm impairment status, and to determine the need for a specific reserve, however there is no formal rating system used for these segments. Consumer loans greater than 120 days past due are generally charged off. Residential loans 90 days or more past due are placed on non-accrual status unless the loans are both well secured and in the process of collection.
Allowance for loan losses transactions for the years ended December 31, 2010, 2009 and 2008 were as follows:
The First Bancorp 2010 Form 10-K
Page 65
|
For the year ended
|
Commercial
|
Municipal
|
Residential
|
Home Equity
|
Consumer
|
Unallocated
|
Total
|
|||||||||||||||||||||||||||||||||
|
December 31, 2010
|
Real Estate
|
Construction
|
Other
|
Term
|
Construction
|
Line of Credit
|
||||||||||||||||||||||||||||||||||
|
Allowance for loan losses:
|
||||||||||||||||||||||||||||||||||||||||
|
Beginning balance
|
$ | 4,986,000 | $ | 807,000 | $ | 3,363,000 | $ | 23,000 | $ | 1,198,000 | $ | 174,000 | $ | 515,000 | $ | 717,000 | $ | 1,854,000 | $ | 13,637,000 | ||||||||||||||||||||
|
Charge offs
|
4,005,000 | 175,000 | 1,125,000 | - | 392,000 | 2,361,000 | 8,000 | 951,000 | - | 9,017,000 | ||||||||||||||||||||||||||||||
|
Recoveries
|
4,000 | - | 69,000 | - | 4,000 | - | - | 219,000 | - | 296,000 | ||||||||||||||||||||||||||||||
|
Provision
|
4,275,000 | 380,000 | 70,000 | (4,000 | ) | 598,000 | 2,231,000 | 163,000 | 661,000 | 26,000 | 8,400,000 | |||||||||||||||||||||||||||||
|
Ending balance
|
$ | 5,260,000 | $ | 1,012,000 | $ | 2,377,000 | $ | 19,000 | $ | 1,408,000 | $ | 44,000 | $ | 670,000 | $ | 646,000 | $ | 1,880,000 | $ | 13,316,000 | ||||||||||||||||||||
|
Ending balance specifically evaluated for impairment
|
$ | 192,000 | $ | 152,000 | $ | 291,000 | $ | - | $ | 432,000 | $ | - | $ | 122,000 | $ | 67,000 | $ | - | $ | 1,256,000 | ||||||||||||||||||||
|
Ending balance collectively evaluated for impairment
|
$ | 5,068,000 | $ | 860,000 | $ | 2,086,000 | $ | 19,000 | $ | 976,000 | $ | 44,000 | $ | 548,000 | $ | 579,000 | $ | 1,880,000 | $ | 12,060,000 | ||||||||||||||||||||
|
Related loan balances:
|
||||||||||||||||||||||||||||||||||||||||
|
Ending balance
|
$ | 245,540,000 | $ | 41,869,000 | $ | 101,462,000 | $ | 21,833,000 | $ | 337,927,000 | $ | 15,512,000 | $ | 105,297,000 | $ | 18,156,000 | $ | - | $ | 887,596,000 | ||||||||||||||||||||
|
Ending balance specifically evaluated for impairment
|
$ | 5,946,000 | $ | 937,000 | $ | 1,753,000 | $ | - | $ | 12,456,000 | $ | 3,567,000 | $ | 519,000 | $ | 106,000 | $ | - | $ | 25,284,000 | ||||||||||||||||||||
|
Ending balance collectively evaluated for impairment
|
$ | 239,594,000 | $ | 40,932,000 | $ | 99,709,000 | $ | 21,833,000 | $ | 325,471,000 | $ | 11,945,000 | $ | 104,778,000 | $ | 18,050,000 | $ | - | $ | 862,312,000 | ||||||||||||||||||||
|
For the year ended
|
Commercial
|
Municipal
|
Residential
|
Home Equity
|
Consumer
|
Unallocated
|
Total
|
|||||||||||||||||||||||||||||||||
|
December 31, 2009
|
Real Estate
|
Construction
|
Other
|
Term
|
Construction
|
Line of Credit
|
||||||||||||||||||||||||||||||||||
|
Allowance for loan losses:
|
||||||||||||||||||||||||||||||||||||||||
|
Beginning balance
|
$ | 3,471,000 | $ | 551,000 | $ | 2,181,000 | $ | 20,000 | $ | 716,000 | $ | 41,000 | $ | 482,000 | $ | 662,000 | $ | 676,000 | $ | 8,800,000 | ||||||||||||||||||||
|
Charge offs
|
2,430,000 | - | 2,329,000 | - | 1,767,000 | 47,000 | 177,000 | 826,000 | - | 7,576,000 | ||||||||||||||||||||||||||||||
|
Recoveries
|
- | - | 79,000 | - | 59,000 | - | 1,000 | 114,000 | - | 253,000 | ||||||||||||||||||||||||||||||
|
Provision
|
3,945,000 | 256,000 | 3,432,000 | 3,000 | 2,190,000 | 180,000 | 209,000 | 767,000 | 1,178,000 | 12,160,000 | ||||||||||||||||||||||||||||||
|
Ending balance
|
$ | 4,986,000 | $ | 807,000 | $ | 3,363,000 | $ | 23,000 | $ | 1,198,000 | $ | 174,000 | $ | 515,000 | $ | 717,000 | $ | 1,854,000 | $ | 13,637,000 | ||||||||||||||||||||
|
Ending balance specifically evaluated for impairment
|
$ | 701,000 | $ | 36,000 | $ | 987,000 | $ | - | $ | 271,000 | $ | 125,000 | $ | - | $ | 76,000 | $ | - | $ | 2,196,000 | ||||||||||||||||||||
|
Ending balance collectively evaluated for impairment
|
$ | 4,285,000 | $ | 771,000 | $ | 2,376,000 | $ | 23,000 | $ | 927,000 | $ | 49,000 | $ | 515,000 | $ | 641,000 | $ | 1,854,000 | $ | 11,441,000 | ||||||||||||||||||||
|
Related loan balances:
|
||||||||||||||||||||||||||||||||||||||||
|
Ending balance
|
$ | 240,178,000 | $ | 48,714,000 | $ | 114,486,000 | $ | 45,952,000 | $ | 367,267,000 | $ | 17,361,000 | $ | 94,324,000 | $ | 24,210,000 | $ | - | $ | 952,492,000 | ||||||||||||||||||||
|
Ending balance specifically evaluated for impairment
|
$ | 6,198,000 | $ | 458,000 | $ | 2,638,000 | $ | - | $ | 13,149,000 | $ | 3,182,000 | $ | 143,000 | $ | 75,000 | $ | - | $ | 25,843,000 | ||||||||||||||||||||
|
Ending balance collectively evaluated for impairment
|
$ | 233,980,000 | $ | 48,256,000 | $ | 111,848,000 | $ | 45,952,000 | $ | 354,118,000 | $ | 14,179,000 | $ | 94,181,000 | $ | 24,135,000 | $ | - | $ | 926,649,000 | ||||||||||||||||||||
Page 66
|
For the year ended
|
Commercial
|
Municipal
|
Residential
|
Home Equity
|
Consumer
|
Unallocated
|
Total
|
|||||||||||||||||||||||||||||||||
|
December 31, 2008
|
Real Estate
|
Construction
|
Other
|
Term
|
Construction
|
Line of Credit
|
||||||||||||||||||||||||||||||||||
|
Allowance for loan losses:
|
||||||||||||||||||||||||||||||||||||||||
|
Beginning balance
|
$ | 3,020,000 | $ | - | $ | 1,633,000 | $ | 25,000 | $ | 706,000 | $ | 75,000 | $ | 491,000 | $ | 606,000 | $ | 244,000 | $ | 6,800,000 | ||||||||||||||||||||
|
Charge offs
|
3,000 | - | 1,997,000 | - | 113,000 | - | 83,000 | 745,000 | - | 2,941,000 | ||||||||||||||||||||||||||||||
|
Recoveries
|
- | - | 32,000 | - | 5,000 | - | - | 204,000 | - | 241,000 | ||||||||||||||||||||||||||||||
|
Provision
|
454,000 | 551,000 | 2,513,000 | (5,000 | ) | 118,000 | (34,000 | ) | 74,000 | 597,000 | 432,000 | 4,700,000 | ||||||||||||||||||||||||||||
|
Ending balance
|
$ | 3,471,000 | $ | 551,000 | $ | 2,181,000 | $ | 20,000 | $ | 716,000 | $ | 41,000 | $ | 482,000 | $ | 662,000 | $ | 676,000 | $ | 8,800,000 | ||||||||||||||||||||
|
Ending balance specifically evaluated for impairment
|
$ | 947,000 | $ | - | $ | 821,000 | $ | - | $ | 142,000 | $ | - | $ | 47,000 | $ | - | $ | - | $ | 1,957,000 | ||||||||||||||||||||
|
Ending balance collectively evaluated for impairment
|
$ | 2,524,000 | $ | 551,000 | $ | 1,360,000 | $ | 20,000 | $ | 574,000 | $ | 41,000 | $ | 435,000 | $ | 662,000 | $ | 676,000 | $ | 6,843,000 | ||||||||||||||||||||
|
Related loan balances:
|
||||||||||||||||||||||||||||||||||||||||
|
Ending balance
|
$ | 219,057,000 | $ | 48,182,000 | $ | 118,109,000 | $ | 34,832,000 | $ | 431,520,000 | $ | 26,235,000 | $ | 77,206,000 | $ | 24,132,000 | $ | - | $ | 979,273,000 | ||||||||||||||||||||
|
Ending balance specifically evaluated for impairment
|
$ | 7,477,000 | $ | - | $ | 2,742,000 | $ | - | $ | 2,163,000 | $ | - | $ | 67,000 | $ | - | $ | - | $ | 12,449,000 | ||||||||||||||||||||
|
Ending balance collectively evaluated for impairment
|
$ | 211,580,000 | $ | 48,182,000 | $ | 115,367,000 | $ | 34,832,000 | $ | 429,357,000 | $ | 26,235,000 | $ | 77,139,000 | $ | 24,132,000 | $ | - | $ | 966,824,000 | ||||||||||||||||||||
The First Bancorp 2010 Form 10-K
Page 67
A troubled debt restructured (“TDR”) constitutes a restructuring of debt if the Bank, for economic or legal reasons related to the borrower’s financial difficulties, grants a concession to the borrower that it would not otherwise consider. To determine whether or not a loan should be classified as a TDR, Management evaluates a loan based upon the following criteria:
|
·
|
The borrower demonstrates financial difficulty; common indicators include past due status with bank obligations, substandard credit bureau reports, or an inability to refinance with another lender, and
|
|
·
|
The Bank has granted a concession; common concession types include maturity date extension, interest rate adjustments to below market pricing, and deferment of payments.
|
As of December 31, 2010 we had 32 loans with a value of $5.5 million that have been restructured. This compares to 52 loans with a value of $8.4 million classified as TDRs as of December 31, 2009. As of both dates, all TDRs were for residential term loans.
Premises and equipment are carried at cost and consist of the following:
|
As of December 31,
|
2010
|
2009
|
||||||
|
Land
|
$ | 4,028,000 | $ | 3,556,000 | ||||
|
Land improvements
|
686,000 | 648,000 | ||||||
|
Buildings
|
14,764,000 | 13,821,000 | ||||||
|
Equipment
|
9,961,000 | 9,532,000 | ||||||
| 29,439,000 | 27,557,000 | |||||||
|
Less accumulated depreciation
|
10,459,000 | 9,226,000 | ||||||
| $ | 18,980,000 | $ | 18,331,000 | |||||
The following summarizes other real estate owned:
|
As of December 31,
|
2010
|
2009
|
||||||
|
Real estate acquired in settlement of loans
|
$ | 4,929,000 | $ | 5,345,000 | ||||
Changes in the allowance for losses from other real estate owned were as follows:
|
For the years ended December 31,
|
2010
|
2009
|
2008
|
|||||||||
|
Balance at beginning of year
|
$ | 583,000 | $ | 325,000 | $ | 325,000 | ||||||
|
Losses charged to allowance
|
(803,000 | ) | (223,000 | ) | - | |||||||
|
Provision charged to operating expenses
|
352,000 | 481,000 | - | |||||||||
|
Balance at end of year
|
$ | 132,000 | $ | 583,000 | $ | 325,000 | ||||||
On January 14, 2005, the Company acquired FNB Bankshares (“FNB”) of Bar Harbor, Maine, and its subsidiary, The First National Bank of Bar Harbor. The total value of the transaction was $47,955,000, and all of the voting equity interest of FNB was acquired in the transaction. The transaction was accounted for as a purchase and the excess of purchase price over the fair value of net tangible assets acquired equaled $27,559,000 and was recorded as goodwill, none of which was deductible for tax purposes. The portion of the purchase price related to the core deposit intangible is being amortized over its expected economic life, and goodwill is evaluated annually for possible impairment under the provisions of FASB ASC Topic 350, “Intangibles – Goodwill and Other”. As of December 31, 2010, in accordance with Topic 350, the Company completed its annual review of goodwill and determined there has been no impairment. The Company also carries $125,000 in goodwill for a de minimus transaction in 2001.
The First Bancorp 2010 Form 10-K
Page 68
The current and deferred components of income tax expense (benefit) were as follows:
|
For the years ended December 31,
|
2010
|
2009
|
2008
|
|||||||||
|
Federal income tax
|
||||||||||||
|
Current
|
$ | 3,450,000 | $ | 5,520,000 | $ | 6,415,000 | ||||||
|
Deferred
|
395,000 | (1,210,000 | ) | (1,039,000 | ) | |||||||
| 3,845,000 | 4,310,000 | 5,376,000 | ||||||||||
|
State franchise tax
|
233,000 | 237,000 | 245,000 | |||||||||
| $ | 4,078,000 | $ | 4,547,000 | $ | 5,621,000 | |||||||
The actual tax expense differs from the expected tax expense (computed by applying the applicable U.S. Federal corporate income tax rate to income before income taxes) as follows:
|
For the years ended December 31,
|
2010
|
2009
|
2008
|
|||||||||
|
Expected tax expense
|
$ | 5,668,000 | $ | 6,156,000 | $ | 6,879,000 | ||||||
|
Non-taxable income
|
(1,527,000 | ) | (1,555,000 | ) | (1,364,000 | ) | ||||||
|
State franchise tax, net of federal tax benefit
|
151,000 | 154,000 | 159,000 | |||||||||
|
Tax credits, net of amortization
|
(345,000 | ) | (345,000 | ) | (100,000 | ) | ||||||
|
Other
|
131,000 | 137,000 | 47,000 | |||||||||
| $ | 4,078,000 | $ | 4,547,000 | $ | 5,621,000 | |||||||
Deferred tax assets and liabilities are classified as other assets and other liabilities in the consolidated balance sheets. No valuation allowance is deemed necessary for the deferred tax asset. Items that give rise to the deferred income tax assets and liabilities and the tax effect of each at December 31, 2010 and 2009 are as follows:
|
2010
|
2009
|
|||||||
|
Allowance for loan losses
|
$ | 4,662,000 | $ | 4,773,000 | ||||
|
Other real estate owned
|
46,000 | 204,000 | ||||||
|
Assets related to FNB acquisition
|
- | 1,000 | ||||||
|
Accrued pension and post-retirement
|
1,187,000 | 1,183,000 | ||||||
|
Unrealized loss on securities available for sale
|
1,108,000 | 67,000 | ||||||
|
Other than temporary impairment of securities available for sale
|
321,000 | 321,000 | ||||||
|
Other assets
|
56,000 | 169,000 | ||||||
|
Total deferred tax asset
|
7,380,000 | 6,718,000 | ||||||
|
Net deferred loan costs
|
(663,000 | ) | (672,000 | ) | ||||
|
Depreciation
|
(2,138,000 | ) | (2,106,000 | ) | ||||
|
Mortgage servicing rights
|
(506,000 | ) | (420,000 | ) | ||||
|
Core deposit intangible
|
(401,000 | ) | (500,000 | ) | ||||
|
Liabilities related to FNB acquisition
|
(1,000 | ) | (10,000 | ) | ||||
|
Other liabilities
|
(204,000 | ) | (114,000 | ) | ||||
|
Total deferred tax liability
|
(3,913,000 | ) | (3,822,000 | ) | ||||
|
Net deferred tax asset
|
$ | 3,467,000 | $ | 2,896,000 | ||||
At December 31, 2010, the Company held investments in two limited partnerships with related New Market Tax Credits. These investments are carried at cost and amortized on the effective yield method. The tax credits from these investments are estimated at $530,000 for each of the years ended December 31, 2010 and 2009, respectively, and are recorded as a reduction of income tax expense. Amortization of the investments in the limited partnerships totaled $300,000 and $275,000 for the years ended December 31, 2010 and 2009, respectively, and is recognized as a component of income tax expense in the consolidated statements of income. The carrying value of these investments was $2,412,000 and $2,712,000 at December 31, 2010 and 2009, respectively, and is recorded in other assets. The Company's total exposure to these limited partnerships was $5,912,000 and $6,212,000, at December 31, 2010 and
The First Bancorp 2010 Form 10-K
Page 69
2009, respectively, which is comprised of the Company's equity investment in the limited partnerships and the balance of a participated loan receivable.
FASB ASC Topic 740 “Income Taxes” defines the criteria that an individual tax position must satisfy for some or all of the benefits of that position to be recognized in a company’s financial statements. Topic 740 prescribes a recognition threshold of more-likely-than-not, and a measurement attribute for all tax positions taken or expected to be taken on a tax return, in order for those tax positions to be recognized in the financial statements. Effective January 1, 2007, the Company has adopted these provisions and there was no material effect on the financial statements, and no cumulative effect. The Company is currently open to audit under the statute of limitations by the Internal Revenue Service for the years ended December 31, 2007 through 2009.
The following table represents the breakdown of Certificates of Deposit at December 31, 2010 and 2009:
|
December 31, 2010
|
December 31, 2009
|
|||||||
|
Certificates of deposit < $100,000
|
$ | 231,945,000 | $ | 212,893,000 | ||||
|
Certificates $100,000 to $250,000
|
338,452,000 | 287,051,000 | ||||||
|
Certificates $250,000 and over
|
37,792,000 | 56,153,000 | ||||||
| $ | 608,189,000 | $ | 556,097,000 | |||||
At December 31, 2010, the scheduled maturities of certificates of deposit are as follows:
|
Year of
Maturity
|
Less than $100,000
|
Greater than $100,000
|
All Certificates of Deposit
|
|||||||||
|
2011
|
$ | 96,632,000 | $ | 277,499,000 | $ | 374,131,000 | ||||||
|
2012
|
27,244,000 | 15,944,000 | 43,188,000 | |||||||||
|
2013
|
19,413,000 | 22,663,000 | 42,076,000 | |||||||||
|
2014
|
27,933,000 | 19,958,000 | 47,891,000 | |||||||||
|
2015
|
60,723,000 | 40,180,000 | 100,903,000 | |||||||||
| $ | 231,945,000 | $ | 376,244,000 | $ | 608,189,000 | |||||||
Interest on certificates of deposit of $100,000 or more was $3,724,000, $3,901,000, and $6,905,000 in 2010, 2009 and 2008, respectively.
Borrowed funds consist of advances from the Federal Home Loan Bank of Boston (FHLB), Treasury Tax & Loan Notes, and securities sold under agreements to repurchase with municipal and commercial customers. Pursuant to
collateral agreements, FHLB advances are collateralized by all stock in FHLB, qualifying first mortgage loans, U.S. Government and Agency securities not pledged to others, and funds on deposit with FHLB. As of December 31, 2010, the Bank’s total FHLB borrowing capacity, based on its holding of FHLB stock, was $266,889,000 of which $68,288,000 was unused and available for additional borrowings. All FHLB advances as of December 31, 2010, had fixed rates of interest until their respective maturity dates. Under the Treasury Tax & Loan Note program, the Bank accumulates tax deposits made by customers and is eligible to receive Treasury Direct investments up to an established maximum balance. Securities sold under agreements to repurchase include U.S. Treasury and Agency securities and other securities. Repurchase agreements have maturity dates ranging from one to 365 days. The Bank also has in place $10.0 million in credit lines with correspondent banks and a credit facility of $116,130,000 with the Federal Reserve Bank of Boston using commercial and home equity loans as collateral which are currently not in use.
Borrowed funds at December 31, 2010 and 2009 have the following range of interest rates and maturity dates:
The First Bancorp 2010 Form 10-K
Page 70
|
As of December 31, 2010
|
||||||||
|
Federal Home Loan Bank Advances
|
||||||||
|
2011
|
0.23% - 0.52 | % | $ | 68,441,000 | ||||
|
2012
|
4.39 | % | 10,000,000 | |||||
|
2013
|
3.49 | % | 10,000,000 | |||||
|
2014
|
2.73% - 3.89 | % | 20,000,000 | |||||
|
2015
|
2.03% - 2.98 | % | 40,000,000 | |||||
|
2016 and thereafter
|
0.00% - 3.69 | % | 50,170,000 | |||||
| 198,611,000 | ||||||||
|
Treasury Tax & Loan Notes (rate at December 31, 2010 was 0.00%)
|
variable
|
1,427,000 | ||||||
|
Repurchase agreements
|
||||||||
|
Municipal and commercial customers
|
0.65% - 2.34 | % | 57,292,000 | |||||
| $ | 257,330,000 | |||||||
|
As of December 31, 2009
|
||||||||
|
Federal Home Loan Bank Advances
|
||||||||
|
2010
|
0.20% - 5.41 | % | $ | 99,225,000 | ||||
|
2012
|
4.39 | % | 10,000,000 | |||||
|
2013
|
3.49 | % | 10,000,000 | |||||
|
2014
|
2.73% - 3.89 | % | 20,000,000 | |||||
|
2015 and thereafter
|
0.00% - 2.69 | % | 60,177,000 | |||||
| 199,402,000 | ||||||||
|
Treasury Tax & Loan Notes (rate at December 31, 2009 was 0.00%)
|
variable
|
638,000 | ||||||
|
Repurchase agreements
|
||||||||
|
Municipal and commercial customers
|
0.90% - 4.00 | % | 49,738,000 | |||||
| $ | 249,778,000 | |||||||
401(k) Plan
The Bank has a defined contribution plan available to substantially all employees who have completed six months of service. Employees may contribute up to $16,500 of their compensation if under age 50 and $22,000 if over age 50, and the Bank may provide a match to employee contributions not to exceed 3.0% of compensation depending on contribution level. Subject to a vote of the Board of Directors, the Bank may also make a profit-sharing contribution to the Plan. Such contribution equaled 2.0% of each eligible employee’s compensation in 2010, 2009, and 2008. The expense related to the 401(k) plan was $362,000, $365,000, and $356,000 in 2010, 2009, and 2008, respectively.
Supplemental Retirement Plan
The Bank also provides unfunded, non-qualified supplemental retirement benefits for certain officers, payable in installments over 20 years upon retirement or death. The agreements consist of individual contracts with differing characteristics that, when taken together, do not constitute a post-retirement plan. The costs for these benefits are recognized over the service periods of the participating officers in accordance with FASB ASC Topic 712, “Compensation – Nonretirement Postemployment Benefits”. The expense of these supplemental plans was $230,000 in 2010, $214,000 in 2009, and $164,000 in 2008. As of December 31, 2010 and 2009, the accrued liability of these plans was $1,596,000 and $1,418,000, respectively.
Post-Retirement Benefit Plans
The Bank sponsors two post-retirement benefit plans. One plan currently provides a subsidy for health insurance premiums to certain retired employees and a future subsidy for seven active employees who were age 50 and over in 1996. These subsidies are based on years of service and range between $40 and $1,200 per month per person. The other plan provides life insurance coverage to certain retired employees. The Bank also provides health insurance for retired directors. None of these plans are pre-funded.
The Company utilizes FASB ASC Topic 712, “Compensation – Nonretirement Postemployment Benefits”, to recognize the overfunded or underfunded status of a defined benefit post-retirement plan (other than a multiemployer
The First Bancorp 2010 Form 10-K
Page 71
plan) as an asset or liability in its balance sheet and to recognize changes in the funded status in the year in which the changes occur through comprehensive income of a business entity. The Bank sponsors post-retirement benefit plans which provide certain life insurance and health insurance benefits for certain retired employees and health insurance for retired directors. The following tables set forth the accumulated post-retirement benefit obligation, funded status, and net periodic benefit cost:
|
At December 31,
|
2010
|
2009
|
2008
|
|||||||||
|
Change in benefit obligations
|
||||||||||||
|
Benefit obligation at beginning of year:
|
$ | 1,962,000 | $ | 1,990,000 | $ | 1,949,000 | ||||||
|
Service cost
|
15,000 | 21,000 | 19,000 | |||||||||
|
Interest cost
|
117,000 | 134,000 | 134,000 | |||||||||
|
Benefits paid
|
(136,000 | ) | (143,000 | ) | (155,000 | ) | ||||||
|
Actuarial (gain) loss
|
(162,000 | ) | (40,000 | ) | 43,000 | |||||||
|
Benefit obligation at end of year:
|
$ | 1,796,000 | $ | 1,962,000 | $ | 1,990,000 | ||||||
|
Funded status
|
||||||||||||
|
Benefit obligation at end of year
|
$ | (1,796,000 | ) | $ | (1,962,000 | ) | $ | (1,990,000 | ) | |||
|
Accrued benefit cost
|
$ | (1,796,000 | ) | $ | (1,962,000 | ) | $ | (1,990,000 | ) | |||
|
For the years ended December 31,
|
2010
|
2009
|
2008
|
|||||||||
|
Components of net periodic benefit cost
|
||||||||||||
|
Service cost
|
$ | 15,000 | $ | 21,000 | $ | 19,000 | ||||||
|
Interest cost
|
117,000 | 134,000 | 134,000 | |||||||||
|
Amortization of unrecognized transition obligation
|
29,000 | 29,000 | 29,000 | |||||||||
|
Amortization of prior service credit
|
- | (1,000 | ) | (3,000 | ) | |||||||
|
Amortization of accumulated losses
|
22,000 | 24,000 | 21,000 | |||||||||
|
Net periodic benefit cost
|
$ | 183,000 | $ | 207,000 | $ | 200,000 | ||||||
|
Weighted average assumptions as of December 31
|
||||||||||||
|
Discount rate
|
6.5 | % | 7.0 | % | 7.0 | % | ||||||
The above discount rate assumption was used in determining both the accumulated benefit obligation as well as the net benefit cost. The measurement date for benefit obligations was as of year-end for all years presented. The estimated amount of benefits to be paid in 2011 is $147,000. For years ending 2012 through 2015 the estimated amount of benefits to be paid is $149,000, $150,000, $158,000 and $166,000 respectively, and the total estimated amount of benefits to be paid for years ended 2016 through 2020 is $810,000. Plan expense for 2011 is estimated to be $165,000.
In accordance with FASB ASC Topic 715, “Compensation – Retirement Benefits”, amounts not yet reflected in net periodic benefit cost and included in accumulated other comprehensive income (loss) are as follows:
|
At December 31,
|
2010
|
2009
|
Portion to Be Recognized in
Income in 2011
|
|||||||||
|
Unamortized net actuarial loss
|
$ | (49,000 | ) | $ | (233,000 | ) | $ | - | ||||
|
Unrecognized transition obligation
|
(63,000 | ) | (92,000 | ) | 29,000 | |||||||
| (112,000 | ) | (325,000 | ) | 29,000 | ||||||||
|
Deferred tax benefit at 35%
|
39,000 | 114,000 | (10,000 | ) | ||||||||
|
Net unrecognized post-retirement benefits included in accumulated other comprehensive income (loss)
|
$ | (73,000 | ) | $ | (211,000 | ) | $ | 19,000 | ||||
The First Bancorp 2010 Form 10-K
Page 72
Preferred Stock
On January 9, 2009, the Company received $25 million from preferred stock issuance under the U.S. Treasury Capital Purchase Program (the “CPP Shares”) at a purchase price of $1,000 per share. The CPP Shares call for cumulative
dividends at a rate of 5.0% per year for the first five years, and at a rate of 9.0% per year in following years, payable quarterly in arrears on February 15, May 15, August 15 and November 15 of each year. Incident to such issuance, the Company issued to the U.S. Treasury warrants (the “Warrants”) to purchase up to 225,904 shares of the Company’s common stock at a price per share of $16.60 (subject to adjustment). The CPP Shares and the related Warrants (and any shares of common stock issuable pursuant to the Warrants) are freely transferable by the U.S. Treasury to third parties and the Company has filed a registration statement with the Securities and Exchange Commission to allow for possible resale of such securities. The CPP Shares qualify as Tier 1 capital on the Company’s books for regulatory purposes and rank senior to the Company’s common stock and senior or at an equal level in the Company’s capital structure to any other shares of preferred stock the Company may issue in the future.
The Company may redeem the CPP Shares at any time using any funds available to the Company, and any redemption would be subject to the prior approval of the Federal Reserve Bank of Boston. The minimum amount that may be redeemed is 25% of the original CPP investment. The CPP Shares are “perpetual” preferred stock, which means that neither Treasury nor any subsequent holder would have a right to require that the Company redeem any of the shares.
During the first three years following the Company’s sale of the CPP Shares, the Company is required to obtain Treasury’s consent to increase the dividend per share paid on the Company’s common stock unless the Company had redeemed the CPP Shares in full or Treasury had transferred all of the CPP Shares to other parties. Also during the first three years following the Company’s sale of the CPP Shares, the Company is required to obtain Treasury’s consent in order to repurchase any shares of its outstanding stock of any type (other than purchases of common stock or preferred stock ranking junior to the CPP Shares in the ordinary course of the Company’s business and consistent with the Company’s past practices in connection with a benefit plan) unless the Company had redeemed the CPP Shares in full or Treasury had transferred all of the CPP Shares to other parties.
As a condition to Treasury’s purchase of the CPP Shares, during the time that Treasury holds any equity or debt instrument the Company issued, the Company is required to comply with certain restrictions and other requirements relating to the compensation of the Company’s chief executive officer, chief financial officer and three other most highly compensated executive officers. These restrictions include a prohibition on severance payments to those executive officers upon termination of their employment and a $500,000 limit on the tax deductions the Company can take for compensation expense for each of those executive officers in a single year as well as a prohibition on bonus compensation to such officers other than limited amounts of long-term restricted stock.
In conjunction with the sale of the CPP Shares, the Company also issued the Warrants which have a term of ten years and could be exercised by Treasury or a subsequent holder at any time or from time to time during their term. Treasury will not vote any shares of common stock it receives upon exercise of the Warrants, but that restriction would not apply to third parties to whom Treasury transferred the Warrants. The Warrants (and any common stock issued upon exercise of the Warrants) could be transferred to third parties separately from the CPP Shares. The proceeds from the sale of the CPP Shares were allocated between the CPP Shares and Warrants based on their relative fair values on the issue date. The fair value of the Warrants was determined using the Black-Scholes model which includes the following assumptions: common stock price of $16.60 per share, dividend yield of 4.70%, stock price volatility of 24.43%, and a risk-free interest rate of 2.01%. The discount on the CPP Shares was based on the value that was allocated to the Warrants upon issuance, and is being accreted back to the value of the CPP Shares over a five-year period (the expected life of the shares upon issuance) on a straight-line basis.
Common Stock
On August 16, 2007, the Company announced that its Board of Directors had authorized a program for the repurchase of up to 300,000 shares of the Company’s common stock or approximately 3.1% of the outstanding shares. This program ended on August 16, 2009 and under the program the Company repurchased 182,869 shares at an average price of $15.63 and at a total cost of $2.9 million. As a consequence of the Company’s issuance of securities under the U.S. Treasury’s CPP program, its ability to repurchase stock while such securities remain outstanding is restricted to purchases from employee benefit plans. In 2009, the Company repurchased 11,412 shares from employee benefit plans at an average price of $14.73 per share and for total proceeds of $168,000. Fractional shares totaling five shares were repurchased from employee benefit plans in 2010.
The Company has reserved 700,000 shares of its common stock to be made available to directors and employees
The First Bancorp 2010 Form 10-K
Page 73
who elect to participate in the stock purchase or savings and investment plans. During 2006, the number of shares set aside for these plans was increased by the Board of Directors from 480,000 to 700,000. As of December 31, 2010, 497,185 shares had been issued pursuant to these plans, leaving 202,815 shares available for future use. The issuance price is based on the market price of the stock at issuance date. Sales of stock to directors and employees amounted to 12,334 in 2010, 21,469 shares in 2009, and 17,425 shares in 2008.
In 2001, the Company established a dividend reinvestment plan to allow Shareholders to use their cash dividends
for the automatic purchase of shares in the Company. When the plan was established, 600,000 shares were registered with the Securities and Exchange Commission, and as of December 31, 2010, 172,137 shares have been issued, leaving 427,863 shares for future use. Participation in this plan is optional and at the individual discretion of each Shareholder. Shares are purchased for the plan from the Company at a price per share equal to the average of the daily bid and asked prices reported on the NASDAQ System for the five trading days immediately preceding, but not including, the dividend payment date. Sales of stock under the Dividend Reinvestment Plan amounted to 16,520 shares in 2010, 21,229 shares in 2009, and 22,243 shares in 2008.
At the 2010 Annual Meeting, shareholders approved the 2010 Equity Incentive Plan (the “2010 Plan”). This reserves 400,000 shares of Common Stock for issuance in connection with stock options, restricted stock awards and other equity based awards to attract and retain the best available personnel, provide additional incentive to officers, employees and non-employee Directors and promote the success of our business. Such grants and awards will be structured in a manner that does not encourage the recipients to expose the Company to undue or inappropriate risk. Options issued under the 2010 Plan will qualify for treatment as incentive stock options for purposes of Section 422 of the Internal Revenue Code. Other compensation under the 2010 Plan will qualify as performance-based for purposes of Section 162(m) of the Internal Revenue Code, and will satisfy NASDAQ guidelines relating to equity compensation. As of December 31, 2010, no awards had been granted under the 2010 Plan.
The Company established a shareholder-approved stock option plan in 1995 (the “1995 Plan”), under which the Company granted options to employees for 600,000 shares of common stock. Only incentive stock options were granted under the 1995 Plan. The option price of each option grant was determined by the Options Committee of the Board of Directors, and in no instance was less than the fair market value on the date of the grant. An option’s maximum term was ten years from the date of grant, with 50% of the options granted vesting two years from the date of grant and the remaining 50% vesting five years from date of grant. As of January 16, 2005, all options under the 1995 Plan had been granted.
The Company applies the fair value recognition provisions of the Financial Accounting Standards Board (“FASB”) Accounting Standards Codification (“ASC”) Topic 718 “Compensation – Stock Compensation”, to stock-based employee compensation. For the year ended December 31, 2010, $37,000 in compensation cost was recognized for options granted under the 1995 Plan, which is for 42,000 options granted in 2005. The weighted average fair value per option was $4.41 at the time of grant. The fair market value was estimated using the Black-Scholes option pricing model and the following assumptions: quarterly dividends of $0.12, risk-free interest rate of 4.20%, volatility of 25.81%, and an expected life of ten years, the options’ maximum term. Volatility is based on the actual volatility of the Company’s stock during the quarter in which the options were granted. The risk-free rate for periods within the contractual life of the option is based on the U.S. Treasury yield curve at the time of the option grant.
The following table summarizes the non-vested options as of December 31, 2010:
|
Number of Shares
|
Weighted Average
Grant Date Fair Value
|
|||||||
|
Non-vested at December 31, 2009
|
21,000 | $ | 4.41 | |||||
|
Granted in 2010
|
- | - | ||||||
|
Vested in 2010
|
(21,000 | ) | 4.41 | |||||
|
Forfeited in 2010
|
- | - | ||||||
|
Non-vested at December 31, 2010
|
- | $ | - | |||||
During 2010, no options have been exercised. A summary of the status of the Stock Option Plan as of December 31, 2010 and changes during the year then ended, is presented below.
The First Bancorp 2010 Form 10-K
Page 74
|
Number of Shares
|
Weighted Average Exercise Price
|
Weighted Average Remaining Contractual Term (In years)
|
Aggregate Intrinsic Value
(In thousands)
|
|||||||||||||
|
Outstanding at December 31, 2009
|
55,500 | $ | 15.89 | |||||||||||||
|
Granted in 2010
|
- | - | ||||||||||||||
|
Exercised in 2010
|
- | - | ||||||||||||||
|
Forfeited in 2010
|
- | - | ||||||||||||||
|
Outstanding at December 31, 2010
|
55,500 | $ | 15.89 | 3.8 | $ | 51 | ||||||||||
|
Exercisable at December 31, 2010
|
55,500 | $ | 15.89 | 3.8 | $ | 51 | ||||||||||
The following table provides detail for basic earnings per share (EPS) and diluted earnings per share for the years ended December 31, 2010, 2009 and 2008:
|
Income
|
Shares
|
Per-Share
|
||||||||||
|
(Numerator)
|
(Denominator)
|
Amount
|
||||||||||
|
For the year ended December 31, 2010
|
||||||||||||
|
Net income as reported
|
$ | 12,116,000 | ||||||||||
|
Less dividends and amortization of premium on preferred stock
|
1,348,000 | |||||||||||
|
Basic EPS: Income available to common shareholders
|
10,768,000 | 9,760,760 | $ | 1.10 | ||||||||
|
Effect of dilutive securities: incentive stock options
|
4,726 | |||||||||||
|
Diluted EPS: Income available to common shareholders plus assumed conversions
|
$ | 10,768,000 | 9,765,486 | $ | 1.10 | |||||||
|
For the year ended December 31, 2009
|
||||||||||||
|
Net income as reported
|
$ | 13,042,000 | ||||||||||
|
Less dividends and amortization of premium on preferred stock
|
1,161,000 | |||||||||||
|
Basic EPS: Income available to common shareholders
|
11,881,000 | 9,721,172 | $ | 1.22 | ||||||||
|
Effect of dilutive securities: incentive stock options
|
12,072 | |||||||||||
|
Diluted EPS: Income available to common shareholders plus assumed conversions
|
$ | 11,881,000 | 9,733,244 | $ | 1.22 | |||||||
|
For the year ended December 31, 2008
|
||||||||||||
|
Net income as reported
|
$ | 14,034,000 | ||||||||||
|
Basic EPS: Income available to common shareholders
|
14,034,000 | 9,701,379 | $ | 1.45 | ||||||||
|
Effect of dilutive securities: incentive stock options
|
18,952 | |||||||||||
|
Diluted EPS: Income available to common shareholders plus assumed conversions
|
$ | 14,034,000 | 9,720,331 | $ | 1.44 | |||||||
All earnings per share calculations have been made using the weighted average number of shares outstanding during the period. The dilutive securities are incentive stock options granted to certain key members of Management and warrants granted to the U.S. Treasury under the Capital Purchase program. The dilutive number of shares has been calculated using the treasury method, assuming that all granted options and warrants were exercisable at the end of each period. The following table presents the number of options and warrants outstanding as of December 31, 2010, 2009 and 2008 and the amount which are above or below the strike price:
The First Bancorp 2010 Form 10-K
Page 75
|
Outstanding
|
In-the-Money
|
Out-of-the-Money
|
|
|
As of December 31, 2010
|
|||
|
Incentive stock options
|
55,500
|
13,500
|
42,000
|
|
Warrants issued to U.S. Treasury
|
225,904
|
-
|
225,904
|
|
Total dilutive securities
|
281,404
|
13,500
|
267,904
|
|
As of December 31, 2009
|
|||
|
Incentive stock options
|
55,500
|
13,500
|
42,000
|
|
Warrants issued to U.S. Treasury
|
225,904
|
-
|
225,904
|
|
Total dilutive securities
|
281,404
|
13,500
|
267,904
|
|
As of December 31, 2008
|
|||
|
Incentive stock options
|
76,500
|
76,500
|
-
|
|
Total dilutive securities
|
76,500
|
76,500
|
-
|
The ability of the Company to pay cash dividends to its Shareholders depends primarily on receipt of dividends from its subsidiary, the Bank. The subsidiary may pay dividends to its parent out of so much of its net income as the Bank’s directors deem appropriate, subject to the limitation that the total of all dividends declared by the Bank in any calendar year may not exceed the total of its net income of that year combined with its retained net income of the preceding two years and subject to minimum regulatory capital requirements. The amount available for dividends in 2011 will be 2011 earnings plus retained earnings of $8,074,000 from 2010 and 2009.
The payment of dividends by the Company is also affected by various regulatory requirements and policies, such as the requirements to maintain adequate capital. In addition, if, in the opinion of the applicable regulatory authority, a bank under its jurisdiction is engaged in or is about to engage in an unsafe or unsound practice (which, depending on the financial condition of the bank, could include the payment of dividends), that authority may require, after notice and hearing, that such bank cease and desist from that practice. The Federal Reserve Bank and the Comptroller of the Currency have each indicated that paying dividends that deplete a bank’s capital base to an inadequate level would be an unsafe and unsound banking practice. The Federal Reserve Bank, the Comptroller and the Federal Deposit Insurance Corporation have issued policy statements which provide that bank holding companies and insured banks should generally only pay dividends out of current operating earnings.
In addition to the effect on the payment of dividends, failure to meet minimum capital requirements can also result in mandatory and discretionary actions by regulators that, if undertaken, could have an impact on the Company’s operations. Under capital adequacy guidelines and the regulatory framework for prompt corrective action, the Bank must meet specific capital guidelines that involve quantitative measurements of the Bank’s assets, liabilities, and certain off-balance-sheet items as calculated under regulatory accounting practices. The Bank’s capital amounts and classifications are also subject to qualitative judgments by the regulators about components, risk weightings, and other factors.
Quantitative measures established by regulation to ensure capital adequacy require the Bank to maintain minimum amounts and ratios set forth in the table below of Tier 1 capital and Tier 2 or total capital to risk-weighted assets and of Tier 1 capital to average assets. Management believes, as of December 31, 2010, that the Bank meets all capital adequacy requirements to which it is subject.
As of December 31, 2010, the most recent notification from the Office of the Comptroller of the Currency classified the Bank as well-capitalized under the regulatory framework for prompt corrective action. To be categorized as well-capitalized, the Bank must maintain minimum total risk-based, Tier 1 risk-based, and Tier 1 leverage ratios as set forth in the table. There are no conditions or events since this notification that Management believes have changed the institution’s category.
The actual and minimum capital amounts and ratios for the Bank are presented in the following table:
The First Bancorp 2010 Form 10-K
Page 76
|
For capital
|
To be well-capitalized
|
|||||||||||
|
adequacy
|
under prompt corrective
|
|||||||||||
|
Actual
|
purposes
|
action provisions
|
||||||||||
|
As of December 31, 2010
|
||||||||||||
|
Tier 2 capital to
|
$ | 132,530,000 | $ | 65,799,000 | $ | 82,249,000 | ||||||
|
risk-weighted assets
|
16.11 | % | 8.00 | % | 10.00 | % | ||||||
|
Tier 1 capital to
|
$ | 122,210,000 | $ | 32,900,000 | $ | 49,349,000 | ||||||
|
risk-weighted assets
|
14.86 | % | 4.00 | % | 6.00 | % | ||||||
|
Tier 1 capital to
|
$ | 122,210,000 | $ | 54,117,000 | $ | 67,646,000 | ||||||
|
average assets
|
9.03 | % | 4.00 | % | 5.00 | % | ||||||
|
As of December 31, 2009
|
||||||||||||
|
Tier 2 capital to
|
$ | 129,338,000 | $ | 69,553,000 | $ | 86,941,000 | ||||||
|
risk-weighted assets
|
14.88 | % | 8.00 | % | 10.00 | % | ||||||
|
Tier 1 capital to
|
$ | 118,437,000 | $ | 34,776,000 | $ | 52,165,000 | ||||||
|
risk-weighted assets
|
13.62 | % | 4.00 | % | 6.00 | % | ||||||
|
Tier 1 capital to
|
$ | 118,437,000 | $ | 51,559,000 | $ | 64,449,000 | ||||||
|
average assets
|
9.19 | % | 4.00 | % | 5.00 | % | ||||||
The actual and minimum capital amounts and ratios for the Company, on a consolidated basis, are presented in the following table:
|
For capital
|
To be well-capitalized
|
|||||||||||
|
adequacy
|
under prompt corrective
|
|||||||||||
|
Actual
|
purposes
|
action provisions
|
||||||||||
|
As of December 31, 2010
|
||||||||||||
|
Tier 2 capital to
|
$ | 133,473,000 | $ | 65,799,000 | n/a | |||||||
|
risk-weighted assets
|
16.23 | % | 8.00 | % | n/a | |||||||
|
Tier 1 capital to
|
$ | 123,153,000 | $ | 32,900,000 | n/a | |||||||
|
risk-weighted assets
|
14.97 | % | 4.00 | % | n/a | |||||||
|
Tier 1 capital to
|
$ | 123,153,000 | $ | 52,963,000 | n/a | |||||||
|
average assets
|
9.30 | % | 4.00 | % | n/a | |||||||
|
As of December 31, 2009
|
||||||||||||
|
Tier 2 capital to
|
$ | 130,031,000 | $ | 69,557,000 | n/a | |||||||
|
risk-weighted assets
|
14.96 | % | 8.00 | % | n/a | |||||||
|
Tier 1 capital to
|
$ | 119,130,000 | $ | 34,778,000 | n/a | |||||||
|
risk-weighted assets
|
13.70 | % | 4.00 | % | n/a | |||||||
|
Tier 1 capital to
|
$ | 119,130,000 | $ | 50,461,000 | n/a | |||||||
|
average assets
|
9.44 | % | 4.00 | % | n/a | |||||||
The Bank is party to financial instruments with off-balance-sheet risk in the normal course of business to meet the financing needs of its customers. These financial instruments include commitments to originate loans, commitments for unused lines of credit, and standby letters of credit. The instruments involve, to varying degrees, elements of credit risk in excess of the amount recognized in the consolidated balance sheets. The contract amounts of those instruments reflect the extent of involvement the Bank has in particular classes of financial instruments.
Commitments for unused lines are agreements to lend to a customer provided there is no violation of any condition established in the contract. Commitments generally have fixed expiration dates or other termination clauses and may require payment of a fee. Since many of the commitments are expected to expire without being drawn upon, the total commitment amounts do not necessarily represent future cash requirements. The Bank evaluates each customer’s creditworthiness on a case-by-case basis. The amount of collateral obtained, if deemed necessary by the Bank upon extension of credit, is based on Management’s credit evaluation of the borrower. The Bank did not incur any losses on its commitments in 2010, 2009 or 2008.
The First Bancorp 2010 Form 10-K
Page 77
Standby letters of credit are conditional commitments issued by the Bank to guarantee a customer’s performance to a third party, with the customer being obligated to repay (with interest) any amounts paid out by the Bank under the letter of credit. The credit risk involved in issuing letters of credit is essentially the same as that involved in extending loans to customers.
The Bank’s exposure to credit loss in the event of nonperformance by the other party to the financial instrument for loan commitments and standby letters of credit is represented by the contractual amount of those instruments.
The Bank uses the same credit policies in making commitments and conditional obligations as it does for on-balance sheet instruments. At December 31, 2010 and 2009, the Bank had the following off-balance-sheet financial instruments, whose contract amounts represent credit risk:
|
As of December 31,
|
2010
|
2009
|
||||||
|
Unused lines, collateralized by residential real estate
|
$ | 62,765,000 | $ | 58,751,000 | ||||
|
Other unused commitments
|
50,179,000 | 76,125,000 | ||||||
|
Standby letters of credit
|
2,792,000 | 3,449,000 | ||||||
|
Commitments to extend credit
|
9,222,000 | 4,512,000 | ||||||
|
Total
|
$ | 124,958,000 | $ | 142,837,000 | ||||
The Bank grants residential, commercial and consumer loans to customers principally located in the Mid-Coast and Down East regions of Maine. Collateral on these loans typically consists of residential or commercial real estate, or personal property. Although the loan portfolio is diversified, a substantial portion of borrowers’ ability to honor their contracts is dependent on the economic conditions in the area, especially in the real estate sector.
Certain assets and liabilities are recorded at fair value to provide additional insight into the Company’s quality of earnings. Some of these assets and liabilities are measured on a recurring basis while others are measured on a nonrecurring basis, with the determination based upon applicable existing accounting pronouncements. For example, securities available for sale are recorded at fair value on a recurring basis. Other assets, such as, mortgage servicing rights, loans held for sale, and impaired loans, are recorded at fair value on a nonrecurring basis using the lower of cost or market methodology to determine impairment of individual assets. The Company groups assets and liabilities which are recorded at fair value in three levels, based on the markets in which the assets and liabilities are traded and the reliability of the assumptions used to determine fair value. A financial instrument’s level within the fair value hierarchy is based on the lowest level of input that is significant to the fair value measurement (with level 1 considered highest and level 3 considered lowest). A brief description of each level follows.
Level 1
– Valuation is based upon quoted prices for identical instruments in active markets.
Level 2
– Valuation is based upon quoted prices for similar instruments in active markets, quoted prices for identical or similar instruments in markets that are not active, and model-based valuation techniques for which all significant assumptions are observable in the market.
Level 3
– Valuation is generated from model-based techniques that use at least one significant assumption not observable in the market. These unobservable assumptions reflect estimates that market participants would use in pricing the asset or liability. Valuation includes use of discounted cash flow models and similar techniques.
The most significant instruments that the Company fair values include securities which fall into Level 2 in the fair value hierarchy. The securities in the available for sale portfolio are priced by independent providers. In obtaining such
valuation information from third parties, the Company has evaluated their valuation methodologies used to develop the fair values in order to determine whether the valuations are representative of an exit price in the Company’s principal markets. The Company’s principal markets for its securities portfolios are the secondary institutional markets, with an exit price that is predominantly reflective of bid level pricing in those markets.
The First Bancorp 2010 Form 10-K
Page 78
Assets and Liabilities Recorded at Fair Value on a Recurring Basis
Securities Available for Sale.
Investment securities available for sale are recorded at fair value on a recurring basis. Fair value measurement is based upon quoted prices for similar assets, if available. If quoted prices are not available, fair values are measured using matrix pricing models, or other model-based valuation techniques requiring observable inputs other than quoted prices such as yield curves, prepayment speeds, and default rates. Recurring Level 1 securities would include U.S. Treasury securities that are traded by dealers or brokers in active over-the-counter markets. Recurring Level 2 securities include federal agency securities, mortgage-backed securities, collateralized mortgage obligations, municipal bonds and corporate debt securities. The following table presents the balances of assets and liabilities that were measured at fair value on a recurring basis as of December 31, 2010 and 2009.
|
At December 31, 2010
|
||||||||||||||||
|
Level 1
|
Level 2
|
Level 3
|
Total
|
|||||||||||||
|
Securities available for sale
|
||||||||||||||||
|
U.S. Treasury and agency
|
$ | - | $ | 16,045,000 | $ | - | $ | 16,045,000 | ||||||||
|
Mortgage-backed securities
|
- | 234,414,000 | - | 234,414,000 | ||||||||||||
|
State and political subdivisions
|
- | 41,524,000 | - | 41,524,000 | ||||||||||||
|
Corporate securities
|
- | 866.000 | - | 866.000 | ||||||||||||
|
Other equity securities
|
- | 380,000 | - | 380,000 | ||||||||||||
|
Total assets
|
$ | - | $ | 293,229,000 | $ | - | $ | 293,229,000 | ||||||||
|
At December 31, 2009
|
||||||||||||||||
|
Level 1
|
Level 2
|
Level 3
|
Total
|
|||||||||||||
|
Securities available for sale
|
||||||||||||||||
|
U.S. Treasury and agency
|
$ | - | $ | 30,959,000 | $ | - | $ | 30,959,000 | ||||||||
|
Mortgage-backed securities
|
- | 31,148,000 | - | 31,148,000 | ||||||||||||
|
State and political subdivisions
|
- | 18,514,000 | - | 18,514,000 | ||||||||||||
|
Corporate securities
|
- | 818,000 | - | 818,000 | ||||||||||||
|
Other equity securities
|
- | 399,000 | - | 399,000 | ||||||||||||
|
Total assets
|
$ | - | $ | 81,838,000 | $ | - | $ | 81,838,000 | ||||||||
Assets and Liabilities Recorded at Fair Value on a Non-Recurring Basis
Mortgage Servicing Rights
. Mortgage servicing rights represent the value associated with servicing residential mortgage loans. Servicing assets and servicing liabilities are reported using the amortization method or the fair value measurement method. In evaluating the carrying values of mortgage servicing rights, the Company obtains third party valuations based on loan level data including note rate, type and term of the underlying loans. As such, the Company classifies mortgage servicing rights as nonrecurring Level 2.
Loans Held for Sale.
Mortgage loans held for sale are recorded at the lower of carrying value or market value. The fair value of mortgage loans held for sale is based on what secondary markets are currently offering for portfolios with similar characteristics. As such, the Company classifies mortgage loans held for sale as nonrecurring Level 2.
Other Real Estate Owned.
Real estate acquired through foreclosure is recorded at fair value. The fair value of other real estate owned is based on property appraisals and an analysis of similar properties currently available. As such, the Company records other real estate owned as nonrecurring Level 2.
Impaired Loans.
A loan is considered to be impaired when it is probable that all of the principal and interest due under the original underwriting terms of the loan may not be collected. Impairment is measured based on the fair value of the underlying collateral or the present value of future cashflows. The Company measures impairment on all nonaccrual loans for which it has established specific reserves as part of the specific allocated allowance component of the allowance for loan losses. As such, the Company records impaired loans as nonrecurring Level 2.
The following table presents assets measured at fair value on a nonrecurring basis as of December 31, 2010, that have had a fair value adjustment since their initial recognition as of March 31, 2008. Other real estate owned is presented net of an allowance for losses of $132,000. Impaired loans are presented net of their related specific allowance for loan losses of $1,256,000.
The First Bancorp 2010 Form 10-K
Page 79
|
At December 31, 2010
|
||||||||||||||||
|
Level 1
|
Level 2
|
Level 3
|
Total
|
|||||||||||||
|
Mortgage servicing rights
|
$ | - | $ | 1,684,000 | $ | - | $ | 1,684,000 | ||||||||
|
Loans held for sale
|
- | 2,806,000 | - | 2,806,000 | ||||||||||||
|
Other real estate owned
|
- | 4,929,000 | - | 4,929,000 | ||||||||||||
|
Impaired loans
|
- | 8,254,000 | - | 8,254,000 | ||||||||||||
|
Total Assets
|
$ | - | $ | 17,673,000 | $ | - | $ | 17,673,000 | ||||||||
The following table presents assets measured at fair value on a nonrecurring basis as of December 31, 2009, that have had a fair value adjustment since their initial recognition as of March 31, 2008. Other real estate owned is presented net of an allowance for losses of $583,000. Impaired loans are presented net of their related specific allowance for loan losses of $2,196,000.
|
At December 31, 2009
|
||||||||||||||||
|
Level 1
|
Level 2
|
Level 3
|
Total
|
|||||||||||||
|
Mortgage servicing rights
|
$ | - | $ | 1,422,000 | $ | - | $ | 1,422,000 | ||||||||
|
Loans held for sale
|
- | 2,876,000 | - | 2,876,000 | ||||||||||||
|
Other real estate owned
|
- | 5,345,000 | - | 5,345,000 | ||||||||||||
|
Impaired loans
|
- | 9,965,000 | - | 9,965,000 | ||||||||||||
|
Total Assets
|
$ | - | $ | 19,608,000 | $ | - | $ | 19,608,000 | ||||||||
FASB ASC Topic 825 “Financial Instruments” requires disclosures of fair value information about financial instruments, whether or not recognized in the balance sheet, if the fair values can be reasonably determined. Fair value is best determined based upon quoted market prices. However, in many instances, there are no quoted market prices for the Company’s various financial instruments. In cases where quoted market prices are not available, fair values are based on estimates using present value or other valuation techniques using observable inputs when available. Those techniques are significantly affected by the assumptions used, including the discount rate and estimates of future cash flows. Accordingly, the fair value estimates may not be realized in an immediate settlement of the instrument. FASB ASC Topic 825 excludes certain financial instruments and all nonfinancial instruments from its disclosure requirements. Accordingly, the aggregate fair value amounts presented may not necessarily represent the underlying fair value of the Company.
The estimated fair values for financial instruments as of December 31, 2010 and 2009 were as follows:
|
December 31, 2010
|
December 31, 2009
|
|||||||||||||||
|
Carrying
|
Estimated
|
Carrying
|
Estimated
|
|||||||||||||
|
amount
|
fair value
|
amount
|
fair value
|
|||||||||||||
|
Financial assets
|
||||||||||||||||
|
Cash and cash equivalents
|
$ | 13,838,000 | $ | 13,838,000 | $ | 15,332,000 | $ | 15,332,000 | ||||||||
|
Time deposits in other banks
|
100,000 | 100,000 | - | - | ||||||||||||
|
Securities available for sale
|
293,229,000 | 293,229,000 | 81,838,000 | 81,838,000 | ||||||||||||
|
Securities to be held to maturity
|
107,380,000 | 110,366,000 | 190,537,000 | 192,838,000 | ||||||||||||
|
Federal Home Loan Bank and Federal Reserve Bank stock
|
15,443,000 | 15,443,000 | 15,443,000 | 15,443,000 | ||||||||||||
|
Loans held for sale
|
2,806,000 | 2,806,000 | 2,876,000 | 2,876,000 | ||||||||||||
|
Loans (net of allowance for loan losses)
|
874,280,000 | 878,856,000 | 938,855,000 | 938,095,000 | ||||||||||||
|
Cash surrender value of life insurance
|
9,842,000 | 9,842,000 | 9,492,000 | 9,492,000 | ||||||||||||
|
Accrued interest receivable
|
5,263,000 | 5,263,000 | 4,889,000 | 4,889,000 | ||||||||||||
|
Financial liabilities
|
||||||||||||||||
|
Deposits
|
$ | 974,518,000 | $ | 924,903,000 | $ | 922,667,000 | $ | 877,883,000 | ||||||||
|
Borrowed funds
|
257,330,000 | 262,984,000 | 249,778,000 | 255,292,000 | ||||||||||||
|
Accrued interest payable
|
926,000 | 926,000 | 1,078,000 | 1,078,000 | ||||||||||||
The First Bancorp 2010 Form 10-K
Page 80
The fair value methods and assumptions for the Company’s financial instruments are set forth below.
Cash and Cash Equivalents
The carrying values of cash equivalents, due from banks and federal funds sold approximate their relative fair values.
Investment Securities
The fair values of investment securities are estimated based on bid prices published in financial newspapers or bid quotations received from securities dealers. The fair value of certain state and municipal securities is not readily available through market sources other than dealer quotations, so fair value estimates are based on quoted market prices of similar instruments, adjusted for differences between the quoted instruments and the instruments being valued. Fair values are calculated based on the value of one unit without regard to any premium or discount that may result from concentrations of ownership of a financial instrument, possible tax ramifications, or estimated transaction costs. If these considerations had been incorporated into the fair value estimates, the aggregate fair value could have been changed. The carrying values of restricted equity securities approximate fair values.
Loans Held for Sale
The carrying value approximates fair value because the sale price of the loans has been contracted.
Loans
Fair values are estimated for portfolios of loans with similar financial characteristics. The fair values of performing loans are calculated by discounting scheduled cash flows through the estimated maturity using estimated market discount rates that reflect the credit and interest risk inherent in the loan. The estimates of maturity are based on the Company’s historical experience with repayments for each loan classification, modified, as required, by an estimate of the effect of current economic and lending conditions, and the effects of estimated prepayments. Fair values for significant non-performing loans are based on estimated cash flows and are discounted using a rate commensurate with the risk associated with the estimated cash flows. Assumptions regarding credit risk, cash flows, and discount rates are judgmentally determined using available market information and specific borrower information. Management has made estimates of fair value using discount rates that it believes to be reasonable. However, because there is no market for many of these financial instruments, Management has no basis to determine whether the fair value presented above would be indicative of the value negotiated in an actual sale.
Cash Surrender Value of Life Insurance
The fair value is based on the actual cash surrender value of life insurance policies.
Accrued Interest Receivable
The fair value estimate of this financial instrument approximates the carrying value as this financial instrument has a short maturity. It is the Company’s policy to stop accruing interest on loans for which it is probable that the interest is not collectible. Therefore, this financial instrument has been adjusted for estimated credit loss.
Deposits
The fair value of deposits is based on the discounted value of contractual cash flows. The discount rate is estimated using the rates currently offered for deposits of similar remaining maturities. The fair value estimates do not include the benefit that results from the low-cost funding provided by the deposits compared to the cost of borrowing funds in the market. If that value were considered, the fair value of the Company’s net assets could increase.
Borrowed Funds
The fair value of borrowed funds is based on the discounted value of contractual cash flows. The discount rate is estimated using the rates currently available for borrowings of similar remaining maturities.
Accrued Interest Payable
The fair value estimate approximates the carrying amount as this financial instrument has a short maturity.
Off-Balance-Sheet Instruments
Off-balance-sheet instruments include loan commitments. Fair values for loan commitments have not been presented as the future revenue derived from such financial instruments is not significant.
Limitations
Fair value estimates are made at a specific point in time, based on relevant market information and information about
The First Bancorp 2010 Form 10-K
Page 81
the financial instrument. These values do not reflect any premium or discount that could result from offering for sale at one time the Company’s entire holdings of a particular financial instrument. Because no market exists for a significant portion of the Company’s financial instruments, fair value estimates are based on Management’s judgments regarding future expected loss experience, current economic conditions, risk characteristics of various financial instruments, and other factors. These estimates are subjective in nature and involve uncertainties and matters of significant judgment and therefore cannot be determined with precision. Changes in assumptions could significantly affect the estimates. Fair value estimates are based on existing on- and off-balance-sheet financial instruments without attempting to estimate the value of anticipated future business and the value of assets and liabilities that are not considered financial instruments. Other significant assets and liabilities that are not considered financial instruments include the deferred tax asset, premises and equipment, and other real estate owned. In addition, tax ramifications related to the realization of the unrealized gains and losses can have a significant effect on fair value estimates and have not been considered in any of the estimates.
Other operating income and other operating expense include the following items greater than 1% of revenues.
|
For the years ended December 31,
|
2010
|
2009
|
2008
|
|||||||||
|
Other operating income
|
||||||||||||
|
Merchant credit card processing income
|
$ | - | $ | 2,289,000 | $ | 2,433,000 | ||||||
|
ATM and debit card income
|
1,394,000 | 1,184,000 | 1,156,000 | |||||||||
|
Gain on sale of merchant credit card processing portfolio
|
- | 1,402,000 | - | |||||||||
|
Other operating expense
|
||||||||||||
|
Merchant credit card processing fees
|
$ | - | $ | 2,214,000 | $ | 2,358,000 | ||||||
|
Advertising and marketing expense
|
688,000 | - | - | |||||||||
|
Collections/foreclosures/other real estate owned expense
|
1,355,000 | - | - | |||||||||
Various legal claims also arise from time to time in the normal course of business which, in the opinion of Management, will have no material effect on the Company’s consolidated financial statements.
Certain items from prior years were reclassified in the financial statements to conform with the current year presentation. These do not have a material impact on the balance sheet or statement of income presentations.
The First Bancorp 2010 Form 10-K
Page 82
Condensed financial information for The First Bancorp, Inc. exclusive of its subsidiary is as follows:
Balance Sheets
|
As of December 31,
|
2010
|
2009
|
||||||
|
Assets
|
||||||||
|
Cash and cash equivalents
|
$ | 642,000 | $ | 313,000 | ||||
|
Dividends receivable
|
1,900,000 | 1,900,000 | ||||||
|
Investments
|
285,000 | 260,000 | ||||||
|
Investment in subsidiary
|
121,346,000 | 119,786,000 | ||||||
|
Premises and Equipment
|
10,000 | - | ||||||
|
Goodwill
|
27,559,000 | 27,559,000 | ||||||
|
Other assets
|
15,000 | 20,000 | ||||||
|
Total assets
|
$ | 151,757,000 | $ | 149,838,000 | ||||
|
Liabilities and shareholders’ equity
|
||||||||
|
Dividends payable
|
$ | 1,906,000 | $ | 1,900,000 | ||||
|
Other liabilities
|
3,000 | - | ||||||
|
Total liabilities
|
1,909,000 | 1,900,000 | ||||||
|
Shareholders’ equity
|
||||||||
|
Preferred stock
|
24,705,000 | 24,606,000 | ||||||
|
Common stock
|
98,000 | 97,000 | ||||||
|
Additional paid-in capital
|
45,474,000 | 45,121,000 | ||||||
|
Retained earnings
|
79,638,000 | 78,335,000 | ||||||
|
Accumulated other comprehensive loss
|
||||||||
|
Net unrealized loss on available for sale securities, net
of taxes of $3,000 in 2010 and tax benefit of $5,000 in 2009
|
6,000 | (10,000 | ) | |||||
|
Net unrealized loss on post-retirement benefit costs, net
of tax benefit of $39,000 in 2010 and $114,000 in 2009
|
(73,000 | ) | (211,000 | ) | ||||
|
Total accumulated other comprehensive loss
|
(67,000 | ) | (221,000 | ) | ||||
|
Total shareholders’ equity
|
149,848,000 | 147,938,000 | ||||||
|
Total liabilities and shareholders’ equity
|
$ | 151,757,000 | $ | 149,838,000 | ||||
Statements of Income
|
For the years ended December 31,
|
2010
|
2009
|
2008
|
|||||||||
|
Investment income
|
$ | 10,000 | $ | 10,000 | $ | 11,000 | ||||||
|
Other expense
|
113,000 | 152,000 | 136,000 | |||||||||
|
Loss before Bank earnings
|
(103,000 | ) | (142,000 | ) | (125,000 | ) | ||||||
|
Equity in earnings of Bank
|
||||||||||||
|
Remitted
|
8,850,000 | 8,404,000 | 7,281,000 | |||||||||
|
Unremitted
|
3,369,000 | 4,780,000 | 6,878,000 | |||||||||
|
Net income
|
$ | 12,116,000 | $ | 13,042,000 | $ | 14,034,000 | ||||||
The First Bancorp 2010 Form 10-K
Page 83
Statements of Cash Flows
|
For the years ended December 31,
|
2010
|
2009
|
2008
|
|||||||||
|
Cash flows from operating activities:
|
||||||||||||
|
Net income
|
$ | 12,116,000 | $ | 13,042,000 | $ | 14,034,000 | ||||||
|
Adjustments to reconcile net income to net cash provided by operating activities:
|
||||||||||||
|
Depreciation
|
- | - | 2,000 | |||||||||
|
Net realized loss on sale of securities
|
- | - | 24,000 | |||||||||
|
Equity compensation expense
|
37,000 | 37,000 | 37,000 | |||||||||
|
(Increase) decrease in other assets
|
(1,000 | ) | 38,000 | (38,000 | ) | |||||||
|
Increase (decrease) in other liabilities
|
5,000 | (41,000 | ) | 278,000 | ||||||||
|
Unremitted earnings of Bank
|
(3,369,000 | ) | (4,780,000 | ) | (6,878,000 | ) | ||||||
|
Net cash provided by operating activities
|
8,788,000 | 8,296,000 | 7,459,000 | |||||||||
|
Cash flows from investing activities:
|
||||||||||||
|
Purchases of investments
|
- | (120,000 | ) | - | ||||||||
|
Preferred stock investment in subsidiary
|
(25,000,000 | ) | - | |||||||||
|
Capital expenditures
|
(10,000 | ) | - | - | ||||||||
|
Net cash used in investing activities
|
(10,000 | ) | (25,120,000 | ) | - | |||||||
|
Cash flows from financing activities:
|
||||||||||||
|
Proceeds from sale of real estate
|
- | - | 348,000 | |||||||||
|
Proceeds from issuance of preferred stock
|
- | 25,000,000 | - | |||||||||
|
Payments to purchase common stock
|
- | (263,000 | ) | (1,414,000 | ) | |||||||
|
Proceeds from sale of common stock
|
416,000 | 836,000 | 732,000 | |||||||||
|
Dividends paid
|
(8,865,000 | ) | (8,649,000 | ) | (7,281,000 | ) | ||||||
|
Net cash provided (used) in financing activities
|
(8,449,000 | ) | 16,924,000 | (7,615,000 | ) | |||||||
|
Net increase (decrease) in cash and cash equivalents
|
329,000 | 100,000 | (156,000 | ) | ||||||||
|
Cash and cash equivalents at beginning of year
|
313,000 | 213,000 | 369,000 | |||||||||
|
Cash and cash equivalents at end of year
|
$ | 642,000 | $ | 313,000 | $ | 213,000 | ||||||
The First Bancorp 2010 Form 10-K
Page 84
In June 2009, FASB issued guidance (incorporated in the FASB ASC via Accounting Standards Update (“ASU”) 2009-16, Transfers and Servicing: Accounting for Transfers of Financial Assets, in December 2009) which provides amended guidance relating to transfers of financial assets that eliminates the concept of a qualifying special-purpose entity. This guidance must be applied as of the beginning of each reporting entity’s first annual reporting period that begins after November 15, 2009, for interim periods within that first annual reporting period, and for interim and annual reporting periods thereafter. This guidance must be applied to transfers occurring on or after its effective date. On and after the effective date, the concept of a qualifying special-purpose entity is no longer relevant for accounting purposes. Therefore, formerly qualifying special-purpose entities should be evaluated for consolidation by reporting entities on and after the effective date in accordance with the applicable consolidation guidance. The new guidance also changed the requirements which must be satisfied in order for an entity to treat a loan participation as a sale. The disclosure provisions were also amended and apply to transfers that occurred both before and after the effective date of this guidance. The adoption of this update did not have a significant impact on the Company’s consolidated financial statements.
In June 2009, the FASB issued guidance (incorporated in the FASB ASC via ASU 2009-17, Consolidations: Improvements to Financial Reporting by Enterprises Involved with Variable Interest Entities, in December 2009) which provides amended guidance for consolidation of a variable interest entity by replacing the quantitative-based risks and rewards calculation for determining which enterprise, if any, has a controlling financial interest in a variable interest entity. The amended guidance uses an approach that focuses on identifying which enterprise has the power to direct the activities of a variable interest entity that most significantly impact the entity’s economic performance and (1) the obligation to absorb losses of the entity or (2) the right to receive benefits from the entity. Additional disclosures about an enterprise’s involvement in variable interest entities are also required. This guidance is effective as of the beginning of each reporting entity’s first annual reporting period that begins after November 15, 2009, for interim periods within that first annual reporting period, and for interim and annual reporting periods thereafter. The adoption of this update did not have a significant impact on the Company’s consolidated financial statements.
In January 2010, the FASB issued ASU 2010-06, Fair Value Measurements and Disclosures: Improving Disclosures about Fair Value Measurements, to amend the disclosure requirements related to recurring and nonrecurring fair value measurements. The guidance requires new disclosures regarding transfers of assets and liabilities between Level 1 (quoted prices in active market for identical assets or liabilities) and Level 2 (significant other observable inputs) of the fair value measurement hierarchy, including the reasons and the timing of the transfers. Additionally, the guidance requires a rollforward of activities, separately reporting purchases, sales, issuance, and settlements, for assets and liabilities measured using significant unobservable inputs (Level 3 fair value measurements). The guidance is effective for annual reporting periods that begin after December 15, 2009, and for interim periods within those annual reporting periods except for the changes to the disclosure of rollforward activities for any Level 3 fair value measurements, which are effective for annual reporting periods that begin after December 15, 2010, and for interim periods within those annual reporting periods. Other than requiring additional disclosures, adoption of this new guidance did not have a material impact on the Company’s consolidated financial statements.
In February 2010, the FASB issued ASU 2010-09, Subsequent Events: Amendments to Certain Recognition and Disclosure Requirements, related to events that occur after the balance sheet date but before financial statements are issued. This guidance amends existing standards to address potential conflicts with Securities and Exchange Commission (“SEC”) guidance and refines the scope of the reissuance disclosure requirements to include revised
financial statements only. Under this guidance, SEC registrants or filers with the SEC are no longer required to disclose the date through which subsequent events have been evaluated. The adoption of this update did not have a material effect on the Company’s consolidated financial statements.
In July 2010, the FASB issued ASU No. 2010-20, Receivables (Topic 310): Disclosures about the Credit Quality of Financing Receivables and the Allowance for Credit Losses. This ASU is intended to provide additional information to assist financial statement users in assessing an entity’s credit risk exposures and evaluating the adequacy of its allowance for credit losses. The guidance is effective for interim and annual reporting periods ending after December 15, 2010. Other than requiring additional disclosures, adoption of this new guidance did not have a material impact on the Company’s consolidated financial statements.
The First Bancorp 2010 Form 10-K
Page 85
The following tables provide unaudited financial information by quarter for each of the past two years:
|
Dollars in thousands except per share data
|
2009Q1 | 2009Q2 | 2009Q3 | 2009Q4 | 2010Q1 | 2010Q2 | 2010Q3 | 2010Q4 | ||||||||||||||||||||||||
|
Balance Sheets
|
||||||||||||||||||||||||||||||||
|
Cash
|
$ | 15,815 | $ | 18,575 | $ | 23,921 | $ | 15,332 | $ | 11,731 | $ | 22,219 | $ | 13,880 | $ | 13,838 | ||||||||||||||||
|
Investments
|
309,106 | 283,599 | 250,359 | 272,375 | 296,465 | 279,141 | 353,416 | 400,609 | ||||||||||||||||||||||||
|
FHLB & FRB stock,
at cost
|
14,693 | 14,693 | 14,693 | 15,443 | 15,443 | 15,443 | 15,443 | 15,443 | ||||||||||||||||||||||||
|
Net loans
|
982,158 | 973,746 | 963,817 | 941,730 | 924,877 | 921,271 | 905,324 | 877,086 | ||||||||||||||||||||||||
|
Other assets
|
76,728 | 79,373 | 79,052 | 86,514 | 88,028 | 88,201 | 86,561 | 86,826 | ||||||||||||||||||||||||
|
Total assets
|
$ | 1,398,500 | $ | 1,369,986 | $ | 1,331,842 | $ | 1,331,394 | $ | 1,336,544 | $ | 1,326,275 | $ | 1,374,624 | $ | 1,393,802 | ||||||||||||||||
|
Deposits
|
$ | 987,440 | $ | 913,949 | $ | 960,072 | $ | 922,667 | $ | 939,180 | $ | 949,501 | $ | 986,932 | $ | 974,518 | ||||||||||||||||
|
Borrowed funds
|
254,124 | 297,361 | 213,061 | 249,778 | 236,913 | 213,944 | 222,672 | 257,330 | ||||||||||||||||||||||||
|
Other liabilities
|
12,336 | 12,478 | 11,095 | 11,011 | 11,909 | 12,385 | 12,790 | 12,106 | ||||||||||||||||||||||||
|
Shareholders’ equity
|
144,600 | 146,198 | 147,614 | 147,938 | 148,542 | 150,445 | 152,230 | 149,848 | ||||||||||||||||||||||||
|
Total liabilities
& equity
|
$ | 1,398,500 | $ | 1,369,986 | $ | 1,331,842 | $ | 1,331,394 | $ | 1,336,544 | $ | 1,326,275 | $ | 1,374,624 | $ | 1,393,802 | ||||||||||||||||
|
Income Statements
|
||||||||||||||||||||||||||||||||
|
Interest income
|
$ | 16,618 | $ | 16,251 | $ | 15,224 | $ | 14,476 | $ | 14,133 | $ | 14,215 | $ | 14,570 | $ | 14,342 | ||||||||||||||||
|
Interest expense
|
5,545 | 4,814 | 4,409 | 4,148 | 4,112 | 4,258 | 4,317 | 3,984 | ||||||||||||||||||||||||
|
Net interest income
|
11,073 | 11,437 | 10,815 | 10,328 | 10,021 | 9,957 | 10,253 | 10,358 | ||||||||||||||||||||||||
|
Provision for
loan losses
|
1,650 | 2,950 | 3,060 | 4,500 | 2,400 | 2,100 | 1,800 | 2,100 | ||||||||||||||||||||||||
|
Net interest income after provision for loan losses
|
9,423 | 8,487 | 7,755 | 5,828 | 7,621 | 7,857 | 8,453 | 8,258 | ||||||||||||||||||||||||
|
Non-interest income
|
2,586 | 2,963 | 2,977 | 4,228 | 2,175 | 2,282 | 2,067 | 2,611 | ||||||||||||||||||||||||
|
Non-interest expense
|
6,787 | 6,234 | 6,872 | 6,765 | 6,282 | 5,895 | 6,228 | 6,725 | ||||||||||||||||||||||||
|
Income before taxes
|
5,222 | 5,216 | 3,860 | 3,291 | 3,514 | 4,244 | 4,292 | 4,144 | ||||||||||||||||||||||||
|
Income taxes
|
1,494 | 1,454 | 970 | 629 | 830 | 1,084 | 1,097 | 1,067 | ||||||||||||||||||||||||
|
Net income
|
$ | 3,728 | $ | 3,762 | $ | 2,890 | $ | 2,662 | $ | 2,684 | $ | 3,160 | $ | 3,195 | $ | 3,077 | ||||||||||||||||
|
Less preferred stock
premium amortization
and dividends
|
150 | 337 | 337 | 337 | 337 | 337 | 337 | 337 | ||||||||||||||||||||||||
|
Net income available to common shareholders
|
$ | 3,578 | $ | 3,425 | $ | 2,553 | $ | 2,325 | $ | 2,347 | $ | 2,823 | $ | 2,858 | $ | 2,740 | ||||||||||||||||
|
Basic earnings per share
|
$ | 0.37 | $ | 0.35 | $ | 0.26 | $ | 0.24 | $ | 0.24 | $ | 0.29 | $ | 0.29 | $ | 0.28 | ||||||||||||||||
|
Diluted earnings per share
|
$ | 0.37 | $ | 0.35 | $ | 0.26 | $ | 0.24 | $ | 0.24 | $ | 0.29 | $ | 0.29 | $ | 0.28 |
The First Bancorp 2010 Form 10-K
Page 86
Report of Independent Registered Public Accounting Firm
Berry, Dunn, McNeil & Parker
The Shareholders and Board of Directors
The First Bancorp, Inc.
We have audited the accompanying consolidated balance sheets of The First Bancorp, Inc. and Subsidiary as of December 31, 2010 and 2009, and the related consolidated statements of income, changes in shareholders’ equity, and cash flows for each of the three years in the period ended December 31, 2010. We have also audited The First Bancorp, Inc.’s internal control over financial reporting as of December 31, 2010, based on criteria established in Internal Control – Integrated Framework issued by the Committee of Sponsoring Organizations of the Treadway Commission (COSO). The First Bancorp, Inc.’s management is responsible for these financial statements, for maintaining effective internal control over financial reporting, and for its assessment of the effectiveness of internal control over financial reporting, included in the accompanying Management’s Annual Report on Internal Control Over Financial Reporting. Our responsibility is to express an opinion on these financial statements and an opinion on the Company’s internal control over financial reporting based on our audits.
We conducted our audits in accordance with the standards of the Public Company Accounting Oversight Board (United States). Those standards require that we plan and perform the audit to obtain reasonable assurance about whether the financial statements are free of material misstatement and whether effective internal control over financial reporting was maintained in all material respects. Our audits of the financial statements included examining, on a test basis, evidence supporting the amounts and disclosures in the financial statements, assessing the accounting principles used and significant estimates made by Management, and evaluating the overall financial statement presentation. Our audit of internal control over financial reporting included obtaining an understanding of internal control over financial reporting, assessing the risk that a material weakness exists, and testing and evaluating the design and operating effectiveness of internal control based on the assessed risk. Our audits also included performing such other procedures as we considered necessary in the circumstances. We believe that our audits provide a reasonable basis for our opinions.
A company’s internal control over financial reporting is a process designed to provide reasonable assurance regarding the reliability of financial reporting and the preparation of financial statements for external purposes in accordance with U.S. generally accepted accounting principles. A company’s internal control over financial reporting includes those policies and procedures that (1) pertain to the maintenance of records that, in reasonable detail, accurately and fairly reflect the transactions and dispositions of the assets of the company; (2) provide reasonable assurance that transactions are recorded as necessary to permit preparation of financial statements in accordance with U.S. generally accepted accounting principles, and that receipts and expenditures of the company are being made only in accordance with authorizations of Management and directors of the company; and (3) provide reasonable assurance regarding prevention or timely detection of unauthorized acquisition, use, or disposition of the company’s assets that could have a material effect on the financial statements.
Because of its inherent limitations, internal control over financial reporting may not prevent or detect misstatements. Also, projections of any evaluation of effectiveness to future periods are subject to the risk that controls may become inadequate because of changes in conditions, or that the degree of compliance with the policies or procedures may deteriorate.
In our opinion, the financial statements referred to above present fairly, in all material respects, the consolidated financial position of The First Bancorp, Inc. and Subsidiary as of December 31, 2010 and 2009, and the consolidated results of their operations and their consolidated cash flows for each of the three years in the period ended December 31, 2010, in conformity with accounting principles generally accepted in the United States of America. Also, in our opinion, The First Bancorp, Inc. maintained, in all material respects, effective internal control over financial reporting as of December 31, 2010, based on criteria established in COSO.
/s/Berry, Dunn, McNeil & Parker
Portland, Maine
March 11, 2011
The First Bancorp 2010 Form 10-K
Page 87
on Accounting and Financial Disclosure
None.
As required by Rule 13a-15 under the Securities Exchange Act of 1934 (the “Exchange Act”), as of December 31, 2010, the end of the period covered by this report, the Company carried out an evaluation under the supervision and with the participation of the Company’s Management, including the Company’s Chief Executive Officer and Chief Financial Officer, of the effectiveness of the design and operation of the Company’s disclosure controls and procedures. In designing and evaluating the Company’s disclosure controls and procedures, the Company and its Management recognize that any controls and procedures, no matter how well designed and operated, can provide only reasonable assurance of achieving the desired control objectives, and the Company’s Management necessarily was required to apply its judgment in evaluating and implementing possible controls and procedures. Based upon that evaluation, the Chief Executive Officer and Chief Financial Officer concluded that the Company’s disclosure controls and procedures are effective to provide reasonable assurance that information required to be disclosed by the Company in the reports it files or submits under the Exchange Act is recorded, processed, summarized and reported within the time periods specified in the Securities and Exchange Commission’s rules and forms. Also, based on Management’s evaluation, there was no change in the Company’s internal control over financial reporting that occurred during the fiscal quarter ended December 31, 2010 that has materially affected, or is reasonably likely to materially affect, the Company’s internal control over financial reporting. The Company reviews its disclosure controls and procedures, which may include its internal controls over financial reporting, on an ongoing basis, and may from time to time make changes aimed at enhancing their effectiveness and to ensure that the Company’s systems evolve with its business.
Management’s Annual Report on Internal Control over Financial Reporting
The Management of the Company is responsible for the preparation and fair presentation of the financial statements and other financial information contained in this Form 10-K. Management is also responsible for establishing and maintaining adequate internal control over financial reporting and for identifying the framework used to evaluate its effectiveness. Management has designed processes, internal control and a business culture that foster financial integrity and accurate reporting. The Company’s comprehensive system of internal control over financial reporting was designed to provide reasonable assurances regarding the reliability of financial reporting and the preparation of the consolidated financial statements of the Company in accordance with generally accepted accounting principles. The Company’s accounting policies and internal control over financial reporting, established and maintained by Management, are under the general oversight of the Company’s Board of Directors, including the Board of Directors’ Audit Committee.
Management has made a comprehensive review, evaluation, and assessment of the Company’s internal control over financial reporting as of December 31, 2010. The standard measures adopted by Management in making its evaluation are the measures in Internal Control – Integrated Framework published by the Committee of Sponsoring Organizations of the Treadway Commission (“the COSO”). Based upon its review and evaluation, Management concluded that, as of December 31, 2010, the Company’s internal control over financial reporting was effective and that there were no material weaknesses.
Berry, Dunn, McNeil & Parker, an independent registered public accounting firm, which has audited and reported on the consolidated financial statements contained in this Form 10-K, has issued its written attestation report on Management’s assessment of the Company’s internal control over financial reporting which precedes this report.
/s/Daniel R. Daigneault /s/F. Stephen Ward
Daniel R. Daigneault, President and Director F. Stephen Ward , Treasurer and Chief Financial Officer
(Principal Executive Officer) (Principal Financial Officer, Principal Accounting Officer)
March 11, 2011 March 11, 2011
The First Bancorp 2010 Form 10-K
Page 88
None
Information with respect to directors and executive officers of the Company required by Item 10 shall be included in the Proxy Statement for the Annual Meeting of Stockholders to be held on April 27, 2011 and is incorporated herein by reference.
Information with respect to executive compensation required by Item 11 shall be included in the Proxy Statement for the Annual Meeting of Stockholders to be held on April 27, 2011 and is incorporated herein by reference.
Information with respect to security ownership of certain beneficial owners and Management and related stockholder matters required by Item 12 shall be included in the Proxy Statement for the Annual Meeting of Stockholders to be held on April 27, 2011 and is incorporated herein by reference.
Information with respect to certain relationships and related transactions required by Item 13 shall be included in the Proxy Statement for the Annual Meeting of Stockholders to be held on April 27, 2011 and is incorporated herein by reference.
Information with respect to principal accounting fees and services required by Item 14 shall be included in the Proxy Statement for the Annual Meeting of Stockholders to be held on April 27, 2011 and is incorporated herein by reference.
The First Bancorp 2010 Form 10-K
Page 89
A. Exhibits
Exhibit 2.1 Agreement and Plan of Merger With FNB Bankshares Dated August 25, 2004, incorporated by reference to Exhibit 2.1 to the Company’s Form 8-K dated August 25, 2004, filed under item 1.01 on August 27, 2004.
Exhibit 3.1 Conformed Copy of the Registrant’s Articles of Incorporation (incorporated by reference to Exhibit 3.1 to the Company’s Form 8-K filed under item 5.03 on October 7, 2004).
Exhibit 3.2 Amendment to the Registrant’s Articles of Incorporation (incorporated by reference to Exhibit 3.1 to the Company’s Form 8-K filed under item 5.03 on May 1, 2008).
Exhibit 3.3 Amendment to the Registrant’s Articles of Incorporation (incorporated by reference to the Definitive Proxy Statement for the Company’s 2008 Annual Meeting filed on March 14, 2008).
Exhibit 3.4 Amendment to the Registrant’s Articles of Incorporation authorizing issuance of preferred stock (incorporated by reference to Exhibit 3.1 to Current Report on Form 8-K filed on December 29, 2008).
Exhibit 3.5 Conformed Copy of the Company’s Bylaws (incorporated by reference to Exhibit 3.2 to the Company’s Form 8-K filed under item 5.03 on October 7, 2004).
Exhibit 10.2(a) Specimen Employment Continuity Agreement entered into with Mr. McKim, incorporated by reference to Exhibit 10.2(a) to the Company’s Form 8-K filed under item 1.01 on January 14, 2005.
Exhibit 10.2(b) Specimen Amendment to Employment Continuity Agreement entered into with Mr. McKim, incorporated by reference to Exhibit 10.2(b) to the Company’s Form 8-K filed under item 1.01 on January 14, 2005.
Exhibit 10.2(c) Specimen Amendment to Employment Continuity Agreement entered into with Mr. McKim, incorporated by reference to Exhibit 10.1 to the Company’s Form 8-K filed under item 1.01 on January 31, 2006.
Exhibit 10.3(a) Specimen Split Dollar Agreement entered into with Mr. McKim with a death benefit of $250,000. Incorporated by reference to Exhibit 10.3(a) to the Company’s Form 8-K filed under item 1.01 on January 14, 2005.
Exhibit 10.3(b) Specimen Amendment to Split Dollar Agreement entered into with Mr. McKim, incorporated by reference to Exhibit 10.3(b) to the Company’s Form 8-K filed under item 1.01 on January 14, 2005.
Exhibit 10.4 Specimen Amendment to Supplemental Executive Retirement Plan entered into with Messrs. Daigneault and Ward changing the normal retirement age to receive the full benefit under the Plan from age 65 to age 63, incorporated by reference to Exhibit 10.1 to the Company’s Form 8-K filed under item 1.01 on December 30, 2008.
Exhibit 14.1 Code of Ethics for Senior Financial Officers, adopted by the Board of Directors on September 19, 2003. Incorporated by reference to Exhibit 14.1 to the Company’s Annual Report on Form 10-K filed on March 15, 2006.
Exhibit 14.2 Code of Business Conduct and Ethics, adopted by the Board of Directors on April 15, 2004. Incorporated by reference to Exhibit 14.2 to the Company’s Annual Report on Form 10-K filed on March 15, 2006.
Exhibit 101.INS XBRL Instance Document
Exhibit 101.SCH XBRL Taxonomy Extension Schema Document
Exhibit 101.CAL XBRL Taxonomy Extension Calculation Linkbase Document
Exhibit 101.LAB XBRL Taxonomy Extension Label Linkbase Document
Exhibit 101.PRE XBRL Taxonomy Extension Presentation Linkbase Document
Exhibit 101.DEF XBRL Taxonomy Extension Definitions Linkbase Document
The First Bancorp 2010 Form 10-K
Page 90
Pursuant to the requirements of section 13 or 15(d) of the Securities Exchange Act of 1934, the Registrant has duly caused this report to be signed on its behalf by the undersigned, thereunto duly authorized.
THE FIRST BANCORP, INC.
/s/ DANIEL R. DAIGNEAULT
Daniel R. Daigneault, President
March 12, 2010
Pursuant to the requirements of the Securities Exchange Act of 1934, this report has been signed below by the following persons on behalf of the Registrant and in the capacities and on the dates indicated.
|
/s/ DANIEL R. DAIGNEAULT /s/ F. STEPHEN WARD
|
|
Daniel R. Daigneault, President and Director F. Stephen Ward , Treasurer and Chief Financial Officer
|
|
(Principal Executive Officer) (Principal Financial Officer, Principal Accounting Officer)
|
|
March 11, 2011 March 11, 2011
|
|
/s/ STUART G. SMITH
|
|
Stuart G. Smith, Director and Chairman of the Board
|
|
March 11, 2011
|
|
/s/ KATHERINE M. BOYD /s/ CARL S. POOLE, JR.
|
|
Katherine M. Boyd , Director Carl S. Poole, Jr., Director
|
|
March 11, 2011 March 11, 2011
|
|
/s/ ROBERT B. GREGORY /s/ MARK N. ROSBOROUGH
|
|
Robert B. Gregory, Director Mark N. Rosborough, Director
|
|
March 11, 2011 March 11, 2011
|
|
/s/ TONY C. MCKIM /s/ DAVID B. SOULE, JR.
|
|
Tony C. McKim, Director David B. Soule, Jr. , Director
|
|
March 11, 2011 March 11, 2011
|
|
/s/ BRUCE A. TINDAL
|
|
Bruce A. Tindal, Director
|
|
March 11, 2011
|
The First Bancorp 2010 Form 10-K
Page 91
TABLE OF CONTENTS
Item 1. Discussion Of BusinessItem 1A. Risk FactorsItem 1B. Unresolved Staff CommentsItem 2. PropertiesItem 3. Legal ProceedingsItem 4. Submission Of Matters To A Vote Of Security HoldersItem 5. Market For Registrant S Common Equity, Related Shareholder Matters and Issuer Purchases Of Equity SecuritiesItem 5. Market For Registrant S Common Equity, Related Shareholder MattersItem 6. Selected Financial DataItem 7. Management S Discussion and Analysis Of Financial Condition and Results Of OperationsItem 7A. Quantitative and Qualitative Disclosures About Market RiskItem 8. Financial Statements and Supplementary DataNote 1. Summary Of Significant Accounting PoliciesNote 2. Cash and Cash EquivalentsNote 3. Investment SecuritiesNote 4. Loan ServicingNote 5. LoansNote 6. Allowance For Loan LossesNote 7. Premises and EquipmentNote 8. Other Real Estate OwnedNote 9. GoodwillNote 10. Income TaxesNote 11. Certificates Of DepositNote 12. Borrowed FundsNote 13. Employee Benefit PlansNote 14. Preferred and Common StockNote 15. Stock Options and Stock-based CompensationNote 16. Earnings Per ShareNote 17. Regulatory Capital RequirementsNote 18. Off-balance-sheet Financial Instruments and Concentrations Of Credit RiskNote 19. Fair Value DisclosuresNote 20. Other Operating Income and ExpenseNote 21. Legal ContingenciesNote 2 2. ReclassificationsNote 23. Condensed Financial Information Of ParentNote 24. New Accounting PronouncementsNote 25. Quarterly InformationItem 9. Changes in and Disagreements with AccountantsItem 9A. Controls and ProceduresItem 9B. Other InformationItem 10. Directors, Executive Officers and Corporate GovernanceItem 11. Executive CompensationItem 12. Security Ownership Of Certain Beneficial Owners and Management and Related Stockholder MattersItem 13. Certain Relationships and Related Transactions, and Director IndependenceItem 14. Principal Accounting Fees and ServicesItem 15. Exhibits, Financial Statement Schedules