FEDERAL NATIONAL MORTGAGE ASSOCIATION FANNIE MAE
10-Ks and 10-Qs
UNITED STATES SECURITIES AND EXCHANGE COMMISSION
Washington, D.C. 20549
Form 10-Q
|
þ
|
QUARTERLY REPORT PURSUANT TO SECTION 13 OR 15(d) OF THE SECURITIES EXCHANGE ACT OF 1934
|
For the quarterly period ended
September 30, 2017
OR
|
o
|
TRANSITION REPORT PURSUANT TO SECTION 13 OR 15(d) OF THE SECURITIES EXCHANGE ACT OF 1934
|
For the transition period from to
Commission File No.: 0-50231
Federal National Mortgage Association
(Exact name of registrant as specified in its charter)
Fannie Mae
|
Federally chartered corporation
|
52-0883107
|
|
(State or other jurisdiction of
incorporation or organization)
|
(I.R.S. Employer
Identification No.)
|
|
3900 Wisconsin Avenue, NW
Washington, DC
|
20016
(Zip Code)
|
|
(Address of principal executive offices)
|
|
Registrant’s telephone number, including area code: (800) 2FANNIE (800-232-6643)
Indicate by check mark whether the registrant (1) has filed all reports required to be filed by Section 13 or 15(d) of the Securities Exchange Act of 1934 during the preceding 12 months (or for such shorter period that the registrant was required to file such reports), and (2) has been subject to such filing requirements for the past 90 days. Yes
þ
No
o
Indicate by check mark whether the registrant has submitted electronically and posted on its corporate Web site, if any, every Interactive Data File required to be submitted and posted pursuant to Rule 405 of Regulation S-T (§ 232.405 of this chapter) during the preceding 12 months (or for such shorter period that the registrant was required to submit and post such files). Yes
þ
No
o
Indicate by check mark whether the registrant is a large accelerated filer, an accelerated filer, a non-accelerated filer, a smaller reporting company, or an emerging growth company. See the definitions of “large accelerated filer,” “accelerated filer,” “smaller reporting company,” and “emerging growth company” in Rule 12b-2 of the Exchange Act.
|
Large accelerated filer
þ
|
Accelerated filer
o
|
|
Non-accelerated filer
o
(Do not check if a smaller reporting company)
|
Smaller reporting company
o
|
|
Emerging growth company
o
|
|
If an emerging growth company, indicate by check mark if the registrant has elected not to use the extended transition period for complying with any new or revised financial accounting standards provided pursuant to Section 13(a) of the Exchange Act.
o
Indicate by check mark whether the registrant is a shell company (as defined in Rule 12b-2 of the Exchange Act). Yes
o
No
þ
As of
September 30, 2017
, there were
1,158,087,567
shares of common stock of the registrant outstanding.
TABLE OF CONTENTS
|
Page
|
||
|
PART I—Financial Information
|
||
|
Item 1.
|
||
|
Note 14—Fair Value
|
||
|
Item 2.
|
||
|
Legislation and Regulation
|
||
|
Retained Mortgage Portfolio
|
||
|
Mortgage Credit Book of Business
|
||
|
Item 3.
|
||
|
Item 4.
|
||
|
PART II—Other Information
|
||
|
Item 1.
|
||
|
Item 1A.
|
||
|
Item 2.
|
||
|
Item 3.
|
||
|
Item 4.
|
||
|
Item 5.
|
||
|
Item 6.
|
||
|
Fannie Mae Third Quarter 2017 Form 10-Q
|
i
|
|
|
MD&A | Introduction
|
||
Item 2.
Management’s Discussion and Analysis of Financial Condition and Results of Operations
|
We have been under conservatorship, with the Federal Housing Finance Agency (“FHFA”) acting as conservator, since September 6, 2008. As conservator, FHFA succeeded to all rights, titles, powers and privileges of the company, and of any shareholder, officer or director of the company with respect to the company and its assets. The conservator has since delegated specified authorities to our Board of Directors and has delegated to management the authority to conduct our day-to-day operations. Our directors do not have any fiduciary duties to any person or entity except to the conservator and, accordingly, are not obligated to consider the interests of the company, the holders of our equity or debt securities or the holders of Fannie Mae MBS unless specifically directed to do so by the conservator. We describe the rights and powers of the conservator, key provisions of our agreements with the U.S. Department of the Treasury (“Treasury”), and their impact on shareholders in our annual report on Form 10-K for the year ended December 31, 2016 (“2016 Form 10-K”) in “Business—Conservatorship and Treasury Agreements.”
|
||
You should read this Management’s Discussion and Analysis of Financial
Condition and Results of Operations (“MD&A”) in conjunction with our unaudited condensed consolidated financial statements and related notes in this report and the more detailed information in our
2016
Form 10-K.
This report contains forward-looking statements that are based on management’s current expectations and are subject to significant uncertainties and changes in circumstances. Please review “Forward-Looking Statements” for more information on the
forward-looking statements in this report.
Our actual results may differ materially from those reflected in our forward-looking statements due to a variety of factors including, but not limited to, those discussed in “Risk Factors” and elsewhere in this report and in our
2016
Form 10-K.
You can find a “Glossary of Terms Used in This
Report” in the MD&A of our
2016
Form 10-K.
|
Introduction
|
||||
Fannie Mae is a government-sponsored enterprise (“GSE”) chartered by Congress. We serve as a stable source of liquidity for purchases of homes and financing of multifamily rental housing, as well as for refinancing existing mortgages. Our role in the market enables qualified borrowers to have reliable access to affordable mortgage credit, including a variety of conforming mortgage products such as the prepayable 30-year fixed-rate mortgage that protects homeowners from fluctuations in interest rates.
We provide liquidity to the mortgage market and increase the availability and affordability of housing in the United States through our two business segments—a Single-Family business, which operates in the secondary mortgage market relating to loans secured by properties containing four or fewer residential dwelling units, and a Multifamily business, which operates in the secondary mortgage market relating primarily to loans secured by properties containing five or more residential units. We support the liquidity and stability of the U.S. mortgage market primarily by securitizing mortgage loans originated by lenders into Fannie Mae mortgage-backed securities that we guarantee, which we refer to as Fannie Mae MBS. We also purchase mortgage loans and mortgage-related securities, primarily for securitization and sale at a later date. We use the term “acquire” in this report to refer to both our securitizations and our purchases of mortgage-related assets. We do not originate loans or lend money directly to consumers in the primary mortgage market.
We remain in conservatorship and our conservatorship has no specified termination date. We do not know when or how the conservatorship will terminate, what further changes to our business will be made during or following conservatorship, what form we will have and what ownership interest, if any, our current common and preferred stockholders will hold in us after the conservatorship is terminated, or whether we will continue to exist following conservatorship. In addition, as a result of our agreements with Treasury and directives from our conservator, we are not permitted to retain our net worth (other than a limited amount that will decrease to zero in the first quarter of 2018), rebuild our capital position or pay dividends or other distributions to stockholders other than Treasury. Our senior preferred stock purchase agreement with Treasury also includes covenants that significantly restrict our business activities. Congress continues to consider options for reform of the housing finance system, including the GSEs. We cannot predict the prospects for the enactment, timing or final content of housing finance
|
Fannie Mae Third Quarter 2017 Form 10-Q
|
1
|
|
|
MD&A | Introduction
|
||
reform legislation or actions the Administration or FHFA may take with respect to housing finance reform. We provide additional information on the uncertainty of our future, the conservatorship, the provisions of our agreements with Treasury, their impact on our business, and recent actions and statements relating to housing finance reform by the Administration, Congress and FHFA in “Business—Conservatorship and Treasury Agreements,” “Business—Legislation and Regulation—Housing Finance Reform” and “Risk Factors” in our
2016
Form 10-K and in “Legislation and Regulation” and “Risk Factors” in our quarterly report on Form 10-Q for the quarter ended March 31, 2017 (“First Quarter 2017 Form 10-Q”), our quarterly report on Form 10-Q for the quarter ended June 30, 2017 (“Second Quarter 2017 Form 10-Q”), and in this report.
Although Treasury owns our senior preferred stock and a warrant to purchase 79.9% of our common stock, and has made a commitment under a senior preferred stock purchase agreement to provide us with funds to maintain a positive net worth under specified conditions, the U.S. government does not guarantee our securities or other obligations.
Our common stock is traded in the over-the-counter market and quoted on the OTC Bulletin Board under the symbol “FNMA.” Our debt securities are actively traded in the over-the-counter market.
|
Executive Summary
|
||||
Summary of Our Financial Performance
Quarterly Results
We recognized comprehensive income and net income of
$3.0 billion
in the
third quarter
of
2017
. In comparison, we recognized comprehensive income of
$3.0 billion
in the
third quarter
of
2016
, consisting of net income of
$3.2 billion
, partially offset by other comprehensive loss of
$207 million
. The decrease in our net income in the
third quarter
of
2017
compared with the
third quarter
of
2016
was primarily driven by a shift to credit-related expense from credit-related income, partially offset by higher fee and other income and lower fair value losses.
Year-to-Date Results
We recognized comprehensive income of
$8.9 billion
in the
first nine months
of
2017
, consisting of net income of
$9.0 billion
, partially offset by other comprehensive loss of
$52 million
. In comparison, we recognized comprehensive income of
$6.8 billion
in the
first nine months
of
2016
, consisting of net income of
$7.3 billion
, partially offset by other comprehensive loss of
$484 million
. The increase in our net income in the
first nine months
of
2017
compared with the
first nine months
of
2016
was primarily driven by lower fair value losses and higher fee and other income, partially offset by lower credit-related income.
The table below highlights our financial results and key performance data. The performance measures shown below are discussed in later sections of MD&A. See “
Consolidated Results of Operations
” for more information on our financial results.
|
Fannie Mae Third Quarter 2017 Form 10-Q
|
2
|
|
|
MD&A | Executive Summary
|
||
Financial Results and Key Performance Data
|
Third Quarter
|
First Nine Months
|
|||
|
2017
|
2016
|
2017
|
2016
|
|
|
Comprehensive income
|
$3.0 billion
|
$3.0 billion
|
$8.9 billion
|
$6.8 billion
|
|
Net income
|
3.0 billion
|
3.2 billion
|
9.0 billion
|
7.3 billion
|
|
Net interest income
Net interest income in the third quarter and first nine months of 2017 was primarily derived from guaranty fees from our guaranty book of business and remained relatively flat compared with the third quarter and first nine months of 2016. We receive guaranty fee income as compensation for managing the credit risk on loans underlying Fannie Mae MBS held by third parties.
|
5.3 billion
|
5.4 billion
|
15.6 billion
|
15.5 billion
|
|
Fee and other income
Fee and other income in the third quarter and first nine months of 2017 was primarily the result of a settlement agreement resolving legal claims related to private-label securities we purchased.
|
1.2 billion
|
0.2 billion
|
1.8 billion
|
0.6 billion
|
|
Net fair value losses
Fair value losses in the third quarter and first nine months of 2017 were primarily due to losses on commitments to sell mortgage-related securities due to an increase in prices as interest rates decreased during the commitment periods. In addition, we recognized fair value losses on our risk management derivatives primarily attributable to declines in long-term swap rates during the periods.
Fair value losses in the third quarter of 2016 were primarily due to losses on Connecticut Avenue Securities™ (“CAS”) debt we issued prior to 2016 which, unlike CAS debt we currently issue, is reported at fair value. These losses resulted from tightening spreads between CAS debt yields and LIBOR during the periods. Fair value losses in the first nine months of 2016 were primarily due to losses on risk management derivatives resulting from decreases in the fair value of our pay-fixed derivatives due to declines in longer-term swap rates.
|
0.3 billion
|
0.5 billion
|
1.0 billion
|
5.0 billion
|
|
Credit-related income (expense)
Credit-related expense in the third quarter of 2017 was primarily driven by a provision for credit losses of approximately $1.0 billion resulting from the impact of estimated incurred losses from the hurricanes, partially offset by a benefit for credit losses driven by an increase in actual home prices and the redesignation of mortgage loans from held-for-investment (“HFI”) to held-for-sale (“HFS”). Credit-related income in the first nine months of 2017 was primarily driven by an increase in actual and forecasted home prices, and the redesignation of mortgage loans from HFI to HFS. The credit-related income was partially offset by a provision for credit losses resulting from the impact of estimated incurred losses from the hurricanes. Credit-related income in the third quarter and first nine months of 2016 was primarily attributable to an increase in home prices, including distressed property valuations. Credit-related income in the first nine months of 2016 was also attributable to a decline in actual and projected mortgage interest rates in the period. |
(0.3) billion
|
0.6 billion
|
1.1 billion
|
3.0 billion
|
|
Fannie Mae Third Quarter 2017 Form 10-Q
|
3
|
|
|
MD&A | Executive Summary
|
||
|
Third Quarter
|
First Nine Months
|
|||
|
2017
|
2016
|
2017
|
2016
|
|
|
Retained mortgage portfolio
as of period end
|
245.1 billion
|
306.5 billion
|
245.1 billion
|
306.5 billion
|
|
Single-family guaranty book of business
as of period end
|
2.9 trillion
|
2.8 trillion
|
2.9 trillion
|
2.8 trillion
|
|
Net worth
as of period end
|
3.6 billion
|
4.2 billion
|
3.6 billion
|
4.2 billion
|
|
Capital reserve amount
applicable to quarterly dividend payment to Treasury
|
600 million
|
1.2 billion
|
600 million
|
1.2 billion
|
|
Dividends paid to Treasury
in the period
|
3.1 billion
|
2.9 billion
|
11.4 billion
|
6.7 billion
|
Impact of Hurricanes Harvey, Irma and Maria.
As of September 30, 2017, our allowance for loan losses of
$20.2 billion
includes an estimate of incurred credit losses from Hurricanes Harvey, Irma and Maria (collectively, the “hurricanes”) of approximately
$1.0 billion
. Approximately
80
% of the estimate relates to our single-family mortgage loans in Puerto Rico which, as of September 30, 2017, had an unpaid principal balance of
$8.9 billion
. See “
Critical Accounting Policies and Estimates
” for further information.
Future Volatility.
We expect volatility from period to period in our financial results from a number of factors, particularly changes in market conditions that result in fluctuations in the estimated fair value of the financial instruments that we mark to market through our earnings. These instruments include derivatives and certain securities whose estimated fair value may fluctuate substantially from period to period because of changes in interest rates, the yield curve, mortgage and credit spreads, and implied volatility, as well as activity related to these financial instruments. We use derivatives to manage the interest rate risk exposure of our net portfolio, which consists of our retained mortgage portfolio, other investments portfolio, and outstanding debt of Fannie Mae. Some of these financial instruments in our net portfolio are not recorded at fair value in our condensed consolidated financial statements, and as a result we may experience accounting gains or losses due to changes in interest rates or other market conditions that may not be indicative of the economic interest rate risk exposure of our net portfolio. See “
Risk Management
—
Market Risk Management, Including Interest Rate Risk Management
” for more information. In addition, our credit-related income or expense can vary substantially from period to period based on a number of factors such as changes in actual and expected home prices, fluctuations in interest rates, borrower payment behavior, the types and volume of our loss mitigation activities, the volume of foreclosures completed, the impact of natural disasters, and redesignations of loans from HFI to HFS.
Our Strategy and Business Objectives
Our vision is to be America’s most valued housing partner and to provide liquidity, access to credit and affordability in all U.S. housing markets at all times, while effectively managing and reducing risk to our business, taxpayers and the housing finance system. In support of this vision, we are focused on:
|
•
|
advancing a sustainable and reliable business model that reduces risk to the housing finance system and taxpayers;
|
|
•
|
providing reliable, large-scale access to affordable mortgage credit for qualified borrowers and helping struggling homeowners; and
|
|
•
|
serving customer needs by building a company that is efficient, innovative and continuously improving.
|
Advancing a sustainable and reliable business model that reduces risk to the housing finance system and taxpayers
We have significantly changed our business model since we entered conservatorship in 2008 and our business continues to evolve. We have strengthened our underwriting and eligibility standards and transitioned from a portfolio-focused business to a guaranty-focused business. In addition, we are transferring an increasing portion of the credit risk on our guaranty book of business. These changes have transformed our business model and reduced certain risks of our business as compared with our business prior to entering conservatorship.
Our business also continues to evolve as a result of our many other efforts to build a safer and sustainable housing finance system and to pursue the strategic goals identified by our conservator. See “Business—Legislation and Regulation—Housing Finance Reform—Conservator Developments and Strategic Goals” in our
2016
Form 10-K for a discussion of some of these efforts and FHFA’s strategic goals for our conservatorship.
|
Fannie Mae Third Quarter 2017 Form 10-Q
|
4
|
|
|
MD&A | Executive Summary
|
||
Stronger underwriting and eligibility standards
We strengthened our underwriting and eligibility standards for loans we acquired beginning in late 2008 and 2009. These changes improved the credit quality of our single-family guaranty book of business and contributed to improvement in our credit performance.
As of September 30, 2017
,
90%
of our single-family conventional guaranty book of business consisted of loans acquired since 2009. Our single-family serious delinquency rate has declined or remained flat each quarter since the first quarter of 2010 and was
1.01%
as of September 30, 2017
.
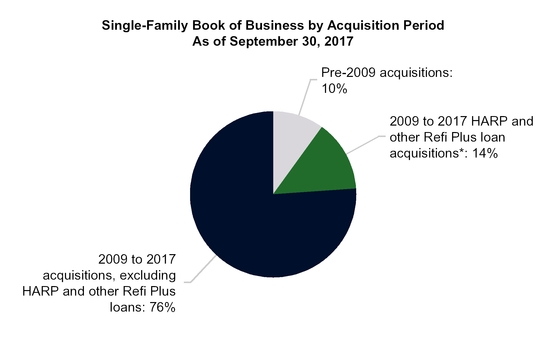
__________
|
*
|
We have acquired HARP loans and other Refi Plus loans under our Refi Plus
TM
initiative since 2009. Our Refi Plus initiative offers refinancing flexibility to eligible borrowers who are current on their loans and whose loans are owned or guaranteed by us and meet certain additional criteria. HARP loans, which have loan-to-value (“LTV”) ratios at origination greater than 80%, refers to loans we have acquired pursuant to the Home Affordable Refinance Program
®
(“HARP
®
”). Other Refi Plus loans, which have LTV ratios at origination of 80% or less, refers to loans we have acquired under our Refi Plus initiative other than HARP loans. Loans we acquire under Refi Plus and HARP are refinancings of loans that were originated prior to June 2009.
|
See “Business Segments—Single-Family Business” for information on our recent single-family acquisitions and the credit performance of our single-family mortgage loans.
Transition to a guaranty-focused business
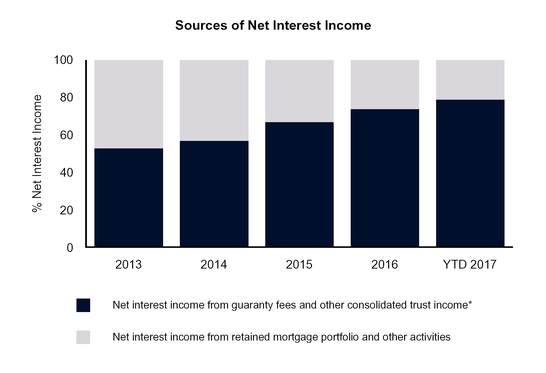
We have two primary sources of revenues: (1) the guaranty fees we receive for managing the credit risk on loans underlying Fannie Mae MBS held by third parties; and (2) the difference between interest income earned on the assets in our retained mortgage portfolio and the interest expense associated with the debt that funds those assets. Our retained mortgage portfolio refers to the mortgage-related assets we own (which excludes the portion of assets held by consolidated MBS trusts that back mortgage-related securities owned by third parties).
As shown in the chart below, in recent years an increasing portion of our net interest income has been derived from guaranty fees, rather than from our retained mortgage portfolio assets. This shift has been driven by both the guaranty fee increases we implemented in 2012 and the reduction of our retained mortgage portfolio. More than 75% of our net interest income for the
first nine months
of
2017
was derived from the loans underlying our Fannie Mae MBS in consolidated trusts, which primarily generate income through guaranty fees.
|
Fannie Mae Third Quarter 2017 Form 10-Q
|
5
|
|
|
MD&A | Executive Summary
|
||
__________
|
*
|
Guaranty fee income reflects the impact of a 10 basis point guaranty fee increase implemented in 2012 pursuant to the Temporary Payroll Tax Cut Continuation Act of 2011, the incremental revenue from which is remitted to Treasury and not retained by us.
|
Transferring a portion of the mortgage credit risk on our single-family book of business
In late 2013, we began entering into credit risk transfer transactions with the goal of transferring, to the extent economically sensible, a portion of the mortgage credit risk on some of the recently acquired loans in our single-family book of business in order to reduce the economic risk to us and to taxpayers of future borrower defaults. Our primary method of achieving this objective has been through our CAS and Credit Insurance Risk Transfer
TM
(“CIRT
TM
”) transactions. In these transactions, we transfer to investors a portion of the mortgage credit risk associated with losses on a reference pool of mortgage loans and in exchange we pay investors a premium that effectively reduces the guaranty fee income we retain on the loans.
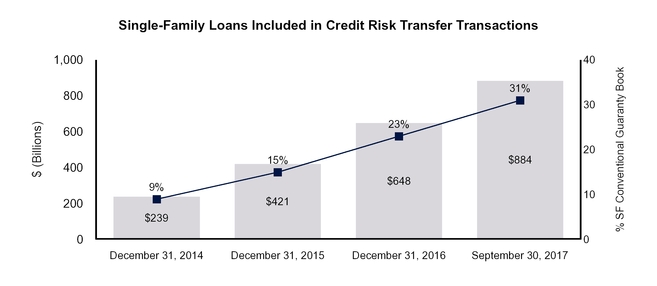
As of September 30, 2017
,
$884 billion
in outstanding unpaid principal balance of our single-family loans, or
31%
of the loans in our single-family conventional guaranty book of business measured by unpaid principal balance, were included in a reference pool for a credit risk transfer transaction. Over time, we expect that a larger portion of our single-family conventional guaranty book of business will be covered by credit risk transfer transactions.
The chart below shows as of the dates specified the total outstanding unpaid principal balance of our single-family loans, as well as the percentage of our total single-family conventional guaranty book of business measured by unpaid principal balance, that were included in a reference pool for a credit risk transfer transaction.
|
Fannie Mae Third Quarter 2017 Form 10-Q
|
6
|
|
|
MD&A | Executive Summary
|
||
The risk in force of these transactions, which refers to the maximum amount of losses that could be absorbed by credit risk transfer investors, was approximately
$28 billion
as of September 30, 2017
. For further discussion of our credit risk transfer transactions, including more detailed information on the portion of the credit risk of these loans we have transferred, see “Business Segments—Single-Family Business—Single-Family Mortgage Credit Risk Management—Transfer of Mortgage Credit Risk: Single-Family Credit Risk Transfer Transactions.”
Providing reliable, large-scale access to affordable mortgage credit for qualified borrowers and helping struggling homeowners
We continued to provide reliable, large-scale access to affordable mortgage credit to the U.S. housing market and to help struggling homeowners in the
third quarter
of
2017
:
|
•
|
We provided approximately
$150 billion
in liquidity to the mortgage market in the
third quarter
of
2017
through our purchases of loans and guarantees of loans and securities. This liquidity enabled borrowers to complete approximately
229,000
mortgage refinancings and approximately
358,000
home purchases, and provided financing for approximately
189,000
units of multifamily housing.
|
|
•
|
We provided approximately
23,500
loan workouts in the
third quarter
of
2017
to help homeowners stay in their homes or otherwise avoid foreclosure.
|
|
•
|
We helped borrowers refinance loans, including through our Refi Plus
TM
initiative, which offers refinancing flexibility to eligible borrowers who are current on their loans, whose loans are owned or guaranteed by us and who meet certain additional criteria. We acquired approximately
17,800
Refi Plus loans in the
third quarter
of
2017
. Refinancings delivered to us through Refi Plus in the
third quarter
of
2017
reduced borrowers’ monthly mortgage payments by an average of
$182
.
|
|
•
|
We support affordability in the multifamily rental market. Supporting affordability has become more challenging as rent growth has generally outpaced wage growth in recent years, making units at many income levels less affordable than in prior years. Approximately
90%
of the multifamily units we financed in the
third quarter
of
2017
were affordable to families earning at or below 120% of the median income in their area, providing support for both workforce housing and affordable housing.
|
Serving customer needs by building a company that is efficient, innovative and continuously improving
We are committed to providing our lender customers with the products, services and tools they need to serve the housing market more effectively and efficiently, as well as continuing to improve our business processes. See “Business—Executive Summary—Our Strategy and Business Objectives” in our
2016
Form 10-K for information on changes we have made to help our customers originate mortgages with increased certainty and efficiency, and lower costs.
|
Fannie Mae Third Quarter 2017 Form 10-Q
|
7
|
|
|
MD&A | Executive Summary
|
||
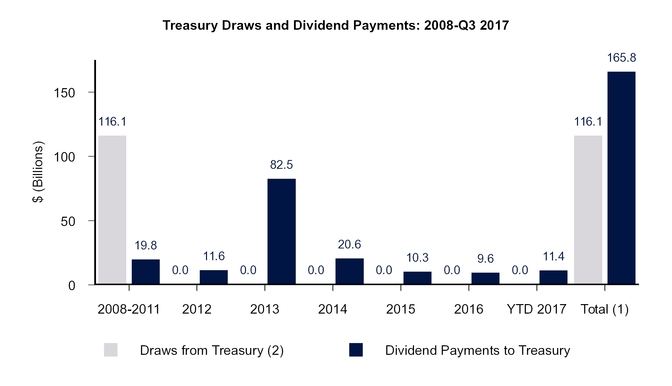
Treasury Draws and Dividend Payments
Treasury has made a commitment under a senior preferred stock purchase agreement to provide funding to us under certain circumstances if we have a net worth deficit. Acting as successor to the rights, titles, powers and privileges of the Board, the conservator has declared and directed us to pay dividends to Treasury on the senior preferred stock on a quarterly basis since we entered into conservatorship in 2008.
The chart below shows the funds we have drawn from Treasury pursuant to the senior preferred stock purchase agreement, as well as the dividend payments we have made to Treasury on the senior preferred stock, since entering into conservatorship.
__________
|
(1)
|
Under the terms of the senior preferred stock purchase agreement, dividend payments we make to Treasury do not offset our prior draws of funds from Treasury, and we are not permitted to pay down draws we have made under the agreement except in limited circumstances. Accordingly, the current aggregate liquidation preference of the senior preferred stock is
$117.1 billion
, due to the initial
$1.0 billion
liquidation preference of the senior preferred stock (for which we did not receive cash proceeds) and the
$116.1 billion
we have drawn from Treasury. Amounts may not sum due to rounding.
|
|
(2)
|
Treasury draws are shown in the period for which requested, not when the funds were received by us. We have not requested a draw for any period since 2012.
|
The dividend provisions of the senior preferred stock provide for quarterly dividends consisting of the amount, if any, by which our net worth as of the end of the immediately preceding fiscal quarter exceeds an applicable capital reserve amount. This capital reserve amount is
$600 million
for each quarter of
2017
and will decrease to zero in the first quarter of 2018. These are referred to as “net worth sweep” dividend provisions. As a result of these provisions, we will pay Treasury a dividend of
$3.0 billion
for the
fourth quarter
of
2017
by
December 31, 2017
, calculated based on our net worth of
$3.6 billion
as of September 30, 2017
, less the current capital reserve amount of
$600 million
, if our conservator declares a dividend in this amount before
December 31, 2017
. To the extent that these quarterly dividends are not paid, they will accumulate and be added to the liquidation preference of the senior preferred stock. This would not affect the amount of available funding from Treasury under the senior preferred stock purchase agreement.
If we experience a net worth deficit in a future quarter, we will be required to draw additional funds from Treasury under the senior preferred stock purchase agreement in order to avoid being placed into receivership. As of the date of this filing, the maximum amount of remaining funding under the agreement is
$117.6 billion
. If we were to draw additional funds from Treasury under the agreement in a future period, the amount of remaining funding
|
Fannie Mae Third Quarter 2017 Form 10-Q
|
8
|
|
|
MD&A | Executive Summary
|
||
under the agreement would be reduced by the amount of our draw. Dividend payments we make to Treasury do not restore or increase the amount of funding available to us under the agreement. For a description of the terms of the senior preferred stock purchase agreement and the senior preferred stock, see “Business—Conservatorship and Treasury Agreements—Treasury Agreements” in our
2016
Form 10-K. See “Risk Factors” in our
2016
Form 10-K for a discussion of the risks associated with our limited and declining capital reserves, and “Outlook” in this report for our current expectations about our future financial results.
In May 2017, the Director of FHFA testified before the U.S. Senate Committee on Banking, Housing and Urban Affairs that a draw by Fannie Mae or Freddie Mac could erode investor confidence, which could affect liquidity and increase the cost of mortgage credit for borrowers. To avoid a draw, the Director indicated that FHFA has the authority to withhold dividend payments without the consent of Treasury, but that his first option would be to work with the Secretary of the Treasury. He further stated that any action FHFA may take to avoid additional draws would not be intended to influence the outcome of housing finance reform or as a step toward “recap and release,” which refers to proposals by some investors to recapitalize Fannie Mae and Freddie Mac with private capital and release them from conservatorship. The Secretary of the Treasury testified before the same committee later that month and stated that it was Treasury’s expectation that dividends should be paid per the terms of the senior preferred stock purchase agreement.
As described in “Legal Proceedings” and “
Note 15, Commitments and Contingencies
,” several lawsuits have been filed by preferred and common stockholders of Fannie Mae and Freddie Mac against one or more of the United States, Treasury and FHFA challenging actions taken by the defendants relating to the senior preferred stock purchase agreements and the conservatorships of Fannie Mae and Freddie Mac, including challenges to the net worth sweep dividend provisions of the senior preferred stock. We are also a party to some of those lawsuits. We cannot predict the outcome of the lawsuits that remain pending, or the actions the U.S. government (including Treasury or FHFA) may take in response to any ruling or finding in any of these lawsuits.
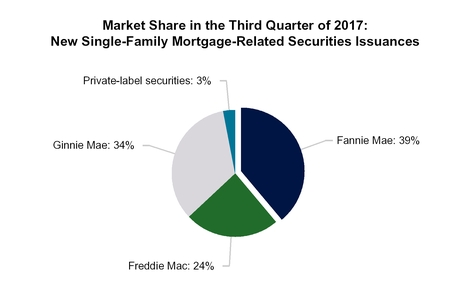
2017
Market Share
We were the largest issuer of single-family mortgage-related securities in the secondary market in the
third quarter
of
2017
. Our estimated market share of new single-family mortgage-related securities issuances was
39%
in both the
second quarter
and
third quarter
of
2017
, compared with
38%
in the
third quarter
of
2016
. The chart below shows our market share of single-family mortgage-related securities issuances in the
third quarter
of
2017
compared with that of our primary competitors.
We remained a continuous source of liquidity in the multifamily market in the
third quarter
of
2017
. We owned or guaranteed approximately
20%
of the outstanding debt on multifamily properties as of
June 30, 2017
(the latest date for which information is available).
|
Fannie Mae Third Quarter 2017 Form 10-Q
|
9
|
|
|
MD&A | Executive Summary
|
||
Outlook
In this section, we present a number of estimates and expectations regarding our future performance, as well as future home prices. These estimates and expectations are forward-looking statements based on our current assumptions regarding numerous factors. See “Forward-Looking Statements” and “Risk Factors” in this report and in our
2016
Form 10-K for discussions of factors that could cause actual results to differ materially from our current estimates and expectations. Due to the large size of our guaranty book of business, even small changes in these factors could have a significant impact on our financial results for a particular period.
Financial Results.
We continued to be profitable in the
third quarter
of
2017
, with net income of
$3.0 billion
. We expect to remain profitable on an annual basis for the foreseeable future; however, certain factors, such as changes in interest rates or home prices, could result in significant volatility in our financial results from quarter to quarter or year to year. Our future financial results also will be affected by a number of other factors, including: our guaranty fee rates; the volume of single-family mortgage originations in the future; the size, composition and quality of our retained mortgage portfolio and guaranty book of business; and economic and housing market conditions. Although we expect to remain profitable on an annual basis for the foreseeable future, due to our limited and declining capital reserves (which decrease to zero in the first quarter of 2018) and the potential for significant volatility in our financial results, we could experience a net worth deficit in a future quarter. If we experience a net worth deficit in a future quarter, we will be required to draw additional funds from Treasury under the senior preferred stock purchase agreement to avoid being placed into receivership.
Our expectations for our future financial results do not take into account the impact on our business of potential future legislative or regulatory changes, which could have a material impact on our financial results, particularly the enactment of housing finance reform legislation, corporate income tax reform legislation and changes in accounting standards. For example, the current Administration proposes reducing the U.S. corporate income tax rate. Under applicable accounting standards, a significant reduction in the U.S. corporate income tax rate would require that we record a substantial reduction in the value of our deferred tax assets in the quarter in which the legislation is enacted. Thus, if legislation significantly lowering the U.S. corporate income tax rate is enacted, we expect to incur a significant net loss and net worth deficit for the quarter in which the legislation is enacted and we could potentially incur a net loss for that year. As noted above, if we experience a net worth deficit in a future quarter, we will be required to draw additional funds from Treasury under the senior preferred stock purchase agreement in order to avoid being placed into receivership.
See “Risk Factors” in our
2016
Form 10-K and in this report for discussions of the risks associated with our limited and declining capital reserves and the potential impact of legislative and regulatory actions.
Revenues.
We have two primary sources of revenues: (1) the guaranty fees we receive for managing the credit risk on loans underlying Fannie Mae MBS held by third parties; and (2) the difference between interest income earned on the assets in our retained mortgage portfolio and the interest expense associated with the debt that funds those assets.
Our guaranty fee revenues consist of two primary components: (1) the base guaranty fees that we receive over the life of the loan; and (2) upfront fees we receive at loan acquisition which are amortized over the contractual life of the loan. When mortgage loans prepay faster due to a lower interest rate environment, we typically have higher amortization income. Conversely, when mortgage loans prepay more slowly due to a higher interest rate environment, we typically have lower amortization income. Our guaranty fee revenues increased in recent years primarily driven by: (1) loans with higher base guaranty fees comprising a larger part of our guaranty book of business; and (2) an increase in amortization income as a lower interest rate environment during portions of these years increased prepayments on mortgage loans. We expect loans with lower guaranty fees to continue to liquidate from our book of business and be replaced with new loans that typically have higher guaranty fees, which will contribute to increasing guaranty fee revenues. However, the impact of this trend on our guaranty fee revenues could be more than offset by lower amortization income if mortgage loans prepay more slowly due to a higher interest rate environment.
We expect the size of our retained mortgage portfolio to continue to decrease in 2017, which will continue to negatively impact our net interest income and net revenues.
Factors that may affect our future revenues include: changes to guaranty fee pricing we may make in the future and their impact on our competitive environment and guaranty fee revenues; economic and housing market conditions, including changes in interest rates and home prices; the size, composition and quality of our guaranty
|
Fannie Mae Third Quarter 2017 Form 10-Q
|
10
|
|
|
MD&A | Executive Summary
|
||
book of business; the life of the loans in our guaranty book of business; the size, composition and quality of our retained mortgage portfolio; our market share; and legislative and regulatory changes.
Home Prices.
Based on our home price index, we estimate that home prices on a national basis increased by
1.1%
in the
third quarter
of
2017
and by
5.3%
in the
first nine months
of
2017
. We expect the rate of home price appreciation on a national basis in
2017
will be similar to the estimated
5.7%
rate in
2016
. We also expect significant regional variation in the timing and rate of home price growth.
Credit Losses.
Our credit losses, which include our charge-offs, net of recoveries, reflect our realization of losses on our loans. Our credit losses were
$2.4 billion
for the
first nine months
of
2017
, down from
$3.0 billion
for the
first nine months
of
2016
. We expect our credit losses for
2017
to be lower than for
2016
; however, we expect a significantly smaller decline in credit losses for
2017
than the
$7.0 billion
decline for
2016
. See “
Consolidated Results of Operations
—
Credit-Related Income (Expense)
—
Credit Loss Performance Metrics
” for a discussion of our credit losses for the
third quarter
and
first nine months
of
2017
and
2016
.
Loss Reserves.
Our allowance for loan losses was
$20.2 billion
as of September 30, 2017
, down from
$23.5 billion
as of
December 31, 2016
. Our loss reserves declined in recent years and are expected to decline further in
2017
. For more information on the factors that contributed to changes in our loss reserves in the
third quarter
and
first nine months
of
2017
, see “
Consolidated Results of Operations
—
Credit-Related Income (Expense)
,” “Consolidated Balance Sheet Analysis—Mortgage Loans and Allowance for Loan Losses” and “
Critical Accounting Policies and Estimates
.”
|
Legislation and Regulation
|
||||
The information in this section updates and supplements information regarding legislation and regulation affecting our business set forth in “Business—Legislation and Regulation” in our
2016
Form 10-K and in “MD&A—Legislation and Regulation” in our First Quarter 2017 Form 10-Q and in our Second Quarter 2017 Form 10-Q. Also see “Risk Factors” in this report and in our
2016
Form 10-K for discussions of risks relating to legislative and regulatory matters.
Housing Finance Reform
Congress continues to consider housing finance reform that could result in significant changes in our structure and role in the future. As a result, there continues to be significant uncertainty regarding the future of our company. See “Risk Factors” for a discussion of the risks to our business relating to the uncertain future of our company.
The Future of LIBOR and Alternative Reference Rates
On July 27, 2017, the United Kingdom’s Financial Conduct Authority, which regulates LIBOR, announced its intention to stop persuading or compelling the group of major banks that sustains LIBOR to submit rate quotations after 2021. As a result, it is uncertain whether LIBOR will continue to be quoted after 2021. The Federal Reserve convened a group of private-market participants, known as the Alternative Reference Rate Committee, to identify a set of alternative U.S. dollar reference interest rates and an adoption plan for those alternative rates. In June 2017 that committee recommended an alternative reference rate which the Federal Reserve Bank of New York would publish that, in the consensus view of the Alternative Reference Rate Committee, would be its preferred alternative reference rate. At this time, it is not possible to predict the effect of these developments. Because we routinely engage in transactions involving financial instruments that reference LIBOR, these developments could have a material impact on us.
2016 Housing Goals Performance
We are subject to housing goals, which establish specified requirements for our mortgage acquisitions relating to affordability or location. Our single-family performance is measured against the lower of benchmarks established by FHFA or goals-qualifying originations in the primary mortgage market. Multifamily goals are established as a number of units to be financed.
In October 2017, after the release of data reported under the Home Mortgage Disclosure Act, FHFA notified us that it had preliminarily determined that we met three of our five single-family housing goals and all of our multifamily housing goals for 2016. For the single-family very low-income families home purchase goal, FHFA
|
Fannie Mae Third Quarter 2017 Form 10-Q
|
11
|
|
|
MD&A | Legislation and Regulation
|
||
preliminarily determined that our performance was 5.2% of our 2016 acquisitions of single-family owner-occupied purchase money mortgage loans, which failed to meet the FHFA-established benchmark of 6% or the overall market level of 5.4% for 2016. For the single-family low-income families refinancing goal, FHFA preliminarily determined that our performance was 19.5% of our 2016 acquisitions of single-family owner-occupied refinance mortgage loans, which failed to meet the FHFA-established benchmark of 21% or the overall market level of 19.8% for 2016.
If FHFA’s final determination is that we did not meet these housing goals, it will determine whether the goals were feasible. If FHFA finds that these goals were feasible, we may become subject to a housing plan that could require us to take additional steps, which may increase our credit losses and credit-related expenses. The housing plan must describe the actions we would take to meet the goal in the next calendar year and be approved by FHFA. The potential penalties for failure to comply with housing plan requirements include a cease-and-desist order and civil money penalties.
See “Business—Legislation and Regulation—GSE Act and Other Regulation of Our Business—Housing Goals” in our 2016 Form 10-K for a more detailed discussion of our housing goals.
|
Consolidated Results of Operations
|
||||
This section provides a discussion of our condensed consolidated results of operations and should be read together with our condensed consolidated financial statements, including the accompanying notes.
|
Table 1: Summary of Condensed Consolidated Results of Operations
|
|||||||||||||||||||||||
|
For the Three Months
|
For the Nine Months
|
||||||||||||||||||||||
|
Ended September 30,
|
Ended September 30,
|
||||||||||||||||||||||
|
2017
|
2016
|
Variance
|
2017
|
2016
|
Variance
|
||||||||||||||||||
|
(Dollars in millions)
|
|||||||||||||||||||||||
|
Net interest income
|
$
|
5,274
|
|
$
|
5,435
|
|
$
|
(161
|
)
|
$
|
15,622
|
|
$
|
15,490
|
|
$
|
132
|
|
|||||
|
Fee and other income
|
1,194
|
|
175
|
|
1,019
|
|
1,796
|
|
552
|
|
1,244
|
|
|||||||||||
|
Net revenues
|
6,468
|
|
5,610
|
|
858
|
|
17,418
|
|
16,042
|
|
1,376
|
|
|||||||||||
|
Investment gains, net
|
313
|
|
467
|
|
(154
|
)
|
689
|
|
934
|
|
(245
|
)
|
|||||||||||
|
Fair value losses, net
|
(289
|
)
|
(491
|
)
|
202
|
|
(1,020
|
)
|
(4,971
|
)
|
3,951
|
|
|||||||||||
|
Administrative expenses
|
(664
|
)
|
(661
|
)
|
(3
|
)
|
(2,034
|
)
|
(2,027
|
)
|
(7
|
)
|
|||||||||||
|
Credit-related income (expense):
|
|||||||||||||||||||||||
|
Benefit (provision) for credit losses
|
(182
|
)
|
673
|
|
(855
|
)
|
1,481
|
|
3,458
|
|
(1,977
|
)
|
|||||||||||
|
Foreclosed property expense
|
(140
|
)
|
(110
|
)
|
(30
|
)
|
(391
|
)
|
(507
|
)
|
116
|
|
|||||||||||
|
Total credit-related income (expense)
|
(322
|
)
|
563
|
|
(885
|
)
|
1,090
|
|
2,951
|
|
(1,861
|
)
|
|||||||||||
|
Temporary Payroll Tax Cut Continuation Act of 2011 (“TCCA”) fees
|
(531
|
)
|
(465
|
)
|
(66
|
)
|
(1,552
|
)
|
(1,358
|
)
|
(194
|
)
|
|||||||||||
|
Other expenses, net
|
(427
|
)
|
(300
|
)
|
(127
|
)
|
(1,100
|
)
|
(818
|
)
|
(282
|
)
|
|||||||||||
|
Income before federal income taxes
|
4,548
|
|
4,723
|
|
(175
|
)
|
13,491
|
|
10,753
|
|
2,738
|
|
|||||||||||
|
Provision for federal income taxes
|
(1,525
|
)
|
(1,527
|
)
|
2
|
|
(4,495
|
)
|
(3,475
|
)
|
(1,020
|
)
|
|||||||||||
|
Net income
|
$
|
3,023
|
|
$
|
3,196
|
|
$
|
(173
|
)
|
$
|
8,996
|
|
$
|
7,278
|
|
$
|
1,718
|
|
|||||
|
Total comprehensive income
|
$
|
3,048
|
|
$
|
2,989
|
|
$
|
59
|
|
$
|
8,944
|
|
$
|
6,794
|
|
$
|
2,150
|
|
|||||
Net Interest Income
We have two primary sources of net interest income:
|
•
|
the guaranty fees we receive for managing the credit risk on loans underlying Fannie Mae MBS held by third parties; and
|
|
•
|
the difference between interest income earned on the assets in our retained mortgage portfolio and the interest expense associated with the debt that funds those assets.
|
Guaranty fees consist of two primary components:
|
•
|
base guaranty fees that we receive over the life of the loan; and
|
|
Fannie Mae Third Quarter 2017 Form 10-Q
|
12
|
|
|
MD&A | Consolidated Results of Operations
|
||
|
•
|
upfront fees that we receive at the time of loan acquisition, primarily related to single-family loan level pricing adjustments and other fees we receive from lenders, which are amortized over the contractual life of the loan.
|
Guaranty fees include revenues generated by the 10 basis point increase in guaranty fees we implemented in 2012 pursuant to the TCCA, the incremental revenue from which is remitted to Treasury and not retained by us. We recognize almost all of our guaranty fee revenue in net interest income due to the consolidation of the substantial majority of loans underlying our Fannie Mae MBS in consolidated trusts on our balance sheet. Those guaranty fees are the primary component of the difference between the interest income on loans in consolidated trusts and the interest expense on the debt of consolidated trusts.
Table 2
displays an analysis of our net interest income, average balances, and related yields earned on assets and incurred on liabilities. For most components of the average balances, we use a daily weighted average of amortized cost. When daily average balance information is not available, such as for mortgage loans, we use monthly averages.
Table 3
displays the change in our net interest income between periods and the extent to which that variance is attributable to: (1) changes in the volume of our interest-earning assets and interest-bearing liabilities or (2) changes in the interest rates of these assets and liabilities.
|
Table 2: Analysis of Net Interest Income and Yield
|
|||||||||||||||||||||
|
For the Three Months Ended September 30,
|
|||||||||||||||||||||
|
2017
|
2016
|
||||||||||||||||||||
|
Average
Balance |
Interest
Income/ Expense |
Average
Rates Earned/Paid |
Average
Balance |
Interest
Income/ Expense |
Average
Rates Earned/Paid |
||||||||||||||||
|
(Dollars in millions)
|
|||||||||||||||||||||
|
Interest-earning assets:
|
|||||||||||||||||||||
|
Mortgage loans of Fannie Mae
|
$
|
181,445
|
|
$
|
1,879
|
|
4.14
|
%
|
$
|
226,334
|
|
$
|
2,357
|
|
4.17
|
%
|
|||||
|
Mortgage loans of consolidated trusts
|
2,979,153
|
|
25,168
|
|
3.38
|
|
2,837,241
|
|
23,254
|
|
3.28
|
|
|||||||||
|
Total mortgage loans
(1)
|
3,160,598
|
|
27,047
|
|
3.42
|
|
3,063,575
|
|
25,611
|
|
3.34
|
|
|||||||||
|
Mortgage-related securities, net
|
12,132
|
|
99
|
|
3.30
|
|
19,258
|
|
203
|
|
4.22
|
|
|||||||||
|
Non-mortgage-related securities
(2)
|
57,880
|
|
173
|
|
1.17
|
|
57,013
|
|
71
|
|
0.49
|
|
|||||||||
|
Other
(3)
|
41,728
|
|
142
|
|
1.33
|
|
35,731
|
|
66
|
|
0.72
|
|
|||||||||
|
Total interest-earning assets
|
$
|
3,272,338
|
|
$
|
27,461
|
|
3.36
|
%
|
$
|
3,175,577
|
|
$
|
25,951
|
|
3.27
|
%
|
|||||
|
Interest-bearing liabilities:
|
|||||||||||||||||||||
|
Short-term funding debt
|
$
|
27,967
|
|
$
|
71
|
|
0.99
|
%
|
$
|
50,579
|
|
$
|
55
|
|
0.43
|
%
|
|||||
|
Long-term funding debt
|
268,312
|
|
1,506
|
|
2.25
|
|
302,629
|
|
1,647
|
|
2.18
|
|
|||||||||
|
Total funding debt
|
296,279
|
|
1,577
|
|
2.13
|
|
353,208
|
|
1,702
|
|
1.93
|
|
|||||||||
|
Debt securities of consolidated trusts held by third parties
|
2,984,811
|
|
20,610
|
|
2.76
|
|
2,839,871
|
|
18,814
|
|
2.65
|
|
|||||||||
|
Total interest-bearing liabilities
|
$
|
3,281,090
|
|
$
|
22,187
|
|
2.70
|
%
|
$
|
3,193,079
|
|
$
|
20,516
|
|
2.57
|
%
|
|||||
|
Net interest income/net interest yield
|
$
|
5,274
|
|
0.64
|
%
|
$
|
5,435
|
|
0.68
|
%
|
|||||||||||
|
Fannie Mae Third Quarter 2017 Form 10-Q
|
13
|
|
|
MD&A | Consolidated Results of Operations
|
||
|
For the Nine Months Ended September 30,
|
|||||||||||||||||||||
|
2017
|
2016
|
||||||||||||||||||||
|
Average
Balance |
Interest
Income/ Expense |
Average
Rates Earned/Paid |
Average
Balance |
Interest
Income/ Expense |
Average
Rates Earned/Paid |
||||||||||||||||
|
(Dollars in millions)
|
|||||||||||||||||||||
|
Interest-earning assets:
|
|||||||||||||||||||||
|
Mortgage loans of Fannie Mae
|
$
|
190,552
|
|
$
|
5,950
|
|
4.16
|
%
|
$
|
232,222
|
|
$
|
7,082
|
|
4.07
|
%
|
|||||
|
Mortgage loans of consolidated trusts
|
2,951,478
|
|
75,155
|
|
3.40
|
|
2,826,405
|
|
71,746
|
|
3.38
|
|
|||||||||
|
Total mortgage loans
(1)
|
3,142,030
|
|
81,105
|
|
3.44
|
|
3,058,627
|
|
78,828
|
|
3.44
|
|
|||||||||
|
Mortgage-related securities, net
|
13,796
|
|
368
|
|
3.55
|
|
22,966
|
|
713
|
|
4.14
|
|
|||||||||
|
Non-mortgage-related securities
(2)
|
56,145
|
|
414
|
|
0.97
|
|
53,509
|
|
182
|
|
0.45
|
|
|||||||||
|
Other
(3)
|
42,705
|
|
351
|
|
1.08
|
|
30,104
|
|
160
|
|
0.70
|
|
|||||||||
|
Total interest-earning assets
|
$
|
3,254,676
|
|
$
|
82,238
|
|
3.37
|
%
|
$
|
3,165,206
|
|
$
|
79,883
|
|
3.36
|
%
|
|||||
|
Interest-bearing liabilities:
|
|||||||||||||||||||||
|
Short-term funding debt
|
$
|
30,231
|
|
$
|
170
|
|
0.74
|
%
|
$
|
55,580
|
|
$
|
161
|
|
0.38
|
%
|
|||||
|
Long-term funding debt
|
280,030
|
|
4,821
|
|
2.30
|
|
308,349
|
|
5,237
|
|
2.26
|
|
|||||||||
|
Total funding debt
|
310,261
|
|
4,991
|
|
2.14
|
|
363,929
|
|
5,398
|
|
1.98
|
|
|||||||||
|
Debt securities of consolidated trusts held by third parties
|
2,953,203
|
|
61,625
|
|
2.78
|
|
2,819,775
|
|
58,995
|
|
2.79
|
|
|||||||||
|
Total interest-bearing liabilities
|
$
|
3,263,464
|
|
$
|
66,616
|
|
2.72
|
%
|
$
|
3,183,704
|
|
$
|
64,393
|
|
2.70
|
%
|
|||||
|
Net interest income/net interest yield
|
$
|
15,622
|
|
0.64
|
%
|
$
|
15,490
|
|
0.65
|
%
|
|||||||||||
|
As of September 30,
|
|||||
|
2017
|
2016
|
||||
|
Selected benchmark interest rates
|
|||||
|
3-month LIBOR
|
1.33
|
%
|
0.85
|
%
|
|
|
2-year swap rate
|
1.74
|
|
1.01
|
|
|
|
5-year swap rate
|
2.00
|
|
1.18
|
|
|
|
10-year swap rate
|
2.29
|
|
1.46
|
|
|
|
30-year Fannie Mae MBS par coupon rate
|
2.97
|
|
2.36
|
|
|
__________
|
(1)
|
Average balance includes mortgage loans on nonaccrual status. Typically, interest income on nonaccrual mortgage loans is recognized when cash is received. Interest income not recognized for loans on nonaccrual status was
$209 million
and
$611 million
, respectively, for the
third quarter
and
first nine months
of
2017
, compared with
$318 million
and
$977 million
, respectively, for the
third quarter
and
first nine months
of
2016
.
|
|
(2)
|
Includes cash equivalents.
|
|
(3)
|
Consists of federal funds sold and securities purchased under agreements to resell or similar arrangements and advances to lenders.
|
|
Fannie Mae Third Quarter 2017 Form 10-Q
|
14
|
|
|
MD&A | Consolidated Results of Operations
|
||
|
Table 3: Rate/Volume Analysis of Changes in Net Interest Income
|
|||||||||||||||||||||||
|
|
For the Three Months Ended
|
For the Nine Months Ended
|
|||||||||||||||||||||
|
|
September 30, 2017 vs. 2016
|
September 30, 2017 vs. 2016
|
|||||||||||||||||||||
|
|
Total Variance
|
Variance Due to:
(1)
|
Total Variance
|
Variance Due to:
(1)
|
|||||||||||||||||||
|
|
Volume
|
Rate
|
Volume
|
Rate
|
|||||||||||||||||||
|
(Dollars in millions)
|
|||||||||||||||||||||||
|
Interest income:
|
|||||||||||||||||||||||
|
Mortgage loans of Fannie Mae
|
$
|
(478
|
)
|
$
|
(465
|
)
|
$
|
(13
|
)
|
$
|
(1,132
|
)
|
$
|
(1,298
|
)
|
$
|
166
|
|
|||||
|
Mortgage loans of consolidated trusts
|
1,914
|
|
1,185
|
|
729
|
|
3,409
|
|
3,184
|
|
225
|
|
|||||||||||
|
Total mortgage loans
|
1,436
|
|
720
|
|
716
|
|
2,277
|
|
1,886
|
|
391
|
|
|||||||||||
|
Mortgage-related securities, net
|
(104
|
)
|
(66
|
)
|
(38
|
)
|
(345
|
)
|
(260
|
)
|
(85
|
)
|
|||||||||||
|
Non-mortgage-related securities
(2)
|
102
|
|
1
|
|
101
|
|
232
|
|
9
|
|
223
|
|
|||||||||||
|
Other
(3)
|
76
|
|
8
|
|
68
|
|
191
|
|
62
|
|
129
|
|
|||||||||||
|
Total interest income
|
$
|
1,510
|
|
$
|
663
|
|
$
|
847
|
|
$
|
2,355
|
|
$
|
1,697
|
|
$
|
658
|
|
|||||
|
Interest expense:
|
|||||||||||||||||||||||
|
Short-term funding debt
|
16
|
|
(33
|
)
|
49
|
|
9
|
|
(96
|
)
|
105
|
|
|||||||||||
|
Long-term funding debt
|
(141
|
)
|
(191
|
)
|
50
|
|
(416
|
)
|
(487
|
)
|
71
|
|
|||||||||||
|
Total funding debt
|
(125
|
)
|
(224
|
)
|
99
|
|
(407
|
)
|
(583
|
)
|
176
|
|
|||||||||||
|
Debt securities of consolidated trusts held by third parties
|
1,796
|
|
999
|
|
797
|
|
2,630
|
|
2,861
|
|
(231
|
)
|
|||||||||||
|
Total interest expense
|
$
|
1,671
|
|
$
|
775
|
|
$
|
896
|
|
$
|
2,223
|
|
$
|
2,278
|
|
$
|
(55
|
)
|
|||||
|
Net interest income
|
$
|
(161
|
)
|
$
|
(112
|
)
|
$
|
(49
|
)
|
$
|
132
|
|
$
|
(581
|
)
|
$
|
713
|
|
|||||
__________
|
(1)
|
Combined rate/volume variances are allocated to rate and volume based on the relative size of each variance
.
|
|
(2)
|
Includes cash equivalents.
|
|
(3)
|
Consists of federal funds sold and securities purchased under agreements to resell or similar arrangements and advances to lenders.
|
Net interest income and net interest yield decreased in the
third quarter
of
2017
compared with the
third quarter
of
2016
due to a decline in the average balance of our retained mortgage portfolio as we continued to reduce this portfolio. The decrease in net interest income was partially offset by a slight increase in guaranty fee income driven by loans with higher base guaranty fees comprising a larger part of our guaranty book of business in the
third quarter
of
2017
compared with the
third quarter
of
2016
.
Net interest income increased in the
first nine months
of
2017
compared with the
first nine months
of
2016
due to an increase in guaranty fee income driven by: (1) loans with higher base guaranty fees comprising a larger part of our guaranty book of business in the
first nine months
of
2017
compared with the
first nine months
of
2016
; and (2) an increase in amortization income in the
first nine months
of
2017
due to activity related to increased prepayments on mortgage loans and liquidations of MBS debt of consolidated trusts, which accelerated the amortization of cost basis adjustments on the loans and related debt.
The increase in net interest income due to higher guaranty fee income was partially offset by a decline in the average balance of our retained mortgage portfolio as we continued to reduce this portfolio.
See “
Retained Mortgage Portfolio
” for information about our retained mortgage portfolio.
We initially recognize mortgage loans and debt of consolidated trusts in our consolidated balance sheets at fair value. We recognize the difference between: (1) the initial fair value of the consolidated trust’s mortgage loans and debt and (2) the unpaid principal balance of these mortgage loans and debt as cost basis adjustments in our consolidated balance sheets. We amortize cost basis adjustments, including premiums and discounts on mortgage loans and securities, as a yield adjustment over the contractual life of the loan or security as a component of net interest income. Net unamortized premiums on debt of consolidated trusts exceeded net unamortized premiums on the related mortgage loans of consolidated trusts by
$36.9 billion
as of
September 30, 2017
, compared with
$34.7 billion
as of
December 31, 2016
. The amortization of this net premium position will contribute to our net interest income over time.
|
Fannie Mae Third Quarter 2017 Form 10-Q
|
15
|
|
|
MD&A | Consolidated Results of Operations
|
||
We had
$7.8 billion
in net unamortized discounts and other cost basis adjustments on mortgage loans of Fannie Mae included in our consolidated balance sheets as of
September 30, 2017
, compared with
$10.4 billion
as of
December 31, 2016
. This net discount position on mortgage loans was primarily recorded upon the acquisition of credit-impaired loans and the extent to which we may record them as income in future periods will be based on the actual performance of the loans.
Fee and Other Income
Fee and other income includes transaction fees, technology fees, multifamily fees and other miscellaneous income. Fee and other income increased in the third quarter and first nine months of 2017, compared with the third quarter and first nine months of 2016, primarily as a result of $975 million of income in the third quarter of 2017 resulting from a settlement agreement resolving legal claims related to private-label securities we purchased. See “Legal Proceedings—FHFA Private-Label Mortgage-Related Securities Litigation” for additional information.
Fair Value Losses, Net
The estimated fair value of our derivatives and trading securities may fluctuate substantially from period to period because of changes in interest rates, credit spreads and interest rate volatility, as well as activity related to these financial instruments. While the estimated fair value of our derivatives that serve to mitigate certain risk exposures may fluctuate, some of the financial instruments that generate these exposures are not recorded at fair value in our condensed consolidated financial statements.
Table 4
displays the components of our fair value gains and losses.
|
Table 4: Fair Value Losses, Net
|
|||||||||||||||
|
For the Three Months Ended September 30,
|
For the Nine Months Ended September 30,
|
||||||||||||||
|
2017
|
2016
|
2017
|
2016
|
||||||||||||
|
(Dollars in millions)
|
|||||||||||||||
|
Risk management derivatives fair value gains (losses) attributable to:
|
|||||||||||||||
|
Net contractual interest expense accruals on interest rate swaps
|
$
|
(223
|
)
|
$
|
(295
|
)
|
$
|
(702
|
)
|
$
|
(855
|
)
|
|||
|
Net change in fair value during the period
|
75
|
|
362
|
|
364
|
|
(2,639
|
)
|
|||||||
|
Total risk management derivatives fair value gains (losses), net
|
(148
|
)
|
67
|
|
(338
|
)
|
(3,494
|
)
|
|||||||
|
Mortgage commitment derivatives fair value losses, net
|
(248
|
)
|
(216
|
)
|
(520
|
)
|
(945
|
)
|
|||||||
|
Total derivatives fair value losses, net
|
(396
|
)
|
(149
|
)
|
(858
|
)
|
(4,439
|
)
|
|||||||
|
Trading securities gains, net
|
59
|
|
38
|
|
145
|
|
88
|
|
|||||||
|
CAS debt fair value gains (losses), net
(1)
|
113
|
|
(388
|
)
|
(218
|
)
|
(616
|
)
|
|||||||
|
Other, net
(2)
|
(65
|
)
|
8
|
|
(89
|
)
|
(4
|
)
|
|||||||
|
Fair value losses, net
|
$
|
(289
|
)
|
$
|
(491
|
)
|
$
|
(1,020
|
)
|
$
|
(4,971
|
)
|
|||
|
(1)
|
Consists of fair value gains and losses on CAS debt reported at fair value.
|
|
(2)
|
Consists of fair value gains and losses on non-CAS debt and mortgage loans.
|
Fair value
losses
in the
third quarter
and
first nine months
of
2017
were primarily driven by:
|
•
|
decreases
in the fair value of our
mortgage commitments
due to losses on commitments to sell mortgage-related securities due to an increase in prices as interest rates decreased during most of the commitment periods; and
|
|
•
|
decreases
in the fair value of our
pay-fixed risk management derivatives
due to
declines
in longer-term swap rates during the second quarter and most of the third quarter.
|
Fair value
losses
in the
third quarter
of
2016
were primarily due to
losses
on CAS debt reported at fair value resulting from
tightening
spreads between CAS debt yields and LIBOR during the periods. Fair value
losses
in the
first nine months
of
2016
were primarily due to
losses
on risk management derivatives resulting from
decreases
in the fair value of our pay-fixed derivatives due to
declines
in longer-term swap rates.
|
Fannie Mae Third Quarter 2017 Form 10-Q
|
16
|
|
|
MD&A | Consolidated Results of Operations
|
||
Credit-Related Income (Expense)
We refer to our benefit (provision) for loan losses and benefit (provision) for guaranty losses collectively as our “benefit (provision) for credit losses.” Credit-related income (expense) consists of our benefit (provision) for credit losses and foreclosed property income (expense).
Provision (Benefit) for Credit Losses
Our combined loss reserves provide for an estimate of credit losses incurred in our guaranty book of business, including concessions we granted borrowers upon modification of their loans. We establish our combined loss reserves through our provision for credit losses for losses that we believe have been incurred and will eventually be realized over time in our financial statements. When we reduce our combined loss reserves, we recognize a benefit for credit losses. When we determine that a loan is uncollectible, typically upon foreclosure or other liquidation event (such as a deed-in-lieu of foreclosure or a short sale), we recognize a charge-off against our combined loss reserves. For a subset of delinquent single-family loans, we charge off the portion of the loans that is deemed uncollectible prior to foreclosure when the loans have been delinquent for a specified length of time and meet specified mark-to-market LTV ratios. We also recognize a charge-off upon the redesignation of loans from HFI to HFS. If the amounts charged off upon redesignation exceed the allowance related to the loans, we record a provision for credit losses. If the amounts charged off are less than the allowance related to the loans, we recognize a benefit for credit losses. We record recoveries of previously charged-off amounts as a reduction to charge-offs.
Table 5
displays the changes in the combined loss reserves, which consists of the allowance for loan losses and the reserve for guaranty losses.
|
Table 5: Changes in Combined Loss Reserves
|
|||||||||||||||
|
For the Three Months Ended September 30,
|
For the Nine Months Ended September 30,
|
||||||||||||||
|
2017
|
2016
|
2017
|
2016
|
||||||||||||
|
(Dollars in millions)
|
|||||||||||||||
|
Changes in combined loss reserves:
|
|||||||||||||||
|
Beginning balance
|
$
|
20,742
|
|
$
|
24,089
|
|
$
|
23,835
|
|
$
|
28,590
|
|
|||
|
Provision (benefit) for credit losses
|
182
|
|
(673
|
)
|
(1,481
|
)
|
(3,458
|
)
|
|||||||
|
Charge-offs
|
(458
|
)
|
(630
|
)
|
(2,224
|
)
|
(2,761
|
)
|
|||||||
|
Recoveries
|
75
|
|
207
|
|
373
|
|
536
|
|
|||||||
|
Other
|
(17
|
)
|
10
|
|
21
|
|
96
|
|
|||||||
|
Ending balance
|
$
|
20,524
|
|
$
|
23,003
|
|
$
|
20,524
|
|
$
|
23,003
|
|
|||
|
As of
|
||||||||||||||||
|
September 30, 2017
|
December 31, 2016
|
|||||||||||||||
|
(Dollars in millions)
|
||||||||||||||||
|
Allocation of combined loss reserves:
|
||||||||||||||||
|
Balance at end of each period attributable to:
|
||||||||||||||||
|
Single-family
|
$
|
20,291
|
|
$
|
23,639
|
|
||||||||||
|
Multifamily
|
233
|
|
196
|
|
||||||||||||
|
Total
|
$
|
20,524
|
|
$
|
23,835
|
|
||||||||||
|
Single-family and multifamily combined loss reserves as a percentage of applicable guaranty book of business:
|
||||||||||||||||
|
Single-family
|
0.70
|
|
%
|
0.83
|
|
%
|
||||||||||
|
Multifamily
|
0.09
|
|
0.08
|
|
||||||||||||
|
Combined loss reserves as a percentage of:
|
||||||||||||||||
|
Total guaranty book of business
|
0.65
|
|
%
|
0.77
|
|
%
|
||||||||||
|
Recorded investment in nonaccrual loans
|
53.84
|
|
53.62
|
|
||||||||||||
|
Fannie Mae Third Quarter 2017 Form 10-Q
|
17
|
|
|
MD&A | Consolidated Results of Operations
|
||
The following factors impacted our provision for credit losses in the
third quarter
of
2017
:
|
•
|
The estimate of incurred losses from the hurricanes contributed approximately
$1.0 billion
to the provision for credit losses, the majority of which relates to single-family loans located in Puerto Rico.
|
|
•
|
This was partially offset by a benefit primarily due to higher actual home prices. Higher home prices decrease the likelihood that loans will default and reduce the amount of credit loss on loans that do default, which impacts our estimate of losses and ultimately reduces our total loss reserves and provision for credit losses.
|
|
•
|
In addition, we recognized a benefit from the redesignation of certain reperforming single-family loans from HFI to HFS during the period as we no longer intend to hold them to maturity. Upon redesignation of these loans, we recorded the loans at the lower of cost or fair value via a charge-off to the allowance for loan losses. Amounts recorded in the allowance related to the loans exceeded the amount charged off, which reduced the provision for credit losses.
|
The following factors impacted our benefit for credit losses in the
first nine months
of
2017
:
|
•
|
We recognized a benefit for credit losses due to higher actual and forecasted home prices.
|
|
•
|
We also recognized a benefit from the redesignation of certain reperforming and nonperforming single-family loans from HFI to HFS during the period.
|
|
•
|
This was partially offset by the estimate of incurred losses from the hurricanes, which contributed approximately
$1.0 billion
to the allowance for loan losses.
|
The following factors contributed to our benefit for credit losses in the third quarter and first nine months of 2016:
|
•
|
We recognized a benefit for credit losses in the
third quarter
of 2016 primarily due to an increase in home prices, including distressed property valuations.
|
|
•
|
We recognized a benefit for credit losses in the
first nine months
of 2016 primarily due to an increase in home prices, including distressed property valuations and a decline in interest rates. As mortgage interest rates decline, we expect an increase in future prepayments on single-family individually impaired loans, including modified loans. Higher expected prepayments shorten the expected lives of modified loans, which decreases the impairment relating to concessions provided on these loans and results in a decrease in the provision for credit losses.
|
We discuss our expectations regarding our future loss reserves in “
Executive Summary
—
Outlook
—Loss Reserves.”
Troubled Debt Restructurings and Nonaccrual Loans
Table 6
displays the composition of loans restructured in a troubled debt restructuring (“TDR”) that are on accrual status and loans on nonaccrual status. The table includes our recorded investment in HFI and HFS mortgage loans. For information on the impact of TDRs and other individually impaired loans on our allowance for loan losses, see “
Note 3, Mortgage Loans
.”
|
Table 6: Troubled Debt Restructurings and Nonaccrual Loans
|
|||||||||||
|
As of
|
|||||||||||
|
September 30, 2017
|
December 31, 2016
|
||||||||||
|
(Dollars in millions)
|
|||||||||||
|
TDRs on accrual status:
|
|||||||||||
|
Single-family
|
$
|
117,724
|
|
$
|
127,353
|
|
|||||
|
Multifamily
|
164
|
|
141
|
|
|||||||
|
Total TDRs on accrual status
|
$
|
117,888
|
|
$
|
127,494
|
|
|||||
|
Nonaccrual loans:
|
|||||||||||
|
Single-family
|
$
|
37,797
|
|
$
|
44,047
|
|
|||||
|
Multifamily
|
322
|
|
403
|
|
|||||||
|
Total nonaccrual loans
|
$
|
38,119
|
|
$
|
44,450
|
|
|||||
|
Accruing on-balance sheet loans past due 90 days or more
(1)
|
$
|
289
|
|
$
|
402
|
|
|||||
|
Fannie Mae Third Quarter 2017 Form 10-Q
|
18
|
|
|
MD&A | Consolidated Results of Operations
|
||
|
For the Nine Months
|
|||||||
|
Ended September 30,
|
|||||||
|
2017
|
2016
|
||||||
|
(Dollars in millions)
|
|||||||
|
Interest related to on-balance sheet TDRs and nonaccrual loans:
|
|||||||
|
Interest income forgone
(2)
|
$
|
2,628
|
|
$
|
3,312
|
|
|
|
Interest income recognized for the period
(3)
|
4,253
|
|
4,565
|
|
|||
__________
|
(1)
|
Includes loans that, as of the end of each period, are 90 days or more past due and continuing to accrue interest. The majority of these amounts consists of loans insured or guaranteed by the U.S. government and loans for which we have recourse against the seller in the event of a default.
|
|
(2)
|
Represents the amount of interest income we did not recognize, but would have recognized during the period for nonaccrual loans and TDRs on accrual status as of the end of each period had the loans performed according to their original contractual terms.
|
|
(3)
|
Represents interest income recognized during the period, including the amortization of any deferred cost basis adjustments, for loans classified as either nonaccrual loans or TDRs on accrual status as of the end of each period. Includes primarily amounts accrued while the loans were performing and cash payments received on nonaccrual loans.
|
Credit Loss Performance Metrics
Our credit-related income (expense) should be considered in conjunction with our credit loss performance metrics. Our credit loss performance metrics, however, are not defined terms within generally accepted accounting principles (“GAAP”) and may not be calculated in the same manner as similarly titled measures reported by other companies. Because management does not view changes in the fair value of our mortgage loans as credit losses, we adjust our credit loss performance metrics for the impact associated with our acquisition of credit-impaired loans from unconsolidated MBS trusts. We also exclude interest forgone on nonaccrual loans and TDRs, other-than-temporary impairment losses resulting from deterioration in the credit quality of our mortgage-related securities and accretion of interest income on acquired credit-impaired loans from credit losses. We believe that credit loss performance metrics may be useful to investors as the losses are presented as a percentage of our book of business and have historically been used by analysts, investors and other companies within the financial services industry. Moreover, by presenting credit losses with and without the effect of fair value losses associated with the acquisition of credit-impaired loans, investors are able to evaluate our credit performance on a more consistent basis among periods.
|
Fannie Mae Third Quarter 2017 Form 10-Q
|
19
|
|
|
MD&A | Consolidated Results of Operations
|
||
Table 7
displays the components of our credit loss performance metrics as well as our single-family and multifamily initial charge-off severity rates.
|
Table 7: Credit Loss Performance Metrics
|
|||||||||||||||||||||||||||
|
For the Three Months Ended September 30,
|
For the Nine Months Ended September 30,
|
||||||||||||||||||||||||||
|
2017
|
2016
|
2017
|
2016
|
||||||||||||||||||||||||
|
Amount
|
Ratio
(1)
|
Amount
|
Ratio
(1)
|
Amount
|
Ratio
(1)
|
Amount
|
Ratio
(1)
|
||||||||||||||||||||
|
(Dollars in millions)
|
|||||||||||||||||||||||||||
|
Charge-offs, net of recoveries
|
$
|
383
|
|
4.9
|
bps
|
$
|
423
|
|
5.6
|
bps
|
$
|
1,851
|
|
7.9
|
bps
|
$
|
2,225
|
|
9.8
|
bps
|
|||||||
|
Foreclosed property expense
|
140
|
|
1.8
|
110
|
|
1.4
|
391
|
|
1.7
|
507
|
|
2.2
|
|||||||||||||||
|
Credit losses including the effect of fair value losses on acquired credit-impaired loans
|
523
|
|
6.7
|
533
|
|
7.0
|
2,242
|
|
9.6
|
2,732
|
|
12.0
|
|||||||||||||||
|
Plus: Impact of acquired credit-impaired loans on charge-offs and foreclosed property expense
(2)
|
61
|
|
0.7
|
83
|
|
1.1
|
183
|
|
0.7
|
273
|
|
1.1
|
|||||||||||||||
|
Credit losses and credit loss ratio
|
$
|
584
|
|
7.4
|
bps
|
$
|
616
|
|
8.1
|
bps
|
$
|
2,425
|
|
10.3
|
bps
|
$
|
3,005
|
|
13.1
|
bps
|
|||||||
|
Credit losses attributable to:
|
|||||||||||||||||||||||||||
|
Single-family
|
$
|
600
|
|
$
|
622
|
|
$
|
2,439
|
|
$
|
3,003
|
|
|||||||||||||||
|
Multifamily
(3)
|
(16
|
)
|
(6
|
)
|
(14
|
)
|
2
|
|
|||||||||||||||||||
|
Total
|
$
|
584
|
|
$
|
616
|
|
$
|
2,425
|
|
$
|
3,005
|
|
|||||||||||||||
|
Single-family initial charge-off severity rate
(4)
|
13.8
|
%
|
16.0
|
%
|
15.5
|
%
|
20.3
|
%
|
|||||||||||||||||||
|
Multifamily initial charge-off severity rate
(4)
|
11.8
|
%
|
22.0
|
%
|
7.2
|
%
|
15.4
|
%
|
|||||||||||||||||||
__________
|
(1)
|
Basis points are based on the annualized amount for each line item presented divided by the average guaranty book of business during the period.
|
|
(2)
|
Includes fair value losses from acquired credit-impaired loans.
|
|
(3)
|
Negative credit losses are the result of recoveries on previously charged-off amounts.
|
|
(4)
|
Single-family and multifamily rates exclude fair value losses on credit-impaired loans acquired from MBS trusts and any costs, gains or losses associated with real estate owned (“REO”) after initial acquisition through final disposition. The single-family rate includes charge-offs pursuant to the provisions of FHFA’s Advisory Bulletin 2012-02, “Framework for Adversely Classifying Loans, Other Real Estate Owned, and Other Assets and Listing Assets for Special Mention” and charge-offs of property tax and insurance receivables, while it excludes charge-offs from short sales and third-party sales. Multifamily rate is net of risk sharing agreements.
|
Credit losses and our credit loss ratio decreased in the
third quarter
and
first nine months
of
2017
compared with the
third quarter
and
first nine months
of
2016
primarily due to lower charge-offs as a result of lower serious delinquencies.
We discuss our expectations regarding our future credit losses in “
Executive Summary
—
Outlook
—Credit Losses.”
|
Fannie Mae Third Quarter 2017 Form 10-Q
|
20
|
|
|
MD&A | Consolidated Results of Operations
|
||
Table 8
displays concentrations of our single-family credit losses based on geography, credit characteristics and loan vintages.
|
Table 8: Credit Loss Concentration Analysis
|
||||||||||||||||||||
|
Percentage of Single-Family Conventional Guaranty Book of Business Outstanding
(1)
|
Percentage of Single-Family Credit Losses
(2)
|
|||||||||||||||||||
|
As of
|
For the Three Months Ended September 30,
|
For the Nine Months Ended September 30,
|
||||||||||||||||||
|
September 30,
|
|
December 31,
|
|
September 30,
|
||||||||||||||||
|
2017
|
|
2016
|
|
2016
|
2017
|
2016
|
2017
|
2016
|
||||||||||||
|
Geographical distribution:
|
||||||||||||||||||||
|
California
|
19
|
%
|
19
|
%
|
20
|
%
|
9
|
%
|
1
|
%
|
9
|
%
|
1
|
%
|
||||||
|
Florida
|
6
|
|
6
|
|
6
|
|
3
|
|
4
|
|
10
|
|
7
|
|
||||||
|
Illinois
|
4
|
|
4
|
|
4
|
|
9
|
|
10
|
|
9
|
|
8
|
|
||||||
|
New Jersey
|
4
|
|
4
|
|
4
|
|
17
|
|
18
|
|
14
|
|
18
|
|
||||||
|
New York
|
5
|
|
5
|
|
5
|
|
12
|
|
11
|
|
11
|
|
20
|
|
||||||
|
All other states
|
62
|
|
62
|
|
61
|
|
50
|
|
56
|
|
47
|
|
46
|
|
||||||
|
Select higher-risk product features
(3)
|
21
|
|
21
|
|
22
|
|
55
|
|
68
|
|
60
|
|
59
|
|
||||||
|
Vintages:
(4)
|
||||||||||||||||||||
|
2004 and prior
|
4
|
|
5
|
|
4
|
|
11
|
|
13
|
|
11
|
|
16
|
|
||||||
|
2005 - 2008
|
7
|
|
8
|
|
9
|
|
66
|
|
60
|
|
66
|
|
64
|
|
||||||
|
2009 - 2017
|
89
|
|
87
|
|
87
|
|
23
|
|
27
|
|
23
|
|
20
|
|
||||||
__________
|
(1)
|
Calculated based on the unpaid principal balance of loans, where we have detailed loan level information, for each category divided by the unpaid principal balance of our single-family conventional guaranty book of business as of the end of each period.
|
|
(2)
|
Excludes the impact of recoveries resulting from resolution agreements related to representation and warranty matters and compensatory fee income related to servicing matters that have not been allocated to specific loans.
|
|
(3)
|
Includes Alt-A loans, subprime loans, interest-only loans, loans with original LTV ratios greater than 90% and loans with FICO
®
scores less than 620.
|
|
(4)
|
Credit losses on mortgage loans typically do not peak until the third through sixth years following origination; however, this range can vary based on many factors, including changes in macroeconomic conditions and foreclosure timelines.
|
As shown in
Table 8
, the percentage of our credit losses for loans in California was higher in the
third quarter
and
first nine months
of
2017
compared with the
third quarter
and
first nine months
of
2016
because a large portion of the reperforming loans that were redesignated as HFS and charged-off in the
third quarter
and
first nine months
of
2017
were single-family loans located in California. The percentage of our credit losses for loans in New Jersey and New York were lower in the
first nine months
of
2017
compared with the
first nine months
of
2016
because we charged off a greater portion of excessively delinquent loans in these states in 2016. The majority of our credit losses for the
third quarter
and
first nine months
of
2017
continued to be driven by loans originated in 2005 through 2008. We provide more detailed single-family credit performance information, including serious delinquency rate share and foreclosure activity, in “
Business Segments
—
Single-Family Business
—
Single-Family Mortgage Credit Risk Management
.”
Temporary Payroll Tax Cut Continuation Act of 2011 (“TCCA”) Fees
Pursuant to the TCCA, in 2012, FHFA directed us to increase our single-family guaranty fees by 10 basis points and remit this increase to Treasury. This TCCA-related revenue is included in “Net interest income” and the expense is recognized as “TCCA fees.” TCCA fees increased in the
third quarter
and
first nine months
of
2017
compared with the
third quarter
and
first nine months
of
2016
as our book of business subject to the TCCA continued to grow. We expect the guaranty fees collected and expenses incurred under the TCCA to continue to increase.
|
Fannie Mae Third Quarter 2017 Form 10-Q
|
21
|
|
|
MD&A | Consolidated Balance Sheet Analysis
|
||
|
|
||||
This section provides a discussion of our condensed consolidated balance sheets and should be read together with our condensed consolidated financial statements, including the accompanying notes.
|
Table 9: Summary of Condensed Consolidated Balance Sheets
|
|||||||||||
|
As of
|
|||||||||||
|
September 30, 2017
|
December 31, 2016
|
Variance
|
|||||||||
|
(Dollars in millions)
|
|||||||||||
|
Assets
|
|||||||||||
|
Cash and cash equivalents and federal funds sold and securities purchased under agreements to resell or similar arrangements
|
$
|
47,654
|
|
$
|
55,639
|
|
$
|
(7,985
|
)
|
||
|
Restricted cash
|
28,137
|
|
36,953
|
|
(8,816
|
)
|
|||||
|
Investments in securities
(1)
|
42,849
|
|
48,925
|
|
(6,076
|
)
|
|||||
|
Mortgage loans:
|
|||||||||||
|
Of Fannie Mae
|
174,964
|
|
207,190
|
|
(32,226
|
)
|
|||||
|
Of consolidated trusts
|
2,997,989
|
|
2,896,028
|
|
101,961
|
|
|||||
|
Allowance for loan losses
|
(20,194
|
)
|
(23,465
|
)
|
3,271
|
|
|||||
|
Mortgage loans, net of allowance for loan losses
|
3,152,759
|
|
3,079,753
|
|
73,006
|
|
|||||
|
Deferred tax assets, net
|
30,454
|
|
33,530
|
|
(3,076
|
)
|
|||||
|
Other assets
|
28,906
|
|
33,168
|
|
(4,262
|
)
|
|||||
|
Total assets
|
$
|
3,330,759
|
|
$
|
3,287,968
|
|
$
|
42,791
|
|
||
|
Liabilities and equity
|
|||||||||||
|
Debt:
|
|||||||||||
|
Of Fannie Mae
|
$
|
291,289
|
|
$
|
327,097
|
|
$
|
(35,808
|
)
|
||
|
Of consolidated trusts
|
3,017,294
|
|
2,935,219
|
|
82,075
|
|
|||||
|
Other liabilities
|
18,528
|
|
19,581
|
|
(1,053
|
)
|
|||||
|
Total liabilities
|
3,327,111
|
|
3,281,897
|
|
45,214
|
|
|||||
|
Equity
|
3,648
|
|
6,071
|
|
(2,423
|
)
|
|||||
|
Total liabilities and equity
|
$
|
3,330,759
|
|
$
|
3,287,968
|
|
$
|
42,791
|
|
||
__________
|
(1)
|
Includes
$30.8 billion
as of September 30, 2017
and
$32.3 billion
as of
December 31, 2016
of U.S. Treasury securities that are included in our other investments portfolio.
|
Other Investments Portfolio
Our other investments portfolio consists of cash and cash equivalents, securities purchased under agreements to resell or similar arrangements, and investments in U.S. Treasury securities. See “
Liquidity and Capital Management
—
Liquidity Management
—
Other Investments Portfolio
” for additional information on our other investments portfolio.
Restricted Cash
Restricted cash primarily includes unscheduled borrower payments received by servicers of loans backing consolidated trusts due to be remitted to the MBS certificateholders in the subsequent month. Our restricted cash
decreased
as of September 30, 2017
compared with the balance as of
December 31, 2016
primarily as a result of a
decrease
in prepayments received on mortgage loans in September 2017 compared with prepayments received in December 2016.
|
Fannie Mae Third Quarter 2017 Form 10-Q
|
22
|
|
|
MD&A | Consolidated Balance Sheet Analysis
|
||
Investments in Mortgage-Related Securities
Our investments in mortgage-related securities are classified in our condensed consolidated balance sheets as either trading or available-for-sale and are measured at fair value.
Table 10
displays the fair value of our investments in trading and available-for-sale mortgage-related securities. We classify private-label securities as Alt-A, subprime or commercial mortgage-backed securities (“CMBS”) if the securities were labeled as such when issued. We have also invested in subprime private-label mortgage-related securities that we have resecuritized to include our guaranty.
|
Table 10: Summary of Mortgage-Related Securities at Fair Value
|
|||||||||||
|
As of
|
|||||||||||
|
September 30, 2017
|
December 31, 2016
|
||||||||||
|
(Dollars in millions)
|
|||||||||||
|
Mortgage-related securities:
|
|||||||||||
|
Fannie Mae
|
$
|
6,308
|
|
$
|
7,323
|
|
|||||
|
Other agency
|
1,819
|
|
2,605
|
|
|||||||
|
Alt-A and subprime private-label securities
|
2,583
|
|
3,345
|
|
|||||||
|
CMBS
|
191
|
|
1,580
|
|
|||||||
|
Mortgage revenue bonds
|
750
|
|
1,293
|
|
|||||||
|
Other mortgage-related securities
|
399
|
|
462
|
|
|||||||
|
Total
|
$
|
12,050
|
|
$
|
16,608
|
|
|||||
The
decrease
in mortgage-related securities at fair value from
December 31, 2016
to
September 30, 2017
was primarily driven by liquidations and sales of securities.
See “
Note 5, Investments in Securities
” for additional information on our investments in mortgage-related securities, including the composition of our trading and available-for-sale securities at amortized cost and fair value and the gross unrealized gains and losses related to our available-for-sale securities as of
September 30, 2017
and
December 31, 2016
.
Mortgage Loans and Allowance for Loan Losses
The
increase
in mortgage loans, net of allowance for loan losses, from
December 31, 2016
to
September 30, 2017
was driven by an increase in mortgage loans of consolidated trusts as we continued to add to our guaranty book of business through securitization activity. Partially offsetting this was a decline in mortgage loans of Fannie Mae resulting from liquidations, portfolio securitizations and sales. For additional information on our mortgage loans, see “
Note 3, Mortgage Loans
.”
The decrease in our allowance for loan losses from
December 31, 2016
to
September 30, 2017
was primarily driven by the relief of the allowance for loan losses upon redesignation of certain reperforming and nonperforming single-family loans from HFI to HFS, liquidations and higher actual and forecasted home prices. This decrease was partially offset by estimated incurred losses of approximately
$1.0 billion
resulting from the hurricanes.
Other Assets
The
decrease
in other assets from
December 31, 2016
to
September 30, 2017
was primarily driven by a decrease in advances to lenders as a result of lower lender funding needs. For additional information on our accounting policy for advances to lenders, refer to “
Note 1, Summary of Significant Accounting Policies
” in our
2016
Form 10-K.
Debt
Debt of Fannie Mae is the primary means of funding our mortgage purchases. Debt of consolidated trusts represents the amount of Fannie Mae MBS issued from consolidated trusts and held by third-party certificateholders. We provide a summary of the activity of the debt of Fannie Mae and a comparison of the mix between our outstanding short-term and long-term debt in “
Liquidity and Capital Management
—
Liquidity Management
—
Debt Funding
.” Also see “
Note 7, Short-Term Borrowings and Long-Term Debt
” for additional information on our outstanding debt.
|
Fannie Mae Third Quarter 2017 Form 10-Q
|
23
|
|
|
MD&A | Consolidated Balance Sheet Analysis
|
||
The
decrease
in debt of Fannie Mae from
December 31, 2016
to
September 30, 2017
was primarily driven by lower funding needs, as our retained mortgage portfolio
decreased
. The
increase
in debt of consolidated trusts from
December 31, 2016
to
September 30, 2017
was primarily driven by sales of Fannie Mae MBS, which are accounted for as issuances of debt of consolidated trusts in our condensed consolidated balance sheets, since the MBS certificate ownership is transferred from us to a third party.
Stockholders’ Equity
Our net equity
decreased
as of
September 30, 2017
compared with
December 31, 2016
due to our payments of senior preferred stock dividends to Treasury during the
first nine months
of
2017
, partially offset by our comprehensive income recognized during the
first nine months
of
2017
.
|
Retained Mortgage Portfolio
|
||||
Our retained mortgage portfolio consists of mortgage loans and mortgage-related securities that we own, including Fannie Mae MBS and non-Fannie Mae mortgage-related securities. Assets held by consolidated MBS trusts that back mortgage-related securities owned by third parties are not included in our retained mortgage portfolio.
Table 11
displays the unpaid principal balance of our retained mortgage portfolio.
|
Table 11: Retained Mortgage Portfolio
|
|||||||||||
|
As of
|
|||||||||||
|
September 30, 2017
|
December 31, 2016
|
||||||||||
|
(Dollars in millions)
|
|||||||||||
|
Single-family:
|
|||||||||||
|
Mortgage loans
(1)
|
$
|
152,731
|
|
$
|
181,219
|
|
|||||
|
Reverse mortgages
|
27,456
|
|
29,443
|
|
|||||||
|
Mortgage-related securities:
|
|||||||||||
|
Agency securities
(2)
|
36,714
|
|
25,667
|
|
|||||||
|
Fannie Mae-wrapped reverse mortgage securities
|
6,884
|
|
7,420
|
|
|||||||
|
Other Fannie Mae-wrapped securities
|
3,518
|
|
3,773
|
|
|||||||
|
Private-label and other securities
|
3,623
|
|
4,980
|
|
|||||||
|
Total single-family mortgage-related securities
(3)
|
50,739
|
|
41,840
|
|
|||||||
|
Total single-family mortgage loans and mortgage-related securities
|
230,926
|
|
252,502
|
|
|||||||
|
Multifamily:
|
|||||||||||
|
Mortgage loans
(4)
|
5,252
|
|
9,407
|
|
|||||||
|
Mortgage-related securities:
|
|||||||||||
|
Agency securities
(2)
|
8,095
|
|
7,693
|
|
|||||||
|
CMBS
|
191
|
|
1,567
|
|
|||||||
|
Mortgage revenue bonds
|
669
|
|
1,185
|
|
|||||||
|
Total multifamily mortgage-related securities
(5)
|
8,955
|
|
10,445
|
|
|||||||
|
Total multifamily mortgage loans and mortgage-related securities
|
14,207
|
|
19,852
|
|
|||||||
|
Total retained mortgage portfolio
|
$
|
245,133
|
|
$
|
272,354
|
|
|||||
__________
|
(1)
|
Includes single-family loans restructured in a TDR that were on accrual status of
$93.4 billion
and
$119.4 billion
as of September 30, 2017
and
December 31, 2016
, respectively, and single-family loans on nonaccrual status of
$32.6 billion
and
$38.7 billion
as of September 30, 2017
and
December 31, 2016
, respectively.
|
|
(2)
|
Includes Fannie Mae, Freddie Mac and Ginnie Mae mortgage-related securities, excluding Fannie Mae-wrapped reverse mortgage securities and other Fannie Mae-wrapped securities.
|
|
(3)
|
The fair value of these single-family mortgage-related securities was $
52.9 billion
and $
42.9 billion
as of September 30, 2017
and
December 31, 2016
, respectively.
|
|
Fannie Mae Third Quarter 2017 Form 10-Q
|
24
|
|
|
MD&A | Retained Mortgage Portfolio
|
||
|
(4)
|
Includes multifamily loans restructured in a TDR that were on accrual status of
$159 million
and
$131 million
as of September 30, 2017
and
December 31, 2016
, respectively, and multifamily loans on nonaccrual status of
$133 million
and
$246 million
as of September 30, 2017
and
December 31, 2016
, respectively.
|
|
(5)
|
The fair value of these multifamily mortgage-related securities was
$9.6 billion
and
$11.2 billion
as of September 30, 2017
and
December 31, 2016
, respectively.
|
In support of our loss mitigation strategy, we purchased $
8.9 billion
of loans from our single-family MBS trusts in the
first nine months
of
2017
, the substantial majority of which were delinquent. See “
Business
—Mortgage Securitizations—Purchases of Loans from Our MBS Trusts” in our
2016
Form 10-K for more information relating to our purchases of loans from MBS trusts.
We primarily use our retained mortgage portfolio to: (1) provide liquidity to the mortgage market and (2) support our loss mitigation activities. Previously, we also used our retained mortgage portfolio for investment purposes.
The amount of mortgage assets that we may own is restricted by our senior preferred stock purchase agreement with Treasury and FHFA’s additional cap, as described in “
Business
—
Conservatorship and Treasury Agreements
—
Treasury Agreements
” in our
2016
Form 10-K. Our retained mortgage portfolio is already below the caps that will become effective on
December 31, 2017
, and is below the final
$250 billion
cap under the senior preferred stock purchase agreement, which becomes effective on
December 31,
2018
. The amount is not yet below the final FHFA cap of
$225 billion
that becomes effective on
December 31,
2018
. We expect the size of our retained mortgage portfolio will continue to decrease in
2017
.
Table 12
below separates the instruments within our retained mortgage portfolio by unpaid principal balance into three categories based on each instrument’s use. “Lender liquidity,” which includes balances related to our whole loan conduit activity, supports our efforts to provide liquidity to the Single-Family and Multifamily mortgage markets. “Loss mitigation” supports our loss mitigation efforts through the purchase of delinquent loans from MBS trusts. “Other” represents assets that were previously purchased for investment purposes. More than half of the balance of “Other” consisted of reverse mortgage loans and Fannie Mae-wrapped reverse mortgage securities
as of September 30, 2017
and
December 31, 2016
.
|
Table 12: Retained Mortgage Portfolio Profile
|
|||||||||||||||||||||||||||||
|
As of
|
|||||||||||||||||||||||||||||
|
September 30, 2017
|
December 31, 2016
|
||||||||||||||||||||||||||||
|
Single-Family
|
Multifamily
|
Total
|
% of Mortgage Credit Book of Business
|
Single-Family
|
Multifamily
|
Total
|
% of Mortgage Credit Book of Business
|
||||||||||||||||||||||
|
(Dollars in millions)
|
|||||||||||||||||||||||||||||
|
Lender liquidity
|
$
|
52,041
|
|
$
|
8,095
|
|
$
|
60,136
|
|
2
|
%
|
$
|
36,272
|
|
$
|
7,694
|
|
$
|
43,966
|
|
2
|
%
|
|||||||
|
Loss mitigation
|
131,077
|
|
292
|
|
131,369
|
|
4
|
|
164,028
|
|
376
|
|
164,404
|
|
5
|
|
|||||||||||||
|
Other
|
47,808
|
|
5,820
|
|
53,628
|
|
2
|
|
52,202
|
|
11,782
|
|
63,984
|
|
2
|
|
|||||||||||||
|
Total
|
$
|
230,926
|
|
$
|
14,207
|
|
$
|
245,133
|
|
8
|
%
|
$
|
252,502
|
|
$
|
19,852
|
|
$
|
272,354
|
|
9
|
%
|
|||||||
|
Mortgage Credit Book of Business
|
||||
Table 13
displays the composition of our mortgage credit book of business based on unpaid principal balance. Our single-family mortgage credit book of business accounted for
92%
of our mortgage credit book of business
as of September 30, 2017
and
December 31, 2016
. While our mortgage credit book of business includes all of our mortgage-related assets, both on- and off-balance sheet, our guaranty book of business excludes non-Fannie Mae mortgage-related securities held in our retained mortgage portfolio for which we do not provide a guaranty.
|
Fannie Mae Third Quarter 2017 Form 10-Q
|
25
|
|
|
MD&A | Mortgage Credit Book of Business
|
||
|
Table 13: Composition of Mortgage Credit Book of Business
|
|||||||||||||||||||||||
|
As of
|
|||||||||||||||||||||||
|
September 30, 2017
|
December 31, 2016
|
||||||||||||||||||||||
|
Single-Family
|
Multifamily
|
Total
|
Single-Family
|
Multifamily
|
Total
|
||||||||||||||||||
|
(Dollars in millions)
|
|||||||||||||||||||||||
|
Mortgage loans and Fannie Mae MBS
(1)
|
$
|
2,882,463
|
|
$
|
253,031
|
|
$
|
3,135,494
|
|
$
|
2,838,086
|
|
$
|
229,896
|
|
$
|
3,067,982
|
|
|||||
|
Unconsolidated Fannie Mae MBS, held by third parties
(2)
|
6,688
|
|
1,086
|
|
7,774
|
|
7,795
|
|
1,159
|
|
8,954
|
|
|||||||||||
|
Other credit guarantees
(3)
|
1,925
|
|
12,564
|
|
14,489
|
|
2,193
|
|
13,142
|
|
15,335
|
|
|||||||||||
|
Guaranty book of business
|
$
|
2,891,076
|
|
$
|
266,681
|
|
$
|
3,157,757
|
|
$
|
2,848,074
|
|
$
|
244,197
|
|
$
|
3,092,271
|
|
|||||
|
Other agency mortgage-related securities
(4)
|
1,730
|
|
—
|
|
1,730
|
|
2,500
|
|
—
|
|
2,500
|
|
|||||||||||
|
Other mortgage-related securities
(5)
|
3,623
|
|
860
|
|
4,483
|
|
4,980
|
|
2,752
|
|
7,732
|
|
|||||||||||
|
Mortgage credit book of business
|
$
|
2,896,429
|
|
$
|
267,541
|
|
$
|
3,163,970
|
|
$
|
2,855,554
|
|
$
|
246,949
|
|
$
|
3,102,503
|
|
|||||
|
Guaranty Book of Business Detail:
|
|||||||||||||||||||||||
|
Conventional Guaranty Book of Business
(6)
|
$
|
2,849,182
|
|
$
|
265,399
|
|
$
|
3,114,581
|
|
$
|
2,802,572
|
|
$
|
242,834
|
|
$
|
3,045,406
|
|
|||||
|
Government Guaranty Book of Business
(7)
|
$
|
41,894
|
|
$
|
1,282
|
|
$
|
43,176
|
|
$
|
45,502
|
|
$
|
1,363
|
|
$
|
46,865
|
|
|||||
__________
|
(1)
|
Consists of mortgage loans and Fannie Mae MBS recognized in our condensed consolidated balance sheets. The principal balance of resecuritized Fannie Mae MBS is included only once in the reported amount.
|
|
(2)
|
The principal balance of resecuritized Fannie Mae MBS is included only once in the reported amount.
|
|
(3)
|
Consists of single-family and multifamily credit enhancements that we have provided and that are not otherwise reflected in the table.
|
|
(4)
|
Consists of mortgage-related securities issued by Freddie Mac and Ginnie Mae.
|
|
(5)
|
Primarily includes mortgage revenue bonds, Alt-A and subprime private-label securities, and CMBS.
|
|
(6)
|
Consists of mortgage loans and mortgage-related securities that are not guaranteed or insured, in whole or in part, by the U.S. government or one of its agencies.
|
|
(7)
|
Consists of mortgage loans and mortgage-related securities guaranteed or insured, in whole or in part, by the U.S. government or one of its agencies.
|
The Federal Housing Enterprises Financial Safety and Soundness Act of 1992, as amended by the Federal Housing Finance Regulatory Reform Act of 2008 (together, the “GSE Act”), requires us to set aside each year an amount equal to 4.2 basis points for each dollar of the unpaid principal balance of our total new business purchases and to pay this amount to specified U.S. Department of Housing and Urban Development (“HUD”) and Treasury funds. New business purchases consist of single-family and multifamily whole mortgage loans purchased during the period and single-family and multifamily mortgage loans underlying Fannie Mae MBS issued during the period pursuant to lender swaps. In February 2017, we paid $268 million to the funds based on our new business purchases in
2016
. Our new business purchases were
$421.4 billion
for the
first nine months
of
2017
. Accordingly, we recognized an expense of
$177 million
related to this obligation for the
first nine months
of
2017
. We expect to pay this amount, plus additional amounts to be accrued based on our new business purchases in the last three months of 2017, to the funds on or before March 1, 2018. See “Business—Legislation and Regulation—GSE Act and Other Regulation of Our Business—Affordable Housing Allocations” in our
2016
Form 10-K for more information regarding this obligation.
|
Business Segments
|
||||
Overview
We have two reportable business segments: Single-Family and Multifamily. Previously, we had a third reportable business segment, Capital Markets, which was incorporated into the Single-Family and Multifamily segments in the fourth quarter of 2016. Results of our two business segments are intended to reflect each segment as if it were a stand-alone business. We have revised the presentation of our segment results for the prior periods to be consistent with the current period presentation.
|
Fannie Mae Third Quarter 2017 Form 10-Q
|
26
|
|
|
MD&A | Business Segments
|
||
This section describes the following for each of our business segments:
|
•
|
market conditions relating to the business segment;
|
|
•
|
the segment’s business and financial results; and
|
|
•
|
credit risk management relating to the business segment.
|
This section should be read together with our comparative discussion of our condensed consolidated results of operations in “
Consolidated Results of Operations
.”
Single-Family Business
Single-Family Housing and Mortgage Market and Economic Conditions
According to the U.S. Bureau of Economic Analysis advance estimate, the inflation-adjusted U.S. gross domestic product, or GDP, rose by
3.0%
on an annualized basis in the
third quarter
of
2017
, compared with an increase of
3.1%
in the
second quarter
of
2017
. The overall economy gained an estimated
274,000
non-farm jobs in the
third quarter
of
2017
. According to the U.S. Bureau of Labor Statistics, over the 12 months ending in
September
2017
, the economy created an estimated
1.8 million
non-farm jobs. The unemployment rate was
4.2%
in
September
2017
, compared with
4.4%
in
June 2017
.
According to the Federal Reserve, total U.S. residential mortgage debt outstanding, which includes
$10.4 trillion
of single-family debt outstanding, was estimated to be approximately
$11.7 trillion
as of
June 30, 2017
(the latest date for which information is available) and
$11.6 trillion
as of
December 31, 2016
.
We forecast that total originations in the U.S. single-family mortgage market in
2017
will decrease from
2016
levels by approximately
13%
from an estimated
$2.05 trillion
in
2016
to
$1.79 trillion
in
2017
, and that the amount of originations in the U.S. single-family mortgage market that are refinancings will decrease from an estimated
$1.0 trillion
in
2016
to
$662 billion
in
2017
.
Housing sales remained relatively flat in the
third quarter
of
2017
compared with the
second quarter
of
2017
. Total existing home sales averaged
5.4 million
units annualized in the
third quarter
of
2017
, a
3.1%
decrease from the second quarter of
2017
, according to data from the National Association of REALTORS
®
. Sales of foreclosed homes and preforeclosure, or “short,” sales (together, “distressed sales”) accounted for
4.0%
of existing home sales in
September
2017
, the same as in
June 2017
and
September
2016
. According to the U.S. Census Bureau, new single-family home sales decreased during the
third quarter
of
2017
, averaging an annualized rate of
603,000
units, a
0.3%
decrease from the
second quarter
of
2017
.
The number of months’ supply, or the inventory/sales ratio, of available existing homes and of new homes were each below their historical average at the end of the
third quarter
of
2017
. According to the U.S. Census Bureau, the months’ supply of new single-family unsold homes was
5.0
months
as of September 30, 2017
, compared with
5.3
months as of
June 30, 2017
. According to the National Association of REALTORS
®
, the months’ supply of existing unsold homes was
4.2
months
as of September 30, 2017
, the same as of
June 30, 2017
.
The overall mortgage market serious delinquency rate fell to
2.5%
as of
June 30, 2017
(the latest date for which information is available), according to the Mortgage Bankers Association’s National Delinquency Survey, compared with
3.1%
as of
June 30, 2016
. We provide information about Fannie Mae’s serious delinquency rate in “Single-Family Mortgage Credit Risk Management” below.
Based on our home price index, we estimate that home prices on a national basis increased by
1.1%
in the
third quarter
of
2017
and by
5.3%
in the
first nine months
of
2017
, following increases of
5.7%
in
2016
,
4.6%
in
2015
and
4.2%
in
2014
. Our home price estimates are based on preliminary data and are subject to change as additional data become available.
Thirty-year fixed-rate mortgage rates ended the quarter at
3.83%
for the week of
September 30, 2017
,
down
from
3.88%
for the week of
June 30, 2017
, according to Freddie Mac’s Primary Mortgage Market Survey
®
.
|
Fannie Mae Third Quarter 2017 Form 10-Q
|
27
|
|
|
MD&A | Business Segments
|
||
Single-Family Business Metrics
|
Table 14: Single-Family Business Key Performance Data
|
|||||||||||||||||||
|
For the Three Months Ended September 30,
|
For the Nine Months Ended September 30,
|
||||||||||||||||||
|
2017
|
2016
|
2017
|
2016
|
||||||||||||||||
|
(Dollars in millions)
|
|||||||||||||||||||
|
Securitization Activity/New Business
|
|||||||||||||||||||
|
Single-family Fannie Mae MBS issuances
|
$
|
138,603
|
|
$
|
166,023
|
|
$
|
387,118
|
|
$
|
399,906
|
|
|||||||
|
Single-family Fannie Mae MBS outstanding, at end of period
|
$
|
2,738,647
|
|
$
|
2,646,908
|
|
$
|
2,738,647
|
|
$
|
2,646,908
|
|
|||||||
|
Portfolio Data
|
|||||||||||||||||||
|
Single-family retained mortgage portfolio, at end of period
|
$
|
230,926
|
|
$
|
283,372
|
|
$
|
230,926
|
|
$
|
283,372
|
|
|||||||
|
Credit Guaranty Activity
|
|||||||||||||||||||
|
Average single-family guaranty book of business
(1)
|
$
|
2,882,733
|
|
$
|
2,821,030
|
|
$
|
2,869,986
|
|
$
|
2,823,787
|
|
|||||||
|
Average charged guaranty fee on single-family guaranty book of business:
(2)
|
|||||||||||||||||||
|
Fee, net of TCCA fees (in basis points)
(3)
|
42.4
|
|
41.1
|
|
42.1
|
|
40.7
|
|
|||||||||||
|
Total fee (in basis points)
|
49.9
|
|
47.8
|
|
49.4
|
|
47.2
|
|
|||||||||||
|
Average charged guaranty fee on new single-family acquisitions:
(4)
|
|||||||||||||||||||
|
Fee, net of TCCA fees (in basis points)
(3)
|
47.1
|
|
46.2
|
|
47.9
|
|
47.3
|
|
|||||||||||
|
Total fee (in basis points)
|
57.1
|
|
56.2
|
|
57.9
|
|
57.3
|
|
|||||||||||
|
Single-family credit loss ratio (in basis points)
(5)
|
8.3
|
|
8.8
|
|
11.3
|
|
14.2
|
|
|||||||||||
|
Single-family serious delinquency rate, at end of period
(6)
|
1.01
|
|
%
|
1.24
|
|
%
|
1.01
|
|
%
|
1.24
|
|
%
|
|||||||
__________
|
(1)
|
Our single-family guaranty book of business consists of (a) single-family mortgage loans of Fannie Mae, (b) single-family mortgage loans underlying Fannie Mae MBS, and (c) other credit enhancements that we provide on single-family mortgage assets, such as long-term standby commitments. It excludes non-Fannie Mae single-family mortgage-related securities held in our retained mortgage portfolio for which we do not provide a guaranty.
|
|
(2)
|
Calculated based on the average guaranty fee rate for our single-family guaranty arrangements outstanding during the period plus the recognition of any upfront cash payments over an estimated average life.
|
|
(3)
|
Excludes the impact of a 10 basis point guaranty fee increase implemented in 2012 pursuant to the TCCA, the incremental revenue from which is remitted to Treasury and not retained by us.
|
|
(4)
|
Calculated based on the average guaranty fee rate for our single-family guaranty arrangements entered into during the period plus the recognition of any upfront cash payments over an estimated average life.
|
|
(5)
|
Calculated based on single-family segment credit losses divided by the average single-family guaranty book of business.
|
|
(6)
|
Calculated based on the number of single-family conventional loans that are 90 days or more past due or in the foreclosure process, divided by the number of loans in our single-family conventional guaranty book of business.
|
Our single-family Fannie Mae MBS issuances
decreased
in the
third quarter
and
first nine months
of
2017
compared with the
third quarter
and
first nine months
of
2016
driven primarily by a decrease in refinance activity, partially offset by an increase in our acquisition of home purchase mortgage loans in the
third quarter
and
first nine months
of
2017
.
|
Fannie Mae Third Quarter 2017 Form 10-Q
|
28
|
|
|
MD&A | Business Segments
|
||
Single-Family Business Financial Results
|
Table 15: Single-Family Business Financial Results
|
|||||||||||||||||||||||
|
For the Three Months Ended September 30,
|
For the Nine Months Ended September 30,
|
||||||||||||||||||||||
|
2017
|
2016
|
Variance
|
2017
|
2016
|
Variance
|
||||||||||||||||||
|
(Dollars in millions)
|
|||||||||||||||||||||||
|
Net interest income
(1)
|
$
|
4,627
|
|
$
|
4,857
|
|
$
|
(230
|
)
|
$
|
13,749
|
|
$
|
13,832
|
|
$
|
(83
|
)
|
|||||
|
Fee and other income
|
1,005
|
|
77
|
|
928
|
|
1,192
|
|
222
|
|
970
|
|
|||||||||||
|
Net revenues
|
5,632
|
|
4,934
|
|
698
|
|
14,941
|
|
14,054
|
|
887
|
|
|||||||||||
|
Investment gains, net
|
286
|
|
399
|
|
(113
|
)
|
557
|
|
735
|
|
(178
|
)
|
|||||||||||
|
Fair value losses, net
|
(300
|
)
|
(499
|
)
|
199
|
|
(997
|
)
|
(5,028
|
)
|
4,031
|
|
|||||||||||
|
Administrative expenses
|
(580
|
)
|
(582
|
)
|
2
|
|
(1,781
|
)
|
(1,788
|
)
|
7
|
|
|||||||||||
|
Credit-related income (expense)
(2)
|
(294
|
)
|
532
|
|
(826
|
)
|
1,113
|
|
2,895
|
|
(1,782
|
)
|
|||||||||||
|
TCCA fees
(1)
|
(531
|
)
|
(465
|
)
|
(66
|
)
|
(1,552
|
)
|
(1,358
|
)
|
(194
|
)
|
|||||||||||
|
Other expenses, net
|
(320
|
)
|
(275
|
)
|
(45
|
)
|
(731
|
)
|
(773
|
)
|
42
|
|
|||||||||||
|
Income before federal income taxes
|
3,893
|
|
4,044
|
|
(151
|
)
|
11,550
|
|
8,737
|
|
2,813
|
|
|||||||||||
|
Provision for federal income taxes
|
(1,361
|
)
|
(1,399
|
)
|
38
|
|
(4,014
|
)
|
(3,042
|
)
|
(972
|
)
|
|||||||||||
|
Net income
|
$
|
2,532
|
|
$
|
2,645
|
|
$
|
(113
|
)
|
$
|
7,536
|
|
$
|
5,695
|
|
$
|
1,841
|
|
|||||
__________
|
(1)
|
Reflects the impact of a 10 basis point guaranty fee increase implemented in 2012 pursuant to the TCCA, the incremental revenue from which is remitted to Treasury. The resulting revenue is included in net interest income and the expense is recognized as “TCCA fees.”
|
|
(2)
|
Consists of the benefit (provision) for credit losses and foreclosed property expense.
|
Single-family net income decreased in the
third quarter
of
2017
compared with the
third quarter
of
2016
driven by a shift to credit-related expense from credit-related income and a decrease in net interest income. The decrease in net income was partially offset by an increase in fee and other income. Single-family net income increased in the
first nine months
of
2017
compared with the
first nine months
of
2016
driven by lower fair value losses and an increase in fee and other income, partially offset by lower credit-related income.
Single-family net interest income
decreased
in the
third quarter
of
2017
compared with the
third quarter
of
2016
, primarily due to a decline in the average balance of our retained mortgage portfolio partially offset by a slight increase in single-family guaranty fee income. The drivers of net interest income for the single-family segment for the third quarter of 2017 are consistent with the drivers of net interest income discussed in our condensed consolidated statements of operations and comprehensive income. See “
Consolidated Results of Operations
—
Net Interest Income
” for more information on the drivers of our net interest income.
Fee and other income increased in the
third quarter
and
first nine months
of
2017
compared with the
third quarter
and
first nine months
of
2016
due to income recognized in the third quarter of 2017 resulting from a settlement agreement resolving legal claims relating to private-label securities we purchased.
Fair value losses
decreased
in the
third quarter
and
first nine months
of
2017
compared with the
third quarter
and
first nine months
of
2016
. The fair value losses that are reported for the single-family segment are consistent with the fair value losses reported in our condensed consolidated statements of operations and comprehensive income. We discuss our fair value gains and losses in “
Consolidated Results of Operations
—
Fair Value Losses, Net
.”
Credit-related expense in the
third quarter
of
2017
was primarily driven by the provision for credit losses resulting from the impact of estimated incurred losses from the hurricanes, partially offset by the benefit for credit losses resulting from increases in actual home prices and the redesignation of certain reperforming loans from HFI to HFS. Credit-related income in the
first nine months
of
2017
was primarily driven by an increase in actual and forecasted home prices and a benefit for credit losses resulting from the redesignation of certain reperforming and nonperforming loans from HFI to HFS, partially offset by estimated incurred losses resulting from the hurricanes. We recognized a benefit for credit losses in the
third quarter
of 2016 primarily due to an increase in home prices, including distressed property valuations. We recognized a benefit for credit losses in the
first nine months
of 2016
|
Fannie Mae Third Quarter 2017 Form 10-Q
|
29
|
|
|
MD&A | Business Segments
|
||
primarily due to an increase in home prices, including distressed property valuations and a decline in interest rates.
Single-Family Mortgage Credit Risk Management
Our strategy in managing single-family mortgage credit risk consists of five primary components:
|
•
|
our acquisition and servicing policies along with our underwriting and servicing standards;
|
|
•
|
the transfer of credit risk through credit risk transfer transactions and the use of credit enhancements;
|
|
•
|
portfolio diversification and monitoring;
|
|
•
|
management of problem loans; and
|
|
•
|
real estate owned (“REO”) management.
|
This section updates our discussion of single-family mortgage credit risk management in our
2016
Form 10-K in “
MD&A
—
Business Segments
—
Single-Family Business
—
Single-Family Mortgage Credit Risk Management
.” For additional information on how we manage risk, see “MD&A—Risk Management” and “Risk Factors” in our
2016
Form 10-K.
The single-family credit statistics we focus on and report below generally relate to our single-family conventional guaranty book of business, which represents the substantial majority of our total single-family guaranty book of business. We exclude from these credit statistics approximately
1%
of our single-family conventional guaranty book of business for which our loan level information is incomplete
as of September 30, 2017
and
December 31, 2016
. We typically obtain this data from the sellers or servicers of the mortgage loans in our guaranty book of business and receive representations and warranties from them as to the accuracy of the information. While we perform various quality assurance checks by sampling loans to assess compliance with our underwriting and eligibility criteria, we do not independently verify all reported information. We rely on a combination of data verification tools we make available to lenders and lender representations regarding the accuracy of the characteristics of loans in our guaranty book of business. We provide information on non-Fannie Mae mortgage-related securities held in our portfolio in “
Note 5, Investments in Securities
.”
Single-Family Acquisition and Servicing Policies and Underwriting and Servicing Standards
For an overview and additional information on our quality control process and recent changes, see “
MD&A
—
Business Segments
—
Single-Family Business
—
Single-Family Mortgage Credit Risk Management
—
Single-Family Acquisition and Servicing Policies and Underwriting and Servicing Standards
” in our
2016
Form 10-K and Second Quarter 2017 Form 10-Q.
Repurchase Requests
If we determine that a mortgage loan did not meet our underwriting or eligibility requirements, loan representations or warranties were violated or a mortgage insurer rescinded coverage, then our mortgage sellers and/or servicers are obligated to either repurchase the loan or foreclosed property, reimburse us for our losses or provide other remedies, unless the loan is eligible for representation and warranty relief as described below. We collectively refer to our demands that mortgage sellers and servicers meet these obligations as repurchase requests. The unpaid principal balance of single-family loans that are subject to a repurchase request has declined significantly since we strengthened our underwriting standards in late 2008 and 2009, implemented changes to our quality control process in 2013 and implemented our revised representation and warranty framework described below.
As of September 30, 2017
, we had issued repurchase requests on approximately
0.09%
of the
$594.4 billion
of unpaid principal balance of single-family loans delivered to us during the twelve months ended January 2017. Our total outstanding repurchase requests were
$202 million
as of September 30, 2017
, compared with
$303 million
as of
December 31, 2016
.
Representation and Warranty Relief
We implemented a revised representation and warranty framework in 2013 to provide lenders with a higher degree of certainty and clarity regarding their exposure to repurchase requests on future deliveries, as well as greater consistency around repurchase timelines and remedies. This framework was further revised in 2014. Under the framework, lenders are relieved of certain repurchase liabilities for loans that meet specific requirements. In addition, through our Day 1 Certainty
TM
initiative we have developed new tools that enable lenders to obtain relief from certain representations and warranties at an earlier date than provided for under the
|
Fannie Mae Third Quarter 2017 Form 10-Q
|
30
|
|
|
MD&A | Business Segments
|
||
framework. For information on our representation and warranty framework and our Day 1 Certainty initiative, see “
MD&A
—
Business Segments
—
Single-Family Business
—
Single-Family Mortgage Credit Risk Management
—
Single-Family Acquisition and Servicing Policies and Underwriting and Servicing Standards
—
Representation and Warranty Relief
” in our
2016
Form 10-K.
As of September 30, 2017
, approximately
54%
of the outstanding loans in our single-family conventional guaranty book of business were acquired after January 1, 2013 and are subject to the revised representation and warranty framework, compared with
48%
as of
December 31, 2016
.
Table 16
below displays information regarding the relief status of outstanding single-family conventional loans, based only on payment history or the satisfactory conclusion of a full-file quality control review, delivered to us beginning in 2013 under the revised representation and warranty framework.
|
Table 16: Representation and Warranty Status of Single-Family Conventional Loans Acquired in 2013-2017
|
||||||||||||||||||||
|
As of September 30, 2017
|
||||||||||||||||||||
|
Refi Plus
|
Non-Refi Plus
|
Total
|
||||||||||||||||||
|
Unpaid Principal Balance
|
Number of Loans
|
Unpaid Principal Balance
|
Number of Loans
|
Unpaid Principal Balance
|
Number of Loans
|
|||||||||||||||
|
(Dollars in millions)
|
||||||||||||||||||||
|
Single-family conventional loans that:
|
||||||||||||||||||||
|
Obtained relief
|
$
|
165,881
|
|
1,216,744
|
|
$
|
423,831
|
|
2,325,929
|
|
$
|
589,712
|
|
3,542,673
|
|
|||||
|
Remain eligible for relief
|
19,566
|
|
130,176
|
|
1,172,898
|
|
5,418,206
|
|
1,192,464
|
|
5,548,382
|
|
||||||||
|
Are not eligible for relief
|
4,521
|
|
30,430
|
|
17,490
|
|
93,889
|
|
22,011
|
|
124,319
|
|
||||||||
|
Total outstanding loans acquired since January 1, 2013
|
$
|
189,968
|
|
1,377,350
|
|
$
|
1,614,219
|
|
7,838,024
|
|
$
|
1,804,187
|
|
9,215,374
|
|
|||||
As of September 30, 2017
, approximately
38%
of loans acquired under the revised representation and warranty framework had obtained relief, compared with
37%
as of
December 31, 2016
. Providing lenders with relief from repurchasing loans for breaches of certain representations and warranties on loans that meet specified eligibility requirements shifts some of the risk of non-compliance with our requirements back to us. However, we believe that we have taken appropriate steps to mitigate this risk, including moving the primary focus and timing of our quality control reviews to shortly after loan delivery. We also retain the right to review all loans, including reviews for any violations of “life of loan” representations and warranties.
Transfer of Mortgage Credit Risk
:
Single-Family Credit Risk Transfer Transactions
Our Single-Family business has developed risk-sharing capabilities to transfer portions of our single-family mortgage credit risk to the private market. The goal of these transactions is, to the extent economically sensible, to transfer a portion of the existing mortgage credit risk on a portion of recently acquired loans in our single-family guaranty book of business in order to reduce the economic risk to us and to taxpayers of future borrower defaults. Our primary method of achieving this objective has been through our CAS and CIRT transactions. In these transactions, we transfer to investors a portion of the mortgage credit risk associated with losses on a reference pool of mortgage loans and in exchange we pay investors a premium that effectively reduces the guaranty fee income we retain on the loans. We enter into other types of credit risk transfer transactions in addition to our CAS and CIRT transactions, including lender risk-sharing transactions. For information on our credit risk transfer transactions, see “
MD&A
—
Business Segments
—
Single-Family Business
—
Single-Family Mortgage Credit Risk Management
—
Transfer of Mortgage Credit Risk
—Credit Risk Transfer Transactions” in our
2016
Form 10-K.
As of September 30, 2017
,
$884 billion
in outstanding unpaid principal balance of our single-family loans, or
31%
of the loans in our single-family conventional guaranty book of business measured by unpaid principal balance, were included in a reference pool for a credit risk transfer transaction. During the
first nine months
of
2017
, pursuant to our credit risk transfer transactions, we transferred a portion of the mortgage credit risk on single-family mortgages with an unpaid principal balance of
$345 billion
at the time of the transactions. Our CAS and CIRT transactions are our primary credit risk transfer transactions. In the
first nine months
of
2017
, we paid
$568 million
on our outstanding CAS debt for the spread over LIBOR at the time of issuance of the debt and
$127 million
in CIRT premiums, compared with
$377 million
on CAS debt and
$77 million
in CIRT premiums in the
first
|
Fannie Mae Third Quarter 2017 Form 10-Q
|
31
|
|
|
MD&A | Business Segments
|
||
nine months
of
2016
. These amounts increased from the
first nine months
of
2016
to the
first nine months
of
2017
as we continue to transfer credit risk on a larger portion of our single-family book of business.
We generally include approximately half of our recent single-family acquisitions in credit risk transfer transactions, as we target only certain types of loan categories for these transactions. Loan categories we have targeted for credit risk transfer transactions generally consist of fixed-rate 30-year single-family conventional loans that meet certain credit performance characteristics, are non-Refi Plus and have LTV ratios between 60% and 97%. The portion of our single-family loan acquisitions we include in credit risk transfer transactions can vary from period to period based on market conditions and other factors.
Table 17
displays the mortgage credit risk transferred to third parties and retained by Fannie Mae at the time of issuance and the outstanding reference pool balances
as of September 30, 2017
pursuant to our single-family credit risk transfer transactions.
|
Table 17: Single-Family Credit Risk Transfer Transactions
|
||||||||||||||||
|
Issuances from Inception to September 30, 2017
|
||||||||||||||||
|
(Dollars in billions)
|
||||||||||||||||

|
Senior
|
Fannie Mae
(1)
|
||||||||||||||
|
$1,112
|
||||||||||||||||
|
Mezzanine
|
Fannie Mae
(1)
|
CIRT
(2)(3)
|
CAS
(2)
|
Lender Risk-Sharing
(2)
|
Initial Reference Pool
(4)
|
|||||||||||
|
$1
|
$5
|
$26
|
*
|
$1,153
|
||||||||||||
|
First Loss
|
Fannie Mae
(1)
|
CAS
(2)(5)
|
Lender Risk-Sharing
(2)
|
|||||||||||||
|
$6
|
$2
|
$1
|
||||||||||||||
|
Outstanding as of September 30, 2017
|
||||||||||||||||
|
(Dollars in billions)
|
||||||||||||||||
|
Senior
|
Fannie Mae
(1)
|
||||||||||||||
|
$849
|
||||||||||||||||
|
Mezzanine
|
Fannie Mae
(1)
|
CIRT
(2)(3)
|
CAS
(2)
|
Lender Risk-Sharing
(2)
|
Outstanding Reference Pool
(4)(6)
|
|||||||||||
|
$1
|
$5
|
$20
|
*
|
$884
|
||||||||||||
|
First Loss
|
Fannie Mae
(1)
|
CAS
(2)(5)
|
Lender Risk-Sharing
(2)
|
|||||||||||||
|
$6
|
$2
|
$1
|
||||||||||||||
__________
|
*
|
Represents less than $500 million.
|
|
(1)
|
Credit risk retained by Fannie Mae in CAS, CIRT and lender risk-sharing transactions. Tranche sizes vary across programs.
|
|
(2)
|
Credit risk transferred to third parties. Tranche sizes vary across programs.
|
|
(3)
|
Includes mortgage pool insurance transactions covering loans with an unpaid principal balance of approximately
$7 billion
at issuance and approximately
$4 billion
outstanding
as of September 30, 2017
.
|
|
Fannie Mae Third Quarter 2017 Form 10-Q
|
32
|
|
|
MD&A | Business Segments
|
||
|
(4)
|
For CIRT and some lender risk-sharing transactions, “reference pool” reflects a pool of covered loans.
|
|
(5)
|
For CAS transactions, “First Loss” represents all B tranche balances.
|
|
(6)
|
For CAS and some lender risk-sharing transactions, represents outstanding reference pools, not the outstanding unpaid principal balance of the underlying loans,
as of September 30, 2017
.
|
As shown in the outstanding balances in
Table 17
above, we have designed our credit risk transfer transactions so that prepayment activity typically has a more substantial impact on the senior tranches retained by Fannie Mae than on the risk transferred to third parties. Principal payments on the underlying reference pool are first allocated between the senior tranches and then applied sequentially to the subordinate tranches. Losses are applied in reverse sequential order starting with the first loss tranche. For CAS transactions, all principal payments and losses are allocated pro rata between the sold notes and the portion we retain. The
decreases
in outstanding balances from issuance to
September 30, 2017
in the senior and mezzanine tranches are the result of paydowns. Outstanding balances from issuance to
September 30, 2017
in the first loss tranches
decreased
only slightly as the losses allocated to those tranches were insignificant.
While these deals are expected to mitigate some of our potential future credit losses, they are not designed to shield us from all losses. We retain a portion of the risk of future credit losses on loans covered by CAS and CIRT transactions, including all or at least half of the first loss positions and all of the senior loss positions. In addition, on our CAS transactions, we retain a pro rata share of risk equal to approximately
5%
of all notes sold. When structuring these transactions, we seek to optimize benefit to cost considerations by taking into account a number of factors, including the level of investor demand, liquidity and pricing levels, and the amount of risk reduction provided assuming various economic scenarios. Due to differences in accounting, there also could be a significant lag between the time when we recognize a provision for credit losses and when we recognize the related recovery from our CAS transactions. See “Risk Factors” in our
2016
Form 10-K for a discussion of factors that may limit our ability to use credit risk transfer transactions to mitigate some of our potential future credit losses, including factors that may result in these transactions providing less protection than we expect.
We continue to explore ways to innovate and improve our credit risk transfer programs. As part of this continued innovation, we announced a proposed new structure that would enhance our CAS program by structuring our CAS offerings as notes issued by trusts that qualify as real estate mortgage investment conduits. This proposed enhancement to our CAS program is designed to promote the continued growth of the market by expanding the potential investor base for these securities, making the program more attractive to real estate investment trust investors, as well as certain other investors, and limiting investor exposure to Fannie Mae counterparty risk.
Single-Family Portfolio Diversification and Monitoring
Overview
Diversification within our single-family mortgage credit book of business by product type, loan characteristics and geography is an important factor that influences credit quality and performance and may reduce our credit risk. We monitor various loan attributes, in conjunction with housing market and economic conditions, to determine if our pricing, eligibility and underwriting criteria accurately reflect the risk associated with loans we acquire or guarantee. In some cases, we may decide to significantly reduce our participation in riskier loan product categories. We also review the payment performance of loans in order to help identify potential problem loans early in the delinquency cycle and to guide the development of our loss mitigation strategies. For information on key loan attributes, see “
MD&A
—
Business Segments
—
Single-Family Business
—
Single-Family Mortgage Credit Risk Management
—
Single-Family Portfolio Diversification and Monitoring
” in our
2016
Form 10-K.
|
Fannie Mae Third Quarter 2017 Form 10-Q
|
33
|
|
|
MD&A | Business Segments
|
||
Credit Risk Profile of Our Single-Family Acquisitions and Book of Business
Table 18
below displays information regarding the credit characteristics of the loans in our single-family conventional guaranty book of business by acquisition period.
|
Table 18: Selected Credit Characteristics of Single-Family Conventional Guaranty Book of Business, by Acquisition Period
|
|||||||||||
|
As of September 30, 2017
|
|||||||||||
|
% of Single-Family Conventional Guaranty Book of Business
(1)
|
Current Estimated Mark-to-Market LTV Ratio
(2)
|
Current Estimated Mark-to-Market LTV Ratio>100%
(3)
|
Serious Delinquency Rate
|
||||||||
|
2009-2017 acquisitions, excluding HARP and other Refi Plus loans
|
76
|
%
|
57
|
%
|
*
|
%
|
0.23
|
%
|
|||
|
HARP loans
(4)
|
8
|
71
|
6
|
1.09
|
|||||||
|
Other Refi Plus loans
(5)
|
6
|
42
|
*
|
0.43
|
|||||||
|
2005-2008 acquisitions
|
7
|
67
|
8
|
5.69
|
|||||||
|
2004 and prior acquisitions
|
3
|
40
|
1
|
2.78
|
|||||||
|
Total single-family conventional guaranty book of business
|
100
|
%
|
58
|
%
|
1
|
%
|
1.01
|
%
|
|||
__________
|
*
|
Represents less than 0.5%.
|
|
(1)
|
Calculated based on the aggregate unpaid principal balance of single-family loans for each category divided by the aggregate unpaid principal balance of loans in our single-family conventional guaranty book of business
as of September 30, 2017
.
|
|
(2)
|
The aggregate estimated mark-to-market LTV ratio is based on the unpaid principal balance of the loans as of the end of the period divided by the estimated current value of the properties, which we calculate using an internal valuation model that estimates periodic changes in home value. Excludes loans for which this information is not readily available.
|
|
(3)
|
The current estimated mark-to-market LTV ratio greater than 100% is based on the unpaid principal balance of the loans with mark-to-market LTV ratios greater than 100% for each category as of the end of the period divided by the aggregate unpaid principal balance of loans for each category in our single-family conventional guaranty book of business
as of September 30, 2017
.
|
|
(4)
|
HARP loans, which we began to acquire in 2009, have LTV ratios at origination in excess of 80%. Some borrowers for HARP loans may have lower FICO
credit scores and may provide less documentation than we would otherwise require.
As of September 30, 2017
, HARP loans had a weighted average FICO
credit score at origination of
725
compared with
745
for loans in our single-family book of business overall.
|
|
(5)
|
Other Refi Plus loans, which we began to acquire in 2009, includes all other Refi Plus loans that are not HARP loans.
|
|
Fannie Mae Third Quarter 2017 Form 10-Q
|
34
|
|
|
MD&A | Business Segments
|
||
Table 19
displays our single-family conventional business volumes and our single-family conventional guaranty book of business, based on certain key risk characteristics that we use to evaluate the risk profile and credit quality of our single-family loans.
|
Table 19: Risk Characteristics of Single-Family Conventional Business Volume and Guaranty Book of Business
(1)
|
|||||||||||||||||||||||||||
|
Percent of Single-Family Conventional Business
Volume at Acquisition
(2)
|
Percent of Single-Family Conventional Guaranty Book of
Business
(3)(4)
As of
|
||||||||||||||||||||||||||
|
For the Three Months Ended September 30,
|
For the Nine Months Ended September 30,
|
||||||||||||||||||||||||||
|
2017
|
2016
|
2017
|
2016
|
September 30, 2017
|
December 31, 2016
|
||||||||||||||||||||||
|
Original LTV ratio:
(5)
|
|||||||||||||||||||||||||||
|
<= 60%
|
16
|
|
%
|
21
|
|
%
|
18
|
|
%
|
19
|
|
%
|
21
|
|
%
|
21
|
|
%
|
|||||||||
|
60.01% to 70%
|
12
|
|
14
|
|
13
|
|
14
|
|
14
|
|
14
|
|
|||||||||||||||
|
70.01% to 80%
|
39
|
|
38
|
|
39
|
|
39
|
|
38
|
|
38
|
|
|||||||||||||||
|
80.01% to 90%
|
13
|
|
12
|
|
12
|
|
12
|
|
11
|
|
11
|
|
|||||||||||||||
|
90.01% to 100%
|
20
|
|
15
|
|
18
|
|
16
|
|
13
|
|
12
|
|
|||||||||||||||
|
Greater than 100%
|
*
|
|
*
|
|
*
|
|
*
|
|
3
|
|
4
|
|
|||||||||||||||
|
Total
|
100
|
|
%
|
100
|
|
%
|
100
|
|
%
|
100
|
|
%
|
100
|
|
%
|
100
|
|
%
|
|||||||||
|
Weighted average
|
76
|
|
%
|
74
|
|
%
|
75
|
|
%
|
74
|
|
%
|
75
|
|
%
|
75
|
|
%
|
|||||||||
|
Average loan amount
|
$
|
228,445
|
|
$
|
232,225
|
|
$
|
225,123
|
|
$
|
228,183
|
|
$
|
165,691
|
|
$
|
163,200
|
|
|||||||||
|
Estimated mark-to-market LTV ratio:
(6)
|
|||||||||||||||||||||||||||
|
<= 60%
|
53
|
|
%
|
49
|
|
%
|
|||||||||||||||||||||
|
60.01% to 70%
|
19
|
|
19
|
|
|||||||||||||||||||||||
|
70.01% to 80%
|
16
|
|
17
|
|
|||||||||||||||||||||||
|
80.01% to 90%
|
8
|
|
9
|
|
|||||||||||||||||||||||
|
90.01% to 100%
|
3
|
|
4
|
|
|||||||||||||||||||||||
|
Greater than 100%
|
1
|
|
2
|
|
|||||||||||||||||||||||
|
Total
|
100
|
|
%
|
100
|
|
%
|
|||||||||||||||||||||
|
Weighted average
|
58
|
|
%
|
60
|
|
%
|
|||||||||||||||||||||
|
Product type:
|
|||||||||||||||||||||||||||
|
Fixed-rate:
(7)
|
|||||||||||||||||||||||||||
|
Long-term
|
85
|
|
%
|
81
|
|
%
|
83
|
|
%
|
81
|
|
%
|
79
|
|
%
|
77
|
|
%
|
|||||||||
|
Intermediate-term
|
12
|
|
17
|
|
14
|
|
17
|
|
16
|
|
17
|
|
|||||||||||||||
|
Interest-only
|
—
|
|
—
|
—
|
|
—
|
|
*
|
|
*
|
|
||||||||||||||||
|
Total fixed-rate
|
97
|
|
98
|
|
97
|
|
98
|
|
95
|
|
94
|
|
|||||||||||||||
|
Adjustable-rate:
|
|||||||||||||||||||||||||||
|
Interest-only
|
—
|
—
|
|
—
|
|
—
|
|
1
|
|
1
|
|
||||||||||||||||
|
Other ARMs
|
3
|
|
2
|
|
3
|
|
2
|
|
4
|
|
5
|
|
|||||||||||||||
|
Total adjustable-rate
|
3
|
|
2
|
|
3
|
|
2
|
|
5
|
|
6
|
|
|||||||||||||||
|
Total
|
100
|
|
%
|
100
|
|
%
|
100
|
|
%
|
100
|
|
%
|
100
|
|
%
|
100
|
|
%
|
|||||||||
|
Number of property units:
|
|||||||||||||||||||||||||||
|
1 unit
|
98
|
|
%
|
98
|
|
%
|
97
|
|
%
|
98
|
|
%
|
97
|
|
%
|
97
|
|
%
|
|||||||||
|
2-4 units
|
2
|
|
2
|
|
3
|
|
2
|
|
3
|
|
3
|
|
|||||||||||||||
|
Total
|
100
|
|
%
|
100
|
|
%
|
100
|
|
%
|
100
|
|
%
|
100
|
|
%
|
100
|
|
%
|
|||||||||
|
Fannie Mae Third Quarter 2017 Form 10-Q
|
35
|
|
|
MD&A | Business Segments
|
||
|
Percent of Single-Family Conventional Business
Volume at Acquisition
(2)
|
Percent of Single-Family Conventional Guaranty Book of
Business
(3)(4)
As of
|
||||||||||||||||||||
|
For the Three Months Ended September 30,
|
For the Nine Months Ended September 30,
|
||||||||||||||||||||
|
2017
|
2016
|
2017
|
2016
|
September 30, 2017
|
December 31, 2016
|
||||||||||||||||
|
Property type:
|
|||||||||||||||||||||
|
Single-family homes
|
90
|
|
%
|
91
|
|
%
|
90
|
|
%
|
90
|
|
%
|
91
|
|
%
|
91
|
|
%
|
|||
|
Condo/Co-op
|
10
|
|
9
|
|
10
|
|
10
|
|
9
|
|
9
|
|
|||||||||
|
Total
|
100
|
|
%
|
100
|
|
%
|
100
|
|
%
|
100
|
|
%
|
100
|
|
%
|
100
|
|
%
|
|||
|
Occupancy type:
|
|||||||||||||||||||||
|
Primary residence
|
89
|
|
%
|
91
|
|
%
|
89
|
|
%
|
90
|
|
%
|
88
|
|
%
|
88
|
|
%
|
|||
|
Second/vacation home
|
4
|
|
4
|
|
4
|
|
4
|
|
4
|
|
4
|
|
|||||||||
|
Investor
|
7
|
|
5
|
|
7
|
|
6
|
|
8
|
|
8
|
|
|||||||||
|
Total
|
100
|
|
%
|
100
|
|
%
|
100
|
|
%
|
100
|
|
%
|
100
|
|
%
|
100
|
|
%
|
|||
|
FICO credit score at origination:
|
|||||||||||||||||||||
|
< 620
(8)
|
*
|
|
%
|
*
|
|
%
|
*
|
|
%
|
*
|
|
%
|
2
|
|
%
|
2
|
|
%
|
|||
|
620 to < 660
|
5
|
|
4
|
|
5
|
|
4
|
|
5
|
|
5
|
|
|||||||||
|
660 to < 700
|
13
|
|
11
|
|
13
|
|
12
|
|
12
|
|
12
|
|
|||||||||
|
700 to < 740
|
23
|
|
20
|
|
23
|
|
21
|
|
20
|
|
20
|
|
|||||||||
|
>= 740
|
59
|
|
65
|
|
59
|
|
63
|
|
61
|
|
61
|
|
|||||||||
|
Total
|
100
|
|
%
|
100
|
|
%
|
100
|
|
%
|
100
|
|
%
|
100
|
|
%
|
100
|
|
%
|
|||
|
Weighted average
|
745
|
|
752
|
|
745
|
|
749
|
|
745
|
|
745
|
|
|||||||||
|
Loan purpose:
|
|||||||||||||||||||||
|
Purchase
|
63
|
|
%
|
47
|
|
%
|
56
|
|
%
|
47
|
|
%
|
38
|
|
%
|
35
|
|
%
|
|||
|
Cash-out refinance
|
19
|
|
18
|
|
21
|
|
18
|
|
20
|
|
20
|
|
|||||||||
|
Other refinance
|
18
|
|
35
|
|
23
|
|
35
|
|
42
|
|
45
|
|
|||||||||
|
Total
|
100
|
|
%
|
100
|
|
%
|
100
|
|
%
|
100
|
|
%
|
100
|
|
%
|
100
|
|
%
|
|||
|
Geographic concentration:
(9)
|
|||||||||||||||||||||
|
Midwest
|
15
|
|
%
|
15
|
|
%
|
14
|
|
%
|
14
|
|
%
|
15
|
|
%
|
15
|
|
%
|
|||
|
Northeast
|
14
|
|
14
|
|
14
|
|
14
|
|
18
|
|
18
|
|
|||||||||
|
Southeast
|
23
|
|
21
|
|
23
|
|
21
|
|
22
|
|
22
|
|
|||||||||
|
Southwest
|
20
|
|
19
|
|
20
|
|
20
|
|
17
|
|
17
|
|
|||||||||
|
West
|
28
|
|
31
|
|
29
|
|
31
|
|
28
|
|
28
|
|
|||||||||
|
Total
|
100
|
|
%
|
100
|
|
%
|
100
|
|
%
|
100
|
|
%
|
100
|
|
%
|
100
|
|
%
|
|||
__________
|
*
|
Represents less than 0.5% of single-family conventional business volume or book of business.
|
|
(1)
|
Second lien mortgage loans held by third parties are not reflected in the original LTV or mark-to-market LTV ratios in this table.
|
|
(2)
|
Calculated based on unpaid principal balance of single-family loans for each category at time of acquisition.
|
|
(3)
|
Calculated based on the aggregate unpaid principal balance of single-family loans for each category divided by the aggregate unpaid principal balance of loans in our single-family conventional guaranty book of business as of the end of each period.
|
|
(4)
|
Our single-family conventional guaranty book of business includes jumbo-conforming and high-balance loans that represented approximately
6%
of our single-family conventional guaranty book of business
as of September 30, 2017
and
December 31, 2016
. See “Business—Legislation and Regulation—Charter Act” and “
MD&A
—
Business Segments
—
Single-Family Business
—
Single-Family Mortgage Credit Risk Management
—
Single-Family Portfolio Diversification and Monitoring
—
Jumbo-Conforming and High-Balance Loans
” in our
2016
Form 10-K for information on our loan limits.
|
|
(5)
|
The original LTV ratio generally is based on the original unpaid principal balance of the loan divided by the appraised property value reported to us at the time of acquisition of the loan. Excludes loans for which this information is not readily available.
|
|
Fannie Mae Third Quarter 2017 Form 10-Q
|
36
|
|
|
MD&A | Business Segments
|
||
|
(6)
|
The aggregate estimated mark-to-market LTV ratio is based on the unpaid principal balance of the loan as of the end of each reported period divided by the estimated current value of the property, which we calculate using an internal valuation model that estimates periodic changes in home value. Excludes loans for which this information is not readily available.
|
|
(7)
|
Long-term fixed-rate consists of mortgage loans with maturities greater than 15 years, while intermediate-term fixed-rate loans have maturities equal to or less than 15 years. Loans with interest-only terms are included in the interest-only category regardless of their maturities.
|
|
(8)
|
Loans acquired after 2009 with FICO credit scores at origination below 620 consist primarily of the refinance of existing loans under our Refi Plus initiative.
|
|
(9)
|
Midwest consists of IL, IN, IA, MI, MN, NE, ND, OH, SD and WI. Northeast consists of CT, DE, ME, MA, NH, NJ, NY, PA, PR, RI, VT and VI. Southeast consists of AL, DC, FL, GA, KY, MD, MS, NC, SC, TN, VA and WV. Southwest consists of AZ, AR, CO, KS, LA, MO, NM, OK, TX and UT. West consists of AK, CA, GU, HI, ID, MT, NV, OR, WA and WY.
|
Our acquisitions in the
first nine months
of
2017
continued to have a strong credit profile with a weighted average original LTV ratio of
75
% and a weighted average FICO
credit score at origination of
745
. As shown in the table above, the
first nine months
of
2017
had a higher proportion of acquisitions consisting of home purchase loans than refinance loans compared with the
first nine months
of
2016
. The shift toward home purchase loans drove up the proportion of our acquisitions consisting of loans with a weighted average original LTV ratio over 90%, as home purchase loans tend to have less equity than refinance loans. Additionally, lower refinancing activity led to a lower weighted average FICO credit score at origination during the
first nine months
of
2017
.
The credit profile of our future acquisitions will depend on many factors. For example, if a higher proportion of our future acquisitions consists of home purchase loans and we acquire lower volumes of refinance loans in future periods, the loans we acquire in those periods may have a higher weighted average original LTV ratio and a lower weighted average FICO credit score at origination than our acquisitions in recent periods. Other factors that may affect the credit profile of our future acquisitions include: our future guaranty fee pricing and our competitors’ pricing, and any impact of that pricing on the volume and mix of loans we acquire; our future eligibility standards and those of mortgage insurers, the Federal Housing Administration and the U.S. Department of Veteran Affairs; changes in interest rates; our future objectives and activities in support of those objectives, including actions we may take to reach additional underserved creditworthy borrowers; government policy; market and competitive conditions; and the volume and characteristics of HARP and high LTV refinance loans we acquire in the future. We expect the ultimate performance of all our loans will be affected by borrower behavior, public policy and macroeconomic trends, including unemployment, the economy and home prices. In addition, if lender customers retain more of the higher-quality loans they originate, it could negatively affect the credit profile of our new single-family acquisitions.
In August 2016, FHFA directed us and Freddie Mac to implement a new high LTV refinance offering aimed at borrowers who are making their mortgage payments on time and whose current LTV ratio exceeds a specified amount. In August 2017, FHFA announced that the new high LTV refinance offering will be available for borrowers whose loans were originated on or after October 1, 2017 and who meet other eligibility requirements. FHFA also directed us and Freddie Mac to extend the HARP sunset date from September 30, 2017 to December 31, 2018. We have also extended the end date of our Refi Plus initiative to December 31, 2018.
See “
MD&A
—
Business Segments
—
Single-Family Business
—
Single-Family Mortgage Credit Risk Management
—
Single-Family Portfolio Diversification and Monitoring
” in our
2016
Form 10-K for more information on the credit characteristics of loans in our guaranty book of business, including HARP and Refi Plus loans, Alt-A loans, jumbo-conforming and high-balance loans, reverse mortgages and mortgage products with rate resets.
Problem Loan Management
Our problem loan management strategies are primarily focused on reducing defaults to avoid losses that would otherwise occur and pursuing foreclosure alternatives to attempt to minimize the severity of the losses we incur. If a borrower does not make required payments, or is in jeopardy of not making payments, we work with the loan servicer to offer workout solutions to minimize the likelihood of foreclosure as well as the severity of loss. Our loan workouts reflect our various types of home retention solutions, including loan modifications, repayment plans and forbearances, and foreclosure alternatives, including short sales and deeds-in-lieu of foreclosure. When appropriate, we seek to move to foreclosure expeditiously. See “
MD&A
—
Business Segments
—
Single-Family Business
—
Single-Family Mortgage Credit Risk Management
—
Problem Loan Management
” in our
2016
Form 10-K for a discussion of our work with mortgage servicers to implement our foreclosure prevention initiatives.
|
Fannie Mae Third Quarter 2017 Form 10-Q
|
37
|
|
|
MD&A | Business Segments
|
||
In the following section, we present statistics on our problem loans, describe efforts undertaken to manage these loans and prevent foreclosures, and provide metrics regarding the performance of our loan workout activities. Unless otherwise noted, single-family delinquency data is calculated based on number of loans. We include single-family conventional loans that we own and those that back Fannie Mae MBS in the calculation of the single-family delinquency rate. Seriously delinquent loans are loans that are 90 days or more past due or in the foreclosure process. Percentage of book outstanding calculations are based on the unpaid principal balance of loans for each category divided by the unpaid principal balance of our total single-family guaranty book of business for which we have detailed loan level information.
Problem Loan Statistics
Table 20
displays the delinquency status of loans in our single-family conventional guaranty book of business (based on number of loans) and changes in the balance of seriously delinquent loans in our single-family conventional guaranty book of business.
|
Table 20: Delinquency Status and Activity of Single-Family Conventional Loans
|
||||||||
|
As of
|
||||||||
|
September 30, 2017
|
December 31, 2016
|
September 30,
2016 |
||||||
|
Delinquency status:
|
||||||||
|
30 to 59 days delinquent
|
1.63
|
%
|
1.51
|
%
|
1.45
|
%
|
||
|
60 to 89 days delinquent
|
0.40
|
|
0.41
|
|
0.39
|
|
||
|
Seriously delinquent (“SDQ”)
|
1.01
|
|
1.20
|
|
1.24
|
|
||
|
Percentage of SDQ loans that have been delinquent for more than 180 days
|
57
|
%
|
59
|
%
|
64
|
%
|
||
|
Percentage of SDQ loans that have been delinquent for more than two years
|
18
|
|
21
|
|
25
|
|
||
|
For the Nine Months Ended September 30,
|
|||||
|
2017
|
2016
|
||||
|
Single-family SDQ loans (number of loans):
|
|||||
|
Beginning balance
|
206,549
|
|
267,174
|
|
|
|
Additions
|
177,449
|
|
183,395
|
|
|
|
Removals:
|
|||||
|
Modifications and other loan workouts
|
(56,048
|
)
|
(60,985
|
)
|
|
|
Liquidations and sales
|
(63,854
|
)
|
(89,236
|
)
|
|
|
Cured or less than 90 days delinquent
|
(91,545
|
)
|
(88,863
|
)
|
|
|
Total removals
|
(211,447
|
)
|
(239,084
|
)
|
|
|
Ending balance
|
172,551
|
|
211,485
|
|
|
Our single-family serious delinquency rate was
1.01%
as of September 30, 2017
, compared with
1.20%
as of
December 31, 2016
. The
decrease
in our serious delinquency rate in the
first nine months
of
2017
was primarily the result of home retention solutions, foreclosure alternatives and completed foreclosures, improved loan payment performance and nonperforming loan sales. Our 30 to 59 days delinquency rate increased to 1.63%
as of September 30, 2017
, compared with 1.51% as of
December 31, 2016
. This increase was greatest in Texas, Florida and Puerto Rico, which were most significantly impacted by the hurricanes. Our 30 to 59 days delinquency rate includes delinquent loans that have a temporary forbearance arrangement.
We expect our single-family serious delinquency rate to continue to decline over the long term; however, because our single-family serious delinquency rate has already declined significantly over the past several years, we expect more modest declines and, as a result, may experience period to period fluctuations in this rate. In addition, we expect our single-family serious delinquency rate will likely increase in the short term due to the hurricanes. Our single-family serious delinquency rate and the period of time that loans remain seriously delinquent continue to be negatively affected by the length of time required to complete a foreclosure in some
|
Fannie Mae Third Quarter 2017 Form 10-Q
|
38
|
|
|
MD&A | Business Segments
|
||
states. Other factors that affect our single-family serious delinquency rate include the pace of loan modifications, the timing and volume of nonperforming loan sales we make, servicer performance, natural disasters, and changes in home prices, unemployment levels and other macroeconomic conditions.
Certain higher-risk loan categories, such as Alt-A loans, loans with higher mark-to-market LTV ratios, and our 2005 through 2008 loan vintages, continue to exhibit higher than average delinquency rates and/or account for a higher share of our credit losses. Single-family loans originated in 2005 through 2008 constituted
7%
of our single-family book of business
as of September 30, 2017
, but constituted
48%
of our seriously delinquent single-family loans
as of September 30, 2017
and drove
66%
of our single-family credit losses in the
first nine months
of
2017
. In addition, loans in certain states such as Florida, New Jersey and New York have exhibited higher than average delinquency rates and/or account for a higher share of our credit losses.
Table 21
displays the serious delinquency rates for, and the percentage of our total seriously delinquent single-family conventional loans represented by, the specified loan categories. We also include information for our loans in California, as this state accounts for a large share of our single-family conventional guaranty book of business. The reported categories are not mutually exclusive.
|
Table 21: Single-Family Conventional Seriously Delinquent Loan Concentration Analysis
|
|||||||||||||||||||||||||||
|
As of
|
|||||||||||||||||||||||||||
|
September 30, 2017
|
December 31, 2016
|
September 30, 2016
|
|||||||||||||||||||||||||
|
Percentage of Book Outstanding
|
Percentage of Seriously Delinquent Loans
(1)
|
Serious Delinquency Rate
|
Percentage of Book Outstanding
|
Percentage of Seriously Delinquent Loans
(1)
|
Serious Delinquency Rate
|
Percentage of Book Outstanding
|
Percentage of Seriously Delinquent Loans
(1)
|
Serious Delinquency Rate
|
|||||||||||||||||||
|
States:
|
|||||||||||||||||||||||||||
|
California
|
19
|
%
|
6
|
%
|
0.43
|
%
|
19
|
%
|
6
|
%
|
0.50
|
%
|
20
|
%
|
6
|
%
|
0.49
|
%
|
|||||||||
|
Florida
|
6
|
|
10
|
|
1.50
|
|
6
|
|
10
|
|
1.89
|
|
6
|
|
11
|
|
2.05
|
|
|||||||||
|
New Jersey
|
4
|
|
7
|
|
2.36
|
|
4
|
|
8
|
|
3.07
|
|
4
|
|
9
|
|
3.47
|
|
|||||||||
|
New York
|
5
|
|
9
|
|
2.13
|
|
5
|
|
10
|
|
2.65
|
|
5
|
|
10
|
|
2.77
|
|
|||||||||
|
All other states
|
66
|
|
68
|
|
0.94
|
|
66
|
|
66
|
|
1.11
|
|
65
|
|
64
|
|
1.11
|
|
|||||||||
|
Product type:
|
|||||||||||||||||||||||||||
|
Alt-A
(2)
|
3
|
|
14
|
|
4.54
|
|
3
|
|
15
|
|
5.00
|
|
3
|
|
16
|
|
5.27
|
|
|||||||||
|
Vintages:
|
|||||||||||||||||||||||||||
|
2004 and prior
|
4
|
|
25
|
|
2.75
|
|
5
|
|
26
|
|
2.82
|
|
4
|
|
26
|
|
2.75
|
|
|||||||||
|
2005-2008
|
7
|
|
48
|
|
5.83
|
|
8
|
|
51
|
|
6.39
|
|
9
|
|
53
|
|
6.49
|
|
|||||||||
|
2009-2017
|
89
|
|
27
|
|
0.33
|
|
87
|
|
23
|
|
0.36
|
|
87
|
|
21
|
|
0.33
|
|
|||||||||
|
Estimated mark-to-market LTV ratio:
|
|||||||||||||||||||||||||||
|
<= 60%
|
53
|
|
40
|
|
0.66
|
|
49
|
|
33
|
|
0.70
|
|
49
|
|
32
|
|
0.69
|
|
|||||||||
|
60.01% to 70%
|
19
|
|
17
|
|
1.05
|
|
19
|
|
15
|
|
1.13
|
|
19
|
|
15
|
|
1.13
|
|
|||||||||
|
70.01% to 80%
|
16
|
|
15
|
|
1.17
|
|
17
|
|
16
|
|
1.31
|
|
17
|
|
16
|
|
1.40
|
|
|||||||||
|
80.01%
to 90%
|
8
|
|
11
|
|
1.77
|
|
9
|
|
13
|
|
2.11
|
|
9
|
|
13
|
|
2.26
|
|
|||||||||
|
90.01% to 100%
|
3
|
|
7
|
|
2.72
|
|
4
|
|
9
|
|
2.99
|
|
4
|
|
9
|
|
3.61
|
|
|||||||||
|
Greater than 100%
|
1
|
|
10
|
|
10.73
|
|
2
|
|
14
|
|
10.44
|
|
2
|
|
15
|
|
10.56
|
|
|||||||||
|
Credit enhanced:
(3)
|
|||||||||||||||||||||||||||
|
Primary
MI & other
(4)
|
19
|
|
26
|
|
1.62
|
|
18
|
|
28
|
|
2.18
|
|
18
|
|
28
|
|
2.19
|
|
|||||||||
|
Credit risk transfer
(5)
|
31
|
|
4
|
|
0.16
|
|
22
|
|
2
|
|
0.17
|
|
23
|
|
2
|
|
0.12
|
|
|||||||||
|
Non-credit enhanced
|
60
|
|
72
|
|
1.05
|
|
67
|
|
70
|
|
1.16
|
|
66
|
|
71
|
|
1.20
|
|
|||||||||
__________
|
(1)
|
Calculated based on the number of single-family loans that were seriously delinquent for each category divided by the total number of single-family conventional loans that were seriously delinquent.
|
|
(2)
|
For a description of our Alt-A loan classification criteria, see “
MD&A
—
Business Segments
—
Single-Family Business
—
Single-Family Mortgage Credit Risk Management
—
Single-Family Portfolio Diversification and Monitoring
” in our
2016
Form 10-K.
|
|
Fannie Mae Third Quarter 2017 Form 10-Q
|
39
|
|
|
MD&A | Business Segments
|
||
|
(3)
|
The credit-enhanced categories are not mutually exclusive. A loan with primary mortgage insurance that is also covered by a credit risk transfer transaction will be included in both the “Primary MI & other” category and the “Credit risk transfer” category. As a result, the “Credit enhanced” and “Non-credit enhanced” categories do not sum to 100%. The total percentage of our single-family conventional guaranty book of business with some form of credit enhancement
as of September 30, 2017
was
40%
.
|
|
(4)
|
Refers to loans included in an agreement used to reduce credit risk by requiring primary mortgage insurance, collateral, letters of credit, corporate guarantees, or other agreements to provide an entity with some assurance that it will be compensated to some degree in the event of a financial loss. Excludes loans covered by credit risk transfer transactions unless such loans are also covered by primary mortgage insurance.
|
|
(5)
|
Refers to loans included in reference pools for credit risk transfer transactions, including loans in these transactions that are also covered by primary mortgage insurance. For Connecticut Avenue Securities and some lender risk-sharing transactions, this represents outstanding unpaid principal balance of the underlying loans on the single-family mortgage credit book, not the outstanding reference pool, as of the specified date. Loans included in our credit risk transfer transactions have all been acquired since 2012 and newer vintages typically have significantly lower delinquency rates than more seasoned loans.
|
Loan Workout Metrics
Our loan workouts reflect our home retention solutions, including loan modifications, repayment plans and forbearances, and foreclosure alternatives, including short sales and deeds-in-lieu of foreclosure.
Our primary loan modification initiatives have included the Home Affordable Modification Program (“HAMP”), which had a December 31, 2016 application
deadline, and our proprietary Standard and Streamlined Modification initiatives. In December 2016, we announced a new modification program, the Fannie Mae Flex Modification, which replaces both HAMP and our Standard and Streamlined Modification programs with a single modification program that leverages the lessons learned from the housing crisis. The Flex Modification program became available for our servicers to implement on March 1, 2017 and was required to be implemented by October 1, 2017. The program offers additional payment relief allowing forbearance of principal to an 80% mark-to-market LTV ratio for eligible borrowers and targeting a 20% payment reduction.
Table 22
displays statistics on our single-family loan workouts that were completed, by type. For a description of our loan workout types, see “
MD&A
—
Business Segments
—
Single-Family Business
—
Single-Family Mortgage Credit Risk Management
—
Problem Loan Management
—
Loan Workout Metrics
” in our
2016
Form 10-K.
|
Table 22: Statistics on Single-Family Loan Workouts
(1)
|
|||||||||||||||||
|
For the Nine Months Ended September 30,
|
|||||||||||||||||
|
2017
|
2016
|
||||||||||||||||
|
Unpaid Principal Balance
|
Number of Loans
|
Unpaid Principal Balance
|
Number of Loans
|
||||||||||||||
|
(Dollars in millions)
|
|||||||||||||||||
|
Home retention solutions:
|
|||||||||||||||||
|
Modifications
|
$
|
10,101
|
|
61,394
|
|
$
|
10,553
|
|
62,979
|
|
|||||||
|
Repayment plans and forbearances completed
(2)
|
706
|
|
4,944
|
|
631
|
|
4,491
|
|
|||||||||
|
Total home retention solutions
|
10,807
|
|
66,338
|
|
11,184
|
|
67,470
|
|
|||||||||
|
Foreclosure alternatives:
|
|||||||||||||||||
|
Short sales
|
1,222
|
|
5,887
|
|
1,777
|
|
8,577
|
|
|||||||||
|
Deeds-in-lieu of foreclosure
|
460
|
|
3,041
|
|
702
|
|
4,631
|
|
|||||||||
|
Total foreclosure alternatives
|
1,682
|
|
8,928
|
|
2,479
|
|
13,208
|
|
|||||||||
|
Total loan workouts
|
$
|
12,489
|
|
75,266
|
|
$
|
13,663
|
|
80,678
|
|
|||||||
|
Loan workouts as a percentage of single-family guaranty book of business
|
0.58
|
|
%
|
0.58
|
|
%
|
0.65
|
|
%
|
0.63
|
|
%
|
|||||
__________
|
(1)
|
These statistics include loan modifications but do not include trial modifications, loans to certain borrowers who have received bankruptcy relief that are classified as TDRs, or repayment or forbearance plans that have been initiated but not completed.
As of September 30, 2017
, there were approximately
32,800
loans in a trial modification period.
|
|
(2)
|
Repayment plans reflect only those plans associated with loans that were 60 days or more delinquent. Forbearances reflect loans that were 90 days or more delinquent.
|
|
Fannie Mae Third Quarter 2017 Form 10-Q
|
40
|
|
|
MD&A | Business Segments
|
||
The volume of modifications completed in the
first nine months
of
2017
decreased
compared with the
first nine months
of
2016
, primarily due to a
decline
in the number of delinquent loans in the
first nine months
of
2017
compared with the
first nine months
of
2016
.
Nonperforming Loan Sales
FHFA’s
2017
conservatorship scorecard includes an objective relating to reducing the number of our severely-aged delinquent loans, including through nonperforming loan sales. During the
first nine months
of
2017
, we sold approximately
9,900
nonperforming loans with an aggregate unpaid principal balance of
$1.8 billion
.
As of September 30, 2017
, we had sold a total of approximately
49,900
nonperforming loans with an aggregate unpaid principal balance of
$9.4 billion
. We plan to complete additional nonperforming loan sales in the future.
REO Management
Foreclosure and REO activity affect the amount of credit losses we realize in a given period.
Table 23
displays our foreclosure activity by region. Regional REO acquisition and charge-off trends generally follow a pattern that is similar to, but lags, that of regional delinquency trends.
|
Table 23: Single-Family Foreclosed Properties
|
|||||||||
|
|
For the Nine Months
|
||||||||
|
|
Ended September 30,
|
||||||||
|
2017
|
2016
|
||||||||
|
Single-family foreclosed properties (number of properties):
|
|||||||||
|
Beginning of period inventory of single-family foreclosed properties (REO)
(1)
|
38,093
|
|
57,253
|
|
|||||
|
Acquisitions by geographic area:
(2)
|
|||||||||
|
Midwest
|
6,716
|
|
9,865
|
|
|||||
|
Northeast
|
7,496
|
|
9,897
|
|
|||||
|
Southeast
|
8,966
|
|
13,805
|
|
|||||
|
Southwest
|
4,083
|
|
5,418
|
|
|||||
|
West
|
2,156
|
|
3,788
|
|
|||||
|
Total properties acquired through foreclosure
(1)
|
29,417
|
|
42,773
|
|
|||||
|
Dispositions of REO
|
(38,497
|
)
|
(58,053
|
)
|
|||||
|
End of period inventory of single-family foreclosed properties (REO)
(1)
|
29,013
|
|
41,973
|
|
|||||
|
Carrying value of single-family foreclosed properties (dollars in millions)
|
$
|
3,448
|
|
$
|
4,833
|
|
|||
|
Single-family foreclosure rate
(3)
|
0.23
|
|
%
|
0.33
|
|
%
|
|||
|
REO net sales prices to unpaid principal balance
(4)
|
75
|
|
%
|
74
|
|
%
|
|||
|
Short sales net sales prices to unpaid principal balance
(5)
|
75
|
|
%
|
74
|
|
%
|
|||
__________
|
(1)
|
Includes acquisitions through deeds-in-lieu of foreclosure. Also includes held for use properties, which are reported in our condensed consolidated balance sheets as a component of “Other assets.”
|
|
(2)
|
See footnote 9 to “
Table 19
:
Risk Characteristics of Single-Family Conventional Business Volume and Guaranty Book of Business
” for states included in each geographic region.
|
|
(3)
|
Estimated based on the annualized total number of properties acquired through foreclosure or deeds-in-lieu of foreclosure as a percentage of the total number of loans in our single-family guaranty book of business as of the end of each respective period.
|
|
(4)
|
Calculated as the amount of sale proceeds received on disposition of REO properties during the respective periods, excluding those subject to repurchase requests made to our sellers or servicers, divided by the aggregate unpaid principal balance of the related loans at the time of foreclosure. Net sales price represents the contract sales price less selling costs for the property and other charges paid by the seller at closing.
|
|
(5)
|
Calculated as the amount of sale proceeds received on properties sold in short sale transactions during the respective periods divided by the aggregate unpaid principal balance of the related loans. Net sales price represents the contract sales price less the selling costs for the property and other charges paid by the seller at the closing, including borrower relocation incentive payments and subordinate lien(s) negotiated payoffs.
|
The continued
decrease
in the number of our seriously delinquent single-family loans resulted in a reduction in the number of REO acquisitions in the
first nine months
of
2017
compared with the
first nine months
of
2016
.
|
Fannie Mae Third Quarter 2017 Form 10-Q
|
41
|
|
|
MD&A | Business Segments
|
||
We continue to manage our REO inventory to appropriately control costs and maximize sales proceeds. However, we are unable to market and sell a large portion of our inventory, primarily due to occupancy and state or local redemption or confirmation periods, which extends the amount of time it takes to bring our properties to a marketable state and eventually dispose of them. This results in higher foreclosed property expenses, which include costs related to maintaining the property and ensuring that the property is vacant.
As of September 30, 2017
, approximately
39
% of our REO properties were unable to be marketed,
25%
of our REO properties were available for sale,
17
% of our REO properties were pending sale settlement and
19
% of our REO properties were pending appraisals and being prepared to be listed for sale.
Multifamily Business
Our Multifamily business provides mortgage market liquidity primarily for loans backed by properties with five or more residential units, which may be communities, cooperative properties, seniors housing, dedicated student housing or manufactured housing communities.
Multifamily Mortgage Market Conditions and Outlook
National multifamily market fundamentals, which include factors such as vacancy rates and rents, exhibited improved results during the
third quarter
of
2017
.
|
•
|
Vacancy rates.
According to preliminary third-party data, the national multifamily vacancy rate for institutional investment-type apartment properties was an estimated
5.3%
as of
September 30, 2017
and as of
June 30, 2017
. The national estimated multifamily vacancy rate remains below its average rate over the last 10 years.
|
|
•
|
Rents.
Estimated multifamily rents increased during the
third quarter
of
2017
by an estimated
0.8%
. Despite the recent moderating trend, because estimated multifamily rent growth has outpaced wage growth over the past few years, multifamily rental housing affordability has declined in recent years.
|
Despite the increase in new multifamily supply, estimated rent growth was positive during the
third quarter
of
2017
, likely due to job growth and new household formations.
Continued demand for multifamily rental units was reflected in the estimated positive net absorption (that is, the net change in the number of occupied rental units during the time period) of approximately
31,000
units during the
third quarter
of
2017
, according to preliminary data from Reis, Inc., compared with approximately
28,000
units during the
second quarter
of
2017
.
As a result of the continued demand for multifamily rental units over the past few years, there has been an increase in the amount of new multifamily construction development nationally. According to Dodge Data & Analytics, it is estimated that there will be approximately
422,000
new multifamily units completed in
2017
. The bulk of this new supply is concentrated in a limited number of metropolitan areas. We believe this increase in supply will result in a slowdown in national net absorption rates, occupancy levels and effective rents in the early part of 2018.
|
Fannie Mae Third Quarter 2017 Form 10-Q
|
42
|
|
|
MD&A | Business Segments
|
||
Multifamily Business Metrics
|
Table 24: Multifamily Business Key Performance Data
|
|||||||||||||||||||
|
For the Three Months Ended September 30,
|
For the Nine Months Ended September 30,
|
||||||||||||||||||
|
2017
|
|
2016
|
2017
|
2016
|
|||||||||||||||
|
(Dollars in millions)
|
|||||||||||||||||||
|
Securitization Activity/New Business
|
|||||||||||||||||||
|
Multifamily new business volume
(1)
|
$
|
16,178
|
|
$
|
17,864
|
|
$
|
45,854
|
|
$
|
40,666
|
|
|||||||
|
Multifamily units financed from new business volume
|
189,000
|
|
240,000
|
|
553,000
|
|
542,000
|
|
|||||||||||
|
Other rental business volume
(2)
|
$
|
—
|
|
$
|
—
|
|
$
|
945
|
|
$
|
—
|
|
|||||||
|
Multifamily Fannie Mae MBS issuances
(3)
|
$
|
15,835
|
|
$
|
17,884
|
|
$
|
45,378
|
|
$
|
40,618
|
|
|||||||
|
Multifamily Fannie Mae structured securities issuances
|
$
|
2,548
|
|
$
|
2,067
|
|
$
|
8,228
|
|
$
|
7,651
|
|
|||||||
|
Multifamily Fannie Mae MBS outstanding, at end of period
(3)
|
$
|
249,783
|
|
$
|
214,387
|
|
$
|
249,783
|
|
$
|
214,387
|
|
|||||||
|
Portfolio Data
|
|
|
|||||||||||||||||
|
Multifamily retained mortgage portfolio, at end of period
|
$
|
14,207
|
|
$
|
23,165
|
|
$
|
14,207
|
|
$
|
23,165
|
|
|||||||
|
Credit Guaranty Activity
|
|
|
|||||||||||||||||
|
Average multifamily guaranty book of business
(4)
|
$
|
262,553
|
|
$
|
230,717
|
|
$
|
256,007
|
|
$
|
223,897
|
|
|||||||
|
Average charged guaranty fee rate on multifamily guaranty book of business (in basis points), at end of period
|
79.8
|
|
73.4
|
|
79.8
|
|
73.4
|
|
|||||||||||
|
Multifamily credit loss ratio (in basis points)
(5)
|
(2.4
|
)
|
(1.0
|
)
|
(0.7
|
)
|
0.1
|
|
|||||||||||
|
Multifamily serious delinquency rate, at end of period
|
0.03
|
|
%
|
0.07
|
|
%
|
0.03
|
|
%
|
0.07
|
|
%
|
|||||||
|
Percentage of multifamily guaranty book of business with lender risk-sharing, at end of period
|
96
|
|
%
|
93
|
|
%
|
96
|
|
%
|
93
|
|
%
|
|||||||
__________
|
(1)
|
Reflects unpaid principal balance of multifamily Fannie Mae MBS issued (excluding portfolio securitizations), multifamily loans purchased, and credit enhancements provided during the period.
|
|
(2)
|
Consists of a transaction backed by a pool of single-family rental properties financed in the second quarter of 2017.
|
|
(3)
|
Excludes a transaction backed by a pool of single-family rental properties financed in the second quarter of 2017.
|
|
(4)
|
Our multifamily guaranty book of business consists of: (a) multifamily mortgage loans of Fannie Mae; (b) multifamily mortgage loans underlying Fannie Mae MBS; and (c) other credit enhancements that we provide on multifamily mortgage assets and relating to a transaction backed by a pool of single-family rental properties. It excludes non-Fannie Mae multifamily mortgage-related securities held in our retained mortgage portfolio for which we do not provide a guaranty.
|
|
(5)
|
Calculated based on Multifamily segment credit losses divided by the average multifamily guaranty book of business. Negative credit losses are a result of recoveries on previously charged-off amounts.
|
FHFA’s
2017
conservatorship scorecard includes an objective to maintain the dollar volume of new multifamily business at or below
$36.5 billion
excluding certain targeted affordable and underserved market business segments. Approximately
47%
of Fannie Mae’s multifamily new business and other rental volume of
$46.8 billion
for the
first nine months
of
2017
counted towards FHFA’s
2017
multifamily volume cap.
|
Fannie Mae Third Quarter 2017 Form 10-Q
|
43
|
|
|
MD&A | Business Segments
|
||
Multifamily Business Financial Results
|
Table 25: Multifamily Business Financial Results
|
|||||||||||||||||||||||
|
For the Three Months Ended September 30,
|
For the Nine Months Ended September 30,
|
||||||||||||||||||||||
|
2017
|
2016
|
Variance
|
2017
|
2016
|
Variance
|
||||||||||||||||||
|
(Dollars in millions)
|
|||||||||||||||||||||||
|
Net interest income
|
$
|
647
|
|
$
|
578
|
|
$
|
69
|
|
$
|
1,873
|
|
$
|
1,658
|
|
$
|
215
|
|
|||||
|
Fee and other income
|
189
|
|
98
|
|
91
|
|
604
|
|
330
|
|
274
|
|
|||||||||||
|
Net revenues
|
836
|
|
676
|
|
160
|
|
2,477
|
|
1,988
|
|
489
|
|
|||||||||||
|
Fair value gains (losses), net
|
11
|
|
8
|
|
3
|
|
(23
|
)
|
57
|
|
(80
|
)
|
|||||||||||
|
Administrative expenses
|
(84
|
)
|
(79
|
)
|
(5
|
)
|
(253
|
)
|
(239
|
)
|
(14
|
)
|
|||||||||||
|
Credit-related income (expense)
(1)
|
(28
|
)
|
31
|
|
(59
|
)
|
(23
|
)
|
56
|
|
(79
|
)
|
|||||||||||
|
Other income (expenses), net
(2)
|
(80
|
)
|
43
|
|
(123
|
)
|
(237
|
)
|
154
|
|
(391
|
)
|
|||||||||||
|
Income before federal income taxes
|
655
|
|
679
|
|
(24
|
)
|
1,941
|
|
2,016
|
|
(75
|
)
|
|||||||||||
|
Provision for federal income taxes
|
(164
|
)
|
(128
|
)
|
(36
|
)
|
(481
|
)
|
(433
|
)
|
(48
|
)
|
|||||||||||
|
Net income
|
$
|
491
|
|
$
|
551
|
|
$
|
(60
|
)
|
$
|
1,460
|
|
$
|
1,583
|
|
$
|
(123
|
)
|
|||||
__________
|
(1)
|
Consists of the benefit (provision) for credit losses and foreclosed property income.
|
|
(2)
|
Consists of investment gains, gains on partnership investments and other income (expenses).
|
Multifamily net income decreased in the
third quarter
of
2017
compared with the
third quarter
of
2016
primarily driven by a shift to credit-related expense from credit-related income and a decrease in investment gains, partially offset by an increase in net interest income. Multifamily net income decreased in the
first nine months
of
2017
compared with the
first nine months
of
2016
primarily driven by a shift to fair value losses from fair value gains, a shift to credit-related expense from credit-related income and a decrease in investment gains. This decrease was partially offset by an increase in net interest income.
Net interest income in all periods presented was primarily driven by
guaranty fee income, which continued to increase as our multifamily guaranty book of business grew and loans with higher guaranty fees became a larger part of our book of business, while loans with lower guaranty fees continued to liquidate.
Fair value losses in the
first nine months
of
2017
were primarily driven by losses on commitments to sell multifamily mortgage-related securities as a result of increases in prices during the commitment periods.
Credit-related expense in the
third quarter
and
first nine months
of
2017
was primarily driven by an increase in our allowance for loan losses, which included approximately $50 million in estimated losses from the hurricanes.
Investment gains resulting from the sale of available-for-sale securities was the primary driver of other income in the
third quarter
and
first nine months
of
2016
.
|
Fannie Mae Third Quarter 2017 Form 10-Q
|
44
|
|
|
MD&A | Business Segments
|
||
Multifamily Mortgage Credit Risk Management
This section updates our discussion of multifamily mortgage credit risk management in our
2016
Form 10-K in “
MD&A
—
Business Segments
—
Multifamily Business
—
Multifamily Mortgage Credit Risk Management
.”
We exclude from the multifamily credit statistics reported below the approximately
1%
of our multifamily guaranty book of business for which our loan level information is incomplete as of
September 30, 2017
and
December 31, 2016
.
Multifamily Acquisition Policy and Underwriting Standards
Our multifamily business is responsible for pricing and managing the credit risk on multifamily mortgage loans we have purchased, on Fannie Mae MBS backed by multifamily loans (whether held in our retained mortgage portfolio or held by third parties), and on other credit enhancements provided on multifamily mortgage assets, with oversight from our Enterprise Risk Management division. Our primary multifamily delivery channel is the Delegated Underwriting and Servicing, or DUS
®
, program, which consists of large financial institutions and independent mortgage lenders. Multifamily loans that we purchase or that back Fannie Mae MBS are underwritten by Fannie Mae-approved lenders and may be subject to our underwriting review prior to closing, depending on the product type, loan size, market and other factors. Loans delivered to us by DUS lenders and their affiliates represented
98%
of our multifamily guaranty book of business as of
September 30, 2017
, and
97%
of our multifamily guaranty book of business as of
December 31, 2016
.
We use credit enhancement arrangements, primarily lender risk-sharing, for our multifamily loans. As of
September 30, 2017
,
96%
of the unpaid principal balance of loans in our multifamily guaranty book of business had lender risk-sharing, compared with
94%
as of
December 31, 2016
. Our maximum potential loss recovery from lenders under current risk-sharing agreements represented over
20%
of the unpaid principal balance of our multifamily guaranty book of business as of
September 30, 2017
and
December 31, 2016
.
Our standards for multifamily loans specify maximum original LTV ratio and minimum original debt service coverage ratio (“DSCR”) values that vary based on loan characteristics. Our experience has been that original LTV ratio and DSCR values have been reliable indicators of future credit performance. At underwriting, the DSCR is evaluated based on both actual and underwritten debt service payments. The original DSCR is calculated using the underwritten debt service payments for the loan, rather than the actual debt service payments which, depending on the interest rate of the loan and loan structure, may result in a more conservative estimate of the debt service payments.
Table 26
displays original LTV ratio and DSCR metrics for our multifamily guaranty book of business.
|
Table 26: Multifamily Guaranty Book of Business Key Risk Characteristics
|
||||||||||||||
|
As of
|
||||||||||||||
|
September 30, 2017
|
December 31, 2016
|
September 30,
2016 |
||||||||||||
|
Weighted average original LTV ratio
|
67
|
%
|
67
|
%
|
67
|
%
|
||||||||
|
Original LTV ratio greater than 80%
|
2
|
|
2
|
|
2
|
|
||||||||
|
Original DSCR less than or equal to 1.10
|
14
|
|
14
|
|
13
|
|
||||||||
Multifamily Portfolio Diversification and Monitoring
Diversification within our multifamily mortgage credit book of business by geographic concentration, term to maturity, interest rate structure, borrower concentration and loan size, as well as credit enhancement coverage, are important factors that influence credit performance and help reduce our credit risk.
We and our lenders monitor the performance and risk characteristics of our multifamily loans and the underlying properties on an ongoing basis throughout the loan term at the asset and portfolio level. We closely monitor loans with an estimated current DSCR below 1.0, as that is an indicator of heightened default risk. The percentage of loans in our multifamily guaranty book of business, calculated based on unpaid principal balance, with a current DSCR less than 1.0 was approximately
1%
as of
September 30, 2017
, compared with approximately
2%
as of
December 31, 2016
.
|
Fannie Mae Third Quarter 2017 Form 10-Q
|
45
|
|
|
MD&A | Business Segments
|
||
Multifamily Problem Loan Management and Foreclosure Prevention
We periodically refine our underwriting standards in response to market conditions and implement proactive portfolio management and monitoring, which are each designed to keep credit losses and delinquencies to a low level relative to our multifamily guaranty book of business. The multifamily serious delinquency rate was
0.03%
as of
September 30, 2017
and 0.05% as of
December 31, 2016
. We classify multifamily loans as seriously delinquent when payment is 60 days or more past due.
REO Management
The number of multifamily foreclosed properties held for sale remained low at
14
properties with a carrying value of
$78 million
as of
September 30, 2017
, compared with
13
properties with a carrying value of
$85 million
as of
December 31, 2016
.
|
Liquidity and Capital Management
|
||||
Liquidity Management
Our business activities require that we maintain adequate liquidity to fund our operations. Our liquidity risk management framework is designed to address our liquidity risk. Liquidity risk is the risk that we will not be able to meet our funding obligations in a timely manner. Liquidity risk management involves forecasting funding requirements, maintaining sufficient capacity to meet our needs based on our ongoing assessment of financial market liquidity and adhering to our regulatory requirements.
Our primary source of funds is proceeds from the issuance of short-term and long-term debt securities. Accordingly, our liquidity depends largely on our ability to issue unsecured debt in the capital markets. Our status as a GSE and federal government support of our business continue to be essential to maintaining our access to the unsecured debt markets. Our treasury group is responsible for implementing our liquidity and contingency planning strategies. We hold a portfolio of highly liquid investments and maintain access to alternative sources of liquidity which are designed to provide near term availability of cash in the event that our access to the debt markets becomes limited. While our liquidity contingency planning attempts to address stressed market conditions and our status under conservatorship and Treasury arrangements, we believe that our liquidity contingency plans may be difficult or impossible to execute for a company of our size in our circumstances.
Our liquidity position could be adversely affected by many factors, both internal and external to our business, including: actions taken by FHFA, the Federal Reserve, Treasury or other government agencies; legislation relating to us or our business; a U.S. government payment default on its debt obligations; a downgrade in the credit ratings of our senior unsecured debt or the U.S. government’s debt from the major ratings organizations; a systemic event leading to the withdrawal of liquidity from the market; an extreme market-wide widening of credit spreads; public statements by key policy makers; a significant decline in our net worth; potential investor concerns about the adequacy of funding available to us under the senior preferred stock purchase agreement; loss of demand for our debt, or certain types of our debt, from a major group of investors; a significant credit event involving one of our major institutional counterparties; a sudden catastrophic operational failure in the financial sector; or elimination of our GSE status.
This section supplements and updates information regarding liquidity risk management in our
2016
Form 10-K. See “
MD&A
—
Liquidity and Capital Management
—
Liquidity Management
” and “Risk Factors” in our
2016
Form 10-K for additional information, including discussions of our primary sources and uses of funds, our liquidity risk management practices and liquidity contingency planning, factors that influence our debt funding activity, factors that may impact our access to or the cost of our debt funding, and factors that could adversely affect our liquidity.
Debt Funding
We fund our business primarily through the issuance of a variety of short-term and long-term debt securities in the domestic and international capital markets. Because debt issuance is our primary funding source, we are subject to “roll over,” or refinancing, risk on our outstanding debt.
Our debt funding needs and debt funding activity may vary from quarter to quarter depending on market conditions and are influenced by anticipated liquidity needs, the size of our retained mortgage portfolio and our
|
Fannie Mae Third Quarter 2017 Form 10-Q
|
46
|
|
|
MD&A | Liquidity and Capital Management
|
||
dividend payments to Treasury. See “
Retained Mortgage Portfolio
” for information about our retained mortgage portfolio and our requirement to reduce the size of our retained mortgage portfolio.
Fannie Mae Debt Funding Activity
Table 27
displays the activity in debt of Fannie Mae. This activity excludes the debt of consolidated trusts and intraday loans. Activity for short-term debt of Fannie Mae relates to borrowings with an original contractual maturity of one year or less while activity for long-term debt of Fannie Mae relates to borrowings with an original contractual maturity of greater than one year. The reported amounts of debt issued and paid off during the period represent the face amount of the debt at issuance and redemption.
The
increase
in our issuances and payoffs of short-term debt during the
first nine months
of
2017
compared with the
first nine months
of
2016
was driven by increased utilization of notes with overnight maturities. The decrease in our issuances and payoffs of long-term debt during the
third quarter
and
first nine months
of
2017
compared with the
third quarter
and
first nine months
of
2016
was primarily due to decreased funding needs, as well as declines in call activity due to a higher interest rate environment.
|
Table 27: Activity in Debt of Fannie Mae
|
|||||||||||||||
|
For the Three Months
|
For the Nine Months
|
||||||||||||||
|
Ended September 30,
|
Ended September 30,
|
||||||||||||||
|
2017
|
2016
|
2017
|
2016
|
||||||||||||
|
(Dollars in millions)
|
|||||||||||||||
|
Issued during the period:
|
|||||||||||||||
|
Short-term:
|
|||||||||||||||
|
Amount
|
$
|
199,940
|
|
$
|
142,937
|
|
$
|
513,635
|
|
$
|
419,822
|
|
|||
|
Weighted-average interest rate
|
0.97
|
%
|
0.23
|
%
|
0.78
|
%
|
0.25
|
%
|
|||||||
|
Long-term:
(1)
|
|||||||||||||||
|
Amount
|
$
|
6,435
|
|
$
|
48,853
|
|
$
|
25,457
|
|
$
|
100,505
|
|
|||
|
Weighted-average interest rate
|
2.44
|
%
|
1.42
|
%
|
2.44
|
%
|
1.58
|
%
|
|||||||
|
Total issued:
|
|||||||||||||||
|
Amount
|
$
|
206,375
|
|
$
|
191,790
|
|
$
|
539,092
|
|
$
|
520,327
|
|
|||
|
Weighted-average interest rate
|
1.02
|
%
|
0.54
|
%
|
0.85
|
%
|
0.51
|
%
|
|||||||
|
Paid off during the period:
(2)
|
|||||||||||||||
|
Short-term:
|
|||||||||||||||
|
Amount
|
$
|
197,034
|
|
$
|
152,088
|
|
$
|
515,220
|
|
$
|
439,408
|
|
|||
|
Weighted-average interest rate
|
0.93
|
%
|
0.31
|
%
|
0.71
|
%
|
0.28
|
%
|
|||||||
|
Long-term:
(1)
|
|||||||||||||||
|
Amount
|
$
|
21,123
|
|
$
|
51,211
|
|
$
|
60,419
|
|
$
|
116,657
|
|
|||
|
Weighted-average interest rate
|
1.35
|
%
|
1.92
|
%
|
2.81
|
%
|
2.01
|
%
|
|||||||
|
Total paid off:
|
|||||||||||||||
|
Amount
|
$
|
218,157
|
|
$
|
203,299
|
|
$
|
575,639
|
|
$
|
556,065
|
|
|||
|
Weighted-average interest rate
|
0.97
|
%
|
0.71
|
%
|
0.93
|
%
|
0.64
|
%
|
|||||||
__________
|
(1)
|
Includes credit risk-sharing securities issued under our CAS series. For additional information on our credit risk transfer transactions, see “
Business Segments
—
Single-Family Business
—
Single-Family Mortgage Credit Risk Management
—
Transfer of Mortgage Credit Risk
:
Single-Family Credit Risk Transfer Transactions
.”
|
|
(2)
|
Consists of all payments on debt, including regularly scheduled principal payments, payments at maturity, payments resulting from calls and payments for any other repurchases. Repurchases of debt and early retirements of zero-coupon debt are reported at original face value, which does not equal the amount of actual cash payment.
|
|
Fannie Mae Third Quarter 2017 Form 10-Q
|
47
|
|
|
MD&A | Liquidity and Capital Management
|
||
Intraday Line of Credit
We use a secured intraday funding line of credit provided by a large financial institution. We post collateral which, in some circumstances, the secured party has the right to repledge to third parties. As this line of credit is an uncommitted intraday loan facility, we may be unable to draw on it if and when needed. The line of credit under this facility was
$15.0 billion
as of
September 30, 2017
and
2016
.
Outstanding Debt
Total outstanding debt of Fannie Mae includes short-term and long-term debt, excluding debt of consolidated trusts. Short-term debt of Fannie Mae consists of borrowings with an original contractual maturity of one year or less and, therefore, does not include the current portion of long-term debt. Long-term debt of Fannie Mae consists of borrowings with an original contractual maturity of greater than one year.
Our outstanding short-term debt, based on its original contractual maturity, as a percentage of our total outstanding debt, was
11%
as of
September 30, 2017
and
December 31, 2016
. The weighted-average interest rate on our long-term debt, based on its original contractual maturity,
decreased
to
2.30%
as of
September 30, 2017
from
2.31%
as of
December 31, 2016
.
Our outstanding debt maturing within one year, including the current portion of our long-term debt and amounts we have announced for early redemption, as a percentage of our total outstanding debt, excluding debt of consolidated trusts, was
31%
as of
September 30, 2017
and
32%
as of
December 31, 2016
. The weighted-average maturity of our outstanding debt that is maturing within one year was
114
days as of
September 30, 2017
, compared with
146
days as of
December 31, 2016
. The weighted-average maturity of our outstanding debt maturing in more than one year was approximately
57
months as of
September 30, 2017
, compared with approximately
56
months as of
December 31, 2016
.
We intend to repay our short-term and long-term debt obligations as they become due primarily through proceeds from the issuance of additional debt securities. We also may use proceeds from our mortgage assets to pay our debt obligations.
Pursuant to the terms of the senior preferred stock purchase agreement, we are prohibited from issuing debt without the prior consent of Treasury if it would result in our aggregate indebtedness exceeding our outstanding debt limit, which is
120%
of the amount of mortgage assets we were allowed to own under the senior preferred stock purchase agreement on December 31 of the immediately preceding calendar year. Our debt limit under the senior preferred stock purchase agreement was reduced to
$407.2 billion
in
2017
. As of
September 30, 2017
, our aggregate indebtedness totaled
$292.2 billion
, which was
$115.0 billion
below our debt limit. The calculation of our indebtedness for purposes of complying with our debt limit reflects the unpaid principal balance and excludes debt basis adjustments and debt of consolidated trusts. Because of our debt limit, we may be restricted in the amount of debt we issue to fund our operations.
|
Fannie Mae Third Quarter 2017 Form 10-Q
|
48
|
|
|
MD&A | Liquidity and Capital Management
|
||
Table 28
displays information on our outstanding short-term and long-term debt based on its original contractual terms.
|
Table 28: Outstanding Short-Term Borrowings and Long-Term Debt
(1)
|
|||||||||||||||||
|
As of
|
|||||||||||||||||
|
September 30, 2017
|
December 31, 2016
|
||||||||||||||||
|
Maturities
|
Outstanding
|
Weighted-
Average
Interest
Rate
|
Maturities
|
Outstanding
|
Weighted-
Average
Interest
Rate
|
||||||||||||
|
(Dollars in millions)
|
|||||||||||||||||
|
Federal funds purchased and securities sold under agreements to repurchase
(2)
|
—
|
$
|
81
|
|
0.25
|
%
|
—
|
$
|
—
|
|
—
|
%
|
|||||
|
Short-term debt:
|
|||||||||||||||||
|
Debt of Fannie Mae
|
—
|
$
|
33,332
|
|
1.03
|
%
|
—
|
$
|
34,995
|
|
0.49
|
%
|
|||||
|
Debt of consolidated trusts
|
—
|
459
|
|
0.78
|
|
—
|
584
|
|
0.48
|
|
|||||||
|
Total short-term debt
|
$
|
33,791
|
|
1.02
|
%
|
$
|
35,579
|
|
0.49
|
%
|
|||||||
|
Long-term debt:
|
|||||||||||||||||
|
Senior fixed:
|
|||||||||||||||||
|
Benchmark notes and bonds
|
2017 - 2030
|
$
|
133,022
|
|
2.01
|
%
|
2017 - 2030
|
$
|
153,983
|
|
2.16
|
%
|
|||||
|
Medium-term notes
(3)
|
2017 - 2026
|
78,087
|
|
1.41
|
|
2017 - 2026
|
82,230
|
|
1.40
|
|
|||||||
|
Other
(4)
|
2017 - 2038
|
7,852
|
|
4.83
|
|
2017 - 2038
|
12,800
|
|
6.74
|
|
|||||||
|
Total senior fixed
|
218,961
|
|
1.90
|
|
249,013
|
|
2.14
|
|
|||||||||
|
Senior floating:
|
|||||||||||||||||
|
Medium-term notes
(3)
|
2017 - 2020
|
11,424
|
|
1.26
|
|
2017 - 2019
|
21,476
|
|
0.71
|
|
|||||||
|
Connecticut Avenue Securities
(5)
|
2023 - 2030
|
22,131
|
|
5.08
|
|
2023 - 2029
|
16,511
|
|
4.77
|
|
|||||||
|
Other
(6)
|
2020 - 2037
|
369
|
|
7.44
|
|
2020 - 2037
|
346
|
|
6.75
|
|
|||||||
|
Total senior floating
|
33,924
|
|
3.78
|
|
38,333
|
|
2.48
|
|
|||||||||
|
Subordinated debentures
|
2019
|
4,987
|
|
9.93
|
|
2019
|
4,645
|
|
9.93
|
|
|||||||
|
Secured borrowings
(7)
|
2021 - 2022
|
85
|
|
1.52
|
|
2021 - 2022
|
111
|
|
1.44
|
|
|||||||
|
Total long-term debt of Fannie Mae
|
257,957
|
|
2.30
|
|
292,102
|
|
2.31
|
|
|||||||||
|
Debt of consolidated trusts
|
2017 - 2057
|
3,016,835
|
|
2.75
|
|
2017 - 2056
|
2,934,635
|
|
2.57
|
|
|||||||
|
Total long-term debt
|
$
|
3,274,792
|
|
2.71
|
%
|
$
|
3,226,737
|
|
2.54
|
%
|
|||||||
|
Outstanding callable debt of Fannie Mae
(8)
|
$
|
73,743
|
|
2.23
|
%
|
$
|
77,257
|
|
1.89
|
%
|
|||||||
__________
|
(1)
|
Outstanding debt amounts and weighted-average interest rates reported in this table include the effects of discounts, premiums and other cost basis adjustments. Reported outstanding amounts include fair value gains and losses associated with debt that we elected to carry at fair value. Reported amounts for total debt of Fannie Mae include unamortized discounts and premiums, other cost basis adjustments and fair value adjustments of
$1.0 billion
and
$1.8 billion
as of
September 30, 2017
and
December 31, 2016
, respectively.
|
|
(2)
|
Represents agreements to repurchase securities for a specified price, with repayment generally occurring on the following day.
|
|
(3)
|
Includes long-term debt with an original contractual maturity of greater than 1 year and up to 10 years, excluding zero-coupon debt.
|
|
(4)
|
Includes other long-term debt with an original contractual maturity of greater than 10 years.
|
|
(5)
|
Credit risk-sharing securities that transfer a portion of the credit risk on specified pools of mortgage loans in our single-family guaranty book of business to the investors in these securities, a portion of which is reported at fair value. For additional information on our credit risk transfer transactions, see “
Business Segments
—
Single-Family Business
—
Single-Family Mortgage Credit Risk Management
—
Transfer of Mortgage Credit Risk
:
Single-Family Credit Risk Transfer Transactions
.”
|
|
(6)
|
Consists of structured debt instruments that are reported at fair value.
|
|
Fannie Mae Third Quarter 2017 Form 10-Q
|
49
|
|
|
MD&A | Liquidity and Capital Management
|
||
|
(7)
|
Represents remaining liability resulting from the transfer of financial assets from our condensed consolidated balance sheets that did not qualify as a sale.
|
|
(8)
|
Consists of the unpaid principal balance of long-term callable debt of Fannie Mae that can be paid off in whole or in part at our option at any time on or after a specified date.
|
Other Investments Portfolio
Table 29
displays information on the composition of our other investments portfolio. The balance of our other investments portfolio fluctuates based on changes in our cash flows, liquidity in the fixed income markets and our liquidity risk management framework and practices. See “
Risk Management
—
Credit Risk Management
—
Institutional Counterparty Credit Risk Management
—
Counterparty Credit Exposure of Investments Held in Our Other Investments Portfolio
” for additional information on the risks associated with the assets in our other investments portfolio.
|
Table 29: Other Investments Portfolio
|
|||||||||||
|
As of
|
|||||||||||
|
September 30, 2017
|
December 31, 2016
|
||||||||||
|
(Dollars in millions)
|
|||||||||||
|
Cash and cash equivalents
|
$
|
23,914
|
|
$
|
25,224
|
|
|||||
|
Federal funds sold and securities purchased under agreements to resell or similar arrangements
|
23,740
|
|
30,415
|
|
|||||||
|
U.S. Treasury securities
|
30,799
|
|
32,317
|
|
|||||||
|
Total other investments
|
$
|
78,453
|
|
$
|
87,956
|
|
|||||
Cash Flows
Nine Months Ended
September 30, 2017
.
Cash and cash equivalents
decreased
by
$1.3 billion
from $
25.2 billion
as of
December 31, 2016
to $
23.9 billion
as of
September 30, 2017
. The
decrease
was primarily driven by
cash outflows
from (1) the purchase of Fannie Mae MBS from third parties, (2) the redemption of funding debt, which outpaced issuances, due to lower funding needs, and (3) the payment of dividends to Treasury under our senior preferred stock purchase agreement.
Partially offsetting these
cash outflows
were
cash inflows
from (1) the sale of Fannie Mae MBS to third parties and (2) proceeds from repayments and sales of loans of Fannie Mae.
Nine Months Ended
September 30, 2016
.
Cash and cash equivalents
increased
by $
11.9 billion
from $
14.7 billion
as of
December 31, 2015
to $
26.6 billion
as of
September 30, 2016
. The
increase
was primarily driven by
cash inflows
from (1) the sale of Fannie Mae MBS to third parties, (2) proceeds from the repayments and sales of loans of Fannie Mae and (3) proceeds from the sale and liquidation of mortgage-related securities.
Partially offsetting these
cash inflows
were
cash outflows
from (1) the redemption of funding debt, which outpaced issuances, due to lower funding needs, (2) the acquisition of delinquent loans out of MBS trusts and (3) the payment of dividends to Treasury under our senior preferred stock purchase agreement.
Credit Ratings
As of
September 30, 2017
, our credit ratings have not changed since we filed our
2016
Form 10-K. For additional information on our credit ratings, see “
MD&A
—
Liquidity and Capital Management
—
Liquidity Management
—
Credit Ratings
” in our
2016
Form 10-K.
Capital Management
Regulatory Capital
FHFA stated that, during conservatorship, our existing statutory and FHFA-directed regulatory capital requirements will not be binding and FHFA will not issue quarterly capital classifications. The deficit of our core capital over statutory minimum capital was
$137.7 billion
as of
September 30, 2017
and $
136.2 billion
as of
December 31, 2016
. For more information on our minimum capital requirements, see “Note 14, Regulatory Capital Requirements” in our
2016
Form 10-K.
|
Fannie Mae Third Quarter 2017 Form 10-Q
|
50
|
|
|
MD&A | Liquidity and Capital Management
|
||
Capital Activity
Each quarter during conservatorship, the Director of FHFA has directed us to make dividend payments to Treasury. Our
third quarter
2017
dividend of
$3.1 billion
was declared by FHFA and subsequently paid by us on September 29, 2017.
The terms of our senior preferred stock provide for quarterly dividends to accumulate at a rate equal to our net worth less an applicable capital reserve amount. The capital reserve amount is
$600 million
for dividend periods in
2017
, and will be reduced to
zero
on January 1, 2018. We will pay Treasury a dividend for the
fourth quarter
of
2017
of
$3.0 billion
by
December 31, 2017
if our conservator declares a dividend in this amount before
December 31, 2017
. To the extent that these quarterly dividends are not paid, they will accumulate and be added to the liquidation preference of the senior preferred stock. This would not affect the amount of available funding from Treasury under the senior preferred stock purchase agreement.
We are effectively unable to raise equity capital from private sources at this time and, therefore, are reliant on the funding available under our senior preferred stock purchase agreement with Treasury to address any net worth deficit. Under the senior preferred stock purchase agreement, Treasury made a commitment to provide funding, under certain conditions, to eliminate deficiencies in our net worth. We have received a total of
$116.1 billion
from Treasury pursuant to the senior preferred stock purchase agreement as of
September 30, 2017
. The current aggregate liquidation preference of the senior preferred stock, including the initial aggregate liquidation preference of
$1.0 billion
, remains at
$117.1 billion
. Dividend payments we make to Treasury do not reduce the outstanding liquidation preference of the senior preferred stock, although we are permitted to pay down the liquidation preference of the senior preferred stock to the extent of any accumulated and unpaid dividends previously added to the liquidation preference and not previously paid down.
While we had a positive net worth as of
September 30, 2017
and have not received funds from Treasury under the agreement since the first quarter of 2012, we will be required to obtain additional funding from Treasury pursuant to the senior preferred stock purchase agreement if we have a net worth deficit in future periods. As of the date of this filing, the amount of remaining available funding under the senior preferred stock purchase agreement is
$117.6 billion
. If we were to draw additional funds from Treasury under the agreement in a future period, the amount of remaining funding under the agreement would be reduced by the amount of our draw. Dividend payments we make to Treasury do not restore or increase the amount of funding available to us under the agreement.
See “
Business
—
Conservatorship and Treasury Agreements
—
Treasury Agreements
” in our
2016
Form 10-K for more information on the terms of our senior preferred stock and our senior preferred stock purchase agreement with Treasury. See “Risk Factors” in our
2016
Form 10-K for a discussion of the risks relating to our limited and declining capital reserves and the dividend provisions of the senior preferred stock.
|
Off-Balance Sheet Arrangements
|
||||
We enter into certain business arrangements to facilitate our statutory purpose of providing liquidity to the secondary mortgage market and to reduce our exposure to interest rate fluctuations. Some of these arrangements are not recorded in our condensed consolidated balance sheets or may be recorded in amounts different from the full contract or notional amount of the transaction. Our off-balance sheet arrangements result primarily from: our guaranty of mortgage loan securitization and resecuritization transactions, and other guaranty commitments over which we do not have control; liquidity support transactions; and partnership interests. For a description of our off-balance sheet arrangements, see “
MD&A
—
Off-Balance Sheet Arrangements
” in our
2016
Form 10-K.
Our maximum potential exposure to credit losses relating to our outstanding and unconsolidated Fannie Mae MBS and other financial guarantees is primarily represented by the unpaid principal balance of the mortgage loans underlying outstanding and unconsolidated Fannie Mae MBS and other financial guarantees of
$22.3 billion
as of
September 30, 2017
and
$24.3 billion
as of
December 31, 2016
. Our total outstanding liquidity commitments to advance funds for securities backed by multifamily housing revenue bonds totaled $
9.6 billion
as of
September 30, 2017
and $
10.4 billion
as of
December 31, 2016
.
|
Fannie Mae Third Quarter 2017 Form 10-Q
|
51
|
|
|
MD&A | Risk Management
|
||
|
Risk Management
|
||||
Our business activities expose us to the following three major categories of risk: credit risk, market risk (including interest rate and liquidity risk) and operational risk. We seek to actively manage and monitor these risks by using an established risk management program. We are also exposed to compliance risk, reputational risk and strategic risk, which encompasses the uncertainty regarding the future of our company, including how long we will continue to be in existence, which we discuss in more detail in “Risk Factors” and in “
Business
—
Legislation and Regulation
—
Housing Finance Reform
” in our
2016
Form 10-K.
In this section we provide an update on our management of our major risk categories. For a more complete discussion of the primary risks we face and how we manage credit risk, market risk and operational risk, see “
MD&A
—
Risk Management
” and “Risk Factors” in our
2016
Form 10-K.
Credit Risk Management
We are generally subject to two types of credit risk: mortgage credit risk and institutional counterparty credit risk.
Mortgage Credit Risk Management
Mortgage credit risk is the risk of loss resulting from the failure of a borrower to make required mortgage payments. We are exposed to credit risk on our mortgage credit book of business because we either hold mortgage assets, have issued a guaranty in connection with the creation of Fannie Mae MBS backed by mortgage assets or provided other credit enhancements on mortgage assets. For a discussion of our single-family mortgage credit risk management, see “
MD&A
—
Business Segments
—
Single-Family Business
—
Single-Family Mortgage Credit Risk Management
” in our
2016
Form 10-K and in this report. For a discussion of our multifamily credit risk management, see “
MD&A
—
Business Segments
—
Multifamily Business
—
Multifamily Mortgage Credit Risk Management
” in our
2016
Form 10-K and in this report.
Institutional Counterparty Credit Risk Management
Institutional counterparty credit risk is the risk of loss resulting from the failure of an institutional counterparty to fulfill its contractual obligations to us. Defaults by a counterparty with significant obligations to us could result in significant financial losses to us.
See “
MD&A
—
Risk Management
—
Credit Risk Management
—
Institutional Counterparty Credit Risk Management
” and “Risk Factors” in our
2016
Form 10-K for additional information about our institutional counterparty risk, including counterparty risk we face from mortgage originators, investors and dealers, from debt security dealers, from document custodians and from mortgage fraud.
Mortgage Sellers and Servicers
One of our primary exposures to institutional counterparty risk is with mortgage servicers that service the loans we hold in our retained mortgage portfolio or that back our Fannie Mae MBS, as well as mortgage sellers and servicers that are obligated to repurchase loans from us or reimburse us for losses in certain circumstances. We rely on mortgage servicers to meet our servicing standards and fulfill their servicing obligations. We also rely on mortgage sellers and servicers to fulfill their repurchase obligations.
Our
five
largest single-family mortgage servicers, including their affiliates, serviced approximately
41%
of our single-family guaranty book of business as of
September 30, 2017
, compared with approximately
39%
as
December 31, 2016
. Our largest mortgage servicer is Wells Fargo Bank, N.A., which, together with its affiliates, serviced approximately
17%
of our single-family guaranty book of business as of
September 30, 2017
and
December 31, 2016
.
Our
five
largest multifamily mortgage servicers, including their affiliates, serviced approximately
47%
of our multifamily guaranty book of business as of
September 30, 2017
and
December 31, 2016
. Wells Fargo Bank, N.A. and Walker & Dunlop, LLC each serviced over 10% of our multifamily guaranty book of business as of
September 30, 2017
and
December 31, 2016
.
A large portion of our single-family guaranty book is serviced by non-depository servicers. As of
September 30, 2017
,
18%
of our total single-family guaranty book of business, including
33%
of our delinquent single-family loans, was serviced by our five largest non-depository servicers, compared with
16%
of our total single-family guaranty book of business, including
51%
of our delinquent single-family loans, as of
December 31, 2016
.
|
Fannie Mae Third Quarter 2017 Form 10-Q
|
52
|
|
|
MD&A | Risk Management
|
||
Compared with depository financial institutions, non-depository servicers pose additional risks to us because non-depository servicers may have a greater reliance on third-party sources of liquidity and may, in the event of significant increases in delinquent loan volumes, have less financial capacity to advance funds on our behalf or satisfy repurchase requests or compensatory fee obligations. In addition, regulatory bodies have been reviewing the activities of some of our largest non-depository servicers. See “Risk Factors” in our
2016 Form 10-K
for a discussion of the risks of our reliance on servicers.
Our
five
largest single-family mortgage sellers, including their affiliates, accounted for approximately
35%
of our single-family business acquisition volume in the
first nine months
of
2017
, compared with approximately
28%
in the
first nine months
of
2016
. Our largest mortgage seller is Wells Fargo Bank, N.A., which, together with its affiliates, accounted for approximately
16%
of our single-family business acquisition volume in the
first nine months
of
2017
, compared with approximately
13%
in the
first nine months
of
2016
.
We acquire a portion of our business volume directly from non-depository and smaller depository financial institutions that may not have the same financial strength or operational capacity as our largest mortgage seller counterparties. We could be required to absorb losses on defaulted loans that a failed mortgage seller is obligated to repurchase from us if we determine there was an underwriting eligibility breach.
Credit Guarantors
We use various types of credit guarantors to manage our mortgage credit risk, including mortgage insurers, credit insurance risk transfer counterparties, financial guarantors, and multifamily lenders with risk sharing.
Mortgage Insurers
We are generally required, pursuant to our charter, to obtain credit enhancements on single-family conventional mortgage loans that we purchase or securitize with LTV ratios over 80% at the time of purchase. We use several types of credit enhancements to manage our single-family mortgage credit risk, including primary and pool mortgage insurance coverage. Mortgage insurance does not cover losses if the borrower's default is principally caused by damage to the underlying property, including when the damage is caused by natural disaster, like the hurricanes.
Table 30
displays our risk in force for mortgage insurance coverage on single-family loans in our guaranty book of business and our insurance in force for our mortgage insurer counterparties, excluding insurance coverage provided by federal government entities and credit insurance obtained through CIRT deals. The table includes our top nine mortgage insurer counterparties, which provided over
99%
of our total mortgage insurance coverage on single-family loans in our guaranty book of business as of
September 30, 2017
and
December 31, 2016
. In addition, for our mortgage insurer counterparties not approved to write new business, we have provided the percentage of their claims payments the counterparties are currently deferring based on the direction of their state regulators, referred to as their deferred payment obligation. As of
September 30, 2017
and
December 31, 2016
, less than
1%
of our total risk in force mortgage insurance coverage was pool insurance. In addition, approximately
1%
of our total insurance in force mortgage insurance coverage was pool insurance as of
September 30, 2017
and
December 31, 2016
.
When we estimate the credit losses that are inherent in our mortgage loans and under the terms of our guaranty obligations we also consider the recoveries that we expect to receive on primary mortgage insurance, as mortgage insurance recoveries would reduce the severity of the loss associated with defaulted loans. The amount by which our estimated benefit from mortgage insurance reduced our total combined loss reserves was
$1.0 billion
as of
September 30, 2017
and
$1.4 billion
as of
December 31, 2016
.
|
Fannie Mae Third Quarter 2017 Form 10-Q
|
53
|
|
|
MD&A | Risk Management
|
||
|
Table 30: Mortgage Insurance Coverage
|
|||||||||||||||||||||||
|
Risk in Force
(1)
|
Insurance in Force
(2)
|
||||||||||||||||||||||
|
As of
|
As of
|
Deferred
|
|||||||||||||||||||||
|
September 30,
|
December 31,
|
September 30,
|
December 31,
|
Payment
|
|||||||||||||||||||
|
2017
|
2016
|
2017
|
2016
|
Obligation %
(3)
|
|||||||||||||||||||
|
(Dollars in millions)
|
|||||||||||||||||||||||
|
Counterparty:
(4)
|
|||||||||||||||||||||||
|
Approved
:
(5)
|
|||||||||||||||||||||||
|
Arch Capital Group Ltd.:
(6)
|
|||||||||||||||||||||||
|
United Guaranty Residential Insurance Co.
|
$
|
25,818
|
|
$
|
27,161
|
|
$
|
98,794
|
|
$
|
104,418
|
|
|||||||||||
|
Arch Mortgage Insurance Co.
|
9,202
|
|
6,059
|
|
36,333
|
|
23,998
|
|
|||||||||||||||
|
Total Arch Capital Group Ltd.
|
35,020
|
|
33,220
|
|
135,127
|
|
128,416
|
|
|||||||||||||||
|
Radian Guaranty, Inc.
|
27,817
|
|
25,866
|
|
107,960
|
|
100,626
|
|
|||||||||||||||
|
Mortgage Guaranty Insurance Corp.
|
25,844
|
|
24,662
|
|
100,269
|
|
95,431
|
|
|||||||||||||||
|
Genworth Mortgage Insurance Corp.
|
19,914
|
|
18,573
|
|
78,352
|
|
73,075
|
|
|||||||||||||||
|
Essent Guaranty, Inc.
|
13,933
|
|
11,213
|
|
55,834
|
|
45,053
|
|
|||||||||||||||
|
National Mortgage Insurance Corp.
|
5,977
|
|
4,388
|
|
27,206
|
|
21,209
|
|
|||||||||||||||
|
Others
|
305
|
|
282
|
|
1,867
|
|
1,724
|
|
|||||||||||||||
|
Total approved
|
128,810
|
|
118,204
|
|
506,615
|
|
465,534
|
|
|||||||||||||||
|
Not approved
:
(5)
|
|||||||||||||||||||||||
|
PMI Mortgage Insurance Co.
(7)
|
3,112
|
|
3,790
|
|
12,434
|
|
15,112
|
|
28.5
|
%
|
|||||||||||||
|
Republic Mortgage Insurance Co.
(7)
|
2,550
|
|
3,104
|
|
9,888
|
|
12,043
|
|
—
|
|
|||||||||||||
|
Triad Guaranty Insurance Corp.
(7)
|
925
|
|
1,106
|
|
3,326
|
|
3,975
|
|
25.0
|
%
|
|||||||||||||
|
Others
|
10
|
|
11
|
|
28
|
|
34
|
|
|||||||||||||||
|
Total not approved
|
6,597
|
|
8,011
|
|
25,676
|
|
31,164
|
|
|||||||||||||||
|
Total
|
$
|
135,407
|
|
$
|
126,215
|
|
$
|
532,291
|
|
$
|
496,698
|
|
|||||||||||
|
Total as a percentage of single-family guaranty book of business
|
5
|
|
%
|
4
|
|
%
|
18
|
|
%
|
17
|
|
%
|
|||||||||||
__________
|
(1)
|
Risk in force is generally the maximum potential loss recovery under the applicable mortgage insurance policies in force and is based on the loan level insurance coverage percentage and, if applicable, any aggregate pool loss limit, as specified in the policy.
|
|
(2)
|
Insurance in force represents the unpaid principal balance of single-family loans in our guaranty book of business covered under the applicable mortgage insurance policies.
|
|
(3)
|
Deferred payment obligation represents the percentage of cash payments on policyholder claims being deferred as directed by the insurer’s respective regulator in its state of domicile. As of
September 30, 2017
, we had an aggregate unpaid issued deferred payment obligation of
$944 million
from PMI Mortgage Insurance Co. and Triad Guaranty Insurance Corporation. We reserve for any unpaid amounts for which collectability is uncertain.
|
|
(4)
|
Insurance coverage amounts provided for each counterparty may include coverage provided by affiliates and subsidiaries of the counterparty.
|
|
(5)
|
“Approved” mortgage insurers are counterparties approved to write new insurance with us. “Not approved” mortgage insurers are counterparties that are no longer approved to write new insurance with us.
|
|
(6)
|
In December 2016, Arch Capital Group Ltd., the ultimate parent company of Arch Mortgage Insurance Co., acquired United Guaranty Corporation. United Guaranty Corporation is the ultimate parent company of United Guaranty Residential Insurance Co.
|
|
(7)
|
These mortgage insurers are under various forms of supervised control by their state regulators and are in run-off.
|
When an insured loan held in our retained mortgage portfolio subsequently goes into foreclosure, we charge off the loan, eliminating any previously-recorded loss reserves, and record REO and a mortgage insurance receivable for the claim proceeds deemed probable of recovery, as appropriate. However, if a mortgage insurer rescinds, cancels or denies insurance coverage, the initial receivable becomes due from the mortgage seller or servicer. We had outstanding receivables of
$875 million
recorded in “Other assets” in our condensed consolidated balance sheets as of
September 30, 2017
and
$1.0 billion
as of
December 31, 2016
related to
|
Fannie Mae Third Quarter 2017 Form 10-Q
|
54
|
|
|
MD&A | Risk Management
|
||
amounts claimed on insured, defaulted loans excluding government insured loans. Of this amount,
$84 million
as of
September 30, 2017
and
$141 million
as of
December 31, 2016
was due from our mortgage sellers or servicers. We assessed the total outstanding receivables for collectibility, and they are recorded net of a valuation allowance of
$596 million
as of
September 30, 2017
and
$638 million
as of
December 31, 2016
. The valuation allowance reduces our claim receivable to the amount considered probable of collection as of
September 30, 2017
and
December 31, 2016
.
Credit Insurance Risk Transfer Counterparties
In a CIRT transaction, we shift a portion of the credit risk on a reference pool of mortgage loans to credit insurers or reinsurers.
As of September 30, 2017
, our single-family CIRT counterparties had a maximum liability to us of
$5.0 billion
. A portion of these counterparties’ obligation is collateralized with highly-rated liquid assets held in a trust account.
As of September 30, 2017
,
$1.3 billion
in assets securing these counterparties’ obligations were held in a trust account. Our credit risk exposure to our CIRT counterparties is concentrated. Our top
five
single-family CIRT counterparties had a maximum liability to us of
$2.9 billion
(representing
59%
of our total CIRT coverage) as of
September 30, 2017
, compared to
$2.1 billion
(
70%
of our total CIRT coverage) as of
December 31, 2016
. Our single-family CIRT transactions are described in “
Business Segments
—
Single-Family Business
—
Single-Family Mortgage Credit Risk Management
—
Transfer of Mortgage Credit Risk
—Credit Risk Transfer Transactions” in our
2016
Form 10-K.
Multifamily Lenders with Risk Sharing
We enter into risk sharing agreements with lenders pursuant to which the lenders agree to bear all or some portion of the credit losses on the covered loans. Our maximum potential loss recovery from lenders under risk sharing agreements on DUS and non-DUS multifamily loans was $
60.6 billion
as of
September 30, 2017
, compared with $
54.8 billion
as of
December 31, 2016
. As of
September 30, 2017
and
December 31, 2016
,
43%
of our maximum potential loss recovery on multifamily loans was from
four
DUS lenders.
As noted above in “
Business Segments
—
Multifamily Business
—
Multifamily Mortgage Credit Risk Management
—
Multifamily Acquisition Policy and Underwriting Standards
,” our primary multifamily delivery channel is our DUS program, which is comprised of lenders that range from large depositories to independent non-bank financial institutions. As of
September 30, 2017
and
December 31, 2016
, approximately
35%
of the unpaid principal balance of loans in our multifamily guaranty book of business serviced by our DUS lenders was from institutions with an external investment grade credit rating or a guaranty from an affiliate with an external investment grade credit rating. Given the recourse nature of the DUS program, DUS lenders are bound by eligibility standards that dictate, among other items, minimum capital and liquidity levels, and the posting of collateral at a highly rated custodian to secure a portion of the lenders’ future obligations. We actively monitor the financial condition of these lenders to help ensure the level of risk remains within our standards and to ensure required capital levels are maintained and are in alignment with actual and modeled loss projections.
Custodial Depository Institutions
We evaluate our custodial depository institutions to determine whether they are eligible to hold deposits on our behalf based on requirements specified in our Servicing Guide. If a custodial depository institution were to fail while holding remittances of borrower payments of principal and interest due to us in our custodial account, we would be exposed to risk for balances in excess of the deposit insurance protection and might not be able to recover all of the principal and interest payments being held by the depository on our behalf, or there might be a substantial delay in receiving these amounts. If this were to occur, we would be required to replace these amounts with our own funds to make payments that are due to Fannie Mae MBS certificateholders. Accordingly, the insolvency of one of our principal custodial depository institutions could result in significant financial losses to us.
A total of $
33.8 billion
in deposits for single-family payments were received and held by
256
institutions during the month of
September
2017
and a total of $
42.3 billion
in deposits for single-family payments were received and held by
258
institutions during the month of
December
2016
. Of these total deposits,
90%
as of
September 30, 2017
, compared with
91%
as of
December 31, 2016
were held by institutions rated as investment grade by S&P Global Ratings (“S&P”), Moody’s Investors Services (“Moody’s”) and Fitch Ratings Limited (“Fitch”).
|
Fannie Mae Third Quarter 2017 Form 10-Q
|
55
|
|
|
MD&A | Risk Management
|
||
During the month of
September
2017
, a total of
$3.7 billion
in deposits for multifamily payments were received and held by
28
institutions and
$3.1 billion
in deposits for multifamily payments were received and held by
27
institutions during the month of
December
2016
. Of these total deposits,
98%
as of
September 30, 2017
and
December 31, 2016
were held by institutions rated as investment grade by S&P, Moody’s and Fitch.
Our transactions with custodial depository institutions are concentrated. Our six largest single-family custodial depository institutions held
78%
of these deposits as of
September 30, 2017
, compared with
80%
as of
December 31, 2016
. Our six largest multifamily custodial depository institutions held
92%
of these deposits as of
September 30, 2017
, compared with
91%
as of
December 31, 2016
.
Counterparty Credit Exposure of Investments Held in Our Other Investments Portfolio
Our other investments portfolio consists of cash and cash equivalents, securities purchased under agreements to resell or similar arrangements and U.S. Treasury securities. Our other investment counterparties are primarily financial institutions, including clearing organizations, and the Federal Reserve Bank.
As of September 30, 2017
, we held
$5.3 billion
in short-term unsecured deposits with
four
financial institutions compared to $2.0 billion held with two financial institutions as
December 31, 2016
. The short-term credit ratings for each of these financial institutions by S&P, Moody’s and Fitch, were at least A-1 or the Moody’s or Fitch equivalent of A-1. See “
Liquidity and Capital Management
—
Liquidity Management
—
Other Investments Portfolio
” for more detailed information on our other investments portfolio.
Derivative Counterparty Credit Exposure
Our derivative counterparty credit exposure relates principally to interest rate derivative contracts. We are exposed to the risk that a counterparty in a derivative transaction will default on payments due to us, which may require us to seek a replacement derivative from a different counterparty. This replacement may be at a higher cost, or we may be unable to find a suitable replacement. Historically, our risk management derivative transactions have been made pursuant to bilateral contracts with a specific counterparty governed by the terms of an International Swaps and Derivatives Association Inc. master agreement. Pursuant to regulations implementing the Dodd-Frank Wall Street Reform and Consumer Protection Act, we are required to submit certain categories of new interest rate swaps to a derivatives clearing organization. We refer to our derivative transactions made pursuant to bilateral contracts as our over-the-counter (“OTC”) derivative transactions and our derivative transactions accepted for clearing by a derivatives clearing organization as our cleared derivative transactions.
We manage our derivative counterparty credit exposure relating to our OTC derivative transactions through enforceable master netting arrangements. These arrangements allow us to net derivative assets and liabilities with the same counterparty. We also manage our derivative counterparty exposure relating to our OTC derivative transactions by requiring counterparties to post collateral, which may include cash, U.S. Treasury securities, agency debt and agency mortgage-related securities. Regulations that took effect March 1, 2017 require posting of variation margin without the application of any thresholds for OTC derivative transactions executed after that date.
Our cleared derivative transactions are submitted to derivatives clearing organizations on our behalf through clearing members of the organizations. A contract accepted by a derivatives clearing organization is governed by the terms of the clearing organization’s rules and arrangements between us and the clearing member of the clearing organization. As a result, we are exposed to the institutional credit risk of both the derivatives clearing organizations and the members who are acting on our behalf. We manage our credit exposure relating to our cleared derivative transactions through enforceable master netting arrangements. These arrangements allow us to net our exposure to cleared derivatives by clearing organization and by clearing member.
We will continue to have credit risk exposure to derivatives clearing organizations and certain of their members in the future as cleared derivative contracts comprise a larger percentage of our derivative instruments. We estimate our exposure to credit loss on derivative instruments by calculating the replacement cost, on a present value basis, to settle at current market prices all outstanding derivative contracts in a net gain position at the counterparty level where the right of legal offset exists.
The fair value of derivatives in a gain position is included in our condensed consolidated balance sheets in “Other assets.” Total exposure represents our exposure to credit loss on derivative instruments less the cash and non-cash collateral posted by our counterparties to us. This does not include collateral held in excess of exposure. Our total exposure was
$29 million
as of
September 30, 2017
and
$54 million
as of
December 31, 2016
. The majority
|
Fannie Mae Third Quarter 2017 Form 10-Q
|
56
|
|
|
MD&A | Risk Management
|
||
of our total exposure as of each date consisted of credit risk transfer transactions and mortgage insurance contracts that we account for as derivatives.
As of
September 30, 2017
, we had
thirteen
counterparties with which we may transact OTC derivative transactions, all of which were subject to enforceable master netting arrangements, compared with
sixteen
counterparties as of
December 31, 2016
. We had outstanding notional amounts with all of these counterparties, and the highest concentration by our total outstanding notional amount was approximately
8%
as of
September 30, 2017
and approximately
9%
as of
December 31, 2016
.
See “
Note 8, Derivative Instruments
” and “
Note 13, Netting Arrangements
” for additional information on our derivative contracts as of
September 30, 2017
and
December 31, 2016
.
Market Risk Management, Including Interest Rate Risk Management
We are subject to market risk, which includes interest rate risk, spread risk and liquidity risk. These risks arise from our mortgage asset investments. Interest rate risk is the risk of loss from adverse changes in the value of our assets or liabilities or our future earnings due to changes in interest rates. Spread risk or basis risk is the resulting impact of changes in the spread between our mortgage assets and our debt and derivatives we use to hedge our position. Liquidity risk is the risk that we will not be able to meet our funding obligations in a timely manner. We describe our sources of interest rate risk exposure, business risks posed by changes in interest rates, and our strategy for managing interest rate risk and spread risk in “MD&A—Risk Management—Market Risk Management, Including Interest Rate Risk Management” and in “Risk Factors” in our
2016
Form 10-K.
Measurement of Interest Rate Risk
Below we present two quantitative metrics that provide estimates of our interest rate risk exposure: (1) fair value sensitivity of our net portfolio to changes in interest rate levels and slope of yield curve; and (2) duration gap. Our net portfolio consists of our retained mortgage portfolio assets; other investments portfolio assets; our outstanding debt of Fannie Mae that is used to fund our retained mortgage portfolio assets and other investments portfolio assets; mortgage commitments; and risk management derivatives. Risk management derivatives along with our debt instruments are used to manage interest rate risk.
The metrics presented are calculated using internal models that require standard assumptions regarding interest rates and future prepayments of principal over the remaining life of our securities. These assumptions are derived based on the characteristics of the underlying structure of the securities and historical prepayment rates experienced at specified interest rate levels, taking into account current market conditions, the current mortgage rates of our existing outstanding loans, loan age and other factors. On a continuous basis, management makes judgments about the appropriateness of the risk assessments and will make adjustments as necessary to properly assess our interest rate exposure and manage our interest rate risk. The methodologies used to calculate risk estimates are periodically changed on a prospective basis to reflect improvements in the underlying estimation process.
Interest Rate Sensitivity to Changes in Interest Rate Level and Slope of Yield Curve
Pursuant to a disclosure commitment with FHFA, we disclose on a monthly basis the estimated adverse impact on the fair value of our net portfolio that would result from the following hypothetical situations:
|
•
|
A 50 basis point shift in interest rates.
|
|
•
|
A 25 basis point change in the slope of the yield curve.
|
In measuring the estimated impact of changes in the level of interest rates, we assume a parallel shift in all maturities of the U.S. LIBOR interest rate swap curve.
In measuring the estimated impact of changes in the slope of the yield curve, we assume a constant 7-year rate and a shift of 16.7 basis points for the 1-year rate and 8.3 basis points for the 30-year rate. We believe these interest rate shocks represent moderate movements in interest rates over a one-month period.
Duration Gap
Duration gap measures the price sensitivity of our assets and liabilities in our net portfolio to changes in interest rates by quantifying the difference between the estimated durations of our assets and liabilities. Our duration gap analysis reflects the extent to which the estimated maturity and repricing cash flows for our assets are matched, on average, over time and across interest rate scenarios to those of our liabilities. A positive duration gap
|
Fannie Mae Third Quarter 2017 Form 10-Q
|
57
|
|
|
MD&A | Risk Management
|
||
indicates that the duration of our assets exceeds the duration of our liabilities. We disclose duration gap on a monthly basis under the caption “Interest Rate Risk Disclosures” in our Monthly Summary, which is available on our website and announced in a press release.
While our goal is to reduce the price sensitivity of our net portfolio to movements in interest rates, various factors can contribute to a duration gap that is either positive or negative. For example, changes in the market environment can increase or decrease the price sensitivity of our mortgage assets relative to the price sensitivity of our liabilities because of prepayment uncertainty associated with our assets. In a declining interest rate environment, prepayment rates tend to accelerate, thereby shortening the duration and average life of the fixed rate mortgage assets we hold in our net portfolio. Conversely, when interest rates increase, prepayment rates generally slow, which extends the duration and average life of our mortgage assets. Our debt and derivative instrument positions are used to manage the interest rate sensitivity of our retained mortgage portfolio and our investments in non-mortgage securities. As a result, the degree to which the interest rate sensitivity of our retained mortgage portfolio and our investments in non-mortgage securities is offset will depend on, among other factors, the mix of funding and other risk management derivative instruments we use at any given point in time.
The market value sensitivities of our net portfolio are a function of both the duration and the convexity of our net portfolio. Duration provides a measure of the price sensitivity of a financial instrument to changes in interest rates while convexity reflects the degree to which the duration of the assets and liabilities in our net portfolio changes in response to a given change in interest rates. We use convexity measures to provide us with information about how quickly and by how much our net portfolio’s duration may change in different interest rate environments. The market value sensitivity of our net portfolio will depend on a number of factors, including the interest rate environment, modeling assumptions and the composition of assets and liabilities in our net portfolio, which vary over time.
Results of Interest Rate Sensitivity Measures
The interest rate risk measures discussed below exclude the impact of changes in the fair value of our guaranty assets and liabilities resulting from changes in interest rates. We exclude our guaranty business from these sensitivity measures based on our current assumption that the guaranty fee income generated from future business activity will largely replace guaranty fee income lost due to mortgage prepayments.
Table 31
displays the pre-tax market value sensitivity of our net portfolio to changes in the level of interest rates and the slope of the yield curve as measured on the last day of each period presented.
Table 31
also provides the daily average, minimum, maximum and standard deviation values for duration gap and for the most adverse market value impact on the net portfolio to changes in the level of interest rates and the slope of the yield curve
for the three months
ended
September 30, 2017
and
2016
.
The sensitivity measures displayed in
Table 31
, which we disclose on a quarterly basis pursuant to a disclosure commitment with FHFA, are an extension of our monthly sensitivity measures. There are three primary differences between our monthly sensitivity disclosure and the quarterly sensitivity disclosure presented below: (1) the quarterly disclosure is expanded to include the sensitivity results for larger rate level shocks of positive or negative 100 basis points; (2) the monthly disclosure reflects the estimated pre-tax impact on the market value of our net portfolio calculated based on a daily average, while the quarterly disclosure reflects the estimated pre-tax impact calculated based on the estimated financial position of our net portfolio and the market environment as of the last business day of the quarter; and (3) the monthly disclosure shows the most adverse pre-tax impact on the market value of our net portfolio from the hypothetical interest rate shocks, while the quarterly disclosure includes the estimated pre-tax impact of both up and down interest rate shocks.
|
Fannie Mae Third Quarter 2017 Form 10-Q
|
58
|
|
|
MD&A | Risk Management
|
||
|
Table 31: Interest Rate Sensitivity of Net Portfolio to Changes in Interest Rate Level and Slope of Yield Curve
|
|||||||||||
|
As of
(1)(2)
|
|||||||||||
|
September 30, 2017
|
December 31, 2016
|
||||||||||
|
(Dollars in billions)
|
|||||||||||
|
Rate level shock:
|
|||||||||||
|
-100 basis points
|
$
|
0.0
|
|
$
|
(0.2
|
)
|
|||||
|
-50 basis points
|
0.0
|
|
0.0
|
|
|||||||
|
+50 basis points
|
0.0
|
|
0.0
|
|
|||||||
|
+100 basis points
|
(0.1
|
)
|
0.0
|
|
|||||||
|
Rate slope shock:
|
|||||||||||
|
-25 basis points (flattening)
|
0.0
|
|
0.0
|
|
|||||||
|
+25 basis points (steepening)
|
0.0
|
|
0.0
|
|
|||||||
|
For the Three Months Ended September 30,
(1)(3)
|
|||||||||||||||||||||||||||
|
2017
|
2016
|
||||||||||||||||||||||||||
|
Duration Gap
|
Rate Slope Shock 25 bps
|
Rate Level Shock 50 bps
|
Duration Gap
|
Rate Slope Shock 25 bps
|
Rate Level Shock 50 bps
|
||||||||||||||||||||||
|
Exposure
|
Exposure
|
||||||||||||||||||||||||||
|
(In months)
|
(Dollars in billions)
|
(In months)
|
(Dollars in billions)
|
||||||||||||||||||||||||
|
Average
|
0.0
|
$
|
0.0
|
|
$
|
0.0
|
|
0.3
|
$
|
0.0
|
|
$
|
0.0
|
|
|||||||||||||
|
Minimum
|
(0.4)
|
0.0
|
|
0.0
|
|
(0.3)
|
0.0
|
|
0.0
|
|
|||||||||||||||||
|
Maximum
|
0.3
|
0.0
|
|
0.1
|
|
0.9
|
0.1
|
|
0.1
|
|
|||||||||||||||||
|
Standard deviation
|
0.2
|
0.0
|
|
0.0
|
|
0.3
|
0.0
|
|
0.0
|
|
|||||||||||||||||
__________
|
(1)
|
Computed based on changes in LIBOR interest rates swap curve.
|
|
(2)
|
Measured on the last day of each period presented.
|
|
(3)
|
Computed based on daily values during the period presented.
|
The market value sensitivity of our net portfolio varies across a range of interest rate shocks depending upon the duration and convexity profile of our net portfolio. Because the effective duration gap of our net portfolio was close to zero months in the periods presented, the convexity exposure was the primary driver of the market value sensitivity of our net portfolio as of
September 30, 2017
. In addition, the convexity exposure may result in similar market value sensitivities for positive and negative interest rate shocks of the same magnitude.
A majority of the interest rate risk associated with our mortgage-related securities and loans is hedged with our debt issuances, which include callable debt. We use derivatives to help manage the residual interest rate risk exposure between our assets and liabilities. Derivatives have enabled us to keep our interest rate risk exposure at consistently low levels in a wide range of interest-rate environments.
Table 32
displays an example of how derivatives impacted the net market value exposure for a 50 basis point parallel interest rate shock.
|
Table 32: Derivative Impact on Interest Rate Risk (50 Basis Points)
|
|||||||||||
|
As of
(1)
|
|||||||||||
|
September 30, 2017
|
December 31, 2016
|
||||||||||
|
(Dollars in billions)
|
|||||||||||
|
Before derivatives
|
$
|
(0.6
|
)
|
$
|
(1.0
|
)
|
|||||
|
After derivatives
|
0.0
|
|
0.0
|
|
|||||||
|
Effect of derivatives
|
0.6
|
|
1.0
|
|
|||||||
__________
|
(1)
|
Measured on the last day of each period presented.
|
|
Fannie Mae Third Quarter 2017 Form 10-Q
|
59
|
|
|
MD&A | Risk Management
|
||
Liquidity Risk Management
See “MD&A—Liquidity and Capital Management—Liquidity Management” in our
2016
Form 10-K and in this report for a discussion of how we manage liquidity risk.
Operational Risk Management
See “MD&A—Risk Management—Operational Risk Management” in our
2016
Form 10-K for information on operational risks that we face and our framework for managing operational risk.
|
Critical Accounting Policies and Estimates
|
||||
The preparation of financial statements in accordance with GAAP requires management to make a number of judgments, estimates and assumptions that affect the reported amount of assets, liabilities, income and expenses in the condensed consolidated financial statements. Understanding our accounting policies and the extent to which we use management judgment and estimates in applying these policies is integral to understanding our financial statements. We describe our most significant accounting policies in “
Note 1, Summary of Significant Accounting Policies
” in this report and in our
2016
Form 10-K.
We evaluate our critical accounting estimates and judgments required by our policies on an ongoing basis and update them as necessary based on changing conditions. Management has discussed any significant changes in judgments and assumptions in applying our critical accounting policies with the Audit Committee of our Board of Directors. See “Risk Factors” in our
2016
Form 10-K for a discussion of the risks associated with the need for management to make judgments and estimates in applying our accounting policies and methods. We have identified two of our accounting policies as critical because they involve significant judgments and assumptions about highly complex and inherently uncertain matters, and the use of reasonably different estimates and assumptions could have a material impact on our reported results of operations or financial condition: fair value measurement and combined loss reserves.
Combined Loss Reserves
Our combined loss reserves consist of the following components:
|
•
|
Allowance for loan losses
|
|
•
|
Reserve for guaranty losses
|
These components can be further allocated into our single-family and multifamily loss reserves.
We maintain an allowance for loan losses for loans classified as held for investment, including both loans we hold in our portfolio and loans held in consolidated Fannie Mae MBS trusts. We maintain a reserve for guaranty losses for loans held in unconsolidated Fannie Mae MBS trusts we guarantee and loans we have guaranteed under long-term standby commitments and other credit enhancements we have provided. These amounts, which we collectively refer to as our combined loss reserves, represent probable losses incurred related to loans in our guaranty book of business, including concessions granted to borrowers upon modifications of their loans, as of the balance sheet date.
The allowance for loan losses is a valuation allowance that reflects an estimate of incurred credit losses related to our loans held for investment. The reserve for guaranty losses is a liability account in our consolidated balance sheets that reflects an estimate of incurred credit losses related to our guaranty to each unconsolidated Fannie Mae MBS trust that we will supplement amounts received by the Fannie Mae MBS trust as required to permit timely payments of principal and interest on the related Fannie Mae MBS. As a result, the guaranty reserve considers not only the principal and interest due on the loan at the current balance sheet date, but also an estimate of any additional interest payments due to the trust from the current balance sheet date until the point of loan acquisition or foreclosure. Our loss reserves consist of a specific loss reserve for individually impaired loans and a collective loss reserve for all other loans.
We have an established process, using analytical tools, benchmarks and management judgment, to determine our loss reserves. Our process for determining our loss reserves is complex and involves significant management judgment. Although our loss reserve process benefits from extensive historical loan performance data, this process is subject to risks and uncertainties, including a reliance on historical loss information that may not be representative of current conditions. We continually monitor prepayment, delinquency, modification, default and
|
Fannie Mae Third Quarter 2017 Form 10-Q
|
60
|
|
|
MD&A | Critical Accounting Policies and Estimates
|
||
loss severity trends and periodically make changes in our historically developed assumptions and estimates as necessary to better reflect present conditions, including current trends in borrower risk, general economic trends, changes in risk management practices, and changes in public policy and the regulatory environment. We also consider the recoveries that we expect to receive on mortgage insurance and other loan-specific credit enhancements entered into contemporaneously with and in contemplation of a guaranty or loan purchase transaction, as such recoveries reduce the severity of the loss associated with defaulted loans.
As of September 30, 2017, our allowance for loan losses of
$20.2 billion
includes an estimate of incurred credit losses from the hurricanes of approximately
$1.0 billion
. Approximately
80
% of the estimate relates to our single-family mortgage loans in Puerto Rico which, as of September 30, 2017, had an unpaid principal balance of
$8.9 billion
. Our estimate of incurred credit losses from the hurricanes is based on assumptions about a number of factors, including the probability of borrower default, the hurricanes’ impact on collateral value, and potential insurance recoveries. We used our historical data from past hurricanes as a basis for our assumptions, while taking into account that the recent hurricanes may not be fully comparable to past hurricanes. The accuracy of our assumptions may be significantly impacted by the limited nature of information available to us at this time. For Hurricane Harvey and Hurricane Irma, we have initial information on trends in borrower delinquencies and have been able to preliminarily assess the severity of property damage. For Puerto Rico, because Hurricane Maria occurred in late September 2017, soon after Hurricane Irma, there is less information available on borrower delinquencies and we have had limited opportunity to assess the severity of property damage. Our estimate will likely change in the future as additional information becomes available. We will continue to evaluate our assumptions and any resulting adjustments to our estimate will impact our allowance for loan losses in future periods.
Single-Family Loss Reserves
We establish a specific single-family loss reserve for individually impaired loans, which includes loans we restructure in troubled debt restructurings (“TDRs”), certain nonperforming loans in MBS trusts and acquired credit-impaired loans that have been further impaired subsequent to acquisition. The single-family loss reserve for individually impaired loans represents the majority of our single-family loss reserves due to the high volume of restructured loans. We typically measure impairment based on the difference between our recorded investment in the loan and the present value of the estimated cash flows we expect to receive, which we calculate using the effective interest rate of the original loan or the effective interest rate at acquisition for an acquired credit-impaired loan. However, when foreclosure is probable on an individually impaired loan, we measure impairment based on the difference between our recorded investment in the loan and the fair value of the underlying property, adjusted for the estimated discounted costs to sell the property and estimated insurance or other proceeds we expect to receive. When a loan has been restructured or modified, we measure impairment using a cash flow analysis discounted at the loan’s original effective interest rate.
We establish a collective single-family loss reserve for all other single-family loans in our single-family guaranty book of business using a model that estimates the probability of default of loans to derive a loss reserve estimate given multiple factors such as: origination year, mark-to-market LTV ratio, delinquency status and loan product type. The loss severity estimates we use in determining our loss reserves reflect current available information on actual events and conditions as of each balance sheet date, including current home prices. Our loss severity estimates do not incorporate assumptions about future changes in home prices. We do, however, use recent regional historical sales and appraisal information, including the sales of our own foreclosed properties, to develop our loss severity estimates for all loan categories.
Multifamily Loss Reserves
We establish a collective multifamily loss reserve for all loans in our multifamily guaranty book of business that are not individually impaired using an internal model that applies loss factors to loans in similar risk categories. Our loss factors are developed based on our historical default and loss severity experience. Management may also apply judgment to adjust the loss factors derived from our models, taking into consideration model imprecision and specific, known events, such as current credit conditions, that may affect the credit quality of our multifamily loan portfolio but are not yet reflected in our model-generated loss factors.
We establish a specific multifamily loss reserve for multifamily loans that we determine are individually impaired. We identify multifamily loans for evaluation for impairment through a credit risk assessment process. As part of this assessment process, we stratify multifamily loans into different internal risk categories based on the credit risk inherent in each individual loan and management judgment. We categorize loan credit risk, taking into
|
Fannie Mae Third Quarter 2017 Form 10-Q
|
61
|
|
|
MD&A | Critical Accounting Policies and Estimates
|
||
consideration available operating statements and expected cash flows from the underlying property, the estimated value of the property, the historical loan payment experience and current relevant market conditions that may impact credit quality. If we conclude that a multifamily loan is impaired, we measure the impairment based on the difference between our recorded investment in the loan and the fair value of the underlying property less the estimated discounted costs to sell the property and any lender loss sharing or other proceeds we expect to receive. When a multifamily loan is deemed individually impaired because we have modified it, we measure the impairment based on the difference between our recorded investment in the loan and the present value of expected cash flows discounted at the loan’s original interest rate unless foreclosure is probable, at which time we measure impairment the same way we measure it for other individually impaired multifamily loans.
See “MD&A—Critical Accounting Policies and Estimates” in our
2016
Form 10-K for a discussion of our fair value measurement critical accounting policies and estimates.
|
Impact of Future Adoption of New Accounting Guidance
|
||||
We identify and discuss the expected impact on our condensed consolidated financial statements of recently issued accounting guidance in “
Note 1, Summary of Significant Accounting Policies
.”
|
Forward-Looking Statements
|
||||
This report includes statements that constitute forward-looking statements within the meaning of Section 21E of the Securities Exchange Act of 1934 (the “Exchange Act”). In addition, our senior management may from time to time make forward-looking statements orally to analysts, investors, the news media and others. Forward-looking statements often include words such as “expect,” “anticipate,” “intend,” “plan,” “believe,” “seek,” “estimate,” “forecast,” “project,” “would,” “should,” “could,” “likely,” “may,” “will” or similar words. Examples of forward-looking statements in this report include, but are not limited to, statements relating to our expectations regarding the following matters:
|
•
|
our profitability and financial results, and the factors that will affect our profitability and financial results;
|
|
•
|
our revenues and the factors that will affect our revenues;
|
|
•
|
the composition, quality and size of our retained mortgage portfolio;
|
|
•
|
our business plans and strategies and the impact of such plans and strategies;
|
|
•
|
our capital reserves and our dividend payments to Treasury;
|
|
•
|
our payments to HUD and Treasury funds under the GSE Act;
|
|
•
|
the impact of legislation, regulation and accounting guidance on our business or financial results, including the impact of corporate income tax legislation and impairment accounting guidance;
|
|
•
|
housing and mortgage market conditions (including home price appreciation rates, mortgage origination volumes, changes in interest rates and changes in mortgage spreads) and the impact of such conditions on our financial results;
|
|
•
|
the risks to our business;
|
|
•
|
our credit losses and loss reserves;
|
|
•
|
our serious delinquency rate and foreclosures;
|
|
•
|
our engagement in credit risk transfer transactions and the effects of those transactions;
|
|
•
|
factors that will affect or mitigate our credit risk exposure;
|
|
•
|
the characteristics and performance of the loans in our book of business and factors that will affect their characteristics and performance;
|
|
•
|
our single-family loan acquisitions and the credit risk profile of such acquisitions;
|
|
•
|
factors that will affect our liquidity and ability to meet our debt obligations and factors relating to our liquidity contingency plans; and
|
|
Fannie Mae Third Quarter 2017 Form 10-Q
|
62
|
|
|
MD&A | Forward-Looking Statements
|
||
|
•
|
our response to legal and regulatory proceedings and their impact on our business or financial condition.
|
Forward-looking statements reflect our management’s expectations, forecasts or predictions of future conditions, events or results based on various assumptions and management’s estimates of trends and economic factors in the markets in which we are active, as well as our business plans. They are not guarantees of future performance. By their nature, forward-looking statements are subject to risks and uncertainties. Our actual results and financial condition may differ, possibly materially, from the anticipated results and financial condition indicated in these forward-looking statements.
There are a number of factors that could cause actual conditions, events or results to differ materially from those described in the forward-looking statements contained in this report, including, but not limited to, the following:
|
•
|
the uncertainty of our future;
|
|
•
|
future legislative and regulatory requirements or changes affecting us, such as the enactment of housing finance reform legislation or corporate income tax reform legislation;
|
|
•
|
actions by FHFA, Treasury, HUD or other regulators that affect our business;
|
|
•
|
changes in the structure and regulation of the financial services industry;
|
|
•
|
the timing and level of, as well as regional variation in, home price changes;
|
|
•
|
changes in interest rates, including negative interest rates;
|
|
•
|
changes in unemployment rates and other macroeconomic and housing market variables;
|
|
•
|
the level and volatility of interest rates and credit spreads;
|
|
•
|
credit availability;
|
|
•
|
disruptions in the housing and credit markets;
|
|
•
|
changes in the fiscal and monetary policies of the Federal Reserve, including implementation of the Federal Reserve’s balance sheet normalization program;
|
|
•
|
our future guaranty fee pricing and the impact of that pricing on our competitive environment and guaranty fee revenues;
|
|
•
|
the size, composition and quality of our guaranty book of business and retained mortgage portfolio;
|
|
•
|
our market share;
|
|
•
|
the life of the loans in our guaranty book of business;
|
|
•
|
our future serious delinquency rates;
|
|
•
|
the deteriorated credit performance of many loans in our guaranty book of business;
|
|
•
|
the conservatorship and its effect on our business;
|
|
•
|
the investment by Treasury and its effect on our business;
|
|
•
|
adverse effects from activities we undertake to support the mortgage market and help borrowers;
|
|
•
|
actions we may be required to take by FHFA, in its role as our conservator or as our regulator, such as changes in the type of business we do or implementation of the Single Security Initiative for Fannie Mae and Freddie Mac;
|
|
•
|
limitations on our business imposed by FHFA, in its role as our conservator or as our regulator;
|
|
•
|
our future objectives and activities in support of those objectives, including actions we may take to reach additional underserved creditworthy borrowers;
|
|
•
|
a decrease in our credit ratings;
|
|
•
|
limitations on our ability to access the debt capital markets;
|
|
•
|
significant changes in modification and foreclosure activity;
|
|
•
|
the volume and pace of future nonperforming and reperforming loan sales and their impact on our results and serious delinquency rates;
|
|
•
|
changes in borrower behavior;
|
|
Fannie Mae Third Quarter 2017 Form 10-Q
|
63
|
|
|
MD&A | Forward-Looking Statements
|
||
|
•
|
the effectiveness of our loss mitigation strategies, management of our REO inventory and pursuit of contractual remedies;
|
|
•
|
defaults by one or more institutional counterparties;
|
|
•
|
resolution or settlement agreements we may enter into with our counterparties;
|
|
•
|
our need to rely on third parties to fully achieve some of our corporate objectives;
|
|
•
|
our reliance on mortgage servicers;
|
|
•
|
changes in GAAP;
|
|
•
|
guidance by the Financial Accounting Standards Board (“FASB”);
|
|
•
|
future changes to our accounting policies;
|
|
•
|
changes in the fair value of our assets and liabilities; operational control weaknesses;
|
|
•
|
our reliance on models and future updates we make to our models, including the assumptions used by these models;
|
|
•
|
challenges we face in retaining and hiring qualified executives and other employees;
|
|
•
|
global political risks;
|
|
•
|
natural disasters, environmental disasters, terrorist attacks, pandemics or other major disruptive events;
|
|
•
|
cyber attacks or other information security breaches or threats; and
|
|
•
|
those factors described in “Risk Factors” in this report and in our
2016
Form 10-K.
|
Readers are cautioned to place forward-looking statements in this report or that we make from time to time into proper context by carefully considering the factors discussed in “Risk Factors” in this report and in our
2016
Form 10-K. These forward-looking statements are representative only as of the date they are made, and we undertake no obligation to update any forward-looking statement as a result of new information, future events or otherwise, except as required under the federal securities laws.
|
Fannie Mae Third Quarter 2017 Form 10-Q
|
64
|
|
|
Financial Statements | Condensed Consolidated Balance Sheets
|
||
FANNIE MAE
(In conservatorship)
Condensed Consolidated Balance Sheets — (Unaudited)
(Dollars in millions, except share amounts)
|
As of
|
|||||||||||
|
September 30,
|
December 31,
|
||||||||||
|
2017
|
2016
|
||||||||||
|
ASSETS
|
|||||||||||
|
Cash and cash equivalents
|
$
|
23,914
|
|
$
|
25,224
|
|
|||||
|
Restricted cash (includes $23,126 and $31,536, related to consolidated trusts)
|
28,137
|
|
36,953
|
|
|||||||
|
Federal funds sold and securities purchased under agreements to resell or similar arrangements
|
23,740
|
|
30,415
|
|
|||||||
|
Investments in securities:
|
|||||||||||
|
Trading, at fair value (includes $727 and $1,277, respectively, pledged as collateral)
|
36,886
|
|
40,562
|
|
|||||||
|
Available-for-sale, at fair value (includes $92 and $107, respectively, related to consolidated trusts)
|
5,963
|
|
8,363
|
|
|||||||
|
Total investments in securities
|
42,849
|
|
48,925
|
|
|||||||
|
Mortgage loans:
|
|||||||||||
|
Loans held for sale, at lower of cost or fair value
|
4,516
|
|
2,899
|
|
|||||||
|
Loans held for investment, at amortized cost:
|
|||||||||||
|
Of Fannie Mae
|
170,473
|
|
204,318
|
|
|||||||
|
Of consolidated trusts
|
2,997,964
|
|
2,896,001
|
|
|||||||
|
Total loans held for investment (includes $11,013 and $12,057, respectively, at fair value)
|
3,168,437
|
|
3,100,319
|
|
|||||||
|
Allowance for loan losses
|
(20,194
|
)
|
(23,465
|
)
|
|||||||
|
Total loans held for investment, net of allowance
|
3,148,243
|
|
3,076,854
|
|
|||||||
|
Total mortgage loans
|
3,152,759
|
|
3,079,753
|
|
|||||||
|
Deferred tax assets, net
|
30,454
|
|
33,530
|
|
|||||||
|
Accrued interest receivable, net (includes $7,496 and $7,064, respectively, related to consolidated trusts)
|
8,097
|
|
7,737
|
|
|||||||
|
Acquired property, net
|
3,581
|
|
4,489
|
|
|||||||
|
Other assets
|
17,228
|
|
20,942
|
|
|||||||
|
Total assets
|
$
|
3,330,759
|
|
$
|
3,287,968
|
|
|||||
|
LIABILITIES AND EQUITY
|
|||||||||||
|
Liabilities:
|
|||||||||||
|
Accrued interest payable (includes $8,482 and $8,285, respectively, related to consolidated trusts)
|
$
|
9,637
|
|
$
|
9,431
|
|
|||||
|
Debt:
|
|||||||||||
|
Of Fannie Mae (includes $8,491 and $9,582, respectively, at fair value)
|
291,289
|
|
327,097
|
|
|||||||
|
Of consolidated trusts (includes $32,760 and $36,524, respectively, at fair value)
|
3,017,294
|
|
2,935,219
|
|
|||||||
|
Other liabilities (includes $362 and $390, respectively, related to consolidated trusts)
|
8,891
|
|
10,150
|
|
|||||||
|
Total liabilities
|
3,327,111
|
|
3,281,897
|
|
|||||||
|
Commitments and contingencies (Note 15)
|
—
|
|
—
|
|
|||||||
|
Stockholders’ equity:
|
|||||||||||
|
Senior preferred stock, 1,000,000 shares issued and outstanding
|
117,149
|
|
117,149
|
|
|||||||
|
Preferred stock, 700,000,000 shares are authorized—555,374,922 shares issued and outstanding
|
19,130
|
|
19,130
|
|
|||||||
|
Common stock, no par value, no maximum authorization—1,308,762,703 shares issued, 1,158,087,567 and 1,158,082,750 shares outstanding, respectively
|
687
|
|
687
|
|
|||||||
|
Accumulated deficit
|
(126,625
|
)
|
(124,253
|
)
|
|||||||
|
Accumulated other comprehensive income
|
707
|
|
759
|
|
|||||||
|
Treasury stock, at cost, 150,675,136 and 150,679,953 shares, respectively
|
(7,400
|
)
|
(7,401
|
)
|
|||||||
|
Total stockholders’ equity (See Note 1: Senior Preferred Stock for information on our dividend to Treasury)
|
3,648
|
|
6,071
|
|
|||||||
|
Total liabilities and equity
|
$
|
3,330,759
|
|
$
|
3,287,968
|
|
|||||
See Notes to Condensed Consolidated Financial Statements
|
Fannie Mae (In conservatorship) Third Quarter 2017 Form 10-Q
|
65
|
|
|
Financial Statements | Condensed Consolidated Statements of Operations and Comprehensive Income
|
||
FANNIE MAE
(In conservatorship)
(Dollars and shares in millions, except per share amounts)
|
For the Three Months
|
For the Nine Months
|
||||||||||||||||||||||
|
Ended September 30,
|
Ended September 30,
|
||||||||||||||||||||||
|
2017
|
2016
|
2017
|
2016
|
||||||||||||||||||||
|
Interest income:
|
|||||||||||||||||||||||
|
Trading securities
|
$
|
195
|
|
$
|
140
|
|
$
|
513
|
|
$
|
388
|
|
|||||||||||
|
Available-for-sale securities
|
77
|
|
134
|
|
269
|
|
507
|
|
|||||||||||||||
|
Mortgage loans (includes $25,168 and $23,254, respectively, for the three months ended and $75,155 and $71,746, respectively, for the nine months ended related to consolidated trusts)
|
27,047
|
|
25,611
|
|
81,105
|
|
78,828
|
|
|||||||||||||||
|
Other
|
142
|
|
66
|
|
351
|
|
160
|
|
|||||||||||||||
|
Total interest income
|
27,461
|
|
25,951
|
|
82,238
|
|
79,883
|
|
|||||||||||||||
|
Interest expense:
|
|||||||||||||||||||||||
|
Short-term debt
|
72
|
|
56
|
|
173
|
|
164
|
|
|||||||||||||||
|
Long-term debt (includes $20,609 and $18,814, respectively, for the three months ended and $61,622 and $58,993, respectively, for the nine months ended related to consolidated trusts)
|
22,115
|
|
20,460
|
|
66,443
|
|
64,229
|
|
|||||||||||||||
|
Total interest expense
|
22,187
|
|
20,516
|
|
66,616
|
|
64,393
|
|
|||||||||||||||
|
Net interest income
|
5,274
|
|
5,435
|
|
15,622
|
|
15,490
|
|
|||||||||||||||
|
Benefit (provision) for credit losses
|
(182
|
)
|
673
|
|
1,481
|
|
3,458
|
|
|||||||||||||||
|
Net interest income after benefit (provision) for credit losses
|
5,092
|
|
6,108
|
|
17,103
|
|
18,948
|
|
|||||||||||||||
|
Investment gains, net
|
313
|
|
467
|
|
689
|
|
934
|
|
|||||||||||||||
|
Fair value losses, net
|
(289
|
)
|
(491
|
)
|
(1,020
|
)
|
(4,971
|
)
|
|||||||||||||||
|
Fee and other income
|
1,194
|
|
175
|
|
1,796
|
|
552
|
|
|||||||||||||||
|
Non-interest income (loss)
|
1,218
|
|
151
|
|
1,465
|
|
(3,485
|
)
|
|||||||||||||||
|
Administrative expenses:
|
|||||||||||||||||||||||
|
Salaries and employee benefits
|
331
|
|
322
|
|
1,007
|
|
1,017
|
|
|||||||||||||||
|
Professional services
|
218
|
|
237
|
|
681
|
|
684
|
|
|||||||||||||||
|
Occupancy expenses
|
51
|
|
45
|
|
144
|
|
136
|
|
|||||||||||||||
|
Other administrative expenses
|
64
|
|
57
|
|
202
|
|
190
|
|
|||||||||||||||
|
Total administrative expenses
|
664
|
|
661
|
|
2,034
|
|
2,027
|
|
|||||||||||||||
|
Foreclosed property expense
|
140
|
|
110
|
|
391
|
|
507
|
|
|||||||||||||||
|
Temporary Payroll Tax Cut Continuation Act of 2011 (“TCCA”) fees
|
531
|
|
465
|
|
1,552
|
|
1,358
|
|
|||||||||||||||
|
Other expenses, net
|
427
|
|
300
|
|
1,100
|
|
818
|
|
|||||||||||||||
|
Total expenses
|
1,762
|
|
1,536
|
|
5,077
|
|
4,710
|
|
|||||||||||||||
|
Income before federal income taxes
|
4,548
|
|
4,723
|
|
13,491
|
|
10,753
|
|
|||||||||||||||
|
Provision for federal income taxes
|
(1,525
|
)
|
(1,527
|
)
|
(4,495
|
)
|
(3,475
|
)
|
|||||||||||||||
|
Net income
|
3,023
|
|
3,196
|
|
8,996
|
|
7,278
|
|
|||||||||||||||
|
Other comprehensive income (loss):
|
|||||||||||||||||||||||
|
Changes in unrealized gains on available-for-sale securities, net of reclassification adjustments and taxes
|
27
|
|
(205
|
)
|
(46
|
)
|
(478
|
)
|
|||||||||||||||
|
Other
|
(2
|
)
|
(2
|
)
|
(6
|
)
|
(6
|
)
|
|||||||||||||||
|
Total other comprehensive income (loss)
|
25
|
|
(207
|
)
|
(52
|
)
|
(484
|
)
|
|||||||||||||||
|
Total comprehensive income
|
$
|
3,048
|
|
$
|
2,989
|
|
$
|
8,944
|
|
$
|
6,794
|
|
|||||||||||
|
Net income
|
$
|
3,023
|
|
$
|
3,196
|
|
$
|
8,996
|
|
$
|
7,278
|
|
|||||||||||
|
Dividends distributed or available for distribution to senior preferred stockholder (Note 9)
|
(3,048
|
)
|
(2,977
|
)
|
(8,944
|
)
|
(6,765
|
)
|
|||||||||||||||
|
Net income (loss) attributable to common stockholders (Note 9)
|
$
|
(25
|
)
|
$
|
219
|
|
$
|
52
|
|
$
|
513
|
|
|||||||||||
|
Earnings (loss) per share:
|
|||||||||||||||||||||||
|
Basic
|
$
|
0.00
|
|
$
|
0.04
|
|
$
|
0.01
|
|
$
|
0.09
|
|
|||||||||||
|
Diluted
|
0.00
|
0.04
|
|
0.01
|
|
0.09
|
|
||||||||||||||||
|
Weighted-average common shares outstanding:
|
|||||||||||||||||||||||
|
Basic
|
5,762
|
|
5,762
|
|
5,762
|
|
5,762
|
|
|||||||||||||||
|
Diluted
|
5,762
|
|
5,893
|
|
5,893
|
|
5,893
|
|
|||||||||||||||
See Notes to Condensed Consolidated Financial Statements
|
Fannie Mae (In conservatorship) Third Quarter 2017 Form 10-Q
|
66
|
|
|
Financial Statements | Condensed Consolidated Statements of Cash Flows
|
||
FANNIE MAE
(In conservatorship)
(Dollars in millions)
|
For the Nine Months Ended September 30,
|
|||||||||||
|
2017
|
2016
|
||||||||||
|
Net cash provided by (used in) operating activities
|
$
|
4,123
|
|
$
|
(4,749
|
)
|
|||||
|
Cash flows provided by investing activities:
|
|||||||||||
|
Proceeds from maturities and paydowns of trading securities held for investment
|
1,088
|
|
1,282
|
|
|||||||
|
Proceeds from sales of trading securities held for investment
|
149
|
|
1,405
|
|
|||||||
|
Proceeds from maturities and paydowns of available-for-sale securities
|
1,671
|
|
2,355
|
|
|||||||
|
Proceeds from sales of available-for-sale securities
|
1,207
|
|
10,481
|
|
|||||||
|
Purchases of loans held for investment
|
(142,565
|
)
|
(168,729
|
)
|
|||||||
|
Proceeds from repayments of loans acquired as held for investment of Fannie Mae
|
17,721
|
|
18,413
|
|
|||||||
|
Proceeds from sales of loans acquired as held for investment of Fannie Mae
|
5,399
|
|
3,209
|
|
|||||||
|
Proceeds from repayments and sales of loans acquired as held for investment of consolidated trusts
|
323,424
|
|
395,561
|
|
|||||||
|
Net change in restricted cash
|
8,816
|
|
(12,047
|
)
|
|||||||
|
Advances to lenders
|
(89,348
|
)
|
(96,797
|
)
|
|||||||
|
Proceeds from disposition of acquired property and preforeclosure sales
|
9,671
|
|
12,478
|
|
|||||||
|
Net change in federal funds sold and securities purchased under agreements to resell or similar arrangements
|
6,675
|
|
9,000
|
|
|||||||
|
Other, net
|
344
|
|
(305
|
)
|
|||||||
|
Net cash provided by investing activities
|
144,252
|
|
176,306
|
|
|||||||
|
Cash flows used in financing activities:
|
|||||||||||
|
Proceeds from issuance of debt of Fannie Mae
|
776,380
|
|
736,239
|
|
|||||||
|
Payments to redeem debt of Fannie Mae
|
(813,250
|
)
|
(772,380
|
)
|
|||||||
|
Proceeds from issuance of debt of consolidated trusts
|
282,433
|
|
290,146
|
|
|||||||
|
Payments to redeem debt of consolidated trusts
|
(383,969
|
)
|
(406,968
|
)
|
|||||||
|
Payments of cash dividends on senior preferred stock to Treasury
|
(11,367
|
)
|
(6,647
|
)
|
|||||||
|
Other, net
|
88
|
|
(62
|
)
|
|||||||
|
Net cash used in financing activities
|
(149,685
|
)
|
(159,672
|
)
|
|||||||
|
Net increase (decrease) in cash and cash equivalents
|
(1,310
|
)
|
11,885
|
|
|||||||
|
Cash and cash equivalents at beginning of period
|
25,224
|
|
14,674
|
|
|||||||
|
Cash and cash equivalents at end of period
|
$
|
23,914
|
|
$
|
26,559
|
|
|||||
|
Cash paid during the period for:
|
|||||||||||
|
Interest
|
$
|
82,652
|
|
$
|
78,281
|
|
|||||
|
Income taxes
|
1,670
|
|
1,141
|
|
|||||||
See Notes to Condensed Consolidated Financial Statements
|
Fannie Mae (In conservatorship) Third Quarter 2017 Form 10-Q
|
67
|
|
|
Notes to Condensed Consolidated Financial Statements | Summary of Significant Accounting Policies
|
||
FANNIE MAE
(In conservatorship)
Notes to Condensed Consolidated Financial Statements
(Unaudited)
1
.
Summary of Significant Accounting Policies
Organization
We are a stockholder-owned corporation organized and existing under the Federal National Mortgage Association Charter Act (the “Charter Act” or our “charter”). We are a government-sponsored enterprise (“GSE”) and we are subject to government oversight and regulation. Our regulators include the Federal Housing Finance Agency (“FHFA”), the U.S. Department of Housing and Urban Development (“HUD”), the U.S. Securities and Exchange Commission (“SEC”), and the U.S. Department of the Treasury (“Treasury”). The U.S. government does not guarantee our securities or other obligations.
Conservatorship
On September 7, 2008, the Secretary of the Treasury and the Director of FHFA announced several actions taken by Treasury and FHFA regarding Fannie Mae, which included: (1) placing us in conservatorship, and (2) the execution of a senior preferred stock purchase agreement by our conservator, on our behalf, and Treasury, pursuant to which we issued to Treasury both senior preferred stock and a warrant to purchase common stock.
Under the Federal Housing Enterprises Financial Safety and Soundness Act of 1992, as amended by the Federal Housing Finance Regulatory Reform Act of 2008 (together, the “GSE Act”), the conservator immediately succeeded to (1) all rights, titles, powers and privileges of Fannie Mae, and of any stockholder, officer or director of Fannie Mae with respect to Fannie Mae and its assets, and (2) title to the books, records and assets of any other legal custodian of Fannie Mae. The conservator has since delegated specified authorities to our Board of Directors and has delegated to management the authority to conduct our day-to-day operations. The conservator retains the authority to withdraw its delegations at any time.
The conservatorship has no specified termination date and there continues to be significant uncertainty regarding our future, including how long we will continue to exist in our current form, the extent of our role in the market, how long we will be in conservatorship, what form we will have and what ownership interest, if any, our current common and preferred stockholders will hold in us after the conservatorship is terminated, and whether we will continue to exist following conservatorship. Under the GSE Act, FHFA must place us into receivership if the Director of FHFA makes a written determination that our assets are less than our obligations or if we have not been paying our debts, in either case, for a period of
60
days. In addition, the Director of FHFA may place us into receivership at his discretion at any time for other reasons set forth in the GSE Act, including if we are critically undercapitalized or if we are undercapitalized and have no reasonable prospect of becoming adequately capitalized. Should we be placed into receivership, different assumptions would be required to determine the carrying value of our assets, which could lead to substantially different financial results. We are not aware of any plans of FHFA to fundamentally change our business model or capital structure in the near term.
Impact of U.S. Government Support
We continue to rely on support from Treasury to eliminate any net worth deficits we may experience in the future, which would otherwise trigger our being placed into receivership. Based on consideration of all the relevant conditions and events affecting our operations, including our reliance on the U.S. government, we continue to operate as a going concern and in accordance with our delegation of authority from FHFA.
We fund our business primarily through the issuance of short-term and long-term debt securities in the domestic and international capital markets. Because debt issuance is our primary funding source, we are subject to “roll over,” or refinancing, risk on our outstanding debt. Our ability to issue long-term debt has been strong primarily due to actions taken by the federal government to support us.
We believe that continued federal government support of our business, as well as our status as a GSE, are essential to maintaining our access to debt funding. Changes or perceived changes in federal government support of our business without appropriate capitalization of the company could materially and adversely affect our liquidity, financial condition and results of operations. Changes or perceived changes in our status as a GSE could also materially and adversely affect our liquidity, financial condition and results of operations. In addition,
|
Fannie Mae (In conservatorship) Third Quarter 2017 Form 10-Q
|
68
|
|
|
Notes to Condensed Consolidated Financial Statements | Summary of Significant Accounting Policies
|
||
due to our reliance on the U.S. government’s support, our access to debt funding or the cost of debt funding also could be materially adversely affected by a change or perceived change in the creditworthiness of the U.S. government.
A downgrade in our credit ratings could reduce demand for our debt securities and increase our borrowing costs. Future changes or disruptions in the financial markets could significantly change the amount, mix and cost of funds we obtain, which also could increase our liquidity and “roll over” risk and have a material adverse impact on our liquidity, financial condition and results of operations.
Pursuant to the senior preferred stock purchase agreement, Treasury has committed to provide us with funding to help us maintain a positive net worth thereby avoiding the mandatory receivership trigger described above.
As consideration for Treasury’s funding commitment, we issued
one million
shares of senior preferred stock and a warrant to purchase shares of our common stock to Treasury. As of
September 30, 2017
, the amount of remaining funding available to us under the senior preferred stock purchase agreement was
$117.6 billion
.
Senior Preferred Stock
Treasury, as the holder of the senior preferred stock, is entitled to receive quarterly cash dividends, when, as and if declared by our conservator, acting as successor to the rights, titles, powers and privileges of the Board of Directors. The dividends we have paid to Treasury on the senior preferred stock during conservatorship have been declared by, and paid at the direction of, our conservator.
For each quarterly period through and including
December 31, 2017
, dividends on the senior preferred stock accumulate based on the amount by which our net worth at the end of the immediately preceding fiscal quarter exceeds an applicable capital reserve amount. If our net worth does not exceed the applicable capital reserve amount, then dividends will neither accumulate nor be payable to the shareholder for such period.
Pursuant to the terms of our senior preferred stock, our net worth is the amount by which our total assets (excluding Treasury’s funding commitment and any unfunded amounts related to the commitment) exceed our total liabilities (excluding any obligation in respect of capital stock), in each case as reflected on our balance sheet prepared in accordance with accounting principles generally accepted in the United States of America (“GAAP”). The applicable capital reserve amount was
$1.2 billion
for
2016
, decreased to
$600 million
for quarterly dividend periods in
2017
, and will decrease to
zero
in the first quarter of
2018
.
We recognize a liability on our balance sheet for senior preferred stock dividends only upon their declaration by our conservator, at which point they become payable to the shareholder.
Shares of the senior preferred stock have
no
par value and have a stated value and initial liquidation preference equal to
$1,000
per share.
The liquidation preference of the senior preferred stock is subject to adjustment. To the extent that quarterly dividends are not paid, they will accumulate and be added to the liquidation preference of the senior preferred stock. In addition, the liquidation preference of the senior preferred stock will be increased by (1) any amounts Treasury pays to us pursuant to its funding commitment provided in the senior preferred stock purchase agreement and (2) any quarterly commitment fee payments that are payable but not paid in cash or waived by Treasury under the senior preferred stock purchase agreement. As long as the dividend provisions described above remain in effect, however, the periodic commitment fee will neither accrue nor become payable. As of
September 30, 2017
, we have received a total of
$116.1 billion
under Treasury’s funding commitment and the aggregate liquidation preference of the senior preferred stock was
$117.1 billion
. Because the senior preferred stock ranks prior to our common stock and all other series of our preferred stock, as well as any capital stock we issue in the future, as to both dividends and distributions upon liquidation, if we are liquidated, the senior preferred stock is entitled to its then-current liquidation preference (which includes any accumulated but unpaid dividends) before any distribution is made to the holders of our common stock or other preferred stock.
On September 29, 2017, we paid Treasury a dividend of
$3.1 billion
based on our net worth of
$3.7 billion
as of
June 30, 2017
, less the applicable capital reserve amount of
$600 million
. We will pay Treasury a dividend of
$3.0 billion
by
December 31, 2017
, calculated based on our net worth of
$3.6 billion
as of
September 30, 2017
, less the applicable capital reserve amount of
$600 million
, if our conservator declares a dividend in this amount before
December 31, 2017
.
|
Fannie Mae (In conservatorship) Third Quarter 2017 Form 10-Q
|
69
|
|
|
Notes to Condensed Consolidated Financial Statements | Summary of Significant Accounting Policies
|
||
Basis of Presentation
The accompanying unaudited interim condensed consolidated financial statements have been prepared in accordance with GAAP for interim financial information and with the SEC’s instructions to Form 10-Q and Article 10 of Regulation S-X. Accordingly, they do not include all of the information and note disclosures required by GAAP for complete consolidated financial statements. In the opinion of management, all adjustments of a normal recurring nature considered necessary for a fair presentation have been included. The accompanying condensed consolidated financial statements include our accounts as well as the accounts of other entities in which we have a controlling financial interest. All intercompany accounts and transactions have been eliminated. To conform to our current period presentation, we have reclassified certain amounts reported in our prior periods’ condensed consolidated financial statements. Results for the
nine
months ended
September 30, 2017
may not necessarily be indicative of the results for the year ending
December 31, 2017
. The unaudited interim condensed consolidated financial statements as of and for the
nine
months ended
September 30, 2017
should be read in conjunction with our audited consolidated financial statements and related notes included in our annual report on Form 10-K for the year ended
December 31, 2016
(“
2016
Form 10-K”), filed with the SEC on February 17,
2017
.
Regulatory Capital
FHFA stated that, during conservatorship, our existing statutory and FHFA-directed regulatory capital requirements will not be binding and FHFA will not issue quarterly capital classifications. We submit capital reports to FHFA and FHFA monitors our capital levels. The deficit of core capital over statutory minimum capital was
$137.7 billion
as of
September 30, 2017
and
$136.2 billion
as of
December 31, 2016
.
Under the terms of the senior preferred stock, we are required to pay Treasury a dividend each quarter, when, as and if declared, equal to the excess of our net worth as of the end of the preceding quarter over an applicable capital reserve amount. The Director of FHFA has directed us to make dividend payments on the senior preferred stock on a quarterly basis. Therefore, we do not expect to eliminate our deficit of core capital over statutory minimum capital.
Related Parties
As a result of our issuance to Treasury of the warrant to purchase shares of Fannie Mae common stock equal to
79.9%
of the total number of shares of Fannie Mae common stock, we and Treasury are deemed related parties. As of
September 30, 2017
, Treasury held an investment in our senior preferred stock with an aggregate liquidation preference of
$117.1 billion
. FHFA’s control of both us and Freddie Mac has caused us, FHFA and Freddie Mac to be deemed related parties. In 2013, Fannie Mae and Freddie Mac established Common Securitization Solutions, LLC (“CSS”), a jointly owned limited liability company to operate a common securitization platform; therefore, CSS is deemed a related party.
Transactions with Treasury
Our administrative expenses were reduced by $
9 million
and $
32 million
for the
three
and
nine
months ended
September 30, 2017
, respectively, and
$14 million
and
$45 million
for the
three
and
nine
months ended
September 30, 2016
, respectively, due to reimbursements from Treasury and Freddie Mac for expenses incurred as program administrator for Treasury’s Home Affordable Modification Program (“HAMP”) and other initiatives under Treasury’s Making Home Affordable Program.
We made tax payments to the Internal Revenue Service (“IRS”), a bureau of Treasury, of
$600 million
and
$1.7 billion
during the
three
and
nine
months ended
September 30, 2017
, respectively. We made tax payments of
$531 million
and
$1.1 billion
during the
three
and
nine
months ended
September 30, 2016
, respectively.
In 2009, we entered into a memorandum of understanding with Treasury, FHFA and Freddie Mac pursuant to which we agreed to provide assistance to state and local housing finance agencies (“HFAs”) through certain programs, including a new issue bond (“NIB”) program. As of
September 30, 2017
, under the NIB program, Fannie Mae and Freddie Mac had
$5.0 billion
outstanding of pass-through securities backed by single-family and multifamily housing bonds issued by HFAs, which is less than
35%
of the total original principal under the program, the amount of losses that Treasury would bear. Accordingly, we do not have a potential risk of loss under the NIB program.
The fee revenue and expense related to the TCCA are recorded in “Mortgage loans interest income” and “TCCA fees,” respectively, in our condensed consolidated statements of operations and comprehensive income. We recognized
$531 million
and
$465 million
in TCCA fees during the
three
months ended
September 30, 2017
and
|
Fannie Mae (In conservatorship) Third Quarter 2017 Form 10-Q
|
70
|
|
|
Notes to Condensed Consolidated Financial Statements | Summary of Significant Accounting Policies
|
||
2016
, respectively, and
$1.6 billion
and
$1.4 billion
for the
nine
months ended
September 30, 2017
and
2016
, respectively, of which
$531 million
had not been remitted to Treasury as of
September 30, 2017
.
We incurred expenses in connection with certain funding obligations under the GSE Act, a portion of which is attributable to Treasury’s Capital Magnet and HOPE Reserve Funds. These expenses, recognized in “Other expenses, net” in our condensed consolidated statements of operations and comprehensive income, were measured as the product of
4.2
basis points and the unpaid principal balance of our total new business purchases for the respective period. We recognized $
32 million
and $
40 million
in “Other expenses, net” in connection with Treasury’s Capital Magnet and HOPE Reserve Funds for the
three
months ended
September 30, 2017
and
2016
, respectively, and
$91 million
and
$96 million
for the
nine
months ended
September 30, 2017
and
2016
, respectively, of which
$91 million
had not been remitted as of
September 30, 2017
.
In addition to the transactions with Treasury mentioned above, we also purchase and sell Treasury securities in the normal course of business.
As of September 30, 2017
and
December 31, 2016
, we held Treasury securities with a fair value of
$30.8 billion
and
$32.3 billion
, respectively, and accrued interest receivable of
$74 million
and
$39 million
, respectively. We recognized interest income on these securities held by us of
$95 million
and
$40 million
for the
three
months ended
September 30, 2017
and
2016
, respectively, and
$244 million
and
$105 million
for the
nine
months ended
September 30, 2017
and
2016
, respectively.
Transactions with Freddie Mac
As of
September 30, 2017
and
December 31, 2016
, we held Freddie Mac mortgage-related securities with a fair value of
$651 million
and
$1.4 billion
, respectively, and accrued interest receivable of
$3 million
and
$5 million
, respectively. We recognized interest income on these securities held by us of $
8 million
and $
19 million
for the
three
months ended
September 30, 2017
and
2016
, respectively, and
$31 million
and
$100 million
for the
nine
months ended
September 30, 2017
and
2016
, respectively. In addition, Freddie Mac may be an investor in variable interest entities (“VIEs”) that we have consolidated, and we may be an investor in VIEs that Freddie Mac has consolidated. Freddie Mac may also be an investor in our debt securities.
Transactions with FHFA
The GSE Act authorizes FHFA to establish an annual assessment for regulated entities, including Fannie Mae, which is payable on a semi-annual basis (April and October), for FHFA’s costs and expenses, as well as to maintain FHFA’s working capital. We recognized FHFA assessment fees, which are recorded in “Administrative expenses” in our condensed consolidated statements of operations and comprehensive income, of
$26 million
and
$28 million
for the
three
months ended
September 30, 2017
and
2016
, respectively, and $
82 million
and
$84 million
for the
nine
months ended
September 30, 2017
and
2016
, respectively.
Transactions with CSS
In connection with our jointly owned company with Freddie Mac, we contributed capital to CSS of $
25 million
and $
23 million
for the
three
months ended
September 30, 2017
and
2016
, respectively, and
$78 million
and
$88 million
for the
nine
months ended
September 30, 2017
and
2016
, respectively. In November 2016, Fannie Mae, Freddie Mac and CSS entered into a Customer Services Agreement that sets forth the terms under which CSS will provide securitization services to us and Freddie Mac. No other transactions outside of normal business activities have occurred between us and CSS during the
nine
months ended
September 30, 2017
and
2016
.
Use of Estimates
Preparing condensed consolidated financial statements in accordance with GAAP requires management to make estimates and assumptions that affect our reported amounts of assets and liabilities, and disclosure of contingent assets and liabilities as of the dates of our condensed consolidated financial statements, as well as our reported amounts of revenues and expenses during the reporting periods. Management has made significant estimates in a variety of areas including, but not limited to, valuation of certain financial instruments, other assets and liabilities, and allowance for loan losses. Actual results could be different from these estimates.
Fee and Other Income
Fee and other income includes transaction fees, technology fees, multifamily fees and other miscellaneous income. During the three and nine months ended September 30, 2017, we recognized
$975 million
in “Fee and other income” in our condensed consolidated statement of operations and comprehensive income resulting from a settlement agreement resolving legal claims related to private-label securities we purchased.
|
Fannie Mae (In conservatorship) Third Quarter 2017 Form 10-Q
|
71
|
|
|
Notes to Condensed Consolidated Financial Statements | Summary of Significant Accounting Policies
|
||
New Accounting Guidance
In June 2016, the Financial Accounting Standards Board (“FASB”) issued guidance that changes the impairment model for most financial assets and certain other instruments. For loans, held-to-maturity debt securities and other financial assets recorded at amortized cost, entities will be required to use a new forward-looking “expected loss” model that will replace today’s “incurred loss” model and generally will result in the earlier recognition of allowance for loan losses. The guidance is effective on January 1, 2020 with early adoption permitted on January 1, 2019. We will recognize the impact of the new guidance through a cumulative effect adjustment to retained earnings as of the beginning of the year of adoption. We are continuing to evaluate the impact of this guidance on our condensed consolidated financial statements, including the timing of the adoption. We expect the greater impact of the guidance to relate to our accounting for credit losses for loans that are not individually impaired. The adoption of this guidance will decrease, perhaps substantially, our retained earnings and increase our allowance for loan losses.
In August 2017, the FASB issued changes to the hedge accounting guidance that is intended to more closely align hedge accounting with companies’ risk management strategies, simplify the application of hedge accounting, and increase transparency as to the scope and results of hedging programs. The revised guidance will make more financial and nonfinancial hedging strategies eligible for hedge accounting. It also amends the presentation and disclosure requirements and changes how companies assess the effectiveness of hedging relationships. The guidance is effective January 1, 2019 and early adoption is permitted. Hedge accounting is elective and while we do not currently have a hedge accounting program, we are actively considering electing a hedge accounting program in the future.
2
.
Consolidations and Transfers of Financial Assets
We have interests in various entities that are considered to be VIEs. The primary types of entities are securitization trusts and limited partnerships. These interests include investments in securities issued by VIEs, such as Fannie Mae MBS created pursuant to our securitization transactions and our guaranty to the entity. We consolidate the substantial majority of our single-class securitization trusts because our role as guarantor and master servicer provides us with the power to direct matters (primarily the servicing of mortgage loans) that impact the credit risk to which we are exposed. In contrast, we do not consolidate single-class securitization trusts when other organizations have the power to direct these activities.
Unconsolidated VIEs
We do not consolidate VIEs when we are not deemed to be the primary beneficiary. Our unconsolidated VIEs include securitization trusts and limited partnerships. The following table displays the carrying amount and classification of our assets and liabilities that relate to our involvement with unconsolidated securitization trusts.
|
As of
|
|||||||||||
|
September 30, 2017
|
December 31, 2016
|
||||||||||
|
(Dollars in millions)
|
|||||||||||
|
Assets:
|
|||||||||||
|
Trading securities:
|
|||||||||||
|
Fannie Mae
|
$
|
4,026
|
|
$
|
4,642
|
|
|||||
|
Non-Fannie Mae
|
1,985
|
|
3,473
|
|
|||||||
|
Total trading securities
|
6,011
|
|
8,115
|
|
|||||||
|
Available-for-sale securities:
|
|
|
|||||||||
|
Fannie Mae
|
2,116
|
|
2,447
|
|
|||||||
|
Non-Fannie Mae
|
3,016
|
|
4,879
|
|
|||||||
|
Total available-for-sale securities
|
5,132
|
|
7,326
|
|
|||||||
|
Other assets
|
73
|
|
77
|
|
|||||||
|
Other liabilities
|
(481
|
)
|
(528
|
)
|
|||||||
|
Net carrying amount
|
$
|
10,735
|
|
$
|
14,990
|
|
|||||
Our maximum exposure to loss generally represents the greater of our recorded investment in the entity or the unpaid principal balance of the assets covered by our guaranty. However, our securities issued by Fannie Mae
|
Fannie Mae (In conservatorship) Third Quarter 2017 Form 10-Q
|
72
|
|
|
Notes to Condensed Consolidated Financial Statements | Consolidations and Transfers of Financial Assets
|
||
multi-class resecuritization trusts that are not consolidated do not give rise to any additional exposure to loss as we already consolidate the underlying collateral. The maximum exposure to loss related to unconsolidated securitization trusts was approximately
$16 billion
and
$21 billion
as of
September 30, 2017
and
December 31, 2016
, respectively. The total assets of our unconsolidated securitization trusts were approximately
$90 billion
and
$150 billion
as of
September 30, 2017
and
December 31, 2016
, respectively.
The maximum exposure to loss for our unconsolidated limited partnerships and similar legal entities, which consist of low-income housing tax credit investments, community investments and other entities, was
$107 million
and the related carrying value was
$83 million
as of
September 30, 2017
. As of
December 31, 2016
, the maximum exposure to loss was
$118 million
and the related carrying value was
$92 million
. The total assets of these limited partnership investments were
$3.2 billion
and
$3.9 billion
as of
September 30, 2017
and
December 31, 2016
, respectively.
The unpaid principal balance of our multifamily loan portfolio was
$253.0 billion
as of
September 30, 2017
. As our lending relationship does not provide us with a controlling financial interest in the borrower entity, we do not consolidate these borrowers regardless of their status as either a VIE or a voting interest entity. We have excluded these entities from our VIE disclosures. However, the disclosures we have provided in “
Note 3, Mortgage Loans
,” “
Note 4, Allowance for Loan Losses
” and “
Note 6, Financial Guarantees
” with respect to this population are consistent with the FASB’s stated objectives for the disclosures related to unconsolidated VIEs.
Transfers of Financial Assets
We issue Fannie Mae MBS through portfolio securitization transactions by transferring pools of mortgage loans or mortgage-related securities to one or more trusts or special purpose entities. We are considered to be the transferor when we transfer assets from our own retained mortgage portfolio in a portfolio securitization transaction. For the
three
months ended
September 30, 2017
and
2016
, the unpaid principal balance of portfolio securitizations was
$68.1 billion
and
$76.1 billion
, respectively. For the
nine
months ended
September 30, 2017
and
2016
, the unpaid principal balance of portfolio securitizations was
$194.5 billion
and
$188.7 billion
, respectively.
We retain interests from the transfer and sale of mortgage-related securities to unconsolidated single-class and multi-class portfolio securitization trusts. As of
September 30, 2017
, the unpaid principal balance of retained interests was
$4.0 billion
and its related fair value was
$5.0 billion
. The unpaid principal balance of retained interests was
$4.4 billion
and its related fair value was
$5.8 billion
as of
December 31, 2016
. For the
three
months ended
September 30, 2017
and
2016
, the principal and interest received on retained interests was
$294 million
and
$284 million
, respectively. For the
nine
months ended
September 30, 2017
and
2016
, the principal and interest received on retained interests was
$854 million
and
$907 million
, respectively.
Managed Loans
Managed loans are on-balance sheet mortgage loans, as well as mortgage loans that we have securitized in unconsolidated portfolio securitization trusts. The unpaid principal balance of securitized loans in unconsolidated portfolio securitization trusts, which are primarily loans that are guaranteed or insured, in whole or in part, by the U.S. government, was
$1.3 billion
and
$1.4 billion
as of
September 30, 2017
and
December 31, 2016
, respectively. For information on our on-balance sheet mortgage loans, see “
Note 3, Mortgage Loans
.”
3
.
Mortgage Loans
We own single-family mortgage loans, which are secured by four or fewer residential dwelling units, and multifamily mortgage loans, which are secured by five or more residential dwelling units. We classify these loans as either held for investment (“HFI”) or held for sale (“HFS”). We report the carrying value of HFI loans at the unpaid principal balance, net of unamortized premiums and discounts, other cost basis adjustments, and an allowance for loan losses. We report the carrying value of HFS loans at the lower of cost or fair value and record valuation changes in “
Investment gains, net
” in our condensed consolidated statements of operations and comprehensive income. We define the recorded investment of HFI loans as unpaid principal balance, net of unamortized premiums and discounts, other cost basis adjustments, and accrued interest receivable.
|
Fannie Mae (In conservatorship) Third Quarter 2017 Form 10-Q
|
73
|
|
|
Notes to Condensed Consolidated Financial Statements | Mortgage Loans
|
||
For purposes of the single-family mortgage loan disclosures below, we define “primary” class as mortgage loans that are not included in other loan classes; “government” class as mortgage loans that are guaranteed or insured, in whole or in part, by the U.S. government or one of its agencies, and that are not Alt-A; and “other” class as loans with higher-risk characteristics, such as interest-only loans and negative-amortizing loans, that are neither government nor Alt-A.
The following table displays the carrying value of our mortgage loans.
|
As of
|
|||||||
|
September 30, 2017
|
December 31, 2016
|
||||||
|
(Dollars in millions)
|
|||||||
|
Single-family
|
$
|
2,878,456
|
|
$
|
2,833,750
|
|
|
|
Multifamily
|
253,031
|
|
229,896
|
|
|||
|
Total unpaid principal balance of mortgage loans
|
3,131,487
|
|
3,063,646
|
|
|||
|
Cost basis and fair value adjustments, net
|
41,466
|
|
39,572
|
|
|||
|
Allowance for loan losses for loans held for investment
|
(20,194
|
)
|
(23,465
|
)
|
|||
|
Total mortgage loans
|
$
|
3,152,759
|
|
$
|
3,079,753
|
|
|
During the
three
and
nine
months ended
September 30, 2017
, we redesignated loans with a carrying value of $
2.1 billion
and
$7.5 billion
, respectively, from HFI to HFS. During the
three
and
nine
months ended
September 30, 2016
, we redesignated loans with a carrying value of $
652 million
and
$2.3 billion
, respectively, from HFI to HFS. During the
three
and
nine
months ended
September 30, 2017
, we redesignated loans with a carrying value of $
59 million
and
$111 million
, respectively, from HFS to HFI. We sold loans with an unpaid principal balance of
$3.4 billion
and $
6.5 billion
during the
three
and
nine
months ended
September 30, 2017
, respectively. We sold loans with an unpaid balance of $
1.6 billion
and
$4.2 billion
during the
three
and
nine
months ended
September 30, 2016
, respectively.
The recorded investment of single-family mortgage loans for which formal foreclosure proceedings are in process was
$14.5 billion
and
$18.3 billion
as of
September 30, 2017
and
December 31, 2016
, respectively. As a result of our various loss mitigation and foreclosure prevention efforts, we expect that a portion of the loans in the process of formal foreclosure proceedings will not ultimately foreclose.
Nonaccrual Loans
We discontinue accruing interest on loans when we believe collectibility of principal or interest is not reasonably assured, which for a single-family loan we have determined, based on our historical experience, to be when the loan becomes two months or more past due according to its contractual terms. Interest previously accrued but not collected is reversed through interest income at the date a loan is placed on nonaccrual status. We return a nonmodified single-family loan to accrual status at the point that the borrower brings the loan current. We return a modified single-family loan to accrual status at the point that the borrower successfully makes all required payments during the trial period (generally three to four months) and the modification is made permanent. We place a multifamily loan on nonaccrual status when the loan becomes three months or more past due according to its contractual terms or is deemed to be individually impaired, unless the loan is well secured such that collectibility of principal and accrued interest is reasonably assured. We return a multifamily loan to accrual status when the borrower cures the delinquency of the loan or we otherwise determine that the loan is well secured such that collectibility is reasonably assured.
|
Fannie Mae (In conservatorship) Third Quarter 2017 Form 10-Q
|
74
|
|
|
Notes to Condensed Consolidated Financial Statements | Mortgage Loans
|
||
Aging Analysis
The following tables display an aging analysis of the total recorded investment in our HFI mortgage loans by portfolio segment and class, excluding loans for which we have elected the fair value option.
|
|
As of September 30, 2017
|
||||||||||||||||||||||||||||||
|
30 - 59 Days
Delinquent
|
60 - 89 Days Delinquent
|
Seriously Delinquent
(1)
|
Total Delinquent
|
Current
|
Total
|
Recorded Investment in Loans 90 Days or More Delinquent and Accruing Interest
|
Recorded Investment in Nonaccrual Loans
|
||||||||||||||||||||||||
|
|
(Dollars in millions)
|
||||||||||||||||||||||||||||||
|
Single-family:
|
|||||||||||||||||||||||||||||||
|
Primary
|
$
|
34,976
|
|
$
|
7,810
|
|
$
|
18,110
|
|
$
|
60,896
|
|
$
|
2,720,530
|
|
$
|
2,781,426
|
|
$
|
24
|
|
$
|
29,169
|
|
|||||||
|
Government
(2)
|
53
|
|
25
|
|
212
|
|
290
|
|
34,267
|
|
34,557
|
|
212
|
|
—
|
|
|||||||||||||||
|
Alt-A
|
3,460
|
|
1,060
|
|
3,381
|
|
7,901
|
|
62,863
|
|
70,764
|
|
2
|
|
4,935
|
|
|||||||||||||||
|
Other
|
1,253
|
|
372
|
|
1,252
|
|
2,877
|
|
20,714
|
|
23,591
|
|
2
|
|
1,793
|
|
|||||||||||||||
|
Total single-family
|
39,742
|
|
9,267
|
|
22,955
|
|
71,964
|
|
2,838,374
|
|
2,910,338
|
|
240
|
|
35,897
|
|
|||||||||||||||
|
Multifamily
(3)
|
10
|
|
N/A
|
|
87
|
|
97
|
|
254,896
|
|
254,993
|
|
—
|
|
322
|
|
|||||||||||||||
|
Total
|
$
|
39,752
|
|
$
|
9,267
|
|
$
|
23,042
|
|
$
|
72,061
|
|
$
|
3,093,270
|
|
$
|
3,165,331
|
|
$
|
240
|
|
$
|
36,219
|
|
|||||||
|
|
As of December 31, 2016
|
||||||||||||||||||||||||||||||
|
30 - 59 Days
Delinquent
|
60 - 89 Days Delinquent
|
Seriously Delinquent
(1)
|
Total Delinquent
|
Current
|
Total
|
Recorded Investment in Loans 90 Days or More Delinquent and Accruing Interest
|
Recorded Investment in Nonaccrual Loans
|
||||||||||||||||||||||||
|
|
(Dollars in millions)
|
||||||||||||||||||||||||||||||
|
Single-family:
|
|||||||||||||||||||||||||||||||
|
Primary
|
$
|
31,631
|
|
$
|
7,910
|
|
$
|
21,761
|
|
$
|
61,302
|
|
$
|
2,654,195
|
|
$
|
2,715,497
|
|
$
|
22
|
|
$
|
33,448
|
|
|||||||
|
Government
(2)
|
56
|
|
22
|
|
256
|
|
334
|
|
36,814
|
|
37,148
|
|
256
|
|
—
|
|
|||||||||||||||
|
Alt-A
|
3,629
|
|
1,194
|
|
4,221
|
|
9,044
|
|
72,903
|
|
81,947
|
|
2
|
|
6,019
|
|
|||||||||||||||
|
Other
|
1,349
|
|
438
|
|
1,582
|
|
3,369
|
|
25,974
|
|
29,343
|
|
5
|
|
2,238
|
|
|||||||||||||||
|
Total single-family
|
36,665
|
|
9,564
|
|
27,820
|
|
74,049
|
|
2,789,886
|
|
2,863,935
|
|
285
|
|
41,705
|
|
|||||||||||||||
|
Multifamily
(3)
|
44
|
|
N/A
|
|
129
|
|
173
|
|
231,708
|
|
231,881
|
|
—
|
|
403
|
|
|||||||||||||||
|
Total
|
$
|
36,709
|
|
$
|
9,564
|
|
$
|
27,949
|
|
$
|
74,222
|
|
$
|
3,021,594
|
|
$
|
3,095,816
|
|
$
|
285
|
|
$
|
42,108
|
|
|||||||
__________
|
(1)
|
Single-family seriously delinquent loans are loans that are
90 days
or more past due or in the foreclosure process. Multifamily seriously delinquent loans are loans that are
60 days
or more past due.
|
|
(2)
|
Primarily consists of reverse mortgages, which due to their nature, are not aged and are included in the current column.
|
|
(3)
|
Multifamily loans
60
-
89
days delinquent are included in the seriously delinquent column.
|
|
Fannie Mae (In conservatorship) Third Quarter 2017 Form 10-Q
|
75
|
|
|
Notes to Condensed Consolidated Financial Statements | Mortgage Loans
|
||
Credit Quality Indicators
The following table displays the total recorded investment in our single-family HFI loans by class and credit quality indicator, excluding loans for which we have elected the fair value option.
|
|
As of
|
||||||||||||||||||||||
|
|
September 30, 2017
(1)
|
December 31, 2016
(1)
|
|||||||||||||||||||||
|
|
Primary
|
Alt-A
|
Other
|
Primary
|
Alt-A
|
Other
|
|||||||||||||||||
|
|
(Dollars in millions)
|
||||||||||||||||||||||
|
Estimated mark-to-market loan-to-value (“LTV”) ratio:
(2)
|
|
|
|
|
|||||||||||||||||||
|
Less than or equal to 80%
|
$
|
2,447,197
|
|
$
|
54,238
|
|
$
|
17,598
|
|
$
|
2,321,201
|
|
$
|
56,250
|
|
$
|
19,382
|
|
|||||
|
Greater than 80%
and less than or equal to 90%
|
226,113
|
|
7,090
|
|
2,453
|
|
244,231
|
|
9,787
|
|
3,657
|
|
|||||||||||
|
Greater than 90%
and less than or equal to 100%
|
88,076
|
|
4,330
|
|
1,606
|
|
114,412
|
|
6,731
|
|
2,627
|
|
|||||||||||
|
Greater than 100%
|
20,040
|
|
5,106
|
|
1,934
|
|
35,653
|
|
9,179
|
|
3,677
|
|
|||||||||||
|
Total
|
$
|
2,781,426
|
|
$
|
70,764
|
|
$
|
23,591
|
|
$
|
2,715,497
|
|
$
|
81,947
|
|
$
|
29,343
|
|
|||||
__________
|
(1)
|
Excludes
$34.6 billion
and
$37.1 billion
as of
September 30, 2017
and
December 31, 2016
, respectively, of mortgage loans guaranteed or insured, in whole or in part, by the U.S. government or one of its agencies, that are not Alt-A loans. The segment class is primarily reverse mortgages for which we do not calculate an estimated mark-to-market LTV ratio.
|
|
(2)
|
The aggregate estimated mark-to-market LTV ratio is based on the unpaid principal balance of the loan as of the end of each reported period divided by the estimated current value of the property, which we calculate using an internal valuation model that estimates periodic changes in home value.
|
The following table displays the total recorded investment in our multifamily HFI loans by credit quality indicator, excluding loans for which we have elected the fair value option.
|
|
As of
|
||||||||||
|
|
September 30,
|
December 31,
|
|||||||||
|
2017
|
2016
|
||||||||||
|
|
(Dollars in millions)
|
||||||||||
|
Credit risk profile by internally assigned grade:
|
|||||||||||
|
Non-classified
|
$
|
252,085
|
|
$
|
228,749
|
|
|||||
|
Classified:
(1)
|
|||||||||||
|
Substandard
|
2,893
|
|
3,129
|
|
|||||||
|
Doubtful
|
15
|
|
3
|
|
|||||||
|
Total classified
|
2,908
|
|
3,132
|
|
|||||||
|
Total
|
$
|
254,993
|
|
$
|
231,881
|
|
|||||
_________
|
(1)
|
A loan classified as “Substandard” has a well-defined weakness that jeopardizes the timely full repayment. “Doubtful” refers to a loan with a weakness that makes collection or liquidation in full highly questionable and improbable based on existing conditions and values.
|
|
Fannie Mae (In conservatorship) Third Quarter 2017 Form 10-Q
|
76
|
|
|
Notes to Condensed Consolidated Financial Statements | Mortgage Loans
|
||
Individually Impaired Loans
Individually impaired loans include troubled debt restructurings (“TDRs”), acquired credit-impaired loans and multifamily loans that we have assessed as probable that we will not collect all contractual amounts due, regardless of whether we are currently accruing interest; excluding loans classified as HFS. The following tables display the total unpaid principal balance, recorded investment, related allowance, average recorded investment and interest income recognized for individually impaired loans.
|
As of
|
||||||||||||||||||||||||||||||||||
|
September 30, 2017
|
December 31, 2016
|
|||||||||||||||||||||||||||||||||
|
Unpaid Principal Balance
|
Total Recorded Investment
|
Related Allowance for Loan Losses
|
Unpaid Principal Balance
|
Total Recorded Investment
|
Related Allowance for Loan Losses
|
|||||||||||||||||||||||||||||
|
(Dollars in millions)
|
||||||||||||||||||||||||||||||||||
|
Individually impaired loans:
|
|
|
||||||||||||||||||||||||||||||||
|
With related allowance recorded:
|
|
|
|
|
||||||||||||||||||||||||||||||
|
Single-family:
|
|
|
|
|
||||||||||||||||||||||||||||||
|
Primary
|
$
|
93,983
|
|
$
|
89,453
|
|
$
|
12,102
|
|
$
|
105,113
|
|
$
|
99,825
|
|
$
|
14,462
|
|
||||||||||||||||
|
Government
|
283
|
|
286
|
|
58
|
|
302
|
|
305
|
|
59
|
|
||||||||||||||||||||||
|
Alt-A
|
24,426
|
|
22,269
|
|
4,327
|
|
28,599
|
|
26,059
|
|
5,365
|
|
||||||||||||||||||||||
|
Other
|
9,052
|
|
8,539
|
|
1,602
|
|
11,087
|
|
10,465
|
|
2,034
|
|
||||||||||||||||||||||
|
Total single-family
|
127,744
|
|
120,547
|
|
18,089
|
|
145,101
|
|
136,654
|
|
21,920
|
|
||||||||||||||||||||||
|
Multifamily
|
242
|
|
245
|
|
35
|
|
320
|
|
323
|
|
33
|
|
||||||||||||||||||||||
|
Total individually impaired loans with related allowance recorded
|
127,986
|
|
120,792
|
|
18,124
|
|
145,421
|
|
136,977
|
|
21,953
|
|
||||||||||||||||||||||
|
With no related allowance recorded:
(1)
|
|
|
||||||||||||||||||||||||||||||||
|
Single-family:
|
|
|
||||||||||||||||||||||||||||||||
|
Primary
|
16,356
|
|
15,438
|
|
—
|
|
15,733
|
|
14,758
|
|
—
|
|
||||||||||||||||||||||
|
Government
|
67
|
|
62
|
|
—
|
|
63
|
|
59
|
|
—
|
|
||||||||||||||||||||||
|
Alt-A
|
3,402
|
|
2,992
|
|
—
|
|
3,511
|
|
3,062
|
|
—
|
|
||||||||||||||||||||||
|
Other
|
1,054
|
|
968
|
|
—
|
|
1,159
|
|
1,065
|
|
—
|
|
||||||||||||||||||||||
|
Total single-family
|
20,879
|
|
19,460
|
|
—
|
|
20,466
|
|
18,944
|
|
—
|
|
||||||||||||||||||||||
|
Multifamily
|
338
|
|
340
|
|
—
|
|
266
|
|
266
|
|
—
|
|
||||||||||||||||||||||
|
Total individually impaired loans with no related allowance recorded
|
21,217
|
|
19,800
|
|
—
|
|
20,732
|
|
19,210
|
|
—
|
|
||||||||||||||||||||||
|
Total individually impaired loans
(2)
|
$
|
149,203
|
|
$
|
140,592
|
|
$
|
18,124
|
|
$
|
166,153
|
|
$
|
156,187
|
|
$
|
21,953
|
|
||||||||||||||||
|
Fannie Mae (In conservatorship) Third Quarter 2017 Form 10-Q
|
77
|
|
|
Notes to Condensed Consolidated Financial Statements | Mortgage Loans
|
||
|
For the Three Months Ended September 30,
|
|||||||||||||||||||||||||||||||||||
|
2017
|
2016
|
||||||||||||||||||||||||||||||||||
|
Average Recorded Investment
|
Total Interest Income Recognized
(3)
|
Interest Income Recognized on a Cash Basis
|
Average Recorded Investment
|
Total Interest Income Recognized
(3)
|
Interest Income Recognized on a Cash Basis
|
||||||||||||||||||||||||||||||
|
(Dollars in millions)
|
|||||||||||||||||||||||||||||||||||
|
Individually impaired loans:
|
|
|
|||||||||||||||||||||||||||||||||
|
With related allowance recorded:
|
|
|
|
|
|||||||||||||||||||||||||||||||
|
Single-family:
|
|
|
|
|
|||||||||||||||||||||||||||||||
|
Primary
|
$
|
90,941
|
|
$
|
912
|
|
$
|
75
|
|
$
|
103,523
|
|
$
|
992
|
|
$
|
68
|
|
|||||||||||||||||
|
Government
|
289
|
|
2
|
|
—
|
|
310
|
|
3
|
|
—
|
|
|||||||||||||||||||||||
|
Alt-A
|
22,904
|
|
228
|
|
13
|
|
27,115
|
|
250
|
|
10
|
|
|||||||||||||||||||||||
|
Other
|
8,817
|
|
78
|
|
4
|
|
11,220
|
|
91
|
|
4
|
|
|||||||||||||||||||||||
|
Total single-family
|
122,951
|
|
1,220
|
|
92
|
|
142,168
|
|
1,336
|
|
82
|
|
|||||||||||||||||||||||
|
Multifamily
|
232
|
|
1
|
|
—
|
|
492
|
|
3
|
|
—
|
|
|||||||||||||||||||||||
|
Total individually impaired loans with related allowance recorded
|
123,183
|
|
1,221
|
|
92
|
|
142,660
|
|
1,339
|
|
82
|
|
|||||||||||||||||||||||
|
With no related allowance recorded:
(1)
|
|
||||||||||||||||||||||||||||||||||
|
Single-family:
|
|
||||||||||||||||||||||||||||||||||
|
Primary
|
15,402
|
|
273
|
|
24
|
|
15,534
|
|
320
|
|
19
|
|
|||||||||||||||||||||||
|
Government
|
61
|
|
—
|
|
—
|
|
61
|
|
1
|
|
—
|
|
|||||||||||||||||||||||
|
Alt-A
|
3,008
|
|
65
|
|
5
|
|
3,312
|
|
81
|
|
—
|
|
|||||||||||||||||||||||
|
Other
|
983
|
|
21
|
|
1
|
|
1,115
|
|
27
|
|
—
|
|
|||||||||||||||||||||||
|
Total single-family
|
19,454
|
|
359
|
|
30
|
|
20,022
|
|
429
|
|
19
|
|
|||||||||||||||||||||||
|
Multifamily
|
304
|
|
6
|
|
—
|
|
311
|
|
3
|
|
—
|
|
|||||||||||||||||||||||
|
Total individually impaired loans with no related allowance recorded
|
19,758
|
|
365
|
|
30
|
|
20,333
|
|
432
|
|
19
|
|
|||||||||||||||||||||||
|
Total individually impaired loans
|
$
|
142,941
|
|
$
|
1,586
|
|
$
|
122
|
|
$
|
162,993
|
|
$
|
1,771
|
|
$
|
101
|
|
|||||||||||||||||
|
Fannie Mae (In conservatorship) Third Quarter 2017 Form 10-Q
|
78
|
|
|
Notes to Condensed Consolidated Financial Statements | Mortgage Loans
|
||
|
For the Nine Months Ended September 30,
|
|||||||||||||||||||||||||||||||||||
|
2017
|
2016
|
||||||||||||||||||||||||||||||||||
|
Average Recorded Investment
|
Total Interest Income Recognized
(3)
|
Interest Income Recognized on a Cash Basis
|
Average Recorded Investment
|
Total Interest Income Recognized
(3)
|
Interest Income Recognized on a Cash Basis
|
||||||||||||||||||||||||||||||
|
(Dollars in millions)
|
|||||||||||||||||||||||||||||||||||
|
Individually impaired loans:
|
|
|
|||||||||||||||||||||||||||||||||
|
With related allowance recorded:
|
|
|
|
|
|||||||||||||||||||||||||||||||
|
Single-family:
|
|
|
|
|
|||||||||||||||||||||||||||||||
|
Primary
|
$
|
94,594
|
|
$
|
2,853
|
|
$
|
240
|
|
$
|
106,498
|
|
$
|
3,028
|
|
$
|
243
|
|
|||||||||||||||||
|
Government
|
295
|
|
7
|
|
—
|
|
317
|
|
9
|
|
—
|
|
|||||||||||||||||||||||
|
Alt-A
|
24,233
|
|
717
|
|
42
|
|
27,899
|
|
759
|
|
40
|
|
|||||||||||||||||||||||
|
Other
|
9,480
|
|
247
|
|
14
|
|
11,622
|
|
276
|
|
15
|
|
|||||||||||||||||||||||
|
Total single-family
|
128,602
|
|
3,824
|
|
296
|
|
146,336
|
|
4,072
|
|
298
|
|
|||||||||||||||||||||||
|
Multifamily
|
271
|
|
7
|
|
—
|
|
555
|
|
21
|
|
—
|
|
|||||||||||||||||||||||
|
Total individually impaired loans with related allowance recorded
|
128,873
|
|
3,831
|
|
296
|
|
146,891
|
|
4,093
|
|
298
|
|
|||||||||||||||||||||||
|
With no related allowance recorded:
(1)
|
|
||||||||||||||||||||||||||||||||||
|
Single-family:
|
|
||||||||||||||||||||||||||||||||||
|
Primary
|
15,173
|
|
835
|
|
71
|
|
15,398
|
|
915
|
|
69
|
|
|||||||||||||||||||||||
|
Government
|
61
|
|
2
|
|
—
|
|
59
|
|
3
|
|
—
|
|
|||||||||||||||||||||||
|
Alt-A
|
3,041
|
|
205
|
|
10
|
|
3,350
|
|
224
|
|
8
|
|
|||||||||||||||||||||||
|
Other
|
1,023
|
|
65
|
|
3
|
|
1,128
|
|
79
|
|
3
|
|
|||||||||||||||||||||||
|
Total single-family
|
19,298
|
|
1,107
|
|
84
|
|
19,935
|
|
1,221
|
|
80
|
|
|||||||||||||||||||||||
|
Multifamily
|
294
|
|
16
|
|
—
|
|
330
|
|
9
|
|
—
|
|
|||||||||||||||||||||||
|
Total individually impaired loans with no related allowance recorded
|
19,592
|
|
1,123
|
|
84
|
|
20,265
|
|
1,230
|
|
80
|
|
|||||||||||||||||||||||
|
Total individually impaired loans
|
$
|
148,465
|
|
$
|
4,954
|
|
$
|
380
|
|
$
|
167,156
|
|
$
|
5,323
|
|
$
|
378
|
|
|||||||||||||||||
__________
|
(1)
|
The discounted cash flows or collateral value equals or exceeds the carrying value of the loan and, as such, no valuation allowance is required.
|
|
(2)
|
Includes single-family loans restructured in a TDR with a recorded investment of
$139.5 billion
and
$155.0 billion
as of
September 30, 2017
and
December 31, 2016
, respectively. Includes multifamily loans restructured in a TDR with a recorded investment of
$264 million
and
$248 million
as of
September 30, 2017
and
December 31, 2016
, respectively.
|
|
(3)
|
Total single-family interest income recognized of
$1.5 billion
for the
three
months ended
September 30, 2017
consists of
$1.3 billion
of contractual interest and
$216 million
of effective yield adjustments. Total single-family interest income recognized of
$1.8 billion
for the
three
months ended
September 30, 2016
consists of
$1.4 billion
of contractual interest and
$320 million
of effective yield adjustments. Total single-family interest income recognized of
$4.9 billion
for the
nine
months ended
September 30, 2017
consists of
$4.2 billion
of contractual interest and
$713 million
of effective yield adjustments. Total single-family interest income recognized of
$5.3 billion
for the
nine
months ended
September 30, 2016
consists of
$4.3 billion
of contractual interest and
$961 million
of effective yield adjustments.
|
Troubled Debt Restructurings
A modification to the contractual terms of a loan that results in granting a concession to a borrower experiencing financial difficulties is considered a TDR.
The substantial majority of the loan modifications we complete result in term extensions, interest rate reductions or a combination of both. During the
three
months ended
September 30, 2017
and
2016
, the average term extension of a single-family modified loan was
156 months
and
153 months
, respectively, and the average interest rate reduction was
0.35
and
0.82
percentage points, respectively. During the
nine
months ended
September 30, 2017
and
2016
, the average term extension of a single-family modified loan was
155 months
and
157 months
, respectively, and the average interest rate reduction was
0.66
and
0.76
percentage points, respectively.
|
Fannie Mae (In conservatorship) Third Quarter 2017 Form 10-Q
|
79
|
|
|
Notes to Condensed Consolidated Financial Statements | Mortgage Loans
|
||
The following tables display the number of loans and recorded investment in loans restructured in a TDR.
|
For the Three Months Ended September 30,
|
|||||||||||||||||||||
|
2017
|
2016
|
||||||||||||||||||||
|
Number of Loans
|
Recorded
Investment
|
Number of Loans
|
Recorded
Investment
|
||||||||||||||||||
|
(Dollars in millions)
|
|||||||||||||||||||||
|
Single-family:
|
|||||||||||||||||||||
|
Primary
|
13,323
|
|
$
|
1,847
|
|
13,983
|
|
$
|
1,922
|
|
|||||||||||
|
Government
|
32
|
|
5
|
|
54
|
|
5
|
|
|||||||||||||
|
Alt-A
|
1,229
|
|
182
|
|
1,578
|
|
227
|
|
|||||||||||||
|
Other
|
264
|
|
50
|
|
317
|
|
57
|
|
|||||||||||||
|
Total single-family
|
14,848
|
|
2,084
|
|
15,932
|
|
2,211
|
|
|||||||||||||
|
Multifamily
|
5
|
|
82
|
|
2
|
|
5
|
|
|||||||||||||
|
Total TDRs
|
14,853
|
|
$
|
2,166
|
|
15,934
|
|
$
|
2,216
|
|
|||||||||||
|
For the Nine Months Ended September 30,
|
|||||||||||||||||||||
|
2017
|
2016
|
||||||||||||||||||||
|
Number of Loans
|
Recorded
Investment
|
Number of Loans
|
Recorded
Investment
|
||||||||||||||||||
|
(Dollars in millions)
|
|||||||||||||||||||||
|
Single-family:
|
|||||||||||||||||||||
|
Primary
|
44,706
|
|
$
|
6,155
|
|
45,987
|
|
$
|
6,282
|
|
|||||||||||
|
Government
|
138
|
|
15
|
|
136
|
|
14
|
|
|||||||||||||
|
Alt-A
|
4,122
|
|
600
|
|
5,112
|
|
735
|
|
|||||||||||||
|
Other
|
844
|
|
149
|
|
1,078
|
|
190
|
|
|||||||||||||
|
Total single-family
|
49,810
|
|
6,919
|
|
52,313
|
|
7,221
|
|
|||||||||||||
|
Multifamily
|
8
|
|
99
|
|
6
|
|
50
|
|
|||||||||||||
|
Total TDRs
|
49,818
|
|
$
|
7,018
|
|
52,319
|
|
$
|
7,271
|
|
|||||||||||
The following tables display the number of loans and our recorded investment in these loans at the time of payment default for loans that were restructured in a TDR in the twelve months prior to the payment default. For purposes of this disclosure, we define loans that had a payment default as: single-family and multifamily loans with completed TDRs that liquidated during the period, either through foreclosure, deed-in-lieu of foreclosure, or a short sale; single-family loans with completed modifications that are two or more months delinquent during the period; or multifamily loans with completed modifications that are one or more months delinquent during the period.
|
For the Three Months Ended September 30,
|
|||||||||||||||||||||
|
2017
|
2016
|
||||||||||||||||||||
|
Number of Loans
|
Recorded
Investment
|
Number of Loans
|
Recorded
Investment
|
||||||||||||||||||
|
(Dollars in millions)
|
|||||||||||||||||||||
|
Single-family:
|
|||||||||||||||||||||
|
Primary
|
4,900
|
|
$
|
684
|
|
5,268
|
|
$
|
734
|
|
|||||||||||
|
Government
|
25
|
|
3
|
|
31
|
|
4
|
|
|||||||||||||
|
Alt-A
|
627
|
|
95
|
|
734
|
|
116
|
|
|||||||||||||
|
Other
|
178
|
|
34
|
|
235
|
|
41
|
|
|||||||||||||
|
Total TDRs that subsequently defaulted
|
5,730
|
|
$
|
816
|
|
6,268
|
|
$
|
895
|
|
|||||||||||
|
Fannie Mae (In conservatorship) Third Quarter 2017 Form 10-Q
|
80
|
|
|
Notes to Condensed Consolidated Financial Statements | Mortgage Loans
|
||
|
For the Nine Months Ended September 30,
|
|||||||||||||||||||||
|
2017
|
2016
|
||||||||||||||||||||
|
Number of Loans
|
Recorded
Investment
|
Number of Loans
|
Recorded
Investment
|
||||||||||||||||||
|
(Dollars in millions)
|
|||||||||||||||||||||
|
Single-family:
|
|||||||||||||||||||||
|
Primary
|
13,617
|
|
$
|
1,894
|
|
15,377
|
|
$
|
2,174
|
|
|||||||||||
|
Government
|
69
|
|
8
|
|
73
|
|
9
|
|
|||||||||||||
|
Alt-A
|
1,857
|
|
288
|
|
2,342
|
|
376
|
|
|||||||||||||
|
Other
|
529
|
|
102
|
|
767
|
|
130
|
|
|||||||||||||
|
Total single-family
|
16,072
|
|
2,292
|
|
18,559
|
|
2,689
|
|
|||||||||||||
|
Multifamily
|
1
|
|
4
|
|
—
|
|
—
|
|
|||||||||||||
|
Total TDRs that subsequently defaulted
|
16,073
|
|
$
|
2,296
|
|
18,559
|
|
$
|
2,689
|
|
|||||||||||
4
.
Allowance for Loan Losses
We maintain an allowance for loan losses for HFI loans held by Fannie Mae and loans backing Fannie Mae MBS issued from consolidated trusts. When calculating our allowance for loan losses, we consider our net carrying value of HFI loans at the balance sheet date, which includes unpaid principal balance, net of amortized premiums and discounts, and other cost basis adjustments. We record charge-offs as a reduction to our allowance for loan losses at the point of foreclosure, completion of a short sale, upon the redesignation of loans from HFI to HFS or when a loan is determined to be uncollectible.
We aggregate single-family HFI loans that are not individually impaired based on similar risk characteristics for purposes of estimating incurred credit losses and establishing a collective single-family loss reserve using an econometric model that derives an overall loss reserve estimate. We base our allowance methodology on historical events and trends, such as loss severity (in event of default), default rates, and recoveries from mortgage insurance contracts and other credit enhancements that provide loan level loss coverage and are either contractually attached to a loan or that were entered into contemporaneously with and in contemplation of a guaranty or loan purchase transaction. We use recent regional historical sales and appraisal information including the sales of our own foreclosed properties, to develop our loss severity estimates for all loan categories. Our allowance calculation also incorporates a loss confirmation period (the anticipated time lag between a credit loss event and the confirmation of the credit loss resulting from that event) to ensure our allowance estimate captures credit losses that have been incurred as of the balance sheet date but have not been confirmed. In addition, management performs a review of the observable data used in its estimate to ensure it is representative of prevailing economic conditions and other events existing as of the balance sheet date.
Individually impaired single-family loans currently include those restructured in a TDR and acquired credit-impaired loans. We consider a loan to be impaired when, based on current information, it is probable that we will not receive all amounts due, including interest, in accordance with the contractual terms of the loan agreement. When a loan has been restructured, we measure impairment using a cash flow analysis discounted at the loan’s original effective interest rate. If we expect to recover our recorded investment in an individually impaired loan through probable foreclosure of the underlying collateral, we measure impairment based on the fair value of the collateral, reduced by estimated disposal costs and adjusted for estimated proceeds from mortgage, flood, or hazard insurance or similar sources.
We establish a collective allowance for all loans in our multifamily guaranty book of business that are not individually impaired using an internal model that applies loss factors to loans in similar risk categories. Our loss factors are developed based on our historical default and loss severity experience. We identify multifamily loans for evaluation for impairment through a credit risk assessment process. If we determine that a multifamily loan is individually impaired, we generally measure impairment on that loan based on the fair value of the underlying collateral less estimated costs to sell the property, as we have concluded that such loans are collateral dependent. We evaluate collectively for impairment smaller-balance homogeneous multifamily loans.
As of September 30, 2017, we included an estimate of incurred credit losses from Hurricanes Harvey, Irma and Maria of approximately
$1.0 billion
in the allowance for loan losses.
|
Fannie Mae (In conservatorship) Third Quarter 2017 Form 10-Q
|
81
|
|
|
Notes to Condensed Consolidated Financial Statements | Allowance for Loan Losses
|
||
The following table displays changes in single-family, multifamily and total allowance for loan losses.
|
For the Three Months Ended September 30,
|
For the Nine Months Ended September 30,
|
||||||||||||||
|
2017
|
2016
|
2017
|
2016
|
||||||||||||
|
(Dollars in millions)
|
|||||||||||||||
|
Single-family allowance for loan losses:
|
|||||||||||||||
|
Beginning balance
|
$
|
20,218
|
|
$
|
23,584
|
|
$
|
23,283
|
|
$
|
27,709
|
|
|||
|
Provision (benefit) for loan losses
(1)
|
163
|
|
(609
|
)
|
(1,442
|
)
|
(2,957
|
)
|
|||||||
|
Charge-offs
|
(434
|
)
|
(604
|
)
|
(2,163
|
)
|
(2,701
|
)
|
|||||||
|
Recoveries
|
42
|
|
135
|
|
273
|
|
369
|
|
|||||||
|
Other
(2)
|
(17
|
)
|
10
|
|
21
|
|
96
|
|
|||||||
|
Ending balance
|
$
|
19,972
|
|
$
|
22,516
|
|
$
|
19,972
|
|
$
|
22,516
|
|
|||
|
Multifamily allowance for loan losses:
|
|||||||||||||||
|
Beginning balance
|
$
|
181
|
|
$
|
215
|
|
$
|
182
|
|
$
|
242
|
|
|||
|
Provision (benefit) for loan losses
(1)
|
42
|
|
(27
|
)
|
40
|
|
(47
|
)
|
|||||||
|
Charge-offs
|
(3
|
)
|
(4
|
)
|
(3
|
)
|
(12
|
)
|
|||||||
|
Recoveries
|
2
|
|
6
|
|
3
|
|
7
|
|
|||||||
|
Ending balance
|
$
|
222
|
|
$
|
190
|
|
$
|
222
|
|
$
|
190
|
|
|||
|
Total allowance for loan losses:
|
|||||||||||||||
|
Beginning balance
|
$
|
20,399
|
|
$
|
23,799
|
|
$
|
23,465
|
|
$
|
27,951
|
|
|||
|
Provision (benefit) for loan losses
(1)
|
205
|
|
(636
|
)
|
(1,402
|
)
|
(3,004
|
)
|
|||||||
|
Charge-offs
|
(437
|
)
|
(608
|
)
|
(2,166
|
)
|
(2,713
|
)
|
|||||||
|
Recoveries
|
44
|
|
141
|
|
276
|
|
376
|
|
|||||||
|
Other
(2)
|
(17
|
)
|
10
|
|
21
|
|
96
|
|
|||||||
|
Ending balance
|
$
|
20,194
|
|
$
|
22,706
|
|
$
|
20,194
|
|
$
|
22,706
|
|
|||
__________
|
(1)
|
Provision (benefit) for loan losses is included in “
Benefit (provision) for credit losses
” in our condensed consolidated statements of operations and comprehensive income.
|
|
(2)
|
Amounts represent changes in other loss reserves which are reflected in provision (benefit) for loan losses, charge-offs, and recoveries.
|
|
Fannie Mae (In conservatorship) Third Quarter 2017 Form 10-Q
|
82
|
|
|
Notes to Condensed Consolidated Financial Statements | Allowance for Loan Losses
|
||
The following table displays the allowance for loan losses and recorded investment in our HFI loans, excluding loans for which we have elected the fair value option, by impairment or allowance methodology and portfolio segment.
|
As of
|
|||||||||||||||||||||||
|
|
September 30, 2017
|
December 31, 2016
|
|||||||||||||||||||||
|
Single-Family
|
Multifamily
|
Total
|
Single-Family
|
Multifamily
|
Total
|
||||||||||||||||||
|
(Dollars in millions)
|
|||||||||||||||||||||||
|
Allowance for loan losses by segment:
|
|||||||||||||||||||||||
|
Individually impaired loans
(1)
|
$
|
18,089
|
|
$
|
35
|
|
$
|
18,124
|
|
$
|
21,920
|
|
$
|
33
|
|
$
|
21,953
|
|
|||||
|
Collectively reserved loans
|
1,883
|
|
187
|
|
2,070
|
|
1,363
|
|
149
|
|
1,512
|
|
|||||||||||
|
Total allowance for loan losses
|
$
|
19,972
|
|
$
|
222
|
|
$
|
20,194
|
|
$
|
23,283
|
|
$
|
182
|
|
$
|
23,465
|
|
|||||
|
Recorded investment in loans by segment:
|
|||||||||||||||||||||||
|
Individually impaired loans
(1)
|
$
|
140,007
|
|
$
|
585
|
|
$
|
140,592
|
|
$
|
155,598
|
|
$
|
589
|
|
$
|
156,187
|
|
|||||
|
Collectively reserved loans
|
2,770,331
|
|
254,408
|
|
3,024,739
|
|
2,708,337
|
|
231,292
|
|
2,939,629
|
|
|||||||||||
|
Total recorded investment in loans
|
$
|
2,910,338
|
|
$
|
254,993
|
|
$
|
3,165,331
|
|
$
|
2,863,935
|
|
$
|
231,881
|
|
$
|
3,095,816
|
|
|||||
__________
|
(1)
|
Includes acquired credit-impaired loans.
|
5
.
Investments in Securities
Trading Securities
Trading securities are recorded at fair value with subsequent changes in fair value recorded as “
Fair value losses, net
” in our condensed consolidated statements of operations and comprehensive income. The following table displays our investments in trading securities.
|
As of
|
|||||||||||
|
September 30, 2017
|
December 31, 2016
|
||||||||||
|
(Dollars in millions)
|
|||||||||||
|
Mortgage-related securities:
|
|||||||||||
|
Fannie Mae
|
$
|
4,100
|
|
$
|
4,769
|
|
|||||
|
Other agency
|
1,428
|
|
2,058
|
|
|||||||
|
Alt-A and subprime private-label securities
|
549
|
|
636
|
|
|||||||
|
Commercial mortgage-backed securities (“CMBS”)
|
9
|
|
761
|
|
|||||||
|
Mortgage revenue bonds
|
1
|
|
21
|
|
|||||||
|
Total mortgage-related securities
|
6,087
|
|
8,245
|
|
|||||||
|
U.S. Treasury securities
|
30,799
|
|
32,317
|
|
|||||||
|
Total trading securities
|
$
|
36,886
|
|
$
|
40,562
|
|
|||||
The following table displays information about our net trading gains and losses.
|
For the Three
|
For the Nine
|
||||||||||||||
|
Months Ended
|
Months Ended
|
||||||||||||||
|
September 30,
|
September 30,
|
||||||||||||||
|
2017
|
2016
|
2017
|
2016
|
||||||||||||
|
(Dollars in millions)
|
|||||||||||||||
|
Net trading gains
|
$
|
59
|
|
$
|
38
|
|
$
|
145
|
|
$
|
88
|
|
|||
|
Net trading gains (losses) recognized in the period related to securities still held at period end
|
51
|
|
1
|
|
125
|
|
(34
|
)
|
|||||||
|
Fannie Mae (In conservatorship) Third Quarter 2017 Form 10-Q
|
83
|
|
|
Notes to Condensed Consolidated Financial Statements | Investments in Securities
|
||
Available-for-Sale Securities
We record available-for-sale (“AFS”) securities at fair value with unrealized gains and losses, recorded net of tax, as a component of “
Other comprehensive income (loss)
” and we recognize realized gains and losses from the sale of AFS securities in “
Investment gains, net
” in our condensed consolidated statements of operations and comprehensive income.
The following table displays the gross realized gains, losses and proceeds on sales of AFS securities.
|
For the Three Months Ended
|
For the Nine Months Ended
|
||||||||||||||
|
September 30,
|
September 30,
|
||||||||||||||
|
2017
|
2016
|
2017
|
2016
|
||||||||||||
|
(Dollars in millions)
|
|||||||||||||||
|
Gross realized gains
|
$
|
30
|
|
$
|
400
|
|
$
|
260
|
|
$
|
845
|
|
|||
|
Gross realized losses
|
—
|
|
—
|
|
—
|
|
12
|
|
|||||||
|
Total proceeds (excludes initial sale of securities from new portfolio securitizations)
|
187
|
|
2,819
|
|
1,081
|
|
10,086
|
|
|||||||
The following tables display the amortized cost, gross unrealized gains and losses, and fair value by major security type for AFS securities.
|
As of September 30, 2017
|
||||||||||||||||||||||
|
Total Amortized Cost
(1)
|
Gross Unrealized Gains
|
Gross Unrealized Losses
(2)
|
Total Fair Value
|
|||||||||||||||||||
|
(Dollars in millions)
|
||||||||||||||||||||||
|
Fannie Mae
|
$
|
2,118
|
|
$
|
116
|
|
$
|
(26
|
)
|
$
|
2,208
|
|
||||||||||
|
Other agency
|
361
|
|
30
|
|
—
|
|
391
|
|
||||||||||||||
|
Alt-A and subprime private-label securities
|
1,155
|
|
879
|
|
—
|
|
2,034
|
|
||||||||||||||
|
CMBS
|
182
|
|
—
|
|
—
|
|
182
|
|
||||||||||||||
|
Mortgage revenue bonds
|
736
|
|
19
|
|
(6
|
)
|
749
|
|
||||||||||||||
|
Other mortgage-related securities
|
380
|
|
19
|
|
—
|
|
399
|
|
||||||||||||||
|
Total
|
$
|
4,932
|
|
$
|
1,063
|
|
$
|
(32
|
)
|
$
|
5,963
|
|
||||||||||
|
As of December 31, 2016
|
||||||||||||||||||||||
|
Total Amortized Cost
(1)
|
Gross Unrealized Gains
|
Gross Unrealized Losses
(2)
|
Total Fair Value
|
|||||||||||||||||||
|
(Dollars in millions)
|
||||||||||||||||||||||
|
Fannie Mae
|
$
|
2,445
|
|
$
|
137
|
|
$
|
(28
|
)
|
$
|
2,554
|
|
||||||||||
|
Other agency
|
508
|
|
39
|
|
—
|
|
547
|
|
||||||||||||||
|
Alt-A and subprime private-label securities
|
1,817
|
|
895
|
|
(3
|
)
|
2,709
|
|
||||||||||||||
|
CMBS
|
815
|
|
4
|
|
—
|
|
819
|
|
||||||||||||||
|
Mortgage revenue bonds
|
1,245
|
|
36
|
|
(9
|
)
|
1,272
|
|
||||||||||||||
|
Other mortgage-related securities
|
431
|
|
31
|
|
—
|
|
462
|
|
||||||||||||||
|
Total
|
$
|
7,261
|
|
$
|
1,142
|
|
$
|
(40
|
)
|
$
|
8,363
|
|
||||||||||
__________
|
(1)
|
Amortized cost consists of unpaid principal balance, unamortized premiums, discounts and other cost basis adjustments, as well as net other-than-temporary impairments (“OTTI”) recognized in “
Investment gains, net
” in our condensed consolidated statements of operations and comprehensive income.
|
|
(2)
|
Represents the gross unrealized losses on securities for which we have not recognized OTTI, as well as the noncredit component of OTTI and cumulative changes in fair value of securities for which we previously recognized the credit component of OTTI in “
Accumulated other comprehensive income
” in our condensed consolidated balance sheets.
|
|
Fannie Mae (In conservatorship) Third Quarter 2017 Form 10-Q
|
84
|
|
|
Notes to Condensed Consolidated Financial Statements | Investments in Securities
|
||
The following tables display additional information regarding gross unrealized losses and fair value by major security type for AFS securities in an unrealized loss position.
|
As of September 30, 2017
|
|||||||||||||||||||
|
Less Than 12 Consecutive Months
|
12 Consecutive Months or Longer
|
||||||||||||||||||
|
Gross Unrealized Losses
|
Fair Value
|
Gross Unrealized Losses
|
Fair Value
|
||||||||||||||||
|
(Dollars in millions)
|
|||||||||||||||||||
|
Fannie Mae
|
$
|
(2
|
)
|
$
|
150
|
|
$
|
(24
|
)
|
$
|
430
|
|
|||||||
|
Mortgage revenue bonds
|
—
|
|
—
|
|
(6
|
)
|
15
|
|
|||||||||||
|
Total
|
$
|
(2
|
)
|
$
|
150
|
|
$
|
(30
|
)
|
$
|
445
|
|
|||||||
|
As of December 31, 2016
|
|||||||||||||||||||
|
Less Than 12 Consecutive Months
|
12 Consecutive Months or Longer
|
||||||||||||||||||
|
Gross Unrealized Losses
|
Fair Value
|
Gross Unrealized Losses
|
Fair Value
|
||||||||||||||||
|
(Dollars in millions)
|
|||||||||||||||||||
|
Fannie Mae
|
$
|
(2
|
)
|
$
|
139
|
|
$
|
(26
|
)
|
$
|
477
|
|
|||||||
|
Alt-A and subprime private-label securities
|
—
|
|
—
|
|
(3
|
)
|
73
|
|
|||||||||||
|
Mortgage revenue bonds
|
(7
|
)
|
78
|
|
(2
|
)
|
6
|
|
|||||||||||
|
Total
|
$
|
(9
|
)
|
$
|
217
|
|
$
|
(31
|
)
|
$
|
556
|
|
|||||||
Other-Than-Temporary Impairments
The balance of the unrealized credit loss component of AFS debt securities held by us and recognized in our condensed consolidated statements of operations and comprehensive income was
$1.2 billion
,
$1.8 billion
,
$1.9 billion
,
$2.0 billion
,
$2.2 billion
and
$2.4 billion
as of
September 30, 2017
,
June 30, 2017
,
December 31, 2016
,
September 30, 2016
,
June 30, 2016
and
December 31, 2015
, respectively. The
decrease
s for the
three and nine
months ended
September 30, 2017
and
September 30, 2016
were primarily driven by securities we intend to sell or that it is more likely than not we will be required to sell before recovery of our amortized cost basis.
Maturity Information
The following table displays the amortized cost and fair value of our AFS securities by major security type and remaining contractual maturity, assuming no principal prepayments. The contractual maturity of mortgage-backed securities is not a reliable indicator of their expected life because borrowers generally have the right to prepay their obligations at any time.
|
|
As of September 30, 2017
|
||||||||||||||||||||||||||||||||||||||||||||||||
|
Total Amortized Cost
|
Total
Fair
Value
|
One Year or Less
|
After One Year Through Five Years
|
After Five Years Through Ten Years
|
After Ten Years
|
||||||||||||||||||||||||||||||||||||||||||||
|
Amortized Cost
|
Fair Value
|
Amortized Cost
|
Fair Value
|
Amortized Cost
|
Fair Value
|
Amortized Cost
|
Fair Value
|
||||||||||||||||||||||||||||||||||||||||||
|
|
(Dollars in millions)
|
||||||||||||||||||||||||||||||||||||||||||||||||
|
Fannie Mae
|
$
|
2,118
|
|
$
|
2,208
|
|
$
|
4
|
|
$
|
4
|
|
$
|
11
|
|
$
|
11
|
|
$
|
64
|
|
$
|
68
|
|
$
|
2,039
|
|
$
|
2,125
|
|
|||||||||||||||||||
|
Other agency
|
361
|
|
391
|
|
—
|
|
—
|
|
22
|
|
23
|
|
58
|
|
62
|
|
281
|
|
306
|
|
|||||||||||||||||||||||||||||
|
Alt-A and subprime private-label securities
|
1,155
|
|
2,034
|
|
—
|
|
—
|
|
—
|
|
—
|
|
—
|
|
—
|
|
1,155
|
|
2,034
|
|
|||||||||||||||||||||||||||||
|
CMBS
|
182
|
|
182
|
|
182
|
|
182
|
|
—
|
|
—
|
|
—
|
|
—
|
|
—
|
|
—
|
|
|||||||||||||||||||||||||||||
|
Mortgage revenue bonds
|
736
|
|
749
|
|
14
|
|
14
|
|
66
|
|
66
|
|
103
|
|
105
|
|
553
|
|
564
|
|
|||||||||||||||||||||||||||||
|
Other mortgage-related securities
|
380
|
|
399
|
|
—
|
|
—
|
|
—
|
|
—
|
|
10
|
|
11
|
|
370
|
|
388
|
|
|||||||||||||||||||||||||||||
|
Total
|
$
|
4,932
|
|
$
|
5,963
|
|
$
|
200
|
|
$
|
200
|
|
$
|
99
|
|
$
|
100
|
|
$
|
235
|
|
$
|
246
|
|
$
|
4,398
|
|
$
|
5,417
|
|
|||||||||||||||||||
|
Fannie Mae (In conservatorship) Third Quarter 2017 Form 10-Q
|
85
|
|
|
Notes to Condensed Consolidated Financial Statements | Financial Guarantees
|
||
6
.
Financial Guarantees
We recognize a guaranty obligation for our obligation to stand ready to perform on our guarantees to unconsolidated trusts and other guaranty arrangements. These guarantees expose us to credit losses on the mortgage loans or, in the case of mortgage-related securities, the underlying mortgage loans of the related securities. The remaining contractual terms of our guarantees range from
1 day
to
35 years
; however, the actual term of each guaranty may be significantly less than the contractual term based on the prepayment characteristics of the related mortgage loans.
The following table displays our maximum exposure, guaranty obligation recognized in our condensed consolidated balance sheets, and the maximum potential recovery from third parties through available credit enhancements and recourse related to our financial guarantees.
|
As of
|
|||||||||||||||||||||||
|
September 30, 2017
|
December 31, 2016
|
||||||||||||||||||||||
|
Maximum Exposure
(1)
|
Guaranty Obligation
|
Maximum Recovery
(2)
|
Maximum Exposure
(1)
|
Guaranty Obligation
|
Maximum Recovery
(2)
|
||||||||||||||||||
|
(Dollars in millions)
|
|||||||||||||||||||||||
|
Unconsolidated Fannie Mae MBS
|
$
|
11,215
|
|
$
|
129
|
|
$
|
7,469
|
|
$
|
12,607
|
|
$
|
143
|
|
$
|
8,048
|
|
|||||
|
Other guaranty arrangements
(3)
|
14,489
|
|
138
|
|
2,467
|
|
15,335
|
|
137
|
|
2,663
|
|
|||||||||||
|
Total
|
$
|
25,704
|
|
$
|
267
|
|
$
|
9,936
|
|
$
|
27,942
|
|
$
|
280
|
|
$
|
10,711
|
|
|||||
__________
|
(1)
|
Primarily consists of the unpaid principal balance of the underlying mortgage loans.
|
|
(2)
|
Recoverability of such credit enhancements and recourse is subject to, among other factors, our mortgage insurers’ and financial guarantors’ ability to meet their obligations to us. For information on our mortgage insurers and financial guarantors, see “Note 15, Concentrations of Credit Risk” in our
2016 Form 10-K
.
|
|
(3)
|
Primarily consists of credit enhancements and long-term standby commitments.
|
The fair value of our guaranty obligations associated with the Fannie Mae MBS included in “Investments in securities” in our condensed consolidated balance sheets was
$275 million
and
$446 million
as of
September 30, 2017
and
December 31, 2016
, respectively. These Fannie Mae MBS consist primarily of private-label wraps where our guaranty arrangement is with an unconsolidated MBS trust.
7
.
Short-Term Borrowings and Long-Term Debt
Short-Term Borrowings
The following table displays our outstanding short-term borrowings (borrowings with an original contractual maturity of one year or less) and weighted-average interest rates of these borrowings.
|
As of
|
|||||||||||||
|
|
September 30, 2017
|
December 31, 2016
|
|||||||||||
|
Outstanding
|
Weighted- Average Interest Rate
(1)
|
Outstanding
|
Weighted- Average Interest Rate
(1)
|
||||||||||
|
(Dollars in millions)
|
|||||||||||||
|
Federal funds purchased and securities sold under agreements to repurchase
(2)
|
$
|
81
|
|
0.25
|
%
|
$
|
—
|
|
—
|
%
|
|||
|
Short-term debt of Fannie Mae
|
$
|
33,332
|
|
1.03
|
%
|
$
|
34,995
|
|
0.49
|
%
|
|||
|
Debt of consolidated trusts
|
459
|
|
0.78
|
|
584
|
|
0.48
|
|
|||||
|
Total short-term debt
|
$
|
33,791
|
|
1.02
|
%
|
$
|
35,579
|
|
0.49
|
%
|
|||
__________
|
(1)
|
Includes the effects of discounts, premiums and other cost basis adjustments.
|
|
(2)
|
Represents agreements to repurchase securities for a specified price, with repayment generally occurring on the following day.
|
|
Fannie Mae (In conservatorship) Third Quarter 2017 Form 10-Q
|
86
|
|
|
Notes to Condensed Consolidated Financial Statements | Short-Term Borrowings and Long-Term Debt
|
||
Intraday Line of Credit
We use a secured intraday funding line of credit provided by a large financial institution. We post collateral which, in some circumstances, the secured party has the right to repledge to third parties. As this line of credit is an uncommitted intraday loan facility, we may be unable to draw on it if and when needed. The line of credit under this facility was
$15.0 billion
as of
September 30, 2017
and
December 31, 2016
.
Long-Term Debt
Long-term debt represents borrowings with an original contractual maturity of greater than one year. The following table displays our outstanding long-term debt.
|
As of
|
|||||||||||||||||
|
September 30, 2017
|
December 31, 2016
|
||||||||||||||||
|
Maturities
|
Outstanding
|
Weighted- Average Interest Rate
(1)
|
Maturities
|
Outstanding
|
Weighted- Average Interest Rate
(1)
|
||||||||||||
|
(Dollars in millions)
|
|||||||||||||||||
|
Senior fixed:
|
|||||||||||||||||
|
Benchmark notes and bonds
|
2017 - 2030
|
$
|
133,022
|
|
2.01
|
%
|
2017 - 2030
|
$
|
153,983
|
|
2.16
|
%
|
|||||
|
Medium-term notes
(2)
|
2017 - 2026
|
78,087
|
|
1.41
|
|
2017 - 2026
|
82,230
|
|
1.40
|
|
|||||||
|
Other
(3)
|
2017 - 2038
|
7,852
|
|
4.83
|
|
2017 - 2038
|
12,800
|
|
6.74
|
|
|||||||
|
Total senior fixed
|
218,961
|
|
1.90
|
|
249,013
|
|
2.14
|
|
|||||||||
|
Senior floating:
|
|||||||||||||||||
|
Medium-term notes
(2)
|
2017 - 2020
|
11,424
|
|
1.26
|
|
2017 - 2019
|
21,476
|
|
0.71
|
|
|||||||
|
Connecticut Avenue Securities
(4)
|
2023 - 2030
|
22,131
|
|
5.08
|
|
2023 - 2029
|
16,511
|
|
4.77
|
|
|||||||
|
Other
(5)
|
2020 - 2037
|
369
|
|
7.44
|
|
2020 - 2037
|
346
|
|
6.75
|
|
|||||||
|
Total senior floating
|
33,924
|
|
3.78
|
|
38,333
|
|
2.48
|
|
|||||||||
|
Subordinated debentures
|
2019
|
4,987
|
|
9.93
|
|
2019
|
4,645
|
|
9.93
|
|
|||||||
|
Secured borrowings
(6)
|
2021 - 2022
|
85
|
|
1.52
|
|
2021 - 2022
|
111
|
|
1.44
|
|
|||||||
|
Total long-term debt of Fannie Mae
(7)
|
257,957
|
|
2.30
|
|
292,102
|
|
2.31
|
|
|||||||||
|
Debt of consolidated trusts
|
2017 - 2057
|
3,016,835
|
|
2.75
|
|
2017 - 2056
|
2,934,635
|
|
2.57
|
|
|||||||
|
Total long-term debt
|
$
|
3,274,792
|
|
2.71
|
%
|
$
|
3,226,737
|
|
2.54
|
%
|
|||||||
__________
|
(1)
|
Includes the effects of discounts, premiums and other cost basis adjustments.
|
|
(2)
|
Includes long-term debt with an original contractual maturity of greater than
1
year and up to
10
years, excluding zero-coupon debt.
|
|
(3)
|
Includes other long-term debt with an original contractual maturity of greater than
10
years.
|
|
(4)
|
Credit risk-sharing securities that transfer a portion of the credit risk on specified pools of single-family mortgage loans to the investors in these securities, a portion of which is reported at fair value.
|
|
(5)
|
Consists of structured debt instruments that are reported at fair value.
|
|
(6)
|
Represents our remaining liability resulting from the transfer of financial assets from our condensed consolidated balance sheets that did not qualify as a sale under the accounting guidance for the transfer of financial instruments.
|
|
(7)
|
Includes unamortized discounts and premiums, other cost basis adjustments and fair value adjustments of
$979 million
and
$1.8 billion
as of
September 30, 2017
and
December 31, 2016
, respectively.
|
|
Fannie Mae (In conservatorship) Third Quarter 2017 Form 10-Q
|
87
|
|
|
Notes to Condensed Consolidated Financial Statements | Derivative Instruments
|
||
8
.
Derivative Instruments
Derivative instruments are an integral part of our strategy in managing interest rate risk. Derivative instruments may be privately-negotiated, bilateral contracts, or they may be listed and traded on an exchange. We refer to our derivative transactions made pursuant to bilateral contracts as our over-the-counter (“OTC”) derivative transactions and our derivative transactions accepted for clearing by a derivatives clearing organization as our cleared derivative transactions. We typically do not settle the notional amount of our risk management derivatives; rather, notional amounts provide the basis for calculating actual payments or settlement amounts. The derivatives we use for interest rate risk management purposes consist primarily of interest rate swaps and interest rate options.
We enter into various forms of credit risk sharing agreements, including credit risk transfer transactions, swap credit enhancements and mortgage insurance contracts, that we account for as derivatives. The majority of our credit-related derivatives are credit risk transfer transactions, whereby a portion of the credit risk associated with losses on a reference pool of mortgage loans is transferred to a third party.
We enter into forward purchase and sale commitments that lock in the future delivery of mortgage loans and mortgage-related securities at a fixed price or yield. Certain commitments to purchase mortgage loans and purchase or sell mortgage-related securities meet the criteria of a derivative. We typically settle the notional amount of our mortgage commitments that are accounted for as derivatives.
We recognize all derivatives as either assets or liabilities in our condensed consolidated balance sheets at their fair value on a trade date basis. Fair value amounts, which are netted to the extent a legal right of offset exists and is enforceable by law at the counterparty level and are inclusive of the right or obligation associated with the cash collateral posted or received, are recorded in “Other assets” or “Other liabilities” in our condensed consolidated balance sheets. See “
Note 14, Fair Value
” for additional information on derivatives recorded at fair value. We present cash flows from derivatives as operating activities in our condensed consolidated statements of cash flows.
|
Fannie Mae (In conservatorship) Third Quarter 2017 Form 10-Q
|
88
|
|
|
Notes to Condensed Consolidated Financial Statements | Derivative Instruments
|
||
Notional and Fair Value Position of our Derivatives
The following table displays the notional amount and estimated fair value of our asset and liability derivative instruments.
|
As of September 30, 2017
|
As of December 31, 2016
|
||||||||||||||||||||||||||||||
|
Asset Derivatives
|
Liability Derivatives
|
Asset Derivatives
|
Liability Derivatives
|
||||||||||||||||||||||||||||
|
Notional Amount
|
Estimated Fair Value
|
Notional Amount
|
Estimated Fair Value
|
Notional Amount
|
Estimated Fair Value
|
Notional Amount
|
Estimated Fair Value
|
||||||||||||||||||||||||
|
(Dollars in millions)
|
|||||||||||||||||||||||||||||||
|
Risk management derivatives:
|
|||||||||||||||||||||||||||||||
|
Swaps:
|
|||||||||||||||||||||||||||||||
|
Pay-fixed
|
$
|
40,400
|
|
$
|
472
|
|
$
|
75,647
|
|
$
|
(2,639
|
)
|
$
|
29,540
|
|
$
|
660
|
|
$
|
94,584
|
|
$
|
(4,396
|
)
|
|||||||
|
Receive-fixed
|
46,989
|
|
2,554
|
|
124,153
|
|
(1,109
|
)
|
30,207
|
|
2,696
|
|
135,470
|
|
(1,552
|
)
|
|||||||||||||||
|
Basis
|
6,524
|
|
129
|
|
600
|
|
—
|
|
1,624
|
|
115
|
|
15,600
|
|
(11
|
)
|
|||||||||||||||
|
Foreign currency
|
232
|
|
54
|
|
234
|
|
(64
|
)
|
214
|
|
40
|
|
216
|
|
(85
|
)
|
|||||||||||||||
|
Swaptions:
|
|||||||||||||||||||||||||||||||
|
Pay-fixed
|
10,250
|
|
141
|
|
2,750
|
|
(4
|
)
|
9,600
|
|
241
|
|
4,850
|
|
(82
|
)
|
|||||||||||||||
|
Receive-fixed
|
400
|
|
—
|
|
8,350
|
|
(280
|
)
|
—
|
|
—
|
|
10,100
|
|
(257
|
)
|
|||||||||||||||
|
Other
(1)
|
24,324
|
|
23
|
|
—
|
|
(1
|
)
|
15,087
|
|
33
|
|
655
|
|
(2
|
)
|
|||||||||||||||
|
Total gross risk management derivatives
|
129,119
|
|
3,373
|
|
211,734
|
|
(4,097
|
)
|
86,272
|
|
3,785
|
|
261,475
|
|
(6,385
|
)
|
|||||||||||||||
|
Accrued interest receivable (payable)
|
—
|
|
724
|
|
—
|
|
(907
|
)
|
—
|
|
785
|
|
—
|
|
(937
|
)
|
|||||||||||||||
|
Netting adjustment
(2)
|
—
|
|
(4,034
|
)
|
—
|
|
4,877
|
|
—
|
|
(4,514
|
)
|
—
|
|
6,844
|
|
|||||||||||||||
|
Total net risk management derivatives
|
$
|
129,119
|
|
$
|
63
|
|
$
|
211,734
|
|
$
|
(127
|
)
|
$
|
86,272
|
|
$
|
56
|
|
$
|
261,475
|
|
$
|
(478
|
)
|
|||||||
|
Mortgage commitment derivatives:
|
|||||||||||||||||||||||||||||||
|
Mortgage commitments to purchase whole loans
|
$
|
1,227
|
|
$
|
2
|
|
$
|
6,808
|
|
$
|
(18
|
)
|
$
|
4,753
|
|
$
|
28
|
|
$
|
3,039
|
|
$
|
(49
|
)
|
|||||||
|
Forward contracts to purchase mortgage-related securities
|
16,572
|
|
38
|
|
55,847
|
|
(137
|
)
|
31,635
|
|
198
|
|
27,297
|
|
(388
|
)
|
|||||||||||||||
|
Forward contracts to sell mortgage-related securities
|
77,781
|
|
181
|
|
35,790
|
|
(55
|
)
|
34,103
|
|
405
|
|
47,645
|
|
(300
|
)
|
|||||||||||||||
|
Total mortgage commitment derivatives
|
$
|
95,580
|
|
$
|
221
|
|
$
|
98,445
|
|
$
|
(210
|
)
|
$
|
70,491
|
|
$
|
631
|
|
$
|
77,981
|
|
$
|
(737
|
)
|
|||||||
|
Derivatives at fair value
|
$
|
224,699
|
|
$
|
284
|
|
$
|
310,179
|
|
$
|
(337
|
)
|
$
|
156,763
|
|
$
|
687
|
|
$
|
339,456
|
|
$
|
(1,215
|
)
|
|||||||
|
(1)
|
Includes credit risk transfer transactions, futures, swap credit enhancements and mortgage insurance contracts that we account for as derivatives.
|
|
(2)
|
The netting adjustment represents the effect of the legal right to offset under legally enforceable master netting arrangements to settle with the same counterparty on a net basis, including cash collateral posted and received. Cash collateral posted was
$1.5 billion
and
$2.9 billion
as of
September 30, 2017
and
December 31, 2016
, respectively. Cash collateral received was
$690 million
and
$535 million
as of
September 30, 2017
and
December 31, 2016
, respectively.
|
|
Fannie Mae (In conservatorship) Third Quarter 2017 Form 10-Q
|
89
|
|
|
Notes to Condensed Consolidated Financial Statements | Derivative Instruments
|
||
We record all derivative gains and losses, including accrued interest, in “
Fair value losses, net
” in our condensed consolidated statements of operations and comprehensive income. The following table displays, by type of derivative instrument, the fair value gains and losses, net on our derivatives.
|
For the Three Months
|
For the Nine Months
|
||||||||||||||
|
Ended September 30,
|
Ended September 30,
|
||||||||||||||
|
2017
|
2016
|
2017
|
2016
|
||||||||||||
|
(Dollars in millions)
|
|||||||||||||||
|
Risk management derivatives:
|
|||||||||||||||
|
Swaps:
|
|||||||||||||||
|
Pay-fixed
|
$
|
300
|
|
$
|
1,386
|
|
$
|
300
|
|
$
|
(6,044
|
)
|
|||
|
Receive-fixed
|
(202
|
)
|
(1,020
|
)
|
120
|
|
3,338
|
|
|||||||
|
Basis
|
1
|
|
2
|
|
24
|
|
51
|
|
|||||||
|
Foreign currency
|
13
|
|
(6
|
)
|
36
|
|
(37
|
)
|
|||||||
|
Swaptions:
|
|||||||||||||||
|
Pay-fixed
|
(40
|
)
|
(3
|
)
|
(88
|
)
|
26
|
|
|||||||
|
Receive-fixed
|
(8
|
)
|
10
|
|
(34
|
)
|
(126
|
)
|
|||||||
|
Other
|
11
|
|
(7
|
)
|
6
|
|
153
|
|
|||||||
|
Net accrual of periodic settlements
|
(223
|
)
|
(295
|
)
|
(702
|
)
|
(855
|
)
|
|||||||
|
Total risk management derivatives fair value gains (losses), net
|
$
|
(148
|
)
|
$
|
67
|
|
$
|
(338
|
)
|
$
|
(3,494
|
)
|
|||
|
Mortgage commitment derivatives fair value losses, net
|
(248
|
)
|
(216
|
)
|
(520
|
)
|
(945
|
)
|
|||||||
|
Total derivatives fair value losses, net
|
$
|
(396
|
)
|
$
|
(149
|
)
|
$
|
(858
|
)
|
$
|
(4,439
|
)
|
|||
Derivative Counterparty Credit Exposure
Our derivative counterparty credit exposure relates principally to interest rate derivative contracts. We are exposed to the risk that a counterparty in a derivative transaction will default on payments due to us, which may require us to seek a replacement derivative from a different counterparty. This replacement may be at a higher cost, or we may be unable to find a suitable replacement. We manage our derivative counterparty credit exposure relating to our risk management derivative transactions mainly through enforceable master netting arrangements, which allow us to net derivative assets and liabilities with the same counterparty or clearing organization and clearing member. For our OTC derivative transactions, we require counterparties to post collateral, which may include cash, U.S. Treasury securities, agency debt and agency mortgage-related securities.
See “
Note 13, Netting Arrangements
” for information on our rights to offset assets and liabilities.
9
.
Earnings (Loss) Per Share
The calculation of income available to common stockholders and earnings per share is based on the underlying premise that all income after payment of dividends on preferred shares is available to and will be distributed to common stockholders. However, as a result of our conservatorship status and the terms of the senior preferred stock, no amounts are available to distribute as dividends to common or preferred stockholders (other than to Treasury as holder of the senior preferred stock).
|
Fannie Mae (In conservatorship) Third Quarter 2017 Form 10-Q
|
90
|
|
|
Notes to Condensed Consolidated Financial Statements | Earnings Per Share
|
||
The following table displays the computation of basic and diluted earnings (loss) per share of common stock.
|
For the Three Months Ended September 30,
|
For the Nine Months Ended September 30,
|
||||||||||||||
|
2017
|
2016
|
2017
|
2016
|
||||||||||||
|
(Dollars and shares in millions, except per share amounts)
|
|||||||||||||||
|
Net income
|
$
|
3,023
|
|
$
|
3,196
|
|
$
|
8,996
|
|
$
|
7,278
|
|
|||
|
Dividends distributed or available for distribution to senior preferred stockholder
(1)
|
(3,048
|
)
|
(2,977
|
)
|
(8,944
|
)
|
(6,765
|
)
|
|||||||
|
Net income (loss) attributable to common stockholders
|
$
|
(25
|
)
|
$
|
219
|
|
$
|
52
|
|
$
|
513
|
|
|||
|
Weighted-average common shares outstanding—Basic
(2)
|
5,762
|
|
5,762
|
|
5,762
|
|
5,762
|
|
|||||||
|
Convertible preferred stock
|
—
|
|
131
|
|
131
|
|
131
|
|
|||||||
|
Weighted-average common shares outstanding—Diluted
(2)
|
5,762
|
|
5,893
|
|
5,893
|
|
5,893
|
|
|||||||
|
Earnings (loss) per share:
|
|||||||||||||||
|
Basic
|
$
|
0.00
|
|
$
|
0.04
|
|
$
|
0.01
|
|
$
|
0.09
|
|
|||
|
Diluted
|
0.00
|
|
0.04
|
|
0.01
|
|
0.09
|
|
|||||||
__________
|
(1)
|
Dividends distributed or available for distribution were calculated based on our net worth as of the end of the fiscal quarters, less the applicable capital reserve amount. See “
|
|
(2)
|
Includes
4.6 billion
of weighted-average shares of common stock that would be issued upon the full exercise of the warrant issued to Treasury from the date the warrant was issued through
September 30, 2017
and
2016
.
|
10
.
Segment Reporting
We have
two
reportable business segments: Single-Family and Multifamily. Previously, we had a third reportable business segment, Capital Markets, which was incorporated into the Single-Family and Multifamily segments in the fourth quarter of 2016. Results of our
two
business segments are intended to reflect each segment as if it were a stand-alone business. We have revised the presentation of our segment results for the prior periods to be consistent with the current period presentation.
|
Fannie Mae (In conservatorship) Third Quarter 2017 Form 10-Q
|
91
|
|
|
Notes to Condensed Consolidated Financial Statements | Segment Reporting
|
||
|
For the Three Months Ended September 30,
|
|||||||||||||||||||||||
|
2017
|
2016
|
||||||||||||||||||||||
|
Single-Family
|
Multifamily
|
Total
|
Single-Family
|
Multifamily
|
Total
|
||||||||||||||||||
|
(Dollars in millions)
|
|||||||||||||||||||||||
|
Net interest income
(1)
|
$
|
4,627
|
|
$
|
647
|
|
$
|
5,274
|
|
$
|
4,857
|
|
$
|
578
|
|
$
|
5,435
|
|
|||||
|
Fee and other income
(2)
|
1,005
|
|
189
|
|
1,194
|
|
77
|
|
98
|
|
175
|
|
|||||||||||
|
Net revenues
|
5,632
|
|
836
|
|
6,468
|
|
4,934
|
|
676
|
|
5,610
|
|
|||||||||||
|
Investment gains, net
(3)
|
286
|
|
27
|
|
313
|
|
399
|
|
68
|
|
467
|
|
|||||||||||
|
Fair value gains (losses), net
(4)
|
(300
|
)
|
11
|
|
(289
|
)
|
(499
|
)
|
8
|
|
(491
|
)
|
|||||||||||
|
Administrative expenses
|
(580
|
)
|
(84
|
)
|
(664
|
)
|
(582
|
)
|
(79
|
)
|
(661
|
)
|
|||||||||||
|
Credit-related income
(5)
|
|||||||||||||||||||||||
|
Benefit (provision) for credit losses
|
(137
|
)
|
(45
|
)
|
(182
|
)
|
646
|
|
27
|
|
673
|
|
|||||||||||
|
Foreclosed property income (expense)
|
(157
|
)
|
17
|
|
(140
|
)
|
(114
|
)
|
4
|
|
(110
|
)
|
|||||||||||
|
Total credit-related income (expense)
|
(294
|
)
|
(28
|
)
|
(322
|
)
|
532
|
|
31
|
|
563
|
|
|||||||||||
|
TCCA fees
(6)
|
(531
|
)
|
—
|
|
(531
|
)
|
(465
|
)
|
—
|
|
(465
|
)
|
|||||||||||
|
Other expenses, net
|
(320
|
)
|
(107
|
)
|
(427
|
)
|
(275
|
)
|
(25
|
)
|
(300
|
)
|
|||||||||||
|
Income before federal income taxes
|
3,893
|
|
655
|
|
4,548
|
|
4,044
|
|
679
|
|
4,723
|
|
|||||||||||
|
Provision for federal income taxes
|
(1,361
|
)
|
(164
|
)
|
(1,525
|
)
|
(1,399
|
)
|
(128
|
)
|
(1,527
|
)
|
|||||||||||
|
Net income
|
$
|
2,532
|
|
$
|
491
|
|
$
|
3,023
|
|
$
|
2,645
|
|
$
|
551
|
|
$
|
3,196
|
|
|||||
|
For the Nine Months Ended September 30,
|
|||||||||||||||||||||||
|
2017
|
2016
|
||||||||||||||||||||||
|
Single-Family
|
Multifamily
|
Total
|
Single-Family
|
Multifamily
|
Total
|
||||||||||||||||||
|
(Dollars in millions)
|
|||||||||||||||||||||||
|
Net interest income
(1)
|
$
|
13,749
|
|
$
|
1,873
|
|
$
|
15,622
|
|
$
|
13,832
|
|
$
|
1,658
|
|
$
|
15,490
|
|
|||||
|
Fee and other income
(2)
|
1,192
|
|
604
|
|
1,796
|
|
222
|
|
330
|
|
552
|
|
|||||||||||
|
Net revenues
|
14,941
|
|
2,477
|
|
17,418
|
|
14,054
|
|
1,988
|
|
16,042
|
|
|||||||||||
|
Investment gains, net
(3)
|
557
|
|
132
|
|
689
|
|
735
|
|
199
|
|
934
|
|
|||||||||||
|
Fair value gains (losses), net
(4)
|
(997
|
)
|
(23
|
)
|
(1,020
|
)
|
(5,028
|
)
|
57
|
|
(4,971
|
)
|
|||||||||||
|
Administrative expenses
|
(1,781
|
)
|
(253
|
)
|
(2,034
|
)
|
(1,788
|
)
|
(239
|
)
|
(2,027
|
)
|
|||||||||||
|
Credit-related income
(5)
|
|||||||||||||||||||||||
|
Benefit (provision) for credit losses
|
1,518
|
|
(37
|
)
|
1,481
|
|
3,405
|
|
53
|
|
3,458
|
|
|||||||||||
|
Foreclosed property income (expense)
|
(405
|
)
|
14
|
|
(391
|
)
|
(510
|
)
|
3
|
|
(507
|
)
|
|||||||||||
|
Total credit-related income (expense)
|
1,113
|
|
(23
|
)
|
1,090
|
|
2,895
|
|
56
|
|
2,951
|
|
|||||||||||
|
TCCA fees
(6)
|
(1,552
|
)
|
—
|
|
(1,552
|
)
|
(1,358
|
)
|
—
|
|
(1,358
|
)
|
|||||||||||
|
Other expenses, net
|
(731
|
)
|
(369
|
)
|
(1,100
|
)
|
(773
|
)
|
(45
|
)
|
(818
|
)
|
|||||||||||
|
Income before federal income taxes
|
11,550
|
|
1,941
|
|
13,491
|
|
8,737
|
|
2,016
|
|
10,753
|
|
|||||||||||
|
Provision for federal income taxes
|
(4,014
|
)
|
(481
|
)
|
(4,495
|
)
|
(3,042
|
)
|
(433
|
)
|
(3,475
|
)
|
|||||||||||
|
Net income
|
$
|
7,536
|
|
$
|
1,460
|
|
$
|
8,996
|
|
$
|
5,695
|
|
$
|
1,583
|
|
$
|
7,278
|
|
|||||
__________
|
(1)
|
Net interest income primarily consists of guaranty fees received as compensation for assuming and managing the credit risk on loans underlying Fannie Mae MBS held by third parties for the respective business segment, and the difference between the interest income earned on the respective business segment’s mortgage assets in our retained mortgage portfolio and the interest expense associated with the debt funding those assets. Revenues from single-family guaranty fees include revenues generated by the 10 basis point increase in guaranty fees we implemented in 2012 pursuant to TCCA.
|
|
Fannie Mae (In conservatorship) Third Quarter 2017 Form 10-Q
|
92
|
|
|
Notes to Condensed Consolidated Financial Statements | Segment Reporting
|
||
|
(2)
|
Single-Family fee and other income primarily consists of compensation for engaging in structured transactions and providing other lender services, and income resulting from settlement agreements resolving legal claims related to private-label securities we purchased or that we have guaranteed. Multifamily fee and other income consists of fees associated with multifamily business activities, including yield maintenance income.
|
|
(3)
|
Investment gains and losses primarily consists of gains and losses on the sale of mortgage assets for the respective business segment.
|
|
(4)
|
Single-Family fair value gains and losses primarily consist of fair value gains and losses on risk management and mortgage commitment derivatives, trading securities and other financial instruments associated with our single-family mortgage credit book of business. Multifamily fair value gains and losses primarily consist of fair value gains and losses on MBS commitment derivatives, trading securities and other financial instruments associated with our multifamily mortgage credit book of business.
|
|
(5)
|
Credit-related income or expense is based on the guaranty book of business of the respective business segment and consists of the applicable segment’s benefit or provision for credit losses and foreclosed property expense on loans underlying the segment’s guaranty book of business.
|
|
(6)
|
Consists of the portion of our single-family guaranty fees that is remitted to Treasury pursuant to the TCCA.
|
11
.
Equity
The following table displays the activity in other comprehensive income (loss), net of tax, by major categories.
|
For the Three Months Ended September 30,
|
For the Nine Months Ended September 30,
|
||||||||||||||
|
2017
|
2016
|
2017
|
2016
|
||||||||||||
|
(Dollars in millions)
|
|||||||||||||||
|
Net income
|
$
|
3,023
|
|
$
|
3,196
|
|
$
|
8,996
|
|
$
|
7,278
|
|
|||
|
Other comprehensive income (loss), net of tax effect:
|
|||||||||||||||
|
Changes in net unrealized gains (losses) on AFS securities (net of tax of $25 and $18, respectively, for the three months ended and net of tax of $36 and $3, respectively, for the nine months ended)
|
47
|
|
33
|
|
67
|
|
(6
|
)
|
|||||||
|
Reclassification adjustment for OTTI recognized in net income (net of tax of $1 and $1, respectively, for the three months ended and net of tax of $1 and $12, respectively, for the nine months ended)
|
1
|
|
2
|
|
2
|
|
22
|
|
|||||||
|
Reclassification adjustment for gains on AFS securities included in net income (net of tax of $11 and $129, respectively, for the three months ended and net of tax of $62 and $266, respectively, for the nine months ended)
|
(21
|
)
|
(240
|
)
|
(115
|
)
|
(494
|
)
|
|||||||
|
Other
|
(2
|
)
|
(2
|
)
|
(6
|
)
|
(6
|
)
|
|||||||
|
Total other comprehensive income (loss)
|
25
|
|
(207
|
)
|
(52
|
)
|
(484
|
)
|
|||||||
|
Total comprehensive income
|
$
|
3,048
|
|
$
|
2,989
|
|
$
|
8,944
|
|
$
|
6,794
|
|
|||
The following table displays our accumulated other comprehensive income, net of tax, by major categories.
|
As of
|
|||||||||||
|
September 30,
|
December 31,
|
||||||||||
|
2017
|
2016
|
||||||||||
|
(Dollars in millions)
|
|||||||||||
|
Net unrealized gains on AFS securities for which we have not recorded OTTI
|
$
|
102
|
|
$
|
135
|
|
|||||
|
Net unrealized gains on AFS securities for which we have recorded OTTI
|
568
|
|
581
|
|
|||||||
|
Other
|
37
|
|
43
|
|
|||||||
|
Accumulated other comprehensive income
|
$
|
707
|
|
$
|
759
|
|
|||||
|
Fannie Mae (In conservatorship) Third Quarter 2017 Form 10-Q
|
93
|
|
|
Notes to Condensed Consolidated Financial Statements | Equity
|
||
The table below displays changes in accumulated other comprehensive income, net of tax.
|
For the Three Months Ended September 30,
|
For the Nine Months Ended September 30,
|
||||||||||||||||||||||||||||||||||||||||||||||
|
2017
|
2016
|
2017
|
2016
|
||||||||||||||||||||||||||||||||||||||||||||
|
AFS
(1)
|
Other
|
Total
|
AFS
(1)
|
Other
|
Total
|
AFS
(1)
|
Other
|
Total
|
AFS
(1)
|
Other
|
Total
|
||||||||||||||||||||||||||||||||||||
|
(Dollars in millions)
|
|||||||||||||||||||||||||||||||||||||||||||||||
|
Beginning balance
|
$
|
643
|
|
$
|
39
|
|
$
|
682
|
|
$
|
1,085
|
|
$
|
45
|
|
$
|
1,130
|
|
$
|
716
|
|
$
|
43
|
|
$
|
759
|
|
$
|
1,358
|
|
$
|
49
|
|
$
|
1,407
|
|
|||||||||||
|
Other comprehensive income (loss) before reclassifications
|
47
|
|
—
|
|
47
|
|
33
|
|
—
|
|
33
|
|
67
|
|
—
|
|
67
|
|
(6
|
)
|
—
|
|
(6
|
)
|
|||||||||||||||||||||||
|
Amounts reclassified from other comprehensive income (loss)
|
(20
|
)
|
(2
|
)
|
(22
|
)
|
(238
|
)
|
(2
|
)
|
(240
|
)
|
(113
|
)
|
(6
|
)
|
(119
|
)
|
(472
|
)
|
(6
|
)
|
(478
|
)
|
|||||||||||||||||||||||
|
Net other comprehensive income (loss)
|
27
|
|
(2
|
)
|
25
|
|
(205
|
)
|
(2
|
)
|
(207
|
)
|
(46
|
)
|
(6
|
)
|
(52
|
)
|
(478
|
)
|
(6
|
)
|
(484
|
)
|
|||||||||||||||||||||||
|
Ending balance
|
$
|
670
|
|
$
|
37
|
|
$
|
707
|
|
$
|
880
|
|
$
|
43
|
|
$
|
923
|
|
$
|
670
|
|
$
|
37
|
|
$
|
707
|
|
$
|
880
|
|
$
|
43
|
|
$
|
923
|
|
|||||||||||
__________
|
(1)
|
The amounts reclassified from accumulated other comprehensive income represent the gain or loss recognized in earnings due to a sale of an AFS security or the recognition of a net impairment recognized in earnings, which are recorded in “
Investment gains, net
” in our condensed consolidated statements of operations and comprehensive income.
|
12
.
Concentrations of Credit Risk
Risk Characteristics of our Guaranty Book of Business
One of the measures by which we gauge our performance risk under our guaranty is the delinquency status of the mortgage loans we hold in our retained mortgage portfolio, or in the case of mortgage-backed securities, the mortgage loans underlying the related securities.
For single-family loans, management monitors the serious delinquency rate, which is the percentage of single-family loans
90
days or more past due or in the foreclosure process, and loans that have higher risk characteristics, such as high mark-to-market LTV ratios.
For multifamily loans, management monitors the serious delinquency rate, which is the percentage of loans, based on unpaid principal balance, that are
60
days or more past due, and other loans that have higher risk characteristics, to determine our overall credit quality indicator. Higher risk characteristics include, but are not limited to, current debt service coverage ratio (“DSCR”) below
1.0
and high original LTV ratios. We stratify multifamily loans into different internal risk categories based on the credit risk inherent in each individual loan.
For single-family and multifamily loans, we use this information, in conjunction with housing market and economic conditions, to structure our pricing and our eligibility and underwriting criteria to reflect the current risk of loans with these higher-risk characteristics, and in some cases we decide to significantly reduce our participation in riskier loan product categories. Management also uses this data together with other credit risk measures to identify key trends that guide the development of our loss mitigation strategies.
The following tables display the delinquency status and serious delinquency rates for specified loan categories of our single-family conventional and total multifamily guaranty book of business.
|
As of
|
|||||||||||||||||
|
September 30, 2017
(1)
|
December 31, 2016
(1)
|
||||||||||||||||
|
30 Days Delinquent
|
60 Days Delinquent
|
Seriously Delinquent
(2)
|
30 Days Delinquent
|
60 Days Delinquent
|
Seriously Delinquent
(2)
|
||||||||||||
|
Percentage of single-family conventional guaranty book of business
(3)
|
1.42
|
%
|
0.34
|
%
|
0.95
|
%
|
1.30
|
%
|
0.36
|
%
|
1.18
|
%
|
|||||
|
Percentage of single-family conventional loans
(4)
|
1.63
|
|
0.40
|
|
1.01
|
|
1.51
|
|
0.41
|
|
1.20
|
|
|||||
|
Fannie Mae (In conservatorship) Third Quarter 2017 Form 10-Q
|
94
|
|
|
Notes to Condensed Consolidated Financial Statements | Concentrations of Credit Risk
|
||
|
As of
|
|||||||||||
|
September 30, 2017
(1)
|
December 31, 2016
(1)
|
||||||||||
|
Percentage of
Single-Family
Conventional
Guaranty Book of Business
(3)
|
Seriously Delinquent Rate
(2)
|
Percentage of
Single-Family
Conventional
Guaranty Book of Business
(3)
|
Seriously Delinquent Rate
(2)
|
||||||||
|
Estimated mark-to-market loan-to-value ratio:
|
|||||||||||
|
Greater than 100%
|
1
|
%
|
10.73
|
%
|
2
|
%
|
10.44
|
%
|
|||
|
Geographical distribution:
|
|||||||||||
|
California
|
19
|
|
0.43
|
|
19
|
|
0.50
|
|
|||
|
Florida
|
6
|
|
1.50
|
|
6
|
|
1.89
|
|
|||
|
New Jersey
|
4
|
|
2.36
|
|
4
|
|
3.07
|
|
|||
|
New York
|
5
|
|
2.13
|
|
5
|
|
2.65
|
|
|||
|
All other states
|
66
|
|
0.94
|
|
66
|
|
1.11
|
|
|||
|
Product distribution:
|
|||||||||||
|
Alt-A
|
3
|
|
4.54
|
|
3
|
|
5.00
|
|
|||
|
Vintages:
|
|||||||||||
|
2004 and prior
|
4
|
|
2.75
|
|
5
|
|
2.82
|
|
|||
|
2005-2008
|
7
|
|
5.83
|
|
8
|
|
6.39
|
|
|||
|
2009-2017
|
89
|
|
0.33
|
|
87
|
|
0.36
|
|
|||
__________
|
(1)
|
Consists of the portion of our single-family conventional guaranty book of business for which we have detailed loan level information, which constituted approximately
99%
of our total single-family conventional guaranty book of business as of
September 30, 2017
and
December 31, 2016
.
|
|
(2)
|
Consists of single-family conventional loans that were
90
days or more past due or in the foreclosure process as of
September 30, 2017
and
December 31, 2016
.
|
|
(3)
|
Calculated based on the aggregate unpaid principal balance of single-family conventional loans for each category divided by the aggregate unpaid principal balance of loans in our single-family conventional guaranty book of business.
|
|
(4)
|
Calculated based on the number of single-family conventional loans that were delinquent divided by the total number of loans in our single-family conventional guaranty book of business.
|
|
As of
|
|||||||||||
|
September 30, 2017
(1)(2)
|
December 31, 2016
(1)(2)
|
||||||||||
|
30 Days Delinquent
|
Seriously Delinquent
(3)
|
30 Days Delinquent
|
Seriously Delinquent
(3)
|
||||||||
|
Percentage of multifamily guaranty book of business
|
0.02
|
%
|
0.03
|
%
|
0.02
|
%
|
0.05
|
%
|
|||
|
As of
|
|||||||||||
|
September 30, 2017
(1)
|
December 31, 2016
(1)
|
||||||||||
|
Percentage of Multifamily Guaranty Book of Business
(2)
|
Percentage Seriously Delinquent
(3)(4)
|
Percentage of Multifamily Guaranty Book of Business
(2)
|
Percentage Seriously Delinquent
(3)(4)
|
||||||||
|
Original LTV ratio:
|
|||||||||||
|
Greater than 80%
|
2
|
%
|
0.09
|
%
|
2
|
%
|
0.22
|
%
|
|||
|
Less than or equal to 80%
|
98
|
|
0.03
|
|
98
|
|
0.05
|
|
|||
|
Current DSCR less than 1.0
(5)
|
1
|
|
1.36
|
|
2
|
|
1.96
|
|
|||
__________
|
(1)
|
Consists of the portion of our multifamily guaranty book of business for which we have detailed loan level information, which constituted approximately
99%
of our total multifamily guaranty book of business as of
September 30, 2017
and
December 31, 2016
, excluding loans that have been defeased.
|
|
(2)
|
Calculated based on the aggregate unpaid principal balance of multifamily loans for each category divided by the aggregate unpaid principal balance of loans in our multifamily guaranty book of business.
|
|
(3)
|
Consists of multifamily loans that were
60
days or more past due as of the dates indicated.
|
|
Fannie Mae (In conservatorship) Third Quarter 2017 Form 10-Q
|
95
|
|
|
Notes to Condensed Consolidated Financial Statements | Concentrations of Credit Risk
|
||
|
(4)
|
Calculated based on the unpaid principal balance of multifamily loans that were seriously delinquent divided by the aggregate unpaid principal balance of multifamily loans for each category included in our guaranty book of business.
|
|
(5)
|
Our estimates of current DSCRs are based on the latest available income information for these properties. Although we use the most recently available results of our multifamily borrowers, there is a lag in reporting, which typically can range from
3
to
6
months but in some cases may be longer.
|
Other Concentrations
Mortgage Sellers and Servicers.
Mortgage servicers collect mortgage and escrow payments from borrowers, pay taxes and insurance costs from escrow accounts, monitor and report delinquencies, and perform other required activities on our behalf. Our mortgage sellers and servicers may also be obligated to repurchase loans or foreclosed properties, reimburse us for losses or provide other remedies under certain circumstances, such as if it is determined that the mortgage loan did not meet our underwriting or eligibility requirements, if certain loan representations and warranties are violated or if mortgage insurers rescind coverage. However, under our revised representation and warranty framework, we no longer require repurchase for loans that have breaches of certain selling representations and warranties if they have met specified criteria for relief. Our business with mortgage servicers is concentrated. Our
five
largest single-family mortgage servicers, including their affiliates, serviced approximately
41%
of our single-family guaranty book of business as of
September 30, 2017
, compared with approximately
39%
as of
December 31, 2016
. Our
five
largest multifamily mortgage servicers, including their affiliates, serviced approximately
47%
of our multifamily guaranty book of business as of
September 30, 2017
and
December 31, 2016
.
If a significant mortgage seller or servicer counterparty, or a number of mortgage sellers or servicers, fails to meet their obligations to us, it could increase our credit losses and credit-related expense, and adversely affect our results of operations and financial condition.
Mortgage Insurers.
Mortgage insurance “risk in force” generally represents our maximum potential loss recovery under the applicable mortgage insurance policies. We had total mortgage insurance coverage risk in force of
$135.4 billion
and
$126.2 billion
on the single-family mortgage loans in our guaranty book of business as of
September 30, 2017
and
December 31, 2016
, respectively, which represented
5%
and
4%
of our single-family guaranty book of business as of
September 30, 2017
and
December 31, 2016
, respectively. Our primary mortgage insurance coverage risk in force was
$134.9 billion
and
$125.6 billion
as of
September 30, 2017
and
December 31, 2016
, respectively. Our pool mortgage insurance coverage risk in force was
$540 million
and
$617 million
as of
September 30, 2017
and
December 31, 2016
, respectively. Our top
three
mortgage insurance companies provided
65%
of our mortgage insurance coverage risk in force as of
September 30, 2017
and
66%
of our mortgage insurance coverage risk in force as of
December 31, 2016
. Mortgage insurance does not cover losses if the borrower's default is principally caused by damage to the underlying property, including when the damage is caused by natural disaster, like the recent hurricanes.
Of our largest primary mortgage insurers, PMI Mortgage Insurance Co., Triad Guaranty Insurance Corporation and Republic Mortgage Insurance Company are under various forms of supervised control by their state regulators and are in run-off. Entering run-off may close off a source of profits and liquidity that may have otherwise assisted a mortgage insurer in paying claims under insurance policies, and could also cause the quality and speed of its claims processing to deteriorate. These
three
mortgage insurers provided a combined
$6.6 billion
, or
5%
, of our risk in force mortgage insurance coverage of our single-family guaranty book of business as of
September 30, 2017
.
We have counterparty credit risk relating to the potential insolvency of, or non-performance by, mortgage insurers that insure single-family loans we purchase or guarantee. There is risk that these counterparties may fail to fulfill their obligations to pay our claims under insurance policies. If we determine that it is probable that we will not collect all of our claims from one or more of our mortgage insurer counterparties, it could increase our loss reserves, which could adversely affect our results of operations, liquidity, financial condition and net worth.
When we estimate the credit losses that are inherent in our mortgage loans and under the terms of our guaranty obligations we also consider the recoveries that we will receive on primary mortgage insurance, as mortgage insurance recoveries would reduce the severity of the loss associated with defaulted loans. We evaluate the financial condition of our mortgage insurer counterparties and adjust the contractually due recovery amounts to ensure that only probable losses as of the balance sheet date are included in our loss reserve estimate. As a result, if our assessment of one or more of our mortgage insurer counterparties’ ability to fulfill their respective obligations to us worsens, it could increase our combined loss reserves. As of
September 30, 2017
and
|
Fannie Mae (In conservatorship) Third Quarter 2017 Form 10-Q
|
96
|
|
|
Notes to Condensed Consolidated Financial Statements | Concentrations of Credit Risk
|
||
December 31, 2016
, the amount by which our estimated benefit from mortgage insurance reduced our combined loss reserves was
$1.0 billion
and
$1.4 billion
, respectively.
We had outstanding receivables of
$875 million
recorded in “Other assets” in our condensed consolidated balance sheets as of
September 30, 2017
and
$1.0 billion
as of
December 31, 2016
related to amounts claimed on insured, defaulted loans excluding government-insured loans. Of this amount,
$84 million
as of
September 30, 2017
and
$141 million
as of
December 31, 2016
was due from our mortgage sellers or servicers. We assessed the total outstanding receivables for collectibility, and they are recorded net of a valuation allowance of
$596 million
as of
September 30, 2017
and
$638 million
as of
December 31, 2016
. The valuation allowance reduces our claim receivable to the amount which is considered probable of collection as of
September 30, 2017
and
December 31, 2016
.
For information on credit risk associated with our derivative transactions and repurchase agreements refer to “
Note 8, Derivative Instruments
” and “
Note 13, Netting Arrangements
.”
13
.
Netting Arrangements
We use master netting arrangements, which allow us to offset certain financial instruments and collateral with the same counterparty, to minimize counterparty credit exposure. The tables below display information related to derivatives, securities purchased under agreements to resell or similar arrangements, and securities sold under agreements to repurchase or similar arrangements, which are subject to an enforceable master netting arrangement or similar agreement that are either offset or not offset in our condensed consolidated balance sheets.
|
As of September 30, 2017
|
|||||||||||||||||||||||||||
|
Net Amount Presented in our Condensed Consolidated Balance Sheets
|
Amounts Not Offset in our Condensed Consolidated Balance Sheets
|
||||||||||||||||||||||||||
|
Gross Amount
|
Gross Amount Offset
(1)
|
Financial Instruments
(2)
|
Collateral
(3)
|
Net Amount
|
|||||||||||||||||||||||
|
(Dollars in millions)
|
|||||||||||||||||||||||||||
|
Assets:
|
|||||||||||||||||||||||||||
|
OTC risk management derivatives
|
$
|
2,504
|
|
$
|
(2,478
|
)
|
$
|
26
|
|
$
|
—
|
|
$
|
—
|
|
$
|
26
|
|
|||||||||
|
Cleared risk management derivatives
|
1,570
|
|
(1,556
|
)
|
14
|
|
—
|
|
—
|
|
14
|
|
|||||||||||||||
|
Mortgage commitment derivatives
|
221
|
|
—
|
|
221
|
|
(154
|
)
|
(11
|
)
|
56
|
|
|||||||||||||||
|
Total derivative assets
|
4,295
|
|
(4,034
|
)
|
261
|
|
(4)
|
(154
|
)
|
(11
|
)
|
96
|
|
||||||||||||||
|
Securities purchased under agreements to resell or similar arrangements
(5)
|
40,490
|
|
—
|
|
40,490
|
|
—
|
|
(40,490
|
)
|
—
|
|
|||||||||||||||
|
Total assets
|
$
|
44,785
|
|
$
|
(4,034
|
)
|
$
|
40,751
|
|
$
|
(154
|
)
|
$
|
(40,501
|
)
|
$
|
96
|
|
|||||||||
|
Liabilities:
|
|||||||||||||||||||||||||||
|
OTC risk management derivatives
|
$
|
(3,292
|
)
|
$
|
3,181
|
|
$
|
(111
|
)
|
$
|
—
|
|
$
|
—
|
|
$
|
(111
|
)
|
|||||||||
|
Cleared risk management derivatives
|
(1,711
|
)
|
1,696
|
|
(15
|
)
|
—
|
|
15
|
|
—
|
|
|||||||||||||||
|
Mortgage commitment derivatives
|
(210
|
)
|
—
|
|
(210
|
)
|
154
|
|
—
|
|
(56
|
)
|
|||||||||||||||
|
Total derivative liabilities
|
(5,213
|
)
|
4,877
|
|
(336
|
)
|
(4)
|
154
|
|
15
|
|
(167
|
)
|
||||||||||||||
|
Securities sold under agreements to repurchase or similar arrangements
|
(81
|
)
|
—
|
|
(81
|
)
|
—
|
|
81
|
|
—
|
|
|||||||||||||||
|
Total liabilities
|
$
|
(5,294
|
)
|
$
|
4,877
|
|
$
|
(417
|
)
|
$
|
154
|
|
$
|
96
|
|
$
|
(167
|
)
|
|||||||||
|
Fannie Mae (In conservatorship) Third Quarter 2017 Form 10-Q
|
97
|
|
|
Notes to Condensed Consolidated Financial Statements | Netting Arrangements
|
||
|
As of December 31, 2016
|
|||||||||||||||||||||||||||
|
Net Amount Presented in our Condensed Consolidated Balance Sheets
|
Amounts Not Offset in our Condensed Consolidated Balance Sheets
|
||||||||||||||||||||||||||
|
Gross Amount
|
Gross Amount Offset
(1)
|
Financial Instruments
(2)
|
Collateral
(3)
|
Net Amount
|
|||||||||||||||||||||||
|
(Dollars in millions)
|
|||||||||||||||||||||||||||
|
Assets:
|
|||||||||||||||||||||||||||
|
OTC risk management derivatives
|
$
|
3,688
|
|
$
|
(3,667
|
)
|
$
|
21
|
|
$
|
—
|
|
$
|
—
|
|
$
|
21
|
|
|||||||||
|
Cleared risk management derivatives
|
849
|
|
(847
|
)
|
2
|
|
—
|
|
—
|
|
2
|
|
|||||||||||||||
|
Mortgage commitment derivatives
|
631
|
|
—
|
|
631
|
|
(357
|
)
|
(22
|
)
|
252
|
|
|||||||||||||||
|
Total derivative assets
|
5,168
|
|
(4,514
|
)
|
654
|
|
(4)
|
(357
|
)
|
(22
|
)
|
275
|
|
||||||||||||||
|
Securities purchased under agreements to resell or similar arrangements
(5)
|
51,115
|
|
—
|
|
51,115
|
|
—
|
|
(51,115
|
)
|
—
|
|
|||||||||||||||
|
Total assets
|
$
|
56,283
|
|
$
|
(4,514
|
)
|
$
|
51,769
|
|
$
|
(357
|
)
|
$
|
(51,137
|
)
|
$
|
275
|
|
|||||||||
|
Liabilities:
|
|||||||||||||||||||||||||||
|
OTC risk management derivatives
|
$
|
(4,905
|
)
|
$
|
4,520
|
|
$
|
(385
|
)
|
$
|
—
|
|
$
|
—
|
|
$
|
(385
|
)
|
|||||||||
|
Cleared risk management derivatives
|
(2,415
|
)
|
2,324
|
|
(91
|
)
|
—
|
|
91
|
|
—
|
|
|||||||||||||||
|
Mortgage commitment derivatives
|
(737
|
)
|
—
|
|
(737
|
)
|
357
|
|
16
|
|
(364
|
)
|
|||||||||||||||
|
Total derivative liabilities
|
(8,057
|
)
|
6,844
|
|
(1,213
|
)
|
(4)
|
357
|
|
107
|
|
(749
|
)
|
||||||||||||||
|
Total liabilities
|
$
|
(8,057
|
)
|
$
|
6,844
|
|
$
|
(1,213
|
)
|
$
|
357
|
|
$
|
107
|
|
$
|
(749
|
)
|
|||||||||
__________
|
(1)
|
Represents the effect of the right to offset under legally enforceable master netting arrangements to settle with the same counterparty on a net basis, including cash collateral posted and received and accrued interest.
|
|
(2)
|
Mortgage commitment derivative amounts reflect where we have recognized both an asset and a liability with the same counterparty under an enforceable master netting arrangement but we have not elected to offset the related amounts in our condensed consolidated balance sheets.
|
|
(3)
|
Represents collateral received that has not been recognized and not offset in our condensed consolidated balance sheets as well as collateral posted which has been recognized but not offset in our condensed consolidated balance sheets. Does not include collateral held or posted in excess of our exposure. The fair value of non-cash collateral we pledged was
$808 million
and
$1.3 billion
as of
September 30, 2017
and
December 31, 2016
, respectively, which the counterparty was permitted to sell or repledge. The fair value of non-cash collateral received was
$40.5 billion
and
$51.2 billion
, of which
$38.3 billion
and
$45.5 billion
could be sold or repledged as of
September 30, 2017
and
December 31, 2016
, respectively.
None
of the underlying collateral was sold or repledged as of
September 30, 2017
and
December 31, 2016
.
|
|
(4)
|
Excludes derivative assets of
$23 million
and
$33 million
as of
September 30, 2017
and
December 31, 2016
, respectively, and derivative liabilities of
$1 million
and
$2 million
recognized in our condensed consolidated balance sheets as of
September 30, 2017
and
December 31, 2016
, respectively, that are not subject to enforceable master netting arrangements.
|
|
(5)
|
Includes
$16.8 billion
and
$20.7 billion
of securities purchased under agreements to resell classified as “Cash and cash equivalents” in our condensed consolidated balance sheets as of
September 30, 2017
and
December 31, 2016
, respectively.
|
Derivative instruments are recorded at fair value and securities purchased under agreements to resell or similar arrangements are recorded at amortized cost in our condensed consolidated balance sheets.
We determine our rights to offset the assets and liabilities presented above with the same counterparty, including collateral posted or received, based on the contractual arrangements entered into with our individual counterparties and various rules and regulations that would govern the insolvency of a derivative counterparty. The following is a description, under various agreements, of the nature of those rights and their effect or potential effect on our financial position.
The terms of the majority of our contracts for OTC risk management derivatives are governed under master agreements of the International Swaps and Derivatives Association Inc. (“ISDA”). These agreements provide that all transactions entered into under the agreement with the counterparty constitute a single contractual relationship. An event of default by the counterparty allows the early termination of all outstanding transactions
|
Fannie Mae (In conservatorship) Third Quarter 2017 Form 10-Q
|
98
|
|
|
Notes to Condensed Consolidated Financial Statements | Netting Arrangements
|
||
under the same ISDA agreement and we may offset all outstanding amounts related to the terminated transactions including collateral posted or received.
The terms of our contracts for cleared derivatives are governed under the rules of the clearing organization and the agreement between us and the clearing member of that clearing organization. In the event of a clearing organization default, all open positions at the clearing organization are closed and a net position (on a clearing member by clearing member basis) is calculated. Unless otherwise transferred, in the event of a clearing member default, all open positions cleared through that clearing member are closed and a net position is calculated.
The terms of our contracts for mortgage commitment derivatives are primarily governed by the Fannie Mae Single-Family Selling Guide (“Guide”), for Fannie Mae-approved lenders, or Master Securities Forward Transaction Agreements (“MSFTA”), for counterparties that are not Fannie Mae-approved lenders. In the event of default by the counterparty, both the Guide and the MSFTA allow us to terminate all outstanding transactions under the applicable agreement and offset all outstanding amounts related to the terminated transactions including collateral posted or received. Under the Guide, upon a lender event of default, we generally may offset any amounts owed to a lender against any amounts a lender may owe us under any other existing agreement, regardless of whether or not such other agreements are in default or payments are immediately due.
The terms of our contracts for securities purchased under agreements to resell and securities sold under agreements to repurchase are governed by Master Repurchase Agreements, which are based on the guidelines prescribed by the Securities Industry and Financial Markets Association. Master Repurchase Agreements provide that all transactions under the agreement constitute a single contractual relationship. An event of default by the counterparty allows the early termination of all outstanding transactions under the same agreement and we may offset all outstanding amounts related to the terminated transactions including collateral posted or received.
We also have securities purchased under agreements to resell which we transact through the Fixed Income Clearing Corporation (“FICC”). Under the rules of the FICC, all agreements for securities purchased under agreements to resell that are submitted to the FICC for clearing become transactions with the FICC that are subject to FICC clearing rules. In the event of a FICC default, all open positions at the FICC are closed and a net position is calculated.
14
.
Fair Value
We use fair value measurements for the initial recording of certain assets and liabilities and periodic remeasurement of certain assets and liabilities on a recurring or nonrecurring basis.
Fair Value Measurement
Fair value measurement guidance defines fair value, establishes a framework for measuring fair value, and sets forth disclosures around fair value measurements. This guidance applies whenever other accounting guidance requires or permits assets or liabilities to be measured at fair value. The guidance establishes a three-level fair value hierarchy that prioritizes the inputs into the valuation techniques used to measure fair value. The fair value hierarchy gives the highest priority, Level 1, to measurements based on unadjusted quoted prices in active markets for identical assets or liabilities. The next highest priority, Level 2, is given to measurements of assets and liabilities based on limited observable inputs or observable inputs for similar assets and liabilities. The lowest priority, Level 3, is given to measurements based on unobservable inputs.
|
Fannie Mae (In conservatorship) Third Quarter 2017 Form 10-Q
|
99
|
|
|
Notes to Condensed Consolidated Financial Statements | Fair Value
|
||
Recurring Changes in Fair Value
The following tables display our assets and liabilities measured in our condensed consolidated balance sheets at fair value on a recurring basis subsequent to initial recognition, including instruments for which we have elected the fair value option.
|
Fair Value Measurements as of September 30, 2017
|
|||||||||||||||||||||||||||||
|
Quoted Prices in Active Markets for Identical Assets (Level 1)
|
Significant Other Observable Inputs
(Level 2)
|
Significant Unobservable Inputs
(Level 3)
|
Netting Adjustment
(1)
|
Estimated Fair Value
|
|||||||||||||||||||||||||
|
(Dollars in millions)
|
|||||||||||||||||||||||||||||
|
Recurring fair value measurements:
|
|||||||||||||||||||||||||||||
|
Assets:
|
|||||||||||||||||||||||||||||
|
Trading securities:
|
|
|
|||||||||||||||||||||||||||
|
Mortgage-related securities:
|
|
|
|||||||||||||||||||||||||||
|
Fannie Mae
|
$
|
—
|
|
$
|
2,214
|
|
$
|
1,886
|
|
$
|
—
|
|
$
|
4,100
|
|
||||||||||||||
|
Other agency
|
—
|
|
1,428
|
|
—
|
|
—
|
|
1,428
|
|
|||||||||||||||||||
|
Alt-A and subprime private-label securities
|
—
|
|
296
|
|
253
|
|
—
|
|
549
|
|
|||||||||||||||||||
|
CMBS
|
—
|
|
9
|
|
—
|
|
—
|
|
9
|
|
|||||||||||||||||||
|
Mortgage revenue bonds
|
—
|
|
—
|
|
1
|
|
—
|
|
1
|
|
|||||||||||||||||||
|
Non-mortgage-related securities:
|
|||||||||||||||||||||||||||||
|
U.S. Treasury securities
|
30,799
|
|
—
|
|
—
|
|
—
|
|
30,799
|
|
|||||||||||||||||||
|
Total trading securities
|
30,799
|
|
3,947
|
|
2,140
|
|
—
|
|
36,886
|
|
|||||||||||||||||||
|
Available-for-sale securities:
|
|||||||||||||||||||||||||||||
|
Mortgage-related securities:
|
|||||||||||||||||||||||||||||
|
Fannie Mae
|
—
|
|
2,012
|
|
196
|
|
—
|
|
2,208
|
|
|||||||||||||||||||
|
Other agency
|
—
|
|
391
|
|
—
|
|
—
|
|
391
|
|
|||||||||||||||||||
|
Alt-A and subprime private-label securities
|
—
|
|
1,854
|
|
180
|
|
—
|
|
2,034
|
|
|||||||||||||||||||
|
CMBS
|
—
|
|
182
|
|
—
|
|
—
|
|
182
|
|
|||||||||||||||||||
|
Mortgage revenue bonds
|
—
|
|
—
|
|
749
|
|
—
|
|
749
|
|
|||||||||||||||||||
|
Other
|
—
|
|
29
|
|
370
|
|
—
|
|
399
|
|
|||||||||||||||||||
|
Total available-for-sale securities
|
—
|
|
4,468
|
|
1,495
|
|
—
|
|
5,963
|
|
|||||||||||||||||||
|
Mortgage loans
|
—
|
|
9,923
|
|
1,090
|
|
—
|
|
11,013
|
|
|||||||||||||||||||
|
Other assets:
|
|||||||||||||||||||||||||||||
|
Risk management derivatives:
|
|||||||||||||||||||||||||||||
|
Swaps
|
—
|
|
3,790
|
|
143
|
|
—
|
|
3,933
|
|
|||||||||||||||||||
|
Swaptions
|
—
|
|
141
|
|
—
|
|
—
|
|
141
|
|
|||||||||||||||||||
|
Other
|
—
|
|
—
|
|
23
|
|
—
|
|
23
|
|
|||||||||||||||||||
|
Netting adjustment
|
—
|
|
—
|
|
—
|
|
(4,034
|
)
|
(4,034
|
)
|
|||||||||||||||||||
|
Mortgage commitment derivatives
|
—
|
|
221
|
|
—
|
|
—
|
|
221
|
|
|||||||||||||||||||
|
Total other assets
|
—
|
|
4,152
|
|
166
|
|
(4,034
|
)
|
284
|
|
|||||||||||||||||||
|
Total assets at fair value
|
$
|
30,799
|
|
$
|
22,490
|
|
$
|
4,891
|
|
$
|
(4,034
|
)
|
$
|
54,146
|
|
||||||||||||||
|
Fannie Mae (In conservatorship) Third Quarter 2017 Form 10-Q
|
100
|
|
|
Notes to Condensed Consolidated Financial Statements | Fair Value
|
||
|
Fair Value Measurements as of September 30, 2017
|
|||||||||||||||||||||||||||||
|
Quoted Prices in Active Markets for Identical Assets (Level 1)
|
Significant Other Observable Inputs
(Level 2)
|
Significant Unobservable Inputs
(Level 3)
|
Netting Adjustment
(1)
|
Estimated Fair Value
|
|||||||||||||||||||||||||
|
|
(Dollars in millions)
|
||||||||||||||||||||||||||||
|
Liabilities:
|
|||||||||||||||||||||||||||||
|
Long-term debt:
|
|||||||||||||||||||||||||||||
|
Of Fannie Mae:
|
|||||||||||||||||||||||||||||
|
Senior floating
|
$
|
—
|
|
$
|
8,122
|
|
$
|
369
|
|
$
|
—
|
|
$
|
8,491
|
|
||||||||||||||
|
Total of Fannie Mae
|
—
|
|
8,122
|
|
369
|
|
—
|
|
8,491
|
|
|||||||||||||||||||
|
Of consolidated trusts
|
—
|
|
32,055
|
|
705
|
|
—
|
|
32,760
|
|
|||||||||||||||||||
|
Total long-term debt
|
—
|
|
40,177
|
|
1,074
|
|
—
|
|
41,251
|
|
|||||||||||||||||||
|
Other liabilities:
|
|||||||||||||||||||||||||||||
|
Risk management derivatives:
|
|||||||||||||||||||||||||||||
|
Swaps
|
—
|
|
4,695
|
|
24
|
|
—
|
|
4,719
|
|
|||||||||||||||||||
|
Swaptions
|
—
|
|
284
|
|
—
|
|
—
|
|
284
|
|
|||||||||||||||||||
|
Other
|
—
|
|
—
|
|
1
|
|
—
|
|
1
|
|
|||||||||||||||||||
|
Netting adjustment
|
—
|
|
—
|
|
—
|
|
(4,877
|
)
|
(4,877
|
)
|
|||||||||||||||||||
|
Mortgage commitment derivatives
|
—
|
|
194
|
|
16
|
|
—
|
|
210
|
|
|||||||||||||||||||
|
Total other liabilities
|
—
|
|
5,173
|
|
41
|
|
(4,877
|
)
|
337
|
|
|||||||||||||||||||
|
Total liabilities at fair value
|
$
|
—
|
|
$
|
45,350
|
|
$
|
1,115
|
|
$
|
(4,877
|
)
|
$
|
41,588
|
|
||||||||||||||
|
Fannie Mae (In conservatorship) Third Quarter 2017 Form 10-Q
|
101
|
|
|
Notes to Condensed Consolidated Financial Statements | Fair Value
|
||
|
Fair Value Measurements as of December 31, 2016
|
|||||||||||||||||||||||||||||
|
Quoted Prices in Active Markets for Identical Assets (Level 1)
|
Significant Other Observable Inputs
(Level 2)
|
Significant Unobservable Inputs
(Level 3)
|
Netting Adjustment
(1)
|
Estimated Fair Value
|
|||||||||||||||||||||||||
|
(Dollars in millions)
|
|||||||||||||||||||||||||||||
|
Assets:
|
|||||||||||||||||||||||||||||
|
Trading securities:
|
|||||||||||||||||||||||||||||
|
Mortgage-related securities:
|
|||||||||||||||||||||||||||||
|
Fannie Mae
|
$
|
—
|
|
$
|
3,934
|
|
$
|
835
|
|
$
|
—
|
|
$
|
4,769
|
|
||||||||||||||
|
Other agency
|
—
|
|
2,058
|
|
—
|
|
—
|
|
2,058
|
|
|||||||||||||||||||
|
Alt-A and subprime private-label securities
|
—
|
|
365
|
|
271
|
|
—
|
|
636
|
|
|||||||||||||||||||
|
CMBS
|
—
|
|
761
|
|
—
|
|
—
|
|
761
|
|
|||||||||||||||||||
|
Mortgage revenue bonds
|
—
|
|
—
|
|
21
|
|
—
|
|
21
|
|
|||||||||||||||||||
|
Non-mortgage-related securities:
|
|||||||||||||||||||||||||||||
|
U.S. Treasury securities
|
32,317
|
|
—
|
|
—
|
|
—
|
|
32,317
|
|
|||||||||||||||||||
|
Total trading securities
|
32,317
|
|
7,118
|
|
1,127
|
|
—
|
|
40,562
|
|
|||||||||||||||||||
|
Available-for-sale securities:
|
|||||||||||||||||||||||||||||
|
Mortgage-related securities:
|
|||||||||||||||||||||||||||||
|
Fannie Mae
|
—
|
|
2,324
|
|
230
|
|
—
|
|
2,554
|
|
|||||||||||||||||||
|
Other agency
|
—
|
|
542
|
|
5
|
|
—
|
|
547
|
|
|||||||||||||||||||
|
Alt-A and subprime private-label securities
|
—
|
|
2,492
|
|
217
|
|
—
|
|
2,709
|
|
|||||||||||||||||||
|
CMBS
|
—
|
|
819
|
|
—
|
|
—
|
|
819
|
|
|||||||||||||||||||
|
Mortgage revenue bonds
|
—
|
|
—
|
|
1,272
|
|
—
|
|
1,272
|
|
|||||||||||||||||||
|
Other
|
—
|
|
33
|
|
429
|
|
—
|
|
462
|
|
|||||||||||||||||||
|
Total available-for-sale securities
|
—
|
|
6,210
|
|
2,153
|
|
—
|
|
8,363
|
|
|||||||||||||||||||
|
Mortgage loans
|
—
|
|
10,860
|
|
1,197
|
|
—
|
|
12,057
|
|
|||||||||||||||||||
|
Other assets:
|
|||||||||||||||||||||||||||||
|
Risk management derivatives:
|
|||||||||||||||||||||||||||||
|
Swaps
|
—
|
|
4,159
|
|
137
|
|
—
|
|
4,296
|
|
|||||||||||||||||||
|
Swaptions
|
—
|
|
241
|
|
—
|
|
—
|
|
241
|
|
|||||||||||||||||||
|
Other
|
—
|
|
—
|
|
33
|
|
—
|
|
33
|
|
|||||||||||||||||||
|
Netting adjustment
|
—
|
|
—
|
|
—
|
|
(4,514
|
)
|
(4,514
|
)
|
|||||||||||||||||||
|
Mortgage commitment derivatives
|
—
|
|
619
|
|
12
|
|
—
|
|
631
|
|
|||||||||||||||||||
|
Total other assets
|
—
|
|
5,019
|
|
182
|
|
(4,514
|
)
|
687
|
|
|||||||||||||||||||
|
Total assets at fair value
|
$
|
32,317
|
|
$
|
29,207
|
|
$
|
4,659
|
|
$
|
(4,514
|
)
|
$
|
61,669
|
|
||||||||||||||
|
Fannie Mae (In conservatorship) Third Quarter 2017 Form 10-Q
|
102
|
|
|
Notes to Condensed Consolidated Financial Statements | Fair Value
|
||
|
Fair Value Measurements as of December 31, 2016
|
|||||||||||||||||||||||||||||
|
Quoted Prices in Active Markets for Identical Assets (Level 1)
|
Significant Other Observable Inputs
(Level 2)
|
Significant Unobservable Inputs
(Level 3)
|
Netting Adjustment
(1)
|
Estimated Fair Value
|
|||||||||||||||||||||||||
|
(Dollars in millions)
|
|||||||||||||||||||||||||||||
|
Liabilities:
|
|||||||||||||||||||||||||||||
|
Long-term debt:
|
|||||||||||||||||||||||||||||
|
Of Fannie Mae:
|
|||||||||||||||||||||||||||||
|
Senior floating
|
$
|
—
|
|
$
|
9,235
|
|
$
|
347
|
|
$
|
—
|
|
$
|
9,582
|
|
||||||||||||||
|
Total of Fannie Mae
|
—
|
|
9,235
|
|
347
|
|
—
|
|
9,582
|
|
|||||||||||||||||||
|
Of consolidated trusts
|
—
|
|
36,283
|
|
241
|
|
—
|
|
36,524
|
|
|||||||||||||||||||
|
Total long-term debt
|
—
|
|
45,518
|
|
588
|
|
—
|
|
46,106
|
|
|||||||||||||||||||
|
Other liabilities:
|
|||||||||||||||||||||||||||||
|
Risk management derivatives:
|
|||||||||||||||||||||||||||||
|
Swaps
|
—
|
|
6,933
|
|
48
|
|
—
|
|
6,981
|
|
|||||||||||||||||||
|
Swaptions
|
—
|
|
339
|
|
—
|
|
—
|
|
339
|
|
|||||||||||||||||||
|
Other
|
—
|
|
—
|
|
2
|
|
—
|
|
2
|
|
|||||||||||||||||||
|
Netting adjustment
|
—
|
|
—
|
|
—
|
|
(6,844
|
)
|
(6,844
|
)
|
|||||||||||||||||||
|
Mortgage commitment derivatives
|
—
|
|
649
|
|
88
|
|
—
|
|
737
|
|
|||||||||||||||||||
|
Total other liabilities
|
—
|
|
7,921
|
|
138
|
|
(6,844
|
)
|
1,215
|
|
|||||||||||||||||||
|
Total liabilities at fair value
|
$
|
—
|
|
$
|
53,439
|
|
$
|
726
|
|
$
|
(6,844
|
)
|
$
|
47,321
|
|
||||||||||||||
__________
|
(1)
|
Derivative contracts are reported on a gross basis by level. The netting adjustment represents the effect of the legal right to offset under legally enforceable master netting arrangements to settle with the same counterparty on a net basis, including cash collateral posted and received.
|
|
Fannie Mae (In conservatorship) Third Quarter 2017 Form 10-Q
|
103
|
|
|
Notes to Condensed Consolidated Financial Statements | Fair Value
|
||
The following tables display a reconciliation of all assets and liabilities measured at fair value on a recurring basis using significant unobservable inputs (Level 3). The tables also display gains and losses due to changes in fair value, including realized and unrealized gains and losses, recognized in our condensed consolidated statements of operations and comprehensive income for Level 3 assets and liabilities. When assets and liabilities are transferred between levels, we recognize the transfer as of the end of the period.
|
Fair Value Measurements Using Significant Unobservable Inputs (Level 3)
|
|||||||||||||||||||||||||||||||||||||||||||||||
|
For the Three Months Ended September 30, 2017
|
|||||||||||||||||||||||||||||||||||||||||||||||
|
Net Unrealized Gains (Losses) Included in Net Income Related to Assets and Liabilities Still Held as of September 30,
2017
(5)(6)
|
|||||||||||||||||||||||||||||||||||||||||||||||
|
Total Gains (Losses)
(Realized/Unrealized)
|
|||||||||||||||||||||||||||||||||||||||||||||||
|
Balance, June 30, 2017
|
Included in Net Income
|
Included in Total Other Comprehensive
Income (Loss)
(1)
|
Purchases
(2)
|
Sales
(2)
|
Issues
(3)
|
Settlements
(3)
|
Transfers out of Level 3
|
Transfers into
Level 3
(4)
|
Balance, September 30, 2017
|
||||||||||||||||||||||||||||||||||||||
|
(Dollars in millions)
|
|||||||||||||||||||||||||||||||||||||||||||||||
|
Trading securities:
|
|||||||||||||||||||||||||||||||||||||||||||||||
|
Mortgage-related:
|
|||||||||||||||||||||||||||||||||||||||||||||||
|
Fannie Mae
|
$
|
1,871
|
|
$
|
16
|
|
$
|
—
|
|
$
|
—
|
|
$
|
—
|
|
$
|
—
|
|
$
|
—
|
|
$
|
(8
|
)
|
$
|
7
|
|
$
|
1,886
|
|
$
|
27
|
|
||||||||||||||
|
Alt-A and subprime private-label securities
|
264
|
|
(2
|
)
|
—
|
|
—
|
|
—
|
|
—
|
|
(9
|
)
|
—
|
|
—
|
|
253
|
|
(1
|
)
|
|||||||||||||||||||||||||
|
Mortgage revenue bonds
|
1
|
|
—
|
|
—
|
|
—
|
|
—
|
|
—
|
|
—
|
|
—
|
|
—
|
|
1
|
|
—
|
|
|||||||||||||||||||||||||
|
Total trading securities
|
$
|
2,136
|
|
$
|
14
|
|
(6)(7)
|
$
|
—
|
|
$
|
—
|
|
$
|
—
|
|
$
|
—
|
|
$
|
(9
|
)
|
$
|
(8
|
)
|
$
|
7
|
|
$
|
2,140
|
|
$
|
26
|
|
|||||||||||||
|
Available-for-sale securities:
|
|||||||||||||||||||||||||||||||||||||||||||||||
|
Mortgage-related:
|
|||||||||||||||||||||||||||||||||||||||||||||||
|
Fannie Mae
|
$
|
206
|
|
$
|
—
|
|
$
|
—
|
|
$
|
—
|
|
$
|
—
|
|
$
|
—
|
|
$
|
(2
|
)
|
$
|
(16
|
)
|
$
|
8
|
|
$
|
196
|
|
$
|
—
|
|
||||||||||||||
|
Alt-A and subprime private-label securities
|
178
|
|
—
|
|
10
|
|
—
|
|
—
|
|
—
|
|
(8
|
)
|
—
|
|
—
|
|
180
|
|
—
|
|
|||||||||||||||||||||||||
|
Mortgage revenue bonds
|
873
|
|
5
|
|
(3
|
)
|
—
|
|
(59
|
)
|
—
|
|
(67
|
)
|
—
|
|
—
|
|
749
|
|
—
|
|
|||||||||||||||||||||||||
|
Other
|
380
|
|
—
|
|
4
|
|
—
|
|
—
|
|
—
|
|
(14
|
)
|
—
|
|
—
|
|
370
|
|
—
|
|
|||||||||||||||||||||||||
|
Total available-for-sale securities
|
$
|
1,637
|
|
$
|
5
|
|
(7)(8)
|
$
|
11
|
|
$
|
—
|
|
$
|
(59
|
)
|
$
|
—
|
|
$
|
(91
|
)
|
$
|
(16
|
)
|
$
|
8
|
|
$
|
1,495
|
|
$
|
—
|
|
|||||||||||||
|
Mortgage loans
|
$
|
1,119
|
|
$
|
9
|
|
(6)(7)
|
$
|
—
|
|
$
|
—
|
|
$
|
—
|
|
$
|
—
|
|
$
|
(58
|
)
|
$
|
(6
|
)
|
$
|
26
|
|
$
|
1,090
|
|
$
|
6
|
|
|||||||||||||
|
Net derivatives
|
124
|
|
18
|
|
(6)
|
—
|
|
—
|
|
—
|
|
—
|
|
(16
|
)
|
—
|
|
(1
|
)
|
125
|
|
(14
|
)
|
||||||||||||||||||||||||
|
Long-term debt:
|
|||||||||||||||||||||||||||||||||||||||||||||||
|
Of Fannie Mae:
|
|||||||||||||||||||||||||||||||||||||||||||||||
|
Senior floating
|
$
|
(365
|
)
|
$
|
(4
|
)
|
$
|
—
|
|
$
|
—
|
|
$
|
—
|
|
$
|
—
|
|
$
|
—
|
|
$
|
—
|
|
$
|
—
|
|
$
|
(369
|
)
|
$
|
(4
|
)
|
||||||||||||||
|
Of consolidated trusts
|
(760
|
)
|
(2
|
)
|
—
|
|
—
|
|
—
|
|
—
|
|
33
|
|
141
|
|
(117
|
)
|
(705
|
)
|
(5
|
)
|
|||||||||||||||||||||||||
|
Total long-term debt
|
$
|
(1,125
|
)
|
$
|
(6
|
)
|
(6)
|
$
|
—
|
|
$
|
—
|
|
$
|
—
|
|
$
|
—
|
|
$
|
33
|
|
$
|
141
|
|
$
|
(117
|
)
|
$
|
(1,074
|
)
|
$
|
(9
|
)
|
|||||||||||||
|
Fannie Mae (In conservatorship) Third Quarter 2017 Form 10-Q
|
104
|
|
|
Notes to Condensed Consolidated Financial Statements | Fair Value
|
||
|
Fair Value Measurements Using Significant Unobservable Inputs (Level 3)
|
|||||||||||||||||||||||||||||||||||||||||||||||
|
For the Nine Months Ended September 30, 2017
|
|||||||||||||||||||||||||||||||||||||||||||||||
|
Net Unrealized Gains (Losses) Included in Net Income Related to Assets and Liabilities Still Held as of September 30,
2017
(5)(6)
|
|||||||||||||||||||||||||||||||||||||||||||||||
|
Total Gains (Losses)
(Realized/Unrealized)
|
|||||||||||||||||||||||||||||||||||||||||||||||
|
Balance, December 31, 2016
|
Included in Net Income
|
Included in Total Other Comprehensive
Income (Loss)
(1)
|
Purchases
(2)
|
Sales
(2)
|
Issues
(3)
|
Settlements
(3)
|
Transfers out of Level 3
|
Transfers into
Level 3
(4)
|
Balance, September 30, 2017
|
||||||||||||||||||||||||||||||||||||||
|
(Dollars in millions)
|
|||||||||||||||||||||||||||||||||||||||||||||||
|
Trading securities:
|
|||||||||||||||||||||||||||||||||||||||||||||||
|
Mortgage-related:
|
|||||||||||||||||||||||||||||||||||||||||||||||
|
Fannie Mae
|
$
|
835
|
|
$
|
20
|
|
$
|
—
|
|
$
|
63
|
|
$
|
—
|
|
$
|
—
|
|
$
|
(5
|
)
|
$
|
(30
|
)
|
$
|
1,003
|
|
$
|
1,886
|
|
$
|
3
|
|
||||||||||||||
|
Alt-A and subprime private-label securities
|
271
|
|
9
|
|
—
|
|
—
|
|
—
|
|
—
|
|
(27
|
)
|
—
|
|
—
|
|
253
|
|
10
|
|
|||||||||||||||||||||||||
|
Mortgage revenue bonds
|
21
|
|
3
|
|
—
|
|
—
|
|
(21
|
)
|
—
|
|
(2
|
)
|
—
|
|
—
|
|
1
|
|
—
|
|
|||||||||||||||||||||||||
|
Total trading securities
|
$
|
1,127
|
|
$
|
32
|
|
(6)(7)
|
$
|
—
|
|
$
|
63
|
|
$
|
(21
|
)
|
$
|
—
|
|
$
|
(34
|
)
|
$
|
(30
|
)
|
$
|
1,003
|
|
$
|
2,140
|
|
$
|
13
|
|
|||||||||||||
|
Available-for-sale securities:
|
|||||||||||||||||||||||||||||||||||||||||||||||
|
Mortgage-related:
|
|||||||||||||||||||||||||||||||||||||||||||||||
|
Fannie Mae
|
$
|
230
|
|
$
|
1
|
|
$
|
(2
|
)
|
$
|
—
|
|
$
|
—
|
|
$
|
—
|
|
$
|
(8
|
)
|
$
|
(63
|
)
|
$
|
38
|
|
$
|
196
|
|
$
|
—
|
|
||||||||||||||
|
Other agency
|
5
|
|
—
|
|
—
|
|
—
|
|
(1
|
)
|
—
|
|
—
|
|
(4
|
)
|
—
|
|
—
|
|
—
|
|
|||||||||||||||||||||||||
|
Alt-A and subprime private-label securities
|
217
|
|
—
|
|
(5
|
)
|
—
|
|
—
|
|
—
|
|
(32
|
)
|
—
|
|
—
|
|
180
|
|
—
|
|
|||||||||||||||||||||||||
|
Mortgage revenue bonds
|
1,272
|
|
40
|
|
(15
|
)
|
—
|
|
(383
|
)
|
—
|
|
(165
|
)
|
—
|
|
—
|
|
749
|
|
—
|
|
|||||||||||||||||||||||||
|
Other
|
429
|
|
—
|
|
(10
|
)
|
—
|
|
—
|
|
—
|
|
(49
|
)
|
—
|
|
—
|
|
370
|
|
—
|
|
|||||||||||||||||||||||||
|
Total available-for-sale securities
|
$
|
2,153
|
|
$
|
41
|
|
(7)(8)
|
$
|
(32
|
)
|
$
|
—
|
|
$
|
(384
|
)
|
$
|
—
|
|
$
|
(254
|
)
|
$
|
(67
|
)
|
$
|
38
|
|
$
|
1,495
|
|
$
|
—
|
|
|||||||||||||
|
Mortgage loans
|
$
|
1,197
|
|
$
|
41
|
|
(6)(7)
|
$
|
—
|
|
$
|
—
|
|
$
|
—
|
|
$
|
—
|
|
$
|
(175
|
)
|
$
|
(73
|
)
|
$
|
100
|
|
$
|
1,090
|
|
$
|
21
|
|
|||||||||||||
|
Net derivatives
|
44
|
|
118
|
|
(6)
|
—
|
|
—
|
|
—
|
|
—
|
|
(40
|
)
|
5
|
|
(2
|
)
|
125
|
|
3
|
|
||||||||||||||||||||||||
|
Long-term debt:
|
|||||||||||||||||||||||||||||||||||||||||||||||
|
Of Fannie Mae:
|
|||||||||||||||||||||||||||||||||||||||||||||||
|
Senior floating
|
$
|
(347
|
)
|
$
|
(22
|
)
|
$
|
—
|
|
$
|
—
|
|
$
|
—
|
|
$
|
—
|
|
$
|
—
|
|
$
|
—
|
|
$
|
—
|
|
$
|
(369
|
)
|
$
|
(22
|
)
|
||||||||||||||
|
Of consolidated trusts
|
(241
|
)
|
(6
|
)
|
—
|
|
—
|
|
—
|
|
(2
|
)
|
52
|
|
229
|
|
(737
|
)
|
(705
|
)
|
(6
|
)
|
|||||||||||||||||||||||||
|
Total long-term debt
|
$
|
(588
|
)
|
$
|
(28
|
)
|
(6)
|
$
|
—
|
|
$
|
—
|
|
$
|
—
|
|
$
|
(2
|
)
|
$
|
52
|
|
$
|
229
|
|
$
|
(737
|
)
|
$
|
(1,074
|
)
|
$
|
(28
|
)
|
|||||||||||||
|
Fannie Mae (In conservatorship) Third Quarter 2017 Form 10-Q
|
105
|
|
|
Notes to Condensed Consolidated Financial Statements | Fair Value
|
||
|
Fair Value Measurements Using Significant Unobservable Inputs (Level 3)
|
|||||||||||||||||||||||||||||||||||||||||||||||
|
For the Three Months Ended September 30, 2016
|
|||||||||||||||||||||||||||||||||||||||||||||||
|
Net Unrealized Gains (Losses) Included in Net Income Related to Assets and Liabilities Still Held as of September 30,
2016
(5)(6)
|
|||||||||||||||||||||||||||||||||||||||||||||||
|
Total Gains (Losses)
(Realized/Unrealized)
|
|||||||||||||||||||||||||||||||||||||||||||||||
|
Balance, June 30, 2016
|
Included in Net Income
|
Included in Total Other Comprehensive
Income (Loss)
(1)
|
Purchases
(2)
|
Sales
(2)
|
Issues
(3)
|
Settlements
(3)
|
Transfers out of Level 3
|
Transfers into
Level 3
|
Balance, September 30, 2016
|
||||||||||||||||||||||||||||||||||||||
|
(Dollars in millions)
|
|||||||||||||||||||||||||||||||||||||||||||||||
|
Trading securities:
|
|||||||||||||||||||||||||||||||||||||||||||||||
|
Mortgage-related:
|
|||||||||||||||||||||||||||||||||||||||||||||||
|
Alt-A and subprime private-label securities
|
$
|
303
|
|
$
|
8
|
|
$
|
—
|
|
$
|
—
|
|
$
|
—
|
|
$
|
—
|
|
$
|
(12
|
)
|
$
|
—
|
|
$
|
—
|
|
$
|
299
|
|
$
|
8
|
|
||||||||||||||
|
Mortgage revenue bonds
|
193
|
|
5
|
|
—
|
|
—
|
|
—
|
|
—
|
|
(7
|
)
|
—
|
|
—
|
|
191
|
|
4
|
|
|||||||||||||||||||||||||
|
Total trading securities
|
$
|
496
|
|
$
|
13
|
|
(6)(7)
|
$
|
—
|
|
$
|
—
|
|
$
|
—
|
|
$
|
—
|
|
$
|
(19
|
)
|
$
|
—
|
|
$
|
—
|
|
$
|
490
|
|
$
|
12
|
|
|||||||||||||
|
Available-for-sale securities:
|
|||||||||||||||||||||||||||||||||||||||||||||||
|
Mortgage-related:
|
|||||||||||||||||||||||||||||||||||||||||||||||
|
Other agency
|
$
|
1
|
|
$
|
—
|
|
$
|
—
|
|
$
|
—
|
|
$
|
—
|
|
$
|
—
|
|
$
|
—
|
|
$
|
—
|
|
$
|
1
|
|
$
|
2
|
|
$
|
—
|
|
||||||||||||||
|
Alt-A and subprime private-label securities
|
348
|
|
80
|
|
(76
|
)
|
—
|
|
(123
|
)
|
—
|
|
(7
|
)
|
—
|
|
—
|
|
222
|
|
—
|
|
|||||||||||||||||||||||||
|
Mortgage revenue bonds
|
2,029
|
|
35
|
|
(23
|
)
|
—
|
|
(201
|
)
|
—
|
|
(115
|
)
|
—
|
|
—
|
|
1,725
|
|
—
|
|
|||||||||||||||||||||||||
|
Other
|
450
|
|
—
|
|
6
|
|
—
|
|
—
|
|
—
|
|
(20
|
)
|
—
|
|
—
|
|
436
|
|
—
|
|
|||||||||||||||||||||||||
|
Total available-for-sale securities
|
$
|
2,828
|
|
$
|
115
|
|
(7)(8)
|
$
|
(93
|
)
|
$
|
—
|
|
$
|
(324
|
)
|
$
|
—
|
|
$
|
(142
|
)
|
$
|
—
|
|
$
|
1
|
|
$
|
2,385
|
|
$
|
—
|
|
|||||||||||||
|
Mortgage loans
|
$
|
1,280
|
|
$
|
23
|
|
(6)(7)
|
$
|
—
|
|
$
|
4
|
|
$
|
(72
|
)
|
$
|
—
|
|
$
|
(60
|
)
|
$
|
(17
|
)
|
$
|
15
|
|
$
|
1,173
|
|
$
|
6
|
|
|||||||||||||
|
Net derivatives
|
248
|
|
11
|
|
(6)
|
—
|
|
—
|
|
—
|
|
(1
|
)
|
(43
|
)
|
—
|
|
1
|
|
216
|
|
(18
|
)
|
||||||||||||||||||||||||
|
Long-term debt:
|
|||||||||||||||||||||||||||||||||||||||||||||||
|
Of Fannie Mae:
|
|||||||||||||||||||||||||||||||||||||||||||||||
|
Senior floating
|
$
|
(410
|
)
|
$
|
(9
|
)
|
$
|
—
|
|
$
|
—
|
|
$
|
—
|
|
$
|
—
|
|
$
|
—
|
|
$
|
—
|
|
$
|
—
|
|
$
|
(419
|
)
|
$
|
(9
|
)
|
||||||||||||||
|
Of consolidated trusts
|
(326
|
)
|
(2
|
)
|
—
|
|
—
|
|
—
|
|
(16
|
)
|
11
|
|
95
|
|
(64
|
)
|
(302
|
)
|
—
|
|
|||||||||||||||||||||||||
|
Total long-term debt
|
$
|
(736
|
)
|
$
|
(11
|
)
|
(6)
|
$
|
—
|
|
$
|
—
|
|
$
|
—
|
|
$
|
(16
|
)
|
$
|
11
|
|
$
|
95
|
|
$
|
(64
|
)
|
$
|
(721
|
)
|
$
|
(9
|
)
|
|||||||||||||
|
Fannie Mae (In conservatorship) Third Quarter 2017 Form 10-Q
|
106
|
|
|
Notes to Condensed Consolidated Financial Statements | Fair Value
|
||
|
Fair Value Measurements Using Significant Unobservable Inputs (Level 3)
|
|||||||||||||||||||||||||||||||||||||||||||||||
|
For the Nine Months Ended September 30, 2016
|
|||||||||||||||||||||||||||||||||||||||||||||||
|
Net Unrealized Gains (Losses) Included in Net Income Related to Assets and Liabilities Still Held as of September 30,
2016
(5)(6)
|
|||||||||||||||||||||||||||||||||||||||||||||||
|
Total Gains (Losses)
(Realized/Unrealized)
|
|||||||||||||||||||||||||||||||||||||||||||||||
|
Balance, December 31, 2015
|
Included in Net Income
|
Included in Total Other Comprehensive
Income (Loss)
(1)
|
Purchases
(2)
|
Sales
(2)
|
Issues
(3)
|
Settlements
(3)
|
Transfers out of Level 3
(4)
|
Transfers into
Level 3
|
Balance, September 30, 2016
|
||||||||||||||||||||||||||||||||||||||
|
(Dollars in millions)
|
|||||||||||||||||||||||||||||||||||||||||||||||
|
Trading securities:
|
|||||||||||||||||||||||||||||||||||||||||||||||
|
Mortgage-related:
|
|||||||||||||||||||||||||||||||||||||||||||||||
|
Fannie Mae
|
$
|
—
|
|
$
|
—
|
|
$
|
—
|
|
$
|
—
|
|
$
|
—
|
|
$
|
—
|
|
$
|
(1
|
)
|
$
|
(24
|
)
|
$
|
25
|
|
$
|
—
|
|
$
|
—
|
|
||||||||||||||
|
Other agency
|
—
|
|
—
|
|
—
|
|
—
|
|
—
|
|
—
|
|
—
|
|
(1
|
)
|
1
|
|
—
|
|
—
|
|
|||||||||||||||||||||||||
|
Alt-A and subprime private-label securities
|
949
|
|
(56
|
)
|
—
|
|
—
|
|
(187
|
)
|
—
|
|
(44
|
)
|
(363
|
)
|
—
|
|
299
|
|
(32
|
)
|
|||||||||||||||||||||||||
|
Mortgage revenue bonds
|
449
|
|
34
|
|
—
|
|
—
|
|
(279
|
)
|
—
|
|
(13
|
)
|
—
|
|
—
|
|
191
|
|
14
|
|
|||||||||||||||||||||||||
|
Total trading securities
|
$
|
1,398
|
|
$
|
(22
|
)
|
(6)(7)
|
$
|
—
|
|
$
|
—
|
|
$
|
(466
|
)
|
$
|
—
|
|
$
|
(58
|
)
|
$
|
(388
|
)
|
$
|
26
|
|
$
|
490
|
|
$
|
(18
|
)
|
|||||||||||||
|
Available-for-sale securities:
|
|||||||||||||||||||||||||||||||||||||||||||||||
|
Mortgage-related:
|
|||||||||||||||||||||||||||||||||||||||||||||||
|
Fannie Mae
|
$
|
—
|
|
$
|
—
|
|
$
|
—
|
|
$
|
—
|
|
$
|
—
|
|
$
|
—
|
|
$
|
—
|
|
$
|
(1
|
)
|
$
|
1
|
|
$
|
—
|
|
$
|
—
|
|
||||||||||||||
|
Other agency
|
4
|
|
—
|
|
—
|
|
—
|
|
—
|
|
—
|
|
—
|
|
(3
|
)
|
1
|
|
2
|
|
—
|
|
|||||||||||||||||||||||||
|
Alt-A and subprime private-label securities
|
4,322
|
|
184
|
|
(235
|
)
|
—
|
|
(998
|
)
|
—
|
|
(212
|
)
|
(2,839
|
)
|
—
|
|
222
|
|
—
|
|
|||||||||||||||||||||||||
|
Mortgage revenue bonds
|
2,701
|
|
115
|
|
25
|
|
—
|
|
(812
|
)
|
—
|
|
(304
|
)
|
—
|
|
—
|
|
1,725
|
|
—
|
|
|||||||||||||||||||||||||
|
Other
|
1,404
|
|
—
|
|
(20
|
)
|
—
|
|
(605
|
)
|
—
|
|
(59
|
)
|
(284
|
)
|
—
|
|
436
|
|
—
|
|
|||||||||||||||||||||||||
|
Total available-for-sale securities
|
$
|
8,431
|
|
$
|
299
|
|
(7)(8)
|
$
|
(230
|
)
|
$
|
—
|
|
$
|
(2,415
|
)
|
$
|
—
|
|
$
|
(575
|
)
|
$
|
(3,127
|
)
|
$
|
2
|
|
$
|
2,385
|
|
$
|
—
|
|
|||||||||||||
|
Mortgage loans
|
$
|
1,477
|
|
$
|
139
|
|
(6)(7)
|
$
|
—
|
|
$
|
29
|
|
$
|
(392
|
)
|
$
|
—
|
|
$
|
(199
|
)
|
$
|
(101
|
)
|
$
|
220
|
|
$
|
1,173
|
|
$
|
24
|
|
|||||||||||||
|
Net derivatives
|
157
|
|
243
|
|
(6)
|
—
|
|
—
|
|
—
|
|
(8
|
)
|
(176
|
)
|
(2
|
)
|
2
|
|
216
|
|
41
|
|
||||||||||||||||||||||||
|
Long-term debt:
|
|||||||||||||||||||||||||||||||||||||||||||||||
|
Of Fannie Mae:
|
|||||||||||||||||||||||||||||||||||||||||||||||
|
Senior floating
|
$
|
(369
|
)
|
$
|
(50
|
)
|
$
|
—
|
|
$
|
—
|
|
$
|
—
|
|
$
|
—
|
|
$
|
—
|
|
$
|
—
|
|
$
|
—
|
|
$
|
(419
|
)
|
$
|
(50
|
)
|
||||||||||||||
|
Of consolidated trusts
|
(496
|
)
|
(77
|
)
|
—
|
|
—
|
|
—
|
|
(70
|
)
|
329
|
|
140
|
|
(128
|
)
|
(302
|
)
|
(9
|
)
|
|||||||||||||||||||||||||
|
Total long-term debt
|
$
|
(865
|
)
|
$
|
(127
|
)
|
(6)
|
$
|
—
|
|
$
|
—
|
|
$
|
—
|
|
$
|
(70
|
)
|
$
|
329
|
|
$
|
140
|
|
$
|
(128
|
)
|
$
|
(721
|
)
|
$
|
(59
|
)
|
|||||||||||||
__________
|
(1)
|
Gains (losses) included in other comprehensive income (loss) are included in “Changes in unrealized gains on AFS securities, net of reclassification adjustments and taxes” in our condensed consolidated statements of operations and comprehensive income.
|
|
(2)
|
Purchases and sales include activity related to the consolidation and deconsolidation of assets of securitization trusts.
|
|
(3)
|
Issues and settlements include activity related to the consolidation and deconsolidation of liabilities of securitization trusts.
|
|
(4)
|
Transfers into Level 3 during the
first nine months
of
2017
consisted primarily of a Fannie Mae security backed by private-label mortgage-related securities. Prices for this security were based on inputs that were not readily available. Transfers out of Level 3 during the
first nine months
of
2016
consisted primarily of private-label mortgage-related securities backed by Alt-A loans and subprime loans. Prices for these securities were available from multiple third-party vendors and demonstrated an increased and sustained level of observability over time.
|
|
(5)
|
Amount represents temporary changes in fair value. Amortization, accretion and OTTI are not considered unrealized and are not included in this amount.
|
|
(6)
|
Gains (losses) are included in “
Fair value losses, net
” in our condensed consolidated statements of operations and comprehensive income.
|
|
(7)
|
Gains (losses) are included in “
Net interest income
” in our condensed consolidated statements of operations and comprehensive income.
|
|
(8)
|
Gains (losses) are included in “
Investment gains, net
” in our condensed consolidated statements of operations and comprehensive income.
|
|
Fannie Mae (In conservatorship) Third Quarter 2017 Form 10-Q
|
107
|
|
|
Notes to Condensed Consolidated Financial Statements | Fair Value
|
||
The following tables display valuation techniques and the range and the weighted average of significant unobservable inputs for our Level 3 assets and liabilities measured at fair value on a recurring basis.
|
Fair Value Measurements as of September 30, 2017
|
|||||||||||||
|
Fair Value
|
Significant Valuation Techniques
|
Significant Unobservable Inputs
(1)
|
Range
(1)
|
Weighted - Average
(1)
|
|||||||||
|
(Dollars in millions)
|
|||||||||||||
|
Recurring fair value measurements:
|
|||||||||||||
|
Trading securities:
|
|||||||||||||
|
Mortgage-related securities:
|
|||||||||||||
|
Agency
(2)
|
$
|
902
|
|
Single Vendor
|
Prepayment Speed (%)
|
0.0
|
-
|
188.0
|
163.2
|
||||
|
Spreads (bps)
|
47.8
|
-
|
395.0
|
201.6
|
|||||||||
|
943
|
|
Consensus
|
Prepayment Speed (%)
|
177.0
|
177.0
|
||||||||
|
Spreads (bps)
|
150.0
|
150.0
|
|||||||||||
|
41
|
|
Various
|
|||||||||||
|
Total agency
|
1,886
|
|
|||||||||||
|
Alt-A and subprime private-label securities
|
156
|
|
Consensus
|
||||||||||
|
97
|
|
Various
|
|||||||||||
|
Total Alt-A and subprime private-label securities
|
253
|
|
|||||||||||
|
Mortgage revenue bonds
|
1
|
|
Various
|
||||||||||
|
Total trading securities
|
$
|
2,140
|
|
||||||||||
|
Available-for-sale securities:
|
|||||||||||||
|
Mortgage-related securities:
|
|||||||||||||
|
Agency
(2)
|
$
|
196
|
|
Various
|
|||||||||
|
Alt-A and subprime private-label securities
|
180
|
|
Various
|
||||||||||
|
Mortgage revenue bonds
|
594
|
|
Single Vendor
|
Spreads (bps)
|
2.5
|
-
|
360.5
|
60.0
|
|||||
|
155
|
|
Various
|
|||||||||||
|
Total mortgage revenue bonds
|
749
|
|
|||||||||||
|
Other
|
330
|
|
Discounted Cash Flow
|
Default Rate (%)
|
1.6
|
-
|
3.5
|
3.4
|
|||||
|
Prepayment Speed (%)
|
0.5
|
-
|
2.5
|
2.4
|
|||||||||
|
Severity (%)
|
50.0
|
-
|
100.0
|
98.1
|
|||||||||
|
Spreads (bps)
|
102.9
|
-
|
608.0
|
579.9
|
|||||||||
|
40
|
|
Various
|
|||||||||||
|
Total other
|
370
|
|
|||||||||||
|
Total available-for-sale securities
|
$
|
1,495
|
|
||||||||||
|
Fannie Mae (In conservatorship) Third Quarter 2017 Form 10-Q
|
108
|
|
|
Notes to Condensed Consolidated Financial Statements | Fair Value
|
||
|
Fair Value Measurements as of September 30, 2017
|
||||||||||||||
|
Fair Value
|
Significant Valuation Techniques
|
Significant Unobservable Inputs
(1)
|
Range
(1)
|
Weighted - Average
(1)
|
||||||||||
|
(Dollars in millions)
|
||||||||||||||
|
Mortgage loans:
|
||||||||||||||
|
Single-family
|
$
|
434
|
|
Build-Up
|
||||||||||
|
100
|
|
Consensus
|
Default Rate (%)
|
1.7
|
-
|
8.4
|
3.3
|
|||||||
|
Prepayment Speed (%)
|
3.3
|
-
|
16.5
|
11.4
|
||||||||||
|
Severity (%)
|
38.0
|
-
|
95.0
|
72.3
|
||||||||||
|
Spreads (bps)
|
113.7
|
|
-
|
140.0
|
129.7
|
|||||||||
|
300
|
|
Consensus
|
||||||||||||
|
96
|
|
Various
|
||||||||||||
|
Total single-family
|
930
|
|
||||||||||||
|
Multifamily
|
160
|
|
Build-Up
|
Spreads (bps)
|
45.0
|
|
-
|
286.2
|
124.3
|
|||||
|
Total mortgage loans
|
$
|
1,090
|
|
|||||||||||
|
Net derivatives
|
$
|
119
|
|
Dealer Mark
|
||||||||||
|
6
|
|
Various
|
||||||||||||
|
Total net derivatives
|
$
|
125
|
|
|||||||||||
|
Long-term debt:
|
||||||||||||||
|
Of Fannie Mae:
|
||||||||||||||
|
Senior floating
|
$
|
(369
|
)
|
Discounted Cash Flow
|
||||||||||
|
Of consolidated trusts
(3)
|
(500
|
)
|
Discounted Cash Flow
|
Default Rate (%)
|
2.4
|
-
|
5.9
|
4.6
|
||||||
|
Prepayment Speed (%)
|
5.1
|
-
|
100.0
|
99.5
|
||||||||||
|
Severity (%)
|
29.0
|
-
|
69.0
|
56.4
|
||||||||||
|
Spreads (bps)
|
40.0
|
|
-
|
239.3
|
88.0
|
|||||||||
|
(205
|
)
|
Various
|
||||||||||||
|
Total of consolidated trusts
|
(705
|
)
|
||||||||||||
|
Total long-term debt
|
$
|
(1,074
|
)
|
|||||||||||
|
Fannie Mae (In conservatorship) Third Quarter 2017 Form 10-Q
|
109
|
|
|
Notes to Condensed Consolidated Financial Statements | Fair Value
|
||
|
Fair Value Measurements as of December 31, 2016
|
||||||||||||||
|
Fair Value
|
Significant Valuation Techniques
|
Significant Unobservable Inputs
(1)
|
Range
(1)
|
Weighted - Average
(1)
|
||||||||||
|
(Dollars in millions)
|
||||||||||||||
|
Recurring fair value measurements:
|
||||||||||||||
|
Trading securities:
|
||||||||||||||
|
Mortgage-related securities:
|
||||||||||||||
|
Agency
(2)
|
$
|
809
|
|
Consensus
|
||||||||||
|
26
|
|
Various
|
||||||||||||
|
Total agency
|
835
|
|
||||||||||||
|
Alt-A and subprime private-label securities
|
232
|
|
Consensus
|
Default Rate (%)
|
0.4
|
|
-
|
10.9
|
8.2
|
|||||
|
Prepayment Speed (%)
|
4.3
|
|
-
|
7.4
|
6.6
|
|||||||||
|
Severity (%)
|
71.0
|
|
-
|
95.0
|
88.9
|
|||||||||
|
Spreads (bps)
|
244.6
|
|
-
|
253.9
|
251.5
|
|||||||||
|
39
|
|
Consensus
|
||||||||||||
|
Total Alt-A and subprime private-label securities
|
271
|
|
||||||||||||
|
Mortgage revenue bonds
|
19
|
|
Discounted Cash Flow
|
Spreads (bps)
|
13.0
|
|
-
|
268.2
|
252.2
|
|||||
|
2
|
|
Various
|
||||||||||||
|
Total mortgage revenue bonds
|
21
|
|
||||||||||||
|
Total trading securities
|
$
|
1,127
|
|
|||||||||||
|
Available-for-sale securities:
|
||||||||||||||
|
Mortgage-related securities:
|
||||||||||||||
|
Agency
(2)
|
$
|
129
|
|
Single Vendor
|
Prepayment Speed (%)
|
124.8
|
-
|
165.5
|
142.4
|
|||||
|
Spreads (bps)
|
175.0
|
|
-
|
210.0
|
182.5
|
|||||||||
|
72
|
|
Consensus
|
||||||||||||
|
34
|
|
Various
|
||||||||||||
|
Total agency
|
235
|
|
||||||||||||
|
Alt-A and subprime private-label securities
|
93
|
|
Single Vendor
|
Default Rate (%)
|
2.5
|
-
|
8.0
|
3.8
|
||||||
|
Prepayment Speed (%)
|
3.0
|
-
|
11.0
|
4.9
|
||||||||||
|
Severity (%)
|
38.0
|
-
|
80.0
|
48.1
|
||||||||||
|
Spreads (bps)
|
266.1
|
|
-
|
306.8
|
297.1
|
|||||||||
|
45
|
|
Discounted Cash Flow
|
Spreads (bps)
|
361.0
|
|
-
|
450.0
|
|
406.0
|
|||||
|
79
|
|
Various
|
||||||||||||
|
Total Alt-A and subprime private-label securities
|
217
|
|
||||||||||||
|
Mortgage revenue bonds
|
684
|
|
Single Vendor
|
Spreads (bps)
|
(16.8
|
)
|
-
|
336.9
|
44.3
|
|||||
|
126
|
|
Single Vendor
|
||||||||||||
|
435
|
|
Discounted Cash Flow
|
Spreads (bps)
|
(16.8
|
)
|
-
|
391.1
|
260.0
|
||||||
|
27
|
|
Various
|
||||||||||||
|
Total mortgage revenue bonds
|
1,272
|
|
||||||||||||
|
Other
|
47
|
|
Consensus
|
Default Rate (%)
|
0.5
|
-
|
3.5
|
3.5
|
||||||
|
Prepayment Speed (%)
|
2.5
|
-
|
6.0
|
2.5
|
||||||||||
|
Severity (%)
|
20.0
|
-
|
88.0
|
87.5
|
||||||||||
|
Spreads (bps)
|
221.6
|
|
-
|
300.2
|
237.7
|
|||||||||
|
348
|
|
Discounted Cash Flow
|
Default Rate (%)
|
2.3
|
2.3
|
|||||||||
|
Prepayment Speed (%)
|
0.5
|
0.5
|
||||||||||||
|
Severity (%)
|
95.0
|
95.0
|
||||||||||||
|
Spreads (bps)
|
190.0
|
|
-
|
450.0
|
449.1
|
|||||||||
|
34
|
|
Various
|
||||||||||||
|
Total other
|
429
|
|
||||||||||||
|
Total available-for-sale securities
|
$
|
2,153
|
|
|||||||||||
|
Fannie Mae (In conservatorship) Third Quarter 2017 Form 10-Q
|
110
|
|
|
Notes to Condensed Consolidated Financial Statements | Fair Value
|
||
|
Fair Value Measurements as of December 31, 2016
|
|||||||||||||
|
Fair Value
|
Significant Valuation Techniques
|
Significant Unobservable Inputs
(1)
|
Range
(1)
|
Weighted - Average
(1)
|
|||||||||
|
(Dollars in millions)
|
|||||||||||||
|
Mortgage loans:
|
|||||||||||||
|
Single-family
|
$
|
516
|
|
Build-Up
|
|||||||||
|
300
|
|
Consensus
|
|||||||||||
|
218
|
|
Various
|
|||||||||||
|
Total single-family
|
1,034
|
|
|||||||||||
|
Multifamily
|
163
|
|
Build-Up
|
Spreads (bps)
|
55.0
|
-
|
305.2
|
140.2
|
|||||
|
Total mortgage loans
|
$
|
1,197
|
|
||||||||||
|
Net derivatives
|
$
|
10
|
|
Internal Model
|
|||||||||
|
89
|
|
Dealer Mark
|
|||||||||||
|
21
|
|
Discounted Cash Flow
|
|||||||||||
|
(76
|
)
|
Various
|
|||||||||||
|
Total net derivatives
|
$
|
44
|
|
||||||||||
|
Long-term debt:
|
|||||||||||||
|
Of Fannie Mae:
|
|||||||||||||
|
Senior floating
|
$
|
(347
|
)
|
Discounted Cash Flow
|
|||||||||
|
Of consolidated trusts
|
(241
|
)
|
Various
|
||||||||||
|
Total long-term debt
|
$
|
(588
|
)
|
||||||||||
_________
|
(1)
|
Valuation techniques for which no unobservable inputs are disclosed generally reflect the use of third-party pricing services or dealers, and the range of unobservable inputs applied by these sources is not readily available or cannot be reasonably estimated. Where we have disclosed unobservable inputs for consensus and single vendor techniques, those inputs are based on our validations performed at the security level using discounted cash flows. The prepayment speed used for trading agency securities and available-for-sale agency securities is the Public Securities Association prepayment speed, which can be greater than 100%. For all other securities, the Conditional Prepayment Rate is used as the prepayment speed, which can be between 0% and 100%.
|
|
(2)
|
Includes Fannie Mae and Freddie Mac securities.
|
|
(3)
|
Includes instruments for which the prepayment speed represents the estimated annualized rate of prepayment after all prepayment penalty provisions have expired and also instruments for which prepayment speed represents the estimated rate of prepayment over the remaining life of the instrument.
|
In our condensed consolidated balance sheets certain assets and liabilities are measured at fair value on a nonrecurring basis; that is, the instruments are not measured at fair value on an ongoing basis but are subject to fair value adjustments in certain circumstances (for example, when we evaluate loans for impairment). We did not have any Level 1 assets or liabilities held as of
September 30, 2017
or
December 31, 2016
that were measured at fair value on a nonrecurring basis. We held
$149 million
and
$250 million
in Level 2 assets, comprised of mortgage loans held for sale, and no Level 2 liabilities that were measured at fair value on a nonrecurring basis as of
September 30, 2017
and
December 31, 2016
, respectively.
|
Fannie Mae (In conservatorship) Third Quarter 2017 Form 10-Q
|
111
|
|
|
Notes to Condensed Consolidated Financial Statements | Fair Value
|
||
The following table displays valuation techniques for our Level 3 assets measured at fair value on a nonrecurring basis. The significant unobservable inputs related to these techniques primarily relate to collateral dependent valuations. The related ranges and weighted averages are not meaningful when aggregated as they vary significantly from property to property.
|
Fair Value Measurements
as of
|
|||||||||||||
|
Valuation Techniques
|
September 30, 2017
|
December 31, 2016
|
|||||||||||
|
(Dollars in millions)
|
|||||||||||||
|
Nonrecurring fair value measurements:
|
|||||||||||||
|
Mortgage loans held for sale, at lower of cost or fair value
|
Consensus
|
$
|
2,235
|
|
$
|
1,025
|
|
||||||
|
Single Vendor
|
89
|
|
54
|
|
|||||||||
|
Various
|
—
|
|
9
|
|
|||||||||
|
Total mortgage loans held for sale, at lower of cost or fair value
|
2,324
|
|
1,088
|
|
|||||||||
|
Single-family mortgage loans held for investment, at amortized cost
|
Internal Model
|
1,846
|
|
2,816
|
|
||||||||
|
Multifamily mortgage loans held for investment, at amortized cost
|
Broker Price Opinions
|
24
|
|
25
|
|
||||||||
|
Asset Manager Estimate
|
139
|
|
170
|
|
|||||||||
|
Various
|
4
|
|
3
|
|
|||||||||
|
Total multifamily mortgage loans held for investment, at amortized cost
|
167
|
|
198
|
|
|||||||||
|
Acquired property, net:
(1)
|
|||||||||||||
|
Single-family
|
Accepted Offers
|
221
|
|
340
|
|
||||||||
|
Appraisals
|
429
|
|
571
|
|
|||||||||
|
Walk Forwards
|
190
|
|
306
|
|
|||||||||
|
Internal Model
|
308
|
|
476
|
|
|||||||||
|
Various
|
161
|
|
99
|
|
|||||||||
|
Total single-family
|
1,309
|
|
1,792
|
|
|||||||||
|
Multifamily
|
Broker Price Opinions
|
29
|
|
—
|
|
||||||||
|
Other assets
|
Various
|
2
|
|
12
|
|
||||||||
|
Total nonrecurring assets at fair value
|
$
|
5,677
|
|
$
|
5,906
|
|
|||||||
__________
|
(1)
|
The most commonly used techniques in our valuation of acquired property are proprietary home price model and third-party valuations (both current and walk forward). Based on the number of properties measured as of
September 30, 2017
, these methodologies comprised approximately
76%
of our valuations, while accepted offers comprised approximately
19%
of our valuations. Based on the number of properties measured as of
December 31, 2016
, these methodologies comprised approximately
75%
of our valuations, while accepted offers comprised approximately
19%
of our valuations.
|
We use valuation techniques that maximize the use of observable inputs and minimize the use of unobservable inputs. See “Note 17, Fair Value” in our
2016
Form 10-K for information on the valuation control processes and the valuation techniques we use for fair value measurement and disclosure as well as our basis for classifying these measurements as Level 1, Level 2 or Level 3 of the valuation hierarchy in more specific situations. There were no significant changes made to the valuation control processes and the valuation techniques for the
nine
months ended
September 30, 2017
.
|
Fannie Mae (In conservatorship) Third Quarter 2017 Form 10-Q
|
112
|
|
|
Notes to Condensed Consolidated Financial Statements | Fair Value
|
||
Fair Value of Financial Instruments
The following table displays the carrying value and estimated fair value of our financial instruments. The fair value of financial instruments we disclose includes commitments to purchase multifamily and single-family mortgage loans that we do not record in our condensed consolidated balance sheets. The fair values of these commitments are included as “Mortgage loans held for investment, net of allowance for loan losses.” The disclosure excludes all non-financial instruments; therefore, the fair value of our financial assets and liabilities does not represent the underlying fair value of our total consolidated assets and liabilities.
|
As of September 30, 2017
|
|||||||||||||||||||||||
|
Carrying
Value |
Quoted Prices in Active Markets for Identical Assets
(Level 1) |
Significant Other Observable Inputs
(Level 2) |
Significant Unobservable Inputs
(Level 3) |
Netting Adjustment
|
Estimated
Fair Value |
||||||||||||||||||
|
(Dollars in millions)
|
|||||||||||||||||||||||
|
Financial assets:
|
|||||||||||||||||||||||
|
Cash and cash equivalents and restricted cash
|
$
|
52,051
|
|
$
|
35,301
|
|
$
|
16,750
|
|
$
|
—
|
|
$
|
—
|
|
$
|
52,051
|
|
|||||
|
Federal funds sold and securities purchased under agreements to resell or similar arrangements
|
23,740
|
|
—
|
|
23,740
|
|
—
|
|
—
|
|
23,740
|
|
|||||||||||
|
Trading securities
|
36,886
|
|
30,799
|
|
3,947
|
|
2,140
|
|
—
|
|
36,886
|
|
|||||||||||
|
Available-for-sale securities
|
5,963
|
|
—
|
|
4,468
|
|
1,495
|
|
—
|
|
5,963
|
|
|||||||||||
|
Mortgage loans held for sale
|
4,516
|
|
—
|
|
2,389
|
|
2,780
|
|
—
|
|
5,169
|
|
|||||||||||
|
Mortgage loans held for investment, net of allowance for loan losses
|
3,148,243
|
|
—
|
|
2,869,318
|
|
318,453
|
|
—
|
|
3,187,771
|
|
|||||||||||
|
Advances to lenders
|
4,771
|
|
—
|
|
4,769
|
|
2
|
|
—
|
|
4,771
|
|
|||||||||||
|
Derivative assets at fair value
|
284
|
|
—
|
|
4,152
|
|
166
|
|
(4,034
|
)
|
284
|
|
|||||||||||
|
Guaranty assets and buy-ups
|
155
|
|
—
|
|
—
|
|
444
|
|
—
|
|
444
|
|
|||||||||||
|
Total financial assets
|
$
|
3,276,609
|
|
$
|
66,100
|
|
$
|
2,929,533
|
|
$
|
325,480
|
|
$
|
(4,034
|
)
|
$
|
3,317,079
|
|
|||||
|
Financial liabilities:
|
|||||||||||||||||||||||
|
Federal funds purchased and securities sold under agreements to repurchase
|
$
|
81
|
|
$
|
—
|
|
$
|
81
|
|
$
|
—
|
|
$
|
—
|
|
$
|
81
|
|
|||||
|
Short-term debt:
|
|||||||||||||||||||||||
|
Of Fannie Mae
|
33,332
|
|
—
|
|
33,334
|
|
—
|
|
—
|
|
33,334
|
|
|||||||||||
|
Of consolidated trusts
|
459
|
|
—
|
|
—
|
|
458
|
|
—
|
|
458
|
|
|||||||||||
|
Long-term debt:
|
|||||||||||||||||||||||
|
Of Fannie Mae
|
257,957
|
|
—
|
|
265,390
|
|
824
|
|
—
|
|
266,214
|
|
|||||||||||
|
Of consolidated trusts
|
3,016,835
|
|
—
|
|
2,995,046
|
|
40,075
|
|
—
|
|
3,035,121
|
|
|||||||||||
|
Derivative liabilities at fair value
|
337
|
|
—
|
|
5,173
|
|
41
|
|
(4,877
|
)
|
337
|
|
|||||||||||
|
Guaranty obligations
|
267
|
|
—
|
|
—
|
|
489
|
|
—
|
|
489
|
|
|||||||||||
|
Total financial liabilities
|
$
|
3,309,268
|
|
$
|
—
|
|
$
|
3,299,024
|
|
$
|
41,887
|
|
$
|
(4,877
|
)
|
$
|
3,336,034
|
|
|||||
|
Fannie Mae (In conservatorship) Third Quarter 2017 Form 10-Q
|
113
|
|
|
Notes to Condensed Consolidated Financial Statements | Fair Value
|
||
|
As of December 31, 2016
|
|||||||||||||||||||||||
|
Carrying
Value |
Quoted Prices in Active Markets for Identical Assets
(Level 1) |
Significant Other Observable Inputs
(Level 2) |
Significant Unobservable Inputs
(Level 3) |
Netting Adjustment
|
Estimated
Fair Value |
||||||||||||||||||
|
(Dollars in millions)
|
|||||||||||||||||||||||
|
Financial assets:
|
|||||||||||||||||||||||
|
Cash and cash equivalents and restricted cash
|
$
|
62,177
|
|
$
|
41,477
|
|
$
|
20,700
|
|
$
|
—
|
|
$
|
—
|
|
$
|
62,177
|
|
|||||
|
Federal funds sold and securities purchased under agreements to resell or similar arrangements
|
30,415
|
|
—
|
|
30,415
|
|
—
|
|
—
|
|
30,415
|
|
|||||||||||
|
Trading securities
|
40,562
|
|
32,317
|
|
7,118
|
|
1,127
|
|
—
|
|
40,562
|
|
|||||||||||
|
Available-for-sale securities
|
8,363
|
|
—
|
|
6,210
|
|
2,153
|
|
—
|
|
8,363
|
|
|||||||||||
|
Mortgage loans held for sale
|
2,899
|
|
—
|
|
509
|
|
2,751
|
|
—
|
|
3,260
|
|
|||||||||||
|
Mortgage loans held for investment, net of allowance for loan losses
|
3,076,854
|
|
—
|
|
2,767,813
|
|
316,742
|
|
—
|
|
3,084,555
|
|
|||||||||||
|
Advances to lenders
|
7,494
|
|
—
|
|
7,156
|
|
352
|
|
—
|
|
7,508
|
|
|||||||||||
|
Derivative assets at fair value
|
687
|
|
—
|
|
5,019
|
|
182
|
|
(4,514
|
)
|
687
|
|
|||||||||||
|
Guaranty assets and buy-ups
|
158
|
|
—
|
|
—
|
|
432
|
|
—
|
|
432
|
|
|||||||||||
|
Total financial assets
|
$
|
3,229,609
|
|
$
|
73,794
|
|
$
|
2,844,940
|
|
$
|
323,739
|
|
$
|
(4,514
|
)
|
$
|
3,237,959
|
|
|||||
|
Financial liabilities:
|
|||||||||||||||||||||||
|
Short-term debt:
|
|||||||||||||||||||||||
|
Of Fannie Mae
|
$
|
34,995
|
|
$
|
—
|
|
$
|
34,998
|
|
$
|
—
|
|
$
|
—
|
|
$
|
34,998
|
|
|||||
|
Of consolidated trusts
|
584
|
|
—
|
|
—
|
|
584
|
|
—
|
|
584
|
|
|||||||||||
|
Long-term debt:
|
|||||||||||||||||||||||
|
Of Fannie Mae
|
292,102
|
|
—
|
|
298,980
|
|
770
|
|
—
|
|
299,750
|
|
|||||||||||
|
Of consolidated trusts
|
2,934,635
|
|
—
|
|
2,901,316
|
|
36,668
|
|
—
|
|
2,937,984
|
|
|||||||||||
|
Derivative liabilities at fair value
|
1,215
|
|
—
|
|
7,921
|
|
138
|
|
(6,844
|
)
|
1,215
|
|
|||||||||||
|
Guaranty obligations
|
280
|
|
—
|
|
—
|
|
710
|
|
—
|
|
710
|
|
|||||||||||
|
Total financial liabilities
|
$
|
3,263,811
|
|
$
|
—
|
|
$
|
3,243,215
|
|
$
|
38,870
|
|
$
|
(6,844
|
)
|
$
|
3,275,241
|
|
|||||
For a detailed description and classification of our financial instruments, see “Note 17, Fair Value” in our
2016
Form 10-K.
Fair Value Option
We elected the fair value option for our credit risk sharing debt securities issued under our CAS series issued prior to January 1, 2016 and certain loans and debt that contain embedded derivatives that would otherwise require bifurcation. Under the fair value option, we elected to carry these instruments at fair value instead of bifurcating the embedded derivative from such instruments.
We elected the fair value option for all long-term structured debt instruments that are issued in response to specific investor demand and have interest rates that are based on a calculated index or formula and are economically hedged with derivatives at the time of issuance. By electing the fair value option for these instruments, we are able to eliminate the volatility in our results of operations that would otherwise result from the accounting asymmetry created by recording these structured debt instruments at cost while recording the related derivatives at fair value.
We elected the fair value option for the financial assets and liabilities of the consolidated senior-subordinate trust structures. By electing the fair value option for these instruments, we are able to eliminate the volatility in our results of operations that would otherwise result from different accounting treatment between loans at cost and debt at cost.
|
Fannie Mae (In conservatorship) Third Quarter 2017 Form 10-Q
|
114
|
|
|
Notes to Condensed Consolidated Financial Statements | Fair Value
|
||
Interest income for the mortgage loans is recorded in “Interest income—Mortgage loans” and interest expense for the debt instruments is recorded in “Interest expense—Long-term debt” in our condensed consolidated statements of operations and comprehensive income.
The following table displays the fair value and unpaid principal balance of the financial instruments for which we have made fair value elections.
|
As of
|
|||||||||||||||||||||||||||||||||||
|
September 30, 2017
|
December 31, 2016
|
||||||||||||||||||||||||||||||||||
|
Loans
(1)
|
Long-Term Debt of Fannie Mae
|
Long-Term Debt of Consolidated Trusts
|
Loans
(1)
|
Long-Term Debt of Fannie Mae
|
Long-Term Debt of Consolidated Trusts
|
||||||||||||||||||||||||||||||
|
(Dollars in millions)
|
|||||||||||||||||||||||||||||||||||
|
Fair value
|
$
|
11,013
|
|
$
|
8,491
|
|
$
|
32,760
|
|
$
|
12,057
|
|
$
|
9,582
|
|
$
|
36,524
|
|
|||||||||||||||||
|
Unpaid principal balance
|
10,596
|
|
7,758
|
|
29,560
|
|
11,688
|
|
9,090
|
|
33,055
|
|
|||||||||||||||||||||||
__________
|
(1)
|
Includes nonaccrual loans with a fair value of
$181 million
and
$200 million
as of
September 30, 2017
and
December 31, 2016
, respectively. The difference between unpaid principal balance and the fair value of these nonaccrual loans as of
September 30, 2017
and
December 31, 2016
was
$35 million
and
$34 million
, respectively. Includes loans that are 90 days or more past due with a fair value of
$133 million
and
$152 million
as of
September 30, 2017
and
December 31, 2016
, respectively. The difference between unpaid principal balance and the fair value of these
90
or more days past due loans as of
September 30, 2017
and
December 31, 2016
was
$26 million
and
$25 million
, respectively.
|
Changes in Fair Value under the Fair Value Option Election
The following tables display fair value gains and losses, net, including changes attributable to instrument-specific credit risk, for loans and debt for which the fair value election was made. Amounts are recorded as a component of “
Fair value losses, net
” in our condensed consolidated statements of operations and comprehensive income.
|
For the Three Months Ended September 30,
|
|||||||||||||||||||||||
|
2017
|
2016
|
||||||||||||||||||||||
|
Loans
|
Long-Term Debt
|
Total Gains (Losses)
|
Loans
|
Long-Term Debt
|
Total Gains (Losses)
|
||||||||||||||||||
|
(Dollars in millions)
|
|||||||||||||||||||||||
|
Changes in instrument-specific credit risk
|
$
|
(6
|
)
|
$
|
113
|
|
$
|
107
|
|
$
|
14
|
|
$
|
(389
|
)
|
$
|
(375
|
)
|
|||||
|
Other changes in fair value
|
36
|
|
(78
|
)
|
(42
|
)
|
48
|
|
(65
|
)
|
(17
|
)
|
|||||||||||
|
Fair value gains (losses), net
|
$
|
30
|
|
$
|
35
|
|
$
|
65
|
|
$
|
62
|
|
$
|
(454
|
)
|
$
|
(392
|
)
|
|||||
|
For the Nine Months Ended September 30,
|
|||||||||||||||||||||||
|
2017
|
2016
|
||||||||||||||||||||||
|
Loans
|
Long-Term Debt
|
Total Gains (Losses)
|
Loans
|
Long-Term Debt
|
Total Gains (Losses)
|
||||||||||||||||||
|
(Dollars in millions)
|
|||||||||||||||||||||||
|
Changes in instrument-specific credit risk
|
$
|
47
|
|
$
|
(226
|
)
|
$
|
(179
|
)
|
$
|
46
|
|
$
|
(610
|
)
|
$
|
(564
|
)
|
|||||
|
Other changes in fair value
|
119
|
|
(196
|
)
|
(77
|
)
|
392
|
|
(511
|
)
|
(119
|
)
|
|||||||||||
|
Fair value gains (losses), net
|
$
|
166
|
|
$
|
(422
|
)
|
$
|
(256
|
)
|
$
|
438
|
|
$
|
(1,121
|
)
|
$
|
(683
|
)
|
|||||
|
Fannie Mae (In conservatorship) Third Quarter 2017 Form 10-Q
|
115
|
|
|
Notes to Condensed Consolidated Financial Statements | Fair Value
|
||
In determining the changes in the instrument-specific credit risk for loans, the changes in the associated credit-related components of these loans, primarily the guaranty obligation, were taken into consideration with the change in the fair value of the loans for which we elected the fair value option for financial instruments. In determining the changes in the instrument-specific credit risk for debt, the changes in Fannie Mae debt spreads to LIBOR that occurred during the period were taken into consideration with the change in the fair value of the debt for which we elected the fair value option for financial instruments. Specifically, cash flows are evaluated taking into consideration any derivatives through which Fannie Mae has swapped out of the structured features of the notes and thus created a floating-rate LIBOR-based debt instrument. The change in value of these LIBOR-based cash flows based on the Fannie Mae yield curve at the beginning and end of the period represents the instrument-specific credit risk.
15
.
Commitments and Contingencies
We are party to various types of legal actions and proceedings, including actions brought on behalf of various classes of claimants. We also are subject to regulatory examinations, inquiries and investigations, and other information gathering requests. In some of the matters, indeterminate amounts are sought. Modern pleading practice in the U.S. permits considerable variation in the assertion of monetary damages or other relief. Jurisdictions may permit claimants not to specify the monetary damages sought or may permit claimants to state only that the amount sought is sufficient to invoke the jurisdiction of the trial court. This variability in pleadings, together with our and our counsel’s actual experience in litigating or settling claims, leads us to conclude that the monetary relief that may be sought by plaintiffs bears little relevance to the merits or disposition value of claims.
On a quarterly basis, we review relevant information about all pending legal actions and proceedings for the purpose of evaluating and revising our contingencies, accruals and disclosures.
We have substantial and valid defenses to the claims in the proceedings described below and intend to defend these matters vigorously. However, legal actions and proceedings of all types are subject to many uncertain factors that generally cannot be predicted with assurance. Accordingly, the outcome of any given matter and the amount or range of potential loss at particular points in time is frequently difficult to ascertain. Uncertainties can include how fact finders will evaluate documentary evidence and the credibility and effectiveness of witness testimony, and how courts will apply the law. Disposition valuations are also subject to the uncertainty of how opposing parties and their counsel may view the evidence and applicable law.
We establish an accrual for matters when a loss is probable and we can reasonably estimate the amount of such loss. For legal actions or proceedings where there is only a reasonable possibility that a loss may be incurred, or where we are not currently able to estimate the reasonably possible loss or range of loss, we do not establish an accrual. We are often unable to estimate the possible losses or ranges of losses, particularly for proceedings that are in their early stages of development, where plaintiffs seek indeterminate or unspecified damages, where there may be novel or unsettled legal questions relevant to the proceedings, or where settlement negotiations have not occurred or progressed.
Given the uncertainties involved in any action or proceeding, regardless of whether we have established an accrual, the ultimate resolution of certain of these matters may be material to our operating results for a particular period, depending on, among other factors, the size of the loss or liability imposed and the level of our net income or loss for that period.
In addition to the matters specifically described below, we are involved in a number of legal and regulatory proceedings that arise in the ordinary course of business that we do not expect will have a material impact on our business or financial condition. We have also advanced fees and expenses of certain current and former officers and directors in connection with various legal proceedings pursuant to our bylaws and indemnification agreements.
Senior Preferred Stock Purchase Agreements Litigation
A number of putative class action lawsuits were filed in the U.S. District Court for the District of Columbia against us, FHFA as our conservator, Treasury and Freddie Mac from July through September 2013 by shareholders of Fannie Mae and/or Freddie Mac challenging the August 2012 amendment to each company’s senior preferred stock purchase agreement with Treasury. These lawsuits were consolidated and, on December 3, 2013, plaintiffs (preferred and common shareholders of Fannie Mae and/or Freddie Mac) filed a consolidated class action complaint in the U.S. District Court for the District of Columbia against us, FHFA as our conservator, Treasury and Freddie Mac (“
In re Fannie Mae/Freddie Mac Senior Preferred Stock Purchase Agreement Class Action
|
Fannie Mae (In conservatorship) Third Quarter 2017 Form 10-Q
|
116
|
|
|
Notes to Condensed Consolidated Financial Statements | Commitments and Contingencies
|
||
Litigations
”). The preferred shareholder plaintiffs allege that the net worth sweep dividend provisions of the senior preferred stock that were implemented pursuant to the August 2012 amendments to the senior preferred stock purchase agreements nullified certain of the shareholders’ rights, particularly the right to receive dividends. The common shareholder plaintiffs allege that the August 2012 amendments constituted a taking of their property by requiring that all future profits of Fannie Mae and Freddie Mac be paid to Treasury. Plaintiffs allege claims for breach of contract and breach of the implied covenant of good faith and fair dealing against us, FHFA and Freddie Mac, a takings claim against FHFA and Treasury, and a breach of fiduciary duty claim derivatively on our and Freddie Mac’s behalf against FHFA and Treasury. Plaintiffs seek to represent several classes of preferred and/or common shareholders of Fannie Mae and/or Freddie Mac who held stock as of the public announcement of the August 2012 amendments. Plaintiffs seek unspecified damages, equitable and injunctive relief, and costs and expenses, including attorneys’ fees.
A non-class action suit,
Arrowood Indemnity Company v. Fannie Mae
, was filed in the U.S. District Court for the District of Columbia on September 20, 2013 by preferred shareholders against us, FHFA as our conservator, the Director of FHFA (in his official capacity), Treasury, the Secretary of the Treasury (in his official capacity) and Freddie Mac. Plaintiffs bring claims for breach of contract and breach of the implied covenant of good faith and fair dealing against us, FHFA and Freddie Mac, and claims for violation of the Administrative Procedure Act against the FHFA and Treasury defendants, alleging that the net worth sweep dividend provisions nullified certain rights of the preferred shareholders, particularly the right to receive dividends. Plaintiffs seek damages, equitable and injunctive relief, and costs and expenses, including attorneys’ fees.
On September 30, 2014, the court dismissed both lawsuits and plaintiffs in both suits filed timely notices of appeal. On February 21, 2017, the U.S. Court of Appeals for the D.C. Circuit affirmed the district court’s dismissal of the claims alleging violation of the Administrative Procedure Act, but reversed the district court’s dismissal of the claims alleging breach of the implied covenant of good faith and fair dealing and one of the breach of contract claims
. The court also ruled that the class-action plaintiffs could seek leave in the district court to amend their claim for breach of fiduciary duty from a derivative to a direct claim. On July 17, 2017, the Court of Appeals issued a revised opinion allowing certain plaintiffs to continue to maintain their breach of the implied covenant of good faith and fair dealing and breach of contract claims that the original opinion had found not properly preserved, and modifying its discussion of the standard that applies to the breach of implied covenant claim. On October 16, 2017, the plaintiffs filed
petitions for certiorari
with the United States Supreme Court seeking review of the Court of Appeals’ ruling upholding the district court’s dismissal of claims alleging violation of the Administrative Procedure Act.
On August 2, 2017, shareholder David J. Voacolo filed a lawsuit,
Voacolo v. Fannie Mae
, in the U.S. District Court for the District of New Jersey against Fannie Mae and the United States alleging that the net worth sweep dividend provisions of the senior preferred stock that were implemented pursuant to the August 2012 amendments to the senior preferred stock purchase agreements were a violation of due process and an illegal exaction. Plaintiff seeks damages only.
Given the stage of these lawsuits, the substantial and novel legal questions that remain, and our substantial defenses, we are currently unable to estimate the reasonably possible loss or range of loss arising from this litigation.
|
Fannie Mae (In conservatorship) Third Quarter 2017 Form 10-Q
|
117
|
|
|
Quantitative and Qualitative Disclosures about Market Risk
|
||
Information about market risk is set forth in “MD&A—Risk Management—Market Risk Management, Including Interest Rate Risk Management.”
Overview
We are required under applicable laws and regulations to maintain controls and procedures, which include disclosure controls and procedures as well as internal control over financial reporting, as further described below.
Evaluation of Disclosure Controls and Procedures
Disclosure Controls and Procedures
Disclosure controls and procedures refer to controls and other procedures designed to provide reasonable assurance that information required to be disclosed in the reports we file or submit under the Exchange Act is recorded, processed, summarized and reported within the time periods specified in the rules and forms of the SEC. Disclosure controls and procedures include, without limitation, controls and procedures designed to provide reasonable assurance that information required to be disclosed by us in the reports that we file or submit under the Exchange Act is accumulated and communicated to management, including our Chief Executive Officer and Chief Financial Officer, as appropriate, to allow timely decisions regarding our required disclosure. In designing and evaluating our disclosure controls and procedures, management recognizes that any controls and procedures, no matter how well designed and operated, can provide only reasonable assurance of achieving the desired control objectives, and management was required to apply its judgment in evaluating and implementing possible controls and procedures.
Evaluation of Disclosure Controls and Procedures
As required by Rule 13a-15 under the Exchange Act, management has evaluated, with the participation of our Chief Executive Officer and Chief Financial Officer, the effectiveness of our disclosure controls and procedures as in effect as of
September 30, 2017
, the end of the period covered by this report. As a result of management’s evaluation, our Chief Executive Officer and Chief Financial Officer concluded that our disclosure controls and procedures were not effective at a reasonable assurance level as of
September 30, 2017
or as of the date of filing this report.
Our disclosure controls and procedures were not effective as of
September 30, 2017
or as of the date of filing this report because they did not adequately ensure the accumulation and communication to management of information known to FHFA that is needed to meet our disclosure obligations under the federal securities laws. As a result, we were not able to rely upon the disclosure controls and procedures that were in place as of
September 30, 2017
or as of the date of this filing, and we continue to have a material weakness in our internal control over financial reporting. This material weakness is described in more detail below under “Description of Material Weakness.” Based on discussions with FHFA and the structural nature of this material weakness, we do not expect to remediate this material weakness while we are under conservatorship.
Description of Material Weakness
The Public Company Accounting Oversight Board’s Auditing Standard 2201 defines a material weakness as a deficiency, or a combination of deficiencies, in internal control over financial reporting, such that there is a reasonable possibility that a material misstatement of the company’s annual or interim financial statements will not be prevented or detected on a timely basis.
Management has determined that we continued to have the following material weakness as of
September 30, 2017
and as of the date of filing this report:
|
•
|
Disclosure Controls and Procedures.
We have been under the conservatorship of FHFA since September 6, 2008. Under the GSE Act, FHFA is an independent agency that currently functions as both our conservator and our regulator with respect to our safety, soundness and mission. Because of the nature of the conservatorship under the GSE Act, which places us under the “control” of FHFA (as that term is defined by securities laws), some of the information that we may need to meet our disclosure obligations may be solely within the knowledge of FHFA. As our conservator, FHFA has the power to take actions
|
|
Fannie Mae Third Quarter 2017 Form 10-Q
|
118
|
|
|
Controls and Procedures
|
||
without our knowledge that could be material to our shareholders and other stakeholders, and could significantly affect our financial performance or our continued existence as an ongoing business. Although we and FHFA attempted to design and implement disclosure policies and procedures that would account for the conservatorship and accomplish the same objectives as a disclosure controls and procedures policy of a typical reporting company, there are inherent structural limitations on our ability to design, implement, test or operate effective disclosure controls and procedures. As both our regulator and our conservator under the GSE Act, FHFA is limited in its ability to design and implement a complete set of disclosure controls and procedures relating to Fannie Mae, particularly with respect to current reporting pursuant to Form 8-K. Similarly, as a regulated entity, we are limited in our ability to design, implement, operate and test the controls and procedures for which FHFA is responsible.
Due to these circumstances, we have not been able to update our disclosure controls and procedures in a manner that adequately ensures the accumulation and communication to management of information known to FHFA that is needed to meet our disclosure obligations under the federal securities laws, including disclosures affecting our condensed consolidated financial statements. As a result, we did not maintain effective controls and procedures designed to ensure complete and accurate disclosure as required by GAAP as of
September 30, 2017
or as of the date of filing this report. Based on discussions with FHFA and the structural nature of this weakness, we do not expect to remediate this material weakness while we are under conservatorship.
Mitigating Actions Related to Material Weakness
As described above under “Description of Material Weakness,” we continue to have a material weakness in our internal control over financial reporting relating to our disclosure controls and procedures. However, we and FHFA have engaged in the following practices intended to permit accumulation and communication to management of information needed to meet our disclosure obligations under the federal securities laws:
|
•
|
FHFA has established the Division of Conservatorship, which is intended to facilitate operation of the company with the oversight of the conservator.
|
|
•
|
We have provided drafts of our SEC filings to FHFA personnel for their review and comment prior to filing. We also have provided drafts of external press releases, statements and speeches to FHFA personnel for their review and comment prior to release.
|
|
•
|
FHFA personnel, including senior officials, have reviewed our SEC filings prior to filing, including this quarterly report on Form 10-Q for the quarter ended
September 30, 2017
(“Third Quarter
2017
Form 10-Q”), and engaged in discussions regarding issues associated with the information contained in those filings. Prior to filing our Third Quarter
2017
Form 10-Q, FHFA provided Fannie Mae management with a written acknowledgment that it had reviewed the Third Quarter
2017
Form 10-Q, and it was not aware of any material misstatements or omissions in the Third Quarter
2017
Form 10-Q and had no objection to our filing the Third Quarter
2017
Form 10-Q.
|
|
•
|
The Director of FHFA and our Chief Executive Officer have been in frequent communication and meet on a regular basis.
|
|
•
|
FHFA representatives attend meetings frequently with various groups within the company to enhance the flow of information and to provide oversight on a variety of matters, including accounting, credit and market risk management, external communications and legal matters.
|
|
•
|
Senior officials within FHFA’s Office of the Chief Accountant have met frequently with our senior finance executives regarding our accounting policies, practices and procedures.
|
Changes in Internal Control over Financial Reporting
Management has evaluated, with the participation of our Chief Executive Officer and Chief Financial Officer, whether any changes in our internal control over financial reporting that occurred during our last fiscal quarter have materially affected, or are reasonably likely to materially affect, our internal control over financial reporting. There have been no changes in our internal control over financial reporting since
June 30, 2017
that management believes have materially affected, or are reasonably likely to materially affect, our internal control over financial reporting.
|
Fannie Mae Third Quarter 2017 Form 10-Q
|
119
|
|
|
Other Information
|
||
The information in this item supplements and updates information regarding certain legal proceedings set forth in “Legal Proceedings” in our
2016
Form 10-K, our First Quarter 2017 Form 10-Q and our Second Quarter 2017 Form 10-Q. We also provide information regarding material legal proceedings in “
Note 15, Commitments and Contingencies
,” which is incorporated herein by reference. In addition to the matters specifically described or incorporated by reference in this item, we are involved in a number of legal and regulatory proceedings that arise in the ordinary course of business that do not have a material impact on our business. Litigation claims and proceedings of all types are subject to many factors that generally cannot be predicted accurately.
We record accruals for legal claims when losses associated with those claims become probable and the amounts can be reasonably estimated. The actual costs of resolving legal claims may be substantially higher or lower than the amounts accrued for those claims. For matters where the likelihood or extent of a loss is not probable or cannot be reasonably estimated, we do not recognize in our condensed consolidated financial statements the potential liability that may result from these matters. Except for matters that have been settled, we presently cannot determine the ultimate resolution of the matters described below or incorporated by reference into this item or in our
2016
Form 10-K, our First Quarter 2017 Form 10-Q or our Second Quarter 2017 Form 10-Q. If certain of these matters are determined against us, FHFA or Treasury, it could have a material adverse effect on our results of operations, liquidity and financial condition, including our net worth.
FHFA Private-Label Mortgage-Related Securities Litigation
In September 2011, FHFA, in its role as conservator of Fannie Mae and Freddie Mac, filed a lawsuit against The Royal Bank of Scotland Group plc and certain related entities and individuals (collectively, “RBS”) in the U.S. District Court for the District of Connecticut alleging violations of federal and state securities laws in connection with private-label mortgage-backed securities RBS sold to Fannie Mae and Freddie Mac. At the same time, FHFA also filed a lawsuit in the U.S. District Court for the Southern District of New York against Nomura Holdings Inc., RBS Securities Inc. and certain related entities and individuals (collectively “Nomura”) alleging similar violations of federal and state securities laws in connection with Nomura related private-label mortgage-backed securities sold to Fannie Mae and Freddie Mac. On July 12, 2017, FHFA, on behalf of Fannie Mae and Freddie Mac as our conservator, entered into a
$5.5 billion
settlement agreement with RBS resolving all claims in the RBS lawsuit. RBS paid us approximately
$975 million
of the settlement amount in August 2017. On September 28, 2017, the U.S. Court of Appeals for the Second Circuit affirmed the district court’s May 15, 2015 judgment in favor of FHFA in the Nomura case.
Senior Preferred Stock Purchase Agreements Litigation
Between June 2013 and June 2017, several lawsuits were filed by preferred and common stockholders of Fannie Mae and Freddie Mac in multiple federal courts against one or more of the United States, Treasury and FHFA, challenging actions taken by the defendants relating to the senior preferred stock purchase agreements and the conservatorships of Fannie Mae and Freddie Mac. Some of these lawsuits also contain claims against Fannie Mae and Freddie Mac. The legal claims being advanced by one or more of these lawsuits include challenges to the net worth sweep dividend provisions of the senior preferred stock that were implemented pursuant to the August 2012 amendments to the agreements, the payment of dividends to Treasury under the net worth sweep dividend provisions, and FHFA’s decision to require Fannie Mae and Freddie Mac to draw funds from Treasury in order to pay dividends to Treasury prior to the August 2012 amendments. The plaintiffs seek various forms of equitable and injunctive relief, including rescission of the August 2012 amendments, as well as damages. The cases that remain pending or were terminated after
June 30, 2017
are as follows:
District of Columbia.
On September 30, 2014, the U.S. District Court for the District of Columbia dismissed all but one of the cases then pending before that court. The plaintiffs in each of the dismissed cases filed a notice of appeal. The plaintiffs in the case that was not dismissed by the court voluntarily dismissed their lawsuit on October 31, 2014. On February 21, 2017, the Court of Appeals for the District of Columbia Circuit affirmed in part and reversed in part the district court’s dismissal of the cases filed in the U.S. District Court for the District of Columbia. On July 17, 2017, the Court of Appeals issued a revised opinion allowing certain plaintiffs to continue to maintain certain claims the original opinion had found not properly preserved, and modifying its discussion of the standard that applies to one of those claims. On October 16, 2017, the plaintiffs filed petitions for certiorari with the United States Supreme Court seeking review of the Court of Appeals' ruling upholding the district court's
|
Fannie Mae Third Quarter 2017 Form 10-Q
|
120
|
|
|
Other Information
|
||
dismissal of certain claims. Fannie Mae is a defendant in this action, which is described in “Note 15, Commitments and Contingencies.”
Eastern District of Kentucky.
On September 9, 2016, the U.S. District Court for the Eastern District of Kentucky dismissed the case pending before it. The plaintiff in that case filed a notice of appeal and the appeal was docketed on November 17, 2016.
Northern District of Illinois.
On March 20, 2017, the U.S. District Court for the Northern District of Illinois dismissed the case pending before it. The plaintiff in that case filed a notice of appeal and the appeal was docketed on April 27, 2017. Oral argument was held in the appeal on October 30, 2017.
Northern District of Iowa.
On March 27, 2017, the U.S. District Court for the Northern District of Iowa dismissed the case pending before it. The plaintiff in that case filed a notice of appeal and the appeal was docketed on April 4, 2017.
Southern District of Texas.
On May 22, 2017, the U.S. District Court for the Southern District of Texas dismissed the case pending before it. The plaintiff in that case filed a notice of appeal and the appeal was docketed on May 30, 2017.
Western District of Michigan and District of Minnesota.
On June 1, 2017 and June 22, 2017, preferred and common stockholders of Fannie Mae and Freddie Mac filed complaints for declaratory and injunctive relief against FHFA and Treasury in the U.S. District Court for the Western District of Michigan and the U.S. District Court for the District of Minnesota. The complaints, which also ask the courts to set aside the net worth sweep dividend provisions of the senior preferred stock purchase agreements, allege that FHFA’s structure violates constitutional requirements, including: presidential removal authority; separation of powers; the appointments clause; the nondelegation doctrine; and the private nondelegation doctrine.
District of New Jersey.
On August 2, 2017, shareholder David J. Voacolo filed a lawsuit against Fannie Mae and the United States in the U.S. District Court for the District of New Jersey alleging that the net worth sweep dividend provisions of the senior preferred stock that were implemented in August 2012 were a violation of due process and an illegal exaction. Plaintiff seeks damages only.
U.S. Court of Federal Claims.
Fannie Mae is a nominal defendant in two actions filed against the United States in the U.S. Court of Federal Claims:
Fisher v. United States of America
, filed on December 2, 2013, and
Rafter v. United States of America
, filed on August 14, 2014. Plaintiffs in these cases allege that the net worth sweep dividend provisions of the senior preferred stock that were implemented pursuant to the August 2012 amendment to the senior preferred stock purchase agreement constitute a taking of Fannie Mae’s property without just compensation in violation of the U.S. Constitution. The
Fisher
plaintiffs are pursuing this claim derivatively on behalf of Fannie Mae, while the
Rafter
plaintiffs are pursing the claim directly against the United States. Plaintiffs in
Rafter
also allege a derivative claim that the government breached an implied contract with Fannie Mae’s Board of Directors by implementing the net worth sweep dividend provisions. Plaintiffs in
Fisher
request just compensation to Fannie Mae in an unspecified amount. Plaintiffs in
Rafter
seek just compensation for themselves on their constitutional claim and payment of damages to Fannie Mae on their derivative claim for breach of an implied contract. The United States filed a motion to dismiss the
Fisher
case on January 23, 2014; however, the court has stayed proceedings in this case until discovery in a related case,
Fairholme Funds v. United States
, is complete. The plaintiffs in
Fisher, Rafter
and the other cases pending before the court have 45 days after completion of discovery in
Fairholme Funds
to file amended complaints. The United States must file an omnibus motion to dismiss all cases within 120 days after the deadline for filing amended complaints.
District of Delaware.
Fannie Mae is also a nominal defendant in a case filed against FHFA and Treasury in the U.S. District Court for the District of Delaware:
Jacobs v. FHFA,
filed on August 17, 2015. The plaintiffs allege that the net worth sweep dividend provisions of the senior preferred stock that were implemented pursuant to the August 2012 amendments to the agreements violate Delaware law. The plaintiffs are pursuing this claim derivatively on behalf of Fannie Mae and directly against the government. The plaintiffs amended their complaint on March 16, 2017 to add unjust enrichment claims against FHFA and Treasury. The defendants filed motions to dismiss on April 17, 2017.
In addition to the information in this report, you should carefully consider the risks relating to our business that we identify in “Risk Factors” in our
2016
Form 10-K. This section supplements and updates that discussion. Please
|
Fannie Mae Third Quarter 2017 Form 10-Q
|
121
|
|
|
Other Information
|
||
also refer to “MD&A—Risk Management” in this report and in our
2016
Form 10-K for more detailed descriptions of the primary risks to our business and how we seek to manage those risks.
The risks we face could materially adversely affect our business, results of operations, financial condition, liquidity and net worth, and could cause our actual results to differ materially from our past results or the results contemplated by forward-looking statements contained in this report. However, these are not the only risks we face. In addition to the risks we discuss below and in our
2016
Form 10-K, we face risks and uncertainties not currently known to us or that we currently believe are immaterial.
The future of our company is uncertain.
There continues to be significant uncertainty regarding the future of our company, including how long the company will continue to exist in its current form, the extent of our role in the market, how long we will be in conservatorship, what form we will have and what ownership interest, if any, our current common and preferred stockholders will hold in us after the conservatorship is terminated, and whether we will continue to exist following conservatorship. The conservatorship is indefinite in duration and the timing, conditions and likelihood of our emerging from conservatorship are uncertain. Our conservatorship could terminate through a receivership. Termination of the conservatorship, other than in connection with a receivership, requires Treasury’s consent under the senior preferred stock purchase agreement.
The previous Administration endorsed the wind down of Fannie Mae and Freddie Mac through a responsible transition and the enactment of comprehensive housing finance reform legislation. The current Administration has not articulated a formal position on housing finance reform or the future of the GSEs; however, the Secretary of the Treasury has publicly stated that he is focused on housing finance reform and a solution to the current status of Fannie Mae and Freddie Mac.
We expect that Congress will continue to consider legislation that could result in significant changes in our structure and role in the future, including proposals that would result in Fannie Mae’s liquidation or dissolution. Congress, FHFA or other agencies may also consider legislation or regulation aimed at or having the effect of increasing the competition we face, reducing our market share, expanding our obligations to provide funds to Treasury, constraining our business operations, or subjecting us to new obligations, such as the Freedom of Information Act, that could impose substantial burdens or adversely affect our results of operations or financial condition. We cannot predict the prospects for the enactment, timing or final content of housing finance reform legislation or other legislation related to our activities. See “Business—Legislation and Regulation—Housing Finance Reform” in our
2016
Form 10-K and “MD&A—Legislation and Regulation—Housing Finance Reform” in our First Quarter 2017 Form 10-Q for more information about recent actions and statements relating to housing finance reform from Congress, as well as actions our conservator has been taking to further housing finance reform.
A breach of the security of our systems or facilities, or those of third parties with which we do business, including as a result of cyber attacks, could damage or disrupt our business or result in the disclosure or misuse of confidential information, which could damage our reputation, increase our costs and cause losses.
Our operations rely on the secure receipt, processing, storage and transmission of confidential and other information in our computer systems and networks and with our business partners, including proprietary, confidential or personal information that is subject to privacy laws, regulations or contractual obligations. Information security risks for large institutions like us have significantly increased in recent years in part because of the proliferation of new technologies and the use of the Internet and telecommunications technologies to conduct or automate financial transactions. There have been several recent, highly publicized cases involving financial services companies, consumer-based companies and other organizations reporting the unauthorized disclosure of client, customer or other confidential information, as well as cyber attacks involving the dissemination, theft and destruction of corporate information, intellectual property, cash or other valuable assets. There have also been several highly publicized cases where hackers have requested “ransom” payments in exchange for not disclosing customer information or for not making the targets’ computer systems unavailable.
We have been, and likely will continue to be, the target of attempted cyber attacks, computer viruses, malicious code, phishing attacks, denial of service attacks and other information security threats. To date, cyber attacks have not had a material impact on our financial condition, results, or business; however, we could suffer material financial or other losses in the future and we are not able to predict the severity of these attacks. Our risk and
|
Fannie Mae Third Quarter 2017 Form 10-Q
|
122
|
|
|
Other Information
|
||
exposure to these matters remains heightened because of, among other things, the evolving nature of these threats, the current global economic and political environment, our prominent size and scale and our role in the financial services industry, the outsourcing of some of our business operations, the ongoing shortage of qualified cyber security professionals, and the interconnectivity and interdependence of third parties to our systems.
Despite our efforts to ensure the integrity of our software, computers, systems and information, we may not be able to anticipate, detect or recognize threats to our systems and assets, or to implement effective preventive measures against all cyber threats, especially because the techniques used are increasingly sophisticated, change frequently, are complex, and are often not recognized until launched. We routinely identify cyber threats as well as vulnerabilities in our systems and work to address them, but these efforts may be insufficient. Cyber attacks can originate from a variety of sources, including external parties who are affiliated with foreign governments or are involved with organized crime or terrorist organizations. Third parties may also attempt to induce employees, clients or other users of our systems to disclose sensitive information or provide access to our systems or network, or to our data or that of our counterparties or borrowers, and these types of risks may be difficult to detect or prevent.
The occurrence of a cyber attack, breach, unauthorized access, misuse, computer virus or other malicious code or other cyber security event could jeopardize or result in the unauthorized disclosure, gathering, monitoring, misuse, corruption, loss or destruction of confidential and other information that belongs to us, our customers, our counterparties, third-party service providers or borrowers that is processed and stored in, and transmitted through, our computer systems and networks. The occurrence of such an event could also result in damage to our software, computers or systems, or otherwise cause interruptions or malfunctions in our, our customers’, our counterparties’ or third parties’ operations. This could result in significant losses, loss of customers and business opportunities, reputational damage, litigation, regulatory fines, penalties or intervention, reimbursement or other compensatory costs, or otherwise adversely affect our business, financial condition or results of operations.
A cyber attack could occur and persist for an extended period of time without detection. We expect that any investigation of a cyber attack would be inherently unpredictable and that it would take time before the completion of any investigation and before there is availability of full and reliable information. During such time we would not necessarily know the extent of the harm or how best to remediate it, and certain errors or actions could be repeated or compounded before they are discovered and remediated. In addition, announcing that a cyber attack has occurred increases the risk of additional cyber attacks, and preparing for this elevated risk can delay the announcement of a cyber attack. All or any of these challenges could further increase the costs and consequences of a cyber attack.
In addition, we may be required to expend significant additional resources to modify our protective measures and to investigate and remediate vulnerabilities or other exposures arising from operational and security risks. Although we maintain insurance coverage relating to cybersecurity risks, our insurance may not be sufficient to provide adequate loss coverage in all circumstances.
Because we are interconnected with and dependent on third-party vendors, exchanges, clearing houses, fiscal and paying agents, and other financial institutions, we could be adversely impacted if any of them is subject to a successful cyber attack or other information security event. For example, if a data breach compromises the integrity of borrower data that we or our customers rely on, it could adversely affect our operations or financial results. Third parties with which we do business may also be sources of cybersecurity or other technological risks. We outsource certain functions and these relationships allow for the external storage and processing of our information, as well as customer, counterparty and borrower information, including on cloud-based systems. We also share this type of information with regulatory agencies and their vendors. While we engage in actions to mitigate our exposure resulting from our information-sharing activities, ongoing threats may result in unauthorized access, loss or destruction of data or other cybersecurity incidents with increased costs and consequences to us such as those described above.
We routinely transmit and receive personal, confidential and proprietary information by electronic means. We have discussed and worked with clients, vendors, service providers, counterparties and other third parties to develop secure transmission capabilities and protect against cyber attacks, but we do not have, and may be unable to put in place, secure capabilities with all of our clients, vendors, service providers, counterparties and other third parties and we may not be able to ensure that these third parties have appropriate controls in place to protect the confidentiality of the information. An interception, misuse or mishandling of personal, confidential or proprietary information being sent to or received from a client, vendor, service provider, counterparty or other third party could result in legal liability, regulatory action and reputational harm.
|
Fannie Mae Third Quarter 2017 Form 10-Q
|
123
|
|
|
Other Information
|
||
A decline in activity in the U.S. housing market, increasing interest rates, or changes in tax laws could lower our business volumes or otherwise adversely affect our results of operations, net worth and financial condition.
Our business volume is affected by the rate of growth in total U.S. residential mortgage debt outstanding and the size of the U.S. residential mortgage market. A decline in mortgage debt outstanding reduces the unpaid principal balance of mortgage loans available for us to acquire, which in turn could reduce our net interest income. Even if we were able to increase our share of the secondary mortgage market, it may not be sufficient to make up for a decline in the rate of growth in mortgage originations.
Mortgage interest rates also affect our business volume. Rising interest rates generally result in fewer mortgage originations, particularly for refinances. An increase in interest rates, particularly if the increase is sudden and steep, could significantly reduce our business volume. Significant reductions in our business volume could adversely affect our results of operations and financial condition. The Federal Reserve raised the target range for the federal funds rate in December 2015, December 2016, March 2017 and June 2017. In September 2017, the Federal Reserve stated that it expects economic conditions will evolve in a manner that will warrant gradual increases in the federal funds rate; however, the actual path of the federal funds rate will depend on the economic outlook as informed by incoming data. The Federal Reserve may increase rates at a faster rate than it is currently expecting. Moreover, the Federal Reserve’s federal funds rate path is not the only factor that affects long-term interest rates. Accordingly, our business remains subject to the risk of sudden and steep interest rate increases.
Changes in tax laws may also adversely affect housing demand, home prices or other housing or mortgage market conditions, which could adversely affect our results of operations, net worth and financial condition.
The Federal Reserve’s balance sheet normalization program could adversely affect our business, results of operations, financial condition, liquidity and net worth.
In recent years, the Federal Reserve has purchased a significant amount of mortgage-backed securities issued by us, Freddie Mac and Ginnie Mae. The Federal Reserve began to taper these purchases in January 2014 and concluded its asset purchase program in October 2014. From October 2014 through September 2017, the Federal Reserve maintained a policy of reinvesting principal payments from its holdings of agency debt and agency mortgage-backed securities in agency mortgage-backed securities; therefore, it continued to purchase a significant amount of agency mortgage-backed securities. In October 2017, the Federal Reserve initiated the balance sheet normalization program the Federal Open Market Committee described in June 2017. Under this program, the Federal Reserve’s securities holdings will be gradually reduced by decreasing reinvestment of principal payments from those securities. We expect the Federal Reserve’s balance sheet normalization program likely will result, in the longer term, in increases in mortgage interest rates and a widening of mortgage spreads, which could adversely affect our business volume and reduce demand for Fannie Mae MBS. If this occurs, it could adversely affect our business, results of operations, financial condition, liquidity and net worth.
Recent Sales of Unregistered Securities
Under the terms of our senior preferred stock purchase agreement with Treasury, we are prohibited from selling or issuing our equity interests, other than as required by (and pursuant to) the terms of a binding agreement in effect on September 7, 2008, without the prior written consent of Treasury. During the quarter ended
September 30, 2017
, we did not sell any equity securities.
Information about Certain Securities Issuances by Fannie Mae
Pursuant to SEC regulations, public companies are required to disclose certain information when they incur a material direct financial obligation or become directly or contingently liable for a material obligation under an off-balance sheet arrangement. The disclosure must be made in a current report on Form 8-K under Item 2.03 or, if the obligation is incurred in connection with certain types of securities offerings, in prospectuses for that offering that are filed with the SEC.
Because the securities we issue are exempted securities under the Securities Act of 1933, we do not file registration statements or prospectuses with the SEC with respect to our securities offerings. To comply with the disclosure requirements of Form 8-K relating to the incurrence of material financial obligations, we report our incurrence of these types of obligations either in offering circulars or prospectuses (or supplements thereto) that
|
Fannie Mae Third Quarter 2017 Form 10-Q
|
124
|
|
|
Other Information
|
||
we post on our website or in a current report on Form 8-K that we file with the SEC, in accordance with a “no-action” letter we received from the SEC staff in 2004. In cases where the information is disclosed in a prospectus or offering circular posted on our website, the document will be posted on our website within the same time period that a prospectus for a non-exempt securities offering would be required to be filed with the SEC.
The website address for disclosure about our debt securities is www.fanniemae.com/debtsearch. From this address, investors can access the offering circular and related supplements for debt securities offerings under Fannie Mae’s universal debt facility, including pricing supplements for individual issuances of debt securities.
Disclosure about our obligations pursuant to some of the MBS we issue, some of which may be off-balance sheet obligations, can be found at www.fanniemae.com/mbsdisclosure. From this address, investors can access information and documents about our MBS, including prospectuses and related prospectus supplements.
We are providing our website address solely for your information. Information appearing on our website is not incorporated into this report.
Our Purchases of Equity Securities
We did not repurchase any of our equity securities during the
third
quarter of
2017
.
Dividend Restrictions
Our payment of dividends is subject to the following restrictions:
Restrictions Relating to Conservatorship.
Our conservator announced on September 7, 2008 that we would not pay any dividends on the common stock or on any series of preferred stock, other than the senior preferred stock. In addition, FHFA’s regulations relating to conservatorship and receivership operations prohibit us from paying any dividends while in conservatorship unless authorized by the Director of FHFA. The Director of FHFA has directed us to make dividend payments on the senior preferred stock on a quarterly basis.
Restrictions Under Senior Preferred Stock Purchase Agreement.
The senior preferred stock purchase agreement prohibits us from declaring or paying any dividends on Fannie Mae equity securities (other than the senior preferred stock) without the prior written consent of Treasury. In addition, in 2012 the terms of the senior preferred stock purchase agreement and the senior preferred stock were amended to require that we pay Treasury each quarter any dividends declared consisting of the amount, if any, by which our net worth as of the end of the immediately preceding fiscal quarter exceeds an applicable capital reserve amount, which will decrease to zero in the first quarter of 2018. As a result, our net income is not available to common stockholders. For more information on the terms of the senior preferred stock purchase agreement and senior preferred stock, see “Business—Conservatorship and Treasury Agreements—Treasury Agreements—Senior Preferred Stock Purchase Agreement and Related Issuance of Senior Preferred Stock and Common Stock Warrant” in our
2016
Form 10-K.
Additional Restrictions Relating to Preferred Stock.
Payment of dividends on our common stock is also subject to the prior payment of dividends on our preferred stock and our senior preferred stock. Payment of dividends on all outstanding preferred stock, other than the senior preferred stock, is also subject to the prior payment of dividends on the senior preferred stock.
Statutory Restrictions.
Under the GSE Act, FHFA has authority to prohibit capital distributions, including payment of dividends, if we fail to meet our capital requirements. If FHFA classifies us as significantly undercapitalized, approval of the Director of FHFA is required for any dividend payment. Under the Charter Act and the GSE Act, we are not permitted to make a capital distribution if, after making the distribution, we would be undercapitalized. The Director of FHFA, however, may permit us to repurchase shares if the repurchase is made in connection with the issuance of additional shares or obligations in at least an equivalent amount and will reduce our financial obligations or otherwise improve our financial condition.
None.
None.
|
Fannie Mae Third Quarter 2017 Form 10-Q
|
125
|
|
|
Other Information
|
||
None.
The exhibits listed below are being filed with this report.
|
Item
|
Description
|
|
|
3.1
|
||
|
3.2
|
||
|
31.1
|
||
|
31.2
|
||
|
32.1
|
||
|
32.2
|
||
|
101. INS
|
XBRL Instance Document*
|
|
|
101. SCH
|
XBRL Taxonomy Extension Schema*
|
|
|
101. CAL
|
XBRL Taxonomy Extension Calculation*
|
|
|
101. DEF
|
XBRL Taxonomy Extension Definition*
|
|
|
101. LAB
|
XBRL Taxonomy Extension Label*
|
|
|
101. PRE
|
XBRL Taxonomy Extension Presentation*
|
|
__________
|
*
|
The financial information contained in these XBRL documents is unaudited.
|
|
Fannie Mae Third Quarter 2017 Form 10-Q
|
126
|
|
|
Signatures
|
||
SIGNATURES
Pursuant to the requirements of the Securities Exchange Act of 1934, the registrant has duly caused this report to be signed on its behalf by the undersigned thereunto duly authorized.
|
Federal National Mortgage Association
|
||
|
By:
|
/s/ Timothy J. Mayopoulos
|
|
|
Timothy J. Mayopoulos
President and Chief Executive Officer |
||
Date:
November 2, 2017
|
By:
|
/s/ David C. Benson
|
|
|
David C. Benson
Executive Vice President and
Chief Financial Officer
|
||
Date:
November 2, 2017
|
Fannie Mae Third Quarter 2017 Form 10-Q
|
127
|
|

TABLE OF CONTENTS
Part I Financial InformationItem 2. Management S Discussion and Analysis Of Financial Condition and Results Of OperationsNote 15, Commitments and ContingenciesNote 3, Mortgage LoansNote 5, Investments in SecuritiesNote 1, Summary Of Significant Accounting PoliciesNote 7, Short-term Borrowings and Long-term DebtNote 8, Derivative InstrumentsNote 13, Netting ArrangementsItem 1. Financial StatementsNote 4, Allowance For Loan LossesNote 6, Financial GuaranteesNote 14, Fair ValueItem 3. Quantitative and Qualitative Disclosures About Market RiskItem 4. Controls and ProceduresPart II Other InformationItem 1. Legal ProceedingsItem 1A. Risk FactorsItem 2. Unregistered Sales Of Equity Securities and Use Of ProceedsItem 3. Defaults Upon Senior SecuritiesItem 4. Mine Safety DisclosuresItem 5. Other InformationItem 6. ExhibitsItem Description