FEDERAL NATIONAL MORTGAGE ASSOCIATION FANNIE MAE
10-Ks and 10-Qs
UNITED STATES SECURITIES AND EXCHANGE COMMISSION
Washington, D.C. 20549
Form 10-Q
|
þ
|
QUARTERLY REPORT PURSUANT TO SECTION 13 OR 15(d) OF THE SECURITIES EXCHANGE ACT OF 1934
|
For the quarterly period ended
September 30, 2018
OR
|
o
|
TRANSITION REPORT PURSUANT TO SECTION 13 OR 15(d) OF THE SECURITIES EXCHANGE ACT OF 1934
|
For the transition period from to
Commission File No.: 0-50231
Federal National Mortgage Association
(Exact name of registrant as specified in its charter)
Fannie Mae
|
Federally chartered corporation
|
52-0883107
|
1100 15th Street, NW
Washington, DC 20005
|
3900 Wisconsin Avenue, NW
Washington, DC 20016
|
(800) 2FANNIE
(800-232-6643)
|
|
(State or other jurisdiction of
incorporation or organization)
|
(I.R.S. Employer
Identification No.)
|
(Address of principal executive offices, including zip code)
|
(Former address, if changed since last report)
|
(Registrant’s telephone number, including area code)
|
Indicate by check mark whether the registrant (1) has filed all reports required to be filed by Section 13 or 15(d) of the Securities Exchange Act of 1934 during the preceding 12 months (or for such shorter period that the registrant was required to file such reports), and (2) has been subject to such filing requirements for the past 90 days. Yes
þ
No
o
Indicate by check mark whether the registrant has submitted electronically every Interactive Data File required to be submitted pursuant to Rule 405 of Regulation S-T (§ 232.405 of this chapter) during the preceding 12 months (or for such shorter period that the registrant was required to submit such files). Yes
þ
No
o
Indicate by check mark whether the registrant is a large accelerated filer, an accelerated filer, a non-accelerated filer, a smaller reporting company, or an emerging growth company. See the definitions of “large accelerated filer,” “accelerated filer,” “smaller reporting company,” and “emerging growth company” in Rule 12b-2 of the Exchange Act.
|
Large accelerated filer
þ
|
Accelerated filer
o
|
|
Non-accelerated filer
o
|
Smaller reporting company
o
|
|
Emerging growth company
o
|
|
If an emerging growth company, indicate by check mark if the registrant has elected not to use the extended transition period for complying with any new or revised financial accounting standards provided pursuant to Section 13(a) of the Exchange Act.
o
Indicate by check mark whether the registrant is a shell company (as defined in Rule 12b-2 of the Exchange Act). Yes
o
No
þ
As of
September 30, 2018
, there were
1,158,087,567
shares of common stock of the registrant outstanding.
TABLE OF CONTENTS
|
Page
|
||
|
PART I—Financial Information
|
||
|
Item 1.
|
||
|
Item 2.
|
||
|
Retained Mortgage Portfolio
|
||
|
Item 3.
|
||
|
Item 4.
|
||
|
PART II—Other Information
|
||
|
Item 1.
|
||
|
Item 1A.
|
||
|
Item 2.
|
||
|
Item 3.
|
||
|
Item 4.
|
||
|
Item 5.
|
||
|
Item 6.
|
||
|
Fannie Mae Third Quarter 2018 Form 10-Q
|
i
|
|
|
MD&A | Introduction
|
||
Item 2.
Management’s Discussion and Analysis of Financial Condition and Results of Operations
|
We have been under conservatorship, with the Federal Housing Finance Agency (“FHFA”) acting as conservator, since September 6, 2008. As conservator, FHFA succeeded to all rights, titles, powers and privileges of the company, and of any shareholder, officer or director of the company with respect to the company and its assets. The conservator has since provided for the exercise of certain functions by our Board of Directors. Our directors do not have any fiduciary duties to any person or entity except to the conservator and, accordingly, are not obligated to consider the interests of the company, the holders of our equity or debt securities, or the holders of Fannie Mae MBS unless specifically directed to do so by the conservator.
|
||
|
Our conservatorship has no specified termination date. We do not know when or how the conservatorship will terminate, what further changes to our business will be made during or following conservatorship, what form we will have and what ownership interest, if any, our current common and preferred stockholders will hold in us after the conservatorship is terminated or whether we will continue to exist following conservatorship. Congress continues to consider options for reform of the housing finance system, including Fannie Mae. As a result of our agreements with the U.S. Department of the Treasury (“Treasury”) and directives from our conservator, we are not permitted to retain more than $3.0 billion in capital reserves or to pay dividends or other distributions to stockholders other than Treasury. Our agreements with Treasury also include covenants that significantly restrict our business activities. For additional information on the conservatorship, the uncertainty of our future, our agreements with Treasury, and recent actions and statements relating to housing finance reform by the Administration, Congress and FHFA, see “Business—Conservatorship and Treasury Agreements,” “Business—Legislation and Regulation” and “Risk Factors” in our Form 10-K for the year ended December 31, 2017 (“2017 Form 10-K”) and “Legislation and Regulation” and “Risk Factors” in our Form 10-Q for the quarter ended March 31, 2018 (“First Quarter 2018 Form 10-Q”), our Form 10-Q for the quarter ended June 30, 2018 (“Second Quarter 2018 Form 10-Q”), and in this report.
|
||
You should read this Management’s Discussion and Analysis of Financial
Condition and Results of Operations (“MD&A”) in conjunction with our unaudited condensed consolidated financial statements and related notes in this report and the more detailed information in our
2017
Form 10-K. You can find a “Glossary of Terms Used in This
Report” in the MD&A of our
2017
Form 10-K.
This report contains forward-looking statements that are based on management’s current expectations and are subject to significant uncertainties and changes in circumstances. Please review “Forward-Looking Statements” for more information on these
forward-looking statements.
Our actual results may differ materially from those reflected in our forward-looking statements due to a variety of factors including, but not limited to, those discussed in “Risk Factors” and elsewhere in this report and in our
2017
Form 10-K.
|
Introduction
|
||||
Fannie Mae provides a stable source of liquidity to the mortgage market and increases the availability and affordability of housing in the United States. We operate in the secondary mortgage market, primarily working with lenders. We do not originate loans or lend money directly to consumers in the primary mortgage market. Instead, we securitize mortgage loans originated by lenders into Fannie Mae mortgage-backed securities that we guarantee (which we refer to as Fannie Mae MBS); purchase mortgage loans and mortgage-related securities, primarily for securitization and sale at a later date; and engage in other activities that increase the supply of affordable housing. Our common stock is traded in the OTCQB market and quoted under the ticker symbol “FNMA.”
Through our single-family and multifamily business segments, we provided
$140 billion
in liquidity to the mortgage market in the
third quarter
of
2018
, which enabled the financing of
726,000
home purchases, refinancings or rental units.
|
Fannie Mae Third Quarter 2018 Form 10-Q
|
1
|
|
|
MD&A | Introduction
|
||
Fannie Mae Provided
$140
Billion in Liquidity in the
Third Quarter
of
2018

|
Executive Summary
|
||||
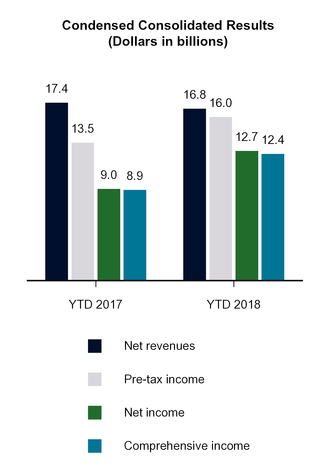
Summary of Our Financial Performance

|
Quarterly Results
|
|
The increase in our net income in the third quarter of 2018, compared with the third quarter of 2017, was primarily driven by:
•
a shift to a benefit for credit losses from a provision for credit losses;
•
a shift to fair value gains from fair value losses; and
•
a lower provision for federal income taxes;
•
partially offset by a decrease in fee and other income.
See “Consolidated Results of Operations” for more information on our quarterly financial results.
|
|
Fannie Mae Third Quarter 2018 Form 10-Q
|
2
|
|
|
MD&A | Executive Summary
|
||
|
Year-to-Date Results
|
|
The increase in our net income in the first nine months of 2018, compared with the first nine months of 2017, was primarily driven by:
•
a shift to fair value gains from fair value losses;
•
a lower provision for federal income taxes; and
•
a higher benefit for credit losses;
•
partially offset by a decrease in fee and other income.
See “Consolidated Results of Operations” for more information on our year-to-date financial results.
|
Net Worth
Our net worth of
$7.0 billion
as of
September 30, 2018
reflects our comprehensive income of
$4.0 billion
for the
third quarter
of
2018
and
$3.0 billion
in retained capital reserves.
Financial Performance Outlook
We expect to remain profitable on an annual basis for the foreseeable future; however, certain factors could result in significant volatility in our financial results from quarter to quarter or year to year. We expect volatility from quarter to quarter in our financial results due to a number of factors, particularly changes in market conditions that result in fluctuations in the estimated fair value of the financial instruments that we mark to market through our earnings. Other factors that may result in volatility in our quarterly financial results include developments that affect our loss reserves, such as changes in interest rates, home prices or accounting standards, or events such as natural disasters.
The potential for significant volatility in our financial results could result in a net loss in a future quarter. We are permitted to retain up to
$3.0 billion
in capital reserves as a buffer in the event of a net loss in a future quarter. However, any net loss we experience in the future could be greater than the amount of our capital reserves, resulting in a net worth deficit for that quarter. See “Risk Factors” in our
2017
Form 10-K for a discussion of the risks associated with the limitations on our ability to rebuild our capital reserves, including factors that could result in a net loss or net worth deficit in a future quarter.
|
Fannie Mae Third Quarter 2018 Form 10-Q
|
3
|
|
|
MD&A | Executive Summary
|
||
Treasury Draws and Dividend Payments
Treasury has made a commitment under a senior preferred stock purchase agreement to provide funding to us under certain circumstances if we have a net worth deficit. Pursuant to the senior preferred stock purchase agreement, we issued shares of senior preferred stock to Treasury in 2008. Acting as successor to the rights, titles, powers and privileges of the Board, the conservator has declared and directed us to pay dividends to Treasury on the senior preferred stock on a quarterly basis for every dividend period for which dividends were payable since we entered into conservatorship in 2008.
The chart below shows the funds we have drawn from Treasury pursuant to the senior preferred stock purchase agreement, as well as the dividend payments we have made to Treasury on the senior preferred stock, since entering into conservatorship.
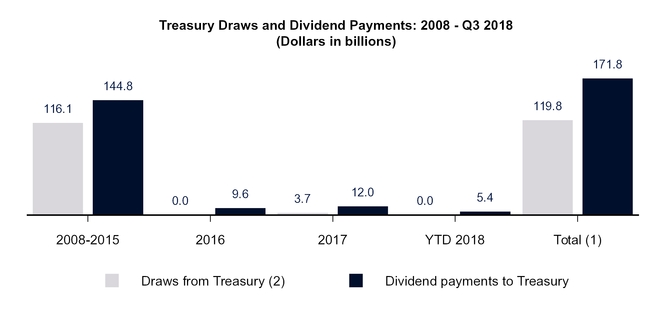
__________
|
(1)
|
Under the terms of the senior preferred stock purchase agreement, dividend payments we make to Treasury do not offset our prior draws of funds from Treasury, and we are not permitted to pay down draws we have made under the agreement except in limited circumstances. Amounts may not sum due to rounding.
|
|
(2)
|
Treasury draws are shown in the period for which requested, not when the funds were received by us. Draw requests have been funded in the quarter following a net worth deficit.
|
We expect to pay Treasury a
fourth quarter
2018
dividend of
$4.0 billion
by
December 31, 2018
. The current dividend provisions of the senior preferred stock provide for quarterly dividends consisting of the amount, if any, by which our net worth as of the end of the immediately preceding fiscal quarter exceeds a
$3.0 billion
capital reserve amount. We refer to this as a “net worth sweep” dividend. As noted above, our net worth was
$7.0 billion
as of September 30, 2018
.
If we experience a net worth deficit in a future quarter, we will be required to draw additional funds from Treasury under the senior preferred stock purchase agreement to avoid being placed into receivership. As of the date of this filing, the maximum amount of remaining funding under the agreement is
$113.9 billion
. If we were to draw additional funds from Treasury under the agreement with respect to a future period, the amount of remaining funding under the agreement would be reduced by the amount of our draw. Dividend payments we make to Treasury do not restore or increase the amount of funding available to us under the agreement. For a description of the terms of the senior preferred stock purchase agreement and the senior preferred stock, see “Business—Conservatorship and Treasury Agreements—Treasury Agreements” in our
2017
Form 10-K.
Although Treasury owns our senior preferred stock and a warrant to purchase 79.9% of our common stock, and has made a commitment under a senior preferred stock purchase agreement to provide us with funds to maintain a positive net worth under specified conditions, the U.S. government does not guarantee our securities or other obligations.
|
Fannie Mae Third Quarter 2018 Form 10-Q
|
4
|
|
|
MD&A | Legislation and Regulation
|
||
|
Legislation and Regulation
|
||||
The information in this section updates and supplements information regarding legislation and regulation affecting our business set forth in “Business—Legislation and Regulation” in our
2017
Form 10-K and in “MD&A—Legislation and Regulation” in our First Quarter 2018 Form 10-Q and Second Quarter 2018 Form 10-Q. Also see “Risk Factors” in this report and in our
2017
Form 10-K for discussions of risks relating to legislative and regulatory matters.
Housing Finance Reform
We expect Congress, the Administration and FHFA to continue considering housing finance reform that could result in significant changes in our structure and role in the future. As a result, there continues to be significant uncertainty regarding the future of our company. See “Risk Factors” in our
2017
Form 10-K for a discussion of the risks to our business relating to the uncertain future of our company.
2017 Housing Goals Performance
We are subject to housing goals, which establish specified requirements for our mortgage acquisitions relating to affordability or location. In October 2018, FHFA notified us that it had preliminarily determined that we met all of our single-family and multifamily housing goals for 2017. See “Business—Legislation and Regulation—GSE Act and Other Regulation of Our Business—Housing Goals” in our 2017 Form 10-K and “MD&A—Legislation and Regulation—Housing Goals” in our First Quarter 2018 Form 10-Q for more information regarding our housing goals.
Proposed Rule on MBS Prepayment Rates
On September 12, 2018, FHFA issued a proposed rule to require Fannie Mae and Freddie Mac to align their programs, policies and practices that affect the prepayment rates of “To-Be-Announced” (“TBA”)-eligible MBS. The rule would apply to both Fannie Mae’s and Freddie Mac’s current offerings of TBA-eligible MBS and to the new Uniform Mortgage-Backed Security (“UMBS”) scheduled to be implemented in June 2019. The objective of the Single Security Initiative and the proposed rule is to enhance the overall liquidity of Fannie Mae and Freddie Mac TBA-eligible MBS by supporting their fungibility without regard to which company is the issuer.
The proposed rule notes that “[t]he industry has expressed concerns that Fannie Mae and Freddie Mac UMBS may not be truly fungible because differences in Fannie Mae and Freddie Mac policies could result in materially differing cash flows (as a result of,
e.g.
, differing prepayment speeds).” FHFA, as conservator, has previously responded to industry input by imposing alignment mandates on Fannie Mae and Freddie Mac, and publishing a Prepayment Monitoring Report. The proposed rule would codify FHFA’s previous mandates, and is intended to ensure that Fannie Mae and Freddie Mac programs, policies and practices that individually have a material effect on cash flows (including policies that affect prepayment speeds) are aligned and will continue to be aligned.
See “Risk Factors” for a discussion of the risks to our business associated with the new UMBS and the Single Security Initiative.
Amended FHFA Corporate Governance Regulation: New Strategic Business Plan Requirement
On October 19, 2018, FHFA published in the Federal Register a final rule amending its corporate governance regulation applicable to Fannie Mae, Freddie Mac and the Federal Home Loan Banks. The amended regulation requires our Board of Directors to adopt and have in effect at all times a strategic business plan that describes our strategy for achieving our mission and public purposes. Among other things, this plan must articulate measurable goals and objectives for each significant activity, describe any significant changes to business strategy or approach we are planning to undertake, and identify current and emerging risks associated with our significant activities. The amended regulation requires our Board of Directors to review the strategic business plan at least annually, to re-adopt the plan at least every three years, and to establish management reporting requirements and monitor the implementation of the plan. The final rule will become effective on December 18, 2018. Our Board of Directors has previously adopted a strategic business plan and we are currently assessing whether any changes to this plan may be required as a result of FHFA’s amended regulation.
|
Fannie Mae Third Quarter 2018 Form 10-Q
|
5
|
|
|
MD&A | Key Market Economic Indicators
|
||
|
Key Market Economic Indicators
|
||||
The table below displays certain macroeconomic indicators that can significantly influence our business and financial results. We expect home prices on a national basis to continue to grow in 2018 at a similar rate as in 2017. We also expect significant regional variation in the timing and rate of home price growth.
|
Selected Key Market Economic Indicators
|
||||||||||||
|
For the Three Months
|
For the Nine Months
|
|||||||||||
|
Ended September 30,
|
Ended September 30,
|
|||||||||||
|
2018
|
2017
|
2018
|
2017
|
|||||||||
|
Home price change based on Fannie Mae national home price index
(1)
|
1.2
|
%
|
1.2
|
%
|
5.7
|
%
|
5.4
|
%
|
||||
|
Growth in U.S. gross domestic product ("GDP"), annualized percentage change
(2)
|
3.5
|
%
|
2.8
|
%
|
||||||||
|
As of
|
||||||||
|
September 30, 2018
|
December 31, 2017
|
September 30, 2017
|
||||||
|
U.S. unemployment rate
(3)
|
3.7
|
%
|
4.1
|
%
|
4.2
|
%
|
||
|
2-year swap rate
(4)
|
2.99
|
|
2.08
|
|
1.74
|
|
||
|
10-year swap rate
(4)
|
3.12
|
|
2.40
|
|
2.29
|
|
||
|
10-year Treasury rate
(4)
|
3.06
|
|
2.41
|
|
2.33
|
|
||
|
30-year Fannie Mae MBS par coupon rate
(4)
|
3.81
|
|
3.00
|
|
2.97
|
|
||
_______
|
(1)
|
Calculated internally using property data information on loans purchased by Fannie Mae or Freddie Mac and property data information obtained from other third-party data providers. Fannie Mae’s home price index is a weighted repeat transactions index, measuring average price changes in repeat transactions on the same properties. Fannie Mae’s home price index excludes prices on properties sold in foreclosure. Fannie Mae’s home price estimates are based on preliminary data and are subject to change as additional data becomes available.
|
|
(2)
|
According to the U.S. Bureau of Economic Analysis and subject to revision.
|
|
(3)
|
According to the U.S. Bureau of Labor Statistics and subject to revision.
|
|
(4)
|
According to Bloomberg.
|
See “Key Market Economic Indicators” in our
2017
Form 10-K for a description of how changes in GDP, unemployment rates, home prices and interest rates can affect our financial results.
|
Fannie Mae Third Quarter 2018 Form 10-Q
|
6
|
|
|
MD&A | Consolidated Results of Operations
|
||
|
Consolidated Results of Operations
|
||||
This section provides a discussion of our condensed consolidated results of operations and should be read together with our condensed consolidated financial statements, including the accompanying notes.
|
Summary of Condensed Consolidated Results of Operations
|
|||||||||||||||||||||||
|
For the Three Months
|
For the Nine Months
|
||||||||||||||||||||||
|
Ended September 30,
|
Ended September 30,
|
||||||||||||||||||||||
|
2018
|
2017
|
Variance
|
2018
|
2017
|
Variance
|
||||||||||||||||||
|
(Dollars in millions)
|
|||||||||||||||||||||||
|
Net interest income
|
$
|
5,369
|
|
$
|
5,274
|
|
$
|
95
|
|
$
|
15,978
|
|
$
|
15,622
|
|
$
|
356
|
|
|||||
|
Fee and other income
|
271
|
|
1,194
|
|
(923
|
)
|
830
|
|
1,796
|
|
(966
|
)
|
|||||||||||
|
Net revenues
|
5,640
|
|
6,468
|
|
(828
|
)
|
16,808
|
|
17,418
|
|
(610
|
)
|
|||||||||||
|
Investment gains, net
|
166
|
|
313
|
|
(147
|
)
|
693
|
|
689
|
|
4
|
|
|||||||||||
|
Fair value gains (losses), net
|
386
|
|
(289
|
)
|
675
|
|
1,660
|
|
(1,020
|
)
|
2,680
|
|
|||||||||||
|
Administrative expenses
|
(740
|
)
|
(664
|
)
|
(76
|
)
|
(2,245
|
)
|
(2,034
|
)
|
(211
|
)
|
|||||||||||
|
Credit-related income (expense):
|
|||||||||||||||||||||||
|
Benefit (provision) for credit losses
|
716
|
|
(182
|
)
|
898
|
|
2,229
|
|
1,481
|
|
748
|
|
|||||||||||
|
Foreclosed property expense
|
(159
|
)
|
(140
|
)
|
(19
|
)
|
(460
|
)
|
(391
|
)
|
(69
|
)
|
|||||||||||
|
Total credit-related income (expense)
|
557
|
|
(322
|
)
|
879
|
|
1,769
|
|
1,090
|
|
679
|
|
|||||||||||
|
Temporary Payroll Tax Cut Continuation Act of 2011 (“TCCA”) fees
|
(576
|
)
|
(531
|
)
|
(45
|
)
|
(1,698
|
)
|
(1,552
|
)
|
(146
|
)
|
|||||||||||
|
Other expenses, net
|
(377
|
)
|
(427
|
)
|
50
|
|
(946
|
)
|
(1,100
|
)
|
154
|
|
|||||||||||
|
Income before federal income taxes
|
5,056
|
|
4,548
|
|
508
|
|
16,041
|
|
13,491
|
|
2,550
|
|
|||||||||||
|
Provision for federal income taxes
|
(1,045
|
)
|
(1,525
|
)
|
480
|
|
(3,312
|
)
|
(4,495
|
)
|
1,183
|
|
|||||||||||
|
Net income
|
$
|
4,011
|
|
$
|
3,023
|
|
$
|
988
|
|
$
|
12,729
|
|
$
|
8,996
|
|
$
|
3,733
|
|
|||||
|
Total comprehensive income
|
$
|
3,975
|
|
$
|
3,048
|
|
$
|
927
|
|
$
|
12,372
|
|
$
|
8,944
|
|
$
|
3,428
|
|
|||||
Net Interest Income
We have two primary sources of net interest income:
|
•
|
guaranty fees we receive for managing the credit risk on loans underlying Fannie Mae MBS held by third parties; and
|
|
•
|
the difference between interest income earned on the assets in our retained mortgage portfolio and our other investments portfolio (collectively, our “portfolios”) and the interest expense associated with the debt that funds those assets.
|
Guaranty fees consist of two primary components:
|
•
|
base guaranty fees that we receive over the life of the loan; and
|
|
•
|
upfront fees that we receive at the time of loan acquisition primarily related to single-family loan level pricing adjustments and other fees we receive from lenders, which are amortized over the contractual life of the loan. We refer to this as amortization income.
|
|
Fannie Mae Third Quarter 2018 Form 10-Q
|
7
|
|
|
MD&A | Consolidated Results of Operations
|
||
The table below displays the components of our net interest income from our portfolios and our guaranty book of business.
|
Components of Net Interest Income
|
||||||||||||||||||||||||
|
For the Three Months Ended September 30,
|
For the Nine Months Ended September 30,
|
|||||||||||||||||||||||
|
|
2018
|
2017
|
Variance
|
2018
|
2017
|
Variance
|
||||||||||||||||||
|
(Dollars in millions)
|
||||||||||||||||||||||||
|
Net interest income from portfolios
(1)
|
$
|
1,132
|
|
$
|
1,109
|
|
$
|
23
|
|
$
|
3,425
|
|
$
|
3,318
|
|
$
|
107
|
|
||||||
|
Net interest income from guaranty book of business:
|
||||||||||||||||||||||||
|
Base guaranty fee income, net of TCCA
|
2,153
|
|
2,050
|
|
103
|
|
6,352
|
|
6,060
|
|
292
|
|
||||||||||||
|
Base guaranty fee income related to TCCA
(2)
|
576
|
|
531
|
|
45
|
|
1,698
|
|
1,552
|
|
146
|
|
||||||||||||
|
Net amortization income
|
1,508
|
|
1,584
|
|
(76
|
)
|
4,503
|
|
4,692
|
|
(189
|
)
|
||||||||||||
|
Total net interest income from guaranty book of business
|
4,237
|
|
4,165
|
|
72
|
|
12,553
|
|
12,304
|
|
249
|
|
||||||||||||
|
Total net interest income
|
$
|
5,369
|
|
$
|
5,274
|
|
$
|
95
|
|
$
|
15,978
|
|
$
|
15,622
|
|
$
|
356
|
|
||||||
__________
|
(1)
|
Includes interest income from assets held in our retained mortgage portfolio and our other investments portfolio, as well as other assets used to generate lender liquidity. Also includes interest expense on our outstanding Connecticut Avenue Securities
®
of
$366 million
and
$274 million
for the three months
ended September 30, 2018 and
2017
, respectively, and
$1.0 billion
and
$723 million
for the
nine months ended September 30, 2018 and 2017
, respectively.
|
|
(2)
|
Revenues generated by the 10 basis point guaranty fee increase we implemented pursuant to the TCCA, the incremental revenue from which is remitted to Treasury and not retained by us.
|
Net interest income increased slightly in the third quarter and first nine months of 2018 compared with the third quarter and first nine months of 2017 due to:
|
•
|
An increase in base guaranty fee income as the size of our guaranty book of business increased and loans with higher base guaranty fees comprised a larger part of our guaranty book of business in the third quarter and first nine months of 2018 compared with the third quarter and first nine months of 2017.
|
|
•
|
An increase in income from our other investments portfolio, primarily due to higher interest rates in the third quarter and first nine months of 2018 compared with the third quarter and first nine months of 2017.
|
|
•
|
These increases were partially offset by a decline in net amortization income as higher interest rates in the third quarter and first nine months of 2018 compared with the third quarter and first nine months of 2017 slowed down loan prepayments, resulting in lower amortization of cost basis adjustments on mortgage loans of consolidated trusts and related debt.
|
Amortization of Cost Basis Adjustments
We initially recognize mortgage loans and debt of consolidated trusts in our consolidated balance sheet at fair value. We recognize the difference between the initial fair value and the carrying value of these mortgage loans and debt as cost basis adjustments in our consolidated balance sheet. We amortize these cost basis adjustments as a yield adjustment over the contractual lives of these loans or debt as a component of net interest income.
|
Fannie Mae Third Quarter 2018 Form 10-Q
|
8
|
|
|
MD&A | Consolidated Results of Operations
|
||
The following charts display information about the outstanding net premium on debt in excess of loans of consolidated trusts and net discount positions on loans of Fannie Mae.


The net premium position of our consolidated debt will amortize as income over time. The timing of when this amortization income is recognized in our consolidated statements of income can vary based on a number of factors, the most significant of which is interest rates. In a rising interest rate environment, our mortgage loans tend to prepay more slowly, which typically results in lower net amortization income from cost basis adjustments on our net consolidated debt. Conversely, in a declining interest rate environment, our mortgage loans tend to prepay faster, resulting in higher net amortization income from cost basis adjustments on our net consolidated debt.
The net discount position on our mortgage loans of Fannie Mae was primarily recorded upon the acquisition of credit-impaired loans. The extent to which we may record income in future periods as we amortize this discount will be based on the actual performance of the loans.
|
Fannie Mae Third Quarter 2018 Form 10-Q
|
9
|
|
|
MD&A | Consolidated Results of Operations
|
||
Analysis of Net Interest Income and Yield
The table below displays an analysis of our net interest income, average balances, and related yields earned on assets and incurred on liabilities for the periods indicated. For most components of the average balances, we use a daily weighted average of amortized cost. When daily average balance information is not available, such as for mortgage loans, we use monthly averages.
|
Analysis of Net Interest Income and Yield
|
|||||||||||||||||||||
|
|
For the Three Months Ended September 30,
|
||||||||||||||||||||
|
|
2018
|
|
2017
|
||||||||||||||||||
|
|
Average
Balance |
|
Interest
Income/ Expense |
|
Average
Rates Earned/Paid |
|
Average
Balance |
|
Interest
Income/ Expense |
|
Average
Rates Earned/Paid |
||||||||||
|
|
(Dollars in millions)
|
||||||||||||||||||||
|
Interest-earning assets:
|
|
|
|
|
|
|
|
|
|
|
|
|
|
||||||||
|
Mortgage loans of Fannie Mae
|
$
|
149,859
|
|
|
$
|
1,665
|
|
|
4.44
|
%
|
|
$
|
181,445
|
|
$
|
1,879
|
|
4.14
|
%
|
||
|
Mortgage loans of consolidated trusts
|
3,090,212
|
|
|
27,058
|
|
|
3.50
|
|
|
2,979,153
|
|
25,168
|
|
3.38
|
|
||||||
|
Total mortgage loans
(1)
|
3,240,071
|
|
|
28,723
|
|
|
3.55
|
|
|
3,160,598
|
|
27,047
|
|
3.42
|
|
||||||
|
Mortgage-related securities
|
10,513
|
|
|
115
|
|
|
4.38
|
|
|
12,132
|
|
99
|
|
3.30
|
|
||||||
|
Non-mortgage-related securities
(2)
|
57,271
|
|
|
302
|
|
|
2.06
|
|
|
57,880
|
|
173
|
|
1.17
|
|
||||||
|
Federal funds sold and securities purchased under agreements to resell or similar arrangements
|
32,208
|
|
|
166
|
|
|
2.02
|
|
|
37,094
|
|
109
|
|
1.15
|
|
||||||
|
Advances to lenders
|
4,459
|
|
|
38
|
|
|
3.34
|
|
|
4,634
|
|
33
|
|
2.78
|
|
||||||
|
Total interest-earning assets
|
$
|
3,344,522
|
|
|
$
|
29,344
|
|
|
3.51
|
%
|
|
$
|
3,272,338
|
|
$
|
27,461
|
|
3.36
|
%
|
||
|
Interest-bearing liabilities:
|
|
|
|
|
|
|
|
||||||||||||||
|
Short-term funding debt
|
$
|
22,837
|
|
|
$
|
(114
|
)
|
|
1.95
|
%
|
|
$
|
27,967
|
|
$
|
(71
|
)
|
0.99
|
%
|
||
|
Long-term funding debt
|
196,266
|
|
|
(1,133
|
)
|
|
2.31
|
|
|
247,334
|
|
(1,232
|
)
|
1.99
|
|
||||||
|
Connecticut Avenue Securities
®
(“CAS”)
|
25,100
|
|
|
(366
|
)
|
|
5.83
|
|
|
20,978
|
|
(274
|
)
|
5.22
|
|
||||||
|
Total debt of Fannie Mae
|
244,203
|
|
|
(1,613
|
)
|
|
2.64
|
|
|
296,279
|
|
(1,577
|
)
|
2.13
|
|
||||||
|
Debt securities of consolidated trusts held by third parties
|
3,090,509
|
|
|
(22,362
|
)
|
|
2.89
|
|
|
2,984,811
|
|
(20,610
|
)
|
2.76
|
|
||||||
|
Total interest-bearing liabilities
|
$
|
3,334,712
|
|
|
$
|
(23,975
|
)
|
|
2.88
|
%
|
|
$
|
3,281,090
|
|
$
|
(22,187
|
)
|
2.70
|
%
|
||
|
Net interest income/net interest yield
|
|
|
$
|
5,369
|
|
|
0.64
|
%
|
|
$
|
5,274
|
|
0.64
|
%
|
|||||||
|
Fannie Mae Third Quarter 2018 Form 10-Q
|
10
|
|
|
MD&A | Consolidated Results of Operations
|
||
|
For the Nine Months Ended September 30,
|
|||||||||||||||||||||
|
2018
|
2017
|
||||||||||||||||||||
|
Average
Balance |
Interest
Income/ Expense |
Average
Rates Earned/Paid |
Average
Balance |
Interest
Income/ Expense |
Average
Rates Earned/Paid |
||||||||||||||||
|
(Dollars in millions)
|
|||||||||||||||||||||
|
Interest-earning assets:
|
|||||||||||||||||||||
|
Mortgage loans of Fannie Mae
|
$
|
156,168
|
|
$
|
5,187
|
|
4.43
|
%
|
$
|
190,552
|
|
$
|
5,950
|
|
4.16
|
%
|
|||||
|
Mortgage loans of consolidated trusts
|
3,068,521
|
|
79,877
|
|
3.47
|
|
2,951,478
|
|
75,155
|
|
3.40
|
|
|||||||||
|
Total mortgage loans
(1)
|
3,224,689
|
|
85,064
|
|
3.52
|
|
3,142,030
|
|
81,105
|
|
3.44
|
|
|||||||||
|
Mortgage-related securities
|
10,670
|
|
321
|
|
4.01
|
|
13,796
|
|
368
|
|
3.55
|
|
|||||||||
|
Non-mortgage-related securities
(2)
|
54,572
|
|
771
|
|
1.86
|
|
56,145
|
|
414
|
|
0.97
|
|
|||||||||
|
Federal funds sold and securities purchased under agreements to resell or similar arrangements
|
33,826
|
|
457
|
|
1.78
|
|
38,260
|
|
262
|
|
0.90
|
|
|||||||||
|
Advances to lenders
|
4,171
|
|
102
|
|
3.22
|
|
4,445
|
|
89
|
|
2.63
|
|
|||||||||
|
Total interest-earning assets
|
$
|
3,327,928
|
|
$
|
86,715
|
|
3.47
|
%
|
$
|
3,254,676
|
|
$
|
82,238
|
|
3.37
|
%
|
|||||
|
Interest-bearing liabilities:
|
|||||||||||||||||||||
|
Short-term funding debt
|
$
|
26,395
|
|
$
|
(328
|
)
|
1.64
|
%
|
$
|
30,231
|
|
$
|
(170
|
)
|
0.74
|
%
|
|||||
|
Long-term funding debt
|
204,543
|
|
(3,426
|
)
|
2.23
|
|
261,090
|
|
(4,098
|
)
|
2.09
|
|
|||||||||
|
Connecticut Avenue Securities
®
(“CAS”)
|
23,830
|
|
(1,007
|
)
|
5.63
|
|
18,940
|
|
(723
|
)
|
5.09
|
|
|||||||||
|
Total debt of Fannie Mae
|
254,768
|
|
(4,761
|
)
|
2.49
|
|
310,261
|
|
(4,991
|
)
|
2.14
|
|
|||||||||
|
Debt securities of consolidated trusts held by third parties
|
3,068,839
|
|
(65,976
|
)
|
2.87
|
|
2,953,203
|
|
(61,625
|
)
|
2.78
|
|
|||||||||
|
Total interest-bearing liabilities
|
$
|
3,323,607
|
|
$
|
(70,737
|
)
|
2.84
|
%
|
$
|
3,263,464
|
|
$
|
(66,616
|
)
|
2.72
|
%
|
|||||
|
Net interest income/net interest yield
|
$
|
15,978
|
|
0.64
|
%
|
$
|
15,622
|
|
0.64
|
%
|
|||||||||||
__________
|
(1)
|
Average balance includes mortgage loans on nonaccrual status. Typically, interest income on nonaccrual mortgage loans is recognized when cash is received. Interest income not recognized for loans on nonaccrual status was
$86 million
and
$351 million
, respectively, for the third quarter and first nine months of 2018, compared with
$209 million
and
$611 million
, respectively, for the third quarter and first nine months of 2017.
|
|
(2)
|
Includes cash equivalents.
|
Fee and Other Income
Fee and other income includes transaction fees, multifamily fees, technology fees and other miscellaneous income. Fee and other income declined in the
third quarter
and
first nine months
of
2018
, compared with the
third quarter
and
first nine months
of
2017
, primarily due to $975 million of income in the
third quarter
of
2017
resulting from a settlement agreement resolving legal claims related to private-label securities we purchased.
Fair Value Gains (Losses), Net
The estimated fair value of our derivatives, trading securities and other financial instruments carried at fair value may fluctuate substantially from period to period because of changes in interest rates, the yield curve, mortgage and credit spreads and implied volatility, as well as activity related to these financial instruments. While the estimated fair value of our derivatives that serve to mitigate certain risk exposures may fluctuate, some of the financial instruments that generate these exposures are not recorded at fair value in our condensed consolidated financial statements.
|
Fannie Mae Third Quarter 2018 Form 10-Q
|
11
|
|
|
MD&A | Consolidated Results of Operations
|
||
The table below
displays the components of our fair value gains and losses.
|
Fair Value Gains (Losses), Net
|
|||||||||||||||
|
For the Three Months Ended September 30,
|
For the Nine Months Ended September 30,
|
||||||||||||||
|
2018
|
2017
|
2018
|
2017
|
||||||||||||
|
(Dollars in millions)
|
|||||||||||||||
|
Risk management derivatives fair value gains (losses) attributable to:
|
|||||||||||||||
|
Net contractual interest expense accruals on interest rate swaps
|
$
|
(285
|
)
|
$
|
(223
|
)
|
$
|
(786
|
)
|
$
|
(702
|
)
|
|||
|
Net change in fair value during the period
|
527
|
|
75
|
|
1,365
|
|
364
|
|
|||||||
|
Total risk management derivatives fair value gains (losses), net
|
242
|
|
(148
|
)
|
579
|
|
(338
|
)
|
|||||||
|
Mortgage commitment derivatives fair value gains (losses), net
|
118
|
|
(248
|
)
|
606
|
|
(520
|
)
|
|||||||
|
Total derivatives fair value gains (losses), net
|
360
|
|
(396
|
)
|
1,185
|
|
(858
|
)
|
|||||||
|
Trading securities gains (losses), net
|
(40
|
)
|
59
|
|
79
|
|
145
|
|
|||||||
|
CAS fair value gains (losses), net
|
16
|
|
113
|
|
35
|
|
(218
|
)
|
|||||||
|
Other, net
|
50
|
|
(65
|
)
|
361
|
|
(89
|
)
|
|||||||
|
Fair value gains (losses), net
|
$
|
386
|
|
$
|
(289
|
)
|
$
|
1,660
|
|
$
|
(1,020
|
)
|
|||
Fair value gains in the third quarter and first nine months of
2018
were primarily driven by:
|
•
|
increases
in the fair value of our mortgage commitment derivatives due to gains on commitments to sell mortgage-related securities as a result of decreases in the prices of securities as interest rates rose during the commitment periods; and
|
|
•
|
increases
in the fair value of our pay-fixed risk management derivatives due to an increase in longer-term swap rates during the periods.
|
Fair value
losses
in the
third quarter
and first nine months of 2017 were primarily driven by:
|
•
|
decreases in the fair value of our mortgage commitments due to losses on commitments to sell mortgage-related securities due to an increase in prices as interest rates decreased during most of the commitment periods; and
|
|
•
|
decreases in the fair value of our pay-fixed risk management derivatives due to declines in longer-term swap rates during the second quarter and most of the third quarter.
|
Administrative Expenses
Administrative expenses include salaries and employee benefits, professional services, occupancy and other miscellaneous expenses. Administrative expenses increased in the third quarter and first nine months of 2018, compared with the third quarter and first nine months of 2017, primarily due to an increase in salaries and professional services expense in support of our business resiliency activities and from severance expenses.
|
Fannie Mae Third Quarter 2018 Form 10-Q
|
12
|
|
|
MD&A | Consolidated Results of Operations
|
||
Credit-Related Income (Expense)
Benefit (Provision) for Credit Losses
The table below provides quantitative analysis of the drivers of our single-family benefit or provision for credit losses for the periods presented. Many of the drivers that contribute to our benefit or provision for credit losses overlap or are interdependent. The attribution shown below is based on internal allocation estimates. The table does not display our multifamily benefit or provision for credit losses as the amounts for all periods presented were less than $50 million.
|
Components of Benefit (Provision) for Credit Losses
|
|||||||||||||||
|
For the Three Months Ended September 30,
|
For the Nine Months Ended September 30,
|
||||||||||||||
|
2018
|
2017
|
2018
|
2017
|
||||||||||||
|
(Dollars in billions)
|
|||||||||||||||
|
Single-family benefit (provision) for credit losses:
|
|||||||||||||||
|
Changes in loan activity
(1)
|
$
|
0.4
|
|
$
|
(0.9
|
)
|
$
|
0.7
|
|
$
|
(0.8
|
)
|
|||
|
Redesignation of held for investment (“HFI”) loans to held for sale (“HFS”) loans
|
0.4
|
|
0.5
|
|
1.4
|
|
1.0
|
|
|||||||
|
Actual and forecasted home prices
|
0.2
|
|
0.1
|
|
0.9
|
|
1.3
|
|
|||||||
|
Actual and projected interest rates
|
(0.3
|
)
|
(0.1
|
)
|
(1.0
|
)
|
(0.2
|
)
|
|||||||
|
Other
(2)
|
*
|
|
0.2
|
|
0.2
|
|
0.2
|
|
|||||||
|
Single-family benefit (provision) for credit losses
|
0.7
|
|
(0.2
|
)
|
2.2
|
|
1.5
|
|
|||||||
|
Total benefit (provision) for credit losses
|
$
|
0.7
|
|
$
|
(0.2
|
)
|
$
|
2.2
|
|
$
|
1.5
|
|
|||
_________
|
*
|
Represents less than $50 million.
|
|
(1)
|
Primarily consists of changes in the allowance due to loan delinquency, loan liquidations, new troubled debt restructurings, amortization of concessions granted to borrowers and the impact of FHFA’s Advisory Bulletin 2012-02, “Framework for Adversely Classifying Loans, Other Real Estate Owned, and Other Assets and Listing Assets for Special Mention” (the “Advisory Bulletin”). The 2017 amounts include our estimate as of September 30, 2017 of incurred losses resulting from Hurricanes Harvey, Irma and Maria (the “2017 hurricanes”), which is revised quarterly.
|
|
(2)
|
Primarily consists of the impact of model and assumption changes that are not separately included in the other components.
|
The primary factors that impacted our benefit for credit losses in the
third quarter
and
first nine months
of
2018
were:
|
•
|
The redesignation of certain reperforming and nonperforming single-family loans from HFI to HFS as we no longer intend to hold them for the foreseeable future or to maturity. Upon redesignation of these loans, we recorded the loans at the lower of cost or fair value with a charge-off to the allowance for loan losses. Amounts recorded in the allowance related to the loans exceeded the amounts charged off, which contributed to the benefit for credit losses.
|
|
•
|
An increase in actual home prices, which contributed to the benefit for credit losses. Higher home prices decrease the likelihood that loans will default and reduce the amount of credit loss on loans that do default, which impacts our estimate of losses and ultimately reduces our loss reserves and provision for credit losses.
|
|
•
|
The benefit for credit losses was partially offset by the impact of higher actual and projected mortgage interest rates. As mortgage interest rates rise, we expect a decrease in future prepayments on single-family individually impaired loans, including modified loans. Lower expected prepayments lengthen the expected lives of modified loans, which increases the impairment relating to term and interest rate concessions provided on these loans and results in an increase in the provision for credit losses.
|
|
Fannie Mae Third Quarter 2018 Form 10-Q
|
13
|
|
|
MD&A | Consolidated Results of Operations
|
||
The following factors impacted our provision for credit losses in the
third quarter
of
2017
:
|
•
|
The estimate of incurred losses from the 2017 hurricanes contributed to the provision for credit losses.
|
|
•
|
This was partially offset by a benefit primarily due to higher actual home prices.
|
|
•
|
In addition, we recognized a benefit from the redesignation of certain reperforming single-family loans from HFI to HFS during the period.
|
The following factors impacted our benefit for credit losses in the
first nine months
of
2017
:
|
•
|
We recognized a benefit for credit losses due to higher actual and forecasted home prices in the period.
|
|
•
|
In addition, we recognized a benefit from the redesignation of certain reperforming and nonperforming single-family loans from HFI to HFS during the period.
|
|
•
|
This was partially offset by the estimate of incurred losses from the 2017 hurricanes.
|
Temporary Payroll Tax Cut Continuation Act of 2011 (“TCCA”) Fees
Pursuant to the TCCA, FHFA directed us to increase our single-family guaranty fees by 10 basis points and remit this increase to Treasury. This TCCA-related revenue is included in “Net interest income” and the expense is recognized as “TCCA fees” in our condensed consolidated financial statements. TCCA fees increased in the third quarter and
first nine months
of
2018
compared with the third quarter and
first nine months
of
2017
as our book of business subject to the TCCA continued to grow. We expect the guaranty fees collected and expenses incurred under the TCCA to continue to increase.
Federal Income Taxes
The
decrease
in our provision for federal income taxes in the
third quarter
and
first nine months
of
2018
as compared to the
third quarter
and
first nine months
of
2017
was the result of the Tax Cuts and Jobs Act of 2017, which
reduced
the federal statutory corporate income tax rate from
35%
to
21%
effective January 1, 2018. This
decline
was the primary driver of the
reduction
in our effective tax rate to
20.7%
for the
third quarter
of
2018
and
20.6%
for the first
nine
months of
2018
, compared with
33.5%
for the
third quarter
of
2017
and
33.3%
for the first
nine
months of
2017
. Our effective tax rates for all the periods presented were different from the prevailing federal statutory rate primarily due to the benefits of our investments in housing projects eligible for low-income housing tax credits.
|
Fannie Mae Third Quarter 2018 Form 10-Q
|
14
|
|
|
MD&A | Consolidated Balance Sheet Analysis
|
||
|
|
||||
This section provides a discussion of our condensed consolidated balance sheets and should be read together with our condensed consolidated financial statements, including the accompanying notes.
|
Summary of Condensed Consolidated Balance Sheets
|
|||||||||||
|
As of
|
|||||||||||
|
September 30, 2018
|
December 31, 2017
|
Variance
|
|||||||||
|
(Dollars in millions)
|
|||||||||||
|
Assets
|
|||||||||||
|
Cash and cash equivalents and federal funds sold and securities purchased under agreements to resell or similar arrangements
|
$
|
54,387
|
|
$
|
51,580
|
|
$
|
2,807
|
|
||
|
Restricted cash
|
23,242
|
|
28,150
|
|
(4,908
|
)
|
|||||
|
Investments in securities
(1)
|
47,438
|
|
39,522
|
|
7,916
|
|
|||||
|
Mortgage loans:
|
|||||||||||
|
Of Fannie Mae
|
137,227
|
|
167,793
|
|
(30,566
|
)
|
|||||
|
Of consolidated trusts
|
3,111,570
|
|
3,029,816
|
|
81,754
|
|
|||||
|
Allowance for loan losses
|
(15,663
|
)
|
(19,084
|
)
|
3,421
|
|
|||||
|
Mortgage loans, net of allowance for loan losses
|
3,233,134
|
|
3,178,525
|
|
54,609
|
|
|||||
|
Deferred tax assets, net
|
14,368
|
|
17,350
|
|
(2,982
|
)
|
|||||
|
Other assets
|
28,536
|
|
30,402
|
|
(1,866
|
)
|
|||||
|
Total assets
|
$
|
3,401,105
|
|
$
|
3,345,529
|
|
$
|
55,576
|
|
||
|
Liabilities and equity (deficit)
|
|||||||||||
|
Debt:
|
|||||||||||
|
Of Fannie Mae
|
$
|
246,682
|
|
$
|
276,752
|
|
$
|
(30,070
|
)
|
||
|
Of consolidated trusts
|
3,127,688
|
|
3,053,302
|
|
74,386
|
|
|||||
|
Other liabilities
|
19,760
|
|
19,161
|
|
599
|
|
|||||
|
Total liabilities
|
3,394,130
|
|
3,349,215
|
|
44,915
|
|
|||||
|
Fannie Mae stockholders’ equity (deficit):
|
|||||||||||
|
Senior preferred stock
|
120,836
|
|
117,149
|
|
3,687
|
|
|||||
|
Other net deficit
|
(113,861
|
)
|
(120,835
|
)
|
6,974
|
|
|||||
|
Total equity (deficit)
|
6,975
|
|
(3,686
|
)
|
10,661
|
|
|||||
|
Total liabilities and equity (deficit)
|
$
|
3,401,105
|
|
$
|
3,345,529
|
|
$
|
55,576
|
|
||
__________
|
(1)
|
Includes
$37.4 billion
as of September 30, 2018
and
$29.2 billion
as of
December 31, 2017
of non-mortgage-related securities.
|
Mortgage Loans, Net of Allowance for Loan Losses
The mortgage loans reported in our condensed consolidated balance sheet are classified as either HFS or HFI and include loans owned by Fannie Mae and loans held in consolidated trusts.
Mortgage loans, net of allowance for loan losses increased as of
September 30, 2018
compared with
December 31, 2017
primarily driven by:
|
•
|
an increase in mortgage loans due to acquisitions outpacing liquidations and sales; and
|
|
•
|
a decrease in our allowance for loan losses primarily driven by the redesignation of single-family loans from HFI to HFS.
|
For additional information on our mortgage loans, see “
Note 3, Mortgage Loans
,” and for additional information on changes in our allowance for loan losses, see “
Note 4, Allowance for Loan Losses
.”
|
Fannie Mae Third Quarter 2018 Form 10-Q
|
15
|
|
|
MD&A | Consolidated Balance Sheet Analysis
|
||
Debt
The
decrease
in debt of Fannie Mae from
December 31, 2017
to
September 30, 2018
was primarily driven by lower funding needs as our retained mortgage portfolio continued to decrease during the first nine months of 2018. The
increase
in debt of consolidated trusts from
December 31, 2017
to
September 30, 2018
was primarily driven by sales of Fannie Mae MBS, which are accounted for as issuances of debt of consolidated trusts in our condensed consolidated balance sheets, since the MBS certificate ownership is transferred from us to a third party. See “Liquidity and Capital Management—Liquidity Management—Debt Funding” for a summary of the activity of the debt of Fannie Mae and a comparison of the mix between our outstanding short-term and long-term debt. Also see “
Note 7, Short-Term and Long-Term Debt
” for additional information on our outstanding debt.
Stockholders’ Equity (Deficit)
The shift from a net deficit of
$3.7 billion
as of
December 31, 2017
to net equity of
$7.0 billion
as of
September 30, 2018
reflects:
|
•
|
our comprehensive income of
$12.4 billion
for the
first nine months
of
2018
;
|
|
•
|
our receipt of
$3.7 billion
from Treasury during the
first quarter
of
2018
pursuant to the senior preferred stock purchase agreement, which eliminated our net worth deficit as of
December 31, 2017
; and
|
|
•
|
our dividend payments to Treasury of
$5.4 billion
during the year.
|
|
Fannie Mae Third Quarter 2018 Form 10-Q
|
16
|
|
|
MD&A | Retained Mortgage Portfolio
|
||
|
Retained Mortgage Portfolio
|
||||
Our retained mortgage portfolio consists of mortgage loans and mortgage-related securities that we own, including Fannie Mae MBS and non-Fannie Mae mortgage-related securities. Assets held by consolidated MBS trusts that back mortgage-related securities owned by third parties are not included in our retained mortgage portfolio. We use our retained mortgage portfolio primarily to provide liquidity to the mortgage market and support our loss mitigation activities. Previously, we also used our retained mortgage portfolio for investment purposes.
The chart below separates the instruments within our retained mortgage portfolio, measured by unpaid principal balance, into three categories based on each instrument’s use:
|
•
|
Lender liquidity
, which includes balances related to our whole loan conduit activity, supports our efforts to provide liquidity to the single-family and multifamily mortgage markets.
|
|
•
|
Loss mitigation
supports our loss mitigation efforts through the purchase of delinquent loans from MBS trusts.
|
|
•
|
Other
represents assets that were previously purchased for investment purposes. More than half of the balance of “Other” consisted of reverse mortgage loans and Fannie Mae-wrapped reverse mortgage securities as of
September 30, 2018
. We expect the amount of assets in “Other” will continue to decline over time as they liquidate, mature or are sold.
|
|
Retained Mortgage Portfolio
(Dollars in billions)
|
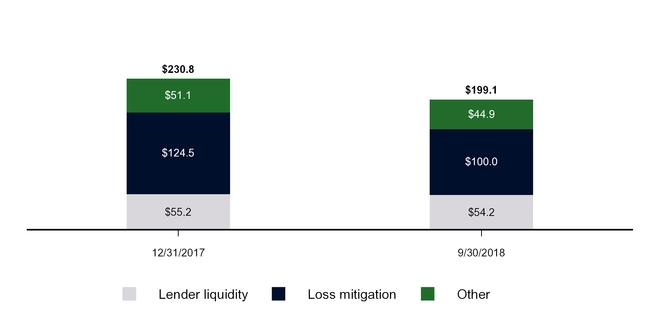
|
Fannie Mae Third Quarter 2018 Form 10-Q
|
17
|
|
|
MD&A | Retained Mortgage Portfolio
|
||
The table below displays the components of our retained mortgage portfolio, measured by unpaid principal balance.
|
Retained Mortgage Portfolio
|
|||||||||||
|
As of
|
|||||||||||
|
September 30, 2018
|
December 31, 2017
|
||||||||||
|
(Dollars in millions)
|
|||||||||||
|
Single-family:
|
|||||||||||
|
Mortgage loans
(1)
|
$
|
118,118
|
|
$
|
146,316
|
|
|||||
|
Reverse mortgages
|
22,943
|
|
26,458
|
|
|||||||
|
Mortgage-related securities:
|
|||||||||||
|
Agency securities
(2)
|
34,688
|
|
31,719
|
|
|||||||
|
Fannie Mae-wrapped reverse mortgage securities
|
6,171
|
|
6,689
|
|
|||||||
|
Ginnie Mae reverse mortgage securities
|
1,882
|
|
527
|
|
|||||||
|
Other Fannie Mae-wrapped securities
(3)
|
664
|
|
3,414
|
|
|||||||
|
Private-label and other securities
(3)
|
3,107
|
|
2,588
|
|
|||||||
|
Total single-family mortgage-related securities
(4)
|
46,512
|
|
44,937
|
|
|||||||
|
Total single-family mortgage loans and mortgage-related securities
|
187,573
|
|
217,711
|
|
|||||||
|
Multifamily:
|
|||||||||||
|
Mortgage loans
(5)
|
3,430
|
|
4,591
|
|
|||||||
|
Mortgage-related securities:
|
|||||||||||
|
Agency securities
(2)
|
7,709
|
|
7,860
|
|
|||||||
|
Commercial mortgage-backed securities (“CMBS”)
|
—
|
|
24
|
|
|||||||
|
Mortgage revenue bonds
|
402
|
|
597
|
|
|||||||
|
Total multifamily mortgage-related securities
(6)
|
8,111
|
|
8,481
|
|
|||||||
|
Total multifamily mortgage loans and mortgage-related securities
|
11,541
|
|
13,072
|
|
|||||||
|
Total retained mortgage portfolio
|
$
|
199,114
|
|
$
|
230,783
|
|
|||||
__________
|
(1)
|
Includes single-family loans classified as troubled debt restructurings (“TDRs”) that were on accrual status of
$68.4 billion
and
$86.3 billion
as of September 30, 2018
and
December 31, 2017
, respectively, and single-family loans on nonaccrual status of
$26.5 billion
and
$33.1 billion
as of September 30, 2018
and
December 31, 2017
, respectively.
|
|
(2)
|
Includes Fannie Mae, Freddie Mac and Ginnie Mae mortgage-related securities, excluding Fannie Mae-wrapped securities and Ginnie Mae reverse mortgage securities.
|
|
(3)
|
The increase in private-label and other securities from
December 31, 2017
to
September 30, 2018
was due to the dissolution in the first quarter of 2018 of a Fannie Mae-wrapped private-label securities trust. The Fannie Mae-wrapped private-label securities had been classified as other Fannie Mae-wrapped securities prior to the dissolution.
|
|
(4)
|
The fair value of these single-family mortgage-related securities was $
47.5 billion
and $
46.7 billion
as of September 30, 2018
and
December 31, 2017
, respectively.
|
|
(5)
|
Includes multifamily loans classified as TDRs that were on accrual status of
$64 million
and
$84 million
as of September 30, 2018
and
December 31, 2017
, respectively, and multifamily loans on nonaccrual status of
$163 million
and
$122 million
as of September 30, 2018
and
December 31, 2017
, respectively.
|
|
(6)
|
The fair value of these multifamily mortgage-related securities was
$8.3 billion
and
$9.0 billion
as of September 30, 2018
and
December 31, 2017
, respectively.
|
The amount of mortgage assets that we may own is restricted by our senior preferred stock purchase agreement with Treasury, as described in “Business—Conservatorship and Treasury Agreements—Treasury Agreements” in our 2017 Form 10-K. Our retained mortgage portfolio is below the final $250 billion cap under the senior preferred stock purchase agreement that becomes effective on
December 31, 2018
. We expect the size of our retained mortgage portfolio will continue to decrease in
2018
.
In support of our loss mitigation strategy, we purchased
$13.6 billion
of loans from our single-family MBS trusts in the
first nine months
of
2018
, the substantial majority of which were delinquent. See “
MD&A
—
Retained Mortgage Portfolio
—Purchases of Loans from Our MBS Trusts” in our
2017
Form 10-K for more information relating to our purchases of loans from MBS trusts.
|
Fannie Mae Third Quarter 2018 Form 10-Q
|
18
|
|
|
MD&A | Total Book of Business
|
||
|
Total Book of Business
|
||||
The table below displays the composition of our total book of business based on unpaid principal balance. Our single-family book of business accounted for
91%
of our total book of business
as of September 30, 2018
and
December 31, 2017
. While our total book of business includes all of our mortgage-related assets, both on- and off-balance sheet, our guaranty book of business excludes non-Fannie Mae mortgage-related securities held in our retained mortgage portfolio for which we do not provide a guaranty.
|
Composition of Total Book of Business
|
|||||||||||||||||||||||
|
As of
|
|||||||||||||||||||||||
|
September 30, 2018
|
December 31, 2017
|
||||||||||||||||||||||
|
Single-Family
|
Multifamily
|
Total
|
Single-Family
|
Multifamily
|
Total
|
||||||||||||||||||
|
(Dollars in millions)
|
|||||||||||||||||||||||
|
Guaranty book of business
(1)
|
$
|
2,955,925
|
|
$
|
299,817
|
|
$
|
3,255,742
|
|
$
|
2,931,356
|
|
$
|
280,502
|
|
$
|
3,211,858
|
|
|||||
|
Non-Fannie Mae mortgage securities
(2)
|
6,924
|
|
402
|
|
7,326
|
|
4,005
|
|
621
|
|
4,626
|
|
|||||||||||
|
Total book of business
|
$
|
2,962,849
|
|
$
|
300,219
|
|
$
|
3,263,068
|
|
$
|
2,935,361
|
|
$
|
281,123
|
|
$
|
3,216,484
|
|
|||||
|
Guaranty Book of Business Detail:
|
|||||||||||||||||||||||
|
Conventional guaranty book of business
(3)
|
$
|
2,920,132
|
|
$
|
298,589
|
|
$
|
3,218,721
|
|
$
|
2,890,908
|
|
$
|
279,235
|
|
$
|
3,170,143
|
|
|||||
|
Government guaranty book of business
(4)
|
$
|
35,793
|
|
$
|
1,228
|
|
$
|
37,021
|
|
$
|
40,448
|
|
$
|
1,267
|
|
$
|
41,715
|
|
|||||
__________
|
(1)
|
Includes other single-family Fannie Mae guaranty arrangements of
$1.6 billion
and
$1.8 billion
as of
September 30, 2018
and
December 31, 2017
, respectively, and other multifamily Fannie Mae guaranty arrangements of
$12.4 billion
as of
September 30, 2018
and
December 31, 2017
. The unpaid principal balance of resecuritized Fannie Mae MBS is included only once in the reported amount.
|
|
(2)
|
Includes mortgage-related securities issued by Freddie Mac and Ginnie Mae, mortgage revenue bonds, Alt-A and subprime private-label securities, and CMBS.
|
|
(3)
|
Refers to mortgage loans and mortgage-related securities that are not guaranteed or insured, in whole or in part, by the U.S. government or one of its agencies.
|
|
(4)
|
Refers to mortgage loans and mortgage-related securities guaranteed or insured, in whole or in part, by the U.S. government or one of its agencies.
|
The Federal Housing Enterprises Financial Safety and Soundness Act of 1992, as amended by the Federal Housing Finance Regulatory Reform Act of 2008 (together, the “GSE Act”), requires us to set aside each year an amount equal to 4.2 basis points for each dollar of the unpaid principal balance of our total new business purchases and to pay this amount to specified U.S. Department of Housing and Urban Development (“HUD”) and Treasury funds. New business purchases consist of single-family and multifamily mortgage loans purchased during the period and single-family and multifamily mortgage loans underlying Fannie Mae MBS issued during the period pursuant to lender swaps. In February 2018, we paid
$239 million
to the funds based on our new business purchases in
2017
. Our new business purchases were
$389.5 billion
for the
first nine months
of
2018
. Accordingly, we recognized an expense of
$163 million
related to this obligation for the
first nine months
of
2018
. We expect to pay this amount, plus additional amounts to be accrued based on our new business purchases in the fourth quarter of
2018
, to the funds on or before March 1, 2019. See “Business—Legislation and Regulation—GSE Act and Other Regulation of Our Business—Affordable Housing Allocations” in our 2017 Form 10-K for more information regarding this obligation.
|
Fannie Mae Third Quarter 2018 Form 10-Q
|
19
|
|
|
MD&A | Business Segments
|
||
|
Business Segments
|
||||
We have two reportable business segments: Single-Family and Multifamily. The Single-Family business operates in the secondary mortgage market relating to loans secured by properties containing four or fewer residential dwelling units, which are referred to as single-family mortgage loans. The Multifamily business operates in the secondary mortgage market relating primarily to loans secured by properties containing five or more residential units, which are referred to as multifamily mortgage loans.
The chart below displays the net revenues and net income for each of our business segments for the first nine months of 2018 compared with the first nine months of 2017.

This section describes each segment’s business and credit metrics, and financial results. For further discussion of our Single-Family and Multifamily business segments, including each segment’s primary business activities and customers, see “MD&A—Business Segments” in our 2017 Form 10-K.
Single-Family Business
Single-Family Mortgage Market
Housing activity declined in the
third quarter
of
2018
compared with the
second quarter
of
2018
. Total existing home sales averaged
5.3 million
units annualized in the
third quarter
of
2018
, compared with
5.4 million
units in the
second quarter
of
2018
, according to data from the National Association of REALTORS®. According to the U.S. Census Bureau, new single-family home sales decreased during the
third quarter
of
2018
, averaging an annualized rate of
580,000
units, compared with
633,000
units in the
second quarter
of
2018
.
The 30-year fixed mortgage rate averaged
4.72%
during the week ended September 28, 2018, compared with
4.55%
during the week ended
June 30, 2018
, according to Freddie Mac’s Primary Mortgage Market Survey®. The single-family mortgage market continued to experience a shift to a purchase mortgage market, as the share of refinance originations in the
third quarter
of
2018
fell to the lowest level since the
third quarter
of 2000.
We forecast that total originations in the U.S. single-family mortgage market in
2018
will decrease from
2017
levels by approximately
10.5%
, from an estimated
$1.83 trillion
in
2017
to
$1.64 trillion
in
2018
, and that the
|
Fannie Mae Third Quarter 2018 Form 10-Q
|
20
|
|
|
MD&A | Business Segments
|
||
amount of originations in the U.S. single-family mortgage market that are refinancings will decrease from an estimated
$650 billion
in
2017
to
$454 billion
in
2018
.
Single-Family Market Share
The chart below displays our estimated market share of single-family mortgage-related securities issuances in the
third quarter
of
2018
as compared with that of our primary competitors for the issuance of single-family mortgage-related securities.

|
•
|
We estimate our market share of single-family mortgage-related securities issuances was
40%
in the
third quarter
of
2018
, compared with
36%
in the
second quarter
of
2018
and
39%
in the
third quarter
of
2017
.
|
|
Fannie Mae Third Quarter 2018 Form 10-Q
|
21
|
|
|
MD&A | Business Segments
|
||
Single-Family Business Metrics
Single-family Fannie Mae MBS outstanding increased as of
September 30, 2018
compared to September 30, 2017 because acquisitions during the past twelve months outpaced liquidations, which slowed as a result of a decline in prepayments due to the rising interest rate environment.

__________
|
(1)
|
Our single-family guaranty book of business consists of (a) single-family mortgage loans of Fannie Mae, (b) single-family mortgage loans underlying Fannie Mae MBS, and (c) other credit enhancements that we provide on single-family mortgage assets, such as long-term standby commitments. It excludes non-Fannie Mae single-family mortgage-related securities held in our retained mortgage portfolio for which we do not provide a guaranty.
|
Our average charged guaranty fee on newly acquired single-family loans, net of TCCA fees, increased from
47.1
basis points in the
third quarter
of
2017
to
51.2
basis points in the
third quarter
of
2018
, primarily driven by an increase in the total base guaranty fees charged on our
2018
acquisitions.
Average Charged Guaranty Fee on Single-Family Guaranty Book of Business and
Average Charged Guaranty Fee on New Single-Family Acquisitions
(1)
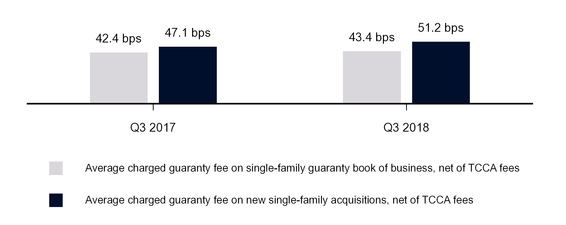
__________
|
Fannie Mae Third Quarter 2018 Form 10-Q
|
22
|
|
|
MD&A | Business Segments
|
||
|
(1)
|
Calculated based on the average guaranty fee rate for our single-family guaranty arrangements during the period plus the recognition of any upfront cash payments over an estimated average life. Excludes the impact of a 10 basis point guaranty fee increase implemented pursuant to the TCCA, the incremental revenue from which is remitted to Treasury and not retained by us.
|
Single-Family Business Financial Results
|
Single-Family Business Financial Results
|
|||||||||||||||||||||||
|
For the Three Months Ended September 30,
|
For the Nine Months Ended September 30,
|
||||||||||||||||||||||
|
2018
|
2017
|
Variance
|
2018
|
2017
|
Variance
|
||||||||||||||||||
|
(Dollars in millions)
|
|||||||||||||||||||||||
|
Net interest income
(1)
|
$
|
4,670
|
|
$
|
4,627
|
|
$
|
43
|
|
$
|
13,954
|
|
$
|
13,749
|
|
$
|
205
|
|
|||||
|
Fee and other income
|
79
|
|
1,005
|
|
(926
|
)
|
306
|
|
1,192
|
|
(886
|
)
|
|||||||||||
|
Net revenues
|
4,749
|
|
5,632
|
|
(883
|
)
|
14,260
|
|
14,941
|
|
(681
|
)
|
|||||||||||
|
Investment gains, net
|
146
|
|
286
|
|
(140
|
)
|
640
|
|
557
|
|
83
|
|
|||||||||||
|
Fair value gains (losses), net
|
417
|
|
(300
|
)
|
717
|
|
1,729
|
|
(997
|
)
|
2,726
|
|
|||||||||||
|
Administrative expenses
|
(636
|
)
|
(580
|
)
|
(56
|
)
|
(1,928
|
)
|
(1,781
|
)
|
(147
|
)
|
|||||||||||
|
Credit-related income (expense)
(2)
|
582
|
|
(294
|
)
|
876
|
|
1,775
|
|
1,113
|
|
662
|
|
|||||||||||
|
TCCA fees
(1)
|
(576
|
)
|
(531
|
)
|
(45
|
)
|
(1,698
|
)
|
(1,552
|
)
|
(146
|
)
|
|||||||||||
|
Other expenses, net
|
(282
|
)
|
(320
|
)
|
38
|
|
(684
|
)
|
(731
|
)
|
47
|
|
|||||||||||
|
Income before federal income taxes
|
4,400
|
|
3,893
|
|
507
|
|
14,094
|
|
11,550
|
|
2,544
|
|
|||||||||||
|
Provision for federal income taxes
|
(938
|
)
|
(1,361
|
)
|
423
|
|
(2,998
|
)
|
(4,014
|
)
|
1,016
|
|
|||||||||||
|
Net income
|
$
|
3,462
|
|
$
|
2,532
|
|
$
|
930
|
|
$
|
11,096
|
|
$
|
7,536
|
|
$
|
3,560
|
|
|||||
__________
|
(1)
|
Reflects the impact of a 10 basis point guaranty fee increase implemented pursuant to the TCCA, the incremental revenue from which is remitted to Treasury. The resulting revenue is included in net interest income and the expense is recognized as “TCCA fees.”
|
|
(2)
|
Consists of the benefit (provision) for credit losses and foreclosed property expense.
|
Net interest income
Single-family net interest income increased in the
third quarter
and
first nine months
of
2018
compared with the
third quarter
and
first nine months
of
2017
. The drivers of net interest income for the single-family segment for all periods presented are consistent with the drivers of net interest income reported in our condensed consolidated statements of operations and comprehensive income for the same periods, which we discuss in “
Consolidated Results of Operations
—
Net Interest Income
.”
Fee and other income
Fee and other income
decreased
in the
third quarter
and
first nine months
of
2018
compared with the
third quarter
and
first nine months
of
2017
primarily due to $975 million of income in the
third quarter
of
2017
resulting from a settlement agreement resolving legal claims related to private-label securities we purchased.
Fair value gains (losses), net
We recognized fair value gains in the
third quarter
and
first nine months
of
2018
, a shift from fair value losses recognized in the
third quarter
and
first nine months
of
2017
. The drivers of fair value gains and losses for the single-family segment for all the periods presented are consistent with the drivers of fair value gains and losses reported in our condensed consolidated statements of operations and comprehensive income for the same periods, which we discuss in “
Consolidated Results of Operations
—
Fair Value Gains (Losses), Net
.”
Credit-related income (expense)
We recognized credit-related income in the
third quarter
of
2018
, a shift from credit-related expense in the
third quarter
of
2017
. We recognized higher credit-related income in the
first nine months
of
2018
compared with the
first nine months
of
2017
. The drivers of credit-related income and expense for the single-family segment for all
|
Fannie Mae Third Quarter 2018 Form 10-Q
|
23
|
|
|
MD&A | Business Segments
|
||
periods presented are consistent with the drivers of credit-related income and expense reported in our condensed consolidated statements of operations and comprehensive income for the same periods. We discuss our credit-related income and expense in “Consolidated Results of Operations—Credit-Related Income (Expense).”
Single-Family Mortgage Credit Risk Management
This section updates our discussion of single-family mortgage credit risk management in our
2017
Form 10-K in “
MD&A
—
Business Segments
—
Single-Family Business
—
Single-Family Mortgage Credit Risk Management
.”
Single-Family Acquisition and Servicing Policies and Underwriting and Servicing Standards
For information on our underwriting and servicing standards, quality control process, repurchase requests, and representation and warranty framework, see “
MD&A
—
Business Segments
—
Single-Family Business
—
Single-Family Mortgage Credit Risk Management
—
Single-Family Acquisition and Servicing Policies and Underwriting and Servicing Standards
” in our
2017
Form 10-K.
|
Fannie Mae Third Quarter 2018 Form 10-Q
|
24
|
|
|
MD&A | Business Segments
|
||
Single-Family Portfolio Diversification and Monitoring
For information on key loan attributes, see “
MD&A
—
Business Segments
—
Single-Family Business
—
Single-Family Mortgage Credit Risk Management
—
Single-Family Portfolio Diversification and Monitoring
” in our
2017
Form 10-K.
The table below
displays our single-family conventional business volumes and our single-family conventional guaranty book of business, based on certain key risk characteristics that we use to evaluate the risk profile and credit quality of our single-family loans.
|
Risk Characteristics of Single-Family Conventional Business Volume and Guaranty Book of Business
(1)
|
|||||||||||||||||||||||||||
|
Percent of Single-Family Conventional Business
Volume at Acquisition
(2)
|
Percent of Single-Family
Conventional Guaranty Book of Business
(3)
As of
|
||||||||||||||||||||||||||
|
For the Three Months Ended September 30,
|
For the Nine Months Ended September 30,
|
||||||||||||||||||||||||||
|
2018
|
2017
|
2018
|
2017
|
September 30, 2018
|
December 31, 2017
|
||||||||||||||||||||||
|
Original loan-to-value (“LTV”) ratio:
(4)
|
|||||||||||||||||||||||||||
|
<= 60%
|
14
|
|
%
|
16
|
|
%
|
16
|
|
%
|
18
|
|
%
|
20
|
|
%
|
20
|
|
%
|
|||||||||
|
60.01% to 70%
|
11
|
|
12
|
|
12
|
|
13
|
|
13
|
|
14
|
|
|||||||||||||||
|
70.01% to 80%
|
37
|
|
39
|
|
37
|
|
39
|
|
38
|
|
38
|
|
|||||||||||||||
|
80.01% to 90%
|
14
|
|
13
|
|
13
|
|
12
|
|
11
|
|
11
|
|
|||||||||||||||
|
90.01% to 95%
|
16
|
|
15
|
|
15
|
|
14
|
|
11
|
|
10
|
|
|||||||||||||||
|
95.01% to 100%
|
8
|
|
5
|
|
7
|
|
4
|
|
4
|
|
4
|
|
|||||||||||||||
|
Greater than 100%
|
*
|
|
*
|
|
*
|
|
*
|
|
3
|
|
3
|
|
|||||||||||||||
|
Total
|
100
|
|
%
|
100
|
|
%
|
100
|
|
%
|
100
|
|
%
|
100
|
|
%
|
100
|
|
%
|
|||||||||
|
Weighted average
|
78
|
|
%
|
76
|
|
%
|
77
|
|
%
|
75
|
|
%
|
75
|
|
%
|
75
|
|
%
|
|||||||||
|
Average loan amount
|
$
|
235,125
|
|
$
|
228,445
|
|
$
|
233,027
|
|
$
|
225,123
|
|
$
|
169,600
|
|
$
|
166,643
|
|
|||||||||
|
Estimated mark-to-market LTV ratio:
(5)
|
|||||||||||||||||||||||||||
|
<= 60%
|
56
|
|
%
|
52
|
|
%
|
|||||||||||||||||||||
|
60.01% to 70%
|
18
|
|
18
|
|
|||||||||||||||||||||||
|
70.01% to 80%
|
15
|
|
17
|
|
|||||||||||||||||||||||
|
80.01% to 90%
|
7
|
|
8
|
|
|||||||||||||||||||||||
|
90.01% to 100%
|
3
|
|
4
|
|
|||||||||||||||||||||||
|
Greater than 100%
|
1
|
|
1
|
|
|||||||||||||||||||||||
|
Total
|
100
|
|
%
|
100
|
|
%
|
|||||||||||||||||||||
|
Weighted average
|
56
|
|
%
|
58
|
|
%
|
|||||||||||||||||||||
|
Product type:
|
|||||||||||||||||||||||||||
|
Fixed-rate:
(6)
|
|||||||||||||||||||||||||||
|
Long-term
|
91
|
|
%
|
85
|
|
%
|
89
|
|
%
|
83
|
|
%
|
82
|
|
%
|
80
|
|
%
|
|||||||||
|
Intermediate-term
|
7
|
|
12
|
|
9
|
|
14
|
|
14
|
|
15
|
|
|||||||||||||||
|
Total fixed-rate
|
98
|
|
97
|
|
98
|
|
97
|
|
96
|
|
95
|
|
|||||||||||||||
|
Adjustable-rate
|
2
|
|
3
|
|
2
|
|
3
|
|
4
|
|
5
|
|
|||||||||||||||
|
Total
|
100
|
|
%
|
100
|
|
%
|
100
|
|
%
|
100
|
|
%
|
100
|
|
%
|
100
|
|
%
|
|||||||||
|
Number of property units:
|
|||||||||||||||||||||||||||
|
1 unit
|
98
|
|
%
|
98
|
|
%
|
98
|
|
%
|
97
|
|
%
|
97
|
|
%
|
97
|
|
%
|
|||||||||
|
2 to 4 units
|
2
|
|
2
|
|
2
|
|
3
|
|
3
|
|
3
|
|
|||||||||||||||
|
Total
|
100
|
|
%
|
100
|
|
%
|
100
|
|
%
|
100
|
|
%
|
100
|
|
%
|
100
|
|
%
|
|||||||||
|
Fannie Mae Third Quarter 2018 Form 10-Q
|
25
|
|
|
MD&A | Business Segments
|
||
|
Percent of Single-Family Conventional Business
Volume at Acquisition
(2)
|
Percent of Single-Family Conventional Guaranty Book of Business
(3)
As of
|
||||||||||||||||||||
|
For the Three Months Ended September 30,
|
For the Nine Months Ended September 30,
|
||||||||||||||||||||
|
2018
|
2017
|
2018
|
2017
|
September 30, 2018
|
December 31, 2017
|
||||||||||||||||
|
Property type:
|
|||||||||||||||||||||
|
Single-family homes
|
90
|
|
%
|
90
|
|
%
|
90
|
|
%
|
90
|
|
%
|
91
|
|
%
|
91
|
|
%
|
|||
|
Condo/Co-op
|
10
|
|
10
|
|
10
|
|
10
|
|
9
|
|
9
|
|
|||||||||
|
Total
|
100
|
|
%
|
100
|
|
%
|
100
|
|
%
|
100
|
|
%
|
100
|
|
%
|
100
|
|
%
|
|||
|
Occupancy type:
|
|||||||||||||||||||||
|
Primary residence
|
89
|
|
%
|
89
|
|
%
|
89
|
|
%
|
89
|
|
%
|
89
|
|
%
|
89
|
|
%
|
|||
|
Second/vacation home
|
4
|
|
4
|
|
4
|
|
4
|
|
4
|
|
4
|
|
|||||||||
|
Investor
|
7
|
|
7
|
|
7
|
|
7
|
|
7
|
|
7
|
|
|||||||||
|
Total
|
100
|
|
%
|
100
|
|
%
|
100
|
|
%
|
100
|
|
%
|
100
|
|
%
|
100
|
|
%
|
|||
|
FICO credit score at origination:
|
|||||||||||||||||||||
|
< 620
|
*
|
|
%
|
*
|
|
%
|
*
|
|
%
|
*
|
|
%
|
2
|
|
%
|
2
|
|
%
|
|||
|
620 to < 660
|
6
|
|
5
|
|
6
|
|
5
|
|
5
|
|
5
|
|
|||||||||
|
660 to < 700
|
14
|
|
13
|
|
14
|
|
13
|
|
12
|
|
12
|
|
|||||||||
|
700 to < 740
|
23
|
|
23
|
|
23
|
|
23
|
|
20
|
|
20
|
|
|||||||||
|
>= 740
|
57
|
|
59
|
|
57
|
|
59
|
|
61
|
|
61
|
|
|||||||||
|
Total
|
100
|
|
%
|
100
|
|
%
|
100
|
|
%
|
100
|
|
%
|
100
|
|
%
|
100
|
|
%
|
|||
|
Weighted average
|
743
|
|
745
|
|
743
|
|
745
|
|
745
|
|
745
|
|
|||||||||
|
Loan purpose:
|
|||||||||||||||||||||
|
Purchase
|
72
|
|
%
|
63
|
|
%
|
64
|
|
%
|
56
|
|
%
|
42
|
|
%
|
39
|
|
%
|
|||
|
Cash-out refinance
|
19
|
|
19
|
|
22
|
|
21
|
|
20
|
|
20
|
|
|||||||||
|
Other refinance
|
9
|
|
18
|
|
14
|
|
23
|
|
38
|
|
41
|
|
|||||||||
|
Total
|
100
|
|
%
|
100
|
|
%
|
100
|
|
%
|
100
|
|
%
|
100
|
|
%
|
100
|
|
%
|
|||
|
Geographic concentration:
(7)
|
|||||||||||||||||||||
|
Midwest
|
15
|
|
%
|
15
|
|
%
|
14
|
|
%
|
14
|
|
%
|
15
|
|
%
|
15
|
|
%
|
|||
|
Northeast
|
14
|
|
14
|
|
13
|
|
14
|
|
17
|
|
18
|
|
|||||||||
|
Southeast
|
23
|
|
23
|
|
23
|
|
23
|
|
22
|
|
22
|
|
|||||||||
|
Southwest
|
21
|
|
20
|
|
21
|
|
20
|
|
18
|
|
17
|
|
|||||||||
|
West
|
27
|
|
28
|
|
29
|
|
29
|
|
28
|
|
28
|
|
|||||||||
|
Total
|
100
|
|
%
|
100
|
|
%
|
100
|
|
%
|
100
|
|
%
|
100
|
|
%
|
100
|
|
%
|
|||
|
Origination year:
|
|||||||||||||||||||||
|
2012 and prior
|
31
|
|
%
|
36
|
|
%
|
|||||||||||||||
|
2013
|
11
|
|
12
|
|
|||||||||||||||||
|
2014
|
6
|
|
7
|
|
|||||||||||||||||
|
2015
|
10
|
|
12
|
|
|||||||||||||||||
|
2016
|
17
|
|
18
|
|
|||||||||||||||||
|
2017
|
15
|
|
15
|
|
|||||||||||||||||
|
2018
|
10
|
|
—
|
|
|||||||||||||||||
|
Total
|
100
|
|
%
|
100
|
|
%
|
|||||||||||||||
__________
|
*
|
Represents less than 0.5% of single-family conventional business volume or book of business.
|
|
Fannie Mae Third Quarter 2018 Form 10-Q
|
26
|
|
|
MD&A | Business Segments
|
||
|
(1)
|
Second lien mortgage loans held by third parties are not reflected in the original LTV or mark-to-market LTV ratios in this table.
|
|
(2)
|
Calculated based on unpaid principal balance of single-family loans for each category at time of acquisition.
|
|
(3)
|
Calculated based on the aggregate unpaid principal balance of single-family loans for each category divided by the aggregate unpaid principal balance of loans in our single-family conventional guaranty book of business as of the end of each period.
|
|
(4)
|
The original LTV ratio generally is based on the original unpaid principal balance of the loan divided by the appraised property value reported to us at the time of acquisition of the loan. Excludes loans for which this information is not readily available.
|
|
(5)
|
The aggregate estimated mark-to-market LTV ratio is based on the unpaid principal balance of the loan as of the end of each reported period divided by the estimated current value of the property, which we calculate using an internal valuation model that estimates periodic changes in home value. Excludes loans for which this information is not readily available.
|
|
(6)
|
Long-term fixed-rate consists of mortgage loans with maturities greater than 15 years, while intermediate-term fixed-rate loans have maturities equal to or less than 15 years.
|
|
(7)
|
Midwest consists of IL, IN, IA, MI, MN, NE, ND, OH, SD and WI. Northeast consists of CT, DE, ME, MA, NH, NJ, NY, PA, PR, RI, VT and VI. Southeast consists of AL, DC, FL, GA, KY, MD, MS, NC, SC, TN, VA and WV. Southwest consists of AZ, AR, CO, KS, LA, MO, NM, OK, TX and UT. West consists of AK, CA, GU, HI, ID, MT, NV, OR, WA and WY.
|
The share of our single-family loan acquisitions consisting of home purchase loans rather than refinances increased in the
first nine months
of
2018
compared with the
first nine months
of
2017
, primarily driven by higher mortgage rates in
2018
. In addition, our acquisitions of loans from first-time home buyers increased from
23%
of our single-family loan acquisitions in the
first nine months
of
2017
to
27%
in the
first nine months
of
2018
. Typically, home purchase loans—particularly those to first-time home buyers—have significantly higher LTV ratios than refinances. This trend contributed to an increase in the percentage of our single-family loan acquisitions with LTV ratios over 95%—from
4%
in the
first nine months
of
2017
to
7%
in the
first nine months
of
2018
. The increased share of home purchase loan acquisitions has increased the percentage of home purchase loans in our single-family conventional guaranty book of business.
In July 2017, we implemented Desktop Underwriter
®
(“DU
®
”) Version 10.1, which included a change that enabled loans with debt-to-income ratios above 45% (up to 50%) to rely on DU’s comprehensive risk assessment, and removed specific policy rules that had previously set maximum LTV ratio and minimum reserves requirements for those loans. Due in part to our implementation of this change, acquisitions associated with borrower debt-to-income ratios above 45% increased to
25%
of our non-Refi Plus single-family acquisitions in the
first nine months
of
2018
, compared with
7%
in the
first nine months
of
2017
. After assessing the profile of loans delivered to us using DU Version 10.1, in March 2018 we implemented DU Version 10.2, which revised DU’s risk assessment to limit risk layering. Risk layering refers to the acquisition of loans with multiple higher-risk characteristics (such as high LTV ratio, credit profile with a history of delinquencies, debt-to-income ratio above 45% and no or low levels of reserves). In October 2018, we announced our plan to implement DU Version 10.3 in December 2018. DU Version 10.3 will revise DU’s risk assessment to further limit risk layering, particularly with respect to loans with debt-to-income ratios above 45%. We expect to continue to acquire a higher proportion of loans with debt-to-income ratios above 45% than we acquired in periods prior to our July 2017 implementation of DU Version 10.1. We will continue to closely monitor loan acquisitions and market conditions and, as appropriate, make changes in our eligibility criteria so that the loans we acquire are consistent with our risk appetite.
For a discussion of factors that may impact the credit characteristics of loans we acquire in the future, see “
MD&A
—
Business Segments
—
Single-Family Business
—
Single-Family Mortgage Credit Risk Management
—
Single-Family Portfolio Diversification and Monitoring
” in our
2017
Form 10-K. In this section of our
2017
Form 10-K, we also provide more information on the credit characteristics of loans in our guaranty book of business, including Home Affordable Refinance Program
®
(“HARP
®
”) and Refi Plus
TM
loans, jumbo-conforming and high-balance loans, reverse mortgages and mortgage products with rate resets.
|
Fannie Mae Third Quarter 2018 Form 10-Q
|
27
|
|
|
MD&A | Business Segments
|
||
Transfer of Mortgage Credit Risk
Single-Family Credit Enhancements
Our charter generally requires credit enhancement on any single-family conventional mortgage loan that we purchase or securitize if it has an LTV ratio over 80% at the time of purchase. We also enter into various other types of transactions in which we transfer mortgage credit risk to third parties. The table below displays information on the outstanding unpaid principal balance of our single-family loans, as well as the percentage of our total single-family conventional guaranty book of business measured by unpaid principal balance, that were covered by one or more forms of credit enhancement as of the dates specified. For a description of the types of credit enhancements specified in the table, see “
MD&A
—
Business Segments
—
Single-Family Business
—
Single-Family Mortgage Credit Risk Management
—
Transfer of Mortgage Credit Risk
” in our
2017
Form 10-K. For a discussion of our exposure to and management of the institutional counterparty credit risk associated with the providers of these credit enhancements see “
Risk Management
—
Credit Risk Management
—
Institutional Counterparty Credit Risk Management
” in our
2017
Form 10-K and “
Note 11, Concentrations of Credit Risk
” in this report.
|
Single-Family Loans with Credit Enhancement
|
||||||||||||||
|
As of
|
||||||||||||||
|
September 30, 2018
|
December 31, 2017
|
|||||||||||||
|
Unpaid Principal Balance
|
Percentage of Single-Family Conventional Guaranty Book of Business
|
Unpaid Principal Balance
|
Percentage of Single-Family Conventional Guaranty Book of Business
|
|||||||||||
|
(Dollars in billions)
|
||||||||||||||
|
Primary mortgage insurance and other
|
$
|
601
|
|
21
|
%
|
$
|
566
|
|
20
|
%
|
||||
|
Connecticut Avenue Securities
|
768
|
|
27
|
|
681
|
|
24
|
|
||||||
|
Credit Insurance Risk Transfer
TM
(“CIRT
TM”
)
|
231
|
|
8
|
|
181
|
|
6
|
|
||||||
|
Lender risk sharing
|
94
|
|
3
|
|
65
|
|
2
|
|
||||||
|
Less: Loans covered by multiple credit enhancements
|
(379
|
)
|
(14
|
)
|
(335
|
)
|
(12
|
)
|
||||||
|
Total unpaid principal balance of single-family loans with credit enhancement
|
$
|
1,315
|
|
45
|
%
|
$
|
1,158
|
|
40
|
%
|
||||
Credit Risk Transfer Transactions
Our Single-Family business has developed risk-sharing capabilities to transfer portions of our single-family mortgage credit risk to the private market. Our primary method of achieving this objective has been through our CAS and CIRT transactions. In most of our credit risk transfer transactions, we transfer a small portion of the expected credit losses, and a significant portion of the losses we expect would be incurred in a stressed credit environment, such as a severe or prolonged economic downturn.
|
Fannie Mae Third Quarter 2018 Form 10-Q
|
28
|
|
|
MD&A | Business Segments
|
||
The tables below display the mortgage credit risk transferred to third parties and retained by Fannie Mae pursuant to our single-family credit risk transfer transactions.
|
Single-Family Credit Risk Transfer Transactions
|
||||||||||||||||
|
Issuances from Inception to September 30, 2018
(1)
|
||||||||||||||||
|
(Dollars in billions)
|
||||||||||||||||

|
Senior
|
Fannie Mae
(2)
|
Initial Reference Pool
(5)
|
|||||||||||||
|
$1,427
|
||||||||||||||||
|
Mezzanine
|
Fannie Mae
(2)
|
CIRT
(3)(4)
|
CAS
(3)
|
Lender Risk-Sharing
(3)
|
||||||||||||
|
$2
|
$7
|
$31
|
$2
|
$1,481
|
||||||||||||
|
First Loss
|
Fannie Mae
(2)
|
CAS
(3)(6)
|
Lender Risk-Sharing
(3)
|
|||||||||||||
|
$8
|
$3
|
$1
|
||||||||||||||
|
Outstanding as of September 30, 2018
(1)
|
||||||||||||||||
|
(Dollars in billions)
|
||||||||||||||||
|
Senior
|
Fannie Mae
(2)
|
Outstanding Reference Pool
(5)(7)
|
|||||||||||||
|
$1,041
|
||||||||||||||||
|
Mezzanine
|
Fannie Mae
(2)
|
CIRT
(3)(4)
|
CAS
(3)
|
Lender Risk-Sharing
(3)
|
||||||||||||
|
$1
|
$7
|
$22
|
$2
|
$1,085
|
||||||||||||
|
First Loss
|
Fannie Mae
(2)
|
CAS
(3)(6)
|
Lender Risk-Sharing
(3)
|
|||||||||||||
|
$8
|
$3
|
$1
|
||||||||||||||
__________
|
(1)
|
For some lender risk-sharing transactions, does not reflect completed transfers of risk prior to settlement.
|
|
(2)
|
Credit risk retained by Fannie Mae in CAS, CIRT and lender risk-sharing transactions. Tranche sizes vary across programs.
|
|
(3)
|
Credit risk transferred to third parties. Tranche sizes vary across programs.
|
|
(4)
|
Includes mortgage pool insurance transactions covering loans with an unpaid principal balance of approximately
$7 billion
at issuance and approximately
$4 billion
outstanding
as of September 30, 2018
.
|
|
(5)
|
For CIRT and some lender risk-sharing transactions, “Reference Pool” reflects a pool of covered loans.
|
|
(6)
|
For CAS transactions, “First Loss” represents all B tranche balances.
|
|
(7)
|
For CAS and some lender risk-sharing transactions, represents outstanding reference pools, not the outstanding unpaid principal balance of the underlying loans. The outstanding unpaid principal balance for all loans covered by credit risk transfer programs, including all loans on which risk has been transferred in lender risk-sharing transactions, was
$1,093 billion
as of September 30, 2018
.
|
|
Fannie Mae Third Quarter 2018 Form 10-Q
|
29
|
|
|
MD&A | Business Segments
|
||
During the
first nine months
of
2018
, pursuant to our credit risk transfer transactions, we transferred a portion of the mortgage credit risk on single-family mortgages with an unpaid principal balance of over
$250 billion
at the time of the transactions.
Because a larger portion of our single-family book of business was covered by CAS and CIRT transactions in the
first nine months
of
2018
than in the
first nine months
of
2017
, the expenses related to these transactions increased:
|
•
|
For the
first nine months
of
2018
, we paid approximately
$655 million
in interest expense, net of LIBOR, on our outstanding CAS and approximately
$205 million
in CIRT premiums.
|
|
•
|
Comparatively, we paid approximately
$568 million
in interest expense, net of LIBOR, on our outstanding CAS and approximately
$127 million
in CIRT premiums for the
first nine months
of
2017
.
|
As a part of our continued effort to innovate and improve our credit risk transfer programs, we are in the process of executing an enhancement to our credit risk transfer securities that will structure our CAS offerings as notes issued by a trust that qualifies as a Real Estate Mortgage Investment Conduit (“REMIC”), enabling expanded participation by real estate investment trusts and international investors. The new REMIC structure will differ from the prior CAS notes that were issued as Fannie Mae corporate debt. Under the prior CAS structure, there can be a significant lag between the time when we recognize a provision for credit losses and when we recognize the related recovery from the CAS transaction. Under current accounting rules, while a credit expense on a loan in a reference pool for a CAS transaction is recorded when it is probable that we have incurred a loss, for our CAS issued beginning in 2016, a recovery is recorded only when an actual loss event occurs, which is typically several months after the collateral has been liquidated. The new CAS structure will eliminate this timing mismatch, allowing us to recognize the expected credit loss protection benefit at the same time the credit loss is recognized in our consolidated financial statements. We will continue to record the expected benefit and the loss in the same period upon our adoption of Accounting Standards Update 2016-13, Financial Instruments—Credit Losses, in January 2020.
The enhancement to our CAS program is designed to promote the continued growth of the market by expanding the potential investor base for these securities and limiting investor exposure to Fannie Mae counterparty risk, without disrupting the TBA MBS market. We expect to issue CAS under the new REMIC structure in November 2018.
|
Fannie Mae Third Quarter 2018 Form 10-Q
|
30
|
|
|
MD&A | Business Segments
|
||
Single-Family Problem Loan Management
Our problem loan management strategies are primarily focused on reducing defaults to avoid losses that would otherwise occur and pursuing foreclosure alternatives to attempt to minimize the severity of the losses we incur. See “MD&A—Business Segments—Single-Family Business—Single-Family Mortgage Credit Risk Management—Problem Loan Management” in our 2017 Form 10-K for a discussion of delinquency statistics on our problem loans, efforts undertaken to manage our problem loans, metrics regarding our loan workout activities, real estate owned (“REO”) management and other single-family credit-related disclosures. The discussion below updates some of that information.
Delinquency
The tables below display the delinquency status of loans and changes in the balance of seriously delinquent loans in our single-family conventional guaranty book of business, based on the number of loans. We include single-family conventional loans that we own and those that back Fannie Mae MBS in the calculation of the single-family delinquency rate. Seriously delinquent loans are loans that are 90 days or more past due or in the foreclosure process.
|
Delinquency Status and Activity of Single-Family Conventional Loans
|
||||||||
|
As of
|
||||||||
|
September 30, 2018
|
December 31, 2017
|
September 30,
2017 |
||||||
|
Delinquency status:
|
||||||||
|
30 to 59 days delinquent
|
1.52
|
%
|
1.63
|
%
|
1.63
|
%
|
||
|
60 to 89 days delinquent
|
0.37
|
|
0.50
|
|
0.40
|
|
||
|
Seriously delinquent (“SDQ”)
|
0.82
|
|
1.24
|
|
1.01
|
|
||
|
Percentage of SDQ loans that have been delinquent for more than 180 days
|
53
|
%
|
43
|
%
|
57
|
%
|
||
|
Percentage of SDQ loans that have been delinquent for more than two years
|
13
|
|
13
|
|
18
|
|
||
|
For the Nine Months Ended September 30,
|
|||||
|
2018
|
2017
|
||||
|
Single-family SDQ loans (number of loans):
|
|||||
|
Beginning balance
|
212,183
|
|
206,549
|
|
|
|
Additions
|
171,516
|
|
177,449
|
|
|
|
Removals:
|
|||||
|
Modifications and other loan workouts
|
(83,567
|
)
|
(56,048
|
)
|
|
|
Liquidations and sales
|
(58,912
|
)
|
(63,854
|
)
|
|
|
Cured or less than 90 days delinquent
|
(101,524
|
)
|
(91,545
|
)
|
|
|
Total removals
|
(244,003
|
)
|
(211,447
|
)
|
|
|
Ending balance
|
139,696
|
|
172,551
|
|
|
Our single-family serious delinquency rate was
0.82%
as of September 30, 2018
, compared with
1.24%
as of December 31, 2017 and
1.01%
as of September 30, 2017. Our single-family serious delinquency rate increased in the latter part of 2017 due to the impact of the 2017 hurricanes, but has since resumed its prior downward trend because many delinquent borrowers in the affected areas have resolved their loan delinquencies by obtaining loan modifications or through resuming payments and becoming current on their loans. Our single-family serious delinquency rate may be negatively impacted in the near term as a result of the hurricanes that occurred late in the third quarter of 2018 and early in the fourth quarter of 2018, which may cause some borrowers in the affected regions to miss their payments, including through forbearance arrangements that may be extended. We are still evaluating the impact, but we do not believe that the hurricanes to date in 2018, individually or in aggregate, will have a material impact on our credit losses or loss reserves. In the longer term, we expect our single-family
|
Fannie Mae Third Quarter 2018 Form 10-Q
|
31
|
|
|
MD&A | Business Segments
|
||
serious delinquency rate to continue to decline, but at a more modest pace than in the past several years, and to experience period-to-period fluctuations.
Certain higher-risk loan categories, such as Alt-A loans, loans with higher estimated mark-to-market LTV ratios, and our 2005 through 2008 loan vintages, continue to exhibit higher than average delinquency rates and/or account for a higher share of our credit losses. Single-family loans originated in 2005 through 2008 constituted
5%
of our single-family book of business
as of September 30, 2018
, but constituted
41%
of our seriously delinquent single-family loans
as of September 30, 2018
. In addition, single-family loans originated in 2005 through 2008 drove
58%
of our single-family credit losses in the
third quarter
of
2018
and
65%
in the
first nine months
of
2018
. Loans in certain judicial foreclosure states such as Florida, New Jersey and New York with historically long foreclosure timelines have exhibited higher than average delinquency rates and/or account for a higher share of our credit losses.
The table below displays the serious delinquency rates for, and the percentage of our total seriously delinquent single-family conventional loans represented by, the specified loan categories. We also include information for our loans in California, as this state accounts for a large share of our single-family conventional guaranty book of business. The reported categories are not mutually exclusive. Percentage of book outstanding calculations are based on the unpaid principal balance of loans for each category divided by the unpaid principal balance of our total single-family guaranty book of business for which we have detailed loan level information.
|
Single-Family Conventional Seriously Delinquent Loan Concentration Analysis
|
|||||||||||||||||||||||||||
|
As of
|
|||||||||||||||||||||||||||
|
September 30, 2018
|
December 31, 2017
|
September 30, 2017
|
|||||||||||||||||||||||||
|
Percentage of Book Outstanding
|
Percentage of Seriously Delinquent Loans
(1)
|
Serious Delinquency Rate
|
Percentage of Book Outstanding
|
Percentage of Seriously Delinquent Loans
(1)
|
Serious Delinquency Rate
|
Percentage of Book Outstanding
|
Percentage of Seriously Delinquent Loans
(1)
|
Serious Delinquency Rate
|
|||||||||||||||||||
|
States:
|
|||||||||||||||||||||||||||
|
California
|
19
|
%
|
6
|
%
|
0.34
|
%
|
19
|
%
|
5
|
%
|
0.42
|
%
|
19
|
%
|
6
|
%
|
0.43
|
%
|
|||||||||
|
Florida
|
6
|
|
12
|
|
1.51
|
|
6
|
|
19
|
|
3.71
|
|
6
|
|
10
|
|
1.50
|
|
|||||||||
|
New Jersey
|
4
|
|
6
|
|
1.51
|
|
4
|
|
5
|
|
2.15
|
|
4
|
|
7
|
|
2.36
|
|
|||||||||
|
New York
|
5
|
|
8
|
|
1.55
|
|
5
|
|
7
|
|
2.02
|
|
5
|
|
9
|
|
2.13
|
|
|||||||||
|
All other states
|
66
|
|
68
|
|
0.77
|
|
66
|
|
64
|
|
1.09
|
|
66
|
|
68
|
|
0.94
|
|
|||||||||
|
Product type:
|
|||||||||||||||||||||||||||
|
Alt-A
(2)
|
2
|
|
12
|
|
3.68
|
|
2
|
|
12
|
|
4.95
|
|
3
|
|
14
|
|
4.54
|
|
|||||||||
|
Vintages:
|
|||||||||||||||||||||||||||
|
2004 and prior
|
3
|
|
23
|
|
2.77
|
|
4
|
|
23
|
|
3.28
|
|
4
|
|
25
|
|
2.75
|
|
|||||||||
|
2005-2008
|
5
|
|
41
|
|
4.90
|
|
6
|
|
42
|
|
6.55
|
|
7
|
|
48
|
|
5.83
|
|
|||||||||
|
2009-2018
|
92
|
|
36
|
|
0.34
|
|
90
|
|
35
|
|
0.53
|
|
89
|
|
27
|
|
0.33
|
|
|||||||||
|
Estimated mark-to-market LTV ratio:
|
|||||||||||||||||||||||||||
|
<= 60%
|
56
|
|
47
|
|
0.61
|
|
52
|
|
41
|
|
0.84
|
|
53
|
|
40
|
|
0.66
|
|
|||||||||
|
60.01% to 70%
|
18
|
|
17
|
|
0.91
|
|
18
|
|
18
|
|
1.34
|
|
19
|
|
17
|
|
1.05
|
|
|||||||||
|
70.01% to 80%
|
15
|
|
15
|
|
0.99
|
|
17
|
|
16
|
|
1.48
|
|
16
|
|
15
|
|
1.17
|
|
|||||||||
|
80.01%
to 90%
|
7
|
|
10
|
|
1.38
|
|
8
|
|
11
|
|
2.09
|
|
8
|
|
11
|
|
1.77
|
|
|||||||||
|
90.01% to 100%
|
3
|
|
5
|
|
1.74
|
|
4
|
|
6
|
|
2.62
|
|
3
|
|
7
|
|
2.72
|
|
|||||||||
|
Greater than 100%
|
1
|
|
6
|
|
10.65
|
|
1
|
|
8
|
|
11.70
|
|
1
|
|
10
|
|
10.73
|
|
|||||||||
|
Credit enhanced:
(3)
|
|||||||||||||||||||||||||||
|
Primary
MI & other
(4)
|
21
|
|
25
|
|
1.19
|
|
20
|
|
26
|
|
1.95
|
|
19
|
|
26
|
|
1.62
|
|
|||||||||
|
Credit risk transfer
(5)
|
38
|
|
8
|
|
0.23
|
|
32
|
|
8
|
|
0.42
|
|
31
|
|
4
|
|
0.16
|
|
|||||||||
|
Non-credit enhanced
|
55
|
|
70
|
|
0.90
|
|
60
|
|
69
|
|
1.27
|
|
60
|
|
72
|
|
1.05
|
|
|||||||||
__________
|
(1)
|
Calculated based on the number of single-family loans that were seriously delinquent for each category divided by the total number of single-family conventional loans that were seriously delinquent.
|
|
Fannie Mae Third Quarter 2018 Form 10-Q
|
32
|
|
|
MD&A | Business Segments
|
||
|
(2)
|
For a description of our Alt-A loan classification criteria, see “Glossary of Terms Used in This Report” in our 2017 Form 10-K.
|
|
(3)
|
The credit-enhanced categories are not mutually exclusive. A loan with primary mortgage insurance that is also covered by a credit risk transfer transaction will be included in both the “Primary MI & other” category and the “Credit risk transfer” category. As a result, the “Credit enhanced” and “Non-credit enhanced” categories do not sum to 100%. The total percentage of our single-family conventional guaranty book of business with some form of credit enhancement
as of September 30, 2018
was
45%
.
|
|
(4)
|
Refers to loans included in an agreement used to reduce credit risk by requiring primary mortgage insurance, collateral, letters of credit, corporate guarantees, or other agreements to provide an entity with some assurance that it will be compensated to some degree in the event of a financial loss. Excludes loans covered by credit risk transfer transactions unless such loans are also covered by primary mortgage insurance.
|
|
(5)
|
Refers to loans included in reference pools for credit risk transfer transactions, including loans in these transactions that are also covered by primary mortgage insurance. For CAS and some lender risk-sharing transactions, this represents outstanding unpaid principal balance of the underlying loans on the single-family mortgage credit book, not the outstanding reference pool, as of the specified date. Loans included in our credit risk transfer transactions have all been acquired since 2012 and newer vintages typically have significantly lower delinquency rates than more seasoned loans.
|
Loan Workout Metrics
Our loan workouts reflect our home retention solutions, including loan modifications, repayment plans and forbearances, and foreclosure alternatives, including short sales and deeds-in-lieu of foreclosure.
The chart below
displays the unpaid principal balance of our completed single-family loan workouts by type, as well as the number of loan workouts.
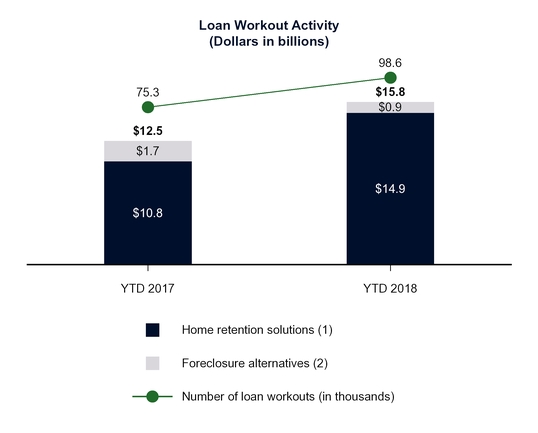
__________
|
(1
)
|
Consists of loan modifications and completed repayment plans and forbearances. Repayment plans reflect only those plans associated with loans that were 60 days or more delinquent. Forbearances reflect loans that were 90 days or more delinquent. Excludes trial modifications, loans to certain borrowers who have received bankruptcy relief that are classified as troubled debt restructurings, and repayment and forbearance plans that have been initiated but not completed. There were approximately
22,700
loans in a trial modification period
as of September 30, 2018
.
|
|
(2)
|
Consists of short sales and deeds-in-lieu of foreclosure.
|
|
Fannie Mae Third Quarter 2018 Form 10-Q
|
33
|
|
|
MD&A | Business Segments
|
||
The increase in home retention solutions in the
first nine months
of
2018
compared with the
first nine months
of
2017
was primarily driven by modifications and forbearances granted during the
first nine months
of
2018
to borrowers in areas affected by the 2017 hurricanes.
REO Management
If a loan defaults, we acquire the home through foreclosure or a deed-in-lieu of foreclosure.
The table below
displays our foreclosure activity by region. Regional REO acquisition trends generally follow a pattern that is similar to, but lags, that of regional delinquency trends.
|
Single-Family REO Properties
|
|||||||||
|
|
For the Nine Months
|
||||||||
|
|
Ended September 30,
|
||||||||
|
2018
|
2017
|
||||||||
|
Single-family REO properties (number of properties):
|
|||||||||
|
Beginning of period inventory of single-family REO properties
(1)
|
26,311
|
|
38,093
|
|
|||||
|
Acquisitions by geographic area:
(2)
|
|||||||||
|
Midwest
|
4,675
|
|
6,716
|
|
|||||
|
Northeast
|
5,023
|
|
7,496
|
|
|||||
|
Southeast
|
6,190
|
|
8,966
|
|
|||||
|
Southwest
|
2,864
|
|
4,083
|
|
|||||
|
West
|
1,518
|
|
2,156
|
|
|||||
|
Total REO acquisitions
(1)
|
20,270
|
|
29,417
|
|
|||||
|
Dispositions of REO
|
(25,549
|
)
|
(38,497
|
)
|
|||||
|
End of period inventory of single-family REO properties
(1)
|
21,032
|
|
29,013
|
|
|||||
|
Carrying value of single-family REO properties (dollars in millions)
|
$
|
2,606
|
|
$
|
3,448
|
|
|||
|
Single-family foreclosure rate
(3)
|
0.16
|
|
%
|
0.23
|
|
%
|
|||
|
REO net sales prices to unpaid principal balance
(4)
|
77
|
|
%
|
75
|
|
%
|
|||
|
Short sales net sales prices to unpaid principal balance
(5)
|
77
|
|
%
|
75
|
|
%
|
|||
__________
|
(1)
|
Includes acquisitions through foreclosure and deeds-in-lieu of foreclosure. Also includes held for use properties, which are reported in our condensed consolidated balance sheets as a component of “Other assets.”
|
|
(2)
|
See footnote 7 to the
Risk Characteristics of Single-Family Conventional Business Volume and Guaranty Book of Business
table for states included in each geographic region.
|
|
(3)
|
Estimated based on the annualized total number of properties acquired through foreclosure or deeds-in-lieu of foreclosure as a percentage of the total number of loans in our single-family guaranty book of business as of the end of each respective period.
|
|
(4)
|
Calculated as the amount of sale proceeds received on disposition of REO properties during the respective periods, excluding those subject to repurchase requests made to our sellers or servicers, divided by the aggregate unpaid principal balance of the related loans at the time of foreclosure. Net sales price represents the contract sales price less selling costs for the property and other charges paid by the seller at closing.
|
|
(5)
|
Calculated as the amount of sale proceeds received on properties sold in short sale transactions during the respective periods divided by the aggregate unpaid principal balance of the related loans. Net sales price represents the contract sales price less the selling costs for the property and other charges paid by the seller at the closing, including borrower relocation incentive payments and subordinate lien(s) negotiated payoffs.
|
The decrease in single-family REO properties from
December 31, 2017
to
September 30, 2018
was primarily due to a reduction in REO acquisitions from serious delinquencies aged greater than 180 days driven by improved loan performance and the continued sale of nonperforming loans in
2018
.
|
Fannie Mae Third Quarter 2018 Form 10-Q
|
34
|
|
|
MD&A | Business Segments
|
||
Other Single-Family Credit Information
Credit Loss Performance and Concentration Metrics
The amount of credit losses we realize in a given period are driven by foreclosures, pre-foreclosure sales, REO activity, mortgage loan redesignations and charge-offs pursuant to the provisions of the Advisory Bulletin in the period. The table below displays the components of our single-family credit loss performance metrics, as well as our single-family initial charge-off severity rate. Our credit loss performance metrics are not defined terms within generally accepted accounting principles in the United States of America (“GAAP”) and may not be calculated in the same manner as similarly titled measures reported by other companies. We believe that credit loss performance metrics may be useful to investors as the losses are presented as a percentage of our guaranty book of business and have historically been used by analysts, investors and other companies within the financial services industry.
|
Single-Family Credit Loss Performance Metrics
|
|||||||||||||||||||||||||||||||||
|
For the Three Months Ended September 30,
|
For the Nine Months Ended September 30,
|
||||||||||||||||||||||||||||||||
|
2018
|
2017
|
2018
|
2017
|
||||||||||||||||||||||||||||||
|
Amount
|
Ratio
(1)
|
Amount
|
Ratio
(1)
|
Amount
|
Ratio
(1)
|
Amount
|
Ratio
(1)
|
||||||||||||||||||||||||||
|
(Dollars in millions)
|
|||||||||||||||||||||||||||||||||
|
Charge-offs, net of recoveries
|
$
|
(430
|
)
|
5.8
|
|
bps
|
$
|
(382
|
)
|
5.2
|
|
bps
|
$
|
(1,473
|
)
|
6.7
|
|
bps
|
$
|
(1,851
|
)
|
8.5
|
|
bps
|
|||||||||
|
Foreclosed property expense
|
(150
|
)
|
2.1
|
|
(157
|
)
|
2.2
|
|
(448
|
)
|
2.0
|
|
(405
|
)
|
1.9
|
|
|||||||||||||||||
|
Credit losses and credit loss ratio
|
$
|
(580
|
)
|
7.9
|
|
bps
|
$
|
(539
|
)
|
7.4
|
|
bps
|
$
|
(1,921
|
)
|
8.7
|
|
bps
|
$
|
(2,256
|
)
|
10.4
|
|
bps
|
|||||||||
|
Single-family initial charge-off severity rate
(2)
|
10.34
|
%
|
13.82
|
%
|
11.56
|
%
|
15.44
|
%
|
|||||||||||||||||||||||||
|
(1)
|
Basis points are based on the amount for each line item presented divided by the average single-family guaranty book of business during the period.
|
|
(2)
|
The rate excludes any costs, gains or losses associated with REO after initial acquisition through final disposition. The rate includes charge-offs pursuant to the provisions of the Advisory Bulletin and charge-offs of property tax and insurance receivables.
|
Our single-family credit losses and credit loss ratio
increased
in the
third quarter
of
2018
compared with the
third quarter
of
2017
, primarily due to higher charge-offs related to the redesignation of single-family loans from HFI to HFS, partially offset by lower charge-off expenses from reduced foreclosures and foreclosure alternatives and higher home prices in the
third quarter
of
2018
.
Our single-family credit losses and credit loss ratio
decreased
in the
first nine months
of
2018
compared with the
first nine months
of
2017
primarily due to lower charge-off expenses from reduced foreclosures and foreclosure alternatives and higher home prices in
2018
, as well as an expansion at the beginning of
2017
of the charge-off criteria for non-liquidated loans pursuant to the provisions of the Advisory Bulletin. The decline in single-family credit losses and credit loss ratio in the
first nine months
of
2018
was partially offset by higher charge-offs related to the redesignation of single-family loans from HFI to HFS.
Our single-family initial charge-off severity rates
declined
in the
third quarter
and
first nine months
of
2018
compared with the third quarter and first nine months of 2017 primarily as a result of higher home prices in 2018.
|
Fannie Mae Third Quarter 2018 Form 10-Q
|
35
|
|
|
MD&A | Business Segments
|
||
Single-Family Loss Reserves
Our single-family loss reserves provide for an estimate of credit losses incurred in our single-family guaranty book of business, including concessions we granted borrowers upon modification of their loans. The table below summarizes the changes in our single-family loss reserves.
|
Single-Family Loss Reserves
|
|||||||||||||||
|
For the Three Months Ended September 30,
|
For the Nine Months Ended September 30,
|
||||||||||||||
|
2018
|
2017
|
2018
|
2017
|
||||||||||||
|
(Dollars in millions)
|
|||||||||||||||
|
Changes in loss reserves:
|
|||||||||||||||
|
Beginning balance
|
$
|
(16,638
|
)
|
$
|
(20,553
|
)
|
$
|
(19,155
|
)
|
$
|
(23,639
|
)
|
|||
|
Benefit (provision) for credit losses
|
732
|
|
(137
|
)
|
2,223
|
|
1,518
|
|
|||||||
|
Charge-offs
|
514
|
|
455
|
|
1,728
|
|
2,221
|
|
|||||||
|
Recoveries
|
(84
|
)
|
(73
|
)
|
(255
|
)
|
(370
|
)
|
|||||||
|
Other
(1)
|
(2
|
)
|
17
|
|
(19
|
)
|
(21
|
)
|
|||||||
|
Ending balance
|
$
|
(15,478
|
)
|
$
|
(20,291
|
)
|
$
|
(15,478
|
)
|
$
|
(20,291
|
)
|
|||
|
As of
|
|||||||||||||||
|
September 30, 2018
|
December 31, 2017
|
||||||||||||||
|
Loss reserves as a percentage of single-family:
|
|||||||||||||||
|
Guaranty book of business
|
0.52
|
%
|
0.65
|
%
|
|||||||||||
|
Recorded investment in nonaccrual loans
|
47.52
|
|
40.80
|
|
|||||||||||
__________
|
(1)
|
Amounts represent the portion of single-family benefit (provision) for credit losses, charge-offs and recoveries that are not a part of loss reserves.
|
Troubled Debt Restructurings and Nonaccrual Loans
The table below
displays the single-family loans classified as TDRs that are on accrual status and loans on nonaccrual status. The table includes our recorded investment in HFI and HFS single-family mortgage loans. For information on the impact of TDRs and other individually impaired loans on our allowance for loan losses, see “
Note 3, Mortgage Loans
.”
|
Single-Family Troubled Debt Restructurings on Accrual Status and Nonaccrual Loans
|
|||||||||||
|
As of
|
|||||||||||
|
September 30, 2018
|
December 31, 2017
|
||||||||||
|
(Dollars in millions)
|
|||||||||||
|
TDRs on accrual status
|
$
|
104,569
|
|
$
|
110,043
|
|
|||||
|
Nonaccrual loans
|
32,571
|
|
46,945
|
|
|||||||
|
Total TDRs on accrual status and nonaccrual loans
|
$
|
137,140
|
|
$
|
156,988
|
|
|||||
|
Accruing on-balance sheet loans past due 90 days or more
(1)
|
$
|
243
|
|
$
|
353
|
|
|||||
|
For the Nine Months
|
|||||||||||
|
Ended September 30,
|
|||||||||||
|
2018
|
2017
|
||||||||||
|
(Dollars in millions)
|
|||||||||||
|
Interest related to on-balance sheet TDRs on accrual status and nonaccrual loans:
|
|||||||||||
|
Interest income forgone
(2)
|
$
|
1,680
|
|
$
|
2,616
|
|
|||||
|
Interest income recognized
(3)
|
4,141
|
|
4,247
|
|
|||||||
|
Fannie Mae Third Quarter 2018 Form 10-Q
|
36
|
|
|
MD&A | Business Segments
|
||
__________
|
(1)
|
Includes loans that, as of the end of each period, are 90 days or more past due and continuing to accrue interest. The majority of these amounts consists of loans insured or guaranteed by the U.S. government and loans for which we have recourse against the seller in the event of a default.
|
|
(2)
|
Represents the amount of interest income we did not recognize, but would have recognized during the period for nonaccrual loans and TDRs on accrual status as of the end of each period had the loans performed according to their original contractual terms.
|
|
(3)
|
Includes primarily amounts accrued while the loans were performing and cash payments received on nonaccrual loans.
|
The post-modification unpaid principal balance of single-family HFI and HFS loans classified as TDRs as of
September 30, 2018
was
$134.8 billion
, compared with
$146.4 billion
as of
December 31, 2017
. This
decrease
in loans classified as TDRs was primarily attributable to HFS loan sales in the
first nine months
of
2018
, in addition to other removals, and was partially offset by a higher volume of single-family loan modifications and other forms of loss mitigation in the areas affected by the 2017 hurricanes that resulted in a restructuring of the terms of these loans.
|
Fannie Mae Third Quarter 2018 Form 10-Q
|
37
|
|
|
MD&A | Business Segments
|
||
Multifamily Business
Our Multifamily business provides mortgage market liquidity primarily for properties with five or more residential units, which may be apartment communities, cooperative properties, seniors housing, dedicated student housing or manufactured housing communities.
Multifamily Mortgage Market
National multifamily market fundamentals, which include factors such as vacancy rates and rents, showed improvement during the
third quarter
of
2018
despite an increase in new apartment supply. As a result of continued multifamily demand, the national estimated vacancy level decreased during the
third quarter
of
2018
, remaining near historic lows.
|
•
|
Vacancy rates.
According to preliminary third-party data, the national multifamily vacancy rate for institutional investment-type apartment properties was an estimated
5.3%
as of
September 30, 2018
, compared with
5.5%
as of
June 30, 2018
.
|
|
•
|
Rents.
Rents continued to increase during the
third quarter
of
2018
. National asking rents increased by an estimated
0.8%
, compared with
1.5%
during the
second quarter
of
2018
.
|
Continued demand for multifamily rental units during the
third quarter
of
2018
was reflected in the estimated positive net absorption (that is, the net change in the number of occupied rental units during the time period) of approximately
36,000
units, according to preliminary data from Reis, Inc., compared with approximately
40,000
units during the
second quarter
of
2018
.
Vacancy rates and rents are important to loan performance because multifamily loans are generally repaid from the cash flows generated by the underlying property. Several years of improvement in these fundamentals has helped to increase property values in most metropolitan areas. It is estimated that approximately
423,000
new multifamily units will be completed in
2018
. The bulk of this new supply is concentrated in a limited number of metropolitan areas.
Multifamily Business Metrics
We support affordability in the multifamily rental market. We enabled the financing of
206,000
multifamily units from new business volume in the
third quarter
of
2018
, compared with
189,000
units in the
third quarter
of
2017
. Over
90%
of the multifamily units we financed in the
third quarter
of
2018
were affordable to families earning at or below 120% of the median income in their area, providing support for both workforce housing and affordable housing.
Multifamily New Business Volume
(1)
(Dollars in billions)
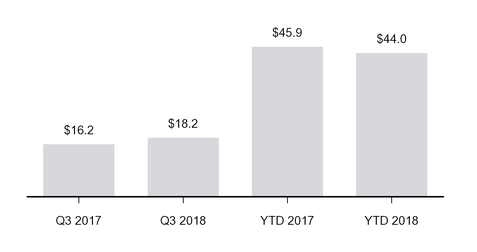
__________
|
(1)
|
Reflects unpaid principal balance of multifamily Fannie Mae MBS issued, multifamily loans purchased, and credit enhancements provided during the period.
|
|
Fannie Mae Third Quarter 2018 Form 10-Q
|
38
|
|
|
MD&A | Business Segments
|
||
FHFA’s
2018
conservatorship scorecard includes an objective to maintain the dollar volume of new multifamily business at or below
$35 billion
, excluding certain targeted affordable and underserved market business segments. Approximately
42%
of our multifamily new business volume of
$44.0 billion
for the
first nine months
of
2018
counted toward FHFA’s
2018
multifamily volume cap.
The chart below displays our multifamily MBS outstanding as of
September 30, 2018
compared with
December 31, 2017
.
Multifamily Fannie Mae MBS Outstanding
(Dollars in billions)
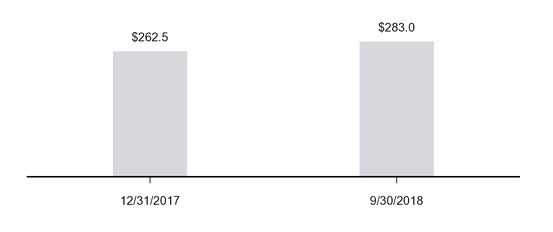
Multifamily Business Financial Results
|
Multifamily Business Financial Results
|
|||||||||||||||||||||||
|
For the Three Months Ended September 30,
|
For the Nine Months Ended September 30,
|
||||||||||||||||||||||
|
2018
|
2017
|
Variance
|
2018
|
2017
|
Variance
|
||||||||||||||||||
|
(Dollars in millions)
|
|||||||||||||||||||||||
|
Net interest income
|
$
|
699
|
|
$
|
647
|
|
$
|
52
|
|
$
|
2,024
|
|
$
|
1,873
|
|
$
|
151
|
|
|||||
|
Fee and other income
|
192
|
|
189
|
|
3
|
|
524
|
|
604
|
|
(80
|
)
|
|||||||||||
|
Net revenues
|
891
|
|
836
|
|
55
|
|
2,548
|
|
2,477
|
|
71
|
|
|||||||||||
|
Fair value gains (losses), net
|
(31
|
)
|
11
|
|
(42
|
)
|
(69
|
)
|
(23
|
)
|
(46
|
)
|
|||||||||||
|
Administrative expenses
|
(104
|
)
|
(84
|
)
|
(20
|
)
|
(317
|
)
|
(253
|
)
|
(64
|
)
|
|||||||||||
|
Credit-related expense
(1)
|
(25
|
)
|
(28
|
)
|
3
|
|
(6
|
)
|
(23
|
)
|
17
|
|
|||||||||||
|
Other expenses, net
(2)
|
(75
|
)
|
(80
|
)
|
5
|
|
(209
|
)
|
(237
|
)
|
28
|
|
|||||||||||
|
Income before federal income taxes
|
656
|
|
655
|
|
1
|
|
1,947
|
|
1,941
|
|
6
|
|
|||||||||||
|
Provision for federal income taxes
|
(107
|
)
|
(164
|
)
|
57
|
|
(314
|
)
|
(481
|
)
|
167
|
|
|||||||||||
|
Net income
|
$
|
549
|
|
$
|
491
|
|
$
|
58
|
|
$
|
1,633
|
|
$
|
1,460
|
|
$
|
173
|
|
|||||
__________
|
(1)
|
Consists of the provision for credit losses and foreclosed property income (expense).
|
|
(2)
|
Consists of investment gains, gains (losses) on partnership investments and other income (expenses).
|
Net interest income
Multifamily net interest income increased in the
third quarter
and
first nine months
of
2018
compared with the
third quarter
and
first nine months
of
2017
, primarily due to continued growth of our multifamily guaranty book of business.
|
Fannie Mae Third Quarter 2018 Form 10-Q
|
39
|
|
|
MD&A | Business Segments
|
||

__________
|
(1)
|
Our multifamily guaranty book of business consists of: (a) multifamily mortgage loans of Fannie Mae; (b) multifamily mortgage loans underlying Fannie Mae MBS; and (c) other credit enhancements that we provide on multifamily mortgage assets. It excludes non-Fannie Mae multifamily mortgage-related securities held in our retained mortgage portfolio for which we do not provide a guaranty.
|
Fee and Other Income
Fee and other income decreased in the
first nine months
of
2018
compared with the
first nine months
of
2017
primarily driven by lower yield maintenance fees as a result of increases in interest rates during the
first nine months
of
2018
.
Fair value gains (losses), net
Fair value losses in the
third quarter
and
first nine months
of
2018
were primarily driven by losses on commitments to buy multifamily mortgage-related securities due to increasing interest rates resulting in decreasing prices during the commitment periods.
Fair value losses in the
first nine months
of
2017
were primarily driven by losses on commitments to sell multifamily mortgage-related securities as a result of increases in prices during the commitment periods.
Credit-related expense
Credit-related expense in the
third quarter
and
first nine months
of
2018
was due to an increase in the allowance for loan losses primarily driven by a slight increase in downgrades in loan risk ratings.
Credit-related expense in the
third quarter
and
first nine months
of
2017
was primarily driven by an increase in our allowance for loan losses, which included estimated losses from the 2017 hurricanes.
Multifamily Mortgage Credit Risk Management
This section updates our discussion of multifamily mortgage credit risk management in our
2017
Form 10-K in “
MD&A
—
Business Segments
—
Multifamily Business
—
Multifamily Mortgage Credit Risk Management
.”
Multifamily Underwriting Standards and Portfolio Monitoring
Lender risk-sharing is a cornerstone of our Multifamily business. We primarily transfer risk through our Delegated Underwriting and Servicing (“DUS
®
”) program, which delegates to DUS lenders the ability to underwrite and service multifamily loans, in accordance with our standards and requirements. DUS lenders receive credit risk-related revenues for their respective portion of credit risk retained, and, in turn, are required to fulfill any loss
|
Fannie Mae Third Quarter 2018 Form 10-Q
|
40
|
|
|
MD&A | Business Segments
|
||
sharing obligation. This aligns the interests of the lender and Fannie Mae from day one and throughout the life of the loan.
Our DUS model typically results in our lenders sharing on a pro-rata or tiered basis approximately
one-third
of the credit risk on our multifamily loans. In the
first nine months
of
2018
, nearly
100%
of our new multifamily business volume had lender risk-sharing.
As of September 30, 2018
,
97%
of the unpaid principal balance of loans in our multifamily guaranty book of business had lender risk-sharing, compared with
96%
as of
December 31, 2017
.
To complement our lender-risk sharing program through our DUS model, we engage in multifamily CIRT transactions, pursuant to which we transfer a portion of the mortgage credit risk on multifamily loans in our multifamily guaranty book of business to insurers or reinsurers. In August 2018, we completed our third multifamily CIRT transaction since the inception of the program, which covered multifamily loans with an unpaid principal balance of approximately
$11.1 billion
. We plan to continue to transfer credit risk through multifamily CIRT transactions in the future.
We and our lenders monitor the performance and risk characteristics of our multifamily loans and the underlying properties on an ongoing basis throughout the loan term at the asset and portfolio level. Our standards for multifamily loans specify maximum original LTV ratio and minimum original debt service coverage ratio (“DSCR”) values that vary based on loan characteristics. We closely monitor loans with an estimated current DSCR below 1.0, as that is an indicator of heightened default risk.
The table below
displays original LTV ratio and DSCR metrics for our multifamily guaranty book of business.
|
Multifamily Guaranty Book of Business Key Risk Characteristics
|
||||||||||||||
|
As of
|
||||||||||||||
|
September 30, 2018
|
December 31, 2017
|
September 30,
2017 |
||||||||||||
|
Weighted average original LTV ratio
|
67
|
%
|
67
|
%
|
67
|
%
|
||||||||
|
Original LTV ratio greater than 80%
|
1
|
|
2
|
|
2
|
|
||||||||
|
Original DSCR less than or equal to 1.10
|
13
|
|
14
|
|
14
|
|
||||||||
|
Current DSCR less than 1.0
|
2
|
|
2
|
|
1
|
|
||||||||
Multifamily Problem Loan Management and Foreclosure Prevention
The multifamily serious delinquency rate was
0.07%
as of September 30, 2018
, compared with
0.11%
as of
December 31, 2017
and
0.03%
as of
September 30, 2017
. We classify multifamily loans as seriously delinquent when payment is 60 days or more past due. The decrease in the multifamily serious delinquency rate since
December 31, 2017
resulted mostly from a decrease in delinquent loans subject to forbearance agreements granted to borrowers in the areas affected by the 2017 hurricanes.
REO Management
The number of multifamily foreclosed properties held for sale increased to
13
properties with a carrying value of
$79 million
as of
September 30, 2018
, compared with
11
properties with a carrying value of
$66 million
as of
December 31, 2017
.
Other Multifamily Credit Information
Multifamily Credit Losses
We had
$7 million
in multifamily credit losses in the
third quarter
of
2018
compared with a benefit for credit losses of
$16 million
in the
third quarter
of
2017
. We had
$15 million
in multifamily credit losses in the
first nine months
of
2018
compared with a benefit for credit losses of
$14 million
in the
first nine months
of
2017
. The benefit for credit losses for both
2017
periods was the result of recoveries of previously charged-off amounts.
|
Fannie Mae Third Quarter 2018 Form 10-Q
|
41
|
|
|
MD&A | Business Segments
|
||
Multifamily Loss Reserves
The table below summarizes the changes in our multifamily loss reserves.
|
Multifamily Loss Reserves
|
|||||||||||||||
|
For the Three Months Ended September 30,
|
For the Nine Months Ended September 30,
|
||||||||||||||
|
2018
|
2017
|
2018
|
2017
|
||||||||||||
|
(Dollars in millions)
|
|||||||||||||||
|
Changes in loss reserves:
|
|||||||||||||||
|
Beginning balance
|
$
|
(218
|
)
|
$
|
(189
|
)
|
$
|
(245
|
)
|
$
|
(196
|
)
|
|||
|
Benefit (provision) for credit losses
|
(16
|
)
|
(45
|
)
|
6
|
|
(37
|
)
|
|||||||
|
Charge-offs
|
1
|
|
3
|
|
6
|
|
3
|
|
|||||||
|
Recoveries
|
(3
|
)
|
(2
|
)
|
(3
|
)
|
(3
|
)
|
|||||||
|
Ending balance
|
$
|
(236
|
)
|
$
|
(233
|
)
|
$
|
(236
|
)
|
$
|
(233
|
)
|
|||
|
As of
|
|||||||||||||||
|
September 30, 2018
|
December 31, 2017
|
||||||||||||||
|
Loss reserves as a percentage of multifamily guaranty book of business
|
0.08
|
%
|
0.09
|
%
|
|||||||||||
Troubled Debt Restructurings and Nonaccrual Loans
The table below displays the composition of multifamily loans classified as TDRs that are on accrual status and multifamily loans on nonaccrual status. The table includes our recorded investment in HFI and HFS multifamily mortgage loans. For information on the impact of TDRs and other individually impaired loans on our allowance for loan losses, see “
Note 3, Mortgage Loans
.”
|
Multifamily Troubled Debt Restructurings on Accrual Status and Nonaccrual Loans
|
||||||||
|
As of
|
||||||||
|
September 30, 2018
|
December 31, 2017
|
|||||||
|
(Dollars in millions)
|
||||||||
|
TDRs on accrual status
|
$
|
63
|
|
$
|
87
|
|
||
|
Nonaccrual loans
|
554
|
|
424
|
|
||||
|
Total TDRs on accrual status and nonaccrual loans
|
$
|
617
|
|
$
|
511
|
|
||
|
For the Nine Months
|
||||||||
|
Ended September 30,
|
||||||||
|
2018
|
2017
|
|||||||
|
(Dollars in millions)
|
||||||||
|
Interest related to on-balance sheet TDRs on accrual status and nonaccrual loans:
|
||||||||
|
Interest income forgone
(1)
|
$
|
20
|
|
$
|
12
|
|
||
|
Interest income recognized
(2)
|
2
|
|
6
|
|
||||
__________
|
(1)
|
Represents the amount of interest income we did not recognize, but would have recognized during the period for nonaccrual loans and TDRs on accrual status as of the end of each period had the loans performed according to their original contractual terms.
|
|
(2)
|
Represents interest income recognized during the period, including the amortization of any deferred cost basis adjustments, for loans classified as either nonaccrual loans or TDRs on accrual status as of the end of each period. Includes primarily amounts accrued while the loans were performing and cash payments received on nonaccrual loans.
|
|
Fannie Mae Third Quarter 2018 Form 10-Q
|
42
|
|
|
MD&A | Liquidity and Capital Management
|
||
|
Liquidity and Capital Management
|
||||
Liquidity Management
This section supplements and updates information regarding liquidity risk management in our
2017
Form 10-K. See “
MD&A
—
Liquidity and Capital Management
—
Liquidity Management
” and “Risk Factors” in our
2017
Form 10-K for additional information, including discussions of our primary sources and uses of funds, our liquidity risk management practices and liquidity contingency planning, factors that influence our debt funding activity, factors that may impact our access to or the cost of our debt funding, and factors that could adversely affect our liquidity.
Debt Funding
Outstanding Debt
Total outstanding debt of Fannie Mae excludes debt of consolidated trusts. Short-term debt of Fannie Mae consists of borrowings with an original contractual maturity of one year or less and, therefore, does not include the current portion of long-term debt. Long-term debt of Fannie Mae consists of borrowings with an original contractual maturity of greater than one year.
The chart and table below display information on our outstanding short-term and long-term debt of Fannie Mae based on original contractual maturity. The total amount of our outstanding debt of Fannie Mae decreased as of
September 30, 2018
compared with
December 31, 2017
primarily due to lower funding needs as our retained mortgage portfolio continued to decrease during the first nine months of 2018.
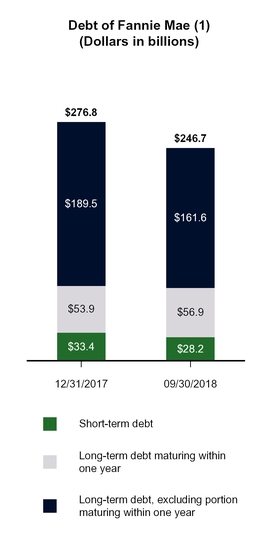
|
Selected Debt Information
|
||||||||
|
As of
|
||||||||
|
December 31, 2017
|
September 30, 2018
|
|||||||
|
(Dollars in billions)
|
||||||||
|
Selected Weighted-Average Interest Rates
(1)
|
||||||||
|
Interest rate on short-term debt
|
1.18
|
%
|
2.06
|
%
|
||||
|
Interest rate on long-term debt, including portion maturing within one year
|
2.40
|
%
|
2.75
|
%
|
||||
|
Interest rate on callable long-term debt
|
2.31
|
%
|
2.82
|
%
|
||||
|
Selected Maturity Data
|
||||||||
|
Weighted-average maturity of debt maturing within one year (in days)
|
123
|
|
149
|
|
||||
|
Weighted-average maturity of debt maturing in more than one year (in months)
|
57
|
|
61
|
|
||||
|
Other Data
|
||||||||
|
Outstanding callable debt
|
$
|
72.3
|
|
$
|
67.1
|
|
||
|
Connecticut Avenue Securities
(2)
|
$
|
22.5
|
|
$
|
25.7
|
|
||
|
Fannie Mae Third Quarter 2018 Form 10-Q
|
43
|
|
|
MD&A | Liquidity and Capital Management
|
||
__________
|
(1)
|
Outstanding debt amounts and weighted-average interest rates reported in this chart and table include the effects of discounts, premiums, other cost basis adjustments and fair value gains and losses associated with debt that we elected to carry at fair value. Reported amounts for total debt of Fannie Mae include unamortized cost basis adjustments and fair value adjustments of
$433 million
and
$788 million
as of
September 30, 2018
and
December 31, 2017
, respectively.
|
|
(2)
|
See “Business Segments—Single-Family Business—Single-Family Mortgage Credit Risk Management—Transfer of Mortgage Credit Risk—Credit Risk Transfer Transactions” in our
2017
Form 10-K and this report for information regarding our Connecticut Avenue Securities.
|
For more information on our outstanding short-term and long-term debt, see “
Note 7, Short-Term and Long-Term Debt
.”
Debt Funding Activity
The table below
displays the activity in debt of Fannie Mae. This activity excludes the debt of consolidated trusts and intraday loans. The reported amounts of debt issued and paid off during the period represent the face amount of the debt at issuance and redemption.
|
Activity in Debt of Fannie Mae
|
|||||||||||||||
|
For the Three Months
|
For the Nine Months
|
||||||||||||||
|
Ended September 30,
|
Ended September 30,
|
||||||||||||||
|
2018
|
2017
|
2018
|
2017
|
||||||||||||
|
(Dollars in millions)
|
|||||||||||||||
|
Issued during the period:
|
|||||||||||||||
|
Short-term:
|
|||||||||||||||
|
Amount
|
$
|
106,520
|
|
$
|
199,940
|
|
$
|
446,914
|
|
$
|
513,635
|
|
|||
|
Weighted-average interest rate
|
1.90
|
%
|
0.97
|
%
|
1.52
|
%
|
0.78
|
%
|
|||||||
|
Long-term:
(1)
|
|||||||||||||||
|
Amount
|
$
|
6,032
|
|
$
|
6,435
|
|
$
|
17,595
|
|
$
|
25,457
|
|
|||
|
Weighted-average interest rate
|
3.26
|
%
|
2.44
|
%
|
3.08
|
%
|
2.44
|
%
|
|||||||
|
Total issued:
|
|||||||||||||||
|
Amount
|
$
|
112,552
|
|
$
|
206,375
|
|
$
|
464,509
|
|
$
|
539,092
|
|
|||
|
Weighted-average interest rate
|
1.97
|
%
|
1.02
|
%
|
1.58
|
%
|
0.85
|
%
|
|||||||
|
Paid off during the period:
(2)
|
|||||||||||||||
|
Short-term:
|
|||||||||||||||
|
Amount
|
$
|
103,256
|
|
$
|
197,034
|
|
$
|
451,295
|
|
$
|
515,220
|
|
|||
|
Weighted-average interest rate
|
1.82
|
%
|
0.93
|
%
|
1.42
|
%
|
0.71
|
%
|
|||||||
|
Long-term:
(1)
|
|||||||||||||||
|
Amount
|
$
|
12,668
|
|
$
|
21,123
|
|
$
|
42,854
|
|
$
|
60,419
|
|
|||
|
Weighted-average interest rate
|
1.62
|
%
|
1.35
|
%
|
1.47
|
%
|
2.81
|
%
|
|||||||
|
Total paid off:
|
|||||||||||||||
|
Amount
|
$
|
115,924
|
|
$
|
218,157
|
|
$
|
494,149
|
|
$
|
575,639
|
|
|||
|
Weighted-average interest rate
|
1.79
|
%
|
0.97
|
%
|
1.43
|
%
|
0.93
|
%
|
|||||||
__________
|
(1)
|
Includes Connecticut Avenue Securities.
|
|
(2)
|
Consists of all payments on debt, including regularly scheduled principal payments, payments at maturity, payments resulting from calls and payments for any other repurchases. Repurchases of debt and early retirements of zero-coupon debt are reported at original face value, which does not equal the amount of actual cash payment.
|
|
Fannie Mae Third Quarter 2018 Form 10-Q
|
44
|
|
|
MD&A | Liquidity and Capital Management
|
||
Other Investments Portfolio
The chart below displays information on the composition of our other investments portfolio. The balance of our other investments portfolio fluctuates based on changes in our cash flows, liquidity in the fixed income markets and our liquidity risk management framework and practices.

Cash Flows
Nine Months Ended
September 30, 2018
.
Cash, cash equivalents and restricted cash
decreased
by
$9.2 billion
in the
nine
months ended
September 30, 2018
. The
decrease
was primarily driven by
cash outflows
from (1) the purchase of Fannie Mae MBS from third parties, (2) the redemption of funding debt, which outpaced issuances, due to lower funding needs, and (3) the acquisition of delinquent loans out of MBS trusts.
Partially offsetting these
cash outflows
were primarily
cash inflows
from (1) the sale of Fannie Mae MBS to third parties and (2) proceeds from repayments and sales of loans of Fannie Mae.
Nine Months Ended
September 30, 2017
.
Cash, cash equivalents and restricted cash
decreased
by
$10.1 billion
in the
nine
months ended
September 30, 2017
. The decrease was primarily driven by
cash outflows
from (1) the purchase of Fannie Mae MBS from third parties, (2) the redemption of funding debt, which outpaced issuances, due to lower funding needs, and (3) the payment of dividends to Treasury under our senior preferred stock purchase agreement.
Partially offsetting these
cash outflows
were primarily
cash inflows
from (1) the sale of Fannie Mae MBS to third parties and (2) proceeds from repayments and sales of loans of Fannie Mae.
Credit Ratings
In June 2018, upon reexamining the terms of our subordinated debt, Standard & Poor’s Ratings Services (“S&P”) both revised its rating on our outstanding rated subordinated debt from "AA-" to "AA" and announced that it was withdrawing its rating on our subordinated debt program due to our program no longer being active. There have been no other changes in our credit ratings since we filed our 2017 Form 10-K. For information on our credit ratings, see “MD&A—Liquidity and Capital Management—Liquidity Management—Credit Ratings” in our 2017 Form 10-K.
|
Fannie Mae Third Quarter 2018 Form 10-Q
|
45
|
|
|
MD&A | Liquidity and Capital Management
|
||
Capital Management
Regulatory Capital
The deficit of our core capital over statutory minimum capital was
$136.7 billion
as of
September 30, 2018
and $
144.4 billion
as of
December 31, 2017
. For information on our minimum capital requirements, see “Note 12, Regulatory Capital Requirements” and “Business—Legislation and Regulation—GSE Act and Other Regulation of Our Business—Capital” in our
2017
Form 10-K and “MD&A—Legislation and Regulation” in our Second Quarter 2018 Form 10-Q.
Capital Activity
The current dividend provisions of the senior preferred stock provide for quarterly dividends consisting of the amount, if any, by which our net worth as of the end of the immediately preceding fiscal quarter exceeds a
$3.0 billion
capital reserve amount. Because we had a net worth of
$7.5 billion
as of
June 30, 2018
, we paid Treasury a third quarter
2018
dividend of
$4.5 billion
. We expect to pay Treasury a
fourth quarter
2018
dividend of
$4.0 billion
by
December 31, 2018
based on our net worth of
$7.0 billion
as of
September 30, 2018
.
See “
Business
—
Conservatorship and Treasury Agreements
—
Treasury Agreements
” and “
Business
—
Legislative and Regulation
—
GSE Act and Other Regulation of Our Business
—
Conservatorship Capital Framework
” in our
2017
Form 10-K for more information on the terms of our senior preferred stock, our senior preferred stock purchase agreement with Treasury and our conservatorship capital framework. See “Risk Factors” in our
2017
Form 10-K for a discussion of the risks associated with the limit on our capital reserves.
|
Off-Balance Sheet Arrangements
|
||||
Our off-balance sheet arrangements result primarily from the following:
|
•
|
our guaranty of mortgage loan securitization and resecuritization transactions, and other guaranty commitments over which we do not have control;
|
|
•
|
liquidity support transactions; and
|
|
•
|
partnership interests.
|
Our off-balance sheet exposure to credit losses is primarily related to the unpaid principal balance of our unconsolidated Fannie Mae MBS and other financial guarantees. This exposure was
$21.5 billion
as of
September 30, 2018
and
$25.1 billion
as of
December 31, 2017
.
Our total outstanding liquidity commitments to advance funds for securities backed by multifamily housing revenue bonds totaled $
8.7 billion
as of
September 30, 2018
and $
9.2 billion
as of
December 31, 2017
.
|
Fannie Mae Third Quarter 2018 Form 10-Q
|
46
|
|
|
MD&A | Risk Management
|
||
|
Risk Management
|
||||
Our business activities expose us to the following three major categories of risk: credit risk (including mortgage credit risk and institutional counterparty credit risk), market risk (including interest rate risk and liquidity risk) and operational risk (including cybersecurity, third-party and model risk). See “
MD&A
—
Risk Management
” and “MD&A—
Business Segments
” in our
2017
Form 10-K for a discussion of our management of these risks.
In this section we provide an update on our management of institutional counterparty credit risk and interest rate risk. We provide an update on our management of mortgage credit risk in this report in “
Business Segments
—
Single-Family Business
—
Single-Family Mortgage Credit Risk Management
” and “
Business Segments
—
Multifamily Business
—
Multifamily Mortgage Credit Risk Management
.”
Institutional Counterparty Credit Risk Management
This section updates our discussion of institutional counterparty credit risk management in our
2017
Form 10-K. See “
MD&A
—
Risk Management
—
Institutional Counterparty Credit Risk Management
” and “Risk Factors” in our
2017
Form 10-K for additional information, including our exposure to institutional counterparty credit risk and our strategy for managing this risk.
Mortgage Insurers
For information on our mortgage insurers, see “MD&A—
Risk Management
—
Institutional Counterparty Credit Risk Management
—
Mortgage Insurers
” in our 2017 Form 10-K. The discussion below updates some of that information.
Recent Changes
FHFA’s 2018 conservatorship scorecard directs Fannie Mae and Freddie Mac to evaluate the companies’ existing private mortgage insurer eligibility requirements (“PMIERs”) and consider whether changes or updates are appropriate. The PMIERs set the standards and guidelines that a private mortgage insurer must meet and maintain to be an approved insurer eligible to write mortgage insurance on loans acquired by Fannie Mae. The PMIERs are designed to ensure that mortgage insurers have sufficient liquid assets to pay all claims under a hypothetical future stress scenario. At FHFA’s direction, we and Freddie Mac completed our analysis of the PMIERs and, after consulting with our mortgage insurer counterparties, published revised PMIERs in September 2018. The revised PMIERs include certain changes to the risk-based asset requirements, enhancements to the treatment of approved risk transfer transactions, and adjustments to risk transfer credit arising from counterparty risk associated with reinsurance transactions. Many of the changes contained in the update were previously announced through guidance. The revised PMIERs will become effective on March 31, 2019 for existing approved private mortgage insurers and are effective immediately for any new mortgage insurer applicant.
Market Risk Management, Including Interest Rate Risk Management
This section supplements and updates information regarding market risk management in our
2017
Form 10-K. See “MD&A—Risk Management—Market Risk Management, Including Interest Rate Risk Management” and “Risk Factors” in our
2017
Form 10-K for additional information, including our sources of interest rate risk exposure, business risks posed by changes in interest rates, and our strategy for managing interest rate risk.
Measurement of Interest Rate Risk
The table below
displays the pre-tax market value sensitivity of our net portfolio to changes in the level of interest rates and the slope of the yield curve as measured on the last day of each period presented.
The table below
also provides the daily average, minimum, maximum and standard deviation values for duration gap and for the most adverse market value impact on the net portfolio to changes in the level of interest rates and the slope of the yield curve
for the three months
ended
September 30, 2018
and
2017
.
During the second quarter of 2018, we revised the presentation of our interest rate risk measures to show the market value sensitivity in millions, rather than billions, and to show effective duration gap in years, rather than in months. We have revised all prior period interest rate risk measures to correspond to the current period presentation.
|
Fannie Mae Third Quarter 2018 Form 10-Q
|
47
|
|
|
MD&A | Risk Management
|
||
For information on how we measure our interest rate risk, see our
2017
Form 10-K in “
MD&A
—Risk Management—Market Risk Management, Including Interest Rate Risk Management.”
|
Interest Rate Sensitivity of Net Portfolio to Changes in Interest Rate Level and Slope of Yield Curve
|
|||||||||||
|
As of
(1)(2)
|
|||||||||||
|
September 30, 2018
|
December 31, 2017
|
||||||||||
|
(Dollars in millions)
|
|||||||||||
|
Rate level shock:
|
|||||||||||
|
-100 basis points
|
$
|
(193
|
)
|
$
|
(44
|
)
|
|||||
|
-50 basis points
|
(53
|
)
|
(21
|
)
|
|||||||
|
+50 basis points
|
(30
|
)
|
(29
|
)
|
|||||||
|
+100 basis points
|
(113
|
)
|
(122
|
)
|
|||||||
|
Rate slope shock:
|
|||||||||||
|
-25 basis points (flattening)
|
3
|
|
(17
|
)
|
|||||||
|
+25 basis points (steepening)
|
(6
|
)
|
17
|
|
|||||||
|
For the Three Months Ended September 30,
(1)(3)
|
|||||||||||||||||||||||||||
|
2018
|
2017
|
||||||||||||||||||||||||||
|
Duration Gap
|
Rate Slope Shock 25 bps
|
Rate Level Shock 50 bps
|
Duration Gap
|
Rate Slope Shock 25 bps
|
Rate Level Shock 50 bps
|
||||||||||||||||||||||
|
Market Value Sensitivity
|
Market Value Sensitivity
|
||||||||||||||||||||||||||
|
(In years)
|
(Dollars in millions)
|
(In years)
|
(Dollars in millions)
|
||||||||||||||||||||||||
|
Average
|
0.01
|
$
|
(13
|
)
|
$
|
(51
|
)
|
0.00
|
$
|
(16
|
)
|
$
|
(26
|
)
|
|||||||||||||
|
Minimum
|
(0.01)
|
(22
|
)
|
(119
|
)
|
(0.04)
|
(46
|
)
|
(64
|
)
|
|||||||||||||||||
|
Maximum
|
0.07
|
(1
|
)
|
(30
|
)
|
0.02
|
(4
|
)
|
1
|
|
|||||||||||||||||
|
Standard deviation
|
0.02
|
6
|
|
17
|
|
0.02
|
8
|
|
15
|
|
|||||||||||||||||
__________
|
(1)
|
Computed based on changes in LIBOR interest rates swap curve. Changes in the level of interest rates assume a parallel shift in all maturities of the U.S. LIBOR interest rate swap curve. Changes in the slope of the yield curve assume a constant 7-year rate, a shift of 16.7 basis points for the 1-year rate (and shorter tenors) and an opposite shift of 8.3 basis points for the 30-year rate. Rate shocks for remaining maturity points are interpolated.
|
|
(2)
|
Measured on the last day of each period presented.
|
|
(3)
|
Computed based on daily values during the period presented.
|
The market value sensitivity of our net portfolio varies across a range of interest rate shocks depending upon the duration and convexity profile of our net portfolio. Because the effective duration gap of our net portfolio was close to zero years in the periods presented, the convexity exposure was the primary driver of the market value sensitivity of our net portfolio as of
September 30, 2018
. In addition, the convexity exposure may result in similar market value sensitivities for positive and negative interest rate shocks of the same magnitude.
We use derivatives to help manage the residual interest rate risk exposure between our assets and liabilities. Derivatives have enabled us to keep our interest rate risk exposure at consistently low levels in a wide range of interest-rate environments.
The table below
displays an example of how derivatives impacted the net market value exposure for a 50 basis point parallel interest rate shock.
|
Derivative Impact on Interest Rate Risk (50 Basis Points)
|
|||||||||||
|
As of
(1)
|
|||||||||||
|
September 30, 2018
|
December 31, 2017
|
||||||||||
|
(Dollars in millions)
|
|||||||||||
|
Before derivatives
|
$
|
(600
|
)
|
$
|
(520
|
)
|
|||||
|
After derivatives
|
(30
|
)
|
(29
|
)
|
|||||||
|
Effect of derivatives
|
570
|
|
491
|
|
|||||||
__________
|
(1)
|
Measured on the last day of each period presented.
|
|
Fannie Mae Third Quarter 2018 Form 10-Q
|
48
|
|
|
MD&A | Critical Accounting Policies and Estimates
|
||
|
Critical Accounting Policies and Estimates
|
||||
The preparation of financial statements in accordance with GAAP requires management to make a number of judgments, estimates and assumptions that affect the reported amount of assets, liabilities, income and expenses in the condensed consolidated financial statements. Understanding our accounting policies and the extent to which we use management judgment and estimates in applying these policies is integral to understanding our financial statements. We describe our most significant accounting policies in “
Note 1, Summary of Significant Accounting Policies
” in this report and in our
2017
Form 10-K.
We evaluate our critical accounting estimates and judgments required by our policies on an ongoing basis and update them as necessary based on changing conditions. Management has discussed any significant changes in judgments and assumptions in applying our critical accounting policies with the Audit Committee of our Board of Directors. See “Risk Factors” in our
2017
Form 10-K for a discussion of the risks associated with the need for management to make judgments and estimates in applying our accounting policies and methods. We have identified two of our accounting policies as critical because they involve significant judgments and assumptions about highly complex and inherently uncertain matters, and the use of reasonably different estimates and assumptions could have a material impact on our reported results of operations or financial condition: fair value measurement and allowance for loan losses. See “MD&A—Critical Accounting Policies and Estimates” in our
2017
Form 10-K for a discussion of these critical accounting policies and estimates.
|
Impact of Future Adoption of New Accounting Guidance
|
||||
We identify and discuss the expected impact on our condensed consolidated financial statements of recently issued accounting guidance in “
Note 1, Summary of Significant Accounting Policies
.”
|
Fannie Mae Third Quarter 2018 Form 10-Q
|
49
|
|
|
MD&A | Forward-Looking Statements
|
||
|
Forward-Looking Statements
|
||||
This report includes statements that constitute forward-looking statements within the meaning of Section 21E of the Securities Exchange Act of 1934 (the “Exchange Act”). In addition, our senior management may from time to time make forward-looking statements orally to analysts, investors, the news media and others. Forward-looking statements often include words such as “expect,” “anticipate,” “intend,” “plan,” “believe,” “seek,” “estimate,” “forecast,” “project,” “would,” “should,” “could,” “likely,” “may,” “will” or similar words. Examples of forward-looking statements in this report include, but are not limited to, statements relating to our expectations regarding the following matters:
|
•
|
our profitability, financial condition and results of operations, and the factors that will affect our profitability, financial condition and results of operations;
|
|
•
|
our business plans and strategies and the impact of such plans and strategies;
|
|
•
|
our dividend payments to Treasury;
|
|
•
|
our retained mortgage portfolio;
|
|
•
|
our payments to HUD and Treasury funds under the GSE Act;
|
|
•
|
our plans relating to and the effects of our credit risk transfer transactions;
|
|
•
|
the impact of accounting guidance and accounting changes on our business or financial results, including the impact of impairment accounting guidance;
|
|
•
|
mortgage market and economic conditions (including home price appreciation rates) and the impact of such conditions on our business or financial results;
|
|
•
|
the risks to our business;
|
|
•
|
the impact of the 2018 hurricanes on our credit losses and loss reserves;
|
|
•
|
our serious delinquency rate and the factors that will affect our serious delinquency rate; and
|
|
•
|
our single-family loan acquisitions and the credit risk profile of such acquisitions.
|
Forward-looking statements reflect our management’s expectations, forecasts or predictions of future conditions, events or results based on various assumptions and management’s estimates of trends and economic factors in the markets in which we are active, as well as our business plans. They are not guarantees of future performance. By their nature, forward-looking statements are subject to risks and uncertainties. Our actual results and financial condition may differ, possibly materially, from the anticipated results and financial condition indicated in these forward-looking statements.
There are a number of factors that could cause actual conditions, events or results to differ materially from those described in the forward-looking statements contained in this report, including, but not limited to, the following:
|
•
|
the uncertainty of our future;
|
|
•
|
future legislative and regulatory requirements or changes affecting us, such as the enactment of housing finance reform legislation;
|
|
•
|
actions by FHFA, Treasury, HUD or other regulators that affect our business;
|
|
•
|
changes in the structure and regulation of the financial services industry;
|
|
•
|
the timing and level of, as well as regional variation in, home price changes;
|
|
•
|
changes in interest rates and credit spreads;
|
|
•
|
changes in unemployment rates and other macroeconomic and housing market conditions;
|
|
•
|
credit availability;
|
|
•
|
disruptions in the housing and credit markets;
|
|
•
|
changes in the fiscal and monetary policies of the Federal Reserve, including implementation of the Federal Reserve’s balance sheet normalization program;
|
|
•
|
our future guaranty fee pricing and the impact of that pricing on our competitive environment and guaranty fee revenues;
|
|
Fannie Mae Third Quarter 2018 Form 10-Q
|
50
|
|
|
MD&A | Forward-Looking Statements
|
||
|
•
|
the volume of mortgage originations;
|
|
•
|
the size, composition and quality of our guaranty book of business and retained mortgage portfolio;
|
|
•
|
our market share;
|
|
•
|
the life of the loans in our guaranty book of business;
|
|
•
|
challenges we face in retaining and hiring qualified executives and other employees;
|
|
•
|
our future serious delinquency rates;
|
|
•
|
the deteriorated credit performance of many loans in our guaranty book of business;
|
|
•
|
the conservatorship and its effect on our business;
|
|
•
|
the investment by Treasury and its effect on our business;
|
|
•
|
adverse effects from activities we undertake to support the mortgage market and help borrowers;
|
|
•
|
actions we may be required to take by FHFA, in its role as our conservator or as our regulator, such as changes in the type of business we do or implementation of the Single Security Initiative;
|
|
•
|
limitations on our business imposed by FHFA, in its role as our conservator or as our regulator;
|
|
•
|
our future objectives and activities in support of those objectives, including actions we may take to reach additional underserved creditworthy borrowers;
|
|
•
|
a decrease in our credit ratings;
|
|
•
|
limitations on our ability to access the debt capital markets;
|
|
•
|
significant changes in modification and foreclosure activity;
|
|
•
|
the volume and pace of future nonperforming and reperforming loan sales and their impact on our results and serious delinquency rates;
|
|
•
|
changes in borrower behavior;
|
|
•
|
the effectiveness of our loss mitigation strategies, management of our REO inventory and pursuit of contractual remedies;
|
|
•
|
defaults by one or more institutional counterparties;
|
|
•
|
resolution or settlement agreements we may enter into with our counterparties;
|
|
•
|
our need to rely on third parties to fully achieve some of our corporate objectives;
|
|
•
|
our reliance on mortgage servicers;
|
|
•
|
changes in GAAP, guidance by the Financial Accounting Standards Board and changes to our accounting policies;
|
|
•
|
changes in the fair value of our assets and liabilities;
|
|
•
|
operational control weaknesses;
|
|
•
|
our reliance on models and future updates we make to our models, including the assumptions used by these models;
|
|
•
|
global political risks;
|
|
•
|
natural disasters, environmental disasters, terrorist attacks, pandemics or other major disruptive events;
|
|
•
|
cyber attacks or other information security breaches or threats; and
|
|
•
|
those factors described in “Risk Factors” in this report and in our
2017
Form 10-K.
|
Readers are cautioned to place forward-looking statements in this report or that we make from time to time into proper context by carefully considering the factors discussed in “Risk Factors” in this report and in our
2017
Form 10-K. These forward-looking statements are representative only as of the date they are made, and we undertake no obligation to update any forward-looking statement as a result of new information, future events or otherwise, except as required under the federal securities laws.
|
Fannie Mae Third Quarter 2018 Form 10-Q
|
51
|
|
|
Financial Statements | Condensed Consolidated Balance Sheets
|
||
FANNIE MAE
(In conservatorship)
Condensed Consolidated Balance Sheets — (Unaudited)
(Dollars in millions, except share amounts)
|
As of
|
|||||||||||
|
September 30,
|
December 31,
|
||||||||||
|
2018
|
2017
|
||||||||||
|
ASSETS
|
|||||||||||
|
Cash and cash equivalents
|
$
|
|
|
$
|
|
|
|||||
|
Restricted cash (includes $17,835 and $22,132, respectively, related to consolidated trusts)
|
|
|
|
|
|||||||
|
Federal funds sold and securities purchased under agreements to resell or similar arrangements
|
|
|
|
|
|||||||
|
Investments in securities:
|
|||||||||||
|
Trading, at fair value (includes $3,734 and $747, respectively, pledged as collateral)
|
|
|
|
|
|||||||
|
Available-for-sale, at fair value
|
|
|
|
|
|||||||
|
Total investments in securities
|
|
|
|
|
|||||||
|
Mortgage loans:
|
|||||||||||
|
Loans held for sale, at lower of cost or fair value
|
|
|
|
|
|||||||
|
Loans held for investment, at amortized cost:
|
|||||||||||
|
Of Fannie Mae
|
|
|
|
|
|||||||
|
Of consolidated trusts
|
|
|
|
|
|||||||
|
Total loans held for investment (includes $9,153 and $10,596, respectively, at fair value)
|
|
|
|
|
|||||||
|
Allowance for loan losses
|
(
|
)
|
(
|
)
|
|||||||
|
Total loans held for investment, net of allowance
|
|
|
|
|
|||||||
|
Total mortgage loans
|
|
|
|
|
|||||||
|
Deferred tax assets, net
|
|
|
|
|
|||||||
|
Accrued interest receivable, net (includes $8,234 and $7,560, respectively, related to consolidated trusts)
|
|
|
|
|
|||||||
|
Acquired property, net
|
|
|
|
|
|||||||
|
Other assets
|
|
|
|
|
|||||||
|
Total assets
|
$
|
|
|
$
|
|
|
|||||
|
LIABILITIES AND EQUITY (DEFICIT)
|
|||||||||||
|
Liabilities:
|
|||||||||||
|
Accrued interest payable (includes $8,942 and $8,598, respectively, related to consolidated trusts)
|
$
|
|
|
$
|
|
|
|||||
|
Debt:
|
|||||||||||
|
Of Fannie Mae (includes $7,251 and $8,186, respectively, at fair value)
|
|
|
|
|
|||||||
|
Of consolidated trusts (includes $24,948 and $30,493, respectively, at fair value)
|
|
|
|
|
|||||||
|
Other liabilities (includes $322 and $492, respectively, related to consolidated trusts)
|
|
|
|
|
|||||||
|
Total liabilities
|
|
|
|
|
|||||||
|
Commitments and contingencies (Note 14)
|
|
|
|
|
|||||||
|
Fannie Mae stockholders’ equity (deficit):
|
|||||||||||
|
Senior preferred stock, 1,000,000 shares issued and outstanding
|
|
|
|
|
|||||||
|
Preferred stock, 700,000,000 shares are authorized—555,374,922 shares issued and outstanding
|
|
|
|
|
|||||||
|
Common stock, no par value, no maximum authorization—1,308,762,703 shares issued and 1,158,087,567 shares outstanding
|
|
|
|
|
|||||||
|
Accumulated deficit
|
(
|
)
|
(
|
)
|
|||||||
|
Accumulated other comprehensive income
|
|
|
|
|
|||||||
|
Treasury stock, at cost, 150,675,136 shares
|
(
|
)
|
(
|
)
|
|||||||
|
Total stockholders’ equity (deficit) (See Note 1: Senior Preferred Stock Purchase Agreement and Senior Preferred Stock for information on our dividend obligation to Treasury)
|
|
|
(
|
)
|
|||||||
|
Total liabilities and equity (deficit)
|
$
|
|
|
$
|
|
|
|||||
See Notes to Condensed Consolidated Financial Statements
|
Fannie Mae (In conservatorship) Third Quarter 2018 Form 10-Q
|
52
|
|
|
Financial Statements | Condensed Consolidated Statements of Operations and Comprehensive Income
|
||
FANNIE MAE
(In conservatorship)
(Dollars and shares in millions, except per share amounts)
|
For the Three Months
|
For the Nine Months
|
||||||||||||||||||||||
|
Ended September 30,
|
Ended September 30,
|
||||||||||||||||||||||
|
2018
|
2017
|
2018
|
2017
|
||||||||||||||||||||
|
Interest income:
|
|||||||||||||||||||||||
|
Trading securities
|
$
|
|
|
$
|
|
|
$
|
|
|
$
|
|
|
|||||||||||
|
Available-for-sale securities
|
|
|
|
|
|
|
|
|
|||||||||||||||
|
Mortgage loans (includes $27,058 and $25,168, respectively, for the three months ended and $79,877 and $75,155, respectively, for the nine months ended related to consolidated trusts)
|
|
|
|
|
|
|
|
|
|||||||||||||||
|
Other
|
|
|
|
|
|
|
|
|
|||||||||||||||
|
Total interest income
|
|
|
|
|
|
|
|
|
|||||||||||||||
|
Interest expense:
|
|||||||||||||||||||||||
|
Short-term debt
|
(
|
)
|
(
|
)
|
(
|
)
|
(
|
)
|
|||||||||||||||
|
Long-term debt (includes $22,361 and $20,609, respectively, for the three months ended and $65,972 and $61,622, respectively, for the nine months ended related to consolidated trusts)
|
(
|
)
|
(
|
)
|
(
|
)
|
(
|
)
|
|||||||||||||||
|
Total interest expense
|
(
|
)
|
(
|
)
|
(
|
)
|
(
|
)
|
|||||||||||||||
|
Net interest income
|
|
|
|
|
|
|
|
|
|||||||||||||||
|
Benefit (provision) for credit losses
|
|
|
(
|
)
|
|
|
|
|
|||||||||||||||
|
Net interest income after benefit (provision) for credit losses
|
|
|
|
|
|
|
|
|
|||||||||||||||
|
Investment gains, net
|
|
|
|
|
|
|
|
|
|||||||||||||||
|
Fair value gains (losses), net
|
|
|
(
|
)
|
|
|
(
|
)
|
|||||||||||||||
|
Fee and other income
|
|
|
|
|
|
|
|
|
|||||||||||||||
|
Non-interest income
|
|
|
|
|
|
|
|
|
|||||||||||||||
|
Administrative expenses:
|
|||||||||||||||||||||||
|
Salaries and employee benefits
|
(
|
)
|
(
|
)
|
(
|
)
|
(
|
)
|
|||||||||||||||
|
Professional services
|
(
|
)
|
(
|
)
|
(
|
)
|
(
|
)
|
|||||||||||||||
|
Other administrative expenses
|
(
|
)
|
(
|
)
|
(
|
)
|
(
|
)
|
|||||||||||||||
|
Total administrative expenses
|
(
|
)
|
(
|
)
|
(
|
)
|
(
|
)
|
|||||||||||||||
|
Foreclosed property expense
|
(
|
)
|
(
|
)
|
(
|
)
|
(
|
)
|
|||||||||||||||
|
Temporary Payroll Tax Cut Continuation Act of 2011 (“TCCA”) fees
|
(
|
)
|
(
|
)
|
(
|
)
|
(
|
)
|
|||||||||||||||
|
Other expenses, net
|
(
|
)
|
(
|
)
|
(
|
)
|
(
|
)
|
|||||||||||||||
|
Total expenses
|
(
|
)
|
(
|
)
|
(
|
)
|
(
|
)
|
|||||||||||||||
|
Income before federal income taxes
|
|
|
|
|
|
|
|
|
|||||||||||||||
|
Provision for federal income taxes
|
(
|
)
|
(
|
)
|
(
|
)
|
(
|
)
|
|||||||||||||||
|
Net income
|
|
|
|
|
|
|
|
|
|||||||||||||||
|
Other comprehensive income (loss):
|
|||||||||||||||||||||||
|
Changes in unrealized gains on available-for-sale securities, net of reclassification adjustments and taxes
|
(
|
)
|
|
|
(
|
)
|
(
|
)
|
|||||||||||||||
|
Other
|
(
|
)
|
(
|
)
|
(
|
)
|
(
|
)
|
|||||||||||||||
|
Total other comprehensive income (loss)
|
(
|
)
|
|
|
(
|
)
|
(
|
)
|
|||||||||||||||
|
Total comprehensive income
|
$
|
|
|
$
|
|
|
$
|
|
|
$
|
|
|
|||||||||||
|
Net income
|
$
|
|
|
$
|
|
|
$
|
|
|
$
|
|
|
|||||||||||
|
Dividends distributed or available for distribution to senior preferred stockholder
|
(
|
)
|
(
|
)
|
(
|
)
|
(
|
)
|
|||||||||||||||
|
Net income (loss) attributable to common stockholders
|
$
|
|
|
$
|
(
|
)
|
$
|
|
|
$
|
|
|
|||||||||||
|
Earnings (loss) per share:
|
|||||||||||||||||||||||
|
Basic
|
$
|
|
|
$
|
|
|
$
|
|
|
$
|
|
|
|||||||||||
|
Diluted
|
|
|
|
|
|
|
|
|
|||||||||||||||
|
Weighted-average common shares outstanding:
|
|||||||||||||||||||||||
|
Basic
|
|
|
|
|
|
|
|
|
|||||||||||||||
|
Diluted
|
|
|
|
|
|
|
|
|
|||||||||||||||
See Notes to Condensed Consolidated Financial Statements
|
Fannie Mae (In conservatorship) Third Quarter 2018 Form 10-Q
|
53
|
|
|
Financial Statements | Condensed Consolidated Statements of Cash Flows
|
||
FANNIE MAE
(In conservatorship)
(Dollars in millions)
|
For the Nine Months Ended September 30,
|
|||||||||||
|
2018
|
2017
|
||||||||||
|
Net cash provided by (used in) operating activities
|
$
|
(
|
)
|
$
|
|
|
|||||
|
Cash flows provided by investing activities:
|
|||||||||||
|
Proceeds from maturities and paydowns of trading securities held for investment
|
|
|
|
|
|||||||
|
Proceeds from sales of trading securities held for investment
|
|
|
|
|
|||||||
|
Proceeds from maturities and paydowns of available-for-sale securities
|
|
|
|
|
|||||||
|
Proceeds from sales of available-for-sale securities
|
|
|
|
|
|||||||
|
Purchases of loans held for investment
|
(
|
)
|
(
|
)
|
|||||||
|
Proceeds from repayments of loans acquired as held for investment of Fannie Mae
|
|
|
|
|
|||||||
|
Proceeds from sales of loans acquired as held for investment of Fannie Mae
|
|
|
|
|
|||||||
|
Proceeds from repayments and sales of loans acquired as held for investment of consolidated trusts
|
|
|
|
|
|||||||
|
Advances to lenders
|
(
|
)
|
(
|
)
|
|||||||
|
Proceeds from disposition of acquired property and preforeclosure sales
|
|
|
|
|
|||||||
|
Net change in federal funds sold and securities purchased under agreements to resell or similar arrangements
|
(
|
)
|
|
|
|||||||
|
Other, net
|
(
|
)
|
|
|
|||||||
|
Net cash provided by investing activities
|
|
|
|
|
|||||||
|
Cash flows used in financing activities:
|
|||||||||||
|
Proceeds from issuance of debt of Fannie Mae
|
|
|
|
|
|||||||
|
Payments to redeem debt of Fannie Mae
|
(
|
)
|
(
|
)
|
|||||||
|
Proceeds from issuance of debt of consolidated trusts
|
|
|
|
|
|||||||
|
Payments to redeem debt of consolidated trusts
|
(
|
)
|
(
|
)
|
|||||||
|
Payments of cash dividends on senior preferred stock to Treasury
|
(
|
)
|
(
|
)
|
|||||||
|
Proceeds from senior preferred stock purchase agreement with Treasury
|
|
|
|
|
|||||||
|
Other, net
|
|
|
|
|
|||||||
|
Net cash used in financing activities
|
(
|
)
|
(
|
)
|
|||||||
|
Net decrease in cash, cash equivalents and restricted cash
|
(
|
)
|
(
|
)
|
|||||||
|
Cash, cash equivalents and restricted cash at beginning of period
|
|
|
|
|
|||||||
|
Cash, cash equivalents and restricted cash at end of period
|
$
|
|
|
$
|
|
|
|||||
|
Cash paid during the period for:
|
|||||||||||
|
Interest
|
$
|
|
|
$
|
|
|
|||||
|
Income taxes
|
|
|
|
|
|||||||
See Notes to Condensed Consolidated Financial Statements
|
Fannie Mae (In conservatorship) Third Quarter 2018 Form 10-Q
|
54
|
|
|
Notes to Condensed Consolidated Financial Statements | Summary of Significant Accounting Policies
|
||
FANNIE MAE
(In conservatorship)
Notes to Condensed Consolidated Financial Statements
(Unaudited)
1
.
Summary of Significant Accounting Policies
We are a stockholder-owned corporation organized and existing under the Federal National Mortgage Association Charter Act (the “Charter Act” or our “charter”). We are a government-sponsored enterprise and we are subject to government oversight and regulation. Our regulators include the Federal Housing Finance Agency (“FHFA”), the U.S. Department of Housing and Urban Development (“HUD”), the U.S. Securities and Exchange Commission (“SEC”), and the U.S. Department of the Treasury (“Treasury”). The U.S. government does not guarantee our securities or other obligations.
We have been under conservatorship, with FHFA acting as conservator, since September 6, 2008. See “Note 1, Summary of Significant Accounting Policies” in our annual report on Form 10-K for the year ended
December 31, 2017
(“
2017
Form 10-K”) for additional information on our conservatorship and the impact of U.S. government support of our business.
The unaudited interim condensed consolidated financial statements as of and for the
three
and
nine
months ended
September 30, 2018
, and related notes, should be read in conjunction with our audited consolidated financial statements and related notes included in our
2017
Form 10-K.
Treasury has made a commitment under a senior preferred stock purchase agreement to provide funding to us under certain circumstances if we have a net worth deficit. In the first quarter of 2018, we received
$
3.7
billion
from Treasury to eliminate our net worth deficit as of
December 31, 2017
. Pursuant to the senior preferred stock purchase agreement, we have received a total of
$
119.8
billion
from Treasury as of
September 30, 2018
, and the amount of remaining funding available to us under the agreement was
$
113.9
billion
.
Pursuant to the senior preferred stock purchase agreement, we issued shares of senior preferred stock to Treasury in 2008. Acting as successor to the rights, titles, powers and privileges of the Board, our conservator has declared and directed us to pay dividends to Treasury on the senior preferred stock on a quarterly basis for every dividend period for which dividends were payable since we entered into conservatorship in 2008. Effective January 1, 2018, the dividend provisions of the senior preferred stock provide for quarterly dividends consisting of the amount, if any, by which our net worth as of the end of the immediately preceding fiscal quarter exceeds a
$
3.0
billion
capital reserve amount. We refer to this as a “net worth sweep” dividend. On September 28, 2018, we
|
Fannie Mae (In conservatorship) Third Quarter 2018 Form 10-Q
|
55
|
|
|
Notes to Condensed Consolidated Financial Statements | Summary of Significant Accounting Policies
|
||
paid Treasury a dividend of
$
4.5
billion
based on our net worth of
$
7.5
billion
as of
June 30, 2018
, less the applicable capital reserve amount of
$
3.0
billion
. Because we had a net worth of
$
7.0
billion
as of
September 30, 2018
, we expect to pay Treasury a dividend of
$
4.0
billion
for the
fourth quarter
of
2018
by
December 31, 2018
.
The liquidation preference of the senior preferred stock is subject to adjustment. The aggregate liquidation preference of the senior preferred stock was
$
123.8
billion
as of
September 30, 2018
.
As a result of our issuance to Treasury of a warrant to purchase shares of Fannie Mae common stock equal to
79.9
%
of the total number of shares of Fannie Mae common stock, we and Treasury are deemed related parties. As of
September 30, 2018
, Treasury held an investment in our senior preferred stock with an aggregate liquidation preference of
$
123.8
billion
. FHFA’s control of Fannie Mae and Freddie Mac has caused Fannie Mae, FHFA and Freddie Mac to be deemed related parties. In 2013, Fannie Mae and Freddie Mac established Common Securitization Solutions, LLC (“CSS”), a jointly owned limited liability company to operate a common securitization platform; therefore, CSS is deemed a related party.
Transactions with Treasury
Our administrative expenses were reduced by
$
6
million
and
$
9
million
for the
three
months ended
September 30, 2018
and
2017
, respectively, and
$
19
million
and
$
32
million
for the
nine
months ended
September 30, 2018
and
2017
, respectively, due to reimbursements from Treasury and Freddie Mac for expenses incurred as program administrator for Treasury’s Home Affordable Modification Program and other initiatives under Treasury’s Making Home Affordable Program.
During the three months ended
September 30, 2018
, we did not make any payments to the Internal Revenue Service (“IRS”), a bureau of Treasury. We made tax payments of
$
460
million
during the
nine
months ended
September 30, 2018
. We made tax payments of
$
600
million
and
$
1.7
billion
during the
three
and
nine
months ended
September 30, 2017
, respectively.
In 2009, we entered into a memorandum of understanding with Treasury, FHFA and Freddie Mac pursuant to which we agreed to provide assistance to state and local housing finance agencies (“HFAs”) through certain programs, including a new issue bond (“NIB”) program. As of
September 30, 2018
, under the NIB program, Fannie Mae and Freddie Mac had
$
4.6
billion
outstanding of pass-through securities backed by single-family and multifamily housing bonds issued by HFAs, which is less than
35
%
of the total original principal under the program, the amount of losses that Treasury would bear. Accordingly, we do not have a potential risk of loss under the NIB program.
The fee revenue and expense related to the TCCA are recorded in “Mortgage loans interest income” and “TCCA fees,” respectively, in our condensed consolidated statements of operations and comprehensive income. We recognized
$
576
million
and
$
531
million
in TCCA fees for the
three
months ended
September 30, 2018
and
2017
, respectively, and
$
1.7
billion
and
$
1.6
billion
for the
nine
months ended
September 30, 2018
and
2017
, respectively, of which
$
576
million
had not been remitted to Treasury as of
September 30, 2018
.
We incurred expenses in connection with certain funding obligations under the Federal Housing Enterprises Financial Safety and Soundness Act of 1992, as amended by the Federal Housing Finance Regulatory Reform Act of 2008 (the “GSE Act”), a portion of which is attributable to Treasury’s Capital Magnet Fund. These expenses, recognized in “Other expenses, net” in our condensed consolidated statements of operations and comprehensive income, were measured as the product of
4.2
basis points and the unpaid principal balance of our total new business purchases for the respective period. We recognized
$
20
million
and
$
16
million
in “Other expenses, net” in connection with Treasury’s Capital Magnet Fund for the
three
months ended
September 30,
|
Fannie Mae (In conservatorship) Third Quarter 2018 Form 10-Q
|
56
|
|
|
Notes to Condensed Consolidated Financial Statements | Summary of Significant Accounting Policies
|
||
2018
and
2017
, respectively, and
$
57
million
and
$
46
million
for the
nine
months ended
September 30, 2018
and
2017
, respectively, of which
$
57
million
had not been remitted as of
September 30, 2018
.
In addition to the transactions with Treasury mentioned above, we purchase and sell Treasury securities in the normal course of business.
As of September 30, 2018
and
December 31, 2017
, we held Treasury securities with a fair value of
$
37.6
billion
and
$
29.2
billion
, respectively, and accrued interest receivable of
$
124
million
and
$
77
million
, respectively. We recognized interest income on these securities held by us of
$
192
million
and
$
95
million
for the
three
months ended
September 30, 2018
and
2017
, respectively, and
$
485
million
and
$
244
million
for the
nine
months ended
September 30, 2018
and
2017
, respectively.
Transactions with Freddie Mac
As of
September 30, 2018
and
December 31, 2017
, we held Freddie Mac mortgage-related securities with a fair value of
$
497
million
and
$
613
million
, respectively, and accrued interest receivable of
$
2
million
and
$
2
million
, respectively. We recognized interest income on these securities held by us of
$
6
million
and
$
8
million
for the
three
months ended
September 30, 2018
and
2017
, respectively, and
$
19
million
and
$
31
million
for the
nine
months ended
September 30, 2018
and
2017
, respectively. In addition, Freddie Mac may be an investor in variable interest entities (“VIEs”) that we have consolidated, and we may be an investor in VIEs that Freddie Mac has consolidated. Freddie Mac may also be an investor in our debt securities.
Transactions with FHFA
The GSE Act authorizes FHFA to establish an annual assessment for regulated entities, including Fannie Mae, which is payable on a semi-annual basis (April and October), for FHFA’s costs and expenses, as well as to maintain FHFA’s working capital. We recognized FHFA assessment fees, which are recorded in “Administrative expenses” in our condensed consolidated statements of operations and comprehensive income, of
$
26
million
for the
three
months ended
September 30, 2018
and
2017
, and
$
81
million
and
$
82
million
for the
nine
months ended
September 30, 2018
and
2017
, respectively.
Transactions with CSS
The calculation of diluted EPS includes all the components of basic earnings per share, plus the dilutive effect of common stock equivalents such as convertible securities and stock options. Weighted average shares outstanding is increased to include the number of additional common shares that would have been outstanding if the dilutive potential common shares had been issued. For the three and nine months ended September 30, 2018
|
Fannie Mae (In conservatorship) Third Quarter 2018 Form 10-Q
|
57
|
|
|
Notes to Condensed Consolidated Financial Statements | Summary of Significant Accounting Policies
|
||
The following table updates information about our significant policies that have recently been adopted or are yet to be adopted from the information included in our
2017
Form 10-K.
|
Standard
|
Description
|
Effective Date
|
Impact on Consolidated Financial Statements
|
|
Accounting Standards Update (“ASU”) 2016-01
, Recognition and Measurement of Financial Assets and Financial Liabilities (Subtopic 825-10)
|
The amendment addresses certain aspects of recognition, measurement, presentation and disclosure of financial instruments.
|
January 1, 2018
|
The adoption of the amendments did not have a material impact on our consolidated financial statements.
|
|
ASU 2016-15
,
Statement of Cash Flows (Topic 230), Classification of Certain Cash Receipts and Cash Payments (a consensus of the Emerging Issues Task Force)
|
The main objective of this update is to address the diversity in practice that currently exists in regards to how certain cash receipts and cash payments are presented and classified in the statement of cash flows under Topic 230, Statement of Cash Flows, and other Topics.
|
January 1, 2018
|
This guidance was applied retrospectively to the statement of cash flows for the prior period presented. The adoption of the amendments did not have a material impact on our consolidated financial statements.
|
|
ASU 2016-18,
Statement of Cash Flows
(Topic 230)
,
Restricted Cash (a consensus of the Financial Accounting Standards Board (“FASB”) Emerging Issues Task Force)
|
The amendments in this update address the diversity in the classification and presentation of changes in restricted cash on the statement of cash flows under Topic 230, Statement of Cash Flows. Specifically, this amendment dictates that the statement of cash flows should explain the change in the period of the total of cash, cash equivalents and restricted cash balances.
|
January 1, 2018
|
This guidance was applied retrospectively to the statements of cash flows for the prior period presented. As a result of this adoption, the net change in restricted cash that results from transfers between cash, cash equivalents, and restricted cash is no longer presented as an investing activity in our consolidated statement of cash flows. The adoption of the amendments did not have a material impact on our consolidated financial statements.
|
|
ASU 2018-02,
Income Statement (Topic 220): Reclassification of Certain Tax Effects from Accumulated Other Comprehensive Income
|
The amendments in this update allow a reclassification from accumulated other comprehensive income to retained earnings for stranded tax effects resulting from the Tax Cuts and Jobs Act.
|
January 1, 2019
|
The early adoption of this guidance on January 1, 2018 resulted in the reclassification of $117 million in stranded tax amounts from accumulated other comprehensive income to retained earnings.
|
|
ASU 2018-13
,
Fair Value Measurement (Topic 820), Disclosure Framework—Changes to the Disclosure
Requirements for Fair Value Measurement
|
The amendments in this update streamline, clarify and enhance certain disclosures related to Level 3 recurring and nonrecurring fair value measurements.
|
January 1, 2020
|
We do not expect the adoption of this guidance to have a material impact on our consolidated financial statements. Adoption is required for periods beginning January 1, 2020 with early adoption permitted. We are considering adopting this guidance for our 2018 Form 10-K.
|
|
ASU 2016-13
,
Financial Instruments-Credit Losses (Topic 326): Measurement of Credit Losses on Financial Instruments
|
The amendments in this update replace the incurred loss impairment methodology in current GAAP with a methodology that reflects lifetime expected credit losses and requires consideration of a broader range of reasonable and supportable information to inform credit loss estimates.
|
January 1, 2020
|
We are continuing to evaluate the impact of this guidance on our consolidated financial statements. We expect the greater impact of the guidance to relate to our accounting for credit losses for loans that are not individually impaired. The adoption of this guidance may increase our allowance for loan losses and decrease, perhaps substantially, our retained earnings.
|
|
Fannie Mae (In conservatorship) Third Quarter 2018 Form 10-Q
|
58
|
|
|
Notes to Condensed Consolidated Financial Statements | Consolidations and Transfers of Financial Assets
|
||
2
.
Consolidations and Transfers of Financial Assets
|
As of
|
|||||||||||
|
September 30, 2018
|
December 31, 2017
|
||||||||||
|
(Dollars in millions)
|
|||||||||||
|
Assets:
|
|||||||||||
|
Trading securities:
|
|||||||||||
|
Fannie Mae
|
$
|
|
|
$
|
|
|
|||||
|
Non-Fannie Mae
|
|
|
|
|
|||||||
|
Total trading securities
|
|
|
|
|
|||||||
|
Available-for-sale securities:
|
|
|
|||||||||
|
Fannie Mae
|
|
|
|
|
|||||||
|
Non-Fannie Mae
|
|
|
|
|
|||||||
|
Total available-for-sale securities
|
|
|
|
|
|||||||
|
Other assets
|
|
|
|
|
|||||||
|
Other liabilities
|
(
|
)
|
(
|
)
|
|||||||
|
Net carrying amount
|
$
|
|
|
$
|
|
|
|||||
The maximum exposure to loss for our unconsolidated limited partnerships and similar legal entities, which consist of low-income housing tax credit investments, community investments and other entities, was
$
105
million
and the related carrying value was
$
83
million
as of
September 30, 2018
. As of
December 31, 2017
, the maximum exposure to loss was
$
105
million
and the related carrying value was
$
82
million
. The total assets of these limited partnership investments were
$
2.4
billion
and
$
3.2
billion
as of
September 30, 2018
and
December 31, 2017
, respectively.
We issue Fannie Mae MBS through portfolio securitization transactions by transferring pools of mortgage loans or mortgage-related securities to one or more trusts or special purpose entities. We are considered to be the
|
Fannie Mae (In conservatorship) Third Quarter 2018 Form 10-Q
|
59
|
|
|
Notes to Condensed Consolidated Financial Statements | Consolidations and Transfers of Financial Assets
|
||
|
Fannie Mae (In conservatorship) Third Quarter 2018 Form 10-Q
|
60
|
|
|
Notes to Condensed Consolidated Financial Statements | Mortgage Loans
|
||
3
.
Mortgage Loans
For purposes of the single-family mortgage loan disclosures in this footnote, we define “primary” class as mortgage loans that are not included in other loan classes; “government” class as mortgage loans that are guaranteed or insured, in whole or in part, by the U.S. government or one of its agencies, and that are not Alt-A; and “other” class as loans with higher-risk characteristics, such as interest-only loans and negative-amortizing loans, that are neither government nor Alt-A.
|
As of
|
|||||||
|
September 30, 2018
|
December 31, 2017
|
||||||
|
(Dollars in millions)
|
|||||||
|
Single-family
|
$
|
|
|
$
|
|
|
|
|
Multifamily
|
|
|
|
|
|||
|
Total unpaid principal balance of mortgage loans
|
|
|
|
|
|||
|
Cost basis and fair value adjustments, net
|
|
|
|
|
|||
|
Allowance for loan losses for loans held for investment
|
(
|
)
|
(
|
)
|
|||
|
Total mortgage loans
|
$
|
|
|
$
|
|
|
|
The following table displays information about our redesignated mortgage loans.
|
For the Three Months Ended September 30,
|
For the Nine Months Ended September 30,
|
||||||||||||||
|
2018
|
2017
|
2018
|
2017
|
||||||||||||
|
(Dollars in millions)
|
|||||||||||||||
|
Carrying value of loans redesignated from HFI to HFS
|
$
|
|
|
$
|
|
|
$
|
|
|
$
|
|
|
|||
|
Carrying value of loans redesignated from HFS to HFI
|
|
|
|
|
|
|
|
|
|||||||
|
Loans sold - unpaid principal balance
|
|
|
|
|
|
|
|
|
|||||||
|
Realized gains on sale of mortgage loans
|
|
|
|
|
|
|
|
|
|||||||
The recorded investment of single-family mortgage loans for which formal foreclosure proceedings are in process was
$
10.6
billion
and
$
13.0
billion
as of
September 30, 2018
and
December 31, 2017
, respectively. As a result of our various loss mitigation and foreclosure prevention efforts, we expect that a portion of the loans in the process of formal foreclosure proceedings will not ultimately foreclose.
Nonaccrual Loans
|
Fannie Mae (In conservatorship) Third Quarter 2018 Form 10-Q
|
61
|
|
|
Notes to Condensed Consolidated Financial Statements | Mortgage Loans
|
||
|
|
As of September 30, 2018
|
||||||||||||||||||||||||||||||
|
30 - 59 Days
Delinquent
|
60 - 89 Days Delinquent
|
Seriously Delinquent
(1)
|
Total Delinquent
|
Current
|
Total
|
Recorded Investment in Loans 90 Days or More Delinquent and Accruing Interest
|
Recorded Investment in Nonaccrual Loans
|
||||||||||||||||||||||||
|
|
(Dollars in millions)
|
||||||||||||||||||||||||||||||
|
Single-family:
|
|||||||||||||||||||||||||||||||
|
Primary
|
$
|
|
|
$
|
|
|
$
|
|
|
$
|
|
|
$
|
|
|
$
|
|
|
$
|
|
|
$
|
|
|
|||||||
|
Government
(2)
|
|
|
|
|
|
|
|
|
|
|
|
|
|
|
|
|
|||||||||||||||
|
Alt-A
|
|
|
|
|
|
|
|
|
|
|
|
|
|
|
|
|
|||||||||||||||
|
Other
|
|
|
|
|
|
|
|
|
|
|
|
|
|
|
|
|
|||||||||||||||
|
Total single-family
|
|
|
|
|
|
|
|
|
|
|
|
|
|
|
|
|
|||||||||||||||
|
Multifamily
(3)
|
|
|
N/A
|
|
|
|
|
|
|
|
|
|
|
|
|
|
|||||||||||||||
|
Total
|
$
|
|
|
$
|
|
|
$
|
|
|
$
|
|
|
$
|
|
|
$
|
|
|
$
|
|
|
$
|
|
|
|||||||
|
|
As of December 31, 2017
|
||||||||||||||||||||||||||||||
|
30 - 59 Days
Delinquent
|
60 - 89 Days Delinquent
|
Seriously Delinquent
(1)
|
Total Delinquent
|
Current
|
Total
|
Recorded Investment in Loans 90 Days or More Delinquent and Accruing Interest
|
Recorded Investment in Nonaccrual Loans
|
||||||||||||||||||||||||
|
|
(Dollars in millions)
|
||||||||||||||||||||||||||||||
|
Single-family:
|
|||||||||||||||||||||||||||||||
|
Primary
|
$
|
|
|
$
|
|
|
$
|
|
|
$
|
|
|
$
|
|
|
$
|
|
|
$
|
|
|
$
|
|
|
|||||||
|
Government
(2)
|
|
|
|
|
|
|
|
|
|
|
|
|
|
|
|
|
|||||||||||||||
|
Alt-A
|
|
|
|
|
|
|
|
|
|
|
|
|
|
|
|
|
|||||||||||||||
|
Other
|
|
|
|
|
|
|
|
|
|
|
|
|
|
|
|
|
|||||||||||||||
|
Total single-family
|
|
|
|
|
|
|
|
|
|
|
|
|
|
|
|
|
|||||||||||||||
|
Multifamily
(3)
|
|
|
N/A
|
|
|
|
|
|
|
|
|
|
|
|
|
|
|||||||||||||||
|
Total
|
$
|
|
|
$
|
|
|
$
|
|
|
$
|
|
|
$
|
|
|
$
|
|
|
$
|
|
|
$
|
|
|
|||||||
__________
|
(1)
|
Single-family seriously delinquent loans are loans that are
|
|
(2)
|
Primarily consists of reverse mortgages, which due to their nature, are not aged and are included in the current column.
|
|
(3)
|
|
|
Fannie Mae (In conservatorship) Third Quarter 2018 Form 10-Q
|
62
|
|
|
Notes to Condensed Consolidated Financial Statements | Mortgage Loans
|
||
|
|
As of
|
||||||||||||||||||||||
|
|
September 30, 2018
(1)
|
December 31, 2017
(1)
|
|||||||||||||||||||||
|
|
Primary
|
Alt-A
|
Other
|
Primary
|
Alt-A
|
Other
|
|||||||||||||||||
|
|
(Dollars in millions)
|
||||||||||||||||||||||
|
Estimated mark-to-market loan-to-value (“LTV”) ratio:
(2)
|
|
|
|
|
|||||||||||||||||||
|
Less than or equal to 80%
|
$
|
|
|
$
|
|
|
$
|
|
|
$
|
|
|
$
|
|
|
$
|
|
|
|||||
|
Greater than 80%
and less than or equal to 90%
|
|
|
|
|
|
|
|
|
|
|
|
|
|||||||||||
|
Greater than 90%
and less than or equal to 100%
|
|
|
|
|
|
|
|
|
|
|
|
|
|||||||||||
|
Greater than 100%
|
|
|
|
|
|
|
|
|
|
|
|
|
|||||||||||
|
Total
|
$
|
|
|
$
|
|
|
$
|
|
|
$
|
|
|
$
|
|
|
$
|
|
|
|||||
__________
|
(1)
|
Excludes
$
|
|
(2)
|
|
|
|
As of
|
||||||||||
|
|
September 30,
|
December 31,
|
|||||||||
|
2018
|
2017
|
||||||||||
|
|
(Dollars in millions)
|
||||||||||
|
Credit risk profile by internally assigned grade:
|
|||||||||||
|
Non-classified
|
$
|
|
|
$
|
|
|
|||||
|
Classified
(1)
|
|
|
|
|
|||||||
|
Total
|
$
|
|
|
$
|
|
|
|||||
_________
|
(1)
|
|
Individually impaired loans include troubled debt restructurings (“TDRs”), acquired credit-impaired loans and multifamily loans that we have assessed as probable that we will not collect all contractual amounts due, regardless of whether we are currently accruing interest; excluding loans classified as HFS.
The following tables display the total unpaid principal balance, recorded investment, related allowance, average recorded investment and interest income recognized for individually impaired loans.
|
Fannie Mae (In conservatorship) Third Quarter 2018 Form 10-Q
|
63
|
|
|
Notes to Condensed Consolidated Financial Statements | Mortgage Loans
|
||
|
As of
|
||||||||||||||||||||||||||||||||||
|
September 30, 2018
|
December 31, 2017
|
|||||||||||||||||||||||||||||||||
|
Unpaid Principal Balance
|
Total Recorded Investment
|
Related Allowance for Loan Losses
|
Unpaid Principal Balance
|
Total Recorded Investment
|
Related Allowance for Loan Losses
|
|||||||||||||||||||||||||||||
|
(Dollars in millions)
|
||||||||||||||||||||||||||||||||||
|
Individually impaired loans:
|
|
|
||||||||||||||||||||||||||||||||
|
With related allowance recorded:
|
|
|
|
|
||||||||||||||||||||||||||||||
|
Single-family:
|
|
|
|
|
||||||||||||||||||||||||||||||
|
Primary
|
$
|
|
|
$
|
|
|
$
|
(
|
)
|
$
|
|
|
$
|
|
|
$
|
(
|
)
|
||||||||||||||||
|
Government
|
|
|
|
|
(
|
)
|
|
|
|
|
(
|
)
|
||||||||||||||||||||||
|
Alt-A
|
|
|
|
|
(
|
)
|
|
|
|
|
(
|
)
|
||||||||||||||||||||||
|
Other
|
|
|
|
|
(
|
)
|
|
|
|
|
(
|
)
|
||||||||||||||||||||||
|
Total single-family
|
|
|
|
|
(
|
)
|
|
|
|
|
(
|
)
|
||||||||||||||||||||||
|
Multifamily
|
|
|
|
|
(
|
)
|
|
|
|
|
(
|
)
|
||||||||||||||||||||||
|
Total individually impaired loans with related allowance recorded
|
|
|
|
|
(
|
)
|
|
|
|
|
(
|
)
|
||||||||||||||||||||||
|
With no related allowance recorded:
(1)
|
||||||||||||||||||||||||||||||||||
|
Single-family:
|
||||||||||||||||||||||||||||||||||
|
Primary
|
|
|
|
|
—
|
|
|
|
|
|
—
|
|
||||||||||||||||||||||
|
Government
|
|
|
|
|
—
|
|
|
|
|
|
—
|
|
||||||||||||||||||||||
|
Alt-A
|
|
|
|
|
—
|
|
|
|
|
|
—
|
|
||||||||||||||||||||||
|
Other
|
|
|
|
|
—
|
|
|
|
|
|
—
|
|
||||||||||||||||||||||
|
Total single-family
|
|
|
|
|
—
|
|
|
|
|
|
—
|
|
||||||||||||||||||||||
|
Multifamily
|
|
|
|
|
—
|
|
|
|
|
|
—
|
|
||||||||||||||||||||||
|
Total individually impaired loans with no related allowance recorded
|
|
|
|
|
—
|
|
|
|
|
|
—
|
|
||||||||||||||||||||||
|
Total individually impaired loans
(2)
|
$
|
|
|
$
|
|
|
$
|
(
|
)
|
$
|
|
|
$
|
|
|
$
|
(
|
)
|
||||||||||||||||
|
Fannie Mae (In conservatorship) Third Quarter 2018 Form 10-Q
|
64
|
|
|
Notes to Condensed Consolidated Financial Statements | Mortgage Loans
|
||
|
For the Three Months Ended September 30,
|
|||||||||||||||||||||||||||||||||||
|
2018
|
2017
|
||||||||||||||||||||||||||||||||||
|
Average Recorded Investment
|
Total Interest Income Recognized
|
Interest Income Recognized on a Cash Basis
|
Average Recorded Investment
|
Total Interest Income Recognized
|
Interest Income Recognized on a Cash Basis
|
||||||||||||||||||||||||||||||
|
(Dollars in millions)
|
|||||||||||||||||||||||||||||||||||
|
Individually impaired loans:
|
|
|
|||||||||||||||||||||||||||||||||
|
With related allowance recorded:
|
|
|
|
|
|||||||||||||||||||||||||||||||
|
Single-family:
|
|
|
|
|
|||||||||||||||||||||||||||||||
|
Primary
|
$
|
|
|
$
|
|
|
$
|
|
|
$
|
|
|
$
|
|
|
$
|
|
|
|||||||||||||||||
|
Government
|
|
|
|
|
|
|
|
|
|
|
|
|
|||||||||||||||||||||||
|
Alt-A
|
|
|
|
|
|
|
|
|
|
|
|
|
|||||||||||||||||||||||
|
Other
|
|
|
|
|
|
|
|
|
|
|
|
|
|||||||||||||||||||||||
|
Total single-family
|
|
|
|
|
|
|
|
|
|
|
|
|
|||||||||||||||||||||||
|
Multifamily
|
|
|
|
|
|
|
|
|
|
|
|
|
|||||||||||||||||||||||
|
Total individually impaired loans with related allowance recorded
|
|
|
|
|
|
|
|
|
|
|
|
|
|||||||||||||||||||||||
|
With no related allowance recorded:
(1)
|
|||||||||||||||||||||||||||||||||||
|
Single-family:
|
|||||||||||||||||||||||||||||||||||
|
Primary
|
|
|
|
|
|
|
|
|
|
|
|
|
|||||||||||||||||||||||
|
Government
|
|
|
|
|
|
|
|
|
|
|
|
|
|||||||||||||||||||||||
|
Alt-A
|
|
|
|
|
|
|
|
|
|
|
|
|
|||||||||||||||||||||||
|
Other
|
|
|
|
|
|
|
|
|
|
|
|
|
|||||||||||||||||||||||
|
Total single-family
|
|
|
|
|
|
|
|
|
|
|
|
|
|||||||||||||||||||||||
|
Multifamily
|
|
|
|
|
|
|
|
|
|
|
|
|
|||||||||||||||||||||||
|
Total individually impaired loans with no related allowance recorded
|
|
|
|
|
|
|
|
|
|
|
|
|
|||||||||||||||||||||||
|
Total individually impaired loans
|
$
|
|
|
$
|
|
|
$
|
|
|
$
|
|
|
$
|
|
|
$
|
|
|
|||||||||||||||||
|
Fannie Mae (In conservatorship) Third Quarter 2018 Form 10-Q
|
65
|
|
|
Notes to Condensed Consolidated Financial Statements | Mortgage Loans
|
||
|
For the Nine Months Ended September 30,
|
|||||||||||||||||||||||||||||||||||
|
2018
|
2017
|
||||||||||||||||||||||||||||||||||
|
Average Recorded Investment
|
Total Interest Income Recognized
|
Interest Income Recognized on a Cash Basis
|
Average Recorded Investment
|
Total Interest Income Recognized
|
Interest Income Recognized on a Cash Basis
|
||||||||||||||||||||||||||||||
|
(Dollars in millions)
|
|||||||||||||||||||||||||||||||||||
|
Individually impaired loans:
|
|
|
|||||||||||||||||||||||||||||||||
|
With related allowance recorded:
|
|
|
|
|
|||||||||||||||||||||||||||||||
|
Single-family:
|
|
|
|
|
|||||||||||||||||||||||||||||||
|
Primary
|
$
|
|
|
$
|
|
|
$
|
|
|
$
|
|
|
$
|
|
|
$
|
|
|
|||||||||||||||||
|
Government
|
|
|
|
|
|
|
|
|
|
|
|
|
|||||||||||||||||||||||
|
Alt-A
|
|
|
|
|
|
|
|
|
|
|
|
|
|||||||||||||||||||||||
|
Other
|
|
|
|
|
|
|
|
|
|
|
|
|
|||||||||||||||||||||||
|
Total single-family
|
|
|
|
|
|
|
|
|
|
|
|
|
|||||||||||||||||||||||
|
Multifamily
|
|
|
|
|
|
|
|
|
|
|
|
|
|||||||||||||||||||||||
|
Total individually impaired loans with related allowance recorded
|
|
|
|
|
|
|
|
|
|
|
|
|
|||||||||||||||||||||||
|
With no related allowance recorded:
(1)
|
|||||||||||||||||||||||||||||||||||
|
Single-family:
|
|||||||||||||||||||||||||||||||||||
|
Primary
|
|
|
|
|
|
|
|
|
|
|
|
|
|||||||||||||||||||||||
|
Government
|
|
|
|
|
|
|
|
|
|
|
|
|
|||||||||||||||||||||||
|
Alt-A
|
|
|
|
|
|
|
|
|
|
|
|
|
|||||||||||||||||||||||
|
Other
|
|
|
|
|
|
|
|
|
|
|
|
|
|||||||||||||||||||||||
|
Total single-family
|
|
|
|
|
|
|
|
|
|
|
|
|
|||||||||||||||||||||||
|
Multifamily
|
|
|
|
|
|
|
|
|
|
|
|
|
|||||||||||||||||||||||
|
Total individually impaired loans with no related allowance recorded
|
|
|
|
|
|
|
|
|
|
|
|
|
|||||||||||||||||||||||
|
Total individually impaired loans
|
$
|
|
|
$
|
|
|
$
|
|
|
$
|
|
|
$
|
|
|
$
|
|
|
|||||||||||||||||
__________
|
(1)
|
The discounted cash flows or collateral value equals or exceeds the carrying value of the loan and, as such, no valuation allowance is required.
|
|
(2)
|
|
The substantial majority of the loan modifications we complete result in term extensions, interest rate reductions or a combination of both. During the
three and nine
months ended
September 30, 2018
, the average term extension of a single-family modified loan was
98
months
and
104
months
, respectively, and the average interest rate reduction was
0.14
and
0.23
percentage points, respectively. During the
three and nine
months ended
September 30, 2017
, the average term extension of a single-family modified loan was
156
months
and
155
months
, respectively, and the average interest rate reduction was
0.35
and
0.66
percentage points, respectively.
|
Fannie Mae (In conservatorship) Third Quarter 2018 Form 10-Q
|
66
|
|
|
Notes to Condensed Consolidated Financial Statements | Mortgage Loans
|
||
|
For the Three Months Ended September 30,
|
|||||||||||||||||||||
|
2018
|
2017
|
||||||||||||||||||||
|
Number of Loans
|
Recorded
Investment
|
Number of Loans
|
Recorded
Investment
|
||||||||||||||||||
|
(Dollars in millions)
|
|||||||||||||||||||||
|
Single-family:
|
|||||||||||||||||||||
|
Primary
|
|
|
$
|
|
|
|
|
$
|
|
|
|||||||||||
|
Government
|
|
|
|
|
|
|
|
|
|||||||||||||
|
Alt-A
|
|
|
|
|
|
|
|
|
|||||||||||||
|
Other
|
|
|
|
|
|
|
|
|
|||||||||||||
|
Total single-family
|
|
|
|
|
|
|
|
|
|||||||||||||
|
Multifamily
|
|
|
|
|
|
|
|
|
|||||||||||||
|
Total TDRs
|
|
|
$
|
|
|
|
|
$
|
|
|
|||||||||||
|
For the Nine Months Ended September 30,
|
|||||||||||||||||||||
|
2018
|
2017
|
||||||||||||||||||||
|
Number of Loans
|
Recorded
Investment
|
Number of Loans
|
Recorded
Investment
|
||||||||||||||||||
|
(Dollars in millions)
|
|||||||||||||||||||||
|
Single-family:
|
|||||||||||||||||||||
|
Primary
|
|
|
$
|
|
|
|
|
$
|
|
|
|||||||||||
|
Government
|
|
|
|
|
|
|
|
|
|||||||||||||
|
Alt-A
|
|
|
|
|
|
|
|
|
|||||||||||||
|
Other
|
|
|
|
|
|
|
|
|
|||||||||||||
|
Total single-family
|
|
|
|
|
|
|
|
|
|||||||||||||
|
Multifamily
|
|
|
|
|
|
|
|
|
|||||||||||||
|
Total TDRs
|
|
|
$
|
|
|
|
|
$
|
|
|
|||||||||||
|
Fannie Mae (In conservatorship) Third Quarter 2018 Form 10-Q
|
67
|
|
|
Notes to Condensed Consolidated Financial Statements | Mortgage Loans
|
||
For loans that had a payment default in the period presented and that were classified as a TDR in the twelve months prior to the payment default,
t
he following tables display the number of loans and our recorded investment in these loans at the time of payment default. For purposes of this disclosure, we define loans that had a payment default as: single-family and multifamily loans with completed TDRs that liquidated during the period, either through foreclosure, deed-in-lieu of foreclosure, or a short sale; single-family loans with completed modifications that are two or more months delinquent during the period; or multifamily loans with completed modifications that are one or more months delinquent during the period.
|
For the Three Months Ended September 30,
|
|||||||||||||||||||||
|
2018
|
2017
|
||||||||||||||||||||
|
Number of Loans
|
Recorded
Investment
|
Number of Loans
|
Recorded
Investment
|
||||||||||||||||||
|
(Dollars in millions)
|
|||||||||||||||||||||
|
Single-family:
|
|||||||||||||||||||||
|
Primary
|
|
|
$
|
|
|
|
|
$
|
|
|
|||||||||||
|
Government
|
|
|
|
|
|
|
|
|
|||||||||||||
|
Alt-A
|
|
|
|
|
|
|
|
|
|||||||||||||
|
Other
|
|
|
|
|
|
|
|
|
|||||||||||||
|
Total single-family
|
|
|
|
|
|
|
|
|
|||||||||||||
|
Multifamily
|
|
|
|
|
|
|
|
|
|||||||||||||
|
Total TDRs that subsequently defaulted
|
|
|
$
|
|
|
|
|
$
|
|
|
|||||||||||
|
For the Nine Months Ended September 30,
|
|||||||||||||||||||||
|
2018
|
2017
|
||||||||||||||||||||
|
Number of Loans
|
Recorded
Investment
|
Number of Loans
|
Recorded
Investment
|
||||||||||||||||||
|
(Dollars in millions)
|
|||||||||||||||||||||
|
Single-family:
|
|||||||||||||||||||||
|
Primary
|
|
|
$
|
|
|
|
|
$
|
|
|
|||||||||||
|
Government
|
|
|
|
|
|
|
|
|
|||||||||||||
|
Alt-A
|
|
|
|
|
|
|
|
|
|||||||||||||
|
Other
|
|
|
|
|
|
|
|
|
|||||||||||||
|
Total single-family
|
|
|
|
|
|
|
|
|
|||||||||||||
|
Multifamily
|
|
|
|
|
|
|
|
|
|||||||||||||
|
Total TDRs that subsequently defaulted
|
|
|
$
|
|
|
|
|
$
|
|
|
|||||||||||
|
Fannie Mae (In conservatorship) Third Quarter 2018 Form 10-Q
|
68
|
|
|
Notes to Condensed Consolidated Financial Statements | Allowance for Loan Losses
|
||
4
.
Allowance for Loan Losses
We aggregate single-family HFI loans that are not individually impaired based on similar risk characteristics for purposes of estimating incurred credit losses and establishing a collective single-family loss reserve using an econometric model that derives an overall loss reserve estimate. We base our allowance methodology on historical events and trends, such as loss severity (in event of default), default rates, and recoveries from mortgage insurance contracts and other credit enhancements that provide loan level loss coverage and are either contractually attached to a loan or that were entered into contemporaneously with and in contemplation of a guaranty or loan purchase transaction. We use recent regional historical sales and appraisal information including the sales of our own foreclosed properties, to develop our loss severity estimates for all loan categories. Our allowance calculation also incorporates a loss confirmation period (the anticipated time lag between a credit loss event and the confirmation of the credit loss resulting from that event) to ensure our allowance estimate captures credit losses that have been incurred as of the balance sheet date but have not been confirmed. In addition, management performs a review of the observable data used in its estimate to ensure it is representative of prevailing economic conditions and other events existing as of the balance sheet date.
Individually impaired single-family loans currently include those classified as a TDR and acquired credit-impaired loans. We consider a loan to be impaired when, based on current information, it is probable that we will not receive all amounts due, including interest, in accordance with the contractual terms of the loan agreement. When a loan has been restructured, we measure impairment using a cash flow analysis discounted at the loan’s original effective interest rate. If we expect to recover our recorded investment in an individually impaired loan through probable foreclosure of the underlying collateral, we measure impairment based on the fair value of the collateral, reduced by estimated disposal costs and adjusted for estimated proceeds from mortgage, flood, or hazard insurance or similar sources.
We establish a collective allowance for all loans in our multifamily guaranty book of business that are not individually measured for impairment using an internal model that applies loss factors to loans in similar risk categories. Our loss factors are developed based on our historical default and loss severity experience. We identify multifamily loans for evaluation for impairment through a credit risk assessment process. If we determine that a multifamily loan is individually impaired, we generally measure impairment on that loan based on the fair value of the underlying collateral less estimated costs to sell the property, as we have concluded that such loans are collateral dependent. We evaluate collectively for impairment smaller-balance homogeneous multifamily loans.
|
Fannie Mae (In conservatorship) Third Quarter 2018 Form 10-Q
|
69
|
|
|
Notes to Condensed Consolidated Financial Statements | Allowance for Loan Losses
|
||
|
For the Three Months Ended September 30,
|
For the Nine Months Ended September 30,
|
||||||||||||||
|
2018
|
2017
|
2018
|
2017
|
||||||||||||
|
(Dollars in millions)
|
|||||||||||||||
|
Single-family allowance for loan losses:
|
|||||||||||||||
|
Beginning balance
|
$
|
(
|
)
|
$
|
(
|
)
|
$
|
(
|
)
|
$
|
(
|
)
|
|||
|
Benefit (provision) for loan losses
(1)
|
|
|
(
|
)
|
|
|
|
|
|||||||
|
Charge-offs
|
|
|
|
|
|
|
|
|
|||||||
|
Recoveries
|
(
|
)
|
(
|
)
|
(
|
)
|
(
|
)
|
|||||||
|
Other
(2)
|
(
|
)
|
|
|
(
|
)
|
(
|
)
|
|||||||
|
Ending balance
|
$
|
(
|
)
|
$
|
(
|
)
|
$
|
(
|
)
|
$
|
(
|
)
|
|||
|
Multifamily allowance for loan losses:
|
|||||||||||||||
|
Beginning balance
|
$
|
(
|
)
|
$
|
(
|
)
|
$
|
(
|
)
|
$
|
(
|
)
|
|||
|
Benefit (provision) for loan losses
(1)
|
(
|
)
|
(
|
)
|
|
|
(
|
)
|
|||||||
|
Charge-offs
|
|
|
|
|
|
|
|
|
|||||||
|
Recoveries
|
(
|
)
|
(
|
)
|
(
|
)
|
(
|
)
|
|||||||
|
Ending balance
|
$
|
(
|
)
|
$
|
(
|
)
|
$
|
(
|
)
|
$
|
(
|
)
|
|||
|
Total allowance for loan losses:
|
|||||||||||||||
|
Beginning balance
|
$
|
(
|
)
|
$
|
(
|
)
|
$
|
(
|
)
|
$
|
(
|
)
|
|||
|
Benefit (provision) for loan losses
(1)
|
|
|
(
|
)
|
|
|
|
|
|||||||
|
Charge-offs
|
|
|
|
|
|
|
|
|
|||||||
|
Recoveries
|
(
|
)
|
(
|
)
|
(
|
)
|
(
|
)
|
|||||||
|
Other
(2)
|
(
|
)
|
|
|
(
|
)
|
(
|
)
|
|||||||
|
Ending balance
|
$
|
(
|
)
|
$
|
(
|
)
|
$
|
(
|
)
|
$
|
(
|
)
|
|||
__________
|
(1)
|
Benefit (provision) for loan losses is included in “
Benefit (provision) for credit losses
” in our condensed consolidated statements of operations and comprehensive income.
|
|
(2)
|
|
|
Fannie Mae (In conservatorship) Third Quarter 2018 Form 10-Q
|
70
|
|
|
Notes to Condensed Consolidated Financial Statements | Allowance for Loan Losses
|
||
|
As of
|
|||||||||||||||||||||||
|
|
September 30, 2018
|
December 31, 2017
|
|||||||||||||||||||||
|
Single-Family
|
Multifamily
|
Total
|
Single-Family
|
Multifamily
|
Total
|
||||||||||||||||||
|
(Dollars in millions)
|
|||||||||||||||||||||||
|
Allowance for loan losses by segment:
|
|||||||||||||||||||||||
|
Individually impaired loans
(1)
|
$
|
(
|
)
|
$
|
(
|
)
|
$
|
(
|
)
|
$
|
(
|
)
|
$
|
(
|
)
|
$
|
(
|
)
|
|||||
|
Collectively reserved loans
|
(
|
)
|
(
|
)
|
(
|
)
|
(
|
)
|
(
|
)
|
(
|
)
|
|||||||||||
|
Total allowance for loan losses
|
$
|
(
|
)
|
$
|
(
|
)
|
$
|
(
|
)
|
$
|
(
|
)
|
$
|
(
|
)
|
$
|
(
|
)
|
|||||
|
Recorded investment in loans by segment:
|
|||||||||||||||||||||||
|
Individually impaired loans
(1)
|
$
|
|
|
$
|
|
|
$
|
|
|
$
|
|
|
$
|
|
|
$
|
|
|
|||||
|
Collectively reserved loans
|
|
|
|
|
|
|
|
|
|
|
|
|
|||||||||||
|
Total recorded investment in loans
|
$
|
|
|
$
|
|
|
$
|
|
|
$
|
|
|
$
|
|
|
$
|
|
|
|||||
__________
|
(1)
|
|
5
.
Investments in Securities
|
As of
|
|||||||||||
|
September 30, 2018
|
December 31, 2017
|
||||||||||
|
(Dollars in millions)
|
|||||||||||
|
Mortgage-related securities:
|
|||||||||||
|
Fannie Mae
(1)
|
$
|
|
|
$
|
|
|
|||||
|
Other agency
|
|
|
|
|
|||||||
|
Alt-A and subprime private-label securities
(1)
|
|
|
|
|
|||||||
|
Commercial mortgage-backed securities (“CMBS”)
|
|
|
|
|
|||||||
|
Mortgage revenue bonds
|
|
|
|
|
|||||||
|
Total mortgage-related securities
|
|
|
|
|
|||||||
|
Non-mortgage-related securities:
|
|||||||||||
|
U.S. Treasury securities
|
|
|
|
|
|||||||
|
Other securities
|
|
|
|
|
|||||||
|
Total non-mortgage-related securities
|
|
|
|
|
|||||||
|
Total trading securities
|
$
|
|
|
$
|
|
|
|||||
__________
|
(1)
|
|
|
Fannie Mae (In conservatorship) Third Quarter 2018 Form 10-Q
|
71
|
|
|
Notes to Condensed Consolidated Financial Statements | Investments in Securities
|
||
|
For the Three Months Ended September 30,
|
For the Nine Months Ended September 30,
|
||||||||||||||
|
2018
|
2017
|
2018
|
2017
|
||||||||||||
|
(Dollars in millions)
|
|||||||||||||||
|
Net trading gains (losses)
|
$
|
(
|
)
|
$
|
|
|
$
|
|
|
$
|
|
|
|||
|
Net trading gains (losses) recognized in the period related to securities still held at period end
|
(
|
)
|
|
|
|
|
|
|
|||||||
|
For the Three Months
|
For the Nine Months
|
||||||||||||||
|
Ended September 30,
|
Ended September 30,
|
||||||||||||||
|
2018
|
2017
|
2018
|
2017
|
||||||||||||
|
(Dollars in millions)
|
|||||||||||||||
|
Gross realized gains
|
$
|
|
|
$
|
|
|
$
|
|
|
$
|
|
|
|||
|
Total proceeds (excludes initial sale of securities from new portfolio securitizations)
|
|
|
|
|
|
|
|
|
|||||||
|
As of September 30, 2018
|
|||||||||||||||||||||
|
Total Amortized Cost
(1)
|
Gross Unrealized Gains
|
Gross Unrealized Losses
(2)
|
Total Fair Value
|
||||||||||||||||||
|
(Dollars in millions)
|
|||||||||||||||||||||
|
Fannie Mae
|
$
|
|
|
$
|
|
|
$
|
(
|
)
|
$
|
|
|
|||||||||
|
Other agency
|
|
|
|
|
|
|
|
|
|||||||||||||
|
Alt-A and subprime private-label securities
|
|
|
|
|
|
|
|
|
|||||||||||||
|
Mortgage revenue bonds
|
|
|
|
|
(
|
)
|
|
|
|||||||||||||
|
Other mortgage-related securities
|
|
|
|
|
|
|
|
|
|||||||||||||
|
Total
|
$
|
|
|
$
|
|
|
$
|
(
|
)
|
$
|
|
|
|||||||||
|
As of December 31, 2017
|
|||||||||||||||||||||
|
Total Amortized Cost
(1)
|
Gross Unrealized Gains
|
Gross Unrealized Losses
(2)
|
Total Fair Value
|
||||||||||||||||||
|
(Dollars in millions)
|
|||||||||||||||||||||
|
Fannie Mae
|
$
|
|
|
$
|
|
|
$
|
(
|
)
|
$
|
|
|
|||||||||
|
Other agency
|
|
|
|
|
|
|
|
|
|||||||||||||
|
Alt-A and subprime private-label securities
|
|
|
|
|
|
|
|
|
|||||||||||||
|
CMBS
|
|
|
|
|
|
|
|
|
|||||||||||||
|
Mortgage revenue bonds
|
|
|
|
|
(
|
)
|
|
|
|||||||||||||
|
Other mortgage-related securities
|
|
|
|
|
|
|
|
|
|||||||||||||
|
Total
|
$
|
|
|
$
|
|
|
$
|
(
|
)
|
$
|
|
|
|||||||||
|
Fannie Mae (In conservatorship) Third Quarter 2018 Form 10-Q
|
72
|
|
|
Notes to Condensed Consolidated Financial Statements | Investments in Securities
|
||
__________
|
(1)
|
Amortized cost consists of unpaid principal balance, unamortized premiums, discounts and other cost basis adjustments, as well as net other-than-temporary impairments (“OTTI”) recognized in “
Investment gains, net
” in our condensed consolidated statements of operations and comprehensive income.
|
|
(2)
|
|
|
As of September 30, 2018
|
|||||||||||||||||||
|
Less Than 12 Consecutive Months
|
12 Consecutive Months or Longer
|
||||||||||||||||||
|
Gross Unrealized Losses
|
Fair Value
|
Gross Unrealized Losses
|
Fair Value
|
||||||||||||||||
|
(Dollars in millions)
|
|||||||||||||||||||
|
Fannie Mae
|
$
|
(
|
)
|
$
|
|
|
$
|
(
|
)
|
$
|
|
|
|||||||
|
Mortgage revenue bonds
|
(
|
)
|
|
|
(
|
)
|
|
|
|||||||||||
|
Total
|
$
|
(
|
)
|
$
|
|
|
$
|
(
|
)
|
$
|
|
|
|||||||
|
As of December 31, 2017
|
|||||||||||||||||||
|
Less Than 12 Consecutive Months
|
12 Consecutive Months or Longer
|
||||||||||||||||||
|
Gross Unrealized Losses
|
Fair Value
|
Gross Unrealized Losses
|
Fair Value
|
||||||||||||||||
|
(Dollars in millions)
|
|||||||||||||||||||
|
Fannie Mae
|
$
|
(
|
)
|
$
|
|
|
$
|
(
|
)
|
$
|
|
|
|||||||
|
Mortgage revenue bonds
|
|
|
|
|
(
|
)
|
|
|
|||||||||||
|
Total
|
$
|
(
|
)
|
$
|
|
|
$
|
(
|
)
|
$
|
|
|
|||||||
The balance of the unrealized credit loss component of AFS debt securities held by us and recognized in our condensed consolidated statements of operations and comprehensive income was
$
718
million
,
$
733
million
and
$
1.1
billion
as of
September 30, 2018
,
June 30, 2018
and
December 31, 2017
, respectively. The decreases for the three and nine months ended
September 30, 2018
were primarily driven by securities no longer held in our portfolio at period end.
|
Fannie Mae (In conservatorship) Third Quarter 2018 Form 10-Q
|
73
|
|
|
Notes to Condensed Consolidated Financial Statements | Investments in Securities
|
||
|
|
As of September 30, 2018
|
||||||||||||||||||||||||||||||||||||||||||||||||
|
Total Amortized Cost
|
Total
Fair
Value
|
One Year or Less
|
After One Year Through Five Years
|
After Five Years Through Ten Years
|
After Ten Years
|
||||||||||||||||||||||||||||||||||||||||||||
|
Amortized Cost
|
Fair Value
|
Amortized Cost
|
Fair Value
|
Amortized Cost
|
Fair Value
|
Amortized Cost
|
Fair Value
|
||||||||||||||||||||||||||||||||||||||||||
|
|
(Dollars in millions)
|
||||||||||||||||||||||||||||||||||||||||||||||||
|
Fannie Mae
|
$
|
|
|
$
|
|
|
$
|
|
|
$
|
|
|
$
|
|
|
$
|
|
|
$
|
|
|
$
|
|
|
$
|
|
|
$
|
|
|
|||||||||||||||||||
|
Other agency
|
|
|
|
|
|
|
|
|
|
|
|
|
|
|
|
|
|
|
|
|
|||||||||||||||||||||||||||||
|
Alt-A and subprime private-label securities
|
|
|
|
|
|
|
|
|
|
|
|
|
|
|
|
|
|
|
|
|
|||||||||||||||||||||||||||||
|
Mortgage revenue bonds
|
|
|
|
|
|
|
|
|
|
|
|
|
|
|
|
|
|
|
|
|
|||||||||||||||||||||||||||||
|
Other mortgage-related securities
|
|
|
|
|
|
|
|
|
|
|
|
|
|
|
|
|
|
|
|
|
|||||||||||||||||||||||||||||
|
Total
|
$
|
|
|
$
|
|
|
$
|
|
|
$
|
|
|
$
|
|
|
$
|
|
|
$
|
|
|
$
|
|
|
$
|
|
|
$
|
|
|
|||||||||||||||||||
6
.
Financial Guarantees
|
As of
|
|||||||||||||||||||||||
|
September 30, 2018
|
December 31, 2017
|
||||||||||||||||||||||
|
Maximum Exposure
|
Guaranty Obligation
|
Maximum Recovery
(1)
|
Maximum Exposure
|
Guaranty Obligation
|
Maximum Recovery
(1)
|
||||||||||||||||||
|
(Dollars in millions)
|
|||||||||||||||||||||||
|
Unconsolidated Fannie Mae MBS
|
$
|
|
|
$
|
|
|
$
|
|
|
$
|
|
|
$
|
|
|
$
|
|
|
|||||
|
Other guaranty arrangements
(2)
|
|
|
|
|
|
|
|
|
|
|
|
|
|||||||||||
|
Total
|
$
|
|
|
$
|
|
|
$
|
|
|
$
|
|
|
$
|
|
|
$
|
|
|
|||||
__________
|
(1)
|
Recoverability of such credit enhancements and recourse is subject to, among other factors, our mortgage insurers’ and financial guarantors’ ability to meet their obligations to us. For information on our mortgage insurers and financial guarantors, see “Note 13, Concentrations of Credit Risk” in our
2017
Form 10-K and “
|
|
(2)
|
|
|
Fannie Mae (In conservatorship) Third Quarter 2018 Form 10-Q
|
74
|
|
|
Notes to Condensed Consolidated Financial Statements | Short-Term and Long-Term Debt
|
||
7
.
Short-Term and Long-Term Debt
|
As of
|
|||||||||||||
|
|
September 30, 2018
|
December 31, 2017
|
|||||||||||
|
Outstanding
|
Weighted- Average Interest Rate
(1)
|
Outstanding
|
Weighted- Average Interest Rate
(1)
|
||||||||||
|
(Dollars in millions)
|
|||||||||||||
|
Federal funds purchased and securities sold under agreements to repurchase
(2)
|
$
|
|
|
|
%
|
$
|
|
|
|
%
|
|||
|
Short-term debt of Fannie Mae
|
$
|
|
|
|
%
|
$
|
|
|
|
%
|
|||
|
Debt of consolidated trusts
|
|
|
|
|
|
|
|
|
|||||
|
Total short-term debt
|
$
|
|
|
|
%
|
$
|
|
|
|
%
|
|||
__________
|
(1)
|
|
|
(2)
|
Represents agreements to repurchase securities for a specified price, with repayment generally occurring on the following day.
|
Intraday Line of Credit
|
Fannie Mae (In conservatorship) Third Quarter 2018 Form 10-Q
|
75
|
|
|
Notes to Condensed Consolidated Financial Statements | Short-Term and Long-Term Debt
|
||
Long-term debt represents debt with an original contractual maturity of greater than one year.
The following table displays our outstanding long-term debt.
|
As of
|
|||||||||||||||||
|
September 30, 2018
|
December 31, 2017
|
||||||||||||||||
|
Maturities
|
Outstanding
|
Weighted- Average Interest Rate
(1)
|
Maturities
|
Outstanding
|
Weighted- Average Interest Rate
(1)
|
||||||||||||
|
(Dollars in millions)
|
|||||||||||||||||
|
Senior fixed:
|
|||||||||||||||||
|
Benchmark notes and bonds
|
2018 - 2030
|
$
|
|
|
|
%
|
2018 - 2030
|
$
|
|
|
|
%
|
|||||
|
Medium-term notes
(2)
|
2018 - 2026
|
|
|
|
|
2018 - 2026
|
|
|
|
|
|||||||
|
Other
(3)
|
2018 - 2038
|
|
|
|
|
2018 - 2038
|
|
|
|
|
|||||||
|
Total senior fixed
|
|
|
|
|
|
|
|
|
|||||||||
|
Senior floating:
|
|||||||||||||||||
|
Medium-term notes
(2)
|
2019 - 2020
|
|
|
|
|
2018 - 2020
|
|
|
|
|
|||||||
|
Connecticut Avenue Securities
(4)
|
2023 - 2031
|
|
|
|
|
2023 - 2030
|
|
|
|
|
|||||||
|
Other
(5)
|
2020 - 2037
|
|
|
|
|
2020 - 2037
|
|
|
|
|
|||||||
|
Total senior floating
|
|
|
|
|
|
|
|
|
|||||||||
|
Subordinated debentures
|
2019
|
|
|
|
|
2019
|
|
|
|
|
|||||||
|
Secured borrowings
(6)
|
2021 - 2022
|
|
|
|
|
2021 - 2022
|
|
|
|
|
|||||||
|
Total long-term debt of Fannie Mae
(7)
|
|
|
|
|
|
|
|
|
|||||||||
|
Debt of consolidated trusts
|
2018 - 2058
|
|
|
|
|
2018 - 2057
|
|
|
|
|
|||||||
|
Total long-term debt
|
$
|
|
|
|
%
|
$
|
|
|
|
%
|
|||||||
__________
|
(1)
|
Includes the effects of discounts, premiums and other cost basis adjustments.
|
|
(2)
|
Includes long-term debt with an original contractual maturity of greater than
|
|
(3)
|
Includes other long-term debt with an original contractual maturity of greater than
|
|
(4)
|
Credit risk-sharing securities that transfer a portion of the credit risk on specified pools of single-family mortgage loans to the investors in these securities, a portion of which is reported at fair value.
|
|
(5)
|
Consists of structured debt instruments that are reported at fair value.
|
|
(6)
|
Represents our remaining liability resulting from the transfer of financial assets from our condensed consolidated balance sheets that did not qualify as a sale under the accounting guidance for the transfer of financial instruments.
|
|
(7)
|
|
8
.
Derivative Instruments
We enter into various forms of credit risk sharing agreements, including credit risk transfer transactions, swap credit enhancements and mortgage insurance contracts, that we account for as derivatives. The majority of our credit-related derivatives are credit risk transfer transactions, whereby a portion of the credit risk associated with losses on a reference pool of mortgage loans is transferred to a third party.
|
Fannie Mae (In conservatorship) Third Quarter 2018 Form 10-Q
|
76
|
|
|
Notes to Condensed Consolidated Financial Statements | Derivative Instruments
|
||
We enter into forward purchase and sale commitments that lock in the future delivery of mortgage loans and mortgage-related securities at a fixed price or yield. Certain commitments to purchase mortgage loans and purchase or sell mortgage-related securities meet the criteria of a derivative. We typically settle the notional amount of our mortgage commitments that are accounted for as derivatives.
Notional and Fair Value Position of our Derivatives
|
As of September 30, 2018
|
As of December 31, 2017
|
||||||||||||||||||||||||||||||
|
Asset Derivatives
|
Liability Derivatives
|
Asset Derivatives
|
Liability Derivatives
|
||||||||||||||||||||||||||||
|
Notional Amount
|
Estimated Fair Value
|
Notional Amount
|
Estimated Fair Value
|
Notional Amount
|
Estimated Fair Value
|
Notional Amount
|
Estimated Fair Value
|
||||||||||||||||||||||||
|
(Dollars in millions)
|
|||||||||||||||||||||||||||||||
|
Risk management derivatives:
|
|||||||||||||||||||||||||||||||
|
Swaps:
|
|||||||||||||||||||||||||||||||
|
Pay-fixed
|
$
|
|
|
$
|
|
|
$
|
|
|
$
|
(
|
)
|
$
|
|
|
$
|
|
|
$
|
|
|
$
|
(
|
)
|
|||||||
|
Receive-fixed
|
|
|
|
|
|
|
(
|
)
|
|
|
|
|
|
|
(
|
)
|
|||||||||||||||
|
Basis
|
|
|
|
|
|
|
|
|
|
|
|
|
|
|
|
|
|||||||||||||||
|
Foreign currency
|
|
|
|
|
|
|
(
|
)
|
|
|
|
|
|
|
(
|
)
|
|||||||||||||||
|
Swaptions:
|
|||||||||||||||||||||||||||||||
|
Pay-fixed
|
|
|
|
|
|
|
(
|
)
|
|
|
|
|
|
|
(
|
)
|
|||||||||||||||
|
Receive-fixed
|
|
|
|
|
|
|
(
|
)
|
|
|
|
|
|
|
(
|
)
|
|||||||||||||||
|
Other
(1)
|
|
|
|
|
|
|
(
|
)
|
|
|
|
|
|
|
(
|
)
|
|||||||||||||||
|
Total gross risk management derivatives
|
|
|
|
|
|
|
(
|
)
|
|
|
|
|
|
|
(
|
)
|
|||||||||||||||
|
Accrued interest receivable (payable)
|
—
|
|
|
|
—
|
|
(
|
)
|
—
|
|
|
|
—
|
|
(
|
)
|
|||||||||||||||
|
Netting adjustment
(2)
|
—
|
|
(
|
)
|
—
|
|
|
|
—
|
|
(
|
)
|
—
|
|
|
|
|||||||||||||||
|
Total net risk management derivatives
|
$
|
|
|
$
|
|
|
$
|
|
|
$
|
(
|
)
|
$
|
|
|
$
|
|
|
$
|
|
|
$
|
(
|
)
|
|||||||
|
Mortgage commitment derivatives:
|
|||||||||||||||||||||||||||||||
|
Mortgage commitments to purchase whole loans
|
$
|
|
|
$
|
|
|
$
|
|
|
$
|
(
|
)
|
$
|
|
|
$
|
|
|
$
|
|
|
$
|
(
|
)
|
|||||||
|
Forward contracts to purchase mortgage-related securities
|
|
|
|
|
|
|
(
|
)
|
|
|
|
|
|
|
(
|
)
|
|||||||||||||||
|
Forward contracts to sell mortgage-related securities
|
|
|
|
|
|
|
(
|
)
|
|
|
|
|
|
|
(
|
)
|
|||||||||||||||
|
Total mortgage commitment derivatives
|
|
|
|
|
|
|
(
|
)
|
|
|
|
|
|
|
(
|
)
|
|||||||||||||||
|
Derivatives at fair value
|
$
|
|
|
$
|
|
|
$
|
|
|
$
|
(
|
)
|
$
|
|
|
$
|
|
|
$
|
|
|
$
|
(
|
)
|
|||||||
|
(1)
|
Includes credit risk transfer transactions, futures, swap credit enhancements and mortgage insurance contracts that we account for as derivatives.
|
|
(2)
|
|
|
Fannie Mae (In conservatorship) Third Quarter 2018 Form 10-Q
|
77
|
|
|
Notes to Condensed Consolidated Financial Statements | Derivative Instruments
|
||
|
For the Three Months
|
For the Nine Months
|
||||||||||||||
|
Ended September 30,
|
Ended September 30,
|
||||||||||||||
|
2018
|
2017
|
2018
|
2017
|
||||||||||||
|
(Dollars in millions)
|
|||||||||||||||
|
Risk management derivatives:
|
|||||||||||||||
|
Swaps:
|
|||||||||||||||
|
Pay-fixed
|
$
|
|
|
$
|
|
|
$
|
|
|
$
|
|
|
|||
|
Receive-fixed
|
(
|
)
|
(
|
)
|
(
|
)
|
|
|
|||||||
|
Basis
|
(
|
)
|
|
|
(
|
)
|
|
|
|||||||
|
Foreign currency
|
(
|
)
|
|
|
(
|
)
|
|
|
|||||||
|
Swaptions:
|
|||||||||||||||
|
Pay-fixed
|
|
|
(
|
)
|
|
|
(
|
)
|
|||||||
|
Receive-fixed
|
(
|
)
|
(
|
)
|
(
|
)
|
(
|
)
|
|||||||
|
Other
|
(
|
)
|
|
|
(
|
)
|
|
|
|||||||
|
Net accrual of periodic settlements
|
(
|
)
|
(
|
)
|
(
|
)
|
(
|
)
|
|||||||
|
Total risk management derivatives fair value gains (losses), net
|
|
|
(
|
)
|
|
|
(
|
)
|
|||||||
|
Mortgage commitment derivatives fair value gains (losses), net
|
|
|
(
|
)
|
|
|
(
|
)
|
|||||||
|
Total derivatives fair value gains (losses), net
|
$
|
|
|
$
|
(
|
)
|
$
|
|
|
$
|
(
|
)
|
|||
Our derivative counterparty credit exposure relates principally to interest rate derivative contracts. We are exposed to the risk that a counterparty in a derivative transaction will default on payments due to us, which may require us to seek a replacement derivative from a different counterparty. This replacement may be at a higher cost, or we may be unable to find a suitable replacement. We manage our derivative counterparty credit exposure relating to our risk management derivative transactions mainly through enforceable master netting arrangements, which allow us to net derivative assets and liabilities with the same counterparty or clearing organization and clearing member. For our OTC derivative transactions, we require counterparties to post collateral, which may include cash, U.S. Treasury securities, agency debt and agency mortgage-related securities.
|
Fannie Mae (In conservatorship) Third Quarter 2018 Form 10-Q
|
78
|
|
|
Notes to Condensed Consolidated Financial Statements | Segment Reporting
|
||
9
.
Segment Reporting
|
For the Three Months Ended September 30,
|
|||||||||||||||||||||||
|
2018
|
2017
|
||||||||||||||||||||||
|
Single-Family
|
Multifamily
|
Total
|
Single-Family
|
Multifamily
|
Total
|
||||||||||||||||||
|
(Dollars in millions)
|
|||||||||||||||||||||||
|
Net interest income
(1)
|
$
|
|
|
$
|
|
|
$
|
|
|
$
|
|
|
$
|
|
|
$
|
|
|
|||||
|
Fee and other income
(2)
|
|
|
|
|
|
|
|
|
|
|
|
|
|||||||||||
|
Net revenues
|
|
|
|
|
|
|
|
|
|
|
|
|
|||||||||||
|
Investment gains, net
(3)
|
|
|
|
|
|
|
|
|
|
|
|
|
|||||||||||
|
Fair value gains (losses), net
(4)
|
|
|
(
|
)
|
|
|
(
|
)
|
|
|
(
|
)
|
|||||||||||
|
Administrative expenses
|
(
|
)
|
(
|
)
|
(
|
)
|
(
|
)
|
(
|
)
|
(
|
)
|
|||||||||||
|
Credit-related income (expense)
(5)
|
|||||||||||||||||||||||
|
Benefit (provision) for credit losses
|
|
|
(
|
)
|
|
|
(
|
)
|
(
|
)
|
(
|
)
|
|||||||||||
|
Foreclosed property income (expense)
|
(
|
)
|
(
|
)
|
(
|
)
|
(
|
)
|
|
|
(
|
)
|
|||||||||||
|
Total credit-related income (expense)
|
|
|
(
|
)
|
|
|
(
|
)
|
(
|
)
|
(
|
)
|
|||||||||||
|
TCCA fees
(6)
|
(
|
)
|
—
|
|
(
|
)
|
(
|
)
|
—
|
|
(
|
)
|
|||||||||||
|
Other expenses, net
|
(
|
)
|
(
|
)
|
(
|
)
|
(
|
)
|
(
|
)
|
(
|
)
|
|||||||||||
|
Income before federal income taxes
|
|
|
|
|
|
|
|
|
|
|
|
|
|||||||||||
|
Provision for federal income taxes
|
(
|
)
|
(
|
)
|
(
|
)
|
(
|
)
|
(
|
)
|
(
|
)
|
|||||||||||
|
Net income
|
$
|
|
|
$
|
|
|
$
|
|
|
$
|
|
|
$
|
|
|
$
|
|
|
|||||
|
For the Nine Months Ended September 30,
|
|||||||||||||||||||||||
|
2018
|
2017
|
||||||||||||||||||||||
|
Single-Family
|
Multifamily
|
Total
|
Single-Family
|
Multifamily
|
Total
|
||||||||||||||||||
|
(Dollars in millions)
|
|||||||||||||||||||||||
|
Net interest income
(1)
|
$
|
|
|
$
|
|
|
$
|
|
|
$
|
|
|
$
|
|
|
$
|
|
|
|||||
|
Fee and other income
(2)
|
|
|
|
|
|
|
|
|
|
|
|
|
|||||||||||
|
Net revenues
|
|
|
|
|
|
|
|
|
|
|
|
|
|||||||||||
|
Investment gains, net
(3)
|
|
|
|
|
|
|
|
|
|
|
|
|
|||||||||||
|
Fair value gains (losses), net
(4)
|
|
|
(
|
)
|
|
|
(
|
)
|
(
|
)
|
(
|
)
|
|||||||||||
|
Administrative expenses
|
(
|
)
|
(
|
)
|
(
|
)
|
(
|
)
|
(
|
)
|
(
|
)
|
|||||||||||
|
Credit-related income (expense)
(5)
|
|||||||||||||||||||||||
|
Benefit (provision) for credit losses
|
|
|
|
|
|
|
|
|
(
|
)
|
|
|
|||||||||||
|
Foreclosed property income (expense)
|
(
|
)
|
(
|
)
|
(
|
)
|
(
|
)
|
|
|
(
|
)
|
|||||||||||
|
Total credit-related income (expense)
|
|
|
(
|
)
|
|
|
|
|
(
|
)
|
|
|
|||||||||||
|
TCCA fees
(6)
|
(
|
)
|
—
|
|
(
|
)
|
(
|
)
|
—
|
|
(
|
)
|
|||||||||||
|
Other expenses, net
|
(
|
)
|
(
|
)
|
(
|
)
|
(
|
)
|
(
|
)
|
(
|
)
|
|||||||||||
|
Income before federal income taxes
|
|
|
|
|
|
|
|
|
|
|
|
|
|||||||||||
|
Provision for federal income taxes
|
(
|
)
|
(
|
)
|
(
|
)
|
(
|
)
|
(
|
)
|
(
|
)
|
|||||||||||
|
Net income
|
$
|
|
|
$
|
|
|
$
|
|
|
$
|
|
|
$
|
|
|
$
|
|
|
|||||
|
Fannie Mae (In conservatorship) Third Quarter 2018 Form 10-Q
|
79
|
|
|
Notes to Condensed Consolidated Financial Statements | Segment Reporting
|
||
__________
|
(1)
|
Net interest income primarily consists of guaranty fees received as compensation for assuming and managing the credit risk on loans underlying Fannie Mae MBS held by third parties for the respective business segment, and the difference between the interest income earned on the respective business segment’s mortgage assets in our retained mortgage portfolio and the interest expense associated with the debt funding those assets. Revenues from single-family guaranty fees include revenues generated by the 10 basis point increase in guaranty fees pursuant to the TCCA, the incremental revenue from which is remitted to Treasury and not retained by us.
|
|
(2)
|
Single-Family fee and other income primarily consists of compensation for engaging in structured transactions and providing other lender services, and income resulting from settlement agreements resolving certain claims relating to private-label securities we purchased or that we have guaranteed. Multifamily fee and other income consists of fees associated with multifamily business activities, including yield maintenance income.
|
|
(3)
|
Investment gains and losses primarily consists of gains and losses on the sale of mortgage assets for the respective business segment.
|
|
(4)
|
Single-Family fair value gains and losses primarily consist of fair value gains and losses on risk management and mortgage commitment derivatives, trading securities and other financial instruments associated with our single-family total book of business. Multifamily fair value gains and losses primarily consist of fair value gains and losses on MBS commitment derivatives, trading securities and other financial instruments associated with our multifamily total book of business.
|
|
(5)
|
Credit-related income or expense is based on the guaranty book of business of the respective business segment and consists of the applicable segment’s benefit or provision for credit losses and foreclosed property expense on loans underlying the segment’s guaranty book of business.
|
|
(6)
|
|
10
.
Equity
|
For the Three Months Ended September 30,
|
For the Nine Months Ended September 30,
|
||||||||||||||
|
2018
|
2017
|
2018
|
2017
|
||||||||||||
|
(Dollars in millions)
|
|||||||||||||||
|
Net income
|
$
|
|
|
$
|
|
|
$
|
|
|
$
|
|
|
|||
|
Other comprehensive income (loss), net of tax effect:
|
|||||||||||||||
|
Changes in net unrealized gains (losses) on AFS securities (net of tax of $8 and $25, respectively, for the three months ended and net of tax of $22 and $36, respectively, for the nine months ended)
|
(
|
)
|
|
|
(
|
)
|
|
|
|||||||
|
Reclassification adjustment for gains on AFS securities and OTTI recognized in net income (net of tax of $1 and $12, respectively for the three months ended and net of tax of $71 and $63, respectively, for the nine months ended)
|
(
|
)
|
(
|
)
|
(
|
)
|
(
|
)
|
|||||||
|
Other
|
(
|
)
|
(
|
)
|
(
|
)
|
(
|
)
|
|||||||
|
Total other comprehensive income (loss)
|
(
|
)
|
|
|
(
|
)
|
(
|
)
|
|||||||
|
Total comprehensive income
|
$
|
|
|
$
|
|
|
$
|
|
|
$
|
|
|
|||
|
As of
|
|||||||||||
|
September 30,
|
December 31,
|
||||||||||
|
2018
|
2017
|
||||||||||
|
(Dollars in millions)
|
|||||||||||
|
Net unrealized gains on AFS securities for which we have not recorded OTTI
|
$
|
|
|
$
|
|
|
|||||
|
Net unrealized gains on AFS securities for which we have recorded OTTI
|
|
|
|
|
|||||||
|
Other
|
|
|
|
|
|||||||
|
Accumulated other comprehensive income
|
$
|
|
|
$
|
|
|
|||||
|
Fannie Mae (In conservatorship) Third Quarter 2018 Form 10-Q
|
80
|
|
|
Notes to Condensed Consolidated Financial Statements | Equity
|
||
|
For the Three Months Ended September 30,
|
For the Nine Months Ended September 30,
|
||||||||||||||||||||||||||||||||||||||||||||||
|
2018
|
2017
|
2018
|
2017
|
||||||||||||||||||||||||||||||||||||||||||||
|
AFS
(1)
|
Other
|
Total
|
AFS
(1)
|
Other
|
Total
|
AFS
(1)
|
Other
|
Total
|
AFS
(1)
|
Other
|
Total
|
||||||||||||||||||||||||||||||||||||
|
(Dollars in millions)
|
|||||||||||||||||||||||||||||||||||||||||||||||
|
Beginning balance
|
$
|
|
|
$
|
|
|
$
|
|
|
$
|
|
|
$
|
|
|
$
|
|
|
$
|
|
|
$
|
|
|
$
|
|
|
$
|
|
|
$
|
|
|
$
|
|
|
|||||||||||
|
Reclassification of accumulated other comprehensive income to retained earnings resulting from the enactment of the Tax Cuts and Jobs Act
(2)
|
|
|
|
|
|
|
|
|
|
|
|
|
|
|
|
|
|
|
|
|
|
|
|
|
|||||||||||||||||||||||
|
Other comprehensive income (loss) before reclassifications
|
(
|
)
|
|
|
(
|
)
|
|
|
|
|
|
|
(
|
)
|
|
|
(
|
)
|
|
|
|
|
|
|
|||||||||||||||||||||||
|
Amounts reclassified from other comprehensive income (loss)
|
(
|
)
|
(
|
)
|
(
|
)
|
(
|
)
|
(
|
)
|
(
|
)
|
(
|
)
|
(
|
)
|
(
|
)
|
(
|
)
|
(
|
)
|
(
|
)
|
|||||||||||||||||||||||
|
Net other comprehensive income (loss)
|
(
|
)
|
(
|
)
|
(
|
)
|
|
|
(
|
)
|
|
|
(
|
)
|
(
|
)
|
(
|
)
|
(
|
)
|
(
|
)
|
(
|
)
|
|||||||||||||||||||||||
|
Ending balance
|
$
|
|
|
$
|
|
|
$
|
|
|
$
|
|
|
$
|
|
|
$
|
|
|
$
|
|
|
$
|
|
|
$
|
|
|
$
|
|
|
$
|
|
|
$
|
|
|
|||||||||||
__________
|
(1)
|
The amounts reclassified from accumulated other comprehensive income represent the gain or loss recognized in earnings due to a sale of an AFS security or the recognition of a net impairment recognized in earnings, which are recorded in “
Investment gains, net
” in our condensed consolidated statements of operations and comprehensive income.
|
|
(2)
|
|
11
.
Concentrations of Credit Risk
One of the measures by which we gauge our performance risk under our guaranty is the delinquency status of the mortgage loans we hold in our retained mortgage portfolio, or in the case of mortgage-backed securities, the mortgage loans underlying the related securities.
For single-family loans, management monitors the serious delinquency rate, which is the percentage of single-family loans, based on number of loans, that are
90
days or more past due or in the foreclosure process, and loans that have higher risk characteristics, such as high mark-to-market LTV ratios.
For multifamily loans, management monitors the serious delinquency rate, which is the percentage of multifamily loans, based on unpaid principal balance, that are
60
days or more past due, and other loans that have higher risk characteristics, to determine our overall credit quality indicator. Higher risk characteristics include, but are not limited to, current debt service coverage ratio (“DSCR”) below
1.0
and high original LTV ratios. We stratify multifamily loans into different internal risk categories based on the credit risk inherent in each individual loan.
For single-family and multifamily loans, we use this information, in conjunction with housing market and economic conditions, to structure our pricing and our eligibility and underwriting criteria to reflect the current risk of loans with these higher-risk characteristics, and in some cases we decide to significantly reduce our participation in riskier loan product categories. Management also uses this data together with other credit risk measures to identify key trends that guide the development of our loss mitigation strategies.
|
Fannie Mae (In conservatorship) Third Quarter 2018 Form 10-Q
|
81
|
|
|
Notes to Condensed Consolidated Financial Statements | Concentrations of Credit Risk
|
||
|
As of
|
|||||||||||||||||
|
September 30, 2018
(1)
|
December 31, 2017
(1)
|
||||||||||||||||
|
30 Days Delinquent
|
60 Days Delinquent
|
Seriously Delinquent
(2)
|
30 Days Delinquent
|
60 Days Delinquent
|
Seriously Delinquent
(2)
|
||||||||||||
|
Percentage of single-family conventional guaranty book of business
(3)
|
|
%
|
|
%
|
|
%
|
|
%
|
|
%
|
|
%
|
|||||
|
Percentage of single-family conventional loans
(4)
|
|
|
|
|
|
|
|
|
|
|
|
|
|||||
|
As of
|
|||||||||||
|
September 30, 2018
(1)
|
December 31, 2017
(1)
|
||||||||||
|
Percentage of
Single-Family
Conventional
Guaranty Book of Business
(3)
|
Seriously Delinquent Rate
(2)
|
Percentage of
Single-Family
Conventional
Guaranty Book of Business
(3)
|
Seriously Delinquent Rate
(2)
|
||||||||
|
Estimated mark-to-market LTV ratio:
|
|||||||||||
|
Greater than 100%
|
|
%
|
|
%
|
|
%
|
|
%
|
|||
|
Geographical distribution:
|
|||||||||||
|
California
|
|
|
|
|
|
|
|
|
|||
|
Florida
|
|
|
|
|
|
|
|
|
|||
|
New Jersey
|
|
|
|
|
|
|
|
|
|||
|
New York
|
|
|
|
|
|
|
|
|
|||
|
All other states
|
|
|
|
|
|
|
|
|
|||
|
Product distribution:
|
|||||||||||
|
Alt-A
|
|
|
|
|
|
|
|
|
|||
|
Vintages:
|
|||||||||||
|
2004 and prior
|
|
|
|
|
|
|
|
|
|||
|
2005-2008
|
|
|
|
|
|
|
|
|
|||
|
2009-2018
|
|
|
|
|
|
|
|
|
|||
__________
|
(1)
|
Consists of the portion of our single-family conventional guaranty book of business for which we have detailed loan level information, which constituted approximately
|
|
(2)
|
Consists of single-family conventional loans that were
|
|
(3)
|
Calculated based on the aggregate unpaid principal balance of single-family conventional loans for each category divided by the aggregate unpaid principal balance of loans in our single-family conventional guaranty book of business.
|
|
(4)
|
|
|
Fannie Mae (In conservatorship) Third Quarter 2018 Form 10-Q
|
82
|
|
|
Notes to Condensed Consolidated Financial Statements | Concentrations of Credit Risk
|
||
|
As of
|
|||||||||||
|
September 30, 2018
(1)(2)
|
December 31, 2017
(1)(2)
|
||||||||||
|
30 Days Delinquent
|
Seriously Delinquent
(3)
|
30 Days Delinquent
|
Seriously Delinquent
(3)
|
||||||||
|
Percentage of multifamily guaranty book of business
|
|
%
|
|
%
|
|
%
|
|
%
|
|||
|
As of
|
|||||||||||
|
September 30, 2018
|
December 31, 2017
|
||||||||||
|
Percentage of Multifamily Guaranty Book of Business
(2)
|
Percentage Seriously Delinquent
(3)(4)
|
Percentage of Multifamily Guaranty Book of Business
(2)
|
Percentage Seriously Delinquent
(3)(4)
|
||||||||
|
Original LTV ratio:
|
|||||||||||
|
Greater than 80%
|
|
%
|
|
%
|
|
%
|
|
%
|
|||
|
Less than or equal to 80%
|
|
|
|
|
|
|
|
|
|||
|
Current DSCR below 1.0
(5)
|
|
|
|
|
|
|
|
|
|||
__________
|
(1)
|
Consists of the portion of our multifamily guaranty book of business for which we have detailed loan level information, which constituted approximately
|
|
(2)
|
Calculated based on the aggregate unpaid principal balance of multifamily loans for each category divided by the aggregate unpaid principal balance of loans in our multifamily guaranty book of business.
|
|
(3)
|
Consists of multifamily loans that were
|
|
(4)
|
Calculated based on the unpaid principal balance of multifamily loans that were seriously delinquent divided by the aggregate unpaid principal balance of multifamily loans for each category included in our multifamily guaranty book of business.
|
|
(5)
|
|
Mortgage Insurers.
Mortgage insurance “risk in force” refers to our maximum potential loss recovery under the applicable mortgage insurance policies in force and is generally based on the loan level insurance coverage percentage and, if applicable, any aggregate pool loss limit, as specified in the policy.
|
As of
|
|||||||||||
|
September 30, 2018
|
December 31, 2017
|
||||||||||
|
Risk in Force
|
Percentage of Single-Family Guaranty Book of Business
|
Risk in Force
|
Percentage of Single-Family Guaranty Book of Business
|
||||||||
|
(Dollars in millions)
|
|||||||||||
|
Mortgage insurance risk in force:
|
|||||||||||
|
Primary mortgage insurance
|
$
|
|
|
$
|
|
|
|||||
|
Pool mortgage insurance
|
|
|
|
|
|||||||
|
Total mortgage insurance risk in force
|
$
|
|
|
|
$
|
|
|
|
|||
|
Fannie Mae (In conservatorship) Third Quarter 2018 Form 10-Q
|
83
|
|
|
Notes to Condensed Consolidated Financial Statements | Concentrations of Credit Risk
|
||
|
Percentage of Total Risk in Force Mortgage Insurance Coverage
|
|||||
|
As of
|
|||||
|
September 30, 2018
|
December 31, 2017
|
||||
|
Counterparty:
(1)
|
|||||
|
Arch Capital Group Ltd.
|
|
%
|
|
%
|
|
|
Radian Guaranty, Inc.
|
|
|
|
|
|
|
Mortgage Guaranty Insurance Corp.
|
|
|
|
|
|
|
Genworth Mortgage Insurance Corp.
|
|
|
|
|
|
|
Essent Guaranty, Inc.
|
|
|
|
|
|
|
Others
|
|
|
|
|
|
|
Total
|
|
%
|
|
%
|
|
__________
|
(1)
|
|
Three
of our mortgage insurer counterparties that are currently not approved to write new business are in run-off: PMI Mortgage Insurance Co. (“PMI”), Triad Guaranty Insurance Corporation (“Triad”) and Republic Mortgage Insurance Company (”RMIC”). Entering run-off may close off a source of profits and liquidity that may have otherwise assisted a mortgage insurer in paying claims under insurance policies, and could also cause the quality and speed of its claims processing to deteriorate. These
three
mortgage insurers provided a combined
$
5.0
billion
, or
3
%
, of our risk in force mortgage insurance coverage of our single-family guaranty book of business as of
September 30, 2018
.
PMI and Triad have been paying only a portion of policyholder claims and deferring the remaining portion. PMI is currently paying
72.5
%
of claims under its mortgage insurance policies in cash and is deferring the remaining
27.5
%
, and Triad is currently paying
75
%
of claims in cash and deferring the remaining
25
%
. It is uncertain whether PMI or Triad will be permitted in the future to pay any remaining deferred policyholder claims and/or increase or decrease the amount of cash they pay on claims. RMIC is no longer deferring payments on policyholder claims and has paid us its previously outstanding deferred payment obligations as well as interest on those obligations; however, RMIC remains in run-off.
We have counterparty credit risk relating to the potential insolvency of, or non-performance by, mortgage insurers that insure single-family loans we purchase or guarantee. There is risk that these counterparties may fail to fulfill their obligations to pay our claims under insurance policies. If we determine that it is probable that we will not collect all of our claims from one or more of our mortgage insurer counterparties, it could increase our loss reserves, which could adversely affect our results of operations, liquidity, financial condition and net worth.
When we estimate the credit losses that are inherent in our mortgage loans and under the terms of our guaranty obligations we also consider the recoveries that we will receive on primary mortgage insurance, as mortgage insurance recoveries would reduce the severity of the loss associated with defaulted loans. We evaluate the financial condition of our mortgage insurer counterparties and adjust the contractually due recovery amounts to ensure that only probable losses as of the balance sheet date are included in our loss reserve estimate. As a result, if our assessment of one or more of our mortgage insurer counterparties’ ability to fulfill their respective obligations to us worsens, it could increase our loss reserves. As of
September 30, 2018
and
December 31, 2017
, the amount by which our estimated benefit from mortgage insurance reduced our loss reserves was
$
710
million
and
$
989
million
, respectively.
|
Fannie Mae (In conservatorship) Third Quarter 2018 Form 10-Q
|
84
|
|
|
Notes to Condensed Consolidated Financial Statements | Concentrations of Credit Risk
|
||
We had outstanding receivables of
$
768
million
recorded in “Other assets” in our condensed consolidated balance sheets as of
September 30, 2018
and
$
858
million
as of
December 31, 2017
related to amounts claimed on insured, defaulted loans excluding government-insured loans. Of this amount,
$
42
million
as of
September 30, 2018
and
$
75
million
as of
December 31, 2017
was due from our mortgage servicers or sellers. We assessed the total outstanding receivables for collectibility, and they are recorded net of a valuation allowance of
$
567
million
as of
September 30, 2018
and
$
593
million
as of
December 31, 2017
. The valuation allowance reduces our claim receivable to the amount considered probable of collection as of
September 30, 2018
and
December 31, 2017
.
Mortgage Servicers and Sellers.
Mortgage servicers collect mortgage and escrow payments from borrowers, pay taxes and insurance costs from escrow accounts, monitor and report delinquencies, and perform other required activities on our behalf. Our mortgage servicers and sellers may also be obligated to repurchase loans or foreclosed properties, reimburse us for losses or provide other remedies under certain circumstances, such as if it is determined that the mortgage loan did not meet our underwriting or eligibility requirements, if certain loan representations and warranties are violated or if mortgage insurers rescind coverage. However, under our revised representation and warranty framework, we no longer require repurchase for loans that have breaches of certain selling representations and warranties if they have met specified criteria for relief.
Our business with mortgage servicers is concentrated.
The table below displays the percentage of our single-family guaranty book of business serviced by our top five depository single-family mortgage servicers and top five non-depository single-family mortgage servicers, and identifies one servicer that serviced more than 10% of our single-family guaranty book of business based on unpaid principal balance.
|
Percentage of Single-Family Guaranty Book of Business
|
|||||
|
As of
|
|||||
|
September 30, 2018
|
December 31, 2017
|
||||
|
Wells Fargo Bank, N.A. (together with its affiliates)
|
|
%
|
|
%
|
|
|
Remaining top five depository servicers
|
|
|
|
|
|
|
Top five non-depository servicers
|
|
|
|
|
|
|
Total
|
|
%
|
|
%
|
|
|
Percentage of Multifamily Guaranty Book of Business
|
|||||
|
As of
|
|||||
|
September 30, 2018
|
December 31, 2017
|
||||
|
Wells Fargo Bank, N.A. (together with its affiliates)
|
|
%
|
|
%
|
|
|
Walker & Dunlop, LLC
|
|
|
|
|
|
|
Remaining top five servicers
|
|
|
|
|
|
|
Total
|
|
%
|
|
%
|
|
|
Fannie Mae (In conservatorship) Third Quarter 2018 Form 10-Q
|
85
|
|
|
Notes to Condensed Consolidated Financial Statements | Netting Arrangements
|
||
12
.
Netting Arrangements
We use master netting arrangements, which allow us to offset certain financial instruments and collateral with the same counterparty, to minimize counterparty credit exposure.
The tables below display information related to derivatives, securities purchased under agreements to resell or similar arrangements, and securities sold under agreements to repurchase or similar arrangements, which are subject to an enforceable master netting arrangement or similar agreement that are either offset or not offset in our condensed consolidated balance sheets.
|
As of September 30, 2018
|
|||||||||||||||||||||||||||||
|
Gross Amount Offset
(1)
|
Net Amount Presented in our Condensed Consolidated Balance Sheets
|
Amounts Not Offset in our Condensed Consolidated Balance Sheets
|
|||||||||||||||||||||||||||
|
Gross Amount
|
Financial Instruments
(2)
|
Collateral
(3)
|
Net Amount
|
||||||||||||||||||||||||||
|
(Dollars in millions)
|
|||||||||||||||||||||||||||||
|
Assets:
|
|||||||||||||||||||||||||||||
|
OTC risk management derivatives
|
$
|
|
|
$
|
(
|
)
|
$
|
|
|
$
|
|
|
$
|
|
|
$
|
|
|
|||||||||||
|
Cleared risk management derivatives
|
|
|
|
|
|
|
|
|
|
|
|
|
|||||||||||||||||
|
Mortgage commitment derivatives
|
|
|
|
|
|
|
(
|
)
|
(
|
)
|
|
|
|||||||||||||||||
|
Total derivative assets
|
|
|
(
|
)
|
|
|
(4)
|
(
|
)
|
(
|
)
|
|
|
||||||||||||||||
|
Securities purchased under agreements to resell or similar arrangements
(5)
|
|
|
|
|
|
|
|
|
(
|
)
|
|
|
|||||||||||||||||
|
Total assets
|
$
|
|
|
$
|
(
|
)
|
$
|
|
|
$
|
(
|
)
|
$
|
(
|
)
|
$
|
|
|
|||||||||||
|
Liabilities:
|
|||||||||||||||||||||||||||||
|
OTC risk management derivatives
|
$
|
(
|
)
|
$
|
|
|
$
|
(
|
)
|
$
|
|
|
$
|
|
|
$
|
(
|
)
|
|||||||||||
|
Cleared risk management derivatives
|
|
|
(
|
)
|
(
|
)
|
|
|
|
|
|
|
|||||||||||||||||
|
Mortgage commitment derivatives
|
(
|
)
|
|
|
(
|
)
|
|
|
|
|
(
|
)
|
|||||||||||||||||
|
Total derivative liabilities
|
(
|
)
|
|
|
(
|
)
|
(4)
|
|
|
|
|
(
|
)
|
||||||||||||||||
|
Securities sold under agreements to repurchase or similar arrangements
|
(
|
)
|
|
|
(
|
)
|
|
|
|
|
(
|
)
|
|||||||||||||||||
|
Total liabilities
|
$
|
(
|
)
|
$
|
|
|
$
|
(
|
)
|
$
|
|
|
$
|
|
|
$
|
(
|
)
|
|||||||||||
|
As of December 31, 2017
|
|||||||||||||||||||||||||||
|
Gross Amount Offset
(1)
|
Net Amount Presented in our Condensed Consolidated Balance Sheets
|
Amounts Not Offset in our Condensed Consolidated Balance Sheets
|
|||||||||||||||||||||||||
|
Gross Amount
|
Financial Instruments
(2)
|
Collateral
(3)
|
Net Amount
|
||||||||||||||||||||||||
|
(Dollars in millions)
|
|||||||||||||||||||||||||||
|
Assets:
|
|||||||||||||||||||||||||||
|
OTC risk management derivatives
|
$
|
|
|
$
|
(
|
)
|
$
|
|
|
$
|
|
|
$
|
|
|
$
|
|
|
|||||||||
|
Cleared risk management derivatives
|
|
|
(
|
)
|
|
|
|
|
|
|
|
|
|||||||||||||||
|
Mortgage commitment derivatives
|
|
|
|
|
|
|
(
|
)
|
(
|
)
|
|
|
|||||||||||||||
|
Total derivative assets
|
|
|
(
|
)
|
|
|
(4)
|
(
|
)
|
(
|
)
|
|
|
||||||||||||||
|
Securities purchased under agreements to resell or similar arrangements
(5)
|
|
|
|
|
|
|
|
|
(
|
)
|
|
|
|||||||||||||||
|
Total assets
|
$
|
|
|
$
|
(
|
)
|
$
|
|
|
$
|
(
|
)
|
$
|
(
|
)
|
$
|
|
|
|||||||||
|
Liabilities:
|
|||||||||||||||||||||||||||
|
OTC risk management derivatives
|
$
|
(
|
)
|
$
|
|
|
$
|
(
|
)
|
$
|
|
|
$
|
|
|
$
|
(
|
)
|
|||||||||
|
Cleared risk management derivatives
|
(
|
)
|
|
|
(
|
)
|
|
|
|
|
|
|
|||||||||||||||
|
Mortgage commitment derivatives
|
(
|
)
|
|
|
(
|
)
|
|
|
|
|
(
|
)
|
|||||||||||||||
|
Total derivative liabilities
|
(
|
)
|
|
|
(
|
)
|
(4)
|
|
|
|
|
(
|
)
|
||||||||||||||
|
Total liabilities
|
$
|
(
|
)
|
$
|
|
|
$
|
(
|
)
|
$
|
|
|
$
|
|
|
$
|
(
|
)
|
|||||||||
|
Fannie Mae (In conservatorship) Third Quarter 2018 Form 10-Q
|
86
|
|
|
Notes to Condensed Consolidated Financial Statements | Netting Arrangements
|
||
__________
|
(1)
|
Represents the effect of the right to offset under legally enforceable master netting arrangements to settle with the same counterparty on a net basis, including cash collateral posted and received and accrued interest.
|
|
(2)
|
Mortgage commitment derivative amounts reflect where we have recognized both an asset and a liability with the same counterparty under an enforceable master netting arrangement but we have not elected to offset the related amounts in our condensed consolidated balance sheets.
|
|
(3)
|
Represents collateral received or posted that has not been offset in our condensed consolidated balance sheets. Does not include collateral held or posted in excess of our exposure. The fair value of non-cash collateral we pledged was
$
|
|
(4)
|
Excludes derivative assets of
$
|
|
(5)
|
Includes
$
|
13
.
Fair Value
|
Fannie Mae (In conservatorship) Third Quarter 2018 Form 10-Q
|
87
|
|
|
Notes to Condensed Consolidated Financial Statements | Fair Value
|
||
Recurring Changes in Fair Value
|
Fair Value Measurements as of September 30, 2018
|
|||||||||||||||||||||||||||||
|
Quoted Prices in Active Markets for Identical Assets (Level 1)
|
Significant Other Observable Inputs
(Level 2)
|
Significant Unobservable Inputs
(Level 3)
|
Netting Adjustment
(1)
|
Estimated Fair Value
|
|||||||||||||||||||||||||
|
(Dollars in millions)
|
|||||||||||||||||||||||||||||
|
Recurring fair value measurements:
|
|||||||||||||||||||||||||||||
|
Assets:
|
|||||||||||||||||||||||||||||
|
Cash equivalents
(2)
|
$
|
|
|
$
|
|
|
$
|
|
|
$
|
—
|
|
$
|
|
|
||||||||||||||
|
Trading securities:
|
|||||||||||||||||||||||||||||
|
Mortgage-related securities:
|
|||||||||||||||||||||||||||||
|
Fannie Mae
|
|
|
|
|
|
|
—
|
|
|
|
|||||||||||||||||||
|
Other agency
|
|
|
|
|
|
|
—
|
|
|
|
|||||||||||||||||||
|
Alt-A and subprime private-label securities
|
|
|
|
|
|
|
—
|
|
|
|
|||||||||||||||||||
|
Mortgage revenue bonds
|
|
|
|
|
|
|
—
|
|
|
|
|||||||||||||||||||
|
Non-mortgage-related securities:
|
|||||||||||||||||||||||||||||
|
U.S. Treasury securities
|
|
|
|
|
|
|
—
|
|
|
|
|||||||||||||||||||
|
Other securities
|
|
|
|
|
|
|
—
|
|
|
|
|||||||||||||||||||
|
Total trading securities
|
|
|
|
|
|
|
—
|
|
|
|
|||||||||||||||||||
|
Available-for-sale securities:
|
|||||||||||||||||||||||||||||
|
Mortgage-related securities:
|
|||||||||||||||||||||||||||||
|
Fannie Mae
|
|
|
|
|
|
|
—
|
|
|
|
|||||||||||||||||||
|
Other agency
|
|
|
|
|
|
|
—
|
|
|
|
|||||||||||||||||||
|
Alt-A and subprime private-label securities
|
|
|
|
|
|
|
—
|
|
|
|
|||||||||||||||||||
|
Mortgage revenue bonds
|
|
|
|
|
|
|
—
|
|
|
|
|||||||||||||||||||
|
Other
|
|
|
|
|
|
|
—
|
|
|
|
|||||||||||||||||||
|
Total available-for-sale securities
|
|
|
|
|
|
|
—
|
|
|
|
|||||||||||||||||||
|
Mortgage loans
|
|
|
|
|
|
|
—
|
|
|
|
|||||||||||||||||||
|
Other assets:
|
|||||||||||||||||||||||||||||
|
Risk management derivatives:
|
|||||||||||||||||||||||||||||
|
Swaps
|
|
|
|
|
|
|
—
|
|
|
|
|||||||||||||||||||
|
Swaptions
|
|
|
|
|
|
|
—
|
|
|
|
|||||||||||||||||||
|
Other
|
|
|
|
|
|
|
—
|
|
|
|
|||||||||||||||||||
|
Netting adjustment
|
—
|
|
—
|
|
—
|
|
(
|
)
|
(
|
)
|
|||||||||||||||||||
|
Mortgage commitment derivatives
|
|
|
|
|
|
|
—
|
|
|
|
|||||||||||||||||||
|
Total other assets
|
|
|
|
|
|
|
(
|
)
|
|
|
|||||||||||||||||||
|
Total assets at fair value
|
$
|
|
|
$
|
|
|
$
|
|
|
$
|
(
|
)
|
$
|
|
|
||||||||||||||
|
Fannie Mae (In conservatorship) Third Quarter 2018 Form 10-Q
|
88
|
|
|
Notes to Condensed Consolidated Financial Statements | Fair Value
|
||
|
Fair Value Measurements as of September 30, 2018
|
|||||||||||||||||||||||||||||
|
Quoted Prices in Active Markets for Identical Assets (Level 1)
|
Significant Other Observable Inputs
(Level 2)
|
Significant Unobservable Inputs
(Level 3)
|
Netting Adjustment
(1)
|
Estimated Fair Value
|
|||||||||||||||||||||||||
|
|
(Dollars in millions)
|
||||||||||||||||||||||||||||
|
Liabilities:
|
|||||||||||||||||||||||||||||
|
Long-term debt:
|
|||||||||||||||||||||||||||||
|
Of Fannie Mae:
|
|||||||||||||||||||||||||||||
|
Senior floating
|
$
|
|
|
$
|
|
|
$
|
|
|
$
|
—
|
|
$
|
|
|
||||||||||||||
|
Total of Fannie Mae
|
|
|
|
|
|
|
—
|
|
|
|
|||||||||||||||||||
|
Of consolidated trusts
|
|
|
|
|
|
|
—
|
|
|
|
|||||||||||||||||||
|
Total long-term debt
|
|
|
|
|
|
|
—
|
|
|
|
|||||||||||||||||||
|
Other liabilities:
|
|||||||||||||||||||||||||||||
|
Risk management derivatives:
|
|||||||||||||||||||||||||||||
|
Swaps
|
|
|
|
|
|
|
—
|
|
|
|
|||||||||||||||||||
|
Swaptions
|
|
|
|
|
|
|
—
|
|
|
|
|||||||||||||||||||
|
Other
|
|
|
|
|
|
|
—
|
|
|
|
|||||||||||||||||||
|
Netting adjustment
|
—
|
|
—
|
|
—
|
|
(
|
)
|
(
|
)
|
|||||||||||||||||||
|
Mortgage commitment derivatives
|
|
|
|
|
|
|
—
|
|
|
|
|||||||||||||||||||
|
Total other liabilities
|
|
|
|
|
|
|
(
|
)
|
|
|
|||||||||||||||||||
|
Total liabilities at fair value
|
$
|
|
|
$
|
|
|
$
|
|
|
$
|
(
|
)
|
$
|
|
|
||||||||||||||
|
Fannie Mae (In conservatorship) Third Quarter 2018 Form 10-Q
|
89
|
|
|
Notes to Condensed Consolidated Financial Statements | Fair Value
|
||
|
Fair Value Measurements as of December 31, 2017
|
|||||||||||||||||||||||||||||
|
Quoted Prices in Active Markets for Identical Assets (Level 1)
|
Significant Other Observable Inputs
(Level 2)
|
Significant Unobservable Inputs
(Level 3)
|
Netting Adjustment
(1)
|
Estimated Fair Value
|
|||||||||||||||||||||||||
|
(Dollars in millions)
|
|||||||||||||||||||||||||||||
|
Recurring fair value measurements:
|
|||||||||||||||||||||||||||||
|
Assets:
|
|||||||||||||||||||||||||||||
|
Trading securities:
|
|||||||||||||||||||||||||||||
|
Mortgage-related securities:
|
|||||||||||||||||||||||||||||
|
Fannie Mae
|
$
|
|
|
$
|
|
|
$
|
|
|
$
|
—
|
|
$
|
|
|
||||||||||||||
|
Other agency
|
|
|
|
|
|
|
—
|
|
|
|
|||||||||||||||||||
|
Alt-A and subprime private-label securities
|
|
|
|
|
|
|
—
|
|
|
|
|||||||||||||||||||
|
CMBS
|
|
|
|
|
|
|
—
|
|
|
|
|||||||||||||||||||
|
Mortgage revenue bonds
|
|
|
|
|
|
|
—
|
|
|
|
|||||||||||||||||||
|
Non-mortgage-related securities:
|
|||||||||||||||||||||||||||||
|
U.S. Treasury securities
|
|
|
|
|
|
|
—
|
|
|
|
|||||||||||||||||||
|
Total trading securities
|
|
|
|
|
|
|
—
|
|
|
|
|||||||||||||||||||
|
Available-for-sale securities:
|
|||||||||||||||||||||||||||||
|
Mortgage-related securities:
|
|||||||||||||||||||||||||||||
|
Fannie Mae
|
|
|
|
|
|
|
—
|
|
|
|
|||||||||||||||||||
|
Other agency
|
|
|
|
|
|
|
—
|
|
|
|
|||||||||||||||||||
|
Alt-A and subprime private-label securities
|
|
|
|
|
|
|
—
|
|
|
|
|||||||||||||||||||
|
CMBS
|
|
|
|
|
|
|
—
|
|
|
|
|||||||||||||||||||
|
Mortgage revenue bonds
|
|
|
|
|
|
|
—
|
|
|
|
|||||||||||||||||||
|
Other
|
|
|
|
|
|
|
—
|
|
|
|
|||||||||||||||||||
|
Total available-for-sale securities
|
|
|
|
|
|
|
—
|
|
|
|
|||||||||||||||||||
|
Mortgage loans
|
|
|
|
|
|
|
—
|
|
|
|
|||||||||||||||||||
|
Other assets:
|
|||||||||||||||||||||||||||||
|
Risk management derivatives:
|
|||||||||||||||||||||||||||||
|
Swaps
|
|
|
|
|
|
|
—
|
|
|
|
|||||||||||||||||||
|
Swaptions
|
|
|
|
|
|
|
—
|
|
|
|
|||||||||||||||||||
|
Other
|
|
|
|
|
|
|
—
|
|
|
|
|||||||||||||||||||
|
Netting adjustment
|
—
|
|
—
|
|
—
|
|
(
|
)
|
(
|
)
|
|||||||||||||||||||
|
Mortgage commitment derivatives
|
|
|
|
|
|
|
—
|
|
|
|
|||||||||||||||||||
|
Total other assets
|
|
|
|
|
|
|
(
|
)
|
|
|
|||||||||||||||||||
|
Total assets at fair value
|
$
|
|
|
$
|
|
|
$
|
|
|
$
|
(
|
)
|
$
|
|
|
||||||||||||||
|
Fannie Mae (In conservatorship) Third Quarter 2018 Form 10-Q
|
90
|
|
|
Notes to Condensed Consolidated Financial Statements | Fair Value
|
||
|
Fair Value Measurements as of December 31, 2017
|
|||||||||||||||||||||||||||||
|
Quoted Prices in Active Markets for Identical Assets (Level 1)
|
Significant Other Observable Inputs
(Level 2)
|
Significant Unobservable Inputs
(Level 3)
|
Netting Adjustment
(1)
|
Estimated Fair Value
|
|||||||||||||||||||||||||
|
(Dollars in millions)
|
|||||||||||||||||||||||||||||
|
Liabilities:
|
|||||||||||||||||||||||||||||
|
Long-term debt:
|
|||||||||||||||||||||||||||||
|
Of Fannie Mae:
|
|||||||||||||||||||||||||||||
|
Senior floating
|
$
|
|
|
$
|
|
|
$
|
|
|
$
|
—
|
|
$
|
|
|
||||||||||||||
|
Total of Fannie Mae
|
|
|
|
|
|
|
—
|
|
|
|
|||||||||||||||||||
|
Of consolidated trusts
|
|
|
|
|
|
|
—
|
|
|
|
|||||||||||||||||||
|
Total long-term debt
|
|
|
|
|
|
|
—
|
|
|
|
|||||||||||||||||||
|
Other liabilities:
|
|||||||||||||||||||||||||||||
|
Risk management derivatives:
|
|||||||||||||||||||||||||||||
|
Swaps
|
|
|
|
|
|
|
—
|
|
|
|
|||||||||||||||||||
|
Swaptions
|
|
|
|
|
|
|
—
|
|
|
|
|||||||||||||||||||
|
Other
|
|
|
|
|
|
|
—
|
|
|
|
|||||||||||||||||||
|
Netting adjustment
|
—
|
|
—
|
|
—
|
|
(
|
)
|
(
|
)
|
|||||||||||||||||||
|
Mortgage commitment derivatives
|
|
|
|
|
|
|
—
|
|
|
|
|||||||||||||||||||
|
Total other liabilities
|
|
|
|
|
|
|
(
|
)
|
|
|
|||||||||||||||||||
|
Total liabilities at fair value
|
$
|
|
|
$
|
|
|
$
|
|
|
$
|
(
|
)
|
$
|
|
|
||||||||||||||
__________
|
(1)
|
Derivative contracts are reported on a gross basis by level. The netting adjustment represents the effect of the legal right to offset under legally enforceable master netting arrangements to settle with the same counterparty on a net basis, including cash collateral posted and received.
|
|
(2)
|
|
|
Fannie Mae (In conservatorship) Third Quarter 2018 Form 10-Q
|
91
|
|
|
Notes to Condensed Consolidated Financial Statements | Fair Value
|
||
|
Fair Value Measurements Using Significant Unobservable Inputs (Level 3)
|
|||||||||||||||||||||||||||||||||||||||||||||||
|
For the Three Months Ended September 30, 2018
|
|||||||||||||||||||||||||||||||||||||||||||||||
|
Net Unrealized Gains (Losses) Included in Net Income Related to Assets and Liabilities Still Held as of September 30,
2018
(5)(6)
|
|||||||||||||||||||||||||||||||||||||||||||||||
|
Total Gains (Losses)
(Realized/Unrealized)
|
|||||||||||||||||||||||||||||||||||||||||||||||
|
Balance, June 30, 2018
|
Included in Net Income
|
Included in Total Other Comprehensive
Income (Loss)
(1)
|
Purchases
|
Sales
|
Issues
(3)
|
Settlements
(3)
|
Transfers out of Level 3
|
Transfers into
Level 3
|
Balance, September 30, 2018
|
||||||||||||||||||||||||||||||||||||||
|
(Dollars in millions)
|
|||||||||||||||||||||||||||||||||||||||||||||||
|
Trading securities:
|
|||||||||||||||||||||||||||||||||||||||||||||||
|
Mortgage-related:
|
|||||||||||||||||||||||||||||||||||||||||||||||
|
Fannie Mae
|
$
|
|
|
$
|
(
|
)
|
$
|
|
|
$
|
|
|
$
|
|
|
$
|
|
|
$
|
|
|
$
|
|
|
$
|
|
|
$
|
|
|
$
|
|
|
||||||||||||||
|
Mortgage revenue bonds
|
|
|
|
|
|
|
|
|
|
|
|
|
|
|
|
|
|
|
|
|
|
|
|||||||||||||||||||||||||
|
Total trading securities
|
$
|
|
|
$
|
(
|
)
|
(6)(7)
|
$
|
|
|
$
|
|
|
$
|
|
|
$
|
|
|
$
|
|
|
$
|
|
|
$
|
|
|
$
|
|
|
$
|
|
|
|||||||||||||
|
Available-for-sale securities:
|
|||||||||||||||||||||||||||||||||||||||||||||||
|
Mortgage-related:
|
|||||||||||||||||||||||||||||||||||||||||||||||
|
Fannie Mae
|
$
|
|
|
$
|
|
|
$
|
(
|
)
|
$
|
|
|
$
|
|
|
$
|
|
|
$
|
(
|
)
|
$
|
|
|
$
|
|
|
$
|
|
|
$
|
|
|
||||||||||||||
|
Alt-A and subprime private-label securities
|
|
|
|
|
|
|
|
|
|
|
|
|
(
|
)
|
|
|
|
|
|
|
|
|
|||||||||||||||||||||||||
|
Mortgage revenue bonds
|
|
|
|
|
(
|
)
|
|
|
(
|
)
|
|
|
(
|
)
|
|
|
|
|
|
|
|
|
|||||||||||||||||||||||||
|
Other
|
|
|
|
|
(
|
)
|
|
|
|
|
|
|
(
|
)
|
|
|
|
|
|
|
|
|
|||||||||||||||||||||||||
|
Total available-for-sale securities
|
$
|
|
|
$
|
|
|
(7)(8)
|
$
|
(
|
)
|
$
|
|
|
$
|
(
|
)
|
$
|
|
|
$
|
(
|
)
|
$
|
|
|
$
|
|
|
$
|
|
|
$
|
|
|
|||||||||||||
|
Mortgage loans
|
$
|
|
|
$
|
|
|
(6)(7)
|
$
|
|
|
$
|
|
|
$
|
|
|
$
|
|
|
$
|
(
|
)
|
$
|
(
|
)
|
$
|
|
|
$
|
|
|
$
|
|
|
|||||||||||||
|
Net derivatives
|
|
|
(
|
)
|
(6)
|
|
|
|
|
|
|
|
|
(
|
)
|
|
|
|
|
|
|
(
|
)
|
||||||||||||||||||||||||
|
Long-term debt:
|
|||||||||||||||||||||||||||||||||||||||||||||||
|
Of Fannie Mae:
|
|||||||||||||||||||||||||||||||||||||||||||||||
|
Senior floating
|
$
|
(
|
)
|
$
|
|
|
$
|
|
|
$
|
|
|
$
|
|
|
$
|
|
|
$
|
|
|
$
|
|
|
$
|
|
|
$
|
(
|
)
|
$
|
|
|
||||||||||||||
|
Of consolidated trusts
|
(
|
)
|
|
|
|
|
|
|
|
|
|
|
|
|
|
|
(
|
)
|
(
|
)
|
|
|
|||||||||||||||||||||||||
|
Total long-term debt
|
$
|
(
|
)
|
$
|
|
|
(6)
|
$
|
|
|
$
|
|
|
$
|
|
|
$
|
|
|
$
|
|
|
$
|
|
|
$
|
(
|
)
|
$
|
(
|
)
|
$
|
|
|
|||||||||||||
|
Fannie Mae (In conservatorship) Third Quarter 2018 Form 10-Q
|
92
|
|
|
Notes to Condensed Consolidated Financial Statements | Fair Value
|
||
|
Fair Value Measurements Using Significant Unobservable Inputs (Level 3)
|
|||||||||||||||||||||||||||||||||||||||||||||||
|
For the Nine Months Ended September 30, 2018
|
|||||||||||||||||||||||||||||||||||||||||||||||
|
Net Unrealized Gains (Losses) Included in Net Income Related to Assets and Liabilities Still Held as of September 30,
2018
(5)(6)
|
|||||||||||||||||||||||||||||||||||||||||||||||
|
Total Gains (Losses)
(Realized/Unrealized)
|
|||||||||||||||||||||||||||||||||||||||||||||||
|
Balance, December 31, 2017
|
Included in Net Income
|
Included in Total Other Comprehensive
Income (Loss)
(1)
|
Purchases
(2)
|
Sales
(2)
|
Issues
(3)
|
Settlements
(3)
|
Transfers out of Level 3
(4)
|
Transfers into
Level 3
|
Balance, September 30, 2018
|
||||||||||||||||||||||||||||||||||||||
|
(Dollars in millions)
|
|||||||||||||||||||||||||||||||||||||||||||||||
|
Trading securities:
|
|||||||||||||||||||||||||||||||||||||||||||||||
|
Mortgage-related:
|
|||||||||||||||||||||||||||||||||||||||||||||||
|
Fannie Mae
|
$
|
|
|
$
|
|
|
$
|
|
|
$
|
|
|
$
|
(
|
)
|
$
|
|
|
$
|
|
|
$
|
|
|
$
|
|
|
$
|
|
|
$
|
|
|
||||||||||||||
|
Other agency
|
|
|
(
|
)
|
|
|
|
|
|
|
|
|
(
|
)
|
(
|
)
|
|
|
|
|
|
|
|||||||||||||||||||||||||
|
Alt-A and subprime private-label securities
|
|
|
(
|
)
|
|
|
|
|
|
|
|
|
(
|
)
|
(
|
)
|
|
|
|
|
|
|
|||||||||||||||||||||||||
|
Mortgage revenue bonds
|
|
|
|
|
|
|
|
|
|
|
|
|
|
|
|
|
|
|
|
|
|
|
|||||||||||||||||||||||||
|
Total trading securities
|
$
|
|
|
$
|
|
|
(6)(7)
|
$
|
|
|
$
|
|
|
$
|
(
|
)
|
$
|
|
|
$
|
(
|
)
|
$
|
(
|
)
|
$
|
|
|
$
|
|
|
$
|
|
|
|||||||||||||
|
Available-for-sale securities:
|
|||||||||||||||||||||||||||||||||||||||||||||||
|
Mortgage-related:
|
|||||||||||||||||||||||||||||||||||||||||||||||
|
Fannie Mae
|
$
|
|
|
$
|
|
|
$
|
(
|
)
|
$
|
|
|
$
|
|
|
$
|
|
|
$
|
(
|
)
|
$
|
|
|
$
|
|
|
$
|
|
|
$
|
|
|
||||||||||||||
|
Alt-A and subprime private-label securities
|
|
|
|
|
(
|
)
|
|
|
|
|
|
|
(
|
)
|
(
|
)
|
|
|
|
|
|
|
|||||||||||||||||||||||||
|
Mortgage revenue bonds
|
|
|
|
|
(
|
)
|
|
|
(
|
)
|
|
|
(
|
)
|
|
|
|
|
|
|
|
|
|||||||||||||||||||||||||
|
Other
|
|
|
|
|
|
|
|
|
|
|
|
|
(
|
)
|
|
|
|
|
|
|
|
|
|||||||||||||||||||||||||
|
Total available-for-sale securities
|
$
|
|
|
$
|
|
|
(7)(8)
|
$
|
(
|
)
|
$
|
|
|
$
|
(
|
)
|
$
|
|
|
$
|
(
|
)
|
$
|
(
|
)
|
$
|
|
|
$
|
|
|
$
|
|
|
|||||||||||||
|
Mortgage loans
|
$
|
|
|
$
|
|
|
(6)(7)
|
$
|
|
|
$
|
|
|
$
|
|
|
$
|
|
|
$
|
(
|
)
|
$
|
(
|
)
|
$
|
|
|
$
|
|
|
$
|
|
|
|||||||||||||
|
Net derivatives
|
|
|
(
|
)
|
(6)
|
|
|
|
|
|
|
|
|
|
|
|
|
|
|
|
|
(
|
)
|
||||||||||||||||||||||||
|
Long-term debt:
|
|||||||||||||||||||||||||||||||||||||||||||||||
|
Of Fannie Mae:
|
|||||||||||||||||||||||||||||||||||||||||||||||
|
Senior floating
|
$
|
(
|
)
|
$
|
|
|
$
|
|
|
$
|
|
|
$
|
|
|
$
|
|
|
$
|
|
|
$
|
|
|
$
|
|
|
$
|
(
|
)
|
$
|
|
|
||||||||||||||
|
Of consolidated trusts
|
(
|
)
|
|
|
|
|
|
|
|
|
|
|
|
|
|
|
(
|
)
|
(
|
)
|
(
|
)
|
|||||||||||||||||||||||||
|
Total long-term debt
|
$
|
(
|
)
|
$
|
|
|
(6)
|
$
|
|
|
$
|
|
|
$
|
|
|
$
|
|
|
$
|
|
|
$
|
|
|
$
|
(
|
)
|
$
|
(
|
)
|
$
|
|
|
|||||||||||||
|
Fannie Mae (In conservatorship) Third Quarter 2018 Form 10-Q
|
93
|
|
|
Notes to Condensed Consolidated Financial Statements | Fair Value
|
||
|
Fair Value Measurements Using Significant Unobservable Inputs (Level 3)
|
|||||||||||||||||||||||||||||||||||||||||||||||
|
For the Three Months Ended September 30, 2017
|
|||||||||||||||||||||||||||||||||||||||||||||||
|
Net Unrealized Gains (Losses) Included in Net Income Related to Assets and Liabilities Still Held as of September 30,
2017
(5)(6)
|
|||||||||||||||||||||||||||||||||||||||||||||||
|
Total Gains (Losses)
(Realized/Unrealized)
|
|||||||||||||||||||||||||||||||||||||||||||||||
|
Balance, June 30, 2017
|
Included in Net Income
|
Included in Total Other Comprehensive
Income (Loss)
(1)
|
Purchases
(2)
|
Sales
(2)
|
Issues
(3)
|
Settlements
(3)
|
Transfers out of Level 3
|
Transfers into
Level 3
(4)
|
Balance, September 30, 2017
|
||||||||||||||||||||||||||||||||||||||
|
(Dollars in millions)
|
|||||||||||||||||||||||||||||||||||||||||||||||
|
Trading securities:
|
|||||||||||||||||||||||||||||||||||||||||||||||
|
Mortgage-related:
|
|||||||||||||||||||||||||||||||||||||||||||||||
|
Fannie Mae
|
$
|
|
|
$
|
|
|
$
|
|
|
$
|
|
|
$
|
|
|
$
|
|
|
$
|
|
|
$
|
(
|
)
|
$
|
|
|
$
|
|
|
$
|
|
|
||||||||||||||
|
Alt-A and subprime private-label securities
|
|
|
(
|
)
|
|
|
|
|
|
|
|
|
(
|
)
|
|
|
|
|
|
|
(
|
)
|
|||||||||||||||||||||||||
|
Mortgage revenue bonds
|
|
|
|
|
|
|
|
|
|
|
|
|
|
|
|
|
|
|
|
|
|
|
|||||||||||||||||||||||||
|
Total trading securities
|
$
|
|
|
$
|
|
|
(6)(7)
|
$
|
|
|
$
|
|
|
$
|
|
|
$
|
|
|
$
|
(
|
)
|
$
|
(
|
)
|
$
|
|
|
$
|
|
|
$
|
|
|
|||||||||||||
|
Available-for-sale securities:
|
|||||||||||||||||||||||||||||||||||||||||||||||
|
Mortgage-related:
|
|||||||||||||||||||||||||||||||||||||||||||||||
|
Fannie Mae
|
$
|
|
|
$
|
|
|
$
|
|
|
$
|
|
|
$
|
|
|
$
|
|
|
$
|
(
|
)
|
$
|
(
|
)
|
$
|
|
|
$
|
|
|
$
|
|
|
||||||||||||||
|
Alt-A and subprime private-label securities
|
|
|
|
|
|
|
|
|
|
|
|
|
(
|
)
|
|
|
|
|
|
|
|
|
|||||||||||||||||||||||||
|
Mortgage revenue bonds
|
|
|
|
|
(
|
)
|
|
|
(
|
)
|
|
|
(
|
)
|
|
|
|
|
|
|
|
|
|||||||||||||||||||||||||
|
Other
|
|
|
|
|
|
|
|
|
|
|
|
|
(
|
)
|
|
|
|
|
|
|
|
|
|||||||||||||||||||||||||
|
Total available-for-sale securities
|
$
|
|
|
$
|
|
|
(7)(8)
|
$
|
|
|
$
|
|
|
$
|
(
|
)
|
$
|
|
|
$
|
(
|
)
|
$
|
(
|
)
|
$
|
|
|
$
|
|
|
$
|
|
|
|||||||||||||
|
Mortgage loans
|
$
|
|
|
$
|
|
|
(6)(7)
|
$
|
|
|
$
|
|
|
$
|
|
|
$
|
|
|
$
|
(
|
)
|
$
|
(
|
)
|
$
|
|
|
$
|
|
|
$
|
|
|
|||||||||||||
|
Net derivatives
|
|
|
|
|
(6)
|
|
|
|
|
|
|
|
|
(
|
)
|
|
|
(
|
)
|
|
|
(
|
)
|
||||||||||||||||||||||||
|
Long-term debt:
|
|||||||||||||||||||||||||||||||||||||||||||||||
|
Of Fannie Mae:
|
|||||||||||||||||||||||||||||||||||||||||||||||
|
Senior floating
|
$
|
(
|
)
|
$
|
(
|
)
|
$
|
|
|
$
|
|
|
$
|
|
|
$
|
|
|
$
|
|
|
$
|
|
|
$
|
|
|
$
|
(
|
)
|
$
|
(
|
)
|
||||||||||||||
|
Of consolidated trusts
|
(
|
)
|
(
|
)
|
|
|
|
|
|
|
|
|
|
|
|
|
(
|
)
|
(
|
)
|
(
|
)
|
|||||||||||||||||||||||||
|
Total long-term debt
|
$
|
(
|
)
|
$
|
(
|
)
|
(6)
|
$
|
|
|
$
|
|
|
$
|
|
|
$
|
|
|
$
|
|
|
$
|
|
|
$
|
(
|
)
|
$
|
(
|
)
|
$
|
(
|
)
|
|||||||||||||
|
Fannie Mae (In conservatorship) Third Quarter 2018 Form 10-Q
|
94
|
|
|
Notes to Condensed Consolidated Financial Statements | Fair Value
|
||
|
Fair Value Measurements Using Significant Unobservable Inputs (Level 3)
|
|||||||||||||||||||||||||||||||||||||||||||||||
|
For the Nine Months Ended September 30, 2017
|
|||||||||||||||||||||||||||||||||||||||||||||||
|
Net Unrealized Gains (Losses) Included in Net Income Related to Assets and Liabilities Still Held as of September 30,
2017
(5)(6)
|
|||||||||||||||||||||||||||||||||||||||||||||||
|
Total Gains (Losses)
(Realized/Unrealized)
|
|||||||||||||||||||||||||||||||||||||||||||||||
|
Balance, December 31, 2016
|
Included in Net Income
|
Included in Total Other Comprehensive
Income (Loss)
(1)
|
Purchases
(2)
|
Sales
(2)
|
Issues
(3)
|
Settlements
(3)
|
Transfers out of Level 3
|
Transfers into
Level 3
(4)
|
Balance, September 30, 2017
|
||||||||||||||||||||||||||||||||||||||
|
(Dollars in millions)
|
|||||||||||||||||||||||||||||||||||||||||||||||
|
Trading securities:
|
|||||||||||||||||||||||||||||||||||||||||||||||
|
Mortgage-related:
|
|||||||||||||||||||||||||||||||||||||||||||||||
|
Fannie Mae
|
$
|
|
|
$
|
|
|
$
|
|
|
$
|
|
|
$
|
|
|
$
|
|
|
$
|
(
|
)
|
$
|
(
|
)
|
$
|
|
|
$
|
|
|
$
|
|
|
||||||||||||||
|
Alt-A and subprime private-label securities
|
|
|
|
|
|
|
|
|
|
|
|
|
(
|
)
|
|
|
|
|
|
|
|
|
|||||||||||||||||||||||||
|
Mortgage revenue bonds
|
|
|
|
|
|
|
|
|
(
|
)
|
|
|
(
|
)
|
|
|
|
|
|
|
|
|
|||||||||||||||||||||||||
|
Total trading securities
|
$
|
|
|
$
|
|
|
(6)(7)
|
$
|
|
|
$
|
|
|
$
|
(
|
)
|
$
|
|
|
$
|
(
|
)
|
$
|
(
|
)
|
$
|
|
|
$
|
|
|
$
|
|
|
|||||||||||||
|
Available-for-sale securities:
|
|||||||||||||||||||||||||||||||||||||||||||||||
|
Mortgage-related:
|
|||||||||||||||||||||||||||||||||||||||||||||||
|
Fannie Mae
|
$
|
|
|
$
|
|
|
$
|
(
|
)
|
$
|
|
|
$
|
|
|
$
|
|
|
$
|
(
|
)
|
$
|
(
|
)
|
$
|
|
|
$
|
|
|
$
|
|
|
||||||||||||||
|
Other agency
|
|
|
|
|
|
|
|
|
(
|
)
|
|
|
|
|
(
|
)
|
|
|
|
|
|
|
|||||||||||||||||||||||||
|
Alt-A and subprime private-label securities
|
|
|
|
|
(
|
)
|
|
|
|
|
|
|
(
|
)
|
|
|
|
|
|
|
|
|
|||||||||||||||||||||||||
|
Mortgage revenue bonds
|
|
|
|
|
(
|
)
|
|
|
(
|
)
|
|
|
(
|
)
|
|
|
|
|
|
|
|
|
|||||||||||||||||||||||||
|
Other
|
|
|
|
|
(
|
)
|
|
|
|
|
|
|
(
|
)
|
|
|
|
|
|
|
|
|
|||||||||||||||||||||||||
|
Total available-for-sale securities
|
$
|
|
|
$
|
|
|
(7)(8)
|
$
|
(
|
)
|
$
|
|
|
$
|
(
|
)
|
$
|
|
|
$
|
(
|
)
|
$
|
(
|
)
|
$
|
|
|
$
|
|
|
$
|
|
|
|||||||||||||
|
Mortgage loans
|
$
|
|
|
$
|
|
|
(6)(7)
|
$
|
|
|
$
|
|
|
$
|
|
|
$
|
|
|
$
|
(
|
)
|
$
|
(
|
)
|
$
|
|
|
$
|
|
|
$
|
|
|
|||||||||||||
|
Net derivatives
|
|
|
|
|
(6)
|
|
|
|
|
|
|
|
|
(
|
)
|
|
|
(
|
)
|
|
|
|
|
||||||||||||||||||||||||
|
Long-term debt:
|
|||||||||||||||||||||||||||||||||||||||||||||||
|
Of Fannie Mae:
|
|||||||||||||||||||||||||||||||||||||||||||||||
|
Senior floating
|
$
|
(
|
)
|
$
|
(
|
)
|
$
|
|
|
$
|
|
|
$
|
|
|
$
|
|
|
$
|
|
|
$
|
|
|
$
|
|
|
$
|
(
|
)
|
$
|
(
|
)
|
||||||||||||||
|
Of consolidated trusts
|
(
|
)
|
(
|
)
|
|
|
|
|
|
|
(
|
)
|
|
|
|
|
(
|
)
|
(
|
)
|
(
|
)
|
|||||||||||||||||||||||||
|
Total long-term debt
|
$
|
(
|
)
|
$
|
(
|
)
|
(6)
|
$
|
|
|
$
|
|
|
$
|
|
|
$
|
(
|
)
|
$
|
|
|
$
|
|
|
$
|
(
|
)
|
$
|
(
|
)
|
$
|
(
|
)
|
|||||||||||||
__________
|
(1)
|
Gains (losses) included in other comprehensive income (loss) are included in “Changes in unrealized gains on AFS securities, net of reclassification adjustments and taxes” in our condensed consolidated statements of operations and comprehensive income.
|
|
(2)
|
Purchases and sales include activity related to the consolidation and deconsolidation of assets of securitization trusts. For the nine months ended September 30,
2018
, includes the dissolution of a Fannie Mae-wrapped private-label securities trust.
|
|
(3)
|
Issues and settlements include activity related to the consolidation and deconsolidation of liabilities of securitization trusts.
|
|
(4)
|
Transfers of long-term debt of consolidated trusts out of Level 3 during the first nine months of 2018 consisted of securities for which prices were available from multiple third-party vendors and demonstrated an increased and sustained level of observability over time. Transfers of Fannie Mae trading securities into Level 3 during the nine months ended September 30, 2017 consisted primarily of a Fannie Mae security backed by private-label mortgage-related securities. Prices for this security were based on inputs that were not readily available. Transfers of long-term debt of consolidated trusts into Level 3 during the first nine months of 2017 consisted of securities for which prices were estimated using inputs that were not readily available.
|
|
(5)
|
Amount represents temporary changes in fair value. Amortization, accretion and OTTI are not considered unrealized and are not included in this amount.
|
|
(6)
|
Gains (losses) are included in “
Fair value gains (losses), net
” in our condensed consolidated statements of operations and comprehensive income.
|
|
Fannie Mae (In conservatorship) Third Quarter 2018 Form 10-Q
|
95
|
|
|
Notes to Condensed Consolidated Financial Statements | Fair Value
|
||
|
(7)
|
Gains (losses) are included in “
Net interest income
” in our condensed consolidated statements of operations and comprehensive income.
|
|
(8)
|
|
|
Fair Value Measurements as of September 30, 2018
|
|||||||||||||||
|
Fair Value
|
Significant Valuation Techniques
|
Significant Unobservable Inputs
(1)
|
Range
(1)
|
Weighted - Average
(1)
|
|||||||||||
|
(Dollars in millions)
|
|||||||||||||||
|
Recurring fair value measurements:
|
|||||||||||||||
|
Trading securities:
|
|||||||||||||||
|
Mortgage-related securities:
|
|||||||||||||||
|
Agency
(2)
|
$
|
|
|
Various
|
|||||||||||
|
Mortgage revenue bonds
|
|
|
Various
|
||||||||||||
|
Total trading securities
|
$
|
|
|
||||||||||||
|
Available-for-sale securities:
|
|||||||||||||||
|
Mortgage-related securities:
|
|||||||||||||||
|
Agency
(2)
|
$
|
|
|
Single Vendor
|
|
|
|
|
|||||||
|
|
|
Various
|
|||||||||||||
|
Total Agency
|
|
|
|||||||||||||
|
Alt-A and subprime private-label securities
|
|
|
Various
|
||||||||||||
|
Mortgage revenue bonds
|
|
|
Single Vendor
|
Spreads (bps)
|
(
|
)
|
-
|
|
|
|
|||||
|
|
|
Various
|
|||||||||||||
|
Total mortgage revenue bonds
|
|
|
|||||||||||||
|
Other
|
|
|
Discounted Cash Flow
|
Default Rate (%)
|
|
|
|
||||||||
|
Prepayment Speed (%)
|
|
|
|
||||||||||||
|
Severity (%)
|
|
|
|
||||||||||||
|
Spreads (bps)
|
|
|
-
|
|
|
|
|||||||||
|
|
|
Various
|
|||||||||||||
|
Total other
|
|
|
|||||||||||||
|
Total available-for-sale securities
|
$
|
|
|
||||||||||||
|
Net derivatives
|
$
|
|
|
Dealer Mark
|
|||||||||||
|
|
|
Various
|
|||||||||||||
|
Total net derivatives
|
$
|
|
|
||||||||||||
|
Fannie Mae (In conservatorship) Third Quarter 2018 Form 10-Q
|
96
|
|
|
Notes to Condensed Consolidated Financial Statements | Fair Value
|
||
|
Fair Value Measurements as of December 31, 2017
|
||||||||||||||
|
Fair Value
|
Significant Valuation Techniques
|
Significant Unobservable Inputs
(1)
|
Range
(1)
|
Weighted - Average
(1)
|
||||||||||
|
(Dollars in millions)
|
||||||||||||||
|
Recurring fair value measurements:
|
||||||||||||||
|
Trading securities:
|
||||||||||||||
|
Mortgage-related securities:
|
||||||||||||||
|
Agency
(2)
|
$
|
|
|
Single Vendor
|
Prepayment Speed (%)
|
|
|
-
|
|
|
||||
|
Spreads (bps)
|
|
|
-
|
|
|
|||||||||
|
|
|
Various
|
||||||||||||
|
Total agency
|
|
|
||||||||||||
|
Alt-A and subprime private-label securities
|
|
|
Consensus
|
|||||||||||
|
|
|
Various
|
||||||||||||
|
Total Alt-A and subprime private-label securities
|
|
|
||||||||||||
|
Mortgage revenue bonds
|
|
|
Various
|
|||||||||||
|
Total trading securities
|
$
|
|
|
|||||||||||
|
Available-for-sale securities:
|
||||||||||||||
|
Mortgage-related securities:
|
||||||||||||||
|
Agency
(2)
|
$
|
|
|
Single Vendor
|
Prepayment Speed (%)
|
|
-
|
|
|
|||||
|
Spreads (bps)
|
|
|
-
|
|
|
|||||||||
|
|
|
Various
|
||||||||||||
|
Total agency
|
|
|
||||||||||||
|
Alt-A and subprime private-label securities
|
|
|
Various
|
|||||||||||
|
Mortgage revenue bonds
|
|
|
Single Vendor
|
Spreads (bps)
|
(
|
)
|
-
|
|
|
|||||
|
|
|
Various
|
||||||||||||
|
Total mortgage revenue bonds
|
|
|
||||||||||||
|
Other
|
|
|
Discounted Cash Flow
|
Prepayment Speed (%)
|
|
|
-
|
|
|
|||||
|
Severity (%)
|
|
|
-
|
|
|
|||||||||
|
Spreads (bps)
|
|
|
-
|
|
|
|||||||||
|
|
|
Various
|
||||||||||||
|
Total other
|
|
|
||||||||||||
|
Total available-for-sale securities
|
$
|
|
|
|||||||||||
|
Net derivatives
|
$
|
|
|
Dealer Mark
|
||||||||||
|
|
|
Various
|
||||||||||||
|
Total net derivatives
|
$
|
|
|
|||||||||||
_________
|
(1)
|
Valuation techniques for which no unobservable inputs are disclosed generally reflect the use of third-party pricing services or dealers, and the range of unobservable inputs applied by these sources is not readily available or cannot be reasonably estimated. Where we have disclosed unobservable inputs for consensus and single vendor techniques, those inputs are based on our validations performed at the security level using discounted cash flows. The prepayment speed used for trading agency securities and available-for-sale agency securities is the Public Securities Association prepayment speed, which can be greater than 100%. For all other securities, the Conditional Prepayment Rate is used as the prepayment speed, which can be between 0% and 100%.
|
|
(2)
|
Includes Fannie Mae and Freddie Mac securities.
|
|
Fannie Mae (In conservatorship) Third Quarter 2018 Form 10-Q
|
97
|
|
|
Notes to Condensed Consolidated Financial Statements | Fair Value
|
||
|
Fair Value Measurements
as of
|
|||||||||||||
|
Valuation Techniques
|
September 30, 2018
|
December 31, 2017
|
|||||||||||
|
(Dollars in millions)
|
|||||||||||||
|
Nonrecurring fair value measurements:
|
|||||||||||||
|
Mortgage loans held for sale, at lower of cost or fair value
|
Single Vendor
|
$
|
|
|
$
|
|
|
||||||
|
Consensus
|
|
|
|
|
|||||||||
|
Various
|
|
|
|
|
|||||||||
|
Total mortgage loans held for sale, at lower of cost or fair value
|
|
|
|
|
|||||||||
|
Single-family mortgage loans held for investment, at amortized cost
|
Internal Model
|
|
|
|
|
||||||||
|
Multifamily mortgage loans held for investment, at amortized cost
|
Asset Manager Estimate
|
|
|
|
|
||||||||
|
Various
|
|
|
|
|
|||||||||
|
Total multifamily mortgage loans held for investment, at amortized cost
|
|
|
|
|
|||||||||
|
Acquired property, net:
(1)
|
|||||||||||||
|
Single-family
|
Accepted Offers
|
|
|
|
|
||||||||
|
Appraisals
|
|
|
|
|
|||||||||
|
Walk Forwards
|
|
|
|
|
|||||||||
|
Internal Model
|
|
|
|
|
|||||||||
|
Various
|
|
|
|
|
|||||||||
|
Total single-family
|
|
|
|
|
|||||||||
|
Multifamily
|
Various
|
|
|
|
|
||||||||
|
Other assets
|
Various
|
|
|
|
|
||||||||
|
Total nonrecurring assets at fair value
|
$
|
|
|
$
|
|
|
|||||||
__________
|
(1)
|
|
|
Fannie Mae (In conservatorship) Third Quarter 2018 Form 10-Q
|
98
|
|
|
Notes to Condensed Consolidated Financial Statements | Fair Value
|
||
|
As of September 30, 2018
|
|||||||||||||||||||||||
|
Carrying
Value |
Quoted Prices in Active Markets for Identical Assets
(Level 1) |
Significant Other Observable Inputs
(Level 2) |
Significant Unobservable Inputs
(Level 3) |
Netting Adjustment
|
Estimated
Fair Value |
||||||||||||||||||
|
(Dollars in millions)
|
|||||||||||||||||||||||
|
Financial assets:
|
|||||||||||||||||||||||
|
Cash and cash equivalents and restricted cash
|
$
|
|
|
$
|
|
|
$
|
|
|
$
|
|
|
$
|
—
|
|
$
|
|
|
|||||
|
Federal funds sold and securities purchased under agreements to resell or similar arrangements
|
|
|
|
|
|
|
|
|
—
|
|
|
|
|||||||||||
|
Trading securities
|
|
|
|
|
|
|
|
|
—
|
|
|
|
|||||||||||
|
Available-for-sale securities
|
|
|
|
|
|
|
|
|
—
|
|
|
|
|||||||||||
|
Mortgage loans held for sale
|
|
|
|
|
|
|
|
|
—
|
|
|
|
|||||||||||
|
Mortgage loans held for investment, net of allowance for loan losses
|
|
|
|
|
|
|
|
|
—
|
|
|
|
|||||||||||
|
Advances to lenders
|
|
|
|
|
|
|
|
|
—
|
|
|
|
|||||||||||
|
Derivative assets at fair value
|
|
|
|
|
|
|
|
|
(
|
)
|
|
|
|||||||||||
|
Guaranty assets and buy-ups
|
|
|
|
|
|
|
|
|
—
|
|
|
|
|||||||||||
|
Total financial assets
|
$
|
|
|
$
|
|
|
$
|
|
|
$
|
|
|
$
|
(
|
)
|
$
|
|
|
|||||
|
Financial liabilities:
|
|||||||||||||||||||||||
|
Federal funds purchased and securities sold under agreements to repurchase
|
$
|
|
|
$
|
|
|
$
|
|
|
$
|
|
|
$
|
—
|
|
$
|
|
|
|||||
|
Short-term debt:
|
|||||||||||||||||||||||
|
Of Fannie Mae
|
|
|
|
|
|
|
|
|
—
|
|
|
|
|||||||||||
|
Of consolidated trusts
|
|
|
|
|
|
|
|
|
—
|
|
|
|
|||||||||||
|
Long-term debt:
|
|||||||||||||||||||||||
|
Of Fannie Mae
|
|
|
|
|
|
|
|
|
—
|
|
|
|
|||||||||||
|
Of consolidated trusts
|
|
|
|
|
|
|
|
|
—
|
|
|
|
|||||||||||
|
Derivative liabilities at fair value
|
|
|
|
|
|
|
|
|
(
|
)
|
|
|
|||||||||||
|
Guaranty obligations
|
|
|
|
|
|
|
|
|
—
|
|
|
|
|||||||||||
|
Total financial liabilities
|
$
|
|
|
$
|
|
|
$
|
|
|
$
|
|
|
$
|
(
|
)
|
$
|
|
|
|||||
|
Fannie Mae (In conservatorship) Third Quarter 2018 Form 10-Q
|
99
|
|
|
Notes to Condensed Consolidated Financial Statements | Fair Value
|
||
|
As of December 31, 2017
|
|||||||||||||||||||||||
|
Carrying
Value |
Quoted Prices in Active Markets for Identical Assets
(Level 1) |
Significant Other Observable Inputs
(Level 2) |
Significant Unobservable Inputs
(Level 3) |
Netting Adjustment
|
Estimated
Fair Value |
||||||||||||||||||
|
(Dollars in millions)
|
|||||||||||||||||||||||
|
Financial assets:
|
|||||||||||||||||||||||
|
Cash and cash equivalents and restricted cash
|
$
|
|
|
$
|
|
|
$
|
|
|
$
|
|
|
$
|
—
|
|
$
|
|
|
|||||
|
Federal funds sold and securities purchased under agreements to resell or similar arrangements
|
|
|
|
|
|
|
|
|
—
|
|
|
|
|||||||||||
|
Trading securities
|
|
|
|
|
|
|
|
|
—
|
|
|
|
|||||||||||
|
Available-for-sale securities
|
|
|
|
|
|
|
|
|
—
|
|
|
|
|||||||||||
|
Mortgage loans held for sale
|
|
|
|
|
|
|
|
|
—
|
|
|
|
|||||||||||
|
Mortgage loans held for investment, net of allowance for loan losses
|
|
|
|
|
|
|
|
|
—
|
|
|
|
|||||||||||
|
Advances to lenders
|
|
|
|
|
|
|
|
|
—
|
|
|
|
|||||||||||
|
Derivative assets at fair value
|
|
|
|
|
|
|
|
|
(
|
)
|
|
|
|||||||||||
|
Guaranty assets and buy-ups
|
|
|
|
|
|
|
|
|
—
|
|
|
|
|||||||||||
|
Total financial assets
|
$
|
|
|
$
|
|
|
$
|
|
|
$
|
|
|
$
|
(
|
)
|
$
|
|
|
|||||
|
Financial liabilities:
|
|||||||||||||||||||||||
|
Short-term debt:
|
|||||||||||||||||||||||
|
Of Fannie Mae
|
$
|
|
|
$
|
|
|
$
|
|
|
$
|
|
|
$
|
—
|
|
$
|
|
|
|||||
|
Of consolidated trusts
|
|
|
|
|
|
|
|
|
—
|
|
|
|
|||||||||||
|
Long-term debt:
|
|||||||||||||||||||||||
|
Of Fannie Mae
|
|
|
|
|
|
|
|
|
—
|
|
|
|
|||||||||||
|
Of consolidated trusts
|
|
|
|
|
|
|
|
|
—
|
|
|
|
|||||||||||
|
Derivative liabilities at fair value
|
|
|
|
|
|
|
|
|
(
|
)
|
|
|
|||||||||||
|
Guaranty obligations
|
|
|
|
|
|
|
|
|
—
|
|
|
|
|||||||||||
|
Total financial liabilities
|
$
|
|
|
$
|
|
|
$
|
|
|
$
|
|
|
$
|
(
|
)
|
$
|
|
|
|||||
We elected the fair value option for our credit risk sharing debt securities issued under our CAS series issued prior to January 1, 2016 and certain loans and debt that contain embedded derivatives that would otherwise require bifurcation. Under the fair value option, we elected to carry these instruments at fair value instead of bifurcating the embedded derivative from such instruments.
We elected the fair value option for all long-term structured debt instruments that are issued in response to specific investor demand and have interest rates that are based on a calculated index or formula and are economically hedged with derivatives at the time of issuance. By electing the fair value option for these instruments, we are able to eliminate the volatility in our results of operations that would otherwise result from the accounting asymmetry created by recording these structured debt instruments at cost while recording the related derivatives at fair value.
|
Fannie Mae (In conservatorship) Third Quarter 2018 Form 10-Q
|
100
|
|
|
Notes to Condensed Consolidated Financial Statements | Fair Value
|
||
|
As of
|
|||||||||||||||||||||||||||||||||||
|
September 30, 2018
|
December 31, 2017
|
||||||||||||||||||||||||||||||||||
|
Loans
(1)
|
Long-Term Debt of Fannie Mae
|
Long-Term Debt of Consolidated Trusts
|
Loans
(1)
|
Long-Term Debt of Fannie Mae
|
Long-Term Debt of Consolidated Trusts
|
||||||||||||||||||||||||||||||
|
(Dollars in millions)
|
|||||||||||||||||||||||||||||||||||
|
Fair value
|
$
|
|
|
$
|
|
|
$
|
|
|
$
|
|
|
$
|
|
|
$
|
|
|
|||||||||||||||||
|
Unpaid principal balance
|
|
|
|
|
|
|
|
|
|
|
|
|
|||||||||||||||||||||||
__________
|
(1)
|
|
Changes in Fair Value under the Fair Value Option Election
We recorded losses of
$
63
million
and
$
239
million
for the
three and nine
months ended
September 30, 2018
, respectively, and gains of
$
30
million
and
$
166
million
for the
three and nine
months ended
September 30, 2017
, respectively, from changes in the fair value of loans recorded at fair value in “Fair value gains (losses), net” in our condensed consolidated statements of operations and comprehensive income.
14
.
Commitments and Contingencies
We are party to various types of legal actions and proceedings, including actions brought on behalf of various classes of claimants. We also are subject to regulatory examinations, inquiries and investigations, and other information gathering requests. In some of the matters, indeterminate amounts are sought. Modern pleading practice in the U.S. permits considerable variation in the assertion of monetary damages or other relief. Jurisdictions may permit claimants not to specify the monetary damages sought or may permit claimants to state only that the amount sought is sufficient to invoke the jurisdiction of the trial court. This variability in pleadings, together with our and our counsel’s actual experience in litigating or settling claims, leads us to conclude that the monetary relief that may be sought by plaintiffs bears little relevance to the merits or disposition value of claims.
We have substantial and valid defenses to the claims in the proceedings described below and intend to defend these matters vigorously. However, legal actions and proceedings of all types are subject to many uncertain factors that generally cannot be predicted with assurance. Accordingly, the outcome of any given matter and the amount or range of potential loss at particular points in time is frequently difficult to ascertain. Uncertainties can include how fact finders will evaluate documentary evidence and the credibility and effectiveness of witness testimony, and how courts will apply the law. Disposition valuations are also subject to the uncertainty of how opposing parties and their counsel may view the evidence and applicable law.
|
Fannie Mae (In conservatorship) Third Quarter 2018 Form 10-Q
|
101
|
|
|
Notes to Condensed Consolidated Financial Statements | Commitments and Contingencies
|
||
In addition to the matters specifically described below, we are involved in a number of legal and regulatory proceedings that arise in the ordinary course of business that we do not expect will have a material impact on our business or financial condition. We have also advanced fees and expenses of certain current and former officers and directors in connection with various legal proceedings pursuant to our bylaws and indemnification agreements.
Senior Preferred Stock Purchase Agreements Litigation
A consolidated putative class action (“
In re Fannie Mae/Freddie Mac Senior Preferred Stock Purchase Agreement Class Action Litigations
”) and three non-class action lawsuits filed by Fannie Mae and Freddie Mac shareholders are pending in the U.S. District Court for the District of Columbia against us, FHFA as our conservator, and Freddie Mac that challenge the August 2012 amendment to each company’s senior preferred stock purchase agreement with Treasury.
In the consolidated class action and two of the non-class action suits,
Arrowood Indemnity Company v. Fannie Mae
and
Fairholme Funds v. FHFA,
plaintiffs filed amended complaints on November 1, 2017 alleging that the net worth sweep dividend provisions of the senior preferred stock that were implemented pursuant to the August 2012 amendments nullified certain of the shareholders’ rights, particularly the right to receive dividends. Plaintiffs seek unspecified damages, equitable and injunctive relief, and costs and expenses, including attorneys’ fees. Plaintiffs in the class action seek to represent several classes of preferred and/or common shareholders of Fannie Mae and/or Freddie Mac who held stock as of the public announcement of the August 2012 amendments. On September 28, 2018, the court dismissed all of the plaintiffs’ claims except for their claims for breach of an implied covenant of good faith and fair dealing. On October 15, 2018, defendants filed a motion for partial reconsideration.
On May 21, 2018, a
pro se
plaintiff in a third non-class action case,
Angel v. Federal Home Loan Mortgage Corporation,
filed a complaint for declaratory relief and compensatory damages against Fannie Mae (including certain members of its Board of Directors), Freddie Mac (including certain members of its Board of Directors) and FHFA, as conservator. Plaintiff in that case asserts claims for breach of contract, breach of implied covenants of good faith and fair dealing, and aiding and abetting the federal government in avoiding an alleged implicit guarantee of dividend payments. Defendants moved to dismiss the complaint on July 12, 2018.
|
Fannie Mae (In conservatorship) Third Quarter 2018 Form 10-Q
|
102
|
|
|
Quantitative and Qualitative Disclosures about Market Risk
|
||
Information about market risk is set forth in “MD&A—Risk Management—Market Risk Management, Including Interest Rate Risk Management.”
Overview
We are required under applicable laws and regulations to maintain controls and procedures, which include disclosure controls and procedures as well as internal control over financial reporting, as further described below.
Evaluation of Disclosure Controls and Procedures
Disclosure Controls and Procedures
Disclosure controls and procedures refer to controls and other procedures designed to provide reasonable assurance that information required to be disclosed in the reports we file or submit under the Exchange Act is recorded, processed, summarized and reported within the time periods specified in the rules and forms of the SEC. Disclosure controls and procedures include, without limitation, controls and procedures designed to provide reasonable assurance that information required to be disclosed by us in the reports that we file or submit under the Exchange Act is accumulated and communicated to management, including our Chief Executive Officer and Chief Financial Officer, as appropriate, to allow timely decisions regarding our required disclosure. In designing and evaluating our disclosure controls and procedures, management recognizes that any controls and procedures, no matter how well designed and operated, can provide only reasonable assurance of achieving the desired control objectives, and management was required to apply its judgment in evaluating and implementing possible controls and procedures.
Evaluation of Disclosure Controls and Procedures
As required by Rule 13a-15 under the Exchange Act, management has evaluated, with the participation of our Chief Executive Officer and Chief Financial Officer, the effectiveness of our disclosure controls and procedures as in effect as of
September 30, 2018
, the end of the period covered by this report. As a result of management’s evaluation, our Chief Executive Officer and Chief Financial Officer concluded that our disclosure controls and procedures were not effective at a reasonable assurance level as of
September 30, 2018
or as of the date of filing this report.
Our disclosure controls and procedures were not effective as of
September 30, 2018
or as of the date of filing this report because they did not adequately ensure the accumulation and communication to management of information known to FHFA that is needed to meet our disclosure obligations under the federal securities laws. As a result, we were not able to rely upon the disclosure controls and procedures that were in place as of
September 30, 2018
or as of the date of this filing, and we continue to have a material weakness in our internal control over financial reporting. This material weakness is described in more detail below under “Description of Material Weakness.” Based on discussions with FHFA and the structural nature of this material weakness, we do not expect to remediate this material weakness while we are under conservatorship.
Description of Material Weakness
The Public Company Accounting Oversight Board’s Auditing Standard 2201 defines a material weakness as a deficiency, or a combination of deficiencies, in internal control over financial reporting, such that there is a reasonable possibility that a material misstatement of the company’s annual or interim financial statements will not be prevented or detected on a timely basis.
Management has determined that we continued to have the following material weakness as of
September 30, 2018
and as of the date of filing this report:
|
•
|
Disclosure Controls and Procedures.
We have been under the conservatorship of FHFA since September 6, 2008. Under the GSE Act, FHFA is an independent agency that currently functions as both our conservator and our regulator with respect to our safety, soundness and mission. Because of the nature of the conservatorship under the GSE Act, which places us under the “control” of FHFA (as that term is defined by securities laws), some of the information that we may need to meet our disclosure obligations may be solely within the knowledge of FHFA. As our conservator, FHFA has the power to take actions
|
|
Fannie Mae Third Quarter 2018 Form 10-Q
|
103
|
|
|
Controls and Procedures
|
||
without our knowledge that could be material to our shareholders and other stakeholders, and could significantly affect our financial performance or our continued existence as an ongoing business. Although we and FHFA attempted to design and implement disclosure policies and procedures that would account for the conservatorship and accomplish the same objectives as a disclosure controls and procedures policy of a typical reporting company, there are inherent structural limitations on our ability to design, implement, test or operate effective disclosure controls and procedures. As both our regulator and our conservator under the GSE Act, FHFA is limited in its ability to design and implement a complete set of disclosure controls and procedures relating to Fannie Mae, particularly with respect to current reporting pursuant to Form 8-K. Similarly, as a regulated entity, we are limited in our ability to design, implement, operate and test the controls and procedures for which FHFA is responsible.
Due to these circumstances, we have not been able to update our disclosure controls and procedures in a manner that adequately ensures the accumulation and communication to management of information known to FHFA that is needed to meet our disclosure obligations under the federal securities laws, including disclosures affecting our condensed consolidated financial statements. As a result, we did not maintain effective controls and procedures designed to ensure complete and accurate disclosure as required by GAAP as of
September 30, 2018
or as of the date of filing this report. Based on discussions with FHFA and the structural nature of this weakness, we do not expect to remediate this material weakness while we are under conservatorship.
Mitigating Actions Related to Material Weakness
As described above under “Description of Material Weakness,” we continue to have a material weakness in our internal control over financial reporting relating to our disclosure controls and procedures. However, we and FHFA have engaged in the following practices intended to permit accumulation and communication to management of information needed to meet our disclosure obligations under the federal securities laws:
|
•
|
FHFA has established the Division of Conservatorship, which is intended to facilitate operation of the company with the oversight of the conservator.
|
|
•
|
We have provided drafts of our SEC filings to FHFA personnel for their review and comment prior to filing. We also have provided drafts of external press releases, statements and speeches to FHFA personnel for their review and comment prior to release.
|
|
•
|
FHFA personnel, including senior officials, have reviewed our SEC filings prior to filing, including this quarterly report on Form 10-Q for the quarter ended
September 30, 2018
(“Third Quarter
2018
Form 10-Q”), and engaged in discussions regarding issues associated with the information contained in those filings. Prior to filing our Third Quarter
2018
Form 10-Q, FHFA provided Fannie Mae management with a written acknowledgment that it had reviewed the Third Quarter
2018
Form 10-Q, and it was not aware of any material misstatements or omissions in the Third Quarter
2018
Form 10-Q and had no objection to our filing the Third Quarter
2018
Form 10-Q.
|
|
•
|
The Director of FHFA and our Chief Executive Officer have been in frequent communication and meet on a regular basis.
|
|
•
|
FHFA representatives attend meetings frequently with various groups within the company to enhance the flow of information and to provide oversight on a variety of matters, including accounting, credit and market risk management, external communications and legal matters.
|
|
•
|
Senior officials within FHFA’s Office of the Chief Accountant have met frequently with our senior finance executives regarding our accounting policies, practices and procedures.
|
Changes in Internal Control Over Financial Reporting
Management has evaluated, with the participation of our Chief Executive Officer and Chief Financial Officer, whether any changes in our internal control over financial reporting that occurred during our last fiscal quarter have materially affected, or are reasonably likely to materially affect, our internal control over financial reporting. There have been no changes in our internal control over financial reporting since
June 30, 2018
that management believes have materially affected, or are reasonably likely to materially affect, our internal control over financial reporting.
|
Fannie Mae Third Quarter 2018 Form 10-Q
|
104
|
|
|
Other Information
|
||
The information in this item supplements and updates information regarding certain legal proceedings set forth in “Legal Proceedings” in our
2017
Form 10-K, our First Quarter 2018 Form 10-Q and our Second Quarter 2018 Form 10-Q. We also provide information regarding material legal proceedings in “
Note 14, Commitments and Contingencies
,” which is incorporated herein by reference. In addition to the matters specifically described or incorporated by reference in this item, we are involved in a number of legal and regulatory proceedings that arise in the ordinary course of business that do not have a material impact on our business. Litigation claims and proceedings of all types are subject to many factors that generally cannot be predicted accurately.
We establish an accrual for legal claims only when a loss is probable and we can reasonably estimate the amount of such loss. The actual costs of resolving legal claims may be substantially higher or lower than the amounts accrued for those claims. If certain of these matters are determined against us, FHFA or Treasury, it could have a material adverse effect on our results of operations, liquidity and financial condition, including our net worth.
Senior Preferred Stock Purchase Agreements Litigation
Between June 2013 and August 2018, preferred and common stockholders of Fannie Mae and Freddie Mac filed lawsuits in multiple federal courts against one or more of the United States, Treasury and FHFA, challenging actions taken by the defendants relating to the senior preferred stock purchase agreements and the conservatorships of Fannie Mae and Freddie Mac. Some of these lawsuits also contain claims against Fannie Mae and Freddie Mac. The legal claims being advanced by one or more of these lawsuits include challenges to the net worth sweep dividend provisions of the senior preferred stock that were implemented pursuant to the August 2012 amendments to the agreements, the payment of dividends to Treasury under the net worth sweep dividend provisions, and FHFA’s decision to require Fannie Mae and Freddie Mac to draw funds from Treasury in order to pay dividends to Treasury prior to the August 2012 amendments. Some of the lawsuits also challenge the constitutionality of FHFA’s structure. The plaintiffs seek various forms of equitable and injunctive relief, including rescission of the August 2012 amendments, as well as damages. The cases that remain pending or were terminated after
June 30, 2018
are as follows:
District of Columbia.
Fannie Mae is a defendant in four cases pending in the U.S. District Court for the District of Columbia—a consolidated putative class action and three additional cases. On September 28, 2018, the court dismissed all of the plaintiffs’ claims in three of these cases (including the consolidated class action), except for their claims for breach of an implied covenant of good faith and fair dealing. In the fourth case, which was filed on May 21, 2018, defendants filed a motion to dismiss the case on July 12, 2018. All four cases are described in “
Note 14, Commitments and Contingencies
.”
Northern District of Iowa.
On March 27, 2017, the U.S. District Court for the Northern District of Iowa dismissed the case pending before it. On August 23, 2018, the U.S. Court of Appeals for the Eighth Circuit affirmed the district court’s judgment.
Southern District of Texas.
On May 22, 2017, the U.S. District Court for the Southern District of Texas dismissed the case pending before it. On July 16, 2018, the U.S Court of Appeals for the Fifth Circuit affirmed the dismissal of plaintiffs’ statutory claims seeking to invalidate the net worth sweep dividend provisions. Plaintiffs and FHFA filed petitions for rehearing en banc in August 2018.
Western District of Michigan.
On June 1, 2017, preferred and common stockholders of Fannie Mae and Freddie Mac filed a complaint for declaratory and injunctive relief against FHFA and Treasury in the U.S. District Court for the Western District of Michigan. The complaint asks the court to set aside the net worth sweep dividend provisions of the senior preferred stock purchase agreements. FHFA and Treasury moved to dismiss the case on September 8, 2017, and plaintiffs filed a motion for summary judgment on October 6, 2017.
District of Minnesota.
On June 22, 2017, preferred and common stockholders of Fannie Mae and Freddie Mac filed a complaint for declaratory and injunctive relief against FHFA and Treasury in the U.S. District Court for the District of Minnesota. The complaint asks the court to set aside the net worth sweep dividend provisions of the senior preferred stock purchase agreements. The court dismissed the case on July 6, 2018, and plaintiffs filed a notice of appeal with the U.S. Court of Appeals for the Eighth Circuit on July 10, 2018.
Eastern District of Pennsylvania
. On August 16, 2018, common stockholders of Fannie Mae and Freddie Mac filed a complaint for declaratory and injunctive relief against FHFA and Treasury in the U.S. District Court for the
|
Fannie Mae Third Quarter 2018 Form 10-Q
|
105
|
|
|
Other Information
|
||
Eastern District of Pennsylvania. The complaint asks the court to set aside the net worth sweep dividend provisions of the senior preferred stock purchase agreements.
U.S. Court of Federal Claims.
Fannie Mae is a nominal defendant in three actions filed against the United States in the U.S. Court of Federal Claims:
Fisher v. United States of America
, filed on December 2, 2013;
Rafter v. United States of America
, filed on August 14, 2014; and
Perry Capital LLC v. United States of America
, filed on August 15, 2018. Plaintiffs in these cases allege that the net worth sweep dividend provisions of the senior preferred stock that were implemented pursuant to the August 2012 amendment to the senior preferred stock purchase agreement constitute a taking of Fannie Mae’s property without just compensation in violation of the U.S. Constitution. The
Fisher
plaintiffs are pursuing this claim derivatively on behalf of Fannie Mae, while the
Rafter
and
Perry Capital
plaintiffs are pursing the claim both derivatively and directly against the United States. Plaintiffs in
Rafter
also allege direct and derivative breach of contract claims against the government. The
Perry Capital
plaintiffs allege similar breach of contract claims, as well as breach of fiduciary duty claims against the government. Plaintiffs in
Fisher
request just compensation to Fannie Mae in an unspecified amount. Plaintiffs in
Rafter
and
Perry Capital
seek just compensation for themselves on their direct claims and payment of damages to Fannie Mae on their derivative claims. The United States filed a motion to dismiss the
Fisher
and
Rafter
cases on August 1, 2018.
District of Delaware.
Fannie Mae is a nominal defendant in
Jacobs v. FHFA
,
filed on August 17, 2015 against FHFA and Treasury in the U.S. District Court for the District of Delaware. Plaintiffs allege that the net worth sweep dividend provisions of the senior preferred stock that were implemented pursuant to the August 2012 amendments to the agreements violate Delaware law. Plaintiffs are pursuing this claim derivatively on behalf of Fannie Mae and directly against the government. The court dismissed the case on November 27, 2017, and plaintiffs filed a notice of appeal with the U.S. Court of Appeals for the Third Circuit on December 22, 2017.
In addition to the information in this report, you should carefully consider the risks relating to our business that we identify in “Risk Factors” in our
2017
Form 10-K. This section supplements and updates that discussion. Please also refer to “MD&A—Risk Management” in this report and in our
2017
Form 10-K for more detailed descriptions of the primary risks to our business and how we seek to manage those risks.
The risks we face could materially adversely affect our business, results of operations, financial condition, liquidity and net worth, and could cause our actual results to differ materially from our past results or the results contemplated by forward-looking statements contained in this report. However, these are not the only risks we face. In addition to the risks we discuss below and in our
2017
Form 10-K, we face risks and uncertainties not currently known to us or that we currently believe are immaterial.
The Single Security Initiative may adversely affect our financial results and contribute to declines in the liquidity or market value of our MBS. The Single Security Initiative also increases our counterparty credit risk and operational risk.
In 2014, FHFA directed Fannie Mae and Freddie Mac to develop a single common mortgage-backed security that is fungible with then-outstanding Fannie Mae guaranteed mortgage pass-through certificates and Freddie Mac Participation Certificates (“Freddie Mac PCs”). The security to be developed will be known as a Uniform Mortgage-Backed Security or UMBS. The FHFA initiative to develop a UMBS (the “Single Security Initiative”) is intended to maximize liquidity for both Fannie Mae and Freddie Mac mortgage-backed securities in the “to-be-announced” or TBA market. In March 2018, FHFA announced that Fannie Mae and Freddie Mac will start issuing UMBS in place of their current offerings of TBA-eligible mortgage-backed securities on June 3, 2019. The new UMBS will be issued by Fannie Mae and Freddie Mac through their joint venture, Common Securitization Solutions, LLC (“CSS”), using the Common Securitization Platform (“CSP”).
Historically, Fannie Mae MBS have had a trading advantage over comparable Freddie Mac PCs. One of FHFA’s stated objectives for the Single Security Initiative is to reduce the costs to Freddie Mac and taxpayers that result from differences in liquidity of Fannie Mae MBS and Freddie Mac PCs. As the implementation date of the Single Security Initiative approaches, some Fannie Mae MBS and comparable Freddie Mac PCs are trading closer to or at parity. If this trend continues, it could adversely affect our financial results.
It is also possible that uncertainty surrounding the implementation and overall impact of the Single Security Initiative could contribute to declines in the liquidity or market value of our Fannie Mae MBS.
The industry has expressed concerns that Fannie Mae and Freddie Mac UMBS may not be truly fungible. If investors do not accept
|
Fannie Mae Third Quarter 2018 Form 10-Q
|
106
|
|
|
Other Information
|
||
the fungibility of Fannie Mae and Freddie Mac UMBS or if investors prefer Freddie Mac UMBS over Fannie Mae UMBS, it could have a significant adverse impact on our business, liquidity, financial condition, net worth and results of operations, and could adversely affect the liquidity or market value of our MBS.
The Single Security Initiative will also result in our credit and operational exposure to Freddie Mac. Once the initiative is implemented, investors will be able to commingle Fannie Mae UMBS and Freddie Mac UMBS in resecuritizations. When we resecuritize Freddie Mac UMBS, our guaranty of principal and interest would extend to the underlying Freddie Mac UMBS. Accordingly, in the event Freddie Mac were to fail (for credit or operational reasons) to make a payment on Freddie Mac UMBS that we resecuritized, we would be responsible for making the entire payment on the related Fannie Mae UMBS in order for any of our certificates to be paid. We do not intend to limit the amount of resecuritized Freddie Mac UMBS that we guarantee and we do not intend to modify our liquidity strategies to address this increased risk. As a result, we could be dependent on Freddie Mac and on the senior preferred stock purchase agreements that we and Freddie Mac each have with Treasury to avoid a liquidity event or a default under our guaranty. See “Risk Factors” in our 2017 Form 10-K for a discussion of other operational risks associated with our implementation of the Single Security Initiative and related internal infrastructure upgrades.
Once we begin issuing UMBS, we plan to begin using CSS and the CSP to perform certain operational functions associated with issuing and managing these UMBS on our behalf. Accordingly, we will be reliant on CSS and the CSP for the operation of many of our securitization activities. Our business activities could be adversely affected and the market for Fannie Mae MBS could be disrupted if the CSP were to fail or otherwise become unavailable to us or if CSS were unable to perform its obligations to us. Any such failure or unavailability could have a significant adverse impact on our business, liquidity, financial condition, net worth and results of operations, and could adversely affect the liquidity or market value of our MBS.
Recent Sales of Unregistered Securities
Under the terms of our senior preferred stock purchase agreement with Treasury, we are prohibited from selling or issuing our equity interests, other than as required by (and pursuant to) the terms of a binding agreement in effect on September 7, 2008, without the prior written consent of Treasury. During the quarter ended
September 30, 2018
, we did not sell any equity securities.
Information about Certain Securities Issuances by Fannie Mae
Pursuant to SEC regulations, public companies are required to disclose certain information when they incur a material direct financial obligation or become directly or contingently liable for a material obligation under an off-balance sheet arrangement. The disclosure must be made in a current report on Form 8-K under Item 2.03 or, if the obligation is incurred in connection with certain types of securities offerings, in prospectuses for that offering that are filed with the SEC.
Because the securities we issue are exempted securities under the Securities Act of 1933, we do not file registration statements or prospectuses with the SEC with respect to our securities offerings. To comply with the disclosure requirements of Form 8-K relating to the incurrence of material financial obligations, we report our incurrence of these types of obligations either in offering circulars or prospectuses (or supplements thereto) that we post on our website or in a current report on Form 8-K that we file with the SEC, in accordance with a “no-action” letter we received from the SEC staff in 2004. In cases where the information is disclosed in a prospectus or offering circular posted on our website, the document will be posted on our website within the same time period that a prospectus for a non-exempt securities offering would be required to be filed with the SEC.
The website address for disclosure about our debt securities is www.fanniemae.com/debtsearch. From this address, investors can access the offering circular and related supplements for debt securities offerings under Fannie Mae’s universal debt facility, including pricing supplements for individual issuances of debt securities.
Disclosure about our obligations pursuant to some of the MBS we issue, some of which may be off-balance sheet obligations, can be found at www.fanniemae.com/mbsdisclosure. From this address, investors can access information and documents about our MBS, including prospectuses and related prospectus supplements.
We are providing our website address solely for your information. Information appearing on our website is not incorporated into this report.
|
Fannie Mae Third Quarter 2018 Form 10-Q
|
107
|
|
|
Other Information
|
||
Our Purchases of Equity Securities
We did not repurchase any of our equity securities during the
third
quarter of
2018
.
Dividend Restrictions
Our payment of dividends is subject to the following restrictions:
Restrictions Relating to Conservatorship.
Our conservator announced on September 7, 2008 that we would not pay any dividends on the common stock or on any series of preferred stock, other than the senior preferred stock. In addition, FHFA’s regulations relating to conservatorship and receivership operations prohibit us from paying any dividends while in conservatorship unless authorized by the Director of FHFA. The Director of FHFA has directed us to make dividend payments on the senior preferred stock on a quarterly basis for every dividend period for which dividends were payable.
Restrictions Under Senior Preferred Stock Purchase Agreement and Senior Preferred Stock.
The senior preferred stock purchase agreement prohibits us from declaring or paying any dividends on Fannie Mae equity securities (other than the senior preferred stock) without the prior written consent of Treasury. In addition, pursuant to the dividend provisions of the senior preferred stock and quarterly directives from our conservator, we are obligated to pay Treasury each quarter any dividends declared consisting of the amount, if any, by which our net worth as of the end of the immediately preceding fiscal quarter exceeds $3.0 billion. As a result, our net income is not available to common stockholders. For more information on the terms of the senior preferred stock purchase agreement and senior preferred stock, see “Business—Conservatorship and Treasury Agreements—Treasury Agreements” in our
2017
Form 10-K.
Additional Restrictions Relating to Preferred Stock.
Payment of dividends on our common stock is also subject to the prior payment of dividends on our preferred stock and our senior preferred stock. Payment of dividends on all outstanding preferred stock, other than the senior preferred stock, is also subject to the prior payment of dividends on the senior preferred stock.
Statutory Restrictions.
Under the GSE Act, FHFA has authority to prohibit capital distributions, including payment of dividends, if we fail to meet our capital requirements. If FHFA classifies us as significantly undercapitalized, approval of the Director of FHFA is required for any dividend payment. Under the Charter Act and the GSE Act, we are not permitted to make a capital distribution if, after making the distribution, we would be undercapitalized. The Director of FHFA, however, may permit us to repurchase shares if the repurchase is made in connection with the issuance of additional shares or obligations in at least an equivalent amount and will reduce our financial obligations or otherwise improve our financial condition.
None.
None.
On October 31, 2018, FHFA approved an increase in the annual target direct compensation of Celeste M.
Brown
, Executive Vice President and Chief Financial Officer of Fannie Mae, to reflect her August 2018 promotion from Senior Vice President and Deputy Chief Financial Officer to Executive Vice President and Chief Financial Officer. The increase will be in two steps:
|
•
|
Effective November 11, 2018, her total annual target direct compensation will increase to $2,300,000; consisting of
base
salary of $550,000, fixed deferred salary of $1,060,000, and at-risk deferred salary of $690,000. This increase in Ms. Brown’s compensation will be prorated for 2018 based on the effective date of the increase.
|
|
•
|
Effective August 4, 2019, her total annual target direct compensation will increase to $3,000,000;
consisting
of base salary of $600,000, fixed deferred salary of $1,500,000, and at-risk deferred salary of $900,000. This increase in Ms. Brown’s compensation will be prorated for 2019 based on the effective date of the increase.
|
|
Fannie Mae Third Quarter 2018 Form 10-Q
|
108
|
|
|
Other Information
|
||
For a
description
of the principal elements of Fannie Mae’s executive compensation program for its named executives, see “Executive Compensation—Compensation Discussion and Analysis—Chief Executive Officer Compensation and 2017 Executive Compensation Program—Elements of 2017 Executive Compensation Program” in our 2017 Form 10-K.
The exhibits listed below are being filed with or incorporated by reference into this report.
|
Item
|
Description
|
|
|
3.1
|
||
|
3.2
|
||
|
31.1
|
||
|
31.2
|
||
|
32.1
|
||
|
32.2
|
||
|
101. INS
|
XBRL Instance Document* - the instance document does not appear in the Interactive Data File because its XBRL tags are embedded within the Inline XBRL document
|
|
|
101. SCH
|
XBRL Taxonomy Extension Schema*
|
|
|
101. CAL
|
XBRL Taxonomy Extension Calculation*
|
|
|
101. DEF
|
XBRL Taxonomy Extension Definition*
|
|
|
101. LAB
|
XBRL Taxonomy Extension Label*
|
|
|
101. PRE
|
XBRL Taxonomy Extension Presentation*
|
|
__________
|
*
|
The financial information contained in these XBRL documents is unaudited.
|
|
Fannie Mae Third Quarter 2018 Form 10-Q
|
109
|
|
|
Signatures
|
||
SIGNATURES
Pursuant to the requirements of the Securities Exchange Act of 1934, the registrant has duly caused this report to be signed on its behalf by the undersigned thereunto duly authorized.
|
Federal National Mortgage Association
|
||
|
By:
|
/s/ Hugh R. Frater
|
|
|
Hugh R. Frater
Interim Chief Executive Officer |
||
Date:
November 2, 2018
|
By:
|
/s/ Celeste M. Brown
|
|
|
Celeste M. Brown
Executive Vice President and
Chief Financial Officer
|
||
Date:
November 2, 2018
|
Fannie Mae Third Quarter 2018 Form 10-Q
|
110
|
|

TABLE OF CONTENTS
Part I Financial InformationItem 2. Management S Discussion and Analysis Of Financial Condition and Results Of OperationsNote 3, Mortgage LoansNote 4, Allowance For Loan LossesNote 7, Short-term and Long-term DebtNote 11, Concentrations Of Credit RiskNote 1, Summary Of Significant Accounting PoliciesItem 1. Financial StatementsNote 6, Financial GuaranteesNote 13, Fair ValueNote 12, Netting ArrangementsNote 8, Derivative InstrumentsItem 3. Quantitative and Qualitative Disclosures About Market RiskItem 4. Controls and ProceduresPart II Other InformationItem 1. Legal ProceedingsNote 14, Commitments and ContingenciesItem 1A. Risk FactorsItem 2. Unregistered Sales Of Equity Securities and Use Of ProceedsItem 3. Defaults Upon Senior SecuritiesItem 4. Mine Safety DisclosuresItem 5. Other InformationItem 6. ExhibitsItem Description