|
|
|
|
|
|
|
|
|
|
|
|
|
|
|
|
|
|
|
|
|
|
|
|
|
|
|
|
|
|
|
|
UNITED STATES SECURITIES AND EXCHANGE COMMISSION
Washington, D.C. 20549
___________________________________________
Form 10-K
( Mark One)
|
☒ |
ANNUAL REPORT PURSUANT TO SECTION 13 OR 15(d) OF THE SECURITIES EXCHANGE ACT OF 1934 |
For the fis cal year ended December 31, 2018
or
|
☐ |
TRANSITION REPORT PURSUANT TO SECTION 13 OR 15(d) OF THE SECURITIES EXCHANGE ACT OF 1934 |
For the transition period from _________ to __________
Commission file number 1-584
FERRO CORPORATION
(Exact name of registrant as specified in its charter)
|
|
||
|
Ohio |
34-0217820 |
|
|
(State or Other Jurisdiction of Incorporation or Organization) |
(IRS Employer Identification No.) |
|
|
6060 Parkland Blvd. Suite 250 Mayfield Heights, OH (Address of Principal Executive Offices) |
44124 (Zip Code) |
Registrant’s telephone number, including area code: 216-875-5600
|
|
||
|
Securities Registered Pursuant to section 12(b) of the Act: |
||
|
Title of Each Class |
Name of Each Exchange on Which Registered |
|
|
Common Stock, par value $1.00 |
New York Stock Exchange |
|
Indicate by check mark if the registrant is a well-known seasoned issuer, as defined in Rule 405 of the Securities Act. YES ☒ NO ☐
Indicate by check mark if the registrant is not required to file reports pursuant to Section 13 or Section 15(d) of the Act. YES ☐ NO ☒
Indicate by check mark whether the registrant (1) has filed all reports required to be filed by Section 13 or 15(d) of the Securities Exchange Act of 1934 during the preceding 12 months (or for such shorter period that the registrant was required to file such reports), and (2) has been subject to such filing requirements for the past 90 days. YES ☒ NO ☐
Indicate by check mark whether the registrant has submitted electronically every Interactive Data File required to be submitted pursuant to Rule 405 of Regulation S-T (§ 232.405 of this chapter) during the preceding 12 months (or for such shorter period that the registrant was required to submit such files). YES ☒ NO ☐
Indicate by check mark if disclosure of delinquent filers pursuant to Item 405 of Regulation S-K (§ 229.405 of this chapter) is not contained here in , and will not be contained, to the best of registrant’s knowledge, in definitive proxy or information statements incorporated by reference in Part III of this Form 10-K or any amendment to this Form 10-K. ☒
Indicate by check mark whether the registrant is a large accelerated filer, an accelerated filer, a non-acce lerated filer, a smaller reporting company , or an emerging growth company . See the definitions of “large accelerated filer,” “accelerated filer,” “smaller reporting company , ” and “emerging growth company” in Rule 12b-2 of the Exchange Act. (Check one):
|
|
||||
|
Large accelerated filer ☒ |
Accelerated filer ☐ |
Non-accelerated filer ☐ |
Smaller reporting company ☐ |
Emerging growth company ☐ |
If an emerging growth company, indicate by check mark if the registrant has elected not to use the extended transition period for complying with any new or revised financial accounting standards provided pursuant to Section 13(a) of the Exchange Act. ☐
Indicate by check mark whether the registrant is a shell company (as defined in Rule 12b-2 of the Act). YES ☐ NO ☒
The aggregate market value of Ferro Corporation Common Stock, par value $1.00, held by non-affiliates and based on the closin g sale price as of June 30, 2018 , was approximately $1,728,453 ,000 .
On January 31, 2019 , there were 82,705 , 878 shares of Ferro Corporation Common Stock, par value $1.00 outstanding.
DOCUMENTS INCORPORATED BY REFERENCE
Portions of the Proxy Statem ent for Ferro Corporation’s 2019 Annual Meeting of Shareholders are incorporated into Part III of this Annual Report on Form 10-K.
|
|
|
Item 1 |
Page 3 |
|
|
Item 1A |
Page 7 |
|
|
Item 1B |
Page 16 |
|
|
Item 2 |
Page 16 |
|
|
Item 3 |
Page 16 |
|
|
Item 4 |
Page 17 |
|
|
|
|
|
|
PART II |
||
|
Item 5 |
Page 19 |
|
|
Item 6 |
Page 20 |
|
|
Item 7 |
Management’s Discussion and Analysis of Financial Condition and Results of Operations |
Page 21 |
|
Item 7A |
Page 46 |
|
|
Item 8 |
Page 47 |
|
|
Item 9 |
Changes in and Disagreements with Accountants on Accounting and Financial Disclosure |
Page 103 |
|
Item 9A |
Page 103 |
|
|
Item 9B |
Page 106 |
|
|
|
|
|
|
PART III |
||
|
Item 10 |
Page 107 |
|
|
Item 11 |
Page 107 |
|
|
Item 12 |
Security Ownership of Certain Beneficial Owners and Management and Related Stockholder Matters |
Page 107 |
|
Item 13 |
Certain Relationships and Related Transactions, and Director Independence |
Page 108 |
|
Item 14 |
Page 108 |
|
|
|
|
|
|
PART IV |
||
|
Item 15 |
Page 109 |
|
2
History, Organization and Products
Ferro Corporation was incorporated in Ohio in 1919 as an enameling company and today is a leading producer of specialty materials that are sold to a broad range of manufacturers who, in turn, make products for many end-use markets. When we use the terms “Ferro,” “we,” “us” or “the Company,” we are referring to Ferro Corporation and its subsidiaries unless indicated otherwise.
Ferro’s products fall into two general categories: functional coatings, which perform specific functions in the manufacturing processes and end products of our customers; and color solutions, which provide aesthetic and performance characteristics to our customers’ products. Our products are manufactured in approximately 52 facilities around the world. They include frits, porcelain and other glass enamels, glazes, stains, decorating colors, pigments, inks, polishing materials, dielectrics, electronic glasses, and other specialty coatings.
Ferro develop s and deliver s innovative products to our customers based on our strengths in the following technologies :
|
|
· |
|
Particle Engineering — Our ability to design and produce very small particles made of a broad variety of materials, with precisely controlled characteristics of shape, size and particle distribution. We understand how to disperse these particles within liquid, paste and gel formulations. |
|
|
· |
|
Color and Glass Science — Our understanding of the chemistry required to develop and produce pigments that provide color characteristics ideally suited to customers’ applications. We have a demonstrated ability to manufacture glass-based and certain other coatings with properties that precisely meet customers’ needs in a broad variety of applications. |
|
|
· |
|
Surface Chemistry and Surface Application Technology — Our understanding of chemicals and materials used to develop products and processes that involve the interface between layers and the surface properties of materials. |
|
|
· |
|
Formulation — Our ability to develop and manufacture combinations of materials that deliver specific performance characteristics designed to work within customers’ particular products and manufacturing processes. |
We differentiate ourselves in our industry by innovation and new products and services and the consistent high quality of our products, combined with delivery of localized technical service and customized application technology support. Our value-added technology services assist customers in their material specification and evaluation, product design, and manufacturing process characterization in order to help them optimize the application of our products.
Ferro’s operations are divided into the four business units, which comprise three reportable segments , listed below:
|
Tile Coating Systems (1) |
|
|
|
Porcelain Enamel (1) |
|
|
|
Performance Colors and Glass |
|
|
|
Color Solutions |
|
|
_____________________
|
|
(1) |
|
Tile Coating Systems and Porcelain Enamel are combined into one reportable segment, Performance Coatings, for financial reporting purposes. |
Financial information about our segments is included herein in Note 21 to the consolidated financial statements under Item 8 of this Annual Report on Form 10-K.
3
Markets and Customers
Ferro’s products are used in a variety of product application s , within the following markets :
|
Appliances |
|
Household furnishings |
|
Automotive |
|
Industrial products |
|
Building and renovation |
|
Packaging |
|
Electronics |
|
Sanitary |
Many of our products are used as functional or aesthetic coatings for a variety of different substrates on our customers’ products, such as metals, ceramics, glass, pla stic, wood and concrete . Other products are used to manufacture electronic components and other products. Still other products are added during our customers’ manufacturin g processes to provide desired properties to their end product. Often, Ferro materials are a small portion of the total cost of our customers’ products, but they can be critical to the functionality or appearance of those products.
Our customers include manufacturers of ceramic tile, major appliances, construction materials, aut omobile parts, automobiles, architectural and container glass, and electronic components and devices . Many of our customers, including makers of major appliances and automobile parts, purchase materials from more than one of our business units. Our customer base is well diversified both geographically and by end market.
We generally sell our products directly to our customers. However, a portion of our business uses indirect sales channels, such as agents and distributo rs, to del iver products to ma rket. In 2018 , no single customer or related group of customers represented more than 10% of net sales. In addition, none of our reportable segments is dependent on any single customer or related group of customers.
Backlog of Orders and Seasonality
Generally, there is no significant lead time between customer orders and delivery in any of our business segments. As a result, we do not consider that the dollar amount of backlogged orders believed to be firm is material information for an understanding of our business. Although not seasonal, in certain of our technology-driven markets, our customers’ business is often characterized by product campaigns with specific life cycles, which can result in uneven demand a s product ramp-up periods are followed by down-cycle periods. As our inn ovation activity increases in line with our value cre ation strategy, we expect this type of business to also increase . This type of market operates on a different cycle from the majority of our business. We also do not regard any material part of our business to be seasonal. However, customer demand has historically been higher in the second quarter when building and renovation markets are particularly active, and the second quarter is also normally the strongest for sales and operating profit.
Competition
In most of our markets, we have a substantial number of competitors, none of which is dominant. Due to the diverse nature of our product lines, no single competitor directly matches all of our product offerings. Our competition varies by product and by region, a nd is based primarily on product quality, performance and functionality , as well as on pricing, customer service, technical support, and the ability to develop custom products to mee t specific customer applications .
We are a worldwide leader in the production of specialty coatings and enamels for glass enamels, porcelain enamel , and ceramic tile coatings. There is strong competition in our markets, ranging from large multinational corporations to local producers. While many of our customers purchase customized products and formulations from us, our customers could generally buy from other sources, if necessary.
4
Raw Materials and Supplier Relations
Raw materials widely used in our operations include:
|
Metal Oxides: |
|
Other Inorganic Materials: |
|
Aluminum oxide (1) |
|
Boron (2) |
|
Chrome Oxide (1) (2) |
|
Clay (2) |
|
Cobalt oxide (1)(2) |
|
Feldspar (2) |
|
Iron Oxide (1) |
|
Lithium (2) |
|
Lead Oxide (1) |
|
Silica (2) |
|
Nickel oxide (1)(2) |
|
Soda Ash (1 ) |
|
Titanium dioxide (1)(2) |
|
Zircon (2) |
|
Zinc oxide (2) |
|
|
|
Zirconium dioxide (2) |
|
|
|
Precious and Non-precious Metals: |
|
Energy: |
|
Bismuth (1) |
|
Electricity |
|
Chrome (1)(2) |
|
Natural gas |
|
Copper (1) |
|
|
|
Gold (1) |
|
|
|
Molybdenum (1) |
|
|
|
Silver (1) |
|
|
|
Vandaium (1) |
|
|
|
|
(1) |
|
Primarily used by the Performance Colors and Glass and the Color Solutions segments. |
|
|
(2) |
|
Primarily used by the Performance Coatings segment. |
These raw materials make up a large portion of our product costs in certain of our product lines, and fluctuations in the cost of raw materials can have a significant impact on the financial performance of the related businesses. We attempt to pass through to our customers raw material cost increases.
We have a broad supplier base and, in many instances, multiple sources of essential raw materials are available worldwide if problems arise with a particular supplier. We maintain many comprehensive supplier agreements for strategic and critical raw materials. We did not encounte r raw material shortages in 2018 that significantly affected our manufacturing operations, but we are subject to volatile raw material costs that can affect our results of operations.
Environmental Matters
We handle, process, use and store hazardous materials as part of the pro duction of some of our products . As a result, we operate production facilities that are subject to a broad array of environmental laws and regulations in the countries in which we operate, particularly for wastes, wastewater discharges and air emissions. In addition, some of our products are subject to restrictions under laws or regulations such as California’s Proposition 65, the Tox ic Substances and Control Act and the European Union’s (“EU”) chemical substances directive. The costs to comply with the complex environmental laws and regulations applicable to our operations are significant and will continue for the industry and us for the foreseeable future. These routine costs are expensed as they are incurred. While these costs may increase in the future, they are not expected to have a material impact on our financial position, liquidity or results of operations. We believe that we are in substantial compliance with the environmental laws and regulations applicable to our operations.
5
We also believe that, to the extent that we may not be in compliance w ith such regulations, such non- compliance will not have a materially adverse effect on our financial position, liquidity or results of operations.
Our policy is to operate our plants and facilities in a manner that protects the environment and the health and safety of our employees and the public. We intend to continue to make expenditures for environmental and health and safety protection and improvements in a timely manner consistent with available technology. Although we cannot precisely predict future environmental, health and safety spending, we do not expect the costs to have a material impact on our financial position, liquidity or results of operations. Capital expenditures for environmental, health and safety protection were $6.1 million in 2018, $6.2 million in 2017, and $1.4 million in 2016. We also accrue for environmental remediation costs when it is probable that a liability has been incurred and we can reasonably estimate the amount. We determine the timing and amount of any liability based upon assumptions regarding future events, and inherent uncertainties exist in such evaluations primarily due to unknown conditions or circumstances, changing governmental regulations and legal standards regarding liability, and evolving technologies. We adjust these liabilities periodically as remediation-related efforts progress, the nature and extent of contamination becomes more certain, or as additional technical or legal information becomes available.
Research and Development
We are involved worldwide in research and development activities relating to new and existing products, services and technologies required by our customers’ continually changing markets. Our research and development resources are organized into centers of excellence that support our regional and worldwide major business units. These centers are augmented by local laboratories that provide technical service and support to meet customer and market needs in various geographic areas.
Total expenditures for product and application technology, including research and development, customer technical support and other related activities, were $40.2 million in 2018 , $ 36.4 million in 2017 , and $ 27.3 million in 2016 .
Patents, Trademarks and Licenses
We own a substantial number of patents and patent applications relating to our various products and their uses. While these patents are of importance to us and we exercise diligence to ensure that they are valid, we do not believe that the invalidity or expiration of any single patent or group of patents would have a material adverse effect on our businesses. Our patents will expire at various dates through the year 2037 . We also use a number of trademarks that are important to o ur businesses as a whole or to particular segment s of our business . We believe that these trademarks are adequately protected.
Employees
At Dece mber 31, 2018 , we employed 6,059 full-time employees , including 5,292 employees in our foreign c onsolidated subsidiaries and 767 in the United States (“U.S.”). T otal employment increased by 391 in our foreign subsidiaries and decreased by 14 in the U.S. from the prior year end due to the additions related to acquisitions and new business opportunities , net of cost reduction initiatives.
Collectiv e bargaining agreements cover 11.6 % of our U.S. workforce. Approximately 2.2 % of all U.S. employees are affected by a labor agreement that expires in 2019, and we expect to complete the renewal of the agreement with no significant disruption to the related business. We consider our relations with our employees, including those covered by collective bargaining agreements, to be good.
Our employees in Europe have protections afforded them by local laws and regulations through unions and works councils. Some of these laws and regulations may affect the timing, amount and nature of restructuring and cost reduction programs in that region.
Domestic and Foreign Operations
We began international operations in 1927. Our products are manufactured and/or distributed through our consolidated subsidiaries and unconsolidated affiliates in the following countries:
6
Consolidated Subsidiaries:
|
Argentina |
Egypt |
Japan |
Russia |
|
Australia |
France |
Luxembourg |
Spain |
|
Belgium |
Germany |
Malaysia |
Taiwan |
|
Brazil |
India |
Mexico |
Thailand |
|
Bulgaria |
Indonesia |
Netherlands |
Turkey |
|
Canada |
Ireland |
Poland |
United Kingdom |
|
China |
Israel |
Portugal |
United States |
|
Colombia |
Italy |
Romania |
Vietnam |
Unconsolidated Affiliates:
|
China |
Egypt |
South Korea |
|
|
Ecuador |
Spain |
|
|
Financial information for geograp hic areas is included in Note 21 to the consolidated financial statements under Item 8 of this Annual Report on Form 10-K. More than 76 % of our net sales are outside of the U.S. We sell products in to approximat ely 109 countries.
Our U.S. parent company receives technical service fees and/or royalties from many of its foreign subsidiaries. As a matter of corporate policy, the foreign subsidiaries have historically been expected to remit a portion of their annual earnings to the U.S. parent company as dividends. To the extent earnings of foreign subsidiaries are not remitted to the U.S. parent company, those earnings are indefinitely re-invested in those subsidiaries.
Available Information
Our Annual Report on Form 10-K, Quarterly Reports on Form 10-Q, and Current Reports on Form 8-K, including any amendments, will be made a vailable free of charge on our web site, www.ferro.com, as soon as reasonably practical, following the filing of the reports with the U.S. Securities and Exchange Commission (“SEC”). Our Corporate G overnance Principles, Code of Business Conduct , Guidelines for Determining Director Independence, and charters for our Audit Committee, Compensation Committee and Governance and Nomination Committee are a vailable free of charge either on our web site or to any shareholder who requests them from the Ferro Corporation Investor Relations Department located at 6060 Parkland Blvd., Suite 250, Mayfield Heights, Ohio, 44124.
Forward-looking Statements
Certain statements contained here and in future filings with the SEC reflect our expectations with respect to future performance and constitute “forward-looking statements” within the meaning of Section 27A of the Securities Act of 1933, as amended, and Section 21E of the Securities Exchange Act of 1934, as amended. These statements are subject to a variety of uncertainties, unknown risks and other factors concerning our operations and the business environment, which are difficult to predict and are beyond our control.
Many factors could cause our actual results to differ materially from those suggested by statements contained in this filing and could adversely affect our future financial performance. Such factors include the following:
We sell our products into industries where demand has been unpredictable, cyclical or heavily influenced by consumer spending, and such demand and our results of operations may be further impacted by macro-economic circumstances.
We sell our products to a wide variety of customers who supply many different market segments. Many of these market segments, including building and renovation, major appliances, transportation, and electronics, are cyclical or closely tied to consumer demand. Consumer demand may change and is difficult to accurately forecast . Change in demand and incorrect forecasts of demand or unforeseen reductions in demand can adversely affect costs and profitability due to factors such as underused manufacturing capacity, excess
7
inventory, or working capital needs. Our forecasting systems and modeling tools may not accurately predict changes in demand for our products or other market conditions.
Our results of operations are materially affected by conditions in capital markets and economies in the U.S. and elsewhere around the world. Concerns over fluctuating prices, energy costs, geopolitical issues, government deficits and debt loads, and the availability and cost of credit have contributed to economic uncertainty around the world. Our customers may be impacted by these conditions and may modify, delay, or cancel plans to purchase our products. Additionally, if customers are not successful in generating sufficient revenue or are precluded from securing financing, they may not be able to pay, or may delay payment of, accounts receivable that are owed to us. A reduction in demand or inability of customers to pay us for our products may adversely affect our earnings and cash flow.
We strive to improve operating margins through sales growth, price increases, new products, productivity gains, optimization initiatives, and improved purchasing techniques, but we may not achieve the desired improvements.
We work to improve operating profit margins through activities such as growing sales to achieve increased economies of scale, increasing prices, introducing new products, improving manufacturing processes, product reformulation and adopting purchasing techniques that lower costs or provide increased cost predictability to realize cost savings. However, these activities depend on a combination of improved product design and engineering, effective manufacturing process control initiatives, cost-effective redistribution of production, and other efforts that may not be as successful as anticipated. The success of sales growth and price increases depends not only on our actions but also on the strength of customer demand and competitors ' pricing responses, which are not fully predictable. Failure to successfully implement actions to improve operating margins could adversely affect our financial performance.
The global scope of our operations exposes us to risks related to currency conversion rates, new and different regulatory schemes and changing economic, regulatory, social and political conditions around the world.
More than 76% of our net sales during 2018 were outside of the U.S. In order to support our customers, access regional markets and compete effectively, our operations are located around the world. Our operations are subject to economic, regulatory, social and political conditions in multiple locations and we are subject to risks relating to currency conversion rates. We also may encounter difficulties expanding into additional growth markets around the world. Other risks inherent in our operations include the following:
|
|
· |
|
New, different and unpredictable legal and regulatory requirements and enforcement mechanisms in the U.S. and other countries; |
|
|
· |
|
Export licenses may be difficult to obtain, and we may be subject to import or export duties or import quotas, export controls and restrictions administered by , for example, the Office of Foreign Assets Controls or other trade restrictions or barriers; |
|
|
· |
|
Increased costs, and decreased availability, of transportation or shipping; |
|
|
· |
|
Credit risk and financial conditions of local customers and distributors; |
|
|
· |
|
Risk of nationalization of private enterprises by governments, or restrictions on investments; |
|
|
· |
|
Potentially adverse tax consequences, including imposition or increase of withholding and other taxes on remittances and other payments by subsidiaries; and |
|
|
· |
|
Political, economic and social conditions, including the possibility of hyperinflationary conditions, deflation, organized crime and political instability in certain countries. |
We have subsidiaries in Egypt, Israel and Turkey that are located near politically volatile regions. Such conditions could potentially impact our ability to recover both the cost of our investments and earnings from those investments. While we attempt to anticipate these changes and manage our business appropriately in each location where we do business, these changes are often beyond our control and difficult to forecast.
The consequences of these risks may have significant adverse effects on our results of operations or financial position, and if we fail to comply with applicable laws and regulations, we could be exposed to civil and criminal penalties, reputational harm, and restrictions on our operations.
8
Changes in U.S. and other governments’ trade policies and other factors beyond our control may adversely impact our business, financial condition and results of operations.
Tariffs, retaliatory tariffs or other trade restrictions on products and materials that we or our customers export or import could affect demand for our products. Direct or unforeseen consequences of tariffs, retaliatory tariffs or other trade restrictions may also alter the competitive landscape of our products in one or more regions of the world. Trade tensions or other governmental action related to tariffs or international trade agreements or policies has the potential to negatively impact our business, financial condition and results of operations.
We depend on reliable sources of energy and raw materials, minerals and other supplies, at a reasonable cost, but the availability of these materials and supplies could be interrupted and/or their prices could change and adversely affect our sales and profitability.
We purchase energy and many raw materials to manufacture our products. Changes in their availability or price could affect our ability to manufacture enough products to meet customers’ demands or to manufacture products profitably. We try to maintain multiple sources of raw materials and supplies where practical, but this may not prevent unanticipated changes in their availability or cost and, for certain raw materials, there may not be alternative sources. We may not be able to pass cost increases through to our customers. Significant disruptions in availability or cost increases could adversely affect our manufacturing volume or costs, which could negatively affect product sales or profitability of our operations.
We operate in regions of the world where it can be difficult for a multi-national company such as Ferro to compete lawfully with local competitors, which may cause us to lose business opportunities.
We pursue business opportunities around the world and many of our most promising growth opportunities are in developing markets, including the People’s Republic of China, Latin America, the Asia Pacific region, India and the Middle East. Although we have been able to compete successfully in those markets to date, local laws and customs can make it difficult for a multi-national company such as Ferro to compete on a “level playing field” with local competitors without engaging in conduct that would be illegal under U.S. or other countries’ anti-bribery laws. Our strict policy of observing the highest standards of legal and ethical conduct may cause us to lose some otherwise attractive business opportunities to competitors in these regions.
We have undertaken and continue to undertake optimization initiatives, to rationalize our operations and improve our operating performance, but we may not be able to implement and/or administer these initiatives in the manner contemplated and these initiatives may not produce the desired results.
We have undertaken, and intend to continue undertaking, optimization initiatives to rationalize our operations to improve our operational performance. These initiatives may involve, among other things, changes to the operations of recently acquired business, the transfer of manufacturing to new or existing facilities, and restructuring programs that involve plant closures and staff reductions, which could be material in their nature with respect to the investments, costs and potential benefits. These initiatives also may involve changes in the management and delivery of functional services. Although we expect these initiatives to help us achieve operational efficiencies and cost savings, we may not be able to implement and/or administer these initiatives in the manner contemplated, which could cause the initiatives to fail to achieve the desired results. In addition, transfer and consolidation of manufacturing operations may involve substantial capital expenses and the transfer of manufacturing processes and personnel from one site to another, with resultant inefficiencies and other issues at the receiving site as it starts up, the need for requalification of our products and for ISO or other certifications of our products. We may experience shortages of affected products, delays and higher than expected expenses. Changes in functional services may prove ineffective, inefficient and disruptive. Accordingly, the initiatives that we have implemented and those that we may implement in the future may not improve our operating performance and may not help us achieve cost savings. Failure to successfully implement and/or administer these initiatives could have an adverse effect on our financial performance.
Our businesses depend on a continuous stream of new products and services, and failure to introduce new products and services could affect our sales, profitability and liquidity.
We strive to remain competitive through innovation, including by developing and introducing new and improved products and services on an ongoing basis. Customers continually evaluate our products and services in comparison to those offered by our competitors. A failure to introduce new products and services at the right time that are price competitive and that meet the needs of our
9
customers could adversely affect our sales, or could require us to compensate by lowering prices. In addition, when we invest in new product development, we face risks related to production delays, cost over-runs and unanticipated technical difficulties, which could impact sales, profitability and/or liquidity.
Our strategy includes seeking opportunities in new growth markets, and failure to identify or successfully enter such markets could affect our ability to grow our revenues and earnings.
Certain of our products are sold into mature markets and part of our strategy is to identify and enter into markets growing more rapidly. These growth opportunities may involve new geographies, new product lines, new technologies, or new customers. We may not successfully exploit such opportunities and our ability to increase our revenue and earnings could be impacted as a result.
We may not be able to complete or successfully integrate future acquisitions into our business, which could adversely affect our business or results of operations.
We have pursued and we intend to continue to pursue acquisitions. Our success in accomplishing growth through acquisitions may be limited by the availability and suitability of acquisition candidates and by our financial resources, including available cash and borrowing capacity. Acquisitions involve numerous risks, including difficulty determining appropriate valuation, integrating operations, information systems, technologies, services and products of the acquired product lines or business, personnel turnover, and the diversion of management’s attention from other business matters. In addition, we may be unable to achieve anticipated benefits from these acquisitions in the timeframe that we anticipate, or at all, which could adversely affect our business or result of operations.
Certain of the markets for our products and services are highly competitive and subject to intense price competition, which could adversely affect our sales and earnings performance.
Our customers typically have multiple suppliers from which to choose. If we are unwilling or unable to provide products and services at competitive prices, and if other factors, such as product performance and value-added services do not provide an offsetting competitive advantage, customers may reduce, discontinue, or decide not to purchase our products. If we could not secure alternate customers for lost business, our sales and earnings performance could be adversely affected.
We rely on information systems to conduct our business and interruption, or damage to, or failure or compromise of, these systems may adversely affect our business and results of operations.
We rely on information systems to obtain, process, analyze and manage data to forecast and facilitate the purchase of raw materials and the distribution of our products; to receive, process, and ship orders on a timely basis; to run and operate our facilities; to account for our product and service transactions with customers; to manage the accurate billing and collections for thousands of customers; to process payments to suppliers; and to manage data and records relating to our employees, contractors, and other individuals. Our business and results of operations may be adversely affected if these systems are interrupted, damaged, or compromised or if they fail for any extended period, due to events including but not limited to programming errors, aging information systems infrastructure and required maintenance or replacement, computer viruses and security breaches. Information privacy and cyber security risks have generally increased in recent years because of the proliferation of new technologies and the increased sophistication and activities of perpetrators of cyber-attacks. We may incur significant costs to implement the security measures that we feel are necessary to protect our information systems. However, our information systems may remain vulnerable to damage despite our implementation of security measures that we deem to be appropriate.
In addition, third-party service providers are responsible for managing a significant portion of our information systems, and we are subject to risk because of possible information privacy and security breaches of those third parties. Any system failure, accident or security breach involving our or a third-party’s information system could result in disruptions to our operations. A breach in the security of our information systems could include the theft of our intellectual property or trade secrets, negatively impact our manufacturing operations, or result in the compromise of personal information of our employees, customers or suppliers. While we have, from time to time, experienced system failures, accidents and security breaches involving our information systems, these incidents have not had a material impact on our operations. To the extent that any system failure, accident or security breach results in material disruptions to our operations or the theft, loss or disclosure of, or damage to, material data or confidential information, our reputation, business, results of operations and financial condition could be materially adversely affected.
10
Our implementation and operation of business information systems and processes could adversely affect our results of operations and cash flow.
We implement and operate information systems and related business processes for our business operations. Implementation and operation of information systems and related processes involves risk, including risks related to programming and data transfer. Costs of implementation also could be greater than anticipated. In addition, we may be unable or decide not to implement such systems and processes in certain locations. Inherent risks, decisions and constraints related to implementation and operation of information systems could result in operating inefficiencies and could impact our ability to perform business transactions. These risks could adversely impact our results of operations, financial condition, and cash flows.
Our business is subject to a variety of domestic and international laws, rules, policies and other obligations regarding data protection.
The processing and storage of certain information is increasingly subject to privacy and data security regulations and many such regulations are country-specific. The interpretation and application of data protection laws in the U.S, Europe and elsewhere, including but not limited to the California Consumer Privacy Act and the General Data Protection Regulation (the “GDPR”), are uncertain, evolving and may be inconsistent among jurisdictions. Complying with these various laws is difficult and could cause us to incur substantial costs or require us to change our business practices in a manner adverse to our business. We may be required to expend additional resources to continue to enhance our information privacy and security measures, investigate and remediate any information security vulnerabilities and/or comply with regulatory requirements.
We are subject to a number of restrictive covenants under our revolving credit facility, which could affect our flexibility to fund ongoing operations and strategic initiatives, and, if we are unable to maintain compliance with such covenants, could lead to significant challenges in meeting our liquidity requirements.
Our Amended Credit Facility, entered into on April 25, 2018, contains a number of restrictive covenants, including those described in more detail in Note 9 to the consolidated financial statements under Item 8 of this Annual Report on Form 10 ‑K. These covenants include limitations on use of loan proceeds, limitations on the Company’s ability to pay dividends and repurchase stock, limitations on acquisitions and dispositions and limitations on certain types of investments. The Amended Credit Facility also contains standard provisions relating to conditions of borrowing and customary events of default, including the non-payment of obligations by the Company and the bankruptcy of the Company. Specific to the 2018 Revolving Facility, the Company is subject to a financial covenant regarding the Company’s maximum leverage ratio. If an event of default occurs, all amounts outstanding under the Amended Credit Facility may be accelerated and become immediately due and payable. The Amended Credit Facility is described in more detail in “Capital Resources and Liquidity” under Item 7 and in Note 9 to the consolidated financial statements under Item 8 of this Annual Report on Form 10-K.
We depend on external financial resources, and the economic environment and credit market uncertainty could interrupt our access to capital markets, borrowings, or financial transactions to hedge certain risks, which could adversely affect our financial condition.
At December 31, 201 8, we had approximately $821.4 million of short-term and long-term debt with varying ma turities and approximately $61.9 million of off balance sheet arrangements, including consignment arrangements for precious metals, bank guarantees, and standby letters of credit. These arrangements have allowed us to make investments in growth opportunities and fund working capital requirements. In addition, we may enter into financial transactions to hedge certain risks, including foreign exchange, commodity pricing, and sourcing of certain raw materials. Our continued access to capital markets and, the stability of our lenders, customers and financial partners, and their willingness to support our needs, are essential to our liquidity and our ability to meet our current obligations and to fund operations and our strategic initiatives. An interruption in our access to external financing or financial transactions to hedge risk could adversely affect our business prospects and financial condition. See further information regarding our liquidity in “Capital Resources and Liquidity” under Item 7 and in Note 9 to the consolidated financial statements under Item 8 of this Annual Report on Form 10 ‑K.
11
Regulatory authorities in the U.S., European Union and elsewhere are taking a more aggressive approach to regulating hazardous materials and other substances, and those regulations could affect sales of our products.
Legislation and regulations concerning hazardous materials and other substances can restrict the sale of products and/or increase the cost of producing them. Some of our products are subject to restrictions under laws or regulations such a s California’s Proposition 65 and the EU’s chemical substances directive. The EU “REACH” registration system requires us to perform studies of some of our products or components of our products and to register the information in a central database, increasing the cost of these products. As a result of such regulations, our ability to sell certain products may be curtailed and customers may avoid purchasing some products in favor of less regulated, less hazardous or less costly alternatives. It may be impractical for us to continue manufacturing heavily regulated products, and we may incur costs to shut down or transition such operations to alternative products. These circumstances could adversely affect our business, including our sales and operating profits.
Our operations are subject to operating hazards and to stringent environmental, health and safety regulations, and compliance with those regulations could require us to make significant investments.
Our production facilities are subject to hazards associated with the manufacture, handling, storage, and transportation of chemical materials and products. These hazards can cause personal injury and loss of life, severe damage to, or destruction of, property and equipment and environmental contamination and other environmental damage and could have an adverse effect on our business, financial condition or results of operations.
We strive to maintain our production facilities and conduct our manufacturing operations in a manner that is safe and in compliance with all applicable environmental, health and safety regulations. Compliance with changing regulations, or other circumstances, may require us to make significant capital investments, incur training costs, make changes in manufacturing processes or product formulations, or incur costs that could adversely affect our profitability, and violations of these laws could lead to substantial fines and penalties. These costs may not affect competitors in the same way due to differences in product formulations, manufacturing locations or other factors, and we could be at a competitive disadvantage, which might adversely affect financial performance.
Our business could be adversely affected by safety, environmental and product stewardship issues.
We may be impacted by and may not be able to adequately address safety, human health, product liability and environmental risks associated with our current and historical products, product life cycles, and production processes and the obligations that follow from them. This could adversely impact employees, communities, stakeholders, the environment, our reputation and our business, financial condition, and the results of our operations. Public perception of the risks associated with our products, their respective life cycles, and production processes could impact product acceptance and influence the regulatory environment in which we operate.
We are exposed to lawsuits, governmental investigations and proceeding relating to current and historical operations and products, which could harm our business.
We are from time to time exposed to certain lawsuits, governmental investigations and proceedings relating to current and historical operations and products, which may include claims involving product liability, infringement of intellectual property rights of third parties, environmental compliance, hazardous materials, work place safety, employment contract and other claims. Due to the uncertainties of litigation, we can give no assurance that we will prevail on claims made against us in the lawsuits that we currently face or that additional claims will not be made against us in the future. We do not believe that lawsuits we currently face are likely to have a material adverse effect on our business, operating results or financial condition. Lawsuits or claims, if they were to result in a ruling adverse to us or otherwise result in an obligation on the part of the Company, could give rise to substantial liability, which could have a material adverse effect on our business, operating results or financial condition.
Sales of our products to certain customers or into certain industries may expose us to different and complex regulatory regimes.
We seek to expand our customer base and the industries into which we sell. Selling products to certain customers or into certain industries, such as governments or the defense industry, requires compliance with regulatory regimes that can be complex and difficult to navigate. Our failure to comply with these regulations could result in liabilities or damage to our reputation, which could negatively impact our business, financial condition, or results of operations.
12
If we are unable to protect our intellectual property rights, including trade secrets, or to successfully resolve claims of infringement brought against us, our product sales and financial performance could be adversely affected.
Our performance may depend in part on our ability to establish, protect and enforce intellectual property rights with respect to our products, technologies and proprietary rights and to defend against any claims of infringement, which involves complex legal, scientific and factual questions and uncertainties. We may have to rely on litigation to enforce our intellectual property rights. The intellectual property laws and practice of some coun tries may not protect our interests to the same extent as the laws and practices of the U.S. In addition, we may face claims of infringement that could interfere with our ability to use technology or other intellectual property rights that are material to our business operations. If litigation that we initiate is unsuccessful, we may not be able to protect the value of some of our intellectual property. In the event a claim of infringement against us is successful, we may be required to pay royalties or license fees to continue to use technology or other intellectual property rights that we have been using or we may be unable to obtain necessary licenses from third parties at a reasonable cost or within a reasonable time.
We have limited or no redundancy for certain of our manufacturing operations, and damage to our facilities or interference with our operations could interrupt our business, increase our costs of doing business and impair our ability to deliver our products on a timely basis.
If certain of our existing production facilities become incapable of manufacturing products for any reason, including through interruption of our supply chain, we may be unable to meet production requirements, we may lose revenue and we may not be able to maintain our relationships with our customers. Without operation of certain existing production facilities, we may be unable or limited in our ability to deliver products until we restore the manufacturing capability at the particular facility, find an alternative manufacturing facility or arrange an alternative source of supply. Although we carry business interruption insurance to cover lost revenue and profits in an amount we consider adequate, this insurance does not cover all possible situations or expenses. We may not be able to recover from or be compensated for the loss of opportunity and potential adverse impact on relations with our existing customers resulting from our inability to produce and deliver products for them.
Our multi-jurisdictional tax structure may not provide favorable tax efficiencies.
We conduct our business operations in a number of countries and are subject to taxation in those jurisdictions. While we seek to minimize our worldwide effective tax rate, our corporate structure may not optimize tax efficiency opportunities. We develop our tax position based upon the anticipated nature and structure of our business and the tax laws, administrative practices and judicial decisions now in effect in the countries in which we have assets or conduct business, which are subject to change or differing interpretations. In addition, our effective tax rate could be adversely affected by several other factors, including: increases in expenses that are not deductible for tax purposes, the tax effects of restructuring charges or purchase accounting for acquisitions, changes related to our ability to ultimately realize future benefits attributed to our deferred tax assets, including those related to other-than-temporary impairment, and a change in our decision to indefinitely reinvest foreign earnings. Further, we are subject to review and audit by both domestic and foreign tax authorities, which may result in adverse decisions. Increased tax expense could have a negative effect on our operating results and financial condition.
We have significant deferred tax assets, and if we are unable to utilize these assets, our results of operations may be adversely affected.
To fully realize the carrying value of our net deferred tax assets, we will have to generate adequate taxable profits in various tax jurisdictions. At Decembe r 31, 2018, we had $81.2 million of net deferred tax assets, after valuation allowances. If we do not generate adequate profits within the time periods required by applicable tax statutes, the carrying value of the tax assets will not be realized. If it becomes unlikely that the carrying value of our net deferred tax assets will be realized, the valuation allowances may need to be increased in our consolidated financial statements, adversely affecting results of operations. Further information on our deferred tax assets is presented in Note 11 to the consolidated financial statements under Item 8 of this Annual Report on Form 10 ‑K.
U.S. federal income tax reform could adversely affect us.
On December 22, 2017, U.S. federal tax legislation, commonly referred to as the Tax Cuts and Jobs Act (the “Tax Act”), was signed into law, significantly reforming the U.S. Internal Revenue Code. The Tax Act, among other things, includes changes to U.S. federal tax rates, imposes significant additional limitations on the deductibility of interest, allows for the expensing of capital
13
expenditures, creates a new minimum tax on certain foreign-sourced earnings and modifies or repeals many bu siness deductions and credits. The Act contains many provisions which continue to be clarified through new regulations and we continue to examine the impact the Tax Act may have on our business.
Interest rates on some of our borrowings are variable, and our borrowing costs could be adversely affected by interest rate increases.
Portions of our debt obligations have variable interest rates. Generally, when interest rates rise, our cost of borrowings increases. We estimate, based on the debt obligations outstanding at December 31, 2018, that a one percent increase in interest rates would cause interest expense to increase by $2.7 million annually. Although interest rates have remained relatively stable over the past few years, future increases could raise our cost of borrowings and adversely affect our financial performance. See further information regarding our interest rates on our debt obligations in “Quantitative and Qualitative Disclosures about Market Risk” under Item 7A and in Note 9 to the consolidated financial statements under Item 8 of this Form 10-K.
If we are unable to manage our general and administrative expenses, our business, financial condition or results of operations could be negatively impacted.
We may not be able to effectively manage our administrative expense in all circumstances. While we attempt to effectively manage such expenses, including through projects designed to create administrative efficiencies, increases in staff-related and other administrative expenses may occur from time to time. We have made significant efforts to achieve general and administrative cost savings and improve our operational performance. As a part of these initiatives, we have and will continue to consolidate business and management operations and enter into arrangements with third parties offering cost savings. It cannot be assured that our strategies to reduce our general and administrative costs and improve our operating performance will be successful or achieve the anticipated savings.
We are subject to stringent labor and employment laws in certain jurisdictions in which we operate, we are party to various collective bargaining arrangements, and our relationship with our employees could deteriorate, which could adversely impact our operations.
A majority of our full-time employees are employed outside the U.S. In certain jurisdictions where we operate, labor and employment laws are relatively stringent and, in many cases, grant significant job protection to certain employees, including rights on termination of employment. In addition, in certain countries where we operate, our employees are members of unions or are represented by works councils. We are often required to consult with and seek the consent or advice of these unions and/or works councils. These regulations and laws, coupled with the requirement to seek consent or consult with the relevant unions or works councils, could have a significant impact on our flexibility in managing costs and responding to market changes.
Furthermore, approximately 11.6 % of our U.S. employees as of December 31, 2018, are subject to collective bargaining arran gements or similar arrangements. Approximately 2.2% of all U.S. employees are affected by a labor agreement that expires in 2019. While we expect to be able to renew these agreements without significant disruption to our business when they are scheduled to expire, there can be no assurance that we will be able to negotiate labor agreements on satisfactory terms or that actions by our employees will not be disruptive to our business. If these workers were to engage in a strike, work stoppage or other slowdown or if other employees were to become unionized, we could experience a significant disruption of our operations and/or higher ongoing labor costs, which could adversely affect our business, financial condition and results of operations.
Employee benefit costs, especially postretirement costs, constitute a significant element of our annual expenses, and funding these costs could adversely affect our financial condition.
Employee benefit costs are a significant element of our cost structure. Certain expenses, particularly postretirement costs under defined benefit pension plans and healthcare costs for employees and retirees, may increase significantly at a rate that is difficult to forecast and may adversely affect our financial results, financial condition or cash flows. Changes in the applicable discount rate can affect our postretirement obligation s . Declines in global capital markets may cause reductions in the value of our pension plan assets. Such circumstances could have an adverse effect on future pension expense and funding requirements. Further information regarding our retirement benefits is presented in Note 13 to the consolidated financial statements under Item 8 of this Annual Report on Form 10 ‑K.
14
We are subject to risks associated with outsourcing functions to third parties.
We have entered into outsourcing agreements with third parties, and rely on such parties, to provide certain services in support of our business. One such vendor provides a number of business services related to our information systems and finance and accounting activity. Arrangements with third-party service providers may make our operations vulnerable if vendors fail to provide the expected service or there are changes in their own operations, financial condition, or other matters outside of our control. If these service providers are unable to perform to our requirements or to provide the level of service expected, our operating results and financial condition may suffer and we may be forced to pursue alternatives to provide these services, which could result in delays, business disruptions and additional expenses.
There are risks associated with the manufacture and sale of our materials into industries that make products for sensitive applications.
We manufacture and sell materials to parties that make products for sensitive applications, such as medical devices. The supply of materials that enter the human body involves the risk of illness or injury to consumers, as well as commercial risks. Injury to consumers could result from, among other things, improper use, tampering by unauthorized third parties, or the introduction into the material of foreign objects, substances, chemicals and other agents during the manufacturing, packaging, storage, handling or transportation phases. Shipment of adulterated materials may be a violation of law and may lead to an increased risk of exposure to product liability or other claims, product recalls and increased scrutiny by federal and state regulatory agencies. Such claims or liabilities may not be covered by our insurance or by any rights of indemnity or contribution that we may have against third parties. In addition, the negative publicity surrounding any assertion that our materials caused illness or injury could have a material adverse effect on our reputation with existing and potential customers, which could negatively impact our business, operating results or financial condition.
If we are unable to attract and retain key personnel our business could be materially adversely affected.
Our business substantially depends on the continued service of key members of our management. The loss of the ser vices of a key members of our management could have a material adverse effect on our business. Our future success will also depend on our ability to attract and retain highly skilled personnel, such as engineering, marketing and senior management professionals. Competition for these employees is intense, and we could experience difficulty from time to time in hiring and retaining the personnel necessary to support our business. If we do not succeed in retaining our current employees and attracting new skilled employees, our business could be materially adversely affected.
We are exposed to intangible asset risk, and a write down of our intangible assets could have an adverse impact to our operating results and financial position.
We have recorded intangible assets, including goodwill, in connection with business acquisitions. We are required to perform goodwill impairment tests on at least an annual basis and whenever events or circumstances indicate that the carrying value may not be recoverable from estimated future cash flows. As a result of our annual and other periodic evaluations, we may determine that the intangible asset values need to be written down to their fair values, which could result in material charges that could be adverse to our operating results and financial position. See further information regarding our goodwill and other intangible assets in “Critical Accounting Policies” under Item 7 and in Note 8 to the consolidated financial statements under Item 8 of this Form 10-K.
We may not be successful in implementing our strategies to increase our return on invested capital , internal rate of return, or other return metrics .
We are taking steps to generate a h igher return our investments . There are risks associated with the implementation of these steps, which may be complicated and may involve substantial capital investment. To the extent we fail to achieve these strategies, our results of operations may be adversely affected.
Many of our assets are encumbered by liens that have been granted to lenders, and those liens affect our flexibility to dispose of property and businesses.
Certain of our debt obligations are secured by substantially all of our assets. These liens could reduce our ability and/or extend the time to dispose of property and businesses, as these liens must be cleared or waived by the lenders prior to any disposition. These
15
security interests are described in more detail in Note 9 to the consolidated financial statements under Item 8 of this Annual Report on Form 10 ‑K.
We are exposed to risks associated with acts of God, terrorists and others, as well as fires, explosions, wars, riots, accidents, embargoes, natural disasters, strikes and other work stoppages, quarantines and other governmental actions, and other events or circumstances that are beyond our control.
Ferro is exposed to risks from various events that are beyond our control, which may have significant effects on our results of operations. While we attempt to mitigate these risks through appropriate loss prevention measures, insurance, contingency planning and other means, we may not be able to anticipate all risks or to reasonably or cost-effectively manage those risks that we do anticipate. As a result, our operations could be adversely affected by circumstances or events in ways that are significant and/or long lasting.
The risks and uncertainties identified above are not the only risks that we face. Additional risks and uncertainties not presently known to us or that we currently believe to be immaterial also may adversely affect us. If any known or unknown risks and uncertainties develop into actual events, these developments could have material adverse effects on our financial position, results of operations, and cash flows.
Item 1B — Unresolved Staff Comments
None .
We lease our corporate headquarters offices, which are located at 6060 Parkland Blvd. , Mayfield Heights, Ohio. The C ompany owns other corporate facilities worldwide. We own principal manufacturing p lants that range in size from 21 ,000 sq. ft. to over 700 ,000 sq. ft. Plants we own with more than 250,000 sq. ft. are located in Spain; Germany; Belgium; Colombia; Mexico; Cleveland, Ohio; and Penn Yan, New York . The locations of these principal manufacturing plants by reportable segment are as follows:
Color Solutions -U.S.: Penn Yan, New York and Norcross, Georgia. Outside the U.S.: Colombia, China, India, Belgium, France, Romania and Spain .
Performance Colors and Glass -U.S.: Washington, Pennsylvania; King of Prussia, Pennsylvania and Orrville, Ohio. Outside the U.S.: Brazil, China, France, Germany, Mexico, Spain, and the United Kingdom.
Performance Coatings-U.S.: Cleveland, Ohio. Outside the U.S.: Argentina, Brazil, China, Egypt, France, Indonesia, Italy, Mexic o, Spain, Poland, Portugal, Thailand and the United Kingdom .
In addition, we lease manufacturing facilities for the Performance Colors and Glass segment in the United Kingdom; Germany; Japan; Israel; Turkey ; North Adams, Massachusetts, and Vista, California. We also lease manufacturing facilities for the Performance Coatings segment in Italy and Poland. We also lease manufacturing facilities in Taiwan for Color Solutions. In some instances, the manufacturing facilities are used for two or more segments. Leased facilities range in size from 12 ,000 sq. ft. to over 100,000 sq. ft.
In November 2017, Suffolk County Water Authority filed a complaint, Suffolk County Water Authority v. The Dow Chemical Company et al., against the Company and a number of other companies in the U.S. Federal Court for the Eastern District of New York with regard to the product 1,4 dioxane. The plaintiff alleges, among other things, that the Suffolk County water supply is contaminated with 1,4 dioxane and that the defendants are liable for unspecified costs of cleanup and remediation of the water supply, among other damages. The Company has not manufactured 1,4 dioxane since 2008, denies the allegations related to liability for the plaintiff’s claims, and is vigorously defending this proceeding. In December 2018, additional complaints were filed in the same court by 10 other New York municipal water authorities against the company and others making substantially similar allegations regarding the contamination of their respective water supplies with 1,4 dioxane. The Company is likewise vigorously defending these additional actions. The Company currently does not expect the outcome of these proceedings to have a material adverse impact on its consolidated financial
16
condition, results of operations, or cash flows, net of any insurance coverage. However, it is not possible to predict the ultimate outcome of these proceedings due to the unpredictable nature of litigation.
In addition to the proceedings described above, the Company and its consolidated subsidiaries are subject from time to time to various claims, lawsuits, investigations, and proceedings related to products, services, contracts, environmental, health and safety, employment, intellectual property, and other matters, including with respect to divested businesses. The outcome of such matters is unpredictable, our assessment of them may change, and resolution of them could have a material adverse effect on the Company’s consolidated financial position, results of operations, or cash flows. We do not currently expect the resolution of such matters to materially affect the consolidated financial position, results of operations, or cash flows of the Company.
Item 4 — Mine Safety Disclosures
Not applicable.
17
Executive Officers of the Registrant
The executive officers of the Company as of February 27, 2019 , are listed below, along wi th their ages and business experience during the past five years. The year indicates when the individual was named to the indicated position with Ferro, unless otherwise indicated .
Peter T. Thomas — 6 3
Chairman of the Board of Directors, 2014
President and Chief Executive Officer, 2013
Mark H. Duesenberg — 57
Vice President, General Counsel and Secretary, 2008
Benjamin J. Schlater — 43
Group Vice President and Chief Financial Officer , 2019
Vice President and Chief Financial Officer, 2016
Vice President, Corporate Development and Strategy, 2015
Treasurer and head of corporate development, strategic and financial planning and risk management, Veyance Technologies, a global manufacturing company, 2007
18
Item 5 — Market for Registrant’s Common Equity, Related Stockholder Matters, and Issuer Purchases of Equity Securities
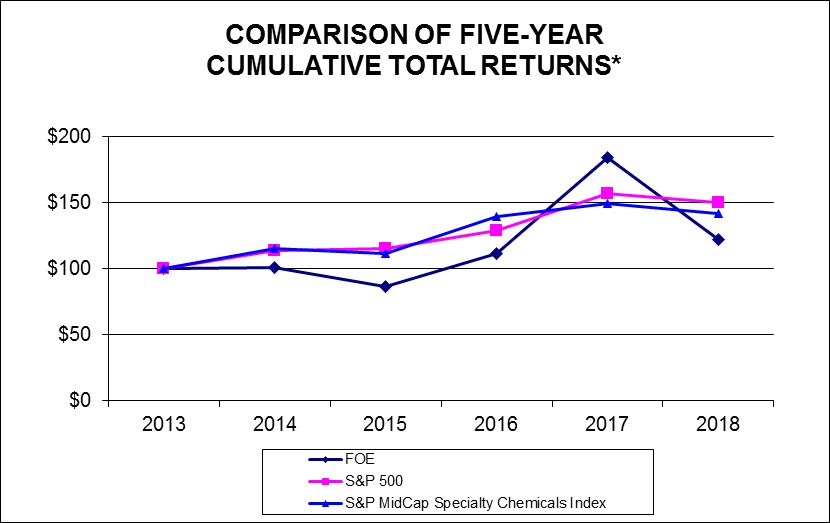
Our common stock is listed on the New York Stock Exchange under the ticker symbol FOE. On January 31, 2019 , we had 824 shareholders of record for our common stock, and the closing price of the common stock was $ 16.67 per share.
The chart below compares Ferro’s cumulative total shareholder return for the fi ve years ended December 31, 2018 , to that of the Standard & Poor’s 500 Index and the Standard & Poor’s MidCap Specialty Chemicals Index. In all cases, the information is presented on a dividend-reinvested basis and assumes investment of $100.00 on December 31, 2013 . At December 31, 2018 , the closing price of our common stock was $ 15.68 per share.
COMPARISON OF FIVE-YEAR
CUMULATIVE TOTAL RETURNS
Our Board of Directors has not declared any dividends on common stock during 2018 or 2017. The Company’s Amended Credit Facility restricts the amount of dividends we can pay on our common stock. Any future dividends declared would be at the discretion of our Board of Directors and would depend on our financial condition, results of operations, cash flows, contractual obligations, the terms our financing agreements at the time a dividend is considered, and other relevant factors. For further discussion, see Management’s Discussion and Analysis of Financial Condition and Results of Operations under Item 7 of this Annual Report on Form 10-K.
In October 2018, the Company’s Board of Directors approved a new share repurchase program under which the Company is authorized to repurchase up to an additional $50 million of the Company’s outstanding common stock on the open market, including through Rule 10b5-1 plans, in privately negotiated transactions, or otherwise. This new program is in addition to the $10 0 million of authorization previously approved and announced.
The Company repurchased 1,470 , 791 shares of common stock at an average price of $ 1 9. 59 per share for a total c ost of $28.8 million during 2018 . No repurchases were made during 2017. As of December 31, 2018 , $71.2 million was available to purchase common stock under the programs.
19
The following table summarizes purchases of our common stock by the Company and affiliated purchasers during the three months ended December 31, 2018 :
|
|
||||||||||||
|
|
||||||||||||
|
|
||||||||||||
|
|
Total Number |
Maximum Dollar |
||||||||||
|
|
of Shares |
Amount that |
||||||||||
|
|
Purchased as |
May Yet Be |
||||||||||
|
|
Total Number |
Average |
Part of Publicly |
Purchased |
||||||||
|
|
of Shares |
Price Paid |
Announced Plans |
Under the Plans |
||||||||
|
|
Purchased |
per Share |
or Programs |
or Programs |
||||||||
|
|
(Dollars in thousands, except for per share amounts) |
|||||||||||
|
October 1, 2018 to October 31, 2018 |
394,279 |
$ |
17.75 | 6,998,284 |
$ |
76,002,240 | ||||||
|
November 1, 2018 to November 30, 2018 |
268,696 |
$ |
17.90 | 4,809,720 |
$ |
71,192,520 | ||||||
|
December 1, 2018 to December 31, 2018 |
— |
$ |
— |
— |
$ |
71,192,520 | ||||||
|
Total |
662,975 | 11,808,004 | ||||||||||
Item 6 — Selected Financial Data
The following table presents selected financial data for the last five years ended December 31st:
|
|
|||||||||||||||
|
|
2018 |
2017 |
2016 |
2015 |
2014 |
||||||||||
|
|
(Dollars in thousands, except for per share data) |
||||||||||||||
|
|
|||||||||||||||
|
Net sales |
$ |
1,612,408 |
$ |
1,396,742 |
$ |
1,145,292 |
$ |
1,075,341 |
$ |
1,111,626 | |||||
|
Income from continuing operations |
80,946 | 57,768 | 44,577 | 99,883 | (8,609) | ||||||||||
|
Basic earnings (loss) per share from continuing operations attributable to Ferro Corporation common shareholders |
0.95 | 0.68 | 0.52 | 1.16 | (0.10) | ||||||||||
|
Diluted earnings (loss) per share from continuing operations attributable to Ferro Corporation common shareholders |
0.94 | 0.67 | 0.51 | 1.14 | (0.10) | ||||||||||
|
Cash dividends declared per common shares |
- |
- |
- |
- |
- |
||||||||||
|
Total assets |
1,812,460 | 1,682,202 | 1,283,769 | 1,225,351 | 1,091,554 | ||||||||||
|
Long-term debt, including current portion |
821,347 | 735,267 | 563,033 | 470,805 | 302,383 | ||||||||||
In 2015, we adopted the provisions of ASU 2015-03. The ASU requires debt issuance costs for term loans to be presented in the balance sheet as a reduction of the related debt liability rather than an asset. The adoption resulted in the reclassificatio n of $5.3 million of unamortized debt issuance costs related to the term loan from Total assets to a reduction in Long-term debt, including current portion within the financial data abov e as of December 31, 2014 .
In 2014, we commenced a process to market for sale all of the assets in our Polymer Additives reportable segment. During 2014, we sold substantially all of the assets related to our North America-based Polymer Additives business, which is presented as discontinued operations in 2014. In 2016, we completed the disposition of the Europe-based Polymer Additives business, which is presented as discontinued operations in 2016 through 2014 .
In 2014, we sold substantially all of the assets in our Specialty Plastics business, which is presented as disconti nued operations in 2014 .
20
Item 7 — Management’s Discussion and Analysis of Financial Condition and Results of Operations
During the year ended December 31, 2018 , net sales increased $215.7 milli on, or 15.4 %, compared with 2017 . The increase was driven by higher sales in Performance Coatings, Performance Colors and Glass and Color Solutions of $139.9 million , $42.8 million and $33 .0 million, respectively. Gross profit increased $39.7 million compared with 2017 . The increase in gross profit was attributable to increases across all of our segments, with increases in Performance Coatings , Color Solutions and Performance Colors and Glass and of $19.9 million, $11 .2 mill ion and $9.9 million, respectively. As a percentage of net sales, gross profit rate decre ased approximately 15 0 basis points to 28.3 %, from 29.8 % in the prior year.
For the year ended December 31, 2018 , selling, general and administrative ( “SG&A”) expenses increased $13.1 mill ion, or 5.0 %, compared with 2017 . As a percentage of net sales, SG&A expenses decreased 170 basis points from 19.0 % in 2017 to 17.3 % in 2018 .
For the year ended December 31, 2018 , net income was $80.9 million, compared with n et income of $57.8 million in 2017 , and net income attributabl e to common shareholders was $80.1 million, compared with net income attributable to common shareholders of $57.1 million in 2017 .
As previously disclosed on January 17, 2019, the Company i s in the process of expanding its production facility in Villagran, Mexico, which will become the Company’s Manufacturing Center of Excellence for the Americas. The expansion of the Villagran facility is expected to significantly increase the revenue generated from products manufactured at that facility. With the expanded capacity in Villagran, the Company (i) will discontinue the production of glass enamels, other industrial specialty products, such as architectural glass coatings, and pigments at its Washington, Pennsylvania facility over the course of 2019 and into 2020, (ii) plans to discontinue production of porcelain enamel products at its Cleveland, Ohio facility and (iii) will close additional facilities in Latin America. As part of this optimization initiative, the Company is expanding its King of Prussia, Pennsylvania facility. Conductive glass coatings production will be discontinued at the Washington, Pennsylvania facility and will be produced at the King of Prussia, Pennsylvania facility, and the Company’s operations at its Vista, California facility will be transferred to the King of Prussia, Pennsylvania facility. In addition, the Company will be moving its Americas research and development center for glass products to its technology center in Independence, Ohio, where the Company is investing in expanded laboratory facilities. The Washington, Pennsylvania facility is expected to remain in operation until sometime in 2020. Production of specialty glasses for electronics applications will continue at the Cleveland, Ohio facility, and the Company will invest in the facility to equip it to serve as a logistics center. The Cleveland, Ohio facility also will serve as the Americas research and development center for the porcelain enamel business.
2018 Transactional Activity
Transaction s undertaken in 2018 included the following business a cquisitions :
Acquisition of Quim ic er , S.A. (“Quimicer”): As discussed in Note 5 , in the fourth quarter of 2018 , the Company acquired 100% of the equit y interests of Quimicer , for €27. 0 million (approximately $31.3 million), including the assumption of d ebt of € 5 . 2 million (approximately $6.1 million) .
Acquisition of UWiZ Technology Co., Ltd. (“UWiZ”) : As discussed in Note 5 , in the third quarter of 2018, the Company acquired 100% of the equity interest of UWiZ for TWD823.4 million (approximately $26.9 million) .
Acquisition of Ernst Diegel GmbH (“Diegel”): As discussed in Note 5 , in the third quarter of 2018, the Company acquired 100% of the equity interests of Diegel, including the real property of a related party , for €12.1 million (approximately $14 .0 million ) .
Acquisition of MRA Laboratories, Inc. ( “ MRA ”): As discussed in Note 5 , in the second quarter of 2018 , the Company acquired 100 % of the equity interests of MRA , for $16 . 0 million .
Acquisition of PT Ferro Materials Utama. (“FMU”): As discussed in Note 5 , in the second quarter of 2018, the Company acquired 66% of the equity interests of FMU, for $2. 7 million in cash, in addition to the forgiveness of debt of $9.2 million, bringing our total ownership to 100%.
2017 Transactional Activity
21
Transaction s undertaken in 2017 included the following business acquisitions:
Acquisition of Endeka Group (“Endeka”) : As discussed in Note 5 , in the fourth quarter of 2017, the Company acquired 100% of the equity interests of Endeka, a global producer of high-value coatings and key raw materials for the ceramic tile m arket, for €72.8 million (approximately $84.8 million).
Acquisition of Gardenia Quimica S.A. (“Gardenia”) : As discussed in Note 5 , in the third quarter of 2017, the Company acquired a majority interest in Gardenia for $3.0 million . On March 1, 2018, the Company acquired the remaining equity interest in Gardenia for $1.4 million.
Acquisition of Dip Tech Ltd. (“Dip-Tech”) : As discussed in Note 5 , in the third quarter of 2017, the Company acquired 100% of the equity interests of Dip-Tech, a leading provider of digital print ing solutions for glass , for $77 .0 million .
Acquisition of S.P.C. Group s.r.l. and Smalti per Ceramiche, s.r.l (together “ SPC ”) : As discussed in Note 5 , in the second quarter of 2017, the Company acquired 100% of the equity interests of SPC, for € 18. 7 million (approximately $20. 3 million).
The Company delivered strong performance throughout 2018 with sales and gross profit improvements driven by increases in organic growth, contributions from businesses acq uired and optimization initiatives. We continue to execute the dynamic innovation and optimization phase of our value creation strategy, which includes organic and inorganic growth and optimization. We expect organic growth through new products and positioning our portfolio to continue to transition to the higher end of our target markets. We also intend to advance the business through acquisitions, and investments in technology, facilities and equipment. We are implementing optimization initiatives throughout the Company to further improve efficiency, productivity and profitability. We will deploy capital for strategic acquisitions, share repurchases or debt repayment depending on what we deem appropriate based on market conditions, shareholder value creation and long term business objectives .
Raw materials costs continued to increase through the majority of 2018, putting pressure on gross margin. Over the long term, we are confident in our ability to offset such increases with reformulated compounds, new product innovations, pricing initiatives and optimization efforts. We believe that , when taken as a whole, raw material prices have now peaked and are decreasing.
We perceive a degree of macro-economic uncertainty and the potential for slower growth in the outlook for 2019 across several industries. We expect demand will continue for our technology-driven functional coatings and color solutions in the niche markets we focus on, and that we will continue to develop innovative new products. We have identified a number of optimization opportunities in our manufacturing and logistics operations and will continue to implement strategic optimization initiatives.
Foreign currency rates may continue to be volatile through 2019 and changes in interest rates could adversely impact reported results. We expect cash flow from operating activities to continue to be positive for 2019, providing additional liquidity.
Factors that could adversely affect our future performance include those described under the heading “Risk Factors” in Item 1A of Part I of this Annual Report on Form 10-K for the year ended December 31, 2018.
22
Results of Operations - Consolidated
Comparison of the years ended December 31, 2018 and 2017
For the year ended December 31, 2018 , net income was $80.9 million, compared with net income of $57.8 million in 2017 . For the year ended December 31, 2018 , net income attributabl e to common shareholders was $80.1 million, or $0.95 earnings p er share, compared with net income attributable to common shareholders of $ 57.1 million, or $ 0.68 earnings per share in 2017 .
Net Sales
|
|
||||||||||||||
|
|
2018 |
2017 |
$ Change |
% Change |
||||||||||
|
|
(Dollars in thousands) |
|||||||||||||
|
Net sales |
$ |
1,612,408 |
$ |
1,396,742 |
$ |
215,666 | 15.4 |
% |
||||||
|
Cost of sales |
1,156,475 | 980,521 | 175,954 | 17.9 |
% |
|||||||||
|
Gross profit |
$ |
455,933 |
$ |
416,221 |
$ |
39,712 | 9.5 |
% |
||||||
|
Gross profit as a % of net sales |
28.3 |
% |
29.8 |
% |
||||||||||
Net sales increased by $215.7 million, or 15.4 % , in the year ended December 31, 2018 , compared with the prior year, with increased sales in Performance Coatings , Performance Colors and Glass and Color Solutions of $139.9 million, $42.8 million and $33 .0 million, resp ectively. The increase in net sales was driven by both acquisitions and organic growth . Organic sales increased in Performance Coatings by $28.2 million, Color Solutions by $28.1 million, and Performa nce Colors and Gla ss by $22.6 million.
Gross Profit
Gross profit increased $39.7 million, or 9.5 % , in 2018 to $455.9 million, compared with $ 416.2 million in 2017 and, as a percenta ge of net sales, it decreased 150 basis points to 28.3 %. The increase in gross profit was attributable to increases across all of our segments, with increases in Performance Coatings , Color Solutions and Performance Colors and Glass of $19.9 millio n, $11.2 million and $ 9.9 million, respectivel y. The increase in gross profit was primarily att ributable to favorable product pricing of $43.1 million, gross profit from acquisitions of $34.1 million, high er sales volumes and mix of $7.5 million, favorable foreign currency impacts of $5.3 million and lower manufacturing and product cost s of $2 .8 million , partially offset by higher raw materi al costs of $51.8 million.
G eographic Revenues
The following table presents our sales on the basis of where sales originated.
|
|
||||||||||||
|
|
2018 |
2017 |
$ Change |
% Change |
||||||||
|
|
(Dollars in thousands) |
|||||||||||
|
Geographic Revenues on a sales origination basis |
||||||||||||
|
EMEA |
$ |
852,775 |
$ |
683,601 |
$ |
169,174 | 24.7 |
% |
||||
|
United States |
379,914 | 356,482 | 23,432 | 6.6 |
% |
|||||||
|
Asia Pacific |
221,389 | 195,918 | 25,471 | 13.0 |
% |
|||||||
|
Latin America |
158,330 | 160,741 | (2,411) | (1.5) |
% |
|||||||
|
Net sales |
$ |
1,612,408 |
$ |
1,396,742 |
$ |
215,666 | 15.4 |
% |
||||
The increase in net sales of $215 .7 million, compared with 2017 , was driven by higher sales from EMEA, Asia Pacific and the United States, partially offset by a decrease in sales in Latin America . T he increase in sales from EMEA was attributable to higher sales in Performance Coatings, Performance Colors and Glass and Color Solutions of $129.2 million, $32.0 million and $8.0 million, respectively. The increase in sales from Asia Pacific was attributable to higher sales in Performance Coatings, Performance Colors and Glass and Color Solutions of $13.9 million, $6.3 million and $5.3 million, respectively. The increase in sales from the United States was attributable to higher sales in Color Solutions , Per formance Colors and Glass and Performance Coatings of $18.2 million, $2.7 million and $2.6 mill ion, respectively. The decrease in sales fro m Latin America was attributable to lower sales in Performance Coatings
23
of $5.8 million, partially mitigated by higher sales in Performance Color s and Glass and Color Solutions of $1.9 million and $1.5 million, respectively .
The follow ing table presents our sales on the basis of where sold products were shipped.
|
|
2018 |
2017 |
$ Change |
% Change |
||||||||
|
|
(Dollars in thousands) |
|||||||||||
|
Geographic Revenues on a shipped-to basis |
||||||||||||
|
EMEA |
$ |
803,282 |
$ |
649,423 |
$ |
153,859 | 23.7 |
% |
||||
|
Asia Pacific |
352,433 | 300,594 | 51,839 | 17.2 |
% |
|||||||
|
United States |
273,226 | 263,236 | 9,990 | 3.8 |
% |
|||||||
|
Latin America |
183,467 | 183,489 | (22) | (0.0) |
% |
|||||||
|
Net sales |
$ |
1,612,408 |
$ |
1,396,742 |
$ |
215,666 | 15.4 |
% |
||||
Selling, General and Administrative Expense
The following table includes SG&A components with significant changes between 2018 and 2017 .
|
|
||||||||||||
|
|
2018 |
2017 |
$ Change |
% Change |
||||||||
|
|
(Dollars in thousands) |
|||||||||||
|
Personnel expenses (excluding R&D personnel expenses) |
$ |
127,359 |
$ |
116,570 |
$ |
10,789 | 9.3 |
% |
||||
|
Research and development expenses |
40,221 | 36,359 | 3,862 | 10.6 |
% |
|||||||
|
Business development |
11,627 | 16,481 | (4,854) | (29.5) |
% |
|||||||
|
Incentive compensation |
8,476 | 12,581 | (4,105) | (32.6) |
% |
|||||||
|
Stock-based compensation |
8,441 | 11,770 | (3,329) | (28.3) |
% |
|||||||
|
Intangible asset amortization |
8,314 | 10,289 | (1,975) | (19.2) |
% |
|||||||
|
Pension and other postretirement benefits |
1,289 | 1,190 | 99 | 8.3 |
% |
|||||||
|
Bad debt |
681 | 44 | 637 | 1,447.7 |
% |
|||||||
|
All other expenses |
72,158 | 60,134 | 12,024 | 20.0 |
% |
|||||||
|
Selling, general and administrative expenses |
$ |
278,566 |
$ |
265,418 |
$ |
13,148 | 5.0 |
% |
||||
SG&A expenses were $13.1 million higher in 2018 compared with the prior year. As a percentage of net sa les, SG&A expenses decreased 170 basis points from 19.0 % in 2017 to 17.3 % in 2018 . The higher SG&A e xpenses compared with the prior year were primarily driven by businesses acquired within the last year. The acquisitions were the primary driver of th e increase in personnel e xpenses . The decrea se in incentive compensation is the result of the Company’s performance relative to targets for certain aw ards compared to the prior year and t he de crease in stock-ba sed compensation expense of $3.3 million is the result of the Company’s performance relative to targets for certain awards compared with the prior year, as well as decreases in the Company’s stock price.
The following table presents SG&A expenses attributable to sales, research and development, and operations costs as strategic services and presents other SG&A costs as functional services .
|
|
||||||||||||
|
|
2018 |
2017 |
$ Change |
% Change |
||||||||
|
|
(Dollars in thousands) |
|||||||||||
|
Strategic services |
$ |
157,020 |
$ |
138,551 |
$ |
18,469 | 13.3 |
% |
||||
|
Functional services |
104,629 | 102,516 | 2,113 | 2.1 |
% |
|||||||
|
Incentive compensation |
8,476 | 12,581 | (4,105) | (32.6) |
% |
|||||||
|
Stock-based compensation |
8,441 | 11,770 | (3,329) | (28.3) |
% |
|||||||
|
Selling, general and administrative expenses |
$ |
278,566 |
$ |
265,418 |
$ |
13,148 | 5.0 |
% |
||||
24
Restructuring and Impairment Charges
|
|
||||||||||||
|
|
2018 |
2017 |
$ Change |
% Change |
||||||||
|
|
(Dollars in thousands) |
|||||||||||
|
Employee severance |
$ |
5,794 |
$ |
5,167 |
$ |
627 | 12.1 |
% |
||||
|
Equity method investment impairment |
— |
1,566 | (1,566) | (100.0) |
% |
|||||||
|
Asset impairment |
— |
1,176 | (1,176) | (100.0) |
% |
|||||||
|
Other restructuring costs |
7,501 | 3,500 | 4,001 | 114.3 |
% |
|||||||
|
Restructuring and impairment charges |
$ |
13,295 |
$ |
11,409 |
$ |
1,886 | 16.5 |
% |
||||
Restru cturing and impairment charges increased $1.9 million in 2018, compared with 2017 . The increase w as primarily related to costs associated with integration of recent acquisitions and optimization programs. The in crease was partially offset by an “other than temporary impairment” charge on an equity method investment of $1.6 million and costs associated with a restructuring plan in Italy, which includes $1.2 million of asset impairment assoc iated with assets that were taken out of service in 2017 , which didn’t occur in 2018 .
Interest Expense
|
|
||||||||||||
|
|
2018 |
2017 |
$ Change |
% Change |
||||||||
|
|
(Dollars in thousands) |
|||||||||||
|
Interest expense |
$ |
32,252 |
$ |
24,337 |
$ |
7,915 | 32.5 |
% |
||||
|
Amortization of bank fees |
3,577 | 3,496 | 81 | 2.3 |
% |
|||||||
|
Interest swap amortization |
(762) |
— |
(762) |
— |
% |
|||||||
|
Interest capitalization |
(1,696) | (79) | (1,617) |
NM |
% |
|||||||
|
Interest expense |
$ |
33,371 |
$ |
27,754 |
$ |
5,617 | 20.2 |
% |
||||
Interest expense in 2018 increased $5.6 million com pared with 2017 . The increase in interest expense was primarily due to an increase in the average lo ng-term debt balance during 2018 , compared with 2017 , partially offset by increased interest capitalization during 2018 .
Income Tax Expense
In 2018, we recorde d an income tax expense of $23.0 million, or 22.2 % of income before income taxes, compared to an income tax expense of $52.8 million, or 47.7% of income before income taxes in 2017. The 2018 effective tax rate is greater than the statutory income tax rate of 21% primarily as a result of a net effect of a $7.9 million net expense related to foreign tax rate differences, $3.5 million net expense resulting from foreign income tax audit settlements, $5.7 million net benefit related to tax credits and $4.1 million net benefit related to the release of valuation allowances related to deferred tax assets that were utilized in the current year or which are deemed no longer necessary based upon changes in the current and expected future years of operating profits. The 2017 effective tax rate is greater than the statutory income tax rate of 35% primarily as a result of a net effect of a $21.5 million expense related to re-measuring the U.S. deferred tax assets as a result of the Tax Act, $5.6 million net expense related to uncertain tax positions and $8.0 million benefit related to foreign tax rate differences.
On December 22, 2017, U.S. federal tax legislation, commonly referred to as the Tax Cut and Jobs Act (the “Tax Act”), was signed into law, significantly changing the U.S. corporate income tax system. These changes include a federal statutory rate reduction from 35% to 21% effective January 1, 2018. Changes in tax rates and tax law are accounted for in the period of enactment. Accordingly, the Company’s U.S. net deferred tax assets were re-measured to reflect the reduction in the federal statutory rate, resulting in a $21.5 million increase in income tax expense for the year ended December 31, 2017. The Tax Act also changed the U.S. taxation of worldwide income. The Tax Act contains many provisions which continue to be clar ified through new regulations. Consistent with the guidance of SEC Staff Accounting Bulletin No. 118, Income Tax Accounting Implications of the Tax Cuts and Jobs Act (“SAB 118”), w e completed our analysis within 2018 consistent with the guidance of SAB 118 and our initial determination of no tax due on the one-time mandatory deemed repatriation tax on accumulated foreign subsidiaries’ previously untaxed foreign earnings and profits was unchanged from our position at December 31, 2017 .
25
Comparison of the years ended December 31, 2017 and 2016
For the year ended December 31, 2017, income from continuing operations was $57.8 million, compared with income from continuing operations of $44.6 million in 2016. For the year ended December 31, 2017, net income was $57.8 million, compared with net loss of $19.9 million in 2016. For the year ended December 31, 2017, net income attributable to common shareholders was $57.1 million, or $0.68 earnings per share, compared with net loss attributable to common shareholders of $20.8 million, or $0.25 loss per share in 2016.
Net Sales
|
|
||||||||||||||
|
|
2017 |
2016 |
$ Change |
% Change |
||||||||||
|
|
(Dollars in thousands) |
|||||||||||||
|
Net sales |
$ |
1,396,742 |
$ |
1,145,292 |
$ |
251,450 | 22.0 |
% |
||||||
|
Cost of sales |
980,521 | 788,914 | 191,607 | 24.3 |
% |
|||||||||
|
Gross profit |
$ |
416,221 |
$ |
356,378 |
$ |
59,843 | 16.8 |
% |
||||||
|
Gross profit as a % of net sales |
29.8 |
% |
31.1 |
% |
||||||||||
Net sales increased by $251.5 million, or 22.0%, in the year ended December 31, 2017, compared with the prior year, with increased sales in Color Solutions, Performance Colors and Glass and Performance Coatings of $111.2 million, $73.2 million and $67.0 million, respectively. The increase in net sales was driven by both acquisitions and organic growth. Organic sales increased in Color Solutions by $39.6 mi llion, Performance Coatings by $24.1 million and P erformance Colors and Glass by $11.8 million.
Gross Profit
Gross profit increased $59.8 million, or 16.8 %, in 2017 to $4 16.2 million, compared with $356.4 million in 2016 and, as a percentage of net sales , it decreased 130 basis points to 29.8%. The increase in gross profit was attributable to increases across all of our segments, with increases in Color Solutions, Performance Colors and Glass a nd Performance Coatings of $29.2 million, $23.6 million and $6.3 million, respec tively. The increase in gross profit was primarily attributable to acquisitions of $46.9 million, lower manufacturing and product costs of $28.8 million, driven by higher volume and mix, as well as strategic purchasing actions, favorable product pricing of $12.9 million, high er sales volumes and mix of $9.5 million, favorable foreign currency impacts of $0.3 million, partially offset by higher raw material costs of $39.3 million.
Geographic Revenues
The following table presents our sales on the basis of where sales originated.
|
|
||||||||||||
|
|
2017 |
2016 |
$ Change |
% Change |
||||||||
|
|
(Dollars in thousands) |
|||||||||||
|
Geographic Revenues on a sales origination basis |
||||||||||||
|
EMEA |
$ |
683,601 |
$ |
515,055 |
$ |
168,546 | 32.7 |
% |
||||
|
United States |
356,482 | 300,187 | 56,295 | 18.8 |
% |
|||||||
|
Asia Pacific |
195,918 | 179,464 | 16,454 | 9.2 |
% |
|||||||
|
Latin America |
160,741 | 150,586 | 10,155 | 6.7 |
% |
|||||||
|
Net sales |
$ |
1,396,742 |
$ |
1,145,292 |
$ |
251,450 | 22.0 |
% |
||||
The increase in net sales of $251.5 million, compared with 2016, was driven by higher sales from all regions. T he increase in sales from EMEA was attributable to higher sales in Color Solutions, Performance Coatings and Performance Colors and Glass of $69.3 million, $56.4 million and $42.8 million, respectively. The increase in sales from the United States was primarily attributable to higher sales in Color Solutions and Performance Colors and Glass of $33.0 million and $22.9 million, respectively. The increase in sales from Latin America and Asia Pacific was attributable to higher sales across all segments.
26
The following table presents our sales on the basis of where sold products were shipped.
|
|
2017 |
2016 |
$ Change |
% Change |
||||||||
|
|
(Dollars in thousands) |
|||||||||||
|
Geographic Revenues on a shipped-to basis |
||||||||||||
|
EMEA |
$ |
649,423 |
$ |
501,231 |
$ |
148,192 | 29.6 |
% |
||||
|
Asia Pacific |
300,594 | 244,057 | 56,537 | 23.2 |
% |
|||||||
|
United States |
263,236 | 239,771 | 23,465 | 9.8 |
% |
|||||||
|
Latin America |
183,489 | 160,233 | 23,256 | 14.5 |
% |
|||||||
|
Net sales |
$ |
1,396,742 |
$ |
1,145,292 |
$ |
251,450 | 22.0 |
% |
||||
Selli ng, General and Administrative Expense
The following table includes SG&A components with significant changes between 2017 and 2016 .
|
|
||||||||||||
|
|
2017 |
2016 |
$ Change |
% Change |
||||||||
|
|
(Dollars in thousands) |
|||||||||||
|
Personnel expenses (excluding R&D personnel expenses) |
$ |
116,570 |
$ |
100,039 |
$ |
16,531 | 16.5 |
% |
||||
|
Research and development expenses |
36,359 | 27,327 | 9,032 | 33.1 |
% |
|||||||
|
Business development |
16,481 | 12,890 | 3,591 | 27.9 |
% |
|||||||
|
Incentive compensation |
12,581 | 10,852 | 1,729 | 15.9 |
% |
|||||||
|
Stock-based compensation |
11,770 | 7,245 | 4,525 | 62.5 |
% |
|||||||
|
Intangible asset amortization |
10,289 | 6,199 | 4,090 | 66.0 |
% |
|||||||
|
Pension and other postretirement benefits |
1,190 | 939 | 251 | 26.7 |
% |
|||||||
|
Bad debt |
44 | 1,383 | (1,339) | (96.8) |
% |
|||||||
|
All other expenses |
60,134 | 60,412 | (278) | (0.5) |
% |
|||||||
|
Selling, general and administrative expenses |
$ |
265,418 |
$ |
227,286 |
$ |
38,132 | 16.8 |
% |
||||
SG&A expenses were $38.1 million higher in 2017 compared with the prior year. As a percentag e of net sales, SG&A expenses decreased 80 basis points from 19.8 % in 2016 to 19.0 % in 2017. The higher SG&A expenses compared with the prior year are primarily driven by businesses acquired within the last year. The acquisitions were the primary driver of the increase in personnel expenses, business development expenses and accounted for the entire increase in intangible asset amortization. The increase in stock-based compensation expense of $4.5 million is the result of the Company’s performance relative to targets for certain awards compared with the prior year, as well as increases in the Company’s stock price.
The following table presents SG&A expenses attributable to sales, research and development, and operations costs as strategic services and presents other SG&A costs as functional services.
|
|
||||||||||||
|
|
2017 |
2016 |
$ Change |
% Change |
||||||||
|
|
(Dollars in thousands) |
|||||||||||
|
Strategic services |
$ |
138,551 |
$ |
116,807 |
$ |
21,744 | 18.6 |
% |
||||
|
Functional services |
102,516 | 92,382 | 10,134 | 11.0 |
% |
|||||||
|
Incentive compensation |
12,581 | 10,852 | 1,729 | 15.9 |
% |
|||||||
|
Stock-based compensation |
11,770 | 7,245 | 4,525 | 62.5 |
% |
|||||||
|
Selling, general and administrative expenses |
$ |
265,418 |
$ |
227,286 |
$ |
38,132 | 16.8 |
% |
||||
27
Restructuring and Impairment Charges
|
|
||||||||||||
|
|
2017 |
2016 |
$ Change |
% Change |
||||||||
|
|
(Dollars in thousands) |
|||||||||||
|
Employee severance |
$ |
5,167 |
$ |
1,353 |
$ |
3,814 | 281.9 |
% |
||||
|
Equity method investment impairment |
1,566 |
— |
1,566 |
NM |
% |
|||||||
|
Asset impairment |
1,176 |
— |
1,176 |
NM |
% |
|||||||
|
Goodwill impairment |
— |
13,198 | (13,198) | (100.0) |
% |
|||||||
|
Other restructuring costs |
3,500 | 1,356 | 2,144 | 158.1 |
% |
|||||||
|
Restructuring and impairment charges |
$ |
11,409 |
$ |
15,907 |
$ |
(4,498) | (28.3) |
% |
||||
Restructuring and impairment charges decreased by $4.5 million in 2017, compared with 2016. The decrease was primarily attributable to an impairment charge in 2016 within our Tile Coating Systems reporting unit, a component of the Performance Coatings operating segment of $13.2 million. The decrease was partially offset by an increase due to an “other than temporary impairment” charge on an equity method investment of $1.6 million and costs associated with a restructuring plan in Italy, which includes $1.2 million of asset impairment associated with assets that have been taken out of service, as well as actions taken in connection with recent acquisitions designed to achieve our targeted synergies.
Interest Expense
|
|
||||||||||||
|
|
2017 |
2016 |
$ Change |
% Change |
||||||||
|
|
(Dollars in thousands) |
|||||||||||
|
Interest expense |
$ |
24,337 |
$ |
20,246 |
$ |
4,091 | 20.2 |
% |
||||
|
Amortization of bank fees |
3,496 | 1,353 | 2,143 | 158.4 |
% |
|||||||
|
Interest capitalization |
(79) | (52) | (27) | 51.9 |
% |
|||||||
|
Interest expense |
$ |
27,754 |
$ |
21,547 |
$ |
6,207 | 28.8 |
% |
||||
Interest expense in 2017 increased $6.2 million compared with 2016. The increase in interest expense was due to an increase in the average long-term debt balance during 2017, compared with 2016 and an increase of the amortization of debt issuance costs associated with the Credit Facility, partially offset by a favorable average borrowing rate as a result of the refinancing completed in the first quarter of 2017.
Income Tax Expense
On December 22, 2017, U.S. federal tax legislation, commonly referred to as the Tax Cut s and Jobs Act (the “Tax Act”), was signed into law, significantly changing the U.S. corporate income tax system. These changes include a federal statutory rate reduction from 35% to 21% effective January 1, 2018. Changes in tax rates and tax law are accounted for in the period of enactment. Accordingly, the Company’s U.S. net deferred tax assets were re-measured to reflect the reduction in the federal statutory rate, resulting in a $21.5 million increase in income tax expense for the year ended December 31, 2017. The Tax Act also changed the U.S. taxation of worldwide income. Accordingly, we have assessed the one-time mandatory deemed repatriation tax on accumulated foreign subsidiaries’ previously untaxed foreign earnings and profits and have preliminarily determined no tax is due.
Additional provisions of the Tax Act which may have an impact to the Company include, but are not limited to, the repeal of the domestic production deduction, limitations on interest expense, accelerated depreciation that will allow for full expensing of qualified property, provisions related to performance-based executive compensation and international provisions, which generally establish a territorial-style system for taxing foreign-source income of domestic multinational corporations.
We have recognized the provisional tax impacts related to the Tax Act under the guidance of SEC Staff Accounting Bulletin No. 118, Income Tax Accounting Implications of the Tax Cuts and Jobs Act (“SAB 118”). The ultimate impact may differ from these provisional amounts due to additional analysis, changes in interpretations and assumptions, additional regulatory guidance that may be issued, and actions we may take as a result of the Tax Act. Pursuant to SAB 118, adjustments to the provisional amounts recorded by the Company as of December 31, 2017, that are identified within a subsequent measurement period of up to one year from the enactment date will be included as an adjustment to income tax expense in the period the amounts are determined.
28
In 2017, we recorded an income tax expense of $52.8 million, or 47.7% of income before income taxes, compared to an income tax expense of $17.9 million, or 28.6% of income before income taxes in 2016. The 2017 effective tax rate is greater than the statutory income tax rate of 35% primarily as a result of a net effect of a $21.5 million expense related to re-measuring the U.S. deferred tax assets as a result of the Tax Act, $5.6 million net expense related to uncertain tax positions and $8.0 million benefit related to foreign tax rate differences. The 2016 effective tax rate is less than the statutory income tax rate of 35%, primarily as a result of a $5.5 million net benefit related to greater levels of income earned in lower tax jurisdictions, $4.8 million net benefit for the release of valuation allowances related to deferred tax assets that were utilized in the current year, $2.0 million in net benefit for the release of valuation allowance, which are deemed no longer necessary based upon changes in the current and expected future years operating profits, $1.8 million benefit related to notional interest deductions, $2.8 million benefit for the generation of tax credits offset by a $4.1 expense related to the impairment of book basis goodwill and a $2.1 million expense related to non-deductible expenses.
Results of Operations - Segment Information
Comparison of t he years ended December 31, 2018 and 2017
Performance Coatings
|
|
|||||||||||||||||||||||||||||
|
|
|||||||||||||||||||||||||||||
|
|
Change due to |
||||||||||||||||||||||||||||
|
|
Volume / |
||||||||||||||||||||||||||||
|
|
2018 |
2017 |
$ Change |
% Change |
Price |
Mix |
Currency |
Acquisitions |
Other |
||||||||||||||||||||
|
|
(Dollars in thousands) |
||||||||||||||||||||||||||||
|
Segment net sales |
$ |
733,926 |
$ |
594,029 |
$ |
139,897 | 23.6 |
% |
$ |
27,082 |
$ |
4,824 |
$ |
(3,714) |
$ |
111,706 |
$ |
— |
|||||||||||
|
Segment gross profit |
165,708 | 145,797 | 19,911 | 13.7 |
% |
27,082 | (842) | 1,707 | 28,046 | (36,082) | |||||||||||||||||||
|
Gross profit as a % of segment net sales |
22.6 |
% |
24.5 |
% |
|||||||||||||||||||||||||
Net sales increased in Performance Coatings by $ 139.9 million compared with the prior year, primarily from sales of Endeka of $89.0 million, SPC of $10.1 million , Quimicer of $7.4 million and Gardenia of $3.3 million, and increases in sales of frits and glazes, digital inks and porcelai n enamel of $14.9 million, $8.0 million and, $5.2 million , respectively. The increase in net sales was driven b y higher product pricing of $27.1 million, sales from acquisitions of $11 1 .7 milli on an d favorable volume and mix of $4.8 million, partially offset by un favorabl e foreign currency impacts of $3 .7 million . Gross profit increas ed $19.9 million from the prior-year , primarily driven by favorable product pricing impacts o f $27.1 million, gross profit from acquisitions of $28.0 million, favorabl e foreign currency impacts of $1.7 mill ion and lower manufacturing costs of $0.9 million , partially offset by higher raw material costs of $37.0 million and lower sales volume and mix of $0.8 million .
|
|
||||||||||||
|
|
2018 |
2017 |
$ Change |
% Change |
||||||||
|
|
(Dollars in thousands) |
|||||||||||
|
Segment net sales by Region |
||||||||||||
|
EMEA |
$ |
475,435 |
$ |
346,199 |
$ |
129,236 | 37.3 |
% |
||||
|
Latin America |
100,818 | 106,640 | (5,822) | (5.5) |
% |
|||||||
|
Asia Pacific |
108,623 | 94,722 | 13,901 | 14.7 |
% |
|||||||
|
United States |
49,050 | 46,468 | 2,582 | 5.6 |
% |
|||||||
|
Net sales |
$ |
733,926 |
$ |
594,029 |
$ |
139,897 | 23.6 |
% |
||||
The net sales increase of $139.9 million was primarily driven by increases in sales from EMEA and Asia Pacific. The increase in sales from EMEA was primarily attributable to sales from acquisitio ns , which contributed $109 .0 million , and higher sales across all product lines. The increase in sales from Asia Pacific was driven by sales from a cquisitions , which contributed $2.7 million , and higher sales of frits and glazes, digital inks and porcelain enamel o f $7.1 million, $2.2 million and $1.6 million, respectively. The increase in sales from the United States was fully attributable to higher sales of porcelain enamel. The decrease in sales from Latin America was driven by lower sales of frits and glazes and porcelain enamel , partially offset by higher sales of digital inks .
29
Performance Colors and Glass
|
|
|||||||||||||||||||||||||||||
|
|
Change due to |
||||||||||||||||||||||||||||
|
|
Volume / |
||||||||||||||||||||||||||||
|
|
2018 |
2017 |
$ Change |
% Change |
Price |
Mix |
Currency |
Acquisitions |
Other |
||||||||||||||||||||
|
|
(Dollars in thousands) |
||||||||||||||||||||||||||||
|
Segment net sales |
$ |
487,455 |
$ |
444,653 |
$ |
42,802 | 9.6 |
% |
$ |
4,546 |
$ |
11,747 |
$ |
6,326 |
$ |
20,184 |
$ |
— |
|||||||||||
|
Segment gross profit |
167,446 | 157,544 | 9,902 | 6.3 |
% |
4,546 | (342) | 2,307 | 4,712 | (1,321) | |||||||||||||||||||
|
Gross profit as a % of segment net sales |
34.4 |
% |
35.4 |
% |
|||||||||||||||||||||||||
N et sales increas e d $42.8 million compared with the prior year, primarily driven by $12.2 million in sales from Dip-Tech and $12.9 million in sales from electronics products . The increase in net sales was driven b y sales from acquisitions of $20.2 million, f avorable volume and mix of $11.7 million, favorabl e foreign currency impacts of $6.3 million and higher product pricing of $4.6 million. Gross profit increased from the prior year , primarily due to gross profit from acquisitions of $4.7 million, higher product pricing of $4.6 million, favor able manufacturing costs of $3.1 million and favorabl e foreign currency impacts of $2 .3 million, partially offset by higher raw material costs of $4.4 million and lo wer sales volume a nd mix of $0.3 millio n .
|
|
||||||||||||
|
|
2018 |
2017 |
$ Change |
% Change |
||||||||
|
|
(Dollars in thousands) |
|||||||||||
|
Segment net sales by Region |
||||||||||||
|
EMEA |
$ |
235,238 |
$ |
203,280 |
$ |
31,958 | 15.7 |
% |
||||
|
United States |
157,963 | 155,284 | 2,679 | 1.7 |
% |
|||||||
|
Asia Pacific |
71,124 | 64,853 | 6,271 | 9.7 |
% |
|||||||
|
Latin America |
23,130 | 21,236 | 1,894 | 8.9 |
% |
|||||||
|
Net sales |
$ |
487,455 |
$ |
444,653 |
$ |
42,802 | 9.6 |
% |
||||
The net sales increase of $42.8 million was driven by higher sales from all regions. The increase in sales from EMEA was primarily attributable to $10 .5 million in sales from acquisitions and higher sales from all product groups. The increase from Asia Pacific was primarily due to an increase in sa les of automotive products of $3.9 million and sales from acquisitions of $2.3 million. The increase in sales from the United States was primarily attributable an increase in sales from acquisitions of $7 . 2 million, partially off set by lower sales of automotive products and industrial products. The increase in sales from Latin America was primarily attributable to sales in automotive products and industrial products, partially offset by lower sales of decoration products.
Color Solutions
|
|
|||||||||||||||||||||||||||||
|
|
Change due to |
||||||||||||||||||||||||||||
|
|
Volume / |
||||||||||||||||||||||||||||
|
|
2018 |
2017 |
$ Change |
% Change |
Price |
Mix |
Currency |
Acquisitions |
Other |
||||||||||||||||||||
|
|
(Dollars in thousands) |
||||||||||||||||||||||||||||
|
Segment net sales |
$ |
391,027 |
$ |
358,060 |
$ |
32,967 | 9.2 |
% |
$ |
11,520 |
$ |
11,933 |
$ |
4,640 |
$ |
4,874 |
$ |
— |
|||||||||||
|
Segment gross profit |
124,852 | 113,694 | 11,158 | 9.8 |
% |
11,520 | 8,720 | 1,268 | 1,292 | (11,643) | |||||||||||||||||||
|
Gross profit as a % of segment net sales |
31.9 |
% |
31.8 |
% |
|||||||||||||||||||||||||
30
Net sales increased $33.0 million compared with th e prior year, primarily due to higher sales of surface technology products and pigments of $19.7 million and $8.7 million , respectively. The increase in net sales was driven by higher volume and mix of $11.9 million, higher product pricing of $11.5 million, sales from acquisitions of $4.9 million and favorabl e foreign currency impacts of $4.6 mill ion . Gross profit increased from the prior year , primarily due t o higher product pricing of $11.5 million, favo ra ble sales volume and mix of $8.7 million, gross profit from acquisitions of $1.3 million and favorable foreign currency impacts of $1.3 million , partially offset by higher raw material costs of $10 .4 million and higher manufacturing costs of $1.2 million.
|
|
||||||||||||
|
|
2018 |
2017 |
$ Change |
% Change |
||||||||
|
|
(Dollars in thousands) |
|||||||||||
|
Segment net sales by Region |
||||||||||||
|
United States |
$ |
172,901 |
$ |
154,730 |
$ |
18,171 | 11.7 |
% |
||||
|
EMEA |
142,102 | 134,122 | 7,980 | 5.9 |
% |
|||||||
|
Asia Pacific |
41,642 | 36,343 | 5,299 | 14.6 |
% |
|||||||
|
Latin America |
34,382 | 32,865 | 1,517 | 4.6 |
% |
|||||||
|
Net sales |
$ |
391,027 |
$ |
358,060 |
$ |
32,967 | 9.2 |
% |
||||
The net sales increase of $33.0 million was driven by higher sales from all regions. The higher sales from EMEA, Asia Pacific and Latin America were driven by sales of pigment products. The increase in sales from the United States was primarily driven by sales of surface technology products.
Comparison of the years ended December 31, 2017 and 2016
Performance Coatings
|
|
|||||||||||||||||||||||||||||
|
|
|||||||||||||||||||||||||||||
|
|
Change due to |
||||||||||||||||||||||||||||
|
|
Volume / |
||||||||||||||||||||||||||||
|
|
2017 |
2016 |
$ Change |
% Change |
Price |
Mix |
Currency |
Acquisitions |
Other |
||||||||||||||||||||
|
|
(Dollars in thousands) |
||||||||||||||||||||||||||||
|
Segment net sales |
$ |
594,029 |
$ |
526,981 |
$ |
67,048 | 12.7 |
% |
$ |
4,319 |
$ |
24,437 |
$ |
(4,657) |
$ |
42,949 |
$ |
— |
|||||||||||
|
Segment gross profit |
145,797 | 139,454 | 6,343 | 4.5 |
% |
4,319 | 6,550 | (572) | 9,512 | (13,466) | |||||||||||||||||||
|
Gross profit as a % of segment net sales |
24.5 |
% |
26.5 |
% |
|||||||||||||||||||||||||
Net sales increased in Performance Coatings by $67.0 million compared with the prior year, primarily driven by sales from SPC of $22.6 million, sales from Endeka of $18.3 million, and by organic g rowth across all product lines. The increase in net sales included higher sales volume and mix of $24.4 million, sales from acquisitions of $42.9 million and higher product pricing of $4.3 million, partially offset by unfavorable foreign currency impacts of $4.7 million. Gross profit increased $6.3 million from the prior year, primarily driven by gross profit from acquisitions of $9.5 million, lower manufacturing and product costs of $13.0 million, higher sales volumes and mix of $6.6 million and favorable product pricing impacts of $4.3 million, partially offset by higher raw material costs of $26.5 million, and unfavorable foreign currency impacts of $0.6 million.
|
|
||||||||||||
|
|
2017 |
2016 |
$ Change |
% Change |
||||||||
|
|
(Dollars in thousands) |
|||||||||||
|
Segment net sales by Region |
||||||||||||
|
EMEA |
$ |
346,199 |
$ |
289,780 |
$ |
56,419 | 19.5 |
% |
||||
|
Latin America |
106,640 | 101,565 | 5,075 | 5.0 |
% |
|||||||
|
Asia Pacific |
94,722 | 89,573 | 5,149 | 5.7 |
% |
|||||||
|
United States |
46,468 | 46,063 | 405 | 0.9 |
% |
|||||||
|
Net sales |
$ |
594,029 |
$ |
526,981 |
$ |
67,048 | 12.7 |
% |
||||
Net sales increased by $67.0 million with increases in sales from all regions. T he increase in sales from EMEA was primarily driven by sales from SPC of $22.6 million, sales from Endeka of $16.8 million, and an increase in sales of porcelain enamel and colors
31
of $5.7 million and $5.5 million, respectively. The sales increase from Latin America was primarily driven by higher sales of frits and glazes and porcelain enamel of $3.4 million and $1.4 million, respectively. The sales increase from Asia Pacific was primarily driven by higher sales of digital inks, sales from Endeka and higher sales of porcelain enamel of $4.4 million, $1.6 million and $1.2 million, respectively, partially offset by a decrease of frits and glazes sales of $1.8 million. The increase in sales from the United States was attributable to higher sales of porcelain enamel.
Performance Colors and Glass
|
|
|||||||||||||||||||||||||||||
|
|
Change due to |
||||||||||||||||||||||||||||
|
|
Volume / |
||||||||||||||||||||||||||||
|
|
2017 |
2016 |
$ Change |
% Change |
Price |
Mix |
Currency |
Acquisitions |
Other |
||||||||||||||||||||
|
|
(Dollars in thousands) |
||||||||||||||||||||||||||||
|
Segment net sales |
$ |
444,653 |
$ |
371,464 |
$ |
73,189 | 19.7 |
% |
$ |
2,557 |
$ |
6,794 |
$ |
2,472 |
$ |
61,366 |
$ |
— |
|||||||||||
|
Segment gross profit |
157,544 | 133,997 | 23,547 | 17.6 |
% |
2,557 | (1,946) | 685 | 21,198 | 1,053 | |||||||||||||||||||
|
Gross profit as a % of segment net sales |
35.4 |
% |
36.1 |
% |
|||||||||||||||||||||||||
The net sales increase of $73.2 million was primarily attributable to sales from ESL of $38.2 million and Dip-Tech of $18.2 million and organic growth in decoration products of $12.5 million. The increase in net sales included sales from acquisitions of $61.4 million, favorable volume and mix of $6.8 million, higher product pricing of $2.6 million and favorable foreign currency impacts of $2.5 million. Gross profit increased from the prior year, primarily due to gross profit from acquisitions of $21.2 million, favorable manufacturing and product costs of $4.8 million, higher product pricing of $2.6 million and favorable foreign currency impacts of $0.7 million, partially offset by unfavorable raw material costs of $3.8 million and low er sales volumes and mix of $1.9 million.
|
|
||||||||||||
|
|
2017 |
2016 |
$ Change |
% Change |
||||||||
|
|
(Dollars in thousands) |
|||||||||||
|
Segment net sales by Region |
||||||||||||
|
EMEA |
$ |
203,280 |
$ |
160,475 |
$ |
42,805 | 26.7 |
% |
||||
|
United States |
155,284 | 132,432 | 22,852 | 17.3 |
% |
|||||||
|
Asia Pacific |
64,853 | 59,121 | 5,732 | 9.7 |
% |
|||||||
|
Latin America |
21,236 | 19,436 | 1,800 | 9.3 |
% |
|||||||
|
Net sales |
$ |
444,653 |
$ |
371,464 |
$ |
73,189 | 19.7 |
% |
||||
The net sales increase of $73.2 million was driven by higher sales from all regions. T he increase in sales from EMEA was primarily attributable to sales from acquisitions and higher sales of decoration products of $9.6 million. The increase in sales from the United States was driven by sales from ESL of $24.5 million and Dip-Tech of $3.3 million, partially offset by a decrease in sales of industrial products of $5.9 million. The increase from Asia Pacific was primarily du e to higher sales of automotive and decoration products of $3.9 million and $1.1 million, respectively. The increase from Latin America was primarily driven by an increase in sales of decoration products of $2.1 million, partially offset by a decrease in sales of automotive and industrial products.
Color Solutions
|
|
|||||||||||||||||||||||||||||
|
|
Change due to |
||||||||||||||||||||||||||||
|
|
Volume / |
||||||||||||||||||||||||||||
|
|
2017 |
2016 |
$ Change |
% Change |
Price |
Mix |
Currency |
Acquisitions |
Other |
||||||||||||||||||||
|
|
(Dollars in thousands) |
||||||||||||||||||||||||||||
|
Segment net sales |
$ |
358,060 |
$ |
246,847 |
$ |
111,213 | 45.1 |
% |
$ |
6,063 |
$ |
32,537 |
$ |
1,003 |
$ |
71,610 |
$ |
— |
|||||||||||
|
Segment gross profit |
113,694 | 84,466 | 29,228 | 34.6 |
% |
6,063 | 4,820 | 202 | 16,213 | 1,930 | |||||||||||||||||||
|
Gross profit as a % of segment net sales |
31.8 |
% |
34.2 |
% |
|||||||||||||||||||||||||
32
Net sales increased $111.2 million compared with the prior year, primarily due to sales from Cappelle of $69.5 million, and higher sales of pigments and surface technology products of $28.8 million an d $12.7 million, respectively. The increase in net sales was driven by sales from acquisitions of $71.6 million, higher volumes and mix of $32.5 million, higher product pricing of $6.1 million and favorable foreign cur rency impacts of $1.0 million. Gross profit increased from the prior year, due to gross profit from acquisitions of $16.2 million, lower manufacturing and product costs of $10.9 million, higher product pricing of $6.1 million, higher sales volumes and mix of $4.8 million and favorable foreign currency impacts of $0.2 million, partially offset by unfavorable raw material costs of $9.0 million.
|
|
||||||||||||
|
|
2017 |
2016 |
$ Change |
% Change |
||||||||
|
|
(Dollars in thousands) |
|||||||||||
|
Segment net sales by Region |
||||||||||||
|
United States |
$ |
154,730 |
$ |
121,692 |
$ |
33,038 | 27.1 |
% |
||||
|
EMEA |
134,122 | 64,800 | 69,322 | 107.0 |
% |
|||||||
|
Asia Pacific |
36,343 | 30,770 | 5,573 | 18.1 |
% |
|||||||
|
Latin America |
32,865 | 29,585 | 3,280 | 11.1 |
% |
|||||||
|
Net sales |
$ |
358,060 |
$ |
246,847 |
$ |
111,213 | 45.1 |
% |
||||
The net sales increase of $111.2 million was driven by higher sales fro m all regions. T he increase in sales from EMEA was primarily driven by sales from Cappelle of $58.3 million and higher sales of pigments of $11.0 million. The increase in sales from the United States was primarily driven by sales from Cappelle of $11.2 million, surface technology products of $12.7 millio n and pigments of $9.0 million. The increases in sales from Asia Pacific and Latin America of $5.6 million and $3.3 million, respectively, were driven by an increase in pigments sales.
Summary of Cash Flows for the years ended December 31, 2018 , 2017 , and 2016
|
|
|||||||||
|
|
2018 |
2017 |
2016 |
||||||
|
|
(Dollars in thousands) |
||||||||
|
Net cash provided by operating activities |
$ |
182,793 |
$ |
84,790 |
$ |
62,630 | |||
|
Net cash (used for) investing activities |
(148,516) | (178,911) | (150,822) | ||||||
|
Net cash provided by financing activities |
9,367 | 108,363 | 81,997 | ||||||
|
Effect of exchange rate changes on cash and cash equivalents |
(2,894) | 3,727 | (6,603) | ||||||
|
Increase (decrease) in cash and cash equivalents |
$ |
40,750 |
$ |
17,969 |
$ |
(12,798) | |||
Operating activities. Cash flows from operating activities increased $98.0 million in 2018 compared to 2017 . The increase was primarily due to higher cash in flow s for net working capital of $68 .5 million and other curre nt assets an d liabilities of $28 .2 million.
Cash flows from operating activities increased $22.2 million in 2017 compared to 2016 . The increase was primarily due to higher earnings after consideration of non-cash items, partially offset by higher cash outflows for net working capital of $15.7 million and other current assets and liabilities of $38.1 million.
Investing activities. Cash flows used in investing activities decreased $30.4 million in 2018 . The de crease was primarily due to lower cash outflows for business acquisitions, net of cash acquired of $56.2 million, partially offset by higher cash outflows for capital expenditures of $30.1 million .
Cash flows from investing activities decreased app roximately $28.1 million in 2017 . The decrease was primarily due to higher cash outflows for capital expenditures of $25.6 million.
Financing activities. Cash flows from financing activities de creased $99.0 million in 2018 compared with 2017 . As further discussed in Note 9, during 2018, we paid off our Credit Facility and entered into our Amended Credit Facility, consisting of a $500 million secured revolving line of credit and $820 million secured term loan facilities. Further, compared to the prior year , purchase of treasury stock increased by $28.8 million.
Cash flows from financing activities increased $26.4 million in 2017 compared with 2016. As further discussed in Note 9 , we paid off our 2014 Credit Facility and entered into our new Credit Facility, consisting of a $400 million secured revolving line of credit,
33
a $357.5 million secured term loan facility and a €250 million secured euro term loan facility. This transaction resulted in additional borrowings in 2017 o f $53.6 million compared to 2016. Further, compared to 2016 , net repayments under loans payable was $24.2 million h igher. Additionally, during 2017 , we paid debt issuance costs related to the Credit Facility entered into during the period, partially offset by no repurchases of com mon stock being made during 2017 .
We have paid no dividends on our common stock since 2009.
34
Capital Resources and Liquidity
Major debt instruments that were outstanding during 2018 are described below.
Amended Credit Facility
On April 25, 2018 , the Company entered into an amendment (the “Amended Credit Facility”) to its existing credit facility (the “Credit Facility”) which Amended Credit Facility (a) provided a new revolving facility (the “2018 Revolving Facility”), which replaced the Company’s existing revolving facility, (b) repriced the (“Tranche B-1 Loans”), (c) provided new tranches of term loans (“Tranche B-2 Loans” and “Tranche B-3 Loans”) denominated in U.S. dollars and will be used for ongoing working capital requirements and general corporate purpose s. The Tranche B-2 Loans are borrowed by the Compa ny and the Tranche B-3 Loans are borrowed on a joint and several basis by Ferro GmbH and Ferro Europe Holdings LLC.
The Amended Credit Facility consists of a $500 million secured revolving line of credit with a maturity of February 2023, a $355 million secured term loan facility with a maturity of February 2024, a $235 million secured term loan facility with a maturity of February 2024 and a $230 million secured term loan facility with a maturity of February 2024. The term loans are payable in equal quarterly installments in an amount equal to 0.25% of the original principal amount of the term loans, with the remaining balance due on the maturity date thereof. In addition, the Company is required, on an annual basis, to make a prepayment in an amount equal to a portion of the Company’s excess cash flow, as calculated pursuant to the Amended Credit Facility, which prepayment will be applied first to the term loans until they are paid in full, and then to the revolving loans.
Subject to the satisfaction of certain conditions, the Company can request additional commitments under the revolving line of credit or term loans in the aggregate principal amount of up to $250 million to the extent that existing or new lenders agree to provide such additional commitments and/or term loans. The Company can also raise certain additional debt or credit facilities subject to satisfaction of certain covenant levels.
Certain of the Company’s U.S. subsidiaries have guaranteed the Company’s obligations under the Amended Credit Facility and such obligations are secured by (a) substantially all of the personal property of the Company and the U.S. subsidiary guarantors and (b) a pledge of 100% of the stock of certain of the Company’s U.S. subsidiaries and 65% of the stock of certain of the Company’s direct foreign subsidiaries. The Tranche B-3 Loans are guaranteed by the Company, the U.S. subsidiary guarantors and a cross-guaranty by the borrowers of the Tranche B-3 Loans, and are secured by the collateral securing the revolving loans and the other term loans, in addition to a pledge of the equity interests of Ferro GmbH.
Interest Rate – Term Loans: The interest rates applicable to the term loans will be, at the Company’s option, equal to either a base rate or a LIBOR rate plus, in both cases, an applicable margin.
|
|
· |
|
The base rate for term loans will be the highest of (i) the federal funds rate plus 0.50%, (ii) syndication agent’s prime rate, (iii) the daily LIBOR rate plus 1.00% or (iv) 0.00%. The applicable margin for base rate loans is 1.25%. |
|
|
· |
|
The LIBOR rate for term loans shall not be less than 0.0% and the applicable margin for LIBOR rate term loans is 2.25%. |
|
|
· |
|
For LIBOR rate term loans, the Company may choose to set the duration on individual borrowings for periods of one, two, three or six months, with the interest rate based on the applicable LIBOR rate for the corresponding duration. |
At December 31, 2018, the Company had borrowed $ 352.3 million under the Tranche B-1 Loans at an interest rate of 5.05 %, $233.2 million under the Tranche B-2 Loans at an interest rate of 5.05 %, and $228.3 million under the Tranche B-3 Loans at an interest rate of 5.05 %. At December 31, 2018, there were no additional borrowings available under the Tranche B-1 Loans, Tranche B-2 Loans and Tranche B-3 Loans. We entered into swap agreements in the second quarter of 2018. At December 31, 2018, the effective int erest rate for the Tranche B-1 Loans, Tranche B-2 Loans, and Tranche B-3 Loans, after adjusting for the interest rate swap , was 5.19 % , 3.43 % , and 2.48%, respectively .
Interest Rate – Revolving Credit Line: The interest rates applicable to loans under the 2018 Revolving Credit Facility will be, at the Company’s option, equal to either a base rate or a LIBOR rate plus, in both cases, an applicable variable margin. The variable margin will be based on the ratio of (a) the Company’s total consolidated net debt outstanding (as defined in the Amended Credit Agreement) at such time to (b) the Company’s consolidated EBITDA (as defined in the Amended Credit Agreement) computed for the period of four consecutive fiscal quarters most recently ended.
35
|
|
· |
|
The base rate for revolving loans will be the highest of (i) the federal funds rate plus 0.50%, (ii) syndication agent’s prime rate, (iii) the daily LIBOR rate plus 1.00% or (iv) 0.00%. The applicable margin for base rate loans will vary between 0.50% to 1.50%. |
|
|
· |
|
The LIBOR rate for revolving loans shall not be less than 0% and the applicable margin for LIBOR rate revolving loans will vary between 1.50% and 2.50%. |
|
|
· |
|
For LIBOR rate revolving loans, the Company may choose to set the duration on individual borrowings for periods of one, two, three or six months, with the interest rate based on the applicable LIBOR rate for the corresponding duration. |
At December 31, 2018, there were no borrowings under the 2018 Revolving Credit Facility . After reductions for outstanding letters of credit secured by these facilities, we had $495.3 million of additional borrowings available under the revolving credit facilities at December 31, 2018.
The Amended Credit Facility contains customary restrictive covenants including, but not limited to, limitations on use of loan proceeds, limitations on the Company’s ability to pay dividends and repurchase stock, limitations on acquisitions and dispositions, and limitations on certain types of investments. The Amended Credit Facility also contains standard provisions relating to conditions of borrowing and customary events of default, including the non-payment of obligations by the Company and the bankruptcy of the Company.
Specific to the 2018 Revolving Facility, the Company is subject to a financial covenant regarding the Company’s maximum leverage ratio. If an event of default occurs, all amounts outstanding under the Amended Credit Facility agreement may be accelerated and become immediate ly due and payable. At December 31 , 2018, we were in compliance with the covenants of the Amended Credit Facility.
Credit Facility
On February 14, 2017 , the Company entered into a credit facility (the “Credit Facility”) with a group of lenders to refinance its then outstanding credit facility debt and to provide liquidity for ongoing working capital requirements and general corporate purposes.
The Credit Facility consisted of a $400 million secured revolving line of credit with a term of five years, a $357.5 million secured term loan facility with a term of seven ye ars and a €250 million secured E uro term loan facility with a term of seven years. The term loans were payable in equal quarterly installments in an amount equal to 0.25% of the original principal amount of the term loans, with the remaining balance due on the maturity date there of. In addition, the Company was required, on an annual basis, to make a prepaym ent of term loans until they were fully paid and then to the revolving loans in an amount equal to a portion of the Company’s excess cash flow, as calculated pursuant to the Credit Facility.
Subject to the satisfaction of cer tain conditions, the Company could request additional commitments under the revolving line of credit or term loans in the aggregate principal amount of up to $250 million , to the extent that existing or new lenders agree to provide such additional co mmitments an d/or term loans. The Company could also raise c ertain additional debt or credit facilities subject to satisfaction of certain covenant levels.
Certain of the Company’s U.S. subsidiaries guaranteed the Company’s obligations under the Credit F acility and such obligations were secured by (a) substantially all of the personal property of the Company and the U.S. subsidiary guarantors and (b) a pledge of 100% of the stock of certain of the Company’s U.S. subsidiaries and 65% of the stock of certain of the Company’s direct foreign subsidiaries.
Interest Rate – Term Loans: The interest rates applicabl e to the U.S. term loans was , at the Company’s option, equal to either a base rate or a LIBOR rate plus, in both cases, an applicable margin. The interest rates applicabl e to the Euro term loans was a Euro Interbank Offered Rate (“EURIBOR”) rate plus an applicable margin.
|
|
· |
|
The base rate for U.S. term loans will be the highest of (i) the federal funds rate plus 0.50%, (ii) syndication agent’s prime rate or (iii) the daily LIBOR rate plus 1.00%. The applicable margin for base rate loans is 1.50%. |
|
|
· |
|
The LIBOR rate for U.S. term loans shall not be less than 0.75% and the applicable margin for LIBOR rate U.S. term loans is 2.50%. |
36
|
|
· |
|
The EURIBOR rate for Euro term loans shall not be less than 0% and the applicable margin for EURIBOR rate loans is 2.75%. |
|
|
· |
|
For LIBOR rate term loans and EURIBOR rate term loans, the Company may choose to set the duration on individual borrowings for periods of one, two, three or six months, with the interest rate based on the applicable LIBOR rate or EURIBOR rate, as applicable, for the corresponding duration. |
At December 31, 2017 , the Company had borrowed $354.8 million under the secured term loan facility at an interest rate of 4.07 % and € 248.1 million (approximately $297.9 million) under the secured E uro term loan facility at an interest rate of 2.75%. At December 31, 2017 , there were no additional borrowings available under the term loan facilities. We entered into interest rate swap agreements in the second quarter of 2017. These swaps converted $150 million and €90 million of our term loans from variable interest rates to fixed interest rates. At December 31, 2017, the effective interest rate for the term loan facilities after adjusting for the interest rate swap was 4.27% for the secured term loan facility and 3.00% for the E uro term loan facility.
Interest Rate – Revolving Credit Line: The interest rates applicable to loans under t he revolving credit line was , at the Company’s option, equal to either a base rate or a LIBOR rate plus, in both cases, an applicable variable marg in. The variable margin was based on the ratio of (a) the Company’s total consolidated net debt outstanding at such time to (b) the Company’s consolidated EBITDA computed for the period of four consecutive fiscal quarters most recently ended.
|
|
· |
|
The base rate for revolving loans will be the highest of (i) the federal funds rate plus 0.50%, (ii) syndication agent’s prime rate or (iii) the daily LIBOR rate plus 1.00%. The applicable margin for base rate loans will vary between 0.75% and 1.75%. |
|
|
· |
|
The LIBOR rate for revolving loans shall not be less than 0% and the applicable margin for LIBOR rate revolving loans will vary between 1.75% and 2.75%. |
|
|
· |
|
For LIBOR rate revolving loans, the Company may choose to set the duration on individual borrowings for periods of one, two, three or six months, with the interest rate based on the applicable LIBOR rate for the corresponding duration. |
At December 31, 2017 , there were $78.0 million borrowings under the revolving credit line at an interest rate of 3.63 %. After reductions for outstanding letters of credit secured by these facilities, we had $317.3 million of additional borrowings available under the revolving credit facilities at December 31, 2017 .
In conjunction with the refinancing of the Credit Facility, we recorded a charge of $3.2 million in connection with the write-off of unamortized issuance costs, which is recorded within Loss on extinguishment of debt in our consolidated statement of operations for the year ended December 31, 2018.
2014 Credit Facility
In 2014, the Company entered into a credit facility that was amended on January 25, 2016, and August 29, 2016, resulting in a $400 million secured revolving line of credit with a term of five years and a $300 million secured term loan facility with a term of seven years from the original issuance date (the “2014 Credit Facility”) with a group of lenders that was replaced on February 14, 2017, by the Credit Facility (as defined above).
In conjunction with the refinancing of the 2014 Credit Facility, we recorded a charge of $3.9 million in connection with the write-off of unamortized issuance costs, which is recorded within Loss on extinguishment of debt in our consolidated statement of operations for the year ended December 31, 2017.
Off Balance Sheet Arrangements
Consignment and Customer Arrangements for Precious Metals. We use precious metals, primarily silver, in the production of some of our products. We obtain most precious metals from financial institutions under consignment agreements . The financial institutions retain ownership of the precious metals and charge us fees based on the amounts we consign and the period of consignment. These fees were $ 2.1 million, $1.2 million and $0.8 million for 2018 , 2017 , and 2016 , respectively. We had on hand precious metals owned by participants in our precious metals consignment program of $ 55 . 2 mill ion at December 31, 2018 and $37 .7 million at December 31, 2017 , measured at fair value based on market prices for identical assets and net of credits.
37
The consignment agreements under our precious metals program involve short-term commitments that typically mature within 30 to 90 days of each transaction and are typically renewed on an ongoing basis. As a result, the Company relies on the continued willingness of financial institutions to participate in these arrangements to maintain this source of liquidity. On occasion, we have been required to deliver cash collateral. While no deposits were outstanding at December 31, 2018 , or December 31, 2017 , we may be required to furnish cash collateral in the future based on the quantity and market value of the precious metals under consignment and the amount of collateral-free lines provided by the financial institutions. The amount of cash collateral required is subject to review by the financial institutions and can be changed at any time at their discretion, based in part on their assessment of our creditworthiness.
International Receivable Sales Programs
We have several international programs to sell without recourse trade accounts receivable to financial institutions. These transactions are treated as a sale and are accounted for as a reduction in accounts receivable because the agreements transfer effective control over and risk related to the receivables to the buyers. The Company continues to service the receivables sold in exchange for a fee. The program, whose maximum capacity is 100 million Euro, is scheduled to expire in December 2023. At December 31, 2018 the outstanding principal amount of receivables sold under this program was $71.3 million. The carrying amount of deferred purchase price was $23.0 million and is recorded in Other Receivables.
Bank Guarantees and Standby Letters of Credit.
At December 31, 2018 , the Company and its subsidiaries had bank guarantees and standby letters of credit issued by financial institutions that totaled $ 6 .7 million. These agreements primarily relate to Ferro’s insurance programs, foreign energy purchase contracts and foreign tax payments.
Other Financing Arrangements
We maintain other lines of credit to provide global flexibility for Ferro’s short-term liquidity requirements. These facilities are uncommitted lines for our international operations and totaled $ 41.4 million at December 31, 2018 . We had $30.3 million of additional borrowings available under these lines at December 31, 2018 .
Liquidity Requirements
Our primary sources of liquidity are available cash and cash equivalents, available lines of credit under the Amended Credit Facility , and cash flows from operating activities. As of December 31, 2018 , we had $ 104.3 million of cash and cash equivalents . Cash generated in the U.S. is generally used to pay down amounts outstanding under our 2018 Revolving F acility and for general corporate purposes , including acquisitions . If needed, we could repatriate the majority of cash held by foreign subsidiaries without the need to accrue and pay U.S. income taxes. We do not anticipate a liquidity need requiring such repatriation of these funds to the U.S.
Our liquidity requirements primarily include debt service, purchase commitments, labor costs, working capital requirements, restructuring expenditures, acquisition costs, capital investments, precious metals cash collateral requirements, and postretirement benefit obligations. We expect to meet these requirements in the long term through cash provided by operating activities and availability under existing credit facilities or other financing arrangements. Cash flows from operating activities are primarily driven by earnings before noncash charges an d changes in working capital needs. In 2018 , cash flows from operating activities were used to fund our investing activities. Additionally , we used the borrowings available under the Amended Credit Facility to fund acquisitio ns an d for other general business purposes . We had a dditional borrowing capacity of $ 525 . 6 million at December 31, 2018 , available under various credit facilities, primarily our revolving credit facility.
Our Amended Credit F acility contains customary restrictive covenants, including those described in more detail in Note 9 to the consolidated financial statements under Item 8 of this Annual Report on Form 10-K. These covenants include customary restrictions, including, but not limited to, limitations on use of loan proceeds, limitations on the Company’s ability to pay dividends and repurchase stock, limitations on acquisitions and dispositions, and limitations on certain types of investments. Specific to the 2018 Revolving F acility, we are subject to a financial covenant regarding the Company’s maximum leverage ratio. This covenant under our Amended Credit Facility restricts the amount of our borrowings, reducing our flexibility to fund ongoing operations and strategic initiatives. This
38
facility is described in more detail in “Capital Resources and Liquidity” under Item 7 and in Note 9 to the consolidated financial statements under Item 8 of this Annual Report on Form 10-K.
As of December 31, 2018 , we were in compliance with our maximum leverage ratio covenant of 4.25x as our actual ratio was 2 . 60 , p roviding $116.9 million of EBITDA cushion on the leverage ratio, as defined within the Amended Credit Facility. To the extent that economic conditions in key markets deteriorate or we are unable to meet our business projections and EBITDA falls below approximately $ 184 million for a rolling four quarters, based on reasonably consistent net debt levels with those as of December 31 , 2018 , we could become unable to maintain compliance with our leverage ratio covenant. In such case, our lenders could demand immediate payment of outstanding amounts and we would need to seek alternate financing sources to pay off such debts and to fund our ongoing operations. Such financing may not be available on favorable terms, if at all.
Difficulties experienced in global capital markets could affect the ability or willingness of counterparties to perform under our various lines of credit, forward contracts, and precious metals program. These counterparties are major, reputable, multinational institutions, all having investment-grade credit ratings. Accordingly, we do not anticipate counterparty default. However, an interruption in access to external financing could adversely affect our business prospects and financial condition.
We assess on an ongoing basis our portfolio of businesses, as well as our financial and capital structure, to ensure that we have sufficient capital and liquidity to meet our strategic objectives. As part of this process, from time to time we evaluate the possible divestiture of businesses that are not critical to our core strategic objectives and, where appropriate, pursue the sale of such businesses and assets. We also evaluate and pursue acquisition opportunities that we believe will enhance our strategic position such as the a cquisitions we completed in 2018, 2017 and 2016 . Generally, we publicly announce material divestiture and acquisition transactions only when we have entered into a material definitive agreement or closed on those transactions.
Th e Company’s aggregate amount of contractual obligations for the next five years and thereafter is set forth below:
|
|
|||||||||||||||||||||
|
|
|||||||||||||||||||||
|
2019 |
2020 |
2021 |
2022 |
2023 |
Thereafter |
Totals |
|||||||||||||||
|
(Dollars in thousands) |
|||||||||||||||||||||
|
Loans Payable (1) |
$ |
50 |
$ |
— |
$ |
— |
$ |
— |
$ |
— |
$ |
— |
$ |
50 | |||||||
|
Long-term debt (2) |
10,575 | 9,671 | 9,393 | 10,203 | 9,131 | 778,077 | 827,050 | ||||||||||||||
|
Interest (3) |
311 | 256 | 256 | 256 | 256 | 3,548 | 4,883 | ||||||||||||||
|
Operating lease obligations |
11,419 | 7,314 | 5,302 | 3,301 | 1,971 | 2,401 | 31,708 | ||||||||||||||
|
Purchase commitments (4) |
27,425 | 7,629 | 7,189 | 6,087 | 2,047 | 3,651 | 54,028 | ||||||||||||||
|
Taxes (5) |
5,986 |
— |
— |
— |
— |
— |
5,986 | ||||||||||||||
|
Retirement and other postemployment benefits (6) |
9,819 | 9,916 |
— |
— |
— |
— |
19,735 | ||||||||||||||
|
|
$ |
65,585 |
$ |
34,786 |
$ |
22,140 |
$ |
19,847 |
$ |
13,405 |
$ |
787,677 |
$ |
943,440 | |||||||
_____________________
|
|
(1) |
|
Loans Payable includ es our loans payable to banks. |
|
|
(2) |
|
Long-term debt excludes imputed interest and executory costs on capitalized lease obligations and unamortized issuance costs on the term loan facility. |
|
|
(3) |
|
Interest represents only contractual payments for fixed-rate debt. |
|
|
(4) |
|
Purchase commitments are noncancelable contractual obligations for raw materials and energy , and exclude capital expenditures for property, plant and equipment . |
|
|
(5) |
|
We have not projected payments past 2019 due to uncertainties in estimating the amount and period of any payments. The amount above relates to our current income tax liability as of December 31, 2018 . We have $ 22.2 million in gross liabilities related to
39 |
|
unrecog nized tax benefits, including $ 1.8 million of accrued interest and penalties that are not included in the above table since we cannot reasonably predict the timing of cash settlements with various taxing authorities. |
|
|
(6) |
|
The funding amounts are based on the minimum contributions required under our various plans and applicable regulations in each respective country. We have not p rojected contributions past 2020 due to uncertainties regarding the assumptions involved in estimating future required contributions. |
When we prepare our consolidated financial statements we are required to make estimates and assumptions that affect the amounts we report in the consolidated financial statements and footnotes. We consider the policies discussed below to be more critical than other policies because their application requires our most subjective or complex judgments. These estimates and judgments arise because of the inherent uncertainty in predicting future events. Management has discussed the development, selection and disclosure of these policies with the Audit Committee of the Board of Directors.
Revenue Recognition
Under ASC 606, revenues are recognized when control of the promised goods is transferred to our customers, in an amount that reflects the consideration we expect to be entitled to in exchange for those goods. In order to achieve that core principle, the Company applies the following five-step approach: 1) identify the contract with a customer, 2) identify the performance obligations, 3) determine the transaction price, 4) allocate the transaction price to the performance obligations in the contract, and 5) recognize revenue when a performance obligation is satisfied.
In order to ensure the revenue recognition in the proper period, we review material sales contracts for proper cut-off based upon the business practices and legal requirements of each country. For sales of products containing precious metals, we report revenues on a gross basis along with their corresponding cost of sales to arrive at gross profit. We record revenues this way because we act as the principal in the transactions into which we enter.
Restructuring and Cost Reduction Programs
In recent years, we have developed and initiated global cost reduction programs with the objectives of leveraging our global scale, realigning and lowering our cost structure, and optimizing capacity utilization. Management continues to evaluate our businesses, and therefore, there may be additional provisions for new optimization and cost-savings initiatives, as well as changes in estimates to amounts previously recorded, as payments are made or actions are completed.
Restructuring charges include both termination benefits and asset writedowns . We estimate accruals for termination benefits based on various factors including length of service, contract provisions, local legal requirements, projected final service dates, and salary levels. We also analyze the carrying value of long-lived assets and record estimated accelerated depreciation through the anticipated end of the useful life of the assets affected by the restructuring or record an asset impairment. In all likelihood, this accelerated depreciation will result in reducing the net book value of those assets to zero at the date operations cease. While we believe that changes to our estimates are unlikely, the accuracy of our estimates depends on the successful completion of numerous actions. Changes in our estimates could increase our restructuring costs to such an extent that it could have a material impact on the Company’s results of operations, financial position, or cash flows. Other events, such as negotiations with unions and works councils, may also delay the resulting cost savings.
Accounts Receivable and the Allowance for Doubtful Accounts
Ferro sells its products to customers in diversified industries throughout the wo rld. No customer or related group of customers represents greater than 10% of net sales or accounts receivable. We perform ongoing credit evaluations of our customers and require collateral principally for export sales, when industry practices allow and as market conditions dictate, subject to our ability to negotiate secured terms relative to competitive offers. We regularly analyze significant customer accounts and provide for uncollectible accounts based on historical experience, customer payment history, the length of time the receivables are past due, the financial health of the customer, economic conditions, and specific circumstances, as appropriate. Changes in these factors could result in additional allowances. Customer accounts we conclude to be uncollectible or to require excessive collection costs are written off against the allowance for doubtful accounts. Historically, write-offs of uncollectible accounts have been within our expectations.
40
Goodwill
We review goodwill for impairment each year using a measurement date of October 31st or more frequently in the event of an impairment indicator. We annually, or more frequently as warranted, evaluate the appropriateness of our reporting units utilizing operating segments as the starting point of our analysis. In the event of a change in our reporting units, we would allocate goodwill based on the relative fair value. We estimate the fair values of the reporting units associated with these assets using the average of both the income approach and the market approach, which we believe provides a reasonable estimate of the reporting units’ fair values, unless facts and circumstances exist that indicate more representative fair values. The income approach uses projected cash flows attributable to the reporting units over their useful lives and allocates certain corporate expenses to the reporting units. We use historical results, trends and our projections of market growth, internal sales efforts and anticipated cost structure assumptions to estimate future cash flows. Using a risk-adjusted, weighted-average cost of capital, we discount the cash flow projections to the measurement date. The market approach estimates a price reasonably expected to be paid by a market participant in the purchase of similar businesses. If the fair value of any reporting unit was determined to be less than its carrying value, we would proceed to the second step and obtain comparable market values or independent appraisals of its assets and liabilities to determine the amount of any impairment.
The significant assumptions and ranges of assumptions we used in our impairment analyses of goodwill at October 31, 2018 and 2017 , were as follows:
|
|
|||||||
|
Significant Assumptions |
2018 |
2017 |
|||||
|
Weighted-average cost of capital |
13.0% - 14.75 |
% |
11.0% - 13.5 |
% |
|||
|
Residual growth rate |
3.0 |
% |
3.0 |
% |
Our estimates of fair value can be adversely affected by a variety of factors. Reductions in actual or projected growth or profitability at our reporting units due to unfavorable market conditions or significant increases in cost structure could lead to the impairment of any related goodwill. Additionally, an increase in inflation, interest rates or the risk-adjusted, weighted-average cost of capital could also lead to a reduction in the fair value of one or more of our reporting units and therefore lead to the impairment of goodwill.
Based on our 2018 annual impairment test performed as of October 31, 2018 , the fair values of the reporting units tested for impairment exceeded the carrying values of the respective reporting units by amounts ranging from 21.3% to 206 .7% at the 2018 measurement date. The lowest cushion relates to goodwill associated with the Performance Coatings reportable segment, which had a goodwill balance of $44.4 million at December 31, 2018 . A future potential impairment is possible for any of these reporting units if actual results are materially less than forecasted results. Some of the factors that could negatively affect our cash flows and, as a result, not support the carrying values of our reporting units are: new environmental regulations or legal restrictions on the use of our products that would either reduce our product revenues or add substantial costs to the manufacturing process, thereby reducing operating margins; new technologies that could make our products less competitive or require substantial capital investment in new equipment or manufacturing processes; and substantial downturns in economic conditions.
Long-Lived Asset Impairment
The Company’s long-lived assets include property, plant and equipment, and intangible assets. We review property, plant and equipment and intangible assets for impairment whenever events or circumstances indicate that their carrying values may not be recoverable. The following are examples of such events or changes in circumstances:
|
|
· |
|
An adverse change in the bu siness climate of a long-lived asset or asset group; |
|
|
· |
|
An adverse change in the extent or manner in which a long-lived asset or asset group is used or in its physical condition; |
|
|
· |
|
Current operating losses for a long-lived asset or asset group combined with a history of such losses or projected or forecasted losses that demonstrate that the losses will continue; or |
|
|
· |
|
A current expectation that, more likely than not, a long-lived asset or asset group will be sold or otherwise significantly disposed of before the end of its previously estimated useful life. |
The carrying amount of property, plant and equipment and intangible assets is not recoverable if the carrying value of the asset group exceeds the sum of the undiscounted cash flows expected to result from the use and eventual disposition of the asset group. In the event of impairment, we recognize a loss for the excess of the recorded value over fair value. The long-term nature of these assets
41
requires the estimation of cash inflows and outflows several years into the future and only takes into consideration technological advances known at the time of review.
Income Taxes
The breadth of our operations and complexity of income tax regulations require us to assess uncertainties and make judgments in estimating the ultimate amount of income taxes we will pay. Our income tax expense, deferred tax assets and liabilities, and reserves for unrecognized tax benefits reflect management’s best assessment of estimated current and future taxes to be paid. The final income taxes we pay are based upon many factors, including existing income tax laws and regulations, negotiations with taxing authorities in various jurisdictions, outcomes of tax litigation, and resolution of disputes arising from federal, state and international income tax audits. The resolution of these uncertainties may result in adjustments to our income tax assets and liabilities in the future.
Deferred income taxes result from differences between the financial and tax basis of our assets and liabilities. We adjust our deferred income tax assets and liabilities for changes in income tax rates and income tax laws when changes are enacted. We record valuation allowances to reduce deferred income tax assets when it is more likely than not that a tax benefit will not be realized. Significant judgment is required in evaluating the need for and the magnitude of appropriate valuation allowances against deferred income tax assets. The realization of these assets is dependent on generating future taxable income, our ability to carry back or carry forward net operating losses and credits to offset tax liabilities, as well as successful implementation of various tax strategies to generate tax where net operating losses or credit carryforwards exist. In evaluating our ability to realize the deferred income tax assets, we rely principally on the reversal of existing temporary differences, the availability of tax planning strategies, and forecasted income.
We recognize a tax benefit from an uncertain tax position when it is more likely than not that the position will be sustained upon examination, including resolutions of any related appeals or litigation processes, based on the technical merits. Our estimate of the potential outcome of any uncertain tax positions is subject to management’s assessment of relevant risks, facts, and circumstances existing at that time. We record a liability for the difference between the benefit recognized and measured based on a more-likely-than-not threshold and the tax position taken or expected to be taken on the tax return. To the extent that our assessment of such tax positions changes, the change in estimate is recorded in the period in which the determination is made. We report tax-related interest and penalties as a component of income tax expense.
Derivative Financial Instruments
We use derivative financial instruments in the normal course of business to manage our exposure to fluctuations in interest rates, foreign currency exchange rates , and precious metal prices. The accounting for derivative financial instruments can be complex and can require significant judgment. Generally, the derivative financial instruments that we use are not complex, and observable market-based inputs are available to measure their fair value. We do not engage in speculative transactions for trading purposes. The use of financial derivatives is managed under a policy that identifies the conditions necessary to identify the transaction as a financial derivative. Financial instruments, including derivative financial instruments, expose us to counterparty credit risk for nonperformance. We manage our exposure to counterparty credit risk through minimum credit standards and procedures to monitor concentrations of credit risk. We enter into these derivative financial instruments with major, reputable, multinational financial institutions. Accordingly, we do not anticipate counter-party default. We continuously evaluate the effectiveness of derivative financial instruments designated as hedges to ensure that they are highly effective. In the event the hedge becomes ineffective, we discontinue hedge treatment. Except as noted below, we do not expect any changes in our risk policies or in the nature of the transactions we enter into to mitigate those risks.
Our exposure to interest rate changes arises from our debt agreements with variable interest rates. To reduce our exposure to interest rate changes on variable rate debt, we entered into interest rate swap agreements. These swaps are settled in cash, and the net interest paid or received is effectively recognized as interest expense. We mark these swaps to fair value and recognize the resulting gains or losses as other comprehensive income.
We have executed cross currency interest rate swaps to minimize our exposure to floating rate debt agreements denominated in a currency other than functional currency. These swaps are settled in cash, and the net interest paid or received is effectively recognized as interest expense as the interest on the debt is accrued. These swaps are designated as cash flows hedges and we mark these swaps to fair value and recognize the resulting gains or losses as other comprehensive income.
To help protect the value of the Company’s net investment in European operations against adverse changes in exchange rates, the Company uses non-derivative financial instruments, such as its foreign currency denominated debt, as economic hedges of its net
42
investments in certain foreign subsidiaries. In addition , we have executed cross currency interest rate swaps to help protect the value of the Company’s net investment in European operations. These swaps are settled in cash, and the net interest paid or received is effectively recognized as interest expense. We mark these swaps to fair value and recognize the resulting gains or losses as cumulative translation adjustments (a component of other comprehensive income).
We manage foreign currency risks in a wide variety of foreign currencies principally by entering into forward contracts to mitigate the impact of currency fluctuations on transactions arising from international trade. Our objective in entering into these forward contracts is to preserve the economic value of nonfunctional currency cash flows. Our principal foreign currency exposures relate to the Euro, the Egyptian Pound, the Turkish Lira, the Taiwan Dollar, the Colombian Peso, the Australian Dollar, the Indian Rupee, the Thailand Baht, the Indonesian Rupiah, the Japanese Yen, the Chinese Renminbi and the Romanian Leu. We mark these forward contracts to fair value based on market prices for comparable contracts and recognize the resulting gains or losses as other income or expense from foreign currency transactions.
Precious metals (primarily silver, gold, platinum and palladium) represent a significant portion of raw material costs in our electronic s products. When we enter into a fixed price sales contract at the customer’s request to establish the price for the precious metals content of the order, we also enter into a forward purchase arrangement with a precious metals supplier to completely cover the value of the precious metals content. Our current precious metal contracts are designated as normal purchase contracts, which are not marked to market.
We also purchase portions of our energy requirements, including natural gas and electricity, under fixed price contracts to reduce the volatility of cost changes. Our current energy contracts are designated as normal purchase contracts, which are not marked to market.
Transfer of Financial Assets
The Company accounts for transfers of financial assets as sales when it has surrendered control over the related assets. Whether control has been relinquished requires, among other things, an evaluation of relevant legal considerations and an assessment of the nature and extent of the Company’s continuing involvement with the assets transferred.
Pension and Other Postretirement Benefits
We sponsor defined benefit plans in the U.S. and many countries outside the U.S., and we also sponsor retiree medical benefits for a segment of our salaried and hourly work force within the U. S. The U.S. pension plans and retiree medical plans represent approximately 86% of pension plan assets, 72 % of benefit obligations and 56 % of net periodic pension expense as of December 31, 2018 .
The assumptions we use in actuarial calculations for these plans have a significant impact on benefit obligations and annual net periodic benefit costs. We meet with our actuaries annually to discuss key economic assumptions used to develop these benefit obligations and net periodic costs.
We determine the discount rate for the U.S. pension and retiree medical plans based on a bond model. Using the pension plans’ projected cash flows, the bond model considers all possible bond portfolios that produce matching cash flows and selects the portfolio with the highest possible yield. These portfolios are based on bonds with a quality rating of AA or better under either Moody’s Investor Services, Inc. or Standard & Poor’s Rating Group, but exclude certain bonds, such as callable bonds, bonds with small amounts outstanding, and bonds with unusually high or low yields. The discount rates for the non-U.S. plans are based on a yield curve method, using AA-rated bonds applicable in their respective capital markets. The duration of each plan’s liabilities is used to select the rate from the yield curve corresponding to the same duration.
For the market-related value of plan assets, we use fair value, rather than a calculated value. The market-related value recognizes changes in fair value in a systematic and rational manner over several years. We calculate the expected return on assets at the beginning of the year for defined benefit plans as the weighted-average of the expected return for the target allocation of the principal asset classes held by each of the plans. In determining the expected returns, we consider both historical performance and an estimate of future long-term rates of return. The Company consults with and considers the opinion of its actuaries in developing appropriate return assumptions. Our target asset allocation percentages are 35% fixed income, 60% equity, and 5% other investments for U.S. plans and 75% fixed income, 24% equity, and 1% other investm ents for non-U.S. plans. In 2018 , our pension plan assets incurred losses of approximately
43
7 % within the U.S. plans and 3% within non-U.S. plans. In 2017, investment returns on average plan assets were approximately 16% within the U.S. plans and 3% within non-U.S. plans. Future actual pension expense will depend on future investment allocation and performance, changes in future discount rates and various other factors related to the population of participants in the Company’s pension plans.
All other assumptions are reviewed periodically by our actuaries and us and may be adjusted based on current trends and expectations as well as past experience in the plans.
The following table provides the sensitivity of net annual periodic benefit costs for our pension plans, including a U.S. nonqualified retirement plan, and the retiree medical plan to a 25-basis-point decrease in both the discount rate and asset return assumption:
|
|
||||||
|
|
25 Basis Point |
|||||
|
|
25 Basis Point |
Decrease in |
||||
|
|
Decrease in |
Asset Return |
||||
|
|
Discount Rate |
Assumption |
||||
|
|
||||||
|
|
(Dollars in thousands) |
|||||
|
U.S. pension plans |
$ |
(370) |
$ |
484 | ||
|
U.S. retiree medical plan |
(28) |
N/A |
||||
|
Non-U.S. pension plans |
(95) | 30 | ||||
|
Total |
$ |
(493) |
$ |
514 | ||
The following table provides the rates used in the assumptions and the changes between 2018 and 2017 :
|
|
||||||||||
|
|
2018 |
2017 |
Change |
|||||||
|
Discount rate used to measure the benefit cost: |
||||||||||
|
U.S. pension plans |
3.80 |
% |
4.40 |
% |
(0.60) |
% |
||||
|
U.S. retiree medical plan |
3.70 |
% |
4.20 |
% |
(0.50) |
% |
||||
|
Non-U.S. pension plans |
2.35 |
% |
2.24 |
% |
0.11 |
% |
||||
|
Discount rate used to measure the benefit obligation: |
||||||||||
|
U.S. pension plans |
4.40 |
% |
3.80 |
% |
0.60 |
% |
||||
|
U.S. retiree medical plan |
4.30 |
% |
3.70 |
% |
0.60 |
% |
||||
|
Non-U.S. pension plans |
2.61 |
% |
2.35 |
% |
0.26 |
% |
||||
|
Expected return on plan assets: |
||||||||||
|
U.S. pension plans |
7.70 |
% |
8.20 |
% |
(0.50) |
% |
||||
|
Non-U.S. pension plans |
2.55 |
% |
2.54 |
% |
0.01 |
% |
Our overall net periodic benefit cost for all defined benefit plans was $19.9 million in 2018 and a credit of $6.4 million in 2017 . The change is mainly the result of mark to ma rket actuarial net losses in 2018 .
For 2019 , assuming expected returns on plan assets and no actuarial gains or losses, we expect our ove rall net periodic benefit expense to be approximately $3.8 million , compared with income of ap proximately $0 .2 million in 2018 on a comparable basis.
Inventories
We value inventor y at the lower of cost or net realizable value , with cost determined utilizing the first-in, first-out (FIFO) method. We periodically evaluate the net realizable value of inventories based primarily upon their age, but also upon assumptions of future usage in production, customer demand and market conditions. Inventories have been reduced to the lower of cost or realizable value by allowances for slow moving or obsolete goods. If actual circumstances are less favorable than those projected by management in its evaluation of the net realizable value of inventories, additional write-downs may be required. Slow moving, excess or obsolete materials are specifically identified and may be physically separated from other materials, and we rework or dispose of these materials as time and manpower permit.
44
Environmental Liabilities
Our manufacturing facilities are subject to a broad array of environmental laws and regulations in the countries in which they are located. The costs to comply with complex environmental laws and regulations are significant and will continue for the foreseeable future. We expense these recurring costs as they are incurred. While these costs may increase in the future, they are not expected to have a material impact on our financial position, liquidity or results of operations.
We also accrue for environmental remediation costs and other obligations when it is probable that a liability has been incurred and we can reasonably estimate the amount. We determine the timing and amount of any liability based upon assumptions regarding future events. Inherent uncertainties exist in such evaluations primarily due to unknown conditions and other circumstances , changing governmental regulations and legal standards regarding liability, and evolving technologies. We adjust these liabilities periodically as remediation efforts progress or as additional technical or legal information becomes available.
Impact of Newly Issued Accounting Pronouncements
Refer to Note 2 to the consolidated financial statements under Item 8 of this Annual Report on Form 10-K for a discussion of accounting standards we recently adopted or will be required to adopt.
45
Item 7A — Quantitative and Qualitative Disclosures about Market Risk
The primary objective of the following information is to provide forward-looking quantitative and qualitative information about our exposure to instruments that are sensitive to fluctuations in interest rates and foreig n currency exchange rates .
Our exposure to interest rate risk arises from our debt portfolio. We manage this risk by controlling the mix of fixed versus variable-rate debt after considering the interest rate environment and expected future cash flows. To reduce our exposure to interest rate changes on variable rate debt, we entered into interest rate swap agreements. These swaps effectively convert a portion of our variable rate debt to a fixed rate. Our objective is to limit variability in earnings, cash flows and overall borrowing costs caused by changes in interest rates, while preserving operating flexibility. We operate internationally and enter into transactions denominated in foreign currencies. These transactions expose us to gains and losses arising from exchange rate movements between the dates foreign currencies are recorded and the dates they are settled. We manage this risk by entering into forward currency contracts that substantially offset these gains and losses.
We are subject to cost changes with respect to our raw materials and energy purchases. We attempt to mitigate raw materials cost increases through product reformulat ions, price increases and productivity improvements. We enter into forward purchase arrangements with preci ous metals suppliers to completely cover the value of the precious metals content of fixed price sales contracts. These agreements are designated as normal purchase contracts, which are not marked to market, and had purchase commitments totaling $ 4 .0 million at December 31, 2018 . In addition, we purchase portions of our natural gas, electricity and oxygen requirements under fixed price contracts to reduce the volatility of these costs. These energy contracts are designated as normal purchase contracts, which are not marked to market, and had purchase commitments totaling $ 50.0 million at December 31, 2018 .
The notional amounts, carrying amounts of assets (liabilities), and fair values associated with our exposure to these market risks and sensitivity analysis about potential gains (losses) resulting from hypothetical changes in market rates are presented below:
|
|
||||||
|
|
December 31, |
December 31, |
||||
|
|
2018 |
2017 |
||||
|
|
(Dollars in thousands) |
|||||
|
Variable-rate debt: |
||||||
|
Carrying amount (1) |
$ |
809,072 |
$ |
739,602 | ||
|
Fair value (1) |
796,846 | 742,634 | ||||
|
Increase in annual interest expense from 1% increase in interest rates |
2,680 | 4,890 | ||||
|
Decrease in annual interest expense from 1% decrease in interest rates |
(2,680) | (2,992) | ||||
|
Fixed-rate debt: |
||||||
|
Carrying amount |
8,362 | 7,112 | ||||
|
Fair value |
5,258 | 3,973 | ||||
|
Change in fair value from 1% increase in interest rates |
NM |
NM |
||||
|
Change in fair value from 1% decrease in interest rates |
NM |
NM |
||||
|
Interest rate swaps: |
||||||
|
Notional amount |
317,604 | 258,045 | ||||
|
Carrying amount and fair value |
(5,244) | 1,492 | ||||
|
Change in fair value from 1% increase in interest rates |
13,945 | 9,157 | ||||
|
Change in fair value from 1% decrease in interest rates |
(13,508) | (3,678) | ||||
|
Cross currency swaps: |
||||||
|
Notional amount |
344,894 |
— |
||||
|
Carrying amount and fair value |
17,104 |
— |
||||
|
Change in fair value from 10% increase |
(35,455) |
— |
||||
|
Change in fair value from 10% decrease |
40,575 |
— |
||||
|
Foreign currency forward contracts: |
||||||
|
Notional amount |
387,190 | 238,457 | ||||
|
Carrying amount and fair value |
(270) | (469) | ||||
|
Change in fair value from 10% appreciation of U.S. dollar |
8,070 | 3,541 | ||||
|
Change in fair value from 10% depreciation of U.S. dollar |
(9,863) | (4,328) | ||||
( 1) The carrying values of the term loan facilities are net of unamortized debt issuance costs of $4. 8 million and $7.5 million for the period ended December 31, 2018, and December 31, 2017, respectively.
46
Item 8 — Financial Statements and Supplementary Data
REPORT OF INDEPENDENT REGISTERED PUBLIC ACCOUNTING FIRM
To the Board of Directors and Shareholders of Ferro Corporation
Opinion on the Financial Statements
We have audited the accompanying consolidated balance sheets of Ferro Corporation and subsidiaries (the "Company") as of December 31, 2018 and 2017, the related consolidated statements of operations, comprehensive income (loss), equity, and cash flows for each of the three years in the period ended December 31, 2018, and the related notes and the financial statement schedule listed in the Index at Item 15 (collectively referred to as the “financial statements”). In our opinion, the financial statements present fairly, in all material respects, the financial position of the Company as of December 31, 2018 and 2017, and the results of its operations and its cash flows for each of the three years in the period ended December 31, 2018, in conformity with accounting principles generally accepted in the United States of America.
We have also audited, in accordance with the standards of the Public Company Accounting Oversight Board (United States) (PCAOB), the Company's internal control over financial reporting as of December 31, 2018, based on criteria established in Internal Control — Integrated Framework (2013) issued by the Committee of Sponsoring Organizations of the Treadway Commission and our report dated February 27, 2019, expressed an unqualified opinion on the Company's internal control over financial reporting.
Basis for Opinion
These financial statements are the responsibility of the Company's management. Our responsibility is to express an opinion on the financial statements based on our audits. We are a public accounting firm registered with the PCAOB and are required to be independent with respect to the Company in accordance with the U.S. federal securities laws and the applicable rules and regulations of the Securities and Exchange Commission and the PCAOB.
We conducted our audits in accordance with the standards of the PCAOB. Those standards require that we plan and perform the audit to obtain reasonable assurance about whether the financial statements are free of material misstatement, whether due to error or fraud. Our audits included performing procedures to assess the risks of material misstatement of the financial statements, whether due to error or fraud, and performing procedures that respond to those risks. Such procedures included examining, on a test basis, evidence regarding the amounts and disclosures in the financial statements. Our audits also included evaluating the accounting principles used and significant estimates made by management, as well as evaluating the overall presentation of the financial statements. We believe that our audits provide a reasonable basis for our opinion.
/s/ Deloitte & Touche LLP
Cleveland, Ohio
February 27, 2019
We have served as the Company's auditor since 2006.
47
FERRO CORPORATION AND SUBSIDIARIES
|
|
|||||||||
|
|
Years Ended December 31, |
||||||||
|
|
2018 |
2017 |
2016 |
||||||
|
|
|||||||||
|
|
(Dollars in thousands, except per share amounts) |
||||||||
|
Net sales |
$ |
1,612,408 |
$ |
1,396,742 |
$ |
1,145,292 | |||
|
Cost of sales |
1,156,475 | 980,521 | 788,914 | ||||||
|
Gross profit |
455,933 | 416,221 | 356,378 | ||||||
|
Selling, general and administrative expenses |
278,566 | 265,418 | 227,286 | ||||||
|
Restructuring and impairment charges |
13,295 | 11,409 | 15,907 | ||||||
|
Other expense (income): |
|||||||||
|
Interest expense |
33,371 | 27,754 | 21,547 | ||||||
|
Interest earned |
(674) | (901) | (630) | ||||||
|
Foreign currency losses, net |
8,187 | 6,554 | 12,906 | ||||||
|
Loss on extinguishment of debt |
3,226 | 3,905 |
— |
||||||
|
Miscellaneous expense (income), net |
15,970 | (8,436) | 16,917 | ||||||
|
Income before income taxes |
103,992 | 110,518 | 62,445 | ||||||
|
Income tax expense |
23,046 | 52,750 | 17,868 | ||||||
|
Income from continuing operations |
80,946 | 57,768 | 44,577 | ||||||
|
Loss from discontinued operations, net of income taxes |
— |
— |
(64,464) | ||||||
|
Net income (loss) |
80,946 | 57,768 | (19,887) | ||||||
|
Less: Net income attributable to noncontrolling interests |
853 | 714 | 930 | ||||||
|
Net income (loss) attributable to Ferro Corporation common shareholders |
$ |
80,093 |
$ |
57,054 |
$ |
(20,817) | |||
|
|
|||||||||
|
Amounts attributable to Ferro Corporation: |
|||||||||
|
Income from continuing operations, net of income tax |
80,093 | 57,054 | 43,647 | ||||||
|
Loss from discontinued operations, net of income tax |
— |
— |
(64,464) | ||||||
|
Income (loss) attributable to Ferro Corporation |
$ |
80,093 |
$ |
57,054 |
$ |
(20,817) | |||
|
Weighted-average common shares outstanding |
83,940 | 83,713 | 83,298 | ||||||
|
Incremental common shares attributable to performance shares, deferred stock units, restricted stock units, and stock options |
1,145 | 1,443 | 1,612 | ||||||
|
Weighted-average diluted shares outstanding |
85,085 | 85,156 | 84,910 | ||||||
|
Earnings (loss) per share attributable to Ferro Corporation common shareholders: |
|||||||||
|
Basic earnings (loss): |
|||||||||
|
Continuing operations |
$ |
0.95 |
$ |
0.68 |
$ |
0.52 | |||
|
Discontinued operations |
— |
— |
(0.77) | ||||||
|
|
$ |
0.95 |
$ |
0.68 |
$ |
(0.25) | |||
|
Diluted earnings (loss): |
|||||||||
|
Continuing operations |
$ |
0.94 |
$ |
0.67 |
$ |
0.51 | |||
|
Discontinued operations |
— |
— |
(0.76) | ||||||
|
|
$ |
0.94 |
$ |
0.67 |
$ |
(0.25) | |||
See accompanying not es to consolidated financial statements.
48
FERRO CORPORATION AND SUBSIDIARIES
CONSOLIDA TED STATEMENTS OF COMPREHENSIVE INCOME (LOSS)
|
|
|||||||||
|
|
Years Ended December 31, |
||||||||
|
|
2018 |
2017 |
2016 |
||||||
|
|
(Dollars in thousands) |
||||||||
|
Net income (loss) |
$ |
80,946 |
$ |
57,768 |
$ |
(19,887) | |||
|
Other comprehensive (loss) income, net of income tax: |
|||||||||
|
Foreign currency translation (loss) income |
(26,113) | 30,558 | (45,986) | ||||||
|
Cash flow hedging instruments unrealized (loss) gain |
(4,242) | 945 |
— |
||||||
|
Postretirement benefit liabilities (loss) gain |
(39) | 24 | 330 | ||||||
|
Other comprehensive (loss) income, net of income tax |
(30,394) | 31,527 | (45,656) | ||||||
|
Total comprehensive income (loss) |
50,552 | 89,295 | (65,543) | ||||||
|
Less: Comprehensive income attributable to noncontrolling interests |
352 | 1,066 | 599 | ||||||
|
Comprehensive income (loss) attributable to Ferro Corporation |
$ |
50,200 |
$ |
88,229 |
$ |
(66,142) | |||
See accompanying notes to consolidated financial statements.
49
FERRO CORPORATION AND SUBSIDIARIES
|
|
||||||
|
|
December 31, |
December 31, |
||||
|
|
2018 |
2017 |
||||
|
|
(Dollars in thousands) |
|||||
|
ASSETS |
||||||
|
Current assets |
||||||
|
Cash and cash equivalents |
$ |
104,301 |
$ |
63,551 | ||
|
Accounts receivable, net |
306,882 | 354,416 | ||||
|
Inventories |
356,998 | 324,180 | ||||
|
Other receivables |
91,143 | 67,137 | ||||
|
Other current assets |
23,960 | 16,448 | ||||
|
Total current assets |
883,284 | 825,732 | ||||
|
Other assets |
||||||
|
Property, plant and equipment, net |
381,341 | 321,742 | ||||
|
Goodwill |
216,464 | 195,369 | ||||
|
Intangible assets, net |
184,953 | 187,616 | ||||
|
Deferred income taxes |
103,488 | 108,025 | ||||
|
Other non-current assets |
42,930 | 43,718 | ||||
|
Total assets |
$ |
1,812,460 |
$ |
1,682,202 | ||
|
LIABILITIES AND EQUITY |
||||||
|
Current liabilities |
||||||
|
Loans payable and current portion of long-term debt |
$ |
10,260 |
$ |
25,136 | ||
|
Accounts payable |
256,573 | 211,711 | ||||
|
Accrued payrolls |
39,989 | 48,201 | ||||
|
Accrued expenses and other current liabilities |
77,995 | 70,151 | ||||
|
Total current liabilities |
384,817 | 355,199 | ||||
|
Other liabilities |
||||||
|
Long-term debt, less current portion |
811,137 | 726,491 | ||||
|
Postretirement and pension liabilities |
173,046 | 166,680 | ||||
|
Other non-current liabilities |
57,611 | 77,152 | ||||
|
Total liabilities |
1,426,611 | 1,325,522 | ||||
|
Equity |
||||||
|
Ferro Corporation shareholders’ equity: |
||||||
|
Common stock, par value $1 per share; 300.0 million shares authorized; 93.4 million shares issued; 83.0 million and 84.0 million shares outstanding at December 31, 2018, and December 31, 2017, respectively |
93,436 | 93,436 | ||||
|
Paid-in capital |
298,123 | 302,158 | ||||
|
Retained earnings |
255,978 | 171,744 | ||||
|
Accumulated other comprehensive loss |
(105,361) | (75,468) | ||||
|
Common shares in treasury, at cost |
(165,545) | (147,056) | ||||
|
Total Ferro Corporation shareholders’ equity |
376,631 | 344,814 | ||||
|
Noncontrolling interests |
9,218 | 11,866 | ||||
|
Total equity |
385,849 | 356,680 | ||||
|
Total liabilities and equity |
$ |
1,812,460 |
$ |
1,682,202 | ||
See a ccompanying notes to consolidated financial statements.
50
FERRO CORPORATION AND SUBSIDIARIES
CONS OLIDATED STATEMENTS OF EQUITY
|
|
|||||||||||||||||||||||
|
|
|||||||||||||||||||||||
|
|
Ferro Corporation Shareholders |
||||||||||||||||||||||
|
|
Common Shares |
Accumulated |
|||||||||||||||||||||
|
|
in Treasury |
Other |
Non- |
||||||||||||||||||||
|
|
Common |
Paid-in |
Retained |
Comprehensive |
controlling |
Total |
|||||||||||||||||
|
|
Shares |
Amount |
Stock |
Capital |
Earnings |
(Loss) Income |
Interests |
Equity |
|||||||||||||||
|
|
|||||||||||||||||||||||
|
|
(In thousands) |
||||||||||||||||||||||
|
Balances at December 31, 2015 |
9,431 |
$ |
(166,020) |
$ |
93,436 |
$ |
314,854 |
$ |
135,507 |
$ |
(61,318) |
$ |
7,822 |
$ |
324,281 | ||||||||
|
Net (loss) income |
— |
— |
— |
— |
(20,817) |
— |
930 | (19,887) | |||||||||||||||
|
Other comprehensive (loss) |
— |
— |
— |
— |
— |
(45,325) | (331) | (45,656) | |||||||||||||||
|
Purchase of treasury stock |
1,175 | (11,429) |
— |
— |
— |
— |
— |
(11,429) | |||||||||||||||
|
Stock-based compensation transactions |
(610) | 16,513 |
— |
(8,288) |
— |
— |
— |
8,225 | |||||||||||||||
|
Distributions to noncontrolling interests |
— |
— |
— |
— |
— |
— |
(502) | (502) | |||||||||||||||
|
Balances at December 31, 2016 |
9,996 | (160,936) | 93,436 | 306,566 | 114,690 | (106,643) | 7,919 | 255,032 | |||||||||||||||
|
Net income |
— |
— |
— |
— |
57,054 |
— |
714 | 57,768 | |||||||||||||||
|
Other comprehensive income |
— |
— |
— |
— |
— |
31,175 | 352 | 31,527 | |||||||||||||||
|
Stock-based compensation transactions |
(610) | 13,880 |
— |
(4,408) |
— |
— |
— |
9,472 | |||||||||||||||
|
Change in ownership interest |
— |
— |
— |
— |
— |
— |
3,355 | 3,355 | |||||||||||||||
|
Distributions to noncontrolling interests |
— |
— |
— |
— |
— |
— |
(474) | (474) | |||||||||||||||
|
Balances at December 31, 2017 |
9,386 | (147,056) | 93,436 | 302,158 | 171,744 | (75,468) | 11,866 | 356,680 | |||||||||||||||
|
Net income |
— |
— |
— |
— |
80,093 |
— |
853 | 80,946 | |||||||||||||||
|
Other comprehensive loss |
— |
— |
— |
— |
— |
(29,893) | (501) | (30,394) | |||||||||||||||
|
Purchase of treasury stock |
1,471 | (28,807) |
— |
— |
— |
— |
— |
(28,807) | |||||||||||||||
|
Stock-based compensation transactions |
(424) | 10,318 |
— |
(4,824) |
— |
— |
— |
5,494 | |||||||||||||||
|
Change in ownership interest |
— |
— |
— |
789 |
— |
— |
(2,228) | (1,439) | |||||||||||||||
|
Distributions to noncontrolling interests |
— |
— |
— |
— |
— |
— |
(772) | (772) | |||||||||||||||
|
Adjustments for accounting standard update 2016-16 |
— |
— |
— |
— |
4,141 |
— |
— |
4,141 | |||||||||||||||
|
Balances at December 31, 2018 |
10,433 |
$ |
(165,545) |
$ |
93,436 |
$ |
298,123 |
$ |
255,978 |
$ |
(105,361) |
$ |
9,218 |
$ |
385,849 | ||||||||
See accompanying notes to consolidated financial statements.
51
FERRO CORPORATION AND SUBSIDIARIES
CONSO
|
|
|||||||||
|
|
2018 |
2017 |
2016 |
||||||
|
|
(Dollars in thousands) |
||||||||
|
Cash flows from operating activities |
|||||||||
|
Net income (loss) |
$ |
80,946 |
$ |
57,768 |
$ |
(19,887) | |||
|
Adjustments to reconcile net income (loss) to net cash provided by operating activities: |
|||||||||
|
Loss (gain) on sale of assets and businesses |
164 | (852) | (2,764) | ||||||
|
Depreciation and amortization |
53,974 | 50,085 | 46,805 | ||||||
|
Interest amortization |
3,577 | 3,496 | 1,353 | ||||||
|
Restructuring and impairment charges |
4,084 | 7,593 | 50,868 | ||||||
|
Loss on extinguishment of debt |
3,226 | 3,905 |
— |
||||||
|
Provision for allowance for doubtful accounts |
681 | 44 | 1,383 | ||||||
|
Retirement benefits |
9,221 | (6,417) | 14,436 | ||||||
|
Deferred income taxes |
(3,720) | 23,490 | (11,451) | ||||||
|
Stock-based compensation |
8,441 | 11,770 | 7,245 | ||||||
|
Changes in current assets and liabilities, net of effects of acquisitions: |
|||||||||
|
Accounts receivable |
19,885 | (25,852) | (21,893) | ||||||
|
Inventories |
(33,922) | (46,962) | (10,271) | ||||||
|
Other receivables and other current assets |
(1,444) | (7,099) | (3,006) | ||||||
|
Accounts payable |
35,887 | 26,150 | 1,162 | ||||||
|
Accrued expenses and other current liabilities |
164 | (22,398) | 11,626 | ||||||
|
Other operating activities |
1,629 | 10,069 | (2,976) | ||||||
|
Net cash provided by operating activities |
182,793 | 84,790 | 62,630 | ||||||
|
Cash flows from investing activities |
|||||||||
|
Capital expenditures for property, plant and equipment and other long-lived assets |
(80,619) | (50,552) | (24,945) | ||||||
|
Proceeds from sale of assets |
— |
— |
3,634 | ||||||
|
Proceeds from sale of equity method investment |
— |
2,268 |
— |
||||||
|
Collections of financing receivables |
7,020 |
— |
— |
||||||
|
Business acquisitions, net of cash acquired |
(74,954) | (131,194) | (129,511) | ||||||
|
Other investing activities |
37 | 567 |
— |
||||||
|
Net cash (used in) investing activities |
(148,516) | (178,911) | (150,822) | ||||||
|
Cash flows from financing activities |
|||||||||
|
Net (repayments) borrowings under loans payable |
(19,077) | (19,634) | 4,596 | ||||||
|
Proceeds from revolving credit facility - 2014 Credit Facility |
— |
15,628 | 355,743 | ||||||
|
Principal payments on revolving credit facility - 2014 Credit Facility |
— |
(327,183) | (214,188) | ||||||
|
Proceeds from term loan facility - Credit Facility |
— |
623,827 |
— |
||||||
|
Principal payments on term loan facility - 2014 Credit Facility |
— |
(243,250) | (53,000) | ||||||
|
Principal payments on term loan facility - Credit Facility |
(304,060) | (4,872) |
— |
||||||
|
Principal payments on term loan facility - Amended Credit Facility |
(6,150) |
— |
— |
||||||
|
Proceeds from term loan facility - Amended Credit Facility |
466,075 |
— |
— |
||||||
|
Proceeds from revolving credit facility - Credit Facility |
134,950 | 180,605 |
— |
||||||
|
Principal payments on revolving credit facility - Credit Facility |
(212,950) | (102,605) |
— |
||||||
|
Proceeds from revolving credit facility - Amended Credit Facility |
240,035 |
— |
— |
||||||
|
Principal payments on revolving credit facility - Amended Credit Facility |
(240,035) |
— |
— |
||||||
|
Principal payments on other long-term debt |
— |
(3,971) |
— |
||||||
|
Proceeds from other long-term debt |
— |
2,700 |
— |
||||||
|
Payment of debt issuance costs |
(3,466) | (12,927) | (711) | ||||||
|
Acquisition related contingent consideration payment |
(9,464) | (1,315) |
— |
||||||
|
Proceeds from exercise of stock options |
764 | 4,526 | 1,140 | ||||||
|
Purchase of treasury stock |
(28,807) |
— |
(11,429) | ||||||
|
Other financing activities |
(8,448) | (3,166) | (154) | ||||||
|
Net cash provided by financing activities |
9,367 | 108,363 | 81,997 | ||||||
|
Effect of exchange rate changes on cash and cash equivalents |
(2,894) | 3,727 | (6,603) | ||||||
|
Increase (decrease) in cash and cash equivalents |
40,750 | 17,969 | (12,798) | ||||||
|
Cash and cash equivalents at beginning of period |
63,551 | 45,582 | 58,380 | ||||||
|
Cash and cash equivalents at end of period |
$ |
104,301 |
$ |
63,551 |
$ |
45,582 | |||
|
Cash paid during the period for: |
|||||||||
|
Interest |
$ |
33,910 |
$ |
26,850 |
$ |
17,486 | |||
|
Income taxes |
$ |
36,789 |
$ |
25,662 |
$ |
19,734 | |||
52
See accompanying notes to consolidated financial statements.
53
FERRO CORPORATION AND SUBSIDIARIES
NOTES TO CONSOLIDATED FINANCIAL STATEMENTS
Years ended December 31, 2018, 2017 and 201 6
Ferro Corporation (“Ferro,” “we,” “us” or “the Company”) is a leading producer of specialty materials that are sold to a broad range of manufacturers who, in turn, make products for many end-use markets. Ferro’s products fall into two general categories: functional coatings, which perform specific functions in the manufacturing processes and end products of our customers; and color solutions, which provide aesthetic and performance characteristics to our customers’ products. We differentiate ourselves in our industry by innovation and new products and services and the consistent high quality of our products, combined with delivery of localized technical service and customized application technology supp ort. Our value-added technical services assist customers in their material specification and evaluation, product design, and manufacturing process characterization in order to help them optimize the application of our products. We manage our businesses through four business units that are differentiated from one another by product type. The four business units are listed below :
|
Tile Coating Systems (1) |
|
|
|
Porcelain Enamel (1) |
|
|
|
Performance Colors and Glass |
|
|
|
Color Solutions |
|
|
(1) Tile Coating Systems and Porcelain Enamel are combined into one reportable segment, Performance Coatings, for financial reporting purposes.
We produce our products primarily in the Europe, Middle East and Africa (“EMEA”) region, the United States (“U.S.”) , the Asia Pacific region, and Latin America.
We sell our products directly to customers and through the use of agents or distributors throughout the world. Our p roducts are sold principally in the EMEA region , the U.S. , the Asia Pacific region, and Latin America. Our customers manufacture products to serve a variety of end markets, including appliances , automobiles, building and renovation, electronics , household furnishings, industrial products, packaging, and sanitary .
As discussed in Note 4 , in the third quarter of 2016, we completed the disposition of the Europe-based Polymer Additives business and have classified the related operating results, net of income tax, as discontinued operations in the accompanying consolidated statements of operations for the year ended December 31, 2016 .
2. Significant Accounting Policies
Principles of Consolidation
Our consolidated financial statements include the accounts of the parent company and the accounts of its subsidiaries and include the results of the Company and all entities in which the Company has a controlling interest . When we consolidate our financial statements, we eliminate intercompany transactions, accounts and profits. When we exert significant influence over an investee but do not control it, we account for the investment and the investment income using the equity method. These investments are reported in the Oth er non-current assets on our balance sheet. We consolidate financial results for five legal entities in which we do not own 100% of the equity interests, either directly or indirectly through our subsidiaries. These entities have non-controlling interest ownerships ranging from 5% to 41%.
When we acquire a subsidiary, its financial results are included in our consolidated financial statements from the date of the acquisition. When we dispose of a subsidiary, its financial results are included in our consolidated financial statements until the date of the disposition. In the event that a disposal group meets the criteria for discontinued operations, prior periods are adjusted to reflect the classification.
54
FERRO CORPORATION AND SUBSIDIARIES
NOTES TO CONSOLIDATED FINANCIAL STATEMENTS
Years ended December 31, 2018, 2017 and 2016 – (Continued)
Use of Estimates and Assumptions in the Preparation of Financial Statements
We prepare our consolidated financial statements in conformity with accounting principles generally accepted in the United States, which requires us to make estimates and to use judgments and assumptions that affect the timing and amount of assets, liabilities, equity, revenues and expenses recorded and disclosed. The more significant estimates and judgments relate to revenue recognition, restructuring and cost reduction programs , asset impairment, income taxes, inventories, goodwill, pension and other postretirement benefits, purchase price accounting and environmental liabilities. Actual outcomes could differ from our estimates, resulting in changes in revenues or costs that could have a material impact on the Company’s results of operations, financial position, or cash flows.
Foreign Currency Translation
The financial results of our operations outside of the U.S. are recorded in local currencies, which generally are also the functional currencies for financial reporting purposes. The results of operations outside of the U.S. are translated from these functional currencies into U.S. dollars using the average monthly currency exchange rates. We use the average currency exchange rate for these results of operations as a reasonable approximation of the results had specific currency exchange rates been used for each individual transaction. Foreign currency transaction gains and losses are recorded , as incurred , as Other expense (income) in the consolidated statements of operations. Assets and liabilities are translated into U.S. dollars using exchange rates at the balance sheet dates, and we record the resulting foreign currency translation adjustment s as a separate component of Accumulated other comprehensive loss in equity.
Revenue Recognition
Under Accounting Standards Codification (“ ASC ”) 606, revenues are recognized when control of the promised goods is transferred to our customers, in an amount that reflects the consideration we expect to be entitled to in exchange for those goods. In order to achieve that core principle, the Company applies the following five-step approach: 1) identify the contract with a customer, 2) identify the performance obligations, 3) determine the transaction price, 4) allocate the transaction price to the performance obligations in the contract, and 5) recognize revenue when a performance obligation is satisfied.
The Company considers confirmed customer purchase orders, which in some cases are governed by master sales agreements, to be the contracts, from an accountin g perspective, with customers. Under our standard contracts, the only performance obligation is the delivery of manufactured goods and the performance obligation is satisfied at a point in time, when the Company transfers control of the manufactured goods . The Company may receive orders for products to be delivered over multiple dates that may extend ac ross several reporting periods. The Company invoices for each order and recognizes revenue for each distinct product upon shipment, once tr ansfer of control has occurred. Payment terms are standard for the industry and ju risdiction in which we operate. In determining the transaction price, the Company evaluates whether the price is subject to refund or adjustment, to determine the net consideration to which the Company expects to be entitled. Discounts or rebates are specifically stated in customer contracts or invoices, and are recorded as a reduction of revenue in the period the related revenue is recognized. The product price as specified on the customer confirmed orders is considered the standalone selling price. The Company allocates the transaction price to each distinct product based on its relative standalone selling p rice. Revenue is recognized when control of the product is transferred to the customer (i.e., when the Company’s performance obligation is satisfied), which generally occurs at shipment. We review material contracts to determine transfer of control based upon the business practices and legal requirements of each country. For sales of all products, including those containing precious metals, we report revenues on a gross basis, along with their corresponding cost of sales to arrive at gross profit.
The amount of shipping and handling fees invoiced to our customers at the time our product is shipped is included in net sales as we are the principal in those activities. Sales, valued-added and other taxes collected from our customers and remitted to governmental
55
FERRO CORPORATION AND SUBSIDIARIES
NOTES TO CONSOLIDATED FINANCIAL STATEMENTS
Years ended December 31, 2018, 2017 and 2016 – (Continued)
authorities are excluded from net sales. Credit memos issued to customers for sales returns and sales adjustments are recorded when they are incurred as a reduction of sales.
There were no changes in amounts previously reported in the Company’s consolidated financial statements due to adopting ASC 606.
Practical Expedients and Exemptions
All material contracts have an original duration of one year or less and, as such, the Company uses the practical expedient applicable to such contracts, and has not disclosed the transaction price for the remaining performance obligations as of the end of each reporting period, or when the Company expects to recognize this revenue.
When the period of time between the transfer of control of the goods and the time the customer pays for the goods is one year or less, the Company uses the practical expedient allowed by ASC 606 that provides relief from adjusting the amount of promised consideration for the effects of a financing component.
We generally expense sales commissions when incurred because the amortization period is one year or less. These costs are recorded within Selling, general and administrative expenses
Research and Development Expenses
Research and development expenses are expensed as incurred and are included in Selling, general and administrative expenses. Total expenditures for product and application technology, including research and development, customer technical support and other related activities, were approximately $40 . 2 million for 2018 , $ 36.4 million for 2017 and $ 27.3 million for 2016 .
Restructuring Programs
We expense costs associated with exit and disposal activities designed to restructure operations and reduce ongoing costs of operations when we incur the related liabilities or when other triggering events occur. After the appropriate level of management , having the authority , approves the detailed restructuring plan and the appropriate criteria for recognition are met, we establish accruals for employee termination and other costs , as applicable . The accruals are estimates that are based upon factors including statutory and union requirements, affected employees’ lengths of service , salary level, health care benefit choices and contract provisions . We also analyze the carrying value of affected long-lived assets for impairment and reductions in their remaining estimated useful lives. In addition, we record the fair value of any new or remaining obligations when existing operating lease contracts are terminated or abandoned as a result of our exit and disposal activities.
Asset Impairment
The Company’s long-lived assets include property, plant and equipment, goodwill, and intangible assets. We review property, plant and equipment and intangible assets for impairment whenever events or circumstances indicate that their carrying values may not be recoverable. The following are examples of such events or changes in circumstances:
|
|
· |
|
An adverse change in the business climate of a long-lived asset or asset group; |
|
|
· |
|
An adverse change in the extent or manner in which a long-lived asset or asset group is used or in its physical condition; |
|
|
· |
|
Current operating losses for a long-lived asset or asset group combined with a history of such losses or projected or forecasted losses that demonstrate that the losses will continue; or |
|
|
· |
|
A current expectation that, more likely than not, a long-lived asset or asset group will be sold or otherwise significantly disposed of before the end of its previously estimated useful life. |
The carrying amount of property, plant and equipment and intangible assets is not recoverable if the carrying value of the asset group exceeds the sum of the undiscounted cash flows expected to result from the use and eventual disposition of the asset group. In the event of impairment, we recognize a loss for the excess of the recorded value over fair value. The long-term nature of these assets
56
FERRO CORPORATION AND SUBSIDIARIES
NOTES TO CONSOLIDATED FINANCIAL STATEMENTS
Years ended December 31, 2018, 2017 and 2016 – (Continued)
requires the estimation of cash inflows and outflows several years into the future and only takes into consideration technological advances known at the time of review.
We review goodwill for impairment annually using a measurement date of October 31, primarily due to the timing of our annual budgeting process, or more frequently in the event of an impairment indicator. The fair value of each reporting unit that has goodwill is estimated using the average of both the income approach and the market approach, which we believe provides a reasonable estimate of the reporting unit’s fair value, unless facts or circumstances exist which indicate a more representative fair value. The income approach is a discounted cash flow model, which uses projected cash flows attributable to the reporting unit, including an allocation of certain corpora te expenses based primarily on proportional sales . We use historical results, trends and our projections of market growth, internal sales efforts and anticipated cost structure assumptions to estimate future cash flows. Using a risk-adjusted, weighted-average cost of capital, we discount the cash flow projections to the measurement date. The market approach estimates a price reasonably expected to be paid by a market participant in the purchase of the reporting units based on a comparison to similar businesses. If the fair value of any reporting unit was determined to be less than its carrying value, we would obtain comparable market values or independent appraisals of its net assets.
Derivative Financial Instruments
As part of our risk management activities, we employ derivative financial instruments, primarily interest rate swaps , cross currency swaps and foreign currency forward contracts, to hedge certain anticipated transactions, firm commitments, or assets and liabilities denominated in foreign currencies. We also purchase portions of our energy and precious metal requirements under fixed price forward purchase contracts designated as normal purchase contracts.
We record derivatives on our balance sheet as either assets or liabilities that are measured at fair value. For derivative instruments that are designated and qualify as cash flow hedges, the gain or loss on the derivative is reported as a compone nt of other comprehensive income or loss and reclassified from accumulated other comprehensive loss into earnings when the hedged transaction affects earnings. For derivatives that are designated and qualify as net investment hedges, the gain or loss on the derivative is reported as a component of other comprehensive income or loss. Time value is excluded and the cash payments are recognized as an adjustment to interest expense. For derivatives that are not designated as hedges, the gain or loss on the derivative is recognized in current earnings. We only use derivatives to manage well-defined risks and do not use derivatives for speculative purposes.
Postretirement and Other Employee Benefits
We recognize postretirement and other employee benefits expense as employees render the services necessary to earn those benefits. We determine defined benefit pension and other postretirement benefit costs and obligations with the assistance of third parties who perform certain actuarial calculations. The calculations and the resulting amounts recorded in our consolidated financial statements are affected by assumptions including the discount rate, expected long-term rate of return on plan assets, the annual rate of change in compensation for plan-eligible employees, estimated changes in costs of healthcare benefits, mortality tables, and other factors. We evaluate the assumptions used on an annual basis. All costs except the service cost component are recorded in Miscellaneous expense (income), net on the consolidated statement of operations.
Income Taxes
We account for income taxes in accordance with ASC Topic 740, Income Taxes , which requires the recognition of deferred tax assets and liabilities for the expected future tax effects of events that have been included in the financial statements. Under this method, deferred tax assets and liabilities are determined based on the differences between the financial statements and tax basis of assets and liabilities using enacted tax rates in effect for the year in which the differences are expected to reverse. The effect of a change in tax rates on deferred tax assets and liabilities is recognized in income in the period that includes the enactment date.
57
FERRO CORPORATION AND SUBSIDIARIES
NOTES TO CONSOLIDATED FINANCIAL STATEMENTS
Years ended December 31, 2018, 2017 and 2016 – (Continued)
We record deferred tax assets to the extent we believe these assets will more likely than not be realized. In making such determination, we consider all available positive and negative evidence, including future reversals of existing temporary differences, the availability of tax planning strategies, forecasted income, and recent financial operations.
We recognize a tax benefit from an uncertain tax position when it is more likely than not that the position will be sustained upon examination, including resolutions of any related appeals or litigation processes, based on the technical merits.
We recognize interest and penalties related to uncertain tax positions within the income tax expense line in the accompanying consolidated statements of operations.
Cash Equivalents
We consider all highly liquid instruments with original maturities of three months or less when purchased to be cash equivalents. These instruments are carried at cost, which approximates fair value.
Accounts Receivable and the Allowance for Doubtful Accounts
Ferro sells its products to customers in diversified industries throughout the world. No customer or related group of customers represents greater than 10% of net sales or accounts receivable. We perform ongoing credit evaluations of our customers and require collateral principally for export sales, when industry practices allow and as market conditions dictate, subject to our ability to negotiate secured terms relative to competitive offers. We regularly analyze significant customer accounts and provide for uncollectible accounts based on historical experience, customer payment history, the length of time the receivables are past due, the financial health of the customer, economic conditions and specific circumstances, as appropriate. Changes in these factors could result in additional allowances. Customer accounts we conclude to be uncollectible or to require excessive collection costs are written off against the allowance for doubtful accounts. Historically, write-offs of uncollectible accounts have been within our expectations. Detailed information about the allowance for doubtful accounts is provided below:
|
|
|||||||||
|
|
2018 |
2017 |
2016 |
||||||
|
|
(Dollars in thousands) |
||||||||
|
Allowance for doubtful accounts |
$ |
5,504 |
$ |
7,821 |
$ |
8,166 | |||
|
Bad debt expense |
681 | 44 | 1,383 | ||||||
Inventories
We value inve ntory at the lower of cost or net realizable value , with cost determined utilizing the first-in, first-out (FIFO) method. We periodically evaluate the net realizable value of inventories based primarily upon their age, but also upon assumptions of future usage in production, customer demand and market conditions. Inventory values have been reduce d to the lower of cost or net realizable value by allowances for slow moving or obsolete goods.
We maintain raw materials on our premises that we do not own, including precious metals consigned from financial institutions and customers. We also consign inventory to our vendors. Although we have physical possession of the goods, their value is not reflected on our balance sheet because we do not have legal title.
We obtain precious metals under consignment agreements with financial institutions for periods of one year or less. These precious metals are primarily silver, gold, platinum, and palladium and are used in the production of certain products for our customers. Under these arrangements, the financial institutions own the precious metals, and accordingly, we do not report these precious metals as inventory on our consolidated balance sheets although they are physically in our possession. The financial institutions charge us fees for these consignment arrangements, and these fees are recorded as cost of sales. These agreements are cancelable by either party at the end of each consignment period, however, because we have access to a number of consignment arrangements with available capacity, our
58
FERRO CORPORATION AND SUBSIDIARIES
NOTES TO CONSOLIDATED FINANCIAL STATEMENTS
Years ended December 31, 2018, 2017 and 2016 – (Continued)
consignment needs can be shifted among the other participating institutions in order to ensure our supply. In certain cases, these financial institutions can require cash deposits to provide additional collateral beyond the value of the underlying precious metals.
Property, Plant and Equipment
We record property, plant and equipment at historical cost. In addition to the original purchased cost, including transportation, installation and taxes, we capitalize expenditures that increase the utility or useful life of existing assets. For constructed assets, we capitalize interest costs incurred during the period of construction. We expense repair and maintenance co sts , as incurred. We depreciate property, plant and equipment on a straight-line basis, generally over the following estimated useful lives of the assets:
|
Buildings |
20 to 40 years |
|
Machinery and equipment |
5 to 15 years |
Other Capitalized Costs
We capitalize the costs of computer software developed or obtained for internal use after the preliminary project stage has been completed, and management, with the relevant authority, authorizes and commits to funding a computer software project, and it is probable that the project will be completed and the software will be used to perform the function intended. External direct costs of materials and services consumed in developing or obtaining internal-use computer software, payroll and payroll-related costs for employees who are directly associated with the project, and interest costs incurred when developing computer software for internal use are capitalized within Intangible assets. Capitalization ceases when the project is substantially complete, generally after all substantial testing is completed. We expense training costs and data conversion costs as incurred. We amortize software on a straight-line basis over its estimated useful life, which has historically been in a range of 1 to 10 years.
Environmental Liabilities
As part of the production of some of our products, we handle, process, use and store hazardous materials. As part of these routine processes, we expense recurring costs associated with control and disposal of hazardous materials as they are incurred. Occasionally we are subject to ongoing, pending or threatened litigation related to the handling of these materials or other matters. If, based on available information, we believe that we have incurred a liability and we can reasonably estimate the amount, we accrue for environmental remediation and other contingent liabilities. We disclose material contingencies if the likelihood of the potential loss is reasonably possible but the amount is not reasonably estimable.
In estimating the amount to be accrued for environmental remediation, we use assumptions about:
|
|
· |
|
Remediation requirements at the contaminated site; |
|
|
· |
|
The nature of the remedy; |
|
|
· |
|
Existing technology; |
|
|
· |
|
The outcome of discussions with regulatory agencies; |
|
|
· |
|
Other potentially responsible parties at multi-party sites; and |
|
|
· |
|
The number and financial viability of other potentially responsible parties. |
We actively monitor the status of sites, and, as assessments and cleanups proceed, we update our assumptions and adjust our estimates as necessary. Because the timing of related payments is uncertain, we do not discount the estimated remediation costs.
Recently Adopted Accounting Pronouncement
On April 1, 2018, we adopted Financial Accounting Standards Board (“FASB”) Accounting Standards Update (“ASU”) 2017-12, Derivatives and Hedging (Topic 815): Targeted Improvements to Accounting for Hedging Activities. ASU 2017-12 provides guidance
59
FERRO CORPORATION AND SUBSIDIARIES
NOTES TO CONSOLIDATED FINANCIAL STATEMENTS
Years ended December 31, 2018, 2017 and 2016 – (Continued)
to better align an entity’s risk management activities and financial reporting for hedging relationships through changes to both the designation and measurement guidance for qualifying hedging relationships and the presentation of hedge results. The adoption of this ASU did not have an impact to the opening balance of Retained earnings.
On April 1, 2018, we adopted FASB ASU 2018-03, Technical Corrections and Improvements to Financial Instruments - Overall (Subtopic 825-10): Recognition and Measurement of Financial Assets and Financial Liabilities. ASU 2018-03 provides targeted improvements to address certain aspects of recognition, measurement presentation, and disclosure of financial instruments. The adoption of ASU 2018-03 did not have a material im pact on the Company’s consolidated financial statements.
On January 1, 2018, we adopted FASB ASU 2017-09, Compensation – Stock Compensation: (Topic 718): Scope of Modification Accounting. ASU 2017-09 provides guidance about which changes to the terms or conditions of a share-based payment award require an entity to apply modification accounting in Topic 718. This new guidance would only impact our consolidated financial statements if, in the future, we modified the terms of any of our share-based awards. The adoption of ASU 2017-09 did not have a material impact on the Company’s consolidated financial statements.
On January 1, 2018, we adopted FASB ASU 2017-07, Compensation – Retirement Benefits: (Topic 715): Improving the Presentation of Net Periodic Pension Cost and Net Periodic Postretirement Benefit Costs. ASU 2017-07 requires that an employer report the service cost component in the same line item as other compensation costs arising from services rendered during the period. The other components of net benefit costs are to be presented in the income statement separately from the service cost component and outside a subtotal of income from operations. This ASU also allows only the service cost component of net benefit costs to be eligible for capitalization. We adopted this ASU using the retrospective approach. This resulted in the reclassification of income of $6.8 million from Selling, general and administrative expenses to Other expense, (income) in our consolidated statement of operations for the year ended December 31, 2017 , and a reclassification of loss of $14.4 million from Selling, general and administrative expenses and a loss of $5.2 million from Cost of Sales to Other expense, (income) in our consolidated statement of operations for the year ended December 31, 2016 . The Company used a practical expedient where the amount disclosed in our Retirement Benefits footnote for the prior year comparative period was the basis for the estimation for applying the retrospective presentation requirements. Other than this reclassification, the adoption of ASU 2017-07 did not have an impac t on the Company’s consolidated financial statements.
On January 1, 2018, we adopted FASB ASU 2017-01, Business Combinations: (Topic 805): Clarifying the Definition of a Business. ASU 2017-01 is intended to clarify the definition of a business with the objective of adding guidance to assist entities in evaluating whether transactions should be accounted for as acquisitions (or dispositions) of assets or businesses. The adoption of ASU 2017-01 did not have a material impact on the Company’s consolidated financial statements.
On January 1, 2018, we adopted FASB ASU 2016-16, Income Taxes: (Topic 740): Intra-Entity Transfers of Assets Other Than Inventory. ASU 2016-16 is intended to improve the accounting for the income tax consequences of intra-entity transfers of assets other than inventory and requires the recognition of the income tax consequences of an intra-entity transfer of an asset, other than inventory, when the transfer occurs. We adopted this ASU using the modified retrospective method. The impact of adopting this guid ance on the Company’s consolidated financial statements resulted in an increase to Retained earnings of $4.1 million and Deferred income taxes of $4.7 million and a decrease to Other receivables of $0.6 million on January 1, 2018.
On January 1, 2018, we adopted FASB ASU 2016-15, Statement of Cash Flow: (Topic 230): Classification of Certain Cash Receipts and Cash Payments. ASU 2016-15 is intended to address eight specific cash flow issues with the objective of reducing the existing diversity in practice. Adoption of ASU 2016-15 did not have a m aterial effect on our consolidated financial statements.
On January 1, 2018, we adopted FASB ASU 2014-09, Revenue from Contracts with Customers: (Topic 606) . This ASU replaces nearly all existing U.S. GAAP guidance on revenue recognition. The standard prescribes a five-step model for recognizing revenue, the application of which require significant judgment. We have completed our assessment and review of specific contracts and have adopted this ASU using the modified retrospective method with no impact to the opening Retained earnings balance.
60
FERRO CORPORATION AND SUBSIDIARIES
NOTES TO CONSOLIDATED FINANCIAL STATEMENTS
Years ended December 31, 2018, 2017 and 2016 – (Continued)
New Accounting Standards Not Yet Adopted
In August 2018, the FASB issued ASU 2018-14, Compensation-Retirement Benefits-Defined Benefit Plans-General (Subtopic 715-20): Disclosure Framework-Changes to the Disclosure Requirements for Defined Benefit Plans. ASU 2018-14 modifies disclosure requirements for employers that sponsor defined benefit pension or other postretirement plans. This pronouncement is effective for fiscal years beginning after December 15, 2020. The Company is in the process of assessing the impact that the adoption of this ASU will have on our consolidated financial statements.
In August 2018, the FASB issued ASU 2018-13, Fair Value Measurement (Topic 820): Disclosure Framework-Changes to the Disclosure Requirements for Fair Value Measurement. ASU 2018-13 modifies the disclosure requirements on fair value measurements. This pronouncement is effective for fiscal years beginning after December 15, 2019, including interim periods within those fiscal years. The Company has adopted this standard effective January 1, 2019, and will update the disclosures for the fair value measurements in accordance with the standard updates.
In February 2018, the FASB issued ASU 2018-02, Income Statement – Reporting Comprehensive Income (Topic 220): Reclassification of Certain Tax Effects from Accumulated Other Comprehensive Income. ASU 2018-02 allows a reclassification from Accumulated Other Comprehensive (Loss) Income to Retained Earnings for stranded tax effects resulting from the Tax Cuts and Jobs Act and requires certain disclosures about stranded tax effects. This pronouncement is effective for fiscal years beginning after December 15, 2018, including interim periods within those fiscal years. The Company has elected not to reclassify the stranded tax effects due to the Tax Cuts and Jobs Act within Accumulated Other Comprehensive Loss, as such reclassification is not deemed beneficial to users of the financial statements.
In January 2017, the FASB issued ASU 2017-04, Intangibles – Goodwill and Other: (Topic 350): Simplifying the Test for Goodwill Impairment. ASU 2017-04 is intended to simplify the subsequent measurement of goodwill by eliminating Step 2 from the current goodwill impairment test. This pronouncement is effective for the annual or any interim goodwill impairment tests conducted in fiscal years beginning after December 15, 2019. The Company is in the process of assessing the impact that the adoption of this ASU will have on our consolidated financial statements.
In February 2016, the FASB issued ASU 2016-02, Leases: (Topic 842). ASU 2016-02 requires companies to recognize a lease liability and asset on the balance sheet for operating leases with a term greater than one year. In July 2018, the FASB issued ASU 2018-11, Targeted Improvements. This ASU provides an additional transition method to adopt the new leasing standard. Under this new transition method, an entity initially applies the new leasing standard using a cumulative-effect adjustment to the opening balance of retained earnings but will continue to report comparative periods under existing guidance in accordance with ASC 840, Leases . The amendments in ASU 2018-11 are effective for fiscal years beginning after December 15, 2018, and interim periods within those fiscal years.
The Company adopt ed this standard effective January 1, 2019 , using this new transition method under ASU 2018-11 . We will elect the package of practical expedients permitted under the transition guidance, which allows us to carryforward our historical lease classification, our assessment on whether a contract is or contains a lease, and our initial direct costs for any leases that exist prior to adoption of the new standard. We will also elect to combine lease and non-lease components and to keep leases with an initial term of 12 months or less off the balance sheet. The Company has substantially completed the process of assessing the impact the adoption of this ASU will have on our consolidated financial statements . W e estimate the impact to be $28 million to $30 million recognized as total right-of-use assets and total lease liabilities on our consolidated balance sheet as of January 1, 2019 . Other than this impact , we do not expect the new standard to have a material impact on our remaining consolidated financial statements.
61
FERRO CORPORATION AND SUBSIDIARIES
NOTES TO CONSOLIDATED FINANCIAL STATEMENTS
Years ended December 31, 2018, 2017 and 2016 – (Continued)
No other new accounting pronouncements issued or with ef fective dates during fiscal 2018 had or are expected to have a material impact of the Company’s consolidated financial statement.
3. Revenue
Revenues disaggregated by geography and reportable segment for the year ended December 31, 2018, follow:
|
|
EMEA |
United States |
Asia Pacific |
Latin America |
Total |
||||||||||
|
|
(Dollars in thousands) |
||||||||||||||
|
Performance Coatings |
$ |
475,435 |
$ |
49,050 |
$ |
108,623 |
$ |
100,818 |
$ |
733,926 | |||||
|
Performance Colors and Glass |
235,238 | 157,963 | 71,124 | 23,130 | 487,455 | ||||||||||
|
Color Solutions |
142,102 | 172,901 | 41,642 | 34,382 | 391,027 | ||||||||||
|
Total net sales |
$ |
852,775 |
$ |
379,914 |
$ |
221,389 |
$ |
158,330 |
$ |
1,612,408 | |||||
Revenues disaggregated by geography and reportable segment for the year ended December 31, 2017, follow:
|
|
EMEA |
United States |
Asia Pacific |
Latin America |
Total |
||||||||||
|
|
(Dollars in thousands) |
||||||||||||||
|
Performance Coatings |
$ |
346,199 |
$ |
46,468 |
$ |
94,722 |
$ |
106,640 |
$ |
594,029 | |||||
|
Performance Colors and Glass |
203,280 | 155,284 | 64,853 | 21,236 | 444,653 | ||||||||||
|
Color Solutions |
134,122 | 154,730 | 36,343 | 32,865 | 358,060 | ||||||||||
|
Total net sales |
$ |
683,601 |
$ |
356,482 |
$ |
195,918 |
$ |
160,741 |
$ |
1,396,742 | |||||
Revenues disaggregated by geography and reportable segment for the year ended December 31, 2016, follow:
|
|
EMEA |
United States |
Asia Pacific |
Latin America |
Total |
||||||||||
|
|
(Dollars in thousands) |
||||||||||||||
|
Performance Coatings |
$ |
289,780 |
$ |
46,063 |
$ |
89,573 |
$ |
101,565 |
$ |
526,981 | |||||
|
Performance Colors and Glass |
160,475 | 132,432 | 59,121 | 19,436 | 371,464 | ||||||||||
|
Color Solutions |
64,800 | 121,692 | 30,770 | 29,585 | 246,847 | ||||||||||
|
Total net sales |
$ |
515,055 |
$ |
300,187 |
$ |
179,464 |
$ |
150,586 |
$ |
1,145,292 | |||||
62
FERRO CORPORATION AND SUBSIDIARIES
NOTES TO CONSOLIDATED FINANCIAL STATEMENTS
Years ended December 31, 2018, 2017 and 2016 – (Continued)
4 . Discontinued Operations
During 2016, the Company completed the disposition of the Europe-based Polymer Additives business to Plahoma Two AG, an affiliate of the LIVIA Group. The Company made a capital contribution of €12 million (approximately $13.6 million) to its subsidiaries that owned the assets prior to t he close of the sale. In 2016 , an impairment charge of $50.9 million was recorded under ASC Topic 360 Property, Plant and Equipment. The charge was calculated as the difference of the executed transaction price and the carrying value of the assets. The impairment charge included $1.1 million associated with the reclassification of foreign currency translation loss from Accumulated ot her comprehensive loss . The Europe-based Polymer Additives operating results, net of income tax, are classified as discontinued operations in the accompanying consolidated statements of operations for the year ended December 31, 2016 .
The table below summarizes results for the Europe-based Polymer Additives assets , for t h e year ended December 31, 2016 , which is reflected in our consolidated statements of operatio ns as discontinued operations. Interest expense has been allocated to the discontinued operations based on the ratio of net assets of each business to consolidated net assets excluding debt.
|
|
||||
|
|
2016 |
|||
|
|
||||
|
Net sales |
$ |
18,481 | ||
|
Cost of sales |
28,473 | |||
|
Gross loss |
(9,992) | |||
|
Selling, general and administrative expenses |
3,094 | |||
|
Restructuring and impairment charges |
50,902 | |||
|
Interest expense |
325 | |||
|
Miscellaneous (income), net |
(392) | |||
|
Loss from discontinued operations before income taxes |
(63,921) | |||
|
Income tax expense |
543 | |||
|
Loss from discontinued operations, net of income taxes |
$ |
(64,464) | ||
5. Acquisitions
Quimicer, S.A.
On October 1, 2018, the Company acquired 100% of the equity interests of Quimicer, S.A. (“Quimicer”), for €32 . 2 million (approximately $37 . 4 million), including the assumption of debt of € 5. 2 million (approximately $6.1 million) . The information included herein has been prepared based on the preliminary allocation of the purchase price using estimates of the fair value and useful lives of the assets acquired and liabilities assumed, which were determined with the assistance of third parties who performed independent valuations using discounted cash flow and comparative market approaches, and estimates made by management. As of December 31, 2018, the purchase price allocation is subject to further adjustment until all information is fully evaluated by the Company. The Company
63
FERRO CORPORATION AND SUBSIDIARIES
NOTES TO CONSOLIDATED FINANCIAL STATEMENTS
Years ended December 31, 2018, 2017 and 2016 – (Continued)
preliminarily recorded $21.5 million of personal and real property, $15.9 million of net working capital, $3.0 million of goodwill and $3.0 million of deferred tax liability on the consolidated balance sheet.
UWiZ Technology Co., Ltd.
On September 25, 2018, the Company acquired 100% of the equity interests of UWiZ Technology Co., Ltd. (“UWiZ”) for TWD823 .4 million (approximately $26.9 million) in cash . The information included herein has been prepared based on the preliminary allocation of the purchase price using estimates of the fair value and useful lives of the assets acquired and liabilities assumed, which were determined with the assistance of third parties who performed independent valuations using discounted cash flow and comparative market approaches, and estimates made by management. As of December 31, 2018, the purchase price allocation is subject to further adjustment until all information is fully evaluated by the Company. The Company preliminarily recorded $12.5 million of net working capital, $7.1 million of goodwill, $6.6 million of amortizable intangible assets, $2.4 million of personal and real property and $1.7 million of deferred tax liability on the consolidated balance sheet.
Ernst Diegel GmbH
On August 31, 2018, the Company acquired 100% of the equity interests of Ernst Diegel GmbH (“Diegel”), including the real property of a related party, for €12. 1 million (approximately $14.0 million) in cash . The information included herein has been prepared based on the preliminary allocation of the purchase price using estimates of the fair value and useful lives of the assets acquired and liabilities assumed, which were determined with the assistance of third parties who performed independent valuations using discounted cash flow and comparative market approaches, and estimates made by management. As of December 31, 2018, the purchase price allocation is subject to further adjustment until all information is fully evaluated by the Company. The Company preliminarily recorded $7.0 million of personal and real property, $4.8 million of net working capital, $2.0 million of amortizable intangible assets, $1.7 million of goodwill and $1.5 million of deferred tax liability on the consolidated balance sheet.
MRA Laboratories, Inc.
On July 12, 2018, the Company acquired 100% of the equity interests of MRA Laboratories, Inc. (“MRA”) for $16.0 million in cash . The information included herein has been prepared based on the preliminary allocation of the purchase price using estimates of the fair value and useful lives of the assets acquired and liabilities assumed, which were determined with the assistance of third parties who performed independent valuations using discounted cash flow and comparative market approaches, and estimates made by management. As of December 31, 2018, the purchase price allocation is subject to further adjustment until all information is fully evaluated by the Company. The Company preliminarily recorded $7.2 million of goodwill, $6.7 million of amortizable intangible assets, $3.4 million of net working capital, $1.6 million of deferred tax liability and $0.3 million of personal and real property on the consolidated balance sheet.
PT Ferro Materials Utama
On June 29, 2018, the Company acquired 66% of the equity interests of PT Ferro Materials Utama (“FMU”) for $2.7 million in cash, in addition to the forgiveness of debt of $9.2 million, bringing our total ownership to 100% . The Company previously recorded its investment in FMU as an equity method investment, and following this transaction, the Company fully consolidates FMU. Due to the change of control that occurred, the Company recorded a gain on purchase of $2.6 million, which is recorded in Miscellaneous expense (income), net, related to the difference between the Company’s carrying value and fair value of the previously held equity method investment.
Endeka Group
On November 1, 2017, the Company acquired 100% of the equity interests of Endeka Group (“Endeka”), a global producer of high-value coatings and key raw materials for the ceramic tile market, for €72. 8 million (approximately $84. 8 million), including the assumption of debt of € 13. 1 million (approximately $15.3 million). The Company incurred acquisition costs of $0.5 million and $2.5 million for the year ended December 31, 2018 and 2017, respectively, which is included in Selling, general and administrative expenses
64
FERRO CORPORATION AND SUBSIDIARIES
NOTES TO CONSOLIDATED FINANCIAL STATEMENTS
Years ended December 31, 2018, 2017 and 2016 – (Continued)
in our consolidated statements of operations. The acquired business contributed net sales of $111.5 million and $19.4 million for the year ended December 31, 2018 and 2017, respectively, and net income attributable to Ferro Corporation of $14 . 1 million for the year ended December 31, 2018 and net loss attributable to Ferro Corporation of $1.7 million for the year ended December 31, 2017.
The information included herein has been prepared based on the allocation of the purchase price using the fair value and useful lives of the assets acquired and liabilities assumed, which were determined with the assistance of third parties who performed independent valuations using discounted cash flow and comparative market approaches, and estimates made by management. During 2018, the Company adjusted the net working capital on the opening balance sheet and as such, the carrying amount of the personal and real property decreased $5.9 million. The Company recorded $44. 1 million of net working capital, $25. 9 million of deferred tax assets, $15. 9 million of personal and real property and $1. 1 million of noncontrolling interest on the consolidated balance sheet.
Gardenia Quimica S.A.
On August 3, 2017, the Company acquired a majority interest in Gardenia Quimica S.A. (“Gardenia”) for $3.0 million . The Company previously owned 46% of Gardenia and recorded it as an equity method investment. Following this transaction, the Company owned 83.5% and fully consolidates Gardenia. Due to a change of control that occurred, the Company recorded a gain on purchase of $2.6 million related to the difference between the Company’s carrying value and fair value of the previously held equity method investment. On March 1, 2018, the Company acquired the remaining equity interest in Gardenia for $1.4 million.
Dip Tech Ltd.
On August 2, 2017, the Company acquired 100% of the equity interests of Dip Tech Ltd. (“Dip-Tech”), a leading provider of digital printing solutions for glass, for $77.0 million. Dip-Tech is headquartered in Kfar Saba, Israel. The purchase consideration consisted of cash paid at closing of $60.1 million, net of the net working capital adjustment, and contingent consideration of $16.9 million. The Company incurred acquisition costs of $0.1 million and $3.2 million for the year ended December 31, 2018 and 2017, respectively, which is included in Selling, general and administrative expenses in our consolidated statements of operations. The acquired business contributed net sales of $28.6 million and $18.2 million for the year ended December 31, 2018 and 2017, respectively, and net loss attributable to Ferro Corporation of $5 . 5 million and $2.2 million for the year ended December 31, 2018 and 2017, respectively. The net loss attributable to Ferro Corporation was primarily driven by acquired intangible asset amortization costs of $3.9 million and $1.6 million for the year ended December 31, 2018 and 2017, respectively , and by the amortization of inventory step up costs of $1.1 million for the year end ed December 31, 2017. Dip-Tech incurred research and development costs of $5.9 million and $2.6 million for the year ended December 31, 2018 and 2017, respectively.
The information included herein has been prepared based on the allocation of the purchase price using the fair value and useful lives of the assets acquired and liabilities assumed, which were determined with the assistance of third parties who performed independent valuations using discounted cash flow and comparative market approaches, and estimates made by management. The Company recorded $41.2 million of amortizable intangible assets, $33.5 million of goodwill, $7.2 million of deferred tax liabilities, $5.1 million of indefinite-lived intangible assets, $3.2 million of personal and real property and $1.2 million of net working capital on the consolidated balance sheet.
Smalti per Ceramiche, s.r.l
On April 24, 2017, the Company acquired 100% of the equity interests of S.P.C. Group s.r.l., and 100% of the equity interest of Smalti per Ceramiche, s.r.l. (together “SPC”), for € 18. 7 million (approximately $20. 3 million), including the assumption of debt of € 5. 7 million (approximately $6.2 million). SPC is a high-end tile coatings manufacturer based in Italy focused on fast-growing specialty products. SPC’s products, strong technology, design capabilities, and customer-centric business model are complementary to our Performance Coatings segment, and position us for continued growth in the high-end tile markets . The Company incurred acquisition
65
FERRO CORPORATION AND SUBSIDIARIES
NOTES TO CONSOLIDATED FINANCIAL STATEMENTS
Years ended December 31, 2018, 2017 and 2016 – (Continued)
costs for the year ended December 31, 2017, of $1.5 million which is included in Selling, general and administrative expenses in our consolidated statements of operations.
The information included herein has been prepared based on the allocation of the purchase price using the fair value and useful lives of the assets acquired and liabilities assumed, which were determined with the assistance of third parties who performed independent valuations using discounted cash flow and comparative market approaches, and estimates made by management. The Company recorded $6.1 million of personal and real property, $6.0 million of amortizable intangible assets, $5.2 million of goodwill, $5.0 million of net working capital and $2.0 million of a deferred tax liability on the consolidated balance sheet.
Cappelle Pigments NV
On December 9, 2016, the Company acquired 100% of the equity interests of Belgium-based Cappelle Pigments NV (“Cappelle”), a leader in specialty, high-performance inorganic and organic pigments used in coatings, inks and plastics, for €49. 8 million (approximately $52.7 million), including the assumption of debt of €9.8 million (approximately $10.4 million) . The acquired business contributed net sales of $71.8 million, $71.8 million and $2.2 million for the year ended December 31, 2018, 2017, and 2016, respectively. The acquired business contributed net income attributable to Ferro Corporation of $6 . 4 million and $5.4 million for the year ended December 31, 2018 and 2017, respectively, and net loss attributable to Ferro Corporation of $1.8 million for the year ended December 31, 2016.
The information included herein has been prepared based on the allocation of the purchase price using the fair value and useful lives of the assets acquired and liabilities assumed, which were determined with the assistance of third parties who performed independent valuations using discounted cash flow and comparative market approaches and estimates made by management. The Company recorded $27. 7 million of net working capital, $25. 0 million of personal and real property, $3.8 million of goodwill and $3.8 million of a deferred tax liability on the consolidated balance sheet.
Electro-Science Laboratories, Inc.
On October 31, 2016, the Company acquired 100% of the equity interests of Electro-Science Laboratories, Inc. (“ESL”), a leader in electronic packaging materials for $78. 5 million. ESL is headquartered in King of Prussia, Pennsylvania. The acquisition of ESL enhances the Company’s position in the electronic packaging materials space with complementary products, and offers a platform for growth in our Performance Colors and Glass segment. ESL produces thick-film pastes and ceramics tape systems that enable important functionality in a wide variety of industrial and consumer applications. The acquired business contributed net sales of $83.0 million, $44.3 million, and $6.1 million for the year ended December 31, 2018, 2017 and 2016, respectively. The acquired business contributed net income attributable to Ferro Corporation of $18 . 2 million, $5.1 million and $0.5 million for the year ended December 31, 2018, 2017, and 2016, respectively. The Company incurred acquisition costs of $0.3 million for the year ended December 31, 2017 and $1.9 million for the year ended December 31, 2016, which is included in Selling, general and administrative expenses in our consolidated statements of operations.
The information included herein has been prepared based on the allocation of the purchase price using the fair value and useful lives of the assets acquired and liabilities assumed, which were determined with the assistance of third parties who performed independent valuations using discounted cash flow and comparative market approaches and estimates made by management. The Company recorded $39.7 million of intangible assets, $19. 0 million of goodwill, $18.9 million of net working capital, $2.9 million of personal and real property and, $2.0 million of a deferred tax liability on the consolidated balance sheet.
Delta Performance Products, LLC
On August 1, 2016, the Company acquired certain assets of Delta Performance Products, LLC (“Delta”), for a cash purchase price of $4.4 million. The information included herein has been prepared based on the allocation of the purchase price using the fair value and useful lives of the assets acquired and liabilities assumed, which were determined with the assistance of third parties who performed independent valuations using discounted cash flow and comparative market approaches and estimates made by management. The
66
FERRO CORPORATION AND SUBSIDIARIES
NOTES TO CONSOLIDATED FINANCIAL STATEMENTS
Years ended December 31, 2018, 2017 and 2016 – (Continued)
Company recorded $3.2 million of amortizable intangible assets, $0.6 million of net working capital, $0.4 million of goodwill and, $0.2 million of a deferred tax asset on the consolidated balance sheet.
Pinturas Benicarló, S.L.
On June 1, 2016, the Company acquired 100% of the equity interests of privately held Pinturas Benicarló, S.L. (“Pinturas”) for €16. 5 million in cash (approximately $18. 4 million). The information included herein has been prepared based on the allocation of the purchase price using the fair value and useful lives of the assets acquired and liabilities assumed, which were determined with the assistance of third parties who performed independent valuations using discounted cash flow and comparative market approaches and estimates made by management. The Company recorded $8.8 million of amortizable intangible assets, $7. 7 million of net working capital, $3.9 million of goodwill, $2. 7 million of a deferred tax liability and, $0.7 million of personal and real property on the consolidated balance sheet.
Ferer Dis Ticaret Ve Kimyasallar Anonim Sirketi A.S.
On January 5, 2016, the Company acquired 100% of the equity interests of privately held Istanbul-based Ferer Dis Ticaret Ve Kimyasallar Anonim Sirketi A.S. (“Ferer”) for $9.4 million in cash. The information included herein has been prepared based on the allocation of the purchase price using the fair value and useful lives of the assets acquired and liabilities assumed, which were determined with the assistance of third parties who performed independent valuations using discounted cash flow and comparative market approaches and estimates made by management. The Company recorded $4.5 million of goodwill, $3.3 million of amortizable intangible assets, $1.7 million of net working capital, $0.7 million of a deferred tax liability, and $0.6 million of personal and real property on the consolidated balance sheet.
Inventory at December 31 consisted of the following:
|
|
||||||
|
|
2018 |
2017 |
||||
|
|
(Dollars in thousands) |
|||||
|
Raw materials |
$ |
116,219 |
$ |
112,300 | ||
|
Work in process |
55,884 | 39,454 | ||||
|
Finished goods |
184,895 | 172,426 | ||||
|
Total inventories |
$ |
356,998 |
$ |
324,180 | ||
In the production of some of our products, we use precious metals, some of which we obtain from financial institutions under consignment agreements with terms of one year or less. The financial institutions retain ownership of the precious metals and charge us fees based on the amounts we consign. These fees were $2 . 1 milli on for 2018 , $1 . 2 mill ion for 2017 , and $0 . 8 million for 2016 . We had on hand precious metals owned by participants in our precious metals consignment program of $ 55 . 2 million at December 31, 2018 , and $37 . 7 million at December 31, 2017 , measured at fair value based on market prices for identical assets.
67
FERRO CORPORATION AND SUBSIDIARIES
NOTES TO CONSOLIDATED FINANCIAL STATEMENTS
Years ended December 31, 2018, 2017 and 2016 – (Continued)
7 . Property, Plant and Equipment
Property, Plant and Equipment at December 31 consisted of the following:
|
|
||||||
|
|
2018 |
2017 |
||||
|
|
||||||
|
|
(Dollars in thousands) |
|||||
|
|
||||||
|
Land |
$ |
55,501 |
$ |
48,566 | ||
|
Buildings |
214,963 | 199,076 | ||||
|
Machinery and equipment |
553,855 | 548,864 | ||||
|
Construction in progress |
80,410 | 28,125 | ||||
|
Total property, plant and equipment |
904,729 | 824,631 | ||||
|
Total accumulated depreciation |
(523,388) | (502,889) | ||||
|
Property, plant and equipment, net |
$ |
381,341 |
$ |
321,742 | ||
Depreciation expense was $ 38 . 1 million for 201 8 , $36 . 9 million for 2017 , and $37 . 9 million for 2016 . Noncash investing activities for capital expenditures, consisting of new capital leases during the year and unpaid capital expenditure liabilities at year end, were $ 13 . 6 million for 2018 , $8 . 8 million for 2017 , and $5 . 0 million for 2016 .
As discussed in Note 4, the Company completed the disposition of the Europe-bas ed Po lymer Additives business in 2016. In 2016, an impairment charge of $50.9 million was recorded under ASC Topic 360 Property, Plant and Equipment. The charge was calculated as the difference of the executed transaction price and the carrying value of the assets and is included in Loss from discontinued operations, net of income taxes, in our consolidated statements of operations for th e year ended Decembe r 31, 2016 .
The following table present s information about the Company’s impairment charges on assets that were required to be measured on a fair value basis for th e year ended December 31, 2016 . The table also indicates the level within the fair value hierarchy of the valuation techniques used by the Company to determine the fair value:
|
|
|||||||||||||||
|
|
Fair Value Measurements Using |
Total |
|||||||||||||
|
Description |
Level 1 |
Level 2 |
Level 3 |
Total |
(Losses) |
||||||||||
|
|
(Dollars in thousands) |
||||||||||||||
|
December 31, 2016 |
$ |
— |
$ |
— |
$ |
— |
$ |
— |
$ |
(50,902) | |||||
|
|
|||||||||||||||
The inputs to the valuation techniques used to measure fair value are classified into the following categories:
Level 1: Quoted market prices in active markets for identical assets or liabilities.
Level 2: Observable market-based inputs or unobservable inputs that are corroborated by market data.
Level 3: Unobservable inputs that are not corroborated by market data.
During 2016, we recorded a $3.9 mil lion gain on sale from the sale proceeds of a closed site in Australia which was recorded in Miscellaneous expense (income) , net in our consolidated statements of operations for the year ended December 31, 2016.
68
FERRO CORPORATION AND SUBSIDIARIES
NOTES TO CONSOLIDATED FINANCIAL STATEMENTS
Years ended December 31, 2018, 2017 and 2016 – (Continued)
8 . Goodwill and Other Intangible Assets
Details and activity in the Company’s goodwill by segment are as follows:
|
|
||||||||||||
|
|
||||||||||||
|
|
Performance |
|||||||||||
|
|
Performance |
Color |
Colors and |
|||||||||
|
|
Coatings |
Solutions |
Glass |
Total |
||||||||
|
|
(Dollars in thousands) |
|||||||||||
|
Goodwill, net at December 31, 2016 |
$ |
28,090 | 40,421 | 79,785 | 148,296 | |||||||
|
Acquisitions |
5,970 |
(2) |
328 |
(4) |
31,616 |
(1), (3) |
37,914 | |||||
|
Foreign currency adjustments |
4,176 | 1,786 | 3,197 | 9,159 | ||||||||
|
Goodwill, net at December 31, 2017 |
38,236 | 42,535 | 114,598 | 195,369 | ||||||||
|
Acquisitions |
8,171 |
(6) |
8,857 |
(8) |
8,530 |
(5), (7) |
25,558 | |||||
|
Foreign currency adjustments |
(2,055) | (847) | (1,561) | (4,463) | ||||||||
|
Goodwill, net at December 31, 2018 |
$ |
44,352 |
$ |
50,545 |
$ |
121,567 |
$ |
216,464 | ||||
( 1 ) During 2017, the Company recorded a purchase price adjustment within the measurement period for goodwill related to the ESL acquisition.
(2 ) During 2017, the Company recorded goodwill related to the SPC and Garden ia acquisitions.
(3 ) During 2017, the Company recorded goodwill related to the Dip-T ech acquisition.
(4 ) During 2017, the Company recorded a purchase price adjustment within the measurement period for goodwill related to the Cappelle acquisition.
(5 ) During 2018, the Company recorded a purchase price adjustment within the measurement period for goodwill related to the Dip-Tech acquisition.
(6 ) During 2018, the Company recorded goodwill related to the FMU acquisition and recorded goodwill related to the Quimicer acquisition .
(7) During 2018, the Company recorded goodwill related to the M RA acquisition.
(8) During 2018, the Company recorded goodwill related to the UWiZ and Diegel acquis ition s .
Refer to Note 5 for additional details on acquisitions mentioned above .
|
|
December 31, |
December 31, |
||||
|
|
2018 |
2017 |
||||
|
|
(Dollars in thousands) |
|||||
|
Goodwill, gross |
$ |
274,931 |
$ |
253,836 | ||
|
Accumulated impairment losses |
(58,467) | (58,467) | ||||
|
Goodwill, net |
$ |
216,464 |
$ |
195,369 | ||
The significant assumptions and ranges of assumptions we used in our impairment analyses of goodwill follow:
|
|
|||||||
|
Significant Assumptions |
2018 |
2017 |
|||||
|
Weighted-average cost of capital |
13.0% - 14.75 |
% |
11.0% - 13.5 |
% |
|||
|
Residual growth rate |
3.0 |
% |
3.0 |
% |
During the fourth quarter of 2018 and 2017 , we performed our annual goodwill impairment testing. The test entailed comparing the fair value of our reporting units to their carrying value as of the meas urement date of October 31, 2018, and October 31, 2017 , respectively. We performed step 1 of the annual impairment test as defined in ASC Topic 350, Intangibles - Goodwill and Other . During our 2018 and 2017 assessment , the result of the goodwill impairment test was that there were no indicators of impairment. During our 2016 assessment , an impairment indicator was identified within our Tile Coating Systems reporting unit, a component of our Performance Coatings segment. The impairment indicator was the current and forecasted performance of the reporting unit in total. We compared the carrying value against the fair value, and determined that the carrying value exceeded the fair value. As a result, an impairment loss of $13.2 million has been included in restructuring and impairment charges in the consolidated statement of operations
69
FERRO CORPORATION AND SUBSIDIARIES
NOTES TO CONSOLIDATED FINANCIAL STATEMENTS
Years ended December 31, 2018, 2017 and 2016 – (Continued)
for the year ended December 31, 2016. The Company is not aware of any events or circumstances that occurred between the annual asses sment date and December 31, 2018 , which would require further testing of goodwill for impairment .
|
|
|||||||||||||||
|
|
Fair Value Measurements Using |
Total |
|||||||||||||
|
Description |
Level 1 |
Level 2 |
Level 3 |
Total |
(Losses) |
||||||||||
|
|
(Dollars in thousands) |
||||||||||||||
|
December 31, 2016 |
$ |
— |
$ |
— |
$ |
— |
$ |
— |
$ |
(13,198) | |||||
A mortizable intangible assets at December 31 consisted of the following:
|
|
Estimated |
||||||||
|
|
Economic Life |
2018 |
2017 |
||||||
|
|
(Dollars in thousands) |
||||||||
|
Gross amortizable intangible assets: |
|||||||||
|
Patents |
10 - 16 years |
$ |
5,462 |
$ |
5,279 | ||||
|
Land rights |
20 - 40 years |
4,773 | 4,947 | ||||||
|
Technology/know-how and other |
1- 30 years |
132,084 | 131,070 | ||||||
|
Customer relationships |
10 - 20 years |
100,368 | 93,500 | ||||||
|
Total gross amortizable intangible assets |
242,687 | 234,796 | |||||||
|
Accumulated amortization: |
|||||||||
|
Patents |
(5,440) | (5,226) | |||||||
|
Land rights |
(2,909) | (2,883) | |||||||
|
Technology/know-how and other |
(48,898) | (45,214) | |||||||
|
Customer relationships |
(17,306) | (11,114) | |||||||
|
Total accumulated amortization |
(74,553) | (64,437) | |||||||
|
Amortizable intangible assets, net |
$ |
168,134 |
$ |
170,359 | |||||
We amortize amortizable intangible assets on a straight-line basis over the estimated useful lives of the assets. Amortization expense related to amortizable intangible assets was $ 15 . 8 million for 2018 , $13 . 1 million for 2017 , and $8 . 9 million for 2016 . A mortization expense for amortizable intangible assets is expected to be approximately $ 16 . 7 million for 2019 , $15 . 5 million for 2020 , $14 . 5 million for 2021 , $14 . 3 million for 2022 , and $14 . 1 million for 2023 .
Indefinite-lived intangible assets at December 31 consisted of the following:
|
|
|||||||||
|
|
2018 |
2017 |
|||||||
|
|
(Dollars in thousands) |
||||||||
|
Indefinite-lived intangibles assets: |
|||||||||
|
Trade names and trademarks |
$ |
16,819 |
$ |
17,257 | |||||
70
FERRO CORPORATION AND SUBSIDIARIES
NOTES TO CONSOLIDATED FINANCIAL STATEMENTS
Years ended December 31, 2018, 2017 and 2016 – (Continued)
9
Loans payable and current portion of long-term debt at December 31 consisted of the following:
|
|
||||||
|
|
||||||
|
|
2018 |
2017 |
||||
|
|
(Dollars in thousands) |
|||||
|
Loans payable |
$ |
50 |
$ |
16,360 | ||
|
Current portion of long-term debt |
10,210 | 8,776 | ||||
|
Loans payable and current portion of long-term debt |
$ |
10,260 |
$ |
25,136 | ||
Long-term debt at December 31 consisted of the following:
|
|
||||||
|
|
||||||
|
|
2018 |
2017 |
||||
|
|
(Dollars in thousands) |
|||||
|
|
||||||
|
Term loan facility, net of unamortized issuance costs, maturing 2024 (1) |
$ |
809,022 |
$ |
645,242 | ||
|
Revolving credit facility |
— |
78,000 | ||||
|
Capital lease obligations |
3,963 | 4,913 | ||||
|
Other notes |
8,362 | 7,112 | ||||
|
Total long-term debt |
821,347 | 735,267 | ||||
|
Current portion of long-term debt |
(10,210) | (8,776) | ||||
|
Long-term debt, less current portion |
$ |
811,137 |
$ |
726,491 | ||
(1) The carrying value of the term loan facility, maturing 2024, is net of unamortized debt issuance costs of $4.8 million at December 31, 2018, and $7.5 million at December 31, 2017.
The annual maturities of long-term debt for each of the fi ve years after December 31, 2018 , are as follows (in thousands):
|
2019 |
$ |
10,575 | |
|
2020 |
9,671 | ||
|
2021 |
9,393 | ||
|
2022 |
10,203 | ||
|
2023 |
9,131 | ||
|
Thereafter |
778,077 | ||
|
Total maturities of long-term debt |
827,050 | ||
|
Unamortized issuance costs on Term loan facility |
(4,828) | ||
|
Imputed interest and executory costs on capitalized lease obligations |
(875) | ||
|
Total long-term debt |
$ |
821,347 |
71
FERRO CORPORATION AND SUBSIDIARIES
NOTES TO CONSOLIDATED FINANCIAL STATEMENTS
Years ended December 31, 2018, 2017 and 2016 – (Continued)
Amended Credit Facility
On April 25, 2018, the Company entered into an amendment (the “Amended Credit Facility”) to its existing credit facility (the “Credit Facility”) which Amended Credit Facility (a) provided a new revolving facility (the “2018 Revolving Facility”), which replaced the Company’s existing revolving facility, (b) repriced the (“Tranche B-1 Loans”), (c) provided new tranches of term loans (“Tranche B-2 Loans” and “Tranche B-3 Loans”) denominated in U.S. dollars and will be used for ongoing working capital requirements and general corporate purp oses. The Tranche B-2 Loans are bo rrowed by the Company and the Tranche B-3 Loans are borrowed on a joint and several basis by Ferro GmbH and Ferro Europe Holdings LLC.
The Amended Credit Facility consists of a $500 million secured revolving line of credit with a maturity of February 2023 , a $355 million secured term loan facility with a maturity of February 2024 , a $235 million secured term loan facility with a maturity of February 2024 and a $230 million secured term loan facility with a maturity of February 2024 . The term loans are payable in equal quarterly installments in an amount equal to 0.25% of the original principal amount of the term loans, with the remaining balance due on the maturity date thereof. In addition, the Company is required, on an annual basis, to make a prepayment in an amount equal to a portion of the Company’s excess cash flow, as calculated pursuant to the Amended Credit Facility, which prepayment will be applied first to the term loans until they are paid in full, and then to the revolving loans.
Subject to the satisfaction of certain conditions, the Company can request additional commitments under the revolving line of credit or term loans in the aggregate principal amount of up to $250 million to the extent that existing or new lenders agree to provide such additional commitments and/or term loans. The Company can also raise certain additional debt or credit facilities subject to satisfaction of certain covenant levels.
Certain of the Company’s U.S. subsidiaries have guaranteed the Company’s obligations under the Amended Credit Facility and such obligations are secured by (a) substantially all of the personal property of the Company and the U.S. subsidiary guarantors and (b) a pledge of 100% of the stock of certain of the Company’s U.S. subsidiaries and 65% of the stock of certain of the Company’s direct foreign subsidiaries. The Tranche B-3 Loans are guaranteed by the Company, the U.S. subsidiary guarantors and a cross-guaranty by the borrowers of the Tranche B-3 Loans, and are secured by the collateral securing the revolving loans and the other term loans, in addition to a pledge of the equity interests of Ferro GmbH.
Interest Rate – Term Loans: The interest rates applicable to the term loans will be, at the Company’s option, equal to either a base rate or a LIBOR rate plus, in both cases, an applicable margin.
|
|
· |
|
The base rate for term loans will be the highest of (i) the federal funds rate plus 0.50% , (ii) syndication agent’s prime rate, (iii) the daily LIBOR rate plus 1.00% or (iv) 0.00% . The applicable margin for base rate loans is 1.25% . |
|
|
· |
|
The LIBOR rate for term loans shall not be less than 0.0% and the applicable margin for LIBOR rate term loans is 2.25% . |
|
|
· |
|
For LIBOR rate term loans, the Company may choose to set the duration on individual borrowings for periods of one, two, three or six months, with the interest rate based on the applicable LIBOR rate for the corresponding duration. |
At December 31, 2018, the Company had borrowed $352.3 million under the Tranche B-1 Loans at a n interest rate of 5.05 % , $233.2 million under the Tranche B-2 Loans at an interest rate of 5.05 % , and $228.3 million under the Tranche B-3 Loans at an interest rate of 5.05 % . At December 31, 2018, there were no additional borrowings available under the Tranche B-1 Loans, Tranche B-2 Loans, and Tranche B-3 Loans. We entered into swap agreements in the second quarter of 2018. At December 31, 2018, the effective interest rate for the Tranche B-1 Loans, Tranche B-2 Loans, and Tranche B-3 Loans, after adjusting for the interest rate swap, was 5.19% , 3.43% , and 2.48% , respectively.
Interest Rate – Revolving Credit Line: The interest rates applicable to loans under the 2018 Revolving Credit Facility will be, at the Company’s option, equal to either a base rate or a LIBOR rate plus, in both cases, an applicable variable margin. The variable margin will be based on the ratio of (a) the Company’s total consolidated net debt outstanding (as defined in the Amended Credit Agreement) at such time to (b) the Company’s consolidated EBITDA (as defined in the Amended Credit Agreement) computed for the period of four consecutive fiscal quarters most recently ended.
72
FERRO CORPORATION AND SUBSIDIARIES
NOTES TO CONSOLIDATED FINANCIAL STATEMENTS
Years ended December 31, 2018, 2017 and 2016 – (Continued)
|
|
· |
|
The base rate for revolving loans will be the highest of (i) the federal funds rate plus 0.50% , (ii) syndication agent’s prime rate, (iii) the daily LIBOR rate plus 1.00% or (iv) 0.00% . The applicable margin for base rate loans will vary between 0.50% to 1.50% . |
|
|
· |
|
The LIBOR rate for revolving loans shall not be less than 0% and the applicable margin for LIBOR rate revolving loans will vary between 1.50% and 2.50% . |
|
|
· |
|
For LIBOR rate revolving loans, the Company may choose to set the duration on individual borrowings for periods of one, two, three or six months, with the interest rate based on the applicable LIBOR rate for the corresponding duration. |
At December 31, 2018, there were no borrowings under the 2018 Revolving Credit Facility . After reductions for outstanding letters of credit secured by these facilities, we had $495.3 million of additional borrowings available under the revolving credit facilities at December 31, 2018.
The Amended Credit Facility contains customary restrictive covenants including, but not limited to, limitations on use of loan proceeds, limitations on the Company’s ability to pay dividends and repurchase stock, limitations on acquisitions and dispositions, and limitations on certain types of investments. The Amended Credit Facility also contains standard provisions relating to conditions of borrowing and customary events of default, including the non-payment of obligations by the Company and the bankruptcy of the Company.
Specific to the 2018 Revolving Facility, the Company is subject to a financial covenant regarding the Company’s maximum leverage ratio. If an event of default occurs, all amounts outstanding under the Amended Credit Facility agreement may be accelerated and become immediately due and payable. At December 31, 2018, we were in compliance with the covenants of the Amended Credit Facility.
Credit Facility
On February 14, 2017 , the Company entered into a credit facility (the “Credit Facility”) with a group of lenders to refinance its then outstanding credit facility debt and to provide liquidity for ongoing working capital requirements and general corporate purposes.
The Credit Facility consisted of a $400 million secured revolving line of credit with a term of five years, a $357.5 million secured term loan facility with a term of seven years and a €250 million secured E uro term loan facility with a term of seven years. The term loans were payable in equal quarterly installments in an amount equal to 0.25% of the original principal amount of the term loans, with the remaining balance due on the maturity date thereof. In addition, the Company was required, on an annual basis, to make a prepaym ent of term loans until they were fully paid and then to the revolving loans in an amount equal to a portion of the Company’s excess cash flow, as calculated pursuant to the Credit Facility.
Subject to the satisfaction of cer tain conditions, the Company could request additional commitments under the revolving line of credit or term loans in the aggregate principal amount of up to $250 million , to the extent that existing or new lenders agree to provide such additional co mmitments an d/or term loans. The Company could also raise c ertain additional debt or credit facilities subject to satisfaction of certain covenant levels.
Certain of the Company’s U.S. subsidiaries guaranteed the Company’s obligations under the Credit F acility and such obligations were secured by (a) substantially all of the personal property of the Company and the U.S. subsidiary guarantors and (b) a pledge of 100% of the stock of certain of the Company’s U.S. subsidiaries and 65% of the stock of certain of the Company’s direct foreign subsidiaries.
Interest Rate – Term Loans: The interest rates applicabl e to the U.S. term loans was , at the Company’s option, equal to either a base rate or a LIBOR rate plus, in both cases, an applicable margin. The interest rates applicabl e to the Euro term loans was a Euro Interbank Offered Rate (“EURIBOR”) rate plus an applicable margin.
73
FERRO CORPORATION AND SUBSIDIARIES
NOTES TO CONSOLIDATED FINANCIAL STATEMENTS
Years ended December 31, 2018, 2017 and 2016 – (Continued)
|
|
· |
|
The base rate for U.S. term loans will be the highest of (i) the federal funds rate plus 0.50% , (ii) syndication agent’s prime rate or (iii) the daily LIBOR rate plus 1.00% . The applicable margin for base rate loans is 1.50% . |
|
|
· |
|
The LIBOR rate for U.S. term loans shall not be less than 0.75% and the applicable margin for LIBOR rate U.S. term loans is 2.50% . |
|
|
· |
|
The EURIBOR rate for Euro term loans shall not be less than 0% and the applicable margin for EURIBOR rate loans is 2.75% . |
|
|
· |
|
For LIBOR rate term loans and EURIBOR rate term loans, the Company may choose to set the duration on individual borrowings for periods of one, two, three or six months, with the interest rate based on the applicable LIBOR rate or EURIBOR rate, as applicable, for the corresponding duration. |
At December 31, 2017 , the Company had borrowed $354.8 million under the secured term loan facility at an interest rate of 4.07% and €248.1 million (approximately $297.9 million) under the secured E uro term loan facility at an interest rate of 2.75% . At December 31, 2017 , there were no additional borrowings available under the term loan facilities. We entered into interest rate swap agreements in the second quarter of 2017. These swaps converted $150 million and €90 million of our term loans from variable interest rates to fixed inte rest rates. At December 31, 2017 , the effective interest rate for the term loan facilities after adjusting for the interest rate swap was 4.27% for the secured term loan facility and 3.00% for the E uro term loan facility.
Interest Rate – Revolving Credit Line: The interest rates applicable to loans under t he revolving credit line was , at the Company’s option, equal to either a base rate or a LIBOR rate plus, in both cases, an applicable variable marg in. The variable margin was based on the ratio of (a) the Company’s total consolidated net debt outstanding at such time to (b) the Company’s consolidated EBITDA computed for the period of four consecutive fiscal quarters most recently ended.
|
|
· |
|
The base rate for revolving loans will be the highest of (i) the federal funds rate plus 0.50% , (ii) syndication agent’s prime rate or (iii) the daily LIBOR rate plus 1.00% . The applicable margin for base rate loans will vary between 0.75% and 1.75% . |
|
|
· |
|
The LIBOR rate for revolving loans shall not be less than 0% and the applicable margin for LIBOR rate revolving loans will vary between 1.75% and 2.75% . |
|
|
· |
|
For LIBOR rate revolving loans, the Company may choose to set the duration on individual borrowings for periods of one, two, three or six months, with the interest rate based on the applicable LIBOR rate for the corresponding duration. |
At December 31, 2017 , there were $78.0 million of borrowings under the revolving credit line at an interest rate of 3.63% . After reductions for outstanding letters of credit secured by these facilities, we had $317.3 million of additional borrowings available under the revolving credit facilitie s at December 31, 2017 .
The Credit Facility contained customary restrictive covenants including, but not limited to, limitations on use of loan proceeds, limitations on the Company’s ability to pay dividends and repurchase stock, limitations on acquisitions and dispositions, and limitations on certain types of investments. T he Credit Facility also contained standard provisions relating to conditions of borrowing and customary events of default, including the non-payment of obligations by the Company and the bankruptcy of the Company.
74
FERRO CORPORATION AND SUBSIDIARIES
NOTES TO CONSOLIDATED FINANCIAL STATEMENTS
Years ended December 31, 2018, 2017 and 2016 – (Continued)
Specific to the revolving credit facility, the Company was subject to a financial covenant regarding the Company’s maximum leverage ratio. If an event of default occurs, all amounts outstanding under the Credit Facility may be accelerated and become immediately due an d payable. At December 31, 2017 , we were in compliance with the covenants of the Credit Facility.
In conjunction with the refinancing of the Credit Facility, we recorded a charge of $3.2 million in connection with the write-off of unamortized issuance costs, which is recorded within Loss on extinguishment of debt in our consolidated statement of operations for the year ended December 31, 2018 .
2014 Credit Facility
In 2014, the Company entered into a credit facility that was amended on January 25, 2016, and August 29, 2016, resulting in a $400 million secured revolving line of credit with a term of five years and a $300 million secured term loan facility with a term of seven years from the original issuance date (the “2014 Credit Facility”) with a group of lenders that was replaced on February 14, 2017, by the Credi t Facility (as defined above).
In conjunction with the refinancing of the 2014 Credit Facility, we recorded a charge of $3.9 million in connection with the write-off of unamortized issuance costs, which is recorded within Loss on extinguishment of debt in our consolidated statement of operations for the year ended December 31, 2017.
International Receivable Sales Programs
We have several international programs to sell without recourse trade accounts receivable to financial institutions. These transactions are treated as a sale and are accounted for as a reduction in accounts receivable because the agreements transfer effective control over and risk related to the receivables to the buyers. The Company continues to service the receivables sold in exchange for a fee. The servicing fee for the year ended December 31, 2018 , was immaterial. The program, whose maximum capacity is 100 million Euro, is scheduled to expire in December 2023 . Generally, at the transfer date, the Company received cash equal to approximately 65% of the value of the sold receivable. Cash proceeds at the transfer date from these arrangements are reflected in operating activities in our consolidated statement of cash flows. The proceeds from the deferred purchase price are reflected in investing activities.
At December 31, 2018 , the outstanding principal amount of receivables sold under this program was $71.3 million. The carrying amount of d eferred purchase price was $23.0 million and is recorded in Other Receivables.
|
|
2018 |
||
|
|
(Dollars in thousands) |
||
|
Trade accounts receivable sold to financial institutions |
$ |
89,894 | |
|
Cash proceeds from financial institutions |
57,316 | ||
|
Trade accounts receivable collected to be remitted (1) |
11,552 | ||
(1) Included in Accrued expense and other current liabilities
Other Financing Arrangements
We maintain other lines of credit to provide global flexibility for Ferro’s short-term liquidity requirements. These facilities are uncommitted lines for our international operations and totaled $ 41 . 4 million at December 31, 2018 , and $64 . 5 million at December 31, 2017 . The unused portions of these lines provided additional liquidity of $ 30 . 3 million at December 31, 2018 , and $39 . 4 million at December 31, 2017 .
75
FERRO CORPORATION AND SUBSIDIARIES
NOTES TO CONSOLIDATED FINANCIAL STATEMENTS
Years ended December 31, 2018, 2017 and 2016 – (Continued)
The following table presents financial instrument assets (liabilities) at the carrying amount, fair value and classification within the fair value hierarchy:
|
|
|||||||||||||||
|
|
December 31, 2018 |
||||||||||||||
|
|
Carrying |
Fair Value |
|||||||||||||
|
|
Amount |
Total |
Level 1 |
Level 2 |
Level 3 |
||||||||||
|
|
(Dollars in thousands) |
||||||||||||||
|
Cash and cash equivalents |
$ |
104,301 |
$ |
104,301 |
$ |
104,301 |
$ |
— |
$ |
— |
|||||
|
Loans payable |
(50) | (50) |
— |
(50) |
— |
||||||||||
|
Term loan facility - Amended Credit Facility (1) |
(809,022) | (796,796) |
— |
(796,796) |
— |
||||||||||
|
Other long-term notes payable |
(8,362) | (5,258) |
— |
(5,258) |
— |
||||||||||
|
Cross currency swaps |
17,104 | 17,104 |
— |
17,104 |
— |
||||||||||
|
Interest rate swaps |
(5,244) | (5,244) |
— |
(5,244) |
— |
||||||||||
|
Foreign currency forward contracts, net |
(270) | (270) |
— |
(270) |
— |
||||||||||
|
|
December 31, 2017 |
||||||||||||||
|
|
Carrying |
Fair Value |
|||||||||||||
|
|
Amount |
Total |
Level 1 |
Level 2 |
Level 3 |
||||||||||
|
|
(Dollars in thousands) |
||||||||||||||
|
Cash and cash equivalents |
$ |
63,551 |
$ |
63,551 |
$ |
63,551 |
$ |
— |
$ |
— |
|||||
|
Loans payable |
(16,360) | (16,360) |
— |
(16,360) |
— |
||||||||||
|
Term loan facility - Credit Facility (1) |
(645,242) | (646,979) |
— |
(646,979) |
— |
||||||||||
|
Revolving credit facility - Credit Facility |
(78,000) | (79,295) |
— |
(79,295) |
— |
||||||||||
|
Other long-term notes payable |
(7,112) | (3,973) |
— |
(3,973) |
— |
||||||||||
|
Interest rate swaps |
1,616 | 1,616 |
— |
1,616 |
— |
||||||||||
|
Interest rate swaps |
(124) | (124) |
— |
(124) |
— |
||||||||||
|
Foreign currency forward contracts, net |
(469) | (469) |
— |
(469) |
— |
||||||||||
(1) The carrying values of the term loan facilities are net of unamortized debt issuance costs of $ 4 . 8 million and $ 7.5 million for th e period ended December 31, 2018, and December 31, 2017 , respectively.
The fair values of cash and cash equivalents are based on the fair values of identical assets. The fair values of loans payable are based on the present value of expected future cash flows and approximate their carrying amounts due to the short periods to maturity. T he fair value of the term loan facility is based on market price information and is measured using the last available bid price of the instrument on a secondary market . The revolving credit facility and other long-term notes payable are based on the present value of expected future cash flows and interest rates that would be currently available to the Company for issuance of similar types of debt instruments with similar terms and remaining maturities adjusted for the Company's performance risk. The fair values of our interest rate swaps and cross currency swaps are determined based on inputs that are readily available in public markets or can be derived from information available in publicly quoted markets. The fair values of the foreign currency forward contracts are based on market prices for comparable contracts.
Derivative Instruments
The Company may use derivative instruments to partially offset its business exposure to foreign currency and interest rate risk on expected future cash flows, on net investment in certain foreign subsidiaries and on certain existing assets and liabilities. However, the Company may choose not to hedge in countries where it is not economically feasible to enter into hedging arrangements or where hedging inefficiencies exist, such as timing of transactions.
76
FERRO CORPORATION AND SUBSIDIARIES
NOTES TO CONSOLIDATED FINANCIAL STATEMENTS
Years ended December 31, 2018, 2017 and 2016 – (Continued)
Derivatives Designated as Hedging Instruments
Cash Flow Hedges. For derivative instruments that are designated and qualify as cash flow hedges, the gain or loss on the derivative is recorded in Accumulated other comprehensive loss (“AOCL”) and reclassified into earnings in the same period during which the hedged transaction affects earnings.
The Company utilizes interest rate swaps to limit exposure to market fluctuations on floating-rate debt. During the second quarter of 2017, the Company entered into interest rate swap agreements that converted $150 million and €90 million of our term loans from variable interest rates to fixed interest rates. These swaps qualified for, and were designated as, cash flow hedges. This interest rate swap agreement were terminated in the second quarter of 2018 in connection with the refinancing of the Credit Facility.
During the second quarter of 2018, the Company entered into variable to fixed interest rate swaps wit h a maturity date of February 14 , 2024. The notional amount is $317 . 6 million at December 31, 2018. These swaps are hedging risk associated with the Tranche B-1 Loans. These interest rate swaps are designated as cash flow hedges. As of December 31, 2018, the Company expects it will reclassify net losses of approximately $0. 8 million, currently recorded in AOCL, into interest expense in earnings within the next twelve months. However, the actual amount reclassified could vary due to future changes in the fair value of these derivatives.
The Company has converted a US dollar denominated, variable rate debt obligation into a eu ro fixed rate obligation using receive-float, pay fixed cross currency swaps in the second quarter of 2018. These swaps are hedging currency and interest rate risk associated with the Tranche B-3 Loans. These cross currency swaps are designated as cash flow hedges. The notional amount is $2 28.3 million at December 31, 2018, with a maturity date of February 14 , 2024. The spot to spot change is recorded in Foreign currency losses, net, to offset the gain or loss recognized on the foreign denominated debt. As of December 31, 2018, the Company expects it will reclassify net gains of approximately $5. 9 million, currently recorded in AOCL, into interest expense in earnings within the next twelve months. However, the actual amount reclassified could vary due to future changes in the fair value of these derivatives.
The amount of (loss) gain recognized in AOCL and the amount of (loss) gain reclassified into earnings for the year ended December 31, 2018 and 2017, follow:
|
|
||||||||||||||
|
|
Amount of (Loss) Gain |
|||||||||||||
|
|
Amount of (Loss) Gain |
Reclassified from |
Location of (Loss) Gain |
|||||||||||
|
|
Recognized in AOCL |
AOCL into Income |
Reclassified from |
|||||||||||
|
|
2018 |
2017 |
2018 |
2017 |
AOCL into Income |
|||||||||
|
|
(Dollars in thousands) |
|||||||||||||
|
Interest rate swaps |
$ |
(4,513) |
$ |
1,492 |
$ |
(966) |
$ |
(527) |
Interest expense |
|||||
|
Cross currency swaps |
15,901 |
— |
3,616 |
— |
Interest expense |
|||||||||
|
|
$ |
2,650 |
$ |
(527) |
Total Interest expense |
|||||||||
|
Cross currency swaps |
14,509 |
— |
Foreign currency losses, net |
|||||||||||
|
|
$ |
14,509 |
$ |
— |
Total Foreign currency losses, net |
|||||||||
The total amounts of expen se line items presented in the c onsolidated statement of o perations in which the effects of cash flow hedges follow:
|
|
2018 |
2017 |
||||
|
|
(Dollars in thousands) |
|||||
|
Interest expense |
$ |
33,371 |
$ |
27,754 | ||
|
Foreign currency losses, net |
8,187 | 6,554 | ||||
Net investment hedge. For derivatives that are designated and qualify as net investment hedges, the gain or loss on the derivative is reported as a component of other comprehensive income or loss. These cross currency swaps are designated as hedges of our net
77
FERRO CORPORATION AND SUBSIDIARIES
NOTES TO CONSOLIDATED FINANCIAL STATEMENTS
Years ended December 31, 2018, 2017 and 2016 – (Continued)
investment in European operations. Time value is excluded from the assessment of effectiveness and the amount of interest paid or received on the swaps will be recognized as an adjustment to interest expense in earnings over the life of the swaps.
In the second quarter of 2017, the Company designated a portion of its Euro denominated debt as a net investment hedge for accounting purposes. The fair value of the net investment hedge is €31.0 million at December 31, 2017. This net investment hedge was terminated in the second quarter of 2018.
In the second quarter of 2018, the Company entered into cross currency swap agreements where we pay variable rate interest in Euros and receive variable rate interest in US dollars. The notional amount is €97.2 million at December 31, 2018 , with a maturity date of February 14, 2024 . These swaps are hedging risk associated with the net investment in EUR operations due to fluctuating exchange rates and are designated as net investment hedges . The changes in the fair value of these designated cross-currency swaps will be recognized in AOCL.
The amount of gain (loss) on net investment hedges recognized in AOCL, the amount reclassified into earnings and the amount of gain recognized in income on derivative (amount excluded from effectiveness testing) for the year ended December 31, 2018 and 2017, follow:
|
|
||||||||||||||||||||
|
|
Amount of Gain |
Amount of Gain Recognized in |
||||||||||||||||||
|
|
Amount of Gain (Loss) |
Reclassified from |
Income on Derivative (Amount |
|||||||||||||||||
|
|
Recognized in AOCL |
AOCL into Income |
Excluded from Effectiveness Testing) |
Location of Gain |
||||||||||||||||
|
|
2018 |
2017 |
2018 |
2017 |
2018 |
2017 |
(Loss) in Earnings |
|||||||||||||
|
|
(Dollars in thousands) |
|||||||||||||||||||
|
Cross currency swaps |
$ |
7,243 |
$ |
— |
$ |
— |
$ |
— |
$ |
2,261 |
$ |
— |
Interest expense |
|||||||
|
Net investment hedge |
— |
(10,972) |
— |
— |
— |
— |
Foreign currency losses, net |
|||||||||||||
Derivatives Not Designated as Hedging Instruments
Foreign currency forward contracts. We manage foreign currency risks principally by entering into forward contracts to mitigate the impact of currency fluctuations on transactions. These forward contracts are not formally designated as hedges. Gains and losses on these foreign currency forward contracts are netted with gains and losses from currency fluctuations on transactions arising from international trade, primarily intercompany transactions, and reported as Foreign currency losses, net in the consolidated statements of operations. We incurred net losses of approximately zero in 2018 , net losses of $ 2.9 million in 2017 and net losses of $ 2.7 million in 2016 , arising from the change in fair value of our financial instruments, which are netted against the related net gains and losses on international trade transactions. The fair values of these contracts are based on market prices for comparable contracts. The notional amount of foreign currency forward contracts was $ 387 . 2 million at December 31, 2018 , and $ 2 38.5 million at December 31, 2017 .
The following table presents the effect on our consolidated statements of operations for the years ended December 31, 2018, 2017 and 2016 , respectively, of foreign currency forward contracts:
|
|
Amount of (Loss) |
|||||||||
|
|
Recognized in Earnings |
|||||||||
|
|
||||||||||
|
|
2018 |
2017 |
2016 |
Location of (Loss) in Earnings |
||||||
|
|
||||||||||
|
|
(Dollars in thousands) |
|||||||||
|
Foreign currency forward contracts |
$ |
(12) |
$ |
(2,938) |
$ |
(2,714) |
Foreign currency losses, net |
|||
78
FERRO CORPORATION AND SUBSIDIARIES
NOTES TO CONSOLIDATED FINANCIAL STATEMENTS
Years ended December 31, 2018, 2017 and 2016 – (Continued)
Location and Fair Value Amount of Derivative Instruments
The following table presents the fair value s of our derivative instruments on our consolidated bal ance sheets at December 31 . All derivatives are reported on a gross basis.
|
|
||||||||
|
|
||||||||
|
|
2018 |
2017 |
Balance Sheet Location |
|||||
|
|
(Dollars in thousands) |
|||||||
|
Asset derivatives: |
||||||||
|
Interest rate swaps |
$ |
— |
$ |
1,616 |
Other non-current assets |
|||
|
Cross currency swaps |
9,606 |
— |
Other current assets |
|||||
|
Cross currency swaps |
7,498 |
— |
Other non-current assets |
|||||
|
Foreign currency forward contracts |
626 | 661 |
Other current assets |
|||||
|
Liability derivatives: |
||||||||
|
Interest rate swaps |
(755) | (124) |
Accrued expenses and other current liabilities |
|||||
|
Interest rate swaps |
(4,489) |
— |
Other non-current liabilities |
|||||
|
Foreign currency forward contracts |
$ |
(896) |
$ |
(1,130) |
Accrued expenses and other current liabilities |
|||
Income tax expense is based on our earnings from continuing operations before income taxes as presented in the following table:
|
|
||||||||||
|
|
2018 |
2017 |
2016 |
|||||||
|
|
(Dollars in thousands) |
|||||||||
|
U.S. |
$ |
2,233 |
$ |
9,857 |
$ |
7,416 | ||||
|
Foreign |
101,759 | 100,661 | 55,029 | |||||||
|
Total |
$ |
103,992 |
$ |
110,518 |
$ |
62,445 | ||||
Our income tax expense (benefit) from continuing operations consists of the following components:
|
|
2018 |
2017 |
2016 |
||||||
|
|
(Dollars in thousands) |
||||||||
|
Current: |
|||||||||
|
U.S. federal |
$ |
483 |
$ |
(82) |
$ |
4,616 | |||
|
Foreign |
26,156 | 29,289 | 24,675 | ||||||
|
State and local |
127 | 53 | 28 | ||||||
|
Total current |
26,766 | 29,260 | 29,319 | ||||||
|
Deferred: |
|||||||||
|
U.S. federal |
2,405 | 24,534 | 379 | ||||||
|
Foreign |
(5,603) | (1,064) | (11,830) | ||||||
|
State and local |
(522) | 20 |
— |
||||||
|
Total deferred |
(3,720) | 23,490 | (11,451) | ||||||
|
Total income tax expense (benefit) |
$ |
23,046 |
$ |
52,750 |
$ |
17,868 | |||
79
FERRO CORPORATION AND SUBSIDIARIES
NOTES TO CONSOLIDATED FINANCIAL STATEMENTS
Years ended December 31, 2018, 2017 and 2016 – (Continued)
In addition, income tax expense (benefit) that we allocated directly to Ferro Corporation shareholders’ equity is detailed in the following table:
|
|
2018 |
2017 |
2016 |
||||||
|
|
(Dollars in thousands) |
||||||||
|
Interest rate swaps |
$ |
(1,529) |
$ |
547 |
$ |
— |
|||
|
Postretirement benefit liability adjustments |
(16) | 18 | 30 | ||||||
|
Net investment hedge |
954 | (4,025) |
— |
||||||
|
Stock options exercised |
— |
— |
(2,355) | ||||||
|
Total income tax (benefit) expense allocated to Ferro Corporation shareholders' equity |
$ |
(591) |
$ |
(3,460) |
$ |
(2,325) | |||
A reconciliation of the U.S. federal statutory income tax rate and our effective tax rate follows:
|
|
||||||||||
|
|
2018 |
2017 |
2016 |
|||||||
|
U.S. federal statutory income tax rate |
21.0 |
% |
35.0 |
% |
35.0 |
% |
||||
|
Foreign tax rate difference |
7.6 | (7.3) | (8.8) | |||||||
|
Uncertain tax positions, net of tax audit settlements |
4.7 | 5.1 | 2.2 | |||||||
|
Non-deductible expenses |
2.9 | 2.4 | 3.4 | |||||||
|
Global intangible low-taxed income, net |
2.5 |
— |
— |
|||||||
|
Foreign currency |
0.6 | (0.6) | (1.6) | |||||||
|
State taxes |
0.1 | (0.1) | (0.7) | |||||||
|
Domestic production activities deduction |
— |
(0.6) | (0.2) | |||||||
|
Goodwill dispositions, impairments and amortization |
(0.3) | (1.8) | 8.3 | |||||||
|
Notional interest deduction |
(0.3) | (0.5) | (2.8) | |||||||
|
Foreign derived intangible income deduction |
(1.1) |
— |
— |
|||||||
|
Other |
(3.5) | (1.5) | 4.8 | |||||||
|
Tax rate changes |
(2.1) | 19.0 | (0.7) | |||||||
|
Adjustment of valuation allowances |
(4.5) | (0.3) | (7.4) | |||||||
|
Other tax credits |
(5.4) | (1.1) | (2.9) | |||||||
|
Effective tax rate |
22.2 |
% |
47.7 |
% |
28.6 |
% |
||||
On December 22, 2017, U.S. federal tax legislation, commonly referred to as the Tax Cut and Jobs Act (the “Tax Act”), was signed into law, significantly changing the U.S. corporate income tax system. These changes include a federal statutory rate reduction from 35% to 21% effective January 1, 2018. Changes in tax rates and tax law are accounted for in the period of enactment. Accordingly, the Company’s U.S. net deferred tax assets were re-measured to reflect the reduction in the federal statutory rate, resulting in a $21.5 million increase in income tax expense for the year ended December 31, 2017. The Tax Act also changed the U.S. taxation of worldwide income. The Tax Act contains many provisions which continue to be clarified through new regulations. Consistent with the guidance of SEC Staff Accounting Bulletin No. 118, Income Tax Accounting Implications of the Tax Cuts and Jobs Act (“SAB 11 8”), we completed our analysis w ithin 2018 and our initial determination of no tax due on the one-time mandatory deemed repatriation tax on accumulated foreign subsidiaries’ previously untaxed foreign earnings and profits was unchanged from our position at December 31, 2017. The Tax Act also subjects a U.S. shareholder to tax on its global intangible low-taxed income. In accordance with FASB Staff Q&A Topic 740, No. 5 "Accounting for Global Intangible Low-Taxed Income," we have elected to account for the tax on global intangible low-taxed income as a current period expense .
We have refundable income taxes of $ 13.5 million at December 31, 2018 , and $6 . 9 million at December 31, 2017 , classified as Other receivables on our consolidated balance sheets. We also have income taxes payable of $ 6 . 0 million at December 31, 2018 , and $8 . 3 million at December 3 1, 2017 , classified as Accrued expenses and other current liabilities on our consolidated balance sheets.
80
FERRO CORPORATION AND SUBSIDIARIES
NOTES TO CONSOLIDATED FINANCIAL STATEMENTS
Years ended December 31, 2018, 2017 and 2016 – (Continued)
The components of deferred tax assets and liabilities at December 31 were:
|
|
2018 |
2017 |
||||
|
|
(Dollars in thousands) |
|||||
|
Deferred tax assets: |
||||||
|
Foreign operating loss carryforwards |
$ |
42,551 |
$ |
44,804 | ||
|
Pension and other benefit programs |
39,174 | 36,720 | ||||
|
Foreign tax credit carryforwards |
17,356 | 20,054 | ||||
|
Accrued liabilities |
12,515 | 14,625 | ||||
|
Other credit carryforwards |
11,446 | 10,889 | ||||
|
Other |
8,605 | 5,823 | ||||
|
State and local operating loss carryforwards |
2,272 | 4,808 | ||||
|
Inventories |
2,732 | 2,679 | ||||
|
Currency differences |
2,566 | 7,376 | ||||
|
Allowance for doubtful accounts |
1,576 | 1,822 | ||||
|
Total deferred tax assets |
140,793 | 149,600 | ||||
|
Deferred tax liabilities: |
||||||
|
Property, plant and equipment and intangibles -- depreciation and amortization |
29,648 | 38,785 | ||||
|
Other |
2,763 | 2,339 | ||||
|
Unremitted earnings of foreign subsidiaries |
1,575 | 1,163 | ||||
|
Total deferred tax liabilities |
33,986 | 42,287 | ||||
|
Net deferred tax assets before valuation allowance |
106,807 | 107,313 | ||||
|
Valuation allowance |
(25,596) | (32,579) | ||||
|
Net deferred tax assets |
$ |
81,211 |
$ |
74,734 | ||
The amounts of foreign operating loss carryforwards, foreign tax credit carryforwards, and other credit carryforwards included in the table of temporary differences are net of reserves for unrecognized tax benefits.
At December 31, 2018 , we had $ 38 . 8 m illion of state operating loss carryforwards and $ 183 . 2 m illion of foreign operating loss carryforwards, some of which can be carried forward indefinitely and others expire in one to twenty years. At December 31, 2018 , we had $ 33.0 million in tax credit carryforwards, some of which can be carried forward indefinitely . These operating loss carryforwards and tax credit carryforwards expire as follows:
|
|
||||||
|
|
Operating Loss |
Tax Credit |
||||
|
|
Carryforwards |
Carryforwards |
||||
|
Expiring in: |
(Dollars in thousands) |
|||||
|
2019 |
$ |
21,072 |
$ |
6,003 | ||
|
2020-2024 |
33,969 | 8,140 | ||||
|
2025-2029 |
16,411 | 9,025 | ||||
|
2030-2034 |
13,112 | 4,906 | ||||
|
2035-2039 |
5,093 | 3,953 | ||||
|
2040-Indefinitely |
132,341 | 1,004 | ||||
|
Total |
$ |
221,998 |
$ |
33,031 | ||
We assess the available positive a nd negative evidence to determine if sufficient future taxable income will be generated to utilize the existing deferred tax assets. A significant piece of objective negative evidence e valuated by jurisdiction was whether a cumulative loss over the three-year period ended December 31, 2018 had been incurred . Such objective evidence limits the ability to consider other subjective evidence such as our projections for future income.
81
FERRO CORPORATION AND SUBSIDIARIES
NOTES TO CONSOLIDATED FINANCIAL STATEMENTS
Years ended December 31, 2018, 2017 and 2016 – (Continued)
Based on this assessment as of December 31, 2018 , the Company has recorded a valuation allowance of $ 25.6 million in order to measure only the portion of the deferred tax assets that more likely than not will be realized. The most significant items that decreased the valuation allowance from 2017 to 2018 primarily related to the removal of a valuation all owance in jurisdictions where it was deemed the valuation allowance was no longer necessary and the utilization of assets with an off-setting valuation allowance.
We classified net deferred income tax assets as of December 31 as detailed in the following table:
|
|
2018 |
2017 |
||||
|
|
(Dollars in thousands) |
|||||
|
Non-current assets |
$ |
103,488 |
$ |
108,025 | ||
|
Non-current liabilities |
(22,277) | (33,291) | ||||
|
Net deferred tax assets |
$ |
81,211 |
$ |
74,734 | ||
Activity and balances of unrecognized tax benefits are summarized below:
|
|
|||||||||
|
|
2018 |
2017 |
2016 |
||||||
|
|
(Dollars in thousands) |
||||||||
|
Balance at beginning of year |
$ |
28,470 |
$ |
30,085 |
$ |
34,541 | |||
|
Additions based on tax positions related to the current year |
4,041 | 1,609 | 1,445 | ||||||
|
Additions for tax positions of prior years |
24 | 2,057 | 170 | ||||||
|
Reductions for tax positions of prior years |
(1,710) | (288) | (2,827) | ||||||
|
Reductions as a results of expiring statutes of limitations |
(420) | (6,284) | (2,718) | ||||||
|
Foreign currency adjustments |
(786) | 1,644 | (526) | ||||||
|
Settlements with taxing authorities |
(4,750) | (353) |
— |
||||||
|
Balance at end of year |
$ |
24,869 |
$ |
28,470 |
$ |
30,085 | |||
The total amount of unrecognized tax benefits that, if recognized, would affect the effective rate was $ 9.2 million at December 31, 2018 , $9 . 8 million at December 31, 2017 , and $11.0 million at December 31, 2016 . The Company recognizes accrued interest and penalties related to unrecognized tax benefits as part of income tax expense. The Company recognized $ 0.4 million of expense in 2018 , $0. 7 million of expense in 2017 , and $0. 1 million o f expense in 2016 for interest, net of tax, and related penalties. The Company accrued $ 1.8 million at December 31, 2018 , $3. 8 million at December 31, 201 7 , and $3.1 million at December 31, 2016 for payment of interest, net of tax, and penalties.
We anticipate that $ 1 . 6 million of liabilities for unrecognized tax benefits, including accrued interest and penalties, may be reversed within the next 12 months. These liabilities relate to international tax issues and are expected to reverse due to the expiration of the applicable statute of limitations periods and the anticipation of the closure of tax examinations.
The Company conducts business globally, and, as a result, the U.S. parent company or one of its subsidiaries files income tax returns in the U.S. federal jurisdiction and various state and foreign jurisdictions. In the normal course of business, the U.S. parent company and its subsidiaries are subject to examination by taxing authorities . With few exceptions, we are not subject to federal, state, local or non-U.S. income tax examinations for years before 2005.
At December 31, 2018 , we provided $1.6 million for deferred income taxes on $ 11.2 million of undistributed earnings of foreign subsidiaries that are not considered to be indefinitely reinvested. For certain other of the Company’s foreign subsidiaries, undistributed earnings of approximately $175.7 million are considered to be indefinitely reinvested, and we have not provided for deferred taxes on such earnings. We have not disclosed deferred income taxes on undistributed earnings of foreign subsidiaries where they are considered to be indefinitely reinvested, as it is not practicable to estimate the additional taxes that might be payable on the eventual remittance of such earnings, given the uncertain timing of when any such eventual remittance may occur, the significant number of foreign subsidiaries we have, the multiple layers within our legal entity structure, and the complexities of tax regulations across those foreign subsidiaries.
82
FERRO CORPORATION AND SUBSIDIARIES
NOTES TO CONSOLIDATED FINANCIAL STATEMENTS
Years ended December 31, 2018, 2017 and 2016 – (Continued)
The Company had bank guarantees and standby letters of credit issued by financial institutions that totaled $6.7 million at December 31, 2018, and $7.7 million at December 31, 2017. These agreements primarily relate to Ferro’s insurance programs, foreign energy purchase contracts and foreign tax payments. If the Company fails to perform its obligations, the guarantees and letters of credit may be drawn down by their holders, and we would be liable to the financial institutions for the amounts drawn.
We have recorded environmental liabilities of $8.5 million at December 31, 2018, and $6.7 million at December 31, 2017, for costs associated with the remediation of certain of our current or former properties that have been contaminated. The balance at December 31, 2018, and December 31, 2017, was primarily comprised of liabilities related to a non-operating facility in Brazil, and for retained environmental obligations related to a site in the United States that was part of the sale of our North American and Asian metal powders product lines in 2013. These costs include, but are not limited to, legal and consulting fees, site studies, the design and implementation of remediation plans, post-remediation monitoring, and related activities. The ultimate liability could be affected by numerous uncertainties, including the extent of contamination found, the required period of monitoring, the ultimate cost of required remediation and other circumstances.
In November 2017, Suffolk County Water Authority filed a complaint, Suffolk County Water Authority v. The Dow Chemical Company et al., against the Company and a number of other companies in the U.S. Federal Court for the Eastern District of New York with regard to the product 1,4 dioxane. The plaintiff alleges, among other things, that the Suffolk County water supply is contaminated with 1,4 dioxane and that the defendants are liable for unspecified costs of cleanup and remediation of the water supply, among other damages. The Company has not manufactured 1,4 dioxane since 2008, denies the allegations related to liability for the plaintiff’s claims, and is vigorously defending this proceeding. In December 2018, additional complaints were filed in the same court by 10 other New York municipal water authorities against the C ompany and others making substantially similar allegations regarding the contamination of their respective water supplies with 1,4 dioxane. The Company is likewise vigorously defending these additional actions. The Company currently does not expect the outcome of these proceedings to have a material adverse impact on its consolidated financial condition, results of operations, or cash flows, net of any insurance coverage. However, it is not possible to predict the ultimate outcome of these proceedings due to the unpredictable nature of litigation.
In 2013, the Supreme Court in Argentina ruled unfavorably related to certain export taxes associated with a divested operation. As a result of this ruling, we recorded a liability for $8.7 million at December 31, 2016. During 2017, the Company participated in a newly available tax regime, resulting in the reduction of interest on these outstanding tax liabilities of $4.5 million. The liability recorded at December 31, 2018 and 2017, is $1.3 million and $3.3 million, respectively.
In addition to the proceedings described above, the Company and its consolidated subsidiaries are subject from time to time to various claims, lawsuits, investigations, and proceedings related to products, services, contracts, environmental, health and safety, employment, intellectual property, and other matters, including with respect to divested businesses. The outcome of such matters is unpredictable, our assessment of them may change, and resolution of them could have a material adverse effect on the Company’s consolidated financial position, results of operations, or cash flows. We do not currently expect the resolution of such matters to materially affect the consolidated financial position, results of operations, or cash flows of the Company.
83
FERRO CORPORATION AND SUBSIDIARIES
NOTES TO CONSOLIDATED FINANCIAL STATEMENTS
Years ended December 31, 2018, 2017 and 2016 – (Continued)
Defined Benefit Pension Plans
|
|
|||||||||||||||||||
|
|
|||||||||||||||||||
|
|
U.S. Pension Plans |
Non-U.S. Plans |
|||||||||||||||||
|
|
2018 |
2017 |
2016 |
2018 |
2017 |
2016 |
|||||||||||||
|
|
(Dollars in thousands) |
||||||||||||||||||
|
Service cost |
$ |
11 |
$ |
11 |
$ |
16 |
$ |
1,714 |
$ |
1,717 |
$ |
1,372 | |||||||
|
Interest cost |
11,308 | 14,594 | 15,552 | 2,551 | 2,468 | 3,319 | |||||||||||||
|
Expected return on plan assets |
(15,982) | (20,111) | (19,735) | (862) | (896) | (1,712) | |||||||||||||
|
Amortization of prior service cost |
— |
7 | 11 | 39 | 42 | 37 | |||||||||||||
|
Mark-to-market actuarial net losses (gains) |
16,633 | (5,432) | 9,127 | 3,840 | (1,459) | 11,180 | |||||||||||||
|
Curtailment and settlement effects losses |
— |
2,581 |
— |
372 | 39 | 688 | |||||||||||||
|
Special termination benefits |
— |
— |
— |
232 | 52 | 330 | |||||||||||||
|
Net periodic benefit cost (credit) |
$ |
11,970 |
$ |
(8,350) |
$ |
4,971 |
$ |
7,886 |
$ |
1,963 |
$ |
15,214 | |||||||
|
Weighted-average assumptions: |
|||||||||||||||||||
|
Discount rate |
3.80 |
% |
4.40 |
% |
4.70 |
% |
2.35 |
% |
2.24 |
% |
3.12 |
% |
|||||||
|
Rate of compensation increase |
N/A |
N/A |
N/A |
3.18 |
% |
3.14 |
% |
3.16 |
% |
||||||||||
|
Expected return on plan assets |
7.70 |
% |
8.20 |
% |
8.20 |
% |
2.55 |
% |
2.54 |
% |
3.41 |
% |
|||||||
For the majority of our U.S. defined benefit pension plan s , the participants stopped accruing benefit s ervice costs after March 31, 200 6, except for one plan with a single employee.
In 2018, the mark-to-market actuarial net loss on the U.S. pension plans of $16.6 million was driven by a loss of $31.0 million from expected returns on plan asset s being lower than actual returns, partially offset by a gain of $17.9 million from the change in the discount ra te compared with the prior year . The mark-to-market actuarial net loss of $3.8 million for non-U.S. plans was primarily driven by expected returns on plan assets being lower than actual returns .
In 2017, the mark-to-market actuarial net gain on the U.S. pension plans of $5.4 million was based on $20.8 million of gain from actual returns on plan assets exceeding expected returns on plan assets , partially offset by a loss on remeasurement of the liability from a lower discount rate compared with the prior year . The m ark-to-market actuarial net gain of $1.5 million for non-U.S. plans was primarily driven by remeasurement of the respective liabilities at a higher discount rate .
In 2016, the mark-to-market actuarial net loss on the U.S. pension plans of $9.1 million consisted of a charge of $5.7 million to remeasure the liability ba s ed on a lower discount rate compared wi th the prior year, and $3.4 million of loss from expected returns on plan assets exceeding actual returns. The mark-to-market actuarial net loss of $11.2 million for non-U.S. plans was primarily driven by remeasurement of the respective liabilities at lower discount rates.
84
FERRO CORPORATION AND SUBSIDIARIES
NOTES TO CONSOLIDATED FINANCIAL STATEMENTS
Years ended December 31, 2018, 2017 and 2016 – (Continued)
|
|
||||||||||||
|
|
U.S. Pension Plans |
Non-U.S. Pension Plans |
||||||||||
|
|
2018 |
2017 |
2018 |
2017 |
||||||||
|
|
(Dollars in thousands) |
|||||||||||
|
Change in benefit obligation |
||||||||||||
|
Benefit obligation at beginning of year |
$ |
303,170 |
$ |
345,202 |
$ |
117,146 |
$ |
103,490 | ||||
|
Service cost |
11 | 11 | 1,714 | 1,717 | ||||||||
|
Interest cost |
11,308 | 14,594 | 2,551 | 2,468 | ||||||||
|
Settlements |
(25) | (51,124) | (1,330) | (387) | ||||||||
|
Special termination benefits |
— |
— |
232 | 52 | ||||||||
|
Plan participants' contributions |
— |
— |
21 | 25 | ||||||||
|
Benefits paid |
(20,165) | (23,469) | (2,825) | (2,826) | ||||||||
|
Net transfer in |
— |
— |
518 | 416 | ||||||||
|
Actuarial (gain) loss |
(14,414) | 17,956 | 2,241 | (1,381) | ||||||||
|
Exchange rate effect |
— |
— |
(4,994) | 13,572 | ||||||||
|
Benefit obligation at end of year |
$ |
279,885 |
$ |
303,170 |
$ |
115,274 |
$ |
117,146 | ||||
|
Accumulated benefit obligation at end of year |
$ |
279,885 |
$ |
303,170 |
$ |
105,137 |
$ |
112,732 | ||||
|
Change in plan assets: |
||||||||||||
|
Fair value of plan assets at beginning of year |
$ |
239,260 |
$ |
272,549 |
$ |
38,270 |
$ |
33,683 | ||||
|
Actual return on plan assets |
(15,065) | 40,919 | (1,109) | 933 | ||||||||
|
Employer contributions |
420 | 385 | 3,185 | 2,515 | ||||||||
|
Plan participants' contributions |
— |
— |
21 | 25 | ||||||||
|
Benefits paid |
(20,165) | (23,469) | (2,825) | (2,826) | ||||||||
|
Effect of settlements |
(25) | (51,124) | (1,330) | (387) | ||||||||
|
Exchange rate effect |
— |
— |
(1,682) | 4,327 | ||||||||
|
Fair value of plan assets at end of year |
$ |
204,425 |
$ |
239,260 |
$ |
34,530 |
$ |
38,270 | ||||
|
Amounts recognized in the balance sheet: |
||||||||||||
|
Accrued expenses and other current liabilities |
$ |
(404) |
$ |
(422) |
$ |
(4,174) |
$ |
(2,354) | ||||
|
Postretirement and pension liabilities |
(75,056) | (63,488) | (76,570) | (76,522) | ||||||||
|
Funded status |
$ |
(75,460) |
$ |
(63,910) |
$ |
(80,744) |
$ |
(78,876) | ||||
During 2017 , the Company settle d a portion of its pension obligation in the U.S. for $51.1 million.
|
|
|||||||||||||
|
|
U.S. Pension Plans |
Non-U.S. Pension Plans |
|||||||||||
|
|
2018 |
2017 |
2018 |
2017 |
|||||||||
|
|
(Dollars in thousands) |
||||||||||||
|
Weighted-average assumptions as of December 31: |
|||||||||||||
|
Discount rate |
4.40 |
% |
3.80 |
% |
2.61 |
% |
2.35 |
% |
|||||
|
Rate of compensation increase |
N/A |
N/A |
3.19 |
% |
3.18 |
% |
|||||||
|
Pension plans with benefit obligations in excess of plan assets: |
|||||||||||||
|
Benefit obligations |
$ |
279,885 |
$ |
303,170 |
$ |
87,955 |
$ |
87,990 | |||||
|
Plan assets |
204,425 | 239,260 | 7,212 | 9,114 | |||||||||
|
Pension plans with accumulated benefit obligations in excess of plan assets: |
|||||||||||||
|
Projected benefit obligations |
$ |
279,885 |
$ |
303,170 |
$ |
85,262 |
$ |
84,206 | |||||
|
Accumulated benefit obligations |
279,885 | 303,170 | 75,343 | 73,902 | |||||||||
|
Plan assets |
204,425 | 239,260 | 4,637 | 5,464 | |||||||||
85
FERRO CORPORATION AND SUBSIDIARIES
NOTES TO CONSOLIDATED FINANCIAL STATEMENTS
Years ended December 31, 2018, 2017 and 2016 – (Continued)
Activity and balances in Accumulated other comprehensive loss related to defined benefit pension plans are summarized below:
|
|
U.S. Pension Plans |
Non-U.S. Pension Plans |
||||||||||
|
|
2018 |
2017 |
2018 |
2017 |
||||||||
|
|
(Dollars in thousands) |
|||||||||||
|
Prior service (cost): |
||||||||||||
|
Balance at beginning of year |
$ |
— |
$ |
(7) |
$ |
(261) |
$ |
(265) | ||||
|
Amounts recognized as net periodic benefit costs |
— |
7 | 39 | 42 | ||||||||
|
Exchange rate effects |
— |
— |
16 | (38) | ||||||||
|
Balance at end of year |
$ |
— |
$ |
— |
$ |
(206) |
$ |
(261) | ||||
|
Estimated amounts to be amortized in 2019 |
$ |
— |
$ |
(39) | ||||||||
The overall investment objective for our defined benefit pension plan assets is to achieve the highest level of investment return that is compatible with prudent investment practices, asset class risk and current and future benefit obligations of the plans. Based on the potential risks and expected returns of various asset classes, the Company establishes asset allocation ranges for major asset classes. For U.S. plans, the target allocations are 35% fixed income, 60% equity, and 5% other investments. For non-U.S. plans, the target allocations are 75% fixed income, 24% equity, and 1% other investments. The Company invests in funds and with asset managers that track broad investment indices. The equity funds generally capture the returns of the equity markets in th e U.S., Europe, and Asia Pacific and also reflect various investment styles, such as growth, value, and large or small capitalization. The fixed income funds generally capture the returns of government and investment-grade corporate fixed income securities in the U.S. and Europe and also reflect various durations of these securities.
We derive our assumption for expected return on plan assets at the beginning of the year based on the weighted-average expected return for the target asset allocations of the major asset classes held by each plan. In determining the expected return, the Company considers both historical performance and an estimate of future long-term rates of return. The Company consults with , and considers the opinion of , its actuaries in developing appropriate return assumptions.
86
FERRO CORPORATION AND SUBSIDIARIES
NOTES TO CONSOLIDATED FINANCIAL STATEMENTS
Years ended December 31, 2018, 2017 and 2016 – (Continued)
The fair values of our pension plan assets at December 31, 2018 , by asset category are as follows:
|
|
||||||||||||
|
|
Level 1 |
Level 2 |
Level 3 |
Total |
||||||||
|
|
(Dollars in thousands) |
|||||||||||
|
U.S. plans: |
||||||||||||
|
Fixed income: |
||||||||||||
|
Guaranteed deposits |
$ |
— |
$ |
1,723 |
$ |
— |
$ |
1,723 | ||||
|
Mutual funds |
74,310 |
— |
— |
74,310 | ||||||||
|
Commingled funds |
— |
502 | 226 | 728 | ||||||||
|
Equities: |
||||||||||||
|
U.S. common stocks |
4,439 |
— |
— |
4,439 | ||||||||
|
Mutual funds |
109,756 |
— |
— |
109,756 | ||||||||
|
Commingled funds |
— |
695 |
— |
695 | ||||||||
|
Total assets in the fair value hierarchy |
$ |
188,505 |
$ |
2,920 |
$ |
226 |
$ |
191,651 | ||||
|
Investments measured at net asset value |
— |
— |
— |
12,774 | ||||||||
|
Investments at fair value |
$ |
188,505 |
$ |
2,920 |
$ |
226 |
$ |
204,425 | ||||
|
Non-U.S. plans |
||||||||||||
|
Fixed income: |
||||||||||||
|
Cash and cash equivalents |
$ |
— |
$ |
89 |
$ |
— |
$ |
89 | ||||
|
Guaranteed deposits |
32 | 744 | 27,318 | 28,094 | ||||||||
|
Mutual funds |
1,077 |
— |
— |
1,077 | ||||||||
|
Other |
2,607 | 2,126 |
— |
4,733 | ||||||||
|
Equities: |
||||||||||||
|
Mutual funds |
455 |
— |
— |
455 | ||||||||
|
Other assets |
82 |
— |
— |
82 | ||||||||
|
Total |
$ |
4,253 |
$ |
2,959 |
$ |
27,318 |
$ |
34,530 | ||||
87
FERRO CORPORATION AND SUBSIDIARIES
NOTES TO CONSOLIDATED FINANCIAL STATEMENTS
Years ended December 31, 2018, 2017 and 2016 – (Continued)
The fair values of our pension plan assets at Decem ber 31, 2017 , by asset category are as follows:
|
|
||||||||||||
|
|
Level 1 |
Level 2 |
Level 3 |
Total |
||||||||
|
|
(Dollars in thousands) |
|||||||||||
|
U.S. plans: |
||||||||||||
|
Fixed income: |
||||||||||||
|
Cash and cash equivalents |
$ |
3 |
$ |
— |
$ |
— |
$ |
3 | ||||
|
Guaranteed deposits |
— |
1,802 |
— |
1,802 | ||||||||
|
Mutual funds |
74,875 |
— |
— |
74,875 | ||||||||
|
Commingled funds |
— |
667 | 269 | 936 | ||||||||
|
Equities: |
||||||||||||
|
U.S. common stocks |
6,678 |
— |
— |
6,678 | ||||||||
|
Mutual funds |
129,887 |
— |
— |
129,887 | ||||||||
|
Commingled funds |
— |
999 |
— |
999 | ||||||||
|
Total assets in the fair value hierarchy |
$ |
211,443 |
$ |
3,468 |
$ |
269 |
$ |
215,180 | ||||
|
Investments measured at net asset value |
— |
— |
— |
24,080 | ||||||||
|
Investments at fair value |
$ |
211,443 |
$ |
3,468 |
$ |
269 |
$ |
239,260 | ||||
|
Non-U.S. plans |
||||||||||||
|
Fixed income: |
||||||||||||
|
Guaranteed deposits |
$ |
42 |
$ |
751 |
$ |
30,127 |
$ |
30,920 | ||||
|
Mutual funds |
1,122 |
— |
— |
1,122 | ||||||||
|
Other |
3,293 | 2,332 |
— |
5,625 | ||||||||
|
Equities: |
||||||||||||
|
Mutual funds |
517 |
— |
— |
517 | ||||||||
|
Other assets |
86 |
— |
— |
86 | ||||||||
|
Total |
$ |
5,060 |
$ |
3,083 |
$ |
30,127 |
$ |
38,270 | ||||
The Company’s U.S. pension plans held 0.3 million shares of the Company’s common stock with a market value of $4 . 4 million at December 31, 2018 , and 0.3 million shares with a market value of $6 . 7 million at December 31, 2017 .
Level 3 assets consist primarily of guaranteed deposits. The guaranteed deposits in Level 3 are in the form of contracts with insurance companies that secure the payment of benefits and are valued based on discounted cash flow models using the same discount rate used to value the related plan liabilities. The investments measured at net investment value, which is a practical expedient to estimating fair value , seek both current income and long term capital appreciation through investing in underlying funds that acquire, manage, and dispose of commercial real estate properties.
88
FERRO CORPORATION AND SUBSIDIARIES
NOTES TO CONSOLIDATED FINANCIAL STATEMENTS
Years ended December 31, 2018, 2017 and 2016 – (Continued)
A rollforward of Level 3 assets is p resented below. Unrealized losses included in earnings were $ 1 . 0 million in 2018 and unrealized gains included in earnings were $ 2 . 3 million in 2017 . T ransfer s out of Level 3 during 2017 represent a correction to remove certain U.S. real estate assets measured at net investment value per share using a practical expedient from the fair value hierarchy .
|
|
Guaranteed |
Commingled |
||||||||||
|
|
deposits |
Real estate |
funds |
Total |
||||||||
|
|
(Dollars in thousands) |
|||||||||||
|
Balance at December 31, 2016 |
$ |
26,332 |
$ |
22,257 |
$ |
371 |
$ |
48,960 | ||||
|
Sales |
(465) |
— |
— |
(465) | ||||||||
|
Gains (losses) included in earnings |
531 | 1,823 | (102) | 2,252 | ||||||||
|
Transfers |
— |
(24,080) |
— |
(24,080) | ||||||||
|
Exchange rate effect |
3,729 |
— |
— |
3,729 | ||||||||
|
Balance at December 31, 2017 |
$ |
30,127 |
$ |
— |
$ |
269 |
$ |
30,396 | ||||
|
Sales |
(487) |
— |
— |
(487) | ||||||||
|
(Losses) included in earnings |
(960) |
— |
(43) | (1,003) | ||||||||
|
Exchange rate effect |
(1,362) |
— |
— |
(1,362) | ||||||||
|
Balance at December 31, 2018 |
$ |
27,318 |
$ |
— |
$ |
226 |
$ |
27,544 | ||||
We expect to contribute approximately $2 . 8 million to our U.S. pension plans and $4 . 5 million to ou r non-U.S. pension plans in 201 9 .
We estimate that future pension benefit payments , will be as follows:
|
|
|||||||
|
|
U.S. Plans |
Non-U.S. Plans |
|||||
|
|
(Dollars in thousands) |
||||||
|
2019 |
$ |
19,290 |
$ |
7,825 | |||
|
2020 |
19,376 | 4,268 | |||||
|
2021 |
19,577 | 4,404 | |||||
|
2022 |
19,779 | 5,710 | |||||
|
2023 |
19,708 | 4,360 | |||||
|
2024-2028 |
96,668 | 25,969 | |||||
Postretirement Health Care and Life Insurance Benefit Plans
|
|
||||||||||
|
|
2018 |
2017 |
2016 |
|||||||
|
|
(Dollars in thousands) |
|||||||||
|
Net periodic benefit cost: |
||||||||||
|
Interest expense |
$ |
732 |
$ |
843 |
$ |
944 | ||||
|
Mark-to-market actuarial net (gain) loss |
(2,580) | 458 | (164) | |||||||
|
Total net periodic benefit (credit) cost |
$ |
(1,848) |
$ |
1,301 |
$ |
780 | ||||
|
Weighted-average assumptions: |
||||||||||
|
Discount rate |
3.70 |
% |
4.20 |
% |
4.50 |
% |
||||
|
Current trend rate for health care costs |
6.40 |
% |
6.50 |
% |
6.60 |
% |
||||
|
Ultimate trend rate for health care costs |
4.50 |
% |
4.50 |
% |
4.50 |
% |
||||
|
Year that ultimate trend rate is reached |
2036 | 2036 | 2036 | |||||||
89
FERRO CORPORATION AND SUBSIDIARIES
NOTES TO CONSOLIDATED FINANCIAL STATEMENTS
Years ended December 31, 2018, 2017 and 2016 – (Continued)
A one-percentage-point change in the assumed health care cost trend rates would have the following effect:
|
|
||||||||
|
|
1-Percentage- |
1-Percentage- |
||||||
|
|
Point |
Point |
||||||
|
|
Increase |
Decrease |
||||||
|
|
(Dollars in thousands) |
|||||||
|
Effect on total of service and interest costs components |
$ |
44 |
$ |
(38) | ||||
|
Effect on postretirement benefit obligation |
894 | (789) | ||||||
|
|
|||||||
|
|
2018 |
2017 |
|||||
|
|
(Dollars in thousands) |
||||||
|
Change in benefit obligation: |
|||||||
|
Benefit obligation at beginning of year |
$ |
20,725 |
$ |
21,056 | |||
|
Interest cost |
732 | 843 | |||||
|
Benefits paid |
(1,679) | (1,632) | |||||
|
Actuarial (gain) loss |
(2,580) | 458 | |||||
|
Benefit obligation at end of year |
$ |
17,198 |
$ |
20,725 | |||
|
Change in plan assets: |
|||||||
|
Fair value of plan assets at beginning of year |
$ |
— |
$ |
— |
|||
|
Employer contributions |
1,679 | 1,632 | |||||
|
Benefits paid |
(1,679) | (1,632) | |||||
|
Fair value of plan assets at end of year |
$ |
— |
$ |
— |
|||
|
Amounts recognized in the balance sheet: |
|||||||
|
Accrued expenses and other current liabilities |
$ |
(1,966) |
$ |
(2,132) | |||
|
Postretirement and pension liabilities |
(15,232) | (18,593) | |||||
|
Funded status |
$ |
(17,198) |
$ |
(20,725) | |||
|
Weighted-average assumptions as of December 31: |
|||||||
|
Discount rate |
4.30 |
% |
3.70 |
% |
|||
|
Current trend rate for health care costs |
6.30 |
% |
6.40 |
% |
|||
|
Ultimate trend rate for health care costs |
4.50 |
% |
4.50 |
% |
|||
|
Year that ultimate rend rate is reached |
2036 | 2036 | |||||
The Medicare Prescription Drug, Improvement, and Modernization Act of 2003 provides subsidies for certain drug costs to companies that provide coverage that is actuarially equivalent to the drug coverage under Medicare Part D. We estimate that future postretirement health care and life insurance benefit payments will be as follows:
|
|
|||||||
|
|
Before Medicare |
After Medicare |
|||||
|
|
Subsidy |
Subsidy |
|||||
|
|
(Dollars in thousands) |
||||||
|
2019 |
$ |
1,968 |
$ |
1,758 | |||
|
2020 |
1,881 | 1,681 | |||||
|
2021 |
1,796 | 1,608 | |||||
|
2022 |
1,704 | 1,528 | |||||
|
2023 |
1,615 | 1,450 | |||||
|
2024-2028 |
6,689 | 6,038 | |||||
90
FERRO CORPORATION AND SUBSIDIARIES
NOTES TO CONSOLIDATED FINANCIAL STATEMENTS
Years ended December 31, 2018, 2017 and 2016 – (Continued)
Other Retirement Plans
We also have defined contribution retirement plans covering certain employees. Our contributions are determined by the terms of the plans and are limited to amounts that are deductible for income taxes. Generally, benefits under these plans vest over a period of five years from date of employment. The largest plan covers salaried and most hourly employees in the U.S. In this plan, the Company contributes a percentage of eligible employee basic compensation and also a percentage of employee contributions. The expense applicable to these plans was $2 . 9 million, $5 . 7 million, and $4 . 2 million in 2018 , 2017 , and 201 6 , respectively.
On May 3, 2018, our shareholders approved the 2018 Omnibus Incentive Plan (the “Plan”), which was adopted by the Board of Directors on February 22, 2018, subject to shareholder approval. The Plan’s purpose is to promote the Company’s long-term financial interests and growth by attracting, retaining and motivating high-quality key employees and directors, motivating such employees and directors to achieve the Company’s short- and long-range performance goals and objectives, and thereby align their interests with those of the Company’s shareholders. The Plan reserves 4,500,000 shares of common stock to be issued for grants of several different types of long-term incentives including stock options, stock appreciation rights, restricted awards, performance awards, other common stock-based awards, and dividend equivalent rights.
The 2013 Omnibus Incentive Plan (the “Previous Plan”), was replaced by the Plan, and no future grants may be made under the Previous Plan. However, any outstanding awards or grants made under the Previous Plan will continue until the end of their specified terms.
Stock options, performance share units, deferred stock units, and restricted stock units were the only grant types outstanding at December 31, 2018 . Stock options, performance share units, and restricted stock units are discussed below. Activities in other grant types were not significant.
Stock Options
General Information
Stock options outstanding at December 31, 2018 , have a term of 10 years, vest evenly over three years on the anniversary of the grant date, and have an exercise price equal to the per share fair market value of our common stock on the grant date. Accelerated vesting is used for options held by employees who meet both the age and years of service requirements to retire prior to the end of the vesting period. In the case of death or retirement, the stock options become 100% vested and exercisable.
Stock Option Valuation Model and Method Information
We estimate the fair value of each stock option on the date of grant using the Black-Scholes option pricing model. We use judgment in selecting assumptions for the model, which may significantly impact the timing and amount of compensation expense, and we base our judgments primarily on historical data. When appropriate, we adjust the historical data for circumstances that are not likely to occur in the future.
91
FERRO CORPORATION AND SUBSIDIARIES
NOTES TO CONSOLIDATED FINANCIAL STATEMENTS
Years ended December 31, 2018, 2017 and 2016 – (Continued)
The following table details the determination of the assumptions used to estimate the fair value of stock options:
|
Assumption |
|
Estimation Method |
|
Expected life, in years |
|
Historical stock option exercise experience |
|
Risk-free interest rate |
|
Yield of U.S. Treasury Bonds with remaining maturity equal to expected life of the stock option |
|
Expected volatility |
|
Historical daily price observations of the Company’s common stock over a period equal to the expected life of the stock option |
|
Expected dividend yield |
|
Historical dividend rate at the date of grant |
The following table details the weighted-average grant-date fair values and the assumptions used for estimating the fair values of stock options granted in the respective years:
|
|
||||||||||
|
|
2018 |
2017 |
2016 |
|||||||
|
Weighted-average grant-date fair value |
$ |
8.91 |
$ |
7.29 |
$ |
4.94 | ||||
|
Expected life, in years |
5.4 | 6.0 | 6.0 | |||||||
|
Risk-free interest rate |
2.7 |
% |
1.9% - 2.3 |
% |
1.4% - 1.6 |
% |
||||
|
Expected volatility |
39.7 |
% |
48.0 % - 51.5 |
% |
52.0% - 53.6 |
% |
||||
|
Expected dividend yield |
— |
% |
— |
% |
— |
% |
||||
Stock Option Activity Information
A summary of stock option activity follows:
|
|
||||||||||||
|
|
||||||||||||
|
|
Weighted- |
|||||||||||
|
|
Average |
|||||||||||
|
|
Weighted- |
Remaining |
Aggregate |
|||||||||
|
|
Number of |
Average |
Contractual |
Intrinsic |
||||||||
|
|
Options |
Exercise Price |
Term |
Value |
||||||||
|
|
||||||||||||
|
Outstanding at December 31, 2017 |
1,567,269 | 10.08 | ||||||||||
|
Granted |
150,300 | 22.01 | ||||||||||
|
Exercised |
(102,880) | 7.43 | ||||||||||
|
Forfeited or expired |
(1,000) | 17.26 | ||||||||||
|
Outstanding at December 31, 2018 |
1,613,689 |
$ |
11.36 | 5.50 |
$ |
7,929 | ||||||
|
Exercisable at December 31, 2018 |
1,230,261 |
$ |
9.87 | 4.64 |
$ |
7,157 | ||||||
|
Vested or expected to vest at December 31, 2018 |
1,613,689 |
$ |
11.36 | 5.50 |
$ |
7,929 |
We calculated the aggregate intrinsic value in the table above by taking the total pretax difference between our common stock’s closing market value per share on the last trading day of the year and the stock option exercise price for each grant and multiplying that result by the number of shares that would have been received by the option holders had they exercised all their in-the-money stock options.
Information related to stock options exercised follows:
|
|
||||||||||
|
|
||||||||||
|
|
2018 |
2017 |
2016 |
|||||||
|
|
(Dollars in thousands) |
|||||||||
|
Proceeds from the exercise of stock options |
$ |
764 |
$ |
4,526 |
$ |
1,140 | ||||
|
Intrinsic value of stock options exercised |
1,612 | 2,898 | 1,496 | |||||||
|
Income tax benefit related to stock options exercised |
338 | 1,014 | 524 | |||||||
92
FERRO CORPORATION AND SUBSIDIARIES
NOTES TO CONSOLIDATED FINANCIAL STATEMENTS
Years ended December 31, 2018, 2017 and 2016 – (Continued)
Stock Options Expense Information
A summary of amounts recorded and to be recorded for stock-based compensation related to stock options follows:
|
|
||||||||||
|
|
||||||||||
|
|
2018 |
2017 |
2016 |
|||||||
|
|
(Dollars in thousands) |
|||||||||
|
Compensation expense recorded in Selling, general and administrative expenses |
$ |
1,560 |
$ |
1,588 |
$ |
1,388 | ||||
|
Deferred income tax benefits related to compensation expense |
328 | 333 | 486 | |||||||
|
Total fair value of stock options vested |
1,418 | 1,388 | 1,757 | |||||||
|
Unrecognized compensation cost |
644 | 621 | 513 | |||||||
|
Expected weighted-average recognition period for unrecognized compensation, in years |
2.7 | 2.0 | 2.1 | |||||||
Performance Share Units
General Information
Performance share units, expressed as shares of the Company’s common stock, are earned only if the Company meets specific performance targets over a three-year pe riod. The grants have a vesting period of three years.
The Plan allows for payout of up to 200% of the vesting-date fair value of the awards. We pay half of the earned value in cash and half in unrestricted shares of common stock. The portion of the grants that will be paid in cash are treated as liability awards, and therefore, we remeasure our liability and the related compensation expense at each balance sheet date, based on fair value. We treat the portion of the grants that will be settled with common stock as equity awards, and therefore, the amount of stock-based compensation we record over the performance period is based on the fair value on the grant date. The compensation expense and number of shares expected to vest for all performance share units are adjusted each reporting period for the achievement of the performance sha re units’ performance metrics , based upon our best estimate using available information.
Performance Share Unit Valuation Model and Method Information
The estimated fair value of perform ance share units granted in 2018, 2017 and 2016 is based on the closing price of the Company’s common stock on the date of issuance and recorded based on achievement of target performance metrics. As of December 31, 2018 , we had 0.1 million and 0.2 million performance share units outs t anding associated with our 2018 and 2017 grants, respectively.
The weighted average grant date fair value of our performance share units was $22 . 92 for shares granted in 2018 , $14 . 89 for shares granted in 2017 and $10 . 07 for shares granted in 2016 . All performance share units are initially expensed at target and are evaluated each reporting period for likelihood of ach ieving the performance metrics , and the expense is adjusted, as appropriate.
93
FERRO CORPORATION AND SUBSIDIARIES
NOTES TO CONSOLIDATED FINANCIAL STATEMENTS
Years ended December 31, 2018, 2017 and 2016 – (Continued)
Performance Share Unit Activity Information
A summary of performance share unit activity follows:
|
|
||||||
|
|
Weighted- |
|||||
|
|
Average |
|||||
|
|
Remaining |
|||||
|
|
Number of |
Contractual |
||||
|
|
Units |
Term |
||||
|
|
||||||
|
Outstanding at December 31, 2017 |
621,490 | |||||
|
Granted |
244,062 | |||||
|
Earned |
(321,382) | |||||
|
Forfeited or expired |
(5,970) | |||||
|
Outstanding at December 31, 2018 |
538,200 | 0.7 | ||||
|
Vested or expected to vest at December 31, 2018 |
538,200 | 0.7 |
Performance Share Unit Expense Information
A summary of amounts recorded and to be recorded for stock-based compensation related to performance share units follows:
|
|
||||||||||
|
|
||||||||||
|
|
2018 |
2017 |
2016 |
|||||||
|
|
(Dollars in thousands) |
|||||||||
|
Compensation expense recorded in Selling, general and administrative expenses |
$ |
4,156 |
$ |
6,881 |
$ |
3,437 | ||||
|
Deferred income tax benefits related to compensation expense |
873 | 1,445 | 1,203 | |||||||
|
Unrecognized compensation cost |
3,670 | 3,801 | 3,733 | |||||||
|
Expected weighted-average recognition period for unrecognized compensation, in years |
1.4 | 1.4 | 2.0 | |||||||
Restricted Stock Units
We granted 0. 1 million , 0. 2 million and 0. 3 mil lio n restricted stock units in 2018, 2017, and 2016 , respectively. F air value of restricted stock units is determined based on the closing price of the Company’s common stock on the date of issuance. Restricted stock units are expressed as equivalent shares of the Company’s common stock, and have a three y ear vesting period. Total expense included in Selling , general and administrative expense related to restri cted stock units granted in 2018 , 2017 and 2016 was $ 2 . 1 million, $2 . 5 million and $1.7 million, respectively. Total unreco gnized compensation cost in 2018, 2017 and 2016 was $3 . 0 million, $2. 8 million and $2. 4 million, respectively.
Directors’ Deferred Compensation
Separate from the Plan, the Company has established the Ferro Corporation Deferred Compensation Plan for Non-employee Directors, permitting its non-employee directors to voluntarily defer all or a portion of their compensation. The voluntarily deferred amounts are placed in individual accounts in a benefit trust known as a “rabbi trust” and invested in the Company’s common stock with dividends reinvested in additional shares. All disbursements from the trust are made in the Company’s common stock. The stock held in the rabbi trust is classified as treasury stock in shareholders’ equity and the deferred compensation obligation that is required to be settled in shares of the Company’s common stock, is classified as paid-in capital. The rabbi trust held 0.1 million shares, valued at $1. 2 million, at December 31, 2018 , and 0. 1 million shares, valued at $1 . 6 million, at December 31, 2017 .
94
FERRO CORPORATION AND SUBSIDIARIES
NOTES TO CONSOLIDATED FINANCIAL STATEMENTS
Years ended December 31, 2018, 2017 and 2016 – (Continued)
15 . Restructuring and Cost Reduction Programs
Our restructuring and cost reduction program s have been developed with the objective of leveraging our global scale, realigning and lowering our cost structure and optimizing capacity utilization. Total restructuring charges resulting from these activities were $ 13 . 3 million in 2018 , $ 9 . 8 million in 2017 , and $2 . 7 million in 2016 , which are reported in Restructuring and impairment charges in our consolidated statement of operations. Descriptions of the restructuring program follow:
Global Cost Reduction Program
In 2013, we initiated a Global Cost Reduction Program that was designed to addr ess 3 key areas of the company: (1) business realignment, (2) operational efficiency and (3) corporate and back office functions. Business realignment was targeted at right-sizing our commercial management organizations globally. The operational efficiency component of the program was designed to improve the efficiency of our plant operations and supply chain. The corporate and back office initiative is principally comprised of work that we are doing with our strategic partners in the areas of finance and accounting and information technology outsourci ng . In 2018, the restructuring charges primarily relate to costs associated with integration of our recent acquisitions and optimization programs.
We have summarized the charges associated w ith this restructuring program by major type of charges below:
|
|
||||||||||||
|
|
Employee |
Asset |
||||||||||
|
|
Severance |
Other Costs |
Impairment |
Total |
||||||||
|
|
(Dollars in thousands) |
|||||||||||
|
Expected restructuring charges: |
||||||||||||
|
Global Cost Reduction Program |
$ |
53,861 | 36,935 | 1,176 |
$ |
91,972 | ||||||
|
Total expected restructuring charges |
$ |
53,861 |
$ |
36,935 |
$ |
1,176 |
$ |
91,972 | ||||
|
|
||||||||||||
|
Restructuring charges incurred: |
||||||||||||
|
Global Cost Reduction Program |
$ |
1,353 | 1,356 |
— |
$ |
2,709 | ||||||
|
Charges incurred in 2016 |
$ |
1,353 |
$ |
1,356 |
$ |
— |
$ |
2,709 | ||||
|
Global Cost Reduction Program |
5,167 | 3,500 | 1,176 | 9,843 | ||||||||
|
Charges incurred in 2017 |
$ |
5,167 |
$ |
3,500 |
$ |
1,176 |
$ |
9,843 | ||||
|
Global Cost Reduction Program |
5,794 | 7,501 |
— |
13,295 | ||||||||
|
Charges incurred in 2018 |
$ |
5,794 |
$ |
7,501 |
$ |
— |
$ |
13,295 | ||||
|
Cumulative restructuring charges incurred: |
||||||||||||
|
Global Cost Reduction Program |
40,818 | 33,480 | 1,176 | 75,474 | ||||||||
|
Cumulative restructuring charges incurred as of December 31, 2018 |
$ |
40,818 |
$ |
33,480 |
$ |
1,176 |
$ |
75,474 | ||||
We have summarized the charges associated with the restructuring programs by segments below:
|
|
|||||||||||||||
|
|
Total |
Cumulative |
|||||||||||||
|
|
Expected |
Charges To |
|||||||||||||
|
|
Charges |
2018 |
2017 |
2016 |
Date |
||||||||||
|
|
(Dollars in thousands) |
||||||||||||||
|
Performance Coatings |
$ |
15,343 |
$ |
274 |
$ |
2,948 |
$ |
192 |
$ |
7,326 | |||||
|
Performance Colors and Glass |
25,546 | 23 | 971 | 205 | 20,055 | ||||||||||
|
Color Solutions |
7,327 | 148 | 1,250 | 630 | 4,337 | ||||||||||
|
Segment Total |
48,216 | 445 | 5,169 | 1,027 | 31,718 | ||||||||||
|
Corporate Restructuring Charges |
43,756 | 12,850 | 4,674 | 1,682 | 43,756 | ||||||||||
|
Total Restructuring Charges |
$ |
91,972 |
$ |
13,295 |
$ |
9,843 |
$ |
2,709 |
$ |
75,474 | |||||
95
FERRO CORPORATION AND SUBSIDIARIES
NOTES TO CONSOLIDATED FINANCIAL STATEMENTS
Years ended December 31, 2018, 2017 and 2016 – (Continued)
We have summarized the activities and accruals related to our restructuring and cost reduction programs below:
|
|
|||||||||||||
|
|
Employee |
Asset |
|||||||||||
|
|
Severance |
Other Costs |
Impairment |
Total |
|||||||||
|
|
(Dollars in thousands) |
||||||||||||
|
Balance at December 31, 2015 |
$ |
693 |
$ |
2,077 |
$ |
— |
$ |
2,770 | |||||
|
Restructuring charges |
1,353 |
$ |
1,356 |
$ |
— |
2,709 | |||||||
|
Cash payments |
(1,634) | (1,089) |
— |
(2,723) | |||||||||
|
Non-cash items |
(173) | (855) |
— |
(1,028) | |||||||||
|
Balance at December 31, 2016 |
$ |
239 |
$ |
1,489 |
$ |
— |
$ |
1,728 | |||||
|
Restructuring charges |
$ |
5,167 |
$ |
3,500 |
$ |
1,176 |
$ |
9,843 | |||||
|
Cash payments |
(3,316) | (500) |
— |
(3,816) | |||||||||
|
Non-cash items |
196 | (3,255) | (1,176) | (4,235) | |||||||||
|
Balance at December 31, 2017 |
$ |
2,286 |
$ |
1,234 |
$ |
— |
$ |
3,520 | |||||
|
Restructuring charges |
$ |
5,794 | 7,501 |
— |
$ |
13,295 | |||||||
|
Cash payments |
(6,749) | (2,462) |
— |
(9,211) | |||||||||
|
Non-cash items |
(180) | (4,985) |
— |
(5,165) | |||||||||
|
Balance at December 31, 2018 |
$ |
1,151 |
$ |
1,288 |
$ |
— |
$ |
2,439 | |||||
We expect to make cash payments to settle the remaining liability for employee severance be nefits and other costs over the next twelve months, except where l egal or contractual obliga tions would require it to extend beyond that period .
Rent expense for all operating leases was $ 15 . 0 million in 2018 , $12 . 2 million in 2017 , and $9 . 8 million in 2016 .
The Company has a number of capital lease arrangements primarily relating to buildings and equipment. Asse ts held under capital leases are included in property, plant and equipment , and at December 31 are as follow s :
|
|
||||||
|
|
2018 |
2017 |
||||
|
|
(Dollars in thousands) |
|||||
|
Gross amounts capitalized |
||||||
|
Buildings |
$ |
4,705 |
$ |
4,781 | ||
|
Equipment |
3,516 | 3,710 | ||||
|
|
8,221 | 8,491 | ||||
|
Accumulated amortization |
||||||
|
Buildings |
(3,238) | (3,190) | ||||
|
Equipment |
(2,798) | (2,420) | ||||
|
|
(6,036) | (5,610) | ||||
|
Net assets under capital leases |
$ |
2,185 |
$ |
2,881 | ||
96
FERRO CORPORATION AND SUBSIDIARIES
NOTES TO CONSOLIDATED FINANCIAL STATEMENTS
Years ended December 31, 2018, 2017 and 2016 – (Continued)
At December 31, 2018 , future minimum lease payments under all non-cancelable leases are as follows:
|
|
||||||
|
|
Capital Leases |
Operating Leases |
||||
|
|
(Dollars in thousands) |
|||||
|
2019 |
$ |
1,048 |
$ |
11,419 | ||
|
2020 |
755 | 7,314 | ||||
|
2021 |
477 | 5,302 | ||||
|
2022 |
1,287 | 3,301 | ||||
|
2023 |
279 | 1,971 | ||||
|
Thereafter |
992 | 2,401 | ||||
|
Net minimum lease payments |
$ |
4,838 |
$ |
31,708 | ||
|
Less amount representing imputed interest and executory costs |
875 | |||||
|
Present value of net minimum lease payments |
3,963 | |||||
|
Less current portion |
679 | |||||
|
Long-term obligations at December 31, 2018 |
$ |
3,284 | ||||
17 . Miscellaneous Expense (Income), Net
Components of Miscellaneous expense (income) , net follow:
|
|
|||||||||
|
|
2018 |
2017 |
2016 |
||||||
|
|
(Dollars in thousands) |
||||||||
|
Pension expense (income) |
$ |
16,281 |
$ |
(6,814) |
$ |
19,577 | |||
|
Argentina export tax matter |
507 | (3,549) | 1,128 | ||||||
|
Gain on change of control |
(2,586) | (2,561) |
— |
||||||
|
Modification of debt |
1,046 |
— |
— |
||||||
|
Dividends/royalty from affiliates, net |
(720) | (993) | (1,245) | ||||||
|
Equity method investment (income) loss |
(55) | 261 | (260) | ||||||
|
(Gain) loss on sale of assets |
(440) | 722 | (3,891) | ||||||
|
Contingent consideration (adjustment) payment |
(1,971) | 1,721 |
— |
||||||
|
Bank fees |
2,648 | 2,229 | 1,855 | ||||||
|
Other, net |
1,260 | 548 | (247) | ||||||
|
Total Miscellaneous expense (income), net |
$ |
15,970 |
$ |
(8,436) |
$ |
16,917 | |||
In 2018, we adopted ASU 2017-07, which requires all other components of net benefit costs (credit) besides service cost to be presented outside a subtotal of income from operations. As such, we r ecorded pension expense of $16.3 million in 2018, income of $6.8 million in 2017 and expense of $19.6 million in 2016 related to these costs.
In 2018, the Company acquired 66% of the equity interests of FMU (Note 5) , bringing our total ownership to 100%. Due to the change of control that occurred, the Company recorded a gain on purchase of $2.6 million, related to the difference between the Company’s carrying value and fair value of the previously held equity method investment.
I n 2017, the Company acquired a majority equity interest in Gardenia (Note 5 ) , and due to the change of control that occurred, the Company recorded a gain on purchase of $2.6 million related to the difference between the Company’s carrying value and fair value of the previously held equity method investment.
In 2013, the Supreme Court in Argentina ruled unfavorably related to certain export taxes associated with a divested operation. In 2017, the Company participated in a newly available tax regime, resulting in the reduction of these outstanding tax labilities, and as a result recorded a gain of $4.5 million for the year ended December 31, 2017. W e recorded a $0. 5 mil lion charge in 2018 , $0 . 9 million charge in 2017 and $1.1 million charge in 2016 related to interest on the liabilities .
97
FERRO CORPORATION AND SUBSIDIARIES
NOTES TO CONSOLIDATED FINANCIAL STATEMENTS
Years ended December 31, 2018, 2017 and 2016 – (Continued)
In 2016, we recorded a $3.9 mil lion gain on sale from the proceeds of a closed site in Australia which was recorded for the year ended December 31, 2016.
Details of the calculations of b asic and diluted earnings per share follow:
|
|
|||||||||
|
|
2018 |
2017 |
2016 |
||||||
|
|
(Dollars in thousands, except per share amounts) |
||||||||
|
Basic earnings (loss) per share computation: |
|||||||||
|
Net income (loss) attributable to Ferro Corporation common shareholders |
$ |
80,093 |
$ |
57,054 |
$ |
(20,817) | |||
|
Adjustment for loss from discontinued operations |
— |
— |
64,464 | ||||||
|
Total |
$ |
80,093 |
$ |
57,054 |
$ |
43,647 | |||
|
Weighted-average common shares outstanding |
83,940 | 83,713 | 83,298 | ||||||
|
Basic earnings per share from continuing operations attributable to Ferro Corporation common shareholders |
$ |
0.95 |
$ |
0.68 |
$ |
0.52 | |||
|
Diluted earnings (loss) per share computation: |
|||||||||
|
Net income (loss) attributable to Ferro Corporation common shareholders |
$ |
80,093 |
$ |
57,054 |
$ |
(20,817) | |||
|
Adjustment for loss from discontinued operations |
— |
— |
64,464 | ||||||
|
Total |
$ |
80,093 |
$ |
57,054 |
$ |
43,647 | |||
|
Weighted-average common shares outstanding |
83,940 | 83,713 | 83,298 | ||||||
|
Assumed exercise of stock options |
772 | 762 | 549 | ||||||
|
Assumed satisfaction of deferred stock unit conditions |
— |
— |
36 | ||||||
|
Assumed satisfaction of restricted stock unit conditions |
301 | 351 | 544 | ||||||
|
Assumed satisfaction of performance stock unit conditions |
72 | 330 | 483 | ||||||
|
Weighted-average diluted shares outstanding |
85,085 | 85,156 | 84,910 | ||||||
|
Diluted earnings per share from continuing operations attributable to Ferro Corporation common shareholders |
$ |
0.94 |
$ |
0.67 |
$ |
0.51 | |||
The number of anti-dilutive or unearned shares was 1. 7 million, 1. 6 million, and 1. 7 million for 2018 , 2017 , and 2016 , respectively. These shares were excluded from the calculation of diluted earnings per share due to their anti-dilutive impact.
19 . Share Repurchase Program
In October 2018, the Company’s Board of Directors approved a new share repurchase program under which the Company is authorized to repurchase up to an additional $50 million of the Company’s outstanding common stock on the open market, including through Rule 10b5-1 plans, in privately negotiated transactions, or otherwise. This new program is in addition to the $100 million of authorization previously approved and announced.
The timing and amount of shares to be repurchased will be determined by the Company, based on evaluation of market and business conditions, share price, and other factors. The share repurchase programs do not obligate the Company to repurchase any dollar amount or number of common shares, and may be suspended or discontinued at any time.
The Company repurchased 1,470 , 791 shares of common stock at an average price of $ 1 9. 59 p er share for a total cost of $28.8 million during 2018. The Company made no repurchases during 2017. The Company repurchased 1,175, 437 shares of common stock at an average price of $9. 72 per share for a total cost of $11.4 million during 2016. As of December 31, 2018 , $71 . 2 million of common stock could still be repurchased under the programs.
98
FERRO CORPORATION AND SUBSIDIARIES
NOTES TO CONSOLIDATED FINANCIAL STATEMENTS
Years ended December 31, 2018, 2017 and 2016 – (Continued)
20 . Accum ulated Other Comprehensive (Loss )
Changes in Accumulated other comprehensive (loss) by component, net of income tax, were as follows:
|
|
||||||||||||
|
|
Postretirement |
Net Gain |
||||||||||
|
|
Benefit Liability |
Translation |
on Cash |
|||||||||
|
|
Adjustments |
Adjustments |
Flow Hedges |
Total |
||||||||
|
|
(Dollars in thousands) |
|||||||||||
|
Balance at December 31, 2015 |
$ |
811 |
$ |
(62,129) |
$ |
— |
$ |
(61,318) | ||||
|
Other comprehensive (loss) before reclassifications, before tax |
— |
(46,770) |
— |
(46,770) | ||||||||
|
Reclassification to earnings: |
||||||||||||
|
Postretirement benefit liabilities gain, before tax |
360 |
— |
— |
360 | ||||||||
|
Foreign currency translation adjustment, before tax (1) |
— |
1,115 |
— |
1,115 | ||||||||
|
Current period other comprehensive income (loss), before tax |
360 | (45,655) |
— |
(45,295) | ||||||||
|
Tax effect |
30 |
— |
— |
30 | ||||||||
|
Current period other comprehensive income (loss), net of tax |
330 | (45,655) |
— |
(45,325) | ||||||||
|
Balance at December 31, 2016 |
1,141 | (107,784) |
— |
(106,643) | ||||||||
|
Other comprehensive income before reclassifications, before tax |
— |
26,181 | 2,019 | 28,200 | ||||||||
|
Reclassification to earnings: |
||||||||||||
|
Cash flow hedge (loss), before tax |
— |
— |
(527) | (527) | ||||||||
|
Postretirement benefit liabilities gain, before tax |
42 |
— |
— |
42 | ||||||||
|
Current period other comprehensive income, before tax |
42 | 26,181 | 1,492 | 27,715 | ||||||||
|
Tax effect |
18 | (4,025) | 547 | (3,460) | ||||||||
|
Current period other comprehensive income, net of tax |
24 | 30,206 | 945 | 31,175 | ||||||||
|
Balance at December 31, 2017 |
1,165 | (77,578) | 945 | (75,468) | ||||||||
|
Other comprehensive (loss) income before reclassifications, before tax |
— |
(24,658) | 11,388 | (13,270) | ||||||||
|
Reclassification to earnings: |
||||||||||||
|
Cash flow hedge loss, before tax |
— |
— |
(17,159) | (17,159) | ||||||||
|
Postretirement benefit liabilities (loss), before tax |
(55) |
— |
— |
(55) | ||||||||
|
Current period other comprehensive (loss), before tax |
(55) | (24,658) | (5,771) | (30,484) | ||||||||
|
Tax effect |
(16) | 954 | (1,529) | (591) | ||||||||
|
Current period other comprehensive (loss), net of tax |
(39) | (25,612) | (4,242) | (29,893) | ||||||||
|
Balance at December 31, 2018 |
$ |
1,126 |
$ |
(103,190) |
$ |
(3,297) |
$ |
(105,361) | ||||
(1) Includes a release of accumulated foreign currency translation of $1.1 million related to the Company’s sale of the Europe-based Polymer Additives business (Note 4 ), which is included in Loss from discontinued operations, net of income taxes in our consolidated statements of operations for the year ended December 31, 2016.
99
FERRO CORPORATION AND SUBSIDIARIES
NOTES TO CONSOLIDATED FINANCIAL STATEMENTS
Years ended December 31, 2018, 2017 and 2016 – (Continued)
The Compan y’s reportable segments are Performance Coatings, Performance Colors and Glass, and Color Solutions .
Net sales to external customers by segment are presented in the table below. Sales between segments were not material.
|
|
|||||||||
|
|
2018 |
2017 |
2016 |
||||||
|
|
(Dollars in thousands) |
||||||||
|
Performance Coatings |
$ |
733,926 |
$ |
594,029 |
$ |
526,981 | |||
|
Performance Colors and Glass |
487,455 | 444,653 | 371,464 | ||||||
|
Color Solutions |
391,027 | 358,060 | 246,847 | ||||||
|
Total net sales |
$ |
1,612,408 |
$ |
1,396,742 |
$ |
1,145,292 | |||
Segment gross profit is the metric utilized by management to evaluate segment performance. We measure segment gross profit for internal reporting purposes by excluding certain other cost of sales not directly attributable to business units. Assets by segment are not regularly reviewed by the chief operating decision maker. Each segment’s gross profit and reconciliations to Income before income taxes are presented in the table below:
|
|
|||||||||
|
|
2018 |
2017 |
2016 |
||||||
|
|
(Dollars in thousands) |
||||||||
|
Performance Coatings |
$ |
165,708 |
$ |
145,797 |
$ |
139,454 | |||
|
Performance Colors and Glass |
167,446 | 157,544 | 133,997 | ||||||
|
Color Solutions |
124,852 | 113,694 | 84,466 | ||||||
|
Other cost of sales |
(2,073) | (814) | (1,539) | ||||||
|
Total gross profit |
455,933 | 416,221 | 356,378 | ||||||
|
Selling, general and administrative expenses |
278,566 | 265,418 | 227,286 | ||||||
|
Restructuring and impairment charges |
13,295 | 11,409 | 15,907 | ||||||
|
Other expense, net |
60,080 | 28,876 | 50,740 | ||||||
|
Income before income taxes |
$ |
103,992 |
$ |
110,518 |
$ |
62,445 | |||
Each segment’s capital expenditures for long-lived assets are detailed below:
|
|
|||||||||
|
|
2018 |
2017 |
2016 |
||||||
|
|
(Dollars in thousands) |
||||||||
|
Performance Coatings |
$ |
41,106 |
$ |
19,734 |
$ |
9,139 | |||
|
Performance Colors and Glass |
8,858 | 9,374 | 7,123 | ||||||
|
Color Solutions |
24,940 | 20,356 | 4,867 | ||||||
|
Total segment expenditures for long-lived assets |
74,904 | 49,464 | 21,129 | ||||||
|
Unallocated corporate expenditures for long-lived assets |
5,715 | 1,088 | 2,896 | ||||||
|
Total expenditures for long lived assets (1) |
$ |
80,619 |
$ |
50,552 |
$ |
24,025 | |||
_____________________
|
|
(1) |
|
Excludes capital expenditure s of discontinued operations of $0 . 9 million in 2016 . |
100
FERRO CORPORATION AND SUBSIDIARIES
NOTES TO CONSOLIDATED FINANCIAL STATEMENTS
Years ended December 31, 2018, 2017 and 2016 – (Continued)
We sell our products throughout the world and we attribute sales to countries based on the country where we generate the customer invoice. No single country other than the U.S . and Spain rep resent greater than 10% of our net sales. Net sales by geography are as follows:
|
|
2018 |
2017 |
2016 |
||||||
|
|
(Dollars in thousands) |
||||||||
|
United States |
$ |
379,914 |
$ |
356,482 |
$ |
300,187 | |||
|
Spain |
305,049 | 214,732 | 188,972 | ||||||
|
Other international |
927,445 | 825,528 | 656,133 | ||||||
|
Total net sales |
$ |
1,612,408 |
$ |
1,396,742 |
$ |
1,145,292 | |||
None of our operations in countries other than Spain, U.S . and Mexico ow ns greater than 10% of consolidated long-lived assets. Long-lived assets that consist of property, plant, an d equipment by geography at December 31 are as follows:
|
|
|||||||
|
|
2018 |
2017 |
|||||
|
|
(Dollars in thousands) |
||||||
|
Spain |
$ |
78,094 |
$ |
76,142 | |||
|
United States |
56,263 | 44,956 | |||||
|
Mexico |
39,019 | 16,989 | |||||
|
Other international |
207,965 | 183,655 | |||||
|
Total long-lived assets |
$ |
381,341 |
$ |
321,742 | |||
22 . Unconsolidated Affiliates Accounted For Under the Equity Method
Our investments have been accounted for under the equity method b ecause we exert significant influence over these affilia tes, but we do not control them . Investment income from these equity method investments, which is reported in Miscellaneous expense (income) , net was income of $0 .1 million in 2018 , loss of $0. 3 million in 2017 , and income of $0. 3 million in 2016 . The balance of our equity method investments, which is reported in Other non-current assets, was $8 . 2 million at December 31, 2018 , and $7 . 6 million at December 31, 2017 .
The income (loss) that we record for these investments is equal to our proportionate share of the affiliates’ income or loss and our investments are equal to our proportionate share of the affiliates’ shareholders’ equity based on our ownership percentage. We have summarized below condensed income statement and balance sheet information for the combined equity method investees:
|
|
|||||||||
|
|
2018 |
2017 |
2016 |
||||||
|
|
(Dollars in thousands) |
||||||||
|
Net sales |
$ |
18,950 |
$ |
33,851 |
$ |
42,555 | |||
|
Gross profit |
3,343 | 5,655 | 4,842 | ||||||
|
Income (loss) from continuing operations |
746 | (224) | 694 | ||||||
|
Net income (loss) |
596 | (220) | 236 | ||||||
|
|
||||||
|
|
2018 |
2017 |
||||
|
|
(Dollars in thousands) |
|||||
|
Current assets |
$ |
17,305 |
$ |
19,908 | ||
|
Non-current assets |
3,356 | 10,834 | ||||
|
Current liabilities |
(3,832) | (13,207) | ||||
|
Non-current liabilities |
(339) | (467) | ||||
101
FERRO CORPORATION AND SUBSIDIARIES
NOTES TO CONSOLIDATED FINANCIAL STATEMENTS
Years ended December 31, 2018, 2017 and 2016 – (Continued)
We had the following transactions with our equity-method investees:
|
|
|||||||||
|
|
2018 |
2017 |
2016 |
||||||
|
|
(Dollars in thousands) |
||||||||
|
Sales |
$ |
4,898 |
$ |
5,378 |
$ |
4,589 | |||
|
Purchases |
15 | 2,006 | 758 | ||||||
|
Dividends and interest received |
415 | 920 | 268 | ||||||
|
Commission and royalties received |
305 | 130 | 1,003 | ||||||
|
Commissions and royalties paid |
— |
57 | 26 | ||||||
23 . Quarterly Data (Unaudited )
|
|
||||||||||||||||||
|
|
||||||||||||||||||
|
|
Net Income |
Earnings (Loss) Attributable to |
||||||||||||||||
|
|
(Loss) |
Ferro Corporation Common |
||||||||||||||||
|
|
Attributable |
Shareholders Per Common |
||||||||||||||||
|
|
Net Income |
to Ferro |
Share |
|||||||||||||||
|
|
Net Sales |
Gross Profit |
(Loss) |
Corporation |
Basic |
Diluted |
||||||||||||
|
|
(Dollars in thousands, except per share data) |
|||||||||||||||||
|
2017 |
||||||||||||||||||
|
Quarter 1 |
$ |
320,555 |
$ |
98,794 |
$ |
22,121 |
$ |
21,898 |
$ |
0.26 |
$ |
0.26 | ||||||
|
Quarter 2 |
348,632 | 108,342 | 21,229 | 21,025 | 0.25 | 0.25 | ||||||||||||
|
Quarter 3 |
350,012 | 103,616 | 22,965 | 22,817 | 0.27 | 0.27 | ||||||||||||
|
Quarter 4 |
377,543 | 105,469 | (8,547) | (8,686) | (0.10) | (0.10) | ||||||||||||
|
Total |
$ |
1,396,742 |
$ |
416,221 |
$ |
57,768 |
$ |
57,054 |
$ |
0.68 |
$ |
0.67 | ||||||
|
2018 |
||||||||||||||||||
|
Quarter 1 |
$ |
405,532 |
$ |
118,686 |
$ |
23,598 |
$ |
23,391 |
$ |
0.28 |
$ |
0.27 | ||||||
|
Quarter 2 |
416,239 | 126,645 | 29,861 | 29,668 | 0.35 | 0.35 | ||||||||||||
|
Quarter 3 |
395,163 | 105,487 | 16,143 | 16,058 | 0.19 | 0.19 | ||||||||||||
|
Quarter 4 |
395,474 | 105,115 | 11,344 | 10,976 | 0.13 | 0.13 | ||||||||||||
|
Total |
$ |
1,612,408 |
$ |
455,933 |
$ |
80,946 |
$ |
80,093 |
$ |
0.95 |
$ |
0.94 | ||||||
Quarterly earnings per share amounts do not always add to the full-year amounts due to the averaging of shares.
Restructurin g and impairment charges in 2018 were $ 4.1 million in the first quarter, $3 .8 million in the second quarter, $ 2.6 million in the third quarter, and $2 . 9 million in the fourth quarter. Restructurin g and impairment charges in 2017 were $3 . 0 million in the first quarter, $3 . 2 million in the second quarter, $ 1.5 million in the third quarter, and $3 . 7 million in the fourth quarter. Mark-to-market net loss es on our postretirement benefit plans was $ 17 . 9 million in the fourth quarter of 2018 and net gains of $6 . 4 million in the fourth quarter of 2017 .
103
Item 9 — Changes in and Disagreements with Accountants on Accounting and Financial Disclosure
None.
Item 9A — Controls and Procedures
Evaluation of Disclosure Controls and Procedures
Ferro is committed to maintaining disclosure controls and procedures that are designed to ensure that information required to be disclosed in its Exchange Act reports is recorded, processed, summarized, and reported within the time periods specified in the U.S. Securities and Exchange Commission’s rules and forms, and that such information is accumulated and communicated to its management, including its Chief Executive Officer and Chief Financial Officer, as appropriate to allow timely decisions regarding required disclosure.
The Company’s management, under the supervision and with the participation of the Chief Executive Officer and the Chief Financial Officer, evaluated the effectiveness of the design and operation of the Company’s disclosure controls and procedures, as defined in Exchange Act Rule 13a-15(e), as of December 31, 2018 . The Company’s disclosure controls and procedures include components of the Company’s internal control over financial reporting. Based on that evaluation, management concluded that the disclosure controls and procedures were effective as of December 31, 2018 .
Changes in Internal Control over Financial Reporting and Other Remediation
During the fourth quarter of 2018 , there were no changes in our internal controls or in other factors that materially affected, or are reasonably likely to materially affect, our internal controls over financial reporting.
Management’s Annual Report on Internal Control over Financial Reporting
The Company’s management is responsible for establishing and maintaining adequate internal control over financial reporting as defined in Exchange Act Rule 13a-15(f). The Company’s internal control system is a process designed by, or under the supervision of, the Company’s principal executive and principal financial officers, or persons performing similar functions, and effected by the Company’s board of directors, management and other personnel, to provide reasonable assurance regarding the reliability of financial reporting and the preparation of financial statements for external purposes in accordance with U.S. generally accepted accounting principles (“U.S. GAAP”).
The Company’s internal control over financial reporting includes policies and procedures that pertain to the maintenance of records that, in reasonable detail, accurately and fairly reflect transactions and dispositions of assets; provide reasonable assurance that transactions are recorded as necessary to permit preparation of financial statements in accordance with U.S. GAAP, and that receipts and expenditures are being made only in accordance with the authorization of its management and directors; and provide reasonable assurance regarding prevention or timely detection of unauthorized acquisition, use or disposition of the Company’s assets that could have a material effect on its consolidated financial statements.
Because of its inherent limitations, internal control over financial reporting may not prevent or detect misstatements. Also, projections of any evaluation of effectiveness to future periods are subject to risk that controls may become inadequate because of changes in conditions, or that the degree of compliance with the policies or procedure s may deteriorate. Entities that management has excluded from its assessment of the Company's internal control over financial report ing are Quimicer S.A. (“Quimicer”) , which was acquired on October 1, 2018, UWiZ Technology Co., Ltd. (“UWiZ”) , which was acquired on September 25, 2018, Ernst Diegel GmbH (“Diegel”) , which was acquired on August 31, 2018, MRA Laboratories, Inc. (“MRA”), which was acquired on July 12, 2018, and PT Ferro Materials Utama (“FMU”), which was acquired on June 29, 2018, whose financial statements constitute in the aggregate 5.8 % of the Company’s total assets, 1.1% of total net sales, and (1.4 % ) of total net income of the consolidated financial statement amoun ts as of and for the year ended December 31, 2018 .
Management assessed the effectiveness of the Company’s internal control over financial reporting as of December 31, 2018 . In making this assessment, the Company used the control criteria framework of the Committee of Sponsoring Organizations of the
104
Treadway Commission published in its report entitled Internal Cont rol - Integrated Framework (2013 ). Management concluded that the Company’s internal control over financial reporting was effective as of December 31, 2018 .
Deloitte & Touche LLP, the independent registered public accounting firm that audited the Company’s consolidated financial statements, has issued an attestation report on the Company’s internal control over financial reporting as of December 31, 2018 , which is included below.
105
REPORT OF INDEPENDENT REGISTERED PUBLIC ACCOUNTING FIRM
To the Board of Directors and Shareholders of Ferro Corporation
Opinion on Internal Control over Financial Reporting
We have audited the internal control over financial reporting of Ferro Corporation and subsidiaries (the "Company") as of December 31, 2018, based on criteria established in Internal Control — Integrated Framework (2013) issued by the Committee of Sponsoring Organizations of the Treadway Commission (COSO). In our opinion, the Company maintained, in all material respects, effective internal control over financial reporting as of December 31, 2018, based on criteria established in Internal Control — Integrated Framework (2013) issued by COSO.
We have also audited, in accordance with the standards of the Public Company Accounting Oversight Board (United States) (PCAOB), the consolidated financial statements and financial statement schedule as of and for the year ended December 31, 2018, of the Company and our report dated February 27, 2019, expressed an unqualified opinion on those consolidated financial statements and financial statement schedule.
As described in Management’s Annual Report on Internal Control over Financial Reporting, management excluded from its assessment the internal control over financial reporting at Quimicer, S.A. (“Quimicer”), which was acquired on October 1, 2018, UWiZ Technology Co., Ltd. (“UWiZ”), which was acquired on September 25, 2018, Ernst Diegel GmbH (“Diegel”), which was acquired on August 31, 2018, MRA Laboratories, Inc. (“MRA”), which was acquired on July 12, 2018, and PT Ferro Materials Utama (“FMU”), which was acquired on June 29, 2018, and whose financial statements constitute in the aggregate 5.8% of the Company’s total assets, 1.1% of total net sales, and (1.4%) of total net income of the consolidated financial statement amounts as of and for the year ended December 31, 2018. Accordingly, our audit did not include the internal control over financial reporting at Quimicer, UWiZ, Diegel, MRA and FMU.
Basis for Opinion
The Company's management is responsible for maintaining effective internal control over financial reporting and for its assessment of the effectiveness of internal control over financial reporting, included in the accompanying Management’s Annual Report on Internal Control over Financial Reporting. Our responsibility is to express an opinion on the Company's internal control over financial reporting based on our audit. We are a public accounting firm registered with the PCAOB and are required to be independent with respect to the Company in accordance with the U.S. federal securities laws and the applicable rules and regulations of the Securities and Exchange Commission and the PCAOB.
We conducted our audit in accordance with the standards of the PCAOB. Those standards require that we plan and perform the audit to obtain reasonable assurance about whether effective internal control over financial reporting was maintained in all material respects. Our audit included obtaining an understanding of internal control over financial reporting, assessing the risk that a material weakness exists, testing and evaluating the design and operating effectiveness of internal control based on the assessed risk, and performing such other procedures as we considered necessary in the circumstances. We believe that our audit provides a reasonable basis for our opinion.
Definition and Limitations of Internal Control over Financial Reporting
A company’s internal control over financial reporting is a process designed to provide reasonable assurance regarding the reliability of financial reporting and the preparation of financial statements for external purposes in accordance with generally accepted accounting principles. A company’s internal control over financial reporting includes those policies and procedures that (1) pertain to the maintenance of records that, in reasonable detail, accurately and fairly reflect the transactions and dispositions of the assets of the company; (2) provide reasonable assurance that transactions are recorded as necessary to permit preparation of financial statements in accordance with generally accepted accounting principles, and that receipts and expenditures of the company are being made only in accordance with authorizations of management and directors of the company; and (3) provide reasonable assurance regarding prevention
106
or timely detection of unauthorized acquisition, use, or disposition of the company’s assets that could have a material effect on the financial statements.
Because of its inherent limitations, internal control over financial reporting may not prevent or detect misstatements. Also, projections of any evaluation of effectiveness to future periods are subject to the risk that controls may become inadequate because of changes in conditions, or that the degree of compliance with the policies or procedures may deteriorate.
/s/ Deloitte & Touche LLP
Cleveland, Ohio
February 27, 2019
None .
107
Item 10 — Directors, Executive Officers and Corporate Governance
The information on Ferro’s directors is contained under the heading “Election of Directors” of the Proxy Statem ent for Ferro Corporation’s 2019 Annual Meeting of Shareholders and is incorporated here by reference. The information about the Audit Committee and the Audit Committee financial expert is contained under the heading “Corporate Governance — Bo ard Committees ” of the Proxy Statem ent for Ferro Corporation’s 2019 Annual Meeting of Shareholders and is incorporated here by reference. Information on Ferro’s executive officers is contained under the heading “Executive Officers of the Registrant” in Part 1 of this Annual Report on Form 10-K. Section 16(a) filing information is contained un der the heading “Security Ownership of Certain Beneficial Owners and Management — Section 16(a) Beneficial Ownership Reporting Compliance” of the Proxy Statem ent for Ferro Corporation’s 2019 Annual Meeting of Shareholders and is incorporated here by reference.
Ferro has adopted a series of policies dealing with business and ethics. These policies apply to all Ferro Directors, officers and employees. A summary of these policies may be found on Ferro’s Web site and the full text of the policies is available in print, free of charge, by writing to: General Counsel, Ferro Corporation, 6060 Parkland Blvd. Suite 250, Mayfield Heights, Ohio, 44124, USA. Exceptions, waivers and amendments of those policies may be made, if at all, only by the Audit Committee of the Board of Directors, and, in the event any such exceptions, waivers or amendments are granted, a description of the change or event will be posted on Ferro’s Web site ( www.ferro.com ) within four business days. Ferro maintains a worldwide hotline that allows employees throughout the world to report confidentially any detected violations of these legal and ethical conduct policies consistent with local legal requirements and subject to local legal limitations.
Item 11 — Executive Compensation
The information on executive compensation is contained under the headings “Executive Compensation Discussion & Analysis” and “2018 Executive Compensation” of the Proxy Statem ent for Ferro Corporation’s 2019 Annual Meeting of Shareholders and is incorporated here by reference.
Item 12 — Security Ownership of Certain Beneficial Owners and Management and Related Stockholder Matters
The information on security ownership of certain beneficial owners and management is contained under the headings “Security Ownership of Certain Beneficial Owners and Management — Stock Ownership by Other Major Shareholders” and “Security Ownership of Certain Beneficial Owners and Management — Stock Ownership by Director and Executive Officers ” of the Proxy Statem ent for Ferro Corporation’s 2019 Annual Meeting of Shareholders and is incorporated here by reference.
108
The numbers of shares issued and available for issuance under Ferro’s equity compensation plans as of December 31, 2018 , were as follows:
|
|
||||||||
|
|
Weighted-Average |
Number of Shares |
||||||
|
|
Number of Shares to Be |
Exercise Price of |
Remaining Available for |
|||||
|
|
Issued on Exercise of |
Outstanding |
Future Issuance Under |
|||||
|
|
Outstanding Options, |
Options, and |
Equity Compensation |
|||||
|
Equity Compensation Plan |
and Other Awards |
Other Awards |
Plans (1) |
|||||
|
Approved by Ferro Shareholders |
2,884,009 |
(2) |
$ |
6.36 | 5,906,120 |
(3) |
||
|
Not Approved by Ferro Shareholders |
184,878 |
— |
— |
|||||
|
Total |
3,068,887 |
$ |
6.36 |
(4) |
5,906,120 | |||
|
|
||||||||
_____________________
|
|
(1) |
|
Excludes shares listed under “Number of Shares to Be Issued on Exercise of Outstanding Options and Other Awards . ” |
|
|
(2) |
|
Includes options and other awards issued under the Company’s 2018 Omnibus Incentive Compensation Plan and prior equity compensation plans. |
|
|
(3) |
|
Shares are only available under the 2018 Omnibus Incentive Plan and may be issued as stock options, stock appreciation rights, restricted shares or units, performance shares or units, and other common stock-based awards. |
|
|
(4) |
|
Weighted-average exercise price of outstanding options and other awards; excludes phantom units. |
A description follows of the material features of each plan that was not approved by Ferro shareholders:
|
|
· |
|
Supplemental Defined Contribution Plan for Executive Employees . The Supplemental Executive Defined Contribution Plan allows participants to be credited annually with matching and basic pension contributions that they would have received under the Company’s 401(k) plan except for the applicable IRS limitations on compensation and contributions. Contributions vest at 20% for each year of service, are deemed invested in Ferro Common Stock and earn dividends. Distributions are made in Ferro Common Stock or in cash. |
Item 13 — Certain Relationships and Related Transactions, and Director Independence
There are no relationships or transactions that are required to be reported. The information about director independence is contained under the heading “Corporate Governance — Director Independence” of the Proxy Statement for Ferro Corporation’s 20 19 Annual Meeting of Shareholders and is incorporated here by reference.
Item 14 — Principal Accountant Fees and Services
The information co ntained under the heading “Accounting Firm Information — Fees” of the Proxy Statem ent for Ferro Corporation’s 2019 Annual Meeting of Shareholders is incorporated here by reference.
109
Item 15 — Exhibits and Financial Statement Schedules
The following documents are filed as part of this Annual Report on Form 10-K:
|
|
(a) |
|
The consolidated financial statements of Ferro Corporation and subsidiaries contained in Part II, Item 8 of this Annual Report on Form 10-K: |
|
|
· |
|
Consolidated Statements of Operations for the years ended December 31, 2018 , 2017 and 2016 ; |
|
|
· |
|
Consolidated Statements o f Comprehensive Income (Loss) for the years ended December 31, 2018 , 2017 and 2016 ; |
|
|
· |
|
Consolidated Balance Sheets at December 31, 2018 and 2017 ; |
|
|
· |
|
Consolidated Statements of Equity for the years ended December 31, 2018 , 2017 and 2016 ; |
|
|
· |
|
Consolidated Statements of Cash Flows for the years ended December 31, 2018 , 2017 and 2016 ; and |
|
|
· |
|
Notes to Consolidated Financial Statements |
|
|
(b) |
|
Schedule II — Valuation and Qualifying Accounts and Reserves for the years ended December 31, 2018 , 2017 and 2016 , contained on page 1 11 of this Annual Report on Form 10-K. All other schedules have been omitted because the material is not applicable or is not required as permitted by the rules and regulations of the U.S. Securities and Exchange Commission, or the required information is included in the consolidated financial statements. |
|
|
(c) |
|
The exhibits listed in the Exhibit Index beginning on page 1 12 of this Annual Report on Form 10-K. |
110
Pursuant to the requirements of Section 13 or 15(d) of the Securities Exchange Act of 1934, the Registrant has duly caused this Annual Report on Form 10-K to be signed on its behalf by the undersigned, thereunto duly authorized.
|
|
FERRO CORPORATION |
|
|
|
||
|
|
By |
/s/ Peter T. Thomas |
|
|
Peter T. Thomas |
|
|
|
Chairman, President and Chief Executive Officer |
|
Date: February 27 , 201 9
Pursuant to the requirements of the Securities Exchange Act of 1934, this Annual Report on Form 10-K has been signed below by the following persons on behalf of the Registrant and in their i ndicated capacities as of the 27th day of February, 2019 .
|
/s/ Peter T. Thomas |
Chairman, President and Chief Executive Officer |
|
|
Peter T. Thomas |
(Principal Executive Officer) |
|
|
|
||
|
/s/ Benjamin J. Schlater |
Group Vice President and Chief Financial Officer |
|
|
Benjamin J. Schlater |
(Principal Financial Officer) |
|
|
|
||
|
/s/ James A. Barna |
Vice President, Controller and Chief Accounting Officer |
|
|
James A. Barna |
(Principal Accounting Officer) |
|
|
|
||
|
|
||
|
|
Director |
|
|
Gregory E. Hyland |
||
|
|
||
|
/s/ David A. Lorber |
Director |
|
|
David A. Lorber |
||
|
/s/ Marran H. Ogilvie |
Director |
|
|
Marran H. Ogilvie |
||
|
|
||
|
|
||
|
/s/ Andrew M. Ross |
Director |
|
|
Andrew M. Ross |
||
|
|
||
|
/s/ Allen A. Spizzo |
Director |
|
|
Allen A. Spizzo |
||
|
|
||
|
/s/ Ronald P. Vargo |
Director |
|
|
Ronald P. Vargo |
111
FERRO CORPORATION AND SUBSIDIARIES
SCHEDULE II — VALUATION AND QUALIFYING ACCOUNTS AND RESERVES
Years Ended December 31, 2018 , 2017 and 2016
|
|
|||||||||||||||
|
|
|||||||||||||||
|
|
Additions Charged |
||||||||||||||
|
|
Balance at |
(Reductions Credited) to |
Adjustment for |
||||||||||||
|
|
Beginning of |
Costs and |
Differences in |
Balance at |
|||||||||||
|
|
Period |
Expenses |
Deductions |
Exchange Rates |
End of Period |
||||||||||
|
|
(Dollars in thousands) |
||||||||||||||
|
Allowance for Possible Losses on Collection of Accounts Receivable: |
|||||||||||||||
|
Year ended December 31, 2018 |
$ |
7,821 | 681 | (2,642) | (356) |
$ |
5,504 | ||||||||
|
Year ended December 31, 2017 |
$ |
8,166 | 44 | (1,253) | 864 |
$ |
7,821 | ||||||||
|
Year ended December 31, 2016 |
$ |
7,784 | 1,383 | (820) | (181) |
$ |
8,166 | ||||||||
|
Valuation Allowance on Net Deferred Tax Assets: |
|||||||||||||||
|
Year ended December 31, 2018 |
$ |
32,579 |
— |
(5,617) |
1 |
(1,366) |
$ |
25,596 | |||||||
|
Year ended December 31, 2017 |
$ |
37,354 |
— |
(5,648) |
1 |
873 |
$ |
32,579 | |||||||
|
Year ended December 31, 2016 |
$ |
55,043 |
— |
(16,686) |
1 |
(1,003) |
$ |
37,354 | |||||||
(1) Included within this deduction is $ 1.7 millio n, $ 0 . 8 million and $6 . 8 million for the year s ended December 31, 2018 , 2017 , and 2016 respectively, of valuation allowance release, resulting from the conclusion that the underlying deferred tax assets are more likely than not to be realized.
112
The following exhibits are filed with this report or are incorporated here by reference to a prior filing in accordance with Rule 12b-32 under the Securities and Exchange Act of 1934.
Exhibit:
|
2 |
Plan of acquisition, reorganization, arrangement or successor: |
|
2.1 |
|
|
2.2 |
|
|
3 |
Articles of Incorporation and by-laws: |
|
3.1 |
|
|
3.2 |
|
|
3.3 |
|
|
3.4 |
|
|
3.5 |
|
|
3.6 |
|
|
4 |
Instruments defining rights of security holders, including indentures: |
|
|
The Company agrees, upon request, to furnish to the U.S. Securities and Exchange Commission a copy of any instrument authorizing long-term debt that does not authorize debt in excess of 10% of the total assets of the Company and its subsidiaries on a consolidated basis. |
|
10 |
Material Contracts: |
|
10.1 |
|
|
10.2 |
|
|
10.3 |
|
|
10. 4 |
|
|
10.5 |
113
|
10.6 |
|
|
10.7 |
|
|
10.8 |
|
|
10. 9 |
|
|
10. 10 |
|
|
10.11 |
|
|
10.12 |
|
|
10.13 |
|
|
10.14 |
|
|
10.15 |
|
|
10.16 |
|
|
10.17 |
|
|
10.18 |
|
|
10.19 |
|
|
10.20 |
|
|
10.21 |
|
|
10.22 |
|
|
10.23 |
|
|
10.24 |
|
|
10.25 |
114
|
10.26 |
|
|
10.27 |
|
|
10.28 |
|
|
10.29 |
|
|
10.30 |
|
|
10.31 |
|
|
10.32 |
|
|
10.33 |
|
|
10. 34 |
|
|
10. 35 |
|
|
21 |
|
|
23.1 |
|
|
31.1 |
Certification of Principal Executive Officer Pursuant to Rule 13a-14(a)/15d-14(a). |
|
31.2 |
Certification of Principal Financial Officer Pursuant to Rule 13a-14(a)/15d-14(a). |
|
32.1 |
Certification of Principal Executive Officer Pursuant to 18 U.S.C. 1350. |
|
32.2 |
Certification of Principal Financial Officer Pursuant to 18 U.S.C. 1350. |
|
101 |
XBRL Documents: |
|
101.INS |
XBRL Instance Document.** |
________________
* Indicates management contract or compensatory plan, contract or arrangement in which one or more Directors and/or executives of Ferro Corporation may be participants.
** In accordance with Rule 406T of Regulation S-T, the XBRL related information in Exhibit 101 t o this Annual Report on Form 10- K shall not be deemed to be “filed” for purposes of Section 18 of the Securities Exchange Act of 1934, or otherwise subject to the liability of that section, and shall not be part of any registration statement or other document filed under the Securities Act of 1933 or the Securities Exchange Act of 1934, except as shall be expressly set forth by specific reference in such filing.
115