FORESTAR GROUP INC.
10-Ks and 10-Qs
|
|
|
|
|
|
|
|
|
|
|
|
|
|
|
|
|
|
|
|
|
|
|
|
|
|
|
|
|
|
|
|
|
|
|
|
|
|
|
|
|
|
|
|
|
|
|
|
|
|
|
|
|
|
|
|
UNITED STATES
SECURITIES AND EXCHANGE COMMISSION
Washington, D.C. 20549
Form 10-K
|
þ
|
ANNUAL REPORT PURSUANT TO SECTION 13 OR 15(d) OF THE SECURITIES EXCHANGE ACT OF 1934
|
For the Fiscal Year Ended
December 31, 2014
or
|
¨
|
TRANSITION REPORT PURSUANT TO SECTION 13 OR 15(d) OF THE SECURITIES EXCHANGE ACT OF 1934
|
For the Transition Period From to
Commission File Number: 001-33662
Forestar Group Inc.
(Exact Name of Registrant as Specified in Its Charter)
|
Delaware
|
|
26-1336998
|
|
(State or Other Jurisdiction of
Incorporation or Organization)
|
|
(I.R.S. Employer
Identification No.)
|
6300 Bee Cave Road
Building Two, Suite 500
Austin, Texas 78746-5149
(Address of Principal Executive Offices, including Zip Code)
Registrant’s telephone number, including area code: (512) 433-5200
Securities registered pursuant to Section 12(b) of the Act:
|
Title of Each Class
|
|
Name of Each Exchange On Which Registered
|
|
Common Stock, par value $1.00 per share
Preferred Share Purchase Rights
|
|
New York Stock Exchange
New York Stock Exchange
|
Securities registered pursuant to Section 12(g) of the Act: None
Indicate by check mark if the registrant is a well-known seasoned issuer, as defined in Rule 405 of the Securities Act. Yes
¨
No
þ
Indicate by check mark if the registrant is not required to file reports pursuant to Section 13 or 15(d) of the Act. Yes
¨
No
þ
Indicate by check mark whether the registrant (1) has filed all reports required to be filed by Section 13 or 15(d) of the Securities Exchange Act of 1934 during the preceding 12 months (or for such shorter period that the registrant was required to file such reports), and (2) has been subject to such filing requirements for the past 90 days. Yes
þ
No
¨
Indicate by check mark whether the registrant has submitted electronically and posted on its corporate Web site, if any, every Interactive Data File required to be submitted and posted pursuant to Rule 405 of Regulation S-T (§ 232.405 of this chapter) during the preceding 12 months (or for such shorter period that the registrant was required to submit and post such files). Yes
þ
No
¨
Indicate by check mark if disclosure of delinquent filers pursuant to Item 405 of Regulation S-K (§ 229.405) is not contained herein, and will not be contained, to the best of registrant’s knowledge, in definitive proxy or information statements incorporated by reference in Part III of this Form 10-K or any amendment to this Form 10-K.
¨
Indicate by check mark whether the registrant is a large accelerated filer, an accelerated filer, a non-accelerated filer, or a smaller reporting company. See the definitions of “large accelerated filer,” “accelerated filer” and “smaller reporting company” in Rule 12b-2 of the Exchange Act.
|
Large accelerated filer
o
|
|
Accelerated filer
þ
|
|
Non-accelerated filer
o
|
|
Smaller reporting company
o
|
|
(Do not check if a smaller reporting company)
|
||||||
Indicate by check mark whether the registrant is a shell company (as defined in Rule 12b-2 of the Exchange Act). Yes
¨
No
þ
The aggregate market value of the Common Stock held by non-affiliates of the registrant, based on the closing sales price of the Common Stock on the New York Stock Exchange on June 30,
2014
, was approximately
$457 million
. For purposes of this computation, all officers, directors, and ten percent beneficial owners of the registrant (as indicated in Item 12) are deemed to be affiliates. Such determination should not be deemed an admission that such directors, officers, or ten percent beneficial owners are, in fact, affiliates of the registrant.
As of
March 2, 2015
, there were
33,618,526
shares of Common Stock outstanding.
DOCUMENTS INCORPORATED BY REFERENCE
Selected portions of the Company’s definitive proxy statement for the
2015
annual meeting of stockholders are incorporated by reference into Part III of this Form 10-K.
TABLE OF CONTENTS
|
|
|
Page
|
|
Item 1.
|
||
|
Item 1A.
|
||
|
Item 1B.
|
||
|
Item 2.
|
||
|
Item 3.
|
||
|
Item 4.
|
||
|
Item 5.
|
||
|
Item 6.
|
||
|
Item 7.
|
||
|
Item 7A.
|
||
|
Item 8.
|
||
|
Item 9.
|
||
|
Item 9A.
|
||
|
Item 9B.
|
||
|
Item 10.
|
||
|
Item 11.
|
||
|
Item 12.
|
||
|
Item 13.
|
||
|
Item 14.
|
||
|
Item 15.
|
||
2
|
Item 1.
|
Business
|
Overview
Forestar Group Inc. is a real estate and oil and gas company. We own directly or through ventures
113,000
acres of real estate located in
ten
states and
13
markets, including about
102,000
acres with timber, primarily in Georgia. We also have
960,000
net acres of oil and gas mineral interests, consisting of fee ownership and leasehold interests located in 16 states in the continental U.S. In
2014
, we had revenues of
$307 million
and net income of
$17 million
. Unless the context otherwise requires, references to “we,” “us,” “our” and “Forestar” mean Forestar Group Inc. and its consolidated subsidiaries. Unless otherwise indicated, information is presented as of
December 31, 2014
, and references to acreage owned include approximate acres owned by us and ventures regardless of our ownership interest in a venture.
Business Segments
We manage our operations through three business segments:
|
•
|
Real estate,
|
|
•
|
Oil and gas, and
|
|
•
|
Other natural resources.
|
A summary of significant business segment assets at year-end
2014
follows:
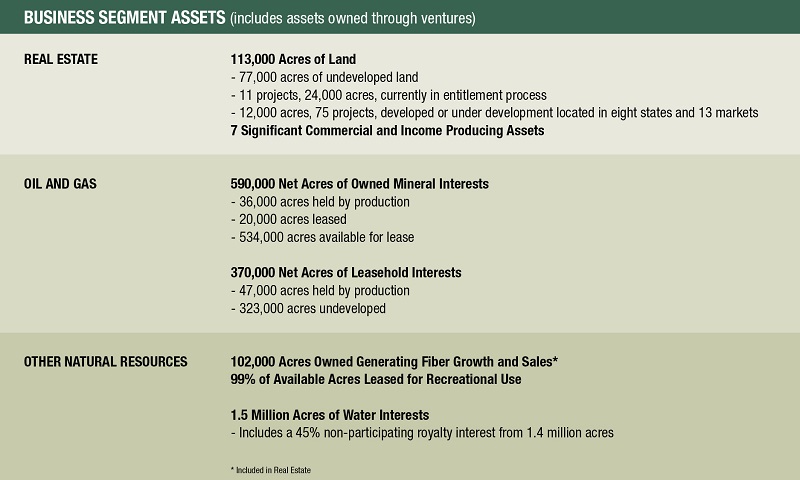
Our real estate segment provided approximately
70%
percent of our
2014
consolidated revenues. We secure entitlements and develop infrastructure, primarily for single-family residential and mixed-use communities. We own
92,000
acres in a broad area around Atlanta, Georgia, with the balance located primarily in Texas. We invest in projects principally in our strategic growth corridors, regions across the southern half of the United States that possess key demographic and growth characteristics that we believe make them attractive for long-term real estate investment. We also develop and own directly or through ventures, multifamily communities as income producing properties, principally in our target markets.
Our oil and gas segment provided
27%
percent of our
2014
consolidated revenues. We promote the exploration, development and production of oil and gas on our
960,000
owned and leasehold mineral interests. This includes
590,000
owned mineral acres and
370,000
net mineral acres leased from others.
3
Our other natural resources segment provided
3%
percent of our
2014
consolidated revenues. We sell wood fiber from our land, primarily in Georgia, and lease land for recreational uses. We have about
102,000
real estate acres with timber we own directly or through ventures. In addition, we have water interests in about 1.5 million acres, including a 45 percent nonparticipating royalty interest in groundwater produced or withdrawn for commercial purposes or sold from approximately 1.4 million acres in Texas, Louisiana, Georgia and Alabama and about 20,000 acres of groundwater leases in central Texas.
Our real estate origins date back to the 1955 incorporation of Lumbermen’s Investment Corporation, which in 2006 changed its name to Forestar (USA) Real Estate Group Inc. We have decades long legacy of residential and commercial real estate development operations, primarily in Texas. Our oil and gas origins date back to the mid-1940s when we started leasing our oil and gas mineral interests to third-party exploration and production companies. In 2007, Temple-Inland distributed all of the issued and outstanding shares of our common stock to its stockholders, which we will refer to as the “spin-off”.
Our results of operations, including information regarding our business segments, are discussed in Item 7, Management’s Discussion and Analysis of Financial Condition and Results of Operations, and in Item 8, Financial Statements and Supplementary Data.
Strategy
Our strategy is:
|
•
|
Recognizing and responsibly delivering the greatest value from every acre; and
|
|
•
|
Growing through strategic and disciplined investments.
|
We are focused on delivering the greatest real estate value from every acre through the entitlement and development of strategically-located residential and mixed-use communities. We secure entitlements by delivering thoughtful plans and balanced solutions that meet the needs of the communities where we operate. Moving land through the entitlement and development process creates significant real estate value. Residential development activities target lot sales to local, regional and national home builders who build quality products and have strong and effective marketing and sales programs. The lots we deliver in the majority of our communities are for mid-priced homes, predominantly in the first and second move-up categories. We also actively market and sell undeveloped land through our retail sales program. We develop multifamily commercial tracts ourselves as a merchant builder or we may venture with partners for the construction, operation, and sale of income producing properties.
We also seek to maximize value from our owned oil and gas mineral interests through promoting exploration, development and production activities by increasing the acreage leased, lease rates, royalty interests, negotiating additional interests in production and by entering into seismic exploration agreements and joint ventures. In addition, we lease mineral interests for oil and gas exploration and production and participate in working interests or may drill as an operator on both our owned and leased mineral interests.
We realize value from our undeveloped land by selling fiber and by managing it for future real estate development and conservation uses. We also generate cash flow and earnings through recreational leases. We are focused on creating value from our water interests by securing reservation and production supply agreements with various municipalities and water providers in our target markets.
We are committed to disciplined investment in our business. A majority of our real estate projects were acquired in the open market, with the remainder coming from entitlement efforts associated with our low basis lands principally located in and around Atlanta, Georgia. Our mineral interest investments are typically in conventional and unconventional oil and liquid-rich formations.
Our portfolio of assets in combination with our strategy, management expertise, stewardship and reinvestment in our business, position Forestar to maximize and grow long-term value for shareholders.
2014 Strategic Initiatives
On February 13, 2014, we announced
Growing FORward
, new strategic initiatives designed to further enhance shareholder value by:
|
•
|
Growing segment earnings through strategic and disciplined investments,
|
|
•
|
Increasing returns, and
|
|
•
|
Repositioning non-core assets.
|
4
On December 8, 2014, we announced that our Board of Directors, working together with our management team and financial advisor, is exploring strategic alternatives to enhance shareholder value. This analysis includes a review of alternatives with respect to our oil and gas business. There is no assurance that exploration of strategic alternatives will result in any transaction being pursued or consummated.
2014
Significant Highlights (including ventures)
Real Estate
|
•
|
Sold 2,343 developed residential lots, with the highest average annual gross profit per lot reported since 2006
|
|
•
|
Sold 22,137 acres of undeveloped land for almost $2,200 per acre
|
|
•
|
Sold 32 commercial acres for over $258,600 per acre
|
|
•
|
Sold 944 acres of residential tracts for over $8,500 per acre
|
|
•
|
Exchanged over 10,000 acres of timber leases into ownership of 5,400 acres of undeveloped land, generating a $10.5 million gain
|
|
•
|
Acquired partner's interest in Eleven multifamily venture for $21.5 million, generating a gain of $7.6 million
|
|
•
|
Received over $60 million from Cibolo Canyons Special Improvement District, generating a gain of $6.6 million
|
Oil and Gas
|
•
|
Increased proved reserves almost 20% to 10.1 MMBOE, with oil and liquids accounting for 76% of total reserves
|
|
•
|
Increased working interest oil and liquids production nearly 53% compared with 2013, principally due to working investments in the Bakken/Three Forks and Lansing-Kansas City formations
|
|
•
|
Production volumes related to royalty interests declined over 20% to approximately 310,300 BOE in 2014 which, in combination with lower lease bonus and delay rental revenues and higher operating costs, negatively impacted segment earnings by $6.1 million
|
|
•
|
Incurred non-cash impairment charges of $32.6 million associated with unproved leasehold interests and proved properties principally due to the significant decline in oil prices
|
|
•
|
Sold oil and gas properties primarily in Oklahoma and North Dakota for $17.7 million, generating gains of $8.5 million
|
|
•
|
Leased over 3,900 net mineral acres to third parties in Texas and Louisiana for over $1.2 million
|
Other Natural Resources
|
•
|
Generated $3.4 million gain related to termination of a timber lease in connection with the sale of the remaining 2,700 acres from the Ironstob venture
|
|
•
|
Sold nearly 330,000 tons of fiber for $14.93 per ton
|
|
•
|
Generated $1.1 million of revenue related to groundwater reservation agreement and almost $0.2 million gain associated with the sale of water rights related to a real estate community near Denver
|
Real Estate
In our real estate segment, we conduct a wide array of project planning and management activities related to the acquisition, entitlement, development and sale of real estate, primarily residential and mixed-use communities, which we refer to as community development. We own and manage our projects either directly or through ventures, which we use to achieve a variety of business objectives, including more effective capital deployment, risk management, and leveraging a partner’s local market contacts and expertise.
We have real estate in
ten
states and
13
markets encompassing
113,000
acres, including
92,000
acres located in a broad area around Atlanta, Georgia, with the balance located principally in Texas. Our development projects are principally located in the major markets of Texas.
5
Our strategy for creating value in our real estate segment is to move acres up the value chain by moving land located in growth corridors but not yet entitled, through the entitlement process, and into development. The chart below depicts our real estate value chain at year-end
2014
:
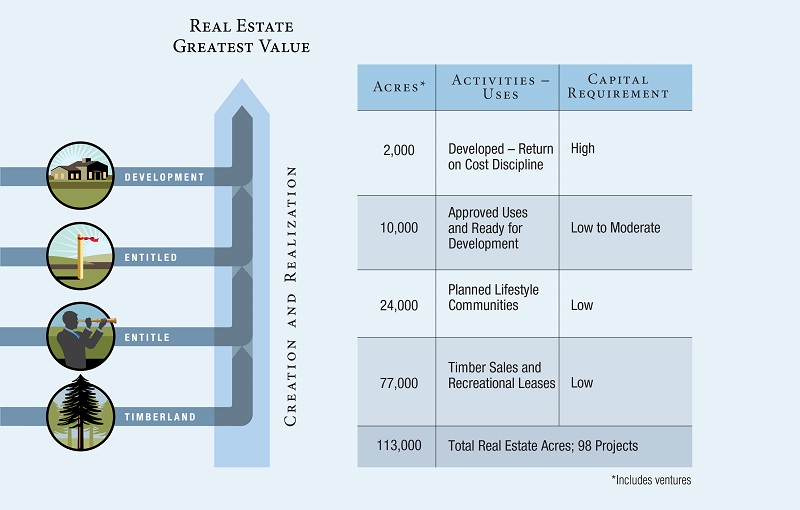
We have approximately
77,000
undeveloped acres located in the path of population growth. As markets grow and mature, we intend to secure the necessary entitlements, the timing for which varies depending upon the size, location, use and complexity of a project, focusing first on those tracts that are more desirable for near-term development. We have
11
real estate projects representing
24,000
acres in the entitlement process, which includes obtaining zoning and access to water, sewer and roads. Additional entitlements, such as flexible land use provisions, annexation, and the creation of local financing districts generate additional value for our business and may provide us the right to reimbursement of major infrastructure costs. We have
75
entitled, developed or under development projects in
eight
states and
13
markets encompassing 12,000 entitled, developed and under development acres, planned for residential and commercial uses. We use return criteria, which include return on cost, internal rate of return, and cash multiples, when determining whether to invest initially or make additional investment in a project. When investment in development meets our return criteria, we will initiate the development process with subsequent sale of lots to home builders or for commercial tracts, internal development, sale to or venture with third parties. We may sell land at any point within the value chain when additional time required for entitlement or investment in development will not meet our return criteria.
I
n
2014
, we sold over 22,000 acres of undeveloped land at an average price of almost $2,200 per acre.
6
A summary of our real estate projects in the entitlement process
(a)
at year-end
2014
follows:
|
Project
|
County
|
Project Acres
(b)
|
|||
|
California
|
|||||
|
Hidden Creek Estates
|
Los Angeles
|
700
|
|
||
|
Terrace at Hidden Hills
|
Los Angeles
|
30
|
|
||
|
Georgia
|
|||||
|
Ball Ground
|
Cherokee
|
500
|
|
||
|
Crossing
|
Coweta
|
230
|
|
||
|
Fincher Road
|
Cherokee
|
3,890
|
|
||
|
Garland Mountain
|
Cherokee/Bartow
|
350
|
|
||
|
Martin’s Bridge
|
Banks
|
970
|
|
||
|
Mill Creek
|
Coweta
|
770
|
|
||
|
Wolf Creek
|
Carroll/Douglas
|
12,230
|
|
||
|
Yellow Creek
|
Cherokee
|
1,060
|
|
||
|
Texas
|
|||||
|
Lake Houston
|
Harris/Liberty
|
3,700
|
|
||
|
Total
|
24,430
|
|
|||
_____________________
|
(a)
|
A project is deemed to be in the entitlement process when customary steps necessary for the preparation of an application for governmental land-use approvals, like conducting pre-application meetings or similar discussions with governmental officials, have commenced, or an application has been filed. Projects listed may have significant steps remaining, and there is no assurance that entitlements ultimately will be received.
|
|
(b)
|
Project acres, which are the total for the project regardless of our ownership interest, are approximate. The actual number of acres entitled may vary.
|
Products
The majority of our projects are single-family residential and mixed-use communities. In some cases, commercial land uses within a project enhance the desirability of the community by providing convenient locations for resident support services. We sometimes undertake projects consisting exclusively of commercial tracts and, on occasion, we invest in a venture to develop a single commercial project.
We develop lots for single-family homes and develop multifamily properties on our commercial tracts or other developed sites we may purchase. We sell residential lots primarily to local, regional and national home builders. We have 10,000 acres, principally in the major markets of Texas, comprised of land planned for over
18,000
residential lots. We generally focus our lot sales on the first and second move-up primary housing categories. First and second move-up segments are homes priced above entry-level products yet below the high-end and custom home segments. We also develop and own directly, or through ventures, multifamily communities as income producing properties, primarily in our target markets. Once these multifamily communities reach stabilization, we generally expect to market the properties for sale. We also actively market and sell undeveloped land through our retail sales program.
Commercial tracts are developed internally or ventured with commercial developers that specialize in the construction and operation of income producing properties, such as apartments, retail centers, or office buildings. We also sell land designated for commercial use to regional and local commercial developers. We have
2,000
acres of entitled land designated for commercial use.
Cibolo Canyons is a significant mixed-use project in the San Antonio market area. Cibolo Canyons includes 2,100 acres planned to include
1,769
residential lots, of which
911
have been sold as of year-end
2014
at an average price of
$71,000
per lot. The residential component includes not only traditional single-family homes but also an active adult section, and is planned to include condominiums. The commercial component includes over 150 acres principally designated for multifamily and retail uses, of which
130
acres have been sold as of year-end
2014
. Located at Cibolo Canyons is the JW Marriott
®
San Antonio Hill Country Resort & Spa, a 1,002 room destination resort and two PGA Tour
®
Tournament Players Club
®
(TPC) golf courses designed by Pete Dye and Greg Norman. We have the right to receive from a legislatively created Cibolo Canyons special improvement district (CCSID) nine percent of hotel occupancy revenues and 1.5 percent of other resort sales revenues collected as taxes by CCSID through 2034 and reimbursement of certain infrastructure costs related to the mixed-use development.
In October 2014, we received $46,500,000 from CCSID under 2007 economic development agreements (EDA) in connection with development of the JW Marriott
®
Hill Country Resort & Spa. CCSID funded payment to us from its issuance
7
of $48,900,000 Hotel Occupancy Tax (HOT) and Sales and Use Tax Revenue Bonds. These bonds are obligations solely of CCSID and are payable from HOT and sales and use taxes levied by CCSID. To facilitate the issuance of the bonds, we provided a $6,846,000 letter of credit to the bond trustee as security for certain debt service fund obligations in the event CCSID tax collections are not sufficient to support payment of the bonds in accordance with their terms. The letter of credit must be maintained until the earlier of redemption of the bonds or scheduled bond maturity in 2034. We also entered into an agreement with San Antonio Real Estate (SARE), owner of the Resort, to assign SARE’s senior rights under the EDA to us in exchange for consideration provided by us, including a surety bond to be drawn if CCSID tax collections are not sufficient to support ad valorem tax rebates payable to SARE. The surety bond has a balance of $9,010,000 at year-end 2014. The surety bond will decrease as CCSID makes annual ad valorem tax rebate payments to SARE, which obligation is scheduled to be retired in full by 2020.
A summary of activity within our projects in the development process, which includes entitled
(a)
, developed and under development single-family and mixed-use projects, at year-end
2014
follows:
|
|
|
|
Residential Lots
(c)
|
Commercial Acres
(d)
|
|||||||||||||
|
Project
|
County
|
Interest
Owned
(b)
|
Lots Sold
Since
Inception
|
Lots
Remaining
|
Acres Sold
Since
Inception
|
Acres
Remaining
(e)
|
|||||||||||
|
Projects we own
|
|||||||||||||||||
|
California
|
|||||||||||||||||
|
San Joaquin River
|
Contra Costa/Sacramento
|
100
|
%
|
—
|
|
—
|
|
—
|
|
288
|
|
||||||
|
Colorado
|
|||||||||||||||||
|
Buffalo Highlands
|
Weld
|
100
|
%
|
—
|
|
164
|
|
—
|
|
—
|
|
||||||
|
Johnstown Farms
|
Weld
|
100
|
%
|
281
|
|
313
|
|
2
|
|
3
|
|
||||||
|
Pinery West
|
Douglas
|
100
|
%
|
45
|
|
41
|
|
20
|
|
106
|
|
||||||
|
Stonebraker
|
Weld
|
100
|
%
|
—
|
|
603
|
|
—
|
|
—
|
|
||||||
|
Tennessee
|
|||||||||||||||||
|
Beckwith Crossing
|
Wilson
|
100
|
%
|
—
|
|
99
|
|
—
|
|
—
|
|
||||||
|
Morgan Farms
|
Williamson
|
100
|
%
|
61
|
|
112
|
|
—
|
|
—
|
|
||||||
|
Weatherford Estates
|
Williamson
|
100
|
%
|
—
|
|
17
|
|
—
|
|
—
|
|
||||||
|
Texas
|
|||||||||||||||||
|
Arrowhead Ranch
|
Hays
|
100
|
%
|
—
|
|
381
|
|
—
|
|
11
|
|
||||||
|
Bar C Ranch
|
Tarrant
|
100
|
%
|
331
|
|
774
|
|
—
|
|
—
|
|
||||||
|
Barrington Kingwood
|
Harris
|
100
|
%
|
148
|
|
32
|
|
—
|
|
—
|
|
||||||
|
Cibolo Canyons
|
Bexar
|
100
|
%
|
911
|
|
858
|
|
130
|
|
56
|
|
||||||
|
Harbor Lakes
|
Hood
|
100
|
%
|
221
|
|
228
|
|
13
|
|
8
|
|
||||||
|
Hunter’s Crossing
|
Bastrop
|
100
|
%
|
510
|
|
—
|
|
41
|
|
62
|
|
||||||
|
Imperial Forest
|
Harris
|
100
|
%
|
—
|
|
428
|
|
—
|
|
—
|
|
||||||
|
La Conterra
|
Williamson
|
100
|
%
|
202
|
|
—
|
|
3
|
|
55
|
|
||||||
|
Lakes of Prosper
|
Collin
|
100
|
%
|
97
|
|
190
|
|
4
|
|
—
|
|
||||||
|
Lantana
|
Denton
|
100
|
%
|
1,131
|
|
650
|
|
9
|
|
3
|
|
||||||
|
Maxwell Creek
|
Collin
|
100
|
%
|
935
|
|
66
|
|
10
|
|
—
|
|
||||||
|
Oak Creek Estates
|
Comal
|
100
|
%
|
226
|
|
328
|
|
13
|
|
—
|
|
||||||
|
Parkside
|
Collin
|
100
|
%
|
—
|
|
200
|
|
—
|
|
—
|
|
||||||
|
Stoney Creek
|
Dallas
|
100
|
%
|
221
|
|
487
|
|
—
|
|
—
|
|
||||||
|
Summer Creek Ranch
|
Tarrant
|
100
|
%
|
974
|
|
277
|
|
35
|
|
44
|
|
||||||
|
Summer Lakes
|
Fort Bend
|
100
|
%
|
614
|
|
455
|
|
56
|
|
—
|
|
||||||
|
Summer Park
|
Fort Bend
|
100
|
%
|
69
|
|
130
|
|
28
|
|
68
|
|
||||||
|
The Colony
|
Bastrop
|
100
|
%
|
451
|
|
1,434
|
|
22
|
|
31
|
|
||||||
|
The Preserve at Pecan Creek
|
Denton
|
100
|
%
|
534
|
|
248
|
|
—
|
|
7
|
|
||||||
|
Village Park
|
Collin
|
100
|
%
|
756
|
|
—
|
|
3
|
|
2
|
|
||||||
|
Westside at Buttercup Creek
|
Williamson
|
100
|
%
|
1,496
|
|
1
|
|
66
|
|
—
|
|
||||||
|
Other projects (9)
|
Various
|
100
|
%
|
1,776
|
|
228
|
|
133
|
|
7
|
|
||||||
8
|
|
|
|
Residential Lots
(c)
|
Commercial Acres
(d)
|
|||||||||||||
|
Project
|
County
|
Interest
Owned
(b)
|
Lots Sold
Since
Inception
|
Lots
Remaining
|
Acres
Sold
Since
Inception
|
Acres
Remaining
(e)
|
|||||||||||
|
Georgia
|
|||||||||||||||||
|
Seven Hills
|
Paulding
|
100
|
%
|
780
|
|
303
|
|
26
|
|
113
|
|
||||||
|
The Villages at Burt Creek
|
Dawson
|
100
|
%
|
—
|
|
1,715
|
|
—
|
|
57
|
|
||||||
|
Other projects (18)
|
Various
|
100
|
%
|
297
|
|
2,796
|
|
—
|
|
705
|
|
||||||
|
Other
|
|||||||||||||||||
|
Other projects (3)
|
Various
|
100
|
%
|
534
|
|
418
|
|
—
|
|
—
|
|
||||||
|
13,601
|
|
13,976
|
|
614
|
|
1,626
|
|
||||||||||
|
Projects in entities we consolidate
|
|||||||||||||||||
|
Texas
|
|||||||||||||||||
|
City Park
|
Harris
|
75
|
%
|
1,311
|
|
504
|
|
50
|
|
115
|
|
||||||
|
Timber Creek
|
Collin
|
88
|
%
|
—
|
|
601
|
|
—
|
|
—
|
|
||||||
|
Willow Creek Farms II
|
Waller/Fort Bend
|
90
|
%
|
90
|
|
160
|
|
—
|
|
—
|
|
||||||
|
Other projects (2)
|
Various
|
Various
|
|
10
|
|
198
|
|
—
|
|
18
|
|
||||||
|
Georgia
|
|||||||||||||||||
|
The Georgian
|
Paulding
|
75
|
%
|
535
|
|
—
|
|
—
|
|
—
|
|
||||||
|
1,946
|
|
1,463
|
|
50
|
|
133
|
|
||||||||||
|
Total owned and consolidated
|
15,547
|
|
15,439
|
|
664
|
|
1,759
|
|
|||||||||
|
Projects in ventures that we account for using the equity method
|
|||||||||||||||||
|
Texas
|
|||||||||||||||||
|
Entrada
|
Travis
|
50
|
%
|
—
|
|
821
|
|
—
|
|
—
|
|
||||||
|
Fannin Farms West
|
Tarrant
|
50
|
%
|
324
|
|
—
|
|
—
|
|
12
|
|
||||||
|
Harper’s Preserve
|
Montgomery
|
50
|
%
|
315
|
|
1,413
|
|
15
|
|
64
|
|
||||||
|
Lantana - Rayzor Ranch
|
Denton
|
25
|
%
|
1,163
|
|
—
|
|
16
|
|
42
|
|
||||||
|
Long Meadow Farms
|
Fort Bend
|
38
|
%
|
1,399
|
|
405
|
|
187
|
|
118
|
|
||||||
|
Southern Trails
|
Brazoria
|
80
|
%
|
794
|
|
202
|
|
—
|
|
1
|
|
||||||
|
Stonewall Estates
|
Bexar
|
50
|
%
|
342
|
|
48
|
|
—
|
|
—
|
|
||||||
|
Other projects (2)
|
Various
|
Various
|
|
—
|
|
—
|
|
—
|
|
15
|
|
||||||
|
Total in ventures
|
4,337
|
|
2,889
|
|
218
|
|
252
|
|
|||||||||
|
Combined Total
|
19,884
|
|
18,328
|
|
882
|
|
2,011
|
|
|||||||||
_____________________
|
(a)
|
A project is deemed entitled when all major discretionary governmental land-use approvals have been received. Some projects may require additional permits and/or non-governmental authorizations for development.
|
|
(b)
|
Interest owned reflects our net equity interest in the project, whether owned directly or indirectly. There are some projects that have multiple ownership structures within them. Accordingly, portions of these projects may appear as owned, consolidated or accounted for using the equity method.
|
|
(c)
|
Lots are for the total project, regardless of our ownership interest. Lots remaining represent vacant developed lots, lots under development and future planned lots and are subject to change based on business plan revisions.
|
|
(d)
|
Commercial acres are for the total project, regardless of our ownership interest, and are net developable acres, which may be fewer than the gross acres available in the project.
|
|
(e)
|
Excludes acres associated with commercial and income producing properties.
|
9
A summary of our significant commercial and income producing properties at year-end
2014
follows:
|
Project
|
Market
|
Interest
Owned
(a)
|
Type
|
Acres
|
Description
|
|||||||
|
Radisson Hotel
|
Austin
|
100
|
%
|
Hotel
|
2
|
|
413 guest rooms and suites
|
|||||
|
Eleven
|
Austin
|
100
|
%
|
Multifamily
|
3
|
|
257-unit luxury apartment
|
|||||
|
Midtown
(b)
|
Dallas
|
100
|
%
|
Multifamily
|
13
|
|
354-unit luxury apartment
|
|||||
|
360°
(b)
|
Denver
|
20
|
%
|
Multifamily
|
4
|
|
304-unit luxury apartment
|
|||||
|
Acklen
(b)
|
Nashville
|
30
|
%
|
Multifamily
|
6
|
|
320-unit luxury apartment
|
|||||
|
HiLine
(b)
|
Denver
|
25
|
%
|
Multifamily
|
6
|
|
385-unit luxury apartment
|
|||||
|
Elan 99
(b)
|
Houston
|
90
|
%
|
Multifamily
|
14
|
|
360-unit luxury apartment
|
|||||
_____________________
|
(a)
|
Interest owned reflects our net equity interest in the project, whether owned directly or indirectly.
|
|
(b)
|
Construction in progress.
|
Our net investment in owned and consolidated real estate projects by geographic location at year-end
2014
follows:
|
State
|
Entitled,
Developed,
and Under
Development
Projects
|
Undeveloped
Land and
Land in
Entitlement
|
Income
Producing
Properties
|
Total
|
||||||||||||
|
|
(In thousands)
|
|||||||||||||||
|
Texas
|
$
|
250,548
|
|
$
|
5,931
|
|
$
|
138,423
|
|
$
|
394,902
|
|
||||
|
Georgia
|
17,418
|
|
63,653
|
|
—
|
|
81,071
|
|
||||||||
|
California
|
8,915
|
|
23,040
|
|
—
|
|
31,955
|
|
||||||||
|
Colorado
|
25,334
|
|
5
|
|
—
|
|
25,339
|
|
||||||||
|
Tennessee
|
10,461
|
|
540
|
|
7,675
|
|
18,676
|
|
||||||||
|
North Carolina
|
—
|
|
13
|
|
15,203
|
|
15,216
|
|
||||||||
|
Other
|
8,597
|
|
—
|
|
—
|
|
8,597
|
|
||||||||
|
Total
|
$
|
321,273
|
|
$
|
93,182
|
|
$
|
161,301
|
|
$
|
575,756
|
|
||||
Approximately
69 percent
of our net investment in real estate is in the major markets of Texas.
Markets
Sales of new U.S. single-family homes rose to a six-year high in September 2014, on a seasonally adjusted basis, but a sharp downward revision of new homes sold in November 2014 when compared with November 2013 indicates the housing recovery remains tentative. Inventories of new homes are at historically low levels in many areas. In addition to declining finished lot inventories and limited supply of economically developable raw land has increased demand for our developed lots. However, national and global economic weakness and uncertainty, and a restrictive mortgage lending environment continue to threaten a robust recovery in the housing market, despite low interest rates. Multifamily market conditions continue to be strong, with many markets experiencing healthy occupancy levels and positive rent growth. This improvement has been driven primarily by limited housing inventory, reduced single-family mortgage credit availability, and the increased propensity to rent among the 18 to 34 year old demographic of the U.S. population.
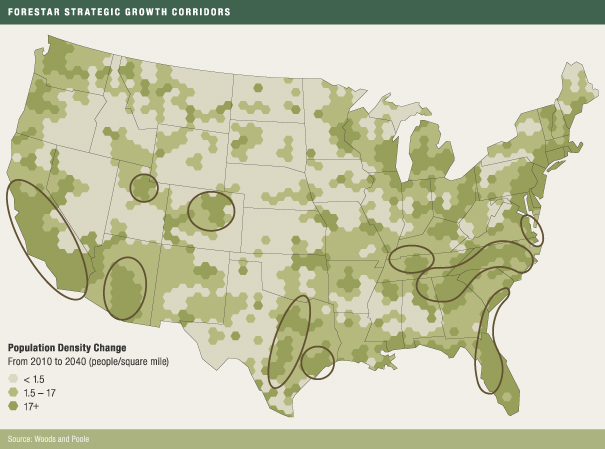
Forestar Strategic Growth Corridors
We target investments primarily in markets within our strategic growth corridors, which we define as areas possessing favorable growth characteristics for population, employment and household formation. These markets are generally located across the southern half of the U.S., and we believe they represent attractive long-term real estate investment opportunities. Demand for residential lots, single-family housing, and commercial land is substantially influenced by these growth characteristics, as well as by immigration and in-migration. Currently, most of our development projects are located within the major markets of Texas.
Our ten strategic growth corridors encompass 164,000 square miles, or approximately 4.6 percent of the total land area in the U.S. According to 2010 census data, 91.7 million people, or 30 percent of the U.S. total, reside in these corridors. The population density in these growth corridors is over six times the national average and is projected to grow to over 10 times the national average between 2010 and 2040. During that time, the target corridors are projected to garner approximately 49 percent of the nation’s population growth and 40 percent of total employment growth. Estimated housing demand from these ten growth corridors from 2010 to 2040 exceeds 24 million new homes.
10
Our value creation strategy includes both growth through strategic and disciplined investment in acquisitions that meet our investment criteria, and entitlement and development on our own lands. We continually monitor the markets in our strategic growth corridors for opportunities to acquire developed lots and land at prices that meet our return criteria.
Competition
We face significant competition for the acquisition, entitlement, development and sale of real estate in our markets. Our major competitors include other landowners who market and sell undeveloped land and numerous national, regional and local developers. In addition, our projects compete with other development projects offering similar amenities, products and/or locations. Competition also exists for investment opportunities, financing, available land, raw materials and labor, with entities that may possess greater financial, marketing and other resources than us. The presence of competition may increase the bargaining power of property owners seeking to sell. These competitive market pressures sometimes make it difficult to acquire, entitle, develop or sell land at prices that meet our return criteria. Some of our real estate competitors are well established and financially strong, may have greater financial resources than we do, or may be larger than us and/or have lower cost of capital and operating costs than we have and expect to have.
The land acquisition and development business is highly fragmented, and we are unaware of any meaningful concentration of market share by any one competitor. Enterprises of varying sizes, from individuals or small companies to large corporations, actively engage in the real estate development business. Many competitors are local, privately-owned companies. We have a few regional competitors and virtually no national competitors other than national home builders that, depending on business cycles and market conditions, may enter or exit the real estate development business in some locations to develop lots on which they construct and sell homes. During periods when access to capital is restricted, participants with weaker financial conditions tend to be less active.
Oil and Gas
Our oil and gas segment is focused on the exploration, development and production of oil and gas on our owned and leasehold mineral interests.
We typically lease our owned mineral interests to third parties for exploration and production of oil and gas. When we lease our mineral interests, we negotiate a lease bonus payment and retain a royalty interest and may take an additional working interest participation in production. Working interests refer to well interests in which we pay a share of the costs to drill, complete and operate a well and receive a proportionate share of the production revenues.
11
In 2012, we acquired 100 percent of the outstanding common stock of Credo in an all cash transaction for $14.50 per share, representing an equity purchase price of approximately $146.4 million. In addition, we paid in full $8.8 million of Credo’s outstanding debt at closing. Credo was an independent oil and gas exploration, development and production company based in Denver, Colorado. The acquired assets principally included leasehold interests in the Bakken and Three Forks formations of North Dakota, the Lansing – Kansas City formation in Kansas and Nebraska, and the Tonkawa and Cleveland formations in Texas.
Our strategy for maximizing value from our owned and leased mineral interests is to move acres up the minerals value chain by participating in working interests in the drilling, completion and production of oil and gas, increasing the net acreage leased of our owned interests, the lease bonus amount per acre and the size of retained royalty interests. The chart below depicts our minerals interests value chain:
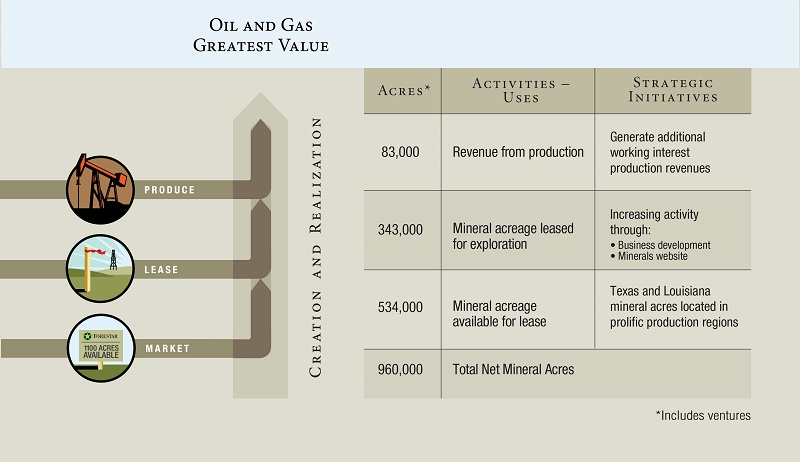
Owned Mineral Interests
We own mineral interests beneath approximately
590,000
net acres located in the United States, principally in Texas, Louisiana, Georgia and Alabama. Our revenue from our owned mineral interests is primarily from oil and gas royalty interests, lease bonus payments and delay rentals received and other related activities. We engage in leasing certain portions of these mineral interests to third parties for the exploration and production of oil and gas.
At year-end
2014
, of our
590,000
net acres of owned mineral interests, about
534,000
net acres are available for lease. We have about
56,000
net acres leased for oil and gas exploration activities, of which about
36,000
net acres are held by production from over
551
gross oil and gas wells that are operated by others, in which we have royalty interest. In addition, we have working interest ownership in 33 of these wells.
12
A summary of our owned mineral acres
(a)
at year-end
2014
follows:
|
State
|
Unleased
|
Leased
(b)
|
Held By
Production
(c)
|
Total
(d)
|
||||||||
|
Texas
|
208,000
|
|
17,000
|
|
27,000
|
|
252,000
|
|
||||
|
Louisiana
|
132,000
|
|
3,000
|
|
9,000
|
|
144,000
|
|
||||
|
Georgia
|
152,000
|
|
—
|
|
—
|
|
152,000
|
|
||||
|
Alabama
|
40,000
|
|
—
|
|
—
|
|
40,000
|
|
||||
|
California
|
1,000
|
|
—
|
|
—
|
|
1,000
|
|
||||
|
Indiana
|
1,000
|
|
—
|
|
—
|
|
1,000
|
|
||||
|
534,000
|
|
20,000
|
|
36,000
|
|
590,000
|
|
|||||
_____________________
|
(a)
|
Includes ventures.
|
|
(b)
|
Includes leases in primary lease term or for which a delayed rental payment has been received. In the ordinary course of business, leases covering a significant portion of leased net mineral acres may expire from time to time in a single reporting period.
|
|
(c)
|
Acres being held by production are producing oil or gas in paying quantities.
|
|
(d)
|
Texas, Louisiana, California and Indiana net acres are calculated as the gross number of surface acres multiplied by our percentage ownership of the mineral interest. Alabama and Georgia net acres are calculated as the gross number of surface acres multiplied by our estimated percentage ownership of the mineral interest based on county sampling.
|
A summary of our Texas and Louisiana owned mineral acres
(a)
primarily in East Texas and Gulf Coast Basins by county or parish at year-end
2014
follows:
|
Texas
|
Louisiana
(b)
|
|||||||
|
County
|
Net Acres
|
Parish
|
Net Acres
|
|||||
|
Trinity
|
46,000
|
|
Beauregard
|
79,000
|
|
|||
|
Angelina
|
42,000
|
|
Vernon
|
39,000
|
|
|||
|
Houston
|
29,000
|
|
Calcasieu
|
17,000
|
|
|||
|
Anderson
|
25,000
|
|
Allen
|
7,000
|
|
|||
|
Cherokee
|
24,000
|
|
Rapides
|
1,000
|
|
|||
|
Sabine
|
23,000
|
|
Other
|
1,000
|
|
|||
|
Red River
|
14,000
|
|
144,000
|
|
||||
|
Newton
|
13,000
|
|
||||||
|
San Augustine
|
13,000
|
|
||||||
|
Jasper
|
12,000
|
|
||||||
|
Other
|
11,000
|
|
||||||
|
252,000
|
|
|||||||
_____________________
|
(a)
|
Includes ventures. These owned mineral acre interests contain numerous oil and gas producing formations consisting of conventional, unconventional, and tight sand reservoirs. Of these reservoirs, we have mineral interests in and around production trends in the Wilcox, Frio, Cockfield, James Lime, Pettet, Travis Peak, Cotton Valley, Austin Chalk, Haynesville Shale, Barnett Shale and Bossier formations.
|
|
(b)
|
A significant portion of our Louisiana net mineral acres were severed from the surface estate shortly before our 2007 spin-off. Under Louisiana law, a mineral servitude that is not producing minerals or which has not been the subject of good-faith drilling operations will cease to burden the property upon the tenth anniversary of the date of its creation.
|
We engage in leasing certain portions of our owned mineral interests to third parties for the exploration and production of oil and gas. Leasing mineral acres for exploration and production can create significant value because we may negotiate a lease bonus payment and retain a royalty interest in all revenues generated by the lessee from oil and gas production. The significant terms of these arrangements include granting the exploration company the rights to oil or gas it may find and requiring that drilling be commenced within a specified period. In return, we may receive an initial lease payment (bonus), subsequent payments if drilling has not started within the specified period (delay rentals), and a percentage interest in the value of any oil or gas produced (royalties). If no oil or gas is produced during the required period, all rights are returned to us. Historically, our capital requirements for our owned mineral acres have been minimal.
13
Our royalty revenues are contractually defined and based on a percentage of production and are received in cash. Our royalty revenues fluctuate based on changes in the market prices for oil and gas, the decline in production in existing wells, and other factors affecting the third-party oil and gas exploration and production companies that operate wells on our minerals including the cost of development and production.
Most leases are for a three to five year term although a portion or all of a lease may be extended by the lessee as long as actual production is occurring. Financial terms vary based on a number of market factors including the location of the mineral interest, the number of acres subject to the agreement, proximity to transportation facilities such as pipelines, depth of formations to be drilled and risk.
Mineral Interests Leased
With the acquisition of Credo, we became an independent oil and gas exploration, development and production company. As of year-end
2014
, our leasehold interests include
370,000
net mineral acres leased from others principally located in Nebraska and Kansas primarily targeting the Lansing – Kansas City formation, in Oklahoma primarily targeting the Anadarko Basin, in the Texas Panhandle primarily targeting the Tonkawa and Cleveland formations, and in North Dakota primarily targeting the Bakken and Three Forks formations. We have
47,000
net acres held by production and
393
gross oil and gas wells with working interest ownership, of which
153
are operated by us.
A summary of our net mineral acres leased from others as of year-end
2014
follows:
|
State
|
Undeveloped
(b)
|
Held By
Production
|
Total
|
||||||
|
Nebraska
|
248,000
|
|
11,000
|
|
259,000
|
|
|||
|
Kansas
|
18,000
|
|
8,000
|
|
26,000
|
|
|||
|
Oklahoma
|
23,000
|
|
18,000
|
|
41,000
|
|
|||
|
Texas
|
10,000
|
|
2,000
|
|
12,000
|
|
|||
|
North Dakota
|
5,000
|
|
4,000
|
|
9,000
|
|
|||
|
Other
(a)
|
19,000
|
|
4,000
|
|
23,000
|
|
|||
|
323,000
|
|
47,000
|
|
370,000
|
|
||||
__________________
|
(a)
|
Excludes approximately
8,000
net acres of overriding royalty interests
|
|
(b)
|
We have approximately 59,000 gross and 44,000 net undeveloped acres scheduled to expire in 2015, some of which we are currently evaluating for lease extension.
|
Nebraska and Kansas
We have about
285,000
net mineral acres primarily located on or near the Central Kansas Uplift formations located in the western Kansas counties of Logan, Lane, Thomas, Rawlins and Gove and in the southwest portion of Nebraska in the counties of Dundy, Red Willow and Hitchcock. At year-end
2014
, we own working interests in 139 gross producing wells with an average working interest of 51 percent.
Oklahoma
We have about
41,000
net mineral acres located in the Anadarko Basin. At year-end
2014
, we own working interests in 88 gross producing wells with an average working interest of 38 percent.
Texas
We have about
12,000
net mineral acres primarily in Sabine, San Augustine, Lipscomb, Hemphill, Tyler and Fayette counties. We own working interests in 55 gross producing wells. These wells have an average working interest of 16 percent.
North Dakota
We have about
9,000
net acres in or near the core of the Bakken and Three Forks formations. Most of the acreage is located on the Fort Berthold Indian Reservation, south and west of the Parshall Field. We own working interests in 118 gross producing oil wells with an average working interest of 7 percent. Where a well has been drilled on a spacing unit, in many cases we expect additional development wells to be drilled on those spacing units in the future.
Most leases are for a three to five year term although a portion or all of a lease may be extended as long as production is occurring. Financial terms vary based on a number of factors including the location of the leasehold interest, the number of acres subject to the agreement, proximity to transportation facilities such as pipelines, depth of formations to be drilled and risk.
14
Estimated Proved Reserves
Our net estimated proved oil and gas reserves, all of which are located in the United States, as of year-end
2014
,
2013
and
2012
are set forth in the table below. We engaged independent petroleum engineers, Netherland, Sewell & Associates, Inc.(NSAI), to assist us in preparing estimates of our proved oil and gas reserves in accordance with the definitions and guidelines of the Securities and Exchange Commission (SEC).
Net quantities of proved oil and gas reserves related to our working and royalty interests follow:
|
|
Reserves
|
||||
|
|
Oil
(a)
(Barrels)
|
Gas
(Mcf)
|
|||
|
|
(In thousands)
|
||||
|
Consolidated entities:
|
|||||
|
Proved developed
|
5,269
|
|
10,848
|
|
|
|
Proved undeveloped
|
2,403
|
|
1,801
|
|
|
|
Total proved reserves 2014
|
7,672
|
|
12,649
|
|
|
|
Proved developed
|
3,893
|
|
11,385
|
|
|
|
Proved undeveloped
|
1,931
|
|
2,245
|
|
|
|
Total proved reserves 2013
|
5,824
|
|
13,630
|
|
|
|
Proved developed
|
2,416
|
|
10,448
|
|
|
|
Proved undeveloped
|
804
|
|
1,274
|
|
|
|
Total proved reserves 2012
|
3,220
|
|
11,722
|
|
|
|
Our share of ventures accounted for using the equity method:
|
|||||
|
Proved developed
|
—
|
|
1,751
|
|
|
|
Proved undeveloped
|
—
|
|
—
|
|
|
|
Total proved reserves 2014
|
—
|
|
1,751
|
|
|
|
Proved developed
|
—
|
|
2,332
|
|
|
|
Proved undeveloped
|
—
|
|
—
|
|
|
|
Total proved reserves 2013
|
—
|
|
2,332
|
|
|
|
Proved developed
|
—
|
|
2,572
|
|
|
|
Proved undeveloped
|
—
|
|
—
|
|
|
|
Total proved reserves 2012
|
—
|
|
2,572
|
|
|
|
Total consolidated and our share of equity method ventures:
|
|||||
|
Proved developed
|
5,269
|
|
12,599
|
|
|
|
Proved undeveloped
|
2,403
|
|
1,801
|
|
|
|
Total proved reserves 2014
|
7,672
|
|
14,400
|
|
|
|
Proved developed
|
3,893
|
|
13,717
|
|
|
|
Proved undeveloped
|
1,931
|
|
2,245
|
|
|
|
Total proved reserves 2013
|
5,824
|
|
15,962
|
|
|
|
Proved developed
|
2,416
|
|
13,020
|
|
|
|
Proved undeveloped
|
804
|
|
1,274
|
|
|
|
Total proved reserves 2012
|
3,220
|
|
14,294
|
|
|
_____________________
|
(a)
|
Includes natural gas liquids.
|
15
The following summarizes the changes in proved reserves for
2014
:
|
|
Reserves
|
||||
|
|
Oil
(Barrels)
|
Gas
(Mcf)
|
|||
|
|
(In thousands)
|
||||
|
Consolidated entities:
|
|||||
|
Year-end 2013
|
5,824
|
|
13,630
|
|
|
|
Revisions of previous estimates
|
608
|
|
293
|
|
|
|
Extensions and discoveries
|
2,191
|
|
774
|
|
|
|
Acquisitions
|
85
|
|
31
|
|
|
|
Sales
|
(105
|
)
|
(218
|
)
|
|
|
Production
|
(931
|
)
|
(1,861
|
)
|
|
|
Year-end 2014
|
7,672
|
|
12,649
|
|
|
|
Our share of ventures accounted for using the equity method:
|
|||||
|
Year-end 2013
|
—
|
|
2,332
|
|
|
|
Revisions of previous estimates
|
—
|
|
(382
|
)
|
|
|
Extensions and discoveries
|
—
|
|
—
|
|
|
|
Production
|
—
|
|
(199
|
)
|
|
|
Year-end 2014
|
—
|
|
1,751
|
|
|
|
Total consolidated and our share of equity method ventures:
|
|||||
|
Year-end 2014
|
7,672
|
|
14,400
|
|
|
We do not have any estimated reserves of synthetic oil, synthetic gas or products of other non-renewable natural resources that are intended to be upgraded into synthetic oil and gas.
At year-end 2014, we have approximately 2,703,000 barrel of oil equivalent (BOE) of proved undeveloped (PUD) reserves compared with 2,305,000 BOE of PUD reserves at year-end 2013. The increase in PUD reserves is principally due to (i) additions of 956,000 BOE from higher estimated recovery rates, lease acquisitions, extensions and new discoveries, (ii) the conversion of 384,000 BOE of PUD reserves to proved developed reserves, and (iii) downward revisions of 174,000 BOE related to lower oil prices. As a percent of our total proved reserves, PUD reserves were 27% at year-end 2014 and year-end 2013.
In 2014, we invested approximately $10,395,000 million, in addition to $383,000 of previous capital investments, to convert 384,000 BOE of PUD reserves into proved developed reserves.
All of our PUD reserves at year-end 2014 are expected to be developed over the next five years. Estimated future development costs related to the development of our 2,700,000 BOE at year-end 2014 PUD reserves are projected to be approximately $57 million.
Reserve estimates were based on the economic and operating conditions existing at year-end
2014
,
2013
and
2012
. Oil and gas prices are based on the twelve month unweighted arithmetic average of the first-day-of-the-month price for each month in the period January through December. For
2014
,
2013
and
2012
, prices used for reserve estimates were
$94.99
,
$96.91
and
$94.71
per barrel of West Texas Intermediate Crude Oil and gas prices of
$4.35
,
$3.67
and
$2.76
per MMBTU per the Henry Hub spot market. All prices were then adjusted for quality, transportation fees and regional price differentials. Since the determination and valuation of proved reserves is a function of the interpretation of engineering and geologic data and prices for oil and gas and the cost to produce these reserves, the reserves presented should be expected to change as future information becomes available. For an estimate of the standardized measure of discounted future net cash flows from proved oil and gas reserves, please read
Note 19
— Supplemental Oil and Gas Disclosures (Unaudited)
to our consolidated financial statements included Part II, Item 8 of this Annual Report on Form 10-K.
The process of estimating oil and gas reserves is complex, involving decisions and assumptions in evaluating the available geological, geophysical, engineering and economic data. Accordingly, these estimates are imprecise. Actual future production, oil and gas prices, capital costs, operating costs, revenues, taxes and quantities of recoverable oil and gas reserves might vary from those estimated. Any variance could materially affect the estimated quantities and present value of proved reserves. In addition, estimates of proved reserves may be adjusted to reflect production history, development, prevailing oil and gas prices and other factors, many of which are beyond our control.
The primary internal technical person in charge of overseeing our reserves estimates has a Bachelor of Science in Physics and Mathematics and a Masters of Science in Civil Engineering. He has over 40 years of domestic and international experience in the exploration and production business including 39 years of reserve evaluations. He has been a registered Professional Engineer for over 25 years.
16
As part of our internal control over financial reporting, we have a process for reviewing well production data and division of interest percentages prior to submitting well level data to NSAI assist us in preparing reserve estimates. Our primary internal technical person and other members of management review the reserve estimates prepared by NSAI, including the underlying assumptions and estimates upon which they are based, for accuracy and reasonableness.
Production
In
2014
,
2013
and
2012
, oil and gas produced was approximately
931,100
,
697,700
and
371,300
barrels of oil at an average price of
$80.63
,
$89.40
and
$85.09
per barrel and
2,060.2
,
2,158.5
and
1,989.0
MMcf of gas at an average price of
$4.19
,
$3.46
and
$2.71
per Mcf. Natural gas liquids (NGLs) are aggregated with oil volumes and prices.
In
2014
,
2013
and
2012
, production lifting costs, which exclude ad valorem and severance taxes, were $13.40, $10.35 and $7.47 per BOE related to
393
, 497 and 403 gross wells.
Drilling and Other Exploratory and Development Activities
The following tables set forth the number of gross and net oil and gas wells in which we participated:
|
Gross Wells
|
|||||||||||||||||||||
|
|
Exploratory
|
Development
|
|||||||||||||||||||
|
Year
|
Total
|
Oil
|
Gas
|
Dry
|
Oil
|
Gas
|
Dry
|
||||||||||||||
|
2014
(a)
|
119
|
|
21
|
|
—
|
|
32
|
|
46
|
|
1
|
|
19
|
|
|||||||
|
2013
(b)
|
120
|
|
10
|
|
—
|
|
30
|
|
71
|
|
—
|
|
9
|
|
|||||||
|
2012
|
40
|
|
8
|
|
1
|
|
9
|
|
16
|
|
2
|
|
4
|
|
|||||||
_____________________
|
(a)
|
Of the gross wells drilled in
2014
, we operated 72 or 61 percent. The remaining wells represent our participations in wells operated by others. Dry holes were principally located in Nebraska and Kansas.
|
|
(b)
|
Of the gross wells drilled in
2013
, we operated 55 or 46 percent. The remaining wells represent our participations in wells operated by others. Dry holes were principally located in Nebraska and Kansas.
|
|
Net Wells
|
|||||||||||||||||||||
|
|
Exploratory
|
Development
|
|||||||||||||||||||
|
Year
|
Total
|
Oil
|
Gas
|
Dry
|
Oil
|
Gas
|
Dry
|
||||||||||||||
|
2014
|
57.3
|
|
11.9
|
|
—
|
|
20.1
|
|
13.6
|
|
0.1
|
|
11.6
|
|
|||||||
|
2013
|
46.7
|
|
6.0
|
|
—
|
|
18.2
|
|
16.8
|
|
—
|
|
5.7
|
|
|||||||
|
2012
|
13.0
|
|
3.0
|
|
—
|
|
4.9
|
|
2.6
|
|
0.2
|
|
2.3
|
|
|||||||
Present Activities
At year-end
2014
, there were nine gross wells (2 net) being drilled in North Dakota, Oklahoma and Nebraska and there were 20 gross wells (2 net) in North Dakota and one gross well (1 net) in Oklahoma in some stage of the completion process requiring additional activities prior to generating sales. We conducted exploratory activities related to unproven properties principally in Oklahoma, Kansas and Nebraska by acquiring leases and seismic data, and evaluating leasehold and existing mineral acreage for potential exploratory drilling.
Delivery Commitments
We have no oil or gas delivery commitments.
17
Wells and Acreage
The number of productive wells as of year-end
2014
follows:
|
Productive Wells
(a)
|
|||||
|
|
Gross
|
Net
|
|||
|
Consolidated entities:
|
|
||||
|
Oil
|
582
|
|
117.4
|
|
|
|
Gas
|
339
|
|
56.0
|
|
|
|
Total
|
921
|
|
173.4
|
|
|
|
Ventures accounted for using the equity method:
|
|||||
|
Oil
|
—
|
|
—
|
|
|
|
Gas
|
23
|
|
1.8
|
|
|
|
Total
|
23
|
|
1.8
|
|
|
|
Total consolidated and equity method ventures:
|
|||||
|
Oil
|
582
|
|
117.4
|
|
|
|
Gas
|
362
|
|
57.8
|
|
|
|
Total
|
944
|
|
175.2
|
|
|
_____________________
|
(a)
|
Excludes approximately 1,200 overriding royalty interest wells.
|
At year-end
2014
,
2013
and
2012
, we have royalty interests in
551
,
547
and
542
gross wells. In addition, at year-end
2014
,
2013
and
2012
, we have working interests in
426
,
497
and
403
gross wells.
We did not have any wells with production of synthetic oil, synthetic gas or products of other non-renewable natural resources that are intended to be upgraded into synthetic oil and gas as of year-end
2014
,
2013
or
2012
. Our plugging liabilities are accrued on the balance sheet based on the present value of our estimated future obligation.
At year-end
2014
, our working interests represent approximately 126,000 gross developed acres and
47,000
net developed acres leased from others that are held by production. We had approximately 746,000 gross undeveloped acres and
323,000
net undeveloped acres at year-end
2014
. We have approximately 52,000 net undeveloped acres scheduled to expire in 2015, some of which we are currently evaluating for lease extension.
Markets
Oil and gas revenues are influenced by prices of, and global supply and demand for, oil and gas. These commodities as determined by both regional and global markets depend on numerous factors beyond our control, including seasonality, the condition of the domestic and global economies, political conditions in other oil and gas producing countries, the extent of domestic production and imports of oil and gas, the proximity and capacity of gas pipelines and other transportation facilities, supply and demand for oil and gas and the effects of federal, state and local regulation. The oil and gas industry also competes with other industries in supplying the energy and fuel requirements of industrial, commercial and individual consumers. Oil prices posted their biggest one-day drop in nearly two years in October 2014 due to weakening global demand and the strength of U.S. domestic oil production. In October 2014, the International Energy Agency cut its full-year oil-demand growth forecast to the lowest level in five years. Exploration and development activity continues to be oil focused due to the premium price of oil over gas when comparing energy equivalency and current estimates of domestic gas producing supplies are believed to be sufficient. However, the impact of lower oil prices on well economics could impact future exploration and development activity.
Mineral leasing activity is influenced by changes in commodity prices, the location of our owned mineral interests relative to existing or projected oil and gas reserves, the proximity of successful production efforts to our mineral interests and the evolution of new plays and improvements in drilling and extraction technology.
Competition
The oil and gas industry is highly competitive, and we compete for prospective properties, producing properties, personnel and services with a substantial number of other companies that may have greater resources. Many of these companies explore for, produce and market oil and gas, carry on refining operations and market the end products on a worldwide basis. The primary areas in which we encounter substantial competition are in locating and acquiring desirable leasehold acreage for our drilling and development operations, locating and acquiring attractive producing oil and gas properties, attracting highly-skilled personnel and obtaining purchasers and transporters of the oil and gas we produce. We also face competition from alternative fuel sources, including coal, heating oil, imported LNG, nuclear and other nonrenewable fuel sources, and renewable fuel sources such as wind, solar, geothermal, hydropower and biomass. Competitive conditions may also be substantially
18
affected by various forms of energy legislation and/or regulation considered from time to time by the United States government. It is not possible to predict whether such legislation or regulation may ultimately be adopted or its precise effects upon our future operations. Such laws and regulations may, however, substantially increase the costs of exploring for, developing or producing oil and gas and may prevent or delay the commencement or continuation of our operations.
In locations where our owned mineral interests are close to producing wells and proven reserves, we may have multiple parties interested in leasing our minerals. Conversely, where our mineral interests are in or near areas where reserves have not been discovered, we may receive nominal interest in leasing our minerals. Portions of our Texas and Louisiana minerals are in close proximity to producing wells and proven reserves. Interest in leasing our minerals is correlated with the economics of production which are substantially influenced by current oil and gas prices and improvements in drilling and extraction technologies.
Other Natural Resources
We sell wood fiber from portions of our land, primarily in Georgia, and lease land for recreational uses. Included in our real estate acres is about
102,000
acres of timber we own directly or through ventures. We manage our timberland in accordance with the Sustainable Forestry Initiative
®
program of Sustainable Forestry Initiative, Inc. At year-end
2014
, approximately 99 percent of available acres of our land including ventures, primarily in Georgia, are leased for recreational purposes. Most recreational leases are for a one-year term but may be terminated by us on 30 days’ notice to the lessee. These leases do not inhibit our ability to harvest timber. We have water interests in about 1.5 million acres which includes a 45 percent nonparticipating royalty interest in groundwater produced or withdrawn for commercial purposes or sold from approximately 1.4 million acres in Texas, Louisiana, Georgia and Alabama, and about 20,000 acres of groundwater leases in central Texas. We have not received significant revenues or earnings from these interests.
Competition
We face significant competition from other landowners for the sale of wood fiber. Some of these competitors own similar timber assets that are located in the same or nearby markets. However, due to its weight, the cost for transporting wood fiber long distances is significant, resulting in a competitive advantage for timber that is located reasonably close to paper and building products manufacturing facilities. A significant portion of our wood fiber is reasonably close to such facilities so we expect continued demand for our wood fiber.
Employees
At year-end 2014, we have approximately 150 employees. None of our employees participate in collective bargaining arrangements. We believe we have a good relationship with our employees. On January 29, 2015, we announced the closure of our Fort Worth, Texas office as part of our previously announced review of strategic alternatives, including a review of the oil and gas business, and our plan to reduce oil and gas operating costs. In connection with the announcement, we reduced our total number of employees by approximately 20.
Environmental Regulations
Our operations are subject to federal, state and local laws, regulations and ordinances relating to protection of public health and the environment. Changes to laws and regulations may adversely affect our ability to drill for and produce oil and gas, develop real estate, harvest and sell timber, withdraw groundwater, or may require us to investigate and remediate contaminated properties. These laws and regulations may relate to, among other things, hydrocarbon drilling, hydraulic fracturing practices, protection of timberlands, endangered species, timber harvesting practices, protection and restoration of natural resources, air and water quality, and remedial standards for contaminated property and groundwater. Additionally, these laws may impose liability on property owners or operators for the costs of removal or remediation of hazardous or toxic substances on real property, without regard to whether the owner or operator knew, or was responsible for, the presence of the hazardous or toxic substances. The presence of, or the failure to properly remediate, such substances may adversely affect the value of a property, as well as our ability to sell the property or to borrow funds using that property as collateral or the ability to produce oil and gas from that property. Environmental claims generally would not be covered by our insurance programs.
The particular environmental laws that apply to any given site vary according to the site’s location, its environmental condition, and the present and former uses of the site and adjoining properties. Environmental laws and conditions may result in delays, may cause us to incur substantial compliance or other costs and can prohibit or severely restrict development activity or mineral production in environmentally sensitive regions or areas, which could negatively affect our results of operations.
We own approximately
288
acres in several parcels in or near Antioch, California, portions of which were sites of a paper manufacturing operation that are in remediation. The remediation is being conducted voluntarily with oversight by the California Department of Toxic Substances Control, or DTSC. We have received certificates of completion on all but one
80
acre tract, a portion of which includes subsurface contamination. We estimate the remaining cost to complete remediation activities is about
$529,000
as of year-end
2014
.
19
Oil and gas operations are subject to numerous federal, state and local laws and regulations controlling the generation, use, processing, storage, transportation, disposal and discharge of materials into the environment or otherwise relating to the protection of the environment. These laws and regulations affect our operations and costs as a result of their impact on crude oil and gas exploration, development and production operations. Failure to comply with these laws and regulations may result in the assessment of administrative, civil and criminal penalties, including the assessment of monetary penalties, the imposition of investigatory and remedial obligations, the suspension or revocation of necessary permits, licenses and authorizations, the requirement that additional pollution controls be installed and the issuance of orders enjoining future operations or imposing additional compliance requirements.
Compliance with environmental laws and regulations increases our overall cost of business, but has not had, to date, a material adverse effect on our operations, financial condition or results of operations. It is not anticipated, based on current laws and regulations, that we will be required in the near future to expend amounts (whether for environmental control equipment, modification of facilities or otherwise) that are material in relation to our total exploration and development expenditure program in order to comply with such laws and regulations. However, given that such laws and regulations are subject to change, we are unable to predict the ultimate cost of compliance or the ultimate effect on our operations, financial condition and results of operations.
Legal Structure
Forestar Group Inc. is a Delaware corporation. The following chart presents the ownership structure for our significant subsidiaries. It does not contain all our subsidiaries and ventures, some of which are immaterial entities.
|
Forestar Group Inc.
|
|||||||
|
Forestar (USA) Real Estate Group Inc.
|
|||||||
|
Forestar Petroleum Corporation
|
Forestar Minerals LP
|
Forestar Oil & Gas LLC
|
|||||
Our principal executive offices are located at 6300 Bee Cave Road, Building Two, Suite 500, Austin, Texas 78746-5149. Our telephone number is (512) 433-5200.
Available Information
From our Internet website,
http://www.forestargroup.com
, you may obtain additional information about us including:
|
•
|
our annual reports on Form 10-K, quarterly reports on Form 10-Q, current reports on Form 8-K, including amendments to these reports, and other documents as soon as reasonably practicable after we file them with the Securities and Exchange Commission;
|
|
•
|
beneficial ownership reports filed by officers, directors, and principal security holders under Section 16(a) of the Securities Exchange Act of 1934, as amended (or the “Exchange Act”); and
|
|
•
|
corporate governance information that includes our:
|
|
•
|
corporate governance guidelines,
|
|
•
|
audit committee charter
|
|
•
|
management development and executive compensation committee charter,
|
|
•
|
nominating and governance committee charter,
|
|
•
|
standards of business conduct and ethics,
|
|
•
|
code of ethics for senior financial officers, and
|
|
•
|
information on how to communicate directly with our board of directors.
|
We will also provide printed copies of any of these documents to any stockholder free of charge upon request. In addition, the materials we file with the SEC may be read and copied at the SEC’s Public Reference Room at 100 F Street, NE, Washington, DC 20549. Information about the operation of the Public Reference Room is available by calling the SEC at 1-800-SEC-0330. The SEC also maintains an Internet site (
http://www.sec.gov
) that contains reports, proxy and information statements, and other information that is filed electronically with the SEC.
20
Executive Officers
The names, ages and titles of our executive officers are:
|
Name
|
Age
|
Position
|
||
|
James M. DeCosmo
|
56
|
President and Chief Executive Officer
|
||
|
Bruce F. Dickson
|
61
|
Chief Real Estate Officer
|
||
|
David M. Grimm
|
54
|
Chief Administrative Officer, Executive Vice President, General Counsel and Secretary
|
||
|
Christopher L. Nines
|
43
|
Chief Financial Officer and Treasurer
|
||
|
Phillip J. Weber
|
54
|
Executive Vice President - Water Resources
|
||
James M. DeCosmo has served as our President and Chief Executive Officer since 2006. He served as Group Vice President of Temple-Inland Inc. from 2005 to 2007, and previously served as Vice President, Forest from 2000 to 2005 and as Director of Forest Management from 1999 to 2000. Prior to joining Temple-Inland, he held various land management positions throughout the southeastern United States. Mr. DeCosmo also serves on the Policy Advisory Board of the Harvard Housing Institute.
Bruce F. Dickson has served as our Chief Real Estate Officer since March 2011. From 2009 through March 2011, he was the owner of Fairchild Investments LLC, a real estate investment firm. He served Standard Pacific Corp. as Southeast Region President from 2004 to 2009 and as Austin Division President from 2002 to 2004. From 1991 to 2001, he held region or division president positions with D.R. Horton, Inc., Milburn Homes and Continental Homes. His prior experience includes investment banking and financial services.
David M. Grimm has served as our Chief Administrative Officer since 2007, in addition to holding the offices of General Counsel and Secretary since 2006. Mr. Grimm served Temple-Inland Inc. as Group General Counsel from 2005 to 2006, Associate General Counsel from 2003 to 2005, and held various other legal positions from 1992 to 2003. Prior to joining Temple-Inland Inc., he was an attorney in private practice in Dallas, Texas. Mr. Grimm is also a Certified Public Accountant.
Christopher L. Nines has served as our Chief Financial Officer since 2007. He served Temple-Inland Inc. as Director of Investor Relations from 2003 to 2007 and as Corporate Finance Director from 2001 to 2003. He was Senior Vice President of Finance for ConnectSouth Communications, Inc. from 2000 to 2001.
Phillip J. Weber has served as our Executive Vice President - Water Resources since May 2013 and previously served as Executive Vice President - Real Estate from 2009 to May 2013. He served the Federal National Mortgage Association (Fannie Mae) as Senior Vice President - Multifamily from 2006 to October 2009, as Chief of Staff to the CEO from 2004 to 2006, as Chief of Staff to non-Executive Chairman of the Board and Corporate Secretary from 2005 to 2006, and as Senior Vice President, Corporate Development in 2005.
21
|
Item 1A.
|
Risk Factors.
|
General Risks Related to our Operations
Both our real estate and oil and gas businesses are cyclical in nature.
The operating results of our business segments reflect the general cyclical pattern of each segment. While the cycles of each industry do not necessarily coincide, demand and prices in each may drop substantially during the same period. Real estate development of residential lots is further influenced by new home construction activity, which has been volatile in recent years. Oil and gas may be further influenced by national and international commodity prices, principally for oil and gas. Cyclical downturns may materially and adversely affect our business, liquidity, financial condition and results of operations. All of our operations are impacted by both national and global economic conditions.
The real estate, oil and gas and natural resource industries are highly competitive and a number of entities with which we compete are larger and have greater resources, and competitive conditions may adversely affect our results of operations.
The real estate, oil and gas, and natural resources industries in which we operate are highly competitive and are affected to varying degrees by supply and demand factors and economic conditions, including changes in interest rates, new housing starts, home repair and remodeling activities, credit availability, consumer confidence, unemployment, housing affordability, changes in oil and gas prices, and federal energy policies.
The competitive conditions in the real estate industry may result in difficulties acquiring suitable land at acceptable prices, lower sales volumes and prices, increased development or construction costs and delays in construction and leasing. We compete with numerous regional and local developers for the acquisition, entitlement, and development of land suitable for development. We also compete with national, regional and local home builders who develop real estate for their own use in homebuilding operations, many of which are larger and have greater resources, including greater marketing and technology budgets. Any improvement in the cost structure or service of our competitors will increase the competition we face.
We face intense competition from both major and independent oil and gas companies in seeking to acquire desirable producing properties, seeking new properties for future exploration and seeking the human resource expertise necessary to effectively develop properties. Many of our competitors have financial and other resources substantially greater than ours, and some of them are fully integrated oil and gas companies. These companies may be able to pay more for development prospects and productive oil and gas properties and are able to define, evaluate, bid for, purchase and subsequently drill a greater number of properties and prospects than our financial or human resources permit, effectively reducing our ability to participate in drilling on certain of our acreage as a working interest owner or drill on properties we operate. Our ability to develop and exploit our oil and gas properties and to acquire additional quality properties in the future will depend upon our ability to successfully evaluate, select and acquire suitable properties and join in drilling with reputable operators in this highly competitive environment.
Our business, financial condition and results of operations may be negatively affected by any of these factors.
Our activities are subject to environmental regulations and liabilities that could have a negative effect on our operating results.
Our operations are subject to federal, state and local laws and regulations related to the protection of the environment. Compliance with these provisions or the promulgation of new environmental laws and regulations may result in delays, may cause us to invest substantial funds to ensure compliance with applicable environmental regulations and can prohibit or severely restrict timber harvesting, real estate development or mineral production activity in environmentally sensitive regions or areas.
Significant reductions in cash flow from slowing real estate, oil and gas or other natural resources market conditions could lead to higher levels of indebtedness, limiting our financial and operating flexibility.
We must comply with various covenants contained in our senior secured credit facility, the indentures governing our 3.75% convertible senior notes due 2020 (Convertible Notes), 4.50% senior amortizing notes due 2016 (Senior Amortizing Notes), 8.50% senior secured notes due 2022 (Senior Secured Notes) and any other existing or future debt arrangements. Significant reductions in cash flow from slowing real estate, oil and gas or other natural resources market conditions could require us to increase borrowing levels under our senior secured credit facility or to borrow under other debt arrangements and lead to higher levels of indebtedness, limiting our financial and operating flexibility, and ultimately limiting our ability to comply with our debt covenants, including the maintenance covenants under our senior secured credit facility. Realization of any of these factors could adversely affect our financial condition and results of operations.
22
Restrictive covenants under our senior secured credit facility and indentures governing our 3.75% convertible senior notes, 4.50% senior amortizing notes and 8.50% senior secured notes may limit the manner in which we operate.
Our senior secured credit facility and indentures covering our Convertible Notes, Senior Amortizing Notes and Senior Secured Notes contain various covenants and conditions that limit our ability to, among other things:
|
•
|
incur or guarantee additional debt;
|
|
•
|
pay dividends or make distributions to our stockholders;
|
|
•
|
repurchase or redeem capital stock or subordinated indebtedness;
|
|
•
|
make loans, investments or acquisitions;
|
|
•
|
incur restrictions on the ability of certain of our subsidiaries to pay dividends or to make other payments to us;
|
|
•
|
enter into transactions with affiliates;
|
|
•
|
create liens;
|
|
•
|
merge or consolidate with other companies or transfer all or substantially all of our assets; and
|
|
•
|
transfer or sell assets, including capital stock of subsidiaries.
|
As a result of these covenants, we are limited in the manner in which we conduct our business and we may be unable to engage in favorable business activities or finance future operations or capital needs.
Debt within some of our ventures may not be renewed or may be difficult or more expensive to replace.
As of
December 31, 2014
, our unconsolidated ventures had approximately
$102.2 million
of debt, substantially all of which was non-recourse to us. When debt within our ventures matures, some of our ventures may be unable to renew existing loans or secure replacement financing, or replacement financing may be more expensive. If our ventures are unable to renew existing loans or secure replacement financing, we may be required to contribute additional equity or elect to loan or contribute funds to our ventures, which could increase our risk or increase our borrowings under our senior secured credit facility, or both. If our ventures secure replacement financing that is more expensive, our profits may be reduced.
We may not be able to generate sufficient cash flow to service all of our indebtedness and may be forced to take other actions to satisfy our obligations under our indebtedness, which may not be successful.
As of
December 31, 2014
, we had approximately
$433 million
of consolidated debt outstanding. Our ability to make scheduled payments or to refinance current or future debt obligations depends on our financial and operating performance, which is subject to prevailing economic and competitive conditions and to certain financial, business and other factors beyond our control. We cannot assure you that we will maintain a level of cash flows from operating activities sufficient to permit us to pay the principal, premium, if any, and interest on our indebtedness.
If our cash flows and capital resources are insufficient to fund our debt service obligations, we may be forced to reduce or delay capital expenditures, sell assets or operations, seek additional debt or equity capital or restructure or refinance our indebtedness. We cannot be certain that we would be able to take any of these actions, that these actions would be successful and permit us to meet our scheduled debt service obligations or that these actions would be permitted under the terms of our existing or future debt agreements. In the absence of such operating results and resources, we could face substantial liquidity problems and might be required to dispose of material assets or operations to meet our debt service and other obligations.
Despite current indebtedness levels, we and our subsidiaries may be able to incur substantially more debt.
We and our subsidiaries may be able to incur substantial additional indebtedness in the future. If new debt is added to our and our subsidiaries’ current debt levels, the related risks that we and they now face could intensify.
Our business may suffer if we lose key personnel.
We depend to a large extent on the services of certain key management personnel. These individuals have extensive experience and expertise in our business segments in which they work. The loss of any of these individuals could have a material adverse effect on our operations. We do not maintain key-man life insurance with respect to any of our employees. Our success will be dependent on our ability to continue to employ and retain skilled personnel in each of our business segments.
23
Risks Related to our Real Estate Operations
Reduced demand for new housing or commercial tracts in the markets where we operate could adversely impact our profitability.
The residential development industry is cyclical and is significantly affected by changes in general and local economic conditions, such as employment levels, availability of financing for home buyers, interest rates, consumer confidence and housing demand. Adverse changes in these conditions generally, or in the markets where we operate, could decrease demand for lots for new homes in these areas. Decline in housing demand could negatively affect our real estate development activities, which could result in a decrease in our revenues and earnings.
Furthermore, the market value of undeveloped land and lots held by us, including commercial tracts, can fluctuate significantly as a result of changing economic and real estate market conditions. If there are significant adverse changes in economic or real estate market conditions, we may have to hold land in inventory longer than planned. Inventory carrying costs can be significant and can result in losses or lower returns and adversely affect our liquidity.
Development of real estate entails a lengthy, uncertain and costly entitlement process.
Approval to develop real property entails an extensive entitlement process involving multiple and overlapping regulatory jurisdictions and often requiring discretionary action by local governments. This process is often political, uncertain and may require significant exactions in order to secure approvals. Real estate projects must generally comply with local land development regulations and may need to comply with state and federal regulations. The process to comply with these regulations is usually lengthy and costly, may not result in the approvals we seek, and can be expected to materially affect our real estate development activities, which may adversely affect our business, liquidity, financial condition and results of operations.
Our real estate development operations are currently concentrated in the major markets of Texas, and a significant portion of our undeveloped land holdings are concentrated in Georgia. As a result, our financial results are dependent on the economic growth and strength of those areas.
The economic growth and strength of Texas, where the majority of our real estate development activity is located, are important factors in sustaining demand for our real estate development activities. The recent sharp decline in oil prices may impact near-term job growth and housing demand in Texas, particularly in Houston, where the energy industry has generated significant job growth over the past several years. Further, the future economic growth and real estate development opportunities in broad area around Atlanta, Georgia may be adversely affected if its infrastructure, such as roads, utilities, and schools, are not improved to meet increased demand. There can be no assurance that these improvements will occur. As a result, any adverse impact to the economic growth and health, or infrastructure development, of those areas could materially adversely affect our business, liquidity, financial condition and results of operations.
Our real estate development operations are highly dependent upon national, regional and local home builders.
We are highly dependent upon our relationships with national, regional, and local home builders to purchase lots in our residential developments. If home builders do not view our developments as desirable locations for homebuilding operations, or if home builders are limited in their ability to conduct operations due to economic conditions, our business, liquidity, financial condition and results of operations will be adversely affected.
In addition, we enter into contracts to sell lots to home builders. A home builder could decide to delay purchases of lots in one or more of our developments due to adverse real estate conditions wholly unrelated to our areas of operations, such as the corporate decisions regarding allocation of limited capital or human resources. As a result, we may sell fewer lots and may have lower sales revenues, which could have an adverse effect on our business, liquidity, financial condition and results of operations.
Our strategic partners may have interests that differ from ours and may take actions that adversely affect us.
We enter into strategic alliances or venture relationships as part of our overall strategy for particular developments or regions. While these partners may bring development experience, industry expertise, financing capabilities, local credibility or other competitive attributes, they may also have economic or business interests or goals that are inconsistent with ours or that are influenced by factors unrelated to our business. We may also be subject to adverse business consequences if the market reputation or financial condition of a partner deteriorates, or if a partner takes actions inconsistent with our interest.
When we enter into a venture, we may rely on our venture partner to fund its share of capital commitments to the venture and to otherwise fulfill its operating and financial obligations. Failure of a venture partner to timely satisfy its funding or other obligations to the venture could require us to elect whether to increase our financial or other operating support of the venture in order to preserve our investment, which may reduce our returns or cause us to incur losses, or to not fund such obligations, which may subject the venture and us to adverse consequences or increase our financial exposure in the project.
24
Delays or failures by governmental authorities to take expected actions could reduce our returns or cause us to incur losses on certain real estate development projects.
For certain projects, we rely on governmental utility and special improvement districts (SID) to issue bonds to reimburse us for qualified expenses, such as road and utility infrastructure costs. Bonds must be supported by district tax revenues, usually from ad valorem taxes. Slowing new home sales, decreasing real estate prices or difficult credit markets for bond sales can reduce or delay district bond sale revenues, causing such districts to delay reimbursement of our qualified expenses. Failure to receive timely reimbursement for qualified expenses could adversely affect our cash flows and reduce our returns or cause us to incur losses on certain real estate development projects.
Development and construction risks could impact our profitability.
We may develop and construct single family or multifamily communities through wholly-owned projects or through ventures with unaffiliated parties. Our development and construction activities may be exposed to the following risks:
|
•
|
we may incur construction costs for a property that exceed original estimates due to increased materials, labor or other costs or unforeseen environmental or other conditions, which could make completion of the property uneconomical, and we may not be able to increase rents or sales to compensate for the increase in construction costs;
|
|
•
|
we may be unable to complete construction and/or lease-up of a community on schedule and meet financial goals for development projects;
|
|
•
|
an adverse incident during construction or development could adversely affect our ability to complete construction, conduct operations or cause substantial losses, including personal injury or loss of life, damage to or destruction of property, equipment, pollution or other environmental contamination, regulatory penalties, suspension of operations, and attorney’s fees and other expenses incurred in the prosecution or defense of litigation; and
|
|
•
|
because occupancy rates and rents at a newly developed community may fluctuate depending on a number of factors, including market and economic conditions, we may be unable to meet our profitability goals for that community.
|
Possible difficulty of selling multifamily communities could limit our operational and financial flexibility.
Purchasers may not be willing to pay acceptable prices for multifamily communities that we wish to sell. Furthermore, general uncertainty in real estate markets has resulted in conditions where pricing of some real estate assets may be difficult due to uncertainty with respect to capitalization rates and valuations, among other things. If we are unable to sell multifamily communities or if we can only sell multifamily communities at prices lower than are generally acceptable, then we may have to take on additional leverage in order to provide adequate capital to execute our business strategy.
Increased competition and increased affordability of residential homes could limit our ability to retain residents, lease apartment homes or increase or maintain rents.
Our multifamily communities compete with numerous housing alternatives in attracting residents, including other multifamily communities and single-family rental homes, as well as owner occupied single and multifamily homes. Competitive housing could adversely affect our ability to retain residents, lease apartments and increase or maintain rents.
Failure to succeed in new markets may limit our growth.
We may from time to time commence development activity or make acquisitions outside of our existing market areas if appropriate opportunities arise. Our historical experience in existing markets does not ensure that we will be able to operate successfully in new markets. We may be exposed to a variety of risks if we choose to enter new markets, including, among others:
|
•
|
an inability to accurately evaluate local apartment or housing market conditions and local economies;
|
|
•
|
an inability to obtain land for development or to identify appropriate acquisition opportunities;
|
|
•
|
an inability to hire and retain key personnel;
|
|
•
|
an inability to successfully integrate operations; and
|
|
•
|
lack of familiarity with local governmental and permitting procedures.
|
Risks Related to our Oil and Gas Operations
Volatile oil and gas prices could adversely affect our cash flows and results of operations.
Our cash flows and results of operations are dependent in part on oil and gas prices, which are volatile. During the second half of 2014, NYMEX-WTI oil prices fell from in excess of $100 per Bbl to below $50 per Bbl, the lowest price since 2009. There is a risk that commodity prices could remain depressed for sustained periods. We can be impacted by short-term changes
25
in commodity prices. Oil and gas prices also impact the amounts we receive for selling and renewing our mineral leases. Moreover, oil and gas prices depend on factors we cannot control, such as: changes in foreign and domestic supply and demand for oil and gas; actions by the Organization of Petroleum Exporting Countries; weather; political conditions in other oil-producing countries, including the possibility of insurgency or war in such areas; prices of foreign exports; domestic and international drilling activity; price and availability of alternate fuel sources; the value of the U.S. dollar relative to other major currencies; the level and effect of trading in commodity markets; the effect of worldwide energy conservation measures and governmental regulations. Any substantial or extended decline in the price of oil and gas could have a negative impact on our business, liquidity, financial condition and results of operations.
Our operations are subject to the numerous risks of oil and gas drilling and production activities.
Our oil and gas drilling and production activities are subject to numerous risks, many of which are beyond our control. These risks include the risk of fire, explosions, blow-outs, pipe failure, abnormally pressured formations and environmental hazards. Environmental hazards include oil spills, gas leaks, ruptures, discharges of toxic gases, underground migration and surface spills or mishandling of any toxic fracture fluids, including chemical additives. In addition, title problems, weather conditions and mechanical difficulties or shortages or delays in delivery of drilling rigs and other equipment could negatively affect our operations. If any of these or other similar industry operating risks occur, we could have substantial losses. Substantial losses also may result from injury or loss of life, severe damage to or destruction of property, clean-up responsibilities, environmental damage, regulatory investigation, enforcement actions and penalties, and restriction or suspension of operations. In accordance with industry practice, we maintain insurance against some, but not all, of the risks described above. We cannot assure you that our insurance will be adequate to cover losses or liabilities. Also, we cannot predict the continued availability of insurance at premium levels that justify its purchase.
Our estimated proved reserves are based on many assumptions that may prove to be inaccurate. Any material inaccuracies in these reserve estimates or underlying assumptions will materially affect the quantities and present value of our reserves and may have a material adverse effect on our financial condition.
The process of estimating oil and gas reserves is complex involving decisions and assumptions in evaluating the available geological, geophysical, engineering and economic data. Accordingly, these estimates are imprecise. Actual future production, oil and gas prices, revenues, taxes and quantities of recoverable oil and gas reserves might vary from those estimated. Any variance could materially affect the estimated quantities and present value of proved reserves. In addition, we may adjust estimates of proved reserves to reflect production history, development, prevailing oil and gas prices and other factors, many of which are beyond our control. Such adjustments could negatively impact our ability to obtain financing.
The estimates of our reserves as of
December 31, 2014
are based upon various assumptions about future production levels, prices and costs that may not prove to be correct over time. In particular, estimates of oil and gas reserves, future net revenue from proved reserves and the standardized measure thereof for our oil and gas interests are based on the assumption that future oil and gas prices remain the same as the twelve month first-day-of-the-month average oil and gas prices for the year ended
December 31, 2014
. The average realized sales prices as of such date used for purposes of such estimates were $3.85 per thousand cubic feet (Mcf) of gas and $84.96 per barrel of oil. The
December 31, 2014
estimates also assume that the working interest owners will make future capital expenditures which are necessary to develop and realize the value of proved reserves.
The standardized measure of future net cash flows from our proved reserves is not necessarily the same as the current market value of our estimated reserves.
Any material inaccuracies in reserve estimates or underlying assumptions will materially affect the quantities and present value of our reserves. As required by SEC regulations, we base our present value of estimated future oil and gas revenues on prices and costs in effect at the time of the estimate. However, actual future net cash flows from our properties will be affected by numerous factors not subject to our control and will be affected by factors such as:
|
•
|
decisions and activities of the well operators;
|
|
•
|
supply of and demand for oil and gas;
|
|
•
|
actual prices we receive for oil and gas;
|
|
•
|
actual operating costs;
|
|
•
|
the amount and timing of capital expenditures;
|
|
•
|
the amount and timing of actual production; and
|
|
•
|
changes in governmental regulations or taxation.
|
The timing of production will affect the timing of actual future net cash flows from proved reserves, and thus their actual present value. In addition, the 10% discount factor we use when calculating discounted future net cash flow, which is required
26
by the SEC, may not be the most appropriate discount factor based on interest rates in effect from time to time and risks associated with us or the oil and gas industry in general. Any material inaccuracies in our reserve estimates or underlying assumptions will materially affect the quantities and present value of our reserves.
The lack of availability or high cost of drilling rigs, equipment, supplies, personnel and oil field services could adversely affect our ability to execute our exploitation and development plans on a timely basis and within our budget.
From time to time, there are shortages of drilling rigs, equipment, supplies, oil field services or qualified personnel. During these periods, the costs and delivery times of rigs, equipment and supplies are substantially greater. In addition, the demand for, and wage rates of, qualified drilling rig crews rise as the number of active rigs in service increases. During times and in areas of increased activity, the demand for oilfield services will also likely rise, and the costs of these services will likely increase, while the quality of these services may suffer. If the lack of availability or high cost of drilling rigs, equipment, supplies, oil field services or qualified personnel were particularly severe in any of our areas of operation, we could be materially and adversely affected. Delays could also have an adverse effect on our results of operations, including the timing of the initiation of production from new wells.
Our drilling operations may be curtailed, delayed or canceled as a result of a variety of factors that are beyond our control.
Our drilling operations are subject to a number of risks, including:
|
•
|
unexpected drilling conditions;
|
|
•
|
facility or equipment failure or accidents;
|
|
•
|
adverse weather conditions;
|
|
•
|
natural disasters;
|
|
•
|
title problems;
|
|
•
|
unusual or unexpected geological formations;
|
|
•
|
fires, blowouts, explosions, and spills; and
|
|
•
|
uncontrollable flows of oil and gas or well fluids.
|
The occurrence of any of these events could adversely affect our ability to conduct operations or cause substantial losses, including personal injury or loss of life, damage to or destruction of property, natural resources and equipment, pollution or other environmental contamination, loss of wells, regulatory investigation, enforcement actions or penalties, restrictions or suspension of operations, and attorney’s fees and other expenses incurred in the prosecution or defense of litigation.
We may not find commercially productive oil and gas reservoirs.
Future oil and gas exploration may involve unprofitable efforts, not only from dry hole wells, but from wells that are productive but do not produce sufficient net revenues to return a profit after drilling, operating and other costs. Completion of a well does not assure a profit on the investment or recovery of drilling, completion and operating costs. There is no assurance that new wells we drill will be productive or that we will recover all or any portion of our capital investment in the wells.
Hydraulic fracturing, the process used for extracting oil and gas from shale and other formations, and other subsurface injections have come under increased scrutiny and could be the subject of further regulation that could impact the timing and cost of extractive activities.
Hydraulic fracturing is the primary production method used to extract reserves located in many of the unconventional oil and gas plays in the United States. The United States Environmental Protection Agency (EPA) is currently engaged in a long-term study mandated by Congress regarding the potential impacts of hydraulic fracturing on drinking water resources that could influence federal and state legislative and regulatory developments. Other federal regulatory developments include (i) interpretive memorandum issued by the EPA in February 2014 in regard to underground injection of hydraulic fracturing fluids that use diesel fuel as a fracking fluid or propping agent; (ii) EPA air regulations for the oil and gas industry, issued in August 2012, that require beginning in January 2015 “reduced emissions completion” technology be used after well completion operations involving hydraulic fracturing, as well as annual reporting of well completions and information concerning on-site storage tanks; (iii) proposed rules by EPA in 2014 to tighten the National Ambient Air Quality Standard (NAAQS) for ozone, which could result in additional mandatory controls on oil and gas sector volatile organic compound (VOC) emissions; and (iv) U.S. Department of the Interior, Bureau of Land Management is expected to release new regulations in 2015 regarding well stimulation involving hydraulic fracturing on federal and tribal lands. These regulations were first proposed in May 2012 and then revised and proposed again in May 2013. In July 2014, EPA also published advanced notice of a proposed rulemaking
27
seeking feedback for implementing new regulations for oil and gas production in Indian Country. In addition, in January 2015, EPA announced that it will propose new regulations to further reduce methane emissions from the oil and gas industry, including hydraulic fracturing.
Hydraulic fracturing is also extensively regulated at the state and local level and has been subject to temporary or permanent moratoria in some states, although in 2014, it has not been subject to such moratoria in the states and locations of our oil and gas operations or minerals. Also under public and governmental scrutiny is subsurface injection of water or other produced fluids from drilling or hydraulic fracturing processes due to potential environmental and physical impacts, including possible links to earthquakes. For example, the Railroad Commission of Texas recently adopted new rules for injection wells aimed at reducing the potential for earthquakes.
Depending on legislation that may ultimately be enacted or regulations that may be adopted at the federal, state and local levels, exploration, exploitation and production activities that entail hydraulic fracturing or other subsurface injection could be subject to additional regulation and permitting requirements. Individually or collectively, such new legislation or regulation could lead to operational delays, increased costs and other burdens that could delay the development of oil and gas resources from formations that are not commercial without the use of these techniques. This could have a material effect on our oil and gas production operations and on the operators conducting activities on our minerals and on the cash flows we receive from them.
Our reserves and production will decline from their current levels.
The rate of production from oil and gas properties generally declines as reserves are produced. Our reserves will decline as they are produced which could materially and adversely affect our future cash flow, liquidity and results of operations.
Our oil and gas production may be subject to interruptions that could have a material and adverse effect on us.
Our oil and gas production may be interrupted, or shut in, from time to time for various reasons, including as a result of accidents, natural disasters, weather conditions, loss of gathering, processing, compression or transportation facility access or field labor issues, or intentionally as a result of market conditions such as oil and gas prices that the operators of our mineral leases, whose decisions we do not control, deem uneconomic. If a substantial amount of production is interrupted, our business, liquidity and results of operations could be materially and adversely affected.
We may acquire properties that are not as commercially productive as we initially believed.
From time to time, we seek to acquire oil and gas properties. Although we perform reviews of properties to be acquired in a manner that we believe is consistent with industry practices, reviews of records and properties may not necessarily reveal existing or potential problems, nor may they permit a buyer to become sufficiently familiar with the properties in order to assess fully their deficiencies and potential. Even when problems with a property are identified, we may assume environmental and other risks and liabilities in connection with acquired properties pursuant to the acquisition agreements. Moreover, there are numerous uncertainties inherent in estimating quantities of oil and gas reserves, actual future production rates and associated costs with respect to acquired properties. Actual reserves, production rates and costs may vary substantially from those assumed in our estimates.
We do not insure against all potential losses and could be materially and adversely affected by unexpected liabilities.
The exploration for, and production of, oil and gas can be hazardous, involving natural disasters and other unforeseen occurrences such as blowouts, cratering, fires and loss of well control, which can damage or destroy wells or production facilities, result in injury or death, and damage property and the environment. We maintain insurance against many, but not all, potential losses or liabilities arising from operations on our property in accordance with what we believe are customary industry practices and in amounts and at costs that we believe to be prudent and commercially practicable. In addition, we require third party operators to maintain customary and commercially practicable types and limits of insurance, but potential losses or liabilities may not be covered by such third party’s insurance which may subject us to liability as the mineral estate owner. The occurrence of any of these events and any costs or liabilities incurred as a result of such events could have a material adverse effect on our business, financial condition and results of operations.
We have limited control over the activities on properties we do not operate and are unable to ensure their proper operation and profitability.
Many of the properties in which we have working interests are operated by other companies and involve third-party working interest owners. As a result, we have limited ability to influence or control the operation or future development of such properties, including compliance with environmental, safety and other regulations, or the amount of capital expenditures that we will be required to fund with respect to such properties. Moreover, we are dependent on the other working interest owners of such projects to fund their contractual share of the capital expenditures of such projects. These limitations and our
28
dependence on the operator and other working interest owners for these projects could cause us to incur unexpected future costs and materially and adversely affect our business, liquidity, financial condition and results of operations.
In addition, operators determine when and where to drill wells and we have no influence over these decisions. The success and timing of the drilling and development activities on our non-operated properties therefore depends upon a number of factors currently outside of our control, including the operator’s timing and amount of capital expenditures, expertise and financial resources, inclusion of other participants in drilling wells and use of technology, and the operators of our properties may not have the same financial and other resources as other oil and gas companies with whom they compete. Further, new wells may not be productive or may not produce at a level to enable us to recover all or any portion of our capital investment where we have a non-operating working interest.
The ability to sell and deliver oil and gas produced from wells on our mineral leasehold interests could be materially and adversely affected if adequate gathering, processing, compression and transportation services are not obtained.
The sale of oil and gas produced from wells on our mineral leasehold interests depends on a number of factors beyond our control, including the availability, proximity and capacity of, and costs associated with, gathering, processing, compression and transportation facilities owned or operated by third parties. These facilities may be temporarily unavailable due to market conditions, mechanical reasons or other factors or conditions, and may not be available in the future on terms the operator considers acceptable, if at all. In addition, federal, state and provincial governments in the United States and Canada have issued or are considering issuance of additional regulations governing transportation of crude oil and its byproducts by rail. Such regulations could increase the cost of transportation or limit the availability of suitable rail cars or both. Any significant change in market or other conditions affecting these facilities or the availability of these facilities, including due to the failure or inability to obtain access to these facilities on terms acceptable to the operator or at all, could materially and adversely affect our business, liquidity, financial condition and results of operations.
A significant portion of our Louisiana owned net mineral acres are subject to prescription of non-use under Louisiana law.
A significant portion of our Louisiana owned net mineral acres were severed from surface ownership and retained by creation of one or more mineral servitudes shortly before our 2007 spin-off. Under Louisiana law, a mineral servitude that is not producing minerals or which has not been the subject of good-faith drilling operations will cease to burden the property upon the tenth anniversary of the date of its creation. Upon such event, the mineral rights effectively will revert to the surface owner and we will no longer own the right to lease, explore for or produce minerals from such acreage.
Weather, climate and climate change regulation may have a significant and adverse impact on us.
Demand for gas is, to a significant degree, dependent on weather and climate, which impacts, among other things, the price we receive for the commodities produced from gas wells and, in turn, our cash flow and results of operations. For example, relatively warm temperatures during a winter season generally result in relatively lower demand for gas, higher inventory (as less gas is used to heat residences and businesses) and, as a result, relatively lower prices for gas production.
Drilling for and production of oil and gas also can be impacted by weather and climate. Specifically, cold temperatures or significant precipitation or both can restrict operation of machinery or access to well sites by personnel or equipment. These restrictions may reduce our production and, in turn, our cash flow and results of operations.
The EPA has proposed regulations for the purpose of restricting greenhouse gas emissions from stationary sources. Such regulatory and legislative proposals to restrict greenhouse gas emissions, or to address climate change generally, could increase our operating costs as well operators incur costs to comply with new rules. Such increased costs may include installation of new or expanded emissions control systems, purchase of allowances to authorize greenhouse gas emissions, and increased taxes. Regulation of greenhouse gases may also occur at the state level. Depending on legislation that may ultimately be enacted or regulations that may be adopted at the Federal or state level, there could be increased costs, operational delays and other burdens affecting the oil and gas industry. This could have a material effect on our oil and gas production operations and on the operators conducting activities on our properties and on cash flows we receive from them.
Risks Related to our Other Natural Resources Operations
Our water interests may require governmental permits, the consent of third parties and/or completion of significant transportation infrastructure prior to commercialization, all of which are dependent on the actions of others.
Many jurisdictions require governmental permits to withdraw and transport water for commercial uses, the granting of which may be subject to discretionary determinations by such jurisdictions regarding necessity. In addition, we do not own the executory rights related to our non-participating royalty interest, and as a result, third-party consent from the executor rights owner(s) would be required prior to production. The process to obtain permits can be lengthy, and governmental jurisdictions or third parties from whom we seek permits or consent may not provide the approvals we seek. We may be unable to secure
29
buyers at commercially economic prices for water that we have a right to extract and transport, and transportation infrastructure across property not owned or controlled by us is required for transport of water prior to commercial use. Such infrastructure can require significant capital and may also require the consent of third parties. We may not have cost effective means to transport water from property we own, lease or manage to buyers. As a result, we may lose some or all of our investment in water assets, or our returns may be diminished.
Our ability to harvest and deliver timber may be affected by our sales of timberland and may be subject to other limitations, which could adversely affect our operations.
Sales of our timberland reduce the amount of timber that we have available for harvest. In addition, weather conditions, timber growth cycles, access limitations, availability of contract loggers and haulers, and regulatory requirements associated with the protection of wildlife and water resources may restrict harvesting of timberlands as may other factors, including damage by fire, insect infestation, disease, prolonged drought, flooding and other natural disasters. Although damage from such natural causes usually is localized and affects only a limited percentage of the timber, there can be no assurance that any damage affecting our timberlands will in fact be so limited. As is common in the forest products industry, we do not maintain insurance coverage with respect to damage to our timberlands.
The revenues, income and cash flow from operations for our other natural resources segment are dependent to a significant extent on the pricing of our products and our continued ability to harvest timber at adequate levels.
Other Risks
The market price of and trading volume of our shares of common stock may be volatile.
The market price of our shares of common stock has fluctuated substantially and may continue to fluctuate in response to the following factors, many of which are beyond our control:
|
•
|
fluctuations in our operating results, including results that vary from expectations of management, analysts and investors;
|
|
•
|
changes in investors’ and analysts’ perception of the business risks and conditions of our business;
|
|
•
|
broader market fluctuations;
|
|
•
|
general financial, economic and political conditions;
|
|
•
|
regulatory changes affecting our industry generally or our businesses and operations;
|
|
•
|
environmental regulations and liabilities that could have a negative effect on our operating results;
|
|
•
|
announcements of strategic developments, acquisitions, financings and other material events by us or our competitors;
|
|
•
|
the sale of a substantial number of shares of our common stock held by existing security holders in the public market; and
|
|
•
|
general conditions in the real estate and mineral resources industries.
|
The stock markets in general have experienced extreme volatility that has at times been unrelated to the operating performance of particular companies. These broad market fluctuations may adversely affect the trading price of our common stock, make it difficult to predict the market price of our common stock in the future and cause the value of our common stock to decline.
Provisions of Delaware law, our charter documents, our shareholder rights plan, the indentures governing the 3.75% convertible senior notes, 8.50% senior secured notes and the stock purchase contracts under the 6.00% tangible equity units may impede or discourage a takeover, which could cause the market price of our common stock to decline.
We are a Delaware corporation, and the anti-takeover provisions of Delaware law impose various impediments to the ability of a third party to acquire control of us, even if a change in control would be beneficial to our existing stockholders. In addition, our board of directors has the power, without stockholder approval, to designate the terms of one or more series of preferred stock and issue shares of preferred stock. We have implemented a shareholders’ rights plan, called a poison pill, which would substantially reduce or eliminate the expected economic benefit to an acquirer from acquiring us in a manner or terms not approved by our board of directors. These and other impediments to third party acquisition or change of control could limit the price investors are willing to pay for shares of our common stock, which could in turn reduce the market price of our common stock. In addition, upon the occurrence of a fundamental change under the terms of the convertible senior notes, the senior secured notes or the tangible equity units, certain repurchase rights and early settlement rights would be triggered under the indentures governing the convertible senior notes, senior secured notes and the stock purchase contracts under the 6.00% tangible equity units, respectively. In such event, the increase of the conversion or early settlement rate, as applicable, in
30
connection with certain make-whole fundamental change transactions under the terms of the convertible senior notes or the stock purchase contracts, respectively, could discourage a potential acquirer.
|
Item 1B.
|
Unresolved Staff Comments.
|
None.
|
Item 2.
|
Properties.
|
Our principal executive offices are located in Austin, Texas, where we lease approximately 32,000 square feet of office space. We also lease office space in Atlanta, Georgia; Dallas, Texas; Denver, Colorado; and Lufkin, Texas. We believe these offices are suitable for conducting our business.
For a description of our properties in our real estate, oil and gas and other natural resources segments, see “Business — Real Estate”, “Business — Oil and Gas” and “Business — Other Natural Resources”, respectively, in Part I, Item 1 of this Annual Report on Form 10-K.
|
Item 3.
|
Legal Proceedings.
|
We are involved directly or through ventures in various legal proceedings that arise from time to time in the ordinary course of doing business. We believe we have established adequate reserves for any probable losses and that the outcome of any of the proceedings should not have a material adverse effect on our financial position or long-term results of operations or cash flows. It is possible, however, that charges related to these matters could be significant to results of operations or cash flow in any single accounting period.
|
Item 4.
|
Mine Safety Disclosures.
|
Not Applicable.
|
Item 5.
|
Market for Registrant’s Common Equity, Related Stockholder Matters and Issuer Purchases of Equity Securities.
|
Market Information
Our common stock is traded on the New York Stock Exchange. The high and low sales prices in each quarter in
2014
and
2013
were:
|
|
2014
|
2013
|
|||||||||||||
|
|
Price Range
|
Price Range
|
|||||||||||||
|
|
High
|
Low
|
High
|
Low
|
|||||||||||
|
First Quarter
|
$
|
21.30
|
|
$
|
17.67
|
|
$
|
22.82
|
|
$
|
16.99
|
|
|||
|
Second Quarter
|
$
|
19.22
|
|
$
|
16.70
|
|
$
|
24.68
|
|
$
|
19.44
|
|
|||
|
Third Quarter
|
$
|
20.10
|
|
$
|
17.72
|
|
$
|
22.57
|
|
$
|
19.51
|
|
|||
|
Fourth Quarter
|
$
|
17.68
|
|
$
|
14.42
|
|
$
|
23.59
|
|
$
|
18.42
|
|
|||
|
For the Year
|
$
|
21.30
|
|
$
|
14.42
|
|
$
|
24.68
|
|
$
|
16.99
|
|
|||
Shareholders
Our stock transfer records indicated that as of
March 2, 2015
, there were approximately 3,374 holders of record of our common stock.
31
Dividend Policy
We currently intend to retain any future earnings to support our business and do not anticipate paying cash dividends in the foreseeable future. The declaration and payment of any future dividends will be at the discretion of our Board of Directors after taking into account various factors, including without limitation, our financial condition, earnings, capital requirements of our business, the terms of any credit agreements or indentures to which we may be a party at the time, legal requirements, industry practice, and other factors that our Board of Directors deems relevant.
Issuer Purchases of Equity Securities
(a)
|
Period
|
Total
Number of
Shares
Purchased
(b)
|
Average
Price Paid
per Share
|
Total Number
of Shares
Purchased as
Publicly
Announced
Plan or
Programs
|
Maximum
Number of
Shares That
May Yet be
Purchased
Under the
Plans or
Programs
|
||||||||
|
Month 10 (10/1/2014 — 10/31/2014)
|
—
|
|
$
|
—
|
|
—
|
|
4,997,855
|
|
|||
|
Month 11 (11/1/2014 — 11/30/2014)
|
1,058,368
|
|
$
|
17.09
|
|
1,058,368
|
|
3,939,487
|
|
|||
|
Month 12 (12/1/2014 — 12/31/2014)
|
433,785
|
|
$
|
15.04
|
|
432,819
|
|
3,506,668
|
|
|||
|
Total
|
1,492,153
|
|
$
|
16.49
|
|
1,491,187
|
|
|||||
_____________________
|
(a)
|
On February 11, 2009, we announced that our Board of Directors authorized the repurchase of up to 7,000,000 shares of our common stock. We have purchased 3,493,332 shares under this authorization, which has no expiration date. We have no repurchase plans or programs that expired during the period covered by the table above and no repurchase plans or programs that we intend to terminate prior to expiration or under which we no longer intend to make further purchases.
|
|
(b)
|
Includes shares withheld to pay taxes in connection with vesting of restricted stock awards and exercises of stock options.
|
Performance Graph
Our peer group consists of a combination of real estate and oil and gas companies: Alexander & Baldwin, Inc., AV Homes Inc., Approach Resources, Inc., Consolidated-Tomoka Land Co., Cousins Properties Incorporated, Contango Oil and Gas Co., Goodrich Petroleum Corp., Magnum Hunter Resources Corp., Matador Resources Co., Penn Virginia Corp., Petroquest Energy Inc., Post Properties, Inc., Potlatch Corporation, PS Business Parks, Inc., Resolute Energy Corp., The St. Joe Company, and Tejon Ranch Co. There were no changes to the peer group in 2014 except for the removal of BRE Properties, Inc. following its acquisition by a larger company in April 2014.
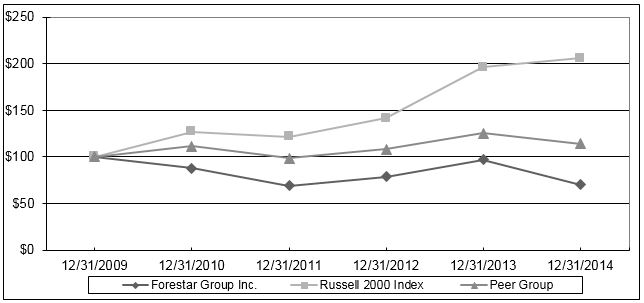
Pursuant to SEC rules, returns of each of the companies in the Peer Index are weighted according to the respective company’s stock market capitalization at the beginning of each period for which a return is indicated.
32
|
Item 6.
|
Selected Financial Data.
|
|
|
For the Year
|
||||||||||||||||||
|
|
2014
|
2013
|
2012
|
2011
|
2010
|
||||||||||||||
|
|
(In thousands, except per share amount)
|
||||||||||||||||||
|
Revenues:
|
|||||||||||||||||||
|
Real estate
|
$
|
213,112
|
|
$
|
248,011
|
|
$
|
120,115
|
|
$
|
106,168
|
|
$
|
68,269
|
|
||||
|
Oil and gas
|
84,300
|
|
72,313
|
|
44,220
|
|
24,448
|
|
24,790
|
|
|||||||||
|
Other natural resources
|
9,362
|
|
10,721
|
|
8,256
|
|
4,957
|
|
8,301
|
|
|||||||||
|
Total revenues
|
$
|
306,774
|
|
$
|
331,045
|
|
$
|
172,591
|
|
$
|
135,573
|
|
$
|
101,360
|
|
||||
|
Segment earnings (loss):
|
|||||||||||||||||||
|
Real estate
(a)
|
$
|
96,906
|
|
$
|
68,454
|
|
$
|
53,582
|
|
$
|
(25,704
|
)
|
$
|
(4,634
|
)
|
||||
|
Oil and gas
(b)
|
(22,686
|
)
|
18,859
|
|
26,608
|
|
19,783
|
|
22,846
|
|
|||||||||
|
Other natural resources
|
5,499
|
|
6,507
|
|
29
|
|
(1,867
|
)
|
4,995
|
|
|||||||||
|
Total segment earnings (loss)
|
79,719
|
|
93,820
|
|
80,219
|
|
(7,788
|
)
|
23,207
|
|
|||||||||
|
Items not allocated to segments:
|
|||||||||||||||||||
|
General and administrative expense
(c)
|
(21,229
|
)
|
(20,597
|
)
|
(25,176
|
)
|
(20,110
|
)
|
(17,341
|
)
|
|||||||||
|
Share-based compensation expense
|
(3,417
|
)
|
(16,809
|
)
|
(14,929
|
)
|
(7,067
|
)
|
(11,596
|
)
|
|||||||||
|
Gain on sale of assets
(d)
|
—
|
|
—
|
|
16
|
|
61,784
|
|
28,607
|
|
|||||||||
|
Interest expense
|
(30,286
|
)
|
(20,004
|
)
|
(19,363
|
)
|
(17,012
|
)
|
(16,446
|
)
|
|||||||||
|
Other corporate non-operating income
|
453
|
|
119
|
|
191
|
|
368
|
|
1,164
|
|
|||||||||
|
Income before taxes
|
25,240
|
|
36,529
|
|
20,958
|
|
10,175
|
|
7,595
|
|
|||||||||
|
Income tax expense
(e)
|
(8,657
|
)
|
(7,208
|
)
|
(8,016
|
)
|
(3,021
|
)
|
(2,470
|
)
|
|||||||||
|
Net income attributable to Forestar Group Inc.
|
$
|
16,583
|
|
$
|
29,321
|
|
$
|
12,942
|
|
$
|
7,154
|
|
$
|
5,125
|
|
||||
|
Diluted net income per common share
|
$
|
0.38
|
|
$
|
0.80
|
|
$
|
0.36
|
|
$
|
0.20
|
|
$
|
0.14
|
|
||||
|
Average diluted shares outstanding
(f)
|
43,596
|
|
36,813
|
|
35,482
|
|
35,781
|
|
36,377
|
|
|||||||||
|
At year-end:
|
|||||||||||||||||||
|
Assets
|
$
|
1,258,199
|
|
$
|
1,172,152
|
|
$
|
918,434
|
|
$
|
794,857
|
|
$
|
789,324
|
|
||||
|
Debt
|
432,744
|
|
357,407
|
|
294,063
|
|
221,587
|
|
221,589
|
|
|||||||||
|
Noncontrolling interest
|
2,540
|
|
5,552
|
|
4,059
|
|
1,686
|
|
4,715
|
|
|||||||||
|
Forestar Group Inc. shareholders’ equity
|
707,202
|
|
709,845
|
|
529,488
|
|
509,526
|
|
509,564
|
|
|||||||||
|
Ratio of total debt to total capitalization
|
38
|
%
|
33
|
%
|
36
|
%
|
30
|
%
|
30
|
%
|
|||||||||
_____________________
|
(a)
|
Real estate segment earnings (loss) include non-cash impairments of $399,000 in 2014, $1,790,000 in 2013, $45,188,000 in 2011 and $11,271,000 in 2010. Segment earnings also includes gain on sale of assets of $25,981,000 in 2014 and $25,273,000 in 2012. Real estate segment earnings (loss) also include the effects of net (income) loss attributable to noncontrolling interests.
|
|
(b)
|
Oil and gas segment earnings (loss) includes non-cash impairment charges of $17,130,000 and $473,000 for unproved leasehold interests in 2014 and 2013. Also, 2014 includes $15,535,000 for non-cash impairment charges related to oil and gas proved properties, partially offset by gain on sale of oil and gas properties principally in North Dakota and Oklahoma for $8,526,000.
|
|
(c)
|
In 2012, general and administrative expense includes $6,323,000 in costs associated with our acquisition of Credo and in 2011 includes $3,187,000 associated with proposed private debt offerings that we withdrew as a result of deterioration of terms available to us in the credit markets.
|
|
(d)
|
Gain on sale of assets in 2011 and 2010 represents gains from timberland sales in accordance with our strategic initiatives announced first quarter 2009 and completed in 2011.
|
|
(e)
|
In 2013, income tax expense includes a benefit from recognition of
$6,326,000
of previously unrecognized tax benefits upon lapse of the statute of limitations for a previously reserved tax position.
|
|
(f)
|
Our 2014 weighted average diluted shares outstanding include 7,857,000 million shares issuable upon settlement of the prepaid stock purchase contract component of our
6.00%
tangible equity units, issued November 27, 2013.
|
33
Item 7.
Management’s Discussion and Analysis of Financial Condition and Results of Operations.
Caution Concerning Forward-Looking Statements
This Annual Report on Form 10-K and other materials we have filed or may file with the Securities and Exchange Commission contain “forward-looking statements” within the meaning of the federal securities laws. These forward-looking statements are identified by their use of terms and phrases such as “believe,” “anticipate,” “could,” “estimate,” “likely,” “intend,” “may,” “plan,” “expect,” and similar expressions, including references to assumptions. These statements reflect our current views with respect to future events and are subject to risk and uncertainties. We note that a variety of factors and uncertainties could cause our actual results to differ significantly from the results discussed in the forward-looking statements. Factors and uncertainties that might cause such differences include, but are not limited to:
|
•
|
general economic, market or business conditions in Texas or Georgia, where our real estate activities are concentrated, or on a national or global scale;
|
|
•
|
our ability to achieve some or all of our strategic initiatives;
|
|
•
|
the opportunities (or lack thereof) that may be presented to us and that we may pursue;
|
|
•
|
our ability to hire and retain key personnel;
|
|
•
|
significant customer concentration;
|
|
•
|
future residential, multifamily or commercial entitlements, development approvals and the ability to obtain such approvals;
|
|
•
|
obtaining approvals of reimbursements and other payments from special improvement districts and timing of such payments;
|
|
•
|
accuracy of estimates and other assumptions related to investment in and development of real estate, the expected timing and pricing of land and lot sales and related cost of real estate sales, impairment of long-lived assets, income taxes, share-based compensation, oil and gas reserves, revenues, capital expenditures and lease operating expense accruals associated with our oil and gas working interests, and depletion of our oil and gas properties;
|
|
•
|
the levels of resale housing inventory in our mixed-use development projects and the regions in which they are located;
|
|
•
|
fluctuations in costs and expenses, including impacts from shortages in materials or labor;
|
|
•
|
demand for new housing, which can be affected by a number of factors including the availability of mortgage credit, job growth, fluctuations in commodity prices;
|
|
•
|
demand for multifamily communities, which can be affected by a number of factors including local markets and economic conditions;
|
|
•
|
competitive actions by other companies;
|
|
•
|
changes in governmental policies, laws or regulations and actions or restrictions of regulatory agencies;
|
|
•
|
risks associated with oil and gas exploration, drilling and production activities;
|
|
•
|
fluctuations in oil and gas commodity prices;
|
|
•
|
government regulation of exploration and production technology, including hydraulic fracturing;
|
|
•
|
the results of financing efforts, including our ability to obtain financing with favorable terms, or at all;
|
|
•
|
our ability to make interest and principal payments on our debt and satisfy the other covenants contained in our senior secured credit facility, indentures and other debt agreements;
|
|
•
|
our partners’ ability to fund their capital commitments and otherwise fulfill their operating and financial obligations;
|
|
•
|
the effect of limitations, restrictions and natural events on our ability to harvest and deliver timber;
|
|
•
|
inability to obtain permits for, or changes in laws, governmental policies or regulations affecting, water withdrawal or usage;
|
|
•
|
the final resolutions or outcomes with respect to our contingent and other liabilities related to our business; and
|
|
•
|
our ability to execute our growth strategy and deliver acceptable returns from acquisitions and other investments.
|
34
Other factors, including the risk factors described in Item 1A of this Annual Report on Form 10-K, may also cause actual results to differ materially from those projected by our forward-looking statements. New factors emerge from time to time and it is not possible for us to predict all such factors, nor can we assess the impact of any such factor on our business or the extent to which any factor, or combination of factors, may cause results to differ materially from those contained in any forward-looking statement.
Any forward-looking statement speaks only as of the date on which such statement is made, and, except as required by law, we expressly disclaim any obligation or undertaking to disseminate any updates or revisions to any forward-looking statement to reflect events or circumstances after the date on which such statement is made or to reflect the occurrence of unanticipated events.
Strategy
Our strategy is:
|
•
|
Recognizing and responsibly delivering the greatest value from every acre; and
|
|
•
|
Growing through strategic and disciplined investments.
|
2014 Strategic Initiatives
On February 13, 2014, we announced
Growing FORward
, new strategic initiatives designed to further enhance shareholder value by:
|
•
|
Growing segment earnings through strategic and disciplined investments,
|
|
•
|
Increasing returns, and
|
|
•
|
Repositioning non-core assets.
|
On December 8, 2014, we announced that our Board of Directors, working together with our management team and financial advisor, is exploring strategic alternatives to enhance shareholder value. This analysis includes a review of alternatives with respect to our oil and gas business. There is no assurance that exploration of strategic alternatives will result in any transaction being pursued or consummated.
Results of Operations for the Years Ended
2014
,
2013
and
2012
A summary of our consolidated results by business segment follows:
|
|
For the Year
|
||||||||||
|
|
2014
|
2013
|
2012
|
||||||||
|
|
(In thousands)
|
||||||||||
|
Revenues:
|
|||||||||||
|
Real estate
|
$
|
213,112
|
|
$
|
248,011
|
|
$
|
120,115
|
|
||
|
Oil and gas
|
84,300
|
|
72,313
|
|
44,220
|
|
|||||
|
Other natural resources
|
9,362
|
|
10,721
|
|
8,256
|
|
|||||
|
Total revenues
|
$
|
306,774
|
|
$
|
331,045
|
|
$
|
172,591
|
|
||
|
Segment earnings (loss):
|
|||||||||||
|
Real estate
|
$
|
96,906
|
|
$
|
68,454
|
|
$
|
53,582
|
|
||
|
Oil and gas
|
(22,686
|
)
|
18,859
|
|
26,608
|
|
|||||
|
Other natural resources
|
5,499
|
|
6,507
|
|
29
|
|
|||||
|
Total segment earnings
|
79,719
|
|
93,820
|
|
80,219
|
|
|||||
|
Items not allocated to segments:
|
|||||||||||
|
General and administrative expense
|
(21,229
|
)
|
(20,597
|
)
|
(25,176
|
)
|
|||||
|
Share-based compensation expense
|
(3,417
|
)
|
(16,809
|
)
|
(14,929
|
)
|
|||||
|
Gain on sale of assets
|
—
|
|
—
|
|
16
|
|
|||||
|
Interest expense
|
(30,286
|
)
|
(20,004
|
)
|
(19,363
|
)
|
|||||
|
Other corporate non-operating income
|
453
|
|
119
|
|
191
|
|
|||||
|
Income before taxes
|
25,240
|
|
36,529
|
|
20,958
|
|
|||||
|
Income tax expense
|
(8,657
|
)
|
(7,208
|
)
|
(8,016
|
)
|
|||||
|
Net income attributable to Forestar Group Inc.
|
$
|
16,583
|
|
$
|
29,321
|
|
$
|
12,942
|
|
||
35
Significant aspects of our results of operations follow:
2014
|
•
|
Real estate segment earnings benefited from increased undeveloped land sales generating earnings of $29,895,000, a $10,476,000 gain associated with a non-monetary exchange of leasehold timber rights for 5,400 acres of undeveloped land with a partner in a consolidated venture, a $7,610,000 gain associated with the acquisition of our partner's interest in the Eleven multifamily venture, higher residential lot sales activity and a $6,577,000 gain associated with $46,500,000 of bond proceeds we received from the Cibolo Canyons Special Improvement District.
|
|
•
|
Oil and gas segment earnings (loss) decreased principally due to non-cash impairment charges of $17,130,000 for unproved leasehold interests and $15,535,000 for proved oil and gas properties, higher exploration costs and lower oil prices, as well as lower oil and gas production volumes associated with royalty interests and reduced lease bonus and delay rental payments received from our owned mineral interests.
These factors were partially offset by higher working interest production volumes attributable to our exploration and production operations and gains of $8,526,000 primarily related to the sale of oil and gas properties in Oklahoma and North Dakota
.
|
|
•
|
Other natural resources segment earnings declined principally due to lower fiber volumes, which were partially offset by gains of
$3,531,000
primarily related to partial terminations of a timber lease related to land sold from a consolidated venture near Atlanta, Georgia.
|
|
•
|
Share-based compensation decreased principally as result of a 28% decrease in our stock price since year-end 2013 and its impact on cash-settled awards.
|
|
•
|
Interest expense increased primarily due to higher average borrowing rates and increased debt outstanding.
|
2013
|
•
|
Real estate segment earnings benefited from the sale of Promesa, a 289-unit multifamily property we developed in Austin, for $41,000,000, which generated approximately $10,881,000 in segment earnings. In addition, segment earnings also benefited from increased residential lot sales activity, residential and commercial tract sales and interest income associated with a loan we hold secured by a mixed-use community in Houston.
|
|
•
|
Oil and gas segment earnings decreased principally due to lower oil and gas production volumes associated with royalty interests and reduced lease bonus and delay rental payments received from our owned mineral interests, which were partially offset by higher working interest production volumes and prices attributable to our exploration and production operations principally as result of our acquisition of Credo in third quarter 2012
.
|
|
•
|
Other natural resources segment earnings benefited from higher levels of timber harvesting activity driven by increased customer demand compared to 2012. In addition, segment earnings also benefited from a $3,828,000 gain from a partial termination of a timber lease related to land sold from a consolidated venture near Atlanta, Georgia.
|
|
•
|
Share-based compensation increased principally as result of our higher stock price in 2013 and its impact on cash-settled awards.
|
2012
|
•
|
Real estate segment earnings benefited from a $11,675,000 gain from the sale of our 25 percent ownership interest in Palisades West LLC, a $10,180,000 gain from the sale of Broadstone Memorial, a 401-unit multifamily investment property in Houston, $8,247,000 in earnings from an unconsolidated venture’s sale of Las Brisas, a 414-unit multifamily property near Austin, a $3,401,000 gain from a consolidated venture’s bulk sale of 800 acres near Dallas, and increased residential lot and commercial tract sales activity.
|
|
•
|
Oil and gas segment earnings benefited from increased lease bonus revenues, higher production volume and earnings attributable to exploration and production operations from our acquisition of Credo in third quarter 2012, partially offset by lower oil and gas prices and increased depletion and production severance taxes due to higher production volumes.
|
|
•
|
Other natural resources segment earnings increased principally as a result of higher levels of harvesting activity.
|
|
•
|
General and administrative expense includes $6,323,000 in transaction costs paid to outside advisors associated with our acquisition of Credo in 2012.
|
|
•
|
Share-based compensation increased principally as a result of our higher stock price in 2012 and its impact on cash-settled awards.
|
36
|
•
|
Interest expense includes a $4,448,000 loss on extinguishment of debt in connection with amendment and extension of our term loan.
|
Current Market Conditions
Sales of new U.S. single-family homes rose to a six-year high in September 2014, on a seasonally adjusted basis, but a sharp downward revision of new homes sold in November 2014 when compared with November 2013 indicates the housing recovery remains tentative. Inventories of new homes are at historically low levels in many areas. In addition to declining finished lot inventories, limited supply of economically developable raw land has increased demand for our developed lots. However, national and global economic weakness and uncertainty continue to threaten a full recovery in the housing market, despite low interest rates. For 2014, home builders and developers started construction on 1.01 million new homes and apartments, an 8.8 percent increase compared to 2013, the first time construction has topped one million new homes since 2005. However, total annual housing starts remain well below the long-term historical average. Multifamily market conditions continue to be strong, with many markets experiencing healthy occupancy levels and positive rent growth. This improvement has been driven primarily by limited housing inventory, reduced single-family mortgage credit availability, and the increased propensity to rent among the 18 to 34 year old demographic of the U.S. population.
Oil prices posted their biggest one-day drop in nearly two years on October 14, 2014 and declined by an additional 35 percent through year-end 2014 due to weakening global demand and the strength of U.S. domestic oil production. In October 2014, the International Energy Agency cut its full-year oil-demand growth forecast to the lowest level in five years. Exploration and development activity continues to be oil focused due to the premium price of oil over gas when comparing energy equivalency and current estimates of domestic gas producing supplies are believed to be sufficient. The continuation of lower oil prices would likely negatively impact future exploration and development activity.
Gas prices are up 17 percent from year ago levels, but are significantly lower than realized prices over the last decade. Prolonged cold weather throughout the 2013 - 2014 heating season has taken gas storage below the previous five year average (2009 - 2013), causing gas prices to recover from their lows of a year ago.
Business Segments
We manage our operations through three business segments:
|
•
|
Real estate,
|
|
•
|
Oil and gas, and
|
|
•
|
Other natural resources.
|
We evaluate performance based on segment earnings (loss) before unallocated items and income taxes. Segment earnings (loss) consist of operating income (loss), equity in earnings of unconsolidated ventures’, gain on sale of assets, interest income on loans secured by real estate and net (income) loss attributable to noncontrolling interests. Items not allocated to our business segments consist of general and administrative expenses, share-based compensation, gain on sale of strategic timberland, interest expense and other corporate non-operating income and expense. The accounting policies of the segments are the same as those described in the accounting policy note to the consolidated financial statements.
We operate in cyclical industries. Our operations are affected to varying degrees by supply and demand factors and economic conditions including changes in interest rates, availability of mortgage credit, consumer and home builder sentiment, new housing starts, real estate values, employment levels, changes in the market prices for oil, gas and timber, and the overall strength or weakness of the U.S. economy.
Real Estate
We own directly or through ventures
113,000
acres of real estate located in
ten
states and
13
markets. Our real estate segment secures entitlements and develops infrastructure on our lands, primarily for single-family residential and mixed-use communities. We own
92,000
acres in a broad area around Atlanta, Georgia, with the balance located primarily in Texas. We target investments principally in our strategic growth corridors, regions across the southern half of the United States that possess key demographic and growth characteristics that we believe make them attractive for long-term real estate investment. We own and manage our projects either directly or through ventures. Our real estate segment revenues are principally derived from the sales of residential single-family lots and tracts, undeveloped land and commercial real estate and from the operation of income producing properties, primarily a hotel and multifamily properties we may develop and sell principally as a merchant builder.
37
A summary of our real estate results follows:
|
|
For the Year
|
||||||||||
|
|
2014
|
2013
|
2012
|
||||||||
|
|
(In thousands)
|
||||||||||
|
Revenues
|
$
|
213,112
|
|
$
|
248,011
|
|
$
|
120,115
|
|
||
|
Cost of sales
|
(123,764
|
)
|
(156,794
|
)
|
(70,039
|
)
|
|||||
|
Operating expenses
|
(34,121
|
)
|
(31,952
|
)
|
(34,160
|
)
|
|||||
|
55,227
|
|
59,265
|
|
15,916
|
|
||||||
|
Interest income on loan secured by real estate
|
8,135
|
|
6,840
|
|
3,430
|
|
|||||
|
Gain on sale of assets
|
25,981
|
|
—
|
|
25,273
|
|
|||||
|
Equity in earnings of unconsolidated ventures
|
8,068
|
|
8,089
|
|
13,897
|
|
|||||
|
Less: Net income attributable to noncontrolling interests
|
(505
|
)
|
(5,740
|
)
|
(4,934
|
)
|
|||||
|
Segment earnings
|
$
|
96,906
|
|
$
|
68,454
|
|
$
|
53,582
|
|
||
In 2014, revenues were principally driven by increased residential real estate and undeveloped land sales, offset by decreased residential and commercial tract revenues and multifamily construction contract revenues. In 2013, revenues include $41,000,000 from the sale of Promesa, a 289-unit multifamily property we developed in Austin.
Revenues in our owned and consolidated ventures consist of:
|
|
For the Year
|
||||||||||
|
|
2014
|
2013
|
2012
|
||||||||
|
|
(In thousands)
|
||||||||||
|
Residential real estate
|
$
|
119,308
|
|
$
|
107,858
|
|
$
|
51,369
|
|
||
|
Commercial real estate
|
2,717
|
|
18,338
|
|
8,320
|
|
|||||
|
Undeveloped land
|
46,554
|
|
22,757
|
|
18,924
|
|
|||||
|
Commercial and income producing properties
|
41,440
|
|
95,327
|
|
38,656
|
|
|||||
|
Other
|
3,093
|
|
3,731
|
|
2,846
|
|
|||||
|
$
|
213,112
|
|
$
|
248,011
|
|
$
|
120,115
|
|
|||
Residential real estate revenues principally consist of the sale of single-family lots to local, regional and national home builders. In 2014, residential real estate revenues increased principally as a result of higher lot sales volume due to increased demand for finished lot inventory by home builders in markets where supply has diminished, offset by lower average price per lot sold, principally due to the bulk sale of 367 residential lots from projects near Atlanta.
The timing of commercial real estate revenues can vary depending on the demand, mix, project life-cycle, size and location of the project. In 2014, our commercial tract sales activity decreased principally due to lower demand. In 2013, we sold 99 commercial acres for $17,398,000 from our owned and consolidated projects, which generated combined segment earnings of $11,687,000. In 2012, we sold 83 commercial acres for $9,551,000 from our owned and consolidated projects located in Texas which generated combined segment earnings of $5,359,000.
In 2014, we sold 21,345 acres of undeveloped land acres for $46,554,000 which generated earnings of $29,895,000, compared with 2013, in which we sold 6,700 acres for $22,757,000 generating segment earnings of $10,788,000. In 2012, undeveloped land sales include the sale of 6,800 acres for $12,800,000 in three retail transactions resulting in segment earnings of $9,700,000.
In 2014, commercial and income producing properties revenue include construction revenues of $12,282,000 associated with our multifamily fixed fee contracts as general contractor. We are reimbursed for costs paid to subcontractors plus may earn a development and construction fee on certain projects, both of which are included in commercial and income producing properties revenue. Construction revenues were $31,595,000 in 2013 and $10,977,000 in 2012. The decrease in construction revenues in 2014 is primarily due to the completion of the Eleven project in second quarter 2014. In 2013, segment results benefited from the sale of Promesa, a 289-unit multifamily property in Austin which we developed as a merchant builder and operated until the sale. As a result, we recognized segment earnings of $10,881,000 related to its sale for $41,000,000.
In 2014, revenues related to our 413 guest room hotel in Austin were up $4,538,000 when compared with 2013, primarily from higher average room rates and increased food and beverage sales. In 2013, revenues related to our 413 guest room hotel in Austin were down $1,140,000 when compared with 2012, primarily from lower food and beverage revenues due to renovation activity.
Other revenues primarily result from sale of stream and impervious cover credits to home builders.
38
Units sold consist of:
|
|
For the Year
|
||||||||||
|
|
2014
|
2013
|
2012
|
||||||||
|
Owned and consolidated ventures:
|
|||||||||||
|
Residential lots sold
|
1,999
|
|
1,469
|
|
926
|
|
|||||
|
Average price per lot sold
|
$
|
55,597
|
|
$
|
58,101
|
|
$
|
52,016
|
|
||
|
Commercial acres sold
|
21
|
|
99
|
|
83
|
|
|||||
|
Average price per acre sold
|
$
|
89,681
|
|
$
|
175,972
|
|
$
|
114,846
|
|
||
|
Undeveloped acres sold
|
21,345
|
|
6,703
|
|
9,190
|
|
|||||
|
Average price per acre sold
|
$
|
2,181
|
|
$
|
3,395
|
|
$
|
2,059
|
|
||
|
Ventures accounted for using the equity method:
|
|||||||||||
|
Residential lots sold
|
344
|
|
414
|
|
439
|
|
|||||
|
Average price per lot sold
|
$
|
72,906
|
|
$
|
58,872
|
|
$
|
52,080
|
|
||
|
Commercial acres sold
|
11
|
|
72
|
|
12
|
|
|||||
|
Average price per acre sold
|
$
|
589,574
|
|
$
|
226,206
|
|
$
|
239,754
|
|
||
|
Undeveloped acres sold
|
792
|
|
108
|
|
135
|
|
|||||
|
Average price per acre sold
|
$
|
2,391
|
|
$
|
2,737
|
|
$
|
2,600
|
|
||
In 2014, cost of sales include $17,393,000 related to multifamily construction contract costs we incurred as general contractor and paid to sub-contractors associated with our development of two multifamily venture properties of which one was completed in May 2014 and the other is about 80 percent complete at year-end 2014, compared to $32,149,000 in 2013. Included in multifamily construction contract costs are charges of $5,111,000 in 2014 reflecting estimated cost increases associated with our fixed fee contracts as general contractor for these two multifamily venture properties compared to $554,000 in 2013. In addition in 2013, cost of sales includes $29,707,000 in carrying value related to Promesa, a 289-unit multifamily property we developed as a merchant builder and sold.
Cost of sales includes non-cash impairment charges of
$399,000
in 2014 associated with two owned entitled projects and $1,790,000 in 2013 associated with a master-planned community and golf club near Dallas. We did not have any non-cash impairment charges in 2012.
Operating expenses consist of:
|
|
For the Year
|
||||||||||
|
|
2014
|
2013
|
2012
|
||||||||
|
|
(In thousands)
|
||||||||||
|
Employee compensation and benefits
|
$
|
10,327
|
|
$
|
8,073
|
|
$
|
10,261
|
|
||
|
Property taxes
|
6,919
|
|
7,188
|
|
7,903
|
|
|||||
|
Professional services
|
5,749
|
|
4,206
|
|
4,050
|
|
|||||
|
Depreciation and amortization
|
3,741
|
|
3,117
|
|
4,340
|
|
|||||
|
Other
|
7,385
|
|
9,368
|
|
7,606
|
|
|||||
|
$
|
34,121
|
|
$
|
31,952
|
|
$
|
34,160
|
|
|||
In 2014, employee compensation and benefits increased when compared with 2013, primarily due to higher incentive compensation as a result of our improved segment operating results. The increase in professional services in 2014 when compared with 2013 is primarily associated with conveyance of land in payment of management fees in a consolidated venture associated with non-monetary exchange of leasehold timber rights for undeveloped land.
Other operating expenses for 2013 includes a $776,000 loss on retirement of assets associated with capital improvements at our hotel and a $583,000 loss on sale of assets related to a project in Austin.
Interest income represents earnings from a loan we hold which is secured by a mixed-use community in Houston.
In 2014, gain on sale of assets principally includes a $10,476,000 gain associated with a non-monetary exchange of leasehold timber rights on approximately 10,300 acres for 5,400 acres of undeveloped land with a partner in a consolidated venture, a gain of $7,610,000 related to acquiring our partner's interest in the Eleven multifamily venture, a gain of $6,577,000 related to bond proceeds received from Cibolo Canyons Special Improvement District (CCSID) at our Cibolo Canyons project near San Antonio, and $1,318,000 gain associated with the sale of a land purchase option contract.
In 2014, we acquired full ownership of the Eleven venture, owner of a
257
-unit multifamily project in Austin in which we previously held a 25 percent interest, for $21,500,000. The acquisition-date fair value was $55,275,000, including debt of $23,936,000. Our investment in the Eleven venture prior to acquiring our partner’s interest was $2,229,000. We accounted for
39
this transaction as a business combination achieved in stages and as a result, we remeasured our equity method investment in the Eleven venture to its acquisition-date fair value of $9,839,000 and recognized the resulting gain of $7,610,000 in real estate segment earnings.
In 2014, we received $50,550,000 from CCSID under 2007 economic development agreements (EDA) related to development of the JW Marriott
®
Hill Country Resort & Spa (Resort) at our Cibolo Canyons project near San Antonio, of which $46,500,000 was related to CCSID's issuance of $48,900,000 Hotel Occupancy Tax (HOT) and Sales and Use Tax Revenue Bonds. These bonds are obligations solely of CCSID and are payable from HOT and sales and use taxes levied on the Resort by CCSID. To facilitate the issuance of the bonds, we provided a $6,846,000 letter of credit to the bond trustee as security for certain debt service fund obligations in the event CCSID tax collections are not sufficient to support payment of the bonds in accordance with their terms. The letter of credit must be maintained until the earlier of redemption of the bonds or scheduled bond maturity in 2034. We also entered into an agreement with San Antonio Real Estate (SARE), owner of the Resort, to assign SARE’s senior rights under the EDA to us in exchange for consideration provided by us, including a surety bond to be drawn if CCSID tax collections are not sufficient to support ad valorem tax rebates payable to SARE. The surety bond has a balance of $9,010,000 at year-end 2014. The surety bond will decrease as CCSID makes annual ad valorem tax rebate payments to SARE, which obligation is scheduled to be retired in full by 2020. As a result of these transactions, we recorded a gain of $6,577,000 after recovery of our full resort investment of $24,067,000.
In 2012, gain on sale of assets principally includes a $11,675,000 gain from the sale of our 25 percent ownership interest in Palisades West LLC, a $10,180,000 gain from the sale of Broadstone Memorial, a 401-unit multifamily investment property in Houston, and a $3,401,000 gain from a consolidated venture’s sale of 800 acres in Dallas.
In 2014, the decrease in net income attributable to noncontrolling interests, compared to 2013, is principally due to the acquisition of our partner's noncontrolling interest in the Lantana ventures for $7,971,000 in March 2014. In 2012, segment results include $8,247,000 in earnings associated with an unconsolidated venture’s sale of Las Brisas, a 414-unit multifamily property near Austin, for $40,400,000. Equity in earnings from unconsolidated ventures includes $11,013,000 in earnings related to this sale, of which ($2,766,000) was allocated to net income attributable to noncontrolling interests.
Information about our real estate projects and our real estate ventures follows:
|
|
Year-End
|
||||
|
|
2014
|
2013
|
|||
|
Owned and consolidated ventures:
|
|||||
|
Entitled, developed and under development projects
|
|||||
|
Number of projects
|
67
|
|
67
|
|
|
|
Residential lots remaining
|
15,439
|
|
17,070
|
|
|
|
Commercial acres remaining
|
1,759
|
|
1,832
|
|
|
|
Undeveloped land and land in the entitlement process
|
|||||
|
Number of projects
|
11
|
|
13
|
|
|
|
Acres in entitlement process
|
24,430
|
|
25,830
|
|
|
|
Acres undeveloped
|
72,260
|
|
85,515
|
|
|
|
Ventures accounted for using the equity method:
|
|||||
|
Ventures’ entitled, developed and under development projects
|
|||||
|
Number of projects
|
8
|
|
7
|
|
|
|
Residential lots remaining
|
2,889
|
|
3,291
|
|
|
|
Commercial acres remaining
|
252
|
|
236
|
|
|
|
Ventures’ undeveloped land and land in the entitlement process
|
|||||
|
Acres undeveloped
|
4,539
|
|
5,547
|
|
|
We underwrite real estate development projects based on a variety of assumptions incorporated into our development plans, including the timing and pricing of sales and leasing and costs to complete development. Our development plans are periodically reviewed in comparison to our return projections and expectations, and we may revise our plans as business conditions warrant. If as a result of changes to our development plans the anticipated future net cash flows are reduced such that our basis in a project is not fully recoverable, we may be required to recognize a non-cash impairment charge for such project.
40
Our net investment in owned and consolidated real estate by geographic location at year-end
2014
follows:
|
State
|
Entitled,
Developed,
and Under
Development
Projects
|
Undeveloped
Land and
Land in
Entitlement
|
Income
Producing
Properties
|
Total
|
||||||||||||
|
|
(In thousands)
|
|||||||||||||||
|
Texas
|
$
|
250,548
|
|
$
|
5,931
|
|
$
|
138,423
|
|
$
|
394,902
|
|
||||
|
Georgia
|
17,418
|
|
63,653
|
|
—
|
|
81,071
|
|
||||||||
|
California
|
8,915
|
|
23,040
|
|
—
|
|
31,955
|
|
||||||||
|
Colorado
|
25,334
|
|
5
|
|
—
|
|
25,339
|
|
||||||||
|
Tennessee
|
10,461
|
|
540
|
|
7,675
|
|
18,676
|
|
||||||||
|
North Carolina
|
—
|
|
13
|
|
15,203
|
|
15,216
|
|
||||||||
|
Other
|
8,597
|
|
—
|
|
—
|
|
8,597
|
|
||||||||
|
Total
|
$
|
321,273
|
|
$
|
93,182
|
|
$
|
161,301
|
|
$
|
575,756
|
|
||||
Approximately
69 percent
of our net investment in real estate is in the major markets of Texas.
As of year-end
2014
, multifamily community projects under various stages of development are as follows:
|
Planning Phase
(a)
|
|||||||||||||
|
Project
|
Market
|
Ownership Interest
(b)
|
Acquisition of Property
|
Project Cost Incurred to Date
|
|||||||||
|
($ in thousands)
|
|||||||||||||
|
Dilworth
|
Charlotte
|
100
|
%
|
$
|
11,628
|
|
$
|
3,441
|
|
||||
|
Music Row
|
Nashville
|
100
|
%
|
$
|
7,182
|
|
$
|
379
|
|
||||
|
Downtown Edge
|
Austin
|
100
|
%
|
$
|
11,613
|
|
$
|
239
|
|
||||
|
West Austin
|
Austin
|
100
|
%
|
$
|
8,522
|
|
$
|
333
|
|
||||
|
Under Construction
|
||||||||||||||||||||||
|
Project
|
Market
|
Ownership Interest
(b)
|
Estimated Project Cost
(c)
|
Project Cost Incurred to Date
|
Planned
Number of Units
|
Planned
Rentable Square Feet
|
Estimated Completion Date
|
Estimated Stabilization Date
(d)
|
||||||||||||||
|
($ in thousands)
|
||||||||||||||||||||||
|
Midtown
|
Dallas
|
100
|
%
|
$
|
35,600
|
|
$
|
33,728
|
|
354
|
317,525
|
|
2Q 2015
|
4Q 2015
|
||||||||
|
360°
|
Denver
|
20
|
%
|
$
|
54,751
|
|
$
|
47,409
|
|
304
|
248,684
|
|
3Q 2015
|
4Q 2015
|
||||||||
|
Acklen
|
Nashville
|
30
|
%
|
$
|
58,100
|
|
$
|
39,379
|
|
320
|
249,453
|
|
3Q 2015
|
2Q 2016
|
||||||||
|
HiLine
|
Denver
|
25
|
%
|
$
|
71,360
|
|
$
|
25,918
|
|
385
|
358,683
|
|
2Q 2016
|
4Q 2016
|
||||||||
|
Elan 99
(e)
|
Houston
|
90
|
%
|
$
|
53,250
|
|
$
|
9,732
|
|
360
|
365,160
|
|
2Q 2016
|
1Q 2017
|
||||||||
|
Complete
|
||||||||||||||||||||||
|
Project
|
Market
|
Ownership Interest
|
Project Cost Incurred to Date
|
Project Cost per Sq Ft
|
Number of Units
|
Rentable Square Feet
|
Completion Date
|
Stabilization Date
|
||||||||||||||
|
Eleven
(f)
|
Austin
|
100
|
%
|
$
|
55,275
|
|
$
|
271
|
|
257
|
203,757
|
|
2Q 2014
|
3Q 2014
|
||||||||
_____________________
|
(a)
|
Acquired development site planned for future construction.
|
|
(b)
|
We may develop and own these projects directly or through ventures.
|
|
(c)
|
Estimated project costs represent the estimated costs of the project through stabilization. Final costs may differ from these estimates. The projected stabilization dates are also estimates and are subject to change as the project proceeds through the development and marketing process.
|
|
(d)
|
Estimated stabilization represents the quarter within which we estimate the project will achieve 90% occupancy.
|
|
(e)
|
Our venture partner is the developer of this project.
|
|
(f)
|
In 2014, we acquired full ownership of the Eleven venture, in which we previously held a 25 percent interest, for $21,500,000.
|
41
Oil and Gas
Our oil and gas segment is focused on the exploration, development and production of oil and gas on our owned and leasehold mineral interests.
We lease portions of our
590,000
owned net mineral acres located principally in Texas, Louisiana, Georgia and Alabama to other oil and gas companies in return for a lease bonus, delay rentals and a royalty interest, and we may negotiate an option to participate in oil and gas exploration and development or we may elect to drill as an operator. At year-end
2014
, we have about
20,000
net acres under lease to others with expiration dates ranging between 2015 to 2019, and about
36,000
net acres leased to others that are held by production related to our owned mineral interests and
551
gross productive wells operated by others on our owned mineral acres.
We acquired Credo in third quarter 2012, an independent oil and gas exploration, development and production company. As of year-end
2014
, our leasehold interests include
370,000
net mineral acres leased from others principally located in Nebraska and Kansas primarily targeting the Lansing – Kansas City formation, in the Texas Panhandle primarily targeting the Tonkawa and Cleveland formations, in Oklahoma targeting various formations in the Anadarko Basin and in North Dakota primarily targeting the Bakken and Three Forks formations. Our leasehold interests include approximately
9,000
net mineral acres in the Bakken and Three Forks formations. We have
47,000
net acres held by production and
393
gross oil and gas wells with working interest ownership, of which
153
are operated by us.
A summary of our oil and gas results follows:
|
|
For the Year
|
||||||||||
|
|
2014
|
2013
|
2012
|
||||||||
|
|
(In thousands)
|
||||||||||
|
Revenues
|
$
|
84,300
|
|
$
|
72,313
|
|
$
|
44,220
|
|
||
|
Cost of oil and gas producing activities
|
(98,371
|
)
|
(42,067
|
)
|
(10,842
|
)
|
|||||
|
Operating expenses
|
(17,727
|
)
|
(13,312
|
)
|
(7,279
|
)
|
|||||
|
(31,798
|
)
|
16,934
|
|
26,099
|
|
||||||
|
Gain on sale of assets
|
8,526
|
|
1,333
|
|
—
|
|
|||||
|
Equity in earnings of unconsolidated ventures
|
586
|
|
592
|
|
509
|
|
|||||
|
Segment earnings (loss)
|
$
|
(22,686
|
)
|
$
|
18,859
|
|
$
|
26,608
|
|
||
Oil and gas segment earnings decreased in 2014 principally due to non-cash impairment charges of $17,130,000 for unproved leasehold interests and $15,535,000 for proved oil and gas properties which were negatively impacted by significantly lower oil prices. In addition, segment earnings decreased from higher exploration and production costs and
lower oil and gas production volumes associated with royalty interests from our owned mineral interests
, which were partially offset by higher working interest production volumes
.
Our 2014 and 2013 oil and gas results include full year results attributed to exploration and production operations related to our acquisition of Credo in third quarter 2012, which generated revenues of $68,205,000 and $50,894,000.
Revenues consist of:
|
|
For the Year
|
||||||||||
|
|
2014
|
2013
|
2012
|
||||||||
|
|
(In thousands)
|
||||||||||
|
Oil production
(a)
|
$
|
75,075
|
|
$
|
62,379
|
|
$
|
31,592
|
|
||
|
Gas production
|
7,844
|
|
6,657
|
|
4,611
|
|
|||||
|
Other
|
1,381
|
|
3,277
|
|
8,017
|
|
|||||
|
$
|
84,300
|
|
$
|
72,313
|
|
$
|
44,220
|
|
|||
_____________________
|
(a)
|
Oil production includes revenues from oil, condensate and natural gas liquids (NGLs). In
2014
,
2013
and
2012
, NGLs accounted for $2,518,000, $1,639,000 and $2,685,000 of oil production revenues.
|
In 2014, oil and gas production revenues increased principally as a result of higher production volumes. Increased oil production volume contributed $20,862,000, partially offset by decreased oil prices which negatively impacted revenues by $8,166,000. Decreased gas production volume negatively impacted revenues by $190,000, offset by higher gas prices increasing revenues by $1,377,000 as compared with 2013.
In 2013, oil and gas production revenues from exploration and production operations increased due to our acquisition of Credo at third quarter-end 2012. Increased oil production contributed $32,766,000 and higher oil prices contributed $5,643,000.
42
Increased gas production contributed about $2,299,000 and higher gas prices contributed $51,000. In 2013, oil and gas production royalty revenues from our owned mineral interests decreased principally as a result of lower production volumes and lower oil prices. Decreased oil production volume negatively impacted revenues by $7,293,000 and lower oil prices by $329,000. Decreased gas production volume negatively impacted revenues by $1,022,000, offset by higher gas prices increasing revenues by $718,000 compared with 2012.
In 2014, other revenues principally represents $1,244,000 in lease bonus payments received from leasing approximately 3,900 owned mineral acres in Texas and Louisiana to third parties for an average of $320 per acre. In 2013, other revenues include $2,486,000 in lease bonus payments received from leasing 9,200 owned mineral acres to third parties for an average of about $270 per acre and $588,000 related to delay rental payments received compared to $5,319,000 in lease bonus payments received from leasing 8,900 owned mineral acres to third parties for an average of about $600 per acre and $2,219,000 related to delay rental payments received in 2012.
Oil and gas produced and average unit prices related to our working and royalty interests follows:
|
|
For the Year
|
||||||||||
|
|
2014
|
2013
|
2012
|
||||||||
|
Consolidated entities:
|
|||||||||||
|
Oil production (barrels)
|
869,700
|
|
648,000
|
|
302,000
|
|
|||||
|
Average oil price per barrel
|
$
|
83.43
|
|
$
|
93.74
|
|
$
|
95.73
|
|
||
|
NGL production (barrels)
|
61,400
|
|
49,700
|
|
69,300
|
|
|||||
|
Average NGL price per barrel
|
$
|
41.02
|
|
$
|
32.92
|
|
$
|
38.73
|
|
||
|
Total oil production (barrels), including NGLs
|
931,100
|
|
697,700
|
|
371,300
|
|
|||||
|
Average total oil price per barrel, including NGLs
|
$
|
80.63
|
|
$
|
89.40
|
|
$
|
85.09
|
|
||
|
Gas production (millions of cubic feet)
|
1,860.6
|
|
1,912.0
|
|
1,667.7
|
|
|||||
|
Average price per thousand cubic feet
|
$
|
4.22
|
|
$
|
3.48
|
|
$
|
2.76
|
|
||
|
Our share of ventures accounted for using the equity method:
|
|||||||||||
|
Gas production (millions of cubic feet)
|
199.6
|
|
246.5
|
|
321.3
|
|
|||||
|
Average price per thousand cubic feet
|
$
|
3.94
|
|
$
|
3.25
|
|
$
|
2.40
|
|
||
|
Total consolidated and our share of equity method ventures:
|
|||||||||||
|
Oil production (barrels)
|
869,700
|
|
648,000
|
|
302,000
|
|
|||||
|
Average oil price per barrel
|
$
|
83.43
|
|
$
|
93.74
|
|
$
|
95.73
|
|
||
|
NGL production (barrels)
|
61,400
|
|
49,700
|
|
69,300
|
|
|||||
|
Average NGL price per barrel
|
$
|
41.02
|
|
$
|
32.92
|
|
$
|
38.73
|
|
||
|
Total oil production (barrels), including NGLs
|
931,100
|
|
697,700
|
|
371,300
|
|
|||||
|
Average total oil price per barrel, including NGLs
|
$
|
80.63
|
|
$
|
89.40
|
|
$
|
85.09
|
|
||
|
Gas production (millions of cubic feet)
|
2,060.2
|
|
2,158.5
|
|
1,989.0
|
|
|||||
|
Average price per thousand cubic feet
|
$
|
4.19
|
|
$
|
3.46
|
|
$
|
2.71
|
|
||
|
Total BOE (barrel of oil equivalent)
(a)
|
1,274,500
|
|
1,057,500
|
|
702,800
|
|
|||||
|
Average price per barrel of oil equivalent
|
$
|
65.68
|
|
$
|
66.04
|
|
$
|
52.61
|
|
||
_____________________
|
(a)
|
Gas is converted to barrels of oil equivalent (BOE) using six Mcf to one barrel of oil.
|
At year-end
2014
, there were
944
productive gross wells of which
551
were operated by others on our owned mineral acres and
393
wells on our leased mineral acres, of which
153
were operated by us. At year-end
2013
, there were
1,011
productive gross wells of which
547
were operated by others on our owned mineral acres and
464
wells on our leased mineral acres, of which 182 were operated by us. At year-end
2012
, there were
936
productive gross wells of which 542 were operated by others on our owned mineral acres and 394 wells were associated with our third quarter acquisition of Credo, of which 136 were operated by us.
43
Cost of oil and gas producing activities consists of:
|
|
For the Year
|
||||||||||
|
|
2014
|
2013
|
2012
|
||||||||
|
|
(In thousands)
|
||||||||||
|
Depletion and amortization
|
$
|
28,442
|
|
$
|
18,417
|
|
$
|
4,526
|
|
||
|
Exploration costs
|
16,648
|
|
10,486
|
|
1,754
|
|
|||||
|
Production costs
|
19,727
|
|
12,477
|
|
4,472
|
|
|||||
|
Impairment of unproved leasehold interests and proved properties
|
32,665
|
|
473
|
|
—
|
|
|||||
|
Other
|
889
|
|
214
|
|
90
|
|
|||||
|
$
|
98,371
|
|
$
|
42,067
|
|
$
|
10,842
|
|
|||
In 2014, cost of oil and gas producing activities increased compared with 2013 principally due to non-cash impairments, and higher exploration, production and depletion expenses. Production costs principally represent our share of lease operating expenses and production severance taxes. Depletion and amortization represent non-cash costs of producing oil and gas associated with our working interests and are computed based on the units of production method.
Exploration costs principally represent exploratory dry hole costs, geological and geophysical and seismic study costs. Dry hole costs were $12,398,000 in 2014, which includes $5,151,000 principally in Kansas and Nebraska, $4,040,000 in east Texas and $3,207,000 in Oklahoma compared with dry hole costs of $5,837,000 in 2013 and $1,518,000 in 2012.
All of our long-lived assets are monitored for potential impairment when circumstances indicate that the carrying value of an asset may be greater than its future net cash flows. In 2014, we recorded non-cash impairment charges of $17,130,000 for unproved leasehold interests and $15,535,000 for oil and gas proved properties compared with $473,000 of non-cash impairment charges of unproved leasehold interests in 2013. Impairments of unproved leasehold interests principally located in Texas, Oklahoma, Nebraska and Kansas in 2014 was based on changes to our drilling plans as a result of significant decline in oil prices and near-term lease expirations. Impairments of proved properties was principally related to wells located in the Texas Panhandle and a mechanical failure associated with an exploratory well in Oklahoma. Our carrying value of these wells located in the Texas Panhandle and Oklahoma is $3,655,000 which is the estimated fair value at year-end 2014.
In 2014, 2013 and 2012, our total cost of oil and gas producing activities includes $70,671,000, $38,825,000 and $6,892,000 of costs related to operations acquired from Credo in third quarter 2012.
Operating expenses consist of:
|
|
For the Year
|
||||||||||
|
|
2014
|
2013
|
2012
|
||||||||
|
|
(In thousands)
|
||||||||||
|
Employee compensation and benefits
|
$
|
10,082
|
|
$
|
8,168
|
|
$
|
4,250
|
|
||
|
Professional and consulting services
|
3,156
|
|
1,557
|
|
769
|
|
|||||
|
Depreciation
|
1,001
|
|
1,135
|
|
429
|
|
|||||
|
Property taxes
|
399
|
|
436
|
|
312
|
|
|||||
|
Other
|
3,089
|
|
2,016
|
|
1,519
|
|
|||||
|
$
|
17,727
|
|
$
|
13,312
|
|
$
|
7,279
|
|
|||
In 2014, the increase in employee compensation and benefits when compared with 2013 is primarily due to severance and retention bonus costs. In December 2014, we expensed $2,177,000 incurred under written severance agreements of which $1,150,000 is to be paid in 2015 and $1,027,000 is to be paid in 2016. Additionally, in December 2014, we entered into retention bonus agreements with key employees for $1,519,000, which will be paid in December 2015 provided they remain our employees. We are expensing retention bonus payments over the retention service period. In 2013, operating expenses increased as a result our acquisition of Credo in third quarter 2012 and staffing to operate as an independent exploration, development and production company.
In 2014, we recorded gains of $8,526,000 related to the sale of approximately 650 net mineral acres in North Dakota and the sale of 124 gross (18 net) producing oil and gas wells primarily in Oklahoma. In 2013, gain on sale of $1,333,000 is related to assigning our leasehold interests in 1,365 net mineral acres in Oklahoma to third parties for a three-year term.
Equity in earnings of unconsolidated ventures includes our share of royalty revenue from producing wells in the Barnett Shale gas formation.
44
Oil and Gas Owned Mineral Interests
A summary of our oil and gas owned mineral interests
(a)
at year-end
2014
follows:
|
State
|
Unleased
|
Leased
(b)
|
Held By
Production
(c)
|
Total
(d)
|
||||||||
|
Texas
|
208,000
|
|
17,000
|
|
27,000
|
|
252,000
|
|
||||
|
Louisiana
|
132,000
|
|
3,000
|
|
9,000
|
|
144,000
|
|
||||
|
Georgia
|
152,000
|
|
—
|
|
—
|
|
152,000
|
|
||||
|
Alabama
|
40,000
|
|
—
|
|
—
|
|
40,000
|
|
||||
|
California
|
1,000
|
|
—
|
|
—
|
|
1,000
|
|
||||
|
Indiana
|
1,000
|
|
—
|
|
—
|
|
1,000
|
|
||||
|
534,000
|
|
20,000
|
|
36,000
|
|
590,000
|
|
|||||
_____________________
|
(a)
|
Includes ventures.
|
|
(b)
|
Includes leases in primary lease term or for which a delayed rental payment has been received. In the ordinary course of business, leases covering a significant portion of leased owned mineral acres may expire from time to time in a single reporting period.
|
|
(c)
|
Includes leases that are producing oil or gas in paying quantities.
|
|
(d)
|
Texas, Louisiana, California and Indiana net acres are calculated as the gross number of surface acres multiplied by our percentage ownership of the mineral interest. Alabama and Georgia net acres are calculated as the gross number of surface acres multiplied by our estimated percentage ownership of the mineral interest based on county sampling.
|
Oil and Gas Mineral Interests Leased
A summary of our net oil and gas mineral acres leased from others at year-end
2014
follows:
|
State
|
Undeveloped
|
Held By
Production
(a)
|
Total
|
||||||
|
Nebraska
|
248,000
|
|
11,000
|
|
259,000
|
|
|||
|
Kansas
|
18,000
|
|
8,000
|
|
26,000
|
|
|||
|
Oklahoma
|
23,000
|
|
18,000
|
|
41,000
|
|
|||
|
Texas
|
10,000
|
|
2,000
|
|
12,000
|
|
|||
|
North Dakota
|
5,000
|
|
4,000
|
|
9,000
|
|
|||
|
Other
(a)
|
19,000
|
|
4,000
|
|
23,000
|
|
|||
|
323,000
|
|
47,000
|
|
370,000
|
|
||||
_____________________
|
(a)
|
Excludes approximately
8,000
net acres of overriding royalty interests.
|
Other Natural Resources
Our other natural resources segment manages our timber holdings, recreational leases and water resource initiatives. Included within our real estate acres is about
102,000
acres of timber we own directly or through ventures, primarily in Georgia. Other natural resources segment revenues are principally derived from sales of wood fiber from our land and leases for recreational uses. In addition, we have water interests in about 1.5 million acres, including a 45 percent nonparticipating royalty interest in groundwater produced or withdrawn for commercial purposes or sold from approximately 1.4 million acres in Texas, Louisiana, Georgia and Alabama, and about 20,000 acres of groundwater leases in central Texas.
45
A summary of our other natural resources results follows:
|
|
For the Year
|
||||||||||
|
|
2014
|
2013
|
2012
|
||||||||
|
|
(In thousands)
|
||||||||||
|
Revenues
|
$
|
9,362
|
|
$
|
10,721
|
|
$
|
8,256
|
|
||
|
Cost of other natural resources
|
(3,006
|
)
|
(2,033
|
)
|
(2,995
|
)
|
|||||
|
Operating expenses
|
(4,419
|
)
|
(6,065
|
)
|
(5,989
|
)
|
|||||
|
1,937
|
|
2,623
|
|
(728
|
)
|
||||||
|
Gain on sale of assets
|
3,531
|
|
3,828
|
|
694
|
|
|||||
|
Equity in earnings of unconsolidated ventures
|
31
|
|
56
|
|
63
|
|
|||||
|
Segment earnings
|
$
|
5,499
|
|
$
|
6,507
|
|
$
|
29
|
|
||
In
2014
, other natural resources segment earnings decreased principally as a result of decreased harvesting activity compared with 2013 offset principally by gains of $3,366,000 associated with partial terminations of a timber lease related to the remaining 2,700 acres of undeveloped land sold from a consolidated venture near Atlanta, Georgia.
Revenues consist of:
|
|
For the Year
|
||||||||||
|
|
2014
|
2013
|
2012
|
||||||||
|
|
(In thousands)
|
||||||||||
|
Fiber
|
$
|
7,050
|
|
$
|
9,584
|
|
$
|
6,332
|
|
||
|
Water
|
1,100
|
|
—
|
|
—
|
|
|||||
|
Recreational leases and other
|
1,212
|
|
1,137
|
|
1,924
|
|
|||||
|
$
|
9,362
|
|
$
|
10,721
|
|
$
|
8,256
|
|
|||
Water revenues for 2014 are associated with a groundwater reservation agreement.
Fiber sold consists of:
|
|
For the Year
|
||||||||||
|
|
2014
|
2013
|
2012
|
||||||||
|
Pulpwood tons sold
|
209,900
|
|
375,200
|
|
370,200
|
|
|||||
|
Average pulpwood price per ton
|
$
|
10.62
|
|
$
|
9.26
|
|
$
|
8.64
|
|
||
|
Sawtimber tons sold
|
120,000
|
|
234,300
|
|
123,700
|
|
|||||
|
Average sawtimber price per ton
|
$
|
22.47
|
|
$
|
22.31
|
|
$
|
21.77
|
|
||
|
Total tons sold
|
329,900
|
|
609,500
|
|
493,900
|
|
|||||
|
Average stumpage price per ton
(a)
|
$
|
14.93
|
|
$
|
14.28
|
|
$
|
11.93
|
|
||
_____________________
|
(a)
|
Average stumpage price per ton is based on gross revenues less cut and haul costs.
|
In 2014, total fiber tons sold decreased principally as a result of decreased harvest activity, offset partially by higher average prices.
Information about our recreational leases follows:
|
|
For the Year
|
||||||||||
|
|
2014
|
2013
|
2012
|
||||||||
|
Average recreational acres leased
|
110,500
|
|
120,400
|
|
129,800
|
|
|||||
|
Average price per leased acre
|
$
|
9.13
|
|
$
|
9.08
|
|
$
|
8.73
|
|
||
46
Operating expenses consist of:
|
|
For the Year
|
||||||||||
|
|
2014
|
2013
|
2012
|
||||||||
|
|
(In thousands)
|
||||||||||
|
Employee compensation and benefits
|
$
|
2,127
|
|
$
|
2,280
|
|
$
|
1,526
|
|
||
|
Professional and consulting services
|
1,587
|
|
2,813
|
|
3,570
|
|
|||||
|
Other
|
705
|
|
972
|
|
893
|
|
|||||
|
$
|
4,419
|
|
$
|
6,065
|
|
$
|
5,989
|
|
|||
The decrease in professional and consulting services in 2014 was primarily due to professional fees incurred in 2013 related to obtaining or extending groundwater leases in central Texas.
Items Not Allocated to Segments
Unallocated items represent income and expenses managed on a company-wide basis and include general and administrative expenses, share-based compensation, gain on sale of strategic timberland, interest expense and other corporate non-operating income and expense. General and administrative expenses principally consist of accounting and finance, tax, legal, human resources, internal audit, information technology and our board of directors. These functions support all of our business segments and are not allocated.
General and administrative expense
General and administrative expenses consist of:
|
|
For the Year
|
||||||||||
|
|
2014
|
2013
|
2012
|
||||||||
|
|
(In thousands)
|
||||||||||
|
Employee compensation and benefits
|
$
|
8,948
|
|
$
|
8,783
|
|
$
|
7,523
|
|
||
|
Professional and consulting services
|
4,647
|
|
4,117
|
|
10,026
|
|
|||||
|
Insurance costs
|
1,115
|
|
898
|
|
944
|
|
|||||
|
Facility costs
|
928
|
|
838
|
|
766
|
|
|||||
|
Depreciation and amortization
|
638
|
|
833
|
|
1,114
|
|
|||||
|
Other
|
4,953
|
|
5,128
|
|
4,803
|
|
|||||
|
$
|
21,229
|
|
$
|
20,597
|
|
$
|
25,176
|
|
|||
In 2013, employee compensation and benefits increased primarily due to higher incentive compensation associated with our improved operating results and value creation activities. In 2012, professional services include $6,323,000 in transaction costs paid to outside advisors associated with our acquisition of Credo.
Share-based compensation expense
Our share-based compensation expense principally fluctuates because a portion of our awards are cash settled and as a result are affected by changes in the market price of our common stock. In 2014, share-based compensation decreased when compared with 2013 principally as a result of a 28 percent decrease in our stock price since year-end 2013 and its impact on cash-settled awards as well as forfeiture of awards due to employee separations. In 2013, share-based compensation increased when compared with 2012 principally as a result of a 23 percent increase in our stock price in 2013 since year-end 2012.
Interest expense
The increase in interest expense in 2014 is primarily due to higher average borrowing rates and higher levels of debt outstanding. The increase in interest expense in 2013 is primarily due to additional interest expense associated with the issuance of 3.75% convertible senior notes in February 2013.
Income taxes
Our effective tax rate was 34 percent in 2014, 17 percent in 2013 and 31 percent in 2012. Our 2013 effective tax rate includes a 15 percent benefit from the recognition of previously unrecognized tax benefits due to lapse of the statute of limitations for a previously reserved tax position.
Our 2014, 2013 and 2012 effective tax rates also include the effect of state income taxes, nondeductible items and benefits from percentage depletion and noncontrolling interests.
47
We have not provided a valuation allowance for our federal deferred tax asset because we believe it is likely it will be recoverable in future periods based on considerations including taxable income in prior carryback years, future reversals of existing temporary differences, tax planning strategies and future taxable income. If these sources of income are not sufficient in future periods, we may be required to provide a valuation allowance for our deferred tax asset.
Capital Resources and Liquidity
Sources and Uses of Cash
We operate in cyclical industries and our cash flows fluctuate accordingly. Our principal cash requirements are for the acquisition and development of real estate and investment in oil and gas leasing and production activities, either directly or indirectly through ventures, taxes, interest and compensation. Our principal sources of cash are proceeds from the sale of real estate and timber, the cash flow from oil and gas and income producing properties, borrowings, and reimbursements from utility and improvement districts. Our cash flows are affected by the timing of the payment of real estate development expenditures and the collection of proceeds from the eventual sale of the real estate, the timing of which can vary substantially depending on many factors including the size of the project, state and local permitting requirements and availability of utilities, by the timing of oil and gas leasing and production activities and fluctuations in oil and gas commodity prices. Working capital is subject to operating needs, the timing of sales of real estate and timber, oil and gas leasing and production activities, collection of receivables, reimbursement from utility and improvement districts and the payment of payables and expenses.
We regularly evaluate alternatives for managing our capital structure and liquidity profile in consideration of expected cash flows, growth and operating capital requirements and capital market conditions. We may, at any time, be considering or be in discussions with respect to the purchase or sale of our common stock, debt securities, convertible securities or a combination thereof.
Cash Flows from Operating Activities
Cash flows from our real estate development activities, undeveloped land sales, income producing properties, timber sales, income from oil and gas properties and recreational leases and reimbursements from utility and improvement districts are classified as operating cash flows.
In 2014, net cash provided by operating activities was
$107,082,000
principally due to
$66,047,000
of reimbursements from utilities and improvement districts. In addition, increased residential lot sales and undeveloped land sales activity contributed to our net cash from operations, which are partially offset by
$114,694,000
of real estate development and acquisition expenditures exceeding
$84,665,000
of real estate cost of sales.
In 2013, net cash provided by operations was
$88,777,000
primarily due to higher earnings and the sale of Promesa, a 289-unit multifamily property we developed and sold for $41,000,000, of which $10,881,000 is included in pre-tax income and $29,707,000 of carrying value is included in real estate cost on sales on the statement of cash flows. These cash flows were partially offset by real estate development and acquisition expenditures of
$106,609,000
.
In 2012, net cash used for operations was
$22,218,000
principally due to expenditures for real estate development and acquisitions significantly exceeding non-cash real estate cost of sales, principally as result of acquiring real estate assets from CL Realty and Temco for $47,000,000. Subsequent to closing of this acquisition, we received $23,370,000 from the ventures, representing our pro-rata share of distributable cash. We also paid $21,678,000 in federal and state taxes, net of refunds. In addition, we received $24,294,000 in net proceeds from a consolidated venture’s bulk sale of 800 acres near Dallas, $10,759,000 in reimbursements from two new multifamily ventures which represents our venture partners’ pro-rata share of costs we previously incurred and $8,524,000 in reimbursements from utility and improvement districts.
Cash Flows from Investing Activities
Capital contributions to and capital distributions from unconsolidated ventures, business acquisitions and investment in oil and gas properties and equipment are classified as investing activities. In addition, proceeds from the sale of property and equipment, software costs and expenditures related to reforestation activities are also classified as investing activities.
In 2014, net cash used in investing activities was
$129,731,000
principally due to our investment of
$101,145,000
in oil and gas properties and equipment associated with our exploration and production operations and purchase of our partner's interest in a
257
-unit multifamily property in Austin for $20,155,000, net of cash. In addition, we invested
$16,398,000
in property and equipment, software and reforestation, of which $8,780,000 is related to capital expenditures on our 413 guest room hotel in Austin and $4,981,000 is related to water production well development, and a net investment in unconsolidated ventures of
$12,895,000
. These are partially offset by proceeds from sale of assets of
$21,962,000
principally related to sale of certain oil and gas properties in North Dakota and Oklahoma.
In 2013, net cash used for investing activities was
$103,927,000
principally due to our investment of
$96,069,000
in oil and gas properties and equipment associated with our exploration and production operations. In addition, we invested
48
$11,828,000
in property and equipment, software and reforestation of which $7,245,000 is related to capital expenditures on our 413 guest room hotel in Austin.
In 2012, net cash used for investing activities was
$105,119,000
principally due to our acquisition of Credo for approximately $152,915,000 including debt, net of cash acquired. In addition, we invested $21,416,000 in oil and gas properties and equipment. Partially offsetting our investment in Credo and oil and gas properties were proceeds received from the sale of our 25 percent ownership interest in Palisades West LLC for $32,095,000 and $29,474,000 in net proceeds from the sale of Broadstone Memorial, a 401-unit multifamily investment property in Houston. We also invested $2,735,000 in property and equipment, software and reforestation and received $10,336,000 in net distributions from unconsolidated ventures, of which $6,850,000 is associated with a venture’s sale of Las Brisas, a 414-unit multifamily property near Austin.
Cash Flows from Financing Activities
In 2014, net cash provided by financing activities was
$469,000
principally due to net proceeds of
$241,947,000
from the issuance of 8.5% senior secured notes, partially offset by debt payments of
$225,481,000
, of which $200,000,000 is related to retirement of the term loan associated with our senior secured credit facility, $9,450,000 is related to payments of our amortizing notes associated with our tangible equity units, $2,878,000 is related to debt outstanding for our Lantana partnerships and the remaining associated with payment of other indebtedness. In addition, we purchased
1,491,187
shares of our common stock for
$24,595,000
.
In 2013, net cash provided by financing activities was
$197,096,000
principally due to net proceeds of $144,998,000 from the issuance of 6.00% tangible equity units and net proceeds of $120,795,000 from the issuance of 3.75% convertible senior notes, partially offset by net debt repayments of $106,076,000, of which $68,000,000 is related to payoff of debt outstanding under our revolving line of credit and $18,902,000 is related to paying off a loan associated with Promesa. We plan to use the remaining net proceeds from the issuance of our convertible senior notes and tangible equity units for general corporate purposes.
In 2012, net cash provided by financing activities was
$119,415,000
. Our net increase in borrowings of $129,416,000 was principally used to fund our acquisition of Credo and our real estate development and acquisition expenditures and our investment in oil and gas properties. We paid $5,883,000 in financing fees primarily related to the amendment and extension of our senior secured credit facility. Also, in 2012, our other consolidated debt decreased by $57,491,000, of which $26,500,000 was due to the sale of Broadstone Memorial, a 401-unit multifamily investment property in Houston and the buyer’s assumption of the debt and $30,991,000 was due to our consolidated venture’s bulk sale of 800 acres in Dallas and the buyer’s assumption of debt. We also purchased about 94,450 shares of our common stock for $1,409,000 which was offset by $1,159,000 in proceeds from exercise of stock options.
Real Estate Acquisition and Development Activities
We secure entitlements and develop infrastructure, primarily for single family residential and mixed-use communities. We also develop and own directly or through ventures multifamily communities as income producing properties, primarily in our target markets. Once these multifamily communities reach stabilization, we generally market the properties for sale.
We categorize real estate development and acquisition expenditures as operating activities on the statement of cash flows. These development and acquisition expenditures include costs for development of residential lots and mixed-used communities and multifamily community projects we develop and sell principally as a merchant builder.
49
A summary of our real estate acquisition and development expenditures is shown below:
|
2014
|
2013
|
2012
|
||||||||||||
|
(In thousands)
|
||||||||||||||
|
Community Development
|
Market
|
|||||||||||||
|
Acquisitions:
|
||||||||||||||
|
Bel-Aire
|
Atlanta
|
$
|
—
|
|
$
|
—
|
|
$
|
548
|
|
||||
|
Heron Pond
|
Atlanta
|
—
|
|
—
|
|
1,003
|
|
|||||||
|
Lakes of Prosper
|
Dallas
|
—
|
|
—
|
|
8,951
|
|
|||||||
|
CL Realty/TEMCO
|
Various
|
—
|
|
—
|
|
22,468
|
|
|||||||
|
Habersham
|
Charlotte
|
—
|
|
3,878
|
|
—
|
|
|||||||
|
Park Place
|
Dallas
|
—
|
|
2,177
|
|
—
|
|
|||||||
|
Morgan Farms
|
Nashville
|
146
|
|
6,841
|
|
—
|
|
|||||||
|
Woodtrace
|
Houston
|
8,622
|
|
—
|
|
—
|
|
|||||||
|
Imperial Forest
|
Houston
|
5,343
|
|
—
|
|
—
|
|
|||||||
|
Beckwith Crossing
|
Nashville
|
1,294
|
|
—
|
|
—
|
|
|||||||
|
River's Edge
|
Dallas
|
1,277
|
|
—
|
|
—
|
|
|||||||
|
Weatherford Estates
|
Nashville
|
855
|
|
—
|
|
—
|
|
|||||||
|
Development:
|
||||||||||||||
|
Owned projects
|
Various
|
50,506
|
|
46,314
|
|
17,073
|
|
|||||||
|
Consolidated venture projects
|
Various
|
3,905
|
|
19,567
|
|
13,701
|
|
|||||||
|
Multifamily
|
||||||||||||||
|
Acquisitions and Development:
|
||||||||||||||
|
Pre-acquisition projects
|
Various
|
910
|
|
797
|
|
962
|
|
|||||||
|
Promesa
|
Austin
|
—
|
|
—
|
|
16,783
|
|
|||||||
|
Eleven
(a)
|
Austin
|
—
|
|
—
|
|
(3,157
|
)
|
|||||||
|
360°
(a)
|
Denver
|
—
|
|
—
|
|
(6,572
|
)
|
|||||||
|
Midtown
|
Dallas
|
25,034
|
|
4,232
|
|
87
|
|
|||||||
|
Acklen
(a)
|
Nashville
|
(7,191
|
)
|
1,048
|
|
10,937
|
|
|||||||
|
HiLine
(a)
|
Denver
|
(9,372
|
)
|
14,272
|
|
—
|
|
|||||||
|
Dilworth
|
Charlotte
|
2,905
|
|
5,845
|
|
5,954
|
|
|||||||
|
Music Row
|
Nashville
|
6,757
|
|
—
|
|
—
|
|
|||||||
|
Downtown Edge
|
Austin
|
11,286
|
|
—
|
|
—
|
|
|||||||
|
West Austin
|
Austin
|
8,456
|
|
—
|
|
—
|
|
|||||||
|
Undeveloped Land/Mitigation
|
||||||||||||||
|
Acquisitions:
|
||||||||||||||
|
Crescent Hills
|
San Antonio
|
1,829
|
|
—
|
|
—
|
|
|||||||
|
Cochran Creek
|
Atlanta
|
—
|
|
—
|
|
1,935
|
|
|||||||
|
Development:
|
||||||||||||||
|
Owned projects
|
Various
|
2,132
|
|
1,638
|
|
1,267
|
|
|||||||
|
Total
|
$
|
114,694
|
|
$
|
106,609
|
|
$
|
91,940
|
|
|||||
_____________________
|
(a)
|
Includes reimbursements received from the ventures for land and pre-development costs.
|
Oil and Gas Drilling and Other Exploration and Development Activities
In 2014, we drilled or participated as a non-operator in approximately 119 gross wells (57 net). At year-end 2014, we had interests in
944
gross productive wells.
In 2014, we acquired leasehold interests principally in Nebraska, Kansas, Texas, Oklahoma and North Dakota for $25,719,000 representing over 141,000 net mineral acres. Also, leasehold interests of approximately 18,000 net mineral acres expired in the normal course of business in 2014, principally in Kansas and Nebraska.
50
Regional allocation of our capital expenditures incurred and paid for drilling and completion activity in
2014
is shown below:
|
|
Drilling and Completion Expenditures
|
||||||
|
2014
|
2013
|
||||||
|
|
(In thousands)
|
||||||
|
Bakken and Three Forks formations of North Dakota
|
$
|
40,270
|
|
$
|
34,985
|
|
|
|
Lansing - Kansas City formation of Nebraska and Kansas
|
18,899
|
|
13,592
|
|
|||
|
Other formations principally in Texas and Oklahoma
|
16,257
|
|
11,686
|
|
|||
|
$
|
75,426
|
|
$
|
60,263
|
|
||
Our total cash capital expenditures for leasehold acquisitions, drilling and completion costs were
$101,145,000
in
2014
and
$96,069,000
in
2013
.
Our planned capital expenditure for 2015 are expected to be reduced significantly compared with 2014 and are primarily related to existing well commitments in the Bakken/Three Forks formations.
Our 2015 capital expenditure budget is subject to various conditions, including third-party operator drilling plans, oilfield services and equipment availability, commodity prices and drilling results. Although a portion of our capital expenditure budget is allocated to acquiring additional leasehold interests, if we decide to pursue incremental leasehold acquisitions, it would require us to adjust our budget. Other factors that could cause us to adjust our budget include commodity prices, service or material costs, or the performance of wells.
Liquidity
Senior Credit Facility
In 2014, we amended our senior secured credit facility in order to consolidate previous amendments and to increase the revolving loan commitment from $200,000,000 to $300,000,000, extend the maturity date, increase the minimum interest coverage ratio from 1.50x to 2.50x, eliminate the collateral value to loan commitment ratio covenant and increase the maximum total leverage ratio from 40% to 50%. At year-end
2014
, our senior secured credit facility provides for a $300,000,000 revolving line of credit maturing May 15, 2017 (with two one-year extension options). The revolving line of credit may be prepaid at any time without penalty. The revolving line of credit includes a $100,000,000 sublimit for letters of credit, of which
$15,415,000
is outstanding at year-end
2014
. Total borrowings under our senior secured credit facility (including the face amount of letters of credit) may not exceed a borrowing base formula.
At year-end
2014
, net unused borrowing capacity under our senior secured credit facility is calculated as follows:
|
|
Senior
Credit Facility
|
||
|
|
(In thousands)
|
||
|
Borrowing base availability
|
$
|
300,000
|
|
|
Less: borrowings
|
—
|
|
|
|
Less: letters of credit
|
(15,415
|
)
|
|
|
Net unused borrowing capacity
|
$
|
284,585
|
|
Our net unused borrowing capacity during fourth quarter
2014
ranged from a high of
$284,660,000
to a low of
$284,585,000
. This facility is used primarily to fund our operating cash needs, which fluctuate due to timing of residential and commercial real estate sales, undeveloped land sales, oil and gas leasing, exploration and production activities and mineral lease bonus payments received, timber sales, reimbursements from utility and improvement districts, payment of payables and expenses and capital expenditures.
Our senior secured credit facility and other debt agreements contain financial covenants customary for such agreements including minimum levels of interest coverage and limitations on leverage. At year-end
2014
, we were in compliance with the financial covenants of these agreements.
51
The following table details our compliance with the financial and other covenants calculated as provided in the senior secured credit facility:
|
Financial Covenant
|
Requirement
|
Year-End
2014
|
|
|
Interest Coverage Ratio
(a)
|
≥ 2.50:1.0
|
5.27:1.0
|
|
|
Total Leverage Ratio
(b)
|
≤ 50%
|
39.7%
|
|
|
Net Worth
(c)
|
≥ $593.3 million
|
$669.3 million
|
|
_____________________
|
(a)
|
Calculated as EBITDA (earnings before interest, taxes, depreciation, depletion and amortization), plus non-cash compensation expense, plus other non-cash expenses, divided by interest expense excluding loan fees. This covenant is applied at the end of each quarter on a rolling four quarter basis.
|
|
(b)
|
Calculated as total funded debt divided by adjusted asset value. Total funded debt includes indebtedness for borrowed funds, secured liabilities, reimbursement obligations with respect to letters of credit or similar instruments, and our pro-rata share of joint venture debt outstanding. Adjusted asset value is defined as the sum of unrestricted cash and cash equivalents, timberlands, high value timberlands, raw entitled lands, entitled land under development, minerals business, Credo asset value, special improvement district receipts (SIDR) reimbursements value and other real estate owned at book value without regard to any indebtedness and our pro rata share of joint ventures’ book value without regard to any indebtedness. This covenant is applied at the end of each quarter.
|
|
(c)
|
Calculated as the amount by which consolidated total assets (excluding Credo acquisition goodwill over $50,000,000) exceeds consolidated total liabilities. At year-end
2014
, the requirement is $593,287,000 computed as: $593,287,000 plus 85 percent of the aggregate net proceeds received by us from any equity offering, plus 75 percent of all positive net income, on a cumulative basis. This covenant is applied at the end of each quarter.
|
To make additional investments, acquisitions, or distributions, we must maintain available liquidity equal to 10 percent of the aggregate commitments in place. At year-end
2014
the minimum liquidity requirement was
$30,000,000
, compared with
$452,798,000
in actual available liquidity based on the unused borrowing capacity under our senior secured credit facility plus unrestricted cash and cash equivalents. The failure to maintain such minimum liquidity does not constitute a default or event of default of our senior secured credit facility.
Discretionary investments in community development may be restricted in the event that the revenue/capital expenditure ratio is less than or equal to 1.0x. As of year-end
2014
, the revenue/capital expenditure ratio was 3.0x. Revenue is defined as total gross revenues (excluding revenues attributed to Credo and multifamily properties), plus our pro rata share of the operating revenues from unconsolidated ventures. Capital expenditures are defined as consolidated development and acquisition expenditures (excluding investments related to Credo and multifamily properties), plus our pro rata share of unconsolidated ventures’ development and acquisition expenditures.
In addition, we may elect to make distributions so long as the total leverage ratio is less than 40 percent, the interest coverage is greater than 3.0:1.0 and available liquidity is not less than $125,000,000.
8.50% Senior Secured Notes due 2022
On May 12, 2014, we issued $250,000,000 aggregate principal amount of 8.50% senior secured notes due 2022 in a private placement. The notes will pay interest semiannually and will mature on June 1, 2022. Net proceeds from the offering were used to retire the $200,000,000 term loan under our senior secured credit facility and pay transaction costs and expenses. The remaining net proceeds will be used for general corporate purposes, which may include strategic growth opportunities.
6.00% Tangible Equity Units
On November 27, 2013, we issued $150,000,000 aggregate principal amount of 6.00% tangible equity units (Units). The total offering was 6,000,000 Units, including an over-allotment option of 600,000 exercised by the underwriters, each with a stated amount of $25.00. Each Unit is comprised of (i) a prepaid stock purchase contract to be settled by delivery of a number of shares of our common stock, par value $1.00 per share to be determined pursuant to a purchase contract agreement, and (ii) a senior amortizing note due December 15, 2016 that has an initial principal amount of $4.2522, bears interest at a rate of 4.50% per annum and has a final installment payment date of December 15, 2016. The aggregate principal amount of the senior amortizing notes is $25,619,000. The aggregate number of shares we may issue upon settlement of the stock purchase contracts will between 6,547,900 shares (the minimum settlement rate) and 7,857,500 (the maximum settlement rate).
Net proceeds of $144,998,000 from the issuance of the Units were designated for general corporate purposes, including investments in strategic growth opportunities.
52
3.75% Convertible Senior Notes due 2020
On February 26, 2013, we issued $125,000,000 aggregate principal amount of 3.75% Convertible Senior Notes due 2020. The convertible senior notes pay interest semiannually at a rate of 3.75 percent per annum and mature on March 1, 2020. The convertible senior notes have an initial conversion rate of 40.8351 per $1,000 principal amount (equivalent to a conversion price of approximately $24.49 per share of common stock and a conversion premium of 37.5 percent based on the closing share price of $17.81 per share of our common stock on February 20, 2013). The initial conversion rate is subject to adjustment upon the occurrence of certain events. Prior to November 1, 2019, the convertible senior notes are convertible only upon certain circumstances, and thereafter are convertible at any time prior to the close of business on the second scheduled trading day prior to maturity. Upon conversion, holders will receive cash, shares of our common stock or a combination thereof at our election.
Net proceeds from the offering were used to repay $68,000,000 under our revolving line of credit, the balance to be used for general corporate purposes, including investments in oil and gas exploration and drilling and real estate acquisition and development.
Contractual Obligations
At year-end
2014
, contractual obligations consist of:
|
|
Payments Due or Expiring by Year
|
|||||||||||||||||||
|
|
Total
|
2015
|
2016-17
|
2018-19
|
Thereafter
|
|||||||||||||||
|
|
(In thousands)
|
|||||||||||||||||||
|
Debt
(a)
|
$
|
432,744
|
|
$
|
49,535
|
|
$
|
30,015
|
|
$
|
—
|
|
$
|
353,194
|
|
|||||
|
Interest payments on debt
|
186,822
|
|
28,048
|
|
52,992
|
|
51,876
|
|
53,906
|
|
||||||||||
|
Purchase obligations
|
26,637
|
|
26,637
|
|
—
|
|
—
|
|
—
|
|
||||||||||
|
Operating leases
|
14,540
|
|
3,308
|
|
6,212
|
|
2,736
|
|
2,284
|
|
||||||||||
|
Performance bond
(a)
|
9,010
|
|
9,010
|
|
—
|
|
—
|
|
—
|
|
||||||||||
|
Standby letter of credit
(a)
|
6,845
|
|
6,845
|
|
—
|
|
—
|
|
—
|
|
||||||||||
|
Total
|
$
|
676,598
|
|
$
|
123,383
|
|
$
|
89,219
|
|
$
|
54,612
|
|
$
|
409,384
|
|
|||||
_____________________
|
(a)
|
Items included in our balance sheet.
|
Interest payments on debt include interest payments related to our fixed rate debt and estimated interest payments related to our variable rate debt. Estimated interest payments on variable rate debt were calculated assuming that the outstanding balances and interest rates that existed at year-end
2014
remain constant through maturity.
Purchase obligations are defined as legally binding and enforceable agreements to purchase goods and services. Our purchase obligations include commitments of $17,599,000 for land acquisition and development primarily related to community development projects and commitments of $9,038,000 for engineering and construction contracts associated with multifamily projects. The multifamily project obligations typically are reimbursed by equity method ventures on jointly owned projects or funded by construction loan draws on wholly-owned projects.
Our operating leases are for facilities, equipment and groundwater. We lease approximately 32,000 square feet of office space in Austin, Texas as our corporate headquarters. At year-end
2014
, the remaining contractual obligation for our Austin office is
$5,632,000
. We also lease office space in several other locations in support of our business operations with approximately
21,000
and
10,000
square feet in Ft. Worth, Texas and Denver, Colorado. The total remaining contractual obligations for these leases is
$6,262,000
. Also included are groundwater leases for about
20,000
acres in central Texas with remaining contractual obligations of
$1,514,000
.
The performance bond and standby letter of credit were provided in support of a bond issuance by CCSID. Please read
Cibolo Canyons — San Antonio, Texas
for additional information.
53
Off-Balance Sheet Arrangements
From time to time, we enter into off-balance sheet arrangements to facilitate our operating activities. At year-end
2014
, our off-balance sheet unfunded arrangements, excluding contractual interest payments, purchase obligations, operating lease obligations and venture contributions included in the table of contractual obligations, consist of:
|
|
Payments Due or Expiring by Year
|
||||||||||||||||||
|
|
Total
|
2015
|
2016-17
|
2018-19
|
Thereafter
|
||||||||||||||
|
|
(In thousands)
|
||||||||||||||||||
|
Performance bonds
|
$
|
11,624
|
|
$
|
11,624
|
|
$
|
—
|
|
$
|
—
|
|
$
|
—
|
|
||||
|
Standby letters of credit
|
8,569
|
|
7,850
|
|
719
|
|
—
|
|
—
|
|
|||||||||
|
Recourse obligations
|
1,095
|
|
658
|
|
45
|
|
109
|
|
283
|
|
|||||||||
|
Total
|
$
|
21,288
|
|
$
|
20,132
|
|
$
|
764
|
|
$
|
109
|
|
$
|
283
|
|
||||
Performance bonds, letters of credit and recourse obligations provided on behalf of certain ventures would be drawn on due to failure to satisfy construction obligations as general contractor or for failure to timely deliver streets and utilities in accordance with local codes and ordinances.
In 2014, FMF Littleton LLC, an equity method venture in which we own a 25 percent interest, obtained a senior secured construction loan in the amount of $46,384,000 to develop a 385-unit multifamily project located in Littleton, Colorado. There was
no
outstanding balance at year-end
2014
. We provided the lender with a guaranty of completion of the improvements; a guaranty for repayment of 25 percent of the principal balance and unpaid accrued interest; and a standard nonrecourse carve-out guaranty. The principal guaranty will reduce from 25 percent of principal to ten percent upon achievement of certain conditions.
In 2014, CREA FMF Nashville LLC, an equity method venture in which we own a 30 percent interest, obtained a senior secured construction loan in the amount of $51,950,000 to develop a 320-unit multifamily project located in Nashville, Tennessee. The outstanding balance at year-end
2014
was
$29,660,000
. We provided the lender with a guaranty of completion of the improvements; a guaranty for repayment of 25 percent of the principal balance and unpaid accrued interest; and a standard nonrecourse carve-out guaranty. The principal guaranty will reduce from 25 percent of principal to zero percent
upon achievement of certain conditions.
In 2012, FMF Peakview LLC, an equity method venture in which we own a 20 percent interest, obtained a senior secured construction loan in the amount of $31,550,000 to develop a 304-unit multifamily property in Denver, of which
$23,070,000
was outstanding at year-end
2014
. We have a construction completion guaranty, a repayment guaranty for 25 percent of the principal and unpaid accrued interest, and a standard non-recourse carve-out guaranty.
At year-end
2014
, we participate in
four
equity method partnerships that are variable interest entities. The partnerships have total assets of
$64,311,000
and total liabilities of
$79,723,000
, which includes
$30,667,000
of borrowings classified as current maturities. These partnerships are managed by third parties who intend to extend or refinance these borrowings; however, there is no assurance that this can be done. Although these borrowings are guaranteed by third parties, we may under certain circumstances elect or be required to provide additional equity to these partnerships. We do not believe that the ultimate resolution of these matters will have a significant effect on our earnings or financial position. Our investment in these partnerships is
$9,500,000
at year-end
2014
.
Cibolo Canyons — San Antonio, Texas
Cibolo Canyons consists of the JW Marriott
®
San Antonio Hill Country Resort & Spa development owned by third parties and a mixed-use development we own. We have about
$53,313,000
invested in Cibolo Canyons at year-end
2014
, all of which is related to the mixed-use development.
Resort Hotel, Spa and Golf Development
In 2007, we entered into agreements to facilitate third-party construction and ownership of the JW Marriott
®
San Antonio Hill Country Resort & Spa, which includes a 1,002 room destination resort and two PGA Tour
®
Tournament Players Club
®
(TPC) golf courses. Under these agreements, we agreed to transfer to third-party owners 700 acres of undeveloped land, to provide $30,000,000 cash and to provide $12,700,000 of other consideration principally consisting of golf course construction materials, all of which has been provided.
In exchange for our commitment to the resort, the third-party owners assigned to us certain rights under an agreement between the third-party owners and CCSID. This agreement includes the right to receive from CCSID nine percent of hotel occupancy revenues and 1.5 percent of other resort sales revenues collected as taxes by the CCSID through 2034. The amount we receive will be net of annual ad valorem tax reimbursements by CCSID to the third-party owners of the resort through 2020.
54
In addition, these payments will be net of debt service on bonds issued by CCSID collateralized by hotel occupancy tax and other resort sales tax through 2034.
The amounts we collect under this agreement are dependent on several factors including the amount of revenues generated by and ad valorem taxes imposed on the resort and the amount of any applicable debt service incurred by CCSID.
In 2014, we received $50,550,000 from CCSID under 2007 EDA related to development of the Resort at our Cibolo Canyons project near San Antonio, of which $46,500,000 was related to CCSID's issuance of $48,900,000 HOT and Sales and Use Tax Revenue Bonds. These bonds are obligations solely of CCSID and are payable from HOT and sales and use taxes levied on the Resort by CCSID. To facilitate the issuance of the bonds, we provided a $6,846,000 letter of credit to the bond trustee as security for certain debt service fund obligations in the event CCSID tax collections are not sufficient to support payment of the bonds in accordance with their terms. The letter of credit must be maintained until the earlier of redemption of the bonds or scheduled bond maturity in 2034. We also entered into an agreement with SARE, owner of the Resort, to assign SARE’s senior rights under the EDA to us in exchange for consideration provided by us, including a surety bond to be drawn if CCSID tax collections are not sufficient to support ad valorem tax rebates payable to SARE. The surety bond has a balance of $9,010,000 at year-end 2014. The surety bond will decrease as CCSID makes annual ad valorem tax rebate payments to SARE, which obligation is scheduled to be retired in full by 2020. As a result of these transactions, we recorded a gain of $6,577,000 after recovery of our full resort investment of $24,067,000. All future receipts are expected to be recognized as gains in the period collected.
Mixed-Use Development
The mixed-use development we own consists of 2,100 acres planned to include about
1,769
residential lots and about 150 commercial acres designated for multifamily and retail uses, of which
911
lots and
130
commercial acres have been sold through year-end
2014
.
In 2007, we entered into an agreement with CCSID providing for reimbursement of certain infrastructure costs related to the mixed-use development. Reimbursements are subject to review and approval by CCSID and unreimbursed amounts accrue interest at 9.75 percent. CCSID’s funding for reimbursements is principally derived from its ad valorem tax collections and bond proceeds collateralized by ad valorem taxes, less debt service on these bonds and annual administrative and public service expenses.
Because the amount of each reimbursement is dependent on several factors, including timing of CCSID approval and CCSID having an adequate tax base to generate funds that can be used to reimburse us, there is uncertainty as to the amount and timing of reimbursements under this agreement. We expect to recover our investment from lot and tract sales and reimbursement of approved infrastructure costs from CCSID. We have not recognized income from interest due, but not collected. As these uncertainties are clarified, we will modify our accounting accordingly.
Through year-end
2014
, we have submitted $65,465,000 for reimbursement and received approval for $57,322,000 of infrastructure costs, of which we have received reimbursements totaling $33,552,000, of which $9,883,000 was received in 2014, $600,000 was received in 2013, $550,000 was received in 2012, all were accounted for as a reduction of our investment in the mixed-use development. At year-end
2014
, we have $31,913,000 in pending reimbursements, excluding interest. At year-end
2014
, we have
$53,313,000
invested in the mixed-use development.
Accounting Policies
Critical Accounting Estimates
In preparing our financial statements, we follow generally accepted accounting principles, which in many cases require us to make assumptions, estimates, and judgments that affect the amounts reported. Our significant accounting policies are included in Note 1 to the Consolidated Financial Statements. Many of these principles are relatively straightforward. There are, however, a few accounting policies that are critical because they are important in determining our financial condition and results of operations and involve significant assumptions, estimates and judgments that are difficult to determine. We must make these assumptions, estimates and judgments currently about matters that are inherently uncertain, such as future economic conditions, operating results and valuations, as well as our intentions. As the difficulty increases, the level of precision decreases, meaning actual results can, and probably will, differ from those currently estimated. We base our assumptions, estimates and judgments on a combination of historical experiences and other factors that we believe are reasonable. We have reviewed the selection and disclosure of these critical accounting estimates with our Audit Committee.
|
•
|
Investment in Real Estate and Cost of Real Estate Sales
— In allocating costs to real estate owned and real estate sold, we must estimate current and future real estate values. Our estimates of future real estate values sometimes must extend over periods 15 to 20 years from today and are dependent on numerous assumptions including our intentions and future market and economic conditions. In addition, when we sell real estate from projects that are not finished, we must estimate future development costs through completion. Differences between our estimates and actual results will affect future carrying values and operating results.
|
55
|
•
|
Impairment of Real Estate Long-Lived Assets
— Measuring real assets for impairment requires estimating the future undiscounted cash flows based on our intentions as to holding periods, and the residual value of assets under review, primarily undeveloped land. If the carrying amount exceeds the estimated undiscounted future cash flows, we will adjust the carrying amount of the real estate long-lived assets to fair value. Depending on the asset under review, we use varying methods to determine fair value, such as discounting expected future cash flows, determining resale values by market, or applying a capitalization rate to net operating income using prevailing rates in a given market. Changes in economic conditions, demand for real estate, and the projected net operating income for a specific property will inevitably change our estimates.
|
|
•
|
Accrued Oil and Gas Revenue
— We recognize revenue as oil and gas is produced and sold. There are a significant amount of oil and gas properties which we do not operate and, therefore, revenue is typically recorded in the month of production based on an estimate of our share of volumes produced and prices realized. We obtain the most current available production data from the operators and price indices for each well to estimate the accrual of revenue. Obtaining production data on a timely basis for some wells is not feasible; therefore we utilize past production receipts and estimated sales price information to estimate accrual of working interest revenue on all other non-operated wells each month. Revisions to such estimates are recorded as actual results become known.
|
|
•
|
Impairment of Oil and Gas Properties
— We review our proved oil and gas properties for impairment whenever events and circumstances indicate that a decline in the recoverability of their carrying value may have occurred. We estimate the expected undiscounted future cash flows of our oil and gas properties and compare such undiscounted future cash flows to the carrying amount of the oil and gas properties to determine if the carrying amount is recoverable. If the carrying amount exceeds the estimated undiscounted future cash flows, we will adjust the carrying amount of the oil and gas properties to fair value. The factors used to determine fair value are subject to our judgment and expertise and include, but are not limited to, recent sales prices of comparable properties, the present value of future cash flows, net of estimated operating and development costs using estimates of proved reserves, future commodity pricing, future production estimates, anticipated capital expenditures, and various discount rates commensurate with the risk and current market conditions associated with realizing the expected cash flows projected. Because of the uncertainty inherent in these factors, we cannot predict when or if future impairment charges for proved properties will be recorded.
|
The assessment of unproved properties to determine any possible impairment requires significant judgment. We assess our unproved properties periodically for impairment on a property-by-property basis based on remaining lease terms, drilling results or future plans to develop acreage. Due to the uncertainty inherent in these factors, we cannot predict the amount of impairment charges that may be recorded in the future.
|
•
|
Oil and Gas Reserves —
The estimation of oil and gas reserves is a significant estimate which affects the amount of non-cash depletion expense we record as well as impairment analysis we perform. On an annual basis, we engage an independent petroleum engineering firm to assist us in preparing estimates of crude oil and gas reserves based on available geologic and seismic data, reservoir pressure data, core analysis reports, well logs, analogous reservoir performance history, production data and other available sources of engineering, geological and geophysical information. Oil and gas prices are volatile and largely affected by worldwide or domestic production and consumption and are outside our control.
|
|
•
|
Asset Retirement Obligations
— We make estimates of the future costs of the retirement obligations of our producing oil and gas properties. Estimating future costs involves significant assumptions and judgments regarding such factors as estimated costs of plugging and abandonment, timing of settlements, discount rates and inflation rates. Such cost estimates could be subject to significant revisions in subsequent years due to changes in regulatory requirements, technological advances and other factors which may be difficult to predict.
|
|
•
|
Impairment of Goodwill
— Measuring goodwill for impairment annually requires estimation of future cash flows and determination of fair values using many assumptions and inputs, including estimated future selling prices and volumes, estimated future costs to develop and explore, observable market inputs, weighted average cost of capital, estimated operating expenses and various other projected economic factors. Changes in economic and operating conditions can affect these assumptions and could result in additional interim testing and goodwill impairment charges in the future periods.
|
|
•
|
Share-Based Compensation
— We use the Black-Scholes option pricing model to determine the fair value of stock options. The determination of the fair value of share-based payment awards on the date of grant using an option-pricing model is affected by the stock price as well as assumptions regarding a number of other variables. These variables include expected stock price volatility over the term of the awards, actual and projected employee stock option exercise behaviors (term of option), risk-free interest rate and expected dividends. We have limited historical experience as a stand-alone company so we utilized alternative methods in determining our valuation assumptions.
|
56
The expected life was based on the simplified method utilizing the midpoint between the vesting period and the contractual life of the awards. The expected stock price volatility was based on a blended rate utilizing our historical volatility and historical prices of our peers’ common stock for a period corresponding to the expected life of the options. Pre-vesting forfeitures are estimated based upon the pool of participants and their expected activity and historical trends. We use Monte Carlo simulation pricing model to determine the fair value of market-leveraged stock units (MSU's). A typical Monte Carlo exercise simulates a distribution of stock prices to yield an expected distribution of stock prices at the end of the performance period. The simulations are repeated many times in order to derive a probabilistic assessment of stock performance. The stock-paths are simulated using assumptions which include expected stock price volatility and risk-free interest rate.
|
•
|
Income Taxes
— In preparing our consolidated financial statements, significant judgment is required to estimate our income taxes. Our estimates are based on our interpretation of federal and state tax laws. We estimate our actual current tax due and assess temporary and permanent differences resulting from differing treatment of items for tax and accounting purposes. The temporary differences result in deferred tax assets and liabilities, which are included in our consolidated balance sheet. If needed, we record a valuation allowance against our deferred tax assets. In addition, when we believe a tax position is supportable but the outcome uncertain, we include the item in our tax return but do not recognize the related benefit in our provision for taxes. Instead, we record a reserve for unrecognized tax benefits, which represents our expectation of the most likely outcome considering the technical merits and specific facts of the position. Changes to liabilities are only made when an event occurs that changes the most likely outcome, such as settlement with the relevant tax authority, expiration of statutes of limitations, changes in tax law, or recent court rulings. Adjustments to temporary differences, permanent differences or uncertain tax positions could materially impact our financial position, cash flow and results of operation.
|
Adopted and Pending Accounting Pronouncements
We adopted several new accounting pronouncements in 2014, the adoption of which did not have a significant effect on our earnings or financial position. There is one pending accounting pronouncement that we will be required to adopt in 2016, which we are currently evaluating its impact on our earnings, financial position and disclosures. Please read
Note 2 — New and Pending Accounting Pronouncement
s to the Consolidated Financial Statements.
Effects of Inflation
Inflation has had minimal effects on operating results the past three years. Our real estate, oil and gas properties, timber, and property and equipment are carried at historical costs. If carried at current replacement costs, the cost of real estate sold, timber cut, and depreciation expense would have been significantly higher than what we reported.
Legal Proceedings
We are involved in various legal proceedings that arise from time to time in the ordinary course of doing business. We believe we have established adequate reserves for any probable losses, and we do not believe that the outcome of any of these proceedings should have a material adverse effect on our financial position, long-term results of operations, or cash flow. It is possible, however, that charges related to these matters could be significant to results of operations or cash flows in any one accounting period.
57
|
Item 7A.
|
Quantitative and Qualitative Disclosures About Market Risk.
|
Interest Rate Risk
Our interest rate risk is principally related to our variable-rate debt. Interest rate changes impact earnings due to the resulting increase or decrease in our variable-rate debt, which was
$62,396,000
at year-end
2014
.
The following table illustrates the estimated effect on our pre-tax income of immediate, parallel, and sustained shifts in interest rates for the next 12 months on our variable-rate debt at year-end
2014
. This estimate assumes that debt reductions from contractual payments will be replaced with short-term, variable-rate debt; however, that may not be the financing alternative we choose.
|
|
Year-End
|
||
|
Change in Interest Rates
|
2014
|
||
|
|
(In thousands)
|
||
|
2%
|
$
|
(1,068
|
)
|
|
1%
|
$
|
(624
|
)
|
|
(1)%
|
$
|
624
|
|
|
(2)%
|
$
|
1,248
|
|
Foreign Currency Risk
We have no exposure to foreign currency fluctuations.
Commodity Price Risk
We have exposure to commodity price fluctuations from our oil and gas production which can materially affect our revenues and cash flows. The prices we receive for our production depend on numerous factors beyond our control. Based on our 2014 production, a 10% decrease in our average realized price received for oil and gas would have reduced our oil and gas production revenues by $7,507,000 and $785,000. To manage our exposure to commodity price risks associated with the sale of oil and gas, we may periodically enter into derivative hedging transactions for a portion of our estimated production. We do not have any commodity derivative positions outstanding at year-end
2014
.
58
|
Item 8.
|
Financial Statements and Supplementary Data.
|
Index to Financial Statements
|
|
Page
|
|
Audited Financial Statements
|
|
|
Financial Statement Schedule
|
|
59
MANAGEMENT’S ANNUAL REPORT ON
INTERNAL CONTROL OVER FINANCIAL REPORTING
The management of Forestar is responsible for establishing and maintaining adequate internal control over financial reporting. Management has designed our internal control over financial reporting to provide reasonable assurance that our published financial statements are fairly presented, in all material respects, in conformity with generally accepted accounting principles.
Management is required by paragraph (c) of Rule 13a-15 of the Securities Exchange Act of 1934, as amended, to assess the effectiveness of our internal control over financial reporting as of each year end. In making this assessment, management used the
Internal Control — Integrated Framework (2013)
by the Committee of Sponsoring Organizations of the Treadway Commission (COSO).
Management conducted the required assessment of the effectiveness of our internal control over financial reporting as of year-end. Based upon this assessment, management believes that our internal control over financial reporting is effective as of year-end
2014
.
Ernst & Young LLP, the independent registered public accounting firm that audited our financial statements included in this Form 10-K, has also audited our internal control over financial reporting. Their attestation report follows this report of management.
60
REPORT OF INDEPENDENT REGISTERED PUBLIC ACCOUNTING FIRM
The Board of Directors and Shareholders of Forestar Group Inc.
We have audited Forestar Group Inc.’s internal control over financial reporting as of
December 31, 2014
, based on criteria established in Internal Control-Integrated Framework issued by the Committee of Sponsoring Organizations of the Treadway Commission (2013 framework) (the COSO criteria). Forestar Group Inc.’s management is responsible for maintaining effective internal control over financial reporting, and for its assessment of the effectiveness of internal control over financial reporting included in the accompanying Management’s Annual Report on Internal Control over Financial Reporting. Our responsibility is to express an opinion on the company’s internal control over financial reporting based on our audit.
We conducted our audit in accordance with the standards of the Public Company Accounting Oversight Board (United States). Those standards require that we plan and perform the audit to obtain reasonable assurance about whether effective internal control over financial reporting was maintained in all material respects. Our audit included obtaining an understanding of internal control over financial reporting, assessing the risk that a material weakness exists, testing and evaluating the design and operating effectiveness of internal control based on the assessed risk, and performing such other procedures as we considered necessary in the circumstances. We believe that our audit provides a reasonable basis for our opinion.
A company’s internal control over financial reporting is a process designed to provide reasonable assurance regarding the reliability of financial reporting and the preparation of financial statements for external purposes in accordance with generally accepted accounting principles. A company’s internal control over financial reporting includes those policies and procedures that (1) pertain to the maintenance of records that, in reasonable detail, accurately and fairly reflect the transactions and dispositions of the assets of the company; (2) provide reasonable assurance that transactions are recorded as necessary to permit preparation of financial statements in accordance with generally accepted accounting principles, and that receipts and expenditures of the company are being made only in accordance with authorizations of management and directors of the company; and (3) provide reasonable assurance regarding prevention or timely detection of unauthorized acquisition, use, or disposition of the company’s assets that could have a material effect on the financial statements.
Because of its inherent limitations, internal control over financial reporting may not prevent or detect misstatements. Also, projections of any evaluation of effectiveness to future periods are subject to the risk that controls may become inadequate because of changes in conditions, or that the degree of compliance with the policies or procedures may deteriorate.
In our opinion, Forestar Group Inc.
maintained, in all material respects, effective internal control over financial reporting as of
December 31, 2014
, based on the COSO criteria.
We also have audited, in accordance with the standards of the Public Company Accounting Oversight Board (United States), the consolidated balance sheets of Forestar Group Inc. as of
December 31, 2014
and
2013
, and the related consolidated statements of income and comprehensive income, equity, and cash flows for each of the three years in the period ended
December 31, 2014
of Forestar Group Inc. and our report dated
March 6, 2015
expressed an unqualified opinion thereon.
/s/ Ernst & Young LLP
Austin, Texas
March 6, 2015
61
REPORT OF INDEPENDENT REGISTERED PUBLIC ACCOUNTING FIRM
The Board of Directors and Shareholders of Forestar Group Inc.
We have audited the accompanying consolidated balance sheets of Forestar Group Inc. as of
December 31, 2014
and
2013
, and the related consolidated statements of income and comprehensive income
,
equity, and cash flows for each of the three years in the period ended
December 31, 2014
. Our audits also included the financial statement schedule listed in the Index at Item 15(a). These financial statements and schedule are the responsibility of the Company's management. Our responsibility is to express an opinion on these financial statements and schedule based on our audits.
We conducted our audits in accordance with the standards of the Public Company Accounting Oversight Board (United States). Those standards require that we plan and perform the audit to obtain reasonable assurance about whether the financial statements are free of material misstatement. An audit includes examining, on a test basis, evidence supporting the amounts and disclosures in the financial statements. An audit also includes assessing the accounting principles used and significant estimates made by management, as well as evaluating the overall financial statement presentation. We believe that our audits provide a reasonable basis for our opinion.
In our opinion, the financial statements referred to above present fairly, in all material respects, the consolidated financial position of Forestar Group Inc. at
December 31, 2014
and
2013
, and the consolidated results of its operations and its cash flows for each of the three years in the period ended
December 31, 2014
, in conformity with U.S. generally accepted accounting principles. Also, in our opinion, the related financial statement schedule, when considered in relation to the basic financial statements taken as a whole, presents fairly in all materials respects the information set forth therein.
As discussed in Note 2 to the consolidated financial statements, the Company changed its method for reporting discontinued operations effective April 1, 2014.
We also have audited, in accordance with the standards of the Public Company Accounting Oversight Board (United States), Forestar Group Inc.’s internal control over financial reporting as of
December 31, 2014
, based on criteria established in Internal Control-Integrated Framework issued by the Committee of Sponsoring Organizations of the Treadway Commission (2013 framework) and our report dated
March 6, 2015
expressed an unqualified opinion thereon.
/s/ Ernst & Young LLP
Austin, Texas
March 6, 2015
62
FORESTAR GROUP INC.
|
|
At Year-End
|
||||||
|
|
2014
|
2013
|
|||||
|
|
(In thousands, except
share data)
|
||||||
|
ASSETS
|
|||||||
|
Cash and cash equivalents
|
$
|
170,127
|
|
$
|
192,307
|
|
|
|
Real estate, net
|
575,756
|
|
519,464
|
|
|||
|
Oil and gas properties and equipment, net
|
263,493
|
|
232,641
|
|
|||
|
Investment in unconsolidated ventures
|
65,005
|
|
41,147
|
|
|||
|
Timber
|
8,315
|
|
10,947
|
|
|||
|
Receivables, net
|
24,589
|
|
39,252
|
|
|||
|
Income taxes receivable
|
7,503
|
|
—
|
|
|||
|
Prepaid expenses
|
6,000
|
|
5,136
|
|
|||
|
Property and equipment, net
|
11,627
|
|
6,112
|
|
|||
|
Deferred tax asset, net
|
40,624
|
|
40,398
|
|
|||
|
Goodwill and other intangible assets
|
66,131
|
|
66,646
|
|
|||
|
Other assets
|
19,029
|
|
18,102
|
|
|||
|
TOTAL ASSETS
|
$
|
1,258,199
|
|
$
|
1,172,152
|
|
|
|
LIABILITIES AND EQUITY
|
|||||||
|
Accounts payable
|
$
|
20,400
|
|
$
|
21,409
|
|
|
|
Accrued employee compensation and benefits
|
8,323
|
|
5,814
|
|
|||
|
Accrued property taxes
|
5,966
|
|
3,822
|
|
|||
|
Accrued interest
|
3,451
|
|
2,343
|
|
|||
|
Income taxes payable
|
—
|
|
3,876
|
|
|||
|
Earnest money deposits
|
10,045
|
|
10,854
|
|
|||
|
Other accrued expenses
|
35,729
|
|
26,851
|
|
|||
|
Other liabilities
|
31,799
|
|
24,379
|
|
|||
|
Debt
|
432,744
|
|
357,407
|
|
|||
|
TOTAL LIABILITIES
|
548,457
|
|
456,755
|
|
|||
|
COMMITMENTS AND CONTINGENCIES
|
|
|
|||||
|
EQUITY
|
|||||||
|
Forestar Group Inc. shareholders’ equity:
|
|||||||
|
Preferred stock, par value $0.01 per share, 25,000,000 authorized shares, none issued
|
—
|
|
—
|
|
|||
|
Common stock, par value $1.00 per share, 200,000,000 authorized shares, 36,946,603 issued at December 31, 2014 and December 31, 2013
|
36,947
|
|
36,947
|
|
|||
|
Additional paid-in capital
|
558,945
|
|
556,676
|
|
|||
|
Retained earnings
|
167,001
|
|
150,418
|
|
|||
|
Treasury stock, at cost, 3,485,278 shares at December 31, 2014 and 2,199,666 shares at December 31, 2013
|
(55,691
|
)
|
(34,196
|
)
|
|||
|
Total Forestar Group Inc. shareholders’ equity
|
707,202
|
|
709,845
|
|
|||
|
Noncontrolling interests
|
2,540
|
|
5,552
|
|
|||
|
TOTAL EQUITY
|
709,742
|
|
715,397
|
|
|||
|
TOTAL LIABILITIES AND EQUITY
|
$
|
1,258,199
|
|
$
|
1,172,152
|
|
|
Please read the notes to the consolidated financial statements.
63
FORESTAR GROUP INC.
|
|
For the Year
|
||||||||||
|
|
2014
|
2013
|
2012
|
||||||||
|
|
(In thousands, except per share amounts)
|
||||||||||
|
REVENUES
|
|||||||||||
|
Real estate sales and other
|
$
|
171,672
|
|
$
|
152,684
|
|
$
|
81,459
|
|
||
|
Commercial and income producing properties
|
41,440
|
|
95,327
|
|
38,656
|
|
|||||
|
Real estate
|
213,112
|
|
248,011
|
|
120,115
|
|
|||||
|
Oil and gas
|
84,300
|
|
72,313
|
|
44,220
|
|
|||||
|
Other natural resources
|
9,362
|
|
10,721
|
|
8,256
|
|
|||||
|
306,774
|
|
331,045
|
|
172,591
|
|
||||||
|
EXPENSES
|
|||||||||||
|
Cost of real estate sales and other
|
(86,432
|
)
|
(76,628
|
)
|
(40,400
|
)
|
|||||
|
Cost of commercial and income producing properties
|
(37,332
|
)
|
(80,166
|
)
|
(29,639
|
)
|
|||||
|
Cost of oil and gas producing activities
|
(98,371
|
)
|
(42,067
|
)
|
(10,842
|
)
|
|||||
|
Cost of other natural resources
|
(3,006
|
)
|
(2,033
|
)
|
(2,995
|
)
|
|||||
|
Other operating
|
(58,683
|
)
|
(60,359
|
)
|
(55,213
|
)
|
|||||
|
General and administrative
|
(22,230
|
)
|
(28,376
|
)
|
(32,320
|
)
|
|||||
|
(306,054
|
)
|
(289,629
|
)
|
(171,409
|
)
|
||||||
|
GAIN ON SALE OF ASSETS
|
38,038
|
|
5,161
|
|
25,983
|
|
|||||
|
OPERATING INCOME
|
38,758
|
|
46,577
|
|
27,165
|
|
|||||
|
Equity in earnings of unconsolidated ventures
|
8,685
|
|
8,737
|
|
14,469
|
|
|||||
|
Interest expense
|
(30,286
|
)
|
(20,004
|
)
|
(19,363
|
)
|
|||||
|
Other non-operating income
|
8,588
|
|
6,959
|
|
3,621
|
|
|||||
|
INCOME BEFORE TAXES
|
25,745
|
|
42,269
|
|
25,892
|
|
|||||
|
Income tax expense
|
(8,657
|
)
|
(7,208
|
)
|
(8,016
|
)
|
|||||
|
NET INCOME
|
17,088
|
|
35,061
|
|
17,876
|
|
|||||
|
Less: Net (income) attributable to noncontrolling interests
|
(505
|
)
|
(5,740
|
)
|
(4,934
|
)
|
|||||
|
NET INCOME ATTRIBUTABLE TO FORESTAR GROUP INC.
|
$
|
16,583
|
|
$
|
29,321
|
|
$
|
12,942
|
|
||
|
WEIGHTED AVERAGE COMMON SHARES OUTSTANDING
|
|||||||||||
|
Basic
|
35,317
|
|
35,365
|
|
35,214
|
|
|||||
|
Diluted
|
43,596
|
|
36,813
|
|
35,482
|
|
|||||
|
NET INCOME PER COMMON SHARE
|
|||||||||||
|
Basic
|
$
|
0.38
|
|
$
|
0.81
|
|
$
|
0.37
|
|
||
|
Diluted
|
$
|
0.38
|
|
$
|
0.80
|
|
$
|
0.36
|
|
||
|
COMPREHENSIVE INCOME ATTRIBUTABLE TO FORESTAR GROUP INC.
|
$
|
16,583
|
|
$
|
29,321
|
|
$
|
12,942
|
|
||
Please read the notes to the consolidated financial statements.
64
FORESTAR GROUP INC.
CONSOLIDATED STATEMENTS OF EQUITY
|
Forestar Group Inc. Shareholders
|
|||||||||||||||||||||||||||||
|
|
Common Stock
|
Additional
Paid-in
Capital
|
Treasury Stock
|
Retained Earnings
|
Non-controlling
Interests
|
||||||||||||||||||||||||
|
|
Total
|
Shares
|
Amount
|
Shares
|
Amount
|
||||||||||||||||||||||||
|
(In thousands, except per share amounts)
|
|||||||||||||||||||||||||||||
|
Balance at December 31, 2011
|
$
|
511,212
|
|
36,835,732
|
|
$
|
36,836
|
|
$
|
398,517
|
|
(2,212,876
|
)
|
$
|
(33,982
|
)
|
$
|
108,155
|
|
$
|
1,686
|
|
|||||||
|
Net income
|
17,876
|
|
—
|
|
—
|
|
—
|
|
—
|
|
—
|
|
12,942
|
|
4,934
|
|
|||||||||||||
|
Distributions to noncontrolling interest
|
(3,694
|
)
|
—
|
|
—
|
|
—
|
|
—
|
|
—
|
|
—
|
|
(3,694
|
)
|
|||||||||||||
|
Contributions from noncontrolling interest
|
1,133
|
|
—
|
|
—
|
|
—
|
|
—
|
|
—
|
|
—
|
|
1,133
|
|
|||||||||||||
|
Issuances of common stock
|
—
|
|
18,469
|
|
19
|
|
(19
|
)
|
—
|
|
—
|
|
—
|
|
—
|
|
|||||||||||||
|
Issuances of restricted stock
|
300
|
|
—
|
|
—
|
|
(129
|
)
|
27,934
|
|
429
|
|
—
|
|
—
|
|
|||||||||||||
|
Issuances from exercises of stock options, net of swaps
|
1,159
|
|
92,402
|
|
92
|
|
899
|
|
11,372
|
|
168
|
|
—
|
|
—
|
|
|||||||||||||
|
Shares withheld for payroll taxes
|
(968
|
)
|
—
|
|
—
|
|
—
|
|
(59,603
|
)
|
(968
|
)
|
—
|
|
—
|
|
|||||||||||||
|
Shares repurchased
|
(1,409
|
)
|
—
|
|
—
|
|
—
|
|
(94,450
|
)
|
(1,409
|
)
|
—
|
|
—
|
|
|||||||||||||
|
Share-based compensation
|
7,572
|
|
—
|
|
—
|
|
7,572
|
|
—
|
|
—
|
|
—
|
|
—
|
|
|||||||||||||
|
Tax benefit from exercise of restricted stock units and stock options and vested restricted stock
|
366
|
|
—
|
|
—
|
|
366
|
|
—
|
|
—
|
|
—
|
|
—
|
|
|||||||||||||
|
Balance at December 31, 2012
|
$
|
533,547
|
|
36,946,603
|
|
$
|
36,947
|
|
$
|
407,206
|
|
(2,327,623
|
)
|
$
|
(35,762
|
)
|
$
|
121,097
|
|
$
|
4,059
|
|
|||||||
|
Net income
|
35,061
|
|
—
|
|
—
|
|
—
|
|
—
|
|
—
|
|
29,321
|
|
5,740
|
|
|||||||||||||
|
Distributions to noncontrolling interest
|
(7,269
|
)
|
—
|
|
—
|
|
—
|
|
—
|
|
—
|
|
—
|
|
(7,269
|
)
|
|||||||||||||
|
Contributions from noncontrolling interest
|
3,022
|
|
—
|
|
—
|
|
—
|
|
—
|
|
—
|
|
—
|
|
3,022
|
|
|||||||||||||
|
Issuances of restricted stock
|
2,871
|
|
—
|
|
—
|
|
2,721
|
|
7,298
|
|
150
|
|
—
|
|
—
|
|
|||||||||||||
|
Convertible note issuance proceeds, net of issuance costs and taxes
|
17,058
|
|
—
|
|
—
|
|
17,058
|
|
—
|
|
—
|
|
—
|
|
—
|
|
|||||||||||||
|
TEU issuance proceeds, net of issuance costs - 6,000,000 units
|
120,335
|
|
—
|
|
—
|
|
120,335
|
|
—
|
|
—
|
|
—
|
|
—
|
|
|||||||||||||
|
Issuances from exercises of stock options, net of swaps
|
2,106
|
|
—
|
|
—
|
|
(449
|
)
|
189,864
|
|
2,555
|
|
—
|
|
—
|
|
|||||||||||||
|
Shares withheld for payroll taxes
|
(1,137
|
)
|
—
|
|
—
|
|
(8
|
)
|
(59,219
|
)
|
(1,129
|
)
|
—
|
|
—
|
|
|||||||||||||
|
Forfeitures of restricted stock
|
—
|
|
—
|
|
—
|
|
10
|
|
(9,986
|
)
|
(10
|
)
|
—
|
|
—
|
|
|||||||||||||
|
Share-based compensation
|
9,911
|
|
—
|
|
—
|
|
9,911
|
|
—
|
|
—
|
|
—
|
|
—
|
|
|||||||||||||
|
Tax benefit from exercise of restricted stock units and stock options and vested restricted stock
|
(108
|
)
|
—
|
|
—
|
|
(108
|
)
|
—
|
|
—
|
|
—
|
|
—
|
|
|||||||||||||
|
Balance at December 31, 2013
|
$
|
715,397
|
|
36,946,603
|
|
$
|
36,947
|
|
$
|
556,676
|
|
(2,199,666
|
)
|
$
|
(34,196
|
)
|
$
|
150,418
|
|
$
|
5,552
|
|
|||||||
|
Net income
|
17,088
|
|
—
|
|
—
|
|
—
|
|
—
|
|
—
|
|
16,583
|
|
505
|
|
|||||||||||||
|
Distributions to noncontrolling interests
|
(4,171
|
)
|
—
|
|
—
|
|
—
|
|
—
|
|
—
|
|
—
|
|
(4,171
|
)
|
|||||||||||||
|
Contributions from noncontrolling interests
|
2,585
|
|
—
|
|
—
|
|
—
|
|
—
|
|
—
|
|
—
|
|
2,585
|
|
|||||||||||||
|
Dissolution of noncontrolling interests
|
1,342
|
|
—
|
|
—
|
|
—
|
|
—
|
|
—
|
|
—
|
|
1,342
|
|
|||||||||||||
|
Purchase of noncontrolling interests, net
|
(6,242
|
)
|
—
|
|
—
|
|
(2,969
|
)
|
—
|
|
—
|
|
—
|
|
(3,273
|
)
|
|||||||||||||
|
Issuances of common stock
|
—
|
|
—
|
|
—
|
|
(2,567
|
)
|
164,914
|
|
2,567
|
|
—
|
|
—
|
|
|||||||||||||
|
Issuances from exercises of stock options, net of swaps
|
1,206
|
|
—
|
|
—
|
|
(376
|
)
|
105,885
|
|
1,582
|
|
—
|
|
—
|
|
|||||||||||||
|
Shares withheld for payroll taxes
|
(1,043
|
)
|
—
|
|
—
|
|
(4
|
)
|
(55,238
|
)
|
(1,039
|
)
|
—
|
|
—
|
|
|||||||||||||
|
Shares repurchased
|
(24,595
|
)
|
—
|
|
—
|
|
—
|
|
(1,491,187
|
)
|
(24,595
|
)
|
—
|
|
—
|
|
|||||||||||||
|
Forfeitures of restricted stock
|
—
|
|
—
|
|
—
|
|
10
|
|
(9,986
|
)
|
(10
|
)
|
—
|
|
—
|
|
|||||||||||||
|
Share-based compensation
|
8,033
|
|
—
|
|
—
|
|
8,033
|
|
—
|
|
—
|
|
—
|
|
—
|
|
|||||||||||||
|
Tax benefit from exercise of restricted stock units and stock options and vested restricted stock
|
142
|
|
—
|
|
—
|
|
142
|
|
—
|
|
—
|
|
—
|
|
—
|
|
|||||||||||||
|
Balance at December 31, 2014
|
$
|
709,742
|
|
36,946,603
|
|
$
|
36,947
|
|
$
|
558,945
|
|
(3,485,278
|
)
|
$
|
(55,691
|
)
|
$
|
167,001
|
|
$
|
2,540
|
|
|||||||
Please read the notes to the consolidated financial statements.
65
FORESTAR GROUP INC.
|
|
For the Year
|
||||||||||
|
|
2014
|
2013
|
2012
|
||||||||
|
|
(In thousands)
|
||||||||||
|
CASH FLOWS FROM OPERATING ACTIVITIES:
|
|||||||||||
|
Consolidated net income
|
$
|
17,088
|
|
$
|
35,061
|
|
$
|
17,876
|
|
||
|
Adjustments:
|
|||||||||||
|
Depreciation, depletion and amortization
|
41,715
|
|
29,980
|
|
18,926
|
|
|||||
|
Change in deferred income taxes
|
1,645
|
|
5,389
|
|
(6,506
|
)
|
|||||
|
Change in unrecognized tax benefits
|
—
|
|
(6,251
|
)
|
151
|
|
|||||
|
Equity in (earnings) loss of unconsolidated ventures
|
(8,685
|
)
|
(8,737
|
)
|
(14,469
|
)
|
|||||
|
Distributions of earnings of unconsolidated ventures
|
5,721
|
|
6,360
|
|
3,251
|
|
|||||
|
Proceeds from consolidated ventures’ sale of assets, net
|
—
|
|
—
|
|
24,294
|
|
|||||
|
Share-based compensation
|
3,417
|
|
16,809
|
|
14,929
|
|
|||||
|
Real estate cost of sales
|
84,665
|
|
104,899
|
|
39,360
|
|
|||||
|
Dry hole and unproved leasehold impairment costs
|
29,528
|
|
5,837
|
|
1,069
|
|
|||||
|
Real estate development and acquisition expenditures, net
|
(114,694
|
)
|
(106,609
|
)
|
(91,940
|
)
|
|||||
|
Reimbursements from utility and improvement districts
|
66,047
|
|
9,945
|
|
8,524
|
|
|||||
|
Other changes in real estate
|
3,537
|
|
3,146
|
|
1,384
|
|
|||||
|
Changes in deferred income
|
143
|
|
(2,246
|
)
|
1,070
|
|
|||||
|
Asset impairments
|
15,934
|
|
1,790
|
|
—
|
|
|||||
|
Gain on sale of assets
|
(38,038
|
)
|
(5,161
|
)
|
(25,983
|
)
|
|||||
|
Other
|
2,207
|
|
1,491
|
|
(21
|
)
|
|||||
|
Changes in:
|
|||||||||||
|
Notes and accounts receivables
|
10,704
|
|
(3,864
|
)
|
(1,132
|
)
|
|||||
|
Prepaid expenses and other
|
2,180
|
|
(795
|
)
|
(2,560
|
)
|
|||||
|
Accounts payable and other accrued liabilities
|
(4,653
|
)
|
(1,557
|
)
|
(2,527
|
)
|
|||||
|
Income taxes
|
(11,379
|
)
|
3,290
|
|
(7,914
|
)
|
|||||
|
Net cash provided by (used for) operating activities
|
107,082
|
|
88,777
|
|
(22,218
|
)
|
|||||
|
CASH FLOWS FROM INVESTING ACTIVITIES:
|
|||||||||||
|
Property, equipment, software, reforestation and other
|
(16,398
|
)
|
(11,828
|
)
|
(2,735
|
)
|
|||||
|
Oil and gas properties and equipment
|
(101,145
|
)
|
(96,069
|
)
|
(21,416
|
)
|
|||||
|
Acquisition of partner's interest in unconsolidated multifamily venture, net of cash
|
(20,155
|
)
|
—
|
|
—
|
|
|||||
|
Acquisition of oil and gas properties
|
(1,100
|
)
|
—
|
|
—
|
|
|||||
|
Investment in unconsolidated ventures
|
(14,692
|
)
|
(857
|
)
|
(2,318
|
)
|
|||||
|
Proceeds from sale of assets
|
21,962
|
|
1,333
|
|
—
|
|
|||||
|
Return of investment in unconsolidated ventures
|
1,797
|
|
3,494
|
|
12,654
|
|
|||||
|
Business acquisition, net of cash acquired
|
—
|
|
—
|
|
(152,915
|
)
|
|||||
|
Proceeds from sale of multifamily property
|
—
|
|
—
|
|
29,474
|
|
|||||
|
Proceeds from sale of venture interest
|
—
|
|
—
|
|
32,095
|
|
|||||
|
Other
|
—
|
|
—
|
|
42
|
|
|||||
|
Net cash (used for) investing activities
|
(129,731
|
)
|
(103,927
|
)
|
(105,119
|
)
|
|||||
|
CASH FLOWS FROM FINANCING ACTIVITIES:
|
|||||||||||
|
Proceeds from issuance of convertible senior notes, net
|
—
|
|
120,795
|
|
—
|
|
|||||
|
Proceeds from issuance of senior secured notes, net
|
241,947
|
|
—
|
|
—
|
|
|||||
|
Proceeds from issuance of tangible equity units, net
|
—
|
|
144,998
|
|
—
|
|
|||||
|
Payments of debt
|
(225,481
|
)
|
(106,076
|
)
|
(74,226
|
)
|
|||||
|
Additions to debt
|
22,593
|
|
43,911
|
|
203,642
|
|
|||||
|
Deferred financing fees
|
(3,217
|
)
|
(438
|
)
|
(5,883
|
)
|
|||||
|
Distributions to noncontrolling interests, net
|
(3,146
|
)
|
(7,154
|
)
|
(3,266
|
)
|
|||||
|
Purchase of noncontrolling interests
|
(7,971
|
)
|
—
|
|
—
|
|
|||||
|
Exercise of stock options
|
1,206
|
|
2,106
|
|
1,159
|
|
|||||
|
Repurchases of common stock
|
(24,595
|
)
|
—
|
|
(1,409
|
)
|
|||||
|
Payroll taxes on restricted stock and stock options
|
(1,043
|
)
|
(1,137
|
)
|
(968
|
)
|
|||||
|
Excess income tax benefit from share-based compensation
|
176
|
|
91
|
|
366
|
|
|||||
|
Net cash provided by financing activities
|
469
|
|
197,096
|
|
119,415
|
|
|||||
|
Net (decrease) increase in cash and cash equivalents
|
(22,180
|
)
|
181,946
|
|
(7,922
|
)
|
|||||
|
Cash and cash equivalents at beginning of year
|
192,307
|
|
10,361
|
|
18,283
|
|
|||||
|
Cash and cash equivalents at year-end
|
$
|
170,127
|
|
$
|
192,307
|
|
$
|
10,361
|
|
||
|
SUPPLEMENTAL DISCLOSURE OF CASH FLOW INFORMATION:
|
|||||||||||
|
Cash paid during the year for:
|
|||||||||||
|
Interest
|
$
|
22,936
|
|
$
|
13,818
|
|
$
|
12,820
|
|
||
|
Income taxes
|
$
|
18,322
|
|
$
|
4,955
|
|
$
|
21,678
|
|
||
|
SUPPLEMENTAL DISCLOSURE OF NON-CASH INFORMATION:
|
|||||||||||
|
Capitalized interest
|
$
|
1,154
|
|
$
|
816
|
|
$
|
721
|
|
||
|
Noncontrolling interests
|
$
|
2,904
|
|
$
|
2,907
|
|
$
|
1,032
|
|
||
Please read the notes to the consolidated financial statements.
66
FORESTAR GROUP INC
NOTES TO THE CONSOLIDATED FINANCIAL STATEMENTS
Note 1 — Summary of Significant Accounting Policies
Basis of Presentation
Our consolidated financial statements include the accounts of Forestar Group Inc., all subsidiaries, ventures and other entities in which we have a controlling interest. We account for our investment in other entities in which we have significant influence over operations and financial policies using the equity method (we recognize our share of the entities’ income or loss and any preferential returns and treat distributions as a reduction of our investment). We eliminate all material intercompany accounts and transactions. Noncontrolling interests in consolidated pass-through entities are recognized before income taxes.
We prepare our financial statements in accordance with generally accepted accounting principles in the United States, which require us to make estimates and assumptions about future events. Actual results can, and probably will, differ from those we currently estimate. Examples of significant estimates include those related to allocating costs to real estate, measuring long-lived assets for impairment, oil and gas revenue accruals, capital expenditure and lease operating expense accruals associated with our oil and gas production activities, oil and gas reserves and depletion of our oil and gas properties.
Cash and Cash Equivalents
Cash and cash equivalents include cash and other short-term instruments with original maturities of three months or less. At year-end
2014
and
2013
, restricted cash was
$217,000
and
$3,954,000
and is included in other assets.
Cash Flows
Expenditures for the acquisition and development of single-family and multifamily real estate are classified as operating activities. Expenditures for the acquisition of stabilized income producing properties, investment in oil and gas properties and equipment, and business acquisitions are classified as investing activities. Our accrued capital expenditures for unproved leasehold acquisitions and drilling and completion costs at year-end 2014 and 2013 were
$19,405,000
and
$12,976,000
and are included in other accrued expenses in our consolidated balance sheets. These oil and gas property additions will be reflected as cash used for investing activities in the period the accrued payables are settled.
Capitalized Software
We capitalize purchased software costs as well as the direct internal and external costs associated with software we develop for our own use. We amortize these capitalized costs using the straight-line method over estimated useful lives generally ranging from
three
to
five years
. The carrying value of capitalized software was
$1,188,000
at year-end
2014
and
$1,544,000
at year-end
2013
and is included in other assets. The amortization of these capitalized costs was
$1,067,000
in
2014
,
$1,593,000
in
2013
and
$1,320,000
in
2012
and is included in general and administrative and operating expenses.
Environmental and Asset Retirement Obligations
We recognize environmental remediation liabilities on an undiscounted basis when environmental assessments or remediation are probable and we can reasonably estimate the cost. We adjust these liabilities as further information is obtained or circumstances change. Our asset retirement obligations are related to the abandonment and site restoration requirements that result from the acquisition, construction and development of our oil and gas properties. We record the fair value of a liability for an asset retirement obligation in the period in which it is incurred and a corresponding increase in the carrying amount of the related long-lived asset. Accretion expense related to the asset retirement obligation and depletion expense related to capitalized asset retirement cost is included in cost of oil and gas producing activities on our consolidated statements of income.
The following summarizes the changes in asset retirement obligations:
|
Year-End
|
|||||||
|
2014
|
2013
|
||||||
|
|
(In thousands)
|
||||||
|
Beginning balance
|
$
|
1,483
|
|
$
|
1,360
|
|
|
|
Additions
|
314
|
|
29
|
|
|||
|
Property dispositions
|
(230
|
)
|
—
|
|
|||
|
Change in estimate
|
118
|
|
—
|
|
|||
|
Accretion expense
|
122
|
|
94
|
|
|||
|
$
|
1,807
|
|
$
|
1,483
|
|
||
67
Fair Value Measurements
Financial instruments for which we did not elect the fair value option include cash and cash equivalents, accounts and notes receivables, other assets, long-term debt, accounts payable and other liabilities. With the exception of long-term notes receivable and debt, the carrying amounts of these financial instruments approximate their fair values due to their short-term nature or variable interest rates.
Goodwill and Other Intangible Assets
We record goodwill when the purchase price of a business acquisition exceeds the estimated fair value of net identified tangible and intangible assets acquired. We do not amortize goodwill or other indefinite lived intangible assets. Instead, we measure these assets for impairment based on the estimated fair values at least annually or more frequently if impairment indicators exist. We perform the annual impairment measurement in the fourth quarter of each year. Intangible assets with finite useful lives are amortized over their estimated useful lives.
In 2014, we performed our annual goodwill impairment evaluation and concluded that goodwill was not impaired as the estimated fair value exceeded the carrying value.
Income Taxes
We provide deferred income taxes using current tax rates for temporary differences between the financial accounting carrying value of assets and liabilities and their tax accounting carrying values. We recognize and value income tax exposures for the various taxing jurisdictions where we operate based on laws, elections, commonly accepted tax positions, and management estimates. We include tax penalties and interest in income tax expense. We provide a valuation allowance for any deferred tax asset that is not likely to be recoverable in future periods.
When we believe a tax position is supportable but the outcome uncertain, we include the item in our tax return but do not recognize the related benefit in our provision for taxes. Instead, we record a reserve for unrecognized tax benefits, which represents our expectation of the most likely outcome considering the technical merits and specific facts of the position. Changes to liabilities are only made when an event occurs that changes the most likely outcome, such as settlement with the relevant tax authority, expiration of statutes of limitations, changes in tax law, or recent court rulings.
Owned Mineral Interests
When we lease our mineral interests to third-party exploration and production entities, we retain a royalty interest and may take an additional participation in production, including a working interest. Mineral interests and working interests related to our owned mineral interests are included in oil and gas properties and equipment on our balance sheet, net of accumulated depletion.
Oil and Gas Properties
We use the successful efforts method of accounting for our oil and gas producing activities. Costs to acquire mineral interests leased, costs to drill and complete development of oil and gas wells and related asset retirement costs are capitalized. Costs to drill exploratory wells are capitalized pending determination of whether the wells have proved reserves and if determined incapable of producing commercial quantities of oil and gas these costs are expensed as dry hole costs. As of year-end 2014, we have
$8,575,000
in capitalized exploratory well costs pending determination of proved reserves,
none
of which have been capitalized for a period greater than one year. Exploration costs include dry hole costs, geological and geophysical costs, expired unproved leasehold costs and seismic studies, and are expensed as incurred. Production costs incurred to maintain wells and related equipment are charged to expense as incurred.
Depreciation and depletion of producing oil and gas properties is calculated using the units-of-production method. Proved developed reserves are used to compute unit rates for unamortized tangible and intangible drilling and completion costs. Proved reserves are used to compute unit rates for unamortized acquisition of proved leasehold costs. Unit-of-production amortization rates are revised whenever there is an indication of the need for revision but at least once a year and those revisions are accounted for prospectively as changes in accounting estimates.
Impairment of Oil and Gas Properties
We evaluate our oil and gas properties, including facilities and equipment, for impairment whenever events or changes in circumstances indicate that the carrying value of an asset may not be recoverable. We estimate the expected undiscounted future cash flows of our oil and gas properties and compare such undiscounted future cash flows to the carrying amount of the oil and gas properties to determine if the carrying amount is recoverable. If the carrying amount exceeds the estimated undiscounted future cash flows, we will adjust the carrying amount of the oil and gas properties to fair value. The factors used to determine fair value are subject to our judgment and expertise and include, but are not limited to, recent sales prices of comparable properties, the present value of future cash flows, net of estimated operating and development costs using estimates
68
of proved reserves, future commodity pricing, future production estimates, anticipated capital expenditures, and various discount rates commensurate with the risk and current market conditions associated with realizing the expected cash flows projected. Because of the uncertainty inherent in these factors, we cannot predict when or if future impairment charges for proved properties will be recorded.
The assessment of unproved leasehold properties to determine any possible impairment requires significant judgment. We assess our unproved leasehold properties periodically for impairment on a property-by-property basis based on remaining lease terms, drilling results or future plans to develop acreage. Impairment expense for proved and unproved oil and gas properties are included in costs of oil and gas producing activities.
Operating Leases
We occupy office space in various locations under operating leases. The lease agreements may contain rent escalation clauses, construction allowances and/or contingent rent provisions. We expense operating leases ratably over the shorter of the useful life or the lease term. For scheduled rent escalation clauses, we recognize the base rent expense on a straight-line basis and record the difference between the recognized rent expense and the amounts payable under the lease as deferred lease credits included in other liabilities in the consolidated balance sheets. Deferred lease credits are amortized over the lease term. For construction allowances, we record leasehold improvement assets included in property and equipment in the consolidated balance sheets amortized over the shorter of their economic lives or the lease term. The related deferred lease credits are amortized as a reduction of rent expense over the lease term.
Property and Equipment
We carry property and equipment at cost less accumulated depreciation. We capitalize the cost of significant additions and improvements, and we expense the cost of repairs and maintenance. We capitalize interest costs incurred on major construction projects. We depreciate these assets using the straight-line method over their estimated useful lives as follows:
|
|
Estimated
|
Carrying
Value Year-End
|
|||||||
|
|
Useful Lives
|
2014
|
2013
|
||||||
|
|
|
(In thousands)
|
|||||||
|
Buildings and building improvements
|
10 to 40 years
|
$
|
4,461
|
|
$
|
4,111
|
|
||
|
Property and equipment
|
2 to 10 years
|
14,084
|
|
8,240
|
|
||||
|
18,545
|
|
12,351
|
|
||||||
|
Less: accumulated depreciation
|
(6,918
|
)
|
(6,239
|
)
|
|||||
|
$
|
11,627
|
|
$
|
6,112
|
|
||||
Depreciation expense of property and equipment was
$903,000
in
2014
,
$1,028,000
in
2013
and
$962,000
in
2012
.
Real Estate
We carry real estate at the lower of cost or fair value less cost to sell. We capitalize interest costs once development begins, and we continue to capitalize throughout the development period. We also capitalize infrastructure, improvements, amenities, and other development costs incurred during the development period. We determine the cost of real estate sold using the relative sales value method. When we sell real estate from projects that are not finished, we include in the cost of real estate sold estimates of future development costs through completion, allocated based on relative sales values. These estimates of future development costs are reevaluated at least annually, with any adjustments being allocated prospectively to the remaining units available for sale. We receive cash deposits from home builders for purchases of real estate community development projects. These earnest money deposits are released to the home builders as lots are developed and sold.
Income producing properties are carried at cost less accumulated depreciation computed using the straight-line method over their estimated useful lives.
We have agreements with utility or improvement districts, principally in Texas, whereby we agree to convey to the district's water, sewer and other infrastructure-related assets we have constructed in connection with projects within their jurisdiction. The reimbursement for these assets ranges from
70
to
100 percent
of allowable cost as defined by the district. The transfer is consummated and we receive payment when the districts have a sufficient tax base to support funding of their bonds. The cost we incur in constructing these assets is included in capitalized development costs, and upon collection, we remove the assets from capitalized development costs. We provide an allowance to reflect our past experiences related to claimed allowable development costs.
69
Impairment of Real Estate Long-Lived Assets
We review real estate long-lived assets held for use for impairment when events or circumstances indicate that their carrying value may not be recoverable. Impairment exists if the carrying amount of the long-lived asset is not recoverable from the undiscounted cash flows expected from its use and eventual disposition. We determine the amount of the impairment loss by comparing the carrying value of the long-lived asset to its estimated fair value. In the absence of quoted market prices, we determine estimated fair value generally based on the present value of future probability weighted cash flows expected from the sale of the long-lived asset. Non-cash impairment charges related to our owned and consolidated real estate assets are included in cost of real estate sales and other.
Reclassifications
In 2014, we have reclassified prior years' earnest money deposits that were included in other accrued expenses and other liabilities on our consolidated balance sheets as a separate line item to conform to the current year presentation.
Revenue
Real Estate
We recognize revenue from sales of real estate when a sale is consummated, the buyer’s initial investment is adequate, any receivables are probable of collection, the usual risks and rewards of ownership have been transferred to the buyer, and we do not have significant continuing involvement with the real estate sold. If we determine that the earnings process is not complete, we defer recognition of any gain until earned. We recognize revenue from hotel room sales and other guest services when rooms are occupied and other guest services have been rendered. We recognize revenue from our multifamily properties when payments are due from residents, generally on a monthly basis.
We recognize construction revenues on multifamily projects that we develop as a general contractor. Construction revenues are recognized as costs are incurred plus fixed fee earned. We are reimbursed for costs paid to subcontractors plus we may earn a development and construction management fee on multifamily projects we develop, both of which are included in commercial and income producing properties revenue. On multifamily projects where our fee is based on a fixed fee plus guaranteed maximum price contract, any cost overruns incurred during construction, as compared to the original budget, will reduce the net fee generated on these projects. Any excess cost overruns estimated over the net fee generated are recognized in the period in which they become evident.
We exclude from revenue amounts we collect from utility or improvement districts related to the conveyance of water, sewer and other infrastructure related assets. We also exclude from revenue amounts we collect for timber sold on land being developed. These proceeds reduce capitalized development costs. We exclude from revenue amounts we collect from customers that represent sales tax or other taxes that are based on the sale. These amounts are included in other accrued expenses until paid.
Oil and Gas
We recognize revenue as oil and gas is produced and sold. There are a significant amount of oil and gas properties which we do not operate and, therefore, revenue is typically recorded in the month of production based on an estimate of our share of volumes produced and prices realized. We obtain the most current available production data from the operators and price indices for each well to estimate the accrual of revenue. Obtaining production data on a timely basis for some wells is not feasible; therefore we utilize past production receipts and estimated sales price information to estimate accrual of working interest revenue on all other non-operated wells each month. Revisions to such estimates are recorded as actual results become known. We review accounts receivable periodically and reduce the carrying amount by a valuation allowance that reflects our best estimate of the amount that may not be collectible. No such allowance was considered necessary at December 31, 2014 or 2013.
A majority of our sales are made under contractual arrangements with terms that are considered to be usual and customary in the oil and gas industry. The contracts are for periods of up to
five years
with prices determined upon a percentage of pre-determined and published monthly index price. The terms of these contracts have not had an effect on how we recognize revenue.
We recognize revenue from mineral bonus payments received as a result of leasing our owned mineral interests to others when we have received an executed agreement with the exploration company transferring the rights to any oil or gas it may find and requiring drilling be done within a specified period, the payment has been collected, and we have no obligation to refund the payment. We recognize revenue from delay rentals received if drilling has not started within the specified period and when the payment has been collected. We recognize revenue from mineral royalties when the minerals have been delivered to the buyer, the value is determinable, and we are reasonably sure of collection.
70
Other Natural Resources
We recognize revenue from timber sales upon passage of title, which occurs at delivery; when the price is fixed and determinable; and we are reasonably sure of collection. We recognize revenue from recreational leases on the straight-line basis over the lease term. We recognize revenue from the sale of water rights or groundwater reservation agreements upon receipt of an executed agreement and payment has been collected and all conditions to the agreement have been met and we have no further performance obligations to meet. The water delivery revenues will be recognized as water is being delivered and metered at the delivery point.
Share-Based Compensation
We use the Black-Scholes option pricing model for stock options, Monte Carlo simulation pricing model for market-leveraged stock units, grant date fair value for equity-settled awards and period-end fair value for cash-settled awards. We expense share-based awards ratably over the vesting period or earlier based on retirement eligibility.
Timber
We carry timber at cost less the cost of timber cut. We expense the cost of timber cut based on the relationship of the timber carrying value to the estimated volume of recoverable timber multiplied by the amount of timber cut. We include the cost of timber cut in cost of other natural resources in the income statement. We determine the estimated volume of recoverable timber using statistical information and other data related to growth rates and yields gathered from physical observations, models and other information gathering techniques. Changes in yields are generally due to adjustments in growth rates and similar matters and are accounted for prospectively as changes in estimates. We capitalize reforestation costs incurred in developing viable seedling plantations (up to
two years
from planting), such as site preparation, seedlings, planting, fertilization, insect and wildlife control, and herbicide application. We expense all other costs, such as property taxes and costs of forest management personnel, as incurred. Once the seedling plantation is viable, we expense all costs to maintain the viable plantations, such as fertilization, herbicide application, insect and wildlife control, and thinning, as incurred.
We own directly or through ventures about
102,000
acres of timber, primarily in Georgia. The non-cash cost of timber cut and sold is
$371,000
in
2014
,
$609,000
in
2013
and
$1,220,000
in
2012
and is included in depreciation, depletion and amortization in our statement of cash flows.
Accounting Standards Adopted in
2014
In
2014
, we adopted ASU 2013-04 — Liabilities (Topic 405):
Obligations Resulting from Joint and Several Liability Arrangements for Which the Total Amount of the Obligation Is Fixed at the Reporting Date,
ASU 2014-12 — Compensation-Stock Compensation (Topic 718):
Accounting for Share-Based Payments When the Terms of an Award Provide That a Performance Target Could Be Achieved after the Requisite Service Period
and ASU 2014-17 — Business Combinations (Topic 805):
Pushdown Accounting
. Adoption did not materially affect our earnings, financial position or disclosures.
We also adopted ASU 2014-08 —
Presentation of Financial Statements (Topic 205) and Property, Plant, and Equipment (Topic 360), Reporting Discontinued Operations and Disclosures of Disposals of Components of an Entity
. ASU 2014-08 raises the threshold for a disposal to qualify as a discontinued operation and requires new and expanded disclosures of both discontinued operations and certain other disposals that do not meet the definition of a discontinued operation. The Company adopted the updated standard in second quarter 2014. As a result, certain asset disposals were not considered discontinued operations, due to the higher threshold under the updated standard, but that would have qualified as discontinued operations under the previous guidance.
Pending Accounting Standards
In May 2014, the FASB issued ASU 2014-09,
Revenue from Contracts with Customers (Topic 606)
, requiring an entity to recognize the amount of revenue to which it expects to be entitled for the transfer of promised goods or services to customers. The updated standard will replace most existing revenue recognition guidance in U.S. GAAP when it becomes effective and permits the use of either the retrospective or cumulative effect transition method. Early adoption is not permitted. The updated standard becomes effective for annual and interim periods beginning after December 15, 2016. We have not yet selected a transition method and we are currently evaluating the effect that the updated standard will have on our earnings, financial position and disclosures.
71
Carrying value of goodwill and other intangible assets follows:
|
|
Year-End
|
||||||
|
|
2014
|
2013
|
|||||
|
|
(In thousands)
|
||||||
|
Goodwill
|
$
|
63,423
|
|
$
|
64,493
|
|
|
|
Identified intangibles, net
|
2,708
|
|
2,153
|
|
|||
|
$
|
66,131
|
|
$
|
66,646
|
|
||
Goodwill related to oil and gas properties is
$59,549,000
and
$60,619,000
at year-end 2014 and 2013. Goodwill associated with our water resources company acquired in 2010 is
$3,874,000
at year-end 2014 and 2013. The change in goodwill for oil and gas properties is related to goodwill allocated to properties sold in 2014.
Identified intangibles include
$1,681,000
in indefinite lived groundwater leases associated with a water resources company acquired in 2010,
$649,000
related to in-place tenant leases with definite lives associated with the purchase of our partner's interest in the Eleven venture and
$378,000
related to patents with definite lives associated with the Calliope Gas Recovery System, a process to increase natural gas production.
Real estate consists of:
|
|
At Year-End
|
||||||
|
|
2014
|
2013
|
|||||
|
|
(In thousands)
|
||||||
|
Entitled, developed and under development projects
|
$
|
321,273
|
|
$
|
361,687
|
|
|
|
Undeveloped land (includes land in entitlement)
|
93,182
|
|
86,367
|
|
|||
|
Commercial and income producing properties
|
|||||||
|
Carrying value
|
192,678
|
|
99,476
|
|
|||
|
Accumulated depreciation
|
(31,377
|
)
|
(28,066
|
)
|
|||
|
Net carrying value
|
161,301
|
|
71,410
|
|
|||
|
$
|
575,756
|
|
$
|
519,464
|
|
||
Our estimated cost of assets we expect to convey to utility and improvement districts were
$65,212,000
in
2014
and
$62,183,000
in
2013
, which includes
$31,913,000
at year-end
2014
and
$41,795,000
at year-end
2013
related to our Cibolo Canyons project near San Antonio. These costs relate to water, sewer and other infrastructure assets we have submitted or will submit to utility or improvement districts for approval and reimbursement. We submitted for reimbursement to these districts
$7,118,000
in
2014
and
$17,923,000
in
2013
. We collected
$15,497,000
from these districts in
2014
, of which
$9,883,000
is related to our Cibolo Canyons project and was accounted for as a reduction of our investment in the mixed-use development. We collected
$5,545,000
from these districts in
2013
, of which
$600,000
related to our Cibolo Canyons project. We expect to collect the remaining amounts billed when these districts achieve adequate tax bases to support payment.
In 2014, we received
$50,550,000
from CCSID under 2007 economic development agreements (EDA) related to development of the JW Marriott
®
Hill Country Resort & Spa (Resort) at our Cibolo Canyons project near San Antonio, of which
$46,500,000
was related to CCSID's issuance of
$48,900,000
Hotel Occupancy Tax (HOT) and Sales and Use Tax Revenue Bonds. These bonds are obligations solely of CCSID and are payable from HOT and sales and use taxes levied on the Resort by CCSID. To facilitate the issuance of the bonds, we provided a
$6,846,000
letter of credit to the bond trustee as security for certain debt service fund obligations in the event CCSID tax collections are not sufficient to support payment of the bonds in accordance with their terms. The letter of credit must be maintained until the earlier of redemption of the bonds or scheduled bond maturity in 2034. We also entered into an agreement with San Antonio Real Estate (SARE), owner of the Resort, to assign SARE’s senior rights under the EDA to us in exchange for consideration provided by us, including a surety bond to be drawn if CCSID tax collections are not sufficient to support ad valorem tax rebates payable to SARE. The surety bond has a balance of
$9,010,000
at year-end 2014. The surety bond will decrease as CCSID makes annual ad valorem tax rebate payments to SARE, which obligation is scheduled to be retired in full by 2020. As a result of these transactions, we recorded a gain of
$6,577,000
after recovery of our full resort investment of
$24,067,000
, which was included in entitled, developed and under development projects. In
2013
, we received
$4,400,000
from CCSID from hotel occupancy and sales revenues collected as taxes by CCSID.
72
In 2014, undeveloped land increased due to a non-monetary exchange of leasehold timber rights on approximately
10,300
acres for
5,400
acres of undeveloped land with a partner in a consolidated venture, in which we recorded a
$10,476,000
gain.
In 2014, we acquired full ownership in CJUF III, RH Holdings LP partnership (the Eleven venture), owner of a
257
-unit multifamily project in Austin in which we previously held a
25 percent
interest, for
$21,500,000
. The acquisition-date fair value was
$55,275,000
, including debt of
$23,936,000
. Our investment in the Eleven venture prior to acquiring our partner’s interest was
$2,229,000
. We accounted for this transaction as a business combination achieved in stages and as a result, we remeasured our equity method investment in the Eleven venture to its acquisition-date fair value of
$9,839,000
and recognized the resulting gain of
$7,610,000
in real estate segment earnings. At acquisition, we recorded additions to real estate commercial and income producing properties of
$53,917,000
and other assets of
$992,000
primarily consisting of in-place tenant leases of
$865,000
. In addition, we recorded a working capital deficit of
$979,000
and debt of
$23,936,000
.
In
2014
, the increase in commercial and income producing properties was principally due to the Eleven multifamily project which is now wholly-owned after acquisition of our partner's interest in the Eleven venture and
$26,110,000
from acquisition of three multifamily development sites. At year-end
2014
, commercial and income producing properties represents our
$53,382,000
investment in our
257
-unit multifamily property in Austin, our investment in a
413
guest room hotel in Austin with a carrying value of
$30,712,000
, our
$33,062,000
investment in our
354
-unit multifamily property in Dallas and our investment in multifamily development sites located in Austin, Charlotte, and Nashville with a combined carrying value of
$44,145,000
.
As a general contractor on guaranteed maximum price contracts associated with two multifamily venture properties, we recognized charges of
$5,111,000
in
2014
and
$554,000
in
2013
related to cost overruns.
We recognized non-cash asset impairment charges of
$399,000
in
2014
associated with two owned and consolidated entitled projects. We had
$1,790,000
non-cash impairment charges in
2013
associated with a master-planned community and golf club near Dallas. We had
no
non-cash asset impairment charges in
2012
.
Depreciation expense related to income producing properties was
$3,319,000
in
2014
,
$2,507,000
in
2013
and
$3,640,000
in
2012
and is included in other operating expense.
Net capitalized costs, utilizing the successful efforts method of accounting, related to our oil and gas producing activities are as follows:
|
|
At Year-End
|
||||||
|
|
2014
|
2013
|
|||||
|
|
(In thousands)
|
||||||
|
Unproved oil and gas properties
|
$
|
90,446
|
|
$
|
100,320
|
|
|
|
Proved oil and gas properties
|
221,299
|
|
155,262
|
|
|||
|
Total costs
|
311,745
|
|
255,582
|
|
|||
|
Less accumulated depreciation, depletion and amortization
|
(48,252
|
)
|
(22,941
|
)
|
|||
|
$
|
263,493
|
|
$
|
232,641
|
|
||
We review unproved oil and gas properties for impairment based on our current exploration plans and proved oil and gas properties by comparing the expected undiscounted future cash flows at a producing field level to the unamortized capitalized cost of the asset.
In 2014, we recognized non-cash impairment charges on our unproved leasehold interests of
$17,130,000
and on our proved properties of
$15,535,000
compared to
$473,000
of non-cash impairment charges on our unproved leasehold interests in
2013
principally due to the significant decline in oil prices. Impairment charges are included in cost of oil and gas producing activities on our income statement.
Asset Sales
In 2014, we sold certain non-strategic assets and recorded gains of
$8,526,000
related to the sale of approximately
650
net mineral acres leased from others in North Dakota and the sale of
124
gross (
18
net) producing oil and gas wells primarily in Oklahoma. Total proceeds received were
$17,660,000
.
73
Note 6 — Investment in Unconsolidated Ventures
At year-end
2014
, we had ownership interests in
15
ventures that we account for using the equity method.
In 2014, we formed
three
new multifamily unconsolidated ventures:
•
FMF Littleton LLC was formed with AIGGRE Littleton Common Investor LLC (AIGGRE) to develop a
385
-unit multifamily property in Littleton, Colorado. We own a
25 percent
interest and AIGGRE owns the remaining
75 percent
interest. We contributed
$4,900,000
of land and pre-development costs to the venture, net of
$9,852,000
of reimbursements received from the venture for land and pre-development costs we previously incurred. The venture obtained a senior secured construction loan in the amount of
$46,384,000
that bears interest at 30-day LIBOR plus
1.90%
payable monthly, of which
none
was outstanding at year-end
2014
. We provided the lender a construction completion guaranty; a guaranty of repayment of
25 percent
of the principal balance and unpaid accrued interest; and a nonrecourse carve-out guaranty. The principal guaranty will reduce from
25 percent
of principal to
10 percent
upon achievement of certain conditions. At year-end
2014
, our investment in this venture is
$6,287,000
.
•
CREA FMF Nashville LLC was formed with Massachusetts Mutual Life Insurance Co. (MassMutual) to develop a
320
-unit multifamily property in Nashville, Tennessee. We own a
30 percent
interest and MassMutual owns the remaining
70 percent
interest. We contributed
$5,897,000
of land and pre-development costs to the venture, net of
$7,191,000
of reimbursements received from the venture for pre-development costs we previously incurred. The venture obtained a senior secured construction loan in the amount of
$51,950,000
that bears interest at 30-day LIBOR plus
2.50%
per annum, of which
$29,660,000
was outstanding at year-end
2014
. MassMutual is obligated to make a capital contribution to the venture in an amount equal to its equity commitment under the construction loan in an amount not to exceed
$14,220,000
. Such capital contribution shall be paid upon the earlier of (i) March 17, 2015 (ii) two months after the issuance of final certificates of occupancy with respect to the entire project, or (iii) ten business days after the date on which the long-term credit rating of MassMutual is less than AA- from Standard & Poor's or A1 from Moody's. We provided the lender a construction completion guaranty; a guaranty of repayment of
25 percent
of the principal balance and unpaid accrued interest; and a nonrecourse carve-out guaranty. The principal guaranty will reduce from
25 percent
of principal to
zero
upon achievement of certain conditions. At year-end
2014
, our investment in this venture is
$5,516,000
.
•
Elan 99, LLC was formed with GS Elan 99 Holdings, LLC (Greystar) to develop a
360
-unit multifamily property in Katy, Texas. We own a
90 percent
non-managing member interest and Greystar owns the remaining
10 percent
managing member interest. We contributed
$8,757,000
in cash to the venture. The venture obtained a senior secured construction loan in the amount of
$37,275,000
that bears interest at LIBOR plus
2.50%
per annum which reduces to
2.30%
upon meeting a debt coverage ratio test, of which
$1,000
was outstanding at year-end 2014. Greystar will act as the guarantor for the construction loan as a developer and general contractor for the benefit of the Elan 99, LLC venture and Forestar as the investor member. At year-end 2014, our investment in this venture is
$8,679,000
.
Combined summarized balance sheet information for our ventures accounted for using the equity method follows:
|
|
Venture Assets
|
Venture Borrowings
(a)
|
Venture Equity
|
Our Investment
|
|||||||||||||||||||||||||||
|
|
At Year-End
|
||||||||||||||||||||||||||||||
|
|
2014
|
2013
|
2014
|
2013
|
2014
|
2013
|
2014
|
2013
|
|||||||||||||||||||||||
|
|
(In thousands)
|
||||||||||||||||||||||||||||||
|
242, LLC
(b)
|
$
|
33,021
|
|
$
|
23,751
|
|
$
|
6,940
|
|
$
|
921
|
|
$
|
21,789
|
|
$
|
19,838
|
|
$
|
10,098
|
|
$
|
9,084
|
|
|||||||
|
CJUF III, RH Holdings
(c)
|
—
|
|
36,320
|
|
—
|
|
18,492
|
|
—
|
|
15,415
|
|
—
|
|
3,235
|
|
|||||||||||||||
|
CL Ashton Woods, LP
(d)
|
13,269
|
|
10,473
|
|
—
|
|
—
|
|
11,453
|
|
9,704
|
|
6,015
|
|
3,544
|
|
|||||||||||||||
|
CL Realty, LLC
|
7,960
|
|
8,298
|
|
—
|
|
—
|
|
7,738
|
|
8,070
|
|
3,869
|
|
4,035
|
|
|||||||||||||||
|
CREA FMF Nashville LLC
(b)
|
40,014
|
|
—
|
|
29,660
|
|
—
|
|
5,987
|
|
—
|
|
5,516
|
|
—
|
|
|||||||||||||||
|
Elan 99, LLC
|
10,070
|
|
—
|
|
1
|
|
—
|
|
9,643
|
|
—
|
|
8,679
|
|
—
|
|
|||||||||||||||
|
FMF Littleton LLC
|
26,953
|
|
—
|
|
—
|
|
—
|
|
24,435
|
|
—
|
|
6,287
|
|
—
|
|
|||||||||||||||
|
FMF Peakview LLC
|
43,638
|
|
30,673
|
|
23,070
|
|
12,533
|
|
17,464
|
|
16,620
|
|
3,575
|
|
3,406
|
|
|||||||||||||||
|
HM Stonewall Estates, Ltd.
(d)
|
3,750
|
|
3,781
|
|
669
|
|
63
|
|
3,081
|
|
3,718
|
|
1,752
|
|
2,128
|
|
|||||||||||||||
|
LM Land Holdings, LP
(d)
|
25,561
|
|
33,298
|
|
4,448
|
|
9,768
|
|
18,500
|
|
13,347
|
|
9,322
|
|
8,283
|
|
|||||||||||||||
|
PSW Communities, LP
|
16,045
|
|
—
|
|
10,515
|
|
—
|
|
4,415
|
|
—
|
|
3,924
|
|
—
|
|
|||||||||||||||
|
TEMCO Associates, LLC
|
11,756
|
|
13,320
|
|
—
|
|
—
|
|
11,556
|
|
13,160
|
|
5,778
|
|
6,580
|
|
|||||||||||||||
|
Other ventures (4)
(e)
|
8,453
|
|
12,723
|
|
26,944
|
|
29,699
|
|
(25,614
|
)
|
(31,357
|
)
|
190
|
|
852
|
|
|||||||||||||||
|
$
|
240,490
|
|
$
|
172,637
|
|
$
|
102,247
|
|
$
|
71,476
|
|
$
|
110,447
|
|
$
|
68,515
|
|
$
|
65,005
|
|
$
|
41,147
|
|
||||||||
74
Combined summarized income statement information for our ventures accounted for using the equity method follows:
|
|
Revenues
|
Earnings (Loss)
|
Our Share of Earnings (Loss)
|
||||||||||||||||||||||||||||||||
|
|
For the Year
|
||||||||||||||||||||||||||||||||||
|
|
2014
|
2013
|
2012
|
2014
|
2013
|
2012
|
2014
|
2013
|
2012
|
||||||||||||||||||||||||||
|
|
(In thousands)
|
||||||||||||||||||||||||||||||||||
|
242, LLC
(b)
|
$
|
5,612
|
|
$
|
6,269
|
|
$
|
4,868
|
|
$
|
2,951
|
|
$
|
1,512
|
|
$
|
1,040
|
|
$
|
1,514
|
|
$
|
805
|
|
$
|
572
|
|
||||||||
|
CJUF III, RH Holdings
(c)
|
2,168
|
|
120
|
|
—
|
|
(956
|
)
|
(652
|
)
|
(241
|
)
|
(956
|
)
|
(652
|
)
|
(241
|
)
|
|||||||||||||||||
|
CL Ashton Woods, LP
(d)
|
5,431
|
|
9,018
|
|
3,353
|
|
1,748
|
|
2,660
|
|
1,472
|
|
2,471
|
|
4,169
|
|
2,024
|
|
|||||||||||||||||
|
CL Realty, LLC
|
1,573
|
|
1,603
|
|
2,667
|
|
1,068
|
|
1,028
|
|
1,060
|
|
534
|
|
514
|
|
530
|
|
|||||||||||||||||
|
CREA FMF Nashville LLC
(b)
|
—
|
|
—
|
|
—
|
|
(163
|
)
|
—
|
|
—
|
|
(163
|
)
|
—
|
|
—
|
|
|||||||||||||||||
|
Elan 99, LLC
|
—
|
|
—
|
|
—
|
|
(87
|
)
|
—
|
|
—
|
|
(78
|
)
|
—
|
|
—
|
|
|||||||||||||||||
|
FMF Littleton LLC
|
—
|
|
—
|
|
—
|
|
(239
|
)
|
—
|
|
—
|
|
(60
|
)
|
—
|
|
—
|
|
|||||||||||||||||
|
FMF Peakview LLC
|
4
|
|
1
|
|
—
|
|
(410
|
)
|
(252
|
)
|
(116
|
)
|
(83
|
)
|
(50
|
)
|
(23
|
)
|
|||||||||||||||||
|
HM Stonewall Estates, Ltd.
(d)
|
1,728
|
|
2,922
|
|
2,500
|
|
613
|
|
1,082
|
|
829
|
|
248
|
|
452
|
|
332
|
|
|||||||||||||||||
|
LM Land Holdings, LP
(d)
|
21,980
|
|
25,426
|
|
10,268
|
|
15,520
|
|
11,012
|
|
1,895
|
|
4,827
|
|
3,418
|
|
257
|
|
|||||||||||||||||
|
PSW Communities, LP
|
—
|
|
—
|
|
—
|
|
(86
|
)
|
—
|
|
—
|
|
(76
|
)
|
—
|
|
—
|
|
|||||||||||||||||
|
TEMCO Associates, LLC
|
2,155
|
|
630
|
|
702
|
|
494
|
|
96
|
|
(80
|
)
|
247
|
|
48
|
|
(40
|
)
|
|||||||||||||||||
|
Other ventures (4)
(f)
|
1,792
|
|
5,994
|
|
8,790
|
|
4,835
|
|
176
|
|
10,032
|
|
260
|
|
33
|
|
11,058
|
|
|||||||||||||||||
|
$
|
42,443
|
|
$
|
51,983
|
|
$
|
33,148
|
|
$
|
25,288
|
|
$
|
16,662
|
|
$
|
15,891
|
|
$
|
8,685
|
|
$
|
8,737
|
|
$
|
14,469
|
|
|||||||||
_____________________
|
(a)
|
Total includes current maturities of
$65,795,000
at year-end
2014
, of which
$42,566,000
is non-recourse to us, and
$37,966,000
at year-end
2013
, of which
$37,822,000
is non-recourse to us.
|
|
(b)
|
Includes unamortized deferred gains on real estate contributed by us to ventures. We recognize deferred gains as income as real estate is sold to third parties. Deferred gains of
$1,621,000
are reflected as a reduction to our investment in unconsolidated ventures at year-end
2014
.
|
|
(c)
|
In 2014, we acquired full ownership in the Eleven venture for
$21,500,000
. The acquisition-date fair value was
$55,275,000
, including debt of
$23,936,000
. Our investment in the Eleven venture prior to acquiring our partner’s interest was
$2,229,000
. At year-end 2014, we no longer have an equity method investment in the Eleven venture.
|
|
(d)
|
Includes unrecognized basis difference of
$1,517,000
which is reflected as a reduction of our investment in unconsolidated ventures at year-end
2014
. This difference between estimated fair value of the equity investment and our capital account within the respective ventures at closing will be accreted as income or expense over the life of the investment and included in our share of earnings (loss) from the respective ventures.
|
|
(e)
|
Our investment in other ventures reflects our ownership interests generally ranging from
25
to
50 percent
, excluding venture losses that exceed our investment where we are not obligated to fund those losses. Please read
Note 16 — Variable Interest Entities
for additional information.
|
|
(f)
|
In 2012, other ventures earnings include
$5,307,000
related to a consolidated venture’s share of the gain associated with Round Rock Luxury Apartment's sale of Las Brisas. Our share of these earnings was
$2,541,000
and we allocated
$2,766,000
to net income attributable to noncontrolling interests.
|
In
2014
, we invested
$14,692,000
in these ventures and received
$7,518,000
in distributions; in
2013
, we invested
$857,000
in these ventures and received
$9,854,000
in distributions; in
2012
, we invested
$2,318,000
in these ventures and received
$15,905,000
in distributions. Distributions include both return of investments and distributions of earnings.
We provide construction and development services for some of these ventures for which we receive fees. Fees for these services were
$2,275,000
in
2014
,
$1,068,000
in
2013
and
$935,000
in
2012
and are included in real estate revenues.
75
Receivables consist of:
|
|
At Year-End
|
||||||
|
|
2014
|
2013
|
|||||
|
|
(In thousands)
|
||||||
|
Loan secured by real estate
|
$
|
3,574
|
|
$
|
7,610
|
|
|
|
Other loans secured by real estate, average interest rate of 4.41% at year-end 2014 and 5.00% at year-end 2013
|
1,737
|
|
7,987
|
|
|||
|
Oil and gas joint interest billing receivables
|
5,738
|
|
3,896
|
|
|||
|
Oil and gas revenue accruals
|
7,293
|
|
8,137
|
|
|||
|
Other receivables and accrued interest
|
6,505
|
|
11,648
|
|
|||
|
24,847
|
|
39,278
|
|
||||
|
Allowance for bad debts
|
(258
|
)
|
(26
|
)
|
|||
|
$
|
24,589
|
|
$
|
39,252
|
|
||
At year-end
2014
, we have
$3,574,000
invested in a loan secured by real estate. The loan was acquired from a financial institution in 2011 when the loan was non-performing and is secured by a lien on developed and undeveloped real estate located near Houston designated for single-family residential and commercial development. In 2012, an approved bankruptcy plan of reorganization of the borrower became effective establishing a principal amount of
$33,900,000
maturing in April 2017. Interest accrues at
nine percent
the first
three years
escalating to
ten percent
in April 2015 and
12 percent
in April 2016, with interest above
6.25 percent
to be forgiven if the loan is prepaid by certain dates. Commencing with the reorganization, we estimated future cash flows and calculated accretable yield to be recognized over the term of the loan, which is included in other non-operating income. In
2014
and
2013
, we received principal payments of
$11,304,000
and
$14,315,000
and interest payments of
$634,000
and
$1,872,000
. At year-end
2014
, the outstanding principal balance was
$4,394,000
.
Estimated accretable yield is as follows:
|
At Year-End
|
|||||||
|
2014
|
2013
|
||||||
|
|
(In thousands)
|
||||||
|
Beginning of year
|
$
|
8,908
|
|
$
|
25,149
|
|
|
|
Change in accretable yield due to change in timing of estimated cash flows
|
(166
|
)
|
(10,950
|
)
|
|||
|
Interest income recognized
|
(7,903
|
)
|
(5,291
|
)
|
|||
|
$
|
839
|
|
$
|
8,908
|
|
||
Other loans secured by real estate generally are secured by a deed of trust and due within
three years
. The decrease in 2014 is principally associated with the sale of
33
commercial tract acres from our Cibolo Canyons project in San Antonio, Texas for
$7,700,000
in which we seller-financed
$6,160,000
at an interest rate of prime plus
one percent
. The buyer was unable to meet the terms of the financing and we foreclosed on the property. The remaining loans secured by real estate at year-end 2014 principally consist of
$824,000
related to a real estate contract for a project in Colorado and
$550,000
related to a real estate contract for a project in Los Angeles.
Debt consists of:
|
|
At Year-End
|
||||||
|
|
2014
|
2013
|
|||||
|
|
(In thousands)
|
||||||
|
Senior secured credit facility
|
|||||||
|
Term loan facility — average interest rate of 4.17% at year-end 2013
|
$
|
—
|
|
$
|
200,000
|
|
|
|
8.50% senior secured notes due 2022
|
250,000
|
|
—
|
|
|||
|
3.75% convertible senior notes due 2020, net of discount
|
103,194
|
|
99,890
|
|
|||
|
6.00% tangible equity units, net of discount
|
17,154
|
|
25,619
|
|
|||
|
Secured promissory notes — average interest rates of 3.17% at year-end 2014 and 2013
|
15,400
|
|
15,400
|
|
|||
|
Other indebtedness due through 2017 at variable and fixed interest rates ranging from 2.19% to 5.00%
|
46,996
|
|
16,498
|
|
|||
|
$
|
432,744
|
|
$
|
357,407
|
|
||
76
In 2014, we amended our senior secured credit facility in order to consolidate previous amendments and to effect the following:
•
increase the revolving loan commitment from
200,000,000
to
300,000,000
;
•
extend the maturity date to
May 15, 2017
(with
two one-year extension options
);
•
increase the minimum interest coverage ratio from
1.50
x to
2.50
x;
•
eliminate the collateral value to loan commitment ratio covenant; and
•
increase the maximum total leverage ratio from
40%
to
50%
.
We incurred fees of
$3,068,000
related to this amendment. At year-end
2014
, our senior secured credit facility provides for a
$300,000,000
revolving line of credit maturing
May 15, 2017
. The term loan and revolving line of credit may be prepaid at any time without penalty. The revolving line of credit includes a
$100,000,000
sublimit for letters of credit, of which
$15,415,000
is outstanding at year-end
2014
. Total borrowings under our senior secured credit facility (including the face amount of letters of credit) may not exceed a borrowing base formula. At year-end
2014
, we had
$284,585,000
in net unused borrowing capacity under our senior credit facility.
Under the terms of our senior secured credit facility, at our option, we can borrow at LIBOR plus
4.0 percent
or at the alternate base rate plus
3.0 percent
. The alternate base rate is the highest of (i) KeyBank National Association’s base rate, (ii) the federal funds effective rate plus
0.5 percent
or (iii) 30 day LIBOR plus
1 percent
. Borrowings under the senior secured credit facility are or may be secured by (a) mortgages on the timberland, high value timberland and portions of raw entitled land, as well as pledges of other rights including certain oil and gas operating properties, (b) assignments of current and future leases, rents and contracts, (c) a security interest in our primary operating account, (d) a pledge of the equity interests in current and future material operating subsidiaries and most of our majority-owned joint venture interests, or if such pledge is not permitted, a pledge of the right to distributions from such entities, and (e) a pledge of certain reimbursements payable to us from special improvement district tax collections in connection with our Cibolo Canyons project. The senior secured credit facility provides for releases of real estate and other collateral provided that borrowing base compliance is maintained.
Our debt agreements contain financial covenants customary for such agreements including minimum levels of interest coverage and limitations on leverage. At year-end
2014
, we were in compliance with the financial covenants of these agreements. In addition, we may elect to make distributions so long as the total leverage ratio is less than
40 percent
, the interest coverage is greater than
3.0
:1.0, and available liquidity is not less than
$125,000,000
. At year-end 2014, we satisfied all of the above conditions.
On May 12, 2014, we issued
$250,000,000
aggregate principal of
8.50%
Senior Secured Notes due 2022 (Notes). The Notes will mature on
June 1, 2022
and interest on the Notes is payable semiannually at a rate of
8.5 percent
per annum in arrears. We incurred debt issuance costs of approximately
$8,053,000
, including the underwriters discount of
$6,250,000
. Notes are secured by a second lien on the same collateral pledged under our credit facility. Net proceeds from issuance of the Notes were used to repay our
$200,000,000
senior secured term loan. We intend to use the remaining amount for general corporate purposes, which may include investments in strategic growth opportunities.
In 2013, we issued
$125,000,000
aggregate principal amount of
3.75%
convertible senior notes due 2020 (Convertible Notes). Interest on the Convertible Notes is payable semiannually at a rate of
3.75 percent
per annum and they mature on
March 1, 2020
. The Convertible Notes have an initial conversion rate of
40.8351
per
$1,000
principal amount. The initial conversion rate is subject to adjustment upon the occurrence of certain events. Prior to November 1, 2019, the Convertible Notes are convertible only upon certain circumstances, and thereafter are convertible at any time prior to the close of business on the second scheduled trading day prior to maturity. If converted, holders will receive cash, shares of our common stock or a combination thereof at our election. We intend to settle the principal amount of the Convertible Notes in cash upon conversion, with any excess conversion value to be settled in shares of our common stock. At year-end
2014
, unamortized debt discount of our Convertible Notes was
$21,806,000
.
In 2013, we issued
$150,000,000
aggregate principal amount of
6.00%
tangible equity units (Units). The total offering was
6,000,000
Units, including
600,000
exercised by the underwriters, each with a stated amount of
$25.00
. Each Unit is comprised of (i) a prepaid stock purchase contract to be settled by delivery of a number of shares of our common stock, par value
$1.00
per share to be determined pursuant to a purchase contract agreement, and (ii) a senior amortizing note due December 15, 2016 that has an initial principal amount of
$4.2522
, bears interest at a rate of
4.50%
per annum and has a final installment payment date of December 15, 2016. The actual number of shares we may issue upon settlement of the stock purchase contract will be between
6,547,800
shares (the minimum settlement rate) and
7,857,000
shares (the maximum settlement rate) based on the applicable market value, as defined in the purchase contract agreement associated with issuance of the Units.
At year-end
2014
, secured promissory notes include a
$15,400,000
loan collateralized by a
413
guest room hotel located in Austin with a carrying value of
$30,712,000
.
77
At year-end
2014
, other indebtedness principally represents senior secured construction loans for two multifamily properties, of which
$23,936,000
is related to the 2014 acquisition of our partner's interest in a
257
-unit multifamily project in Austin and
$19,117,000
is related to our
354
-unit multifamily property in Dallas. The combined carrying value of these two multifamily properties is
$86,444,000
at year-end
2014
.
At year-end
2014
and
2013
, we have
$15,168,000
and
$7,896,000
in unamortized deferred fees which are included in other assets. Amortization of deferred financing fees was
$3,845,000
in
2014
,
$3,050,000
in
2013
and
$2,922,000
in
2012
and is included in interest expense.
Debt maturities during the next
five
years are:
2015
—
$49,535,000
;
2016
—
$29,031,000
;
2017
—
$984,000
;
2018
—
$0
;
2019
—
$0
and thereafter —
$353,194,000
.
Fair value is the exchange price that would be the amount received for an asset or paid to transfer a liability in an orderly transaction between market participants. In arriving at a fair value measurement, we use a fair value hierarchy based on three levels of inputs, of which the first two are considered observable and the last unobservable. The three levels of inputs used to establish fair value are the following:
|
•
|
Level 1 — Quoted prices in active markets for identical assets or liabilities;
|
|
•
|
Level 2 — Inputs other than Level 1 that are observable, either directly or indirectly, such as quoted prices for similar assets or liabilities; quoted prices in markets that are not active; or other inputs that are observable or can be corroborated by observable market data for substantially the full term of the assets or liabilities; and
|
|
•
|
Level 3 — Unobservable inputs that are supported by little or no market activity and that are significant to the fair value of the assets or liabilities.
|
Non-financial assets measured at fair value on a non-recurring basis principally include real estate assets, proved oil and gas properties, goodwill and intangible assets, which are measured for impairment.
Proved oil and gas properties are evaluated for impairment when facts and circumstances indicate that their carrying amounts may not be recoverable. If projected undiscounted future net cash flows are less than the carrying value of the property, an impairment loss is recognized for the excess of the carrying amount over estimated fair value. Future net cash flows are based on future sales prices of oil and gas, future development and production costs, future reserves to be recovered and timing of production. We used Level 3 inputs and the income valuation method to estimate the fair value of proved oil and gas properties where the carrying amount exceeded the estimated undiscounted cash flows. We used a discount rate of 10 percent as of year-end 2014 which is commensurate with our risk and current market conditions associated with realizing the expected cash flows projected. As a result, we recorded proved property non-cash impairment charges of
$15,535,000
in 2014.
In 2014, certain real estate assets were remeasured and reported at fair value due to events or circumstances that indicated the carrying value may not be recoverable. We determined estimated fair value based on the present value of future probability weighted cash flows expected from the sale of the long-lived asset or based on a third party appraisal of current value. As a result, we recognized non-cash asset impairment charges of
$399,000
in
2014
associated with
two owned entitled projects
.
We had
$1,790,000
non-cash impairment charges in
2013
associated with a master-planned community and golf club near Dallas.
|
|
Year-End 2014
|
Year-End 2013
|
|||||||||||||||||||||||||||||
|
|
Level 1
|
Level 2
|
Level 3
|
Total
|
Level 1
|
Level 2
|
Level 3
|
Total
|
|||||||||||||||||||||||
|
|
(In thousands)
|
||||||||||||||||||||||||||||||
|
Non-Financial Assets and Liabilities:
|
|||||||||||||||||||||||||||||||
|
Real estate
|
$
|
—
|
|
$
|
970
|
|
$
|
—
|
|
$
|
970
|
|
$
|
—
|
|
$
|
3,700
|
|
$
|
—
|
|
$
|
3,700
|
|
|||||||
|
Proved oil and gas properties
|
$
|
—
|
|
$
|
—
|
|
$
|
3,655
|
|
$
|
3,655
|
|
$
|
—
|
|
$
|
—
|
|
$
|
—
|
|
$
|
—
|
|
|||||||
We elected not to use the fair value option for cash and cash equivalents, accounts receivable, other current assets, variable debt, accounts payable and other current liabilities. The carrying amounts of these financial instruments approximate their fair values due to their short-term nature or variable interest rates. We determine the fair value of fixed rate financial instruments using quoted prices for similar instruments in active markets.
78
Information about our fixed rate financial instruments not measured at fair value follows:
|
|
Year-End 2014
|
Year-End 2013
|
|
||||||||||||||
|
|
Carrying
Amount
|
Fair
Value
|
Carrying
Amount
|
Fair
Value
|
Valuation
Technique
|
||||||||||||
|
|
(In thousands)
|
||||||||||||||||
|
Loan secured by real estate
|
$
|
3,574
|
|
$
|
4,859
|
|
$
|
7,610
|
|
$
|
18,025
|
|
Level 2
|
||||
|
Fixed rate debt
(a)
|
$
|
(370,348
|
)
|
$
|
(359,131
|
)
|
$
|
(126,640
|
)
|
$
|
(118,634
|
)
|
Level 2
|
||||
_____________________
|
(a)
|
Year-end 2014 includes our
$250,000,000
of
8.50%
senior secured notes due 2022, issued
May 12, 2014
.
|
Pursuant to our shareholder rights plan, each share of common stock outstanding is coupled with one-quarter of a preferred stock purchase right (Right). Each Right entitles our shareholders to purchase, under certain conditions, one one-hundredth of a share of newly issued Series A Junior Participating Preferred Stock at an exercise price of
$100
. Rights will be exercisable only if someone acquires beneficial ownership of
20 percent
or more of our common shares or commences a tender or exchange offer, upon consummation of which they would beneficially own
20 percent
or more of our common shares. We will generally be entitled to redeem the Rights at
$0.001
per Right at any time until the
10th
business day following public announcement that a
20 percent
position has been acquired. The Rights will expire on
December 11, 2017
.
Please read
Note 8 — Debt
and
Note 11 — Net Income per Share
for information about shares of common stock that could be issued under our
3.75%
convertible senior notes due 2020 and our
6.00%
tangible equity units.
Please read
Note 17 — Share-Based Compensation
for information about additional shares of common stock that could be issued under terms of our share-based compensation plans.
At year-end
2014
, personnel of former affiliates held options to purchase
705,000
shares of our common stock. The options have a weighted average exercise price of
$26.15
and a weighted average remaining contractual term of
one year
. At year-end
2014
, the options have an aggregate intrinsic value of
$30,000
.
In
2014
, we repurchased
1,491,187
shares of our common stock for
$24,595,000
. In
2013
, we did not repurchase shares of our common stock. We have repurchased
3,493,332
shares of our common stock for
$54,159,000
since we announced our 2009 strategic initiative of repurchasing up to
20 percent
or up to
7,000,000
shares of our common stock.
Basic and diluted earnings per share is computed using the two-class method. The two-class method is an earnings allocation formula that determines net income per share for each class of common stock and participating security. We have determined that our
6.00%
tangible equity units are participating securities. Per share amounts are computed by dividing earnings available to common shareholders by the weighted average shares outstanding during each period.
79
The computations of basic and diluted earnings per share are as follows:
|
|
For the Year
|
||||||||||
|
|
2014
|
2013
|
2012
|
||||||||
|
|
(In thousands)
|
||||||||||
|
Numerator:
|
|||||||||||
|
Consolidated net income
|
$
|
17,088
|
|
$
|
35,061
|
|
$
|
17,876
|
|
||
|
Less: Net income attributable to noncontrolling interest
|
(505
|
)
|
(5,740
|
)
|
(4,934
|
)
|
|||||
|
Earnings available for diluted earnings per share
|
$
|
16,583
|
|
$
|
29,321
|
|
$
|
12,942
|
|
||
|
Less: Undistributed net income allocated to participating securities
|
(3,018
|
)
|
(585
|
)
|
—
|
|
|||||
|
Earnings available to common shareholders for basic earnings per share
|
$
|
13,565
|
|
$
|
28,736
|
|
$
|
12,942
|
|
||
|
Denominator:
|
|||||||||||
|
Weighted average common shares outstanding — basic
|
35,317
|
|
35,365
|
|
35,214
|
|
|||||
|
Weighted average common shares upon conversion of participating securities
(a)
|
7,857
|
|
835
|
|
—
|
|
|||||
|
Dilutive effect of stock options, restricted stock and equity-settled awards
|
422
|
|
613
|
|
268
|
|
|||||
|
Total weighted average shares outstanding — diluted
|
43,596
|
|
36,813
|
|
35,482
|
|
|||||
|
Anti-dilutive awards excluded from diluted weighted average shares outstanding
|
2,238
|
|
1,803
|
|
2,713
|
|
|||||
_____________________
|
(a)
|
Our earnings per share calculation reflects the weighted average shares issuable upon settlement of the prepaid stock purchase contract component of our
6.00%
tangible equity units, issued November 27, 2013.
|
The actual number of shares we may issue upon settlement of the stock purchase contract will be between
6,547,800
shares (the minimum settlement rate) and
7,857,000
shares (the maximum settlement rate) based on the applicable market value, as defined in the purchase contract agreement associated with issuance of the Units.
We intend to settle the principal amount of the Convertible Notes in cash upon conversion with any excess conversion value to be settled in shares of our common stock. Therefore, only the amount in excess of the par value of the Convertible Notes will be included in our calculation of diluted net income per share using the treasury stock method. As such, the Convertible Notes have no impact on diluted net income per share until the price of our common stock exceeds the conversion price of the Convertible Notes of
$24.49
. The average price of our common stock in 2014 did not exceed the conversion price which resulted in no additional diluted outstanding shares.
Income tax expense consists of:
|
|
For the Year
|
||||||||||
|
|
2014
|
2013
|
2012
|
||||||||
|
|
(In thousands)
|
||||||||||
|
Current tax provision:
|
|||||||||||
|
U.S. Federal
|
$
|
(5,444
|
)
|
$
|
(6,004
|
)
|
$
|
(11,834
|
)
|
||
|
State and other
|
(1,569
|
)
|
(2,066
|
)
|
(2,171
|
)
|
|||||
|
(7,013
|
)
|
(8,070
|
)
|
(14,005
|
)
|
||||||
|
Deferred tax provision:
|
|||||||||||
|
U.S. Federal
|
(2,772
|
)
|
1,148
|
|
4,910
|
|
|||||
|
State and other
|
1,128
|
|
(286
|
)
|
1,079
|
|
|||||
|
(1,644
|
)
|
862
|
|
5,989
|
|
||||||
|
Income tax expense
|
$
|
(8,657
|
)
|
$
|
(7,208
|
)
|
$
|
(8,016
|
)
|
||
80
A reconciliation of the federal statutory rate to the effective income tax rate on continuing operations follows:
|
|
For the Year
|
|||||||
|
|
2014
|
2013
|
2012
|
|||||
|
Federal statutory rate
|
35
|
%
|
35
|
%
|
35
|
%
|
||
|
State, net of federal benefit
|
1
|
|
4
|
|
5
|
|
||
|
Recognition of previously unrecognized tax benefits
|
—
|
|
(15
|
)
|
—
|
|
||
|
State rate change due to acquisition
|
—
|
|
—
|
|
(2
|
)
|
||
|
Acquisition costs
|
—
|
|
—
|
|
4
|
|
||
|
Noncontrolling interests
|
—
|
|
(5
|
)
|
(7
|
)
|
||
|
Goodwill
|
1
|
|
—
|
|
—
|
|
||
|
Charitable contributions
|
(1
|
)
|
—
|
|
—
|
|
||
|
Oil and gas percentage depletion
|
(2
|
)
|
(2
|
)
|
(5
|
)
|
||
|
Other
|
—
|
|
—
|
|
1
|
|
||
|
Effective tax rate
|
34
|
%
|
17
|
%
|
31
|
%
|
||
Our 2013 effective tax rate includes a
15 percent
benefit from recognition of
$6,326,000
of previously unrecognized tax benefits upon lapse of the statute of limitations for a previously reserved tax position. Our 2012 effective tax rate includes a
two percent
non-cash benefit associated with state deferred tax rate changes due to our acquisition of Credo and operating in additional states.
Significant components of deferred taxes are:
|
|
At Year-End
|
||||||
|
|
2014
|
2013
|
|||||
|
|
(In thousands)
|
||||||
|
Deferred Tax Assets:
|
|||||||
|
Real estate
|
$
|
79,244
|
|
$
|
75,157
|
|
|
|
Employee benefits
|
17,352
|
|
17,902
|
|
|||
|
Net operating loss carryforwards
|
3,012
|
|
3,076
|
|
|||
|
Income producing properties
|
364
|
|
3,529
|
|
|||
|
Oil and gas percentage depletion carryforwards
|
3,471
|
|
3,344
|
|
|||
|
Accruals not deductible until paid
|
1,111
|
|
960
|
|
|||
|
Gross deferred tax assets
|
104,554
|
|
103,968
|
|
|||
|
Valuation allowance
|
(384
|
)
|
(375
|
)
|
|||
|
Deferred tax asset net of valuation allowance
|
104,170
|
|
103,593
|
|
|||
|
Deferred Tax Liabilities:
|
|||||||
|
Oil and gas properties
|
(49,905
|
)
|
(46,966
|
)
|
|||
|
Undeveloped land
|
(4,937
|
)
|
(5,961
|
)
|
|||
|
Convertible debt
|
(7,816
|
)
|
(8,803
|
)
|
|||
|
Timber
|
(888
|
)
|
(1,465
|
)
|
|||
|
Gross deferred tax liabilities
|
(63,546
|
)
|
(63,195
|
)
|
|||
|
Net Deferred Tax Asset
|
$
|
40,624
|
|
$
|
40,398
|
|
|
At year-end
2014
, we had federal net operating loss carryforwards of approximately
$7,500,000
as a result of our acquisition of Credo in 2012, and we had approximately
$18,000,000
of state net operating loss carryforwards. These are subject to certain limitations. If not utilized, these carryforwards will expire in
2031
for federal purposes and
2015
to
2034
for state purposes. We had approximately
$9,200,000
of oil and gas percentage depletion carryforwards that also were a result of our acquisition of Credo. These carryforwards are subject to certain limitations but do not expire.
At year-end 2014 and 2013, we have not provided a valuation allowance for our federal deferred tax asset because we believe it is likely it will be recoverable in future periods. We have provided a valuation allowance for some of our state net operating loss carryforwards. The change in our state valuation allowance for the year was
$9,000
. Our deferred tax liability on oil and gas properties includes purchase accounting amounts for the excess of fair value allocated to Credo oil and gas properties over the carryover tax basis received. Goodwill associated with our acquisition of Credo is not deductible for income tax purposes.
We file income tax returns in the U.S. federal jurisdiction and in various state jurisdictions. We are no longer subject to U.S. federal income tax examinations for years before 2011 and state examinations for years before 2010.
81
A reconciliation of the beginning and ending amount of tax benefits not recognized for book purposes is as follows:
|
|
At Year-End
|
||||||||||
|
|
2014
|
2013
|
2012
|
||||||||
|
|
(In thousands)
|
||||||||||
|
Balance at beginning of year
|
$
|
—
|
|
$
|
5,831
|
|
$
|
5,831
|
|
||
|
Reductions for tax positions of prior years
|
—
|
|
—
|
|
—
|
|
|||||
|
Reductions due to lapse of statute of limitations
|
—
|
|
(5,831
|
)
|
—
|
|
|||||
|
Balance at end of year that would affect the annual effective tax rate if recognized
|
$
|
—
|
|
$
|
—
|
|
$
|
5,831
|
|
||
We recognize interest accrued related to unrecognized tax benefits in income tax expense. In
2014
,
2013
and
2012
, we recognized approximately
$0
,
$75,000
and
$152,000
in interest expense. At year-end
2014
and
2013
, we have
no
accrued interest or penalties.
Litigation
We are involved in various legal proceedings that arise from time to time in the ordinary course of doing business and believe that adequate reserves have been established for any probable losses. We do not believe that the outcome of any of these proceedings should have a significant adverse effect on our financial position, long-term results of operations or cash flows. It is possible, however, that charges related to these matters could be significant to our results or cash flows in any one accounting period.
Environmental
Environmental remediation liabilities arise from time to time in the ordinary course of doing business, and we believe we have established adequate reserves for any probable losses that we can reasonably estimate. We own
288
acres near Antioch, California, portions of which were sites of a former paper manufacturing operation that are in remediation. We have received certificates of completion on all but one
80
acre tract, a portion of which includes subsurface contamination. We estimate the remaining cost to complete remediation activities will be approximately
$529,000
, which is included in other accrued expenses. It is possible that remediation or monitoring activities could be required in addition to those included within our estimate, but we are unable to determine the scope, timing or extent of such activities.
We have asset retirement obligations related to the abandonment and site restoration requirements that result from the acquisition, construction and development of oil and gas properties. We record the fair value of a liability for an asset retirement obligation in the period in which it is incurred and a corresponding increase in the carrying amount of the related long-lived asset. Accretion expense related to the asset retirement obligation and depletion expense related to capitalized asset retirement cost is included in cost of oil and gas producing activities on our consolidated statements of income and comprehensive income. At year-end
2014
, our asset retirement obligation was
$1,807,000
, which is included in other liabilities.
We lease facilities and equipment under non-cancelable long-term operating lease agreements. In addition, we have various obligations under other office space and equipment leases of less than one year. Rent expense on facilities and equipment was
$2,617,000
in
2014
,
$2,374,000
in
2013
and
$2,115,000
in
2012
. Future minimum rental commitments under non-cancelable operating leases having a remaining term in excess of
one
year are:
2015
—
$3,308,000
;
2016
—
$3,111,000
;
2017
—
$3,101,000
;
2018
—
$2,165,000
;
2019
—
$571,000
and thereafter —
$2,284,000
.
We have
three years
remaining on groundwater leases of about
20,000
acres. At year-end
2014
, the remaining contractual obligation for these groundwater leases is
$1,514,000
.
We lease approximately
32,000
square feet of office space in Austin, Texas, which we occupy as our corporate headquarters. The remaining contractual obligation for this lease is
$5,632,000
. We also lease office space in several other locations in support of our business operations with approximately
21,000
and
10,000
square feet in Ft. Worth, Texas and Denver, Colorado. The total remaining contractual obligations for these leases is
$6,262,000
.
We may provide performance bonds and letters of credit on behalf of certain ventures that would be drawn on due to failure to satisfy construction obligations as general contractor or for failure to timely deliver streets and utilities in accordance with local codes and ordinances.
82
We manage our operations through
three
business segments: real estate, oil and gas and other natural resources. Real estate secures entitlements and develops infrastructure on our lands for single-family residential and mixed-use communities, and manages our undeveloped land, commercial and income producing properties, primarily a hotel and our multifamily investments. Oil and gas is an independent oil and gas exploration, development and production operation and manages our owned and leased mineral interests. Other natural resources manages our timber, recreational leases and water resource initiatives.
We evaluate performance based on segment earnings (loss) before unallocated items and income taxes. Segment earnings (loss) consist of operating income, equity in earnings (loss) of unconsolidated ventures, gain on sales of assets, interest income on loans secured by real estate and net (income) loss attributable to noncontrolling interests. Items not allocated to our business segments consist of general and administrative expense, share-based compensation, gain on sale of strategic timberland, interest expense and other corporate non-operating income and expense. The accounting policies of the segments are the same as those described in
Note 1 — Summary of Significant Accounting Policies
. Our revenues are derived from our U.S. operations and all of our assets are located in the U.S. In
2014
,
2013
and
2012
,
no
single customer accounted for more than
10 percent
of our total revenues.
|
Real
Estate
|
Oil and Gas
|
Other Natural
Resources
|
Items Not
Allocated to
Segments
|
Total
|
||||||||||||||||
|
|
(In thousands)
|
|||||||||||||||||||
|
For the year or at year-end 2014
|
||||||||||||||||||||
|
Revenues
|
$
|
213,112
|
|
$
|
84,300
|
|
$
|
9,362
|
|
$
|
—
|
|
|
$
|
306,774
|
|
||||
|
Depreciation, depletion and amortization
|
3,741
|
|
29,442
|
|
497
|
|
8,035
|
|
|
41,715
|
|
|||||||||
|
Equity in earnings (loss) of unconsolidated ventures
|
8,068
|
|
586
|
|
31
|
|
—
|
|
|
8,685
|
|
|||||||||
|
Income (loss) before taxes
|
96,906
|
|
(22,686
|
)
|
5,499
|
|
(54,479
|
)
|
(a)
|
25,240
|
|
|||||||||
|
Total assets
|
654,774
|
|
342,703
|
|
22,531
|
|
238,191
|
|
|
1,258,199
|
|
|||||||||
|
Investment in unconsolidated ventures
|
65,005
|
|
—
|
|
—
|
|
—
|
|
|
65,005
|
|
|||||||||
|
Capital expenditures
(b)
|
28,980
|
|
103,385
|
|
5,817
|
|
616
|
|
|
138,798
|
|
|||||||||
|
For the year or at year-end 2013
|
||||||||||||||||||||
|
Revenues
|
$
|
248,011
|
|
$
|
72,313
|
|
$
|
10,721
|
|
$
|
—
|
|
|
$
|
331,045
|
|
||||
|
Depreciation, depletion and amortization
|
3,117
|
|
19,552
|
|
651
|
|
6,660
|
|
|
29,980
|
|
|||||||||
|
Equity in earnings (loss) of unconsolidated ventures
|
8,089
|
|
592
|
|
56
|
|
—
|
|
|
8,737
|
|
|||||||||
|
Income (loss) before taxes
|
68,454
|
|
18,859
|
|
6,507
|
|
(57,291
|
)
|
(a)
|
36,529
|
|
|||||||||
|
Total assets
|
582,802
|
|
312,553
|
|
23,478
|
|
253,319
|
|
|
1,172,152
|
|
|||||||||
|
Investment in unconsolidated ventures
|
41,147
|
|
—
|
|
—
|
|
—
|
|
|
41,147
|
|
|||||||||
|
Capital expenditures
(b)
|
7,265
|
|
97,696
|
|
2,720
|
|
216
|
|
|
107,897
|
|
|||||||||
|
For the year or at year-end 2012
|
||||||||||||||||||||
|
Revenues
|
$
|
120,115
|
|
$
|
44,220
|
|
$
|
8,256
|
|
$
|
—
|
|
|
$
|
172,591
|
|
||||
|
Depreciation, depletion and amortization
|
4,340
|
|
4,987
|
|
1,254
|
|
8,345
|
|
|
18,926
|
|
|||||||||
|
Equity in earnings of unconsolidated ventures
|
13,897
|
|
509
|
|
63
|
|
—
|
|
|
14,469
|
|
|||||||||
|
Income (loss) before taxes
|
53,582
|
|
26,608
|
|
29
|
|
(59,261
|
)
|
(a)
|
20,958
|
|
|||||||||
|
Total assets
|
588,137
|
|
227,061
|
|
24,066
|
|
79,170
|
|
|
918,434
|
|
|||||||||
|
Investment in unconsolidated ventures
|
41,546
|
|
—
|
|
—
|
|
—
|
|
|
41,546
|
|
|||||||||
|
Capital expenditures
(b)
|
1,093
|
|
21,971
|
|
292
|
|
795
|
|
|
24,151
|
|
|||||||||
_____________________
|
(a)
|
Items not allocated to segments consist of:
|
83
|
|
For the Year
|
||||||||||
|
|
2014
|
2013
|
2012
|
||||||||
|
|
(In thousands)
|
||||||||||
|
General and administrative expense
|
$
|
(21,229
|
)
|
$
|
(20,597
|
)
|
$
|
(25,176
|
)
|
||
|
Share-based compensation expense
|
(3,417
|
)
|
(16,809
|
)
|
(14,929
|
)
|
|||||
|
Gain on sale of assets
|
—
|
|
—
|
|
16
|
|
|||||
|
Interest expense
|
(30,286
|
)
|
(20,004
|
)
|
(19,363
|
)
|
|||||
|
Other corporate non-operating income
|
453
|
|
119
|
|
191
|
|
|||||
|
$
|
(54,479
|
)
|
$
|
(57,291
|
)
|
$
|
(59,261
|
)
|
|||
|
(b)
|
Consists of expenditures for oil and gas properties and equipment, commercial and income producing properties, property, plant and equipment and reforestation of timber.
|
We participate in real estate ventures for the purpose of acquiring and developing residential, multifamily and mixed-use communities in which we may or may not have a controlling financial interest. Generally accepted accounting principles require consolidation of VIEs in which an enterprise has a controlling financial interest and is the primary beneficiary. A controlling financial interest will have both of the following characteristics: (a) the power to direct the VIE activities that most significantly impact economic performance and (b) the obligation to absorb the VIE losses and right to receive benefits that are significant to the VIE. We examine specific criteria and use judgment when determining whether we are the primary beneficiary and must consolidate a VIE. We perform this review initially at the time we enter into venture agreements and continuously reassess to see if we are the primary beneficiary of a VIE.
In 2014, we acquired our partner's noncontrolling interests in the Lantana partnerships for
$7,971,000
. Prior to acquisition of the noncontrolling interests, we were the primary beneficiary of all but one of the Lantana partnerships which were variable interest entities (VIEs) and consolidated in our financial statements. We adjusted the carrying amount of noncontrolling interests to reflect the change in our ownership interest in the partnerships. The difference between the consideration paid and the carrying amount of the noncontrolling interests acquired is recognized as an adjustment to additional paid in capital attributable to Forestar, net of deferred taxes of
$1,729,000
.
At year-end
2014
, we have
four
VIEs. We account for these VIEs using the equity method and we are not the primary beneficiary. Although we have certain rights regarding major decisions, we do not have the power to direct the activities that are most significant to the economic performance of these VIEs. At year-end
2014
, these VIEs have total assets of
$64,311,000
, substantially all of which represent developed and undeveloped real estate and total liabilities of
$79,723,000
, which includes
$30,667,000
of borrowings classified as current maturities. These amounts are included in the summarized balance sheet information for ventures accounted for using the equity method in
Note 6 — Investment in Unconsolidated Ventures
. At year-end
2014
, our investment is
$9,500,000
and is included in investment in unconsolidated ventures. In
2014
, we contributed
$4,415,000
to these VIEs. Our maximum exposure to loss related to these VIEs is estimated at
$3,597,000
, which exceeds our investment as we have a nominal general partner interest and could be held responsible for its liabilities. The maximum exposure to loss represents the maximum loss that we could be required to recognize assuming all the ventures’ assets (principally real estate) are worthless, without consideration of the probability of a loss or of any actions we may take to mitigate any such loss.
Share-based compensation expense consists of:
|
|
For the Year
|
||||||||||
|
|
2014
|
2013
|
2012
|
||||||||
|
|
(In thousands)
|
||||||||||
|
Cash-settled awards
|
$
|
(3,710
|
)
|
$
|
7,774
|
|
$
|
6,465
|
|
||
|
Equity-settled awards
|
5,168
|
|
4,281
|
|
3,059
|
|
|||||
|
Restricted stock
|
(25
|
)
|
538
|
|
2,154
|
|
|||||
|
Stock options
|
1,984
|
|
4,216
|
|
3,251
|
|
|||||
|
$
|
3,417
|
|
$
|
16,809
|
|
$
|
14,929
|
|
|||
84
Share-based compensation expense is included in:
|
|
For the Year
|
||||||||||
|
|
2014
|
2013
|
2012
|
||||||||
|
|
(In thousands)
|
||||||||||
|
General and administrative
|
$
|
1,001
|
|
$
|
7,779
|
|
$
|
7,144
|
|
||
|
Other operating
|
2,416
|
|
9,030
|
|
7,785
|
|
|||||
|
$
|
3,417
|
|
$
|
16,809
|
|
$
|
14,929
|
|
|||
In 2014, share-based compensation expense decreased principally as a result of a decrease in our stock price and its impact on cash-settled awards as well as forfeiture of awards due to employee separations.
The fair value of awards granted to retirement-eligible employees and expensed at the date of grant was
$760,000
in
2014
,
$590,000
in
2013
and
$595,000
in
2012
. Unrecognized share-based compensation expense related to non-vested equity-settled awards, restricted stock and stock options is
$7,160,000
at year-end
2014
. The weighted average period over which this amount will be recognized is estimated to be
two
years. We did not capitalize any share-based compensation in
2014
,
2013
or
2012
.
In
2014
and
2013
, we issued
215,561
and
137,943
shares out of our treasury stock associated with vesting of stock-based awards or exercises of stock options. These shares are net of
55,238
and
59,219
shares withheld for payroll taxes having a value of
$1,043,000
and
$1,137,000
which are reflected in financing activities in our consolidated statements of cash flows.
A summary of awards granted under our 2007 Stock Incentive Plan follows:
Cash-settled awards
Cash-settled awards granted to our employees in the form of restricted stock units or stock appreciation rights generally vest over
three
to
four years
from the date of grant and generally provide for accelerated vesting upon death, disability or if there is a change in control. Vesting for some restricted stock unit awards is also conditioned upon achievement of a minimum
one percent
annualized return on assets over a
three
-year period. Cash-settled stock appreciation rights have a
ten
-year term, generally become exercisable ratably over
four years
and provide for accelerated or continued vesting upon retirement, death, disability or if there is a change in control. Stock appreciation rights were granted with an exercise price equal to the market value of our stock on the date of grant.
Cash-settled awards granted to our directors in the form of restricted stock units are fully vested at the time of grant and payable upon retirement.
The following table summarizes the activity of cash-settled restricted stock unit awards in
2014
:
|
Equivalent
Units
|
Weighted Average Grant Date Fair Value
|
|||
|
|
(In thousands)
|
(Per unit)
|
||
|
Non-vested at beginning of period
|
233
|
|
$17.90
|
|
|
Granted
|
93
|
|
18.96
|
|
|
Vested
|
(132
|
)
|
17.86
|
|
|
Forfeited
|
(9
|
)
|
17.42
|
|
|
Non-vested at end of period
|
185
|
|
18.49
|
|
The weighted average grant date fair value of our non-vested cash-settled restricted stock unit awards at year-end
2012
was
$17.03
for
350,000
equivalent units.
85
The following table summarizes the activity of cash-settled stock appreciation rights in
2014
:
|
Rights
Outstanding
|
Weighted Average
Exercise Price
|
Weighted Average
Remaining Contractual Term
|
Aggregate Intrinsic Value
(Current Value Less Exercise Price)
|
|||||
|
|
(In thousands)
|
(Per share)
|
(In years)
|
(In thousands)
|
||||
|
Balance at beginning of period
|
580
|
|
$11.96
|
5
|
$5,400
|
|||
|
Granted
|
—
|
|
—
|
|||||
|
Exercised
|
(116
|
)
|
9.41
|
|||||
|
Forfeited
|
(6
|
)
|
17.80
|
|||||
|
Balance at end of period
|
458
|
|
12.54
|
4
|
1,732
|
|||
|
Exercisable at end of period
|
458
|
|
12.54
|
4
|
1,732
|
|||
The weighted average exercise price of our cash-settled stock appreciation rights at year-end
2012
was
$11.38
for
866,000
awards.
The fair value of awards settled in cash was
$3,467,000
in
2014
,
$7,237,000
in
2013
and
$5,299,000
in
2012
. At year-end
2014
, the fair value of accrued cash-settled awards is
$9,560,000
and is included in other liabilities. The aggregate current value of non-vested awards is
$2,850,000
at year-end
2014
based on a year-end stock price of
$15.40
.
Equity-settled awards
Equity-settled awards granted to our employees include restricted stock units (RSU), which vest after
three years
from the date of grant, market-leveraged stock units (MSU), which vest after
three years
from date of grant and performance stock units (PSU), which generally vest after
three years
from the date of grant if certain performance goals are met. Equity settled awards in the form of restricted stock units granted to our directors are fully vested at time of grant and settled upon retirement. The following table summarizes the activity of equity-settled awards in
2014
:
|
|
Equivalent
Units
|
Weighted Average Grant Date Fair Value
|
||||
|
|
(In thousands)
|
(Per unit)
|
||||
|
Non-vested at beginning of period
|
581
|
|
$
|
19.50
|
|
|
|
Granted
|
512
|
|
19.18
|
|
||
|
Vested
|
(259
|
)
|
20.01
|
|
||
|
Forfeited
|
(124
|
)
|
18.58
|
|
||
|
Non-vested at end of period
|
710
|
|
19.24
|
|
||
In
2014
, we granted
270,000
PSU awards to be settled in common stock upon achievement of the performance goal over the measurement period of
three years
. The number of shares to be issued could range from a high of
540,000
shares to a low of
no
shares issued based upon performance.
In
2014
, we granted
86,000
MSU awards. These awards will be settled in common stock based upon our stock price performance over
three years
from the date of grant. The number of shares to be issued could range from a high of
129,000
shares if our stock price increases by
50 percent
or more, to
43,000
shares if our stock price decreases by
50 percent
, or could be
zero
if our stock price decreases by more than
50 percent
, the minimum threshold performance. MSU awards are valued using a Monte Carlo simulation pricing model, which includes expected stock price volatility and risk-free interest rate assumptions. Compensation expense is recognized regardless of achievement of performance conditions, provided the requisite service period is satisfied.
The weighted average grant date fair value of our non-vested equity-settled awards at year-end
2012
was
$18.99
for
409,000
non-vested restricted shares.
Unrecognized share-based compensation expense related to non-vested equity-settled awards is
$5,975,000
at year-end
2014
. The weighted average period over which this amount will be recognized is estimated to be
two years
.
86
Restricted stock
Restricted stock awards generally vest over
three years
, typically if we achieve a minimum
one percent
annualized return on assets over such
three
-year period. The following table summarizes the activity of restricted stock awards in
2014
:
|
|
Restricted
Shares
|
Weighted Average Grant Date Fair Value
|
||||
|
|
(In thousands)
|
(Per unit)
|
||||
|
Non-vested at beginning of period
|
47
|
|
$
|
14.99
|
|
|
|
Granted
|
—
|
|
—
|
|
||
|
Vested
|
(20
|
)
|
12.74
|
|
||
|
Forfeited
|
(10
|
)
|
15.02
|
|
||
|
Non-vested at end of period
|
17
|
|
17.56
|
|
||
The weighted average grant date fair value of our non-vested restricted stock awards at year-end
2012
was
$16.95
for
211,000
non-vested restricted shares.
Unrecognized share-based compensation expense related to non-vested restricted stock awards is
$138,000
at year-end
2014
. The weighted average period over which this amount will be recognized is estimated to be
one year
.
Stock options
Stock options have a
ten
-year term, generally become exercisable ratably over
four years
and provide for accelerated or continued vesting upon retirement, death, disability or if there is a change in control. Options were granted with an exercise price equal to the market value of our stock on the date of grant. The following table summarizes the activity of stock option awards in
2014
:
|
Options
Outstanding
|
Weighted
Average
Exercise Price
|
Weighted
Average
Remaining
Contractual
Term
|
Aggregate
Intrinsic Value
(Current
Value Less
Exercise Price)
|
|||||||||
|
|
(In thousands)
|
(Per share)
|
(In years)
|
(In thousands)
|
||||||||
|
Balance at beginning of period
|
2,006
|
|
$
|
20.30
|
|
7
|
$
|
6,433
|
|
|||
|
Granted
|
—
|
|
—
|
|
||||||||
|
Exercised
|
(56
|
)
|
9.64
|
|
||||||||
|
Forfeited
|
(89
|
)
|
17.65
|
|
||||||||
|
Balance at end of period
|
1,861
|
|
20.74
|
|
6
|
643
|
|
|||||
|
Exercisable at end of period
|
1,364
|
|
21.86
|
|
5
|
620
|
|
|||||
We estimate the grant date fair value of stock options using the Black-Scholes option pricing model and the following assumptions:
|
For the Year
|
||||||||
|
|
2013
|
2012
|
||||||
|
Expected stock price volatility
|
66.8
|
%
|
60.2
|
%
|
||||
|
Risk-free interest rate
|
1.4
|
%
|
1.3
|
%
|
||||
|
Expected life of options (years)
|
6
|
|
6
|
|
||||
|
Expected dividend yield
|
—
|
%
|
—
|
%
|
||||
|
Weighted average estimated fair value of options at grant date
|
$
|
11.47
|
|
$
|
9.22
|
|
||
We determine the expected life using the simplified method which utilizes the midpoint between the vesting period and the contractual life of the awards. The expected stock price volatility utilizes our historical volatility for a period corresponding to the expected life of the options.
The fair value of vested stock options was
$21,000
in 2014,
$1,355,000
in 2013 and
$429,000
in 2012. The intrinsic value of options exercised was
$568,000
in
2014
and
$562,000
in
2013
. There were
no
options exercised in
2012
. Unrecognized share-based compensation expense related to non-vested stock options is
$1,047,000
at year-end
2014
. The weighted average period over which this amount will be recognized is estimated to be
two years
.
87
Pre-Spin Awards
Certain of our employees participated in Temple-Inland’s share-based compensation plans. In conjunction with our 2007 spin-off, these awards were equitably adjusted into separate awards of the common stock of Temple-Inland and the spin-off entities. As a result of Temple-Inland’s merger with International Paper in first quarter 2012, all outstanding awards on Temple-Inland stock were settled with an intrinsic value of
$1,132,000
.
Pre-spin stock option awards to our employees to purchase our common stock have a
ten
-year term, generally become exercisable ratably over
four years
and provide for accelerated or continued vesting upon retirement, death, disability or if there is a change in control. At year-end
2014
, there were
56,000
pre-spin awards outstanding and exercisable on our stock with a weighted average exercise price of
$27.03
and weighted average remaining term of
one year
.
Our defined contribution retirement plans include a 401(k) plan, which is funded, and a supplemental plan for certain employees, which is unfunded. The expense of our defined contribution retirement plans was
$1,651,000
in
2014
,
$1,456,000
in
2013
and
$1,393,000
in
2012
. The unfunded liability for our supplemental plan was
$715,000
at year-end
2014
and
$586,000
at year-end
2013
and is included in other liabilities.
Note 19
— Supplemental Oil and Gas Disclosures (Unaudited)
The following unaudited information regarding our oil and gas reserves has been prepared and is presented pursuant to requirements of the Securities and Exchange Commission (SEC) and the Financial Accounting Standards Board (FASB).
We lease our mineral interests, principally in Texas and Louisiana, to third-party entities for the exploration and production of oil and gas. When we lease our mineral interests, we may negotiate a lease bonus payment and we retain a royalty interest and may take an additional participation in production, including a working interest in which we pay a share of the costs to drill, complete and operate a well and receive a proportionate share of the production revenues.
In 2012, we acquired
100 percent
of the outstanding common stock of Credo in an all cash transaction for
$14.50
per share, representing an equity purchase price of approximately
$146,445,000
. In addition, we paid in full
$8,770,000
of Credo’s outstanding debt. Credo was an independent oil and gas exploration, development and production company based in Denver, Colorado. The acquired assets included leasehold interests in the Bakken and Three Forks formations of North Dakota, the Lansing – Kansas City formation in Kansas and Nebraska, and the Tonkawa and Cleveland formations in Texas.
We engaged independent petroleum engineers, Netherland, Sewell & Associates, Inc., to assist in preparing estimates of our proved oil and gas reserves, all of which are located in the U.S., and future net cash flows as of year-end
2014
,
2013
and
2012
.
These estimates were based on the economic and operating conditions existing at year-end
2014
,
2013
and
2012
. Proved developed reserves are those quantities of petroleum from existing wells and facilities, which by analysis of geosciences and engineering data, can be estimated with reasonable certainty to be commercially recoverable, from a given date forward for known reservoirs and under defined economic conditions, operating methods and government regulations.
SEC rules require disclosure of proved reserves using the twelve-month average beginning-of-month price (which we refer to as the average price) for the year. These same average prices also are used in calculating the amount of (and changes in) future net cash inflows related to the standardized measure of discounted future net cash flows.
For
2014
,
2013
and
2012
, the average spot price per barrel of oil based on the West Texas Intermediate Crude price is
$94.99
,
$96.91
and
$94.71
and the average price per MMBTU of gas based on the Henry Hub spot market is
$4.35
,
$3.67
and
$2.76
. All prices were then adjusted for quality, transportation fees and regional price differentials.
The process of estimating proved reserves and future net cash flows is complex involving decisions and assumptions in evaluating the available engineering and geologic data and prices for oil and gas and the cost to produce these reserves and other factors, many of which are beyond our control. As a result, these estimates are imprecise and should be expected to change as future information becomes available. These changes could be significant. In addition, this information should not be construed as being the current fair market value of our proved reserves.
88
Estimated Quantities of Proved Oil and Gas Reserves
Estimated quantities of proved oil and gas reserves are summarized as follows:
|
|
Reserves
|
||||
|
|
Oil
(a)
(Barrels)
|
Gas
(Mcf)
|
|||
|
|
(In thousands)
|
||||
|
Consolidated entities:
|
|||||
|
Year-end 2011
|
1,064
|
|
8,203
|
|
|
|
Revisions of previous estimates
|
45
|
|
(2,163
|
)
|
|
|
Extensions and discoveries
|
86
|
|
241
|
|
|
|
Acquisitions
|
2,396
|
|
7,109
|
|
|
|
Production
|
(371
|
)
|
(1,668
|
)
|
|
|
Year-end 2012
|
3,220
|
|
11,722
|
|
|
|
Revisions of previous estimates
|
182
|
|
1,243
|
|
|
|
Extensions and discoveries
|
3,085
|
|
2,046
|
|
|
|
Acquisitions
|
35
|
|
531
|
|
|
|
Production
|
(698
|
)
|
(1,912
|
)
|
|
|
Year-end 2013
|
5,824
|
|
13,630
|
|
|
|
Revisions of previous estimates
|
608
|
|
293
|
|
|
|
Extensions and discoveries
|
2,191
|
|
774
|
|
|
|
Acquisitions
|
85
|
|
31
|
|
|
|
Sales
|
(105
|
)
|
(218
|
)
|
|
|
Production
|
(931
|
)
|
(1,861
|
)
|
|
|
Year-end 2014
|
7,672
|
|
12,649
|
|
|
|
Our share of ventures accounted for using the equity method:
|
|||||
|
Year-end 2011
|
—
|
|
3,283
|
|
|
|
Revisions of previous estimates
|
—
|
|
(390
|
)
|
|
|
Production
|
—
|
|
(321
|
)
|
|
|
Year-end 2012
|
—
|
|
2,572
|
|
|
|
Revisions of previous estimates
|
—
|
|
7
|
|
|
|
Production
|
—
|
|
(247
|
)
|
|
|
Year-end 2013
|
—
|
|
2,332
|
|
|
|
Revisions of previous estimates
|
—
|
|
(382
|
)
|
|
|
Production
|
—
|
|
(199
|
)
|
|
|
Year-end 2014
|
—
|
|
1,751
|
|
|
|
Total consolidated and our share of equity method ventures:
|
|||||
|
Year-end 2012
|
|||||
|
Proved developed reserves
|
2,416
|
|
13,020
|
|
|
|
Proved undeveloped reserves
|
804
|
|
1,274
|
|
|
|
Total Year-end 2012
|
3,220
|
|
14,294
|
|
|
|
Year-end 2013
|
|||||
|
Proved developed reserves
|
3,893
|
|
13,717
|
|
|
|
Proved undeveloped reserves
|
1,931
|
|
2,245
|
|
|
|
Total Year-end 2013
|
5,824
|
|
15,962
|
|
|
|
Year-end 2014
|
|||||
|
Proved developed reserves
|
5,269
|
|
12,599
|
|
|
|
Proved undeveloped reserves
|
2,403
|
|
1,801
|
|
|
|
Total Year-end 2014
|
7,672
|
|
14,400
|
|
|
_____________________
|
(a)
|
Includes natural gas liquids (NGLs).
|
89
We do not have any estimated reserves of synthetic oil, synthetic gas or products of other non-renewable natural resources that are intended to be upgraded into synthetic oil and gas.
In 2014, increases in extensions and discoveries of
2,191,000
barrels were primarily associated with new reserves in the Bakken/Three Forks formations. An estimated
694,000
barrels of these extensions and discoveries were associated with new producing wells while a further
913,000
barrels of proved undeveloped reserves were added during 2014. Approximately
105,000
barrels of oil and
218,000
Mcf of gas reserves located primarily in Oklahoma were sold during the year. We realized a net positive revision of previous estimates of
608,000
barrels which is primarily driven by improved drilling results in the Bakken/Three Forks formation yielding higher average estimated ultimate recoverable quantities of proved reserves per well.
In 2013, increase in gas prices accounted for about
1,243,000
Mcf of upward revisions in gas reserves for our consolidated entities.
In 2012, decreases in gas prices accounted for about
800,000
Mcf of downward revisions in gas reserves for our consolidated entities and about
330,000
Mcf of downward revisions for our equity method ventures. The remaining downward revisions in gas reserves for our consolidated entities were attributable to adverse performance from reducing the total fluid withdrawal rate in a natural water drive reservoir, adverse performance from increasing total fluid withdrawal rate in another natural water drive reservoir, from unfavorable performance from newer wells in over-pressured reservoirs that are exhibiting pressure-dependent permeability reductions, and generally due to higher operating pressures adversely affecting gas well performances in a higher back-pressure environment.
In
2014
,
2013
and
2012
, reserve additions from new wells drilled and completed during the year are shown for both consolidated entities and ventures accounted for using the equity method under extensions and discoveries for the royalty interest wells and in 2012 with the acquisition of Credo, working interest wells apply industry practices for new well classifications. There were
106
new well additions in
2014
,
88
new well additions in
2013
and
27
new well additions in
2012
.
Capitalized Costs Relating to Oil and Gas Producing Activities
Capitalized costs related to our oil and gas producing activities are as follows:
|
|
At Year-End
|
||||||
|
|
2014
|
2013
|
|||||
|
|
(In thousands)
|
||||||
|
Consolidated entities:
|
|||||||
|
Unproved oil and gas properties
|
$
|
90,446
|
|
$
|
100,320
|
|
|
|
Proved oil and gas properties
|
221,299
|
|
155,262
|
|
|||
|
Total costs
|
311,745
|
|
255,582
|
|
|||
|
Less accumulated depreciation, depletion and amortization
|
(48,252
|
)
|
(22,941
|
)
|
|||
|
$
|
263,493
|
|
$
|
232,641
|
|
||
We have not capitalized any costs for our share in ventures accounted for using the equity method.
Costs Incurred in Oil and Gas Property Acquisition, Exploration and Development
Costs incurred in oil and gas property acquisition, exploration and development activities, whether capitalized or expensed, follows:
|
|
For the Year
|
||||||||||
|
|
2014
|
2013
|
2012
|
||||||||
|
|
(In thousands)
|
||||||||||
|
Consolidated entities:
|
|||||||||||
|
Acquisition costs:
|
|||||||||||
|
Proved properties
|
$
|
2,001
|
|
$
|
—
|
|
$
|
—
|
|
||
|
Unproved properties
|
25,666
|
|
35,806
|
|
4,418
|
|
|||||
|
Exploration costs
|
39,399
|
|
10,486
|
|
1,752
|
|
|||||
|
Development costs
|
40,277
|
|
54,538
|
|
15,938
|
|
|||||
|
$
|
107,343
|
|
$
|
100,830
|
|
$
|
22,108
|
|
|||
We have not incurred any costs for our share in ventures accounted for using the equity method. In 2014 and 2013, acquisition of leasehold interests, exploration expenses, and development costs have increased as a result of our increased focus to increase production, reserves, and also to explore and develop the assets acquired from Credo.
90
Standardized Measure of Discounted Future Net Cash Flows
Estimates of future cash flows from proved oil and gas reserves are shown in the following table. Estimated income taxes are calculated by applying the appropriate tax rates to the estimated future pre-tax net cash flows less depreciation of the tax basis of properties and the statutory depletion allowance.
|
|
At Year-End
|
||||||||||
|
|
2014
|
2013
|
2012
|
||||||||
|
|
(In thousands)
|
||||||||||
|
Consolidated entities:
|
|||||||||||
|
Future cash inflows
|
$
|
665,657
|
|
$
|
544,098
|
|
$
|
322,098
|
|
||
|
Future production and development costs
|
(271,735
|
)
|
(231,801
|
)
|
(104,441
|
)
|
|||||
|
Future income tax expenses
|
(106,002
|
)
|
(77,361
|
)
|
(50,350
|
)
|
|||||
|
Future net cash flows
|
287,920
|
|
234,936
|
|
167,307
|
|
|||||
|
10% annual discount for estimated timing of cash flows
|
(124,079
|
)
|
(99,383
|
)
|
(60,764
|
)
|
|||||
|
Standardized measure of discounted future net cash flows
|
$
|
163,841
|
|
$
|
135,553
|
|
$
|
106,543
|
|
||
|
Our share in ventures accounted for using the equity method:
|
|||||||||||
|
Future cash inflows
|
$
|
6,186
|
|
$
|
4,765
|
|
$
|
5,125
|
|
||
|
Future production and development costs
|
(664
|
)
|
(512
|
)
|
(551
|
)
|
|||||
|
Future income tax expenses
|
(2,098
|
)
|
(1,616
|
)
|
(1,738
|
)
|
|||||
|
Future net cash flows
|
3,424
|
|
2,637
|
|
2,836
|
|
|||||
|
10% annual discount for estimated timing of cash flows
|
(1,649
|
)
|
(1,337
|
)
|
(1,423
|
)
|
|||||
|
Standardized measure of discounted future net cash flows
|
$
|
1,775
|
|
$
|
1,300
|
|
$
|
1,413
|
|
||
|
Total consolidated and our share of equity method ventures
|
$
|
165,616
|
|
$
|
136,853
|
|
$
|
107,956
|
|
||
Future net cash flows were computed using prices used in estimating proved oil and gas reserves, year-end costs, and statutory tax rates (adjusted for tax deductions) that relate to proved oil and gas reserves.
91
Changes in the standardized measure of discounted future net cash flow follows:
|
|
For the Year
|
||||||||||
|
|
Consolidated
|
Our Share of Equity
Method Ventures
|
Total
|
||||||||
|
|
(In thousands)
|
||||||||||
|
Year-end 2011
|
$
|
52,698
|
|
$
|
3,508
|
|
$
|
56,206
|
|
||
|
Changes resulting from:
|
|||||||||||
|
Net change in sales prices and production costs
|
(5,709
|
)
|
(2,497
|
)
|
(8,206
|
)
|
|||||
|
Net change in future development costs
|
(1,834
|
)
|
—
|
|
(1,834
|
)
|
|||||
|
Sales of oil and gas, net of production costs
|
(31,732
|
)
|
(632
|
)
|
(32,364
|
)
|
|||||
|
Net change due to extensions and discoveries
|
5,596
|
|
—
|
|
5,596
|
|
|||||
|
Net change due to acquisition of reserves
|
86,013
|
|
—
|
|
86,013
|
|
|||||
|
Net change due to revisions of quantity estimates
|
(2,254
|
)
|
18
|
|
(2,236
|
)
|
|||||
|
Previously estimated development costs incurred
|
1,007
|
|
—
|
|
1,007
|
|
|||||
|
Accretion of discount
|
7,377
|
|
401
|
|
7,778
|
|
|||||
|
Net change in income taxes
|
(4,619
|
)
|
615
|
|
(4,004
|
)
|
|||||
|
Aggregate change for the year
|
53,845
|
|
(2,095
|
)
|
51,750
|
|
|||||
|
Year-end 2012
|
106,543
|
|
1,413
|
|
107,956
|
|
|||||
|
Changes resulting from:
|
|||||||||||
|
Net change in sales prices and production costs
|
23,422
|
|
415
|
|
23,837
|
|
|||||
|
Net change in future development costs
|
(2,897
|
)
|
—
|
|
(2,897
|
)
|
|||||
|
Sales of oil and gas, net of production costs
|
(56,559
|
)
|
(801
|
)
|
(57,360
|
)
|
|||||
|
Net change due to extensions and discoveries
|
54,539
|
|
—
|
|
54,539
|
|
|||||
|
Net change due to acquisition of reserves
|
1,160
|
|
—
|
|
1,160
|
|
|||||
|
Net change due to revisions of quantity estimates
|
8,673
|
|
6
|
|
8,679
|
|
|||||
|
Previously estimated development costs incurred
|
4,124
|
|
—
|
|
4,124
|
|
|||||
|
Accretion of discount
|
13,540
|
|
228
|
|
13,768
|
|
|||||
|
Net change in timing and other
|
(718
|
)
|
(31
|
)
|
(749
|
)
|
|||||
|
Net change in income taxes
|
(16,274
|
)
|
70
|
|
(16,204
|
)
|
|||||
|
Aggregate change for the year
|
29,010
|
|
(113
|
)
|
28,897
|
|
|||||
|
Year-end 2013
|
135,553
|
|
1,300
|
|
136,853
|
|
|||||
|
Changes resulting from:
|
|||||||||||
|
Net change in sales prices and production costs
|
(1,064
|
)
|
1,571
|
|
507
|
|
|||||
|
Net change in future development costs
|
1,308
|
|
—
|
|
1,308
|
|
|||||
|
Sales of oil and gas, net of production costs
|
(63,192
|
)
|
(787
|
)
|
(63,979
|
)
|
|||||
|
Net change due to extensions and discoveries
|
58,228
|
|
—
|
|
58,228
|
|
|||||
|
Net change due to acquisition of reserves
|
2,778
|
|
—
|
|
2,778
|
|
|||||
|
Net change due to divestitures of reserves
|
(5,804
|
)
|
—
|
|
(5,804
|
)
|
|||||
|
Net change due to revisions of quantity estimates
|
15,303
|
|
(343
|
)
|
14,960
|
|
|||||
|
Previously estimated development costs incurred
|
15,497
|
|
—
|
|
15,497
|
|
|||||
|
Accretion of discount
|
18,067
|
|
210
|
|
18,277
|
|
|||||
|
Net change in timing and other
|
4,198
|
|
115
|
|
4,313
|
|
|||||
|
Net change in income taxes
|
(17,031
|
)
|
(291
|
)
|
(17,322
|
)
|
|||||
|
Aggregate change for the year
|
28,288
|
|
475
|
|
28,763
|
|
|||||
|
Year-end 2014
|
$
|
163,841
|
|
$
|
1,775
|
|
$
|
165,616
|
|
||
Results of Operations for Oil and Gas Producing Activities
Our royalty interests are contractually defined and based on a percentage of production at prevailing market prices. We receive our percentage of production in cash. Similarly, our working interests and the associated net revenue interests are contractually defined and we pay our proportionate share of the capital and operating costs to develop and operate the well and we market our share of the production. Our revenues fluctuate based on changes in the market prices for oil and gas, the decline in production from existing wells, and other factors affecting oil and gas exploration and production activities, including the cost of development and production.
92
Information about the results of operations of our oil and gas interests follows:
|
|
For the Year
|
||||||||||
|
|
2014
|
2013
|
2012
|
||||||||
|
|
(In thousands)
|
||||||||||
|
Consolidated entities
(a)
|
|||||||||||
|
Revenues
|
$
|
82,919
|
|
$
|
69,036
|
|
$
|
36,204
|
|
||
|
Production costs
|
(19,727
|
)
|
(12,477
|
)
|
(4,472
|
)
|
|||||
|
Exploration costs
|
(17,416
|
)
|
(10,486
|
)
|
(1,754
|
)
|
|||||
|
Depreciation, depletion, amortization
|
(29,442
|
)
|
(19,552
|
)
|
(4,905
|
)
|
|||||
|
Non-cash impairments
|
(32,665
|
)
|
(473
|
)
|
—
|
|
|||||
|
Oil and gas administrative expenses
|
(17,000
|
)
|
(14,407
|
)
|
(8,332
|
)
|
|||||
|
Accretion expense
|
(121
|
)
|
(94
|
)
|
(26
|
)
|
|||||
|
Income tax expenses
|
13,398
|
|
(3,471
|
)
|
(4,841
|
)
|
|||||
|
Results of operations
|
(20,054
|
)
|
8,076
|
|
11,874
|
|
|||||
|
Our share in ventures accounted for using the equity method:
|
|||||||||||
|
Revenues
|
$
|
786
|
|
$
|
801
|
|
$
|
770
|
|
||
|
Production costs
|
(105
|
)
|
(123
|
)
|
(138
|
)
|
|||||
|
Oil and gas administrative expenses
|
(95
|
)
|
(86
|
)
|
(123
|
)
|
|||||
|
Income tax expenses
|
(235
|
)
|
(178
|
)
|
(147
|
)
|
|||||
|
Results of operations
|
$
|
351
|
|
$
|
414
|
|
$
|
362
|
|
||
|
Total results of operations
|
$
|
(19,703
|
)
|
$
|
8,490
|
|
$
|
12,236
|
|
||
_____________________
|
(a)
|
2012 includes only three months of operations from Credo due to our third quarter 2012 acquisition.
|
Production costs represent our share of oil and gas production severance taxes, and lease operating expenses. Exploration costs principally represent exploratory dry hole costs, geological and geophysical and seismic study costs.
93
Summarized quarterly financial results for
2014
and
2013
follows:
|
First
Quarter
|
Second
Quarter
|
Third
Quarter
|
Fourth
Quarter
(a)
|
||||||||||||
|
|
(In thousands, except per share amounts)
|
||||||||||||||
|
2014
|
|||||||||||||||
|
Total revenues
|
$
|
84,605
|
|
$
|
83,013
|
|
$
|
58,840
|
|
$
|
80,316
|
|
|||
|
Gross profit (loss)
|
35,025
|
|
33,261
|
|
19,606
|
|
(6,259
|
)
|
|||||||
|
Operating income (loss)
|
15,883
|
|
26,942
|
|
12,716
|
|
(16,783
|
)
|
|||||||
|
Equity in earnings of unconsolidated ventures
|
991
|
|
958
|
|
2,016
|
|
4,720
|
|
|||||||
|
Income (loss) before taxes
|
13,665
|
|
22,799
|
|
7,994
|
|
(18,713
|
)
|
|||||||
|
Net income (loss) attributable to Forestar Group Inc.
|
8,334
|
|
14,822
|
|
5,227
|
|
(11,800
|
)
|
|||||||
|
Net income (loss) per share — basic
|
$
|
0.20
|
|
$
|
0.34
|
|
$
|
0.12
|
|
$
|
(0.34
|
)
|
|||
|
Net income (loss) per share — diluted
|
$
|
0.19
|
|
$
|
0.34
|
|
$
|
0.12
|
|
$
|
(0.34
|
)
|
|||
|
2013
|
|||||||||||||||
|
Total revenues
|
$
|
97,471
|
|
$
|
60,079
|
|
$
|
75,107
|
|
$
|
98,388
|
|
|||
|
Gross profit
|
35,899
|
|
22,463
|
|
32,608
|
|
39,181
|
|
|||||||
|
Operating income
|
9,520
|
|
3,554
|
|
10,612
|
|
22,891
|
|
|||||||
|
Equity in earnings of unconsolidated ventures
|
913
|
|
2,566
|
|
3,125
|
|
2,133
|
|
|||||||
|
Income before taxes
|
7,035
|
|
2,109
|
|
9,965
|
|
23,160
|
|
|||||||
|
Net income attributable to Forestar Group Inc.
|
3,951
|
|
541
|
|
11,830
|
|
12,999
|
|
|||||||
|
Net income per share — basic
|
$
|
0.11
|
|
$
|
0.02
|
|
$
|
0.33
|
|
$
|
0.34
|
|
|||
|
Net income per share — diluted
|
$
|
0.11
|
|
$
|
0.02
|
|
$
|
0.33
|
|
$
|
0.33
|
|
|||
_____________________
|
(a)
|
Fourth quarter 2014 results include pre-tax non-cash impairment charges of
$30,591,000
for unproved leasehold interests and proved oil and gas properties.
|
94
Forestar Group Inc.
Schedule III — Consolidated Real Estate and Accumulated Depreciation
Year-End
2014
(In thousands)
|
|
Initial Cost to
Company
|
Costs Capitalized
Subsequent to Acquisition
|
Gross Amount Carried at End of Period
|
|
|
||||||||||||||||||||||||||||
|
Description
|
Encumbrances
|
Land
|
Buildings &
Improvements
|
Improvements
less Cost of
Sales and Other
|
Carrying
Costs
(a)
|
Land & Land
Improvements
|
Buildings &
Improvements
|
Total
|
Accumulated
Depreciation
|
Date of
Construction
|
Date
Acquired
|
||||||||||||||||||||||
|
Entitled, Developed, and Under Development Projects:
|
|||||||||||||||||||||||||||||||||
|
CALIFORNIA
|
|||||||||||||||||||||||||||||||||
|
Contra Costa County
|
|||||||||||||||||||||||||||||||||
|
San Joaquin River
|
$
|
12,225
|
|
$
|
(3,310
|
)
|
$
|
8,915
|
|
$
|
8,915
|
|
(b)
|
||||||||||||||||||||
|
COLORADO
|
|||||||||||||||||||||||||||||||||
|
Douglas County
|
|||||||||||||||||||||||||||||||||
|
Pinery West
|
7,308
|
|
7,045
|
|
14,353
|
|
14,353
|
|
2006
|
2006
|
|||||||||||||||||||||||
|
Weld County
|
|||||||||||||||||||||||||||||||||
|
Buffalo Highlands
|
3,001
|
|
555
|
|
3,556
|
|
3,556
|
|
2006
|
2005
|
|||||||||||||||||||||||
|
Johnstown Farms
|
2,749
|
|
2,046
|
|
$
|
188
|
|
4,983
|
|
4,983
|
|
2002
|
2002
|
||||||||||||||||||||
|
Stonebraker
|
3,878
|
|
(1,436
|
)
|
2,442
|
|
2,442
|
|
2005
|
2005
|
|||||||||||||||||||||||
|
GEORGIA
|
|||||||||||||||||||||||||||||||||
|
Cherokee County
|
|||||||||||||||||||||||||||||||||
|
Heron Pond
|
1,104
|
|
1,285
|
|
2,389
|
|
2,389
|
|
2012
|
||||||||||||||||||||||||
|
Coweta County
|
|||||||||||||||||||||||||||||||||
|
Corinth Landing
|
607
|
|
585
|
|
1,192
|
|
1,192
|
|
(b)
|
||||||||||||||||||||||||
|
Coweta South Industrial Park
|
532
|
|
476
|
|
1,008
|
|
1,008
|
|
(b)
|
||||||||||||||||||||||||
|
Genesee
|
480
|
|
1,176
|
|
1,656
|
|
1,656
|
|
(b)
|
||||||||||||||||||||||||
|
Dawson County
|
|||||||||||||||||||||||||||||||||
|
Woodlands at Burt Creek
|
71
|
|
1,670
|
|
1,741
|
|
1,741
|
|
(b)
|
||||||||||||||||||||||||
|
Paulding County
|
|||||||||||||||||||||||||||||||||
|
Seven Hills
|
2,964
|
|
129
|
|
3,093
|
|
3,093
|
|
2012
|
||||||||||||||||||||||||
|
SOUTH CAROLINA
|
|||||||||||||||||||||||||||||||||
|
York County
|
|||||||||||||||||||||||||||||||||
|
Habersham
|
3,877
|
|
1,478
|
|
239
|
|
5,594
|
|
5,594
|
|
2013
|
||||||||||||||||||||||
|
TENNESEE
|
|||||||||||||||||||||||||||||||||
|
Williamson County
|
|||||||||||||||||||||||||||||||||
|
Morgan Farms
|
6,841
|
|
917
|
|
166
|
|
7,924
|
|
7,924
|
|
2013
|
||||||||||||||||||||||
|
Weatherford Estates
|
856
|
|
201
|
|
1,057
|
|
1,057
|
|
2014
|
||||||||||||||||||||||||
|
Wilson County
|
|||||||||||||||||||||||||||||||||
|
Beckwith Crossing
|
1,294
|
|
185
|
|
1,479
|
|
1,479
|
|
2014
|
||||||||||||||||||||||||
|
TEXAS
|
|||||||||||||||||||||||||||||||||
|
Bastrop County
|
|||||||||||||||||||||||||||||||||
|
Hunter’s Crossing
|
3,613
|
|
6,465
|
|
358
|
|
10,436
|
|
10,436
|
|
2001
|
2001
|
|||||||||||||||||||||
|
The Colony
|
8,726
|
|
12,347
|
|
161
|
|
21,234
|
|
21,234
|
|
1999
|
1999
|
|||||||||||||||||||||
|
Bexar County
|
|||||||||||||||||||||||||||||||||
|
Cibolo Canyons
|
25,569
|
|
26,137
|
|
1,607
|
|
53,313
|
|
53,313
|
|
2004
|
1986
|
|||||||||||||||||||||
|
Calhoun County
|
|||||||||||||||||||||||||||||||||
|
Caracol
|
$
|
3,869
|
|
8,603
|
|
3,355
|
|
2,047
|
|
14,005
|
|
14,005
|
|
2006
|
2006
|
||||||||||||||||||
95
Forestar Group Inc.
Schedule III — Consolidated Real Estate and Accumulated Depreciation
Year-End
2014
(In thousands)
|
|
|
Initial Cost to
Company
|
Costs Capitalized
Subsequent to Acquisition
|
Gross Amount Carried at End of Period
|
|
|
|||||||||||||||||||||||||||||||||
|
Description
|
Encumbrances
|
Land
|
Buildings &
Improvements
|
Improvements
less Cost of
Sales and Other
|
Carrying
Costs
(a)
|
Land & Land
Improvements
|
Buildings &
Improvements
|
Total
|
Accumulated
Depreciation
|
Date of
Construction
|
Date
Acquired
|
||||||||||||||||||||||||||||
|
Collin County
|
|||||||||||||||||||||||||||||||||||||||
|
Lakes of Prosper
|
$
|
8,951
|
|
$
|
(634
|
)
|
$
|
180
|
|
$
|
8,497
|
|
$
|
8,497
|
|
2012
|
|||||||||||||||||||||||
|
Maxwell Creek
|
9,904
|
|
(8,687
|
)
|
635
|
|
1,852
|
|
1,852
|
|
2000
|
2000
|
|||||||||||||||||||||||||||
|
Parkside
|
2,177
|
|
1,294
|
|
3,471
|
|
3,471
|
|
2013
|
||||||||||||||||||||||||||||||
|
Timber Creek
|
7,282
|
|
4,386
|
|
11,668
|
|
11,668
|
|
2007
|
2007
|
|||||||||||||||||||||||||||||
|
Village Park
|
6,550
|
|
(6,579
|
)
|
81
|
|
52
|
|
52
|
|
2012
|
||||||||||||||||||||||||||||
|
Comal County
|
|||||||||||||||||||||||||||||||||||||||
|
Oak Creek Estates
|
1,921
|
|
941
|
|
175
|
|
3,037
|
|
3,037
|
|
2006
|
2005
|
|||||||||||||||||||||||||||
|
Dallas County
|
|||||||||||||||||||||||||||||||||||||||
|
Stoney Creek
|
12,822
|
|
1,278
|
|
49
|
|
14,149
|
|
14,149
|
|
2007
|
2007
|
|||||||||||||||||||||||||||
|
Denton County
|
|||||||||||||||||||||||||||||||||||||||
|
Lantana
|
|
|
27,673
|
|
(825
|
)
|
26,848
|
|
26,848
|
|
2000
|
1999
|
|||||||||||||||||||||||||||
|
River's Edge
|
1,227
|
|
351
|
|
1,578
|
|
1,578
|
|
2014
|
||||||||||||||||||||||||||||||
|
The Preserve at Pecan Creek
|
5,855
|
|
(1,884
|
)
|
436
|
|
4,407
|
|
4,407
|
|
2006
|
2005
|
|||||||||||||||||||||||||||
|
Fort Bend County
|
|||||||||||||||||||||||||||||||||||||||
|
Summer Lakes
|
|
4,269
|
|
(169
|
)
|
4,100
|
|
4,100
|
|
2012
|
|||||||||||||||||||||||||||||
|
Summer Park
|
|
4,804
|
|
3
|
|
4,807
|
|
4,807
|
|
2012
|
|||||||||||||||||||||||||||||
|
Willow Creek Farms
|
|
|
3,479
|
|
358
|
|
90
|
|
3,927
|
|
3,927
|
|
2012
|
||||||||||||||||||||||||||
|
Harris County
|
|||||||||||||||||||||||||||||||||||||||
|
Barrington
|
8,950
|
|
(5,833
|
)
|
3,117
|
|
3,117
|
|
2011
|
||||||||||||||||||||||||||||||
|
City Park
|
$
|
74
|
|
3,946
|
|
(1,485
|
)
|
1,641
|
|
4,102
|
|
4,102
|
|
2002
|
2001
|
||||||||||||||||||||||||
|
Imperial Forest
|
5,345
|
|
47
|
|
5,392
|
|
5,392
|
|
2014
|
||||||||||||||||||||||||||||||
|
Hays County
|
|||||||||||||||||||||||||||||||||||||||
|
Arrowhead Ranch
|
12,856
|
|
3,104
|
|
15,960
|
|
15,960
|
|
2007
|
||||||||||||||||||||||||||||||
|
Hood County
|
|||||||||||||||||||||||||||||||||||||||
|
Harbor Lakes
|
3,514
|
|
(1,970
|
)
|
312
|
|
1,856
|
|
1,856
|
|
2000
|
1998
|
|||||||||||||||||||||||||||
|
Montgomery County
|
|||||||||||||||||||||||||||||||||||||||
|
Woodtrace
|
8,622
|
|
(8,621
|
)
|
1
|
|
1
|
|
2014
|
||||||||||||||||||||||||||||||
|
Nueces County
|
|||||||||||||||||||||||||||||||||||||||
|
Tortuga Dunes
|
12,080
|
|
9,473
|
|
21,553
|
|
21,553
|
|
2006
|
||||||||||||||||||||||||||||||
|
Tarrant County
|
|||||||||||||||||||||||||||||||||||||||
|
Summer Creek Ranch
|
2,887
|
|
(1,625
|
)
|
1,262
|
|
1,262
|
|
2012
|
||||||||||||||||||||||||||||||
|
The Bar C Ranch
|
1,365
|
|
2,330
|
|
32
|
|
3,727
|
|
3,727
|
|
2012
|
||||||||||||||||||||||||||||
|
Williamson County
|
|||||||||||||||||||||||||||||||||||||||
|
La Conterra
|
4,024
|
|
(2,790
|
)
|
293
|
|
1,527
|
|
1,527
|
|
2006
|
||||||||||||||||||||||||||||
|
MISSOURI
|
|||||||||||||||||||||||||||||||||||||||
|
Clay County
|
|||||||||||||||||||||||||||||||||||||||
|
Somerbrook
|
3,061
|
|
(218
|
)
|
13
|
|
2,856
|
|
2,856
|
|
2003
|
2001
|
|||||||||||||||||||||||||||
|
Other
|
32,304
|
|
(22,418
|
)
|
1,271
|
|
11,157
|
|
11,157
|
|
|||||||||||||||||||||||||||||
|
Total Entitled, Developed, and Under Development Projects
|
$
|
3,943
|
|
$
|
290,166
|
|
$
|
—
|
|
$
|
21,133
|
|
$
|
9,974
|
|
$
|
321,273
|
|
$
|
—
|
|
$
|
321,273
|
|
$
|
—
|
|
||||||||||||
96
Forestar Group Inc.
Schedule III — Consolidated Real Estate and Accumulated Depreciation
Year-End
2014
(In thousands)
|
|
|
Initial Cost to
Company
|
Costs Capitalized
Subsequent to Acquisition
|
Gross Amount Carried at End of Period
|
|
|
|||||||||||||||||||||||||||||||||
|
Description
|
Encumbrances
|
Land
|
Buildings &
Improvements
|
Improvements
less Cost of
Sales and Other
|
Carrying
Costs
(a)
|
Land & Land
Improvements
|
Buildings &
Improvements
|
Total
|
Accumulated
Depreciation
|
Date of
Construction
|
Date
Acquired
|
||||||||||||||||||||||||||||
|
Undeveloped Land and Land in Entitlement:
|
|||||||||||||||||||||||||||||||||||||||
|
CALIFORNIA
|
|||||||||||||||||||||||||||||||||||||||
|
Los Angeles County
|
|||||||||||||||||||||||||||||||||||||||
|
Land In Entitlement Process
|
$
|
3,969
|
|
$
|
18,122
|
|
$
|
22,091
|
|
$
|
22,091
|
|
1997
|
||||||||||||||||||||||||||
|
GEORGIA
|
|||||||||||||||||||||||||||||||||||||||
|
Bartow County
|
|||||||||||||||||||||||||||||||||||||||
|
Undeveloped Land
|
3,551
|
|
48
|
|
3,599
|
|
3,599
|
|
(b)
|
||||||||||||||||||||||||||||||
|
Carroll County
|
|||||||||||||||||||||||||||||||||||||||
|
Undeveloped Land
|
4,397
|
|
107
|
|
4,504
|
|
4,504
|
|
(b)
|
||||||||||||||||||||||||||||||
|
Land In Entitlement Process
|
9,006
|
|
2,159
|
|
11,165
|
|
11,165
|
|
(b)
|
||||||||||||||||||||||||||||||
|
Cherokee County
|
|||||||||||||||||||||||||||||||||||||||
|
Undeveloped Land
|
3,322
|
|
92
|
|
3,414
|
|
3,414
|
|
(b)
|
||||||||||||||||||||||||||||||
|
Land In Entitlement Process
|
2,340
|
|
566
|
|
2,906
|
|
2,906
|
|
(b)
|
||||||||||||||||||||||||||||||
|
Coweta County
|
|||||||||||||||||||||||||||||||||||||||
|
Undeveloped Land
|
454
|
|
380
|
|
834
|
|
834
|
|
(b)
|
||||||||||||||||||||||||||||||
|
Land In Entitlement Process
|
644
|
|
222
|
|
866
|
|
866
|
|
(b)
|
||||||||||||||||||||||||||||||
|
Dawson County
|
|||||||||||||||||||||||||||||||||||||||
|
Undeveloped Land
|
2,157
|
|
1,485
|
|
3,642
|
|
3,642
|
|
(b)
|
||||||||||||||||||||||||||||||
|
Gilmer County
|
|||||||||||||||||||||||||||||||||||||||
|
Undeveloped Land
|
2,748
|
|
26
|
|
2,774
|
|
2,774
|
|
(b)
|
||||||||||||||||||||||||||||||
|
Lumpkin County
|
|||||||||||||||||||||||||||||||||||||||
|
Undeveloped Land
|
3,015
|
|
4
|
|
3,019
|
|
3,019
|
|
(b)
|
||||||||||||||||||||||||||||||
|
Paulding County
|
|||||||||||||||||||||||||||||||||||||||
|
Undeveloped Land
|
7,494
|
|
|
|
7,494
|
|
7,494
|
|
(b)
|
||||||||||||||||||||||||||||||
|
Pickens County
|
|||||||||||||||||||||||||||||||||||||||
|
Undeveloped Land
|
2,235
|
|
28
|
|
2,263
|
|
2,263
|
|
(b)
|
||||||||||||||||||||||||||||||
|
Polk County
|
|||||||||||||||||||||||||||||||||||||||
|
Undeveloped Land
|
2,354
|
|
2,354
|
|
2,354
|
|
(b)
|
||||||||||||||||||||||||||||||||
|
TEXAS
|
|||||||||||||||||||||||||||||||||||||||
|
Bexar County
|
|||||||||||||||||||||||||||||||||||||||
|
Undeveloped Land
|
3,038
|
|
3,038
|
|
3,038
|
|
(b)
|
||||||||||||||||||||||||||||||||
|
Harris County
|
|||||||||||||||||||||||||||||||||||||||
|
Land in Entitlement Process
|
685
|
|
1,145
|
|
1,830
|
|
1,830
|
|
(b)
|
||||||||||||||||||||||||||||||
|
Other
|
|||||||||||||||||||||||||||||||||||||||
|
Undeveloped Land
|
8,666
|
|
8,171
|
|
16,837
|
|
16,837
|
|
(b)
|
||||||||||||||||||||||||||||||
|
Land in Entitlement Process
|
504
|
|
48
|
|
552
|
|
552
|
|
(b)
|
||||||||||||||||||||||||||||||
|
Total Undeveloped Land and Land in Entitlement
|
$
|
—
|
|
$
|
57,541
|
|
$
|
—
|
|
$
|
35,641
|
|
$
|
—
|
|
$
|
93,182
|
|
$
|
—
|
|
$
|
93,182
|
|
$
|
—
|
|
||||||||||||
97
Forestar Group Inc.
Schedule III — Consolidated Real Estate and Accumulated Depreciation
Year-End
2014
(In thousands)
|
|
|
Initial Cost to
Company
|
Costs Capitalized
Subsequent to Acquisition
|
Gross Amount Carried at End of Period
|
|
|
|||||||||||||||||||||||||||||||||
|
Description
|
Encumbrances
|
Land
|
Buildings &
Improvements
|
Improvements
less Cost of
Sales and
Other
|
Carrying
Costs
(a)
|
Land & Land
Improvements
|
Buildings &
Improvements
|
Total
|
Accumulated
Depreciation
|
Date of
Construction
|
Date
Acquired
|
||||||||||||||||||||||||||||
|
Income Producing Properties:
|
|||||||||||||||||||||||||||||||||||||||
|
NORTH CAROLINA
|
|||||||||||||||||||||||||||||||||||||||
|
Mecklenburg County
|
|||||||||||||||||||||||||||||||||||||||
|
Dilworth
|
$
|
5,779
|
|
$
|
9,424
|
|
$
|
15,203
|
|
$
|
15,203
|
|
2012
|
||||||||||||||||||||||||||
|
TENNESSEE
|
|||||||||||||||||||||||||||||||||||||||
|
Davidson County
|
|||||||||||||||||||||||||||||||||||||||
|
Music Row
|
6,607
|
|
1,068
|
|
7,675
|
|
7,675
|
|
2014
|
||||||||||||||||||||||||||||||
|
TEXAS
|
|||||||||||||||||||||||||||||||||||||||
|
Dallas County
|
|||||||||||||||||||||||||||||||||||||||
|
Midtown
|
$
|
19,117
|
|
2,526
|
|
30,767
|
|
2,526
|
|
30,767
|
|
33,293
|
|
$
|
(231
|
)
|
2011
|
2011
|
|||||||||||||||||||||
|
Hood County
|
|||||||||||||||||||||||||||||||||||||||
|
Harbor Lakes Golf Club
|
1,446
|
|
608
|
|
2,054
|
|
2,054
|
|
(1,508
|
)
|
2000
|
1998
|
|||||||||||||||||||||||||||
|
Travis County
|
|||||||||||||||||||||||||||||||||||||||
|
Eleven
|
23,936
|
|
7,940
|
|
$
|
45,947
|
|
71
|
|
7,940
|
|
46,018
|
|
53,958
|
|
(576
|
)
|
2013
|
2014
|
||||||||||||||||||||
|
Downtown Edge
|
11,202
|
|
654
|
|
11,856
|
|
11,856
|
|
2014
|
||||||||||||||||||||||||||||||
|
Radisson Hotel & Suites
|
15,400
|
|
10,603
|
|
49,170
|
|
—
|
|
59,773
|
|
59,773
|
|
(29,062
|
)
|
(b)
|
||||||||||||||||||||||||
|
West Austin
|
7,274
|
|
1,592
|
|
8,866
|
|
8,866
|
|
2014
|
||||||||||||||||||||||||||||||
|
Total Income Producing Properties
|
$
|
58,453
|
|
$
|
41,328
|
|
$
|
57,996
|
|
$
|
93,354
|
|
$
|
—
|
|
$
|
54,066
|
|
$
|
138,612
|
|
$
|
192,678
|
|
$
|
(31,377
|
)
|
||||||||||||
|
Total
|
$
|
62,396
|
|
$
|
389,035
|
|
$
|
57,996
|
|
$
|
150,128
|
|
$
|
9,974
|
|
$
|
468,521
|
|
$
|
138,612
|
|
$
|
607,133
|
|
$
|
(31,377
|
)
|
||||||||||||
_____________________
|
(a)
|
We do not capitalize carrying costs until development begins.
|
|
(b)
|
The acquisition date is not available.
|
98
Reconciliation of real estate:
|
2014
|
2013
|
2012
|
||||||||||
|
|
(In thousands)
|
|||||||||||
|
Balance at beginning of year
|
$
|
547,530
|
|
$
|
545,370
|
|
$
|
592,322
|
|
|||
|
Amounts capitalized
|
214,184
|
|
111,428
|
|
143,711
|
|
||||||
|
Amounts retired or adjusted
|
(154,581
|
)
|
(109,268
|
)
|
(190,663
|
)
|
||||||
|
Balance at close of period
|
$
|
607,133
|
|
$
|
547,530
|
|
$
|
545,370
|
|
|||
Reconciliation of accumulated depreciation:
|
2014
|
2013
|
2012
|
||||||||||
|
|
(In thousands)
|
|||||||||||
|
Balance at beginning of year
|
$
|
(28,066
|
)
|
$
|
(28,220
|
)
|
$
|
(26,955
|
)
|
|||
|
Depreciation expense
|
(3,319
|
)
|
(2,185
|
)
|
(3,640
|
)
|
||||||
|
Amounts retired or adjusted
|
8
|
|
2,339
|
|
2,375
|
|
||||||
|
Balance at close of period
|
$
|
(31,377
|
)
|
$
|
(28,066
|
)
|
$
|
(28,220
|
)
|
|||
|
Item 9.
|
Changes in and Disagreements With Accountants on Accounting and Financial Disclosure.
|
None.
|
Item 9A.
|
Controls and Procedures.
|
(a) Disclosure controls and procedures
Our management, with the participation of the Chief Executive Officer and Chief Financial Officer, has evaluated the effectiveness of our disclosure controls and procedures (as such term is defined in Rules 13a-15(e) and 15d-15(e) under the Securities Exchange Act of 1934, as amended (or the Exchange Act)) as of the end of the period covered by this report. Based on such evaluation, our Chief Executive Officer and Chief Financial Officer have concluded that, as of the end of such period, our disclosure controls and procedures are effective in recording, processing, summarizing and reporting, on a timely basis, information required to be disclosed by us in the reports that we file or submit under the Exchange Act and are effective in ensuring that information required to be disclosed by us in the reports that we file or submit under the Exchange Act is accumulated and communicated to our management, including our Chief Executive Officer and Chief Financial Officer, as appropriate to allow timely decisions regarding required disclosure.
(b) Internal control over financial reporting
Management’s report on internal control over financial reporting is included in Part II, Item 8 of this Annual Report on Form 10-K.
(c) Changes in Internal Control over Financial Reporting
There have been no changes in our internal control over financial reporting (as such term is defined in Rules 13a-15(f) and 15d-15(f) under the Exchange Act) during the fourth quarter
2014
that have materially affected, or are reasonably likely to materially affect, our internal control over financial reporting.
|
Item 9B.
|
Other Information.
|
None.
99
|
Item 10.
|
Directors, Executive Officers and Corporate Governance.
|
Set forth below is certain information about the members of our Board of Directors:
|
Name
|
Age
|
Year First
Elected to
the Board
|
Principal Occupation
|
|||
|
Kenneth M. Jastrow, II
|
67
|
2007
|
Non-Executive Chairman of Forestar Group Inc.
|
|||
|
Kathleen Brown
|
69
|
2007
|
Partner at Manatt, Phelps & Phillips, L.L.P.
|
|||
|
William G. Currie
|
67
|
2007
|
Chairman of Universal Forest Products, Inc.
|
|||
|
James M. DeCosmo
|
56
|
2007
|
President and Chief Executive Officer of Forestar Group Inc.
|
|||
|
Michael E. Dougherty
|
74
|
2008
|
Founder and Chairman of Dougherty Financial Group LLC
|
|||
|
James A. Johnson
|
71
|
2007
|
Chairman and Chief Executive Officer of Johnson Capital Partners
|
|||
|
Charles W. Matthews
|
70
|
2012
|
Retired Vice President and General Counsel of Exxon Mobil Corporation
|
|||
|
William C. Powers, Jr.
|
68
|
2007
|
President of The University of Texas at Austin
|
|||
|
James A. Rubright
|
68
|
2007
|
Retired Chairman and Chief Executive Officer of Rock-Tenn Company
|
|||
|
Daniel B. Silvers
|
38
|
2015
|
President of SpringOwl Asset Management LLC
|
|||
|
Richard M. Smith
|
69
|
2007
|
President of Pinkerton Foundation
|
|||
|
David L. Weinstein
|
48
|
2015
|
Retired President and Chief Executive Officer of MPG Office Trust, Inc.
|
|||
The remaining information required by this item is incorporated herein by reference from our definitive proxy statement, involving the election of directors, to be filed pursuant to Regulation 14A with the SEC not later than 120 days after the end of the fiscal year covered by this Form 10-K (or Definitive Proxy Statement). Certain information required by this item concerning executive officers is included in Part I of this report.
|
Item 11.
|
Executive Compensation.
|
The information required by this item is incorporated by reference from our Definitive Proxy Statement.
|
Item 12.
|
Security Ownership of Certain Beneficial Owners and Management and Related Stockholder Matters.
|
Equity Compensation Plan Information
We have only one equity compensation plan, the Forestar 2007 Stock Incentive Plan. It was approved by our sole stockholder prior to spin-off and material terms and amendments thereto were subsequently approved by our stockholders. Information at year-end
2014
about our equity compensation plan under which our common stock may be issued follows:
|
Plan Category
|
Number of Securities to be
Issued Upon Exercise of
Outstanding Options,
Warrants and Rights
(1)(2)
|
Weighted-Average
Exercise Price of
Outstanding Options,
Warrants and Rights
|
Number of Securities
Remaining Available for
Future Issuance Under
Equity Compensation Plans
(Excluding Securities
Reflected in Column (a))
|
||||||
|
|
(a)
|
(b)
|
(c)
|
||||||
|
Equity compensation plans approved by security holders
|
3,688,955
|
|
$
|
22.33
|
|
932,885
|
|
||
|
Equity compensation plans not approved by security holders
|
None
|
|
None
|
|
None
|
|
|||
|
Total
|
3,688,955
|
|
$
|
22.33
|
|
932,885
|
|
||
_____________________
|
(1)
|
Includes approximately 705,000 shares issuable to personnel of Temple-Inland and the other spin-off entity resulting from the equitable adjustment of Temple-Inland equity awards in connection with our spin-off.
|
|
(2)
|
Includes approximately 496,000 equity-settled restricted stock units, 330,000 market-leveraged stock units and 241,000 performance stock units, which are excluded from the calculation of weighted-average exercise price. The market-leveraged stock unit awards will be settled in common stock based upon our stock price performance over three years from the date of grant. The number of shares to be issued could range from a high of 495,000 shares if our stock price increases
|
100
by 50 percent or more, to 165,000 shares if our stock price decreases by 50 percent, or could be zero if our stock price decreases by more than 50 percent, the minimum threshold performance.
The remaining information required by this item is incorporated by reference from our Definitive Proxy Statement.
|
Item 13.
|
Certain Relationships and Related Transactions, and Director Independence.
|
The information required by this item is incorporated by reference from our Definitive Proxy Statement.
|
Item 14.
|
Principal Accountant Fees and Services.
|
The information required by this item is incorporated by reference from our Definitive Proxy Statement.
|
Item 15.
|
Exhibits and Financial Statement Schedules.
|
|
(a)
|
Documents filed as part of this report.
|
|
(1)
|
Financial Statements
|
Our Consolidated Financial Statements are included in Part II, Item 8 of this Annual Report on Form 10-K.
|
(2)
|
Financial Statement Schedules
|
Schedule III — Consolidated Real Estate and Accumulated Depreciation is included in Part II, Item 8 of this Annual Report on Form 10-K.
Schedules other than those listed above are omitted as the required information is either inapplicable or the information is presented in our Consolidated Financial Statements and notes thereto.
|
(3)
|
Exhibits
|
The exhibits listed in the Exhibit Index in (b) below are filed or incorporated by reference as part of this Annual Report on Form 10-K.
|
(b)
|
Exhibits
|
|
Exhibit
Number
|
Exhibit
|
|
|
2.1
|
Agreement and Plan of Merger, dated June 3, 2012, by and among CREDO Petroleum Corporation, Forestar Group Inc. and Longhorn Acquisition Inc. (incorporated by reference to Exhibit 2.1 of the Company’s Current Report on Form 8-K filed with the Commission on June 4, 2012).
|
|
|
3.1
|
Amended and Restated Certificate of Incorporation (incorporated by reference to Exhibit 3.1 of the Company’s Current Report on Form 8-K filed with the Commission on December 11, 2007).
|
|
|
3.2
|
Amended and Restated Bylaws (incorporated by reference to Exhibit 3.2 of the Company’s Current Report on Form 8-K filed with the Commission on December 11, 2007).
|
|
|
3.3
|
First Amendment to Amended and Restated Bylaws of Forestar Real Estate Group Inc. (incorporated by reference to Exhibit 3.1 of the Company’s Current Report on Form 8-K filed with the Commission on February 19, 2008).
|
|
|
3.4
|
Certificate of Designation of Series A Junior Participating Preferred Stock (incorporated by reference to Exhibit 3.3 of the Company’s Current Report on Form 8-K filed with the Commission on December 11, 2007).
|
|
|
3.5
|
Second Amendment to Amended and Restated Bylaws of Forestar Real Estate Group Inc. (incorporated by reference to Exhibit 3.5 of the Company’s Annual Report on Form 10-K filed with the Commission on March 5, 2009).
|
|
|
3.6
|
Certificate of Ownership and Merger, dated November 21, 2008 (incorporated by reference to Exhibit 3.1 of the Company’s Current Report on Form 8-K filed with the Commission on November 24, 2008).
|
|
|
3.7
|
Third Amendment to Amended and Restated Bylaws of Forestar Group Inc. (incorporated by reference to Exhibit 3.2 of the Company’s Current Report on Form 8-K filed with the Commission on November 24, 2008).
|
|
|
3.8
|
Fourth Amendment to the Amended and Restated Bylaws of the Company (incorporated by reference to Exhibit 3.1 of the Company’s Current Report on Form 8-K filed with the Commission on November 26, 2012).
|
|
|
4.1
|
Specimen Certificate for shares of common stock, par value $1.00 per share, of Forestar Real Estate Group Inc. (incorporated by reference to Exhibit 4.1 of Amendment No. 5 to the Company’s Form 10 filed with the Commission on December 10, 2007).
|
|
|
4.2
|
Rights Agreement, dated December 11, 2007, between Forestar Real Estate Group Inc. and Computershare Trust Company, N.A., as Rights Agent (including Form of Rights Certificate) (incorporated by reference to Exhibit 4.1 of the Company’s Current Report on Form 8-K filed with the Commission on December 11, 2007).
|
|
101
|
4.3
|
Indenture, dated February 26, 2013 (incorporated by reference to Exhibit 4.1 of the Company’s Current Report on Form 8-K filed with the Commission on February 26, 2013).
|
|
|
4.4
|
Supplemental Indenture, dated February 26, 2013 (incorporated by reference to Exhibit 4.2 of the Company’s Current Report on Form 8-K filed with the Commission on February 26, 2013).
|
|
|
4.5
|
Form of 3.75% Convertible Senior Note due 2020 (included in Exhibit 4.4 above) (incorporated by reference to Exhibit 4.3 of the Company’s Current Report on Form 8-K filed with the Commission on February 26, 2013).
|
|
|
4.6
|
Second Supplemental Indenture, dated November 27, 2013 (incorporated by reference to Exhibit 4.2 of the Company’s Current Report on Form 8-K filed with the Commission on November 27, 2013).
|
|
|
4.7
|
Purchase Contract Agreement, dated November 27, 2013, between the Company and U.S. Bank National Association (incorporated by reference to Exhibit 4.3 of the Company’s Current Report on Form 8-K filed with the Commission on November 27, 2013).
|
|
|
4.8
|
Form of 6.00% Tangible Equity Unit (incorporated by reference to Exhibit 4.4 of the Company’s Current Report on Form 8-K filed with the Commission on November 27, 2013).
|
|
|
4.9
|
Form of Purchase Contract (incorporated by reference to Exhibit 4.5 of the Company’s Current Report on Form 8-K filed with the Commission on November 27, 2013).
|
|
|
4.10
|
Form of Amortizing Note (incorporated by reference to Exhibit 4.6 of the Company’s Current Report on Form 8-K filed with the Commission on November 27, 2013).
|
|
|
4.11
|
Indenture, dated May 12, 2014 (incorporated by reference to Exhibit 4.1 of the Company’s Current Report on Form 8-K filed with the Commission on May 15, 2014).
|
|
|
10.1
|
Employee Matters Agreement, dated December 11, 2007, among Forestar Real Estate Group Inc., Guaranty Financial Group Inc., and Temple — Inland Inc. (incorporated by reference to Exhibit 10.3 of the Company’s Current Report on Form 8-K filed with the Commission on December 11, 2007).
|
|
|
10.2†
|
Form of Forestar Real Estate Group Supplemental Employee Retirement Plan (incorporated by reference to Exhibit 10.5 of Amendment No. 5 to the Company’s Form 10 filed with the Commission on December 10, 2007).
|
|
|
10.3†
|
Amendment No. 1 to Forestar Group Inc. Supplemental Executive Retirement Plan (incorporated by reference to Exhibit 10.3 of the Company’s Annual Report on Form 10-K filed with the Commission on March 14, 2013).
|
|
|
10.4†
|
Form of Forestar Real Estate Group 2007 Stock Incentive Plan (incorporated by reference to Exhibit 10.6 of Amendment No. 5 to the Company’s Form 10 filed with the Commission on December 10, 2007).
|
|
|
10.5†
|
Amended and Restated Forestar Group Inc. Directors' Fee Deferral Plan (incorporated by reference to Exhibit 10.5 of the Company's Annual Report on Form 10-K filed with the Commission on March 11, 2014).
|
|
|
10.6†
|
Form of Indemnification Agreement to be entered into between the Company and each of its directors (incorporated by reference to Exhibit 10.9 of Amendment No. 5 to the Company’s Form 10 filed with the Commission on December 10, 2007).
|
|
|
10.7†
|
Form of Change in Control Agreement between the Company and its named executive officers (incorporated by reference to Exhibit 10.10 of Amendment No. 5 to the Company’s Form 10 filed with the Commission on December 10, 2007).
|
|
|
10.8†
|
Employment Agreement between the Company and James M. DeCosmo dated August 9, 2007 (incorporated by reference to Exhibit 10.11 of Amendment No. 5 to the Company’s Form 10 filed with the Commission on December 10, 2007).
|
|
|
10.9†
|
Form of Nonqualified Stock Option Agreement (incorporated by reference to Exhibit 10.12 of the Company’s Annual Report on Form 10-K filed with the Commission on March 5, 2009).
|
|
|
10.10†
|
Form of Restricted Stock Agreement (incorporated by reference to Exhibit 10.10 of the Company’s Annual Report on Form 10-K filed with the Commission on March 14, 2013).
|
|
|
10.11†
|
Form of Restricted Stock Units Agreement (incorporated by reference to Exhibit 10.11 of the Company’s Annual Report on Form 10-K filed with the Commission on March 14, 2013).
|
|
|
10.12†
|
Form of Stock Appreciation Rights Agreement (incorporated by reference to Exhibit 10.1 of the Company’s Current Report on Form 8-K filed with the Commission on February 12, 2009).
|
|
|
10.13†
|
First Amendment to the Forestar Real Estate Group Inc. 2007 Stock Incentive Plan (incorporated by reference to Exhibit 10.1 of the Company’s Current Report on Form 8-K filed with the Commission on May 13, 2009).
|
|
|
10.14†
|
Second Amendment to the Forestar Group Inc. 2007 Stock Incentive Plan (incorporated by reference to Exhibit 10.22 to the Company’s Annual Report on Form 10-K filed with the Commission on March 3, 2010).
|
|
|
10.15†
|
First Amendment to Employment Agreement, dated as of November 10, 2010, by and between the Company and James M. DeCosmo (incorporated by reference to Exhibit 10.23 of the Company’s Annual Report on Form 10-K filed with the Commission on March 2, 2011).
|
|
|
10.16†
|
Form of Market-Leveraged Stock Unit Award Agreement (incorporated by reference to Exhibit 10.18 of the Company’s Annual Report on Form 10-K filed with the Commission on March 14, 2013).
|
|
|
10.17†
|
Form of Indemnification Agreement entered into between the Company and each of its executive officers (incorporated by reference to Exhibit 10.19 of the Company’s Annual Report on Form 10-K filed with the Commission on March 14, 2013).
|
|
|
10.18
|
Consulting Agreement, dated effective as of October 1, 2012, by and between Forestar (USA) Real Estate Group Inc. and Craig A. Knight (incorporated by reference to Exhibit 10.2 of the Company’s Quarterly Report on Form 10-Q filed with the Commission on November 9, 2012).
|
|
|
10.19
|
Guaranty Agreement dated June 28, 2012 by Forestar (USA) Real Estate Group. in favor of Wells Fargo Bank, National Association (incorporated by reference to Exhibit 10.1 to the Company’s Current Report on Form 8-K filed with the Commission on June 29, 2012).
|
|
|
10.20
|
Voting Agreement, dated June 3, 2012, by and among Forestar Group Inc., James T. Huffman, RCH Energy Opportunity Fund III, LP and RCH Energy SSI Fund, LP (incorporated by reference to Exhibit 10.1 to the Company’s Current Report on Form 8-K filed with the Commission on June 4, 2012).
|
|
|
10.21
|
Guaranty Agreement dated May 24, 2012 by Forestar (USA) Real Estate Group Inc. in favor of Wells Fargo Bank, National Association (incorporated by reference to Exhibit 10.1 to the Company’s Current Report on Form 8-K filed with the Commission on May 29, 2012).
|
|
|
10.22
|
Underwriting Agreement, dated as of November 21, 2013, by and between the Company and Goldman, Sachs & Co. (incorporated by reference to Exhibit 1.1 of the Company’s Current Report on Form 8-K filed with the Commission on November 27, 2013).
|
|
102
|
10.23†
|
Amendment No. 2 to Forestar Group Inc. Supplemental Executive Retirement Plan (incorporated by reference to Exhibit 10.5 of the Company's Annual Report on Form 10-K filed with the Commission on March 11, 2014).
|
|
|
10.24
|
Agreement of Guaranty and Suretyship (Completion) dated January 17, 2014 by Forestar Group Inc. in favor of PNC Bank, National Association (incorporated by reference to Exhibit 10.1 of the Company’s Current Report on Form 8-K filed with the Commission on January 17, 2014).
|
|
|
10.25
|
Agreement of Guaranty and Suretyship (Payment) dated January 17, 2014 by Forestar Group Inc. in favor of PNC Bank, National Association (incorporated by reference to Exhibit 10.2 of the Company’s Current Report on Form 8-K filed with the Commission on January 17, 2014).
|
|
|
10.26
|
Third Amended and Restated Revolving Credit Agreement dated May 15, 2014, by and among the Company, Forestar (USA) Real Estate Group Inc. and certain of its wholly-owned subsidiaries; Key Bank National Association, as lender, swing line lender and agent, the lenders party thereto; and the other parties thereto (incorporated by reference to Exhibit 10.2 to the Company's Current Report of Form 8-K filed with the Commission on May 16, 2014).
|
|
|
10.27
|
Guaranty dated July 15, 2014 by Forestar (USA) Real Estate Group Inc. in favor of Regions Bank (incorporated by reference to Exhibit 10.1 of the Company's Current Report on Form 8-K filed with the Commission on July 18, 2014).
|
|
|
10.28†
|
Separation Agreement and Release of All Claims dated January 8, 2015, between Flavious J. Smith, Jr. and Forestar Group Inc. (incorporated by reference to Exhibit 10.1 of the Company's Current Report on Form 8-K filed with the Commission on January 14, 2015).
|
|
|
10.29
|
Director Nomination Agreement, dated as of February 9, 2015, by and among Forestar Group Inc., SpringOwl Associates LLC and Cove Street Capital, LLC (incorporated by reference to Exhibit 10.1 of the Company's Current Report on Form 8-K filed with the Commission on February 9, 2015).
|
|
|
21.1*
|
List of Subsidiaries of the Company.
|
|
|
23.1*
|
Consent of Ernst & Young LLP.
|
|
|
23.2*
|
Consent of Netherland, Sewell & Associates, Inc.
|
|
|
31.1*
|
Certification of Chief Executive Officer pursuant to Exchange Act rule 13a-14(a), as adopted pursuant to Section 302 of the Sarbanes-Oxley Act of 2002.
|
|
|
31.2*
|
Certification of Chief Financial Officer pursuant to Exchange Act rule 13a-14(a), as adopted pursuant to Section 302 of the Sarbanes-Oxley Act of 2002.
|
|
|
32.1*
|
Certification of Chief Executive Officer pursuant to 18 U.S.C. Section 1350, as adopted pursuant to Section 906 of the Sarbanes-Oxley Act of 2002.
|
|
|
32.2*
|
Certification of Chief Financial Officer pursuant to 18 U.S.C. Section 1350, as adopted pursuant to Section 906 of the Sarbanes-Oxley Act of 2002.
|
|
|
99.1*
|
Reserve report of Netherland, Sewell & Associates, Inc., dated February 12, 2015.
|
|
|
101.1*
|
The following materials from the Company’s Annual Report on Form 10-K for the year ended December 31, 2014, formatted in XBRL (Extensible Business Reporting Language): (i) Consolidated Balance Sheets, (ii) Consolidated Statements of Income and Comprehensive Income, (iii) Consolidated Statement of Equity (iv) Consolidated Statements of Cash Flows, and (v) Notes to Consolidated Financial Statements.
|
|
_____________________
|
*
|
Filed herewith.
|
|
†
|
Management contract or compensatory plan or arrangement.
|
103
SIGNATURES
Pursuant to the requirements of Section 13 or 15(d) of the Securities Exchange Act of 1934, the registrant has duly caused this report to be signed on its behalf by the undersigned, thereunto duly authorized.
|
F
ORESTAR
G
ROUP
I
NC
.
|
||
|
By:
|
/s/ James M. DeCosmo
|
|
|
James M. DeCosmo
|
||
|
President and Chief Executive Officer
|
||
Date:
March 6, 2015
Pursuant to the requirements of the Securities Exchange Act of 1934, this report has been signed below by the following persons on behalf of the registrant and in the capacities and on the dates indicated.
|
Signature
|
Capacity
|
Date
|
||
|
/s/ James M. DeCosmo
|
Director, President and Chief Executive Officer
(Principal Executive Officer)
|
March 6, 2015
|
||
|
James M. DeCosmo
|
||||
|
/s/ Christopher L. Nines
|
Chief Financial Officer
(Principal Financial Officer)
|
March 6, 2015
|
||
|
Christopher L. Nines
|
||||
|
/s/ Sabita C. Reddy
|
Vice President Accounting
(Principal Accounting Officer)
|
March 6, 2015
|
||
|
Sabita C. Reddy
|
||||
|
/s/ Kenneth M. Jastrow, II
|
Non-Executive
Chairman of the Board
|
March 6, 2015
|
||
|
Kenneth M. Jastrow, II
|
||||
|
/s/ Kathleen Brown
|
Director
|
March 6, 2015
|
||
|
Kathleen Brown
|
||||
|
/s/ William G. Currie
|
Director
|
March 6, 2015
|
||
|
William G. Currie
|
||||
|
/s/ Michael E. Dougherty
|
Director
|
March 6, 2015
|
||
|
Michael E. Dougherty
|
||||
|
/s/ James A. Johnson
|
Director
|
March 6, 2015
|
||
|
James A. Johnson
|
||||
|
/s/ Charles W. Matthews
|
Director
|
March 6, 2015
|
||
|
Charles W. Matthews
|
||||
|
/s/ William C. Powers, Jr.
|
Director
|
March 6, 2015
|
||
|
William C. Powers, Jr.
|
||||
|
/s/ James A. Rubright
|
Director
|
March 6, 2015
|
||
|
James A. Rubright
|
||||
|
/s/ Daniel B. Silvers
|
Director
|
March 6, 2015
|
||
|
Daniel B. Silvers
|
||||
|
/s/ Richard M. Smith
|
Director
|
March 6, 2015
|
||
|
Richard M. Smith
|
||||
|
/s/ David L. Weinstein
|
Director
|
March 6, 2015
|
||
|
David L. Weinstein
|
||||
104
TABLE OF CONTENTS
Part IItem 1. BusinessItem 1A. Risk FactorsItem 1B. Unresolved Staff CommentsItem 2. PropertiesItem 3. Legal ProceedingsItem 4. Mine Safety DisclosuresPart IIItem 5. Market For Registrant S Common Equity, Related Stockholder Matters and Issuer Purchases Of Equity SecuritiesPart OfItem 6. Selected Financial DataItem 7. Management S Discussion and Analysis Of Financial Condition and Results Of OperationsNote 2 New and Pending Accounting PronouncementItem 7A. Quantitative and Qualitative Disclosures About Market RiskItem 8. Financial Statements and Supplementary DataNote 1 Summary Of Significant Accounting PoliciesNote 2 New and Pending Accounting PronouncementsNote 3 Goodwill and Other Intangible AssetsNote 4 Real EstateNote 5 Oil and Gas Properties and Equipment, NetNote 6 Investment in Unconsolidated VenturesNote 16 Variable Interest EntitiesNote 7 ReceivablesNote 8 DebtNote 9 Fair ValueNote 10 Capital StockNote 11 Net Income Per ShareNote 17 Share-based CompensationNote 12 Income TaxesNote 13 Litigation and Environmental ContingenciesNote 14 Commitments and Other ContingenciesNote 15 Segment InformationNote 18 Retirement PlansNote 19 Supplemental Oil and Gas Disclosures (unaudited)Note 20 Summary Of Quarterly Results Of Operations (unaudited)Item 9. Changes in and Disagreements with Accountants on Accounting and Financial DisclosureItem 9A. Controls and ProceduresItem 9B. Other InformationPart IIIItem 10. Directors, Executive Officers and Corporate GovernanceItem 11. Executive CompensationItem 12. Security Ownership Of Certain Beneficial Owners and Management and Related Stockholder MattersItem 13. Certain Relationships and Related Transactions, and Director IndependenceItem 14. Principal Accountant Fees and ServicesPart IVItem 15. Exhibits and Financial Statement Schedules