FORMFACTOR INC
10-Ks and 10-Qs
|
|
|
|
|
|
|
|
|
|
|
|
|
|
|
|
|
|
|
|
|
|
|
|
|
|
|
|
|
|
|
|
|
|
|
|
|
|
|
|
|
|
|
|
|
|
|
|
|
|
|
|
|
|
|
|
UNITED STATES
SECURITIES AND EXCHANGE COMMISSION
Washington, D.C. 20549
FORM 10-K
(Mark One)
ý
ANNUAL REPORT PURSUANT TO SECTION 13 OR 15(d) OF THE SECURITIES EXCHANGE ACT OF 1934
For the fiscal year ended
December 28, 2013
Or
o
TRANSITION REPORT PURSUANT TO SECTION 13 OR 15(d) OF THE SECURITIES EXCHANGE ACT OF 1934
For the transition period from to
Commission file number: 000-50307
FormFactor, Inc.
(Exact name of registrant as specified in its charter)
|
Delaware
(State or other jurisdiction of
incorporation or organization)
|
|
13-3711155
(I.R.S. Employer
Identification No.)
|
7005 Southfront Road, Livermore, California 94551
(Address of principal executive offices, including zip code)
(925) 290-4000
(Registrant's telephone number, including area code)
Securities registered pursuant to Section 12(b) of the Act:
Common Stock
Name of each exchange on which registered:
NASDAQ Global Market
Securities registered pursuant to Section 12(g) of the Act:
None
Indicate by check mark if the registrant is a well-known seasoned issuer, as defined in Rule 405 of the Securities Act. Yes
o
No
ý
Indicate by check mark if the registrant is not required to file reports pursuant to Section 13 or Section 15(d) of the Exchange Act. Yes
o
No
ý
Indicate by check mark whether the registrant: (1) has filed all reports required to be filed by Section 13 or 15(d) of the Exchange Act during the preceding 12 months (or for such shorter period that the registrant was required to file such reports), and (2) has been subject to such filing requirements for the past 90 days. Yes
ý
No
o
Indicate by check mark whether the registrant submitted electronically and posted on its corporate Web site, if any, every Interactive Data File required to be submitted and posted pursuant to Rule 405 of the Regulation S-T during the preceding 12 months (or for such shorter period that the registrant was required to submit and post such files). Yes
x
No
o
Indicate by check mark if disclosure of delinquent filers pursuant to Item 405 of Regulation S-K is not contained herein, and will not be contained, to the best of registrant's knowledge, in definitive proxy or information statements incorporated by reference in Part III of this Form 10-K or any amendment to this Form 10-K
ý
Indicate by check mark whether the registrant is a large accelerated filer, an accelerated filer, a non-accelerated filer or a smaller reporting company. See the definitions of "large accelerated filer," "accelerated filer" and "smaller reporting company" in Rule 12b-2 of the Exchange Act:
|
Large accelerated filer
o
|
Accelerated filer
ý
|
Non-accelerated filer
o
(Do not check if a smaller
reporting company)
|
Smaller reporting company
o
|
|||
Indicate by check mark whether the registrant is a shell company (as defined in Rule 12b-2 of the Exchange Act). Yes
o
No
ý
Aggregate market value of registrant's common stock held by non-affiliates of the registrant, based upon the closing price of a share of the registrant's common stock on June 28, 2013 (the last business day of the registrant's most recently completed second quarter) as reported by NASDAQ Global Market on that date:
$272,422,143
. Shares of the registrant's common stock held by each executive officer, director and person who owns 5% or more of the outstanding common stock of the registrant have been excluded in that such persons may be deemed to be affiliates. This determination of affiliate status is not necessarily a conclusive determination for other purposes.
The number of shares of the registrant's common stock, par value $0.001 per share, outstanding as of
March 6, 2014
was
55,383,545
shares.
DOCUMENTS INCORPORATED BY REFERENCE
Portions of the registrant's definitive Proxy Statement for the 2014 Annual Meeting of Stockholders, which will be filed within 120 days of the end of the registrant's fiscal year ended December 28, 2013, are incorporated by reference in Part III hereof. Except with respect to information specifically incorporated by reference in this Annual Report on Form 10-K, the Proxy Statement is not deemed to be filed as a part of this Annual Report on Form 10-K.
FORMFACTOR, INC.
Form 10-K for the Fiscal Year Ended
December 28, 2013
Index
|
|
|
Page
|
|
Part I
|
||
|
Part II
|
||
|
Part III
|
||
|
Part IV
|
||
FormFactor, the FormFactor logo and its product and technology names, including ATRE, DC-Boost, Matrix, MicroSpring, RapidSoak, SmartMatrix, SMART Matrix 100, TouchMatrix, OneTouch, Takumi, TRE, TrueScale and TrueScale Lite, MicroProbe, the MicroProbe logo, QiLin, Mx-FinePitch, Vx-MP, Vx-RF and Apollo are trademarks or registered trademarks of FormFactor, Inc. in the United States and other countries. All other trademarks, trade names or service marks appearing in this Annual Report on Form 10-K are the property of their respective owners.
Throughout this Annual Report on Form 10-K, we refer to FormFactor, Inc. and its consolidated subsidiaries as "FormFactor," "we," "us," and "our". Our fiscal years end on the last Saturday in December. Our last three fiscal years ended on
December 28, 2013
,
December 29, 2012
and
December 31, 2011
.
2
NOTE REGARDING FORWARD-LOOKING STATEMENTS
This Annual Report on Form 10-K contains forward-looking statements within the meaning of the Securities Exchange Act of 1934 and the Securities Act of 1933, which are subject to risks and uncertainties. The forward-looking statements include statements concerning, among other things, our business strategy (including anticipated trends and developments in, and management plans for, our business and the markets in which we operate), financial results, operating results, revenues, gross margin, operating expenses, products, projected costs and capital expenditures, research and development programs, sales and marketing initiatives and competition. In some cases, you can identify these statements by forward-looking words, such as "may," "might," "will," "could," "should," "expect," "plan," "anticipate," "believe," "estimate," "predict," "intend" and "continue," the negative or plural of these words and other comparable terminology. The forward-looking statements are based on information available to us as of the filing date of this Annual Report on Form 10-K and our current expectations about future events, which are inherently subject to change and involve risks and uncertainties. You should not place undue reliance on these forward-looking statements. We have no obligation to update any of these statements. Actual events or results may differ materially from those expressed or implied by these statements due to various factors, including but not limited to the matters discussed below, in the section entitled "Item 1A: Risk Factors", and elsewhere in this Annual Report on Form 10-K.
Our operating results have fluctuated in the past and are likely to continue to fluctuate. As a result, we believe you should not rely on period-to-period comparisons of our financial results as indicators of our future performance. Some of the important factors that could cause our revenues, operating results and outlook to fluctuate from period-to-period include:
|
•
|
customer demand for and adoption of our products;
|
|
•
|
market and competitive conditions in our industry, the semiconductor industry and the economy as a whole;
|
|
•
|
our ability to improve operating efficiency to achieve operating cash flow break even in the current business environment and to better position our company for long-term, profitable growth;
|
|
•
|
our ability to realize the benefits of certain deferred tax attributes;
|
|
•
|
the timing and success of new technologies and product introductions by our competitors and by us;
|
|
•
|
our ability to work efficiently with our customers on their qualification of our new technologies and products;
|
|
•
|
our ability to deliver reliable, cost-effective products that meet our customers' testing requirements in a timely manner;
|
|
•
|
our ability to transition to new product architectures and to bring new products into volume production on time and at acceptable yields and cost;
|
|
•
|
our ability to implement measures for enabling efficiencies and supporting growth in our design, applications, manufacturing and other operational activities;
|
|
•
|
our ability to continue to integrate successfully and efficiently the operations of Astria Semiconductor Holdings, Inc., including its major subsidiary, Micro-Probe Incorporated (together "MicroProbe");
|
|
•
|
the reduction, rescheduling or cancellation of orders by our customers;
|
|
•
|
our ability to collect accounts receivables owed by our customers;
|
|
•
|
our product and customer sales mix and geographical sales mix;
|
|
•
|
a reduction in the price or the profitability of our products;
|
|
•
|
the timely availability or the cost of components and materials utilized in our products;
|
|
•
|
our ability to efficiently optimize manufacturing capacity and production yields as necessary to meet customer demand and ramp production volume at our manufacturing facilities;
|
|
•
|
our ability to protect our intellectual property against third parties and continue our investment in research and development and design activities;
|
3
|
•
|
any disruption in the operation of our manufacturing facilities;
|
|
•
|
the timing of and return on our investments in research and development;
|
|
•
|
macroeconomic events that impact global buying in general and the semiconductor industry in particular, and
|
|
•
|
seasonality, principally due to our customers' purchasing cycles.
|
The impact of one or more of these factors might cause our operating results to vary widely. If our revenues, operating results or outlook fall below the expectations of market analysts or investors, the market price of our common stock could decline substantially. You should carefully consider the numerous risks and uncertainties described above and in such sections.
Item 1:
Business
We design, develop, manufacture, sell and support precision, high performance advanced semiconductor wafer probe card products and solutions. We are the largest probe card manufacturer, and semiconductor manufacturers use our wafer probe cards in the semiconductor manufacturing process to perform sort and test on the semiconductor die, or chips, on a semiconductor wafer. During wafer sort and test, a wafer probe card is mounted on a prober and electrically connected to a semiconductor tester. The wafer probe card is used as an interface to connect electrically with and test individual chips on a wafer. Using our wafer probe cards to test at this stage of the manufacturing process, our customers can reduce their cost of test by identifying defective chips prior to incurring the time and costs of packaging defective chips. We work closely with our customers on product design, as each wafer probe card is a custom product that is specific to the chip and wafer designs of the customer.
We were incorporated in 1993 and we introduced our first wafer probe card based on our MicroSpring® interconnect technology in 1995. Historically, sales for wafer probe cards for testing Dynamic Random Access Memory, or DRAM, devices have made up the majority of our revenues. In October 2012, we completed the acquisition of Astria Semiconductor Holdings, Inc., including its subsidiary Micro-Probe Incorporated (together "MicroProbe"). The majority of MicroProbe's revenue is made up of sales of wafer probe cards for testing System-on-Chip, or SoC devices.
Our business is generally subject to the cyclicality of the semiconductor industry. In fiscal 2008 through 2012, our financial performance was negatively impacted not only by semiconductor industry specific events, but also by global macro-economic issues and by product transition and other business execution challenges. In fiscal 2008, our revenue declined 55% from our fiscal 2007 revenue level, as the global economic crisis was accompanied by a collapse in demand for semiconductor chips in general, and for DRAM chips in particular. In fiscal 2009, we were late in our development and introduction of a competitive next-generation wafer probe card for memory devices and our revenue declined 36% from our fiscal 2008 revenue level. These dramatic revenue drops were accompanied by gross margin challenges resulting in operating losses in both fiscal 2008 and 2009. In fiscal 2010, our revenue increased by 39% over fiscal 2009, but was partially dampened by the unanticipated length of the evaluation and qualification of our Matrix architecture-based wafer probe cards at one of our customers, which negatively impacted demand and revenues from our DRAM and Flash memory wafer probe cards. We also realized an operating loss in fiscal 2010, during which our revenues for certain products were also impacted significantly by the pricing practices and activities of a competitor.
In fiscal 2011, total sales for the global semiconductor market were relatively unchanged compared to 2010. The moderate growth in SOC and NAND Flash devices was offset by substantial reductions in DRAM and NOR Flash devices. The DRAM and NOR weakening was severe in the second half of 2011 due to the impact of Thailand flooding on personal computer output and selling price erosion for DRAM semiconductor devices. In fiscal 2012, demand for DRAM devices experienced a continued weakening, particularly in the second half of the year, due to lower personal computer demand and falling semiconductor prices. Our sales declined 10% in fiscal 2011 compared to fiscal 2010, and declined 6% in fiscal 2012 compared to fiscal 2011, excluding the impact of the MicroProbe acquisition. Our sales increased
30%
in fiscal 2013 compared to fiscal 2012 primarily due to the Microprobe acquisition. We incurred operating losses in fiscal 2013, 2012 and 2011.
We acquired MicroProbe in fiscal 2012 to better address the changing semiconductor device demand driven by the computing industry moving from a personal computer focus to a more mobile computing focus. SoC devices include microprocessors, graphic processors, mobile radio frequency or RF, and analog and mixed-signal products - important drivers of today's sophisticated, multi-functional consumer mobile devices. The acquisition of MicroProbe enables us to leverage the combination of two advanced wafer probe card manufacturers and expand our SoC product portfolio to diversify our business.
4
We can now assist semiconductor manufacturers in bringing new generations of SoC devices to market faster and more economically.
Since our acquisition of MicroProbe, we have been working as a single worldwide organization to combine our capabilities in technologies. The acquisition created the largest probe card supplier in the semiconductor industry. Combined we believe we have the broadest portfolio of products and the largest customer service and support organization in the industry.
Products
Our products are based on our proprietary technologies, including our MicroSpring interconnect technology, our matrix product architecture and our design tools. Our MicroSpring interconnect technology, which includes resilient spring-like contact elements, enables us to produce wafer probe cards for applications that require reliability, speed, precision and signal integrity. Manufactured through precision micro-machining and scalable semiconductor-like wafer fabrication processes, our MicroSpring contacts are springs that optimize the relative amounts of force on, and across, a bond pad during the test process and maintain their shape and position over a range of compression. These characteristics allow us to achieve reliable, electrical contact on either clean or oxidized surfaces, including bond pads on a wafer. Our wafer probe cards can make hundreds of thousands of touchdowns with minimal maintenance for many device applications. Our MicroSpring contacts include geometrically precise tip structures. These tip structures enable precise contact with small bond pad sizes and pitches. Our technology allows for the design of specific spring and contact tip geometries that deliver precise and predictable electrical contact for a customer's particular application.
Our wafer probe cards are custom designed for our customers' unique wafer designs. For high parallelism memory test applications, our products must accommodate tens of thousands of simultaneous contacts between our MicroSpring contacts and the chip bond pads on the wafer. Our current technology, including our proprietary advanced tester resource enhancement, or ATRE technology, enables probe cards for certain applications to be populated with over 75,000 contacts. Our technology addresses fundamental wafer test challenges, including the planarity of the array, the force needed to make contact and the need to touch all bond pads with equal accuracy. We have developed wafer probe cards that use array sizes ranging from 23 mm by 23 mm up to array sizes suitable for contacting all die on a 300 mm wafer simultaneously.
We have invested and intend to continue to invest considerable resources in our wafer probe card design tools and processes. These tools and processes enable automated routing and trace length adjustment within our complex multi-layer printed circuit boards and greatly enhance our ability to rapidly design and lay out complex printed circuit board structures. Our proprietary design tools also enable us to design wafer probe cards particularly suited for testing today's low voltage, high power chips, which require superior power supply performance and are used to provide a very low inductance, low resistance electrical path between the power source and the chip under test.
Some of our customers test certain chips over a large range of operating temperatures, as opposed to conducting wafer test at one predetermined temperature. We select our wafer probe card materials after careful consideration of the potential range of test operating temperatures and design our wafer probe cards to provide for a precise match with the thermal expansion characteristics of the wafer under test. As a result, our customers can use the same FormFactor wafer probe card for both low and high temperature testing without a loss of performance. In addition, for test situations for which a customer requires positional accuracy at a specific temperature, we have designed wafer probe cards optimized for testing at such temperatures.
We are continually improving our proprietary technologies and design capabilities to respond to our customers' increasing requirements to test smaller, faster and more complex semiconductor devices. Our Matrix product architecture enables test of these leading devices with increasing parallelism. For example, our Matrix products can test up to 1,100 devices on a NAND Flash wafer, 3,100 devices on a NOR Flash wafer and will be able to test up to 1,450 devices on a DRAM wafer. We continue to invest in research and development activities around our interconnect technologies, including our microelectromechanical systems, or MEMS technology, as our MicroSpring contacts need to scale in size with the continuing evolution of semiconductors.
With the acquisition of MicroProbe, we deliver a suite of advanced vertical or flip chip (area array) products including vertical MEMS, Cobra-style vertical and Spring-pin vertical probe cards, and cantilever probe cards. Our vertical products are primarily used to probe SoC chips with advanced packages in grid-array layout. Examples of such advanced packages include Wafer-Level-Packaging (WLP), flip-chip and copper pillar packaging technologies. These technologies have diverse wafer test requirements. To address these test requirements, we offer a wide range of propriety probe designs and metallurgy choices, individually optimized for the customers' specific test requirements and applications. Our cantilever products are primarily used to probe peripheral-layout pads on wire-bonded SoC chips.
5
Our products help our customers to increase wafer test throughputs and achieve optimal test yield. Through on-going investments in our technology, we scale our products to meet customers' future technical roadmap requirements for performance and geometry shrinks. Our high-precision vertical MEMS probe technology enables the necessary pitch shrinks to achieve sub-80nm grid-array layouts.
Customers
Our customers include semiconductor chip manufacturers in the DRAM, Flash and SoC markets. Our customers use our wafer probe cards to test DRAM chips, including LPDDR2, LPDDR3, LPDDR4, DDR, DDR2, DDR3, DDR4, SDRAM, PSRAM, and Graphic DRAM; NOR, PCM and NAND flash memory chips; and SoC devices, including serial data devices, chipsets, microprocessors, microcontrollers, graphic processors, mobile RF, analog and mixed-signal devices.
Three
customers accounted for
45.9%
of our revenues in fiscal
2013
,
three
customers accounted for
55.1%
of our revenues in fiscal
2012
and
three
customers accounted for
47.2%
of our revenues in fiscal
2011
, as follows:
|
Fiscal 2013
|
Fiscal 2012
|
Fiscal 2011
|
||||||
|
Intel
|
17.7
|
%
|
* %
|
|
* %
|
|
||
|
SK hynix
|
16.5
|
|
29.4
|
|
16.3
|
|
||
|
Micron (1)
|
11.7
|
|
13.3
|
|
19.7
|
|
||
|
Samsung
|
*
|
|
12.4
|
|
11.2
|
|
||
|
Total
|
45.9
|
%
|
55.1
|
%
|
47.2
|
%
|
||
|
*
|
Less than 10% of revenues.
|
(1) Includes Elpida Memory Inc. and its consolidated subsidiary Rexchip Electronics Corporation. In July 2013, Micron Technology, Inc. completed its acquisition of Elpida Memory, Inc.
The percentages above reflect customers and their consolidated subsidiaries as of
December 28, 2013
. Prior period consolidated subsidiaries have been updated to reflect the current customer compositions.
Information concerning revenue by geographic region and by country based upon ship to location appears under "Item 7: Management's Discussion and Analysis of Financial Condition and Results of Operations - Revenues - Revenues by Geographic Region" and Note 15 - Operating Segments and Geographic Information of the Notes to our Consolidated Financial Statements, which are included elsewhere in this Annual Report on Form 10-K.
Backlog
Our backlog was
$25.0 million
at
December 28, 2013
compared to
$27.0 million
at
December 29, 2012
. We manufacture our wafer probe cards based on order backlog and customer commitments. Backlog includes only orders with written authorizations and shipment dates within 12 months. Backlog also includes revenue for existing product service agreements to be earned within the next 12 months. Customers may delay delivery of products or cancel orders prior to shipment, subject to possible cancellation penalties. Due to possible changes in delivery schedules and cancellations of orders, our backlog on any particular date is not necessarily indicative of actual sales for any succeeding period. Delays in delivery schedules and/or a reduction in backlog during any particular period could have a material adverse effect on our business and results of operations.
Manufacturing
Our wafer probe cards are custom products that we design and manufacture to order for our customers' unique wafer designs and wafer test strategies. Our proprietary manufacturing processes can generally be divided into a front-end process, which, depending upon the specific product, may include wire bonding, photolithography, plating and metallurgical processes, dry and electro-deposition, pick and place assembly and complex interconnection system design, and a back-end process, which includes assembly and test. The critical steps in our manufacturing process are performed in a Class 100 clean room environment.
We depend upon suppliers for some critical components of our manufacturing processes, including ceramic substrates and complex printed circuit boards, and for materials used in our manufacturing processes. We also rely on suppliers to provide certain contacts and interconnects incorporated into our products. Some of these components and materials are supplied by a single vendor, and some are subject to certain minimum order quantities. Generally, we rely on purchase orders rather than long-term contracts with our suppliers, which subjects us to risks, including price increases, manufacturing capacity issues and component shortages. We continue to evaluate alternative sources of supply for these components and materials.
6
Our primary manufacturing facilities are located in Livermore, San Jose and Carlsbad, California, United States. We also perform certain probe card manufacturing operations in our facility in Suzhou, China and Yokohama, Japan.
We maintain repair and service capabilities in Livermore, San Jose, and Carlsbad, California, United States; Austin, Texas, United States; Dresden, Germany; Gyeonggi-do, South Korea; Yokohama City and Hiroshima, Japan; Suzhou, China; Hsinchu, Taiwan; and Singapore.
Research, Development and Engineering
The semiconductor industry is subject to rapid technological change and new product introductions and enhancements. We believe that our continued commitment to research and development and our timely introduction of new and enhanced wafer probe test solutions and technologies related to our products are integral to maintaining our competitive position. We continue to allocate significant resources to these efforts and to use automation and information technology to provide additional efficiencies in our research and development activities.
Research and development expenses were
$42.1 million
for fiscal
2013
,
$40.1 million
for fiscal
2012
and
$43.5 million
for fiscal
2011
.
Sales and Marketing
We sell our products utilizing a sales model that emphasizes the customer's total cost of ownership as it relates to the costs of test. With this sales model, we strive to demonstrate how test costs can be reduced by simulating the customer's test floor environment, including testers and probers, utilizing our products and comparing the overall cost of test to that of conventional and competitive wafer probe cards.
We sell our products worldwide primarily through a combination of a global direct sales force, independent sales representatives and distributors.
Our sales and marketing staff, located in the United States, China, Germany, Italy, Japan, Singapore, South Korea, and Taiwan, work closely with customers to understand their businesses, anticipate trends and define products that will provide significant technical and economic advantages to our customers.
We utilize a highly skilled team of field application engineers that support our customers as they integrate our products into their manufacturing processes. Through these customer relationships, we develop a close understanding of customer and product requirements, thereby aligning our products with our customers' production ramps.
Environmental Matters
We are subject to U.S. federal, state and local, and foreign governmental laws and regulations relating to the protection of the environment, including those governing the discharge of pollutants into the air and water, the management and disposal of hazardous substances and wastes, the clean-up of contaminated sites and the maintenance of a safe workplace. We believe that we comply in all material respects with the environmental laws and regulations that apply to us, including those of the California Department of Toxic Substances Control, the Bay Area Air Quality Management District, the City of Livermore Water Resources Division, County of Santa Clara Department of Environmental Health, County of San Diego Hazardous Materials Division and Encino Water District, and the California Division of Occupational Safety and Health. We did not receive any notices of violations of environmental laws and regulations in fiscal
2013
,
2012
or
2011
. No provision has been made for loss from environmental remediation liabilities associated with our facilities because we believe that it is not probable that a liability has been incurred as of
December 28, 2013
.
We believe we are in compliance in all material respects with the environmental laws and regulations that apply to us. In the future, we may receive environmental violation notices, and final resolution of the violations could harm our operations and adversely impact our operating results and cash flows. New laws and regulations, amended enforcement practices around existing laws and regulations, discovery of previously unknown contamination at our or others' sites or the imposition of new cleanup requirements could also harm our operations.
We are also subject to new SEC rules that will require diligence, disclosure and reporting on whether certain minerals and metals, known as conflict minerals, used in our products originate from the Democratic Republic of Congo and adjoining countries. We have implemented a program to comply with these new rules, which could adversely affect the sourcing, availability and pricing of minerals we use in our products. We will not only incur costs in relation to our compliance with disclosure requirements, but may also face difficulties in satisfying customers who require that all of our products are certified as conflict mineral free.
7
Competition
The highly competitive wafer probe card market comprises many domestic and foreign companies, and has historically been fragmented with many local suppliers servicing individual customers. Our current and potential competitors in the wafer probe card market include Advantest Corporation, AMST Co., Ltd., BucklingBeam Solutions, Cascade Microtech, Inc., Feinmetall GmbH, Korea Instrument Co., Ltd., Japan Electronic Materials Corporation, SV Probe, Inc., Micronics Japan Co., Ltd., Microfriend Inc., Soulbrain Engineering, Technoprobe, TSE Co., Ltd., Wentworth Laboratories, Inc., and Will Technology Co., Ltd, among others. In addition to the ability to address wafer probe card performance issues, the primary competitive factors in the industry in which we compete include product quality and reliability, price, total cost of ownership, lead times, service, field applications support and timeliness of delivery.
Some of our competitors are also suppliers of other types of test equipment or other semiconductor equipment and may have greater financial and other resources than we do. We expect that our competitors will enhance their current wafer probe products and that they may introduce new products that will be competitive with our wafer probe cards. In addition, it is possible that new competitors, including test equipment manufacturers, may offer new technologies that reduce the value of our wafer probe cards.
Additionally, semiconductor manufacturers may implement chip designs that include built-in self-test, or BIST, capabilities or similar functions or methodologies that increase test throughput and eliminate some or all of our current competitive advantages. Our ability to compete favorably may also be adversely affected by (1) delays in qualification of our new products, (2) low volume orders that do not meet our present minimum volume requirements, (3) very short cycle time requirements, (4) long-standing relationships between our competitors and certain semiconductor manufacturers and (5) semiconductor manufacturer test strategies that include low performance semiconductor testers and less complex wafer probe cards.
Intellectual Property
Our success depends in part upon our ability to continue to innovate and invest in research and development to meet the semiconductor testing requirements of our customers, to maintain and protect our proprietary technology and to conduct our business without infringing on the proprietary rights of others. We rely on a combination of patents, trade secrets, trademarks and contractual restrictions on disclosure to protect our intellectual property rights.
As of
December 28, 2013
, we had
668
issued patents, of which
446
are United States patents and
222
are foreign patents. The expiration dates of these patents range from
2013
to
2030
. Our issued patents cover many of the features of our interconnect technology, as well as some of our inventions related to wafer probe cards and testing, wafer-level packaging and test, sockets and assemblies and chips. In addition, as of
December 28, 2013
, we had
266
patent applications pending worldwide, including
48
United States applications,
212
foreign national or regional stage applications and
6
Patent Cooperation Treaty applications. We cannot provide any assurance that our current patent applications, or any future patent applications that we may file, will result in a patent being issued with the scope of the claims we seek, or at all, or whether any patents that we may obtain will not be challenged or invalidated. Even if additional patents are issued, our patents might not provide sufficiently broad coverage to protect our proprietary rights or to avoid a third party claim against one or more of our products or technologies.
We have both registered and unregistered trademarks, including FormFactor, ATRE, DC-Boost, Matrix, MicroSpring, RapidSoak, SmartMatrix, SmartMatrix 100, TouchMatrix, OneTouch, Takumi, TRE, TrueScale, TrueScale Lite, the FormFactor logo, MicroProbe, the MicroProbe logo, QiLin, Mx-FinePitch, Vx-MP, Vx-RF and Apollo.
We routinely require our employees, customers, suppliers and potential business partners to enter into confidentiality and non-disclosure agreements before we disclose to them any sensitive or proprietary information regarding our products, technology or business plans. We require our employees to assign to us proprietary information, inventions and other intellectual property they create, modify or improve.
Legal protections afford only limited protection for our proprietary rights. We also may not be successful in our efforts to enforce our proprietary rights. To date, for example, we have been unsuccessful in our efforts to enforce certain of our patent rights and obtain injunctive relief for violation of those rights in South Korea, and through the U.S. International Trade Commission, or ITC. Notwithstanding our efforts to protect our proprietary rights, unauthorized parties may attempt to copy aspects of our products or to obtain and use information that we regard as proprietary. From time to time, we have become aware of situations where others are or may be infringing on our proprietary rights. We evaluate these situations as they arise and elect to take actions against these companies as we deem appropriate. In response to our actions, and on occasion without any action on our part, proceedings have been filed in the U.S. Patent and Trademark Office and patent offices in other countries, challenging the validity of certain of our patents. Others might independently develop similar or competing technologies or methods, design around our patents, or attempt to manufacture and sell infringing products in countries that do
8
not strongly enforce intellectual property rights. In addition, leading companies in the semiconductor industry have extensive patent portfolios and other intellectual property with respect to semiconductor technology. In the future, we might receive claims that we are infringing intellectual property rights of others or that our patents or other intellectual property rights are invalid. We have received in the past, and may receive in the future, communications from third parties inquiring about our interest in licensing certain of their intellectual property or more generally identifying intellectual property that may be of interest to us.
We have invested significant time and resources in our technology. As a part of our ongoing efforts to protect the intellectual property, we have filed actions to enforce our intellectual property rights against infringing third parties and may pursue such actions in the future.
For a description of the material patent-related proceedings in which we are involved, see "Item 3: Legal Proceedings".
Employees
As of
December 28, 2013
, we had
961
regular full-time employees, including
210
in research and development,
116
in sales and marketing,
75
in general and administrative functions, and
560
in operations. By region,
685
of our employees were in North America,
75
in Singapore,
78
in China,
34
in Japan,
47
in South Korea,
35
in Taiwan, and
7
in Europe. No employees are currently covered by a collective bargaining agreement. We believe that our relations with our employees are good.
Available Information
We maintain a website at
http://www.formfactor.com
. We make available free of charge on our website our Annual Reports on Form 10-K, Quarterly Reports on Form 10-Q, current reports on Form 8-K and amendments to those reports filed or furnished pursuant to Section 13(a) or 15(d) of the Exchange Act, as soon as reasonably practicable after we electronically file such material with, or furnish it to, the United State Securities and Exchange Commission, or SEC. The reference to our website does not constitute incorporation by reference of the information contained at the site.
The public may also read and copy any materials that we file with the SEC at the SEC's Public Reference Room at 100 F Street N.E., Washington, D.C. 20549. The public may obtain information on the operation of the Public Reference Room by calling the SEC at 1-800-SEC-0330. The SEC also maintains an Internet website that contains reports and other information regarding issuers, such as FormFactor, that file electronically with the SEC. The SEC's Internet website is located at
http://www.sec.gov
.
Directors and Executive Officers
Directors.
The names of the members of our board of directors, their ages as of
December 28, 2013
and their current occupations are set forth below.
|
Name of Director
|
Age
|
Current Occupation
|
|||
|
Edward Rogas, Jr.
|
73
|
|
Director of Vitesse Semiconductor Corporation and Vignani Technologies Pvt Ltd
|
||
|
G. Carl Everett, Jr.(1)
|
63
|
|
Venture Partner at Accel LLP
|
||
|
Lothar Maier
|
58
|
|
Chief Executive Officer and Director of Linear Technology Corporation
|
||
|
Michael D. Slessor
|
44
|
|
President and Director of FormFactor, Inc.
|
||
|
Michael W. Zellner
|
58
|
|
Director of FormFactor, Inc., Vice President and Chief Financial Officer of Cyan Inc.
|
||
|
Richard DeLateur
|
55
|
|
Director of FormFactor, Inc.
|
||
|
Thomas St. Dennis
|
60
|
|
Chief Executive Officer and Executive Chairman of FormFactor, Inc.
|
||
|
(1)
|
Mr. Everett has stated his intention to not seek election as a director at our 2014 Annual Meeting of Stockholders.
|
G. Carl Everett, Jr.
has served as a Director since June 2001, as our Chairman from December 2010 to October 2013, as our Lead Independent Director since October 2013, and served as our interim Chief Executive Officer from May 2010 to September 2010, as well as our Executive Chairman from September 2010 to December 2010. Mr. Everett founded GCE Ventures, a venture advisement firm, in April 2001. Mr. Everett has served as a venture partner at Accel LLP, a venture capital firm, since 2002. From February 1998 to April 2001, Mr. Everett served as Senior Vice President, Personal Systems Group of Dell, Inc. During 1997, Mr. Everett was on a personal sabbatical. From 1978 to December 1996, Mr. Everett held several management positions with Intel Corporation, including Senior Vice President and General Manager of the Microprocessor
9
Products Group, and Senior Vice President and General Manager of the Desktop Products Group. Mr. Everett currently serves on the board of directors of three privately held companies. Mr. Everett holds a B.A. in business administration and an honorary Doctorate of Laws from New Mexico State University.
Lothar Maier
has served as a Director since November 2006. Mr. Maier has served as the Chief Executive Officer and a member of the board of directors of Linear Technology Corporation (Nasdaq: LLTC), a supplier of high performance analog integrated circuits since January 2005. Prior to that, Mr. Maier served as Linear Technology's Chief Operating Officer from April 1999 to December 2004. Before joining Linear Technology, Mr. Maier held various management positions at Cypress Semiconductor Corporation, a provider of high-performance, mixed-signal, programmable solutions, from 1983 to 1999, most recently as Senior Vice President and Executive Vice President of Worldwide Operations. Mr. Maier holds a B.S. in chemical engineering from the University of California at Berkeley.
Thomas St. Dennis
has served as our Chief Executive Officer and a Director since September 2010, when he joined our company and as our Executive Chairman of the Board of Directors since October 23, 2013. Mr. St. Dennis previously held various positions at Applied Materials, Inc. from 1992 to 1999 and again from 2005 to 2009. His most recent role at Applied Materials, Inc. was Senior Vice President and General Manager of the Silicon Systems Group. He also worked at Novellus Systems, Inc. as Executive Vice President of Sales and Marketing from 2003 to 2005. From 1999 to 2003 Mr. St. Dennis was President and CEO of Wind River Systems, Inc. Mr. St. Dennis holds a B.S. in Physics and a M.S. in Physics, both from UCLA.
Mike Slessor,
has served as President and a Director since October 2013. Prior to this, Mr. Slessor served as the Senior Vice President and General Manager, MicroProbe Product Group from October 2012 to October 2013. Before joining FormFactor, he was President and Chief Executive Officer of MicroProbe from July 2008 through the October 2012 closing of FormFactor's acquisition of MicroProbe. Prior to joining MicroProbe, he held various management, product-marketing, and applications-engineering positions in the semiconductor industry, most notably with KLA-Tencor, where he led marketing and applications for the company's fastest growing division. Mr. Slessor received his Ph.D. in Aeronautics and Physics from the California Institute of Technology and his B.A.Sc. in Engineering Physics from the University of British Columbia.
Edward Rogas, Jr.
has served as a Director since October 2010. Mr. Rogas currently serves as a Director on the board of Vitesse Semiconductor Corporation. Mr. Rogas served as a Director of Vignani Technologies Pvt Ltd until February 2014 and Photon Dynamics, Inc., from May 2006 to October 2008. Mr. Rogas held management positions at Teradyne, Inc. for over 30 years, including serving as Senior Vice President from 2000 through 2005. Mr. Rogas holds an M.B.A. degree from Harvard Business School and a B.S. from the United States Naval Academy.
Michael W. Zellner
has served as a Director since April 2011. Mr. Zellner is currently Vice President and Chief Financial Officer of Cyan, Inc. (NYSE: CYNI), a position he has held since March 2013. He was Vice President, Finance and Chief Financial Officer of PMC-Sierra, Inc. (Nasdaq: PMCS) from March 2007 to November 2012. Prior to joining PMC-Sierra, Mr. Zellner was Senior Vice President of Finance and Administration and Chief Financial Officer at Wind River Systems, Inc., a device software solutions provider to the electronics industry. Mr. Zellner attended the Stanford Executive Program at the Stanford Graduate School of Business as well as the MBA and BBA accounting program at Florida Atlantic University.
Richard DeLateur
has served as a Director since May 2011. Mr. DeLateur served as Chief Financial Officer of FormFactor, Inc. from May 2010 to May 2011. Mr. DeLateur is a 20-year veteran of Intel's finance team, where he held various positions, including the role of Vice President and Group Controller of Worldwide Technology and Manufacturing. Mr. DeLateur more recently served as Chief Financial Officer at the private companies Fluidigm Corporation and Topsin Corporation. Mr. DeLateur had also served as a Director at Numonyx Corp., a leading manufacturer of Flash memory, which is now part of Micron Technology, Inc. Mr. DeLateur holds a B.A. in Economics from the University of California, Davis and was awarded his Chartered Financial Analyst (CFA) certification in 1999.
Executive Officers.
Our executive officers, their ages and their positions with our company as of
December 28, 2013
are set forth below.
|
Name
|
Age
|
Position
|
|||
|
Thomas St. Dennis
|
60
|
|
Chief Executive Officer
|
||
|
Michael M. Ludwig
|
52
|
|
Chief Financial Officer
|
||
|
Michael D. Slessor
|
44
|
|
President
|
||
|
Stuart L. Merkadeau
|
52
|
|
Senior Vice President, General Counsel and Secretary
|
||
Michael M. Ludwig
has served as our Chief Financial Officer since May 2011. Mr. Ludwig has also served as our Vice President, Finance from December 2009 to May 2011, was a consultant to our company from February 2009 to December
10
2009, and served as our Vice President and Corporate Controller from April 2001 to April 2007. Mr. Ludwig has also held senior level finance and accounting positions at Force 10 Networks, Inc., a division of Dell Inc., that builds and secures high performance networks, and at divisions of Tyco Electronics and Beckman Coulter. Mr. Ludwig holds a B.S. in accounting from California State Polytechnic University, Pomona.
Stuart L. Merkadeau
has served as one of our Senior Vice Presidents since October 2003 and as our General Counsel and Secretary since October 2002. Mr. Merkadeau previously served as one of our Vice Presidents from October 2002 to September 2003, and as our Vice President of Intellectual Property from July 2000 to October 2002. From 1990 to July 2000, Mr. Merkadeau practiced law as an associate and then a partner with Graham & James LLP, where he specialized in licensing and strategic counseling in intellectual property matters. Mr. Merkadeau is admitted to practice in California and registered to practice before the U.S. Patent and Trademark Office. Mr. Merkadeau holds a B.S. in industrial engineering from Northwestern University and a J.D. from the University of California at Los Angeles.
Item 1A:
Risk Factors
In addition to the other information in this Annual Report on Form 10-K, you should carefully consider the risk factors discussed in this Annual Report on Form 10-K in evaluating FormFactor and our business. If any of the identified risks actually occur, our business, financial condition and results of operations could be materially adversely affected. The trading price of our common stock could decline and you may lose all or part of your investment in our common stock. The risks and uncertainties described in this Annual Report on Form 10-K are not the only ones we face. Additional risks that we currently do not know about or that we currently believe to be immaterial may also impair our business operations.
We have incurred significant costs related to our acquisition of Astria Semiconductor Holdings, Inc., including its subsidiary MicroProbe, Inc., and the acquisition may not be successful.
On October 16, 2012, we completed our acquisition of Astria Semiconductor Holdings, Inc., including its major subsidiary Micro-Probe Incorporated, which is our most substantial acquisition to date (the "MicroProbe Acquisition"). See Note 3 to the Consolidated Financial Statements included elsewhere in this Annual Report on Form 10-K for a more complete description of the MicroProbe Acquisition. MicroProbe transitioned from being a standalone privately-held corporation to a wholly-owned subsidiary of a public company. This combination entailed many changes, including the integration of MicroProbe, its personnel and its systems with those of FormFactor. These transition activities were complex and we incurred significant costs related to the MicroProbe Acquisition, and the commercial and financial success of the MicroProbe Acquisition is subject to many risks as set forth below:
|
•
|
We may fail to realize synergies that we anticipated from the combination of the two companies;
|
|
•
|
We may fail to retain key MicroProbe executives and employees, which could reduce the likelihood of success of the acquisition;
|
|
•
|
The combination of the two companies may not deliver to our customers the benefits that we have anticipated, including a broader range of products, improved product service and support and enhanced R&D programs, and our customers may reduce their aggregate spending on MicroProbe and/or FormFactor products;
|
|
•
|
We may assume unforeseen legal, regulatory, intellectual property or other liabilities;
|
|
•
|
We will have less cash available for other purposes, including other acquisitions of technologies or businesses.
|
If any of these factors impairs our ability to integrate our operations with those of MicroProbe's successfully or on a timely basis, we may not be able to realize the anticipated synergies, business opportunities and growth prospects from combining the businesses. In addition, we may be required to spend additional time or money on integration that otherwise would be spent on the development and expansion of our business.
In addition, the market price of our common stock may decline if the integration of the businesses of FormFactor and MicroProbe fails to achieve financial benefits to the extent anticipated by financial analysts or investors, or the effect of the business combination on the financial results of the combined company is otherwise not consistent with the expectations of financial analysts or investors.
We may make additional acquisitions and investments, which could put a strain on our resources, cause ownership dilution to our stockholders and adversely affect our financial results.
11
Integrating newly acquired businesses, products or technologies into our company could put a strain on our resources, could be expensive and time consuming, may cause delays in product delivery and might not be successful. Future acquisitions and investments could divert management's attention from other business concerns and expose our business to unforeseen liabilities or risks associated with entering new markets. In addition, we might lose key employees while integrating new organizations. We might not be successful in integrating any acquired businesses, products or technologies, and might not achieve anticipated revenues and cost benefits. Investments that we make may not result in a return consistent with our projections upon which such investments are made, or may require additional investment that we did not originally anticipate. In addition, future acquisitions could result in customer dissatisfaction, performance problems with an acquired company, potentially dilutive issuances of equity securities or the incurrence of debt, contingent liabilities, possible impairment charges related to goodwill or other intangible assets or other unanticipated events or circumstances, any of which could harm our business.
If goodwill or other intangible assets that we record in connection with the MicroProbe Acquisition become impaired, we could be required to take significant charges against earnings.
In connection with the accounting for the MicroProbe Acquisition, we have recorded a significant amount of goodwill and other intangible assets. Under U.S. generally accepted accounting principles, or GAAP, we must assess, at least annually and potentially more frequently, whether the value of goodwill and other indefinite-lived intangible assets have been impaired. Finite-lived intangible assets will be assessed for impairment in the event of an impairment indicator. Any reduction or impairment of the value of goodwill or other intangible assets will result in a charge against earnings, which could materially adversely affect our results of operations and stockholders' equity in future periods.
Our delay in qualifying our next generation products at certain of our customers could result in higher development costs and loss of market share at those customers, which could negatively impact our business and financial results.
We may suffer from delays in qualifying our next-generation products at our customers. In fiscal 2011 we engaged with certain customers on a next-generation, or evolution, of our SmartMatrix product which enables greater parallelism, and also with a SoC customer on a next-generation vertical probe technology. In the first quarter of our fiscal 2013, we announced that we suspended development activities specific to our next generation Matrix platform and would consolidate our technologies and development to extend the capabilities of the current Matrix platform. If this consolidation does not extend the capabilities of our products as anticipated, we may lose sales and our financial results will be negatively impacted. In 2013, we also scaled back our efforts on our next-generation vertical probe technology. In 2013, we increased our activities and spending on the development of a new NAND Flash wafer probe card architecture and have engagements with two customers to deliver products based on the new architecture. If we do not successfully develop and deliver production evaluation probe cards for these two customers, and if these or other customers do not qualify the product and purchase the product for NAND Flash wafer test, it could negatively impact our revenues and margins and harm our business.
Periodic global economic and semiconductor industry downturns could continue to negatively affect our business, results of operations, and financial condition.
The recent and historical global economic and semiconductor industry downturns negatively affected and could continue to negatively affect our business, results of operations and financial condition. We may experience continued declines in demand for our probe cards resulting from our customers continuing to conserve cash by cutting production, postponing the implementation of tooling cycles and delaying the ramp of new technology nodes in response to slow demand for consumer and other products incorporating devices tested with our wafer probe cards. We may experience continued pricing pressure on certain of our products, which may reduce our gross margins. A protracted downturn could cause additional customers to file for bankruptcy protection as occurred in 2009 with our customers Spansion and Qimonda, and in 2012 with our customer Elpida, resulting in our loss of revenue. In the past environment, customers were seeking extended payment terms or delaying payment for our products past their original due dates, which could impact their payment histories resulting in our deferral of revenue and which could increase our potential bad debt exposure.
We may also experience the insolvency of key suppliers, leading to delays in the development and shipment of our products, increased expense and loss of revenue. In addition, we may experience increased impairment charges due to declines in the fair values of marketable debt securities, or charges based upon underutilization of our factory.
We derive a substantial portion of our revenues from a small number of customers, and we could continue to experience significant declines in our revenues if any major customer cancels, reduces, delays a purchase of, or does not place a projected order for our products, or does not pay us, or delays or extends payment for our products past their original due dates.
A relatively small number of customers have accounted for a significant portion of our revenues in any particular period.
Three
customers represented
46%
of total revenues in fiscal
2013
,
three
customers represented
55%
of total revenues in fiscal
12
2012
and
three
customers represented
47%
of total revenues in fiscal
2011
. In fiscal
2013
,
2012
and
2011
, our ten largest customers accounted for
75%
,
80%
and
82%
of our revenues, respectively. We anticipate that sales of our products to a relatively small number of customers will continue to account for a significant portion of our revenues. Consolidation in the semiconductor industry may increase this concentration. As a result of the global economic and semiconductor industry downturns, we have experienced significant declines in our revenues. In the future, the cancellation, reduction or deferral of even a small number of purchases of our products could significantly reduce our revenues in any particular period. Cancellations, reductions or deferrals could result from a delay in the recovery of the semiconductor industry, a weaker than anticipated recovery, another downturn in the semiconductor industry, or from manufacturing delays, quality or reliability issues with our products, or from interruptions to our customers' operations due to fire, natural disasters or other events. Furthermore, because our probe cards are custom products designed for our customers' unique wafer designs, any cancellations, reductions or delays can result in significant, non-recoverable costs. In some situations, our customers might be able to cancel or reduce orders without a significant penalty.
Our customers could also fail to pay all or part of an invoice for our products. If a customer fails to pay us or delays payment for our products, we may be unable to recognize revenue, our financial condition and liquidity could be adversely impacted and we may incur additional charges for bad-debt reserve to the extent certain of our customers continue to face financial difficulties during this downturn. It is also possible that if we make the decision to initiate legal proceedings against customers to seek payment of outstanding receivables, it will negatively impact a customer relationship and result in lost revenues in the future. As happened with our customer ProMos Technologies, customers with financial difficulties may be forced to materially reduce or discontinue operations, file for bankruptcy or other relief, or may be acquired by one of our other customers, any of which would further reduce our customer base and/or result in the loss of revenues.
The markets in which we participate are competitive, and if we do not compete effectively, our operating results could be harmed.
We are experiencing increased competition in the wafer probe card market and we expect competition to intensify in the future. Increased competition has resulted in, and in the future is likely to result in, price reductions, reduced gross margins or loss of market share. Competitors might introduce new competitive products for the same markets that our products currently serve. These products may have better performance, lower prices and/or broader acceptance than our products. Competitive products may not have better performance, lower prices and/or broader acceptance than our products, but may be able to meet shorter delivery times required by customers and result in the loss of revenue for us. In addition, for products such as wafer probe cards, semiconductor manufacturers typically qualify more than one source to avoid dependence on a single source of supply. As a result, our customers would likely purchase products from our competitors. Current and potential competitors include Advantest Corporation, AMST Co., Ltd., BucklingBeam Solutions, Cascade Microtech, Inc., Feinmetall GmbH, Korea Instrument Co., Ltd., Japan Electronic Materials Corporation, SV Probe, Inc., Micronics Japan Co., Ltd., Microfriend Inc., Soulbrain Engineering, Technoprobe, TSE Co., Ltd., Wentworth Laboratories, Inc., and Will Technology Co., Ltd, among others.
Many of our current and potential competitors have greater name recognition, larger customer bases, more established customer relationships or greater financial, technical, manufacturing, marketing and other resources than we do. As a result, they might be able to respond more quickly to new or emerging technologies and changes in customer requirements, devote greater resources to the development, promotion, sale and support of their products, and reduce prices to increase market share. Some of our competitors also supply other types of test equipment. Those competitors that offer both advanced wafer probe cards and needle probe cards might have strong, existing relationships with our existing customers or with potential customers. It is possible that one or more of our competitors may be able to increase their sales to with mutual customers, resulting in a loss of revenue share for us. It is further possible that existing or new competitors, including test equipment manufacturers, may offer new technologies that reduce the value of our wafer probe cards.
If we fail to protect our proprietary rights, our competitors might gain access to our technology, which could adversely affect our ability to compete successfully in our markets and harm our operating results.
If we choose not to protect our proprietary rights or fail in our efforts to protect our proprietary rights, our competitors might gain access to our technology. Unauthorized parties might attempt to copy aspects of our products or to obtain and use information that we regard as proprietary. Others might independently develop similar or competing technologies or methods or design around our patents. In addition, the laws of many foreign countries in which we or our customers do business do not protect our intellectual property rights to the same extent as the laws of the United States. To date, we have not been successful in our efforts to enforce our proprietary rights and obtain injunctive relief for violation of those rights in South Korea and in the United States. As a result, our proprietary rights could be compromised, our competitors might offer products similar to ours and we might not be able to compete successfully. We also cannot assure that:
|
•
|
our means of protecting our proprietary rights will be adequate;
|
13
|
•
|
patents will be issued from our pending or future applications;
|
|
•
|
our existing or future patents will be sufficient in scope or strength to provide any meaningful protection or commercial advantage to us;
|
|
•
|
our patents or other intellectual property will not be invalidated, circumvented or successfully challenged in the United States or foreign countries; or
|
|
•
|
others will not misappropriate our proprietary technologies or independently develop similar technologies, duplicate our products or design around any of our patents or other intellectual property, or attempt to manufacture and sell infringing products in countries that do not strongly enforce intellectual property rights.
|
We have spent in the past, and may be required to spend in the future, significant resources to monitor and protect our intellectual property rights. We presently believe it is likely that several of our competitors are using methodologies or have implemented structures into certain of their products that are covered by one or more of our intellectual property rights.
In certain cases, our competitors have initiated re-examination proceedings in the USPTO and invalidity proceedings in foreign patent offices against certain of our patents. Any litigation, whether or not resolved in our favor, and whether initiated by us or by a third party, could result in significant and possibly material expense to us and divert the efforts of our management and technical personnel. In addition, while patents are territorial and a ruling on a certain given patent does not necessarily impact the validity or enforceability of a corresponding or related patent in a different country, an adverse ruling in one country might negatively impact our ability to enforce the corresponding or related patent in other countries. Certain of our customer contracts contain provisions that require us to defend and/or indemnify our customers for third party intellectual property infringement claims, which would increase the cost to us of an adverse ruling in such a claim. An adverse determination could also negatively impact our ability to license certain of our technologies and methods to others, and result in our competitors being allowed to sell products with, or add to their products, features and benefits contained in our products, thereby reducing our competitive advantages over these competing products.
If we do not innovate and keep pace with technological developments in the semiconductor industry, our products might not be competitive and our revenues and operating results could suffer.
We must continue to innovate and to invest in research and development to improve our competitive position and to meet the testing requirements of our customers. Our future growth depends, in significant part, upon our ability to work effectively with and anticipate the testing needs of our customers and to develop and support new products and product enhancements to meet these needs on a timely and cost-effective basis. Our customers' testing needs are becoming more challenging as the semiconductor industry continues to experience rapid technological change driven by the demand for complex circuits that are shrinking in size, are increasing in speed and functionality and also becoming less expensive to produce. Examples of trends driving demand for technological research and development include semiconductor manufacturers' transition to 2x nanometer DRAM technology node, Flash and SoC fabrication process nodes, transition to higher gigabit density memory and lower-power multi-core processors, and rapid adoption of advanced IC packaging types, such as wafer-level packaging, Flipchip, Cu Pillar, and Through-Silicon-Via (TSV) technologies. Our customers expect that they will be able to integrate our wafer probe cards into any manufacturing process as soon as it is deployed. Therefore, to meet these expectations and remain competitive, we must continually design, develop and introduce on a timely basis new products and product enhancements with improved features.
We may also work collaboratively with one or more third parties in the development of new technologies or in improvements to our existing technologies. It is possible that these collaborations may be delayed, or even ultimately prove unsuccessful, by matters outside of our control, such as the financial condition of the third party. It is possible that our internal development efforts and engagements with third parties regarding the development of manufacturing equipment having similar functionality may have a lengthy development and ramp up time and negatively impact our ability to complete new products and realize revenue from those products.
Successful product design, development and introduction on a timely basis require that we:
|
•
|
design innovative and performance-enhancing product architectures, technologies and features that differentiate our products from those of our competitors;
|
|
•
|
in some cases engage with third parties who have particular expertise in order to complete one or more aspects of the design and manufacturing process;
|
|
•
|
qualify with the customer(s) the new product, or an existing product incorporating new technology;
|
14
|
•
|
transition our products to new manufacturing technologies;
|
|
•
|
identify emerging technological trends in our target markets;
|
|
•
|
maintain effective marketing strategies;
|
|
•
|
respond effectively to technological changes or product announcements by others; and
|
|
•
|
adjust to changing market conditions quickly and cost-effectively.
|
Not only do we need the technical expertise to implement the changes necessary to keep our technologies current, but we must also rely heavily on the judgment of our management to anticipate future market trends. If we are unable to timely predict industry changes or industry trends, or if we are unable to modify our products or design, manufacture and deliver new products on a timely basis, or if a third party with which we engage does not timely deliver a component or service for one of our product modifications or new products, we might lose customers or market share. In addition, we might not be able to recover our research and development expenditures, which could harm our operating results.
Changes in customers' test strategies, equipment and processes could cause us to lose revenues.
The demand for wafer probe cards depends in large part upon the number of semiconductor designs, the pace of technology and architecture transitions in chip designs and overall semiconductor unit volume. The time it takes to test a wafer depends upon the number of devices being tested, the complexity of these devices, the test software program and the test equipment itself. As test programs become increasingly effective and test throughput increases, the number of wafer probe cards required to test a given volume of devices declines. Therefore, advances in the test process could cause us to lose sales. Further, many semiconductor manufacturers are implementing chip designs featuring BIST capabilities or similar "design for testability", or DFT, functions or methodologies that increase test throughput and reduce the cost of test. These efforts include strategies to reduce the technical requirements on test equipment, or to improve data about device performance early in the manufacturing process, or to test the device later in the manufacturing process for quality assurance purposes. In some cases, BIST or DFT can create opportunities for our technologies. In other cases BIST or DFT can reduce requirements for wafer level test and reduce our opportunities. Although we seek to work with our customers to show ways that our technologies can be applied together with BIST and DFT approaches to create opportunities to further reduce the cost of test, the overall impact of BIST and DFT technologies, as they exist today and as they may be developed in the future, could slow the migration to wafer level testing and adversely affect our revenues.
Similar results could occur if new chip designs are implemented which we are unable to test efficiently, or if semiconductor manufacturers reduce generally the amount or degree of wafer test they perform. We incur significant research and development expenses in conjunction with the introduction of new product architectures and platforms. Often, we time our product introductions to the introduction of new test equipment platforms or to enable a manufacturer's test roadmap when it elects to retain existing test platforms but requires certain test throughput. Because our customers require both test equipment and wafer probe cards, any delay or disruption in the introduction of new test equipment platforms would negatively affect our growth.
Changes in customers' product roadmaps and the timelines associated with those roadmaps could negatively impact our product development effort and new product introductions, which could in turn, cause us to lose revenues.
The demand for wafer probe cards depends in large part upon the demand for semiconductor devices and our customers' product roadmaps. For example, the DRAM market continued to be impacted negatively in fiscal 2013 as secular changes in the personal computer markets significantly lowered demand for commodity DRAM. The trend is forecasted by some of our customers and by some industry analysts to continue into 2014, which has resulted in certain customers planning lower investment in DRAM test and lower spending on DRAM probe cards for commodity DRAM application. As a consequence, we may make changes to our operational or R&D activities to reduce the breadth of our investments in certain of our products. For example, in the first quarter of fiscal 2013, we announced that we suspended development activities specific to our next generation Matrix platform and will consolidate our technologies and development to extend the capabilities of the current Matrix platform. These changes were implemented in light of the lower demand for commodity DRAM. If this consolidation is not successful, or does not extend the capabilities of our products as anticipated, we may lose sales and our financial results will be negatively impacted.
We have recorded significant restructuring, inventory write-offs and asset impairment charges in the past and may do so again in the future, which could have a material negative impact on our business.
We recorded material restructuring charges related to our global workforce reductions and impairment charges related to our long-lived assets in fiscal
2013
, fiscal
2012
, and fiscal
2011
. In January 2014, we implemented an organizational
15
restructuring and cost reduction plan to improve our efficiency and effectiveness while better positioning the company for profitability. As we continue to align our operations with our business requirements, we may implement additional cost reduction actions, which would require us to take additional, potentially material, restructuring charges related to employee terminations, asset disposal or exit costs. We may also be required to write off additional inventory if our product build plans or usage of inventory experience further declines, and such additional write-offs could constitute material charges. In addition, significant adverse changes in market conditions could require us to take additional material impairment charges related to our long-lived assets. Our long-lived assets, including intangible assets, are amortized over their respective estimated useful lives using the straight-line and accelerated methods and are reviewed for impairment annually, or whenever events or changes in circumstances indicate that their carrying amount may not be recoverable. The valuation of our long-lived assets requires assumptions and estimates of many critical factors, including revenue and market growth, operating cash flows, market multiples, and discount rates. Other adverse changes in market conditions, particularly if such changes have the effect of changing one of the critical assumptions or estimates we use in our assessment of the recoverability of our long-lived assets could result in a change to the estimation of fair value that could result in future impairment charges. We may also incur charges for factory underutilization depending upon the demand for our products and factory capacity. Any such additional material charges, whether related to restructuring, asset impairment or factory underutilization may have a material negative impact on our operating results and related financial statements.
Our recent restructuring plans may not have properly aligned our cost structure with our business needs and overall semiconductor industry requirements and even though completed may adversely affect our business, financial condition, or operating results.
In each of fiscal 2009 through 2013 and into 2014, we conducted reductions in our work force as part of company-wide organizational restructurings or cost reduction plans. These plans were intended to help focus our resources more strategically towards business needs and industry requirements. We expect to realize cost savings from these restructuring actions. Our business, financial condition and operating results could be materially adversely affected if we experience unanticipated inefficiencies as a result of our restructuring activities, unanticipated or product delivery or quality issues resulting in impaired customer relationships caused by reduced headcount, or delay in ramping the manufacture of our products or delay in our development, introduction and qualification of our new products and technologies. We cannot ensure we will not undertake additional workforce reductions, that any of our restructuring efforts will be successful, or that we will be able to realize the cost savings and other anticipated benefits from our previous or future restructuring plans. Any of these issues could render our restructuring plan ineffective, which could have a material adverse effect on our business, financial condition, or operating results.
If we do not continue to take steps to optimize the structure of our operations to position our company for long-term, profitable growth, we might not succeed.
The timing, length and severity of the cyclical downturns in the semiconductor industry are difficult to predict. This cyclicality affects our ability to accurately predict our future operating results and plan our business, and could also impair the value of our tangible and intangible assets. We implemented global cost reduction plans in each fiscal year from 2009 through
2013
, in January 2014, and are continuing to pursue measures to improve our operating efficiency. Such measures have included workforce reductions, the implementation of a shared service center, the consolidation of manufacturing capacity, the centralization of support functions to regional and global shared service centers and the combining of the technical and manufacturing teams across multiple product lines. If we do not continue to implement measures for optimizing our financial model for prevailing market conditions, our competitiveness could be seriously harmed, our ability to invest in our business for future growth may be negatively impacted and our company might not succeed. If we do not successfully structure our operations by, for example, strengthening our local application and service capabilities to improve customer responsiveness, changing our manufacturing structure for shorter cycle time and improved product delivery capabilities, and realigning our research and development efforts, and continue to motivate and retain our key employees, we may experience continued deterioration in our business and our company might not succeed. In addition, as the business environment improves, if we are unable to proactively and effectively manage our operations and/or realign our controls, systems and infrastructure to changing business conditions, we may not be in a position to boost our personnel, manufacturing capacity, service capabilities and productivity, and support growth in response to increasing customer demand for our products, which would, in turn, have a negative impact on our operating results. Adverse general economic conditions may also impair the recovery of our business.
Our pricing for our products could result in certain customers deciding to not purchase our products, which could negatively impact our business and financial results.
We believe that our pricing guidelines are consistent with normal industry cost learning curves, but certain customers may in the future react negatively to our pricing and elect to not purchase our products, to purchase fewer of our products as compared to those of our competitors, or to phase out the purchase of our products, in which case our business, financial condition and operating results could be materially and adversely impacted.
16
Changes in our tax rates, inability to realize our deferred tax assets or exposure to additional tax liabilities could adversely affect our operating results.
We are subject to income taxes in both the United States and various foreign jurisdictions, and our domestic and international tax liabilities are subject to the allocation of expenses in different jurisdictions. The amount of income taxes we pay are subject to audits in various jurisdictions and a material assessment by a governing tax authority could adversely affect our operating results. Our effective tax rate could be adversely affected by changes in the mix of earnings in countries with different statutory tax rates or changes in tax laws. Realization of our deferred tax assets, which are predominantly in the United States, is dependent on our ability to generate sufficient future taxable income. In 2010, we determined that we would not be able to realize some portion of our deferred tax assets in the future, so we recorded a valuation allowance against the deferred tax assets that resulted in additional income tax expense. This valuation allowance does not limit our ability to utilize our federal and state deferred tax assets to offset future U.S. profits. The valuation allowance remains in effect as of
December 28, 2013
.
Environmental and other disasters, such as flooding, earthquakes, volcanic eruptions or leakage from nuclear reactors, or a combination thereof, may negatively impact our business.
Our business is vulnerable to the direct and indirect impact of environmental and other disasters, such as the March 2011 earthquake off the coast of Japan and the resulting tsunami and disaster at certain nuclear power plants in Japan. For instance, while our design operations in Tokyo, Japan, and our repair facilities in Yokohama, Japan and Hiroshima, Japan were all not damaged by the March 2011 disasters in Japan, it is possible that our operations could be impacted in the future by the consequences of those events or similar future events. The facilities of certain of our suppliers, including suppliers of our ceramics, our printed circuit boards and certain of our mechanical parts, are located in Japan. While our suppliers did not report any significant damage to their facilities and they resumed operations consistent with the power usage guidelines in their respective areas, the supply chains for certain of our suppliers were negatively impacted. Additionally, the 2012 flooding in Thailand negatively impacted the operations of several disk drive manufacturers, which created a shortage of disk drives available for incorporation into personal computers. This disk drive shortage resulted in a slowing of the manufacture of personal computers and for the DRAM incorporated into personal computers. It is possible that future acts of terrorism, environmental events or natural disasters, such as earthquakes and aftershocks, and infrastructure events arising out of such occurrences and disasters, could negatively impact our suppliers’ ability to supply components to us on a timely basis. Any such delays in supplying or delivering components to us could, and any catastrophic loss suffered by our key suppliers would likely, disrupt our operations, delay production and shipments and adversely affect our revenues and business. Similarly, any catastrophic loss at our California facilities, such as from an earthquake, would materially and adversely affect our business.
Cyclicality in the semiconductor industry may adversely impact our sales in the future, and as a result we have experienced and may continue to experience reduced revenues and operating results.
The semiconductor industry has historically been cyclical and is characterized by wide fluctuations in product supply and demand. From time to time, this industry has experienced significant downturns, often in connection with, or in anticipation of, maturing product and technology cycles, excess inventories and declines in general economic conditions. The global economic and semiconductor downturns have caused and may continue to cause our operating results to decline dramatically from one period to the next. Our business depends heavily upon the development and manufacture of new semiconductors, the rate at which semiconductor manufacturers make transitions to smaller nanometer technology nodes and implement tooling cycles, the volume of production by semiconductor manufacturers and the overall financial strength of our customers, which, in turn, depend upon the current and anticipated market demand for semiconductors and products, such as personal computers and cell phones, that use semiconductors. During industry downturns, semiconductor manufacturers generally sharply curtail their spending, including their equipment spending, and defer their adoption of emerging technologies and historically have lowered their spending disproportionately more than the decline in their revenues. This is particularly true when there is a point during an industry cycle in which the semiconductor manufacturers' costs related to semiconductor devices approach or exceed the sales price of the devices. As a result, we would experience reduced revenues due to the decreased demand for our wafer probe cards by our semiconductor manufacturer customers. Accordingly, if we are unable to adjust our levels of manufacturing and human resources or manage our costs and deliveries from suppliers in response to lower spending by semiconductor manufacturers, our gross margin may decline and cause us to experience further operating losses.
If we are unable to efficiently manufacture our existing probe card products and our new probe card products, our business may be materially adversely affected.
We must continuously improve our manufacturing processes in an effort to increase yields and product performance, lower our costs and reduce the time required for us to design, manufacture and deliver our products in volume. If we cannot, both our existing products and our new products may not be commercially successful, our revenues may be adversely affected, our customer relationships and our reputation may be harmed and our business may be materially adversely affected. To
17
improve our manufacturing processes, we have incurred, and may incur in the future, substantial costs in an effort to optimize capacity and yields, implement new manufacturing technologies, methods and processes, purchase new equipment, upgrade existing equipment and train technical personnel. We have experienced, and may experience in the future, manufacturing delays and other inefficiencies in connection with implementation of these improvements and customer qualifications of new processes, which have caused and could cause in the future, our operating results to decline.
We have also experienced, and may experience in the future, difficulties in manufacturing our complex products in volume on time and at acceptable yields and cost and installation issues in the field due to complexity of customer design requirements, including integration of wafer probe cards with varying customer test cell environments and testing of semiconductor devices over a wide temperature range. For example, we experienced challenges transitioning our Harmony architecture-based products from a lower-volume, engineering-assisted process to a high-volume manufacturing process. These problems resulted in missed opportunities with customers. While we ramped commercial volume manufacturing of our Matrix architecture products at a significantly greater rate than our Harmony architecture products, design and manufacturing delays related to our Matrix architecture products resulted in qualification at certain customers taking longer than we anticipated. Once a new product or technology is qualified, if we are unable to timely and efficiently expand our manufacturing capacity and ramp volume production to meet customer demand, our operating results will be negatively impacted. Delayed qualification caused and could continue to cause lost sales opportunities. This increases our vulnerability to our competitors and the likelihood that our customers will seek solutions from other suppliers or to develop solutions themselves. If demand for our products decreases, we could have excess manufacturing capacity. The fixed costs associated with excess manufacturing capacity could cause our operating results to decline. If we are unable to achieve further manufacturing efficiencies and cost reductions, particularly if we are experiencing pricing pressures in the marketplace, our operating results could suffer.
Consolidation in the industry and within the semiconductor test equipment market could adversely affect the market for our products and negatively impact our ability to compete, which could cause a decline in our revenues.
Consolidation in the semiconductor industry, particularly among manufacturers of DRAM devices, such as Micron Technology, Inc.'s 2013 acquisition of Elpida Memory, Inc., would reduce our customer base and could adversely affect the market for our products, which could cause a decline in our revenues. The global economic downturn caused significant disruption within the semiconductor industry. The semiconductor industry now has a smaller customer base than in past years. The loss of additional customers could further concentrate, and could adversely affect, the market for our products. Consolidation may lead to lost or delayed sales, reduced demand for our wafer probe cards, loss of market share and increased pricing pressures. Additionally, certain customers may not want to rely entirely or substantially on a single wafer probe card supplier and, as a result, such customers could reduce their purchases of our wafer probe cards.
There has also been a recent move toward consolidation within the semiconductor test equipment market. For example, in 2010, after Verigy announced intent to combine with LTX Credence, a tester company, Advantest Corporation, made a successful unsolicited bid to acquire Verigy. In 2013, Applied Materials, Inc. and Tokyo Electron Ltd., a semiconductor equipment manufacturer that, among other products, manufactures semiconductor test probers announced a business combination that would merge two of the three largest chip equipment companies in the world. This consolidation trend could change our interactions and relationships with semiconductor tester and prober companies and negatively impact our revenue and operating results.
We depend upon the sale of our wafer probe cards for substantially all of our revenues, and the majority of our wafer probe cards are utilized by semiconductor manufacturers for testing SoC and DRAM devices. If we continue to experience a downturn in demand for our SoC and DRAM products, our revenues could decline further.
We have historically derived substantially all of our revenues from the sale of our wafer probe cards to manufacturers of DRAM, flash memory devices, and microprocessor, chipset and other SoC devices. Subsequent to the acquisition of MicroProbe in October 2012, our revenues for fiscal 2013 have substantially been derived from the sale of our wafer probe cards to manufacturers of SoC and DRAM devices.
For fiscal
2013
,
2012
and
2011
, sales to manufacturers of SoC devices accounted for
50%
,
26%
and
17%
, respectively, of our revenues. Sales to manufacturers of DRAM devices accounted for
40%
,
57%
and
68%
, respectively, and sales to manufacturers of flash memory devices accounted for
10%
, 17% and
15%
, respectively. We anticipate that sales of our wafer probe cards will represent a substantial majority of our revenues for the foreseeable future. Our success depends in large part upon the continued acceptance of our products within these markets and our ability to continue to develop and introduce new products that meet our customers' requirements on a timely basis for these markets. In particular, to continue to grow our business, we need to gain additional market share with manufacturers of Flash memory and SoC devices. To the extent that we are unable to realize cost reductions and manufacturing efficiencies in the production of our wafer probe cards, or if we are not able to timely deliver our products, our revenues and business operations could be adversely impacted and our ability to grow could suffer. In the NAND Flash market, we are continuing the development of our new NAND Flash product. In the second
18
half of 2013 and into 2014, we increased our activities on the development of a new NAND Flash wafer probe card architecture and have engagements with two customers to deliver products based on the new architecture. If we do not successfully develop and deliver production evaluation probe cards for these two customers, and if these or other customers do not qualify the product and purchase the product for NAND Flash wafer test, it could negatively impact our revenues and margins and harm our business. As our next generation wafer probe cards are used in greater volume in commercial production, it is possible that we will identify certain areas of technical performance that require improvement, and if we are unable to continually, efficiently and in a timely manner improve our products, we could suffer reduced demand for our products and our operating results could be harmed.
If chip manufacturers fail to make architecture, node or technology transitions as we anticipate, or if anticipated or announced transitions are delayed, it could adversely impact our revenues and operating results. In addition, we might not be able to sustain or increase our revenues from sales of our wafer probe cards, particularly if conditions in the semiconductor market do not improve or if the market enters another downturn. Any decrease in revenues from sales of our wafer probe cards could harm our business.
If our relationships with our customers and companies that manufacture semiconductor test equipment deteriorate, our product development activities could be harmed.
The success of our product development efforts depends upon our ability to anticipate market trends and to collaborate closely with our customers and with companies that manufacture semiconductor test equipment. Our relationships with these customers and companies provide us with access to valuable information regarding manufacturing and process technology trends in the semiconductor industry, which enables us to better plan our product development activities. These relationships also provide us with opportunities to understand the performance and functionality requirements of our customers, which improve our ability to customize our products to fulfill their needs. Our relationships with test equipment companies are important to us because test equipment companies can design the use of our wafer probe cards into their equipment and provide us with the insight into their product plans. This cooperation allows us to offer wafer probe cards for use with the test equipment companies' products when they are introduced to the market as opposed to several months or more later, which would negatively impact our revenues.
Our relationships with our customers and test equipment companies could deteriorate if they:
|
•
|
become concerned about our ability to protect their intellectual property;
|
|
•
|
become concerned with our ability to deliver quality products on a timely basis;
|
|
•
|
develop their own solutions to address the need for testing improvement;
|
|
•
|
implement chip designs that include enhanced built-in self-test capabilities;
|
|
•
|
regard us as a competitor;
|
|
•
|
introduce their own wafer probe card product;
|
|
•
|
establish relationships with others in our industry;
|
|
•
|
acquire or invest in a competitive wafer probe card manufacturer or enter into a business venture with a competitive wafer probe card manufacturer; or
|
|
•
|
attempt to restrict our ability to enter into relationships with their competitors.
|
Many of our customers and the test equipment companies we work with are large companies. The consequences of deterioration in our relationship with any of these companies could be exacerbated due to the significant influence these companies can exert in our markets. If our current relationships with our customers and test equipment companies deteriorate, or if we are unable to develop similar collaborative relationships with important customers and test equipment companies in the future, our long-term ability to produce commercially successful products could be impaired.
Because we generally do not have a sufficient backlog of unfilled orders to meet our quarterly revenue targets, revenues in any quarter are substantially dependent upon customer orders received and fulfilled in that quarter.
Our revenues are difficult to forecast because we generally do not have sufficient backlog of unfilled orders to meet our quarterly revenue targets at the beginning of a quarter. Rather, a substantial percentage of our revenues in any quarter depend upon customer orders for our wafer probe cards that we receive and fulfill in that quarter. Because our expense levels are based in part on our expectations as to future revenues and to a large extent are fixed in the short term, we might be unable to adjust
19
spending in time to compensate for any unexpected shortfall in revenues. Accordingly, any significant shortfall of revenues in relation to our expectations could hurt our operating results.
We manufacture substantially all our products at our facilities in Livermore, San Jose, and Carlsbad, California, and any disruption in the operations of these facilities or our customer's manufacturing facilities could adversely impact our business and operating results.
Certain of our manufacturing processes and our customers' processes require sophisticated and expensive equipment and specially designed facilities, including semiconductor clean rooms. We manufacture the majority of our wafer probe cards at our facilities located in Livermore, San Jose, and Carlsbad, California. Any disruption in our manufacturing, whether due to contamination in our manufacturing process, technical or labor difficulties, destruction or damage from fire or earthquake, infrastructure failures such as power or water shortage or any other reason, could interrupt our operations, impair critical systems, disrupt communications with our customers and suppliers, and cause us to write off inventory, thereby potentially resulting in the loss of revenues. In addition, if the previous energy crises in California that resulted in disruptions in power supply and increases in utility costs were to recur, we might experience power interruptions and shortages, which could disrupt our manufacturing operations. This could subject us to loss of revenues as well as significantly higher costs of energy. Further, current and potential customers might not purchase our products if they perceive our lack of a fully operational alternate manufacturing facility to be a risk to their continuing source of supply. Similarly, any of these events, such as contamination, fire, power or water shortage and labor strike could interrupt our customer's operations thereby potentially resulting in the loss of revenues to our company.
If we are unable to continue to reduce the time it takes for us to design and produce a wafer probe card, our growth could be impeded.
Our customers continuously seek to reduce the time it takes them to introduce new products to market. The cyclicality of the semiconductor industry, coupled with changing demands for semiconductor devices, requires our customers to be flexible and highly adaptable to changes in the volume and mix of products they must produce. Each of those changes requires a new design and each new design requires a new wafer probe card. For some existing semiconductor devices, the manufacturers' volume and mix of product requirements are such that we are unable to design, manufacture and ship products to meet manufacturers' relatively short cycle time requirements. We have lost sales in the past where we were unable to meet a customer's required delivery schedule for wafer probe cards for a particular design. If we are unable to reduce the time it takes for us to design, manufacture and ship our products in response to the needs of our customers, our competitive position could be harmed and we could lose sales. If we are unable to grow design and manufacturing capacity in the event demand increases, our ability to respond to customer requirements could be challenged and our revenues could be negatively impacted.
We obtain some of the components and materials we use in our products from a sole source or a limited group of suppliers, and the partial or complete loss of one of these suppliers could cause production delays and a substantial loss of revenues.
We obtain some of the components and materials used in our products, such as printed circuit board assemblies, plating materials and ceramic substrates, from a sole source or a limited group of suppliers. Alternative sources are not currently available for sole source components and materials. Because we rely on purchase orders rather than long-term contracts with the majority of our suppliers, we cannot predict with certainty our ability to obtain components and materials in the longer term. A sole or limited source supplier could increase prices, which could lead to a decline in our gross margin. Our dependence upon sole or limited source suppliers exposes us to several other risks, including inability to obtain an adequate supply of materials, late deliveries and poor component quality.
In addition, the ability of any of these suppliers to timely provide us with sufficient quality materials would be adversely affected if they are forced to reduce or discontinue operations due to financial difficulties. Disruption or termination of the supply of components or materials could delay shipments of our products, damage our customer relationships and reduce our revenues. For example, if we were unable to obtain an adequate supply of a component or material, we might have to use a substitute component or material, which could require us to make changes in our manufacturing process and could also require us to re-qualify impacted product at certain customers. From time to time, we have experienced difficulties in receiving shipments from one or more of our suppliers, especially during periods of high demand for our products. If we cannot obtain an adequate supply of the components and materials we require, or do not receive them in a timely manner, we might be required to identify new suppliers.
We might not be able to identify new suppliers on a timely basis or at all. We, as well as our customers, would also need to qualify any new suppliers. The lead-time required to identify and qualify new suppliers could affect our ability to timely ship our products and cause our operating results to suffer. Further, a sole or limited source supplier could require us to enter into non-cancelable purchase commitments, minimum volume purchases or pay in advance to ensure our source of supply. In an
20
industry downturn or in an environment in which growth is not at a level we projected or anticipated, commitments of this type could result in charges for excess inventory of parts.
Further, if a customer's needs for a particular probe card design and purchase orders for those probe cards are spread out over several months as opposed to being placed at one time in a single purchase order, it may cause us to purchase excessive materials or components in light of minimum purchase requirements or to be unable to realize volume discounts for materials or components because of the lack of visibility into the customer's overall purchase plan. These purchase issues would require us to incur a greater cost of goods sold than we might otherwise realize. These issues are also magnified in those situations in which the supplied material or component is a custom component for a unique customer probe card design. Additionally, if we are unable to predict our component and materials needs accurately, or if our supply is disrupted, we might miss market opportunities by not being able to meet the demand for our products.
Wafer probe cards that do not meet specifications or that contain defects could damage our reputation, decrease market acceptance of our technology, cause us to lose customers and revenues, and result in liability to us.
The complexity and ongoing development of our wafer probe card manufacturing process, combined with increases in wafer probe card production volumes, have in the past and could in the future lead to design or manufacturing problems. For example, we have experienced the presence of contaminants in our plating baths, which have caused a decrease in our manufacturing yields or have resulted in unanticipated stress-related failures when our wafer probe cards are being used in the manufacturing test environment. This contamination problem caused a yield decline that, in turn, resulted in our inability to timely ship products to our customers. Manufacturing design errors such as the mis-wiring of a wafer probe card or the incorrect placement of probe contact elements have caused us to repeat manufacturing design steps. In addition to these examples, problems might result from a number of factors, including design defects, materials failure, failure of components manufactured by our suppliers to meet our specifications, contamination in the manufacturing environment, impurities in the materials used, and unknown sensitivities to process conditions such as temperature and humidity, and equipment failures. As a result, our products have in the past contained and might in the future contain undetected errors or defects. Any errors or defects could:
|
•
|
cause lower than anticipated yields and lengthen delivery schedules;
|
|
•
|
cause delays in product shipments;
|
|
•
|
cause delays in new product introductions;
|
|
•
|
cause us to incur warranty expenses;
|
|
•
|
result in increased costs and diversion of development resources;
|
|
•
|
cause us to incur increased charges due to unusable inventory;
|
|
•
|
require design modifications; or
|
|
•
|
decrease market acceptance or customer satisfaction with these products.
|
The occurrence of any one or more of these events could adversely affect our operating results.
In addition, if any of our products fails to meet specifications when installed in the customer's test environment, or has reliability, quality or compatibility problems, our reputation could be damaged significantly and customers might be reluctant to buy our products, which could result in a decline in revenues, an increase in product returns or warranty costs and the loss of existing customers or the failure to attract new customers. For example, in mid-2013, we experienced certain supply chain and manufacturing challenges that impacted critical deliveries for a key DRAM customer in Japan in the third quarter. These delays and manufacturing challenges not only impacted in-quarter short-term revenue, but also resulted in our loss of future orders and required us to implement programs to re-establish ourselves as a key supplier to the customer and resulted in increased warranty costs. These consequences negatively impacted our operating results.
Our customers use our products with test equipment and software in their manufacturing facilities. Our products must be compatible with the customers' equipment and software to form an integrated system. While we have designed our test capabilities and standards to replicate the actual test environment of our customers and continually work to improve our capabilities, it is possible that our wafer probe card will perform differently in the customers' actual test environments. If our wafer probe card does not function properly within a customer's specific test environment, we could be required to provide field application engineers to locate the problem, which can take time and resources. If the problem relates to our wafer probe cards, we might have to invest significant capital, manufacturing capacity and other resources to correct it. Our current or
21
potential customers also might seek to recover from us any losses resulting from defects or failures in our products. Liability claims could require us to spend significant time and money in litigation or to pay significant damages.
If our ability to forecast demand for our products or the predictability of our manufacturing yields deteriorates, we could incur higher inventory losses than we currently experience.
Each semiconductor chip design requires a custom wafer probe card. Because our products are design-specific, demand for our products is difficult to forecast. Due to our customers' short delivery time requirements, we often design and procure materials and, at times, produce our products in anticipation of demand for our products rather than in response to an order. Our manufacturing yields, particularly for new DRAM and Flash memory wafer probe cards, have historically been unpredictable and consequently, we generally produce more components for probe cards, or actual probe cards, than forecasted demand. If we do not obtain orders as we anticipate, or if we produce excess inventory to compensate for unpredictable manufacturing yields, we could have excess or obsolete inventory for a specific customer design that we would not be able to sell to any other customer, which would likely result in inventory write-offs or material charges for scrap.
If we fail to maintain an effective system of internal and disclosure controls, we may not be able to accurately report our financial results or prevent fraud, which may adversely affect our business and reputation. In addition, current and potential stockholders could lose confidence in our financial reporting, which may adversely impact the trading price of our securities.
Effective internal and disclosure controls are necessary for us to provide reliable financial reports, to prevent fraud and to operate successfully as a public company. If we cannot provide reliable financial reports or prevent fraud, our business and reputation may be harmed. We regularly review and assess our internal controls over financial reporting and our disclosure controls and procedures. As part of that process, we may discover material weaknesses or significant deficiencies in our internal controls as defined under standards adopted by the Public Company Accounting Oversight Board, or PCAOB, that require remediation. A material weakness is a deficiency, or combination of deficiencies, in internal controls over financial reporting, such that there is a reasonable possibility that a material misstatement of the company's annual or interim financial statements will not be prevented or detected on a timely basis. A significant deficiency is a deficiency or combination of deficiencies, in internal controls over financial reporting that is less severe than a material weakness, yet important enough to merit attention by those responsible for the oversight of the company's financial reporting. As a result of weaknesses that may be identified in our internal controls, we may also identify certain deficiencies in some of our disclosure controls and procedures that we believe require remediation. If we discover weaknesses, we will make efforts to improve our internal and disclosure controls. However, there is no assurance that we will be successful. If we fail to maintain effective controls or timely affect any necessary improvement of our internal and disclosure controls, we may not have accurate information to make management decisions, our operating results could be harmed or we may fail to meet our reporting obligations, which could affect our ability to remain listed with the NASDAQ Global Market. Ineffective internal and disclosure controls could also cause stockholders to lose confidence in our reported financial information and our ability to manage our business, which would likely have a negative effect on the trading price of our securities.
We might be subject to claims of infringement of other parties' proprietary rights which could harm our business.
In the future, as we have in the past, we might receive claims that we are infringing intellectual property rights of others or inquiries about our interest in a license, or assertions that we need a license, to the intellectual property. The semiconductor industry is characterized by uncertain and conflicting intellectual property claims and vigorous protection and pursuit of these rights. The resolution of any claims of this nature, with or without merit, could be time consuming, result in costly litigation or cause product shipment delays. In the event of an adverse ruling or settlement, we might be required to pay substantial damages, cease the use or sale of infringing products, spend significant resources to develop non-infringing technology, discontinue the use of certain technology and/or enter into license agreements. License agreements, if required, might not be available on terms acceptable to us. The loss of access to any of our intellectual property or the ability to use any of our technology could harm our business. Finally, certain of our customer contracts contain provisions that require us to defend and /or indemnify our customers for third party intellectual property infringement claims, which would increase the cost to us of an adverse ruling or settlement.
We may not be able to recruit or retain qualified personnel, which could harm our business.
We believe our ability to manage successfully and grow our business and to develop new products depends, in large part, on our ability to recruit and retain qualified employees, particularly highly skilled technical, sales, management, and key staff personnel. Competition for qualified resources is intense and other companies may have greater resources available to provide substantial inducements to lure key personnel away from us or to offer more competitive compensation packages to individuals we are trying to hire. Additionally, we have implemented global cost reduction plans in which we have reduced our workforce, which could make it challenging to retain key people and recruit new talent, as needed. While we are implementing programs
22
to attract employees, and we may grant additional equity compensation to certain employees outside of our annual equity grant program for retention purposes, or implement retention bonus programs for certain employees, there can be no assurance that we will be able to successfully recruit and retain the qualified personnel we require.
As part of our sales process, we could incur substantial sales and engineering expenses that do not result in revenues, which would harm our operating results.
Our customers generally expend significant efforts evaluating and qualifying our products prior to placing an order. The time that our customers require to evaluate and qualify our wafer probe cards is typically between three and 12 months and sometimes longer. While our customers are evaluating our products, we might incur substantial sales, marketing, and research and development expenses. For example, we typically expend significant resources educating our prospective customers regarding the uses and benefits of our wafer probe cards and developing wafer probe cards customized to the potential customer's needs, for which we might not be reimbursed. Although we commit substantial resources to our sales efforts, we might never receive any revenues from a customer. For example, many semiconductor chip designs never reach production, including designs for which we may have expended design effort and expense. In addition, prospective customers might decide not to use our wafer probe cards. The length of time that it takes for the evaluation process and for us to make a sale depends upon many factors including:
|
•
|
the efforts of our sales force and our distributor and independent sales representatives;
|
|
•
|
the complexity of the customer's fabrication processes;
|
|
•
|
the internal technical capabilities of the customer;
|
|
•
|
the customer's budgetary constraints; and,
|
|
•
|
the customer's ability to devote resources to the evaluation process.
|
In addition, product purchases are frequently subject to delays; as a result, our sales cycles are unpredictable. If we incur substantial sales and engineering expenses without generating revenues, our operating results could be harmed.
Our failure to comply with environmental laws and regulations could subject us to significant fines and liabilities, and new laws and regulations or changes in regulatory interpretation or enforcement could make compliance more difficult and costly.
We are subject to various U.S. Federal, state and local, and foreign governmental laws and regulations relating to the protection of the environment, including those governing the discharge of pollutants into the air and water, the management and disposal of hazardous substances and wastes, the cleanup of contaminated sites and the maintenance of a safe workplace. We could incur substantial costs, including cleanup costs, civil or criminal fines or sanctions and third-party claims for property damage or personal injury, as a result of violations of or liabilities under environmental laws and regulations or non-compliance with the environmental permits required at our facilities.
These laws, regulations and permits also could require the installation of costly pollution control equipment or operational changes to limit pollution emissions or decrease the likelihood of accidental releases of hazardous substances. In addition, changing laws and regulations, new laws and regulations, stricter enforcement of existing laws and regulations, the discovery of previously unknown contamination at our or others' sites or the imposition of new cleanup requirements could require us to curtail our operations, restrict our future expansion, subject us to liability and cause us to incur future costs that could harm our operations, thereby adversely impacting our operating results and cash flow.
Because we conduct most of our business internationally, we are subject to operational, economic, financial and political risks abroad.
Sales of our products to customers outside North America have accounted for a significant part of our revenues. Our international sales as a percentage of our revenues were
73%
,
85%
and
85%
for fiscal
2013
,
2012
and
2011
, respectively. Additionally, certain of our South Korean customers purchase through their North American subsidiaries. In the future, we expect international sales, particularly in Japan, South Korea and Taiwan, to continue to account for a significant percentage of our revenues. Accordingly, we will be subject to risks and challenges that we would not otherwise face if we conducted our business solely in North America.
These risks and challenges include:
|
•
|
compliance with a wide variety of foreign laws and regulations;
|
23
|
•
|
legal uncertainties regarding taxes, tariffs, quotas, export controls, export licenses and other trade barriers;
|
|
•
|
political and economic instability or foreign conflicts that involve or affect the countries of our customers;
|
|
•
|
difficulties in collecting accounts receivable and longer accounts receivable payment cycles;
|
|
•
|
difficulties in staffing and managing personnel, distributors and representatives;
|
|
•
|
reduced protection for intellectual property rights in some countries;
|
|
•
|
currency exchange rate fluctuations, which could affect the value of our assets denominated in local currency, as well as the price of our products relative to locally produced products;
|
|
•
|
seasonal fluctuations in purchasing patterns in other countries; and
|
|
•
|
fluctuations in freight rates and transportation disruptions.
|
Any of these factors could harm our existing international operations, impair our ability to continue expanding into international markets or materially adversely affect our operating results. Additionally, we are required to comply with foreign import and export requirements, customs and value added tax standards. Our failure to meet these requirements and standards could negatively impact our business operations. As an example in the third quarter of 2011, we received inquiries from a foreign jurisdiction tax authority regarding certain indirect tax matters. We cooperated with these inquiries, which related to our prior shipping process for new product qualifications and for products for certain of our repair center activities, and resolved the matter. We regularly address our tax compliance and make submissions to the appropriate jurisdiction as appropriate. In the future, if our tax practices are questioned by authorities or found to be irregular, it is possible that we could incur material expenses or charges, which would negatively impact our financial condition.
The trading price of our common stock has been and is likely to continue to be volatile, and you might not be able to sell your shares at or above the price that you paid for them.
The trading prices of the securities of technology companies have been highly volatile, and from
December 30, 2013
through
March 6, 2014
, our stock price (NASDAQ Global Market close price) has ranged from
$6.01
a share to
$7.19
a share. The trading price of our common stock is likely to continue to be subject to wide fluctuations. Factors affecting the trading price of our common stock include:
|
•
|
variations in our operating results;
|
|
•
|
our forecasts and financial guidance for future periods;
|
|
•
|
announcements of technological innovations, new products or product enhancements, new product adoptions at semiconductor customers or significant agreements by us or by our competitors;
|
|
•
|
reports regarding our ability to bring new products into volume production efficiently;
|
|
•
|
the gain or loss of significant orders or customers;
|
|
•
|
changes in the estimates of our operating results or changes in recommendations by any securities analysts that elect to follow our common stock;
|
|
•
|
rulings on litigations and proceedings relating to intellectual property matters;
|
|
•
|
seasonality, principally due to our customers' purchasing cycles;
|
|
•
|
market and competitive conditions in our industry, the entire semiconductor industry and the economy as a whole;
|
|
•
|
recruitment or departure of key personnel; and
|
|
•
|
announcements of mergers and acquisition transactions and the ability to successfully integrate the business activities of the acquired/merged company.
|
In addition, if the market for technology stocks or the stock market in general experiences loss of investor confidence, the trading price of our common stock could decline for reasons unrelated to our business, operating results or financial condition. The trading price of our common stock also might decline in reaction to events that affect other companies in our industry even if these events do not directly affect us.
24
Provisions of our certificate of incorporation and bylaws or Delaware law might discourage, delay or prevent a change of control of our company or changes in our management and, therefore, depress the trading price of our common stock.
Delaware corporate law and our certificate of incorporation and bylaws contain provisions that could discourage, delay or prevent a change in control of our company or changes in our management that the stockholders of our company may deem advantageous. These provisions:
|
•
|
establish a classified board of directors so that not all members of our board are elected at one time;
|
|
•
|
provide that directors may only be removed "for cause" and only with the approval of 66.7% of our stockholders;
|
|
•
|
require super-majority voting to amend some provisions in our certificate of incorporation and bylaws;
|
|
•
|
authorize the issuance of "blank check" preferred stock that our board could issue to increase the number of outstanding shares and to discourage a takeover attempt;
|
|
•
|
limit the ability of our stockholders to call special meetings of stockholders;
|
|
•
|
prohibit stockholder action by written consent, which requires all stockholder actions to be taken at a meeting of our stockholders;
|
|
•
|
provide that the board of directors is expressly authorized to make, alter or repeal our bylaws; and
|
|
•
|
establish advance notice requirements for nominations for election to our board or for proposing matters that can be acted upon by stockholders at stockholder meetings.
|
In addition, Section 203 of the Delaware General Corporation Law may discourage, delay or prevent a change in control of our company. In addition, each of our named executive officers and certain other officers of the company have entered into change of control severance agreements, which were approved by our Compensation Committee, which could increase the costs associated with a change of control and thus, potentially deter such a transaction.
New regulations related to conflict minerals may force us to incur additional expenses, may make our supply chain more complex and may result in damage to our relationships with customers.
In August 2012, as mandated by the Dodd-Frank Wall Street Reform and Consumer Protection Act of 2010, the SEC adopted new disclosure regulations for public companies that manufacture products that contain certain minerals and their derivatives, namely tin, tantalum, tungsten or gold, known as conflict minerals, if these minerals are necessary to the functionality or production of the company’s products. These regulations require such issuers to report annually whether or not such minerals originate from the Democratic Republic of Congo and adjoining countries and in some cases to perform extensive due diligence on their supply chains for such minerals. The implementation of these new requirements could adversely affect the sourcing, availability and pricing of conflict minerals used in the manufacture of semiconductor equipment, including our products. In addition, we may incur additional costs to comply with the disclosure requirements, including costs related to determining the source of any of the relevant minerals used in our products. Since our supply chain is complex, the due diligence procedures that we implement may not enable us to ascertain the origins for these minerals or determine that these minerals are DRC conflict-free. We may also face difficulties in satisfying customers who may require that our products be certified as DRC conflict-free, which could harm our relationships with these customers and lead to a loss of revenue. These new requirements also could have the effect of limiting the pool of suppliers from which we source these minerals, and we may be unable to obtain conflict-free minerals at competitive prices, which could increase our costs and adversely affect our manufacturing operations and our profitability.
In October 2012, the National Association of Manufacturers and the U.S. Chamber of Commerce filed a petition for review in the U.S. Court of Appeals for the District of Columbia in response to a piece of Dodd-Frank regulation that requires public companies to disclose whether their products have been manufactured with these conflict minerals in countries where the sale of these minerals fuel humanitarian violence. The outcome of this suit is uncertain and may impact the adoption of these new requirements. In January 2013, the SEC’s conflicts minerals disclosure rules became effective, requiring companies to make their first conflict minerals disclosures on or before May 31, 2014 for the 2013 calendar year. We are currently evaluating the disclosure requirements in order to comply with these disclosures, if any, within the prescribed time frame.
Item 1B:
Unresolved Staff Comments
None.
25
Item 2:
Properties
Our corporate headquarters, which includes sales, marketing, administration, manufacturing, engineering, and research and development facilities, is located in Livermore, California, United States. Our corporate headquarters comprises a campus of four buildings totaling approximately 169,000 square feet. We presently lease those four buildings. We also own one building which was a part of our older manufacturing facility and which is being utilized for storage. In addition, we lease office, repair and service, manufacturing and/or research and development space both inside and outside of the United States. The leases expire at various times through 2021. We believe that our existing and planned facilities are suitable for our current needs.
Information concerning our properties as of
December 28, 2013
is set forth below:
|
Location
|
Principal Use
|
Square
Footage
|
Ownership
|
|||
|
Livermore, California, United States
|
Corporate headquarters, sales, marketing, finance, product design, manufacturing, service and repair, distribution, research and development
|
168,636
|
|
Leased
|
||
|
Livermore, California, United States
|
Storage
|
13,531
|
|
Owned
|
||
|
San Jose, California, United States
|
Sales, marketing, finance, product design, manufacturing, service and repair, distribution, research and development
|
39,894
|
|
Leased
|
||
|
Carlsbad, California, United States
|
Product design, finance, manufacturing, service and repair, distribution, research and development
|
25,634
|
|
Leased
|
||
|
Austin, Texas, United States
|
Service and repair
|
2,025
|
|
Leased
|
||
|
Southbury, Connecticut, United States
|
Sales office
|
143
|
|
Leased
|
||
|
Singapore
|
Sales, finance, product design, service, and field service.
|
26,805
|
|
Leased
|
||
|
Suzhou, China
|
Sales, marketing, finance, manufacturing, product design, service and repair, distribution, research and development
|
9,700
|
|
Leased
|
||
|
Shanghai, China
|
Sales office
|
418
|
|
Leased
|
||
|
Jubei City, Hsinchu, Taiwan
|
Sales office, finance, product design, field service and repair center
|
9,309
|
|
Leased
|
||
|
Yokohama City, Japan
|
Sales office, finance, marketing, product design, research and development, field service, and repair center, manufacturing and distribution.
|
8,747
|
|
Leased
|
||
|
Hiroshima, Japan
|
Repair center
|
1,615
|
|
Leased
|
||
|
Gyeonggi-do, South Korea
|
Sales office, finance, product design, field service, and repair center
|
15,310
|
|
Leased
|
||
|
Gyeonggi-do, South Korea
|
Sales office, field service, and repair center
|
1,000
|
|
Leased
|
||
|
Dresden, Germany
|
Sales office
|
2,906
|
|
Leased
|
||
|
Milan, Italy
|
Sales office
|
215
|
|
Leased
|
||
Item 3:
Legal Proceedings
From time to time, we may be subject to legal proceedings and claims in the ordinary course of business. As of the filing of this Annual Report on Form 10-K, we were not involved in any material legal proceedings, other than the proceedings summarized below. In the future we may become a party to additional legal proceedings that may require us to spend significant resources, including proceedings designed to protect our intellectual property rights.
We believe that the factual allegations and circumstances underlying the legal proceedings described below that have been filed against us are without merit. We also believe that our company does not have a material monetary damages exposure in these legal proceedings that would individually or in the aggregate have a material adverse effect on our financial condition, liquidity or results of operations; however, legal proceedings can be costly and it is possible we will incur significant, and
26
possibly material, attorneys' fees, which may not be covered by our insurance policies. These legal proceedings may also divert our management's time and attention away from business operations, which could prove to be disruptive to our business operations. In addition, an unfavorable outcome or settlement of these proceedings, particularly if it is not covered by or exceeds our insurance coverage, could individually or in the aggregate adversely impact our financial condition, liquidity or results of operations.
Other Litigation
In August 2013, a former employee (“Plaintiff”) filed a class action lawsuit against the Company in the Superior Court of California, alleging violations of California’s wage and hour laws and unfair business practices on behalf of himself and all other similarly situated current and former employees at the Company’s Livermore facilities from August 21, 2009 to the present. In February 2014, the Court granted the Company’s motion to strike Plaintiff’s first amended complaint, clarifying the scope of the putative class. Procedurally, the case is in the early stages of litigation and therefore the Company is unable to predict the likelihood or extent of potential liability at this time. The Company denies the allegations and could incur material attorneys’ fees in defending the lawsuit.
Patent Litigation
We amicably resolved the various patent litigations the Company was involved in in prior years. As of December 28, 2013 certain third party initiated challenges to one or more of our patents remained pending in the U.S. Patent and Trademark Office and in the Taiwan Patent Office.
No provision has been made for intellectual property-related litigation because we believe that it is not probable that a liability had been incurred as of
December 28, 2013
. We have incurred and could incur in the future material attorneys' fees in prosecuting and defending actions related to intellectual property.
Item 4:
Mine Safety Disclosures
Not applicable.
27
Item 5:
Market for Registrant's Common Equity, Related Stockholder Matters and Issuer Purchases of Equity Securities
Price Range of Common Stock
Our common stock is listed on the NASDAQ Global Market under the symbol "FORM". The following table sets forth the range of high and low closing sales prices per share as reported on the Nasdaq Global Market for the periods indicated.
|
Fiscal 2013
|
High
|
Low
|
|||||
|
First Quarter
|
$
|
5.15
|
|
$
|
4.56
|
|
|
|
Second Quarter
|
6.96
|
|
4.39
|
|
|||
|
Third Quarter
|
7.66
|
|
6.00
|
|
|||
|
Fourth Quarter
|
$
|
6.86
|
|
$
|
5.00
|
|
|
|
Fiscal 2012
|
High
|
Low
|
|||||
|
First Quarter
|
$
|
5.75
|
|
$
|
4.85
|
|
|
|
Second Quarter
|
6.63
|
|
5.16
|
|
|||
|
Third Quarter
|
6.88
|
|
5.05
|
|
|||
|
Fourth Quarter
|
$
|
5.65
|
|
$
|
3.78
|
|
|
The closing sales price of our common stock on the NASDAQ Global Market was
$6.98
per share on
March 6, 2014
. As of
March 6, 2014
, there were
234
registered holders of record of our common stock.
Repurchase of Common Stock
On October 20, 2010, our board of directors authorized the repurchase up to $50.0 million of outstanding common stock which expired on October 19, 2011. On October 12, 2011, our Board of Directors authorized the extension of our repurchase program through October 19, 2012. Under the extension, we were authorized to repurchase up to a total of $40.5 million of outstanding common stock during the program period. The terms and conditions of the extended repurchase program remained the same as those in the original program approved in fiscal 2010. All of our repurchases were made under the authorized repurchase program. During fiscal 2011, we repurchased and retired 2,332,740 shares of common stock for $16.4 million. We did not repurchase any shares of common stock under the program during fiscal 2012.
Repurchased shares are retired upon the settlement of the related trade transactions. Our policy related to repurchases of our common stock is to charge the excess of cost over par value to additional paid-in capital. All repurchases were made in compliance with Rule 10b-18 under the Securities Exchange Act of 1934, as amended. The repurchase program ended effective October 19, 2012 and was not extended.
Dividend Policy
We have never declared or paid cash dividends on our common stock. We currently expect to retain all available funds and any future earnings for use in the operation and development of our business. Accordingly, we do not anticipate declaring or paying cash dividends on our common stock in the foreseeable future.
Stock Price Performance Graph
The following graph shows the total stockholder return of an investment of $100 in cash on December 31, 2008 through
December 28, 2013
, for (1) our common stock, (2) the S&P 500 Index and (3) the RDG Semiconductor Composite Index. All values assume reinvestment of the full amount of all dividends. No cash dividends have been declared on shares of our common stock. Stockholder returns over the indicated period are based on historical data and are not necessarily indicative of future stockholder returns.
28
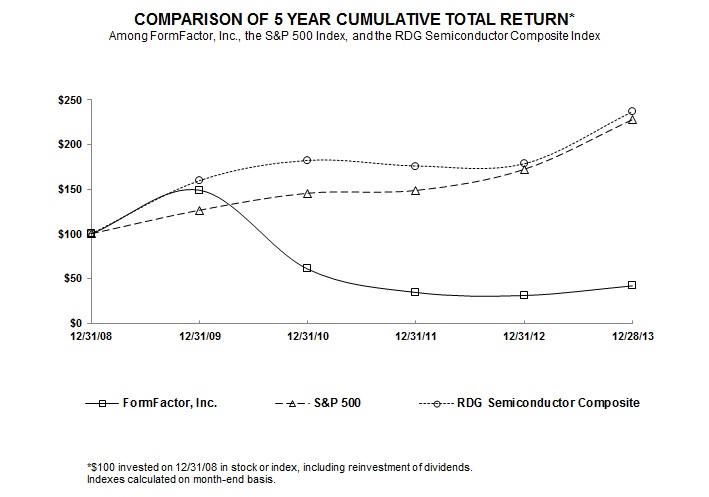
|
|
Cumulative Total Return
|
||||||||||||||||||||||
|
|
December 31,
2008
|
December 31,
2009
|
December 31,
2010
|
December 31,
2011
|
December 31,
2012
|
December 31,
2013
|
|||||||||||||||||
|
FormFactor, Inc.
|
$
|
100.00
|
|
$
|
149.11
|
|
$
|
60.82
|
|
$
|
34.66
|
|
$
|
31.23
|
|
$
|
42.05
|
|
|||||
|
S&P 500
|
100.00
|
|
126.46
|
|
145.51
|
|
148.59
|
|
172.37
|
|
228.19
|
|
|||||||||||
|
RDG Semiconductor Composite
|
100.00
|
|
159.67
|
|
182.24
|
|
176.00
|
|
178.51
|
|
236.96
|
|
|||||||||||
29
Item 6:
Selected Financial Data
The following selected consolidated financial data is derived from our consolidated financial statements. This data should be read in conjunction with our consolidated financial statements and the related notes, and "Item 7: Management's Discussion and Analysis of Financial Condition and Results of Operations" contained elsewhere in this Annual Report on Form 10-K.
|
Fiscal
2013 (1)(2)(4) |
Fiscal
2012 (1)(2)(5)(7) |
Fiscal
2011 (1)(2)(5)(6) |
Fiscal
2010 (1)(2)(3)(4)(6) |
Fiscal
2009 (1)(2)(5)(6) |
|||||||||||||||
|
|
(in thousands, except per share data)
|
||||||||||||||||||
|
Consolidated Statements of Operations Data:
|
|
|
|
|
|||||||||||||||
|
Revenues
|
$
|
231,533
|
|
$
|
178,535
|
|
$
|
169,325
|
|
$
|
188,565
|
|
$
|
135,335
|
|
||||
|
Gross profit (loss)
|
42,284
|
|
25,331
|
|
20,958
|
|
(2,272
|
)
|
819
|
|
|||||||||
|
Net loss
|
(57,683
|
)
|
(35,546
|
)
|
(65,981
|
)
|
(188,286
|
)
|
(155,653
|
)
|
|||||||||
|
Basic and diluted net loss per share
|
$
|
(1.06
|
)
|
$
|
(0.70
|
)
|
$
|
(1.31
|
)
|
$
|
(3.75
|
)
|
$
|
(3.15
|
)
|
||||
|
Consolidated Balance Sheets Data:
|
|
|
|
||||||||||||||||
|
Cash, cash equivalents and marketable securities
|
$
|
151,091
|
|
$
|
165,788
|
|
$
|
296,691
|
|
$
|
347,235
|
|
$
|
449,235
|
|
||||
|
Working capital
|
173,881
|
|
194,125
|
|
308,380
|
|
370,767
|
|
482,607
|
|
|||||||||
|
Total assets
|
340,708
|
|
395,682
|
|
383,071
|
|
466,054
|
|
655,968
|
|
|||||||||
|
Capital leases, net of current portion
|
—
|
|
340
|
|
—
|
|
—
|
|
—
|
|
|||||||||
|
Total stockholders' equity
|
294,086
|
|
339,258
|
|
346,652
|
|
411,201
|
|
577,781
|
|
|||||||||
|
Number of employees
|
961
|
|
1,021
|
|
709
|
|
729
|
|
808
|
|
|||||||||
|
(1)
|
Fiscal 2013, 2012, 2011, 2010 and 2009 net losses include restructuring charges, net of
$4.7 million
, $2.9 million, $0.5 million, $15.9 million and $8.8 million, respectively, relating to our global restructuring and reorganization actions. See Note 5—Restructuring Charges of the Notes to the Consolidated Financial Statements.
|
|
(2)
|
Fiscal 2013, 2012, 2011, 2010 and 2009 net losses include impairment charges of
$0.8 million
, $0.4 million, $0.5 million, $56.4 million and $1.3 million, respectively. See Note 7—Impairment of Long-lived Assets of the Notes to the Consolidated Financial Statements.
|
|
(3)
|
Fiscal 2010 gross loss includes an out-of-period adjustment related to cost of revenues that resulted in $2.9 million of additional expense offset by an income tax benefit of $0.5 million.
|
|
(4)
|
Fiscal 2013 net loss includes $0.3 million attributable to loss on sale of a subsidiary. Fiscal 2010 net loss includes a $3.5 million gain resulting from the release of the liability previously recorded as a secured borrowing due to the dismissal of our complaint against a customer.
|
|
(5)
|
Fiscal 2012 includes a $25.5 million tax benefit from the release of deferred tax asset valuation allowances due to deferred tax liabilities established on the acquired identifiable intangible assets from our acquisition of MicroProbe. Additionally, fiscal 2011 includes a $2.5 million tax benefit from the release of the deferred tax asset valuation allowance for a non-U.S. jurisdiction. We recorded a deferred tax asset valuation allowance of $57.7 million in fiscal 2009 against the U.S. excess tax benefits, including prior years, based on our assessment of the realizability of our U.S. deferred tax assets. This charge resulted in an income tax provision, rather than an income tax benefit, for fiscal 2009.
|
|
(6)
|
Fiscal 2011 and 2010 include a $0.3 million and $1.1 million net benefit, respectively, from collections on amounts previously reserved as bad debts. Fiscal 2009's selling, general and administrative expenses includes a provision for bad debts of $5.0 million.
|
|
(7)
|
Fiscal 2012 includes the following as a result of the MicroProbe Acquisition: $19.8 million in revenue, $5.4 million in the amortization of intangibles expense, $2.6 million release of pre-existing backlog, $0.2 million charge for step-up depreciation on the fair value of fixed assets, resulting in a $6.4 million net loss. As part of the MicroProbe Acquisition, a patent lawsuit was settled with a benefit of $3.3 million.
|
30
Item 7:
Management's Discussion and Analysis of Financial Condition and Results of Operations
The following discussion and analysis of our financial condition and results of operations should be read in conjunction with our consolidated financial statements and the related notes included elsewhere in this Annual Report on Form 10-K. In addition to historical consolidated financial information, the following discussion and analysis contains forward-looking statements that involve risks, uncertainties and assumptions as described under the "Note Regarding Forward-Looking Statements" that appears earlier in this Annual Report on Form 10-K. Our actual results could differ materially from those anticipated by these forward-looking statements as a result of many factors, including those discussed under "Item 1A: Risk Factors" and elsewhere in this Annual Report on Form 10-K.
Overview
We design, develop, manufacture, sell and support precision, high performance advanced semiconductor wafer probe card products and solutions. We are the largest probe card manufacturer, and semiconductor manufacturers use our wafer probe cards to perform wafer sort and test on semiconductor die, or chips, prior to wafer singulation. We work closely with our customers on product design, as each wafer probe card is a custom product that is specific to the chip and wafer designs of the customer. During wafer sort and test, a wafer probe card is mounted on a prober and electrically connected to a semiconductor tester. The wafer probe card is used as an interface to connect electrically with and test individual chips on a wafer. Our wafer probe cards are used by our customers in the front end of the semiconductor manufacturing process, as are our image sensor, parametric or in-line probe cards. We operate in a single industry segment and have derived substantially all of our revenues from the sale of wafer probe cards incorporating our proprietary technology, including our MicroSpring interconnect technology and our ATRE test technology.
During fiscal
2013
, we saw revenues increase
$53.0 million
from
$178.5 million
in
2012
to
$231.5 million
in
2013
. Revenue growth was driven by the SoC product market which was up
$69.0 million
when compared with
2012
, driven by the impact of a full year of sales from our MicroProbe acquisition. DRAM revenues were down
$9.9 million
versus
2012
due to weaker personal computer demand and certain supply chain and manufacturing execution issues we experienced in connection with wafer probe cards for a Japan customer. Flash revenues were down
$6.1 million
due to lower unit volume in the flash memory markets.
During fiscal
2013
, we continued the activities initiated in 2010 to restructure our operations to simplify our overall structure and better align our operations with the current business environment, streamline our manufacturing structure and reduce both manufacturing cost and cycle times. As part of this simplification, we reduced our workforce by
48
full-time employees, or
5%
, during fiscal
2013
, as compared to fiscal
2012
. In January 2014, we implemented an organizational restructuring and cost reduction plan to improve our efficiency and effectiveness while better positioning the company for profitability. As part of this plan, we eliminated
51
full-time employees or approximately 5% as compared to the end of fiscal 2013. In addition, we reduced our temporary workforce by
9
positions.
In the latter part of the third fiscal quarter of 2013, we began to experience a significant decrease in customer orders for our products caused primarily by supply chain and manufacturing execution challenges that resulted in lost orders at one Japan customer and by a fire at a major customer's China facility that impacted probe card orders. This decrease in customer orders also carried-over into the fourth quarter of fiscal 2013. As a consequence, this decline resulted in lower than forecasted manufacturing utilization and coupled with lower margins on a specific high-volume DRAM design, increased warranty and service expenses and excess inventory charges, negatively affected our gross margin for the third quarter of fiscal 2013.
We incurred net losses of
$57.7 million
and
$35.5 million
in fiscal
2013
and fiscal
2012
, respectively. The increase in net loss is primarily attributable to a one-time $25.5 million tax benefit from the release of valuation allowances on our deferred tax assets (DTAs) in connection with our MicroProbe Acquisition in the fourth quarter of fiscal 2012. Deferred tax liabilities (DTLs) were established on the acquired identifiable intangible assets. These DTLs exceeded the acquired DTAs by $25.5 million. The excess DTLs allowed us to realize a tax benefit by releasing the valuation allowances associated with our DTAs. Accordingly, the valuation allowances on a portion of our DTAs were released and resulted in a one-time income tax benefit of $25.5 million in the fourth quarter of fiscal 2012. In connection with the MicroProbe Acquisition, we also agreed to settle patent infringement, unfair competition, trade secret misappropriation and breach of confidence claims against Astria Semiconductor Holding, Inc., its subsidiary Micro-Probe Incorporated and a former FormFactor employee. The settlement in favor of FormFactor resulted in a one-time benefit of $3.3 million in the fourth quarter of fiscal 2012.
The increase in net loss for fiscal 2013 is also attributable to higher intangible amortization costs, integration expenses and a loss on the sale of a MicroProbe subsidiary in Reno, Nevada. These expenses relating to the MicroProbe Acquisition totaled $18.4 million and $12.1 million for fiscal 2013 and fiscal 2012, respectively, which includes amortization of the fixed
31
asset fair value step-up. Excluding these non-recurring MicroProbe Acquisition related benefits and costs, our gross margins and operating margins improved as a result of our ongoing initiatives to reduce manufacturing overhead costs, lower production material costs and reduce operating expenses.
The net loss for fiscal
2013
includes the entire fiscal year's operational activity of MicroProbe, which was acquired in October 2012. In addition, the net loss includes restructuring charges of
$4.7 million
, impairment charges of
$0.8 million
, loss on the sale of a subsidiary of $0.3 million and
$1.3 million
in acquisition and integration costs.
The net loss for fiscal 2012 includes MicroProbe operating activity from the acquisition date on October 16, 2012 to fiscal 2012 year-end of $19.8 million in revenue and $6.4 million of net loss, which includes $8.2 million of intangible amortization and other expenses. In addition, the net loss includes restructuring charges of $2.9 million, impairment charges of $0.4 million, and $3.0 million in acquisition and integration costs, offset by a benefit of $25.5 million from the release of the U.S jurisdiction deferred tax asset valuation allowance resulting from the deferred tax liability recorded in connection with the $77.6 million of intangible assets acquired in the business combination. The net loss also included a gain of $3.3 million from our litigation settlement.
Our cash, cash equivalents and marketable securities and restricted cash totaled
$151.5 million
as of
December 28, 2013
, as compared to
$166.1 million
at
December 29, 2012
. The decrease in our cash, cash equivalents and marketable securities and restricted cash was primarily due to the use of cash for operating activities in 2013. We believe that we will be able to satisfy our working capital requirements for at least the next twelve months with the liquidity provided by our existing cash, cash equivalents and marketable securities. If we are unsuccessful in increasing our revenues, improving our operating efficiency, reducing our cash outlays or increasing our available cash through financing, our cash, cash equivalents and marketable securities will decline in future fiscal years.
We believe the following information is important to understanding our business, our financial statements as well as the remainder of this discussion and analysis of our financial condition and results of operations:
Fiscal Year.
Fiscal years ended
December 28, 2013
and
December 29, 2012
had 52 weeks each and fiscal year ended
December 31, 2011
had 53 weeks. Our fiscal year ends on the last Saturday in December.
MicroProbe Acquisition.
On October 16, 2012, pursuant to an Agreement and Plan of Merger and Reorganization dated as of August 31, 2012, a wholly-owned subsidiary of FormFactor merged with and into Astria Semiconductor Holding, Inc., including its subsidiary, Micro-Probe Incorporated (together “MicroProbe”), with MicroProbe continuing as the surviving corporation and as a wholly-owned subsidiary of FormFactor.
MicroProbe was a semiconductor equipment company that designs, develops, manufactures, sells and services high performance, custom designed advanced SoC wafer probe cards and analytical test equipment used in the semiconductor industry. MicroProbe was a global company with operations in the U.S. and Asia, including China, South Korea, Singapore and Taiwan. The acquisition of MicroProbe enabled us to leverage the combination of two advanced wafer probe card manufacturers and expand our SoC product portfolio to meaningfully diversify our business.
Revenues.
We derive substantially all of our revenues from product sales of wafer probe cards. Revenues from our customers are subject to fluctuations due to factors including, but not limited to, design cycles, technology adoption rates, competitive pressure to reduce prices, cyclicality of the different end markets into which our customers' products are sold and market conditions in the semiconductor industry. Historically, increases in revenues have resulted from increased demand for our existing products, the introduction of new, more complex products and the penetration of new markets. We expect that revenues from the sale of wafer probe cards will continue to account for substantially all of our revenues for the foreseeable future.
Cost of Revenues.
Cost of revenues consists primarily of manufacturing materials, payroll, shipping and handling costs, manufacturing-related overhead and amortization of certain intangible assets. Our manufacturing operations rely upon a limited number of suppliers to provide key components and materials for our products, some of which are a sole-source. We order materials and supplies based on backlog and forecasted customer orders. Tooling and setup costs related to changing manufacturing lots at our suppliers are also included in the cost of revenues. We expense all warranty costs and inventory provisions as cost of revenues.
We design, manufacture and sell custom advanced wafer probe cards into the semiconductor test market, which is subject to significant variability and demand fluctuations. Our wafer probe cards are complex products that are custom to a specific chip design of a customer and must be delivered on relatively short lead-times as compared to our overall manufacturing process. As our advanced wafer probe cards are manufactured in low volumes and must be delivered on relatively short lead-times, it is not uncommon for us to acquire production materials and start certain production activities based on estimated production yields and forecasted demand prior to or in excess of actual demand for our wafer probe cards.
32
We record an adjustment to our inventory valuation for estimated obsolete and non-sellable inventories based on assumptions about future demand, past usage, changes to manufacturing processes and overall market conditions.
Research and Development.
Research and development expenses include expenses related to product development, engineering and material costs. Research and development costs are expensed as incurred. We plan to continue to invest in research and development activities to improve and enhance existing product technologies and to develop new technologies for current and new products and for new applications.
Selling, General and Administrative.
Selling, general and administrative expenses include expenses related to sales, marketing, and administrative personnel, internal and outside sales representatives' commissions, market research and consulting, and other sales, marketing, administrative activities, amortization of certain intangible assets, and provision for doubtful accounts. These expenses also include costs for protecting and enforcing our intellectual property rights and regulatory compliance costs.
Restructuring Charges.
Restructuring charges include costs related to employee termination benefits, cost of long-lived assets abandoned or impaired, as well as contract termination costs.
Impairment of Long-Lived Assets.
Asset impairment charges include charges associated with the write-down of assets that have no future expected benefit or assets for which circumstances indicate that the carrying amount of these assets may not be recoverable, as well as adjustments to the carrying amount of our assets held for sale.
Use of Estimates.
The preparation of consolidated financial statements in conformity with generally accepted accounting principles in the United States of America (“GAAP”) requires management to make estimates and assumptions that affect the reported amounts of assets and liabilities, the disclosure of contingent assets and liabilities at the date of the financial statements, and the reported amounts of revenues and expenses during the reporting period. Actual results could differ from those estimates. Estimates may change as new information is obtained. We believe that the estimates, assumptions and judgments involved in revenue recognition, fair value of marketable securities, allowance for doubtful accounts, reserves for product warranty, valuation of obsolete and slow moving inventory, assets acquired and liabilities assumed in business combinations, legal contingencies, realizability of goodwill, the assessment of recoverability of long-lived assets, valuation and recognition of stock-based compensation, provision for income taxes and related deferred tax assets, valuation and tax liabilities and accruals for other liabilities have the greatest potential impact on our consolidated financial statements. Actual results could differ from those estimates.
Critical Accounting Policies and Estimates
Our discussion and analysis of our financial condition and results of operations are based upon our consolidated financial statements, which have been prepared in accordance with GAAP. The preparation of these financial statements require us to make estimates and assumptions that affect the reported amounts of assets and liabilities at the date of the financial statements and the reported amounts of net revenue and expenses in the reporting period. Our accounting policies are fundamental to understanding our financial condition and results of operations reported in our financial statements and related disclosures. We have identified the following accounting policies as being critical because they require our management to make particularly difficult, subjective and/or complex judgments about the effect of matters that are inherently uncertain. We evaluate our estimates and assumptions on an ongoing basis and we base these estimates and assumptions on current facts, historical experiences and various other factors and assumptions that are believed to be reasonable under the circumstances. Actual results may differ materially and adversely from our estimates. Our management has discussed the development, selection, application and disclosure of these critical accounting policies with the Audit Committee of our Board of Directors.
Revenue Recognition:
We recognize revenue when persuasive evidence of an arrangement exists, title and risk of loss has transferred to the customer, the selling price is fixed or determinable and collection of the related receivable is reasonably assured. In instances where final acceptance of the deliverable is specified by the customer, revenue is deferred until all acceptance criteria have been met. Revenues from the licensing of our design and manufacturing technology, which have not been material to date, are recognized over the term of the license agreement or when the significant contractual obligations have been fulfilled.
Goodwill:
Goodwill represents the excess of the purchase price over the fair value of identifiable assets acquired and liabilities assumed. We have determined that we operate in one reportable segment consisting of two operating segments relating to our FormFactor and MicroProbe product groups. We further have determined that for the purposes of our goodwill impairment analysis, we have two reporting units relating to our FormFactor and MicroProbe product groups and which are
33
both associated with the design, development, manufacture, sale and support of precision, high performance advanced semiconductor wafer probe cards.
In September 2011, the FASB amended its guidance to simplify testing goodwill for impairment, allowing an entity to first assess qualitative factors to determine whether it is necessary to perform a two-step quantitative goodwill impairment test. If an entity determines as a result of the qualitative assessment that it is more likely than not that the fair value of a reporting unit is less than its carrying amount, then the quantitative impairment test is required. Otherwise, no further testing is required.
The performance of the quantitative impairment test involves a two-step process. The first step of the impairment test involves comparing the fair values of the applicable reporting units with their aggregate carrying values, including goodwill. We generally determine the fair values of our reporting units using a combination of the income approach (that includes the use of the discounted cash flow method) and the market approach (guideline company approach) valuation methodologies. If the carrying amount of a reporting unit exceeds the fair value of that reporting unit, we perform the second step of the quantitative impairment test to determine the amount of impairment loss. The second step of the goodwill impairment test involves comparing the implied fair value of the affected reporting unit's goodwill with the carrying value of that goodwill. We acquired MicroProbe and performed a fair value assessment as of the acquisition date, October 16, 2012, resulting in our current goodwill balance.
As we entered the fourth quarter of fiscal 2013, we faced increasing operational and financial challenges, including manufacturing overcapacity and weak operating performance which led to a deterioration in market conditions. As a result, during the fourth quarter of fiscal 2013, in conjunction with our annual goodwill impairment test, we performed the first step of the two-step goodwill impairment test relating to our two reporting units to ascertain if the carrying values of the net assets exceeded fair values. The results of the first step of the impairment test indicated that the goodwill of the FormFactor and MicroProbe reporting units were not impaired, as the estimated fair values in excess of carrying values were approximately $32 million and $41 million, respectively, or 16% and 39%, over the carrying value of the reporting units, respectively. As a result, we did not record any impairment to our goodwill as of December 28, 2013. The evaluation of goodwill and intangible assets for impairment requires the exercise of significant judgment. In the event of future changes in business conditions, we will be required to reassess and update our forecasts and estimates used in future impairment analyses. If the results of these analyses are lower than current estimates, a material impairment charge may result at that time. See note 9 to Notes to Consolidated Financial Statements -
Goodwill and Intangible Assets
, for further details.
Impairment of Long-Lived Assets:
We test long-lived assets or asset groups such as property, plant and equipment and intangibles for recoverability when events or changes in circumstances indicate that their carrying amounts may not be recoverable. Circumstances that could trigger a review include, but are not limited to: significant decreases in the market price of the asset; significant adverse changes in the business climate or legal factors; accumulation of costs significantly in excess of the amount originally expected for the acquisition or construction of the asset; current period cash flow or operating losses combined with a history of losses or a forecast of continuing losses associated with the use of the asset; and current expectation that the asset will more likely than not be sold or disposed of significantly before the end of its estimated useful life.
Recoverability is assessed based on the carrying amounts of the asset or asset group and the sum of the undiscounted cash flows expected to result from the use and the eventual disposal of the asset. An impairment loss is recognized when the carrying amount is not recoverable and exceeds fair value.
Significant judgments and assumptions are required in the forecast of future operating results used in the preparation of the estimated future cash flows, including profit margins, long-term forecasts of the amounts and timing of overall market growth and our percentage of that market, groupings of assets, discount rates and terminal growth rates. In addition, significant estimates and assumptions are required in the determination of the fair value of our intangible assets and tangible long-lived assets, including replacement cost, economic obsolescence, and the value that could be realized in an orderly liquidation. Changes in these estimates could have a material adverse effect on the assessment of our long-lived assets, thereby requiring us to write down the assets.
As we entered the fourth quarter of fiscal 2013, we faced increasing operational and financial challenges, including manufacturing overcapacity and weak operating performance which led to a deterioration in market conditions. As a result, during the fourth quarter of fiscal 2013, we reviewed the recoverability of our long-lived asset groups and we concluded that our business was able to fully recover the carrying amounts of our assets.
Business Acquisitions:
Our consolidated financial statements include the operations of an acquired business after the completion of the Microprobe Acquisition in October 2012. We account for acquired businesses using the acquisition method of accounting. The acquisition method of accounting for acquired businesses requires, among other things, that assets acquired and liabilities assumed be recognized at their estimated fair values as of the acquisition date, and that the fair value of acquired intangible assets including in-process research and development, or IPR&D, be recorded on the balance sheet. Also, transaction
34
costs are expensed as incurred. Any excess of the purchase price over the assigned fair values of the net assets acquired is recorded as goodwill.
Cash, Cash Equivalents and Marketable Securities:
Cash and cash equivalents consist of deposits and financial instruments which are readily convertible into cash and have original maturities of 90 days or less at the time of acquisition. Marketable securities consist primarily of highly liquid investments with maturities of greater than 90 days when purchased. We generally classify our marketable securities at the date of acquisition as available-for-sale. These securities are reported at fair value with the related unrealized gains and losses included in "Accumulated other comprehensive income (loss)", a component of stockholder's equity, net of tax. Any unrealized losses which are considered to be other-than-temporary impairments are recorded in "Other income, net" in the Consolidated Statements of Operations. Realized gains (losses) on the sale of marketable securities are determined using the specific-identification method and recorded in "Other income, net" in the Consolidated Statements of Operations. We measure our cash equivalents and marketable securities at fair value.
All of our available-for-sale investments are subject to a periodic impairment review. We record a charge to earnings when a decline in fair value is significantly below cost basis and judged to be other-than-temporary, or have other indicators of impairments. If the fair value of an available-for-sale investment is less than its amortized cost basis, an other-than-temporary impairment is triggered in circumstances where (1) we intend to sell the instrument, (2) it is more likely than not that we will be required to sell the instrument before recovery of its amortized cost basis, or (3) a credit loss exists where we do not expect to recover the entire amortized cost basis of the instrument. If we intend to sell or it is more likely than not that we will be required to sell the available-for-sale investment before recovery of its amortized cost basis, we recognize an other-than-temporary impairment charge equal to the entire difference between the investment's amortized cost basis and its fair value.
Restructuring Charges:
Restructuring charges include costs related to employee termination benefits, long-lived assets impaired or abandoned, and contract termination costs. The determination of when we accrue for employee termination benefits and which standard applies depends on whether the termination benefits are provided under a one-time benefit arrangement or under an on-going benefit arrangement. For restructuring charges recorded as an on-going benefit arrangement, a liability for post-employment benefits is recorded when payment is probable, the amount is reasonably estimable, and the obligation relates to rights that have vested or accumulated. For restructuring charges recorded as a one-time benefit arrangement, we recognize a liability for employee termination benefits when a plan of termination, approved by management and establishing the terms of the benefit arrangement, has been communicated to employees. The timing of the recognition of one-time employee termination benefits is dependent upon the period of time the employees are required to render service after communication. If employees are not required to render service in order to receive the termination benefits or if employees will not be retained to render service beyond the minimum legal notification period, a liability for the termination benefits is recognized at the communication date. In instances where employees will be retained to render service beyond the minimum legal notification period, the liability for employee termination benefits is measured initially at the communication date based on the fair value of the liability as of the termination date and is recognized ratably over the future service period. We continually evaluate the adequacy of the remaining liabilities under our restructuring initiatives.
We record charges related to long-lived assets to be abandoned when the assets cease to be used. When we cease using a building or other asset with remaining non-cancelable lease payments continuing beyond our use period, we record a liability for remaining payments under lease arrangements, as well as for contract termination costs, that will continue to be incurred under a contract for its remaining term without economic benefit to us at the cease-use date. Given the significance of, and the timing of the execution of such activities, this process is complex and involves periodic reassessments of estimates made at the time the original decisions were made, including evaluating real estate market conditions for expected vacancy periods and sub-lease rents. Although we believe that these estimates accurately reflect the costs of our restructuring plans, actual results may differ, thereby requiring us to record additional provisions or reverse a portion of such provisions.
Warranty Obligations:
We offer warranties on certain products and record a liability for the estimated future costs associated with warranty claims at the time revenue is recognized. The warranty liability is based upon historical experience and our estimate of the level of future costs. While we engage in extensive product quality programs and processes, our warranty obligation is affected by product failure rates, material usage and service delivery costs incurred in correcting a product failure. We continuously monitor product returns for warranty and maintain a reserve for the related expenses based upon our historical experience and any specifically identified field failures. As we sell new products to our customers, we must exercise considerable judgment in estimating the expected failure rates. This estimating process is based on historical experience of similar products, as well as various other assumptions that we believe to be reasonable under the circumstances.
Inventory Valuation:
We state our inventories at the lower of cost (principally standard cost which approximates actual cost on a first in, first out basis) or market value. We continually assess the value of our inventory and will periodically write down its value for estimated excess inventory and product obsolescence based upon assumptions about forecasted future sales, past usage, and market conditions. On a quarterly basis, we review inventory quantities on hand and on order under non-cancelable purchase commitments in comparison to our past usage and estimated forecast of product demand for the next six to
35
twelve months to determine what inventory quantities, if any, may not be sellable. Based on this analysis, we write down the affected inventory value for estimated excess and obsolescence charges. At the point of loss recognition, a new, lower cost basis for that inventory is established, and subsequent changes in facts and circumstances do not result in the restoration or increase in that newly established cost basis. Market conditions are subject to change, and demand for our products can fluctuate significantly. Actual consumption of inventories could differ from forecasted demand and this difference could have a material impact on our gross profit and inventory balances based on additional provisions for excess or obsolete inventories or a benefit from the sale of inventories previously written down.
Allowance for Doubtful Accounts:
A majority of our trade receivables are derived from sales to large multinational semiconductor manufacturers throughout the world. In order to monitor potential credit losses, we perform ongoing credit evaluations of our customers' financial condition. An allowance for doubtful accounts is maintained for probable credit losses based upon our assessment of the expected collectability of all accounts receivable. The allowance for doubtful accounts is reviewed on a quarterly basis to assess the adequacy of the allowance. We take into consideration (1) any circumstances of which we are aware of a customer's inability to meet its financial obligations and (2) our judgments as to prevailing economic conditions in the industry and their impact on our customers.
Income Taxes:
We utilize the asset and liability method of accounting for income taxes, under which deferred taxes are determined based on the temporary differences between the financial statement and tax basis of assets and liabilities using tax rates expected to be in effect during the years in which the basis differences reverse and for operating losses and tax credit carryforwards. We estimate our provision for income taxes and amounts ultimately payable or recoverable in numerous tax jurisdictions around the world. Estimates involve interpretations of regulations and are inherently complex. Resolution of income tax treatments in individual jurisdictions may not be known for many years after completion of any fiscal year. We are required to evaluate the realizability of our deferred tax assets on an ongoing basis to determine whether there is a need for a valuation allowance with respect to such deferred tax assets. A valuation allowance is recorded when it is more likely than not that some or all of the deferred tax assets will not be realized. Significant management judgment is required in determining any valuation allowance recorded against deferred tax assets. In evaluating the ability to recover deferred tax assets, we consider available positive and negative evidence giving greater weight to our recent cumulative losses and our ability to carryback losses against prior taxable income and, commensurate with objective verifiability, the forecast of future taxable income including the reversal of temporary differences and the implementation of feasible and prudent tax planning strategies.
We recognize and measure uncertain tax positions taken or expected to be taken in a tax return if it is more likely than not that the tax position will be sustained on examination by the taxing authorities, based on the technical merits of the position. The tax benefits recognized in the consolidated financial statements from such positions are then measured based on the largest benefit that has a greater than 50 percent likelihood of being realized upon ultimate settlement. We report a liability for unrecognized tax benefits resulting from uncertain tax positions taken or expected to be taken in a tax return. We adjust these reserves in light of changing facts and circumstances, such as the closing of a tax audit or the refinement of an estimate. To the extent that the final tax outcome of these matters is different than the amounts recorded, such differences will impact the provision for income taxes in the period in which such determination is made. The provision for income taxes includes the impact of reserve provisions and changes to reserves that are considered appropriate, as well as the related net interest. We recognize interest and penalties related to unrecognized tax benefits within the income tax provision. Accrued interest and penalties are included within the related tax liability caption line in the consolidated balance sheet.
We file annual income tax returns in multiple taxing jurisdictions around the world. A number of years may elapse before an uncertain tax position is audited and finally resolved. While it is often difficult to predict the final outcome or the timing of resolution of any particular uncertain tax position, we believe that our reserves for income taxes reflect the most likely outcome. We adjust these reserves, as well as the related interest, in light of changing facts and circumstances. Settlement of any particular position could require the use of cash.
Stock-Based Compensation:
Stock-based compensation cost is estimated at the grant date based on the fair-value of the award and is recognized as expense ratably over the requisite service period of the award. Determining the appropriate fair-value model and calculating the fair value of stock-based awards at the grant date requires considerable judgment, including estimating stock price volatility and expected option life. Forfeitures are required to be estimated at the time of grant and revised, if necessary, in subsequent periods if actual forfeitures differ significantly from those estimated.
We develop our estimates based on historical data and market information which can change significantly over time. A small change in the estimates used can result in a relatively large change in the estimated valuation. We use the Black-Scholes option valuation model to value employee stock option awards while the fair value for restricted stock awards and restricted stock units is measured based on the closing market price of our common stock on the dated of grant. We currently estimate when and if market and performance-based grants will be earned. If the awards are not considered probable of achievement, no amount of stock-based compensation is recognized. If we consider the award to be probable, expense is recorded over the estimated service period in the case of market-based awards and on an accelerated attribution model in the case of
36
performance-based awards. To the extent that our assumptions are incorrect, the amount of stock-based compensation recorded will be increased or decreased.
The most significant assumptions impacted by management's judgment are the expected volatility and the expected life of the options. The expected dividend yield and expected risk-free interest rate are not as significant to the calculation of fair value. In addition, adjustments to our estimates of the number of share-based payment awards that we expect to vest did have a significant impact on the recorded share-based compensation expense.
Expected volatility:
The value of a stock option is derived from its potential for appreciation. The more volatile the stock, the more valuable the option becomes because of the greater possibility of significant changes in stock price. Our computation of expected volatility is based on a blend of historical volatility of our common stock and implied volatility of traded options to purchase shares of our common stock. Our decision to incorporate implied volatility was based on our assessment that implied volatility of publicly traded options in our common stock is expected to be more reflective of market conditions and, therefore, can reasonably be expected to be a better indicator of expected volatility than historical volatility of our common stock alone.
Expected life and forfeiture rate:
The expected life also has a significant effect on the value of the option. The longer the term, the more time the option holder has to allow the stock price to increase without a cash investment and thus, the more valuable the option. Further, longer option terms provide more opportunity to exploit market highs. However, employees are not required to wait until the end of the contractual term of a nontransferable option to exercise. Accordingly, we are required to estimate the expected term of the option. We determine the expected life by considering several factors, including historical option exercise behavior, post vesting turnover rates, contractual terms and vesting periods of the options granted. Similarly, we base our estimate of forfeiture on historical option cancellation behavior including pre-vesting turnover rates.
Results of Operations
The following table sets forth our operating results as a percentage of revenues:
|
|
Fiscal 2013
|
Fiscal 2012
|
Fiscal 2011
|
|||||
|
Revenues
|
100.0
|
%
|
100.0
|
%
|
100.0
|
%
|
||
|
Cost of revenues
|
81.7
|
|
85.8
|
|
87.6
|
|
||
|
Gross profit
|
18.3
|
|
14.2
|
|
12.4
|
|
||
|
Operating expenses:
|
|
|
|
|||||
|
Research and development
|
18.2
|
|
22.5
|
|
25.7
|
|
||
|
Selling, general and administrative
|
23.0
|
|
27.6
|
|
27.6
|
|
||
|
Restructuring charges, net
|
2.0
|
|
1.6
|
|
0.3
|
|
||
|
Loss on sale of subsidiary
|
0.1
|
|
—
|
|
—
|
|
||
|
Impairment of long-lived assets
|
0.3
|
|
0.2
|
|
0.3
|
|
||
|
Gain on settlement of litigation
|
—
|
|
(1.8
|
)
|
—
|
|
||
|
Total operating expenses
|
43.6
|
|
50.1
|
|
53.9
|
|
||
|
Operating loss
|
(25.3
|
)
|
(35.9
|
)
|
(41.5
|
)
|
||
|
Interest income, net
|
0.2
|
|
0.4
|
|
0.8
|
|
||
|
Other income, net
|
0.3
|
|
0.8
|
|
0.6
|
|
||
|
Loss before income taxes
|
(24.8
|
)
|
(34.7
|
)
|
(40.1
|
)
|
||
|
Benefit from income taxes
|
—
|
|
(14.8
|
)
|
(1.1
|
)
|
||
|
Net loss
|
(24.8
|
)%
|
(19.9
|
)%
|
(39.0
|
)%
|
||
37
Fiscal Years Ended
December 28, 2013
and
December 29, 2012
Revenues
|
Fiscal
|
% of
|
Fiscal
|
% of
|
Change
|
||||||||||||||||
|
2013
|
Revenues
|
2012
|
Revenues
|
$
|
%
|
|||||||||||||||
|
(In thousands)
|
||||||||||||||||||||
|
Revenues by Market:
|
||||||||||||||||||||
|
SoC
|
$
|
115,597
|
|
49.9
|
%
|
$
|
46,586
|
|
26.1
|
%
|
$
|
69,011
|
|
148.1
|
%
|
|||||
|
DRAM
|
92,603
|
|
40.0
|
|
102,499
|
|
57.4
|
|
(9,896
|
)
|
(9.7
|
)
|
||||||||
|
Flash
|
23,333
|
|
10.1
|
|
29,450
|
|
16.5
|
|
(6,117
|
)
|
(20.8
|
)
|
||||||||
|
Total revenues
|
$
|
231,533
|
|
100.0
|
%
|
$
|
178,535
|
|
100.0
|
%
|
$
|
52,998
|
|
29.7
|
%
|
|||||
Overall, our revenues increased by
29.7%
, or
$53.0 million
, in fiscal
2013
as compared to fiscal
2012
. Out of the total revenues of
$231.5 million
for fiscal
2013
,
$93.2 million
or
40.3%
, was attributable to MicroProbe, compared to $19.8 million or 11.1% for fiscal 2012. MicroProbe's sales were not included in our consolidated revenues for the nine months ended September 29, 2012 as we only acquired Microprobe in October 2012.
Our revenues increased
148.1%
year-over-year in the SoC market but decreased
9.7%
in DRAM and
20.8%
in Flash memory. These fluctuations in revenue were primarily driven by our MicroProbe Acquisition in the SoC product market and unit volume in the DRAM and Flash memory product markets. Smart phone and tablet DRAM demand increased in fiscal 2013 compared to fiscal 2012 but was offset by a significant decrease in personal computer, or PC-related DRAM demand. The reduction in Flash memory revenue was primarily in the NAND Flash area resulting from lower demand for our higher parallelism Flash memory product.
Revenues by Geographic Region
The following table sets forth our revenues by geographic region for the periods indicated:
|
Fiscal
2013
|
% of
Revenues
|
Fiscal
2012
|
% of
Revenues
|
||||||||||
|
(In thousands)
|
|||||||||||||
|
Taiwan
|
$
|
64,623
|
|
27.9
|
%
|
$
|
36,963
|
|
20.7
|
%
|
|||
|
North America
|
63,053
|
|
27.2
|
|
27,508
|
|
15.4
|
|
|||||
|
South Korea
|
45,823
|
|
19.8
|
|
58,515
|
|
32.8
|
|
|||||
|
Asia-Pacific (1)
|
21,173
|
|
9.2
|
|
22,573
|
|
12.7
|
|
|||||
|
Europe
|
20,023
|
|
8.6
|
|
11,662
|
|
6.5
|
|
|||||
|
Japan
|
16,838
|
|
7.3
|
|
21,314
|
|
11.9
|
|
|||||
|
Total Revenues
|
$
|
231,533
|
|
100.0
|
%
|
$
|
178,535
|
|
100.0
|
%
|
|||
|
(1)
|
Asia-Pacific includes all countries in the region except Taiwan, South Korea, and Japan, which are disclosed separately.
|
Geographic revenue information is based on the location to which we ship the customer product. For example, if a certain South Korean customer purchases through their North American subsidiary and requests the products to be shipped to an address in Asia-Pacific, this sale will be reflected in the revenue for Asia-Pacific rather than North America.
The increase in North America and Europe sales for fiscal 2013, when compared to the same period in 2012, was driven by SoC product shipments primarily realized from the business we acquired through our MicroProbe Acquisition. MicroProbe's sales were not included in our consolidated revenues for the nine months ended September 29, 2012, given the business combination was completed on October 16, 2012. The increase in Taiwan sales for fiscal 2013, when compared to fiscal 2012, was driven by a combination of SoC product shipments from MicroProbe and an increase in mobile phone and tablet-based DRAM and Flash memory demand. The decrease in South Korea revenues for fiscal 2013, when compared to the same period in 2012 was primarily due to reduced PC-related DRAM memory demand, based on a reduced overall end-
38
market and lower demand for our higher parallelism Flash memory product. The decrease in Japan sales was driven by lower demand for our SmartMatrix product at a major mobile DRAM producer. This lower demand was primarily the consequence of certain supply chain and manufacturing challenges we experienced in the second half of fiscal 2013. Asia-Pacific revenue was relatively consistent year over year.
Gross Profit
|
Fiscal
2013
|
Fiscal
2012
|
||||||
|
(In thousands)
|
|||||||
|
Gross profit
|
$
|
42,284
|
|
$
|
25,331
|
|
|
|
Gross margin
|
18.3
|
%
|
14.2
|
%
|
|||
Gross margin fluctuates with revenue levels, product mix, selling prices, factory loading and material costs. For fiscal
2013
, gross profit increased
$17.0 million
primarily due to the effect of the MicroProbe Acquisition and our cost reduction initiatives to lower material costs, labor expenses and overhead charges. This improvement in gross margin was partially offset by higher amortization of intangible assets that resulted from the MicroProbe Acquisition.
Gross profit also improved in fiscal
2013
due to our cost reduction activities including the effect of the cessation of our Japan memory product assembly and test activities in the fourth quarter of
2012
, and other personnel restructuring actions and material cost reduction initiatives. Gross profit improvement was offset by an increase in net inventory provision write-downs of
$3.2 million
during fiscal 2013. The value of previously reserved materials that were used in manufacturing and shipped for fiscal
2013
and
2012
was
$2.6 million
and $1.3 million, respectively.
Gross margin included intangible asset amortization expense and inventory and fixed asset fair value step-up expense of $13.8 million and $8.5 million in fiscal 2013 and 2012, respectively, related to the MicroProbe Acquisition. Stock-based compensation expense included in gross margin for fiscal
2013
and
2012
was
$2.4 million
and
$2.6 million
, respectively. The decrease in stock-based compensation is due to less unvested options being earned in fiscal 2013 compared to the prior year.
Future gross margins may be adversely impacted by lower levels of product revenues, even though we have taken significant steps to reduce our operating cost structure. Our gross margins may also be adversely affected if we are required to record additional inventory provision charges and inventory write-downs if estimated average selling prices of products held in finished goods and work in process inventories are below the manufacturing cost of those products.
Research and Development
|
Fiscal
2013
|
Fiscal
2012
|
||||||
|
(In thousands)
|
|||||||
|
Research and development
|
$
|
42,139
|
|
$
|
40,130
|
|
|
|
% of revenues
|
18.2
|
%
|
22.5
|
%
|
|||
Research and development expenses for fiscal
2013
increased
$2.0 million
, or
5%
, compared to the prior year. While research and development expenses increased due to the full year impact of the MicroProbe Acquisition, this increase was partially offset by a decrease in other expenses as a result of our integration activities, including cost reduction efforts. As a percent of revenues, research and development expenses decreased
4.3%
in fiscal
2013
as compared to fiscal
2012
.
In fiscal
2013
, costs related to our research and development activities increased from fiscal
2012
, due to a net increase in headcount and personnel related costs of
$2.9 million
, reflecting additional headcount from the MicroProbe Acquisition and headcount reduction from on-going restructuring activities. This increase was offset by decreases in project and material costs of
$0.5 million
and other miscellaneous costs of
$0.5 million
, as compared to fiscal 2012. Stock-based compensation expenses included within research and development expenses were
$3.4 million
and
$4.3 million
, respectively, for fiscal
2013
and
2012
.
Our research and development expenses fluctuate as projects transition from development to manufacturing, depending on the stage of completion and level of effort related to each project undertaken. We are continuing our strategic investments in research and development, including investments in new vertical technology directed to testing SoC devices, advanced MicroSpring interconnect technology, new process technologies and a new platform architecture for NAND Flash memory
39
wafer probe cards. We suspended development activities specific to our next generation Matrix platform, and are consolidating our development and engineering efforts to extend the capabilities of the current Matrix platform. We remain committed to product development in new and emerging technologies.
Selling, General and Administrative
|
Fiscal
2013
|
Fiscal
2012
|
||||||
|
(In thousands)
|
|||||||
|
Selling, general and administrative
|
$
|
53,217
|
|
$
|
49,231
|
|
|
|
% of revenues
|
23.0
|
%
|
27.6
|
%
|
|||
Selling, general and administrative expenses increased
$4.0 million
, or
8%
, in fiscal
2013
compared to the prior year. Selling, general and administrative expenses increased primarily due to the impact of the MicroProbe Acquisition. As a percent of revenues, selling, general and administrative expenses decreased
4.6%
in fiscal
2013
as compared to fiscal
2012
due to cost reduction efforts.
In fiscal
2013
, salary and payroll related costs for selling, general and administrative functions increased by
$3 million
, respectively, as compared to fiscal
2012
primarily due to the impact of the MicroProbe Acquisition. Additionally, intangible asset amortization costs increased by
$2.3 million
in fiscal
2013
as compared to fiscal
2012
. The above increases were partially offset by a
$1.8 million
decrease in integration and acquisition-related expenses as compared to fiscal
2012
. Stock-based compensation expense included in selling, general and administrative expenses remained unchanged at
$6.2 million
each in fiscal
2013
and fiscal
2012
.
Restructuring Charges, net
|
Fiscal
2013
|
Fiscal
2012
|
||||||
|
(In thousands)
|
|||||||
|
Restructuring charges, net
|
$
|
4,658
|
|
$
|
2,917
|
|
|
|
% of revenues
|
2.0
|
%
|
1.6
|
%
|
|||
Restructuring charges increased
$1.7 million
in fiscal
2013
from fiscal
2012
. The restructuring plans we implemented in fiscal
2013
and
2012
are discussed below.
2013 Restructuring Activities
I
n the first quarter of fiscal 2013, we implemented the Q1 2013 Restructuring Plan which resulted in the reduction of our global workforce by 31 employees across the organization. In addition we reduced our temporary workforce by approximately 20 positions. We also suspended development activities and engineering efforts for our next generation DRAM Matrix platform and terminated development activities for a certain SoC product platform. We recorded $4.0 million of restructuring charges during the first fiscal quarter of 2013, which was comprised of $1.3 million in severance and related benefits and $2.7 million in impairment charges for certain equipment that was no longer utilized.
I
n the fourth fiscal quarter of 2013, we implemented a restructuring plan (the "Q4 2013 Restructuring Plan") which resulted in the reduction of our global workforce by
17
full-time employees across the organization. In addition, we reduced our temporary workforce by
17
positions. We recorded
$0.4 million
of restructuring charges during the fourth fiscal quarter of 2013 for severance and related benefits. As a result of the Q4 2013 Restructuring Plan, we expect to realize quarterly savings, excluding stock-based compensation, of approximately
$0.8 million
in subsequent quarters.
The liabilities we accrued represent our best estimate of the obligations we expect to incur and could be subject to adjustment as market conditions change. The remaining cash payments associated with our various reductions in workforce are expected to be paid by the end of the first fiscal quarter of
2014
. As such, the restructuring accrual is recorded as a current liability within ‘Accrued liabilities’ in the Consolidated Balance Sheet as of
December 28, 2013
.
40
2012 Restructuring Activities
During fiscal 2012, we initiated restructuring plans in our second, third and fourth fiscal quarters which resulted in the reduction of our global workforce by 49 full-time employees across the organization and the cessation of our memory product assembly and test activities in Japan. We reduced our temporary work force as well. We recorded $2.3 million in charges for severance and related benefits, $0.2 million in contract termination costs and $0.4 million in impairment charges for certain equipment and leasehold improvements that would no longer be utilized related to these plans.
The liabilities accrued for the above restructuring plans represent our best estimate of the obligations we expect to incur and could be subject to adjustment as market conditions change. The cash payments associated with our various fiscal 2012 reductions in force were paid in fiscal 2012 and 2013.
Loss on Sale of Subsidiary
|
Fiscal
2013
|
Fiscal
2012
|
||||||
|
(In thousands)
|
|||||||
|
Loss on sale of subsidiary
|
$
|
300
|
|
$
|
—
|
|
|
|
% of revenues
|
0.1
|
%
|
—
|
%
|
|||
On June 29, 2013, we sold The Micromanipulator Company, or TMMC, a wholly owned subsidiary of MicroProbe based in Carson City, Nevada. TMMC manufactures manual, analytical probe stations and accessories. TMMC's assets were sold to its management team for a purchase consideration of
$1.0 million
. FormFactor received
$0.2 million
in cash upon the sale and a
$0.8 million
note to be repaid over
7
years at a
5%
interest rate. The fair value of the note was discounted to
$0.5 million
as of June 29, 2013. We included goodwill of $0.2 million and a trademark intangible asset, net of accumulated amortization, of $0.1 million in the loss on disposal of a subsidiary. We recorded a net loss on the sale of TMMC of $0.3 million in the second quarter of fiscal 2013.
Impairment of Long-Lived Assets
|
Fiscal
2013
|
Fiscal
2012
|
||||||
|
(In thousands)
|
|||||||
|
Impairment of long-lived assets
|
$
|
761
|
|
$
|
421
|
|
|
|
% of revenues
|
0.3
|
%
|
0.2
|
%
|
|||
We test long-lived assets or asset groups for recoverability when events or changes in circumstances indicate that their carrying amounts may not be recoverable. Below is a description of the impairment activities for fiscal
2013
and
2012
.
In fiscal
2013
, we recorded an impairment charge of
$0.8 million
related to certain manufacturing assets which were no longer utilized.
As we entered the fourth quarter of fiscal 2013, we faced increasing operational and financial challenges, including manufacturing overcapacity and weak operating performance which led to a deterioration in market conditions. As a result, during the fourth quarter of fiscal 2013, we reviewed the recoverability of our long-lived asset groups and we concluded that our business was able to fully recover the carrying amounts of our assets.
In fiscal
2012
, we recorded total impairments of $0.4 million, including $0.2 million related to terminations of certain construction-in-progress projects and $0.2 million related to certain assets which were previously held for sale that were determined to no longer be sellable and used for internal purposes.
During the third and fourth quarters of 2012, we reviewed the recoverability of our long lived assets due to a significant change in our business strategy in connection with our 2012 Restructuring Plan, recurring operating losses, net cash outflows from operations and continued decline in the Company's stock price. As a result of the review, we concluded our business was able to fully recover the carrying amounts of our assets.
41
Management believes it is reasonably possible that additional impairment charges that would reduce further the carrying amounts of our property and equipment and intangible assets may arise in fiscal
2014
if we are unable to achieve cash flows anticipated by our forecasted financial plan.
Gain on Settlement of Litigation
|
Fiscal
2013
|
Fiscal
2012
|
||||||
|
(In thousands)
|
|||||||
|
Gain on settlement of litigation
|
$
|
—
|
|
$
|
(3,250
|
)
|
|
|
% of revenues
|
—
|
%
|
(1.8
|
)%
|
|||
In July 2010, we filed a lawsuit against Micro-Probe Incorporated, or Micro-Probe Inc., and one of its officers who was a former FormFactor employee, asserting patent infringement and unfair competition claims against Micro-Probe Inc., and trade secret misappropriation and breach of confidence claims. On October 16, 2012, and in connection with the MicroProbe Acquisition, we agreed to settle all outstanding litigation with Astria, Micro-Probe, Inc. and the former employee in favor of FormFactor for $3.3 million.
Interest Income and Other Income, Net
|
Fiscal
2013
|
Fiscal
2012
|
||||||
|
(In thousands)
|
|||||||
|
Interest income, net
|
$
|
386
|
|
$
|
691
|
|
|
|
% of revenues
|
0.2
|
%
|
0.4
|
%
|
|||
|
Other income, net
|
$
|
623
|
|
$
|
1,461
|
|
|
|
% of revenues
|
0.3
|
%
|
0.8
|
%
|
|||
Interest income is primarily earned on our cash, cash equivalents and marketable securities. The decrease in interest income for fiscal
2013
as compared to fiscal
2012
was primarily the result of lower average balances and was partially offset by interest income from our note receivable from TMMC-refer to Note 8 - Fair Value - to the Notes to Consolidated Financial Statements for further details. Cash, cash equivalents, restricted cash and marketable securities were
$151.5 million
at
December 28, 2013
compared to
$166.1 million
at
December 29, 2012
. The weighted-average yield on our cash, cash equivalents and marketable securities for fiscal
2013
and
2012
was
0.25%
and 0.30%, respectively.
Other income, net is comprised primarily of foreign currency impact and various other gains and losses. The decrease in other income, net for fiscal
2013
compared to fiscal
2012
, was due primarily to foreign currency exchange losses as well as payments received during fiscal 2012 from an intellectual property settlement.
Benefit from Income Taxes
|
Fiscal
2013
|
Fiscal
2012
|
||||||
|
(In thousands)
|
|||||||
|
Benefit from income taxes
|
$
|
(99
|
)
|
$
|
(26,420
|
)
|
|
|
Effective tax rate
|
(0.2
|
)%
|
(42.6
|
)%
|
|||
We recorded an income tax benefit of
$0.1 million
and
$26.4 million
for fiscal 2013 and fiscal 2012, respectively. Our income tax provisions reflect the tax provision on our non- U.S. operations in foreign jurisdictions and the tax benefit from the lapsing of the statute of limitations in US and foreign jurisdictions and reinstatement of the Federal R&D tax credit which was retroactively applied to 2012.
Included in the
$26.4 million
income tax benefit for the year ended December 29, 2012 is a
$25.5 million
tax benefit from the release of valuation allowance of our deferred tax assets ("DTAs"). In connection with our acquisition of MicroProbe Aquisition during the year ended December 29, 2012, deferred tax liabilities ("DTLs") were established on the acquired
42
identifiable intangible assets. These DTLs exceeded the acquired DTAs by
$25.5 million
and created additional sources of income to realize a tax benefit for our DTAs.
Authoritative guidance requires the impact on the acquiring company's deferred tax assets and liabilities caused by an acquisition be recorded in the acquiring company's financial statements outside of acquisition accounting. Accordingly, the valuation allowance on a portion of our DTAs was released and resulted in an income tax benefit of
$25.5 million
.
We recognize interest (benefit) charges and penalties related to uncertain tax positions as part of the income tax provision. We recognized interest (benefit) charges and penalties of
$(0.2) million
and
$0.3 million
in fiscal
2013
and
2012
, respectively. As of
December 28, 2013
and
December 29, 2012
, we have accrued total interest charges and penalties of
$0.2 million
and
$0.4 million
, respectively, related to uncertain tax positions.
We anticipate that we will continue to record a valuation allowance against our U.S. deferred tax assets. We expect our future tax provisions, during the time such valuation allowances are recorded, will consist primarily of the tax provision of our profitable non-U.S. jurisdictions. At
December 28, 2013
, we had Federal research and development tax credit, net operating loss, and foreign tax credit carryforwards of
$18.7 million
,
$328.4 million
and
$1.7 million
, which will expire at various dates from
2016
through
2033
. We had alternative minimum tax credits of
$2.4 million
which do not expire. We had California research credit and net operating loss carryforwards of
$23.5 million
and
$270.5 million
, respectively. The California research credit can be carried forward indefinitely while California net operating loss carryforwards will expire at various dates from
2030
through
2033
. We had Singapore net operating loss carryforwards of
$11.5 million
which can be carried forward indefinitely.
Our effective tax rate may vary from period to period based on changes in estimated taxable income or loss by jurisdiction, changes to the valuation allowance, changes to U.S. Federal, state or foreign tax laws, future expansion into areas with varying country, state, and local income tax rates, deductibility of certain costs and expenses by jurisdiction.
Fiscal Years Ended December 29, 2012 and December 31, 2011 Revenues
|
Fiscal
|
% of
|
Fiscal
|
% of
|
Change
|
||||||||||||||||
|
2012
|
Revenues
|
2011
|
Revenues
|
$
|
%
|
|||||||||||||||
|
(In thousands)
|
||||||||||||||||||||
|
Revenues by Market:
|
||||||||||||||||||||
|
DRAM
|
$
|
102,499
|
|
57.4
|
%
|
$
|
115,678
|
|
68.3
|
%
|
$
|
(13,179
|
)
|
(11.4
|
)%
|
|||||
|
SoC
|
46,586
|
|
26.1
|
|
29,050
|
|
17.2
|
|
17,536
|
|
60.4
|
|
||||||||
|
Flash
|
29,450
|
|
16.5
|
|
24,597
|
|
14.5
|
|
4,853
|
|
19.7
|
|
||||||||
|
Total revenues
|
$
|
178,535
|
|
100.0
|
%
|
$
|
169,325
|
|
100.0
|
%
|
$
|
9,210
|
|
5.4
|
%
|
|||||
For the global semiconductor market, overall device shipments were down in 2012 compared to 2011. Revenues in the memory markets saw the largest reduction compared to the SoC market. The DRAM market weakened, particularly in the second half of the year, as forecasted consumer demand for personal computers, or PC's, did not materialize and device pricing fell to levels resulting in unprofitable business for most suppliers. The NOR and NAND Flash markets also declined, driven by slow growth in bit shipments leading to an inventory oversupply and reduced production capacity by leading producers. SoC revenue reductions were not as severe as those for memory markets, with PC demand-related reductions somewhat offset by growth in mobile processor demand.
Overall, our revenues increased by 5%, or $9.2 million, in fiscal 2012 as compared to fiscal 2011, of which $19.8 million was due to the MicroProbe acquisition. Our revenues increased 60.4% year-over-year in the SoC market and 19.7% in Flash, but were down 11.4% in DRAM. The change in Flash and DRAM revenues was primarily driven by unit volume, while the increase in the SoC revenues was attributed to our MicroProbe Acquisition.
Our revenues for fiscal 2012 were primarily generated by sales of wafer probe cards to manufacturers of DRAM devices. The year-on-year reduction in our revenue from sales to DRAM device manufacturers in fiscal 2012 aligned closely with the overall weakening of the DRAM semiconductor market revenue, particularly in the second half of the year. Forecasted consumer demand for PC's did not materialize and device pricing fell to levels resulting in unprofitable business for most suppliers.
43
Revenues from sales to Flash memory device manufacturers increased in fiscal 2012 compared to the prior year. The increase was mainly driven by increased market share of our TouchMatrix300 product at a major NAND Flash producer in South Korea. Our NOR Flash revenue decreased at a similar rate to the overall NOR Flash semiconductor market for the year.
The significant increase in the SoC segment is attributed primarily to our MicroProbe Acquisition and accelerated market adoption of advanced SoC probe card technologies in place of the traditional cantilever probe cards. Within MicroProbe's revenue, the Vx-MP MEMS and Apollo vertical products that are primarily used to test leading edge mobile SoC chips and microprocessors, accounted for the majority of its revenues.
Revenues by Geographic Region
The following table sets forth our revenues by geographic region for the periods indicated:
|
Fiscal
2012
|
% of
Revenues
|
Fiscal
2011
|
% of
Revenues
|
||||||||||
|
(In thousands)
|
|||||||||||||
|
South Korea
|
$
|
58,515
|
|
32.8
|
%
|
$
|
39,219
|
|
23.1
|
%
|
|||
|
Taiwan
|
36,963
|
|
20.7
|
|
53,844
|
|
31.8
|
|
|||||
|
North America
|
27,508
|
|
15.4
|
|
25,880
|
|
15.3
|
|
|||||
|
Japan
|
21,314
|
|
11.9
|
|
29,467
|
|
17.4
|
|
|||||
|
Asia-Pacific(1)
|
22,573
|
|
12.7
|
|
13,860
|
|
8.2
|
|
|||||
|
Europe
|
11,662
|
|
6.5
|
|
7,055
|
|
4.2
|
|
|||||
|
Total revenues
|
$
|
178,535
|
|
100.0
|
%
|
$
|
169,325
|
|
100.0
|
%
|
|||
|
(1)
|
Asia-Pacific includes all countries in the region except Taiwan, South Korea, and Japan, which are disclosed separately.
|
Geographic revenue information is based on the location to which we ship the customer product. For example, if a certain South Korean customer purchases through their North American subsidiary and requests the products to be shipped to an address in Asia-Pacific, this sale will be reflected in the revenue for Asia-Pacific rather than North America.
The increases from fiscal 2011 to 2012 in South Korea and Asia-Pacific revenues were related to market share gains and a growing available market for our SmartMatrix100 product at a major DRAM manufacturer. South Korea revenue also increased due to improved market share of our TouchMatrix300 product at a major NAND Flash producer. North America and Europe revenue increases were primarily driven by our MicroProbe Acquisition and the sales of Vx-MP MEMS and Apollo vertical products. Revenue decreases in Taiwan and Japan were primarily driven by decreased demand for our DRAM products due to a weakening global DRAM market.
Gross Profit
|
Fiscal
2012
|
Fiscal
2011
|
||||||
|
(In thousands)
|
|||||||
|
Gross profit
|
$
|
25,331
|
|
$
|
20,958
|
|
|
|
Gross margin
|
14.2
|
%
|
12.4
|
%
|
|||
Gross margin fluctuates with revenue levels, product mix, selling prices, factory loading and material costs. For fiscal 2012, gross profit increased $4.4 million compared to fiscal 2011. The increase was primarily due to the benefit of higher gross margins generated from the product lines obtained from our MicroProbe acquisition in addition to lower material costs, and reduced manufacturing overhead expenses from the existing FormFactor production. Manufacturing overhead costs were lower because of the cessation of assembly and test activities in Japan and our worldwide reduction in workforce, which combined generated a savings of $0.8 million for fiscal 2012. Our gross margin benefited from lower excess inventory charges.
The gross margin improvements were offset by higher direct labor costs relative to revenue levels, service and warranty costs. Gross margin was also negatively impacted by $8.5 million of additional amortization and depreciation costs for the tangible and intangible assets associated with our MicroProbe Acquisition.
44
As mentioned above, gross margin for fiscal 2012 also improved compared to the prior year due to a $0.7 million decrease in inventory provision charges. This improvement is the result of current and ongoing initiatives to improve material planning, procurement and production processes that resulted in the continual reduction in our excess inventory levels. Excess custom inventories are not uncommon for our company because our advanced wafer probe cards are custom designs manufactured in low volumes and delivered on relatively short lead times. This requires us to acquire production materials and start certain production activities based on estimated production yields and forecasted demand prior to or in excess of actual demand for our wafer probe cards. In fiscal 2012, the value of previously reserved materials that were used in manufacturing and shipped was $1.3 million as compared to $2.5 million in fiscal 2011.
Gross margin included amortization expense on intangible assets for fiscal 2012 and 2011 of $6.0 million and $1.2 million, respectively. Stock-based compensation expense included in gross margin for fiscal 2012 and 2011 was $2.6 million and $3.5 million, respectively. The decrease was primarily due to fewer unvested options outstanding being amortized to expense.
In the future, our gross margins may be adversely impacted by lower levels of product revenues, even though we have taken significant steps to reduce our operating cost structure. Our gross margins may also be adversely affected if we are required to record additional inventory provision charges and inventory write-downs if estimated average selling prices of products held in finished goods and work in process inventories are below the manufacturing cost of those products.
Research and Development
|
Fiscal
2012
|
Fiscal
2011
|
||||||
|
(In thousands)
|
|||||||
|
Research and development
|
$
|
40,130
|
|
$
|
43,544
|
|
|
|
% of revenues
|
22.5
|
%
|
25.7
|
%
|
|||
Research and development expenses for fiscal 2012 decreased $3.4 million, or 8%, compared to the prior year. Our research and development expenses fluctuate as projects transition from development to manufacturing. Depending on the stage of completion and level of effort related to each project undertaken, we may reflect variations in our research and development spending. As a percent of revenues, research and development expenses decreased in fiscal 2012 to 22.5% as compared to 25.7% in fiscal 2011 primarily due to lower spending.
In fiscal 2012, expenses related to our research and development activities decreased from fiscal 2011 primarily due to lower materials costs of $3.2 million, licensing and equipment costs of $0.5 million, decrease in depreciation expense of $0.2 million, partially offset by increased facility and related costs of $0.6 million. Stock-based compensation included within research and development expenses remained flat at $4.3 million for fiscal 2012 compared to 2011.
In fiscal 2012, we continued our strategic investments in research and development, including investments in new vertical technology directed to testing SoC devices, advanced MicroSpring interconnect technology and new process technologies. In our first quarter of fiscal 2013 we announced that we had taken actions to reduce the investments in commodity DRAM test, but were continuing to develop product capabilities focused on mobile DRAM. We suspended development activities specific to our next generation Matrix platform, and consolidated our development and engineering efforts to extend the capabilities of the current Matrix platform. We remain committed to product development in new and emerging technologies.
Selling, General and Administrative
|
Fiscal
2012
|
Fiscal
2011
|
||||||
|
(In thousands)
|
|||||||
|
Selling, general and administrative
|
$
|
49,231
|
|
$
|
46,705
|
|
|
|
% of revenues
|
27.6
|
%
|
27.6
|
%
|
|||
Selling, general and administrative expenses increased $2.5 million, or 5%, for fiscal 2012 compared to the prior year. As a percent of revenues, selling, general and administrative expenses remained flat in fiscal 2012.
45
For fiscal 2012, the increase in selling, general and administrative expenses was due to $3.0 million of acquisition and integration costs relating to the MicroProbe Acquisition, $0.6 million intangible amortization expense, a $1.2 million increase in certain selling and marketing activities associated with new technology platforms, a $0.8 million increase in bad debt expense. The increased expenses were offset by a decrease in taxes and license costs of $2.0 million, including $0.6 million accrual release of foreign customs and value added tax, a decrease in our legal and outside service fees of $1.2 million, and a decrease due to workforce reduction of $0.4 million. Total amortization expense on intangible assets for fiscal 2012 and 2011 were $0.6 million and $0.0 million, respectively. Stock-based compensation expenses included within selling, general and administrative expense were $6.2 million in fiscal 2012 compared to $6.1 million in fiscal 2011. The increase is primarily due to increase in employee stock awards due to the acquisition.
Restructuring Charges, net
|
Fiscal
2012
|
Fiscal
2011
|
||||||
|
(In thousands)
|
|||||||
|
Restructuring charges
|
$
|
2,917
|
|
$
|
522
|
|
|
|
% of revenues
|
1.6
|
%
|
0.3
|
%
|
|||
Restructuring charges increased $2.4 million in fiscal 2012 from fiscal 2011. The restructuring plans we implemented in fiscal 2012 and 2011 are discussed below.
2012 Restructuring Activities
During fiscal 2012, we initiated restructuring plans in our second, third and fourth fiscal quarters which resulted in the reduction of our global workforce by 49 full-time employees across the organization and the cessation of our memory product assembly and test activities in Japan. We reduced our temporary work force as well. We recorded $2.3 million in charges for severance and related benefits, $0.2 million in contract termination and $0.4 million in impairment charges for certain equipment and leasehold improvements that would no longer be utilized related to these plans.
The liabilities we have accrued for the restructuring plans discussed above represent our best estimate of the obligations we expect to incur and could be subject to adjustment as market conditions change. The remaining cash payments associated with our various reductions in force were paid in fiscal 2013.
2011 Restructuring Activities
During fiscal 2011, we initiated restructuring plans in each of our fiscal quarters which resulted in the reduction of our global workforce by 38 full-time employees across the organization. We recorded $2.3 million in charges for severance and related benefits related to this plan. In fiscal 2011 we executed an amendment to the existing lease arrangement for our facility in Singapore which released us from our obligations related to the area previously utilized for manufacturing in this facility. We were also granted a rent reduction for the remaining occupied facilities in this building. We had previously recorded certain asset retirement obligations of $1.1 million and accruals related to our cessation of the use of these facilities in connection with a prior restructuring action of $0.4 million. As a result, we reflected a benefit of $1.5 million recorded in 2011.
Impairment of Long-Lived Assets
|
Fiscal
2012
|
Fiscal
2011
|
||||||
|
(In thousands)
|
|||||||
|
Impairment of long-lived assets
|
$
|
421
|
|
$
|
549
|
|
|
|
% of revenues
|
0.2
|
%
|
0.3
|
%
|
|||
We test long-lived assets or asset groups for recoverability when events or changes in circumstances indicate that their carrying amounts may not be recoverable. Below is a description of the impairment activities for fiscal 2012 and 2011.
46
In fiscal 2012, we recorded total impairments of $0.4 million, including $0.2 million related to terminations of certain construction-in-progress projects and $0.2 million related to certain assets which were previously held for sale that were determined to no longer be sellable and used for internal purposes.
During the third and fourth quarters of 2012, we reviewed the recoverability of our long lived assets due to a significant change in our business strategy in connection with our 2012 Restructuring Plan, due to recurring operating losses, net cash outflows from operations and continued decline in the Company's stock price. As a result of the review, we concluded our business was able to fully recover the carrying amounts of our assets.
In fiscal 2011, we recorded total impairments of $0.5 million related to the termination of certain on-going projects, including certain software development for internal use that had been recorded in construction-in-progress.
Gain on Settlement of Litigation
|
Fiscal
2012
|
Fiscal
2011
|
||||||
|
(In thousands)
|
|||||||
|
Gain on settlement of litigation
|
$
|
(3,250
|
)
|
$
|
—
|
|
|
|
% of revenues
|
(1.8
|
)%
|
—
|
|
|||
In July 2010, we filed a lawsuit against Micro-Probe Incorporated or Micro-Probe Inc., and one of its officers who was a former FormFactor employee asserting patent infringement and unfair competition claims against Micro-Probe Inc., and trade secret misappropriation and breach of confidence claims. On October 16, 2012, and in connection with the MicroProbe Acquisition, we agreed to settle all outstanding litigation with Astria, Micro-Probe Inc. and the former employee in favor of FormFactor for $3.3 million.
Interest Income and Other Income, Net
|
Fiscal
2012
|
Fiscal
2011
|
||||||
|
(In thousands)
|
|||||||
|
Interest income
|
$
|
691
|
|
$
|
1,404
|
|
|
|
% of revenues
|
0.4
|
%
|
0.8
|
%
|
|||
|
Other income, net
|
$
|
1,461
|
|
$
|
1,076
|
|
|
|
% of revenues
|
0.8
|
%
|
0.6
|
%
|
|||
Interest income is primarily earned on our cash, cash equivalents and marketable securities. The decrease in interest income for fiscal 2012 as compared to fiscal 2011 was primarily the result of lower average balances. The reduction in our cash, cash equivalents, restricted cash and marketable securities to $166.1 million at December 29, 2012 as compared to $297.0 million at December 31, 2011 was driven by our MicroProbe Acquisition and operating losses. The weighted-average yield on our cash, cash equivalents and marketable securities for fiscal 2012 was 0.30% compared to 0.45% for fiscal 2011.
Other income, net was comprised primarily of foreign currency impact and various other gains and losses. The change in other income, net for fiscal 2012 compared to fiscal 2011 was primarily due to lower foreign currency losses in 2012.
Benefit from Income Taxes
|
Fiscal
2012
|
Fiscal
2011
|
||||||
|
(In thousands)
|
|||||||
|
Benefit from income taxes
|
$
|
(26,420
|
)
|
$
|
(1,901
|
)
|
|
|
Effective tax rate
|
42.6
|
%
|
(2.8
|
)%
|
|||
47
Included in the $26.4 million income tax benefit for fiscal 2012 is a $25.5 million tax benefit from the release of valuation allowances on our deferred tax assets ("DTAs"). In connection with our MicroProbe Acquisition during fiscal 2012, deferred tax liabilities ("DTLs") were established on the acquired identifiable intangible assets. These DTLs exceeded the acquired DTAs by $25.5 million. The excess DTLs allow us to realize a tax benefit by releasing the valuation allowances associated with our DTAs. Accordingly, the valuation allowances on a portion of our DTAs were released and resulted in an income tax benefit of $25.5 million.
We recognize interest charges and penalties related to uncertain tax positions as part of the income tax provision. We recognized interest charges and penalties of $0.3 million and $12,000, respectively during fiscal 2012 and 2011. As of December 29, 2012 and December 31, 2011 we had accrued total interest charges and penalties of $0.4 million and $0.7 million, respectively, related to the uncertain tax positions.
We anticipate that we will continue to record a valuation allowance against our U.S. deferred tax assets. We expect our future tax provisions, during the time such valuation allowances are recorded, will consist primarily of the tax provision of our profitable non-U.S. jurisdictions. At December 29, 2012, we had Federal, state and foreign net operating loss carryforwards of $284.2 million, $266.7 million and $12.2 million, respectively. The Federal net operating loss carryforwards expire at various dates from 2016 through 2032, the state net operating loss carryforwards expire at various dates from 2030 through 2032, and the foreign net operating loss carryforwards can be carried forward indefinitely.
Our effective tax rate may vary from period to period based on changes in estimated taxable income or loss by jurisdiction, changes to the valuation allowance, changes to U.S. Federal, state or foreign tax laws, future expansion into areas with varying country, state, and local income tax rates, deductibility of certain costs and expenses by jurisdiction.
On January 2, 2013, President Obama signed into law the American Taxpayer Relief Act of 2012, which includes retroactive extension of the research credit from January 1, 2012 through December 31, 2013. This enacted tax law resulted in an increase in the Company's gross deferred tax asset by approximately $0.4 million, offset by a valuation allowance, during the first quarter of 2013. The Company concluded this enacted law change had immaterial effect on its financials.
Liquidity and Capital Resources
Capital Resources:
Our working capital was
$173.9 million
at
December 28, 2013
and
$194.1 million
at
December 29, 2012
. The decrease in working capital in the year ended
December 28, 2013
was primarily due to the use of cash, cash equivalents and marketable securities to fund operations and fixed asset purchases.
Cash and cash equivalents consist of deposits held at banks, money market funds, U.S. government securities and commercial paper that at the time of purchase had maturities of 90 days or less. Marketable securities consist of U.S. government and agency securities and commercial paper. We typically invest in highly-rated securities with low probabilities of default. Our investment policy requires investments to be rated single-A or better, and limits the types of acceptable investments, issuer concentration and duration of the investment.
Our cash, cash equivalents and marketable securities totaled
$151.1 million
at
December 28, 2013
compared to
$165.8 million
at
December 29, 2012
. Cash, cash equivalents and marketable securities included
$16.6 million
held by our foreign subsidiaries as of
December 28, 2013
. The decrease in our cash, cash equivalents and marketable securities balances was primarily due to the net cash used in our operating activities and cash used to acquire property, plant and equipment. We believe that we will be able to satisfy our working capital requirements for at least the next twelve months with the liquidity provided by our existing cash, cash equivalents and marketable securities. If we are unsuccessful in improving our operating efficiency, reducing our cash outlays or increasing our available cash through financing, our cash, cash equivalents and marketable securities will further decline in fiscal
2014
.
We utilize a variety of tax planning and financing strategies in an effort to manage our worldwide cash and deploy funds to locations where they are needed. As part of these strategies, we indefinitely reinvest a significant portion of our foreign earnings and our current plans do not demonstrate a need to repatriate these earnings. Should we require additional capital in the United States, we may elect to repatriate indefinitely reinvested foreign funds or raise capital in the United States through debt. If we were to repatriate indefinitely reinvested foreign funds, we would be required to accrue and pay additional United States taxes less applicable foreign tax credits.
Day Sales Outstanding:
Days sales outstanding from receivables, or DSO, were
52
days at
December 28, 2013
compared with 49 days at
December 29, 2012
. Our DSO calculation is determined using the count back method and is based on
48
gross accounts receivable (including accounts receivable for amounts in deferred revenue). The increase in DSO is primarily due to a change in customer mix resulting in a greater proportion of sales with 60 day payment terms.
|
Fiscal
2013
|
Fiscal
2012
|
Fiscal
2011
|
|||||||||
|
(In thousands)
|
|||||||||||
|
Net cash used in operating activities
|
$
|
(5,802
|
)
|
$
|
(26,228
|
)
|
$
|
(29,343
|
)
|
||
|
Net cash (used in) provided by investing activities
|
(7,750
|
)
|
(40,701
|
)
|
60,712
|
|
|||||
|
Net cash provided by (used in) financing activities
|
1,999
|
|
2,139
|
|
(12,902
|
)
|
|||||
Cash flows from operating activities:
Net cash used in operating activities for fiscal
2013
was primarily attributable to the net change in operating assets and liabilities that used
$5.3 million
of cash. The company had a net loss of
$57.7 million
which was offset by non-cash expenses of
$57.2 million
, including
$28.9 million
for depreciation and amortization,
$12.1 million
for stock-based compensation,
$10.5 million
of provision for excess and obsolete inventories,
$2.7 million
for non-cash restructuring activities and
$0.8 million
related to impairment of long-lived assets.
The net change in operating assets and liabilities for fiscal
2013
was comprised of cash used of
$8.0 million
for inventory due to inventory build,
$2.1 million
increase in accounts receivable due to customer mix changes and higher sales,
$2.3 million
reduction in accounts payable driven by the timing of our payments on vendor obligations and
$2.5 million
reduction in accrued liabilities primarily related to lower accrued payroll and bonus. These uses of cash were partially offset by cash generated from
$5.1 million
of income tax refunds, a reduction of
$3.6 million
of prepaid and other current assets due to
receipt of the MicroProbe Acquisition working capital adjustment from Astria Semiconductor Holdings Inc. shareholders and reduced prepaid expenses and import taxes, and an increase of
$1.0 million
in deferred revenues due to shipments to customers for which our revenue recognition criteria have not yet been met.
Net cash used in operating activities for fiscal 2012 was primarily attributable to our net loss of $35.5 million, a non-cash $24.5 million benefit resulting from changes in deferred tax assets and a non-cash $3.3 million gain on litigation settlement. This was offset by non-cash expenses of $13.0 million for stock-based compensation, $16.9 million for depreciation and amortization and $7.2 million of provision for excess and obsolete inventories.
The net change in operating assets and liabilities for fiscal 2012 was an increase in net assets, or net use of cash, of $2.5 million, net of the operating assets and liabilities assumed from the MicroProbe acquisition. The increase in net assets was comprised of a decrease in our accounts receivable of $5.2 million, excluding the effect of the accounts receivables assumed in the MicroProbe acquisition, due to our improved collection of payments from customers as well as shortened payment terms for certain customers and a $1.1 million increase in deferred revenues due to shipments to customers for which our revenue recognition criteria had not yet been met, offset in part by a decrease, or source of cash, of $5.9 million in accounts payable driven by payments for vendor obligations assumed in the MicroProbe Acquisition which were past due, and a decrease of $2.1 million in income taxes payable due to the release of a reserve for uncertain tax positions related to the lapsing of the statute of limitations in the U.S. jurisdiction.
Cash flows from investing activities:
Net cash used in investing activities for fiscal
2013
was primarily related to the purchases of marketable securities and property and equipment totaling
$91.3 million
and
$8.5 million
, respectively. These uses of cash were partially offset by proceeds from maturities of marketable securities of
$90.4 million
and proceeds from the sales of marketable securities of
$2.0 million
. We carefully monitor our investments to minimize risks and have not experienced other than temporary investment losses. Except for experiencing declining yields, our investment portfolio has not been negatively impacted by the economic turmoil in the credit markets in the recent past.
Net cash used in investing activities for fiscal 2012 was primarily related to cash used in the MicroProbe Acquisition of $96.7 million net of cash acquired, purchases of marketable securities and property and equipment totaling $82.4 million and $8.0 million, respectively. These uses of cash were partially offset by proceeds from maturities of marketable securities of $135.3 million and proceeds from the sales of marketable securities of $11.0 million.
Cash flows from financing activities:
Net cash provided by financing activities for fiscal
2013
included
$2.6 million
in proceeds received from purchases under our Employee Stock Purchase Plan, or ESPP, offset by stock withheld in lieu of payment of employee taxes related to the release of restricted stock units. This receipt of cash was partially offset by payments of
$0.6 million
made on capital leases.
49
Net cash provided by financing activities for fiscal 2012 included $2.3 million in proceeds received from purchases under our ESPP, offset by stock withheld in lieu of payment of employee taxes related to the release of restricted stock units.
Our cash, cash equivalents and marketable securities declined in fiscal
2013
. We continue to focus on improving our operating efficiency to increase operating cash flows. Our actions have included implementing operational expense reduction initiatives, delaying or eliminating certain capital spending and research and development projects, focusing on timely customer collections and re-negotiating longer payment terms with our vendors. We believe that we will be able to satisfy our cash requirements for at least the next twelve months with the liquidity provided by our existing cash, cash equivalents and marketable securities. To the extent necessary, we may also consider establishing manufacturing and technology partnerships, or to seek short and long-term debt obligations, or to obtain new financing facilities which may not be available on terms favorable to us or at all. Our future capital requirements may vary materially from those now planned. However, if we are unsuccessful in increasing revenues, improving our operating efficiency, executing our cost reduction plan, reducing our cash outlays or increasing our available cash through financing, our cash, cash equivalents and marketable securities will decline in future fiscal years.
Contractual Obligations and Commitments
The following table summarizes our significant commitments to make future payments in cash under contractual obligations as of
December 28, 2013
:
|
Payments Due In Fiscal Years
|
|||||||||||||||||||
|
2014
|
2015-2016
|
2017-2018
|
After 2018
|
Total
|
|||||||||||||||
|
(In thousands)
|
|||||||||||||||||||
|
Operating leases
|
$
|
4,223
|
|
$
|
6,243
|
|
$
|
5,107
|
|
$
|
7,432
|
|
$
|
23,005
|
|
||||
|
Purchase obligations
|
9,849
|
|
839
|
|
—
|
|
—
|
|
10,688
|
|
|||||||||
|
Capital leases
|
270
|
|
—
|
|
—
|
|
—
|
|
270
|
|
|||||||||
|
Total
|
$
|
14,342
|
|
$
|
7,082
|
|
$
|
5,107
|
|
$
|
7,432
|
|
$
|
33,963
|
|
||||
Purchase obligations are primarily for purchases of inventory and manufacturing related service contracts. For the purposes of this table, purchase obligations are defined as agreements that are enforceable and legally binding and that specify all significant terms, including: fixed or minimum quantities to be purchased; fixed, minimum or variable price provisions; and the approximate timing of the transaction. The expected timing of payment of the obligations discussed above is estimated based on information available to us as of
December 28, 2013
. Timing of payments and actual amounts paid may be different depending on the timing of receipt of goods or services or changes to agreed-upon amounts for some obligations.
The table above excludes our gross liability for unrecognized tax benefits, which totaled approximately
$17.0 million
as of
December 28, 2013
and are classified in deferred taxes and other long-term tax liabilities on our consolidated balance sheet. The timing of any payments which could result from these unrecognized tax benefits will depend upon a number of factors. Accordingly, the timing of payment cannot be estimated and has been excluded from the table above. As of
December 28, 2013
, the changes to our uncertain tax positions in the next 12 months that are reasonable and probable are not expected to have a significant impact on our financial position or results of operations.
Off-Balance Sheet Arrangements
Historically, we have not participated in transactions that have generated relationships with unconsolidated entities or financial partnerships, such as entities often referred to as structured finance or special purpose entities, which would have been established for the purpose of facilitating off-balance sheet arrangements or other contractually narrow or limited purposes. As of
December 28, 2013
, we were not involved in any off-balance sheet arrangements.
Indemnification Agreements
We may, from time to time in the ordinary course of our business enter into contractual arrangements with third parties that include indemnification obligations. Under these contractual arrangements, we have agreed to defend, indemnify and/or hold the third party harmless from and against certain liabilities. These arrangements include indemnities in favor of customers in the event that our wafer probe cards infringe a third party's intellectual property and our lessors in connection with facility leasehold liabilities that we may cause. In addition, we have entered into indemnification agreements with our directors and
50
certain of our officers, and our bylaws contain indemnification obligations in favor of our directors, officers and agents. These indemnity arrangements may limit the type of the claim, the total amount that we can be required to pay in connection with the indemnification obligation and the time within which an indemnification claim can be made. The duration of the indemnification obligation may vary and, for most arrangements, survives the agreement term and is indefinite. We believe that substantially all of our indemnity arrangements provide either for limitations on the maximum potential future payments we could be obligated to make, or for limitations on the types of claims and damages we could be obligated to indemnify, or for both. However, it is not possible to determine or reasonably estimate the maximum potential amount of future payments under these indemnification obligations due to the varying terms of such obligations, the history of prior indemnification claims, the unique facts and circumstances involved in each particular contractual arrangement and in each potential future claim for indemnification, and the contingency of any potential liabilities upon the occurrence of events that are not reasonably determinable. We have not had any requests for indemnification under these arrangements. Our management believes that any liability for these indemnity arrangements would not be material to our accompanying consolidated financial statements. We have not recorded any liabilities for these indemnification arrangements on our consolidated balance sheet as of
December 28, 2013
.
Recent Accounting Pronouncements
Please refer to the discussion of our recent accounting pronouncements in Note 2—Summary of Significant Accounting Policies of the Notes to the Consolidated Financial Statements under Part II, Item 8 in this Annual Report on Form 10-K.
Item 7A:
Quantitative and Qualitative Disclosures about Market Risk
Foreign Currency Exchange Risk.
We conduct certain operations in foreign currencies. We enter into currency forward exchange contracts to hedge a portion, but not all, of existing foreign currency denominated amounts. Gains and losses on these contracts are generally recognized in other income. Because the effect of movements in currency exchange rates on the currency forward exchange contracts generally offsets the related effect on the underlying items being hedged, these financial instruments are not expected to subject us to risks that would otherwise result from changes in currency exchange rates. We do not use derivative financial instruments for trading or speculative purposes. We recognized a net loss of
$0.6 million
and
$0.5 million
, respectively for fiscal
2013
and
2012
, from the fluctuation in foreign exchange rates and the valuation of these hedge contracts in our Consolidated Statements of Operations under “Other income, net”.
Interest Rate Sensitivity.
Our exposure to market risk for changes in interest rates relates primarily to our investment portfolio. We invest in a number of securities including U.S. agency discount notes, money market funds and commercial paper. We attempt to ensure the safety and preservation of our invested principal funds by limiting default risk, market risk and reinvestment risk. We mitigate default risk by investing in high grade investment securities. By policy, we limit the amount of credit exposure to an issuer, except U.S. Treasuries and U.S. agencies. We do not use interest rate derivative instruments to manage interest rate exposures nor do we invest for trading or speculative purposes. The fair market value of our fixed rate securities may be adversely impacted by increases in interest rates while income earned on floating rate securities may decline as a result of decreases in interest rates. A hypothetical 100 basis-point (one percentage point) increase or decrease in interest rates compared to rates at
December 28, 2013
and
December 29, 2012
would have affected the fair value of our investment portfolio by less than
$0.7 million
and
$1.2 million
, respectively.
Item 8:
Financial Statements and Supplementary Data
Consolidated Financial Statements
The consolidated financial statements and supplementary data of FormFactor required by this item are included in the section entitled "Consolidated Financial Statements" of this Annual Report on Form 10-K. See Item 15(a)(1) for a list of our consolidated financial statements.
Item 9:
Changes in and Disagreements with Accountants on Accounting and Financial Disclosure
None.
51
Item 9A:
Controls and Procedures
Evaluation of Disclosure Controls and Procedures
Based on our management's evaluation (with the participation of our Principal Executive Officer and Principal Financial Officer), as of the end of the period covered by this report, our Principal Executive Officer and Principal Financial Officer have concluded that our disclosure controls and procedures (as defined in Rules 13a-15(e) and 15d-15(e) under the Securities Exchange Act of 1934, as amended, (the "Exchange Act")) were effective to ensure that information required to be disclosed by us in reports that we file or submit under the Exchange Act is recorded, processed, summarized and reported within the time periods specified in SEC rules and forms and is accumulated and communicated to our management, including our Principal Executive Officer and Principal Financial Officer, as appropriate to allow timely decisions regarding required disclosure.
Changes in Internal Control over Financial Reporting
There was no change in our internal control over financial reporting (as defined in Rules 13a-15(f) and 15d-15(f) under the Exchange Act) other than the inclusion of Astria Semiconductor Holdings, Inc., including its subsidiary Micro-Probe Incorporated (together "MicroProbe") as noted below during the fiscal year ended
December 28, 2013
, that has materially affected, or is reasonably likely to materially affect, our internal control over financial reporting.
Management's Report on Internal Control over Financial Reporting
Our management is responsible for establishing and maintaining adequate internal control over financial reporting as defined in Rules 13a-15(f) and 15d-15(f) under the Exchange Act. Internal control over financial reporting is a process designed by, or under the supervision of, our Principal Executive Officer and Principal Financial Officer, and effected by our board of directors, management and other personnel and consultants, to provide reasonable assurance regarding the reliability of financial reporting and the preparation of financial statements for external purposes in accordance with generally accepted accounting principles, and includes those policies and procedures that:
(i) pertain to the maintenance of records that in reasonable detail accurately and fairly reflect our transactions and dispositions of assets;
(ii) provide reasonable assurance that transactions are recorded as necessary to permit preparation of financial statements in accordance with generally accepted accounting principles, and that our receipts and expenditures are being made only in accordance with the authorization of our management and directors; and
(iii) provide reasonable assurance regarding prevention or timely detection of unauthorized acquisition, use or disposition of our assets that could have a material effect on the financial statements.
Because of its inherent limitations, internal control over financial reporting may not prevent or detect misstatements. Also, projections of any evaluation of effectiveness to future periods are subject to the risk that controls may become inadequate because of changes in conditions, or that the degree of compliance with the policies or procedures may deteriorate.
Under the supervision and with the participation of our management, including our Principal Executive Officer and Principal Financial Officer, we conducted an assessment of the effectiveness of our internal control over financial reporting as of
December 28, 2013
. In making this assessment, our management used the criteria set forth in
Internal Control-Integrated Framework (1992)
issued by the Committee of Sponsoring Organizations of the Treadway Commission ("COSO"). Based on the results of this assessment, management has concluded that, our internal control over financial reporting was effective as of
December 28, 2013
, based on the criteria in
Internal Control-Integrated Framework (1992)
issued by the COSO.
Management has included MicroProbe, which was acquired on October 16, 2012, in its assessment of internal controls over financial reporting as of December 28, 2013.
The effectiveness of our internal control over financial reporting as of
December 28, 2013
has been audited by KPMG LLP, an independent registered public accounting firm, as stated in their report which appears in this Annual Report on Form 10-K.
Limitations on the Effectiveness of Controls
Control systems, no matter how well designed and operated, can provide only reasonable, not absolute, assurance that the control systems' objectives are being met. Further, the design of any control systems must reflect the fact that there are resource constraints, and the benefits of all controls must be considered relative to their costs. Because of the inherent limitations in all control systems, no evaluation of controls can provide absolute assurance that all control issues and instances of fraud, if any, within our company have been detected. These inherent limitations include the realities that judgments in decision making can be faulty and that breakdowns can occur because of simple error or mistake. Control systems can also be circumvented by the individual acts of some persons, by collusion of two or more people, or by management override of the
52
controls. The design of any system of controls is based, in part, on certain assumptions about the likelihood of future events, and there can be no assurance that any design will succeed in achieving its stated goals under all potential future conditions. Over time, controls may become inadequate because of changes in conditions or deterioration in the degree of compliance with policies or procedures.
CEO and CFO Certifications
We have attached as exhibits to this Annual Report on Form 10-K the certifications of our Chief Executive Officer and Chief Financial Officer, which are required in accordance with the Exchange Act. We recommend that this Item 9A be read in conjunction with the certifications for a more complete understanding of the subject matter presented.
Item 9B:
Other Information
None.
53
Item 10:
Directors, Executive Officers and Corporate Governance
Information concerning our board of directors, committees and directors, including our audit committee and audit committee financial expert, will be included in our Proxy Statement for our
2014
Annual Meeting of Stockholders, under the section entitled "Proposal No. 1—Election of Directors". The information in such portions of the Proxy Statement is incorporated in this Annual Report on Form 10-K by reference.
For biographical information with respect to our directors and executive officers, see Part I, Item 1 of this Annual Report on Form 10-K under the section entitled "Directors and Executive Officers".
Information concerning Section 16(a) beneficial ownership reporting compliance will appear in our Proxy Statement under the section entitled "Section 16(a) Beneficial Ownership Reporting Compliance". The information in such portion of the Proxy Statement is incorporated in this Annual Report on Form 10-K by reference.
We have adopted a Statement of Corporate Code of Business Conduct that applies to all directors, officers and employees of FormFactor and a Statement of Financial Code of Ethics that applies to our Chief Executive Officer, Chief Financial Officer, and other employees in our finance department. Information concerning these codes will appear in our Proxy Statement under the section entitled "Proposal No. 1—Election of Directors—Corporate Codes". The information in such portion of the Proxy Statement is incorporated in this Annual Report on Form 10-K by reference.
Item 11:
Executive Compensation
Information concerning executive officer compensation and related information will appear in our Proxy Statement under the section entitled "Compensation Discussion and Analysis", "Executive Compensation and Related Information", "Report of the Compensation Committee" and "Proposal No. 1—Election of Directors—Compensation Committee Interlocks and Insider Participation". Information concerning director compensation and related information will appear in our Proxy Statement under the section entitled "Proposal No. 1—Election of Directors". The information in such portions of the Proxy Statement is incorporated in this Annual Report on Form 10-K by reference.
Item 12:
Security Ownership of Certain Beneficial Owners and Management and Related Stockholder Matters
Information concerning the security ownership of certain beneficial owners and management and related stockholder matters will appear in our Proxy Statement under the section entitled "Security Ownership of Certain Beneficial Owners and Management and Related Stockholder Matters". The information in such portion of the Proxy Statement is incorporated in this Annual Report on Form 10-K by reference.
Information concerning our equity compensation plans will appear in our Proxy Statement under the section entitled "Security Ownership of Certain Beneficial Owners and Management and Related Stockholder Matters—Equity Compensation Plans". The information in such portion of the Proxy Statement is incorporated in this Annual Report on Form 10-K by reference.
Item 13:
Certain Relationships and Related Transactions, and Director Independence
Information concerning certain relationships and related transactions, including our related person transactions policy will appear in our Proxy Statement under the section entitled "Certain Relationships and Related Transactions". The information in such portion of the Proxy Statement is incorporated in this Annual Report on Form 10-K by reference.
Information concerning director independence will appear in our Proxy Statement under the section entitled "Proposal No. 1—Election of Directors". The information in such portion of the Proxy Statement is incorporated in this Annual Report on Form 10-K by reference.
Item 14:
Principal Accounting Fees and Services
Information concerning principal accounting fees and services and the audit committee's pre-approval policies and procedures will appear in our Proxy Statement under the section entitled "Proposal No. 2—Ratification of Selection of Independent Registered Public Accounting Firm". The information in such portion of the Proxy Statement is incorporated in this Annual Report on Form 10-K by reference.
54
Item 15:
Exhibits, Financial Statement Schedules
|
(a)
|
The following documents are filed as part of this Annual Report on Form 10-K:
|
(1)
Consolidated Financial Statements:
Report of Independent Registered Public Accounting Firms
Consolidated Balance Sheets
Consolidated Statements of Operations
Consolidated Statements of Comprehensive Loss
Consolidated Statements of Stockholders' Equity
Consolidated Statements of Cash Flows
Notes to Consolidated Financial Statements
(2)
Exhibits:
The exhibits listed in the accompanying Index to Exhibits are filed or incorporated by reference as part of this Annual Report on Form 10-K.
|
(b)
|
Financial Statement Schedules:
|
All schedules have been omitted because they are not required, not applicable, or the required information is included in the consolidated financial statements or notes thereto.
|
(c)
|
Exhibits:
|
|
Incorporated by Reference
|
|||||||||||||||||
|
Exhibit
Number
|
Exhibit Description
|
Form
|
File No
|
Date of
First Filing
|
Exhibit
Number
|
Filed
Herewith
|
|||||||||||
|
2.01***
|
|
Agreement and Plan of Merger dated as of August 31, 2012 among Astria Semiconductor Holdings, Inc., FormFactor, Inc., ELM Acquisition, Inc. and Fortis Advisors LLC, as Equityholder Representative
|
10-Q/A
|
|
000-50307
|
|
1/23/2013
|
|
33.01
|
|
|||||||
|
3.01
|
|
Amended and Restated Certificate of Incorporation of the Registrant as filed with the Delaware Secretary of State on June 17, 2003
|
S-1
|
|
333-109815
|
|
10/20/2003
|
|
3.01
|
|
|||||||
|
3.02
|
|
Amended and Restated Bylaws of the Registrant
|
8-K
|
|
000-50307
|
|
5/25/2005
|
|
3.02
|
|
|||||||
|
4.01
|
|
Specimen Common Stock Certificate
|
S-1/A
|
|
333-86738
|
|
5/28/2002
|
|
4.01
|
|
|||||||
|
10.01+
|
|
Form of Indemnity Agreement
|
S-1/A
|
|
333-86738
|
|
5/28/2002
|
|
10.01
|
|
|
||||||
|
10.02+
|
|
Form of Change of Control Severance Agreement
|
10-K
|
|
000-50307
|
|
3/14/2005
|
|
10.48
|
|
|
||||||
|
10.03+
|
|
1996 Stock Option Plan, and form of option grant
|
S-1
|
|
333-86738
|
|
4/22/2002
|
|
10.03
|
|
|
||||||
|
10.04+
|
|
Incentive Option Plan, and form of option grant
|
S-1
|
|
333-86738
|
|
4/22/2002
|
|
10.04
|
|
|
||||||
|
10.05+
|
|
Management Incentive Option Plan, and form of option grant
|
S-1
|
|
333-86738
|
|
4/22/2002
|
|
10.05
|
|
|
||||||
|
10.06+
|
|
2002 Equity Incentive Plan, as amended, and forms of plan agreements
|
10-Q
|
|
000-50307
|
|
5/4/2011
|
|
10.06
|
|
|||||||
|
10.07+
|
|
2002 Employee Stock Purchase Plan, as amended
|
10-Q
|
|
000-50307
|
|
8/7/2007
|
|
10.01
|
|
|
||||||
|
10.08+
|
|
Key Employee Bonus Plan, as amended
|
10-Q
|
|
000-50307
|
|
5/7/2007
|
|
10.01
|
|
|
||||||
|
10.09+
|
|
Equity Incentive Plan, as amended and restated effective April 18, 2012, and forms of plan agreements
|
10-K
|
|
000-50307
|
|
3/13/2013
|
|
10.09
|
|
|||||||
|
10.10+
|
|
Employee Stock Purchase Plan, as amended and restated April 18, 2012
|
10-K
|
|
000-50307
|
|
3/13/2013
|
|
10.10
|
|
|||||||
|
10.11
|
|
Pacific Corporate Center Lease by and between Greenville Holding Company LLC (successor to Greenville Investors, L.P.) ("Greenville") and the Registrant dated May 3, 2001
|
S-1/A
|
|
333-86738
|
|
6/10/2003
|
|
10.18
|
|
|
||||||
|
10.12
|
|
First Amendment to Pacific Corporate Center Lease by and between Greenville and the Registrant dated January 31, 2003
|
S-1/A
|
|
333-86738
|
|
5/7/2003
|
|
10.18.1
|
|
|
||||||
|
10.13
|
|
Pacific Corporate Center Lease by and between Greenville and the Registrant dated May 3, 2001
|
S-1/A
|
|
333-86738
|
|
6/10/2003
|
|
10.19
|
|
|
||||||
|
10.14
|
|
First Amendment to Pacific Corporate Center Lease by and between Greenville and the Registrant dated January 31, 2003
|
S-1/A
|
|
333-86738
|
|
5/7/2003
|
|
10.19.1
|
|
|
||||||
55
|
10.15
|
|
Pacific Corporate Center Lease by and between Greenville and the Registrant dated May 3, 2001
|
S-1/A
|
|
333-86738
|
|
6/10/2003
|
|
10.2
|
|
|
||||||
|
10.16+
|
|
First Amendment to Pacific Corporate Center Lease by and between Greenville and the Registrant dated January 31, 2003
|
S-1/A
|
|
333-86738
|
|
5/7/2003
|
|
10.20.1
|
|
|
||||||
|
10.17+
|
|
Pacific Corporate Center Lease by and between Greenville and the Registrant dated September 7, 2004, as amended by First Amendment to Building 6 Lease dated August 16, 2006
|
10-Q
|
|
000-50307
|
|
11/7/2006
|
|
10.01
|
|
|
||||||
|
10.18+
|
|
Employment Letter Agreement, dated September 2, 2010, between Thomas St. Dennis and FormFactor, Inc.
|
8-K
|
|
000-50307
|
|
9/17/2010
|
|
99.01+
|
|
|
||||||
|
10.19+
|
|
Employment Offer Letter, dated August 29, 2012 to Mike Slessor
|
10-K
|
|
000-50307
|
|
3/13/2013
|
|
10.19+
|
|
|||||||
|
16.01
|
|
Letter of PricewaterhouseCoopers LLP dated April 8, 2013
|
8-K
|
|
000-50307
|
|
4/8/2013
|
|
16.01
|
|
|||||||
|
21.01
|
|
List of Registrant's subsidiaries
|
—
|
|
—
|
|
—
|
|
—
|
|
X
|
||||||
|
23.01
|
|
Consent of Independent Registered Public Accounting Firm - PwC
|
—
|
|
—
|
|
—
|
|
—
|
|
X
|
||||||
|
23.02
|
|
Consent of Independent Registered Public Accounting Firm - KPMG
|
—
|
|
—
|
|
—
|
|
—
|
|
X
|
||||||
|
24.01
|
|
Power of Attorney (included on the signature page of this Form 10-K)
|
—
|
|
—
|
|
—
|
|
—
|
|
X
|
||||||
|
31.01
|
|
Certification of Chief Executive Officer pursuant to 15 U.S.C. Section 7241, as adopted pursuant to Section 302 of the Sarbanes-Oxley Act of 2002
|
—
|
|
—
|
|
—
|
|
—
|
|
X
|
||||||
|
31.02
|
|
Certification of Chief Financial Officer pursuant to 15 U.S.C. Section 7241, as adopted pursuant to Section 302 of the Sarbanes-Oxley Act of 2002
|
—
|
|
—
|
|
—
|
|
—
|
|
X
|
||||||
|
32.01*
|
|
Certification of Chief Executive Officer and Chief Financial Officer pursuant to 18 U.S.C. Section 1350, as adopted pursuant to Section 906 of the Sarbanes-Oxley Act of 2002
|
—
|
|
—
|
|
—
|
|
—
|
|
X
|
||||||
|
101.INS**
|
|
XBRL Instance Document
|
—
|
|
—
|
|
—
|
|
—
|
|
X
|
||||||
|
101.SCH**
|
|
XBRL Taxonomy Extension Schema Document
|
—
|
|
—
|
|
—
|
|
—
|
|
X
|
||||||
|
101.CAL**
|
|
XBRL Taxonomy Extension Calculation Linkbase Document
|
—
|
|
—
|
|
—
|
|
—
|
|
X
|
||||||
|
101.DEF**
|
|
XBRL Taxonomy Extension Definition Linkbase Document
|
—
|
|
—
|
|
—
|
|
—
|
|
X
|
||||||
|
101.LAB**
|
|
XBRL Taxonomy Extension Label Linkbase Document
|
—
|
|
—
|
|
—
|
|
—
|
|
X
|
||||||
|
101.PRE**
|
|
XBRL Taxonomy Extension Presentation Linkbase Document
|
—
|
|
—
|
|
—
|
|
—
|
|
X
|
||||||
|
*
|
This exhibit shall not be deemed "filed" for purposes of Section 18 of the Securities Exchange Act of 1934 or otherwise subject to the liabilities of that section, nor shall it be deemed incorporated by reference in any filing under the Securities Act of 1933 or the Securities Exchange Act of 1934, whether made before or after the date hereof and irrespective of any general incorporation language in any filings.
|
|
**
|
Pursuant to Rule 406T of Regulation S-T, these interactive data files are deemed not filed or part of a registration statement or prospectus for purposes of Sections 11 or 12 of the Securities Act of 1933 or Section 18 of the Securities Exchange Act of 1934 and otherwise are not subject to liability.
|
|
***
|
Confidential treatment has been requested for portions of this document. The schedules, exhibits, and annexes to this exhibit have been omitted in reliance on Item 601(b)(2) of Regulation S-K and will be furnished supplementally to the SEC upon request.
|
|
+
|
Indicates a management contract or compensatory plan or arrangement.
|
56
SIGNATURES
Pursuant to the requirements of Section 13 or 15(d) of the Securities Exchange Act of 1934, the Registrant has duly caused this report to be signed on its behalf by the undersigned, thereunto duly authorized, in the City of Livermore, State of California, on the
7
th
day of March 2014.
|
|
FORMFACTOR, INC.
|
|||
|
By:
|
/s/ MICHAEL M. LUDWIG
|
|||
|
|
|
Michael M. Ludwig
Chief Financial Officer
(Principal Financial Officer and Principal
Accounting Officer)
|
||
POWER OF ATTORNEY
KNOW BY ALL PERSONS BY THESE PRESENTS, that each of the undersigned whose signature appears below constitutes and appoints Michael M. Ludwig and Stuart L. Merkadeau, and each of them, the undersigned's true and lawful attorneys-in-fact and agents with full power of substitution, for the undersigned and in the undersigned's name, place and stead, in any and all capacities, to sign any and all amendments to this Annual Report on Form 10-K and any other documents in connection therewith, and to file the same, with all exhibits thereto, with the Securities and Exchange Commission, granting unto said attorneys-in-fact and agents, and each of them, full power and authority to do and perform each and every act requisite and necessary to be done with respect to this Annual Report on Form 10-K, including amendments, as fully to all intents and purposes as the undersigned might or could do in person, hereby ratifying and confirming all that said attorneys-in-fact and agents, or his or their substitute or substitutes, may lawfully do or cause to be done by virtue hereof.
IN WITNESS WHEREOF, each of the undersigned has executed this Power of Attorney as of the date indicated below.
Pursuant to the requirements of the Securities Exchange Act of 1934, this report has been signed below by the following persons on behalf of the Registrant and in the capacities and on the dates indicated.
|
Signature
|
Title
|
Date
|
||
|
|
|
|
||
|
Principal Executive Officer:
|
|
|
||
|
/s/ THOMAS ST. DENNIS
|
Chief Executive Officer and Director
|
March 7, 2014
|
||
|
Thomas St. Dennis
|
||||
|
Principal Financial Officer and Principal
Accounting Officer:
|
|
|
||
|
/s/ MICHAEL M. LUDWIG
|
Chief Financial Officer
|
March 7, 2014
|
||
|
Michael M. Ludwig
|
||||
57
|
Signature
|
Title
|
Date
|
||
|
|
|
|
||
|
Additional Directors:
|
|
|
||
|
/s/ G. CARL EVERETT, JR.
|
Director
|
March 7, 2014
|
||
|
G. Carl Everett, Jr.
|
||||
|
/s/ LOTHAR MAIER
|
Director
|
March 7, 2014
|
||
|
Lothar Maier
|
||||
|
/s/ EDWARD ROGAS, JR
|
Director
|
March 7, 2014
|
||
|
Edward Rogas, Jr
|
||||
|
/s/ MICHAEL W. ZELLNER
|
Director
|
March 7, 2014
|
||
|
Michael W. Zellner
|
||||
|
/s/ RICHARD DELATEUR
|
Director
|
March 7, 2014
|
||
|
Richard DeLateur
|
||||
|
/s/ MICHAEL D. SLESSOR
|
Director
|
March 7, 2014
|
||
|
Michael D. Slessor
|
||||
58
Report of Independent Registered Public Accounting Firm
To the Board of Directors and Stockholders
FormFactor, Inc.:
We have audited the accompanying consolidated balance sheet of FormFactor, Inc. and subsidiaries (“the Company”) as of
December 28, 2013
, and the related consolidated statements of operations, comprehensive loss, stockholders’ equity, and cash flows for the year ended
December 28, 2013
. We also have audited the Company’s internal control over financial reporting as of
December 28, 2013
, based on criteria established in
Internal Control - Integrated Framework (1992)
issued by the Committee of Sponsoring Organizations of the Treadway Commission (COSO). The Company’s management is responsible for these consolidated financial statements, for maintaining effective internal control over financial reporting, and for its assessment of the effectiveness of internal control over financial reporting, included in the accompanying Management’s Report on Internal Control over Financial Reporting. Our responsibility is to express an opinion on these consolidated financial statements and an opinion on the Company’s internal control over financial reporting based on our audit.
We conducted our audit in accordance with the standards of the Public Company Accounting Oversight Board (United States). Those standards require that we plan and perform the audit to obtain reasonable assurance about whether the financial statements are free of material misstatement and whether effective internal control over financial reporting was maintained in all material respects. Our audit of the consolidated financial statements included examining, on a test basis, evidence supporting the amounts and disclosures in the financial statements, assessing the accounting principles used and significant estimates made by management, and evaluating the overall financial statement presentation. Our audit of internal control over financial reporting included obtaining an understanding of internal control over financial reporting, assessing the risk that a material weakness exists, and testing and evaluating the design and operating effectiveness of internal control based on the assessed risk. Our audit also included performing such other procedures as we considered necessary in the circumstances. We believe that our audit provide a reasonable basis for our opinions.
A company’s internal control over financial reporting is a process designed to provide reasonable assurance regarding the reliability of financial reporting and the preparation of financial statements for external purposes in accordance with generally accepted accounting principles. A company’s internal control over financial reporting includes those policies and procedures that (1) pertain to the maintenance of records that, in reasonable detail, accurately and fairly reflect the transactions and dispositions of the assets of the company; (2) provide reasonable assurance that transactions are recorded as necessary to permit preparation of financial statements in accordance with generally accepted accounting principles, and that receipts and expenditures of the company are being made only in accordance with authorizations of management and directors of the company; and (3) provide reasonable assurance regarding prevention or timely detection of unauthorized acquisition, use, or disposition of the company’s assets that could have a material effect on the financial statements.
Because of its inherent limitations, internal control over financial reporting may not prevent or detect misstatements. Also, projections of any evaluation of effectiveness to future periods are subject to the risk that controls may become inadequate because of changes in conditions, or that the degree of compliance with the policies or procedures may deteriorate.
In our opinion, the consolidated financial statements referred to above present fairly, in all material respects, the financial position of FormFactor, Inc. and subsidiaries as of
December 28, 2013
, and the results of their operations and their cash flows for the year ended
December 28, 2013
, in conformity with U.S. generally accepted accounting principles. Also in our opinion, the Company maintained, in all material respects, effective internal control over financial reporting as of
December 28, 2013
, based on criteria established in
Internal Control - Integrated Framework (1992)
issued by COSO.
/s/ KPMG LLP
Santa Clara, California
March 7, 2014
59
Report of Independent Registered Public Accounting Firm
To the Board of Directors and Stockholders of FormFactor, Inc.:
In our opinion, the consolidated balance sheet as of December 29, 2012
and the related consolidated statements of operations, statements of comprehensive loss, stockholders’ equity, and cash flows for each of the two years in the period ended December 29, 2012 present fairly, in all material respects, the financial position of FormFactor, Inc. and its subsidiaries at December 29, 2012 and the results of their operations and their
cash flows for each of the two years in the period ended December 29, 2012, in conformity with accounting principles generally accepted in the United States of America.
These financial statements are the responsibility of the Company's management. Our responsibility is to express an opinion on these financial statements based on our audits. We conducted our audits of these statements in accordance with the standards of the Public Company Accounting Oversight Board (United States). Those standards require that we plan and perform the audit to obtain reasonable assurance about whether the financial statements are free of material misstatement. An audit includes examining, on a test basis, evidence supporting the amounts and disclosures in the financial statements, assessing the accounting principles used and significant estimates made by management, and evaluating the overall financial statement presentation. We believe that our audits provide a reasonable basis for our opinion.
/s/ PricewaterhouseCoopers LLP
San Jose, California
March 13, 2013
60
FORMFACTOR, INC.
|
December 28, 2013
|
December 29, 2012
|
||||||
|
|
(In thousands, except share
and per share data)
|
||||||
|
ASSETS
|
|
|
|||||
|
Current assets:
|
|
|
|||||
|
Cash and cash equivalents
|
$
|
59,196
|
|
$
|
72,243
|
|
|
|
Marketable securities
|
91,895
|
|
93,545
|
|
|||
|
Accounts receivable, net
|
30,189
|
|
28,919
|
|
|||
|
Inventories, net
|
20,707
|
|
23,616
|
|
|||
|
Deferred tax assets
|
2,776
|
|
4,613
|
|
|||
|
Refundable income taxes
|
782
|
|
5,667
|
|
|||
|
Prepaid expenses and other current assets
|
6,106
|
|
10,569
|
|
|||
|
Total current assets
|
211,651
|
|
239,172
|
|
|||
|
Restricted cash
|
435
|
|
318
|
|
|||
|
Property, plant and equipment, net
|
35,190
|
|
45,515
|
|
|||
|
Goodwill
|
30,731
|
|
30,994
|
|
|||
|
Intangibles, net
|
57,470
|
|
74,276
|
|
|||
|
Deferred tax assets
|
3,960
|
|
4,207
|
|
|||
|
Other assets
|
1,271
|
|
1,200
|
|
|||
|
Total assets
|
$
|
340,708
|
|
$
|
395,682
|
|
|
|
LIABILITIES AND STOCKHOLDERS' EQUITY
|
|
|
|||||
|
Current liabilities:
|
|
|
|||||
|
Accounts payable
|
$
|
16,313
|
|
$
|
21,015
|
|
|
|
Accrued liabilities
|
13,985
|
|
17,270
|
|
|||
|
Capital leases, current portion
|
270
|
|
573
|
|
|||
|
Income taxes payable
|
172
|
|
—
|
|
|||
|
Deferred revenue
|
7,030
|
|
6,189
|
|
|||
|
Total current liabilities
|
37,770
|
|
45,047
|
|
|||
|
Long-term income taxes payable
|
2,497
|
|
3,028
|
|
|||
|
Capital leases, less current portion
|
—
|
|
340
|
|
|||
|
Deferred rent and other liabilities
|
6,355
|
|
8,009
|
|
|||
|
Total liabilities
|
46,622
|
|
56,424
|
|
|||
|
Commitments and contingencies (Note 10)
|
|
|
|||||
|
Stockholders' equity:
|
|
|
|||||
|
Preferred stock, $0.001 par value:
|
|
|
|||||
|
10,000,000 shares authorized; no shares issued and outstanding at December 28, 2013 and December 29, 2012
|
—
|
|
—
|
|
|||
|
Common stock, $0.001 par value:
|
|
|
|||||
|
250,000,000 shares authorized; 54,649,600 and 53,286,703 shares issued and outstanding at December 28, 2013 and December 29, 2012, respectively
|
55
|
|
54
|
|
|||
|
Additional paid-in capital
|
695,631
|
|
681,157
|
|
|||
|
Accumulated other comprehensive income (loss)
|
(249
|
)
|
1,715
|
|
|||
|
Accumulated deficit
|
(401,351
|
)
|
(343,668
|
)
|
|||
|
Total stockholders' equity
|
294,086
|
|
339,258
|
|
|||
|
Total liabilities and stockholders' equity
|
$
|
340,708
|
|
$
|
395,682
|
|
|
The accompanying notes are an integral part of these consolidated financial statements.
61
FORMFACTOR, INC.
|
|
Fiscal Year Ended
|
||||||||||
|
|
December 28, 2013
|
December 29, 2012
|
December 31, 2011
|
||||||||
|
|
(In thousands, except per share data)
|
||||||||||
|
Revenues
|
$
|
231,533
|
|
$
|
178,535
|
|
$
|
169,325
|
|
||
|
Cost of revenues
|
189,249
|
|
153,204
|
|
148,367
|
|
|||||
|
Gross profit
|
42,284
|
|
25,331
|
|
20,958
|
|
|||||
|
Operating expenses:
|
|
|
|
||||||||
|
Research and development
|
42,139
|
|
40,130
|
|
43,544
|
|
|||||
|
Selling, general and administrative
|
53,217
|
|
49,231
|
|
46,705
|
|
|||||
|
Restructuring charges, net
|
4,658
|
|
2,917
|
|
522
|
|
|||||
|
Loss on sale of subsidiary
|
300
|
|
—
|
|
—
|
|
|||||
|
Impairment of long-lived assets
|
761
|
|
421
|
|
549
|
|
|||||
|
Gain on settlement of litigation
|
—
|
|
(3,250
|
)
|
—
|
|
|||||
|
Total operating expenses
|
101,075
|
|
89,449
|
|
91,320
|
|
|||||
|
Operating loss
|
(58,791
|
)
|
(64,118
|
)
|
(70,362
|
)
|
|||||
|
Interest income, net
|
386
|
|
691
|
|
1,404
|
|
|||||
|
Other income, net
|
623
|
|
1,461
|
|
1,076
|
|
|||||
|
Loss before income taxes
|
(57,782
|
)
|
(61,966
|
)
|
(67,882
|
)
|
|||||
|
Benefit from income taxes
|
(99
|
)
|
(26,420
|
)
|
(1,901
|
)
|
|||||
|
Net loss
|
$
|
(57,683
|
)
|
$
|
(35,546
|
)
|
$
|
(65,981
|
)
|
||
|
Net loss per share:
|
|
|
|
||||||||
|
Basic and diluted
|
$
|
(1.06
|
)
|
$
|
(0.70
|
)
|
$
|
(1.31
|
)
|
||
|
Weighted-average number of shares used in per share calculations:
|
|
|
|
||||||||
|
Basic and diluted
|
54,204
|
|
50,551
|
|
50,521
|
|
|||||
The accompanying notes are an integral part of these consolidated financial statements.
62
FORMFACTOR, INC.
CONSOLIDATED STATEMENTS OF COMPREHENSIVE LOSS
|
Fiscal Year Ended
|
|||||||||||
|
December 28, 2013
|
December 29, 2012
|
December 31, 2011
|
|||||||||
|
(In thousands)
|
|||||||||||
|
Net loss
|
$
|
(57,683
|
)
|
$
|
(35,546
|
)
|
$
|
(65,981
|
)
|
||
|
Other comprehensive income (loss), net of tax:
|
|||||||||||
|
Foreign currency translation adjustments
|
(1,825
|
)
|
(838
|
)
|
660
|
|
|||||
|
Unrealized gains (losses) on available-for-sale marketable securities
|
(139
|
)
|
(147
|
)
|
13
|
|
|||||
|
Other comprehensive income (loss), net of tax
|
(1,964
|
)
|
(985
|
)
|
673
|
|
|||||
|
Comprehensive loss
|
$
|
(59,647
|
)
|
$
|
(36,531
|
)
|
$
|
(65,308
|
)
|
||
The accompanying notes are an integral part of these consolidated financial statements.
63
FORMFACTOR, INC.
CONSOLIDATED STATEMENTS OF STOCKHOLDERS' EQUITY
|
|
Common Stock
|
Additional
Paid-in
Capital
|
Accumulated
Other
Comprehensive
Income (Loss)
|
Accumulated
Deficit
|
Total
|
|||||||||||||||||
|
|
||||||||||||||||||||||
|
|
Shares
|
Amount
|
||||||||||||||||||||
|
|
(In thousands, except shares)
|
|||||||||||||||||||||
|
Balances, December 25, 2010
|
50,587,917
|
|
$
|
52
|
|
$
|
651,263
|
|
$
|
2,027
|
|
$
|
(242,141
|
)
|
$
|
411,201
|
|
|||||
|
Issuance of common stock pursuant to exercise of options for cash
|
141,280
|
|
—
|
|
914
|
|
—
|
|
—
|
|
914
|
|
||||||||||
|
Issuance of common stock pursuant to vesting of restricted stock units, net of stock withheld
|
485,204
|
|
—
|
|
(219
|
)
|
—
|
|
—
|
|
(219
|
)
|
||||||||||
|
Issuance of common stock under the Employee Stock Purchase Plan
|
386,818
|
|
—
|
|
2,813
|
|
—
|
|
—
|
|
2,813
|
|
||||||||||
|
Purchase and retirement of common stock
|
(2,332,740
|
)
|
(2
|
)
|
(16,409
|
)
|
—
|
|
—
|
|
(16,411
|
)
|
||||||||||
|
Stock-based compensation
|
—
|
|
—
|
|
13,662
|
|
—
|
|
—
|
|
13,662
|
|
||||||||||
|
Components of other comprehensive income (loss):
|
|
|
|
|
|
|||||||||||||||||
|
Change in unrealized gain (loss) on marketable securities, net of tax
|
—
|
|
—
|
|
—
|
|
13
|
|
—
|
|
13
|
|
||||||||||
|
Currency translation adjustments
|
—
|
|
—
|
|
—
|
|
660
|
|
—
|
|
660
|
|
||||||||||
|
Net loss
|
—
|
|
—
|
|
—
|
|
—
|
|
(65,981
|
)
|
(65,981
|
)
|
||||||||||
|
Balances, December 31, 2011
|
49,268,479
|
|
50
|
|
652,024
|
|
2,700
|
|
(308,122
|
)
|
346,652
|
|
||||||||||
|
Issuance of common stock pursuant to exercise of options for cash
|
—
|
|
—
|
|
—
|
|
—
|
|
—
|
|
—
|
|
||||||||||
|
Issuance of common stock pursuant to acquisition of business
|
3,020,944
|
|
3
|
|
13,802
|
|
—
|
|
—
|
|
13,805
|
|
||||||||||
|
Issuance of common stock pursuant to vesting of restricted stock units, net of stock withheld
|
464,203
|
|
—
|
|
(106
|
)
|
—
|
|
—
|
|
(106
|
)
|
||||||||||
|
Issuance of common stock under the Employee Stock Purchase Plan
|
533,077
|
|
1
|
|
2,357
|
|
—
|
|
—
|
|
2,358
|
|
||||||||||
|
Stock-based compensation
|
—
|
|
—
|
|
13,080
|
|
—
|
|
—
|
|
13,080
|
|
||||||||||
|
Components of other comprehensive income (loss):
|
|
|
|
|
|
|||||||||||||||||
|
Change in unrealized gain (loss) on marketable securities, net of tax
|
—
|
|
—
|
|
—
|
|
(147
|
)
|
—
|
|
(147
|
)
|
||||||||||
|
Currency translation adjustments
|
—
|
|
—
|
|
—
|
|
(838
|
)
|
—
|
|
(838
|
)
|
||||||||||
|
Net loss
|
—
|
|
—
|
|
—
|
|
—
|
|
(35,546
|
)
|
(35,546
|
)
|
||||||||||
|
Balances, December 29, 2012
|
53,286,703
|
|
54
|
|
681,157
|
|
1,715
|
|
(343,668
|
)
|
339,258
|
|
||||||||||
|
Issuance of common stock pursuant to exercise of options for cash
|
20,000
|
|
—
|
|
106
|
|
—
|
|
—
|
|
106
|
|
||||||||||
|
Issuance of common stock pursuant to vesting of restricted stock units, net of stock withheld
|
759,724
|
|
—
|
|
(4
|
)
|
—
|
|
—
|
|
(4
|
)
|
||||||||||
|
Issuance of common stock under the Employee Stock Purchase Plan
|
583,173
|
|
1
|
|
2,501
|
|
—
|
|
—
|
|
2,502
|
|
||||||||||
|
Stock-based compensation
|
—
|
|
—
|
|
11,871
|
|
—
|
|
—
|
|
11,871
|
|
||||||||||
|
Components of other comprehensive income (loss):
|
|
|
|
|
|
|
|
|
|
|
||||||||||||
|
Change in unrealized gain (loss) on marketable securities, net of tax
|
—
|
|
—
|
|
—
|
|
(139
|
)
|
—
|
|
(139
|
)
|
||||||||||
|
Currency translation adjustments
|
—
|
|
—
|
|
—
|
|
(1,825
|
)
|
—
|
|
(1,825
|
)
|
||||||||||
|
Net loss
|
—
|
|
—
|
|
—
|
|
—
|
|
(57,683
|
)
|
(57,683
|
)
|
||||||||||
|
Balances, December 28, 2013
|
54,649,600
|
|
$
|
55
|
|
$
|
695,631
|
|
$
|
(249
|
)
|
$
|
(401,351
|
)
|
$
|
294,086
|
|
|||||
The accompanying notes are an integral part of these consolidated financial statements.
64
|
FORMFACTOR, INC.
|
|||||||||||
|
|
Fiscal Year Ended
|
||||||||||
|
|
December 28, 2013
|
December 29, 2012
|
December 31, 2011
|
||||||||
|
|
(In thousands)
|
||||||||||
|
Cash flows from operating activities:
|
|
|
|
||||||||
|
Net loss
|
$
|
(57,683
|
)
|
$
|
(35,546
|
)
|
$
|
(65,981
|
)
|
||
|
Adjustments to reconcile net loss to net cash used in operating activities:
|
|
|
|
||||||||
|
Depreciation and amortization
|
28,909
|
|
16,901
|
|
10,838
|
|
|||||
|
Amortization of discount on investments
|
463
|
|
91
|
|
469
|
|
|||||
|
Stock-based compensation expense
|
12,124
|
|
13,049
|
|
13,849
|
|
|||||
|
Deferred income tax provision (benefit)
|
445
|
|
(24,460
|
)
|
(1,988
|
)
|
|||||
|
(Recovery) provision for doubtful accounts receivable
|
(19
|
)
|
52
|
|
(276
|
)
|
|||||
|
Provision for excess and obsolete inventories
|
10,461
|
|
7,232
|
|
7,897
|
|
|||||
|
Loss on disposal and write-off of long-lived assets
|
365
|
|
41
|
|
5
|
|
|||||
|
Gain on settlement of litigation
|
—
|
|
(3,250
|
)
|
—
|
|
|||||
|
Impairment of long-lived assets
|
761
|
|
421
|
|
549
|
|
|||||
|
Loss on sale of subsidiary
|
300
|
|
—
|
|
—
|
|
|||||
|
Non-cash restructuring
|
2,743
|
|
462
|
|
(1,582
|
)
|
|||||
|
Foreign currency transaction losses
|
620
|
|
1,267
|
|
328
|
|
|||||
|
Changes in assets and liabilities:
|
|
||||||||||
|
Accounts receivable
|
(2,102
|
)
|
5,158
|
|
16,803
|
|
|||||
|
Inventories
|
(7,980
|
)
|
(926
|
)
|
(1,152
|
)
|
|||||
|
Prepaid expenses and other current assets
|
3,557
|
|
821
|
|
5,621
|
|
|||||
|
Refundable income taxes
|
5,143
|
|
(27
|
)
|
(862
|
)
|
|||||
|
Other assets
|
138
|
|
426
|
|
1,907
|
|
|||||
|
Accounts payable
|
(2,324
|
)
|
(5,903
|
)
|
(5,065
|
)
|
|||||
|
Accrued liabilities
|
(2,474
|
)
|
(1,123
|
)
|
(9,643
|
)
|
|||||
|
Income taxes payable
|
(346
|
)
|
(2,145
|
)
|
(1,263
|
)
|
|||||
|
Deferred rent and other liabilities
|
83
|
|
167
|
|
43
|
|
|||||
|
Deferred revenues
|
1,014
|
|
1,064
|
|
160
|
|
|||||
|
Net cash used in operating activities
|
(5,802
|
)
|
(26,228
|
)
|
(29,343
|
)
|
|||||
|
Cash flows from investing activities:
|
|
|
|
||||||||
|
Acquisition of property, plant and equipment
|
(8,530
|
)
|
(7,952
|
)
|
(7,700
|
)
|
|||||
|
Acquisition of MicroProbe, net of cash acquired
|
—
|
|
(96,652
|
)
|
—
|
|
|||||
|
Use of cash from sale of subsidiary
|
(210
|
)
|
—
|
|
—
|
|
|||||
|
Proceeds from sales of property, plant and equipment
|
61
|
|
—
|
|
33
|
|
|||||
|
Purchases of marketable securities
|
(91,338
|
)
|
(82,437
|
)
|
(246,665
|
)
|
|||||
|
Proceeds from maturities of marketable securities
|
90,385
|
|
135,340
|
|
308,681
|
|
|||||
|
Proceeds from sales of marketable securities
|
2,000
|
|
11,000
|
|
6,000
|
|
|||||
|
Change in restricted cash
|
(118
|
)
|
—
|
|
363
|
|
|||||
|
Net cash (used in) provided by investing activities
|
(7,750
|
)
|
(40,701
|
)
|
60,712
|
|
|||||
|
Cash flows from financing activities:
|
|
|
|
||||||||
|
Proceeds from issuances of common stock
|
2,602
|
|
2,251
|
|
3,509
|
|
|||||
|
Purchase and retirement of common stock
|
—
|
|
—
|
|
(16,411
|
)
|
|||||
|
Payments made on capital leases
|
(603
|
)
|
(112
|
)
|
—
|
|
|||||
|
Net cash provided by (used in) financing activities
|
1,999
|
|
2,139
|
|
(12,902
|
)
|
|||||
|
Effect of exchange rate changes on cash and cash equivalents
|
(1,494
|
)
|
(2,016
|
)
|
(625
|
)
|
|||||
|
Net (decrease) increase in cash and cash equivalents
|
(13,047
|
)
|
(66,806
|
)
|
17,842
|
|
|||||
|
Cash and cash equivalents, beginning of year
|
72,243
|
|
139,049
|
|
121,207
|
|
|||||
|
Cash and cash equivalents, end of year
|
$
|
59,196
|
|
$
|
72,243
|
|
$
|
139,049
|
|
||
|
Non-cash investing and financing activities:
|
|
|
|
||||||||
|
Fair value of stock issued in connection with the MicroProbe Acquisition
|
$
|
—
|
|
$
|
13,805
|
|
$
|
—
|
|
||
|
Changes in accounts payable and accrued liabilities related to property, plant and equipment purchases
|
$
|
1,528
|
|
$
|
2,215
|
|
$
|
(66
|
)
|
||
|
Working capital adjustment
|
$
|
—
|
|
$
|
2,782
|
|
$
|
—
|
|
||
65
|
FORMFACTOR, INC.
CONSOLIDATED STATEMENTS OF CASH FLOWS
|
|||||||||||
|
Supplemental disclosure of cash flow information:
|
|
|
|
||||||||
|
Income and property taxes (refunded) paid, net
|
$
|
(6,152
|
)
|
$
|
(40
|
)
|
$
|
1,410
|
|
||
The accompanying notes are an integral part of these consolidated financial statements.
66
FORMFACTOR, INC.
NOTES TO CONSOLIDATED FINANCIAL STATEMENTS
FormFactor, Inc. ("FormFactor" or the "Company" and also referred to as "we" or "our") was incorporated in Delaware on April 15, 1993 and designs, develops, manufactures, sells and supports precision, high performance advanced semiconductor wafer probe cards. We are based in Livermore, California, home to our corporate offices, one of our main research and development centers, and one of our manufacturing locations. We have facilities in the United States, Singapore, Japan, Taiwan, South Korea, Germany and the People's Republic of China.
Fiscal Year
Our fiscal year ends on the last Saturday in December. The fiscal years ended on
December 28, 2013
and
December 29, 2012
, respectively, consisted of
52
weeks and the fiscal year ended on
December 31, 2011
consisted of
53
weeks.
Business Acquisition
On October 16, 2012, we completed the acquisition of Astria Semiconductor Holdings, Inc., including its major subsidiary Micro-Probe Incorporated (together "MicroProbe"), which we refer to as the "MicroProbe Acquisition". As part of the MicroProbe Acquisition, a wholly-owned subsidiary of FormFactor merged with and into MicroProbe, with MicroProbe continuing as the surviving corporation and as a wholly-owned subsidiary of FormFactor. For additional information regarding the MicroProbe Acquisition, see Note 3 - Acquisition - to the Notes to Consolidated Financial Statements.
Reclassifications of Prior Year Amounts
Certain prior year amounts relating to gross long-lived asset balances and their accumulated depreciation associated with manufacturing equipment, computer equipment and software, furniture and fixtures and leasehold improvements were adjusted, due to an immaterial error, as of December 29, 2012. Certain assets that had been fully depreciated and were no longer in use had not been removed from the accounting records. There was no change to total property, plant and equipment, net, and the associated depreciation expense in the consolidated financial statements and the notes thereto, as of and for the year ended December 29, 2012, due to the above adjustment.
Similarly, certain prior year amounts relating to classification of inventory reserves between work-in-process and finished goods as of December 29, 2012 were reclassified, due to an immaterial error. There was no change to inventories, net, in the consolidated financial statements and the notes thereto, as of and for the year ended December 29, 2012, due to the above reclassification.
Basis of Consolidation and Foreign Currency Translation
The consolidated financial statements include our accounts and those of our wholly-owned subsidiaries. All intercompany balances and transactions have been eliminated.
The functional currencies of certain of our foreign subsidiaries are the local currencies and, accordingly, all assets and liabilities of these foreign operations are translated to U.S. Dollars at current period end exchange rates, and revenues and expenses are translated to U.S. Dollars using average exchange rates in effect during the period. The gains and losses from the foreign currency translation of these subsidiaries' financial statements are included as a separate component of stockholders' equity under “Accumulated other comprehensive income (loss).”
Certain other of our foreign subsidiaries in the People's Republic of China, Taiwan, Hong Kong, South Korea and Singapore use the U.S. Dollar as their functional currency. Accordingly, monetary assets and liabilities in non-functional currencies of these subsidiaries are remeasured using exchange rates in effect at the end of the period. Revenues and costs in local currency are remeasured using average exchange rates for the period, except for costs related to those balance sheet items that are remeasured using historical exchange rates. The resulting remeasurement gains and losses are included in the Consolidated Statements of Operations as incurred.
67
FORMFACTOR, INC.
NOTES TO CONSOLIDATED FINANCIAL STATEMENTS (Continued)
Use of Estimates
The preparation of consolidated financial statements in conformity with accounting principles generally accepted in the United States of America ("GAAP") requires management to make estimates and assumptions that affect the reported amounts of assets and liabilities, the disclosure of contingent assets and liabilities at the date of the financial statements, and the reported amounts of revenues and expenses during the reporting period. Estimates may change as new information is obtained. We believe that the estimates, assumptions and judgments involved in revenue recognition, fair value of marketable securities, allowance for doubtful accounts, reserves for product warranty, valuation of obsolete and slow moving inventory, valuation of assets acquired and liabilities assumed in connection with business combinations, legal contingencies, valuation of goodwill, the assessment of recoverability of long-lived assets, valuation and recognition of stock-based compensation, provision or benefit for income taxes and related deferred tax assets, valuation and tax liabilities and accruals for other liabilities have the greatest potential impact on our consolidated financial statements. Actual results could differ from those estimates.
Business Acquisitions
Our consolidated financial statements include the operations of an acquired business after the completion of the acquisition. We account for acquired businesses using the acquisition method of accounting. The acquisition method of accounting for acquired businesses requires, among other things, that assets acquired and liabilities assumed be recognized at their estimated fair values as of the acquisition date, and that the fair value of acquired intangibles including in-process research and development (IPR&D) be recorded on the balance sheet. Also, transaction costs are expensed as incurred. Any excess of the purchase price over the assigned fair values of the net assets acquired is recorded as goodwill.
Cash, Cash Equivalents and Marketable Securities
Cash and cash equivalents consist of deposits and financial instruments which are readily convertible into cash and have original maturities of 90 days or less at the time of acquisition. Marketable securities consist primarily of highly liquid investments with maturities of greater than 90 days when purchased. We generally classify our marketable securities at the date of acquisition as available-for-sale. These securities are reported at fair value with the related unrealized gains and losses included in "Accumulated other comprehensive income (loss)", a component of stockholder's equity, net of tax. Any unrealized losses which are considered to be other-than-temporary impairments are recorded in "Other income, net" in the Consolidated Statements of Operations. Realized gains (losses) on the sale of marketable securities are determined using the specific-identification method and recorded in "Other income, net" in the Consolidated Statements of Operations. We measure our cash equivalents and marketable securities at fair value.
All of our available-for-sale investments are subject to a periodic impairment review. We record a charge to earnings when a decline in fair value is significantly below cost basis and judged to be other-than-temporary, or have other indicators of impairments. If the fair value of an available-for-sale investment is less than its amortized cost basis, an other-than-temporary impairment is triggered in circumstances where (1) we intend to sell the instrument, (2) it is more likely than not that we will be required to sell the instrument before recovery of its amortized cost basis or (3) a credit loss exists where we do not expect to recover the entire amortized cost basis of the instrument. If we intend to sell or it is more likely than not that we will be required to sell the available-for-sale investment before recovery of its amortized cost basis, we recognize an other-than- temporary impairment charge equal to the entire difference between the investment's amortized cost basis and its fair value.
Fair Value of Financial Instruments
We have evaluated the estimated fair value of financial instruments using available market information and valuations as provided by third-party sources. The use of different market assumptions and/or estimation methodologies could have a significant effect on the estimated fair value amounts. The fair value of the Company's cash, cash equivalents, accounts receivable, accounts payable and other current liabilities approximate their carrying amounts due to the relatively short maturity of these items. Estimates of fair value of our marketable securities are based on quoted market prices from active markets or third party, market-based pricing sources which we believe to be reliable. These estimates represent the third parties' good faith opinion as to what a buyer in the marketplace would pay for a security in a current sale.
Whenever possible, the fair values of our financial assets and liabilities are determined using quoted market prices of identical assets or quoted market prices of similar assets from active markets. The three levels of inputs that may be used to measure fair value are as follows:
|
•
|
Level 1 valuations are obtained from real-time quotes for transactions in active exchange markets involving identical assets.
|
|
•
|
Level 2 inputs other than Level 1 that are observable, either directly or indirectly, such as quoted prices for similar assets or liabilities, quoted prices near the reporting date in markets that are less active, or other inputs
|
68
FORMFACTOR, INC.
NOTES TO CONSOLIDATED FINANCIAL STATEMENTS (Continued)
that are observable or can be corroborated by observable market data for substantially the full term of the assets or liabilities.
|
•
|
Level 3 valuations are based on unobservable inputs to the valuation methodology and include our own data about assumptions market participants would use in pricing the asset or liability based on the best information available under the circumstances.
|
Each level of input has different levels of subjectivity and difficulty involved in determining fair value.
Foreign Exchange Management
We transact business in various foreign currencies. We enter into forward foreign exchange contracts in an effort to mitigate the risks associated with currency fluctuations on certain foreign currency balance sheet exposures. Gains and losses resulting from the impact of currency exchange rate movements on forward foreign exchange contracts designated to offset certain foreign currency balance sheet exposures are recognized as "Other income, net" in the Consolidated Statements of Operations in the period in which the exchange rates change. These gains and losses are intended to partially offset the foreign currency exchange gains and losses on the underlying exposures being hedged. We record the fair value of these contracts as of the end of our reporting period in the Consolidated Balance Sheet. We do not use derivative financial instruments for trading or speculative purposes.
Restricted Cash
Under the terms of one of our facility leases, we provide security to the landlord in the form of letters of credit. As of
December 28, 2013
and
December 29, 2012
, restricted cash included
$0.4 million
and
$0.3 million
, respectively, of letters of credit secured by a certificate of deposit.
Inventories
Inventories are stated at the lower of cost (principally standard cost which approximates actual cost on a first-in, first-out basis) or market value. The provision for potentially excess and obsolete inventory is made based on management's analysis of inventory levels and forecasted future sales. On a quarterly basis, we review inventory quantities on hand and on order under non-cancelable purchase commitments in comparison to our past usage and estimated forecast of product demand for the next six to twelve months to determine what inventory quantities, if any, may not be sellable. Based on this analysis, we write down the affected inventory value for estimated excess and obsolescence charges. Once the value is adjusted, the original cost of our inventory less the related inventory write-down represents the new cost basis of such products. Reversal of these write downs is recognized only when the related inventory has been scrapped or sold. Shipping and handling costs are classified as a component of "Cost of revenues" in the Consolidated Statements of Operations.
We design, manufacture and sell a fully custom product into a market that has been subject to cyclicality and significant demand fluctuations. Probe cards are complex products, custom to a specific chip design and have to be delivered on short lead-times. Probe cards are manufactured in low volumes, but for certain materials, the material purchases are often subject to minimum purchase order quantities in excess of the actual underlying probe card demand. It is not uncommon for us to acquire production materials and commence production activities based on estimated production yields and forecasted demand prior to or in excess of actual demand for our wafer probe cards. These factors result in normal recurring inventory valuation adjustments to cost of revenues. Aggregate inventory write downs were
$10.5 million
,
$7.2 million
and
$7.9 million
for fiscal
2013
,
2012
and
2011
, respectively. We retain a portion of the excess inventory until the customer's design is discontinued. The inventory may be used to satisfy customer warranty demand.
When our products have been delivered, but the revenue associated with that product is deferred because the related revenue recognition criteria have not been met, we defer the related inventory costs. The deferred inventory costs do not exceed the deferred revenue amounts. The deferred inventory costs are classified as a component of "Prepaid expenses and other current assets" in the Consolidated Balance Sheet.
Property, Plant, and Equipment
Property and equipment is stated at cost less accumulated depreciation and amortization. Depreciation is provided on a straight-line method over the following estimated useful lives of the assets: 1 to 5 years for machinery and equipment, 1 to 5 years for computer equipment and software and 1 to 5 years for furniture and fixtures. Leasehold improvements are amortized over the shorter of the lease term or the estimated useful life of the related asset. Construction-in-progress assets are not depreciated until the assets are placed in service. Upon sale or retirement of assets, the cost and related accumulated depreciation or amortization, are removed from the balance sheet and the resulting gain or loss is reflected in operations.
69
FORMFACTOR, INC.
NOTES TO CONSOLIDATED FINANCIAL STATEMENTS (Continued)
Goodwill
Goodwill represents the excess of the purchase price over the fair value of identifiable assets acquired and liabilities assumed. We have determined that we operate in one reportable segment consisting of two operating segments relating to our FormFactor and MicroProbe product groups. We further have determined that for the purposes of our goodwill impairment analysis, we have two reporting units relating to our FormFactor and MicroProbe product groups and which are both associated with the design, development, manufacture, sale and support of precision, high performance advanced semiconductor wafer probe cards.
In September 2011, the FASB amended its guidance to simplify testing goodwill for impairment, allowing an entity to first assess qualitative factors to determine whether it is necessary to perform a two-step quantitative goodwill impairment test. If an entity determines as a result of the qualitative assessment that it is more likely than not that the fair value of a reporting unit is less than its carrying amount, then the quantitative impairment test is required. Otherwise, no further testing is required.
The performance of the quantitative impairment test involves a two-step process. The first step of the impairment test involves comparing the fair values of the applicable reporting units with their aggregate carrying values, including goodwill. We generally determine the fair values of our reporting units using a combination of the income approach (that includes the use of the discounted cash flow method) and the market approach (guideline company approach) valuation methodologies. If the carrying amount of a reporting unit exceeds the fair value of that reporting unit, we perform the second step of the quantitative impairment test to determine the amount of impairment loss. The second step of the goodwill impairment test involves comparing the implied fair value of the affected reporting unit's goodwill with the carrying value of that goodwill. We acquired MicroProbe and performed a fair value assessment as of the acquisition date, October 16, 2012, resulting in our current goodwill balance. We performed our goodwill impairment test for both reporting units in the fourth quarter of fiscal 2013. No impairment charges associated with our goodwill were recorded during fiscal 2013. See note 9 to Notes to Consolidated Financial Statements -
Goodwill and Intangible Assets
, for further details.
Intangible Assets
Intangible assets consist of acquisition related intangible assets and intellectual property. The intangible assets are being amortized over periods which reflect the pattern in which economic benefits of the assets are expected to be realized, over
1
to
10
years, utilizing a straight-line basis of amortization. We perform a review of intangible assets when facts and circumstances indicate that the useful life is shorter than originally estimated or that the carrying amount of assets may not be recoverable. Such facts and circumstances include significant adverse changes in the business climate or legal factors; current period cash flow or operating losses combined with a history of losses or a forecast of continuing losses associated with the use of the intangible assets; and current expectation that the intangible assets will more likely than not be sold or disposed of before the end of their estimated useful lives. We assess the recoverability of identified intangible assets by comparing the projected undiscounted net cash flows associated with the related asset or group of assets over their remaining lives against their respective carrying amounts. Impairments, if any, are based on the excess of the carrying amount over the fair value of those assets.
Impairment of Long-Lived Assets
We test long-lived assets or asset groups such as property, plant and equipment for recoverability when events or changes in circumstances indicate that their carrying amounts may not be recoverable. Circumstances which could trigger a review include, but are not limited to: significant decreases in the market price of the asset; significant adverse changes in the business climate or legal factors; accumulation of costs significantly in excess of the amount originally expected for the acquisition or construction of the asset; current period cash flow or operating losses combined with a history of losses or a forecast of continuing losses associated with the use of the asset; and current expectation that the asset will more likely than not be sold or disposed of before the end of its estimated useful life.
Recoverability is assessed based on the carrying amounts of the asset or asset group and the sum of the undiscounted cash flows expected to result from the use and the eventual disposal of the asset. An impairment loss is recognized when the carrying amount is not recoverable and exceeds fair value.
As we entered the fourth quarter of fiscal 2013, we faced increasing operational and financial challenges, including manufacturing overcapacity and weak operating performance which led to a deterioration in market conditions. As a result, during the fourth quarter of fiscal 2013, we reviewed the recoverability of our long-lived asset groups and we concluded that our business was able to fully recover the carrying amounts of our assets. We performed an enterprise-wide impairment test in the fourth fiscal quarter of 2012 and no enterprise-wide impairment charges were recorded. See Note 7 to Consolidated Financial Statements -
Impairment of Long-lived Assets
, for additional information.
70
FORMFACTOR, INC.
NOTES TO CONSOLIDATED FINANCIAL STATEMENTS (Continued)
Long-Lived Assets Held For Sale
We classify long-lived assets as held for sale when certain criteria are met, including: management's commitment to a plan to sell the assets; the availability of the assets for immediate sale in their present condition; whether an active program to locate buyers and other actions to sell the assets has been initiated; whether the sale of the assets is probable and their transfer is expected to qualify for recognition as a completed sale within one year; whether the assets are being marketed at reasonable prices in relation to their fair value; and whether it is unlikely that significant changes will be made to the plan to sell the assets.
We measure long-lived assets to be disposed of by sale at the lower of the carrying amount or fair value less cost to sell. Fair value is determined using quoted market prices or the anticipated cash flows discounted at a rate commensurate with the risk involved. Changes to our estimated fair values of such assets are recorded in the periods in which such changes are identified.
Concentration of Credit Risk and Other Risks and Uncertainties
Financial instruments that potentially subject us to concentrations of credit risk consist primarily of cash equivalents, marketable securities and trade receivables. Our cash equivalents and marketable securities are held in safekeeping by large, credit worthy financial institutions. We invest our excess cash primarily in U.S. banks, government and agency bonds, money market funds and corporate obligations. We have established guidelines relative to credit ratings, diversification and maturities that seek to maintain safety and liquidity. Deposits in these banks may exceed the amounts of insurance provided on such deposits. To date, we have not experienced any losses on our deposits of cash and cash equivalents.
We market and sell our products to a narrow base of customers and generally do not require collateral. In fiscal
2013
,
three
customers accounted for
18%
,
17%
and
12%
of revenues. In fiscal
2012
,
three
customers accounted for
29%
,
13%
and
12%
of revenues. In fiscal
2011
,
three
customers accounted for
20%
,
16%
, and
11%
of revenues.
At
December 28, 2013
,
three
customers accounted for
21%
,
15%
and
11%
of gross accounts receivable. At
December 29, 2012
,
one
customer accounted for
29%
of gross accounts receivable. We operate in the intensely competitive semiconductor industry, including the Dynamic Random Access Memory, or DRAM, Flash memory, and System-on-Chip or SoC markets, which have been characterized by price erosion, rapid technological change, short product life, cyclical market patterns and heightened foreign and domestic competition. Significant technological changes in the industry could adversely affect our operating results.
We are exposed to non-performance risk by counterparties on the currency forward exchange contracts used in hedging activities. We seek to minimize risk by diversifying our hedging program across multiple financial institutions. These counterparties are large international financial institutions, and to date no such counterparty has failed to meet its financial obligations to us.
Certain components for our wafer probe card products that meet our requirements are available only from a limited number of suppliers. The rapid rate of technological change and the necessity of developing and manufacturing products with short life cycles may intensify our reliance on such suppliers. The inability to obtain components as required, or to develop alternative sources, if and as required in the future, could result in delays or reductions in product shipments, which in turn could have a material adverse effect on our business, financial condition, results of operations or cash flows.
Revenue Recognition
We recognize revenue when persuasive evidence of a sales arrangement exists, title and risk of loss has transferred to the customer, the selling price is fixed or determinable and collection of the related receivable is reasonably assured. In instances where final acceptance of the deliverable is specified by the customer, revenue is deferred until all acceptance criteria have been met. Revenues from the licensing of our design and manufacturing technology, which have not been material to date, are recognized over the term of the license agreement or when the significant contractual obligations have been fulfilled.
Warranty Obligations
We offer warranties on certain products and record a liability for the estimated future costs associated with warranty claims at the time revenue is recognized. The warranty liability is based upon historical experience and our estimate of the level of future costs. While we engage in product quality programs and processes, our warranty obligation is affected by product failure rates, material usage and service delivery costs incurred in correcting a product failure. We continuously monitor product returns for warranty and maintain a reserve for the related expenses based upon our historical experience and any specifically identified field failures. As we sell new products to our customers, we must exercise considerable judgment in estimating the expected failure rates. This estimating process is based on historical experience of similar products, as well as various other assumptions that we believe to be reasonable under the circumstances.
71
FORMFACTOR, INC.
NOTES TO CONSOLIDATED FINANCIAL STATEMENTS (Continued)
We provide for the estimated cost of product warranties at the time revenue is recognized. Warranty costs are reflected in the Consolidated Statement of Operations as a cost of revenues. A reconciliation of the changes in our warranty liability is as follows (in thousands):
|
|
Fiscal Years Ended
|
||||||
|
|
December 28, 2013
|
December 29, 2012
|
|||||
|
Warranty accrual beginning balance
|
$
|
734
|
|
$
|
330
|
|
|
|
Accrual for warranties issued during the year
|
1,916
|
|
1,744
|
|
|||
|
Settlements made during the year
|
(1,959
|
)
|
(1,340
|
)
|
|||
|
Warranty accrual ending balance
|
$
|
691
|
|
$
|
734
|
|
|
Research and Development
Research and development expenses include expenses related to product development, engineering and material costs. All research and development costs are expensed as incurred.
Allowance for Doubtful Accounts
The majority of our trade receivables are derived from sales to large multinational semiconductor manufacturers throughout the world. In order to monitor potential credit losses, we perform ongoing credit evaluations of our customers' financial condition. An allowance for doubtful accounts is maintained based upon our assessment of the expected collectability of all accounts receivable. The allowance for doubtful accounts is reviewed and assessed for adequacy on a quarterly basis. We take into consideration (1) any circumstances of which we are aware of a customer's inability to meet its financial obligations and (2) our judgments as to prevailing economic conditions in the industry and their impact on our customers. If circumstances change, and the financial condition of our customers is adversely affected and they are unable to meet their financial obligations to us, we may need to take additional allowances, which would result in an increase in our operating expense.
The allowance for doubtful accounts receivable consisted of the following activity for fiscal years
2013
,
2012
, and
2011
(in thousands):
|
Balance at Beginning of Year
|
Additions
|
Reductions
|
Balance at End of Year
|
||||||||||||
|
Fiscal year ended December 31, 2011
|
$
|
847
|
|
$
|
29
|
|
$
|
(638
|
)
|
$
|
238
|
|
|||
|
Fiscal year ended December 29, 2012
|
238
|
|
202
|
|
(151
|
)
|
289
|
|
|||||||
|
Fiscal year ended December 28, 2013
|
$
|
289
|
|
$
|
—
|
|
$
|
(24
|
)
|
$
|
265
|
|
|||
A description of activity recorded in our allowance for doubtful accounts is as follows:
|
•
|
Fiscal 2011
: we recorded a reduction in the provision of
$0.6 million
primarily due to the receipt of payments totaling
$0.3 million
for accounts receivable previously reserved and we wrote-off previously reserved accounts receivable in the amount of
$0.3 million
.
|
|
•
|
Fiscal 2012
: we recorded a provision of
$0.2 million
and released
$0.2 million
of allowance for doubtful accounts that was previously reserved.
|
|
•
|
Fiscal 2013
: we did not record a provision and released
$24 thousand
of allowance for doubtful accounts that was previously reserved.
|
Restructuring Charges
Restructuring charges include costs related to employee termination benefits, cost of long-lived assets abandoned or impaired, as well as contract termination costs. The determination of when we accrue for employee termination benefits depends on whether the termination benefits are provided under a one-time benefit arrangement or under an on-going benefit arrangement. For restructuring charges recorded as an on-going benefit arrangement, a liability for post-employment benefits is recorded when payment is probable, the amount is reasonably estimable, and the obligation relates to rights that have vested or accumulated. For restructuring charges recorded as a one-time benefit arrangement, we recognize a liability for employee termination benefits when a plan of termination, approved by management and establishing the terms of the benefit arrangement, has been communicated to employees. The timing of the recognition of one-time employee termination benefits is dependent upon the period of time the employees are required to render service after communication. If employees are not
72
FORMFACTOR, INC.
NOTES TO CONSOLIDATED FINANCIAL STATEMENTS (Continued)
required to render service in order to receive the termination benefits or if employees will not be retained to render service beyond the minimum legal notification period, a liability for the termination benefits is recognized at the communication date. In instances where employees will be retained to render service beyond the minimum legal notification period, the liability for employee termination benefits is measured initially at the communication date based on the fair value of the liability as of the termination date and is recognized ratably over the future service period. We continually evaluate the adequacy of the remaining liabilities under our restructuring initiatives.
We record charges related to long-lived assets to be abandoned when the assets cease to be used. When we cease using a building or other asset with remaining non-cancelable lease payments continuing beyond our use period, we record a liability for remaining payments under lease arrangements, as well as for contract termination costs, that will continue to be incurred under a contract for its remaining term without economic benefit to us at the cease-use date. Given the significance of, and the timing of the execution of such activities, this process is complex and involves periodic reassessments of estimates made at the time the original decisions were made, including evaluating real estate market conditions for expected vacancy periods and sub-lease rents. Although we believe that these estimates accurately reflect the costs of our restructuring plans, actual results may differ, thereby requiring us to record additional provisions or reverse a portion of such provisions.
The Company recorded restructuring charges of
$4.7 million
,
$2.9 million
and
$0.5 million
for fiscal years
2013
,
2012
and
2011
, respectively. See Note 5, Restructuring Charges, in Notes to Consolidated Financial Statements for further details.
Income Taxes
We utilize the asset and liability method of accounting for income taxes, under which deferred taxes are determined based on the temporary differences between the financial statement and tax basis of assets and liabilities using tax rates expected to be in effect during the years in which the basis differences reverse and for operating losses and tax credit carryforwards. We estimate our provision for income taxes and amounts ultimately payable or recoverable in numerous tax jurisdictions around the world. Estimates involve interpretations of regulations and are inherently complex. Resolution of income tax treatments in individual jurisdictions may not be known for many years after completion of any fiscal year. We are required to evaluate the realizability of our deferred tax assets on an ongoing basis to determine whether there is a need for a valuation allowance with respect to such deferred tax assets. A valuation allowance is recorded when it is more likely than not that some or all of the deferred tax assets will not be realized. Significant management judgment is required in determining any valuation allowance recorded against deferred tax assets. In evaluating the ability to recover deferred tax assets, we consider all available positive and negative evidence giving greater weight to our recent cumulative losses and our ability to carryback losses against prior taxable income and, commensurate with objective verifiability, the forecast of future taxable income including the reversal of temporary differences and the implementation of feasible and prudent tax planning strategies.
We recognize and measure uncertain tax positions taken or expected to be taken in a tax return if it is more likely than not that the tax position will be sustained on examination by the taxing authorities, based on the technical merits of the position. The tax benefits recognized in the consolidated financial statements from such positions are then measured based on the largest benefit that has a greater than 50 percent likelihood of being realized upon ultimate settlement. We report a liability for unrecognized tax benefits resulting from uncertain tax positions taken or expected to be taken in a tax return. We adjust these reserves in light of changing facts and circumstances, such as the closing of a tax audit or the refinement of an estimate. To the extent that the final tax outcome of these matters is different than the amounts recorded, such differences will impact the provision for income taxes in the period in which such determination is made. The provision for income taxes includes the impact of reserve provisions and changes to reserves that are considered appropriate, as well as the related net interest. We recognize interest and penalties related to unrecognized tax benefits within the income tax provision. Accrued interest and penalties are included within the related tax liability caption line in the consolidated balance sheet.
We file annual income tax returns in multiple taxing jurisdictions around the world. A number of years may elapse before an uncertain tax position is audited and finally resolved. While it is often difficult to predict the final outcome or the timing of resolution of any particular uncertain tax position, we believe that our reserves for income taxes reflect the most likely outcome. We adjust these reserves, as well as the related interest, in light of changing facts and circumstances. Settlement of any particular position could require the use of cash.
Stock-Based Compensation
We recognize compensation expense for all stock-based awards based on the grant-date estimated fair values, net of an estimated forfeiture rate. The value of the portion of the award that is ultimately expected to vest is recognized as expense ratably over the requisite service periods in our Consolidated Statement of Operations. The fair value of stock options is measured using the Black-Scholes option pricing model while the fair value for restricted stock awards and restricted stock units is measured based on the closing market price of our common stock on the date of grant.
73
FORMFACTOR, INC.
NOTES TO CONSOLIDATED FINANCIAL STATEMENTS (Continued)
Net Loss Per Share
Basic net loss per share is computed by dividing net loss by the weighted-average number of common shares outstanding for the period. Diluted net loss per share is computed giving effect to all potential dilutive common stock, including stock options, restricted stock units and common stock subject to repurchase. Diluted loss per share was based only on the weighted-average number of shares outstanding during that period as the inclusion of any common stock equivalents would have been anti-dilutive.
A reconciliation of the numerator and denominator used in the calculation of basic and diluted net loss per share is as follows (in thousands):
|
|
Fiscal Years Ended
|
||||||||||
|
|
December 28, 2013
|
December 29, 2012
|
December 31, 2011
|
||||||||
|
Numerator:
|
|
|
|
||||||||
|
Net loss used in computing basic and diluted net loss per share
|
$
|
(57,683
|
)
|
$
|
(35,546
|
)
|
$
|
(65,981
|
)
|
||
|
Denominator:
|
|
|
|
||||||||
|
Weighted-average shares used in computing basic net loss per share
|
54,204
|
|
50,551
|
|
50,521
|
|
|||||
|
Add potentially dilutive securities
|
—
|
|
—
|
|
—
|
|
|||||
|
Weighted-average shares used in computing basic and diluted net loss per share
|
54,204
|
|
50,551
|
|
50,521
|
|
|||||
The following table sets forth the weighted-average number of potentially dilutive securities excluded from the computation in the table above because their effect would have been anti-dilutive (in thousands):
|
|
Fiscal Years Ended
|
|||||||
|
|
December 28, 2013
|
December 29, 2012
|
December 31, 2011
|
|||||
|
Options to purchase common stock
|
3,805
|
|
4,430
|
|
4,893
|
|
||
|
Restricted stock units
|
373
|
|
1,246
|
|
1,150
|
|
||
|
Employee stock purchase plan
|
22
|
|
39
|
|
135
|
|
||
|
Total potentially dilutive securities
|
4,200
|
|
5,715
|
|
6,178
|
|
||
Accumulated Other Comprehensive Income (Loss)
Accumulated other comprehensive income (loss) includes foreign currency translation adjustments and unrealized gains (losses) on available-for-sale securities net of tax, the impact of which has been excluded from earnings and reflected as components of stockholders' equity.
Components of accumulated other comprehensive income (loss) was as follows (in thousands):
|
December 28, 2013
|
December 29, 2012
|
|||||||
|
Unrealized loss on marketable securities, net of tax of $428 in fiscal 2013 and fiscal 2012, respectively
|
$
|
(409
|
)
|
$
|
(270
|
)
|
||
|
Cumulative translation adjustments
|
160
|
|
1,985
|
|
||||
|
Accumulated other comprehensive income (loss)
|
$
|
(249
|
)
|
$
|
1,715
|
|
||
Recent Accounting Pronouncements
In February 2013, the FASB issued revised guidance on
“Comprehensive Income: Reporting of Amounts Reclassified Out of Accumulated Other Comprehensive Income.”
The revised guidance does not change the current requirements for reporting net income or other comprehensive income in financial statements. However, the revised guidance requires an entity to provide information about the amounts reclassified out of accumulated other comprehensive income by component. In addition, an entity is required to present, either on the face of the statement where net income is presented or in the notes, significant amounts reclassified out of accumulated other comprehensive income by the respective line items of net income but
74
FORMFACTOR, INC.
NOTES TO CONSOLIDATED FINANCIAL STATEMENTS (Continued)
only if the amount reclassified is required under GAAP to be reclassified to net income in its entirety in the same reporting period. For other amounts that are not required under GAAP to be reclassified in their entirety to net income, an entity is required to cross-reference to other disclosures required under GAAP that provide additional detail about those amounts. The revised guidance was adopted by the Company for its fiscal year 2013 commencing on December 30, 2012 and did not have a material effect on the Company's financial position, results of operations or liquidity.
In July 2013, the FASB issued an accounting standard update that provides explicit guidance on the financial statement presentation of an unrecognized tax benefit when a net operating loss carry-forward or a tax credit carry-forward exists, with the purpose of reducing diversity in practice. Under the new standard update, with certain exceptions, the Company’s unrecognized tax benefit, or a portion of an unrecognized tax benefit, should be presented in the financial statements as a reduction to a deferred tax asset for a net operating loss carry-forward or a tax credit carry-forward. This accounting standard update will be effective for the Company beginning in the first quarter of fiscal 2014 and applied prospectively with early adoption permitted. As the Company’s disclosures already conform to the required presentation, adoption of this standard will not impact its financial position or results of operations.
On October 16, 2012, we acquired Astria Semiconductor Holding, Inc., including its subsidiary Micro-Probe Incorporated (together “MicroProbe”), with Astria continuing as the surviving corporation and as a wholly-owned subsidiary of FormFactor (the "MicroProbe Acquisition"). We originally estimated the acquisition price and recorded the fair values of the MicroProbe assets acquired and liabilities assumed on October 17, 2012 at the values noted in the Original Values column in the table below. During the year ended
December 28, 2013
, we made adjustments to the acquisition price related to working capital adjustments pursuant to the relevant acquisition agreement, together with adjustments to preliminary measurements of net tangible assets, resulting in the final values noted below (in thousands):
|
Original Values
|
Final Values
|
||||||
|
Tangible net assets
|
$
|
31,842
|
|
$
|
32,789
|
|
|
|
Intangible assets
|
77,600
|
|
77,600
|
|
|||
|
Deferred income tax liabilities
|
(26,663
|
)
|
(26,663
|
)
|
|||
|
Goodwill
|
30,994
|
|
30,731
|
|
|||
|
Total acquisition price
|
$
|
113,773
|
|
$
|
114,457
|
|
|
The total acquisition consideration of
$114.5 million
was determined based on the terms of the relevant acquisition agreement which consisted of a)
$100.0 million
in cash, subject to a
$2.6 million
decrease based on MicroProbe's working capital as of the consummation of the MicroProbe Acquisition relative to an agreed-upon target, and b)
3,020,944
shares of FormFactor's common stock valued at the closing market price of
$4.57
per share on October 16, 2012, and the fair value of a settlement related to litigation between the two parties of
$3.3 million
. We recorded
$77.6 million
of identifiable intangible assets and
$6.1 million
of net tangible assets, net of
$26.7 million
of deferred income tax liabilities, based on their estimated fair values, and
$30.7 million
of goodwill.
The results of operations of the MicroProbe business and the estimated fair values of the assets acquired and liabilities assumed have been included in our consolidated financial statements since the date of the MicroProbe Acquisition. For the years ended
December 28, 2013
and
December 29, 2012
, the contribution of the acquired MicroProbe business to our total revenues were
$93.2 million
and
$19.8 million
, respectively. The portion of total expenses and net income associated with the acquired MicroProbe business was not separately identifiable due to the integration with our operations.
Marketable Securities
Marketable securities at
December 28, 2013
consisted of the following (in thousands):
75
FORMFACTOR, INC.
NOTES TO CONSOLIDATED FINANCIAL STATEMENTS (Continued)
|
Amortized Cost
|
Gross Unrealized Gains
|
Gross Unrealized Losses
|
Fair Value
|
||||||||||||
|
US Treasuries
|
$
|
48,991
|
|
$
|
33
|
|
$
|
(10
|
)
|
$
|
49,014
|
|
|||
|
Commercial paper
|
11,623
|
|
—
|
|
—
|
|
11,623
|
|
|||||||
|
Agency securities (Federal)
|
31,261
|
|
1
|
|
(4
|
)
|
31,258
|
|
|||||||
|
$
|
91,875
|
|
$
|
34
|
|
$
|
(14
|
)
|
$
|
91,895
|
|
||||
Marketable securities at
December 29, 2012
consisted of the following (in thousands):
|
Amortized Cost
|
Gross Unrealized Gains
|
Gross Unrealized Losses
|
Fair Value
|
||||||||||||
|
US Treasuries
|
$
|
43,490
|
|
$
|
97
|
|
$
|
—
|
|
$
|
43,587
|
|
|||
|
Agency securities (Federal)
|
49,896
|
|
63
|
|
(1
|
)
|
49,958
|
|
|||||||
|
$
|
93,386
|
|
$
|
160
|
|
$
|
(1
|
)
|
$
|
93,545
|
|
||||
We typically invest in highly-rated securities with low probabilities of default. Our investment policy requires investments to be rated single-A or better, limits the types of acceptable investments, concentration as to security holder and duration of the investment. The gross unrealized losses on the Company's investments in fiscal
2013
and
2012
, respectively, were caused primarily by changes in interest rates.
Our investment portfolio consists of both corporate and government securities that have a maximum maturity of
three
years. The longer the duration of these securities, the more susceptible they are to changes in market interest rates and bond yields. As yields increase, those securities with a lower yield-at-cost show a mark-to-market unrealized loss. We do not have a foreseeable need to liquidate the portfolio and anticipate recovering the full cost of the securities either as market conditions improve, or as the securities mature. Accordingly, we believe that the unrealized losses are not other-than-temporary. When evaluating the investments for other-than-temporary impairment, we review factors such as the length of time and extent to which fair value has been below the amortized cost basis, current market liquidity, interest rate risk, the financial condition of the issuer, as well as credit rating downgrades.
As of
December 28, 2013
,
none
of our investments had been in a continuous loss position for
12
months or more.
The contractual maturities of marketable securities as of
December 28, 2013
and
December 29, 2012
were as follows (in thousands):
|
|
December 28, 2013
|
December 29, 2012
|
|||||||||||||
|
|
Amortized Cost
|
Fair Value
|
Amortized Cost
|
Fair Value
|
|||||||||||
|
Due in one year or less
|
$
|
59,888
|
|
$
|
59,894
|
|
$
|
33,407
|
|
$
|
33,500
|
|
|||
|
Due after one year to five years
|
31,987
|
|
32,001
|
|
59,979
|
|
60,045
|
|
|||||||
|
$
|
91,875
|
|
$
|
91,895
|
|
$
|
93,386
|
|
$
|
93,545
|
|
||||
Realized gains on sales or maturities of marketable securities were immaterial for each of the fiscal years
2013
,
2012
, and
2011
, respectively.
Asset Retirement Obligations
We account for the fair value of a liability for an asset retirement obligation to be recognized in the period in which it is incurred if a reasonable estimate of fair value can be made. The fair value of the liability is added to the carrying amount of the associated asset and this additional carrying amount is amortized over the life of the asset. Our asset retirement obligation is associated with our commitment to return property subject to operating leases in Taiwan, South Korea, Singapore and Japan to their original condition upon lease termination. We have estimated that as of
December 28, 2013
, gross expected future cash flows of
$1.0 million
would be required to fulfill these obligations.
The carrying amount of the leasehold improvements resulting from asset retirement obligations is being amortized over the term of the related lease. Leasehold improvements amortization expense was immaterial for each of fiscal years
2013
,
2012
76
FORMFACTOR, INC.
NOTES TO CONSOLIDATED FINANCIAL STATEMENTS (Continued)
and
2011
. During fiscal 2012, we updated our estimate for our asset retirement obligation in conjunction with the renewal of leases in certain locations. As a result, we recorded a benefit of
$0.2 million
due to the reduction in the estimated future required cash flows related to our obligations at these locations.
In connection with our third quarter fiscal 2010 Restructuring Plan, we recorded impairment charges of
$1.1 million
to write down the carrying amount of leasehold improvements associated with asset retirement obligations in our Singapore manufacturing facility. This impairment charge was included within "Restructuring charges, net" in the Consolidated Statements of Operations for fiscal 2010. Subsequently, in fiscal 2011 we executed an amendment to the existing lease arrangement for our facility in Singapore which released us from our obligations related to the floor previously utilized for manufacturing in this facility. As a result, our Consolidated Statements of Operations for fiscal 2011 includes a benefit of
$1.1 million
recorded to "Restructuring charges, net".
The following is a reconciliation of the aggregate retirement liability associated with our commitment to return property to its original condition upon lease termination included in non-current "Deferred rent and other liabilities" in the Consolidated Balance Sheets (in thousands):
|
|
Fiscal Years Ended
|
||||||
|
|
December 28, 2013
|
December 29, 2012
|
|||||
|
Asset retirement obligation beginning balance
|
$
|
1,292
|
|
$
|
1,581
|
|
|
|
Liabilities settled
|
(169
|
)
|
—
|
|
|||
|
Decrease based on revised estimates of asset retirement obligations
|
—
|
|
(212
|
)
|
|||
|
Currency translation
|
(135
|
)
|
(77
|
)
|
|||
|
Asset retirement obligation ending balance
|
$
|
988
|
|
$
|
1,292
|
|
|
Inventories
Inventories consisted of the following (in thousands):
|
|
Fiscal Years Ended
|
||||||
|
|
December 28, 2013
|
December 29, 2012
|
|||||
|
Raw materials
|
$
|
7,411
|
|
$
|
8,702
|
|
|
|
Work-in-progress
|
10,531
|
|
11,181
|
|
|||
|
Finished goods
|
2,765
|
|
3,733
|
|
|||
|
$
|
20,707
|
|
$
|
23,616
|
|
||
77
FORMFACTOR, INC.
NOTES TO CONSOLIDATED FINANCIAL STATEMENTS (Continued)
Property, Plant and Equipment
Property, plant and equipment consisted of the following (in thousands):
|
Fiscal Years Ended
|
|||||||
|
December 28, 2013
|
December 29, 2012
|
||||||
|
Building
|
$
|
790
|
|
$
|
790
|
|
|
|
Machinery and equipment
|
143,463
|
|
132,419
|
|
|||
|
Computer equipment and software
|
34,547
|
|
33,890
|
|
|||
|
Capital leases
|
866
|
|
2,367
|
|
|||
|
Furniture and fixtures
|
5,495
|
|
5,761
|
|
|||
|
Leasehold improvements
|
67,384
|
|
68,440
|
|
|||
|
Sub total
|
252,545
|
|
243,667
|
|
|||
|
Less: Accumulated depreciation and amortization
|
(221,346
|
)
|
(211,557
|
)
|
|||
|
Net long-lived assets
|
31,199
|
|
32,110
|
|
|||
|
Construction-in-progress
|
3,991
|
|
13,405
|
|
|||
|
Total
|
$
|
35,190
|
|
$
|
45,515
|
|
|
In fiscal
2013
, we did not write off any fully depreciated assets, while in fiscal
2012
we wrote off fully depreciated assets with an acquired cost of
$0.2 million
.
As discussed in Note 7 to the Consolidated Financial Statements - Impairment of Long-lived Assets, in fiscal
2013
,
2012
and
2011
, we recorded aggregated impairment charges of
$0.8 million
,
$0.4 million
and
$0.5 million
in our long-lived assets, respectively.
Depreciation and amortization of property, plant and equipment, excluding the impairments charges discussed above, for the fiscal years
2013
,
2012
and
2011
was
$12.2 million
,
$10.3 million
and
$10.8 million
, respectively.
Accrued Liabilities
Accrued liabilities consisted of the following (in thousands):
|
Fiscal Years Ended
|
|||||||
|
December 28, 2013
|
December 29, 2012
|
||||||
|
Accrued compensation and benefits
|
$
|
7,975
|
|
$
|
7,918
|
|
|
|
Accrued indirect and other taxes
|
1,400
|
|
4,382
|
|
|||
|
Accrued commissions
|
448
|
|
515
|
|
|||
|
Accrued warranty
|
691
|
|
734
|
|
|||
|
Deferred rent
|
154
|
|
139
|
|
|||
|
Accrued restructuring
|
138
|
|
616
|
|
|||
|
Other accrued expenses
|
3,179
|
|
2,966
|
|
|||
|
$
|
13,985
|
|
$
|
17,270
|
|
||
In fiscal 2010, we ceased the utilization of the space in our facility in Singapore that was expected to be utilized for our manufacturing operations and in connection with this decision, we accrued a restructuring charge of
$0.4 million
composed of the remaining lease obligation that will continue to be incurred under this operating lease contract. Subsequently, in fiscal 2011, we executed an amendment to the existing lease arrangement for our facility in Singapore which released us from our obligations related to the space previously utilized for manufacturing in this facility. As a result, our Consolidated Statement of Operations for fiscal 2011 includes a benefit of
$0.4 million
recorded to "Restructuring charges, net", reflecting the reduction in the remaining liability as of the date of the newly executed arrangement.
78
FORMFACTOR, INC.
NOTES TO CONSOLIDATED FINANCIAL STATEMENTS (Continued)
Restructuring charges include costs related to employee termination benefits, cost of long-lived assets abandoned or impaired, as well as contract termination costs. Restructuring charges are reflected separately as "Restructuring charges, net" in the Consolidated Statements of Operations. A summary of the actions we have taken during fiscal
2013
,
2012
, and
2011
, the purpose of which were to improve operating efficiency, streamline and simplify our operations and reduce our operating costs, are discussed below:
2013 Restructuring Activities
I
n the first fiscal quarter of 2013, we implemented a restructuring plan (the "Q1 2013 Restructuring Plan") which resulted in the reduction of our global workforce by
31
employees across the organization. In addition we reduced our temporary workforce by approximately
20
positions. We also suspended development activities and engineering efforts for our next generation DRAM Matrix platform and terminated development activities for a certain SoC product platform. We recorded
$4.0 million
of restructuring charges during the first fiscal quarter of 2013, which was comprised of
$1.3 million
in severance and related benefits and
$2.7 million
in impairment charges for certain equipment that would no longer be utilized.
I
n the fourth fiscal quarter of 2013, we implemented a restructuring plan (the "Q4 2013 Restructuring Plan") which resulted in the reduction of our global workforce by
17
full-time employees across the organization. In addition, we reduced our temporary workforce by
17
positions. We recorded
$0.4 million
of restructuring charges during the fourth fiscal quarter of 2013 for severance and related benefits.
The liabilities we accrued represent our best estimate of the obligations we expect to incur and could be subject to adjustment as market conditions change. The remaining cash payments associated with our various reductions in workforce are expected to be paid by the end of the first fiscal quarter of
2014
. As such, the restructuring accrual is recorded as a current liability within ‘Accrued liabilities’ in the Consolidated Balance Sheet as of
December 28, 2013
.
2012 Restructuring Activities
In the second fiscal quarter of 2012, we recorded
$0.1 million
in charges for severance and related benefits related to restructuring activities. This resulted in the reduction of our global workforce by
one
full-time employee across the organization. The activities comprising this restructuring activity were completed in fiscal 2012.
In the third fiscal quarter of 2012, we implemented a restructuring plan (the "Q3 2012 Restructuring Plan") which resulted in the reduction of our global workforce by
44
employees across the organization. In conjunction with this action, we also initiated a plan to cease our memory product assembly and test manufacturing operations in Japan. We recorded
$1.8 million
in severance and related benefits,
$0.2 million
in charges for contract termination, and other costs related to restructuring activities during the quarter related to this plan, and
$0.4 million
in impairment charges for certain equipment and leasehold improvements that would no longer be utilized. The activities comprising this reduction in workforce were completed by the end of fiscal 2012.
In the fourth fiscal quarter of 2012, we implemented a restructuring plan (the "Q4 2012 Restructuring Plan") which resulted in the reduction of our global workforce by
four
employees across the organization. We recorded
$0.4 million
in severance and related benefits related to restructuring activities. The activities comprising this reduction in workforce were completed in fiscal 2013.
2011 Restructuring Activities
In the first quarter of fiscal 2011, we implemented a restructuring plan (the “Q1 2011 Restructuring Plan”) which resulted in the reduction of our global workforce by
13
full-time employees across the organization. We recorded
$1.1 million
in charges for severance and related benefits related to this plan. The activities comprising this reduction in workforce were substantially completed by the end of the second quarter of fiscal 2011.
In the second quarter of fiscal 2011, we implemented a restructuring plan (the “Q2 2011 Restructuring Plan”) which resulted in the reduction of our global workforce by
13
full-time employees across the organization. We recorded
$0.6 million
in charges for severance and related benefits related to this plan. The activities comprising this reduction in workforce were substantially completed by the end of the third quarter of fiscal 2011.
79
FORMFACTOR, INC.
NOTES TO CONSOLIDATED FINANCIAL STATEMENTS (Continued)
Additionally, in the second quarter of fiscal 2011 we executed an amendment to the existing lease arrangement for our facility in Singapore which released us from our obligations related to the space previously utilized for manufacturing in this facility. We were also granted a rent reduction for the remaining occupied facilities in this building. We had previously recorded certain asset retirement obligations of
$1.1 million
(see Note 4 to Consolidated Financial Statements - Balance Sheet Components) and accruals related to our cessation of the use of these facilities in connection with a prior restructuring action of
$0.4 million
. As a result, our Consolidated Statement of Operations for fiscal 2011 includes a benefit of
$1.5 million
recorded to "Restructuring charges, net".
In the third quarter of fiscal 2011, we implemented a restructuring plan (the “Q3 2011 Restructuring Plan”) which resulted in the reduction of our global workforce by
four
full-time employees primarily in our procurement and logistics organizations. We recorded
$0.3 million
in charges for severance and related benefits related to this plan. The activities comprising this plan were completed during fiscal 2011.
In the fourth quarter of fiscal 2011, we implemented a restructuring plan (the “Q4 2011 Restructuring Plan”) which resulted in the reduction of our global workforce by
eight
full-time employees primarily in our finance and procurement and logistics organizations. We recorded
$0.3 million
in charges for severance and related benefits related to this plan. The activities comprising this reduction were completed in fiscal 2012.
The following table summarizes the activities related to the restructuring actions of fiscal
2011
to
2013
(in thousands):
|
Employee
Severance and Benefits |
Property and Equipment Impairment
|
Contract
Termination and Other Costs |
Total
|
||||||||||||
|
Accrual at December 25, 2010
|
$
|
1,382
|
|
$
|
—
|
|
$
|
451
|
|
$
|
1,833
|
|
|||
|
Restructuring charges
|
2,300
|
|
—
|
|
—
|
|
2,300
|
|
|||||||
|
Adjustments to restructuring charges
|
—
|
|
—
|
|
(374
|
)
|
(374
|
)
|
|||||||
|
Cash payments
|
(3,039
|
)
|
—
|
|
(77
|
)
|
(3,116
|
)
|
|||||||
|
Non-cash settlements
|
(443
|
)
|
—
|
|
—
|
|
(443
|
)
|
|||||||
|
Accrual at December 31, 2011
|
200
|
|
—
|
|
—
|
|
200
|
|
|||||||
|
Restructuring charges
|
2,261
|
|
462
|
|
194
|
|
2,917
|
|
|||||||
|
Adjustments to restructuring charges
|
—
|
|
—
|
|
31
|
|
31
|
|
|||||||
|
Cash payments
|
(1,913
|
)
|
—
|
|
(157
|
)
|
(2,070
|
)
|
|||||||
|
Non-cash settlements
|
—
|
|
(462
|
)
|
—
|
|
(462
|
)
|
|||||||
|
Accrual at December 31, 2012
|
548
|
|
—
|
|
68
|
|
616
|
|
|||||||
|
Restructuring charges
|
2,083
|
|
2,743
|
|
15
|
|
4,841
|
|
|||||||
|
Asset impairments
|
—
|
|
(2,743
|
)
|
—
|
|
(2,743
|
)
|
|||||||
|
Adjustments to restructuring charges
|
(178
|
)
|
(5
|
)
|
—
|
|
(183
|
)
|
|||||||
|
Cash payments
|
(2,320
|
)
|
(32
|
)
|
(17
|
)
|
(2,369
|
)
|
|||||||
|
Non-cash settlements
|
5
|
|
37
|
|
(66
|
)
|
(24
|
)
|
|||||||
|
Accrual at December 28, 2013
|
$
|
138
|
|
$
|
—
|
|
$
|
—
|
|
$
|
138
|
|
|||
The liabilities we have accrued represent our best estimate of the obligations we expect to incur and could be subject to adjustment as market conditions change. The remaining cash payments associated with our various reductions in workforce are expected to be completed by the end of the first quarter of fiscal
2014
.
80
FORMFACTOR, INC.
NOTES TO CONSOLIDATED FINANCIAL STATEMENTS (Continued)
We operate and sell our products in various global markets. As a result, we are exposed to changes in foreign currency exchange rates. We utilize foreign currency forward contracts to hedge against future movements in foreign exchange rates that affect certain existing foreign currency denominated assets and liabilities. Under this program, our strategy is to have increases or decreases in our foreign currency exposures offset by gains or losses on the foreign currency forward contracts to mitigate the risks and volatility associated with foreign currency transaction gains or losses. We do not use derivative financial instruments for speculative or trading purposes. Our derivative instruments are not designated as hedging instruments. We record the fair value of these contracts as of the end of our reporting period to our Consolidated Balance Sheet with changes in fair value recorded within "Other income, net" in our Consolidated Statement of Operations for both realized and unrealized gains and losses.
As of
December 28, 2013
, there were three outstanding foreign exchange forward contracts, one contract to sell Japanese Yen and two contracts to buy Korean Won and Taiwan Dollars. The following tables provide information about our foreign currency forward contracts outstanding as of
December 28, 2013
and
December 29, 2012
(in thousands):
|
December 28, 2013
|
Contract Position
|
Contract Amount
(Local Currency) |
Contract Amount
(U.S. Dollar) |
||||||
|
|
(In thousands)
|
||||||||
|
Japanese Yen
|
Sell
|
439,328
|
|
$
|
4,174
|
|
|||
|
Taiwan Dollar
|
Buy
|
(13,772
|
)
|
(462
|
)
|
||||
|
Korean Won
|
Buy
|
(1,034,319
|
)
|
(983
|
)
|
||||
|
Total USD notional amount of outstanding foreign exchange contracts
|
|
|
$
|
2,729
|
|
||||
|
December 29, 2012
|
Contract Position
|
Contract Amount
(Local Currency) |
Contract Amount
(U.S. Dollar) |
||||||
|
|
(In thousands)
|
||||||||
|
Japanese Yen
|
Buy
|
(63,741
|
)
|
$
|
(741
|
)
|
|||
|
Taiwan Dollar
|
Buy
|
(30,461
|
)
|
(1,061
|
)
|
||||
|
Korean Won
|
Buy
|
(721,426
|
)
|
(677
|
)
|
||||
|
Total USD notional amount of outstanding foreign exchange contracts
|
|
|
$
|
(2,479
|
)
|
||||
The contracts outstanding at
December 28, 2013
were entered into on December 27, 2013 and matured on January 28, 2014 for the Taiwan Dollar, Korean Won and Japanese Yen. Our foreign currency contracts are classified within Level 2 of the fair value hierarchy as they are valued using pricing models that utilize observable market inputs. There was
zero
change in the value of these contracts as of
December 28, 2013
. Additionally,
zero
gains or losses relating to the outstanding derivative contracts as of
December 28, 2013
and
December 29, 2012
were recorded during the respective fiscal periods.
The location and amount of losses related to non-designated derivative instruments that matured in fiscal
2013
and
2012
in the Consolidated Statements of Operations are as follows (in thousands):
|
|
Fiscal Years Ended
|
|||||||||
|
Derivatives Not Designated as Hedging Instruments
|
Location of Loss Recognized
on Derivatives |
December 28, 2013
|
December 29, 2012
|
|||||||
|
Foreign exchange forward contracts
|
Other Income, net
|
$
|
(5
|
)
|
$
|
(290
|
)
|
|||
81
FORMFACTOR, INC.
NOTES TO CONSOLIDATED FINANCIAL STATEMENTS (Continued)
The following table summarizes the components of the impairments that we recorded in fiscal
2013
,
2012
and
2011
(in thousands):
|
|
Fiscal Years Ended
|
||||||||||
|
|
December 28, 2013
|
December 29, 2012
|
December 31, 2011
|
||||||||
|
Impairment of long-lived assets:
|
|
|
|
||||||||
|
Assets held for sale
|
$
|
—
|
|
$
|
168
|
|
$
|
—
|
|
||
|
Assets to be disposed of other than by sale
|
761
|
|
253
|
|
549
|
|
|||||
|
Total
|
$
|
761
|
|
$
|
421
|
|
$
|
549
|
|
||
Assets held for sale
In fiscal
2013
, we did not record any assets held for sale. In fiscal
2012
, we recorded a
$0.2 million
charge related to certain assets which were previously held for sale that were determined to be no longer saleable and used for internal purposes. In fiscal
2011
, we did not record impairment charges related to our assets held for sale.
These impairments were included within "Impairment of long-lived assets" in the Consolidated Statement of Operations for their respective periods.
Assets to be disposed of other than by sale
In fiscal
2013
, we recorded
$0.8 million
related to manufacturing assets and software we no longer utilize. In fiscal
2012
, we recorded
$0.2 million
related to the termination of on-going construction-in-progress projects. During fiscal
2011
, we recorded impairment charges totaling
$0.5 million
related to certain assets to be disposed of other than by sale, all of which related to the termination of certain on-going projects that had been recorded in construction-in-progress, including aspects of certain software development for internal use.
All of these charges are included in "Impairment of long-lived assets" in the Consolidated Statements of Operations for their respective periods.
We use fair value measurements to record adjustments to certain financial and non-financial assets and to determine fair value disclosures. The carrying amounts of certain of our financial instruments, including cash and cash equivalents, accounts receivable, accounts payable, accrued compensation and other accrued liabilities, approximate fair value because of their short maturities. Our marketable securities are financial assets recorded at fair value on a recurring basis.
The accounting standards for fair value defines fair value, establishes a framework for measuring fair value and requires disclosures about fair value measurements. Fair value is defined as the price that would be received from selling an asset or paid to transfer a liability in an orderly transaction between market participants at the measurement date. When determining the fair value measurements for assets and liabilities required to be recorded at fair value, we consider the principal or most advantageous market in which we would transact and consider assumptions that market participants would use when pricing the asset or liability, such as inherent risk, transfer restrictions, and risk of nonperformance. The accounting standard establishes a fair value hierarchy that requires an entity to maximize the use of observable inputs and minimize the use of unobservable inputs when measuring fair value. A financial instrument's categorization within the fair value hierarchy is based upon the lowest level of input that is significant to the fair value measurement. The standard describes a fair value hierarchy based on three levels of inputs, the first two of which are considered observable and the last unobservable. We apply the following fair value hierarchy, which prioritizes the inputs used in measuring fair value as follows:
|
•
|
Level 1—Quoted prices in active markets for identical assets or liabilities.
|
|
•
|
Level 2—Inputs, other than the quoted prices in active markets, such as quoted prices for similar assets or liabilities, quoted prices near the reporting date in markets that are less active, or other inputs that are observable or can be corroborated by observable market data for substantially the full term of the assets or liabilities.
|
|
•
|
Level 3—Unobservable inputs that are supported by little or no market activity and that are significant to the fair value of the assets or liabilities.
|
82
FORMFACTOR, INC.
NOTES TO CONSOLIDATED FINANCIAL STATEMENTS (Continued)
We obtain the fair value of our Level 1 investments in certain money market funds, at the expected market price. These investments are expected to maintain a net asset value of $1 per share.
We determine the fair value of our Level 2 financial instruments from several third party asset managers, custodian banks, and the accounting service providers. Independently, these service providers use professional pricing services to gather pricing data, which may include quoted market prices for identical or comparable instruments or inputs other than quoted prices that are observable either directly or indirectly.
We utilize the market approach to measure the fair value of our fixed income securities. The market approach is a valuation technique that uses prices and other relevant information generated by market transactions involving identical or comparable assets or liabilities. The fair value of our fixed income securities is obtained using readily-available market prices from a variety of industry standard data providers, large financial institutions, and other third-party sources for the identical underlying securities.
Assets Measured at Fair Value on a Recurring Basis
We measure and report certain assets and liabilities at fair value on a recurring basis, including money market funds, U.S. Treasury securities, agency securities and foreign currency derivatives (see Note 6 to Consolidated Financial Statements - Derivative Financial Instruments for a discussion of fair value of foreign currency derivatives). The following tables represent the fair value hierarchy for our financial assets (cash equivalents and marketable securities):
Fair value measured on a recurring basis as of
December 28, 2013
(in thousands):
|
Level 1
|
Level 2
|
Total
|
|||||||||
|
Assets:
|
|||||||||||
|
Cash equivalents
|
|||||||||||
|
Money market funds
|
$
|
27,943
|
|
$
|
—
|
|
$
|
27,943
|
|
||
|
Commercial paper
|
—
|
|
11,623
|
|
11,623
|
|
|||||
|
Marketable securities
|
|||||||||||
|
US Treasuries
|
—
|
|
49,014
|
|
49,014
|
|
|||||
|
Agency securities (Federal)
|
—
|
|
31,258
|
|
31,258
|
|
|||||
|
Total
|
$
|
27,943
|
|
$
|
91,895
|
|
$
|
119,838
|
|
||
Fair value measured on a recurring basis as of
December 29, 2012
(in thousands):
|
Level 1
|
Level 2
|
Total
|
|||||||||
|
Assets:
|
|||||||||||
|
Cash equivalents
|
|||||||||||
|
Money market funds
|
$
|
54,732
|
|
$
|
—
|
|
$
|
54,732
|
|
||
|
Marketable securities
|
|||||||||||
|
US Treasuries
|
—
|
|
43,587
|
|
43,587
|
|
|||||
|
Agency securities (Federal)
|
—
|
|
49,958
|
|
49,958
|
|
|||||
|
Total
|
$
|
54,732
|
|
$
|
93,545
|
|
$
|
148,277
|
|
||
The Level 1 assets consist of our money market fund deposits. The Level 2 assets consist of our available-for-sale investment portfolio, which are valued utilizing a market approach. Our investments are priced by pricing vendors who provided observable inputs for their pricing without applying significant judgment. Broker pricing is used mainly when a quoted price is not available, the investment is not priced by our pricing vendors or when a broker price is more reflective of fair values in the market in which the investment trades. Our broker-priced investments are labeled as Level 2 investments because fair values of these investments are based on similar assets without applying significant judgments. In addition, all of our investments have a sufficient level of trading volume to demonstrate that the fair values used are appropriate for these investments.
We did not have any transfers of assets measured at fair value on a recurring basis to or from Level 1 and Level 2 during fiscal
2013
and
2012
.
83
FORMFACTOR, INC.
NOTES TO CONSOLIDATED FINANCIAL STATEMENTS (Continued)
Assets Measured at Fair Value on a Nonrecurring Basis
We measure and report goodwill and intangible assets at fair value on a non-recurring basis. See Note 9-Intangible Assets and Goodwill, for further details.
As of
December 28, 2013
, our financial asset that was recorded at fair value on a non-recurring basis comprised of a note receivable from The MicroManipulator Company (TMMC), a wholly-owned subsidiary of MicroProbe based in Carson City, Nevada. TMMC manufactures manual, analytical probe stations and accessories. As of June 29, 2013, TMMC's assets were sold to its management team for a purchase consideration of
$1.0 million
, of which
$0.2 million
was received in cash and
$0.8 million
in the form of a note receivable to be repaid over
7
years at a
5%
interest rate. We intend to hold this note receivable until its maturity. We classified this note receivable at a Level 3 category in the fair value hierarchy and determined its fair value utilizing the income approach by applying a weighted average cost of capital discount rate to arrive at the net present value of the note receivable of approximately
$0.5 million
which approximates its amortized cost.
We did not have any other assets measured at fair value on a nonrecurring basis during the year ended
December 28, 2013
. The following table represents the fair value hierarchy for our long-lived assets measured at fair value on a nonrecurring basis at their respective measurement dates (in thousands) at
December 29, 2012
:
|
Level 3
|
Total Losses
Fiscal 2012 |
||||||
|
Long-lived assets held for sale at December 31, 2011
|
$
|
389
|
|
$
|
—
|
|
|
|
Equipment impairment
|
(168
|
)
|
(168
|
)
|
|||
|
Equipment returned to held and used
|
(155
|
)
|
—
|
|
|||
|
Equipment sold
|
(66
|
)
|
—
|
|
|||
|
Long-lived assets held for sale at December 29, 2012
|
$
|
—
|
|
$
|
(168
|
)
|
|
During fiscal 2012, equipment with a carrying value of
$0.2 million
was determined to be unusable and was written-off,
$0.2 million
of equipment was returned to held and used, and less than
$0.1 million
of equipment was sold.
Our fair value processes include controls that are designed to ensure appropriate fair values are recorded. Such controls include model validation, review of key model inputs, and analysis of period-over-period fluctuations and independent recalculation of prices.
On October 16, 2012, we completed the acquisition of Astria Semiconductor Holdings, Inc., including its major subsidiary Micro-Probe Incorporated (together "MicroProbe") which is our most substantial acquisition to date (the "MicroProbe Acquisition"). The MicroProbe Acquisition was accounted for using the acquisition method of accounting under which assets and liabilities of MicroProbe were recorded at their respective fair values including an amount for goodwill representing the difference between the acquisition consideration and the fair value of the identifiable net assets. The changes in the carrying amount of goodwill as a result of the above acquisition, which is not deductible for tax purposes for fiscal
2013
were as follows (in thousands):
84
FORMFACTOR, INC.
NOTES TO CONSOLIDATED FINANCIAL STATEMENTS (Continued)
|
Goodwill
|
Amount
|
|||
|
Balance as of December 29, 2012
|
$
|
30,994
|
|
|
|
Working capital adjustments affecting the MicroProbe purchase price
|
684
|
|
||
|
Change in fair value of net intangible and tangible assets
|
(578
|
)
|
||
|
Balance as of March 30, 2013
|
31,100
|
|
||
|
Sale of subsidiary
|
(177
|
)
|
||
|
Change in value of net tangible assets
|
(965
|
)
|
||
|
Balance as of June 29, 2013
|
29,958
|
|
||
|
Change in value of net tangible assets
|
773
|
|
||
|
Balance as of December 28, 2013
|
$
|
30,731
|
|
|
In the first fiscal quarter of 2013, we increased goodwill by approximately
$0.7 million
in connection with the working capital adjustments pursuant to the acquisition agreement, and decreased goodwill by approximately
$0.6 million
resulting from a number of revisions to preliminary fair value measurements of net tangible assets. In the second fiscal quarter of 2013, goodwill was decreased by approximately
$0.2 million
in connection with the sale of TMMC, a subsidiary of MicroProbe, and by approximately
$1.0 million
for further revisions to preliminary fair value measurements, principally resulting from the adjustment of a liability assumed in the acquisition resulting from a settlement. In the third fiscal quarter of 2013, goodwill was increased by approximately
$0.8 million
for correction of an immaterial error relating to the preliminary fair value measurements arising from the valuation of leased equipment as of the acquisition date.
The Company has not recorded any historical goodwill impairments as of
December 28, 2013
.
As we entered the fourth quarter of fiscal 2013, we faced increasing operational and financial challenges, including manufacturing overcapacity and weak operating performance which led to a deterioration in market conditions. As a result, during the fourth quarter of fiscal 2013, in conjunction with our annual goodwill impairment test, we performed the first step of the two-step goodwill impairment test relating to our two reporting units to ascertain if the carrying values of the net assets exceeded fair values. We utilized an equal weighting of both the discounted cash flow method of the income approach and the guideline company method of the market approach to estimate the fair value of our two reporting units. The estimates used in the impairment testing were consistent with the discrete forecasts that we use to manage our business, and considered the significant discrete developments that we expect to occur such as independent forecasts of market growth, the introduction of new products, manufacturing synergies from our acquisition and cost reductions. Under the discounted cash flow method, cash flows beyond the discrete forecasts were estimated using a terminal growth rate, which considered the long-term earnings growth rate specific to our two reporting units. The estimated future cash flows were discounted to present value using a discount rate that was the value-weighted average of the reporting unit's estimated cost of equity and debt derived using both known and estimated market metrics, and was adjusted to reflect risk factors that considered both the timing and risks associated with the estimated cash flows. The tax rate used in the discounted cash flow method reflected the international structure currently in place, which is consistent with the market participant perspective. Under the guideline company method, market multiples were applied to forecasted revenues and earnings before interest, taxes, depreciation and amortization. The market multiples used were consistent with comparable publicly-traded companies.
The results of the first step of the impairment test indicated that the goodwill of the FormFactor and MicroProbe reporting units were not impaired, as the estimated fair values in excess of carrying values were approximately $32 million and $41 million, respectively, or 16% and 39%, over the carrying value of the reporting units, respectively. As a result, we did not record any impairment to our goodwill as of December 28, 2013.
The evaluation of goodwill and intangible assets for impairment requires the exercise of significant judgment. In the event of future changes in business conditions, we will be required to reassess and update our forecasts and estimates used in future impairment analyses. If the results of these analyses are lower than current estimates, a material impairment charge may result at that time.
85
FORMFACTOR, INC.
NOTES TO CONSOLIDATED FINANCIAL STATEMENTS (Continued)
The changes in intangible assets for fiscal
2013
and the net book value of intangible assets at
December 28, 2013
and
December 29, 2012
were as follows (in thousands):
|
Intangible Assets, Gross Amount
|
Accumulated Amortization
|
Intangible Assets, Net
|
Weight Average Useful Life
|
||||||||||||||||||||||||||||||
|
Other Intangible Assets
|
December 29, 2012
|
Additions/Disposals
|
December 28, 2013
|
December 29, 2012
|
Expense, net
|
December 28, 2013
|
December 29, 2012
|
December 28, 2013
|
December 28, 2013
|
||||||||||||||||||||||||
|
Existing developed technologies
|
$
|
37,048
|
|
$
|
14,200
|
|
$
|
51,248
|
|
$
|
6,055
|
|
$
|
12,900
|
|
$
|
18,955
|
|
$
|
30,993
|
|
$
|
32,293
|
|
2.4
|
||||||||
|
Trade name
|
4,500
|
|
(112
|
)
|
4,388
|
|
94
|
|
436
|
|
530
|
|
4,406
|
|
3,858
|
|
8.8
|
||||||||||||||||
|
Customer relationships
|
17,000
|
|
—
|
|
17,000
|
|
445
|
|
2,136
|
|
2,581
|
|
16,555
|
|
14,419
|
|
6.8
|
||||||||||||||||
|
Non-compete agreement
|
100
|
|
—
|
|
100
|
|
21
|
|
79
|
|
100
|
|
79
|
|
—
|
|
0
|
||||||||||||||||
|
Backlog
|
3,500
|
|
—
|
|
3,500
|
|
2,594
|
|
906
|
|
3,500
|
|
906
|
|
—
|
|
0
|
||||||||||||||||
|
Favorable lease asset
|
300
|
|
—
|
|
300
|
|
63
|
|
237
|
|
300
|
|
237
|
|
—
|
|
0
|
||||||||||||||||
|
Total finite-lived intangible assets
|
62,448
|
|
14,088
|
|
76,536
|
|
9,272
|
|
16,694
|
|
25,966
|
|
53,176
|
|
50,570
|
|
|||||||||||||||||
|
In-process research and development
|
21,100
|
|
(14,200
|
)
|
6,900
|
|
—
|
|
—
|
|
—
|
|
21,100
|
|
6,900
|
|
|||||||||||||||||
|
Total intangible assets
|
$
|
83,548
|
|
$
|
(112
|
)
|
$
|
83,436
|
|
$
|
9,272
|
|
$
|
16,694
|
|
$
|
25,966
|
|
$
|
74,276
|
|
$
|
57,470
|
|
|||||||||
|
Intangible Assets, Gross Amount
|
Accumulated Amortization
|
Intangible Assets, Net
|
Weight Average Useful Life
|
||||||||||||||||||||||||||||||
|
Other Intangible Assets
|
December 31, 2011
|
Additions
|
December 29, 2012
|
December 31, 2011
|
Expense
|
December 29, 2012
|
December 31, 2011
|
December 29, 2012
|
December 29, 2012
|
||||||||||||||||||||||||
|
Existing developed technologies
|
$
|
5,948
|
|
$
|
31,100
|
|
$
|
37,048
|
|
$
|
2,706
|
|
$
|
3,349
|
|
$
|
6,055
|
|
$
|
3,242
|
|
$
|
30,993
|
|
2.2
|
||||||||
|
Trade name
|
—
|
|
4,500
|
|
4,500
|
|
—
|
|
94
|
|
94
|
|
—
|
|
4,406
|
|
10.0
|
||||||||||||||||
|
Customer relationships
|
—
|
|
17,000
|
|
17,000
|
|
—
|
|
445
|
|
445
|
|
—
|
|
16,555
|
|
8.0
|
||||||||||||||||
|
Non-compete agreement
|
—
|
|
100
|
|
100
|
|
—
|
|
21
|
|
21
|
|
—
|
|
79
|
|
1.0
|
||||||||||||||||
|
Backlog
|
—
|
|
3,500
|
|
3,500
|
|
—
|
|
2,594
|
|
2,594
|
|
—
|
|
906
|
|
0.3
|
||||||||||||||||
|
Favorable lease asset
|
—
|
|
300
|
|
300
|
|
—
|
|
63
|
|
63
|
|
—
|
|
237
|
|
1.0
|
||||||||||||||||
|
Total finite-lived intangible assets
|
5,948
|
|
56,500
|
|
62,448
|
|
2,706
|
|
6,566
|
|
9,272
|
|
3,242
|
|
53,176
|
|
|||||||||||||||||
|
In-process research and development
|
—
|
|
21,100
|
|
21,100
|
|
—
|
|
—
|
|
—
|
|
—
|
|
21,100
|
|
|||||||||||||||||
|
Total intangible assets
|
$
|
5,948
|
|
$
|
77,600
|
|
$
|
83,548
|
|
$
|
2,706
|
|
$
|
6,566
|
|
$
|
9,272
|
|
$
|
3,242
|
|
$
|
74,276
|
|
|||||||||
During the year ended
December 28, 2013
, purchased in-process research and development (IPR&D) projects from the MicroProbe Acquisition with a carrying value of
$14.2 million
were completed and reclassified as finite-lived intangible assets, and are currently being amortized over their estimated useful lives.
The remaining IPR&D assets are classified as indefinite lived intangible assets that are not currently subject to
amortization but are reviewed for impairment annually or whenever events or changes in circumstances indicate that the carrying value of such assets may not be recoverable. The IPR&D assets will be subject to amortization upon completion of their respective research projects and at the start of commercialization. The fair values assigned to IPR&D assets were determined using the income approach based on estimates and judgments regarding risks inherent in the development process, including the likelihood of achieving technological success and market acceptance. If an IPR&D project is abandoned, the acquired technology attributable to the project will be expensed in the Consolidated Statement of Operations.
We recorded
$16.7 million
,
$6.6 million
and
$1.2 million
, in amortization expense related to our intangible assets in fiscal
2013
,
2012
, and
2011
, respectively. Of the total amortization expense for fiscal
2013
,
2012
, and
2011
,
$13.8 million
,
$6.0
86
FORMFACTOR, INC.
NOTES TO CONSOLIDATED FINANCIAL STATEMENTS (Continued)
million
, and
$1.2 million
were charged to cost of revenues, respectively, and
$2.9 million
,
$0.6 million
and
zero
were charged to selling, general and administrative expense, respectively.
Based on the carrying value of the finite-lived intangible assets recorded as of
December 28, 2013
, and assuming no subsequent additions to or impairment of the underlying assets, the remaining estimated annual amortization expense is expected to be as follows (in thousands):
|
Fiscal Year
|
Amount
|
|||
|
2014
|
$
|
18,781
|
|
|
|
2015
|
12,739
|
|
||
|
2016
|
8,720
|
|
||
|
2017
|
2,551
|
|
||
|
2018
|
2,501
|
|
||
|
and thereafter
|
5,278
|
|
||
|
Total
|
$
|
50,570
|
|
|
Leases
We lease facilities under non-cancellable operating leases with various expiration dates through 2021. The facilities generally require us to pay property taxes, insurance and maintenance costs. Further, several lease agreements contain rent escalation clauses or rent holidays. For purposes of recognizing minimum rental expenses on a straight-line basis over the terms of the leases, we use the date of initial possession to begin amortization. We have the option to extend or renew most of our leases which may increase the future minimum lease commitments.
Rent expense for the fiscal years
2013
,
2012
, and
2011
was
$4.9 million
,
$4.7 million
and
$4.8 million
, respectively.
We lease certain equipment under capital leases. The cost and accumulated depreciation for assets under capital leases, which were included in property, plant and equipment in the accompanying Consolidated Balance Sheets are as follows (in thousands):
|
Fiscal Years Ended
|
|||||||
|
December 28, 2013
|
December 29, 2012
|
||||||
|
Cost
|
$
|
866
|
|
$
|
2,367
|
|
|
|
Accumulated depreciation
|
637
|
|
255
|
|
|||
|
Net book value
|
$
|
229
|
|
$
|
2,112
|
|
|
In fiscal 2013, we decreased the gross value of our capital lease assets and increased goodwill by approximately
$0.8 million
for correction of an immaterial error relating to the preliminary fair value measurements arising from the valuation of leased equipment as of the MicroProbe Acquisition date. See note 9 to Notes to Consolidated Financial Statements -
Goodwill and Intangible Assets
, for further details.
The depreciation expense of these leased assets was
$0.5 million
in fiscal
2013
,
$0.2 million
for fiscal
2012
and
zero
for fiscal
2011
, respectively.
87
FORMFACTOR, INC.
NOTES TO CONSOLIDATED FINANCIAL STATEMENTS (Continued)
Future minimum payments under capital leases and non-cancelable operating leases are as follows as of
December 28, 2013
(in thousands):
|
Capital Leases
|
Operating
Leases |
||||||
|
Fiscal years:
|
|||||||
|
2014
|
$
|
270
|
|
$
|
4,223
|
|
|
|
2015-2016
|
—
|
|
6,243
|
|
|||
|
2017-2018
|
—
|
|
5,107
|
|
|||
|
Thereafter
|
—
|
|
7,432
|
|
|||
|
Total
|
270
|
|
$
|
23,005
|
|
||
|
Less: amount representing interest and executory costs
|
—
|
|
|||||
|
Present value of capital lease amounts
|
270
|
|
|||||
|
Less: current portion
|
(270
|
)
|
|||||
|
Non-current portion
|
$
|
—
|
|
||||
Other Contractual Obligations
The following table sets forth our commitments to settle other contractual obligations in cash as of
December 28, 2013
:
|
|
Payments Due In Fiscal Years
|
||||||||||||||||||
|
|
2014
|
2015-2016
|
2017-2018
|
After 2018
|
Total
|
||||||||||||||
|
|
(In thousands)
|
||||||||||||||||||
|
Purchase obligations
|
$
|
9,849
|
|
$
|
839
|
|
$
|
—
|
|
$
|
—
|
|
$
|
10,688
|
|
||||
Purchase obligations are primarily for purchases of inventory and manufacturing related service contracts. For the purposes of this table, purchase obligations are defined as agreements that are enforceable and legally binding and that specify all significant terms, including: fixed or minimum quantities to be purchased; fixed, minimum or variable price provisions; and the approximate timing of the transaction. The expected timing of payment of the obligations discussed above is estimated based on information available to us as of
December 28, 2013
. Timing of payments and actual amounts paid may be different depending on the time of receipt of goods or services or changes to agreed-upon amounts for some obligations.
The table above excludes our gross liability for unrecognized tax benefits, which totaled
$17.0 million
as of
December 28, 2013
and are classified in deferred taxes and other long-term tax liabilities on our consolidated balance sheet. The timing of any payments which could result from these unrecognized tax benefits will depend upon a number of factors. Accordingly, the timing of payment cannot be estimated and has been excluded from the table above. As of
December 28, 2013
, the changes to our uncertain tax positions in the next 12 months, that are reasonably possible, are not expected to have a significant impact on our financial position or results of operations.
Environmental Matters
We are subject to U.S. federal, state and local, and foreign governmental laws and regulations relating to the protection of the environment, including those governing the discharge of pollutants into the air and water, the management and disposal of hazardous substances and wastes, the clean-up of contaminated sites and the maintenance of a safe workplace. We believe that we comply in all material respects with the environmental laws and regulations that apply to us, including those of the California Department of Toxic Substances Control, the Bay Area Air Quality Management District, the City of Livermore Water Resources Division, County of Santa Clara Department of Environmental Health, County of San Diego Hazardous Materials Division and Encino Water District, and the California Division of Occupational Safety and Health. We did not receive any notices of violations of environmental laws and regulations in fiscal 2013 and 2012. No provision has been made for loss from environmental remediation liabilities associated with our facilities because we believe that it is not reasonable possible that a liability has been incurred as of
December 28, 2013
.
While we believe that we are in compliance in all material respects with the environmental laws and regulations that apply to us, in the future, we may receive additional environmental violation notices, and if received, final resolution of the violations identified by these notices could harm our operations, which may adversely impact our operating results and cash
88
FORMFACTOR, INC.
NOTES TO CONSOLIDATED FINANCIAL STATEMENTS (Continued)
flows. New laws and regulations, amended enforcement practices around existing laws and regulations, the discovery of previously unknown contamination at our or others' sites or the imposition of new cleanup requirements could also harm our operations, thereby adversely impacting our operating results and cash flows.
Indemnification Arrangements
We have entered, and may from time to time in the ordinary course of our business enter, into contractual arrangements with third parties that include indemnification obligations. Under these contractual arrangements, we have agreed to defend, indemnify and/or hold the third party harmless from and against certain liabilities. These arrangements include indemnities in favor of customers in the event that our wafer probe cards infringe a third party's intellectual property and indemnities in favor of our lessors in connection with facility leasehold liabilities that we may cause. In addition, we have entered into indemnification agreements with our directors and certain of our officers, and our bylaws contain indemnification obligations in favor of our directors, officers and agents. These indemnity arrangements may limit the type of the claim, the total amount that we can be required to be paid in connection with the indemnification obligation and the time within which an indemnification claim can be made. The duration of the indemnification obligation may vary, and for most arrangements, survives the agreement term and is indefinite. We believe that substantially all of our indemnity arrangements provide either for limitations on the maximum potential future payments we could be obligated to make, or for limitations on the types of claims and damages we could be obligated to indemnify, or both. However, it is not possible to determine or reasonably estimate the maximum potential amount of future payments under these indemnification obligations due to the varying terms of such obligations, a lack of history of prior indemnification claims, the unique facts and circumstances involved in each particular contractual arrangement and in each potential future claim for indemnification, and the contingency of any potential liabilities upon the occurrence of events that are not reasonably determinable. We have not had any material requests for indemnification under these arrangements. Our management believes that any liability for these indemnity arrangements would not be material to our accompanying consolidated financial statements. We have not recorded any liabilities for these indemnification arrangements on our consolidated balance sheet as of
December 28, 2013
.
Legal Matters
From time to time, we may be subject to legal proceedings and claims in the ordinary course of business. For the year ended
December 28, 2013
, we were not involved in any material legal proceedings. We identify below a proceeding filed in fiscal 2013, which, if not resolved amicably, either (i) includes allegations that could potentially result in a material legal proceeding, or (ii) the cost to defend the allegations through trial could be material. In the future we may become a party to additional legal proceedings that may require us to spend significant resources, including proceedings designed to protect our intellectual property rights. Litigation can be expensive and disruptive to normal business operations. Moreover, the results of legal proceedings are difficult to predict, and the costs incurred in litigation can be substantial, regardless of outcome.
Other Litigation
In August 2013, a former employee (“Plaintiff”) filed a class action lawsuit against the Company in the Superior Court of California, alleging violations of California’s wage and hour laws and unfair business practices on behalf of himself and all other similarly situated current and former employees at the Company’s Livermore facilities from August 21, 2009 to the present. In February 2014, the Court granted the Company’s motion to strike Plaintiff’s first amended complaint, clarifying the scope of the putative class. Procedurally, the case is in the early stages of litigation and therefore the Company is unable to predict the likelihood or extent of potential liability at this time. The Company denies the allegations and could incur material attorneys’ fees in defending the lawsuit.
Customs and Trade Matters
From time to time, we receive communications from certain jurisdictions regarding customs and indirect tax matters such as customs duties and value added taxes. For fiscal
2013
, while we did not receive any communications from jurisdictions regarding any material customs duties or indirect tax matters, we self-reported to a foreign jurisdiction an underpayment of value-added-tax based upon activities of MicroProbe prior to the MicroProbe Acquisition. The self-reported amount at issue is less than $0.1 million. At present, the Company does not have any basis to determine whether any penalty will be imposed and, if imposed, at what rate. In fiscal 2011, we received inquiries from a foreign jurisdiction tax authority regarding certain indirect tax matters. We cooperated with these inquiries, which related to our prior shipping process for new product qualifications and for products for certain of our repair center activities. During fiscal 2011, we accrued
$1.0 million
for potential exposures related to these tax and customs matters. During the third quarter of fiscal 2012, we received what we believe are final communications on these tax and customs matters indicating we owed
$0.3 million
of unpaid indirect taxes and penalties. In the fourth quarter of fiscal 2012, we adjusted our accrual to reflect this final conclusion.
89
FORMFACTOR, INC.
NOTES TO CONSOLIDATED FINANCIAL STATEMENTS (Continued)
Intellectual Property Litigation
We amicably resolved the various patent litigations the Company was involved in in prior years. As of December 28, 2013, certain third party initiated challenges to one or more of our patents remained pending in the U.S. Patent and Trademark Office and in the Taiwan Patent Office.
No provision has been made for intellectual property-related litigation because we believe that it is not probable that a liability had been incurred as of
December 28, 2013
. We could incur material attorneys' fees in prosecuting and defending actions related to intellectual property.
Preferred Stock
We have authorized
10,000,000
shares of undesignated preferred stock,
$0.001
par value, none of which is issued and outstanding. Our Board of Directors shall determine the rights, preferences, privileges and restrictions of the preferred stock, including dividends rights, conversion rights, voting rights, terms of redemption, liquidation preferences, sinking fund terms and the number of shares constituting any series or the designation of any series.
Common Stock
Each share of common stock has the right to one vote. The holders of common stock are also entitled to receive dividends whenever funds are legally available and when declared by the Board of Directors, subject to the prior rights of holders of all classes of stock outstanding having priority rights as to dividends. No dividends have been declared or paid as of
December 28, 2013
.
Common Stock Repurchase Program
On October 20, 2010, our board of directors authorized the repurchase up to
$50.0 million
of outstanding common stock which expired on October 19, 2011. On October 12, 2011, our Board of Directors authorized the extension of our repurchase program through October 19, 2012. Under the extension, we were authorized to repurchase up to a total of
$40.5 million
of outstanding common stock during the program period. The terms and conditions of the extended repurchase program remained the same as those in the original program approved in fiscal 2010. All of our repurchases were made under the authorized repurchase program. During fiscal 2011, we repurchased and retired
2,332,740
shares of common stock for
$16.4 million
. We did not repurchase any shares of common stock under the program during fiscal 2012.
Repurchased shares are retired upon the settlement of the related trade transactions. Our policy related to repurchases of our common stock is to charge the excess of cost over par value to additional paid-in capital. All repurchases were made in compliance with Rule 10b-18 under the Securities Exchange Act of 1934, as amended. The repurchase program ended effective October 19, 2012 and was not extended.
Equity Incentive Plans
During the fiscal quarter ended March 31, 2012 we had four equity incentive plans for which we have reserved shares for issuance upon the exercise of stock options: the 1996 Stock Option Plan, the Incentive Option Plan and the Management Incentive Option Plan (together, the “Prior Plans”), and the 2002 Equity Incentive Plan (the “2002 Plan”), which became effective in April 2002.
At our Annual Meeting of Stockholders on April 18, 2012 (the "2012 Annual Meeting"), our stockholders approved an amended and restated Equity Incentive Plan (the "2012 Plan"), reserving
7.4 million
shares for future grants, less any shares granted between February 28, 2012 and April 18, 2012. In addition, shares underlying any outstanding stock award or stock option grant previously awarded under the Prior Plans and the 2002 Plan canceled or forfeited prior to vesting or exercise become available for use under the 2012 Plan. The 2002 Plan was terminated on April 18, 2012, except for outstanding awards. Upon the effectiveness of the 2012 Plan, we ceased granting any equity awards under the 2002 Plan. Subsequent awards have been and will be granted under the 2012 Plan.
The 2012 Plan provides for the grant of incentive stock options and nonqualified stock options, stock appreciation rights, restricted stock and restricted stock units. The incentive stock options may be granted to our employees and the nonqualified stock options, and all awards other than incentive stock options may be granted to employees, directors and consultants. The exercise price of incentive stock options must be at least equal to the fair market value of common stock on the date of grant.
90
FORMFACTOR, INC.
NOTES TO CONSOLIDATED FINANCIAL STATEMENTS (Continued)
All options granted under the 2012 Plan will generally vest over four years and have a term of ten years, unless otherwise determined by the Compensation Committee of the Board of Directors. Stock appreciation rights, restricted stock and restricted stock units granted under the 2012 Plan will generally vest over four years in annual tranches. Additionally, restricted shares reduce the shares available for issuance at
1.55
shares for every one share issued.
At
December 28, 2013
, there were
4.9 million
shares available for grant under the 2012 Plan.
Stock Options
Stock option activity under our equity plans is set forth below:
|
|
Outstanding Options
|
|
||||||||||
|
|
Number of
Shares |
Weighted
Average Exercise Price |
Weighted
Average Remaining Contractual Life in Years |
Aggregate
Intrinsic Value |
||||||||
|
Outstanding at December 25, 2010
|
5,318,387
|
|
$
|
14.53
|
|
|
|
|
||||
|
Options granted
|
459,750
|
|
9.72
|
|
|
|
|
|||||
|
Options exercised
|
(141,280
|
)
|
6.47
|
|
|
|
|
|||||
|
Options canceled
|
(1,017,835
|
)
|
19.92
|
|
|
|
|
|||||
|
Outstanding at December 31, 2011
|
4,619,022
|
|
13.11
|
|
|
|
|
|||||
|
Options granted
|
70,000
|
|
5.34
|
|
|
|
|
|||||
|
Options exercised
|
—
|
|
—
|
|
|
|
|
|||||
|
Options canceled
|
(480,175
|
)
|
11.94
|
|
|
|
|
|||||
|
Outstanding at December 29, 2012
|
4,208,847
|
|
13.11
|
|
|
|
|
|||||
|
Options granted
|
—
|
|
—
|
|
|
|
|
|||||
|
Options exercised
|
(20,000
|
)
|
5.28
|
|
|
|
|
|||||
|
Options canceled
|
(734,421
|
)
|
17.04
|
|
|
|
|
|||||
|
Outstanding at December 28, 2013
|
3,454,426
|
|
$
|
12.32
|
|
2.89
|
$
|
17,000
|
|
|||
|
Vested and expected to vest at December 28, 2013
|
3,445,692
|
|
$
|
12.33
|
|
2.89
|
$
|
16,031
|
|
|||
|
Exercisable at December 28, 2013
|
3,177,132
|
|
$
|
12.60
|
|
2.79
|
$
|
8,500
|
|
|||
The intrinsic value of option exercises during fiscal
2013
and
2011
was
$10.0 thousand
and
$0.2 million
, respectively. Cash received from stock option exercises in fiscal
2013
and
2011
was
$0.1 million
and
$0.9 million
respectively. We did not realize any gross tax benefits in connection with these exercises.
91
FORMFACTOR, INC.
NOTES TO CONSOLIDATED FINANCIAL STATEMENTS (Continued)
Restricted Stock Units
Restricted stock units are converted into shares of our common stock upon vesting on a one-for-one basis. The vesting of restricted stock units is subject to the employee's continuing service to us. Restricted stock unit activity under our equity plans is set forth below:
|
Number of
Shares |
Weighted
Average Grant Date Fair Value |
|||||
|
Restricted stock units at December 25, 2010
|
1,372,912
|
|
$
|
16.29
|
|
|
|
Granted
|
687,645
|
|
9.94
|
|
||
|
Vested
|
(510,330
|
)
|
16.70
|
|
||
|
Canceled
|
(242,924
|
)
|
15.82
|
|
||
|
Restricted stock units at December 31, 2011
|
1,307,303
|
|
12.88
|
|
||
|
Granted
|
1,630,210
|
|
5.50
|
|
||
|
Vested
|
(484,540
|
)
|
13.99
|
|
||
|
Canceled
|
(224,027
|
)
|
8.78
|
|
||
|
Restricted stock units at December 29, 2012
|
2,228,946
|
|
7.66
|
|
||
|
Granted
|
1,708,000
|
|
5.04
|
|
||
|
Vested
|
(760,590
|
)
|
8.44
|
|
||
|
Canceled
|
(246,717
|
)
|
8.18
|
|
||
|
Restricted stock units at December 28, 2013
|
2,929,639
|
|
$
|
5.88
|
|
|
On May 6, 2013, we issued
355,000
shares of restricted stock units to seven senior executives and one non-executive of our company that will vest based on certain market performance criteria. The performance criteria are based on the Company's Total Shareholder Return (TSR) for the period from April 1, 2013 to March 31, 2015 relative to the TSR of the companies identified as being part of the S&P Semiconductor Select Industry Index (FormFactor peer companies), as of April 1, 2013. The compensation cost will be recognized ratably over the requisite service period. As of
December 28, 2013
, we recorded
$0.5 million
of stock-based compensation expense related to these awards.
On May 4, 2012, we granted
405,000
restricted stock units to certain of our senior executives scheduled to vest upon achievement of specified performance criteria based on the Company's 2013 operating cash flow levels. The restricted stock units would be earned only if performance targets established by the Compensation Committee are met. Compensation cost associated with these awards is recognized on an accelerated attribution model and ultimately based on whether or not satisfaction of the performance criteria is probable. On February 27, 2014, upon the review of the Company's 2013 operating cash flow levels, the Compensation Committee certified a total earn out of
237,816
shares, net of cancellations,
50%
of which will be immediately vested and the remaining
50%
of which will vest one year from this date.
On November 6, 2012, we granted
120,000
restricted stock units to certain of our senior executives of MicroProbe scheduled to vest upon achievement of specified performance criteria based on the Company's 2013 and 2014 revenue and gross profit levels. The restricted stock units will be earned only if the performance targets established by the Compensation Committee are met. Compensation cost associated with these awards is recognized on an accelerated attribution model and ultimately based on whether or not satisfaction of the performance criteria is probable. On January 28, 2014, upon the review of the Company's 2013 revenue and gross profit levels, the Compensation Committee concluded that there would be no earn out achieved with reference to the 2013 targets as specified above.
During fiscal
2013
and
2012
, we recorded
$0.9 million
and
$0.4 million
, respectively, of stock-based compensation expense related to these 2012 equity awards based on the assessed probability of attainment of the performance criteria.
The total fair value of restricted stock units vested during fiscal
2013
,
2012
and
2011
was
$3.9 million
,
$2.9 million
and
$4.6 million
, respectively.
Employee Stock Purchase Plan
Under the ESPP, the offering periods are 12 months commencing on February 1 of each calendar year and ending on January 31 of the subsequent calendar year, and a six month fixed offering period commencing on August 1 of each calendar year and ending on January 31 of the subsequent calendar year. The ESPP 12 month offering period consists of two six month purchase periods and the six month offering period consists of one six month purchase period. The price of the common stock
92
FORMFACTOR, INC.
NOTES TO CONSOLIDATED FINANCIAL STATEMENTS (Continued)
purchased is
85%
of the lesser of the fair market value of the common stock on the first business day of the applicable offering period or the last business day of each purchase period.
During fiscal
2013
,
2012
, and
2011
, employees purchased
583,173
shares,
533,077
shares and
386,818
shares under this program at a weighted average exercise price of
$4.29
,
$4.42
and
$7.27
, respectively.
We account for all stock-based compensation to employees and directors, including grants of stock options, as stock-based compensation costs in the Consolidated Financial Statements based on the fair value measured as of the date of grant. These costs are recognized as an expense in the Consolidated Statements of Operations over the requisite service period and increase additional paid-in capital.
The table below shows the stock-based compensation expense included in the Consolidated Statement of Operations (in thousands):
|
|
Fiscal Years Ended
|
||||||||||
|
|
December 28,
2013 |
December 29,
2012 |
December 31,
2011 |
||||||||
|
Stock-based compensation expense included in:
|
|
|
|
||||||||
|
Cost of revenues (1)
|
$
|
2,436
|
|
$
|
2,588
|
|
$
|
3,473
|
|
||
|
Research and development
|
3,440
|
|
4,262
|
|
4,293
|
|
|||||
|
Selling, general and administrative
|
6,248
|
|
6,199
|
|
6,083
|
|
|||||
|
Total stock-based compensation
|
12,124
|
|
13,049
|
|
13,849
|
|
|||||
|
Tax effect on stock-based compensation
|
—
|
|
—
|
|
—
|
|
|||||
|
Total stock-based compensation, net of tax
|
$
|
12,124
|
|
$
|
13,049
|
|
$
|
13,849
|
|
||
|
(1)
|
Fiscal 2011 includes
$0.3 million
, respectively, of net stock-based compensation expense resulting from the modification and acceleration of certain stock options and restricted stock units to a former executive in conjunction with a separation agreement and mutual release.
|
Stock Options
The exercise price of each stock option equals the market price of our stock on the date of grant. Most options are scheduled to vest over
three
to
four
years and expire
five
to
ten
years from the grant date. The fair value of each option grant is estimated on the date of grant using the Black-Scholes option pricing model. In addition, we estimate forfeitures when recognizing compensation expense, and adjust our estimates of forfeitures over the requisite service period based on the extent to which actual forfeitures differ, or are expected to differ, from such estimates. Changes in estimated forfeitures are recognized as a change in estimate in the period of change and will also impact the amount of compensation expense to be recognized in future periods.
The following weighted-average assumptions were used in the estimated grant-date fair value calculations for stock options granted in fiscal
2013
,
2012
and
2011
;
|
|
Fiscal Years Ended
|
|||||||
|
|
December 28, 2013
|
December 29, 2012
|
December 31, 2011
|
|||||
|
Stock Options:
|
|
|
|
|||||
|
Dividend yield
|
—
|
%
|
—
|
%
|
—
|
%
|
||
|
Expected volatility
|
—
|
%
|
48.44
|
%
|
50.30
|
%
|
||
|
Risk-free interest rate
|
—
|
%
|
0.67
|
%
|
1.67
|
%
|
||
|
Expected life (in years)
|
0.00
|
|
4.75
|
|
4.26
|
|
||
No options were granted in fiscal 2013 and hence there are no assumptions in the table above for fiscal 2013.
Our computation of expected volatility was based on a combination of historical and market-based implied volatility from traded options on our common stock. We believe that including market-based implied volatility in the calculation of
93
FORMFACTOR, INC.
NOTES TO CONSOLIDATED FINANCIAL STATEMENTS (Continued)
expected volatility results in a more accurate measure of the volatility expected in future periods. Risk-free interest rates are yields for zero-coupon U.S. Treasury notes maturing approximately at the end of the expected option life. We determine the expected term by considering several factors, including historical option exercise behavior, post vesting turnover rates, contractual terms and vesting periods of the options granted.
During fiscal
2013
, we did not grant any stock options. During fiscal
2012
, we granted
70,000
stock options under our approved plans with a weighted average grant-date fair value of
$2.17
per share. During fiscal 2011, we granted
459,750
stock options under our approved plans with a weighted average grant-date fair value of
$4.06
per share.
As of
December 28, 2013
, the unamortized stock-based compensation balance related to stock options was
$0.7 million
after estimated forfeitures, which will be recognized over an estimated period of
1.0 years
based on the weighted average days to vest.
Employee Stock Purchase Plan
During fiscal
2013
, we issued
583,173
shares under our approved employee stock purchase plans. As of
December 28, 2013
, we had
$0.1 million
of total unrecognized stock-based compensation expense, which will be recognized over the weighted average period of approximately
one
month. Compensation expense is calculated using the fair value of the employees' purchase rights under the Black-Scholes model. The following assumptions were used in estimating the fair value of employees' purchase rights under the approved employee stock purchase plans:
|
|
Fiscal Years Ended
|
|||||||
|
|
December 28, 2013
|
December 29, 2012
|
December 31, 2011
|
|||||
|
Employee Stock Purchase Plan:
|
|
|
|
|||||
|
Dividend yield
|
—
|
%
|
—
|
%
|
—
|
%
|
||
|
Expected volatility
|
39.8
|
%
|
46.44
|
%
|
53.47
|
%
|
||
|
Risk-free interest rate
|
0.13
|
%
|
0.11
|
%
|
0.23
|
%
|
||
|
Expected life (in years)
|
0.7
|
|
0.8
|
|
0.8
|
|
||
Restricted Stock Units
The fair value of restricted stock units is determined using the market closing price of our common stock on the grant date, and compensation cost is recognized over the vesting period on a straight line basis. The restricted stock units generally vest over four years.
During fiscal
2013
,
2012
and
2011
, we granted
1,708,000
shares,
1,630,210
shares and
687,645
shares of restricted stock units under our 2002 and 2012 Plans with the weighted average grant-date fair values of
$5.04
,
$5.50
and
$9.94
per share, respectively. As of
December 28, 2013
, the unamortized stock-based compensation balance related to restricted stock units was
$7.2 million
after estimated forfeitures, which will be recognized over an estimated period of
1.4
years based on the weighted average days to vest.
Note
13—Income Taxes
The components of loss before income taxes were as follows (in thousands):
|
|
Fiscal Years Ended
|
||||||||||
|
|
December 28, 2013
|
December 29, 2012
|
December 31, 2011
|
||||||||
|
United States
|
$
|
(60,447
|
)
|
$
|
(64,252
|
)
|
$
|
(71,172
|
)
|
||
|
Foreign
|
2,665
|
|
2,286
|
|
3,290
|
|
|||||
|
$
|
(57,782
|
)
|
$
|
(61,966
|
)
|
$
|
(67,882
|
)
|
|||
94
FORMFACTOR, INC.
NOTES TO CONSOLIDATED FINANCIAL STATEMENTS (Continued)
The components of the provision for income taxes are as follows (in thousands):
|
|
Fiscal Years Ended
|
||||||||||
|
|
December 28, 2013
|
December 29, 2012
|
December 31, 2011
|
||||||||
|
Current provision (benefit):
|
|
|
|
||||||||
|
Federal
|
$
|
(770
|
)
|
$
|
(1,929
|
)
|
$
|
(157
|
)
|
||
|
State
|
76
|
|
60
|
|
1
|
|
|||||
|
Foreign
|
287
|
|
(81
|
)
|
(546
|
)
|
|||||
|
(407
|
)
|
(1,950
|
)
|
(702
|
)
|
||||||
|
Deferred provision (benefit):
|
|
|
|
||||||||
|
Federal
|
—
|
|
(25,520
|
)
|
(37
|
)
|
|||||
|
State
|
—
|
|
—
|
|
—
|
|
|||||
|
Foreign
|
308
|
|
1,050
|
|
(1,162
|
)
|
|||||
|
308
|
|
(24,470
|
)
|
(1,199
|
)
|
||||||
|
Total benefit from income taxes
|
$
|
(99
|
)
|
$
|
(26,420
|
)
|
$
|
(1,901
|
)
|
||
The following is a reconciliation of the difference between income taxes computed by applying the federal statutory rate of
35%
and the benefit from income taxes for fiscal
2013
,
2012
and
2011
(in thousands):
|
|
Fiscal Years Ended
|
||||||||||
|
|
December 28, 2013
|
December 29, 2012
|
December 31, 2011
|
||||||||
|
U.S. statutory federal tax rate
|
$
|
(20,224
|
)
|
$
|
(21,687
|
)
|
$
|
(23,759
|
)
|
||
|
State taxes and credits, net of Federal benefit
|
(345
|
)
|
(1,991
|
)
|
(1,890
|
)
|
|||||
|
Amortization of stock-based compensation, net of tax benefit
|
923
|
|
376
|
|
287
|
|
|||||
|
Research and development credits
|
(560
|
)
|
(674
|
)
|
(2,499
|
)
|
|||||
|
Foreign taxes at rates different than the U.S.
|
162
|
|
598
|
|
(294
|
)
|
|||||
|
Other permanent differences
|
(378
|
)
|
(1,164
|
)
|
126
|
|
|||||
|
Change in valuation allowance
|
20,505
|
|
(1,818
|
)
|
25,622
|
|
|||||
|
Other
|
(182
|
)
|
(60
|
)
|
506
|
|
|||||
|
Total
|
$
|
(99
|
)
|
$
|
(26,420
|
)
|
$
|
(1,901
|
)
|
||
95
FORMFACTOR, INC.
NOTES TO CONSOLIDATED FINANCIAL STATEMENTS (Continued)
Deferred tax assets and liabilities are recognized for the future tax consequences of differences between the carrying amounts of assets and liabilities and their respective tax bases using enacted tax rates in effect for the year in which the differences are expected to be reversed. Significant deferred tax assets and liabilities consist of the following (in thousands):
|
|
Fiscal Years Ended
|
||||||
|
|
December 28, 2013
|
December 29, 2012
|
|||||
|
Tax credits
|
$
|
26,181
|
|
$
|
25,223
|
|
|
|
Inventory reserve
|
15,280
|
|
18,871
|
|
|||
|
Other reserves and accruals
|
6,620
|
|
6,403
|
|
|||
|
Non-statutory stock options
|
18,765
|
|
20,418
|
|
|||
|
Depreciation and amortization
|
5,297
|
|
7,570
|
|
|||
|
Net operating loss carryforwards
|
132,857
|
|
117,049
|
|
|||
|
Gross deferred tax assets
|
205,000
|
|
195,534
|
|
|||
|
Valuation allowance
|
(180,913
|
)
|
(163,265
|
)
|
|||
|
Total deferred tax assets
|
24,087
|
|
32,269
|
|
|||
|
Acquired intangibles & fixed assets
|
(20,373
|
)
|
(27,879
|
)
|
|||
|
Unrealized investment gains
|
(7
|
)
|
(42
|
)
|
|||
|
Total deferred tax liabilities
|
(20,380
|
)
|
(27,921
|
)
|
|||
|
Net deferred tax assets
|
$
|
3,707
|
|
$
|
4,348
|
|
|
We are required to evaluate the realizability of our deferred tax assets in both our U.S. and non-U.S. jurisdictions on an ongoing basis in accordance with ASC 740,
Income Taxes
, to determine whether there is a need for a valuation allowance with respect to such deferred tax assets. During fiscal
2013
and
2012
, we maintained a valuation allowance against our U.S. deferred tax assets. We intend to maintain a valuation allowance until sufficient positive evidence exists to support the realization of such deferred tax assets.
Included in the
$26.4 million
income tax benefit for the year ended December 29, 2012 is a
$25.5 million
tax benefit from the release of valuation allowance of our deferred tax assets ("DTAs"). In connection with our acquisition of MicroProbe during the year ended December 29, 2012, deferred tax liabilities ("DTLs") were established on the acquired identifiable intangible assets. These DTLs exceeded the acquired DTAs by
$25.5 million
. As such, authoritative guidance requires the impact on the acquiring company's deferred tax assets and liabilities caused by an acquisition be recorded in the acquiring company's financial statements outside of acquisition accounting. Accordingly, the valuation allowance on a portion of our DTAs was released and resulted in an income tax benefit of
$25.5 million
.
During fiscal 2011, we determined that it is more likely than not that the deferred tax assets of a non-U.S. jurisdiction will be realized after considering all positive and negative evidence. Positive evidence included finalization of our current restructuring activity for the related foreign jurisdiction. It also included conclusion that such location would continue to be in operation for the foreseeable future and future taxable income sufficient to realize such deferred tax assets prior to the expiration of existing net operating loss carryforwards due to a change in the entity's structure to a cost-plus arrangement. Our conclusion that it is more likely than not that such deferred tax assets will be realized is strongly influenced by the expectation that such location will continue to be in operation for the foreseeable future. We believe such conclusion is reasonable in light of our current operational structure and forecasted operations, both for the foreign jurisdiction and our consolidated operations; however, such conclusion is inherently uncertain. Therefore, if we have material unforeseen losses or are required to restructure our non-U.S. operations to further align our operating expense structure with our expected revenues, then its ability to generate sufficient income necessary to realize a portion of the deferred tax assets may be reduced and an additional charge to increase the valuation allowance may be recorded.
96
FORMFACTOR, INC.
NOTES TO CONSOLIDATED FINANCIAL STATEMENTS (Continued)
The valuation allowance against deferred tax assets consisted of the following activity for the fiscal years
2013
,
2012
and
2011
(in thousands):
|
Description
|
Balance at
Beginning of Year |
Additions
|
Reduction
|
Balance at
End of Year |
||||||||||||
|
Allowance against deferred tax assets
|
|
|
|
|
||||||||||||
|
Year ended December 31, 2013
|
$
|
163,265
|
|
$
|
17,648
|
|
$
|
—
|
|
$
|
180,913
|
|
||||
|
Year ended December 31, 2012
|
168,875
|
|
19,910
|
|
(25,520
|
)
|
163,265
|
|
||||||||
|
Year ended December 29, 2011
|
$
|
127,731
|
|
$
|
44,520
|
|
$
|
(3,376
|
)
|
$
|
168,875
|
|
||||
At
December 28, 2013
, we had Federal research and development tax credit, net operating loss, and foreign tax credit carryforwards of
$18.7 million
,
$328.4 million
and
$1.7 million
, respectively, which will expire at various dates from
2016
through
2033
. We had alternative minimum tax credits of
$2.4 million
which do not expire. We had California research credit and net operating loss carryforwards of
$23.5 million
and
$270.5 million
, respectively. The California research credit can be carried forward indefinitely while California net operating loss carryforwards will expire at various dates from
2030
through
2033
. We had Singapore net operating loss carryforwards of
$11.5 million
which can be carried forward indefinitely.
U.S. income taxes and foreign withholding taxes associated with the repatriation of earnings of foreign subsidiaries were not provided for
$7.6 million
of undistributed earnings of its foreign subsidiaries. We intend to reinvest these earnings indefinitely in our foreign subsidiaries. If these earnings were distributed to the U.S. in the form of dividends or otherwise, or if the shares of the relevant foreign subsidiaries were sold or otherwise transferred, we would be subject to additional U.S. income taxes (subject to an adjustment for foreign tax credits) and foreign withholding taxes, of approximately
$42 thousand
. Determination of the amount of unrecognized deferred income tax liability related to these earnings is not practicable.
During fiscal
2013
,
2012
and
2011
, there were no tax benefits associated with the exercise of employee stock options and other employee stock programs.
The following table reflects changes in the unrecognized tax benefits (in thousands):
|
|
Fiscal Years Ended
|
||||||||||
|
|
December 28, 2013
|
December 29, 2012
|
December 31, 2011
|
||||||||
|
Unrecognized tax benefit beginning balance
|
$
|
17,181
|
|
$
|
17,752
|
|
$
|
17,500
|
|
||
|
Additions based on tax positions related to the current year
|
307
|
|
2,237
|
|
751
|
|
|||||
|
Reductions for tax positions of prior years
|
(60
|
)
|
9
|
|
(270
|
)
|
|||||
|
Reductions to unrecognized tax benefits due to lapse of the applicable statute of limitations
|
(456
|
)
|
(2,817
|
)
|
(148
|
)
|
|||||
|
Settlements
|
—
|
|
—
|
|
(81
|
)
|
|||||
|
Unrecognized tax benefit ending balance
|
$
|
16,972
|
|
$
|
17,181
|
|
$
|
17,752
|
|
||
At
December 28, 2013
, we had gross tax-effected unrecognized tax benefits of
$17.0 million
of which
$2.5 million
, if recognized, would impact the effective tax rate.
We recognize interest (benefit) charges and penalties related to uncertain tax positions as part of the income tax provision. We recognized interest (benefit) charges and penalties of
$(0.2) million
,
$0.3 million
and
$12 thousand
in fiscal
2013
,
2012
, and
2011
, respectively. As of
December 28, 2013
and
December 29, 2012
, we have accrued total interest charges and penalties of
$0.2 million
and
$0.4 million
, respectively, related to uncertain tax positions.
The amount of income taxes we pay is subject to ongoing audits by Federal, state and foreign tax authorities which might result in proposed assessments. Our estimate for the potential outcome for any uncertain tax issue is judgmental in nature. However, we believe we have adequately provided for any reasonably foreseeable outcome related to those matters. Our future results may include favorable or unfavorable adjustments to our estimated tax liabilities in the period the assessments are made or resolved or when statutes of limitation on potential assessments expire. As of
December 28, 2013
changes to our uncertain tax positions in the next
12
months that are reasonably possible are not expected to have a significant impact on our financial position or results of operations.
97
FORMFACTOR, INC.
NOTES TO CONSOLIDATED FINANCIAL STATEMENTS (Continued)
We and our subsidiaries file income tax returns in the U.S. Federal jurisdiction, various states and non U.S jurisdictions. The material jurisdictions in which we are subject to potential examination by tax authorities for the tax years after 2004 include, among others, the U.S. (Federal and California), Singapore and Japan. The Company is currently under tax examination in U.S federal jurisdiction for the tax year ended December 31, 2010 and October 16, 2012. It is possible that this tax examination may be concluded in the next 12 months.
We have an employee savings plan that qualifies as a deferred salary arrangement under Section 401(k) of the Internal Revenue Code. We match up to
50%
of an eligible employee's contributions to a maximum of the first
1.5%
of the eligible employee's contributions through a fiscal year. We also provide a tax-qualified profit sharing retirement plan for the benefit of eligible employees in the U.S. The plan is designed to provide employees with an accumulation of funds for retirement on a tax-deferred basis and provide for annual discretionary employer contributions. The total charge to operations under the 401(k) and the profit sharing retirement plans for fiscal
2013
,
2012
and
2011
aggregated
$1.0 million
,
$0.8 million
and
$0.6 million
, respectively.
We operate in
one
reportable segment consisting of
two
operating segments relating to our FormFactor and MicroProbe product groups. Both our operating segments are focused on the design, development, manufacture, sale and support of precision, high performance advanced semiconductor wafer probe cards. The two operating segments have been aggregated into one reportable segment as they share similar economic characteristics in terms of the nature of their products and services, production processes, customers and methods of distributing their products and services. Our chief operating decision maker is the Chief Executive Officer, who reviews operating results to make decisions about allocating resources and assessing performance for the entire company. Since we operate in one reportable segment and in one group of similar products and services, all financial segment and product line information required can be found in the consolidated financial statements.
The following table summarizes revenue by country as a percentage of total revenues based upon ship-to location:
|
Fiscal Years Ended
|
||||||||
|
December 28, 2013
|
December 29, 2012
|
December 31, 2011
|
||||||
|
Taiwan
|
27.9
|
%
|
20.7
|
%
|
31.8
|
%
|
||
|
North America
|
27.2
|
|
15.4
|
|
15.3
|
|
||
|
South Korea
|
19.8
|
|
32.8
|
|
23.1
|
|
||
|
Asia-Pacific (1)
|
9.2
|
|
12.7
|
|
8.2
|
|
||
|
Europe
|
8.6
|
|
6.5
|
|
4.2
|
|
||
|
Japan
|
7.3
|
|
11.9
|
|
17.4
|
|
||
|
Total Revenues
|
100.0
|
%
|
100.0
|
%
|
100.0
|
%
|
||
(1) Asia-Pacific includes all countries in the region except Taiwan, Japan and South Korea, which are disclosed separately.
98
FORMFACTOR, INC.
NOTES TO CONSOLIDATED FINANCIAL STATEMENTS (Continued)
The following table summarizes revenue by product group (in thousands):
|
|
Fiscal Years Ended
|
||||||||||
|
|
December 28, 2013
|
December 29, 2012
|
December 31, 2011
|
||||||||
|
SoC
|
$
|
115,597
|
|
$
|
46,586
|
|
$
|
29,050
|
|
||
|
DRAM
|
92,603
|
|
102,499
|
|
115,678
|
|
|||||
|
Flash
|
23,333
|
|
29,450
|
|
24,597
|
|
|||||
|
Total revenues
|
$
|
231,533
|
|
$
|
178,535
|
|
$
|
169,325
|
|
||
Long-lived assets, comprising net property, plant and equipment, are reported based on the location of the asset. Long-lived assets by geographic location are as follows (in thousands):
|
December 28, 2013
|
December 29, 2012
|
||||||
|
North America
|
$
|
31,505
|
|
$
|
41,592
|
|
|
|
South Korea
|
1,676
|
|
1,691
|
|
|||
|
Asia-Pacific (1)
|
1,206
|
|
1,246
|
|
|||
|
Japan
|
517
|
|
691
|
|
|||
|
Singapore
|
262
|
|
258
|
|
|||
|
Europe
|
24
|
|
37
|
|
|||
|
Total
|
$
|
35,190
|
|
$
|
45,515
|
|
|
|
(1)
|
Asia-Pacific includes all countries in the region except South Korea, Singapore, and Japan, which are disclosed separately.
|
The following customers represented greater than
10%
of our revenues in fiscal
2013
, fiscal
2012
and fiscal
2011
:
|
Fiscal 2013
|
Fiscal 2012
|
Fiscal 2011
|
||||||
|
Intel
|
17.7
|
%
|
* %
|
|
* %
|
|
||
|
SK hynix
|
16.5
|
|
29.4
|
|
16.3
|
|
||
|
Micron (1)
|
11.7
|
|
13.3
|
|
19.7
|
|
||
|
Samsung
|
*
|
|
12.4
|
|
11.2
|
|
||
|
Total
|
45.9
|
%
|
55.1
|
%
|
47.2
|
%
|
||
* Less than 10% of revenues
(1) Includes Elpida Memory Inc. and its consolidated subsidiary Rexchip Electronics Corporation. In July 2013, Micron Technology Inc. completed its acquisition of Elpida Memory Inc. Comparative disclosures for fiscal 2012 and 2011 were adjusted to conform to the revised fiscal 2013 presentation.
The percentages above reflect customer constellations as of
December 28, 2013
. Prior period constellations have been updated to reflect the current customer compositions.
In October 2011, we entered into a Separation Agreement and General Release with a former Senior Vice President. As a result, we recorded charges of
$0.8 million
within “Cost of revenues” in the Consolidated Statements of Operations for fiscal 2011, such charge being composed of
$0.5 million
of payroll and related expenses and
$0.3 million
of stock-based compensation expense related to the modification of certain stock-based compensation awards.
We engaged the law firm of Orrick, Herrington & Sutcliffe LLP ("Orrick") in fiscal 2007, and continuing through part of our fiscal
2013
, to provide us with certain legal services, including matters related to compensation and benefits. A partner at
99
FORMFACTOR, INC.
NOTES TO CONSOLIDATED FINANCIAL STATEMENTS (Continued)
Orrick, who is not involved in the above matters, is the brother-in-law of Stuart L. Merkadeau, our Senior Vice President, General Counsel and Secretary. Mr. Merkadeau does not have a financial or other interest in Orrick's engagement and Mr. Merkadeau's brother-in-law does not provide any legal services to us. Prior to engaging Orrick, our management discussed the potential engagement with our Governance Committee of the Board of Directors under the Statement of Policy regarding Related Person Transactions. The Governance Committee reviewed and approved the Orrick engagement, and continued to monitor the engagement, which in fiscal
2013
also included certain compensation and benefits matters, as well as certain labor and employment matters, as necessary. We paid Orrick
$0.2 million
in fiscal
2012
for legal services rendered. During fiscal 2013, Orrick ceased to provide legal services for the Company.
The following selected quarterly financial data should be read in conjunction with our consolidated financial statements and the related notes and "Item 7: Management's Discussion and Analysis of Financial Condition and Results of Operations." This information has been derived from our unaudited consolidated financial statements that, in our opinion, reflect all recurring adjustments necessary to fairly present this information when read in conjunction with our consolidated financial statements and the related notes appearing in the section entitled "Consolidated Financial Statements." The results of operations for any quarter are not necessarily indicative of the results to be expected for any future period.
|
|
Fiscal Quarters Ended
|
||||||||||||||||||||||||||||||
|
|
Dec. 28,
2013 |
Sep. 28,
2013 |
June. 29, 2013 (1)
|
March 30,
2013 |
Dec. 29,
2012 (2) |
Sep. 29,
2012 |
June. 30,
2012 (3) |
March 31,
2012 |
|||||||||||||||||||||||
|
|
(in thousands, except per share data)
|
||||||||||||||||||||||||||||||
|
Revenues
|
$
|
48,546
|
|
$
|
67,634
|
|
$
|
62,733
|
|
$
|
52,620
|
|
$
|
47,654
|
|
$
|
41,262
|
|
$
|
54,813
|
|
$
|
34,806
|
|
|||||||
|
Cost of revenues
|
44,288
|
|
55,088
|
|
46,328
|
|
43,545
|
|
50,798
|
|
33,110
|
|
38,646
|
|
30,650
|
|
|||||||||||||||
|
Gross profit (loss)
|
4,258
|
|
12,546
|
|
16,405
|
|
9,075
|
|
(3,144
|
)
|
8,152
|
|
16,167
|
|
4,156
|
|
|||||||||||||||
|
Operating Expenses:
|
|
|
|
|
|
|
|
|
|||||||||||||||||||||||
|
Research and development
|
9,994
|
|
10,301
|
|
10,915
|
|
10,929
|
|
9,775
|
|
8,573
|
|
10,935
|
|
10,847
|
|
|||||||||||||||
|
Selling, general and administrative
|
12,160
|
|
12,952
|
|
13,487
|
|
14,618
|
|
14,958
|
|
11,594
|
|
11,531
|
|
11,148
|
|
|||||||||||||||
|
Loss on sale of subsidiary
|
—
|
|
—
|
|
300
|
|
—
|
|
—
|
|
—
|
|
—
|
|
—
|
|
|||||||||||||||
|
Restructuring charges, net
|
443
|
|
143
|
|
92
|
|
3,980
|
|
333
|
|
2,481
|
|
136
|
|
(33
|
)
|
|||||||||||||||
|
Impairment of long-lived assets
|
567
|
|
15
|
|
121
|
|
58
|
|
49
|
|
143
|
|
61
|
|
168
|
|
|||||||||||||||
|
Gain on settlement of litigation
|
—
|
|
—
|
|
—
|
|
—
|
|
(3,250
|
)
|
—
|
|
—
|
|
—
|
|
|||||||||||||||
|
Total operating expenses
|
23,164
|
|
23,411
|
|
24,915
|
|
29,585
|
|
|
21,865
|
|
22,791
|
|
22,663
|
|
22,130
|
|
||||||||||||||
|
Operating loss
|
(18,906
|
)
|
(10,865
|
)
|
(8,510
|
)
|
(20,510
|
)
|
(25,009
|
)
|
(14,639
|
)
|
(6,496
|
)
|
(17,974
|
)
|
|||||||||||||||
|
Interest income, net
|
88
|
|
95
|
|
96
|
|
107
|
|
134
|
|
163
|
|
182
|
|
212
|
|
|||||||||||||||
|
Other income (expense), net
|
82
|
|
(91
|
)
|
209
|
|
423
|
|
334
|
|
171
|
|
546
|
|
410
|
|
|||||||||||||||
|
Loss before income taxes
|
(18,736
|
)
|
(10,861
|
)
|
(8,205
|
)
|
(19,980
|
)
|
(24,541
|
)
|
(14,305
|
)
|
(5,768
|
)
|
(17,352
|
)
|
|||||||||||||||
|
Provision for (benefit from) income taxes
|
53
|
|
(147
|
)
|
202
|
|
(207
|
)
|
(25,144
|
)
|
173
|
|
(1,551
|
)
|
102
|
|
|||||||||||||||
|
Net (loss) income
|
$
|
(18,789
|
)
|
$
|
(10,714
|
)
|
$
|
(8,407
|
)
|
$
|
(19,773
|
)
|
$
|
603
|
|
$
|
(14,478
|
)
|
$
|
(4,217
|
)
|
$
|
(17,454
|
)
|
|||||||
|
Net (loss) income per share:
|
|
|
|
|
|
|
|
|
|||||||||||||||||||||||
|
Basic
|
$
|
(0.34
|
)
|
$
|
(0.20
|
)
|
$
|
(0.16
|
)
|
$
|
(0.37
|
)
|
$
|
0.01
|
|
$
|
(0.29
|
)
|
$
|
(0.08
|
)
|
$
|
(0.35
|
)
|
|||||||
|
Diluted
|
$
|
(0.34
|
)
|
$
|
(0.20
|
)
|
$
|
(0.16
|
)
|
$
|
(0.37
|
)
|
$
|
0.01
|
|
$
|
(0.29
|
)
|
$
|
(0.08
|
)
|
$
|
(0.35
|
)
|
|||||||
|
Weighted average number of shares used in per share calculations:
|
|
|
|
|
|
|
|
|
|
|
|
|
|
|
|
|
|||||||||||||||
|
Basic
|
54,608
|
|
54,437
|
|
54,105
|
|
53,664
|
|
52,745
|
|
50,154
|
|
49,817
|
|
49,487
|
|
|||||||||||||||
|
Diluted
|
54,608
|
|
54,437
|
|
54,105
|
|
53,664
|
|
52,921
|
|
50,154
|
|
49,817
|
|
49,487
|
|
|||||||||||||||
|
(1)
|
In the second quarter of fiscal 2013, we recorded a
$0.3 million
loss on the sale of our subsidiary, TMMC. See Note 8 to the Notes to Consolidated Financial Statements for further details relating to the terms of the sale.
|
|
(2)
|
In the fourth quarter of fiscal 2012, we recorded an income tax benefit in the amount of
$25.5 million
from the release of deferred tax asset valuation allowances due to deferred tax liabilities established on the acquired identifiable intangible assets from our acquisition of MicroProbe and
$3.3 million
benefit from the settlement of patent litigation in conjunction with the acquisition of MicroProbe on October 16, 2012. The fourth quarter of fiscal 2012 includes the following Microprobe operating activity:
$19.8 million
in revenue,
$5.4 million
amortization of intangibles,
$2.6 million
release of pre-existing backlog,
$3.5 million
release of inventory fair value step-up and
$0.2 million
charge for step-up depreciation on fixed assets resulting in a net loss of
$6.4 million
.
|
100
FORMFACTOR, INC.
NOTES TO CONSOLIDATED FINANCIAL STATEMENTS (Continued)
|
(3)
|
In the second quarter of fiscal 2012, we recorded a tax benefit in the amount of
$1.6 million
from the release of a deferred tax valuation allowance recorded in a non-U.S. jurisdiction. This benefit resulted in an overall income tax benefit, rather than an income tax provision in the second quarter of fiscal 2012.
|
On January 27, 2014, we announced a global organizational restructuring and cost reduction plan. As part of the plan, the Company eliminated
51
full-time employees. In addition, we reduced our temporary workforce by
9
positions. We expect to realize about
$1 million
in savings in the first quarter of fiscal 2014 (not including restructuring charges), and about
$2 million
in savings per quarter beginning in the second quarter of fiscal 2014. We expect to incur approximately
$1.2 million
in charges related to employee termination, the majority of which will be recorded in the first quarter of fiscal 2014, when the activities comprising the plan are expected to be substantially completed.
101
INDEX TO EXHIBITS
Set forth below is a list of exhibits that are being filed or incorporated by reference into this Annual Report on Form10-K:
|
|
|
Incorporated by Reference
|
|
|
|||||||||||||
|
Exhibit
Number
|
Exhibit Description
|
Form
|
File No
|
Date of
First Filing
|
Exhibit
Number
|
Filed
Herewith
|
|||||||||||
|
2.01***
|
|
Agreement and Plan of Merger dated as of August 31, 2012 among Astria Semiconductor Holdings, Inc., FormFactor, Inc., ELM Acquisition, Inc. and Fortis Advisors LLC, as Equityholder Representative
|
10-Q/A
|
|
000-50307
|
|
1/23/2013
|
|
33.01
|
|
|||||||
|
3.01
|
|
Amended and Restated Certificate of Incorporation of the Registrant as filed with the Delaware Secretary of State on June 17, 2003
|
S-1
|
|
333-109815
|
|
10/20/2003
|
|
3.01
|
|
|
||||||
|
3.02
|
|
Amended and Restated Bylaws of the Registrant
|
8-K
|
|
000-50307
|
|
5/25/2005
|
|
3.02
|
|
|
||||||
|
4.01
|
|
Specimen Common Stock Certificate
|
S-1/A
|
|
333-86738
|
|
5/28/2002
|
|
4.01
|
|
|
||||||
|
10.01+
|
|
Form of Indemnity Agreement
|
S-1/A
|
|
333-86738
|
|
5/28/2002
|
|
10.01
|
|
|
||||||
|
10.02+
|
|
Form of Change of Control Severance Agreement
|
10-K
|
|
000-50307
|
|
3/14/2005
|
|
10.48
|
|
|
||||||
|
10.03+
|
|
1996 Stock Option Plan, and form of option grant
|
S-1
|
|
333-86738
|
|
4/22/2002
|
|
10.03
|
|
|
||||||
|
10.04+
|
|
Incentive Option Plan, and form of option grant
|
S-1
|
|
333-86738
|
|
4/22/2002
|
|
10.04
|
|
|
||||||
|
10.05+
|
|
Management Incentive Option Plan, and form of option grant
|
S-1
|
|
333-86738
|
|
4/22/2002
|
|
10.05
|
|
|
||||||
|
10.06+
|
|
2002 Equity Incentive Plan, as amended, and forms of plan agreements
|
10-Q
|
|
000-50307
|
|
5/4/2011
|
|
10.06
|
|
|||||||
|
10.07+
|
|
2002 Employee Stock Purchase Plan, as amended
|
10-Q
|
|
000-50307
|
|
8/7/2007
|
|
10.01
|
|
|
||||||
|
10.08+
|
|
Key Employee Bonus Plan, as amended
|
10-Q
|
|
000-50307
|
|
5/7/2007
|
|
10.01
|
|
|
||||||
|
10.09+
|
|
Equity Incentive Plan, as amended and restated effective April 18, 2012, and forms of plan agreements
|
10-K
|
|
000-50307
|
|
3/13/2013
|
|
10.09
|
|
|||||||
|
10.10+
|
|
Employee Stock Purchase Plan, as amended and restated April 18, 2012
|
10-K
|
|
000-50307
|
|
3/13/2013
|
|
10.10
|
|
|||||||
|
10.11
|
|
Pacific Corporate Center Lease by and between Greenville Holding Company LLC (successor to Greenville Investors, L.P.) ("Greenville") and the Registrant dated May 3, 2001
|
S-1/A
|
|
333-86738
|
|
6/10/2003
|
|
10.18
|
|
|
||||||
|
10.12
|
|
First Amendment to Pacific Corporate Center Lease by and between Greenville and the Registrant dated January 31, 2003
|
S-1/A
|
|
333-86738
|
|
5/7/2003
|
|
10.18.1
|
|
|
||||||
|
10.13
|
|
Pacific Corporate Center Lease by and between Greenville and the Registrant dated May 3, 2001
|
S-1/A
|
|
333-86738
|
|
6/10/2003
|
|
10.19
|
|
|
||||||
|
10.14
|
|
First Amendment to Pacific Corporate Center Lease by and between Greenville and the Registrant dated January 31, 2003
|
S-1/A
|
|
333-86738
|
|
5/7/2003
|
|
10.19.1
|
|
|
||||||
|
10.15
|
|
Pacific Corporate Center Lease by and between Greenville and the Registrant dated May 3, 2001
|
S-1/A
|
|
333-86738
|
|
6/10/2003
|
|
10.2
|
|
|
||||||
|
10.16+
|
|
First Amendment to Pacific Corporate Center Lease by and between Greenville and the Registrant dated January 31, 2003
|
S-1/A
|
|
333-86738
|
|
5/7/2003
|
|
10.20.1
|
|
|
||||||
|
10.17+
|
|
Pacific Corporate Center Lease by and between Greenville and the Registrant dated September 7, 2004, as amended by First Amendment to Building 6 Lease dated August 16, 2006
|
10-Q
|
|
000-50307
|
|
11/7/2006
|
|
10.01
|
|
|
||||||
|
10.18+
|
|
Employment Letter Agreement, dated September 2, 2010, between Thomas St. Dennis and FormFactor, Inc.
|
8-K
|
|
000-50307
|
|
9/17/2010
|
|
99.01+
|
|
|
||||||
|
10.19+
|
|
Employment Offer Letter, dated August 29, 2012 to Mike Slessor
|
10-K
|
|
000-50307
|
|
3/13/2013
|
|
10.19+
|
|
|||||||
|
16.01
|
|
Letter of PricewaterhouseCoopers LLP dated April 8, 2013
|
8-K
|
|
000-50307
|
|
4/8/2013
|
|
16.01
|
|
|||||||
|
21.01
|
|
List of Registrant's subsidiaries
|
—
|
|
—
|
|
—
|
|
—
|
|
X
|
||||||
|
23.01
|
|
Consent of Independent Registered Public Accounting Firm - PwC
|
—
|
|
—
|
|
—
|
|
—
|
|
X
|
||||||
|
23.02
|
|
Consent of Independent Registered Public Accounting Firm - KPMG
|
—
|
|
—
|
|
—
|
|
—
|
|
X
|
||||||
|
24.01
|
|
Power of Attorney (included on the signature page of this Form 10-K)
|
—
|
|
—
|
|
—
|
|
—
|
|
X
|
||||||
|
31.01
|
|
Certification of Chief Executive Officer pursuant to 15 U.S.C. Section 7241, as adopted pursuant to Section 302 of the Sarbanes-Oxley Act of 2002
|
—
|
|
—
|
|
—
|
|
—
|
|
X
|
||||||
|
31.02
|
|
Certification of Chief Financial Officer pursuant to 15 U.S.C. Section 7241, as adopted pursuant to Section 302 of the Sarbanes-Oxley Act of 2002
|
—
|
|
—
|
|
—
|
|
—
|
|
X
|
||||||
|
32.01*
|
|
Certification of Chief Executive Officer and Chief Financial Officer pursuant to 18 U.S.C. Section 1350, as adopted pursuant to Section 906 of the Sarbanes-Oxley Act of 2002
|
—
|
|
—
|
|
—
|
|
—
|
|
X
|
||||||
|
101.INS**
|
|
XBRL Instance Document
|
—
|
|
—
|
|
—
|
|
—
|
|
X
|
||||||
102
|
101.SCH**
|
|
XBRL Taxonomy Extension Schema Document
|
—
|
|
—
|
|
—
|
|
—
|
|
X
|
||||||
|
101.CAL**
|
|
XBRL Taxonomy Extension Calculation Linkbase Document
|
—
|
|
—
|
|
—
|
|
—
|
|
X
|
||||||
|
101.DEF**
|
|
XBRL Taxonomy Extension Definition Linkbase Document
|
—
|
|
—
|
|
—
|
|
—
|
|
X
|
||||||
|
101.LAB**
|
|
XBRL Taxonomy Extension Label Linkbase Document
|
—
|
|
—
|
|
—
|
|
—
|
|
X
|
||||||
|
101.PRE**
|
|
XBRL Taxonomy Extension Presentation Linkbase Document
|
—
|
|
—
|
|
—
|
|
—
|
|
X
|
||||||
|
*
|
This exhibit shall not be deemed "filed" for purposes of Section 18 of the Securities Exchange Act of 1934 or otherwise subject to the liabilities of that section, nor shall it be deemed incorporated by reference in any filing under the Securities Act of 1933 or the Securities Exchange Act of 1934, whether made before or after the date hereof and irrespective of any general incorporation language in any filings.
|
|
**
|
Pursuant to Rule 406T of Regulation S-T, these interactive data files are deemed not filed or part of a registration statement or prospectus for purposes of Sections 11 or 12 of the Securities Act of 1933 or Section 18 of the Securities Exchange Act of 1934 and otherwise are not subject to liability.
|
|
***
|
Confidential treatment has been requested for portions of this document. The schedules, exhibits, and annexes to this exhibit have been omitted in reliance Item 601(b)(2) of Regulation S-K and will be furnished supplementally to the SEC upon request.
|
|
+
|
Indicates a management contract or compensatory plan or arrangement.
|
103
TABLE OF CONTENTS
Part IItem 1: BusinessItem 1A: Risk FactorsItem 1B: Unresolved Staff CommentsItem 2: PropertiesItem 3: Legal ProceedingsItem 4: Mine Safety DisclosuresPart IIItem 5: Market For Registrant's Common Equity, Related Stockholder Matters and Issuer Purchases Of Equity SecuritiesItem 6: Selected Financial DataItem 7: Management's Discussion and Analysis Of Financial Condition and Results Of OperationsItem 7A: Quantitative and Qualitative Disclosures About Market RiskItem 8: Financial Statements and Supplementary DataItem 9: Changes in and Disagreements with Accountants on Accounting and Financial DisclosureItem 9A: Controls and ProceduresItem 9B: Other InformationPart IIIItem 10: Directors, Executive Officers and Corporate GovernanceItem 11: Executive CompensationItem 12: Security Ownership Of Certain Beneficial Owners and Management and Related Stockholder MattersItem 13: Certain Relationships and Related Transactions, and Director IndependenceItem 14: Principal Accounting Fees and ServicesPart IVItem 15: Exhibits, Financial Statement SchedulesNote 1 Formation and Business Of The CompanyNote 2 Summary Of Significant Accounting PoliciesNote 3 AcquisitionNote 4 Balance Sheet ComponentsNote 5 Restructuring ChargesNote 6 Derivative Financial InstrumentsNote 7 Impairment Of Long-lived AssetsNote 8 Fair ValueNote 9 Goodwill and Intangible AssetsNote 10 Commitments and ContingenciesNote 11 Stockholders' EquityNote 12 Stock-based CompensationNote 13 Income TaxesNote 14 Employee Benefit PlansNote 15 Operating Segments and Geographic InformationNote 16 Departure Of Executive OfficersNote 17 Related Party TransactionsNote 18 Selected Quarterly Financial Data (unaudited)Note 19 Subsequent Events