FORMFACTOR INC
10-Ks and 10-Qs
|
|
|
|
|
|
|
|
|
|
|
|
|
|
|
|
|
|
|
|
|
|
|
|
|
|
|
|
|
|
|
|
|
|
|
|
|
|
|
|
|
|
|
|
|
|
|
|
|
|
|
|
|
|
|
|
UNITED STATES
SECURITIES AND EXCHANGE COMMISSION
Washington, D.C. 20549
FORM 10-K
(Mark One)
ý
ANNUAL REPORT PURSUANT TO SECTION 13 OR 15(d) OF THE SECURITIES EXCHANGE ACT OF 1934
For the fiscal year ended
December 29, 2018
Or
o
TRANSITION REPORT PURSUANT TO SECTION 13 OR 15(d) OF THE SECURITIES EXCHANGE ACT OF 1934
For the transition period from to
Commission file number: 000-50307
FormFactor, Inc.
(Exact name of registrant as specified in its charter)
|
Delaware
(State or other jurisdiction of
incorporation or organization)
|
|
13-3711155
(I.R.S. Employer
Identification No.)
|
7005 Southfront Road, Livermore, California 94551
(Address of principal executive offices, including zip code)
(925) 290-4000
(Registrant's telephone number, including area code)
Securities registered pursuant to Section 12(b) of the Act:
Common Stock
Name of each exchange on which registered:
NASDAQ Global Market
Securities registered pursuant to Section 12(g) of the Act:
None
Indicate by check mark if the registrant is a well-known seasoned issuer, as defined in Rule 405 of the Securities Act. Yes
o
No
ý
Indicate by check mark if the registrant is not required to file reports pursuant to Section 13 or Section 15(d) of the Exchange Act. Yes
o
No
ý
Indicate by check mark whether the registrant: (1) has filed all reports required to be filed by Section 13 or 15(d) of the Exchange Act during the preceding 12 months (or for such shorter period that the registrant was required to file such reports), and (2) has been subject to such filing requirements for the past 90 days. Yes
ý
No
o
Indicate by check mark whether the registrant submitted electronically and posted on its corporate Web site, if any, every Interactive Data File required to be submitted and posted pursuant to Rule 405 of the Regulation S-T during the preceding 12 months (or for such shorter period that the registrant was required to submit and post such files). Yes
x
No
o
Indicate by check mark if disclosure of delinquent filers pursuant to Item 405 of Regulation S-K is not contained herein, and will not be contained, to the best of registrant's knowledge, in definitive proxy or information statements incorporated by reference in Part III of this Form 10-K or any amendment to this Form 10-K
ý
Indicate by check mark whether the registrant is a large accelerated filer, an accelerated filer, a non-accelerated filer, a smaller reporting company, or an emerging growth company. See the definitions of "large accelerated filer," "accelerated filer," "smaller reporting company" and "emerging growth company" in Rule 12b-2 of the Exchange Act:
|
Large accelerated filer
ý
|
Accelerated filer
o
|
Non-accelerated filer
o
(Do not check if a smaller
reporting company)
|
Smaller reporting company
o
|
Emerging growth company
o
|
||||
If an emerging growth company, indicate by check mark if the registrant has elected not to use the extended transition period for complying with any new or revised financial accounting standards provided pursuant to Section 13(a) of the Exchange Act.
o
Indicate by check mark whether the registrant is a shell company (as defined in Rule 12b-2 of the Exchange Act). Yes
o
No
ý
Aggregate market value of registrant's common stock held by non-affiliates of the registrant, based upon the closing price of a share of the registrant's common stock on
June 30, 2018
(the last business day of the registrant's most recently completed second quarter) as reported by NASDAQ Global Market on that date:
$498,775,456
. Shares of the registrant's common stock held by each executive officer, director and person who owns 5% or more of the outstanding common stock of the registrant have been excluded in that such persons may be deemed to be affiliates. This determination of affiliate status is not necessarily a conclusive determination for other purposes.
The number of shares of the registrant's common stock, par value $0.001 per share, outstanding as of
February 20, 2019
was
74,478,445
shares.
DOCUMENTS INCORPORATED BY REFERENCE
Portions of the registrant's definitive Proxy Statement for the
2019
Annual Meeting of Stockholders, which will be filed within 120 days of the end of the registrant's fiscal year ended
December 29, 2018
, are incorporated by reference in Part III hereof. Except with respect to information specifically incorporated by reference in this Annual Report on Form 10-K, the Proxy Statement is not deemed to be filed as a part of this Annual Report on Form 10-K.
FORMFACTOR, INC.
Form 10-K for the Fiscal Year Ended
December 29, 2018
Index
|
|
|
Page
|
|
Part I
|
||
|
Part II
|
||
|
Part III
|
||
|
Part IV
|
||
______________
Throughout this Annual Report on Form 10-K, we refer to FormFactor, Inc. and its consolidated subsidiaries as "the Company," "FormFactor," "we," "us," and "our." Our fiscal year ends on the last Saturday in December. Our last three fiscal years ended on
December 29, 2018
,
December 30, 2017
and
December 31, 2016
.
2
NOTE REGARDING FORWARD-LOOKING STATEMENTS
This Annual Report on Form 10-K contains forward-looking statements within the meaning of the Securities Exchange Act of 1934 and the Securities Act of 1933, which are subject to known and unknown risks and uncertainties. The forward-looking statements include statements concerning, among other things, our business strategy (including the influence of anticipated trends and developments in our business and the markets in which we operate), financial results, operating results, revenues, gross margin, operating expenses, products, projected costs and capital expenditures, research and development programs, sales and marketing initiatives and competition. In some cases, you can identify these statements by our use of forward-looking words, such as "may," "might," "will," "could," "should," "expect," "plan," "anticipate," "believe," "estimate," "predict," "intend" and "continue," the negative or plural of these words and other comparable terminology. Forward-looking statements are based on information available to us as of the filing date of this Annual Report on Form 10-K and our current expectations about future events, which are inherently subject to change and involve known and unknown risks and uncertainties. You should not place undue reliance on these forward-looking statements. We have no obligation to update any of these statements, and we assume no obligation to do so. Actual events or results may differ materially from those expressed or implied by these statements due to various factors, including but not limited to the matters discussed below in the section entitled "Item 1A: Risk Factors," and elsewhere in this Annual Report on Form 10-K.
Our operating results have fluctuated in the past and are likely to continue to fluctuate. You should not rely on period-to-period comparisons of our financial results as indicators of our future performance. Some of the important factors that could cause our revenues, operating results and outlook to fluctuate from period to period include:
|
•
|
customer demand for and adoption of our products;
|
|
•
|
market and competitive conditions in our industry, the semiconductor industry and the economy as a whole;
|
|
•
|
the timing and success of new technologies and product introductions by our competitors and by us;
|
|
•
|
our ability to work efficiently with our customers on their qualification of our new technologies and products;
|
|
•
|
our ability to deliver reliable, cost-effective products that meet our customers’ testing requirements in a timely manner;
|
|
•
|
our ability to transition to new product architectures to solve next-generation semiconductor test and measurement challenges, and to bring new products into volume production on time and at acceptable yields and cost;
|
|
•
|
our ability to implement measures for enabling efficiencies and supporting growth in our design, applications, manufacturing and other operational activities;
|
|
•
|
the reduction, rescheduling or cancellation of orders by our customers;
|
|
•
|
our ability to collect accounts receivables owed by our customers;
|
|
•
|
our product and customer sales mix and geographical sales mix;
|
|
•
|
a reduction in the price or the profitability of our products due to competitive pressures or other factors;
|
|
•
|
the timely availability or the cost of components and materials utilized in our products;
|
|
•
|
our ability to efficiently optimize manufacturing capacity and production yields as necessary to meet customer demand and ramp variable production volumes at our manufacturing facilities;
|
|
•
|
our ability to protect our intellectual property against infringement and continue our investment in research and development and design activities;
|
|
•
|
any disruption in the operation of our manufacturing facilities;
|
|
•
|
changes in trade, tariff or export regulations in the markets where we produce or sell our products; and
|
|
•
|
the timing of and return on our investments in research and development.
|
3
PART I
Item 1:
Business
General
FormFactor, Inc., headquartered in Livermore, California, is a leading provider of electrical test and measurement technologies. We provide a broad range of high-performance probe cards, analytical probes, probe stations and thermal sub-systems to both semiconductor companies and scientific institutions. Our products provide electrical information from a variety of semiconductor and electro-optical devices and integrated circuits from research, to development through production. Customers use our products and services to lower production costs, improve yields, and enable development of their complex next generation products.
FormFactor, Inc. was incorporated in 1993, and we introduced our first product in 1995. In October 2012, we acquired Astria Semiconductor Holdings, Inc., including its subsidiary Micro-Probe Incorporated (together "MicroProbe"), and, in June 2016, we acquired Cascade Microtech, Inc. ("Cascade Microtech"). These acquisitions helped transform our business into a broader electrical test and measurement market leader with greater scale, diversification and market opportunities.
As of
December 29, 2018
, we operate in two reportable segments consisting of the Probe Cards Segment and the Systems Segment. Sales of our probe cards and analytical probes are included in the Probe Cards Segment, while sales of our probe stations and thermal sub-systems are included in the Systems Segment.
Products
We design, manufacture and sell multiple product lines, including probe cards, analytical probes, probe stations, thermal sub-systems, and related services.
Probe cards.
Our probe cards utilize a variety of technologies and product architectures, including micro-electromechanical systems (MEMS) technologies. We use advanced design and automation technologies to enable our rapid and cost-effective manufacturing of resilient multi-material composite spring-like electrically-conductive contact elements with characteristic length scales of a few microns. These contact elements are designed to provide a specific range of forces on, and across, a chip’s bond pad, solder bump, or copper pillar, during the test process and maintain their shape and position over a range of compression levels. In addition, while maintaining these mechanical characteristics, the contact elements must achieve reliable and high-fidelity electrical contact through wafer surfaces that are generally oxidized or otherwise contaminated, and must maintain these attributes over hundreds of thousands, and even millions, of compression cycles. Our range of capabilities enable us to rapidly produce customer-design specific probe cards that deliver leading precision, reliability, and electro-mechanical performance.
Our probe cards are customized for our customers’ unique wafer and chip designs by modifying and adapting our standard product architectures to meet an individual customer’s design layout and electrical test requirements. We offer probe cards to test a variety of semiconductor device types, including systems on a chip, mobile application processors, microprocessors, microcontrollers, graphic processors, radio frequency, analog, mixed signal, image sensors, electro-optical, DRAM memory, NAND flash memory and NOR flash memory devices.
For many advanced applications, our products must maintain tens of thousands of simultaneous high-fidelity low-impedance electrical contacts with the corresponding chip contacts on the wafer. Our present technologies enable probe cards with over 100,000 contact elements with spacings as small as 40 microns over geometries as large as 300mm. In addition, for high signal-fidelity devices such as wireless radio frequency transceivers and automotive radar chips, our probe card technologies are capable of testing at millimeter-wave frequencies range, currently up to 81 GHz.
We have invested, and intend to continue to invest, considerable resources in proprietary probe card design tools and processes. These tools and processes are intended to enable the rapid and accurate customization of products required to meet customer requirements, including automated routing and trace length adjustment within our probe cards, to rapidly design complex structures.
In addition, some of our customers test certain chips over a large range of operating temperatures, such as for automotive applications. We design probe cards to provide for a precise match with the thermal expansion characteristics of the wafer under test across the range of test operating temperatures. For many of our products, our customers can use the same probe card for both low and high temperature testing. We also design probe cards for customers that require extreme positional accuracy at a specific temperature.
Through on-going investments in both our technology and operations, we continue to innovate and improve so that our products will meet customers’ future technical roadmap performance, quality, and commercial requirements. We also focus upon leveraging these ongoing investments across all advanced probe card markets to realize synergies and economies of scale to benefit our competitiveness, time-to-market and overall profitability.
4
Analytical Probes.
We offer over 50 different analytical probe models for engineering and production testing. Analytical probes are used for a diverse set of applications, including device characterization, electrical simulation model development, failure analysis, and prototype design debugging. Our customers for analytical probes include universities, research institutions, semiconductor integrated device manufacturers, semiconductor foundries, and fabless semiconductor companies. We continue to add new models of analytical probes that address measurements with higher complexities and at higher frequencies.
Probe Stations.
Probe stations, also referred to as probing systems, are a critical tool development of new generations of semiconductor processes and designs. Probe stations are highly configurable for the required measurements, the size and type of wafer under test, the characteristics of the device design to be tested, and the temperatures at which testing is to be performed. Process development and design complexities have continually increased with each new generation of semiconductor technology to accommodate smaller design geometries, new materials and more layers. Probing systems are a fundamental tool for characterizing and verifying electrical performance and reliability to enable new semiconductor technologies. We design our probing systems for semiconductor design engineers to capture and analyze more accurate data in a shorter amount of time.
We build upon our probe stations to create integrated measurement systems that provide complete solutions for our customers’ complex measurement requirements. These systems include test instrumentation, probe, cabling configurations, and software to enable fast, accurate, on-wafer data collection for complex application and measurement needs. We offer pre-configured and customized measurement systems for production testing, power device characterization, vacuum probing, cryogenic probing, high-pressure probing, and a variety of other specific applications.
Thermal Subsystems.
Our thermal subsystems produce thermal chucks and other test systems used in probe stations. Thermal chuck systems enable the testing of devices at precise temperatures or across a range of temperatures.
Services and Support.
In addition to routine installation services at the time of sale, we offer services to enable our customers to maintain and more effectively utilize our products and to enhance our customer relationships. In addition to traditional maintenance services, our applications engineers assist our customers in test methodologies to make advanced measurements during process and product development, and during mass production.
Customers
Our customers include companies that design or make semiconductor, and semiconductor related products in the Foundry & Logic, DRAM, Flash, Display and Sensor markets. Our customers use our products to test nearly all semiconductor device types, including mobile application processors, microprocessors, microcontrollers, graphic processors, radio frequency, analog, mixed signal, image sensors, opto-electrical, DRAM memory, NAND flash memory and NOR flash memory devices.
Fabless semiconductor suppliers do not manufacture their own semiconductors, but they purchase our analytical probes and probe stations for research and development, and device characterization. They also purchase, or direct their foundries or wafer test facilities to purchase, our probe cards to test wafers manufactured for them.
We believe our customers consider timely service and support to be an important aspect of our relationship. Our probe stations are installed at customer sites either by us, our manufacturers’ representatives or our distributors, depending on the complexity of the installation and the customer’s geographic location. We assist our customers in the selection, integration and use of our products through application engineering support. We also provide worldwide on-site probe card maintenance and service training, seminars and telephone support. Our manufacturers’ representatives and distributors provide additional service and support.
Information concerning revenue by geographic region and by country based upon ship-to location appears under Item 7: Management's Discussion and Analysis of Financial Condition and Results of Operations - Revenues - Revenues by Geographic Region and Note 16 of the Notes to Consolidated Financial Statements included in Part II, Item 8 of this Annual Report on Form 10-K.
5
Information concerning revenue concentration by customer appears under Note 2 of the Notes to Consolidated Financial Statements included in Part II, Item 8 of this Annual Report on Form 10-K. The following customers represent 10% or more of our quarterly revenues:
|
Fiscal Quarters Ended
|
|||||||||||||||||||||||
|
Dec. 29,
2018 |
Sep. 29,
2018 |
June 30, 2018
|
March 31, 2018
|
Dec. 30,
2017 |
Sep. 30,
2017 |
July 1, 2017
|
April 1, 2017
|
||||||||||||||||
|
Intel Corporation
|
21.9
|
%
|
24.4
|
%
|
15.1
|
%
|
14.0
|
%
|
21.0
|
%
|
30.6
|
%
|
24.9
|
%
|
26.7
|
%
|
|||||||
|
Samsung Electronics., LTD.
|
13.8
|
%
|
*
|
|
*
|
|
10.1
|
%
|
*
|
|
*
|
|
*
|
|
10.3
|
%
|
|||||||
|
Taiwan Semiconductor Manufacturing Co.,LTD.
|
10.9
|
%
|
*
|
|
*
|
|
*
|
|
*
|
|
*
|
|
*
|
|
*
|
|
|||||||
|
SK Hynix Inc.
|
*
|
|
*
|
|
11.5
|
%
|
*
|
|
*
|
|
*
|
|
*
|
|
*
|
|
|||||||
|
Micron Technology, Inc.
|
*
|
|
12.0
|
%
|
*
|
|
*
|
|
13.1
|
%
|
*
|
|
*
|
|
*
|
|
|||||||
|
46.6
|
%
|
36.4
|
%
|
26.6
|
%
|
24.1
|
%
|
34.1
|
%
|
30.6
|
%
|
24.9
|
%
|
37.0
|
%
|
||||||||
*
Less than 10% of revenues.
Segment and Enterprise-Wide Disclosures
See Note 16 of the Notes to Consolidated Financial Statements included in Part II, Item 8 of this Annual Report on Form 10-K for certain financial information related to our segments and our enterprise-wide disclosures.
Backlog
We manufacture our products based on order backlog and customer commitments. Backlog includes only orders with written authorizations and scheduled shipment dates. Backlog also includes revenue for existing product service agreements to be earned within the next 12 to 24 months. Customers may delay delivery of products or cancel orders prior to shipment, subject to possible cancellation penalties. Due to possible changes in delivery schedules and cancellations of orders, our backlog on any particular date is not necessarily indicative of actual sales for any succeeding period. Delays in delivery schedules or a reduction in backlog during any particular period could have a material adverse effect on our business and results of operations.
Manufacturing
Our probe cards are designed for each of our customers' unique designs, by modifying and adapting our product architectures to meet an individual customer’s chip layout and test requirements. Our proprietary manufacturing processes for our probe cards include: a complex interconnection system-level design process; a front-end process, which may include wire bonding, photolithography, plating and metallurgical processes, dry and electro-deposition, pick and place assembly; and a back-end process, which includes general assembly and test. Critical steps in our manufacturing process are performed in a variety of clean room environments, including as stringent as a Class 100 environment, depending on the requirements of the specific manufacturing processes.
Our probe stations are designed to provide highly accurate electrical measurements enabled by precise and reliable mechanical components and assemblies. We prototype and test our new standard product designs and components to ensure high electrical signal integrity, mechanical accuracy and safety. We also monitor our product quality throughout the various stages of our manufacturing processes using a variety of process control methods and tests.
We depend on suppliers for materials and some critical components of our manufacturing processes, including ceramic and organic substrates and complex printed circuit boards. We also rely on suppliers to provide certain contact elements and interconnects incorporated into our products. Some of these components and materials are supplied by a single vendor, and some are subject to certain minimum order quantities. Generally, we rely on purchase orders rather than long-term contracts with our suppliers, which subjects us to risks, including price increases, manufacturing capacity constraints and component shortages. We continually assess and evaluate alternative sources of supply for all components and materials.
Our primary manufacturing facilities are located in Livermore, San Jose and Carlsbad, California, Beaverton, Oregon, United States, and in Thiendorf, Germany. We also perform manufacturing operations in our facilities in Munich, Germany; Suzhou, China; and Yokohama, Japan.
We maintain repair and service capabilities in Livermore, San Jose, and Carlsbad, California and Beaverton, Oregon, United States; Thiendorf, Dresden and Munich, Germany; Bundang, South Korea; Yokohama and Hiroshima, Japan; Suzhou and Shanghai, China; Hsinchu, Taiwan; and Singapore.
6
Research, Development and Engineering
The semiconductor industry is subject to rapid technological change and new product introductions and enhancements. We believe that our continued commitment to research and development and our timely introduction of new and enhanced products and technologies are integral to maintaining and enhancing our competitive position. We allocate significant resources to these efforts and prioritize those resources to prepare for our customers’ next generation electrical test and measurement challenges. We also increasingly seek to deploy our resources to solve fundamental challenges that are both common to, and provide competitive advantage across, our probe card and system product offerings and roadmaps.
Sales and Marketing
We sell our products worldwide through a global direct sales force and through a combination of manufacturers’ representatives and distributors.
Our direct sales and marketing staff is located in the United States, China, France, Germany, Italy, United Kingdom, Japan, Singapore, South Korea, and Taiwan. They work closely with customers in the effort to understand their businesses, anticipate trends and define products that will provide significant technical and economic advantages to our customers. We employ a highly skilled team of application and customer support engineers that support our customers as they integrate our products into their research, development and manufacturing processes. Through these customer relationships, we seek to develop a close understanding of customer and product requirements to align our capabilities with our customers’ roadmaps and production ramps.
We also have a network of representatives and distributors across the globe to broaden our reach. We engage sales representatives to act as independent third parties that agree to promote our products, at our prices and on terms set by us, in return for a commission based on sales. We typically use sales representatives in areas that we believe require greater levels of customer support than we can deliver from our own sales offices and where local language capabilities can offer an advantage. Our distributors purchase our products and resell them at prices and upon terms set by the particular distributor. We typically use distributors in particular geographies due to local regulations or business customs.
Environmental Matters
We are subject to U.S. federal, state, local, and foreign governmental laws and regulations relating to the protection of the environment, including those governing the discharge of pollutants into the air and water, the management and disposal of hazardous substances and wastes, the clean-up of contaminated sites and the maintenance of a safe workplace. We believe that we comply in all material respects with the environmental laws and regulations that apply to us. We did not receive any notices of violations of environmental laws and regulations in fiscal
2018
,
2017
or
2016
. In the future, we may receive notices of violations of environmental regulations, or otherwise learn of such violations. Environmental contamination or violations may negatively impact our business.
Competition
The markets for our products are highly competitive and we anticipate that these markets will continually evolve and be subject to rapid technological change. Our current and potential competitors are as below:
Probe Card Market.
The probe card market comprises many domestic and foreign companies, and has historically been fragmented with many local suppliers servicing individual customers in often differentiated applications. Our primary competitors are Advantest Corporation, AMST Co., Ltd., Feinmetall GmbH, Japan Electronic Materials Corporation, Korea Instrument Co., Ltd., M2N Co., Ltd., Microfriend Inc., Micronics Japan Co., Ltd., MPI Corporation, Micro Square Technology Inc., NHK Spring Co., Ltd., Soulbrain Engineering, Nidec SV TCL, Synergie CAD, TechnoProbe S.p.A, TSE Co., Ltd., WinWay Technology Co., Ltd., WILL-Technology Co., Ltd., and Yokowo, among others. In addition to the ability to address probe card performance and capability requirements in differing applications, the primary competitive factors in the markets in which we compete include product quality and reliability, price, total cost of ownership, design and manufacturing lead times, service capability, geographic proximity, field applications support and timeliness of delivery.
Probe card vendors such as Japan Electronic Materials Corporation, Micronics Japan Company, Ltd. and TechnoProbe, offer probe cards built using similar types of lithographic patterning as do we. The high capital investment and other costs associated with the development of lithographically defined probe cards and the time and high cost of the customer evaluation process represent significant barriers to entry for this type of technology.
We believe that the primary competitive factors in the production probe card market depend upon the type of integrated circuit being tested, but also include customer service, knowledge of measurement techniques, delivery time, price, probe card lifetime, chip damage prevention, probe tip touch-down accuracy, speed and frequency of the probe card, number of chips contacted in parallel, number of probe tips and their layout, signal integrity, and frequency and effectiveness of any required cleaning. As a result of our relative strengths in these areas, we believe that we compete favorably in the advanced probe card market, and in
7
probe cards for parallel testing of chips with densely-packed bond pads, bumps or pillars, and in high signal integrity testing of wireless radio frequency devices that operate up to millimeter-wave frequencies, as needed for 5G wireless networks.
Analytical Probes.
Our primary competitor in the analytical probe market is GGB Industries Inc. Regional competitors include Yokowo and TechnoProbe Co Ltd. in Japan, and MPI/Allstron in Taiwan. We believe that the primary competitive factors in this market are breadth of probe types, probe frequency and electrical signal integrity, contact integrity and the related cleaning required, knowledge of measurement techniques, calibration support, delivery time and price. We believe that we compete favorably with respect to these factors.
Probe Stations.
Our primary competitors in the probe station market are HiSOL, Inc., LTD/Accretech, The Micromanipulator Company Inc., MPI Corporation, Semiprobe, Signatone Corporation, Tokyo Electron (“TEL”), Tokyo Seimitsu Co., Vector Semiconductor Co. Ltd., and Wentworth Laboratories Inc. We believe that the primary competitive factors in the probe station market are measurement accuracy and versatility, measurement speed, automation features, knowledge of measurement techniques, completeness of the measurement solutions, delivery time and price. We believe that we compete favorably with respect to these factors.
Thermal Subsystems.
In the market for thermal subsystems, we compete principally against ERS Electronic GmbH, Espec Corp, and Temptronic Corporation. In addition, many of our probe station competitors develop and produce their own thermal subsystems for use in their products. We believe the primary competitive factors in this market are thermal performance, reliability, flexibility and completeness of product offerings. We believe that we compete favorably with respect to these factors.
Some of our competitors are also suppliers of other types of test equipment or other semiconductor equipment and may have greater financial and other resources than we do. Our competitors may enhance their current products and may introduce new products that will be competitive with ours. New alternatives to our products may also be introduced, by our current competitors or others, which may reduce the value of one or more of our products.
Semiconductor manufacturers may implement chip designs that include capabilities or use other methodologies that increase test throughput and reduce test content. This may reduce or eliminate some or all of our current products’ advantages. Semiconductor manufacturers may also increase their use of test strategies that include low performance semiconductor testers, less complex probe cards, or test procedures that do not involve our products. Our ability to compete favorably may also adversely affect the long-standing relationships between our competitors and certain semiconductor manufacturers.
Intellectual Property
Our success depends in part upon our ability to continue to innovate and invest in research and development to meet the testing requirements of our customers, to maintain and protect our proprietary technology, and to conduct our business without infringing on the proprietary rights of others. We rely on a combination of patents, trade secrets, trademarks and contractual restrictions on disclosure to protect our intellectual property rights. We have filed actions to enforce those rights against third parties in the past, and may pursue such actions in the future.
We have generated, and continue to generate and maintain, patents and other intellectual property rights covering innovations that are intended to create a competitive advantage, and to support the protection of our investments in research and development. We believe that we possess one of the most substantial patent portfolios relevant to our products.
Although we believe that our patents and other intellectual property rights have significant value, we do not believe that maintaining or growing our business is materially dependent on any single patent. Due to the rapid pace of innovation within the markets that we serve, it is possible that our protection through patents may be less important than factors such as our technological expertise, continuing development of new products and technologies, protection of trade secrets, market penetration, customer relationships, and our ability to provide comprehensive support and service to customers worldwide.
No assurance can be given that any patents will not be challenged, invalidated or circumvented, or that the rights granted thereunder will provide us with a sustained competitive advantage. In addition, there can be no assurance that we will be able to protect our technology, or that competitors will not be able to independently develop similar or functionally competitive technologies, design around our patents, or attempt to manufacture and sell infringing products in countries that do not strongly enforce intellectual property rights.
Employees
As of
December 29, 2018
, we had
1,676
regular full-time employees, including
984
in operations,
327
in research and development,
234
in sales and marketing and
131
in general and administrative functions. By region,
1,188
of our employees were in North America,
315
in Asia and
173
in Europe. No employees are currently covered by a collective bargaining agreement. However,
8
certain employees at our manufacturing facility in Thiendorf, Germany, are represented by a works council. We believe that, overall, our relations with our employees are good.
Available Information
We maintain a website at
http://www.formfactor.com
. We make available free of charge on our website our Annual Reports on Form 10-K, Quarterly Reports on Form 10-Q, current reports on Form 8-K and amendments to those reports filed or furnished pursuant to Section 13(a) or 15(d) of the Exchange Act, as soon as reasonably practicable after we electronically file such material with, or furnish it to, the United State Securities and Exchange Commission, or SEC. The reference to our website does not constitute incorporation by reference of the information contained at the site.
The public may also read and copy any materials that we file with the SEC at the SEC's Public Reference Room at 100 F Street N.E., Washington, D.C. 20549. The public may obtain information on the operation of the Public Reference Room by calling the SEC at 1-800-SEC-0330. The SEC also maintains an Internet website that contains reports and other information regarding issuers, such as FormFactor, that file electronically with the SEC. The SEC's Internet website is located at
http://www.sec.gov
.
Directors and Executive Officers
The information required by this item is incorporated by reference to the proxy statement for our
2019
Annual Meeting of Stockholders.
Item 1A:
Risk Factors
In addition to the other information in this Annual Report on Form 10-K, you should carefully consider the risk factors discussed in this Annual Report on Form 10-K in evaluating FormFactor and our business. If any of the identified risks actually occur, our business, financial condition and results of operations could be materially adversely affected, the trading price of our common stock could decline, and you may lose all or part of your investment in our common stock. The risks and uncertainties described in this Annual Report on Form 10-K are not the only ones we face. Additional risks that we currently do not know about, or that we currently believe to be sufficiently important to describe here, may also impair our business operations or the trading price of our common stock.
Risks Relating to the Nature and Operations of Our Business
The markets in which we participate are competitive, and if we do not compete effectively, our operating results could be harmed.
We have experienced increased competition in the markets in which we operate, and we expect competition to intensify in the future. Increased competition has resulted in, and in the future is likely to result in, price reductions, reduced gross margins or loss of market share. Competitors might introduce new competitive products for the same markets that our products currently serve. These products may have better performance, lower prices, shorter delivery times or broader acceptance than our products.
In addition, it is possible that new competitors, including test equipment manufacturers, may offer new technologies that reduce the value of our products. Also, semiconductor manufacturers may implement chip designs or methodologies that increase test throughput, reduce test content, or change their test procedures, thereby eliminating some or all of our current product advantages.
Our current or potential competitors may have larger customer bases, more established customer relationships or greater financial, technical, manufacturing, marketing and other resources than we do. As a result, they might be able to respond more quickly to new or emerging technologies and changes in customer requirements, devote greater resources to the development, promotion, sale and support of their products, and reduce prices to increase market share.
If we do not innovate and keep pace with technological developments in the semiconductor industry, our products might not be competitive, and our revenues and operating results could suffer.
We must continue to innovate and to invest in research and development to improve our competitive position and to meet the testing requirements of our customers. Our future growth depends, in significant part, upon our ability to work effectively with and anticipate the testing needs of our customers and to develop and support new products and product enhancements to meet these needs on a timely and cost-effective basis. Our customers’ testing needs are becoming more challenging as the semiconductor industry continues to experience rapid technological change driven by the demand for complex circuits that are shrinking in size, are increasing in speed and functionality, and also becoming less expensive to produce.
Successful product design, development and introduction on a timely basis require that we:
|
•
|
collaborate with customers to understand their future requirements;
|
9
|
•
|
design innovative and performance-enhancing product architectures, technologies and features that differentiate our products from those of our competitors;
|
|
•
|
in some cases, engage with third parties who have particular expertise in order to complete one or more aspects of the design and manufacturing process;
|
|
•
|
qualify with the customer(s) the new product, or an existing product incorporating new technology;
|
|
•
|
transition our products to new manufacturing technologies;
|
|
•
|
offer our products for sale at competitive price levels while maintaining our gross-margins within our financial model;
|
|
•
|
identify emerging technological trends in our target markets;
|
|
•
|
maintain effective marketing strategies;
|
|
•
|
respond effectively to technological changes or product announcements by others; and
|
|
•
|
adjust to changing market conditions quickly and cost-effectively.
|
Not only do we need the technical expertise to implement the changes necessary to keep our technologies current, but we must also rely heavily on the judgment of our management to anticipate future market trends. If we are unable to timely predict industry changes or industry trends, or if we are unable to modify our products or design, manufacture and deliver new products on a timely basis, or if a third party with which we engage does not timely deliver a component or service for one of our product modifications or new products, we might lose customers or market share. In addition, we might not be able to recover our research and development expenditures, which could harm our operating results.
We depend upon the sale of our probe card products for the substantial majority of our revenues.
Although we have progressed in diversifying our product offerings in recent years, we derive the majority of our revenues from the sale of our probe card products, primarily to manufacturers of microprocessor, foundry & logic and memory devices. We anticipate that sales of probe cards will represent a substantial majority of our revenues for the foreseeable future. Our success depends in large part upon the continued acceptance of our products on the basis of a variety of factors including performance, quality, timely delivery and price, and depends upon our ability to continue to develop and introduce new products that meet our customers’ requirements. The degree to which we depend upon the sales of our probe card products for our revenues may increase our susceptibility to failures to satisfy the customers for such products, which may adversely affect our revenues and our ability to grow our business.
We derive a substantial portion of our revenues from a small number of customers.
A relatively small number of customers account for a significant portion of our revenues.
One
customer represented
19%
,
26%
and
30%
of total revenues in fiscal
2018
,
2017
and
2016
, respectively. We anticipate that sales of our products to a relatively small number of customers will continue to account for a significant portion of our revenues. Consolidation in the semiconductor industry may increase this concentration. In the future, the loss of any of these customers, or cancellation, reduction or deferral of even a small number of purchases of our products by these customers could significantly reduce our revenues. Cancellations, reductions, deferrals or non-payment of invoices, could result from another downturn in the semiconductor industry, manufacturing delays, quality or reliability issues with our products, or from interruptions to our customers’ operations due to fire, natural disasters or other events, or other issues with the financial stability of our customers. Furthermore, because our probe cards are custom products designed for our customers’ unique wafer designs, any cancellations, reductions or delays can result in significant, non-recoverable costs. In some situations, our customers might be able to cancel or reduce orders without a significant penalty.
If our relationships with our customers deteriorate, our product development activities could be harmed.
The success of our product development efforts depends upon our ability to anticipate market trends and to collaborate closely with our customers. Our relationships with these customers provide us with access to valuable information regarding manufacturing and process technology trends in the semiconductor industry, which enables us to better plan our product development activities. These relationships also provide us with opportunities to understand the performance and functionality requirements of our customers, which improves our ability to customize our products to fulfill their needs. Our relationships with our customers could deteriorate as a result of a variety of factors, such as if they become concerned about our ability to deliver quality products on a timely basis or to protect their intellectual property. Many of our customers are large companies that place significant orders with us, and the consequences of deterioration in our relationship with any of these companies could be significant due to the competitiveness of our industry and the significant influence that these companies exert in our market.
Consolidation in the semiconductor industry and within the semiconductor test equipment market could adversely affect the market for our products and negatively impact our ability to compete.
Consolidation in the semiconductor industry may reduce our customer base and could adversely affect the market for our products, which could cause a decline in our revenues. With consolidation, the number of actual and potential customers for our products has decreased in recent years. Consolidation may lead to relatively fewer opportunities to sell our products if we are not chosen as a supplier by any given prospective customer, and may lead to increased pricing pressures from customers that have greater volume purchasing power.
10
There has also been consolidation within the semiconductor test equipment market. This consolidation trend could change our interactions and relationships with semiconductor tester and prober companies and negatively impact our revenue and operating results.
Changes in customers’ test strategies, equipment and processes could decrease customer demand for our products.
The demand for our products depends in large part upon the number of semiconductor designs, the pace of technology and architecture transitions in chip designs and overall semiconductor unit volume. The number of probe cards involved in a customer’s wafer testing can depend upon the number of devices being tested, the complexity of these devices, the test software program, the test equipment itself, and the utilization of chip designs featuring design-for-testability capabilities. Customers may demand fewer probe cards or probing systems if they use test strategies that reduce the technical requirements on test equipment, improve available data on device performance earlier in the manufacturing process, or test devices later in the manufacturing process. Changes in the effectiveness of test technologies and test strategies used by customers may cause us to lose sales and revenues.
We may also lose sales if new semiconductor technologies or designs are implemented which cannot be efficiently tested using the products that we offer, or if semiconductor manufacturers reduce the amount or degree of testing that they perform. We may also incur significant research and development expenses in order to introduce new product architectures and platforms to serve the testing needs of new semiconductor technologies.
Cyclicality in the semiconductor industry may adversely impact our sales.
The semiconductor industry has historically been cyclical and is characterized by wide fluctuations in product supply and demand. From time to time, this industry has experienced significant downturns, often in connection with, or in anticipation of, maturing product and technology cycles, excess inventories and declines in general economic conditions. The global economic and semiconductor downturns have caused and may in the future cause our operating results to decline dramatically from one period to the next. Our business depends heavily upon the development and manufacture of new semiconductors, the rate at which semiconductor manufacturers make transitions to smaller nanometer technology nodes and implement tooling cycles, the volume of production by semiconductor manufacturers and the overall financial strength of our customers, which, in turn, depend upon the current and anticipated market demand for semiconductors and products, such as servers, personal computers, automobiles and cell phones, that use semiconductors. During industry downturns, semiconductor manufacturers sharply curtail their spending, including their spending on our products, which may adversely impact our revenues, gross margins and results of operations. Further, a protracted downturn could cause one or more of our customers to become insolvent, resulting in a loss of revenue and impacting our ability to collect on accounts receivable. The timing, length and severity of these cyclical downturns are difficult to predict and our business depends on our ability to plan for and react to these cyclical changes.
Because we generally do not have a sufficient backlog of unfilled orders to meet our quarterly revenue targets, revenues in any quarter are substantially dependent upon customer orders received and fulfilled in that quarter.
Our revenues are difficult to forecast because we generally do not have sufficient backlog of unfilled orders to meet our quarterly revenue targets at the beginning of a quarter. Rather, a substantial percentage of our revenues in any quarter depend upon customer orders for our products that we receive and fulfill in that quarter. Because our expense levels are based in part on our expectations as to future revenues and to a large extent are fixed in the short term, we might be unable to adjust spending in time to compensate for any unexpected shortfall in revenues. Accordingly, any significant shortfall of revenues in relation to our expectations could hurt our operating results.
If our ability to forecast demand for our products or the predictability of our manufacturing yields deteriorates, we could incur high inventory losses.
Each semiconductor chip design requires a custom probe card. Because our products are design-specific, demand for our products is difficult to forecast. Due to our customers’ short delivery time requirements, we often design and procure materials and, at times, produce our products in anticipation of demand for our products rather than in response to an order. Our manufacturing yields and inventory requirements, particularly for new probe card products or when we are operating at high output levels, have at times been unpredictable. If we do not obtain orders as we anticipate, if we suffer manufacturing errors, or if we build additional inventory to compensate for unpredictable manufacturing yields, we could have excess or obsolete inventory that we may not be able to sell, which would likely result in inventory write-offs or material charges for scrap.
If we are unable to efficiently manufacture our existing and new products, our business may be materially adversely affected.
We must continuously improve our manufacturing processes in an effort to increase yields and product performance, lower our costs and reduce the time required for us to design, manufacture and deliver our products in volume. If we cannot do these things, both our existing products and our new products may not be commercially successful, our revenues may be adversely affected, our customer relationships and our reputation may be harmed and our business may be materially adversely affected.
11
To improve our manufacturing processes, we have incurred, and may incur in the future, substantial costs in an effort to optimize capacity and yields, implement new manufacturing technologies, methods and processes, purchase new equipment, upgrade existing equipment and train technical personnel. We have experienced, and may experience in the future, manufacturing delays and other inefficiencies in connection with implementation of these improvements and customer qualifications of new processes, which have caused and could cause in the future, our operating results to decline.
We have also experienced, and may experience in the future, difficulties in manufacturing our complex products in volume on time, and at acceptable yields and cost and installation issues in the field due to the complexity of customer design requirements, including integration of probe cards with varying customer test cell environments and testing of semiconductor devices over a wide temperature range.
If we are unable to continue to reduce the time it takes for us to design and produce products, our growth could be impeded.
Our customers continuously seek to reduce the time it takes them to introduce new products to market. The cyclicality of the semiconductor industry, coupled with changing demands for semiconductor products, requires our customers to be flexible and highly adaptable to changes in the design, volume and mix of products they must produce. We may be unable to design and produce our products within the short cycle times required to respond to such rapid changes. We have lost sales in the past where we were unable to meet a customer’s required delivery schedules. If we are unable to continue to reduce the time it takes for us to design, manufacture and ship our products in response to the needs of our customers, our competitive position could be harmed and we could lose sales.
Products that do not meet specifications or that contain defects could damage our reputation, decrease market acceptance of our technology, cause us to lose customers and revenues, and result in liability to us.
The complexity and ongoing development of our product designs and manufacturing processes could lead to design or manufacturing problems. Problems might result from a number of factors, including design defects, materials failure, failure of components manufactured by our suppliers to meet our specifications, contamination in the manufacturing environment, impurities in the materials used, and unknown sensitivities to process conditions such as temperature and humidity, and equipment failures. Any errors or defects could:
|
•
|
cause lower than anticipated yields and lengthen delivery schedules;
|
|
•
|
cause delays in product shipments;
|
|
•
|
cause delays in new product introductions;
|
|
•
|
cause us to incur warranty expenses;
|
|
•
|
result in increased costs and diversion of development resources;
|
|
•
|
cause us to incur increased charges due to unusable inventory;
|
|
•
|
require design modifications; or
|
|
•
|
decrease market acceptance or customer satisfaction with these products.
|
The occurrence of any one or more of these events could adversely affect our business, reputation and operating results.
As part of our sales process, we could incur substantial sales and engineering expenses that do not result in revenues.
Our customers generally expend significant efforts evaluating and qualifying our products prior to placing an order. While our customers are evaluating our products, we might incur substantial sales, marketing, and research and development expenses. For example, we typically expend significant resources educating our prospective customers regarding the uses and benefits of our probe cards and developing probe cards customized to the potential customer’s needs, for which we might not be reimbursed. Although we commit substantial resources to our sales efforts, we might never receive any revenues from a customer. For example, many semiconductor chip designs never reach production, including designs for which we may have expended design effort and expense. In addition, prospective customers might decide not to use our products or use our products for a relatively small percentage of their requirements after we have expended significant effort and expense toward product design, development, and/or manufacture.
We obtain some of the components and materials we use in our products from a sole source or a limited group of suppliers, and the partial or complete loss of one of these suppliers could cause production delays.
We obtain some of the components and materials used in our products, such as printed circuit board assemblies, plating materials and ceramic substrates, from a sole source or a limited group of suppliers, and in some cases alternative sources are not currently available. Because we rely on purchase orders rather than long-term contracts with the majority of our suppliers, we cannot guarantee our ability to obtain components and materials in the long term. A sole or limited source supplier could increase prices, which could lead to a decline in our gross profit. Our dependence upon sole or limited source suppliers exposes us to several other risks, including inability to obtain an adequate supply of materials, late deliveries, poor component quality, and business disruptions
12
while we seek to identify and qualify alternative suppliers. The occurrence of any of these risks could adversely impact our business, results of operations and financial condition.
The use of cash and incurrence of substantial indebtedness in connection with the financing of our acquisition of Cascade Microtech may have an adverse impact on our liquidity, limit our flexibility in responding to other business opportunities and increase our vulnerability to adverse economic and industry conditions.
Our acquisition of Cascade Microtech in 2016 was financed in part by the use of cash on hand and the incurrence of a significant amount of indebtedness.
A
s of
December 29, 2018
, we had
$98.5 million
of cash and cash equivalents,
$50.5 million
of short-term investments and
$64.8 million
term loan debt outstanding, net of debt-related issuance costs. Our use of cash on hand and indebtedness to finance the cash portion of the transaction consideration reduced our liquidity. We must generate cash from operations to pay principal and interest on our debt, thereby reducing the availability of cash flow for working capital and capital expenditure needs or to pursue other initiatives. The senior secured term loan facility contains financial covenants requiring us to maintain a certain leverage ratio of consolidated total indebtedness to EBITDA and a fixed charge coverage ratio. In addition, it also imposes limitations on our ability to incur liens and indebtedness or to pay dividends, make certain investments, or dispose of assets (in each case, subject to customary exceptions). Our ability to comply with these financial and restrictive covenants can be affected by events beyond our control. The indebtedness and restrictive covenants will also have the effect of limiting our ability to obtain additional financing, if needed, which may limit our flexibility in the conduct of our business and makes us more vulnerable to economic downturns and adverse competitive and industry conditions. In addition, a breach of the financial or restrictive covenants, among other things, could result in an event of default with respect to the senior secured term loan facility, which, if not cured or waived, could result in the obligations under the facility becoming immediately due and payable.
Because we conduct most of our business internationally, we are subject to operational, economic, financial and political risks abroad.
Sales of our products to customers outside of the United States represent a significant part of our past and anticipated revenues. Our international sales as a percentage of our revenues were
75%
,
66%
and
67%
for fiscal
2018
,
2017
and
2016
, respectively. Certain of our non-U.S. based customers also purchase through their subsidiaries in the United States. In the future, we expect international sales, to continue to account for a significant percentage of our revenues. Accordingly, we will be subject to risks and challenges that we would not otherwise face if we conducted our business solely in the United States.
These risks and challenges include:
|
•
|
compliance with a wide variety of foreign laws and regulations;
|
|
•
|
legal uncertainties regarding taxes, tariffs, quotas, export controls, export licenses and other trade barriers;
|
|
•
|
political and economic instability or foreign conflicts that involve or affect the countries of our customers;
|
|
•
|
difficulties in collecting accounts receivable and longer accounts receivable payment cycles;
|
|
•
|
difficulties in staffing and managing personnel, distributors and representatives;
|
|
•
|
reduced protection for intellectual property rights in some countries;
|
|
•
|
currency exchange rate fluctuations, which could affect the value of our assets denominated in local currency, as well as the price of our products relative to locally produced products;
|
|
•
|
seasonal fluctuations in purchasing patterns in other countries; and
|
|
•
|
fluctuations in freight rates and transportation disruptions.
|
Any of these factors could harm our existing international operations, impair our ability to continue expanding into international markets or materially adversely affect our operating results. Political developments in the United States and elsewhere may increase the risks and uncertainties associated with conducting international business, including the possibilities of greater tariffs and other trade barriers in the regions where we conduct business. In fiscal 2018 we observed a trend of increasing risks and challenges in the conduct of our international business activities, including with expanded tariffs and trade controls affecting the United States and China. Additionally, we are required to comply with foreign import and export requirements, customs and value added tax standards. Our failure to meet these requirements and standards could negatively impact our business operations.
Our foreign operations expose us to additional risks relating to currency fluctuations.
Our international operations are significant to our revenues and net income, and we plan to continue to grow internationally. We have significant business operations located in Germany. While we report our financial results in U.S. dollars, we incur certain costs in other currencies, and have certain foreign currency denominated assets and liabilities. We, therefore, face exposure to fluctuations in currency exchange rates. Although we may hedge a portion of our international currency exposure, significant fluctuations in exchange rates between the U.S. dollar and foreign currencies may adversely affect our revenues and earnings. Additionally, hedging programs are inherently risky and could expose us to additional costs and risks that could adversely affect our financial condition and results of operations.
13
If we fail to protect our proprietary rights, our competitors might gain access to our technology, which could adversely affect our ability to compete successfully in our markets.
If we choose not to protect our proprietary rights or fail in our efforts to protect our proprietary rights, our competitors might gain access to our technology. Unauthorized parties might attempt to copy aspects of our products or to obtain and use information that we regard as proprietary. Others might independently develop similar or competing technologies or methods or design around our patents. In addition, the laws of many foreign countries in which we or our customers do business do not protect our intellectual property rights to the same extent as the laws of the United States. As a result, our proprietary rights could be compromised, our competitors might offer products similar to ours and we might not be able to compete successfully. We also cannot assure that:
|
•
|
our means of protecting our proprietary rights will be adequate;
|
|
•
|
patents will be issued from our pending or future applications;
|
|
•
|
our existing or future patents will be sufficient in scope or strength to provide any meaningful protection or commercial advantage to us;
|
|
•
|
our patents or other intellectual property will not be invalidated, circumvented or successfully challenged in the United States or foreign countries; or
|
|
•
|
others will not misappropriate our proprietary technologies or independently develop similar technologies, duplicate our products or design around any of our patents or other intellectual property, or attempt to manufacture and sell infringing products in countries that do not strongly enforce intellectual property rights.
|
We have spent and may be required to spend in the future, significant resources to monitor and protect our intellectual property rights. Any litigation, whether or not resolved in our favor, and whether initiated by us or by a third party, could result in significant and possibly material expenses to us and divert the efforts of our management and technical personnel.
We might be subject to claims of infringement of other parties’ proprietary rights.
In the future, as we have in the past, we might receive claims that we are infringing intellectual property rights of others and inquiries about our interest in a license or assertions that we need a license to such intellectual property. The semiconductor industry is characterized by uncertain and conflicting intellectual property claims and vigorous protection and pursuit of these rights. The resolution of any claims of this nature, with or without merit, could be time consuming, result in costly litigation or cause product shipment delays. In the event of an adverse ruling or settlement, we might be required to pay substantial damages, cease the use or sale of infringing products, spend significant resources to develop non-infringing technology, discontinue the use of certain technology and/or enter into license agreements. License agreements, if required, might not be available on terms acceptable to us or at all. The loss of access to any of our intellectual property or the ability to use any of our technology could harm our business. Finally, certain of our customer contracts contain provisions that require us to defend or indemnify our customers for third party intellectual property infringement claims, which would increase the cost to us of an adverse ruling or settlement.
We have recorded significant restructuring, inventory write-offs and asset impairment charges in the past and may do so again in the future, which could have a material negative impact on our business.
We recorded restructuring charges in fiscal
2018
,
2017
and
2016
, and impairment charges related to our long-lived assets in fiscal
2016
. We may implement restructuring plans in the future, which would require us to take additional, potentially material, restructuring charges related to employee terminations, asset disposal or exit costs. We may also be required to write off additional inventory if our product build plans or usage of inventory experience declines, and such additional write-offs could constitute material charges. In addition, significant adverse changes in market conditions could require us to take additional material impairment charges related to our long-lived assets if the changes impact the critical assumptions or estimates that we use in our assessment of the recoverability of our long-lived assets. Any such additional charges, whether related to restructuring, asset impairment or factory underutilization may have a material negative impact on our operating results and related financial statements.
We rely on the security and integrity of our electronic data systems and our business could be damaged by a disruption, security breach or other compromise of these systems.
We rely on electronic data systems to operate and manage our business and to process, maintain, and safeguard information, including information belonging to our customers, partners, and personnel. These systems may be subject to failures or disruptions as a result of, among other things, natural disasters, accidents, power disruptions, telecommunications failures, new system implementations, acts of terrorism or war, physical security breaches, computer viruses, or other cyber security attacks. Such system failures or disruptions could subject us to downtimes and delays, compromise or loss of sensitive or confidential information or intellectual property, destruction or corruption of data, financial losses from remedial actions, liabilities to customers or other third parties, or damage to our reputation or customer relationships. Any of the foregoing could have a material adverse effect on our business, operating results and financial condition.
14
We may not be able to recruit or retain qualified personnel.
We believe our ability to manage successfully and grow our business and to develop new products depends, in large part, on our ability to recruit and retain qualified employees, particularly highly skilled technical, sales, management, and key staff personnel. Competition for qualified resources is intense and other companies may have greater resources available to provide substantial inducements to lure key personnel away from us or to offer more competitive compensation packages to individuals we are trying to hire.
Our failure to comply with environmental laws and regulations could subject us to significant fines and liabilities, and new laws and regulations or changes in regulatory interpretation or enforcement could make compliance more difficult and costly.
We are subject to various U.S. federal, state and local, and foreign governmental laws and regulations relating to the protection of the environment, including those governing the discharge of pollutants into the air and water, the management and disposal of hazardous substances and wastes, the cleanup of contaminated sites and the maintenance of a safe workplace. We could incur substantial costs, including cleanup costs, civil or criminal fines or sanctions and third-party claims for property damage or personal injury, as a result of violations of or liabilities under environmental laws and regulations or non-compliance with the environmental permits required at our facilities.
These laws, regulations and permits also could require the installation of costly pollution control equipment or operational changes to limit pollution emissions or decrease the likelihood of accidental releases of hazardous substances. In addition, changing laws and regulations, new laws and regulations, stricter enforcement of existing laws and regulations, the discovery of previously unknown contamination at our or others’ sites or the imposition of new cleanup requirements could require us to curtail our operations, restrict our future expansion, subject us to liability and cause us to incur future costs that could harm our operations, thereby adversely impacting our operating results and cash flow.
Natural and man-made disasters may negatively impact our business.
Our business is vulnerable to the direct and indirect impact of natural and man-made disasters, such as floods, earthquakes, volcanic eruptions, nuclear accidents, and acts of terrorism. Material parts of our manufacturing and research and development operations are located in areas of California and Oregon that are prone to earthquakes and could be substantially disrupted in the event of an earthquake. It is also possible that future natural and man-made disasters could negatively impact the sales of our products as a result of impacts upon our customer’s ability to make or sell their products, or impacts upon our suppliers’ ability to supply components to us on a timely basis.
Risks Relating to Our Acquisitions
We may make additional acquisitions and investments in the future, which could put a strain on our resources, cause ownership dilution to our stockholders and adversely affect our financial results.
We may in the future make other acquisitions or investments, which may subject us to new or heightened risks. Integrating any newly acquired businesses, products or technologies into our company could put a strain on our resources, could be expensive and time consuming, could substantially reduce our cash reserves, could cause delays in product delivery and might not be successful. Future acquisitions and investments could divert management’s attention from other business concerns and expose our business to unforeseen liabilities or risks associated with entering new markets. In addition, we might lose key employees while integrating new organizations. We might not be successful in integrating any acquired businesses, products or technologies, and might not achieve anticipated revenues and cost benefits. Investments that we make may not result in a return consistent with our projections upon which such investments are made, or may require additional investment that we did not originally anticipate. In addition, future acquisitions could result in customer dissatisfaction, performance problems with an acquired company, potentially dilutive issuances of equity securities or the incurrence of debt and restrictive debt covenants, contingent liabilities, possible impairment charges related to goodwill or other intangible assets or other unanticipated events or circumstances. If any of these risks were to come about, our business, financial results and stock price could be materially and adversely affected.
If goodwill or other intangible assets that we recorded in connection with our past acquisitions become impaired, we could be required to take significant charges against earnings.
In connection with our accounting for the Cascade Microtech and MicroProbe acquisitions, we have recorded a significant amount of goodwill and other intangible assets. Under U.S. generally accepted accounting principles, or GAAP, we must assess, at least annually and potentially more frequently, whether the value of goodwill and other indefinite-lived intangible assets have been impaired. Finite-lived intangible assets will be assessed for impairment in the event of an impairment indicator. Any reduction or impairment of the value of goodwill or other intangible assets will result in a charge against earnings, which could materially adversely affect our results of operations and stockholders’ equity in future periods. Refer to Note 2 to Notes to Consolidated Financial Statements -
Goodwill and Intangible Assets
for further details relating to our annual goodwill impairment assessment.
15
Risks Relating to Owning Our Stock
If we fail to maintain an effective system of internal and disclosure controls and procedures, we may not be able to accurately report our financial results or prevent fraud.
Effective internal and disclosure controls and procedures are necessary for us to provide reliable financial reports, to prevent fraud and to operate successfully as a public company. If we cannot provide reliable financial reports or prevent fraud, our business and reputation may be harmed. We regularly review and assess our internal controls over financial reporting and our disclosure controls and procedures. As part of that process, we may discover material weaknesses in our internal controls. If we fail to maintain effective controls or timely effect any necessary improvement of our internal and disclosure controls, we may not have accurate information to make management decisions, our operating results could be harmed or we may fail to meet our reporting obligations. Ineffective internal and disclosure controls could also cause stockholders to lose confidence in our reported financial information and our ability to manage our business, which would likely have a negative effect on the trading price of our securities.
The trading price of our common stock has been and is likely to continue to be volatile, and you might not be able to sell your shares at or above the price that you paid for them.
The trading prices of the securities of technology companies have been highly volatile. During fiscal
2018
, our stock price (NASDAQ Global Market close price) ranged from
$11.45
per share to
$16.85
per share. The trading price of our common stock is likely to continue to be subject to wide fluctuations. Factors affecting the trading price of our common stock could include:
|
•
|
variations in our operating results;
|
|
•
|
our forecasts and financial guidance for future periods;
|
|
•
|
announcements of technological innovations, new products or product enhancements, new product adoptions at semiconductor customers or significant agreements by us or by our competitors;
|
|
•
|
reports regarding our ability to bring new products into volume production efficiently;
|
|
•
|
the gain or loss of significant orders or customers;
|
|
•
|
changes in the estimates of our operating results or changes in recommendations by any securities analysts that elect to follow our common stock;
|
|
•
|
rulings on litigations and proceedings;
|
|
•
|
seasonality, principally due to our customers' purchasing cycles;
|
|
•
|
market and competitive conditions in our industry, the entire semiconductor industry and the economy as a whole;
|
|
•
|
recruitment or departure of key personnel; and
|
|
•
|
announcements of mergers and acquisition transactions and the ability to successfully integrate the business activities of the acquired/merged company.
|
In addition, if the market for technology stocks or the stock market in general experiences loss of investor confidence, the trading price of our common stock could decline for reasons unrelated to our business, operating results or financial condition. The trading price of our common stock also might decline in reaction to events that affect other companies in our industry even if these events do not directly affect us.
Provisions of our certificate of incorporation and bylaws or Delaware law might discourage, delay or prevent a change of control of our company or changes in our management and, therefore, depress the trading price of our common stock.
Delaware corporate law and our certificate of incorporation and bylaws contain provisions that could discourage, delay or prevent a change in control of our company or changes in our management that the stockholders of our company may deem advantageous. These provisions:
|
•
|
establish a classified board of directors so that not all members of our board are elected at one time;
|
|
•
|
provide that directors may only be removed “for cause” and only with the approval of 66.7% of our stockholders;
|
|
•
|
require super-majority voting to amend some provisions in our certificate of incorporation and bylaws;
|
|
•
|
authorize the issuance of “blank check” preferred stock that our board could issue to increase the number of outstanding shares and to discourage a takeover attempt;
|
|
•
|
limit the ability of our stockholders to call special meetings of stockholders;
|
|
•
|
prohibit stockholder action by written consent, which requires all stockholder actions to be taken at a meeting of our stockholders;
|
|
•
|
provide that the board of directors is expressly authorized to make, alter or repeal our bylaws; and
|
|
•
|
establish advance notice requirements for nominations for election to our board or for proposing matters that can be acted upon by stockholders at stockholder meetings.
|
In addition, Section 203 of the Delaware General Corporation Law may discourage, delay or prevent a change in control of our company. In addition, each of our named executive officers and certain other executives of the company have entered into change
16
of control severance agreements, which were approved by our Compensation Committee, which could increase the costs associated with a change of control and thus, potentially deter such a transaction.
Item 1B:
Unresolved Staff Comments
None.
Item 2:
Properties
Our corporate headquarters, which includes sales, marketing, administration, manufacturing, engineering, and research and development facilities, is located in Livermore, California, United States. Our corporate headquarters comprises a campus of four buildings totaling approximately 169,000 square feet. We presently lease those four buildings. In addition, we lease office, repair and service, manufacturing and/or research and development space both inside and outside of the United States. The leases expire at various times through 2028. We believe that our existing and planned facilities are suitable for our current needs.
Information concerning our properties as of
December 29, 2018
is set forth below:
|
Location
|
Principal Use
|
Square
Footage
|
Ownership
|
||||
|
Livermore, California, United States
|
Corporate headquarters, sales, marketing, administration, product design, manufacturing, service and repair, distribution, research and development
|
168,636
|
|
Leased
|
|||
|
Beaverton, Oregon, United States
|
Sales, marketing, administration, product design, manufacturing, service and repair, distribution, research and development
|
98,946
|
|
Leased
|
|||
|
Carlsbad, California, United States
|
Sales, Product design, administration, manufacturing, service and repair, distribution, research and development
|
30,876
|
|
Leased
|
|||
|
San Jose, California, United States
|
Administration, product design, manufacturing, service and repair, distribution, research and development
|
23,860
|
|
Leased
|
|||
|
St. Paul, Minnesota, United States
|
Marketing and design
|
9,122
|
|
Leased
|
|||
|
Thiendorf, Germany
|
Sales, marketing, administration, manufacturing, service and repair, distribution, research and development
|
45,790
|
|
Leased
|
|||
|
Munich, Germany
|
Sales, Manufacturing, service and repair, distribution, research and development
|
12,809
|
|
Leased
|
|||
|
Dresden, Germany
|
Sales and service
|
2,960
|
|
Leased
|
|||
|
Singapore
|
Sales, administration, product design, service, and field service
|
24,413
|
|
Leased
|
|||
|
Jubei City, Hsinchu, Taiwan
|
Sales, administration, product design, field service and repair center
|
18,568
|
|
Leased
|
|||
|
Bundang, South Korea
|
Sales, administration, product design, field service, and repair center
|
15,310
|
|
Leased
|
|||
|
Yokohama City, Japan
|
Sales, marketing, administration, product design, manufacturing, service and repair, distribution, research and development
|
15,210
|
|
Leased
|
|||
|
Hiroshima, Japan
|
Repair center
|
1,007
|
|
Leased
|
|||
|
Suzhou, China
|
Sales, marketing, administration, product design, manufacturing, service and repair, distribution, research and development
|
15,177
|
|
Leased
|
|||
|
Shanghai, China
|
Sales and service
|
1,865
|
|
Leased
|
|||
|
Montbonoot Saint Martin, France
|
Sales and service
|
4,736
|
|
Leased
|
|||
|
Legnano, Italy
|
Sales office
|
215
|
|
Leased
|
|||
17
Item 3:
Legal Proceedings
From time to time, we may be subject to legal proceedings and claims in the ordinary course of business. As of
December 29, 2018
, and as of the filing of this Annual Report on Form 10-K, we were not involved in any material legal proceedings. In the future, we may become a party to additional legal proceedings that may require us to spend significant resources, including proceedings designed to protect our intellectual property rights. Litigation can be expensive and disruptive to normal business operations. Moreover, the results of legal proceedings are difficult to predict, and the costs incurred in litigation can be substantial, regardless of outcome.
Item 4:
Mine Safety Disclosures
Not applicable.
PART II
Item 5:
Market for Registrant's Common Equity, Related Stockholder Matters and Issuer Purchases of Equity Securities
Price Range of Common Stock
Our common stock is listed on the NASDAQ Global Market under the symbol "FORM." The following table sets forth the range of high and low closing sales prices per share as reported on the Nasdaq Global Market for the periods indicated.
|
Fiscal 2018
|
High
|
Low
|
|||||
|
First Quarter
|
$
|
16.85
|
|
$
|
12.25
|
|
|
|
Second Quarter
|
15.05
|
|
11.45
|
|
|||
|
Third Quarter
|
15.90
|
|
12.80
|
|
|||
|
Fourth Quarter
|
16.49
|
|
11.51
|
|
|||
|
Fiscal 2017
|
High
|
Low
|
|||||
|
First Quarter
|
$
|
12.70
|
|
$
|
10.65
|
|
|
|
Second Quarter
|
15.45
|
|
10.60
|
|
|||
|
Third Quarter
|
16.85
|
|
11.90
|
|
|||
|
Fourth Quarter
|
18.20
|
|
14.85
|
|
|||
The closing sales price of our common stock on the NASDAQ Global Market was
$16.20
per share on
February 20, 2019
. As of
February 20, 2019
, there were
165
registered holders of record of our common stock.
Repurchase of Common Stock
In February 2017, our Board of Directors authorized a program to repurchase up to $25 million of outstanding common stock to offset potential dilution from sales of common stock under our employee stock purchase plan and exercises of stock options. The share repurchase program will expire on February 1, 2020. During the year ended
December 29, 2018
, we did not repurchase any shares and, as of
December 29, 2018
,
$6.0 million
remained available for future repurchases.
Repurchased shares are retired upon the settlement of the related trade transactions with the excess of cost over par value charged to additional paid-in capital.
Dividend Policy
We have never declared or paid cash dividends on our common stock and we do not currently anticipate declaring or paying cash dividends on our common stock.
18
Stock Price Performance Graph
The following graph shows the total stockholder return of an investment of $100 in cash on
December 28, 2013
through
December 29, 2018
for (1) our common stock, (2) the S&P 500 Index and (3) the RDG Semiconductor Composite Index. All values assume reinvestment of the full amount of all dividends. No cash dividends have been declared on shares of our common stock. Stockholder returns over the indicated period are based on historical data and are not necessarily indicative of future stockholder returns.
COMPARISON OF 5 YEAR CUMULATIVE TOTAL RETURN*
Among FormFactor, Inc., the S&P 500 Index, and the RDG Semiconductor Composite Index
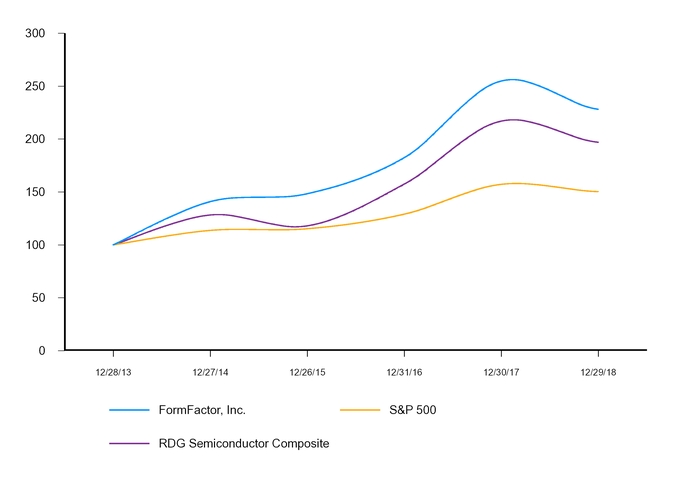
*$100 invested on
December 28, 2013
in stock or index, including reinvestment of dividends.
|
|
Cumulative Total Return
|
||||||||||||||||||||||
|
|
December 28, 2013
|
December 27, 2014
|
December 26, 2015
|
December 31, 2016
|
December 30, 2017
|
December 29, 2018
|
|||||||||||||||||
|
FormFactor, Inc.
|
$
|
100.00
|
|
$
|
140.88
|
|
$
|
148.37
|
|
$
|
182.41
|
|
$
|
254.89
|
|
$
|
228.18
|
|
|||||
|
S&P 500
|
100.00
|
|
113.69
|
|
115.26
|
|
129.05
|
|
157.22
|
|
150.33
|
|
|||||||||||
|
RDG Semiconductor Composite
|
100.00
|
|
128.26
|
|
118.01
|
|
157.41
|
|
216.98
|
|
197.02
|
|
|||||||||||
19
Item 6:
Selected Financial Data
The following selected consolidated financial data is derived from our consolidated financial statements. This data should be read in conjunction with our consolidated financial statements and the related notes, and Item 7:
Management's Discussion and Analysis of Financial Condition and Results of Operations
contained elsewhere in this Annual Report on Form 10-K.
|
Fiscal
2018 (1)(2) |
Fiscal
2017 (2) |
Fiscal
2016 (2)(3)(5)(6) |
Fiscal
2015 (2)(4) |
Fiscal
2014 (2)(3) |
|||||||||||||||
|
|
(Dollars in thousands, except per share data)
|
||||||||||||||||||
|
Consolidated Statements of Operations Data:
|
|
|
|
|
|||||||||||||||
|
Revenues
|
$
|
529,675
|
|
$
|
548,441
|
|
$
|
383,881
|
|
$
|
282,358
|
|
$
|
268,530
|
|
||||
|
Gross profit
|
210,339
|
|
215,597
|
|
102,682
|
|
85,738
|
|
77,439
|
|
|||||||||
|
Net income (loss)
|
104,036
|
|
40,913
|
|
(6,557
|
)
|
(1,523
|
)
|
(19,185
|
)
|
|||||||||
|
Basic net income (loss) per share
|
1.42
|
|
0.57
|
|
(0.10
|
)
|
(0.03
|
)
|
(0.34
|
)
|
|||||||||
|
Diluted net income (loss) per share
|
1.38
|
|
0.55
|
|
(0.10
|
)
|
(0.03
|
)
|
(0.34
|
)
|
|||||||||
|
Consolidated Balance Sheets Data:
|
|
|
|
||||||||||||||||
|
Cash, cash equivalents and marketable securities
|
$
|
149,003
|
|
$
|
140,172
|
|
$
|
108,905
|
|
$
|
187,589
|
|
$
|
163,837
|
|
||||
|
Working capital
|
235,302
|
|
213,693
|
|
172,002
|
|
214,437
|
|
196,412
|
|
|||||||||
|
Total assets
|
728,222
|
|
646,574
|
|
618,982
|
|
342,723
|
|
344,243
|
|
|||||||||
|
Term loan, net of current portion
|
34,971
|
|
87,228
|
|
125,475
|
|
—
|
|
—
|
|
|||||||||
|
Total stockholders' equity
|
580,164
|
|
458,637
|
|
401,056
|
|
294,681
|
|
289,436
|
|
|||||||||
|
Number of employees
|
1,676
|
|
1,685
|
|
1,571
|
|
958
|
|
907
|
|
|||||||||
|
(1)
|
Fiscal 2018 net income includes an income tax benefit of $75.8 million from a valuation allowance release against certain U.S. deferred tax assets. See Note 14 of Notes to Consolidated Financial Statements.
|
|
(2)
|
Fiscal 2018, 2017, 2016, 2015 and 2014 net income (loss) includes restructuring charges, net, of
$0.2 million
,
$0.8 million
, $7.3 million, $0.6 million and $2.7 million, respectively. See Note 6 of Notes to Consolidated Financial Statements.
|
|
(3)
|
Fiscal 2016 and 2014 net loss includes impairment charges of $12.4 million and $1.2 million, respectively. See Note 7 of Notes to Consolidated Financial Statements.
|
|
(4)
|
Fiscal 2015 net loss includes the following: i) a $1.5 million gain from a business interruption insurance claim relating to a factory fire at a customer; and ii) a $1.0 million net gain from the sale of intellectual property.
|
|
(5)
|
Fiscal 2016 includes a $44.0 million tax benefit from the release of deferred tax asset valuation allowances due to deferred tax liabilities established on the acquired identifiable intangible assets from our acquisition of Cascade Microtech. Refer to Results of Operations in Management's Discussion and Analysis.
|
|
(6)
|
Fiscal 2016 includes the following as a result of the Cascade Microtech acquisition: i) $82.6 million in revenue; ii) $27.8 million of intangible amortization expense; and iii) a $7.6 million charge for inventory-related step-up amortization.
|
20
Item 7:
Management's Discussion and Analysis of Financial Condition and Results of Operations
The following discussion and analysis of our financial condition and results of operations should be read in conjunction with our consolidated financial statements and the related notes included elsewhere in this Annual Report on Form 10-K. In addition to historical consolidated financial information, the following discussion and analysis contains forward-looking statements that involve risks, uncertainties and assumptions as described under the "Note Regarding Forward-Looking Statements" that appears earlier in this Annual Report on Form 10-K. Our actual results could differ materially from those anticipated by these forward-looking statements as a result of many factors, including those discussed under "Item 1A: Risk Factors" and elsewhere in this Annual Report on Form 10-K.
Overview
FormFactor, Inc., headquartered in Livermore, California, is a leading provider of electrical test and measurement solutions. We provide a broad range of high-performance probe cards, analytical probes, probe stations and thermal sub-systems to both semiconductor companies and scientific institutions. Our products provide electrical information from a variety of semiconductor and electro-optical devices and integrated circuits from development to production. Customers use our products and services to lower production costs, improve yields, and enable development of complex next-generation devices.
On June 24, 2016, we completed the acquisition of Cascade Microtech, Inc. ("Cascade Microtech"), headquartered in Beaverton, Oregon and, accordingly, our Consolidated Statements of Operations include the results of operations of Cascade Microtech since that date. Therefore, our consolidated financial results for fiscal 2016 may not be directly comparable to our consolidated financial results for fiscal 2018 and 2017.
We operate in two reportable segments consisting of the Probe Cards segment and the Systems segment. Sales of our probe cards and analytical probes are included in the Probe Cards segment, while sales of our probe stations and thermal sub-systems are included in the Systems segment.
We generated net income of
$104.0 million
in fiscal
2018
compared to net income of
$40.9 million
in fiscal
2017
and a net loss of
$6.6 million
in fiscal
2016
. The increase in net income in fiscal 2018 compared to fiscal 2017 was primarily due to a $75.8 million income tax benefit recognized in fiscal 2018 related to the release of valuation allowances against certain U.S. deferred tax assets, partially offset by lower revenues and higher operating expenses. The increase in net income in fiscal 2017 compared to fiscal 2016 was primarily due to increased revenues generated by the acquisition of Cascade Microtech at the end of the second quarter of fiscal 2016, increased demand for our legacy products, and lower restructuring and impairment charges, partially offset by increased operating expenses and a $44.0 million income tax benefit recognized in fiscal 2016 related to the release of valuation allowances on our deferred tax assets in connection with our acquisition of Cascade Microtech.
Fiscal Year
W
e operate on a 52/53 week fiscal year, whereby the fiscal year ends on the last Saturday of December. The fiscal years ended
December 29, 2018
,
December 30, 2017
and
December 31, 2016
included 52 weeks, 52 weeks and 53 weeks (with an extra week falling in the fourth quarter), respectively.
Use of Estimates
Preparation of our financial statements requires management to make estimates and assumptions that affect the reported amounts of assets, liabilities, revenues and expenses. Management bases its estimates on historical experience and on various other assumptions that it believes to be reasonable under the circumstances, the results of which form the basis for making judgments about the carrying values of assets and liabilities that are not readily apparent from other sources. Actual results may differ from these estimates under different assumptions or conditions.
Critical Accounting Policies
Our discussion and analysis of our financial condition and results of operations are based upon our consolidated financial statements, which have been prepared in accordance with generally accepted accounting principles ("GAAP"). The preparation of these financial statements requires us to make estimates and assumptions that affect the reported amounts of assets and liabilities at the date of the financial statements and the reported amounts of net revenue and expenses in the reporting period. Our accounting policies are fundamental to understanding our financial condition and results of operations reported in our financial statements and related disclosures. We have identified the following accounting policies as being critical because they require our management
21
to make particularly difficult, subjective and/or complex judgments about the effect of matters that are inherently uncertain. Our management has discussed the development, selection, application and disclosure of these critical accounting policies with the Audit Committee of our Board of Directors.
Revenue Recognition
We recognize revenue upon transferring control of products and services, and the amounts recognized reflect the consideration we expect to be entitled to receive in exchange for these products and services. An arrangement may include some or all of the following products and services: probe cards, systems, accessories, installation services, service contracts and extended warranty contracts.
A performance obligation is a promise in a contract to transfer a distinct good or service to the customer. In contracts with multiple performance obligations, we identify each performance obligation and evaluate whether the performance obligation is distinct within the context of the contract at contract inception. Performance obligations that are not distinct at contract inception are combined and accounted for as one unit. Generally, the performance obligations in a contract are considered distinct within the context of the contract and are accounted for as separate units.
Our products may be customized to our customers’ specifications, however, control of our product is typically transferred to the
customer at the point in time the product is either shipped or delivered, depending on the terms of the arrangement, as the criteria for over time recognition are not met. In limited circumstances, substantive acceptance by the customer exists, which results in the deferral of revenue until acceptance is formally received from the customer. Judgment may be required in determining if the acceptance clause is substantive.
Installation services are routinely provided to customers purchasing our systems. Installation services are a distinct performance obligation apart from the systems and are recognized in the period they are performed. Service contracts, which include repair and maintenance service contracts, and extended warranty contracts are also distinct performance obligations and are recognized over the contractual service period, which ranges from one to three years. For service contracts recognized over time, we use a days-elapsed input to measure progress.
A contract’s transaction price is allocated to each distinct performance obligation and recognized as revenue when, or as, the performance obligation is satisfied. In determining the transaction price, we evaluate whether the price is subject to refund or adjustment to determine the net consideration to which we expect to be entitled. We generally do not grant return privileges, except for defective products during the warranty period. Sales incentives and other programs that we may make available to customers are considered to be a form of variable consideration, which is estimated in determining the contract’s transaction price to be allocated to the performance obligations.
For contracts with multiple performance obligations, we allocate the contract’s transaction price to each performance obligation
based on its relative stand-alone selling price. The stand-alone selling prices are determined based on observable prices, which are the prices at which we separately sell the products. For items which do not have observable prices, we use our best estimate of the stand-alone selling prices.
We account for tax assessed by a governmental authority that is directly imposed on a revenue-producing transaction (i.e., sales, use, value added) on a net (excluded from revenue) basis.
Inventory Valuation
We state our inventories at the lower of cost (principally standard cost which approximates actual cost on a first in, first out basis) or net realizable value. We continually assess the value of our inventory and will periodically write down its value for estimated excess inventory and product obsolescence based upon assumptions about past consumption, recent purchases and backlog. On a quarterly basis, we review inventory quantities on hand and on order under non-cancelable purchase commitments in comparison to our past consumption, recent purchases, backlog and other factors to determine what inventory quantities, if any, may not be sellable. Based on this analysis, we write down the affected inventory value for estimated excess and obsolescence charges. At the point of loss recognition, a new, lower cost basis for that inventory is established, and subsequent changes in facts and circumstances do not result in the restoration or increase in that newly established cost basis. Market conditions are subject to change, and demand for our products can fluctuate significantly. Actual consumption of inventories could differ from forecasted demand, and this difference could have a material impact on our gross profit and inventory balances based on additional provisions for excess or obsolete inventories or a benefit from the sale of inventories previously written down.
Income Taxes
We utilize the asset and liability method of accounting for income taxes, under which deferred taxes are determined based on the temporary differences between the financial statement and tax basis of assets and liabilities using tax rates expected to be in effect
22
during the years in which the basis differences reverse and for operating losses and tax credit carryforwards. We estimate our provision for income taxes and amounts ultimately payable or recoverable in numerous tax jurisdictions around the world. Estimates involve interpretations of regulations and are inherently complex. Resolution of income tax treatments in individual jurisdictions may not be known for many years after completion of any fiscal year. We are required to evaluate the realizability of our deferred tax assets on an ongoing basis to determine whether there is a need for a valuation allowance with respect to such deferred tax assets. A valuation allowance is recorded when it is more likely than not that some or all of the deferred tax assets will not be realized. In evaluating the ability to recover deferred tax assets, we consider all available positive and negative evidence, giving greater weight to our recent cumulative income, our historical ability to utilize net operating losses in recent years and our forecast of future taxable income, including the reversal of temporary differences and the implementation of feasible and prudent tax planning strategies.
Results of Operations
The following table sets forth our operating results as a percentage of revenues:
|
|
Fiscal 2018
|
Fiscal 2017
|
Fiscal 2016
|
|||||
|
Revenues
|
100.0
|
%
|
100.0
|
%
|
100.0
|
%
|
||
|
Cost of revenues
|
60.3
|
|
60.7
|
|
73.3
|
|
||
|
Gross profit
|
39.7
|
|
39.3
|
|
26.7
|
|
||
|
Operating expenses:
|
|
|
|
|||||
|
Research and development
|
14.2
|
|
13.5
|
|
15.0
|
|
||
|
Selling, general and administrative
|
18.7
|
|
17.3
|
|
19.1
|
|
||
|
Restructuring and impairment charges, net
|
*
|
|
0.1
|
|
5.1
|
|
||
|
Total operating expenses
|
32.9
|
|
30.9
|
|
39.2
|
|
||
|
Operating income (loss)
|
6.8
|
|
8.4
|
|
(12.5
|
)
|
||
|
Interest income
|
0.3
|
|
0.1
|
|
0.1
|
|
||
|
Interest expense
|
(0.6
|
)
|
(0.8
|
)
|
(0.6
|
)
|
||
|
Other expense, net
|
*
|
|
*
|
|
(0.1
|
)
|
||
|
Income (loss) before income taxes
|
6.5
|
|
7.7
|
|
(13.1
|
)
|
||
|
Provision (benefit) for income taxes
|
(13.2
|
)
|
0.2
|
|
(11.4
|
)
|
||
|
Net income (loss)
|
19.7
|
%
|
7.5
|
%
|
(1.7
|
)%
|
||
*
Less than 0.1%.
Revenues by Segment
|
|
Fiscal 2018
|
Fiscal 2017
|
Fiscal 2016
|
||||||||
|
|
(In thousands)
|
||||||||||
|
Probe Cards
|
$
|
434,269
|
|
$
|
454,794
|
|
$
|
337,970
|
|
||
|
Systems
|
95,406
|
|
93,647
|
|
45,911
|
|
|||||
|
Total
|
$
|
529,675
|
|
$
|
548,441
|
|
$
|
383,881
|
|
||
Revenues by Market
|
Fiscal
|
% of
|
Fiscal
|
% of
|
Change
|
||||||||||||||||
|
2018
|
Revenues
|
2017
|
Revenues
|
$
|
%
|
|||||||||||||||
|
(In thousands, except percentages)
|
||||||||||||||||||||
|
Probe Cards Markets:
|
||||||||||||||||||||
|
Foundry & Logic
|
$
|
258,459
|
|
48.8
|
%
|
$
|
313,714
|
|
57.2
|
%
|
$
|
(55,255
|
)
|
(17.6
|
)%
|
|||||
|
DRAM
|
135,333
|
|
25.6
|
|
124,685
|
|
22.7
|
|
10,648
|
|
8.5
|
|
||||||||
|
Flash
|
40,477
|
|
7.6
|
|
16,395
|
|
3.0
|
|
24,082
|
|
146.9
|
|
||||||||
|
Systems Market:
|
||||||||||||||||||||
|
Systems
|
95,406
|
|
18.0
|
|
93,647
|
|
17.1
|
|
1,759
|
|
1.9
|
|
||||||||
|
Total revenues
|
$
|
529,675
|
|
100.0
|
%
|
$
|
548,441
|
|
100.0
|
%
|
$
|
(18,766
|
)
|
(3.4
|
)%
|
|||||
23
|
Fiscal
|
% of
|
Fiscal
|
% of
|
Change
|
||||||||||||||||
|
2017
|
Revenues
|
2016
|
Revenues
|
$
|
%
|
|||||||||||||||
|
(In thousands, except percentages)
|
||||||||||||||||||||
|
Probe Cards Markets:
|
||||||||||||||||||||
|
Foundry & Logic
|
$
|
313,714
|
|
57.2
|
%
|
$
|
237,591
|
|
61.9
|
%
|
$
|
76,123
|
|
32.0
|
%
|
|||||
|
DRAM
|
124,685
|
|
22.7
|
|
86,910
|
|
22.6
|
|
37,775
|
|
43.5
|
|
||||||||
|
Flash
|
16,395
|
|
3.0
|
|
13,469
|
|
3.5
|
|
2,926
|
|
21.7
|
|
||||||||
|
Systems Market:
|
||||||||||||||||||||
|
Systems
|
93,647
|
|
17.1
|
|
45,911
|
|
12.0
|
|
47,736
|
|
104.0
|
|
||||||||
|
Total revenues
|
$
|
548,441
|
|
100.0
|
%
|
$
|
383,881
|
|
100.0
|
%
|
$
|
164,560
|
|
42.9
|
%
|
|||||
The decrease in Foundry & Logic product revenue in fiscal 2018 compared to fiscal 2017 was primarily the result of lower demand from one major customer as a result of delays in its node transitions. This major customer accounted for
19.0%
of total revenues for fiscal 2018, compared to
25.9%
for fiscal 2017.
The increase in DRAM and Flash product revenue in fiscal 2018 compared to fiscal 2017 was driven by increased unit sales as a result of increased design wins and customer demand.
The increase in Systems product revenue in fiscal 2018 compared to fiscal 2017 was driven by increased unit sales of thermal sub-systems due to increased customer demand, partially offset by lower revenue from probe stations due to changes in product sales mix, which decreased the average selling price of units sold.
The increase in Foundry & Logic product revenue in fiscal 2017 compared to fiscal 2016 was primarily the result of strong customer demand across all end markets, including data center, mobile and automotive, as well as to the June 2016 acquisition of Cascade Microtech. All probe card revenues associated with former Cascade Microtech products and technologies are included in our Foundry & Logic revenues.
The increase in DRAM product revenue in fiscal 2017 compared to fiscal 2016 was the result of increased customer demand in the DRAM market driven by a combination of node transitions, customer capacity additions and new designs.
Flash product revenue increased in fiscal 2017 compared to fiscal 2016 due to an increase in the number of design wins.
The increases in Systems product revenue in fiscal 2017 compared to fiscal 2016 was driven by the June 2016 acquisition of Cascade Microtech. Prior to the acquisition, we did not operate in the Systems market.
Revenues by Geographic Region
|
Fiscal 2018
|
% of
Revenues
|
Fiscal 2017
|
% of
Revenues
|
Fiscal 2016
|
% of
Revenues
|
|||||||||||||||
|
(In thousands, except percentages)
|
||||||||||||||||||||
|
United States
|
$
|
133,648
|
|
25.2
|
%
|
$
|
186,654
|
|
34.0
|
%
|
$
|
127,641
|
|
33.3
|
%
|
|||||
|
Taiwan
|
107,476
|
|
20.3
|
|
96,903
|
|
17.7
|
|
57,331
|
|
14.9
|
|
||||||||
|
South Korea
|
91,247
|
|
17.2
|
|
81,727
|
|
14.9
|
|
65,508
|
|
17.1
|
|
||||||||
|
China
|
77,851
|
|
14.7
|
|
61,100
|
|
11.1
|
|
28,219
|
|
7.4
|
|
||||||||
|
Japan
|
49,814
|
|
9.4
|
|
44,559
|
|
8.1
|
|
38,650
|
|
10.0
|
|
||||||||
|
Europe
|
39,671
|
|
7.5
|
|
45,086
|
|
8.2
|
|
49,445
|
|
12.9
|
|
||||||||
|
Asia-Pacific
(1)
|
25,980
|
|
4.9
|
|
29,902
|
|
5.5
|
|
15,440
|
|
4.0
|
|
||||||||
|
Rest of the world
|
3,988
|
|
0.8
|
|
2,510
|
|
0.5
|
|
1,647
|
|
0.4
|
|
||||||||
|
Total Revenues
|
$
|
529,675
|
|
100.0
|
%
|
$
|
548,441
|
|
100.0
|
%
|
$
|
383,881
|
|
100.0
|
%
|
|||||
(1)
Asia-Pacific includes all countries in the region except Taiwan, South Korea, China and Japan, which are disclosed separately.
Geographic revenue information is based on the location to which we ship the product. For example, if a certain South Korean customer purchases through their U.S. subsidiary and requests the products to be shipped to an address in South Korea, this sale will be reflected in the revenue for South Korea rather than U.S.
24
Changes in revenue by geographic region in fiscal 2018 compared to fiscal 2017 were primarily attributable to changes in customer demand, shifts in customer regional manufacturing strategies, and product sales mix.
The increases in geographical revenues across the regions in fiscal 2017 compared to fiscal 2016 were primarily attributable to additional revenues generated as a result of our acquisition of Cascade Microtech and strong demand for our legacy products across the board. The decrease in Europe was driven by decreases in legacy product revenue, partially offset by increases in sales of products related to our Cascade Microtech acquisition.
Cost of Revenues and Gross Margins
Cost of revenues consists primarily of manufacturing materials, payroll, shipping and handling costs, manufacturing-related overhead and amortization of certain intangible assets. Our manufacturing operations rely on a limited number of suppliers to provide key components and materials for our products, some of which are a sole source. We order materials and supplies based on backlog and forecasted customer orders. Tooling and setup costs related to changing manufacturing lots at our suppliers are also included in the cost of revenues. We expense all warranty costs, inventory provisions and amortization of certain intangible assets as cost of revenues.
Gross profit and gross margin by segment were as follows (dollars in thousands):
|
Fiscal 2018
|
|||||||||||||
|
Probe Cards
|
Systems
|
Corporate and Other
|
Total
|
||||||||||
|
Gross profit
|
$187,320
|
$
|
47,074
|
|
$
|
(24,055
|
)
|
$210,339
|
|||||
|
Gross margin
|
43.1
|
%
|
49.3
|
%
|
—
|
%
|
39.7
|
%
|
|||||
|
Fiscal 2017
|
|||||||||||||||
|
Probe Cards
|
Systems
|
Corporate and Other
|
Total
|
||||||||||||
|
Gross profit
|
$
|
195,903
|
|
$
|
46,647
|
|
$
|
(26,953
|
)
|
$
|
215,597
|
|
|||
|
Gross margin
|
43.1
|
%
|
49.8
|
%
|
—
|
%
|
39.3
|
%
|
|||||||
|
Fiscal 2016
|
|||||||||||||||
|
Probe Cards
|
Systems
|
Corporate and Other
|
Total
|
||||||||||||
|
Gross profit
|
$
|
121,407
|
|
$
|
23,925
|
|
$
|
(42,650
|
)
|
$
|
102,682
|
|
|||
|
Gross margin
|
35.9
|
%
|
52.1
|
%
|
—
|
%
|
26.7
|
%
|
|||||||
Probe Cards
Gross profit in the Probe Cards segment decreased in fiscal 2018 compared to fiscal 2017 due to decreased sales. Gross margins remained relatively consistent as positive impacts from changes in product mix and improvements in operating efficiencies were offset by lower volume and factory utilization.
Gross profit and gross margin increased in fiscal 2017 compared to fiscal 2016 in the Probe Cards segment as a result of increased sales to several major customers, favorable product mix, higher factory utilization and improved manufacturing efficiency.
Systems
Gross profit and gross margin in the Systems segment remained relatively consistent in fiscal 2018 compared to fiscal 2017.
Gross margins decreased in the Systems segment in fiscal 2017 compared to fiscal 2016 primarily due to unfavorable changes in product mix and foreign currency exchange rates. Prior to the acquisition of Cascade Microtech in June 2016, we only operated in the Probe Cards segment and did not generate any Systems segment revenue.
Corporate and Other
Corporate and Other includes unallocated expenses relating to amortization of intangible assets, share-based compensation, acquisition-related costs, including charges related to inventory stepped up to fair value and other costs, which are not used in evaluating the results of, or in allocating resources to, our reportable segments.
25
Overall
Gross profit and gross margin fluctuate with revenue levels, product mix, selling prices, factory loading and material costs. For fiscal 2018 compared to fiscal 2017, gross profit decreased due to lower revenue, while gross margins increased due to product mix, partially offset by lower utilization.
The increase in overall gross margins in fiscal 2017 compared to fiscal 2016 was due to strong revenues, favorable product mix and higher factory utilization in our DRAM and Foundry & Logic products, as well as improved manufacturing efficiency. Fiscal 2016 gross margin also included the impact of higher amortization of backlog and inventory step-up, which reduced gross margin.
Stock-based compensation expense included in gross profit for fiscal
2018
,
2017
and
2016
was
$3.5 million
,
$3.5 million
and
$2.5 million
, respectively.
Research and Development
|
Fiscal Year Ended
|
||||||||||||||
|
December 29, 2018
|
December 30, 2017
|
$ Change
|
% Change
|
|||||||||||
|
(Dollars in thousands)
|
||||||||||||||
|
Research and development
|
$
|
74,976
|
|
$
|
73,807
|
|
$
|
1,169
|
|
1.6
|
%
|
|||
|
% of revenues
|
14.2
|
%
|
13.5
|
%
|
||||||||||
|
Fiscal Year Ended
|
||||||||||||||
|
December 30, 2017
|
December 31, 2016
|
$ Change
|
% Change
|
|||||||||||
|
(Dollars in thousands)
|
||||||||||||||
|
Research and development
|
$
|
73,807
|
|
$
|
57,453
|
|
$
|
16,354
|
|
28.5
|
%
|
|||
|
% of revenues
|
13.5
|
%
|
15.0
|
%
|
||||||||||
The increase in research and development expenses in fiscal 2018 compared to fiscal 2017 was primarily driven by an increase in project material costs to support research and development within our Probe Cards segment, partially offset by a decrease in employee incentive compensation. The lower employee incentive compensation was primarily due to decreased profitability from lower revenues. The components of this increase were as follows (in millions):
|
Fiscal 2018 compared to Fiscal 2017
|
|||
|
Employee compensation costs
|
$
|
(0.2
|
)
|
|
Stock-based compensation
|
0.1
|
|
|
|
Project material costs
|
0.4
|
|
|
|
Depreciation
|
0.4
|
|
|
|
Other
|
0.5
|
|
|
|
$
|
1.2
|
|
|
The increase in research and development expenses in fiscal 2017 compared to fiscal 2016 was primarily due to our acquisition of Cascade Microtech in June 2016, as well as an increase in incentive plan costs related to improved performance.
26
The components of this increase were as follows (in millions):
|
Fiscal 2017 compared to Fiscal 2016
|
|||
|
Employee compensation costs
|
$
|
12.5
|
|
|
Stock-based compensation
|
2.0
|
|
|
|
Project material costs
|
0.2
|
|
|
|
Depreciation
|
0.7
|
|
|
|
Other
|
1.0
|
|
|
|
|
$
|
16.4
|
|
Stock-based compensation expense included within research and development in fiscal
2018
,
2017
and
2016
was
$5.4 million
,
$5.3 million
and
$3.3 million
, respectively.
Selling, General and Administrative
|
Fiscal Year Ended
|
||||||||||||||
|
December 29, 2018
|
December 30, 2017
|
$ Change
|
% Change
|
|||||||||||
|
(Dollars in thousands)
|
||||||||||||||
|
Selling, general and administrative
|
$
|
99,094
|
|
$
|
94,679
|
|
$
|
4,415
|
|
4.7
|
%
|
|||
|
% of revenues
|
18.7
|
%
|
17.3
|
%
|
||||||||||
|
Fiscal Year Ended
|
||||||||||||||
|
December 30, 2017
|
December 31, 2016
|
$ Change
|
% Change
|
|||||||||||
|
(Dollars in thousands)
|
||||||||||||||
|
Selling, general and administrative
|
$
|
94,679
|
|
$
|
73,444
|
|
$
|
21,235
|
|
28.9
|
%
|
|||
|
% of revenues
|
17.3
|
%
|
19.1
|
%
|
||||||||||
The increase in fiscal 2018 compared to fiscal 2017 was primarily due to an increase in consulting fees related to information systems implementation and stock-based compensation, partially offset by a reduction in employee incentive compensation due to decreased profitability from lower revenues. The components of this increase were as follows (in millions):
|
Fiscal 2018 compared to Fiscal 2017
|
|||
|
Employee compensation costs
|
$
|
(0.2
|
)
|
|
Stock-based compensation
|
1.5
|
|
|
|
Depreciation and amortization
|
0.7
|
|
|
|
Consulting fees
|
1.5
|
|
|
|
Other
|
0.9
|
|
|
|
|
$
|
4.4
|
|
The increase in selling, general and administrative expenses in fiscal 2017 compared to fiscal 2016 was primarily due to our acquisition of Cascade Microtech in June 2016, an increase in incentive plan costs related to improved performance, and amortization of intangible assets, offset by a reduction in acquisition related costs.
27
The components of this increase were as follows (in millions):
|
Fiscal 2017 compared to Fiscal 2016
|
|||
|
Employee compensation costs
|
$
|
14.0
|
|
|
Consulting fees
|
3.3
|
|
|
|
Depreciation and amortization
|
2.7
|
|
|
|
Travel related costs
|
2.0
|
|
|
|
Stock-based compensation
|
2.5
|
|
|
|
Acquisition related
|
(5.1
|
)
|
|
|
Other
|
1.8
|
|
|
|
|
$
|
21.2
|
|
Stock-based compensation expense included within selling, general and administrative expenses in fiscal
2018
,
2017
and
2016
was
$8.9 million
,
$7.4 million
and
$4.9 million
, respectively.
Restructuring and Impairment Charges, net
|
Fiscal Year Ended
|
|||||||||||
|
December 29, 2018
|
December 30, 2017
|
December 31, 2016
|
|||||||||
|
(Dollars in thousands)
|
|||||||||||
|
Restructuring and impairment charges, net
|
$
|
160
|
|
$
|
810
|
|
$
|
19,692
|
|
||
|
% of revenues
|
*
|
|
0.1
|
%
|
5.1
|
%
|
|||||
*
Less than 0.1%.
Restructuring and impairment charges, net are comprised of costs related to employee termination benefits, cost of long-lived assets abandoned or impaired, as well as contract termination costs.
Restructuring charges in fiscal 2018 were related to a specific product line and associated personnel within the Systems segment. Restructuring and impairment charges, net, in fiscal 2017 and 2016, were related to the integration of Cascade Microtech into our operations. The fiscal 2016 period also included costs related to the consolidation of our operations and a $12.4 million charge for the write-off of in-process research and development.
See Notes 6 and Note 7 of Notes to Consolidated Financial Statements for additional information.
Interest Income and Interest Expense
|
|
Fiscal Year Ended
|
||||||||||
|
|
December 29, 2018
|
December 30, 2017
|
December 31, 2016
|
||||||||
|
|
(Dollars in thousands)
|
||||||||||
|
Interest income
|
$
|
1,356
|
|
$
|
548
|
|
$
|
327
|
|
||
|
Weighted average balance of cash and investments
|
$
|
138,467
|
|
$
|
124,637
|
|
$
|
131,610
|
|
||
|
Weighted average yield on cash and investments
|
1.51
|
%
|
0.84
|
%
|
0.31
|
%
|
|||||
|
|
|
|
|
|
|
||||||
|
Interest expense
|
$
|
3,314
|
|
$
|
4,491
|
|
$
|
2,391
|
|
||
|
Average debt outstanding
|
$
|
90,086
|
|
$
|
127,598
|
|
$
|
76,228
|
|
||
|
Weighted average interest rate on debt
|
3.98
|
%
|
3.07
|
%
|
1.25
|
%
|
|||||
28
Interest income is earned on our cash, cash equivalents, restricted cash and marketable securities. The increase in interest income in fiscal 2018 compared to fiscal 2017 was attributable to higher investment yields, as well as higher average investment balances. The increase in interest income in fiscal 2017 compared with fiscal 2016 was attributable to higher investment yields partially offset by lower average cash and investment balances.
Interest expense primarily includes interest on our term loan, partially offset from income from our interest-rate swap derivative contracts, as well as term loan issuance costs amortization charges. The decrease in interest expense in fiscal 2018 compared to fiscal 2017 was primarily due to lower outstanding debt balances as a result of principal payments made, partially offset by higher interest rates. The increase in interest expense in fiscal 2017 compared to fiscal 2016 was attributable to the term loan entered into at the end of June 2016 in connection with our acquisition of Cascade Microtech and, accordingly, was not outstanding for the first six months of fiscal 2016.
Other Income (Expense), Net
Other income (expense), net primarily includes the effects of foreign currency impact and various other gains and losses.
Provision (Benefit) For Income Taxes
|
Fiscal Year Ended
|
|||||||||||
|
December 29, 2018
|
December 30, 2017
|
December 31, 2016
|
|||||||||
|
(Dollars in thousands)
|
|||||||||||
|
Provision (benefit) for income taxes
|
$
|
(70,109
|
)
|
$
|
1,293
|
|
$
|
(43,638
|
)
|
||
|
Effective tax rate
|
(206.6
|
)%
|
3.1
|
%
|
86.9
|
%
|
|||||
Provision for income taxes reflects the tax provision on our operations in foreign and U.S. jurisdictions, offset by tax benefits from a partial release of valuation allowance against U.S. federal and state deferred tax assets and from lapsing of statute of limitations related to uncertain tax positions in foreign jurisdictions. As of
December 29, 2018
, we maintain a valuation allowance of
$34.0 million
primarily against our California deferred tax assets and foreign tax credits, due to uncertainty about the future realization of these assets.
The benefit for income taxes in fiscal 2018 includes a $75.8 million reduction to our valuation allowance on our U.S. deferred tax assets ("DTAs") as sufficient positive evidence existed to support the realization of such DTAs. The effective tax rate in fiscal 2018 also benefited from a lower statutory tax rate in the U.S., partially offset by higher profits in foreign jurisdictions.
The provision for income taxes in fiscal 2017 includes taxes on higher profits in foreign jurisdictions compared to fiscal 2016 and was reduced in fiscal 2017 for refundable AMT tax credits in the U.S. of $2.4 million. In fiscal 2017 we maintained a full valuation allowance against our U.S. federal and state DTAs.
The income tax benefit in fiscal 2016 was primarily due to the release of valuation allowance on our DTA in connection with our acquisition of Cascade Microtech in June 2016 as a result of the establishment of deferred tax liabilities ("DTLs") on the acquired identifiable intangible assets. These DTLs exceeded the acquired DTAs by $44.0 million and created additional sources of income to realize a tax benefit for our previously-existing DTAs. Accordingly, the valuation allowance on a portion of our DTAs was released and resulted in an income tax benefit of $44.0 million.
Our effective tax rate may vary from period to period based on changes in estimated taxable income or loss by jurisdiction, changes to the valuation allowance, changes to U.S. federal, state or foreign tax laws, future expansion into areas with varying country, state, and local income tax rates, deductibility of certain costs and expenses by jurisdiction.
Liquidity and Capital Resources
Capital Resources
Our working capital increased to
$235.3 million
at
December 29, 2018
compared to
$213.7 million
at
December 30, 2017
primarily due to cash generated from operations, partially offset by cash used for the acquisition of property, plant and equipment and payments on our term loan.
Cash and cash equivalents primarily consist of deposits held at banks and money market funds. Marketable securities primarily consist of U.S. agency securities and corporate bonds. We typically invest in highly-rated securities with low probabilities of
29
default. Our investment policy requires investments to be rated single A or better, and limits the types of acceptable investments, issuer concentration and duration of the investment.
Our cash, cash equivalents and marketable securities totaled approximately
$149.0 million
at
December 29, 2018
compared to
$140.2 million
at
December 30, 2017
. We believe that we will be able to satisfy our working capital requirements for at least the next twelve months with the liquidity provided by our existing cash, cash equivalents, marketable securities and cash provided by operations. To the extent necessary, we may consider entering into short and long-term debt obligations, raising cash through a stock issuance, or obtaining new financing facilities, which may not be available on terms favorable to us. Our future capital requirements may vary materially from those now planned.
If we are unsuccessful in maintaining or growing our revenues, maintaining or reducing our cost structure (in response to an industry demand downturn or other event), or increasing our available cash through debt or equity financings, our cash, cash equivalents and marketable securities may decline in fiscal
2019
.
We utilize a variety of tax planning and financing strategies in an effort to manage our worldwide cash and deploy funds to locations where they are needed. As part of these strategies, we indefinitely reinvest a portion of our foreign earnings. During fiscal
2018
, we repatriated $16.5 million of foreign earnings. Should we require additional capital in the U.S., we may elect to repatriate indefinitely-reinvested foreign funds or raise capital in the U.S.
Cash Flows
|
Fiscal Year Ended
|
|||||||||||
|
December 29, 2018
|
December 30, 2017
|
December 31, 2016
|
|||||||||
|
(Dollars in thousands)
|
|||||||||||
|
Net cash provided by operating activities
|
$
|
68,700
|
|
$
|
86,323
|
|
$
|
17,423
|
|
||
|
Net cash used in investing activities
|
(21,295
|
)
|
(59,425
|
)
|
(205,539
|
)
|
|||||
|
Net cash (used in) provided by financing activities
|
(39,329
|
)
|
(39,470
|
)
|
143,614
|
|
|||||
Operating Activities
Net cash provided by operating activities in fiscal
2018
was primarily attributable to net income of
$104.0 million
, which included
$2.1 million
of net non-cash income, offset by operating assets and liabilities using
$33.3 million
of cash as discussed in more detail below.
Accounts receivable increased
$13.8 million
to
$95.3 million
at
December 29, 2018
compared to
$81.5 million
at
December 30, 2017
as a result of increased revenues in the fourth quarter of 2018 compared to the fourth quarter of 2017, changes in the timing of customer shipments, and changes in payments terms related to customer mix.
Inventories, net, increased
$9.9 million
to
$77.7 million
at
December 29, 2018
compared to
$67.8 million
at
December 30, 2017
as a result of changes in product mix and increased inventory purchases to shorten lead times and improve vendor pricing, partially offset by a
$10.5 million
increase to our provision for excess and obsolete inventories.
Investing Activities
Net cash used in investing activities in fiscal
2018
primarily related to
$19.9 million
of cash used in the acquisition of property, plant and equipment and
$1.5 million
used for the purchase of marketable securities, net of maturities.
Financing Activities
Net cash used in financing activities in fiscal
2018
primarily related to
$41.3 million
of principal payments made towards the repayment of our term loan, and
$5.8 million
related to tax withholdings associated with the net share settlements of our equity awards, partially offset by
$7.7 million
of proceeds received from issuances of common stock under our stock incentive plans.
Debt Facility
On June 24, 2016, we entered into a credit agreement (the “Credit Agreement”) with HSBC Bank USA, National Association ("HSBC"). Pursuant to the Credit Agreement, the lenders provided us with a senior secured term loan facility of $150 million (the “Term Loan”). The proceeds of the Term Loan were used to finance a portion of the purchase price paid in connection with the acquisition of Cascade Microtech. As of
December 29, 2018
, the balance outstanding was
$65.0 million
.
30
The Term Loan bears interest at a rate equal to, at our option, (i) the applicable London Interbank Offered Rate ("LIBOR") rate plus 2.00% per annum or (ii) Base Rate (as defined in the Credit Agreement) plus 1.00% per annum. We have currently elected to pay interest at 2.00% over the one-month LIBOR rate. Interest payments are payable in monthly installments over a five-year period. As of
December 29, 2018
, the interest rate pursuant to the Term Loan was
4.35%
.
On July 25, 2016, we entered into an interest rate swap agreement with HSBC and other lenders to hedge the interest payments on the Term Loan for the notional amount of $95.6 million. As future levels of LIBOR over the life of the loan are uncertain, we entered into these interest-rate swap agreements to hedge the exposure in interest rate risks associated with movement in LIBOR rates. By entering into the agreements, we convert a floating rate interest at one-month LIBOR plus 2% into a fixed rate interest at 2.939%. As of
December 29, 2018
, the notional amount of the loan that is subject to this interest rate swap is $60.0 million. See Note 8 of Notes to Condensed Consolidated Financial Statements for additional information.
The Term Loan amortizes in equal quarterly installments, which began June 30, 2016, in annual amounts equal to 5% for year one, 10% for year two, 20% for year three, 30% for year four and 35% for year five. The Credit Agreement allows voluntary prepayment to be made at any time to prepay the Term Loan in whole or in part without penalty or premium. As of
December 29, 2018
, we have made prepayments of
$40.0 million
in addition to scheduled installments per the Credit Agreement, including
$15.0 million
of prepayments made in fiscal
2018
.
The obligations under the Term Loan are guaranteed by substantially all of our assets and the assets of our domestic subsidiaries, subject to certain customary exceptions.
The Credit Agreement contains negative covenants customary for financing of this type, as well as certain financial maintenance covenants. As of
December 29, 2018
, we were in compliance with all covenants under the Credit Agreement.
Stock Repurchase Program
In February 2017, our Board of Directors authorized a program to repurchase up to
$25 million
of outstanding common stock to offset potential dilution from issuances of common stock under our stock-based incentive plans. The share repurchase program will expire on February 1, 2020. During fiscal
2018
, we did not repurchase any shares and, as of
December 29, 2018
,
$6.0 million
remained available for future repurchases.
Repurchased shares are retired upon the settlement of the related trade transactions with the excess of cost over par value charged to additional paid-in capital. All repurchases were made in compliance with Rule 10b-18 under the Securities Exchange Act of 1934, as amended.
Contractual Obligations and Commitments
The following table summarizes our significant contractual commitments to make future payments in cash under contractual obligations as of
December 29, 2018
(in thousands):
|
Payments Due In Fiscal Year
|
|||||||||||||||||||||||||||
|
2019
|
2020
|
2021
|
2022
|
2023
|
After 2022
|
Total
|
|||||||||||||||||||||
|
Operating leases
|
$
|
6,256
|
|
$
|
6,522
|
|
$
|
5,742
|
|
$
|
4,786
|
|
$
|
4,355
|
|
$
|
20,382
|
|
$
|
48,043
|
|
||||||
|
Senior secured term loan facility-principal payments
|
30,000
|
|
35,000
|
|
—
|
|
—
|
|
—
|
|
—
|
|
65,000
|
|
|||||||||||||
|
Senior secured term loan facility-interest payments
(1)
|
2,190
|
|
556
|
|
—
|
|
—
|
|
—
|
|
—
|
|
2,746
|
|
|||||||||||||
|
Total
|
$
|
38,446
|
|
$
|
42,078
|
|
$
|
5,742
|
|
$
|
4,786
|
|
$
|
4,355
|
|
$
|
20,382
|
|
$
|
115,789
|
|
||||||
(1)
Represents our minimum interest payment commitments at
4.35%
per annum.
The table above excludes our gross liability for unrecognized tax benefits, which totaled
$25.2 million
as of
December 29, 2018
. The timing of any payments which could result from these unrecognized tax benefits will depend upon a number of factors. Accordingly, the timing of payment cannot be estimated and has been excluded from the table above.
31
Off-Balance Sheet Arrangements
Historically, we have not participated in transactions that have generated relationships with unconsolidated entities or financial partnerships, such as entities often referred to as structured finance or special purpose entities, which would have been established for the purpose of facilitating off-balance sheet arrangements or other contractually narrow or limited purposes. As of
December 29, 2018
, we were not involved in any off-balance sheet arrangements.
Indemnification Agreements
We have entered, and may from time to time in the ordinary course of our business enter, into contractual arrangements with third parties that include indemnification obligations. Under these contractual arrangements, we have agreed to defend, indemnify and/or hold the third party harmless from and against certain liabilities. These arrangements include indemnities in favor of customers in the event that our products or services infringe a third party's intellectual property or cause property or other indemnities in favor of our lessors in connection with facility leasehold liabilities that we may cause. In addition, we have entered into indemnification agreements with our directors and certain of our officers, and our bylaws contain indemnification obligations in favor of our directors, officers and agents. These indemnity arrangements may limit the type of the claim, the total amount that we can be required to pay in connection with the indemnification obligation and the time within which an indemnification claim can be made. The duration of the indemnification obligation may vary, and for most arrangements, survives the agreement term and is indefinite. We believe that substantially all of our indemnity arrangements provide either for limitations on the maximum potential future payments we could be obligated to make, or for limitations on the types of claims and damages we could be obligated to indemnify, or both. However, it is not possible to determine or reasonably estimate the maximum potential amount of future payments under these indemnification obligations due to the varying terms of such obligations, a lack of history of prior indemnification claims, the unique facts and circumstances involved in each particular contractual arrangement and in each potential future claim for indemnification, and the contingency of any potential liabilities upon the occurrence of events that are not reasonably determinable. We have not had any material requests for indemnification under these arrangements. We have not recorded any liabilities for these indemnification arrangements on our Consolidated Balance Sheets as of
December 29, 2018
or
December 30, 2017
.
New Accounting Pronouncements
See Note 18 of Notes to Consolidated Financial Statements.
32
Item 7A:
Quantitative and Qualitative Disclosures about Market Risk
Foreign Currency Exchange Risk
We conduct certain operations in foreign currencies. We enter into currency forward exchange contracts to hedge a portion, but not all, of existing foreign currency denominated amounts. Gains and losses on these contracts are generally recognized in Other income (expense), net in our Consolidated Statements of Operations. Because the effect of movements in currency exchange rates on the currency forward exchange contracts generally offsets the related effect on the underlying items being hedged, these financial instruments are not expected to subject us to risks that would otherwise result from changes in currency exchange rates. We do not use derivative financial instruments for trading or speculative purposes. We recognized a net loss from our foreign exchange of
$0.3 million
,
$0.6 million
and
$0.7 million
, respectively in fiscal
2018
,
2017
and
2016
.
Interest Rate Sensitivity
Our exposure to market risk for changes in interest rates relates primarily to our investment portfolio. We invest in a number of securities including U.S. agency discount notes, money market funds and commercial paper. We attempt to ensure the safety and preservation of our invested principal funds by limiting default risk, market risk and reinvestment risk. We mitigate default risk by investing in high grade investment securities. By policy, we limit the amount of credit exposure to an issuer, except U.S. Treasuries and U.S. agencies.
Our exposure to interest rate risk arising from our Term Loan (See Note 5 of Notes to Consolidated Financial Statements) is insignificant as a result of the interest-rate swap agreement (See Note 8 of Notes to Consolidated Financial Statements) that we entered into with HSBC and other lenders to hedge the interest payments on our Term Loan.
We use interest rate derivative instruments to manage interest rate exposures. We do not use derivative instruments for trading or speculative purposes. The fair market value of our fixed rate securities may be adversely impacted by increases in interest rates while income earned on floating rate securities may decline as a result of decreases in interest rates. A hypothetical 100 basis-point (one percentage point) increase or decrease in interest rates compared to rates at
December 29, 2018
and
December 30, 2017
would have affected the fair value of our investment portfolio by
$0.7 million
and
$1.1 million
, respectively.
Item 8:
Financial Statements and Supplementary Data
Consolidated Financial Statements
The consolidated financial statements and supplementary data required by this item are included in the section entitled "Consolidated Financial Statements" of this Annual Report on Form 10-K. See Item 15 for a list of our consolidated financial statements.
Item 9:
Changes in and Disagreements with Accountants on Accounting and Financial Disclosure
None.
Item 9A:
Controls and Procedures
Evaluation of Disclosure Controls and Procedures
Based on our management’s evaluation (with the participation of our principal executive officer and principal financial officer), as of the end of the period covered by this report, our principal executive officer and principal financial officer have concluded that our disclosure controls and procedures (as defined in Rules 13a-15(e) and 15d-15(e) under the Securities Exchange Act of 1934, as amended, (the “Exchange Act”)) were effective to ensure that information required to be disclosed by us in reports that we file or submit under the Exchange Act is recorded, processed, summarized and reported within the time periods specified in Securities and Exchange Commission rules and forms and is accumulated and communicated to our management, including our principal executive officer and principal financial officer, as appropriate to allow timely decisions regarding required disclosure.
Changes in Internal Control over Financial Reporting
There have been no changes in our internal control over financial reporting (as defined in Rules 13a-15(f) and 15d-15(f) under the Exchange Act) that occurred during the quarter ended
December 29, 2018
, that have materially affected, or are reasonably likely to materially affect, our internal control over financial reporting.
33
Management's Report on Internal Control over Financial Reporting
Our management is responsible for establishing and maintaining adequate internal control over financial reporting as defined in Rules 13a-15(f) and 15d-15(f) under the Exchange Act. Internal control over financial reporting is a process designed by, or under the supervision of, our Principal Executive Officer and Principal Financial Officer, and effected by our board of directors, management and other personnel and consultants, to provide reasonable assurance regarding the reliability of financial reporting and the preparation of financial statements for external purposes in accordance with generally accepted accounting principles, and includes those policies and procedures that:
(i) pertain to the maintenance of records that in reasonable detail accurately and fairly reflect our transactions and dispositions of assets;
(ii) provide reasonable assurance that transactions are recorded as necessary to permit preparation of financial statements in accordance with generally accepted accounting principles, and that our receipts and expenditures are being made only in accordance with the authorization of our management and directors; and
(iii) provide reasonable assurance regarding prevention or timely detection of unauthorized acquisition, use or disposition of our assets that could have a material effect on the financial statements.
Because of its inherent limitations, internal control over financial reporting may not prevent or detect misstatements. Also, projections of any evaluation of effectiveness to future periods are subject to the risk that controls may become inadequate because of changes in conditions, or that the degree of compliance with the policies or procedures may deteriorate.
Under the supervision and with the participation of our management, including our Principal Executive Officer and Principal Financial Officer, we conducted an assessment of the effectiveness of our internal control over financial reporting as of
December 29, 2018
. In making this assessment, our management used the criteria set forth in
Internal Control-Integrated Framework (2013)
issued by the Committee of Sponsoring Organizations of the Treadway Commission ("COSO"). Based on the results of this assessment, management has concluded that our internal control over financial reporting was effective as of
December 29, 2018
.
The effectiveness of our internal control over financial reporting as of
December 29, 2018
has been audited by KPMG LLP, an independent registered public accounting firm, as stated in their report which appears in this Annual Report on Form 10-K.
Limitations on the Effectiveness of Controls
Control systems, no matter how well designed and operated, can provide only reasonable, not absolute, assurance that the control systems’ objectives are being met. Further, the design of any control systems must reflect the fact that there are resource constraints, and the benefits of all controls must be considered relative to their costs. Because of the inherent limitations in all control systems, no evaluation of controls can provide absolute assurance that all control issues and instances of fraud, if any, within our company have been detected. These inherent limitations include the realities that judgments in decision making can be faulty and that breakdowns can occur because of simple error or mistake. Control systems can also be circumvented by the individual acts of some persons, by collusion of two or more people, or by management override of the controls. The design of any system of controls is based, in part, on certain assumptions about the likelihood of future events, and there can be no assurance that any design will succeed in achieving its stated goals under all potential future conditions. Over time, controls may become inadequate because of changes in conditions or deterioration in the degree of compliance with policies or procedures.
CEO and CFO Certifications
We have attached as exhibits to this Annual Report on Form 10-K the certifications of our Chief Executive Officer and Chief Financial Officer, which are required in accordance with the Exchange Act. We recommend that this Item 9A be read in conjunction with the certifications for a more complete understanding of the subject matter presented.
Item 9B:
Other Information
None.
34
PART III
Item 10:
Directors, Executive Officers and Corporate Governance
The information required by this item is incorporated by reference to the proxy statement for our
2019
Annual Meeting of Stockholders.
Item 11:
Executive Compensation
The information required by this item is incorporated by reference to the proxy statement for our
2019
Annual Meeting of Stockholders.
Item 12:
Security Ownership of Certain Beneficial Owners and Management and Related Stockholder Matters
The information required by this item is incorporated by reference to the proxy statement for our
2019
Annual Meeting of Stockholders.
Item 13:
Certain Relationships and Related Transactions, and Director Independence
The information required by this item is incorporated by reference to the proxy statement for our
2019
Annual Meeting of Stockholders.
Item 14:
Principal Accounting Fees and Services
The information required by this item is incorporated by reference to the proxy statement for our
2019
Annual Meeting of Stockholders.
35
PART IV
Item 15:
Exhibits, Financial Statement Schedules
Financial Statements and Schedules
The Consolidated Financial Statements, together with the report thereon of KPMG LLP, are included on the pages indicated below:
|
Page
|
||
|
Report of Independent Registered Public Accounting Firm
|
||
|
Consolidated Balance Sheets as of December 29, 2018 and December 30, 2017
|
||
|
Consolidated Statements of Operations for the fiscal years ended December 29, 2018, December 30, 2017 and December 31, 2016
|
||
|
Consolidated Statements of Comprehensive Income (Loss) for the fiscal years ended December 29, 2018, December 30, 2017 and December 31, 2016
|
||
|
Consolidated Statements of Stockholders' Equity for the fiscal years ended December 29, 2018, December 30, 2017 and December 31, 2016
|
||
|
Consolidated Statements of Cash Flows for the fiscal years ended December 29, 2018, December 30, 2017 and December 31, 2016
|
||
|
Notes to Consolidated Financial Statements
|
||
Financial statement schedules have been omitted because they are not applicable or the required information is shown in the consolidated financial statements or notes thereto.
Exhibits
The exhibits listed in the accompanying index to exhibits are filed or incorporated by reference as part of this Annual Report on Form 10-K.
Item 16:
Form 10-K Summary
None.
36
SIGNATURES
Pursuant to the requirements of Section 13 or 15(d) of the Securities Exchange Act of 1934, the Registrant has duly caused this report to be signed on its behalf by the undersigned, thereunto duly authorized, in the City of Livermore, State of California, on
February 26, 2019
.
|
|
FORMFACTOR, INC.
|
|||
|
By:
|
/s/ SHAI SHAHAR
|
|||
|
|
|
Shai Shahar
Chief Financial Officer
(Principal Financial Officer and Principal
Accounting Officer)
|
||
POWER OF ATTORNEY
KNOW BY ALL PERSONS BY THESE PRESENTS, that each of the undersigned whose signature appears below constitutes and appoints Shai Shahar and Jason Cohen, and each of them, the undersigned's true and lawful attorneys in-fact and agents with full power of substitution, for the undersigned and in the undersigned's name, place and stead, in any and all capacities, to sign any and all amendments to this Annual Report on Form 10-K and any other documents in connection therewith, and to file the same, with all exhibits thereto, with the Securities and Exchange Commission, granting unto said attorneys-in-fact and agents, and each of them, full power and authority to do and perform each and every act requisite and necessary to be done with respect to this Annual Report on Form 10-K, including amendments, as fully to all intents and purposes as the undersigned might or could do in person, hereby ratifying and confirming all that said attorneys-in-fact and agents, or his or their substitute or substitutes, may lawfully do or cause to be done by virtue hereof.
IN WITNESS WHEREOF, each of the undersigned has executed this Power of Attorney as of the date indicated below.
Pursuant to the requirements of the Securities Exchange Act of 1934, this report has been signed below by the following persons on behalf of the Registrant and in the capacities and on the dates indicated.
|
Signature
|
Title
|
Date
|
||
|
|
|
|
||
|
Principal Executive Officer:
|
|
|
||
|
/s/ MICHAEL D. SLESSOR
|
Chief Executive Officer and Director
|
February 26, 2019
|
||
|
Michael D. Slessor
|
||||
|
Principal Financial Officer and Principal
Accounting Officer:
|
|
|
||
|
/s/ SHAI SHAHAR
|
Chief Financial Officer
|
February 26, 2019
|
||
|
Shai Shahar
|
||||
37
|
Signature
|
Title
|
Date
|
||
|
|
|
|
||
|
Additional Directors:
|
|
|
||
|
/s/ LOTHAR MAIER
|
Director
|
February 26, 2019
|
||
|
Lothar Maier
|
||||
|
/s/ EDWARD ROGAS, JR
|
Director
|
February 26, 2019
|
||
|
Edward Rogas, Jr
|
||||
|
/s/ KELLEY STEVEN-WAISS
|
Director
|
February 26, 2019
|
||
|
Kelley Steven-Waiss
|
||||
|
/s/ MICHAEL W. ZELLNER
|
Director
|
February 26, 2019
|
||
|
Michael W. Zellner
|
||||
|
/s/ RAYMOND LINK
|
Director
|
February 26, 2019
|
||
|
Raymond Link
|
||||
|
/s/ RICHARD DELATEUR
|
Director
|
February 26, 2019
|
||
|
Richard DeLateur
|
||||
|
/s/ THOMAS ST. DENNIS
|
Director
|
February 26, 2019
|
||
|
Thomas St. Dennis
|
||||
38
Report of Independent Registered Public Accounting Firm
To the Stockholders and Board of Directors
FormFactor, Inc.:
Opinions on the Consolidated Financial Statements and Internal Control Over Financial Reporting
We have audited the accompanying consolidated balance sheets of FormFactor, Inc. and subsidiaries (the Company) as of
December 29, 2018
and
December 30, 2017
, the related consolidated statements of operations, comprehensive income (loss), stockholders’ equity, and cash flows for each of the years in the three-year period ended
December 29, 2018
, and the related notes (collectively, the consolidated financial statements). We also have audited the Company’s internal control over financial reporting as of
December 29, 2018
, based on criteria established in
Internal Control - Integrated Framework (2013)
issued by the Committee of Sponsoring Organizations of the Treadway Commission.
In our opinion, the consolidated financial statements referred to above present fairly, in all material respects, the financial position of the Company as of
December 29, 2018
and
December 30, 2017
, and the results of its operations and its cash flows for each of the years in the three-year period ended
December 29, 2018
, in conformity with U.S. generally accepted accounting principles. Also in our opinion, the Company maintained, in all material respects, effective internal control over financial reporting as of
December 29, 2018
, based on criteria established in
Internal Control - Integrated Framework (2013)
issued by the Committee of Sponsoring Organizations of the Treadway Commission.
Change in Accounting Principle
As discussed in Note 18 to the consolidated financial statements, the Company has changed its method of accounting for revenue from contracts with customers for the year-ended December 29, 2018 due to the adoption of Accounting Standards Codification 606,
Revenue from Contracts with Customers
.
Basis for Opinions
The Company’s management is responsible for these consolidated financial statements, for maintaining effective internal control over financial reporting, and for its assessment of the effectiveness of internal control over financial reporting, included in the accompanying Management’s Report on Internal Control over Financial Reporting appearing under Item 9A. Our responsibility is to express an opinion on the Company’s consolidated financial statements and an opinion on the Company’s internal control over financial reporting based on our audits. We are a public accounting firm registered with the Public Company Accounting Oversight Board (United States) (PCAOB) and are required to be independent with respect to the Company in accordance with the U.S. federal securities laws and the applicable rules and regulations of the Securities and Exchange Commission and the PCAOB.
We conducted our audits in accordance with the standards of the PCAOB. Those standards require that we plan and perform the audits to obtain reasonable assurance about whether the consolidated financial statements are free of material misstatement, whether due to error or fraud, and whether effective internal control over financial reporting was maintained in all material respects.
Our audits of the consolidated financial statements included performing procedures to assess the risks of material misstatement of the consolidated financial statements, whether due to error or fraud, and performing procedures that respond to those risks. Such procedures included examining, on a test basis, evidence regarding the amounts and disclosures in the consolidated financial statements. Our audits also included evaluating the accounting principles used and significant estimates made by management, as well as evaluating the overall presentation of the consolidated financial statements. Our audit of internal control over financial reporting included obtaining an understanding of internal control over financial reporting, assessing the risk that a material weakness exists, and testing and evaluating the design and operating effectiveness of internal control based on the assessed risk. Our audits also included performing such other procedures as we considered necessary in the circumstances. We believe that our audits provide a reasonable basis for our opinions.
Definition and Limitations of Internal Control Over Financial Reporting
A company’s internal control over financial reporting is a process designed to provide reasonable assurance regarding the reliability of financial reporting and the preparation of financial statements for external purposes in accordance with generally accepted accounting principles. A company’s internal control over financial reporting includes those policies and procedures that (1) pertain to the maintenance of records that, in reasonable detail, accurately and fairly reflect the transactions and dispositions of the assets of the company; (2) provide reasonable assurance that transactions are recorded as necessary to permit preparation of financial statements in accordance with generally accepted accounting principles, and that receipts and expenditures of the company are being made only in accordance with authorizations of management and directors of the company; and (3) provide reasonable
39
assurance regarding prevention or timely detection of unauthorized acquisition, use, or disposition of the company’s assets that could have a material effect on the financial statements.
Because of its inherent limitations, internal control over financial reporting may not prevent or detect misstatements. Also, projections of any evaluation of effectiveness to future periods are subject to the risk that controls may become inadequate because of changes in conditions, or that the degree of compliance with the policies or procedures may deteriorate.
/s/ KPMG LLP
We have served as the Company’s auditor since 2013.
Portland, Oregon
February 26, 2019
40
FORMFACTOR, INC.
CONSOLIDATED BALANCE SHEETS
|
December 29, 2018
|
December 30, 2017
|
||||||
|
|
(In thousands, except share
and per share data)
|
||||||
|
ASSETS
|
|
|
|||||
|
Current assets:
|
|
|
|||||
|
Cash and cash equivalents
|
$
|
98,472
|
|
$
|
91,184
|
|
|
|
Marketable securities
|
50,531
|
|
48,988
|
|
|||
|
Accounts receivable, net
|
95,333
|
|
81,515
|
|
|||
|
Inventories, net
|
77,706
|
|
67,848
|
|
|||
|
Restricted cash
|
849
|
|
372
|
|
|||
|
Refundable income taxes
|
1,260
|
|
2,242
|
|
|||
|
Prepaid expenses and other current assets
|
13,669
|
|
13,705
|
|
|||
|
Total current assets
|
337,820
|
|
305,854
|
|
|||
|
Restricted cash
|
1,225
|
|
1,170
|
|
|||
|
Property, plant and equipment, net
|
54,054
|
|
46,754
|
|
|||
|
Goodwill
|
189,214
|
|
189,920
|
|
|||
|
Intangibles, net
|
67,640
|
|
97,484
|
|
|||
|
Deferred tax assets
|
77,301
|
|
3,133
|
|
|||
|
Other assets
|
968
|
|
2,259
|
|
|||
|
Total assets
|
$
|
728,222
|
|
$
|
646,574
|
|
|
|
LIABILITIES AND STOCKHOLDERS' EQUITY
|
|
|
|||||
|
Current liabilities:
|
|
|
|||||
|
Accounts payable
|
$
|
40,006
|
|
$
|
35,046
|
|
|
|
Accrued liabilities
|
27,731
|
|
33,694
|
|
|||
|
Current portion of term loan, net of unamortized issuance cost of $160 and $307
|
29,840
|
|
18,443
|
|
|||
|
Deferred revenue
|
4,941
|
|
4,978
|
|
|||
|
Total current liabilities
|
102,518
|
|
92,161
|
|
|||
|
Term loan, less current portion, net of unamortized issuance cost of $29 and $272
|
34,971
|
|
87,228
|
|
|||
|
Deferred tax liabilities
|
2,355
|
|
3,379
|
|
|||
|
Deferred rent and other liabilities
|
8,214
|
|
5,169
|
|
|||
|
Total liabilities
|
148,058
|
|
187,937
|
|
|||
|
|
|
|
|||||
|
Stockholders' equity:
|
|
|
|||||
|
Preferred stock, $0.001 par value:
|
|
|
|||||
|
10,000,000 shares authorized; no shares issued and outstanding
|
—
|
|
—
|
|
|||
|
Common stock, $0.001 par value:
|
|
|
|||||
|
250,000,000 shares authorized; 74,139,712 and 72,532,176 shares issued and outstanding
|
74
|
|
73
|
|
|||
|
Additional paid-in capital
|
862,897
|
|
843,116
|
|
|||
|
Accumulated other comprehensive income
|
780
|
|
3,021
|
|
|||
|
Accumulated deficit
|
(283,587
|
)
|
(387,573
|
)
|
|||
|
Total stockholders' equity
|
580,164
|
|
458,637
|
|
|||
|
Total liabilities and stockholders' equity
|
$
|
728,222
|
|
$
|
646,574
|
|
|
The accompanying notes are an integral part of these consolidated financial statements.
41
FORMFACTOR, INC.
CONSOLIDATED STATEMENTS OF OPERATIONS
|
|
Fiscal Year Ended
|
||||||||||
|
|
December 29, 2018
|
December 30, 2017
|
December 31, 2016
|
||||||||
|
|
(In thousands, except per share data)
|
||||||||||
|
Revenues
|
$
|
529,675
|
|
$
|
548,441
|
|
$
|
383,881
|
|
||
|
Cost of revenues
|
319,336
|
|
332,844
|
|
281,199
|
|
|||||
|
Gross profit
|
210,339
|
|
215,597
|
|
102,682
|
|
|||||
|
Operating expenses:
|
|
|
|
||||||||
|
Research and development
|
74,976
|
|
73,807
|
|
57,453
|
|
|||||
|
Selling, general and administrative
|
99,094
|
|
94,679
|
|
73,444
|
|
|||||
|
Restructuring and impairment charges, net
|
160
|
|
810
|
|
19,692
|
|
|||||
|
Total operating expenses
|
174,230
|
|
169,296
|
|
150,589
|
|
|||||
|
Operating income (loss)
|
36,109
|
|
46,301
|
|
(47,907
|
)
|
|||||
|
Interest income
|
1,356
|
|
548
|
|
327
|
|
|||||
|
Interest expense
|
(3,314
|
)
|
(4,491
|
)
|
(2,391
|
)
|
|||||
|
Other expense, net
|
(224
|
)
|
(152
|
)
|
(224
|
)
|
|||||
|
Income (loss) before income taxes
|
33,927
|
|
42,206
|
|
(50,195
|
)
|
|||||
|
Provision (benefit) for income taxes
|
(70,109
|
)
|
1,293
|
|
(43,638
|
)
|
|||||
|
Net income (loss)
|
$
|
104,036
|
|
$
|
40,913
|
|
$
|
(6,557
|
)
|
||
|
Net income (loss) per share:
|
|
|
|
||||||||
|
Basic
|
$
|
1.42
|
|
$
|
0.57
|
|
$
|
(0.10
|
)
|
||
|
Diluted
|
$
|
1.38
|
|
$
|
0.55
|
|
$
|
(0.10
|
)
|
||
|
Weighted-average number of shares used in per share calculations:
|
|
|
|
||||||||
|
Basic
|
73,482
|
|
72,292
|
|
64,941
|
|
|||||
|
Diluted
|
75,182
|
|
74,239
|
|
64,941
|
|
|||||
The accompanying notes are an integral part of these consolidated financial statements.
42
FORMFACTOR, INC.
CONSOLIDATED STATEMENTS OF COMPREHENSIVE INCOME (LOSS)
|
Fiscal Year Ended
|
|||||||||||
|
December 29, 2018
|
December 30, 2017
|
December 31, 2016
|
|||||||||
|
(In thousands)
|
|||||||||||
|
Net income (loss)
|
$
|
104,036
|
|
$
|
40,913
|
|
$
|
(6,557
|
)
|
||
|
Other comprehensive income (loss), net of tax:
|
|||||||||||
|
Foreign currency translation adjustments
|
(2,065
|
)
|
6,764
|
|
(2,042
|
)
|
|||||
|
Unrealized gains on the translation of deferred tax assets
|
163
|
|
—
|
|
—
|
|
|||||
|
Unrealized gains (losses) on available-for-sale marketable securities
|
(8
|
)
|
(206
|
)
|
29
|
|
|||||
|
Unrealized gains (losses) on derivative instruments
|
(331
|
)
|
203
|
|
495
|
|
|||||
|
Other comprehensive income (loss), net of tax
|
(2,241
|
)
|
6,761
|
|
(1,518
|
)
|
|||||
|
Comprehensive income (loss)
|
$
|
101,795
|
|
$
|
47,674
|
|
$
|
(8,075
|
)
|
||
The accompanying notes are an integral part of these consolidated financial statements.
43
FORMFACTOR, INC.
CONSOLIDATED STATEMENTS OF STOCKHOLDERS' EQUITY
|
|
Common Stock
|
Additional Paid-in Capital
|
Accumulated Other Comprehensive Income (Loss)
|
Accumulated Deficit
|
Total
|
|||||||||||||||||
|
|
||||||||||||||||||||||
|
|
Shares
|
Amount
|
||||||||||||||||||||
|
|
(In thousands, except shares)
|
|||||||||||||||||||||
|
Balances, December 26, 2015
|
58,088,969
|
|
$
|
58
|
|
$
|
718,904
|
|
$
|
(2,222
|
)
|
$
|
(422,059
|
)
|
$
|
294,681
|
|
|||||
|
Issuance of common stock pursuant to exercise of options for cash
|
232,190
|
|
—
|
|
2,003
|
|
—
|
|
—
|
|
2,003
|
|
||||||||||
|
Issuance of common stock pursuant to vesting of restricted stock units
|
1,579,218
|
|
2
|
|
—
|
|
—
|
|
—
|
|
2
|
|
||||||||||
|
Issuance of common stock under the Employee Stock Purchase Plan
|
557,281
|
|
1
|
|
3,740
|
|
—
|
|
—
|
|
3,741
|
|
||||||||||
|
Issuance of common stock pursuant to Cascade Microtech acquisition
|
10,450,189
|
|
10
|
|
97,069
|
|
—
|
|
—
|
|
97,079
|
|
||||||||||
|
Stock-based compensation
|
—
|
|
—
|
|
11,625
|
|
—
|
|
—
|
|
11,625
|
|
||||||||||
|
Other comprehensive loss
|
—
|
|
—
|
|
—
|
|
(1,518
|
)
|
—
|
|
(1,518
|
)
|
||||||||||
|
Net loss
|
—
|
|
—
|
|
—
|
|
—
|
|
(6,557
|
)
|
(6,557
|
)
|
||||||||||
|
Balances, December 31, 2016
|
70,907,847
|
|
71
|
|
833,341
|
|
(3,740
|
)
|
(428,616
|
)
|
401,056
|
|
||||||||||
|
Issuance of common stock pursuant to exercise of options for cash
|
1,473,389
|
|
1
|
|
13,836
|
|
—
|
|
—
|
|
13,837
|
|
||||||||||
|
Issuance of common stock pursuant to vesting of restricted stock units
|
1,364,612
|
|
1
|
|
—
|
|
—
|
|
—
|
|
1
|
|
||||||||||
|
Common stock withheld from vesting of restricted stock units for tax
|
(502,016
|
)
|
—
|
|
(6,886
|
)
|
—
|
|
—
|
|
(6,886
|
)
|
||||||||||
|
Issuance of common stock under the Employee Stock Purchase Plan
|
655,961
|
|
1
|
|
5,694
|
|
—
|
|
—
|
|
5,695
|
|
||||||||||
|
Purchase and retirement of common stock
|
(1,367,617
|
)
|
(1
|
)
|
(18,969
|
)
|
—
|
|
—
|
|
(18,970
|
)
|
||||||||||
|
Stock-based compensation
|
—
|
|
—
|
|
16,230
|
|
—
|
|
—
|
|
16,230
|
|
||||||||||
|
ASU 2016-09 Adjustment
|
—
|
|
—
|
|
(130
|
)
|
—
|
|
130
|
|
—
|
|
||||||||||
|
Other comprehensive income
|
—
|
|
—
|
|
—
|
|
6,761
|
|
—
|
|
6,761
|
|
||||||||||
|
Net income
|
—
|
|
—
|
|
—
|
|
—
|
|
40,913
|
|
40,913
|
|
||||||||||
|
Balances, December 30, 2017
|
72,532,176
|
|
73
|
|
843,116
|
|
3,021
|
|
(387,573
|
)
|
458,637
|
|
||||||||||
|
Issuance of common stock under the Employee Stock Purchase Plan
|
610,297
|
|
1
|
|
6,661
|
|
—
|
|
—
|
|
6,662
|
|
||||||||||
|
Issuance of common stock pursuant to exercise of options for cash
|
134,609
|
|
—
|
|
1,158
|
|
—
|
|
—
|
|
1,158
|
|
||||||||||
|
Issuance of common stock pursuant to vesting of restricted stock units
|
1,287,107
|
|
1
|
|
—
|
|
—
|
|
—
|
|
1
|
|
||||||||||
|
Common stock withheld from vesting of restricted stock units for tax
|
(424,477
|
)
|
(1
|
)
|
(5,791
|
)
|
—
|
|
—
|
|
(5,792
|
)
|
||||||||||
|
Stock-based compensation
|
—
|
|
—
|
|
17,753
|
|
—
|
|
—
|
|
17,753
|
|
||||||||||
|
ASU 2017-12 Adoption
|
—
|
|
—
|
|
—
|
|
—
|
|
(50
|
)
|
(50
|
)
|
||||||||||
|
Other comprehensive loss
|
—
|
|
—
|
|
—
|
|
(2,241
|
)
|
—
|
|
(2,241
|
)
|
||||||||||
|
Net income
|
—
|
|
—
|
|
—
|
|
—
|
|
104,036
|
|
104,036
|
|
||||||||||
|
Balances, December 29, 2018
|
74,139,712
|
|
$
|
74
|
|
$
|
862,897
|
|
$
|
780
|
|
$
|
(283,587
|
)
|
$
|
580,164
|
|
|||||
The accompanying notes are an integral part of these consolidated financial statements.
44
|
FORMFACTOR, INC.
CONSOLIDATED STATEMENTS OF CASH FLOWS
|
|||||||||||
|
|
Fiscal Year Ended
|
||||||||||
|
|
December 29, 2018
|
December 30, 2017
|
December 31, 2016
|
||||||||
|
|
(In thousands)
|
||||||||||
|
Cash flows from operating activities:
|
|
|
|
||||||||
|
Net income (loss)
|
$
|
104,036
|
|
$
|
40,913
|
|
$
|
(6,557
|
)
|
||
|
Adjustments to reconcile net income (loss) to net cash provided by operating activities:
|
|
|
|
||||||||
|
Depreciation
|
14,314
|
|
13,626
|
|
11,371
|
|
|||||
|
Amortization
|
29,373
|
|
30,940
|
|
35,427
|
|
|||||
|
Impairment of long-lived assets
|
—
|
|
—
|
|
12,400
|
|
|||||
|
Amortization (accretion) of discount on investments
|
(10
|
)
|
38
|
|
(31
|
)
|
|||||
|
Stock-based compensation expense
|
17,827
|
|
16,339
|
|
11,686
|
|
|||||
|
Amortization of debt issuance costs
|
390
|
|
619
|
|
307
|
|
|||||
|
Deferred income tax benefit
|
(74,908
|
)
|
(590
|
)
|
(45,022
|
)
|
|||||
|
Provision (benefit) for doubtful accounts receivable
|
—
|
|
(99
|
)
|
15
|
|
|||||
|
Provision for excess and obsolete inventories
|
10,479
|
|
9,259
|
|
6,631
|
|
|||||
|
Acquired inventory step-up amortization
|
—
|
|
569
|
|
10,022
|
|
|||||
|
Loss on disposal of long-lived assets
|
325
|
|
510
|
|
361
|
|
|||||
|
Foreign currency transaction losses (gains)
|
125
|
|
(1,717
|
)
|
(77
|
)
|
|||||
|
Gain on derivative instruments
|
—
|
|
(10
|
)
|
(51
|
)
|
|||||
|
Changes in assets and liabilities:
|
|
|
|
|
|
|
|||||
|
Accounts receivable
|
(13,830
|
)
|
(10,651
|
)
|
(6,847
|
)
|
|||||
|
Inventories
|
(21,298
|
)
|
(15,635
|
)
|
(11,733
|
)
|
|||||
|
Prepaid expenses and other current assets
|
262
|
|
870
|
|
(3,292
|
)
|
|||||
|
Refundable income taxes
|
942
|
|
(413
|
)
|
126
|
|
|||||
|
Other assets
|
707
|
|
61
|
|
(248
|
)
|
|||||
|
Accounts payable
|
3,050
|
|
741
|
|
3,433
|
|
|||||
|
Accrued liabilities
|
(5,718
|
)
|
810
|
|
786
|
|
|||||
|
Income taxes payable
|
(501
|
)
|
62
|
|
(1,127
|
)
|
|||||
|
Deferred rent and other liabilities
|
3,109
|
|
111
|
|
126
|
|
|||||
|
Deferred revenues
|
26
|
|
(30
|
)
|
(283
|
)
|
|||||
|
Net cash provided by operating activities
|
68,700
|
|
86,323
|
|
17,423
|
|
|||||
|
Cash flows from investing activities:
|
|
|
|
|
|
|
|||||
|
Acquisition of property, plant and equipment
|
(19,869
|
)
|
(17,756
|
)
|
(11,521
|
)
|
|||||
|
Acquisition of Cascade Microtech, net of cash acquired
|
—
|
|
—
|
|
(228,031
|
)
|
|||||
|
Proceeds from sale of subsidiary
|
94
|
|
68
|
|
47
|
|
|||||
|
Proceeds from sale of property and property, plant and equipment
|
23
|
|
—
|
|
53
|
|
|||||
|
Purchases of marketable securities
|
(30,566
|
)
|
(50,733
|
)
|
(10,587
|
)
|
|||||
|
Proceeds from maturities of marketable securities
|
29,023
|
|
8,996
|
|
44,500
|
|
|||||
|
Net cash used in investing activities
|
(21,295
|
)
|
(59,425
|
)
|
(205,539
|
)
|
|||||
|
Cash flows from financing activities:
|
|
|
|
||||||||
|
Proceeds from issuances of common stock
|
7,712
|
|
19,510
|
|
5,745
|
|
|||||
|
Purchase and retirement of common stock
|
—
|
|
(18,970
|
)
|
—
|
|
|||||
|
Tax withholdings related to net share settlements of equity awards
|
(5,791
|
)
|
(6,885
|
)
|
—
|
|
|||||
|
Proceeds from term loan
|
—
|
|
—
|
|
150,000
|
|
|||||
|
Payments on term loan
|
(41,250
|
)
|
(33,125
|
)
|
(10,625
|
)
|
|||||
|
Payment of term loan issuance costs
|
—
|
|
—
|
|
(1,506
|
)
|
|||||
|
Net cash provided by (used in) financing activities
|
(39,329
|
)
|
(39,470
|
)
|
143,614
|
|
|||||
|
Effect of exchange rate changes on cash, cash equivalents and restricted cash
|
(256
|
)
|
2,702
|
|
399
|
|
|||||
|
Net increase (decrease) in cash, cash equivalents and restricted cash
|
7,820
|
|
(9,870
|
)
|
(44,103
|
)
|
|||||
|
Cash, cash equivalents and restricted cash, beginning of year
|
92,726
|
|
102,596
|
|
146,699
|
|
|||||
|
Cash, cash equivalents and restricted cash, end of year
|
$
|
100,546
|
|
$
|
92,726
|
|
$
|
102,596
|
|
||
45
|
FORMFACTOR, INC.
CONSOLIDATED STATEMENTS OF CASH FLOWS
|
|||||||||||
|
Fiscal Year Ended
|
|||||||||||
|
December 29, 2018
|
December 30, 2017
|
December 31, 2016
|
|||||||||
|
(In thousands)
|
|||||||||||
|
Non-cash investing and financing activities:
|
|
|
|
||||||||
|
Fair value of stock issued in connection with the acquisition of Cascade Microtech
|
$
|
—
|
|
$
|
—
|
|
$
|
97,079
|
|
||
|
Fair value of stock options and restricted stock-based awards assumed in connection with the acquisition of Cascade Microtech
|
—
|
|
—
|
|
7,776
|
|
|||||
|
Fair value of vested stock options and restricted stock-based awards paid in cash in connection with the acquisition of Cascade Microtech
|
—
|
|
—
|
|
12,815
|
|
|||||
|
Change in accounts payable and accrued liabilities related to property, plant and equipment purchases
|
2,290
|
|
(33
|
)
|
(732
|
)
|
|||||
|
Supplemental disclosure of cash flow information:
|
|
|
|
||||||||
|
Income taxes paid, net
|
$
|
4,576
|
|
$
|
3,172
|
|
$
|
2,567
|
|
||
|
Cash paid for interest
|
3,113
|
|
3,836
|
|
2,110
|
|
|||||
The accompanying notes are an integral part of these consolidated financial statements.
46
FORMFACTOR, INC.
NOTES TO CONSOLIDATED FINANCIAL STATEMENTS
Note 1—Formation and Nature of Business
FormFactor, Inc. was incorporated in Delaware on April 15, 1993 and is headquartered in Livermore, California. We are a leading provider of electrical test and measurement technologies. We provide a broad range of high-performance probe cards, analytical probes, probe stations and thermal sub-systems to both semiconductor companies and scientific institutions. Our products provide electrical information from a variety of semiconductor and electro-optical devices and integrated circuits from research, to development through production. Customers use our products and services to lower production costs, improve yields, and enable development of complex next generation products. We believe our technology leadership enables critical roadmap advances for our customers.
On June 24, 2016, we acquired Cascade Microtech, Inc. ("Cascade Microtech") which designs, develops, manufactures and markets advanced wafer probing, thermal and reliability solutions for the electrical measurement and testing of high performance semiconductor devices. Design, development and manufacturing operations are located in Beaverton, Oregon, United States and Munich and Thiendorf, Germany, and sales, service and support operations are located in the United States, Germany, Japan, Taiwan, China, and Singapore. The acquisition of Cascade Microtech transforms our business into a broader test and measurement market leader with significant scale and increased diversification and demand for the combined company’s products and technologies.
Fiscal Year
Our fiscal year ends on the last Saturday in December. The fiscal years ended on
December 29, 2018
,
December 30, 2017
and
December 31, 2016
consisted of 52 weeks, 52 weeks and 53 weeks, respectively. The first
three
fiscal quarters in our fiscal year ended
December 31, 2016
contained
13
weeks, and the
fourth
fiscal quarter contained
14
weeks.
Note 2—Summary of Significant Accounting Policies
Basis of Consolidation and Foreign Currency Translation
The consolidated financial statements include our accounts and those of our wholly-owned subsidiaries. All intercompany balances and transactions have been eliminated.
On June 24, 2016, we completed the acquisition of Cascade Microtech and, accordingly, our Consolidated Statements of Operations include the results of operations of Cascade Microtech since that date. See Note 4.
The functional currencies of certain of our foreign subsidiaries are the local currencies and, accordingly, all assets and liabilities of these foreign operations are translated to U.S. Dollars at current period-end exchange rates, and revenues and expenses are translated to U.S. Dollars using average exchange rates in effect during the period. The gains and losses from the foreign currency translation of these subsidiaries' financial statements are included as a separate component of stockholders' equity on our Consolidated Balance Sheets under Accumulated other comprehensive income.
Certain other of our foreign subsidiaries use the U.S. Dollar as their functional currency. Accordingly, monetary assets and liabilities in non-functional currencies of these subsidiaries are remeasured using exchange rates in effect at the end of the period. Revenues and costs in local currency are remeasured using average exchange rates for the period, except for costs related to those balance sheet items that are remeasured using historical exchange rates. The resulting remeasurement gains and losses are included in the Consolidated Statements of Operations as a component of Other income (expense), net as incurred.
Use of Estimates
The preparation of consolidated financial statements in conformity with accounting principles generally accepted in the United States of America ("GAAP") requires management to make estimates and assumptions that affect the reported amounts of assets and liabilities, the disclosure of contingent assets and liabilities at the date of the financial statements, and the reported amounts of revenues and expenses during the reporting period. Estimates may change as new information is obtained. We believe that the estimates, assumptions and judgments involved in revenue recognition, fair value of marketable securities, fair value of derivative financial instruments used to hedge both foreign currency and interest rate exposures, allowance for doubtful accounts, reserves for product warranty, valuation of obsolete and slow moving inventory, assets acquired and liabilities assumed in business combinations, legal contingencies, valuation of goodwill, the assessment of recoverability of long-lived assets, valuation and recognition of stock-based compensation, provision for income taxes and valuation of deferred tax assets have the greatest potential impact on our consolidated financial statements. Actual results could differ from those estimates.
47
FORMFACTOR, INC.
NOTES TO CONSOLIDATED FINANCIAL STATEMENTS (Continued)
Business Acquisitions
Our consolidated financial statements include the operations of acquired businesses after the completion of their respective acquisitions. We account for acquired businesses using the acquisition method of accounting, which requires, among other things, that assets acquired and liabilities assumed be recognized at their estimated fair values as of the acquisition date, and that the fair value of acquired intangibles, including in-process research and development ("IPR&D"), be recorded on the balance sheet. Transaction costs are expensed as incurred. Any excess of the purchase price over the assigned fair values of the net assets acquired is recorded as goodwill.
Cash and Cash Equivalents and Marketable Securities
Cash and cash equivalents consist of deposits and financial instruments which are readily convertible into cash and have original maturities of 90 days or less at the time of acquisition. Marketable securities consist primarily of highly liquid investments with maturities of greater than 90 days when purchased. We classify our marketable securities as available-for-sale and, accordingly, report them at fair value with the related unrealized gains and losses included in Accumulated other comprehensive income in our Consolidated Balance Sheets. Any unrealized losses which are considered to be other-than-temporary are recorded in Other income (expense), net, in the Consolidated Statements of Operations. Realized gains and losses on the sale of marketable securities are determined using the specific-identification method and recorded in Other income (expense), net, in the Consolidated Statements of Operations.
All of our available-for-sale investments are subject to a periodic impairment review. We record a charge to earnings when a decline in fair value is significantly below cost basis and judged to be other-than-temporary, or have other indicators of impairments. If the fair value of an available-for-sale investment is less than its amortized cost basis, an other-than-temporary impairment is triggered in circumstances where (1) we intend to sell the instrument; (2) it is more likely than not that we will be required to sell the instrument before recovery of its amortized cost basis; or (3) a credit loss exists where we do not expect to recover the entire amortized cost basis of the instrument. If we intend to sell, or it is more likely than not that we will be required to sell, the available-for-sale investment before recovery of its amortized cost basis, we recognize an other-than-temporary impairment charge equal to the difference between the investment's amortized cost basis and its fair value. We did not record any other-than-temporary impairments during fiscal
2018
,
2017
or
2016
.
Foreign Exchange Management
We transact business in various foreign currencies. We enter into forward foreign exchange contracts in an effort to mitigate the risks associated with currency fluctuations on certain foreign currency balance sheet exposures and certain operational costs denominated in local currency impacting our statement of operations. Gains and losses resulting from the impact of currency exchange rate movements on forward foreign exchange contracts designated to offset certain foreign currency balance sheet exposures and certain operational exposures are recognized as Other expense, net, in the Consolidated Statements of Operations in the period in which the exchange rates change. These gains and losses are intended to partially offset the foreign currency exchange gains and losses on the underlying exposures being hedged. We record the fair value of these contracts as of the end of our reporting period in the Consolidated Balance Sheets. We do not use derivative financial instruments for trading or speculative purposes.
Accounts Receivable and Allowance for Doubtful Accounts
The majority of our accounts receivable are derived from sales to large multinational semiconductor manufacturers throughout the world, are recorded at their invoiced amount and do not bear interest.
In order to monitor potential credit losses, we perform ongoing credit evaluations of our customers' financial condition. An allowance for doubtful accounts is maintained based upon our assessment of the expected collectability of all accounts receivable. The allowance for doubtful accounts is reviewed and assessed for adequacy on a quarterly basis. We take into consideration (1) any circumstances of which we are aware of a customer's inability to meet its financial obligations and (2) our judgments as to prevailing economic conditions in the industry and their impact on our customers. If circumstances change, and the financial condition of our customers is adversely affected and they are unable to meet their financial obligations, we may need to take additional allowances, which would result in an increase in our operating expense.
48
FORMFACTOR, INC.
NOTES TO CONSOLIDATED FINANCIAL STATEMENTS (Continued)
Activity related to our allowance for doubtful accounts receivable was as follows (in thousands):
|
Fiscal Year Ended
|
|||||||||||
|
|
December 29, 2018
|
December 30, 2017
|
December 31, 2016
|
||||||||
|
Balance at beginning of year
|
$
|
200
|
|
$
|
299
|
|
$
|
284
|
|
||
|
Charges (reversals) to costs and expenses
|
(15
|
)
|
(99
|
)
|
51
|
|
|||||
|
Write-offs
|
—
|
|
—
|
|
(36
|
)
|
|||||
|
Balance at end of year
|
$
|
185
|
|
$
|
200
|
|
$
|
299
|
|
||
Inventories
Inventories are stated at the lower of cost (principally standard cost which approximates actual cost on a first-in, first-out basis) or net realizable value.
The provision for potentially excess and obsolete inventory is made based on management's analysis of current inventory levels, and consideration primarily of past consumption, recent purchases and backlog. On a quarterly basis, we review inventory quantities on hand and on order under non-cancelable purchase commitments in comparison to our past consumption, recent purchases, backlog and other factors to determine what inventory quantities, if any, may not be sellable. Based on this analysis, we write down the affected inventory value for estimated excess and obsolescence charges. Once the value is adjusted, the original cost of our inventory, less the related inventory write-down, represents the new cost basis. Reversal of these write downs is recognized only when the related inventory has been scrapped or sold. Shipping and handling costs are classified as a component of Cost of revenues in the Consolidated Statements of Operations.
We design, manufacture and sell a custom product into a market that has been subject to cyclicality and significant demand fluctuations. Many of our products are complex, custom to a specific chip design and have to be delivered on short lead-times. Probe cards are manufactured in low volumes, but, for certain materials, the purchases are often subject to minimum order quantities in excess of the actual underlying probe card demand. It is not uncommon for us to acquire production materials and commence production activities based on estimated production yields and forecasted demand prior to, or in excess of, actual demand for our probe cards. These factors result in normal recurring inventory valuation charges to Cost of revenues.
Inventory write downs totaled
$10.5 million
,
$9.3 million
and
$6.6 million
for fiscal
2018
,
2017
and
2016
, respectively.
Restricted Cash
Restricted cash is comprised primarily of funds held by our foreign subsidiaries for employee obligations, office leases, customer deposits, and temporary customs import permits.
Property, Plant, and Equipment
Property, plant and equipment is stated at cost less accumulated depreciation and amortization. Depreciation is provided on a straight-line method over the following estimated useful lives of the assets. Machinery and equipment, computer equipment and software, and furniture and fixtures are depreciated over
1
to
5
years.
Leasehold improvements are amortized over the shorter of the lease term or the estimated useful life of the related asset. Construction-in-progress assets are not depreciated until the assets are placed in service. Upon sale or retirement of assets, the cost and related accumulated depreciation or amortization are removed from the Consolidated Balance Sheets and the resulting gain or loss is reflected in Operating income (loss) in our Consolidated Statements of Operations.
Goodwill
Goodwill represents the excess of the purchase price over the fair value of identifiable assets acquired and liabilities assumed. Goodwill is not amortized, rather assessed, at least annually, for impairment at a reporting unit level. Impairment of goodwill exists when the carrying amount of a reporting unit exceeds its fair value. A goodwill impairment loss is recognized for the amount that the carrying amount of the reporting unit, including goodwill, exceeds its fair value, limited to the total amount of goodwill allocated to that reporting unit. If the fair value of a reporting unit exceeds the carrying amount, goodwill of the reporting unit is not considered impaired.
We evaluate impairment by first assessing qualitative factors to determine whether it is necessary to perform a quantitative impairment test. If we determine, as a result of the qualitative assessment, that it is more likely than not that the fair value of a
49
FORMFACTOR, INC.
NOTES TO CONSOLIDATED FINANCIAL STATEMENTS (Continued)
reporting unit is less than its carrying amount, then the quantitative impairment test is required. Otherwise, no further testing is required.
We perform our annual goodwill impairment test in the fourth quarter of each year by assessing qualitative factors, including, but not limited to an assessment of our market capitalization, which was significantly higher than our book value. Based on these tests, we determined that the quantitative impairment test was not required and no impairment charges were recorded in fiscal
2018
,
2017
or
2016
.
The evaluation of goodwill for impairment requires the exercise of significant judgment. In the event of future changes in business conditions, we will be required to reassess and update our forecasts and estimates used in future impairment analysis. If the results of these analysis are lower than current estimates, a material impairment charge may result at that time.
See Note 10 for additional information.
Intangible Assets
Intangible assets consist of acquisition related intangible assets and intellectual property. The intangible assets are being amortized over periods of
1
to
10
years, which reflect the pattern in which economic benefits of the assets are expected to be realized. We perform a review of intangible assets when facts and circumstances indicate that the useful life is shorter than originally estimated or that the carrying amount of assets may not be recoverable. Such facts and circumstances include significant adverse changes in the business climate or legal factors; current period cash flow or operating losses combined with a history of losses or a forecast of continuing losses associated with the use of the intangible assets; and current expectation that the intangible assets will more likely than not be sold or disposed of before the end of their estimated useful lives. We assess the recoverability of identified intangible assets by comparing the projected undiscounted net cash flows associated with the related asset or group of assets over their remaining lives against their respective carrying amounts. Impairments, if any, are based on the excess of the carrying amount over the fair value of those assets.
See Note 10 for additional information.
Impairment of Long-Lived Assets
We test long-lived assets or asset groups, such as property, plant and equipment and intangible assets, for recoverability when events or changes in circumstances indicate that their carrying amounts may not be recoverable. Circumstances which could trigger a review include, but are not limited to: significant decreases in the market price of the asset; significant adverse changes in the business climate or legal factors; accumulation of costs significantly in excess of the amount originally expected for the acquisition or construction of the asset; current period cash flow or operating losses combined with a history of losses or a forecast of continuing losses associated with the use of the asset; and current expectation that the asset will more likely than not be sold or disposed of before the end of its estimated useful life.
Recoverability is assessed based on the carrying amounts of the asset or asset group and the sum of the undiscounted cash flows expected to result from the use and the eventual disposal of the asset. An impairment loss is recognized when the carrying amount is not recoverable and exceeds fair value.
See Note 7 for additional information.
Concentration of Credit Risk and Other Risks and Uncertainties
Financial instruments that potentially subject us to concentrations of credit risk consist primarily of cash equivalents, marketable securities and accounts receivable. Our cash equivalents and marketable securities are held in safekeeping by large, credit worthy financial institutions. We invest our excess cash primarily in U.S. banks, government and agency bonds, money market funds and corporate obligations. We have established guidelines relative to credit ratings, diversification and maturities that seek to maintain safety and liquidity. Deposits in these banks may exceed the amounts of insurance provided on such deposits. To date, we have not experienced any losses on our deposits of cash and cash equivalents. We market and sell our products to a relatively narrow base of customers and generally do not require collateral.
The following customer represented 10% or more of our revenues:
|
Fiscal Year Ended
|
||||||||
|
December 29, 2018
|
December 30, 2017
|
December 31, 2016
|
||||||
|
Intel Corporation
|
19.0
|
%
|
25.9
|
%
|
30.1
|
%
|
||
50
FORMFACTOR, INC.
NOTES TO CONSOLIDATED FINANCIAL STATEMENTS (Continued)
At
December 29, 2018
, two customers accounted for
27.8%
and
13.0%
of gross accounts receivable, respectively. At
December 30, 2017
, one customer accounted for
24.1%
of gross accounts receivable. No other customers accounted for 10% or more of gross accounts receivable for these fiscal period ends. We operate in the competitive semiconductor industry, including the Dynamic Random Access Memory, or DRAM, Flash memory, and Foundry & Logic and probe stations markets, which have been characterized by price erosion, rapid technological change, short product life cycles and heightened foreign and domestic competition. Significant technological changes in the industry could adversely affect our operating results.
We are exposed to non-performance risk by counterparties on our derivative instruments used in hedging activities. We seek to minimize risk by diversifying our hedging program across multiple financial institutions. These counterparties are large international financial institutions, and, to date, no such counterparty has failed to meet its financial obligations to us.
Certain components for our products that meet our requirements are available only from a limited number of suppliers. The rapid rate of technological change and the necessity of developing and manufacturing products with short life cycles may intensify our reliance on such suppliers. The inability to obtain components as required, or to develop alternative sources, if and as required in the future, could result in delays or reductions in product shipments, which in turn could have a material adverse effect on our business, financial condition, results of operations or cash flows.
Revenue Recognition
Revenue is recognized upon transferring control of products and services, and the amounts recognized reflect the consideration we expect to be entitled to receive in exchange for these products and services. Revenue is recognized net of any taxes collected from customers, which are subsequently remitted to governmental authorities. An arrangement may include some or all of the following products and services: probe cards, systems, accessories, installation services, service contracts and extended warranty contracts. We sell our products and services direct to customers and to partners in two distribution channels: global direct sales force and through a combination of manufacturers’ representatives and distributors.
A performance obligation is a promise in a contract to transfer a distinct good or service to the customer. In contracts with multiple performance obligations, we identify each performance obligation and evaluate whether the performance obligation is distinct within the context of the contract at contract inception. Performance obligations that are not distinct at contract inception are combined and accounted for as one unit of account. Generally, the performance obligations in a contract are considered distinct within the context of the contract and are accounted for as separate units of account.
Our products may be customized to our customers’ specifications, however, control of our product is typically transferred to the customer at the point in time the product is either shipped or delivered, depending on the terms of the arrangement, as the criteria for overtime recognition is not met. In limited circumstances, substantive acceptance by the customer exists which results in the deferral of revenue until acceptance is formally received from the customer. Judgment may be required in determining if the acceptance clause is substantive.
Installation services are routinely provided to customers purchasing our systems. Installation services are a distinct performance obligation apart from the systems and recognized in the period they are performed. Service contracts, which include repair and maintenance service contracts, and extended warranty contracts are also distinct performance obligations and recognized over the contractual service period, which ranges from
one
to
three
years. For these service contracts recognized over time, we use an input measure, days elapsed, to measure progress.
A contract’s transaction price is allocated to each distinct performance obligation and recognized as revenue when, or as, the performance obligation is satisfied. In determining the transaction price, we evaluate whether the price is subject to refund or adjustment to determine the net consideration to which we expect to be entitled. We generally do not grant return privileges, except for defective products during the warranty period. Sales incentives and other programs that we may make available to these customers are considered to be a form of variable consideration, which is estimated in determining the contract’s transaction price to be allocated to the performance obligations. We have elected the practical expedient under Accounting Standards Codification (“ASC”) 606-10-32-18 to not assess whether a contract has a significant financing component as our standard payment terms are less than one year.
For contracts with multiple performance obligations, we allocate the contract’s transaction price to each performance obligation based on its relative stand-alone selling price. The stand-alone selling prices are determined based on observable prices, which are the prices at which we separately sell these products. For items which do not have observable prices, we use our best estimate of the stand-alone selling prices.
51
FORMFACTOR, INC.
NOTES TO CONSOLIDATED FINANCIAL STATEMENTS (Continued)
Transaction price allocated to the remaining performance obligations:
On
December 29, 2018
, we had
$3.4 million
of remaining performance obligations, which were comprised of deferred service contracts and extended warranty contracts not yet delivered. We expect to recognize approximately
77.7%
of our remaining performance obligations as revenue in fiscal 2019, and approximately
22.3%
in fiscal 2020 and thereafter. The foregoing excludes the value of remaining performance obligations that have original durations of one year or less, and also excludes information about variable consideration allocated entirely to a wholly unsatisfied performance obligation.
Contract balances:
The timing of revenue recognition may differ from the timing of invoicing to customers. Accounts receivable is recorded at the invoiced amount, net of an allowance for doubtful accounts. A receivable is recognized in the period we deliver goods or provide services or when our right to consideration is unconditional. A contract asset is recorded when we have performed under the contract but our right to consideration is conditional on something other than the passage of time. Contract assets as of
December 29, 2018
and
December 30, 2017
were
$0.3 million
and
$1.6 million
, respectively, and are reported on the Consolidated Balance Sheets as a component of Prepaid expenses and other current assets.
Contract liabilities include payments received in advance of performance under a contract and are satisfied as the associated revenue is recognized. Contract liabilities are reported on the Consolidated Balance Sheets on a contract-by-contract basis at the end of each reporting period as a component of Deferred revenue and Deferred rent and other liabilities. Contract liabilities totaled
$5.7 million
at both
December 29, 2018
and
December 30, 2017
. During fiscal
2018
, we recognized
$4.8 million
of revenue that was included in contract liabilities as of
December 30, 2017
.
Costs to obtain a contract:
We generally expense sales commissions when incurred as a component of Selling, general and administrative expense as the amortization period is typically less than one year.
Revenue by Category:
Refer to Note 16 of Notes to Consolidated Financial Statements for further details.
Warranty Obligations
We offer warranties on certain products and record a liability for the estimated future costs associated with warranty claims at the time revenue is recognized. The warranty liability is based upon historical experience and our estimate of the level of future costs. While we engage in product quality programs and processes, our warranty obligation is affected by product failure rates, material usage and service delivery costs incurred in correcting a product failure. We continuously monitor product returns for warranty and maintain a reserve for the related expenses based upon our historical experience and any specifically identified field failures. As we sell new products to our customers, we must exercise considerable judgment in estimating the expected failure rates. This estimating process is based on historical experience of similar products, as well as various other assumptions that we believe to be reasonable under the circumstances.
We provide for the estimated cost of product warranties at the time revenue is recognized. Warranty costs are reflected in the Consolidated Statement of Operations as a Cost of revenues.
A reconciliation of the changes in our warranty liability is as follows (in thousands):
|
|
Fiscal Year Ended
|
||||||||||
|
|
December 29, 2018
|
December 30, 2017
|
December 31, 2016
|
||||||||
|
Balance at beginning of year
|
$
|
3,662
|
|
$
|
2,972
|
|
$
|
1,116
|
|
||
|
Warranty reserve from acquisition-Cascade Microtech
|
—
|
|
—
|
|
795
|
|
|||||
|
Accruals
|
3,181
|
|
8,115
|
|
5,254
|
|
|||||
|
Settlements
|
(4,741
|
)
|
(7,425
|
)
|
(4,193
|
)
|
|||||
|
Balance at end of year
|
$
|
2,102
|
|
$
|
3,662
|
|
$
|
2,972
|
|
||
Research and Development
Research and development expenses include expenses related to product development, engineering and material costs. All research and development costs are expensed as incurred.
Restructuring Charges
Restructuring charges are comprised of costs related to employee termination benefits, long-lived assets and inventory impaired or abandoned, and contract termination costs. The determination of when we accrue for employee termination benefits depends on whether the termination benefits are provided under a one-time benefit arrangement or under an on-going benefit arrangement. For restructuring charges recorded as an on-going benefit arrangement, a liability for post-employment benefits is recorded when
52
FORMFACTOR, INC.
NOTES TO CONSOLIDATED FINANCIAL STATEMENTS (Continued)
payment is probable, the amount is reasonably estimable, and the obligation relates to rights that have vested or accumulated. For restructuring charges recorded as a one-time benefit arrangement, we recognize a liability for employee termination benefits when a plan of termination, approved by management and establishing the terms of the benefit arrangement, has been communicated to employees. The timing of the recognition of one-time employee termination benefits is dependent upon the period of time the employees are required to render service after communication. If employees are not required to render service in order to receive the termination benefits or if employees will not be retained to render service beyond the minimum legal notification period, a liability for the termination benefits is recognized at the communication date. In instances where employees will be retained to render service beyond the minimum legal notification period, the liability for employee termination benefits is measured initially at the communication date based on the fair value of the liability as of the termination date and is recognized ratably over the future service period. We continually evaluate the adequacy of the remaining liabilities under our restructuring initiatives.
We record charges related to long-lived assets to be abandoned when the assets cease to be used. When we cease using a building or other asset with remaining non-cancelable lease payments continuing beyond our use period, we record a liability for remaining payments under lease arrangements, as well as for contract termination costs, that will continue to be incurred under a contract for its remaining term without economic benefit to us at the cease-use date. Given the significance of, and the timing of the execution of such activities, this process is complex and involves periodic reassessments of estimates made at the time the original decisions were made, including evaluating real estate market conditions for expected vacancy periods and sub-lease rents. Although we believe that these estimates accurately reflect the costs of our restructuring plans, actual results may differ, thereby requiring us to record additional provisions or reverse a portion of such provisions.
We recorded restructuring charges of
$0.2 million
,
$0.8 million
and
$7.3 million
for fiscal years
2018
,
2017
and
2016
, respectively.
See Note 6 for additional information.
Income Taxes
We utilize the asset and liability method of accounting for income taxes, under which deferred taxes are determined based on the temporary differences between the financial statement and tax basis of assets and liabilities using tax rates expected to be in effect during the years in which the basis differences reverse and for operating losses and tax credit carryforwards. We estimate our provision for income taxes and amounts ultimately payable or recoverable in numerous tax jurisdictions around the world. Estimates involve interpretations of regulations and are inherently complex. Resolution of income tax treatments in individual jurisdictions may not be known for many years after completion of any fiscal year. We are required to evaluate the realizability of our deferred tax assets on an ongoing basis to determine whether there is a need for a valuation allowance with respect to such deferred tax assets. A valuation allowance is recorded when it is more likely than not that some or all of the deferred tax assets will not be realized. In evaluating the ability to recover deferred tax assets, we consider all available positive and negative evidence giving greater weight to our recent cumulative income, our historical ability to utlize net operating losses in recent years and our forecast of future taxable income, including the reversal of temporary differences and the implementation of feasible and prudent tax planning strategies.
We recognize and measure uncertain tax positions taken or expected to be taken in a tax return if it is more likely than not that the tax position will be sustained on examination by the taxing authorities, based on the technical merits of the position. The tax benefits recognized are then measured based on the largest benefit that has a greater than 50 percent likelihood of being realized upon ultimate settlement. We report a liability for unrecognized tax benefits resulting from uncertain tax positions taken or expected to be taken in a tax return. We adjust these reserves in light of changing facts and circumstances, such as the closing of a tax audit or the refinement of an estimate. To the extent that the final tax outcome of these matters is different than the amounts recorded, such differences will impact the provision for income taxes in the period in which such determination is made. The provision for income taxes includes the impact of reserve provisions and changes to reserves that are considered appropriate, as well as the related net interest. We recognize interest and penalties related to unrecognized tax benefits within the income tax provision. Accrued interest and penalties are included within the related tax liability in the Consolidated Balance Sheets.
We file annual income tax returns in multiple taxing jurisdictions around the world. A number of years may elapse before an uncertain tax position is audited and finally resolved. While it is often difficult to predict the final outcome or the timing of resolution of any particular uncertain tax position, we believe that our related liability reflects the most likely outcome. We adjust the liability, as well as the related interest, in light of changing facts and circumstances. Settlement of any particular position could require the use of cash.
See Note 14 for additional information, including the Tax Cuts and Jobs Act enacted in December 2017.
53
FORMFACTOR, INC.
NOTES TO CONSOLIDATED FINANCIAL STATEMENTS (Continued)
Stock-Based Compensation
We recognize compensation expense for all stock-based awards based on the grant-date estimated fair values, net of an estimated forfeiture rate. The value of the portion of the award that is ultimately expected to vest is recognized as expense ratably over the requisite service periods in our Consolidated Statements of Operations. The fair value of stock options is measured using the Black-Scholes option pricing model, while the fair value for restricted stock units ("RSUs") is measured based on the closing market price of our common stock on the date of grant. The fair value of Performance RSUs ("PRSU") is based on certain market performance criteria is measured using the Monte Carlo simulation pricing model.
See Notes 12 and 13 for additional information.
Net Income (Loss) Per Share
Basic net income (loss) per share is computed by dividing net income (loss) by the weighted-average number of common shares outstanding for the period. Diluted net income (loss) per share is computed giving effect to all potentially dilutive common stock and common stock equivalents, including stock options, RSUs and common stock subject to repurchase.
The following table reconciles the shares used in calculating basic net income (loss) per share and diluted net income (loss) per share (in thousands):
|
|
Fiscal Year Ended
|
|||||||
|
|
December 29, 2018
|
December 30, 2017
|
December 31, 2016
|
|||||
|
Weighted-average shares used in computing basic net income (loss) per share
|
73,482
|
|
72,292
|
|
64,941
|
|
||
|
Add potentially dilutive securities
|
1,700
|
|
1,947
|
|
—
|
|
||
|
Weighted-average shares used in computing basic and diluted net income (loss) per share
|
75,182
|
|
74,239
|
|
64,941
|
|
||
The following securities were excluded from the calculation of diluted net income (loss) per share because their effect would have been anti-dilutive for the periods presented (in thousands):
|
|
Fiscal Year Ended
|
|||||||
|
|
December 29, 2018
|
December 30, 2017
|
December 31, 2016
|
|||||
|
Options to purchase common stock
|
—
|
|
—
|
|
2,198
|
|
||
|
Restricted stock units
|
—
|
|
1
|
|
3,113
|
|
||
|
Employee stock purchase plan
|
—
|
|
—
|
|
10
|
|
||
|
Total potentially dilutive securities
|
—
|
|
1
|
|
5,321
|
|
||
Accumulated Other Comprehensive Income
Accumulated other comprehensive income ("OCI") includes the following items, the impact of which has been excluded from earnings and reflected as components of stockholders' equity as shown below (in thousands):
|
December 29, 2018
|
December 30, 2017
|
||||||
|
Unrealized losses on marketable securities
|
$
|
(668
|
)
|
$
|
(660
|
)
|
|
|
Cumulative translation adjustments
|
918
|
|
2,983
|
|
|||
|
Unrealized gains on derivative instruments
|
367
|
|
698
|
|
|||
|
Unrealized gains on the translation of deferred tax assets
|
163
|
|
—
|
|
|||
|
Accumulated other comprehensive income
|
$
|
780
|
|
$
|
3,021
|
|
|
54
FORMFACTOR, INC.
NOTES TO CONSOLIDATED FINANCIAL STATEMENTS (Continued)
Note 3—Balance Sheet Components
Marketable Securities
Marketable securities consisted of the following (in thousands):
|
December 29, 2018
|
Amortized Cost
|
Gross Unrealized Gains
|
Gross Unrealized Losses
|
Fair Value
|
|||||||||||
|
U.S. Treasuries
|
$
|
7,997
|
|
$
|
1
|
|
$
|
(1
|
)
|
$
|
7,997
|
|
|||
|
Commercial paper
|
2,296
|
|
—
|
|
(1
|
)
|
2,295
|
|
|||||||
|
Corporate bond
|
30,833
|
|
1
|
|
(160
|
)
|
30,674
|
|
|||||||
|
Certificate of deposit
|
960
|
|
—
|
|
(3
|
)
|
957
|
|
|||||||
|
Agency securities
|
8,667
|
|
—
|
|
(59
|
)
|
8,608
|
|
|||||||
|
$
|
50,753
|
|
$
|
2
|
|
$
|
(224
|
)
|
$
|
50,531
|
|
||||
|
December 30, 2017
|
Amortized Cost
|
Gross Unrealized Gains
|
Gross Unrealized Losses
|
Fair Value
|
|||||||||||
|
U.S. Treasuries
|
$
|
3,968
|
|
$
|
—
|
|
$
|
(5
|
)
|
$
|
3,963
|
|
|||
|
Commercial paper
|
3,000
|
|
—
|
|
—
|
|
3,000
|
|
|||||||
|
Corporate bond
|
30,785
|
|
1
|
|
(150
|
)
|
30,636
|
|
|||||||
|
Certificate of deposit
|
960
|
|
—
|
|
(3
|
)
|
957
|
|
|||||||
|
Agency securities
|
10,489
|
|
—
|
|
(57
|
)
|
10,432
|
|
|||||||
|
$
|
49,202
|
|
$
|
1
|
|
$
|
(215
|
)
|
$
|
48,988
|
|
||||
We classify our marketable securities as available-for-sale. All marketable securities represent the investment of funds available for current operations, notwithstanding their contractual maturities. Such marketable securities are recorded at fair value and unrealized gains and losses are recorded in Accumulated other comprehensive income (loss) until realized.
We typically invest in highly-rated securities with low probabilities of default. Our investment policy requires investments to be rated single A or better, limits the types of acceptable investments, concentration as to security holder and duration of the investment. The gross unrealized gains and losses in fiscal
2018
and
2017
were caused primarily by changes in interest rates.
The longer the duration of marketable securities, the more susceptible they are to changes in market interest rates and bond yields. As yields increase, those securities with a lower yield-at-cost show a mark-to-market unrealized loss. We anticipate recovering the full cost of the securities either as market conditions improve, or as the securities mature. Accordingly, we believe that the unrealized losses are not other-than-temporary. When evaluating the investments for other-than-temporary impairment, we review factors such as the length of time and extent to which fair value has been below the amortized cost basis, current market liquidity, interest rate risk, the financial condition of the issuer, and credit rating downgrades. As of
December 29, 2018
and
December 30, 2017
,
$0.1 million
and
none
, respectively, of our investments had been in a continuous loss position for
12
months or more.
The contractual maturities of marketable securities were as follows (in thousands):
|
|
December 29, 2018
|
December 30, 2017
|
|||||||||||||
|
|
Amortized Cost
|
Fair Value
|
Amortized Cost
|
Fair Value
|
|||||||||||
|
Due in one year or less
|
$
|
35,269
|
|
$
|
35,172
|
|
$
|
23,009
|
|
$
|
22,966
|
|
|||
|
Due after one year to five years
|
15,484
|
|
15,359
|
|
26,193
|
|
26,022
|
|
|||||||
|
$
|
50,753
|
|
$
|
50,531
|
|
$
|
49,202
|
|
$
|
48,988
|
|
||||
See also Note 9.
55
FORMFACTOR, INC.
NOTES TO CONSOLIDATED FINANCIAL STATEMENTS (Continued)
Inventories, net
Inventories consisted of the following (in thousands):
|
|
December 29, 2018
|
December 30, 2017
|
|||||
|
Raw materials
|
$
|
43,380
|
|
$
|
33,101
|
|
|
|
Work-in-progress
|
20,431
|
|
20,134
|
|
|||
|
Finished goods
|
13,895
|
|
14,613
|
|
|||
|
$
|
77,706
|
|
$
|
67,848
|
|
||
Property, Plant and Equipment, net
Property, plant and equipment, net consisted of the following (in thousands):
|
December 29, 2018
|
December 30, 2017
|
||||||
|
Machinery and equipment
|
$
|
192,108
|
|
$
|
183,186
|
|
|
|
Computer equipment and software
|
32,906
|
|
32,841
|
|
|||
|
Furniture and fixtures
|
6,478
|
|
6,478
|
|
|||
|
Leasehold improvements
|
75,285
|
|
73,978
|
|
|||
|
Sub-total
|
306,777
|
|
296,483
|
|
|||
|
Less: Accumulated depreciation and amortization
|
(263,102
|
)
|
(255,755
|
)
|
|||
|
Net property, plant and equipment
|
43,675
|
|
40,728
|
|
|||
|
Construction-in-progress
|
10,379
|
|
6,026
|
|
|||
|
Total
|
$
|
54,054
|
|
$
|
46,754
|
|
|
In fiscal 2018 and 2017, asset impairment charges were immaterial. See Note 7 for a discussion of asset impairment charges recorded in fiscal 2016.
Accrued Liabilities
Accrued liabilities consisted of the following (in thousands):
|
December 29, 2018
|
December 30, 2017
|
||||||
|
Accrued compensation and benefits
|
$
|
15,600
|
|
$
|
18,141
|
|
|
|
Accrued employee stock purchase plan contributions withheld
|
3,174
|
|
3,279
|
|
|||
|
Accrued warranty
|
2,102
|
|
3,662
|
|
|||
|
Accrued income and other taxes
|
4,222
|
|
3,965
|
|
|||
|
Other accrued expenses
|
2,633
|
|
4,647
|
|
|||
|
$
|
27,731
|
|
$
|
33,694
|
|
||
Note 4—Acquisition
On June 24, 2016, we acquired Cascade Microtech pursuant to the Agreement and Plan of Merger dated as of February 3, 2016 (the “Merger Agreement”) between Cascade Microtech and Cardinal Merger Subsidiary, Inc., an Oregon corporation and our wholly owned subsidiary.
In accordance with the terms of the Merger Agreement, each outstanding share of Cascade Microtech common stock was canceled and converted into the right to receive
$16.00
in cash, without interest, and
0.6534
of a share of FormFactor common stock. At the effective time of the merger (the “Effective Time”), each in-the-money Cascade Microtech stock option, which was outstanding and vested prior to the Effective Time (or that vested as a result of the consummation of the merger), was canceled and converted into the right to receive an amount in cash equal to the excess, if any, of
$21.47
over the applicable per share exercise price of such option. Each out-of-the-money vested option to purchase shares of Cascade Microtech common stock was canceled without any cash payment. Also at the Effective Time, each Cascade Microtech RSU, which was outstanding and vested immediately prior
56
FORMFACTOR, INC.
NOTES TO CONSOLIDATED FINANCIAL STATEMENTS (Continued)
to the Effective Time (or that vested as a result of the consummation of the merger), was canceled and converted into the right to receive an amount of cash (without interest) equal to
$21.47
per share underlying such RSU.
Additionally, all of the equity awards originally granted by Cascade Microtech which were outstanding and unvested immediately prior to the consummation of the merger (and that did not vest as a result of the consummation of the merger) were assumed by us on substantially the same terms at the Effective Time, except that the number of shares of our common stock that underlie the assumed award and the exercise price of any assumed option were determined pursuant to a formula intended to preserve the intrinsic value of the original award, resulting in the assumption of stock options exercisable for an aggregate of
152,276
shares of our common stock and RUSs representing
777,444
shares of our common stock as of the acquisition date. The fair value of the stock options assumed was determined using a Black-Scholes valuation model with market-based assumptions. The fair value of the RSUs assumed was
$8.92
per unit, based on the FormFactor closing stock price on June 24, 2016. The fair value of unvested equity awards relating to future services, and not yet earned, is being recorded as operating expense over the remaining service periods. Option pricing models require the use of highly subjective market assumptions, including expected stock price volatility, which, if changed, can materially affect fair value estimates. See Note 12 for additional information.
The acquisition was accounted for using the acquisition method of accounting, with FormFactor treated as the acquirer. The acquired assets and liabilities of Cascade Microtech were recorded at their respective fair values including an amount for goodwill representing the difference between the acquisition consideration and the fair value of the identifiable net assets. As a result of the acquisition, Cascade Microtech shares ceased to trade on the NASDAQ Global Market effective June 24, 2016.
The total acquisition consideration of
$325.1 million
, net of cash acquired of
$40.7 million
, was determined based on the terms of the Merger Agreement which consisted of the following:
|
•
|
payment of
$255.9 million
in cash to former shareholders of Cascade Microtech;
|
|
•
|
issuance of
10,450,189
shares of FormFactor's common stock to former shareholders of Cascade Microtech, which was valued at the closing market price of
$8.92
per share on June 24, 2016 and amounted to
$93.2 million
in the aggregate;
|
|
•
|
payment of
$12.8 million
at the commencement of the third quarter of fiscal 2016, in cash, to Cascade Microtech outstanding and vested equity award holders; and
|
|
•
|
$3.9 million
attributable to the fair value of the assumed unvested equity awards for services performed by Cascade Microtech employees for the period leading up to the effective date of the acquisition.
|
During fiscal 2016, we incurred approximately
$6.5 million
in transaction costs related to the acquisition, which primarily consisted of investment banking, legal, accounting and valuation-related expenses. These expenses were recorded in Selling, general and administrative expense in the accompanying Consolidated Statements of Operations.
Our Consolidated Statements of Operations include the financial results of Cascade Microtech subsequent to the acquisition date of June 24, 2016.
To finance a portion of the acquisition consideration, we entered into a credit agreement with certain lenders to provide a senior secured term loan facility in an aggregate amount of
$150 million
. See Note 5 for additional information.
The acquisition price was allocated to the tangible and identified intangible assets acquired and liabilities assumed as of the closing date of the acquisition based upon their respective fair values. The fair values assigned to assets acquired and liabilities assumed were based on management’s best estimates and assumptions as of the reporting date.
57
FORMFACTOR, INC.
NOTES TO CONSOLIDATED FINANCIAL STATEMENTS (Continued)
The table below summarizes the assets acquired and liabilities assumed following the adjustments mentioned above (in thousands):
|
Amount
|
||||
|
Cash and cash equivalents
|
$
|
40,681
|
|
|
|
Accounts receivable
|
27,112
|
|
||
|
Inventory
|
38,315
|
|
||
|
Prepaid expenses and other current assets
|
6,249
|
|
||
|
Property, plant and equipment
|
19,875
|
|
||
|
Other long-term assets
|
818
|
|
||
|
Tangible assets acquired
|
133,050
|
|
||
|
Deferred revenue
|
(1,829
|
)
|
||
|
Accounts payable and accrued liabilities
|
(23,370
|
)
|
||
|
Deferred tax liabilities
|
(48,993
|
)
|
||
|
Other long-term liabilities
|
(960
|
)
|
||
|
Liabilities assumed
|
(75,152
|
)
|
||
|
Total tangible assets acquired and liabilities assumed
|
57,898
|
|
||
|
Intangible assets
|
149,753
|
|
||
|
Goodwill
|
158,141
|
|
||
|
Net assets acquired
|
$
|
365,792
|
|
|
The intangible assets as of the closing date of the acquisition included (in thousands):
|
Amount
|
Weighted Average Useful Life (in years)
|
|||||
|
Developed technologies
|
$
|
91,100
|
|
4.7
|
||
|
Customer relationships
|
23,053
|
|
6.8
|
|||
|
Order backlog
|
15,600
|
|
0.5
|
|||
|
Trade names
|
7,600
|
|
3.5
|
|||
|
In-process research and development
|
12,400
|
|
N/A
|
|||
|
Total intangible assets
|
$
|
149,753
|
|
4.1
|
||
Indications of fair value of the intangible assets acquired in connection with the acquisition were determined using either the income, market or replacement cost methodologies. The intangible assets are being amortized over periods which reflect the pattern in which economic benefits of the assets are expected to be realized. Order backlog has been fully amortized by the third quarter of fiscal 2017.
Identifiable Intangible Assets
Developed technologies acquired primarily consist of Cascade Microtech’s existing technologies related to engineering and production probes used in testing wafers, manufacturing wafer testing stations, thermal chuck systems, and reliability test systems. A Multi-Period Excess Earnings ("MPEE") Method was used to value the developed technologies. Along with the cash flow forecast associated with each developed technology, other key assumptions in MPEE method are remaining life of technology, technology migration pattern (or technology decay curve), level of R&D required to maintain the technology, discount rate and applicable tax rate. Using this approach, the estimated fair values were calculated using expected future cash flows from specific products discounted to their net present values at an appropriate risk-adjusted rate of return.
Customer relationships represent the fair value of future projected revenues that will be derived from the sale of products to Cascade Microtech's existing customers. The fair value of the customer relationships was determined based on the With and Without Method, which is appropriate for valuing non-primary customer-related assets for which reasonable estimates can be made for both the time and resources required to recreate those assets, as well as the economic impact over the period of time in which the assets are recreated. The Without scenario incorporates lost revenue and lost profits over the period necessary to retain the asset. Key assumptions in this valuation are attrition rate, time to recreate customer relationships, composition of costs into fixed versus variable costs, tax rates and discount rates.
58
FORMFACTOR, INC.
NOTES TO CONSOLIDATED FINANCIAL STATEMENTS (Continued)
Trade names and trademarks are considered a type of guarantee of a certain level of quality or performance represented by the brands owned, including the Cascade Microtech brand. Trade names and trademarks were valued using the Relief-from-Royalty Income approach. This method is based on the assumption that, in lieu of ownership, a market participant would be willing to pay a royalty in order to exploit the related benefits of this asset. Key assumptions involved in the valuation of trade names include royalty rate, expected utilization of the trade names, tax rates and discount rates.
In-process research and development ("IPR&D") represents the estimated fair value of incomplete Cascade Microtech research and development projects that had not reached commercialization stage and meet the criteria for recognition as IPR&D as of the date of the acquisition. The value of the IPR&D was determined to be
$12.4 million
and the amortization was to commence upon completion of the IPR&D projects. However, in the fourth quarter of fiscal 2016, we fully impaired this
$12.4 million
IPR&D intangible asset. See Note 7 for additional information.
Goodwill
The excess of purchase price over the fair value assigned to the assets acquired and liabilities assumed represents the amount of goodwill resulting from the acquisition. We believe the factors that contributed to goodwill include synergies that are specific to our consolidated business, such as cost savings and operational efficiencies, and the acquisition of a talented workforce that expands our expertise in business development and commercializing semiconductor test products, none of which qualify for recognition as a separate intangible asset. We do not expect any portion of this goodwill to be deductible for tax purposes. The goodwill attributable to the acquisition was recorded as a non-current asset and is not amortized, but is subject to an annual review for impairment.
The goodwill arising from the acquisition was allocated to our reporting units based on the relative fair values of the expected incremental cash flows that the acquisition is expected to provide to each reporting unit within our reportable segments.
Operating and Reporting Segments, and Reporting Units
Upon the acquisition of Cascade Microtech, we re-evaluated our
operating and reportable segments, as well as our reporting units, for goodwill impairment consideration. See Note 16 for additional information.
Pro Forma Consolidated Results of Operations
The following unaudited pro forma results of operations present the combined results of operations of FormFactor and Cascade Microtech as if the acquisition had been completed at the beginning of fiscal 2016. The pro forma information includes adjustments to amortization and depreciation for intangible assets and property, plant and equipment, adjustments to stock-based compensation expense, interest expense for the incremental indebtedness incurred, and interest income for the cash paid in connection with the transaction.
The pro forma results also include utilization of the net increase in the cost basis of acquired inventory and acquisition related expenses. The pro forma data are for informational purposes only and are not necessarily indicative of the consolidated results of operations of the combined business had the acquisition actually occurred at the beginning of fiscal 2016 or of the results of future operations of the combined business. Consequently, actual results may differ from the unaudited pro forma information presented below (in thousands, except per share data):
|
Fiscal Year Ended
|
||||
|
|
December 31, 2016
|
|||
|
Revenues
|
$
|
455,713
|
|
|
|
Net loss
|
(20,641
|
)
|
||
|
Net loss per share - basic
|
(0.27
|
)
|
||
|
Net loss per share - diluted
|
(0.27
|
)
|
||
Revenue related to Cascade Microtech since the acquisition date that was included in our Consolidated Statements of Operations for fiscal 2016 was
$83.5 million
. It was not practicable to calculate net income or loss attributed to Cascade Microtech included in our Consolidated Statements of Operations for fiscal 2016 due to integration.
59
FORMFACTOR, INC.
NOTES TO CONSOLIDATED FINANCIAL STATEMENTS (Continued)
Note 5—Debt
Term Loan
Our debt consisted of the following (in thousands):
|
December 29, 2018
|
December 30, 2017
|
||||||
|
Term loan
|
$
|
65,000
|
|
$
|
106,250
|
|
|
|
Less unamortized issuance costs
|
(189
|
)
|
(579
|
)
|
|||
|
Total debt less issuance costs
|
$
|
64,811
|
|
$
|
105,671
|
|
|
On June 24, 2016, we entered into a Credit Agreement (the “Credit Agreement”) with HSBC Bank USA, National Association ("HSBC"), as administrative agent, co-lead arranger, sole bookrunner and syndication agent, other lenders that may from time-to-time be a party to the Credit Agreement, and certain guarantors. Pursuant to the Credit Agreement, the lenders have provided us with a senior secured term loan facility of
$150 million
(the “Term Loan”). The proceeds of the Term Loan were used to finance a portion of the purchase price paid in connection with the Cascade Microtech acquisition and to pay related bank fees and expenses.
The Term Loan bears interest at a rate equal to, at our option, (i) the applicable London Interbank Offered Rate ("LIBOR") rate plus
2.00%
per annum or (ii) Base Rate (as defined in the Credit Agreement) plus
1.00%
per annum. We have initially elected to pay interest at
2.00%
over the one-month LIBOR rate. Interest payments are payable in quarterly installments over a
five
-year period. The interest rate at
December 29, 2018
was
4.35%
.
The principal payments on the Term Loan are paid in equal quarterly installments that began June 30, 2016, in an annual amount equal to
5%
for year one,
10%
for year two,
20%
for year three,
30%
for year four and
35%
for year five. In addition to quarterly installments, we made prepayments totaling
$15.0 million
in fiscal
2018
,
$20.0 million
in fiscal
2017
and
$5.0 million
in fiscal
2016
.
Future principal and interest payments as of
December 29, 2018
, based on the interest rate in effect at that date were as follows (in thousands):
|
Principal
|
Interest*
|
||||||
|
Fiscal year:
|
|||||||
|
2019
|
$
|
30,000
|
|
$
|
2,190
|
|
|
|
2020
|
35,000
|
|
556
|
|
|||
|
Total
|
$
|
65,000
|
|
$
|
2,746
|
|
|
* Represents interest payment commitment at
4.35%
per annum.
On July 25, 2016, we entered into an interest-rate swap agreement with HSBC and other lenders to hedge the interest payments on the Term Loan. See Note 8 for additional information.
The obligations under the Term Loan are fully and unconditionally guaranteed by certain of our existing and subsequently acquired or organized direct and indirect domestic subsidiaries and are secured by a perfected first priority security interest in substantially all of our assets and the assets of those guarantors, subject to certain customary exceptions.
The Credit Agreement contains negative covenants customary for financing of this type, including covenants that place limitations on the incurrence of additional indebtedness, the creation of liens, the payment of dividends; dispositions; fundamental changes, including mergers and acquisitions; loans and investments; sale leasebacks; negative pledges; transactions with affiliates; changes in fiscal year; sanctions and anti-bribery laws and regulations, and modifications to charter documents in a manner materially adverse to the Lenders. The Credit Agreement also contains affirmative covenants and representations and warranties customary for financing of this type.
In addition, the Credit Agreement contains financial maintenance covenants requiring:
|
•
|
a ratio of total debt to earnings before interest, taxes, depreciation and amortization ("EBITDA") not in excess of
2.50
to
1.00
; and
|
|
•
|
a fixed charge coverage ratio of not less than
1.50
to
1.00
, stepping down to
1.30
to
1.00
at the end of the fiscal quarter ended June 30, 2018 and to
1.20
to
1.00
at the end of the fiscal quarter ending June 30, 2019.
|
60
FORMFACTOR, INC.
NOTES TO CONSOLIDATED FINANCIAL STATEMENTS (Continued)
As of
December 29, 2018
, we were in compliance with all of the financial covenants.
The Credit Agreement contains customary events of default, including (subject to certain materiality thresholds and grace periods) payment default, failure to comply with covenants, material inaccuracy of representation or warranty, bankruptcy or insolvency proceedings, change of control, certain material Employee Retirement Security Act ("ERISA") events and cross event of default and cross-acceleration in respect of other material debt.
Note 6—Restructuring Charges
Restructuring charges are comprised of costs related to employee termination benefits, including stock-based compensation, cost of long-lived assets abandoned or impaired, as well as contract termination costs and are included in Restructuring and impairment charges, net in the Consolidated Statements of Operations.
Restructuring charges in fiscal 2018 were related to a specific product line within the Systems segment. Restructuring charges in fiscal 2017 and 2016 were related to the consolidation of Cascade Microtech into our operations. Restructuring charges in fiscal 2016 also included costs related to the consolidation of our sales operations.
The following table summarizes the activities related to the restructuring actions (in thousands):
|
Employee
Severance and Benefits |
Contract
Termination and Other Costs |
Stock-based Compensation
|
Total
|
||||||||||||
|
Accrual at December 26, 2015
|
$
|
2
|
|
$
|
—
|
|
$
|
—
|
|
$
|
2
|
|
|||
|
Restructuring charges
|
6,220
|
|
104
|
|
964
|
|
7,288
|
|
|||||||
|
Cash payments
|
(5,892
|
)
|
—
|
|
—
|
|
(5,892
|
)
|
|||||||
|
Non-cash settlements
|
—
|
|
—
|
|
(964
|
)
|
(964
|
)
|
|||||||
|
Accrual at December 31, 2016
|
330
|
|
104
|
|
—
|
|
434
|
|
|||||||
|
Restructuring charges
|
690
|
|
11
|
|
109
|
|
810
|
|
|||||||
|
Cash payments
|
(622
|
)
|
(109
|
)
|
—
|
|
(731
|
)
|
|||||||
|
Non-cash settlements
|
—
|
|
(5
|
)
|
(109
|
)
|
(114
|
)
|
|||||||
|
Accrual at December 30, 2017
|
398
|
|
1
|
|
—
|
|
399
|
|
|||||||
|
Restructuring charges
|
20
|
|
140
|
|
—
|
|
160
|
|
|||||||
|
Cash payments
|
(398
|
)
|
(1
|
)
|
—
|
|
(399
|
)
|
|||||||
|
Non-cash settlements
|
—
|
|
(140
|
)
|
—
|
|
(140
|
)
|
|||||||
|
Accrual at December 29, 2018
|
$
|
20
|
|
$
|
—
|
|
$
|
—
|
|
$
|
20
|
|
|||
Note 7—Impairment of Long-lived Assets
Impairment of long-lived assets was as follows (in thousands):
|
Fiscal Year Ended
|
||||||||||
|
December 29, 2018
|
December 30, 2017
|
December 31, 2016
|
||||||||
|
$
|
—
|
|
$
|
—
|
|
$
|
12,400
|
|
||
In fiscal 2016, we recorded an impairment charge of
$12.4 million
relating to an in-process research and development intangible asset acquired as part of our acquisition of Cascade Microtech. During the fourth quarter of fiscal 2016, and subsequent to the Cascade Microtech acquisition, we were informed by a customer that they had abandoned their project for which this intangible asset was being developed, and, therefore, we fully impaired this intangible asset as it had no alternative future use.
Long-lived asset impairment charges are included in Restructuring and impairment charges, net in the Consolidated Statements of Operations.
61
FORMFACTOR, INC.
NOTES TO CONSOLIDATED FINANCIAL STATEMENTS (Continued)
Note 8—Derivative Financial Instruments
Foreign Exchange Derivative Contracts
We operate and sell our products in various global markets. As a result, we are exposed to changes in foreign currency exchange rates. We utilize foreign currency forward contracts to hedge against future movements in foreign exchange rates that affect certain existing foreign currency denominated assets and liabilities and forecasted foreign currency revenue and expense transactions. Under this program, our strategy is to have increases or decreases in our foreign currency exposures mitigated by gains or losses on the foreign currency forward contracts in order to mitigate the risks and volatility associated with foreign currency transaction gains or losses.
We do not use derivative financial instruments for speculative or trading purposes. For accounting purposes, our foreign currency forward contracts are not designated as hedging instruments and, accordingly, we record the fair value of these contracts as of the end of our reporting period in our Consolidated Balance Sheets with changes in fair value recorded within
Other expense, net
in our Consolidated Statement of Operations for both realized and unrealized gains and losses.
The fair value of our foreign exchange derivative contracts was determined based on current foreign currency exchange rates and forward points. All of our foreign exchange derivative contracts outstanding at
December 29, 2018
will mature in the first quarter of fiscal
2019
.
The following table provides information about our foreign currency forward contracts outstanding as of
December 29, 2018
(in thousands):
|
Currency
|
Contract Position
|
Contract Amount (Local Currency)
|
Contract Amount (U.S. Dollars)
|
||||||
|
Euro
|
Sell
|
14,843
|
|
$
|
17,082
|
|
|||
|
Japanese Yen
|
Sell
|
1,185,877
|
|
10,758
|
|
||||
|
Total USD notional amount of outstanding foreign exchange contracts
|
$
|
27,840
|
|
||||||
Our foreign currency contracts are classified within Level 2 of the fair value hierarchy as they are valued using pricing models that utilize observable market inputs.
The location and amount of gains (losses) related to non-designated derivative instruments in the Consolidated Statements of Operations were as follows (in thousands):
|
|
Location of Gain (Loss) Recognized
on Derivatives |
Fiscal Year Ended
|
||||||||||||
|
Derivatives Not Designated as Hedging Instruments
|
December 29, 2018
|
December 30, 2017
|
December 31, 2016
|
|||||||||||
|
Foreign exchange forward contracts
|
Other expense, net
|
$
|
906
|
|
$
|
(2,505
|
)
|
$
|
(1,490
|
)
|
||||
Interest Rate Swaps
Pursuant to our interest rate and risk management strategy, on July 25, 2016 we entered into an interest rate swap agreement with HSBC and other lenders to hedge the interest payments on the Term Loan for the notional amount of
$95.6 million
. As future levels of LIBOR over the life of the loan are uncertain, we entered into these interest-rate swap agreements to hedge the exposure in interest rate risks associated with the movement in LIBOR rates. By entering into the agreements, we convert a floating rate interest at one-month LIBOR plus
2.00%
into a fixed rate interest at
2.94%
. As of
December 29, 2018
, the notional amount of the loan that is subject to this interest rate swap is
$60.0 million
. See Note 5 for additional information.
For accounting purposes, the interest-rate swap contracts qualify for and are designated as cash flow hedges. All hedging relationships are formally documented, and the hedges are designed to offset changes to future cash flows on hedged transactions. We evaluate hedge effectiveness at hedge inception and on an ongoing basis. Amounts expected to be reclassified from Other comprehensive income (loss) into earnings in the next twelve months were insignificant at
December 29, 2018
.
The fair value of our interest rate swap contracts is determined at the end of each reporting period based on valuation models that use interest rate yield curves as inputs. For accounting purposes, our interest rate swap contracts qualify for, and are designated as, cash flow hedges. The cash flows associated with the interest rate swaps are reported in Net cash provided by operating activities in our Consolidated Statements of Cash Flows.
62
FORMFACTOR, INC.
NOTES TO CONSOLIDATED FINANCIAL STATEMENTS (Continued)
The estimated fair value of the interest rate swaps as of
December 29, 2018
and
December 30, 2017
was reported as a derivative asset of approximately
$0.9 million
and
$1.0 million
, respectively, within Prepaid expenses and other current assets and Other assets in our Consolidated Balance Sheets.
The impact of the interest rate swaps on the Consolidated Statements of Operations was as follows (in thousands):
|
|
Amount of Gain or (Loss) Recognized in OCI on Derivative (Effective Portion)
|
Location of Gain or (Loss) Reclassified from Accumulated OCI into Income (Effective Portion)
|
Amount of Gain or (Loss) Reclassified from Accumulated OCI into Income (Effective Portion)
|
Location of Gain or (Loss) Recognized in Income on Derivative (Ineffective Portion )
|
Amount of Gain or (Loss) Recognized in Income on Derivative (Ineffective Portion )
|
|||||||||||
|
Fiscal 2018
|
$
|
340
|
|
Other expense, net
|
$
|
721
|
|
Other expense, net
|
$
|
—
|
|
|||||
|
Fiscal 2017
|
$
|
287
|
|
Other expense, net
|
$
|
84
|
|
Other expense, net
|
$
|
29
|
|
|||||
|
Fiscal 2016
|
$
|
628
|
|
Other expense, net
|
$
|
(160
|
)
|
Other expense, net
|
$
|
51
|
|
|||||
See also Note 9.
Note 9—Fair Value
Whenever possible, the fair values of our financial assets and liabilities are determined using quoted market prices of identical securities or quoted market prices of similar securities from active markets. The three levels of inputs that may be used to measure fair value are as follows:
|
•
|
Level 1 valuations are obtained from real-time quotes for transactions in active exchange markets involving identical securities;
|
|
•
|
Level 2 valuations utilize significant observable inputs, such as quoted prices for similar assets or liabilities, quoted prices near the reporting date in markets that are less active, or other inputs that are observable or can be corroborated by observable market data for substantially the full term of the assets or liabilities; and
|
|
•
|
Level 3 valuations utilize unobservable inputs to the valuation methodology and include our own data about assumptions market participants would use in pricing the asset or liability based on the best information available under the circumstances.
|
We did not have any transfers of assets or liabilities measured at fair value on a recurring basis to or from Level 1, Level 2 or Level 3 during fiscal
2018
,
2017
or
2016
.
The carrying values of Cash, Accounts receivable, net, Restricted cash, Prepaid expenses and other current assets, Accounts payable and Accrued liabilities approximate fair value due to their short maturities.
No changes were made to our valuation techniques during fiscal
2018
.
Cash Equivalents
The fair value of our cash equivalents is determined based on quoted market prices for similar or identical securities.
Marketable Securities
We classify our marketable securities as available-for-sale and value them utilizing a market approach. Our investments are priced by pricing vendors who provide observable inputs for their pricing without applying significant judgment. Broker pricing is used mainly when a quoted price is not available, the investment is not priced by our pricing vendors or when a broker price is more reflective of fair value. Our broker-priced investments are categorized as Level 2 investments because fair value is based on similar assets without applying significant judgments. In addition, all of our investments have a sufficient level of trading volume to demonstrate that the fair value is appropriate.
63
FORMFACTOR, INC.
NOTES TO CONSOLIDATED FINANCIAL STATEMENTS (Continued)
Assets Measured at Fair Value on a Recurring Basis
Assets measured at fair value on a recurring basis were as follows (in thousands):
|
December 29, 2018
|
Level 1
|
Level 2
|
Total
|
||||||||
|
Assets:
|
|
|
|
||||||||
|
Cash equivalents:
|
|
|
|
||||||||
|
Money market funds
|
$
|
1,184
|
|
$
|
—
|
|
$
|
1,184
|
|
||
|
Marketable securities:
|
|
|
|
|
|
||||||
|
U.S. Treasuries
|
7,997
|
|
—
|
|
7,997
|
|
|||||
|
Certificates of deposit
|
—
|
|
957
|
|
957
|
|
|||||
|
Agency securities
|
—
|
|
8,608
|
|
8,608
|
|
|||||
|
Corporate bonds
|
—
|
|
30,674
|
|
30,674
|
|
|||||
|
Commercial paper
|
—
|
|
2,295
|
|
2,295
|
|
|||||
|
|
7,997
|
|
42,534
|
|
50,531
|
|
|||||
|
Interest rate swap derivative contracts
|
—
|
|
871
|
|
871
|
|
|||||
|
Total assets
|
$
|
9,181
|
|
$
|
43,405
|
|
$
|
52,586
|
|
||
|
December 30, 2017
|
Level 1
|
Level 2
|
Total
|
||||||||
|
Assets:
|
|||||||||||
|
Cash equivalents:
|
|||||||||||
|
Money market funds
|
$
|
1,064
|
|
$
|
—
|
|
$
|
1,064
|
|
||
|
Corporate bonds
|
—
|
|
774
|
|
774
|
|
|||||
|
1,064
|
|
774
|
|
1,838
|
|
||||||
|
Marketable securities:
|
|||||||||||
|
U.S. Treasuries
|
3,963
|
|
—
|
|
3,963
|
|
|||||
|
Certificates of deposit
|
—
|
|
957
|
|
957
|
|
|||||
|
Agency securities
|
—
|
|
10,432
|
|
10,432
|
|
|||||
|
Corporate bonds
|
—
|
|
30,636
|
|
30,636
|
|
|||||
|
Commercial paper
|
—
|
|
3,000
|
|
3,000
|
|
|||||
|
3,963
|
|
45,025
|
|
48,988
|
|
||||||
|
Foreign exchange derivative contract
|
—
|
|
31
|
|
31
|
|
|||||
|
Interest rate swap derivative contracts
|
—
|
|
1,043
|
|
1,043
|
|
|||||
|
Total assets
|
$
|
5,027
|
|
$
|
46,873
|
|
$
|
51,900
|
|
||
We did
not
have any liabilities measured at fair value on a recurring basis at
December 29, 2018
or
December 30, 2017
.
Assets and Liabilities Measured at Fair Value on a Non-Recurring Basis
We measure and report goodwill and intangible assets at fair value on a non-recurring basis if we determine these assets to be impaired or in the period when we make a business acquisition. Other than as discussed in Note 4 and Note 7, there were
no
assets or liabilities measured at fair value on a nonrecurring basis during fiscal
2018
,
2017
or
2016
.
64
FORMFACTOR, INC.
NOTES TO CONSOLIDATED FINANCIAL STATEMENTS (Continued)
Note 10—Goodwill and Intangible Assets
Goodwill
Goodwill by reportable segment was as follows (in thousands):
|
Probe Cards
|
Systems
|
Total
|
||||||||||
|
Goodwill, gross, as of December 26, 2015
|
$
|
30,731
|
|
$
|
—
|
|
$
|
30,731
|
|
|||
|
Additions - Cascade Microtech acquisition
|
141,751
|
|
16,390
|
|
158,141
|
|
||||||
|
Foreign currency translation
|
—
|
|
(862
|
)
|
(862
|
)
|
||||||
|
Goodwill, gross, as of December 31, 2016
|
172,482
|
|
15,528
|
|
188,010
|
|
||||||
|
Foreign currency translation
|
—
|
|
1,910
|
|
1,910
|
|
||||||
|
Goodwill, gross, as of December 30, 2017
|
172,482
|
|
17,438
|
|
189,920
|
|
||||||
|
Foreign currency translation
|
—
|
|
(706
|
)
|
(706
|
)
|
||||||
|
Goodwill, gross, as of December 29, 2018
|
$
|
172,482
|
|
$
|
16,732
|
|
$
|
189,214
|
|
|||
We have
not
recorded any goodwill impairments as of
December 29, 2018
.
Intangible Assets
Intangible assets were as follows (in thousands):
|
December 29, 2018
|
December 30, 2017
|
|||||||||||||||||||||||
|
Other Intangible Assets
|
Gross
|
Accumulated Amortization
|
Net
|
Gross
|
Accumulated Amortization
|
Net
|
||||||||||||||||||
|
Existing developed technologies
|
$
|
143,408
|
|
$
|
97,111
|
|
$
|
46,297
|
|
$
|
143,966
|
|
$
|
76,826
|
|
$
|
67,140
|
|
||||||
|
Trade name
|
12,023
|
|
9,173
|
|
2,850
|
|
12,086
|
|
5,735
|
|
6,351
|
|
||||||||||||
|
Customer relationships
|
40,146
|
|
21,653
|
|
18,493
|
|
40,313
|
|
16,320
|
|
23,993
|
|
||||||||||||
|
Backlog
|
—
|
|
—
|
|
—
|
|
15,811
|
|
15,811
|
|
—
|
|
||||||||||||
|
$
|
195,577
|
|
$
|
127,937
|
|
$
|
67,640
|
|
$
|
212,176
|
|
$
|
114,692
|
|
$
|
97,484
|
|
|||||||
Amortization expense was included in our Consolidated Statements of Operations as follows (in thousands):
|
Fiscal Year Ended
|
||||||||||||
|
December 29,
2018 |
December 30,
2017 |
December 31,
2016 |
||||||||||
|
Cost of revenues
|
$
|
20,530
|
|
$
|
22,800
|
|
$
|
30,039
|
|
|||
|
Selling, general and administrative
|
8,843
|
|
8,140
|
|
5,388
|
|
||||||
|
$
|
29,373
|
|
$
|
30,940
|
|
$
|
35,427
|
|
||||
The estimated future amortization of intangible assets is as follows (in thousands):
|
Fiscal Year
|
Amount
|
|||
|
2019
|
$
|
26,387
|
|
|
|
2020
|
23,377
|
|
||
|
2021
|
12,628
|
|
||
|
2022
|
3,206
|
|
||
|
2023
|
2,042
|
|
||
|
Total
|
$
|
67,640
|
|
|
We did
not
record any impairment of intangible assets in fiscal
2018
or
2017
. In fiscal
2016
, we recorded an impairment charge of
$12.4 million
relating to an in-process research and development intangible asset acquired as part of our acquisition of Cascade Microtech. See Note 7 for additional information.
65
FORMFACTOR, INC.
NOTES TO CONSOLIDATED FINANCIAL STATEMENTS (Continued)
Note 11—Commitments and Contingencies
Leases
We lease facilities under non-cancellable operating leases with various expiration dates through 2027. The facilities generally require us to pay property taxes, insurance and maintenance costs. Further, several lease agreements contain rent escalation clauses or rent holidays. For purposes of recognizing minimum rental expenses on a straight-line basis over the terms of the leases, we use the date of initial possession to begin amortization. We have the option to extend or renew most of our leases which may increase the future minimum lease commitments.
Rent expense for fiscal
2018
,
2017
and
2016
was
$8.4 million
,
$7.9 million
and
$6.5 million
, respectively.
Future minimum payments under our non-cancelable operating leases were as follows as of
December 29, 2018
(in thousands):
|
Fiscal year:
|
Amount
|
|||
|
2019
|
$
|
6,256
|
|
|
|
2020
|
6,522
|
|
||
|
2021
|
5,742
|
|
||
|
2022
|
4,786
|
|
||
|
2023
|
4,355
|
|
||
|
Thereafter
|
20,382
|
|
||
|
Total
|
$
|
48,043
|
|
|
Environmental Matters
We are subject to U.S. federal, state, local, and foreign governmental laws and regulations relating to the protection of the environment, including those governing the discharge of pollutants into the air and water, the management and disposal of hazardous substances and wastes, the clean-up of contaminated sites and the maintenance of a safe workplace. We believe that we comply in all material respects with the environmental laws and regulations that apply to us. We did not receive any notices of violations of environmental laws and regulations in fiscal
2018
,
2017
or
2016
. In the future, we may receive notices of violations of environmental regulations, or otherwise learn of such violations. Environmental contamination or violations may negatively impact our business.
Indemnification Arrangements
We have entered, and may from time to time in the ordinary course of our business enter, into contractual arrangements with third parties that include indemnification obligations. Under these contractual arrangements, we have agreed to defend, indemnify and/or hold the third party harmless from and against certain liabilities. These arrangements include indemnities in favor of customers in the event that our products or services infringe a third party's intellectual property or cause property or other indemnities in favor of our lessors in connection with facility leasehold liabilities that we may cause. In addition, we have entered into indemnification agreements with our directors and certain of our officers, and our bylaws contain indemnification obligations in favor of our directors, officers and agents. These indemnity arrangements may limit the type of the claim, the total amount that we can be required to pay in connection with the indemnification obligation and the time within which an indemnification claim can be made. The duration of the indemnification obligation may vary, and for most arrangements, survives the agreement term and is indefinite. We believe that substantially all of our indemnity arrangements provide either for limitations on the maximum potential future payments we could be obligated to make, or for limitations on the types of claims and damages we could be obligated to indemnify, or both. However, it is not possible to determine or reasonably estimate the maximum potential amount of future payments under these indemnification obligations due to the varying terms of such obligations, a lack of history of prior indemnification claims, the unique facts and circumstances involved in each particular contractual arrangement and in each potential future claim for indemnification, and the contingency of any potential liabilities upon the occurrence of events that are not reasonably determinable. We have not had any material requests for indemnification under these arrangements. We have not recorded any liabilities for these indemnification arrangements on our Consolidated Balance Sheets as of
December 29, 2018
or
December 30, 2017
.
Legal Matters
From time to time, we may be subject to legal proceedings and claims in the ordinary course of business. As of
December 29, 2018
, and as of the filing of these financial statements, we were not involved in any material legal proceedings. In the future, we may become a party to additional legal proceedings that may require us to spend significant resources. Litigation can be expensive and disruptive to normal business operations. The results of legal proceedings are difficult to predict, and the costs incurred in litigation can be substantial, regardless of outcome.
66
FORMFACTOR, INC.
NOTES TO CONSOLIDATED FINANCIAL STATEMENTS (Continued)
In August 2013, a former employee filed a class action lawsuit against us in the Superior Court of California for the County of Alameda alleging violations of California’s wage and hour laws and other claims on behalf of himself and all similarly situated current and former employees at our Livermore facilities. On August 25, 2017, the court granted final approval of the parties’ agreement to settle the lawsuit. The settlement provided for payment by us of
$1.5 million
, which was accrued as of December 31, 2016 and paid during the third quarter of fiscal 2017.
Note 12—Stockholders' Equity
Preferred Stock
We have authorized
10,000,000
shares of undesignated preferred stock,
$0.001
par value, none of which is issued and outstanding. Our Board of Directors shall determine the rights, preferences, privileges and restrictions of the preferred stock, including dividends rights, conversion rights, voting rights, terms of redemption, liquidation preferences, sinking fund terms and the number of shares constituting any series or the designation of any series.
Common Stock
Each share of common stock has the right to one vote. The holders of common stock are also entitled to receive dividends whenever funds are legally available and when declared by the Board of Directors, subject to the prior rights of holders, if any, of all classes of stock outstanding having priority rights as to dividends.
No
dividends have been declared or paid as of
December 29, 2018
.
Common Stock Repurchase Program
On April 16, 2015, our Board of Directors authorized a program to repurchase up to
$25.0 million
of outstanding common stock on the open market and which expired on April 15, 2016. During fiscal 2015, we repurchased and retired
1,013,162
shares of common stock for approximately
$8.2 million
. During fiscal 2016, we did not repurchase any shares under this program.
In February 2017, our Board of Directors authorized a program to repurchase up to
$25 million
of outstanding common stock to offset potential dilution from issuances of common stock under our stock-based incentive plans. The share repurchase program will expire on February 1, 2020. During fiscal 2018, we did not repurchase any shares. During fiscal 2017, we repurchased
1,367,617
shares of common stock for
$19.0 million
and, as of
December 29, 2018
,
$6.0 million
remained available for future repurchases.
Repurchased shares are retired upon the settlement of the related trade transactions. Our policy related to repurchases of our common stock is to charge the excess of cost over par value to additional paid-in capital. All repurchases were made in compliance with Rule 10b-18 under the Securities Exchange Act of 1934, as amended.
Equity Incentive Plan
We currently grant equity-based awards under our Equity Incentive Plan, as amended (the "2012 Plan") which was approved by our stockholders. As amended, the 2012 Plan has authorized for issuance a total of
17.9 million
shares,
4.9 million
of which were available for grant as of
December 29, 2018
.
RSUs granted under the 2012 Plan generally vest over
three
years in annual tranches, though we have granted, and will continue to grant, such awards that vest over a shorter term for employee retention purposes.
The 2012 Plan provides that incentive stock options may be granted to our employees and nonqualified stock options, and all awards other than incentive stock options, may be granted to employees, directors and consultants. The exercise price of incentive stock options must be at least equal to the fair market value of our common stock on the date of grant. All restricted stock units and options granted under the 2012 Plan generally vest over
three
years and expire after
seven
years, unless otherwise determined by the Compensation Committee of the Board of Directors.
67
FORMFACTOR, INC.
NOTES TO CONSOLIDATED FINANCIAL STATEMENTS (Continued)
Stock Options
Stock option activity was as follows:
|
|
Outstanding Options
|
|
||||||||||
|
|
Number of
Shares |
Weighted
Average Exercise Price |
Weighted
Average Remaining Contractual Life in Years |
Aggregate
Intrinsic Value |
||||||||
|
Outstanding at December 30, 2017
|
659,334
|
|
$
|
8.12
|
|
|
|
|
||||
|
Options exercised
|
(134,609
|
)
|
8.60
|
|
|
|
|
|||||
|
Outstanding at December 29, 2018
|
524,725
|
|
$
|
8.00
|
|
3.1
|
$
|
3,155,659
|
|
|||
|
Vested and expected to vest at December 29, 2018
|
524,725
|
|
$
|
8.00
|
|
3.1
|
$
|
3,155,659
|
|
|||
|
Exercisable at December 29, 2018
|
401,105
|
|
$
|
7.94
|
|
3.0
|
$
|
2,435,515
|
|
|||
Restricted Stock Units
RSUs are converted into shares of our common stock upon vesting on a one-for-one basis. The vesting of RSUs is subject to the employee's continuing service. RSU activity was as follows:
|
Number of
Shares |
Weighted
Average Grant Date Fair Value |
|||||
|
Restricted stock units at December 30, 2017
|
3,148,061
|
|
$
|
11.22
|
|
|
|
Granted
|
1,551,770
|
|
13.79
|
|
||
|
Vested
|
(1,287,107
|
)
|
10.43
|
|
||
|
Canceled
|
(310,498
|
)
|
11.66
|
|
||
|
Restricted stock units at December 29, 2018
|
3,102,226
|
|
12.79
|
|
||
Performance Restricted Stock Units
The Performance RSUs ("PRSU") granted in fiscal
2018
,
2017
and
2016
listed below vest based on us achieving certain market performance criteria. The performance criteria are based on a metric called Total Shareholder Return ("TSR") for the performance period of
two
or
three
years, relative to the TSR of the companies identified as being part of the S&P Semiconductor Select Industry Index (FormFactor peer companies) as of a specific date.
PRSU activity was as follows:
|
Fiscal Year Ended
|
||||||
|
December 29, 2018
|
December 30, 2017
|
December 31, 2016
|
||||
|
Grant Date
|
August 16, 2018
|
July 20, 2017
|
August 19, 2016
|
|||
|
Performance period
|
July 1, 2018 - June 30, 2021
|
July 1, 2017 - June 30, 2020
|
April 1, 2016 - March 31, 2019
|
|||
|
Number of shares
|
318,100
|
333,333
|
195,000
|
|||
|
TSR as-of date
|
August 16, 2018
|
July 1, 2017
|
April 1, 2016
|
|||
|
Stock-based compensation
|
$4.7 million
|
$4.1 million
|
$2.0 million
|
|||
Employee Stock Purchase Plan
Our 2012 Employee Stock Purchase Plan (the "ESPP"), as amended, allows for the issuance of a total of
7,000,000
shares. The offering periods under the ESPP are 12 months commencing on February 1 of each calendar year and ending on January 31 of the subsequent calendar year, and a six-month fixed offering period commencing on August 1 of each calendar year and ending on January 31 of the subsequent calendar year. The 12-month offering period consists of
two
six-month purchase periods and the six-month offering period consists of
one
six-month purchase period. The price of the common stock purchased is
85%
of the lesser of the fair market value of the common stock on the first day of the applicable offering period or the last day of each purchase period.
During fiscal
2018
, employees purchased
610,297
shares under this program at a weighted average exercise price of
$12.84
per share, which represented a weighted average discount of
$2.82
per share from the fair value of the stock purchased. As of
December 29, 2018
,
3,201,493
shares remained available for issuance.
68
FORMFACTOR, INC.
NOTES TO CONSOLIDATED FINANCIAL STATEMENTS (Continued)
Note 13—Stock-Based Compensation
Stock-Based Compensation Expense
Certain information regarding our stock-based compensation was as follows (in thousands, except per share amounts):
|
Fiscal Year Ended
|
|||||||||||
|
December 29, 2018
|
December 30, 2017
|
December 31, 2016
|
|||||||||
|
Weighted average grant date per share fair value of stock options granted
|
$
|
—
|
|
$
|
—
|
|
$
|
2.00
|
|
||
|
Weighted average grant date per share fair value of RSUs granted
|
13.79
|
|
13.20
|
|
8.20
|
|
|||||
|
Total intrinsic value of stock options exercised
|
631
|
|
5,946
|
|
558
|
|
|||||
|
Fair value of RSUs vested
|
17,541
|
|
18,339
|
|
12,441
|
|
|||||
Stock-based compensation expense was included in the Consolidated Statement of Operations as follows (in thousands):
|
|
Fiscal Year Ended
|
||||||||||
|
|
December 29, 2018
|
December 30, 2017
|
December 31, 2016
|
||||||||
|
Stock-based compensation expense included in:
|
|||||||||||
|
Cost of revenues
|
$
|
3,525
|
|
$
|
3,539
|
|
$
|
2,518
|
|
||
|
Research and development
|
5,398
|
|
5,341
|
|
3,329
|
|
|||||
|
Selling, general and administrative
|
8,904
|
|
7,350
|
|
4,875
|
|
|||||
|
Restructuring and impairment charges, net
|
—
|
|
109
|
|
964
|
|
|||||
|
Total stock-based compensation
|
$
|
17,827
|
|
$
|
16,339
|
|
$
|
11,686
|
|
||
Unrecognized Stock-Based Compensation Expense
Unrecognized stock-based compensation expense at
December 29, 2018
consisted of the following (in thousands):
|
Amount
|
Weighted Average Recognition Period (Years)
|
|||||
|
Stock Options
|
$
|
53
|
|
0.1
|
||
|
RSUs
|
29,871
|
|
2.1
|
|||
|
ESPP
|
243
|
|
0.1
|
|||
Valuation Assumptions
The following assumptions were used in estimating the fair value of options awarded and Employee Stock Purchase Plan:
|
|
Fiscal Year Ended
|
|||||||
|
December 29, 2018
|
December 30, 2017
|
December 31, 2016
|
||||||
|
2012 Equity Incentive Plan:
|
||||||||
|
Dividend yield
|
—
|
%
|
—
|
%
|
—
|
%
|
||
|
Expected volatility
|
—
|
%
|
—
|
%
|
43.76
|
%
|
||
|
Risk-free interest rate
|
—
|
%
|
—
|
%
|
1.57
|
%
|
||
|
Expected life (in years)
|
0
|
|
0
|
|
5.5
|
|
||
|
Employee Stock Purchase Plan:
|
|
|
|
|||||
|
Dividend yield
|
—
|
%
|
—
|
%
|
—
|
%
|
||
|
Expected volatility
|
44.85%-48.94%
|
|
46.20%-46.33%
|
|
43.76%-46.48%
|
|
||
|
Risk-free interest rate
|
0.83%-2.22%
|
|
0.65%-1.15%
|
|
0.40%-0.47%
|
|
||
|
Expected life (in years)
|
0.5-1.0
|
|
0.5-1.0
|
|
0.5-1.0
|
|
||
69
FORMFACTOR, INC.
NOTES TO CONSOLIDATED FINANCIAL STATEMENTS (Continued)
Note 14—Income Taxes
Components of Income (Loss) Before Income Taxes
The components of income (loss) before income taxes were as follows (in thousands):
|
|
Fiscal Year Ended
|
||||||||||
|
|
December 29, 2018
|
December 30, 2017
|
December 31, 2016
|
||||||||
|
United States
|
$
|
20,877
|
|
$
|
31,492
|
|
$
|
(50,947
|
)
|
||
|
Foreign
|
13,050
|
|
10,714
|
|
752
|
|
|||||
|
$
|
33,927
|
|
$
|
42,206
|
|
$
|
(50,195
|
)
|
|||
Provision for Income Taxes
The components of the provision for income taxes are as follows (in thousands):
|
|
Fiscal Year Ended
|
||||||||||
|
|
December 29, 2018
|
December 30, 2017
|
December 31, 2016
|
||||||||
|
Current provision (benefit):
|
|
|
|
||||||||
|
Federal
|
$
|
79
|
|
$
|
(2,130
|
)
|
$
|
—
|
|
||
|
State
|
388
|
|
17
|
|
120
|
|
|||||
|
Foreign
|
4,687
|
|
4,069
|
|
1,804
|
|
|||||
|
5,154
|
|
1,956
|
|
1,924
|
|
||||||
|
Deferred provision (benefit):
|
|
|
|
||||||||
|
Federal
|
(72,295
|
)
|
66
|
|
(42,150
|
)
|
|||||
|
State
|
(2,056
|
)
|
—
|
|
(2,165
|
)
|
|||||
|
Foreign
|
(912
|
)
|
(729
|
)
|
(1,247
|
)
|
|||||
|
(75,263
|
)
|
(663
|
)
|
(45,562
|
)
|
||||||
|
Total provision (benefit) for income taxes
|
$
|
(70,109
|
)
|
$
|
1,293
|
|
$
|
(43,638
|
)
|
||
Tax Rate Reconciliation
The following is a reconciliation of the difference between income taxes computed by applying the federal statutory rate of
21%
for fiscal 2018 and for our deferred tax provision in fiscal 2017 and
35%
for the current tax provision in fiscal 2017 and for the entire tax provision (benefit) in fiscal 2016 (in thousands):
|
|
Fiscal Year Ended
|
||||||||||
|
|
December 29, 2018
|
December 30, 2017
|
December 31, 2016
|
||||||||
|
U.S. statutory federal tax rate
|
$
|
7,125
|
|
$
|
14,772
|
|
$
|
(17,568
|
)
|
||
|
State taxes, net of federal benefit
|
778
|
|
951
|
|
(975
|
)
|
|||||
|
Stock-based compensation
|
(453
|
)
|
(1,428
|
)
|
1,256
|
|
|||||
|
Research and development credits
|
(3,213
|
)
|
(1,979
|
)
|
(1,654
|
)
|
|||||
|
Foreign taxes at rates different than the U.S.
|
1,287
|
|
(271
|
)
|
504
|
|
|||||
|
Other permanent differences
|
152
|
|
160
|
|
2,048
|
|
|||||
|
Global intangible low-taxed income
|
1,828
|
|
—
|
|
—
|
|
|||||
|
Mandatory deemed repatriation
|
—
|
|
1,655
|
|
—
|
|
|||||
|
Change in valuation allowance
|
(75,803
|
)
|
(12,207
|
)
|
(27,120
|
)
|
|||||
|
Other
|
(1,810
|
)
|
(360
|
)
|
(129
|
)
|
|||||
|
Total
|
$
|
(70,109
|
)
|
$
|
1,293
|
|
$
|
(43,638
|
)
|
||
Deferred Tax Assets and Liabilities
Deferred tax assets and liabilities are recognized for the future tax consequences of differences between the carrying amounts of assets and liabilities and their respective tax basis using enacted tax rates in effect for the year in which the differences are expected to be reversed.
70
FORMFACTOR, INC.
NOTES TO CONSOLIDATED FINANCIAL STATEMENTS (Continued)
Significant deferred tax assets and liabilities consisted of the following (in thousands):
|
|
As of
|
||||||
|
|
December 29, 2018
|
December 30, 2017
|
|||||
|
Tax credits
|
$
|
39,586
|
|
$
|
35,484
|
|
|
|
Inventory reserve
|
10,850
|
|
10,763
|
|
|||
|
Other reserves and accruals
|
5,398
|
|
5,667
|
|
|||
|
Non-statutory stock options
|
2,722
|
|
2,642
|
|
|||
|
Depreciation and amortization
|
1,979
|
|
3,677
|
|
|||
|
Net operating loss carryforwards
|
61,275
|
|
70,457
|
|
|||
|
Gross deferred tax assets
|
121,810
|
|
128,690
|
|
|||
|
Valuation allowance
|
(34,037
|
)
|
(109,840
|
)
|
|||
|
Total deferred tax assets
|
87,773
|
|
18,850
|
|
|||
|
Acquired intangibles and fixed assets
|
(12,667
|
)
|
(18,921
|
)
|
|||
|
Unrealized investment gains
|
(107
|
)
|
(109
|
)
|
|||
|
Tax on undistributed earnings
|
(53
|
)
|
(66
|
)
|
|||
|
Total deferred tax liabilities
|
(12,827
|
)
|
(19,096
|
)
|
|||
|
Net deferred tax assets (liabilities)
|
$
|
74,946
|
|
$
|
(246
|
)
|
|
We are required to evaluate the realizability of our deferred tax assets in both our U.S. and non-U.S. jurisdictions on an ongoing basis to determine whether there is a need for a valuation allowance with respect to such deferred tax assets. From the fourth quarter of fiscal year 2009 to the third quarter of fiscal year 2018, we maintained a 100% valuation allowance against most of our U.S. deferred tax assets because there was insufficient positive evidence to overcome the existing negative evidence such that it was not more likely than not that the U.S. deferred tax assets were realizable. While we reported U.S. pre-tax income in fiscal year 2015 and 2017, because we reported U.S. pre-tax losses during the previous seven fiscal years, we continued to maintain the 100% valuation allowance through the third quarter of fiscal year 2018.
As of December 29, 2018, we had reported positive operating performance in the U.S. for two consecutive fiscal years and had also reported a cumulative three-year U.S. pre-tax profit. In addition, during the fourth quarter of fiscal year 2018, we completed our financial plan for fiscal year 2019 and expect continued positive operating performance in the U.S. We also considered forecasts of future taxable income and evaluated the utilization of net operating losses and tax credit carryforwards prior to their expiration. After considering these factors, we determined that the positive evidence overcame any negative evidence and concluded that it was more likely than not that the U.S. deferred tax assets were realizable. As a result, we released the valuation allowance against a significant portion of the U.S. federal deferred tax assets and a portion of the U.S. state deferred tax assets during the fourth quarter of fiscal year 2018.
The valuation allowance decreased by
$75.8 million
in fiscal year 2018, primarily due to the release of the valuation allowance on U.S. deferred tax assets. As of December 29, 2018, we maintained a valuation allowance of
$34.0 million
, primarily related to California deferred tax assets and foreign tax credit carryovers, due to uncertainty about the future realization of these assets.
In accordance with rates specified in The Tax Cuts and Jobs Act (“the Tax Act”), we revalued our net deferred tax asset at
21%
in the fourth quarter of fiscal 2017, which resulted in a reduction in the value of our net deferred tax asset of
$31.3 million
, which was offset by a corresponding decrease in the valuation allowance and did not impact our Statements of Operations in fiscal
2017
.
71
FORMFACTOR, INC.
NOTES TO CONSOLIDATED FINANCIAL STATEMENTS (Continued)
Tax Credits and Carryforwards
Tax credits and carryforwards available to us at
December 29, 2018
consisted of the following (in thousands):
|
Amount
|
Latest Expiration Date
|
|||||
|
Federal research and development tax credit
|
$
|
33,837
|
|
2021-2038
|
||
|
Federal net operating loss carryforwards
|
201,484
|
|
2030-2035
|
|||
|
Foreign tax credit carryforwards
|
1,325
|
|
2019-2028
|
|||
|
Alternative minimum tax credits
|
391
|
|
Indefinite
|
|||
|
California research credits
|
32,964
|
|
Indefinite
|
|||
|
Oregon research credits
|
281
|
|
2019-2022
|
|||
|
State net operating loss carryforwards
|
250,873
|
|
2024-2036
|
|||
|
Singapore net operating loss carryforwards
|
8,949
|
|
Indefinite
|
|||
Undistributed Earnings
As of
December 29, 2018
, unremitted earnings of foreign subsidiaries was estimated at
$18.4 million
and were subject to U.S. federal income tax due to the Tax Act one-time transition tax on the deemed repatriation of undistributed foreign earnings and profits. The enactment of the Tax Act also resulted in a reassessment of the permanent reinvestment of undistributed foreign earnings. We intend to permanently invest
$12.0 million
of undistributed earnings indefinitely outside of the U.S. To the extent we repatriate the remaining
$6.4 million
of undistributed foreign earnings to the U.S., we established a deferred tax liability of
$53 thousand
for foreign withholding taxes. Our estimates are provisional and subject to further analysis.
Unrecognized Tax Benefits
We recognize the benefits of tax return positions if we determine that the positions are “more-likely-than-not” to be sustained by the taxing authority. Interest and penalties accrued on unrecognized tax benefits are recorded as tax expense in the period incurred.
The following table reflects changes in the unrecognized tax benefits (in thousands):
|
|
Fiscal Year Ended
|
||||||||||
|
|
December 29, 2018
|
December 30, 2017
|
December 31, 2016
|
||||||||
|
Unrecognized tax benefit, beginning balance
|
$
|
18,296
|
|
$
|
17,978
|
|
$
|
17,033
|
|
||
|
Additions based on tax positions related to the current year
|
1,677
|
|
694
|
|
614
|
|
|||||
|
Additions based on tax positions from prior years
|
5,332
|
|
—
|
|
450
|
|
|||||
|
Reductions for tax positions of prior years
|
(7
|
)
|
—
|
|
—
|
|
|||||
|
Reductions due to lapse of the applicable statute of limitations
|
(74
|
)
|
(376
|
)
|
(119
|
)
|
|||||
|
Unrecognized tax benefit, ending balance
|
$
|
25,224
|
|
$
|
18,296
|
|
$
|
17,978
|
|
||
|
Interest and penalties recognized as a component of Provision (benefit) for income taxes
|
$
|
71
|
|
$
|
67
|
|
$
|
22
|
|
||
|
Interest and penalties accrued at period end
|
230
|
218
|
209
|
|
|||||||
Of the unrecognized tax benefits at
December 29, 2018
,
$12.3 million
would impact the effective tax rate if recognized.
The amount of income taxes we pay is subject to ongoing audits by federal, state and foreign tax authorities which might result in proposed assessments. Our estimate for the potential outcome for any uncertain tax issue is judgmental in nature. However, we believe we have adequately provided for any reasonably foreseeable outcome related to those matters. Our future results may include favorable or unfavorable adjustments to our estimated tax liabilities in the period the assessments are made or resolved or when statutes of limitation on potential assessments expire. As of
December 29, 2018
, changes to our uncertain tax positions in the next
12
months that are reasonably possible are not expected to have a significant impact on our financial position or results of operations.
We file income tax returns in the U.S. federal jurisdiction, various states and non U.S. jurisdictions. Our significant income tax jurisdictions are the U.S. (federal), California, Oregon, Germany and Japan. As a result of our net operating loss carryforwards, the statute of limitations is open for audit for tax years 2007 and forward for U.S. federal purposes, 2008 and forward for California
72
FORMFACTOR, INC.
NOTES TO CONSOLIDATED FINANCIAL STATEMENTS (Continued)
purposes and 2015 and forward for Oregon purposes. For Germany, the statute of limitations is open for audit for tax years 2014 and forward. For Japan, the statute of limitations is open for audit for tax years 2013 and forward.
Tax Cuts and Jobs Act of 2017
The Tax Act was enacted in December 2017. The Tax Act significantly changes U.S. tax law effective January 1, 2018 by, among other things, lowering U.S. corporate income tax rates from
35%
to
21%
, repealing corporate alternative minimum tax, implementing a territorial tax system and imposing a one-time transition tax on deemed repatriated earnings of foreign subsidiaries.
The Tax Act provided for the repeal of corporate alternative minimum tax and made AMT tax credits fully refundable in future years. As a result, we reassessed the realizability of our deferred tax assets and released the valuation allowance against
$0.8 million
of AMT tax credits at December 30, 2017.
Deferred tax assets and liabilities are measured using enacted tax rates expected to apply to taxable income in the years in which those temporary differences are expected to reverse. As a result of the reduction in the U.S. corporate income tax rate, we revalued our ending U.S. deferred tax assets at December 30, 2017, offset by a corresponding change in the U.S. valuation allowance with no material impact to the fiscal 2017 tax provision.
The Tax Act provided for a one-time transition tax on the deemed repatriation of post-1986 undistributed foreign subsidiary earnings and profits (“E&P”). The estimated tax effects of the provisional income inclusion of
$15.7 million
for the deemed repatriation transition tax was fully offset by the benefit of current and carryforward foreign tax credits previously subjected to a full valuation allowance. We paid no U.S. federal cash taxes on the deemed repatriation. The deemed repatriation of undistributed foreign earnings also resulted in a reassessment of the permanent reinvestment of undistributed foreign earnings and profits and we established a deferred tax liability of
$66 thousand
for withholding taxes associated with those earnings which were not permanently reinvested as of December 30, 2017.
The SEC staff issued Staff Accounting Bulletin No. 118 (“SAB 118”) to address the application of U.S. GAAP in situations when a registrant does not have the necessary information available, prepared, or analyzed (including computations) in reasonable detail to complete the accounting for certain income tax effects of the Tax Act and allows the registrant to record provisional amounts during a measurement period not to extend beyond one year of the enactment date. We recognized the provisional impacts related to the one-time transition tax, the revaluation of deferred tax balances and reassessment of the realizability of deferred tax assets and included these estimates in our consolidated financial statements for the year ended December 30, 2017. We completed our analysis within the measurement period in accordance with SAB 118 and did not have a material impact to our consolidated financial statements.
Note 15—Employee Benefit Plans
We have an employee savings plan that qualifies as a deferred salary arrangement under Section 401(k) of the Internal Revenue Code. The plan is designed to provide employees with an accumulation of funds for retirement on a tax-deferred basis and provide for annual discretionary employer contributions. The total charge to operations under the 401(k) plan for fiscal
2018
,
2017
and
2016
aggregated
$2.0 million
,
$1.9 million
and
$0.5 million
, respectively.
Note 16—Segments and Geographic Information
Until the acquisition of Cascade Microtech, we operated in
one
reportable segment relating to the design, development, manufacture and sale of high performance advanced probe cards. We currently operate in
two
reportable segments consisting of the Probe Cards Segment and the Systems Segment.
Our chief operating decision maker ("CODM") is our Chief Executive Officer, who reviews operating results to make decisions about allocating resources and assessing performance for the entire company.
The following table summarizes the operating results by reportable segment (dollars in thousands):
|
Fiscal 2018
|
|||||||||||||||
|
Probe Cards
|
Systems
|
Corporate and Other
|
Total
|
||||||||||||
|
Revenues
|
$
|
434,269
|
|
$
|
95,406
|
|
$
|
—
|
|
$
|
529,675
|
|
|||
|
Gross profit
|
$
|
187,320
|
|
$
|
47,074
|
|
$
|
(24,055
|
)
|
$
|
210,339
|
|
|||
|
Gross margin
|
43.1
|
%
|
49.3
|
%
|
—
|
%
|
39.7
|
%
|
|||||||
|
Fiscal 2017
|
|||||||||||||||
|
Probe Cards
|
Systems
|
Corporate and Other
|
Total
|
||||||||||||
|
Revenues
|
$
|
454,794
|
|
$
|
93,647
|
|
$
|
—
|
|
$
|
548,441
|
|
|||
|
Gross profit
|
$
|
195,903
|
|
$
|
46,647
|
|
$
|
(26,953
|
)
|
$
|
215,597
|
|
|||
|
Gross margin
|
43.1
|
%
|
49.8
|
%
|
—
|
%
|
39.3
|
%
|
|||||||
|
Fiscal 2016
|
|||||||||||||||
|
Probe Cards
|
Systems
|
Corporate and Other
|
Total
|
||||||||||||
|
Revenues
|
$
|
337,970
|
|
$
|
45,911
|
|
$
|
—
|
|
$
|
383,881
|
|
|||
|
Gross profit
|
$
|
121,407
|
|
$
|
23,925
|
|
$
|
(42,650
|
)
|
$
|
102,682
|
|
|||
|
Gross margin
|
35.9
|
%
|
52.1
|
%
|
—
|
%
|
26.7
|
%
|
|||||||
Operating results provide useful information to our management for assessment of our performance and results of operations. Certain components of our operating results are utilized to determine executive compensation along with other measures.
Corporate and Other includes unallocated expenses relating to amortization of intangible assets, share-based compensation expense, acquisition-related costs, including charges related to inventory stepped up to fair value, and other costs, which are not used in
73
FORMFACTOR, INC.
NOTES TO CONSOLIDATED FINANCIAL STATEMENTS (Continued)
evaluating the results of, or in allocating resources to, our reportable segments. Acquisition-related costs include transaction costs and any costs directly related to the acquisition and integration of acquired businesses.
The following table summarizes revenue, by geographic region, as a percentage of total revenues based upon ship-to location:
|
Fiscal Year Ended
|
||||||||
|
December 29, 2018
|
December 30, 2017
|
December 31, 2016
|
||||||
|
United States
|
25.2
|
%
|
34.0
|
%
|
33.3
|
%
|
||
|
Taiwan
|
20.3
|
|
17.7
|
|
14.9
|
|
||
|
South Korea
|
17.2
|
|
14.9
|
|
17.1
|
|
||
|
China
|
14.7
|
|
11.1
|
|
7.4
|
|
||
|
Japan
|
9.4
|
|
8.1
|
|
10.0
|
|
||
|
Europe
|
7.5
|
|
8.2
|
|
12.9
|
|
||
|
Asia-Pacific
(1)
|
4.9
|
|
5.5
|
|
4.0
|
|
||
|
Rest of the world
|
0.8
|
|
0.5
|
|
0.4
|
|
||
|
Total Revenues
|
100.0
|
%
|
100.0
|
%
|
100.0
|
%
|
||
(1)
Asia-Pacific includes all countries in the region except Taiwan, South Korea, China, and Japan, which are disclosed separately.
The following table summarizes revenue by market (in thousands):
|
|
Fiscal Year Ended
|
||||||||||
|
|
December 29, 2018
|
December 30, 2017
|
December 31, 2016
|
||||||||
|
Foundry & Logic
|
$
|
258,459
|
|
$
|
313,714
|
|
$
|
237,591
|
|
||
|
DRAM
|
135,333
|
|
124,685
|
|
86,910
|
|
|||||
|
Flash
|
40,477
|
|
16,395
|
|
13,469
|
|
|||||
|
Systems
|
95,406
|
|
93,647
|
|
45,911
|
|
|||||
|
Total revenues
|
$
|
529,675
|
|
$
|
548,441
|
|
$
|
383,881
|
|
||
The following table summarizes revenue by timing of revenue recognition (in thousands):
|
Fiscal Year Ended
|
|||||||||||||||||||||||||||||||||||
|
December 29,
2018 |
December 30,
2017 |
December 31,
2016 |
|||||||||||||||||||||||||||||||||
|
Probe Cards
|
Systems
|
Total
|
Probe Cards
|
Systems
|
Total
|
Probe Cards
|
Systems
|
Total
|
|||||||||||||||||||||||||||
|
Products transferred at a point in time
|
$
|
432,033
|
|
$
|
91,514
|
|
523,547
|
|
$
|
452,946
|
|
$
|
90,107
|
|
543,053
|
|
$
|
335,988
|
|
$
|
44,048
|
|
380,036
|
|
|||||||||||
|
Services transferred over time
|
2,236
|
|
3,892
|
|
6,128
|
|
1,848
|
|
3,540
|
|
5,388
|
|
1,982
|
|
1,863
|
|
3,845
|
|
|||||||||||||||||
|
Total
|
$
|
434,269
|
|
$
|
95,406
|
|
$
|
529,675
|
|
$
|
454,794
|
|
$
|
93,647
|
|
$
|
548,441
|
|
$
|
337,970
|
|
$
|
45,911
|
|
$
|
383,881
|
|
||||||||
Long-lived assets, comprised of Property, plant and equipment, net, Goodwill and Intangibles, net, reported based on the location of the asset was as follows (in thousands):
|
December 29, 2018
|
December 30, 2017
|
December 31, 2016
|
|||||||||
|
United States
|
$
|
280,405
|
|
$
|
299,574
|
|
$
|
323,369
|
|
||
|
Europe
|
26,118
|
|
30,922
|
|
30,903
|
|
|||||
|
Asia-Pacific
|
4,385
|
|
3,662
|
|
3,009
|
|
|||||
|
Total
|
$
|
310,908
|
|
$
|
334,158
|
|
$
|
357,281
|
|
||
74
FORMFACTOR, INC.
NOTES TO CONSOLIDATED FINANCIAL STATEMENTS (Continued)
Note 17—Selected Quarterly Financial Data (Unaudited)
The following selected quarterly financial data should be read in conjunction with our consolidated financial statements and the related notes and Item 7: Management's Discussion and Analysis of Financial Condition and Results of Operations. This information has been derived from our unaudited consolidated financial statements that, in our opinion, reflect all recurring adjustments necessary to fairly present this information when read in conjunction with our consolidated financial statements and the related notes. The results of operations for any quarter are not necessarily indicative of the results to be expected for any future period.
|
|
Fiscal Quarters Ended
|
||||||||||||||||||||||||||||||
|
|
Dec. 29,
2018 (1) |
Sep. 29,
2018 |
June 30, 2018
|
March 31, 2018
|
Dec. 30,
2017 (2) |
Sep. 30,
2017 |
July 1, 2017
|
April 1, 2017
|
|||||||||||||||||||||||
|
|
(in thousands, except per share data)
|
||||||||||||||||||||||||||||||
|
Revenues
|
$
|
140,887
|
|
$
|
134,989
|
|
$
|
135,509
|
|
$
|
118,290
|
|
$
|
131,901
|
|
$
|
143,735
|
|
$
|
143,976
|
|
$
|
128,829
|
|
|||||||
|
Cost of revenues
|
84,865
|
|
82,019
|
|
79,291
|
|
73,161
|
|
83,272
|
|
86,105
|
|
82,209
|
|
81,258
|
|
|||||||||||||||
|
Gross profit
|
56,022
|
|
52,970
|
|
56,218
|
|
45,129
|
|
48,629
|
|
57,630
|
|
61,767
|
|
47,571
|
|
|||||||||||||||
|
Operating Expenses:
|
|
|
|
|
|
|
|
|
|||||||||||||||||||||||
|
Research and development
|
18,398
|
|
18,857
|
|
19,675
|
|
18,046
|
|
18,513
|
|
19,338
|
|
18,542
|
|
17,414
|
|
|||||||||||||||
|
Selling, general and administrative
|
25,668
|
|
24,745
|
|
25,232
|
|
23,449
|
|
24,238
|
|
24,010
|
|
23,602
|
|
22,829
|
|
|||||||||||||||
|
Restructuring
|
160
|
|
—
|
|
—
|
|
—
|
|
481
|
|
16
|
|
44
|
|
269
|
|
|||||||||||||||
|
Total operating expenses
|
44,226
|
|
43,602
|
|
44,907
|
|
41,495
|
|
|
43,232
|
|
43,364
|
|
42,188
|
|
40,512
|
|
||||||||||||||
|
Operating income
|
11,796
|
|
9,368
|
|
11,311
|
|
3,634
|
|
5,397
|
|
14,266
|
|
19,579
|
|
7,059
|
|
|||||||||||||||
|
Interest income
|
404
|
|
369
|
|
326
|
|
257
|
|
264
|
|
123
|
|
93
|
|
67
|
|
|||||||||||||||
|
Interest expense
|
(660
|
)
|
(777
|
)
|
(910
|
)
|
(967
|
)
|
(1,045
|
)
|
(1,109
|
)
|
(1,162
|
)
|
(1,174
|
)
|
|||||||||||||||
|
Other income (expense), net
|
117
|
|
121
|
|
50
|
|
(512
|
)
|
(170
|
)
|
311
|
|
107
|
|
(400
|
)
|
|||||||||||||||
|
Income before income taxes
|
11,657
|
|
9,081
|
|
10,777
|
|
2,412
|
|
4,446
|
|
13,591
|
|
18,617
|
|
5,552
|
|
|||||||||||||||
|
Provision (benefit) for income taxes
|
(73,443
|
)
|
1,393
|
|
1,654
|
|
287
|
|
(1,142
|
)
|
1,028
|
|
1,040
|
|
367
|
|
|||||||||||||||
|
Net income
|
$
|
85,100
|
|
$
|
7,688
|
|
$
|
9,123
|
|
$
|
2,125
|
|
$
|
5,588
|
|
$
|
12,563
|
|
$
|
17,577
|
|
$
|
5,185
|
|
|||||||
|
Net income per share:
(3)
|
|
|
|
|
|
|
|
|
|||||||||||||||||||||||
|
Basic
|
$
|
1.15
|
|
$
|
0.10
|
|
$
|
0.12
|
|
$
|
0.03
|
|
$
|
0.08
|
|
$
|
0.17
|
|
$
|
0.24
|
|
$
|
0.07
|
|
|||||||
|
Diluted
|
$
|
1.13
|
|
$
|
0.10
|
|
$
|
0.12
|
|
$
|
0.03
|
|
$
|
0.07
|
|
$
|
0.17
|
|
$
|
0.24
|
|
$
|
0.07
|
|
|||||||
|
Weighted average number of shares used in per share calculations:
|
|
|
|
|
|
|
|
|
|
|
|
|
|
|
|
|
|||||||||||||||
|
Basic
|
74,108
|
|
73,837
|
|
73,157
|
|
72,826
|
|
72,846
|
|
72,651
|
|
72,200
|
|
71,423
|
|
|||||||||||||||
|
Diluted
|
75,416
|
|
74,962
|
|
74,533
|
|
74,342
|
|
74,756
|
|
73,885
|
|
73,539
|
|
72,922
|
|
|||||||||||||||
|
(1)
|
In the fourth quarter of fiscal 2018, the tax benefit included a
$75.8 million
benefit from a valuation allowance release against certain U.S. deferred tax assets.
|
|
(2)
|
In the fourth quarter of fiscal 2017, the tax benefit included a
$0.7 million
benefit from U.S. tax reform and a
$0.8 million
benefit from refundable AMT tax credits.
|
|
(3)
|
Quarterly net income per share amounts may not add to the yearly totals due to rounding.
|
Note 18—New Accounting Pronouncements
ASU 2018-15
In August 2018, the Financial Accounting Standard Board ("FASB") issued Accounting Standards Update ("ASU") 2018-15, "
Intangibles-Goodwill and Other-Internal-Use Software (Subtopic 350-40): Customer’s Accounting for Implementation Costs Incurred in a Cloud Computing Arrangement That Is a Service Contract.
" The new guidance clarifies the accounting for implementation costs in cloud computing arrangements. ASU 2018-15 is effective for fiscal years, including interim periods within those fiscal years, beginning after December 15, 2019. Early adoption is permitted. ASU 2018-15 should be applied either retrospectively or prospectively to all implementation costs incurred after the date of adoption. We have not yet determined the impact of this standard on our financial statements.
ASU 2017-12
In August 2017, the FASB issued ASU 2017-12, "
Derivatives and Hedging (Topic 815): Targeted Improvements to Accounting for Hedging Activities
," which changes the recognition and presentation requirements of hedge accounting, including eliminating the requirement to separately measure and report hedge ineffectiveness and changing the presentation to include all items that affect earnings in the same income statement line item as the hedged item. ASU 2017-12 also provides new alternatives for applying hedge accounting to additional hedging strategies, measuring the hedged item in fair value hedges of interest rate risk, reducing
75
FORMFACTOR, INC.
NOTES TO CONSOLIDATED FINANCIAL STATEMENTS (Continued)
the cost and complexity of applying hedge accounting and reducing the risk of material error correction if a company applies the shortcut method inappropriately. ASU 2017-12 is effective for fiscal years, including interim periods within those fiscal years, beginning after December 15, 2018, on a prospective basis. We early adopted ASU 2017-12 on December 31, 2017, the first day of fiscal 2018, resulting in an immaterial adjustment in our accumulated deficit on December 30, 2017.
ASU 2017-09
In May 2017, the FASB issued ASU 2017-09, "
Compensation - Stock Compensation (Topic 718) - Scope of Modification Accounting,
" which provides clarity and reduces both diversity in practice and the cost and complexity when accounting for a change to the terms of a stock-based award. ASU 2017-09 is effective for fiscal years, including interim periods within those fiscal years, beginning after December 15, 2017, on a prospective basis. We adopted ASU 2017-09 on December 31, 2017, the first day of fiscal 2018. There were no modifications to any stock-based awards during fiscal 2018.
ASU 2017-04
In January 2017, the FASB issued ASU 2017-04, "
Intangibles - Goodwill and Other (Topic 350) - Simplifying the Test for Goodwill Impairment,
" which simplifies the subsequent measurement of goodwill by eliminating Step 2 from the goodwill impairment test. An entity should perform its annual, or interim, goodwill impairment test by comparing the fair value of a reporting unit with its carrying amount, and recognize an impairment charge for the amount by which the carrying amount exceeds the reporting unit's fair value, if applicable. The loss recognized should not exceed the total amount of goodwill allocated to the reporting unit. The same impairment test also applies to any reporting unit with a zero or negative carrying amount. An entity still has the option to perform the qualitative assessment for a reporting unit to determine if the quantitative impairment test is necessary. ASU 2017-04 is effective for fiscal years, including interim periods within those fiscal years, beginning after December 15, 2019, on a prospective basis. Early adoption is permitted for interim or annual goodwill impairment tests performed after January 1, 2017. We early adopted ASU 2017-04 on July 1, 2018, the first day of the third quarter of fiscal 2018. The adoption did not have an effect on our financial position, results of operations or cash flows.
ASU 2017-01
In January 2017, the FASB issued ASU 2017-01, “
Business Combinations (Topic 805) - Clarifying the Definition of a Business
” which clarifies the definition and provides a more robust framework to use in determining when a set of assets and activities constitutes a business. ASU 2017-01 is intended to provide guidance when evaluating whether transactions should be accounted for as acquisitions (or disposals) of assets or businesses. We adopted ASU 2017-01 on December 31, 2017, the first day of fiscal 2018. The adoption did not have an effect on our financial position, results of operations or cash flows.
ASU 2016-18
In November 2016, the FASB issued ASU 2016-18, "
Statement of Cash Flows (Topic 230) - Restricted Cash,
" which requires that a statement of cash flows explain the change during the period in the total of cash, cash equivalents, and amounts generally described as restricted cash or restricted cash equivalents. Therefore, an entity should include amounts generally described as restricted cash or restricted cash equivalents within cash and cash equivalents when reconciling the beginning-of-period and end-of-period total amounts shown on the statement of cash flows. Prior to this ASU, there was no guidance to address how to classify and present changes in restricted cash or restricted cash equivalents. The updated guidance is effective for interim and annual periods beginning after December 15, 2017. We adopted ASU 2016-18 as of December 31, 2017, the first day of fiscal 2018 and retrospectively applied such guidance to our Condensed Consolidated Statements of Cash Flows.
The following table provides a reconciliation of Cash and cash equivalents as previously reported within the Condensed Consolidated Statements of Cash Flows to Cash, cash equivalents and restricted cash as currently reported in the Condensed Consolidated Statements of Cash Flows (in thousands):
|
December 30, 2017
|
December 31, 2016
|
||||||
|
Cash and cash equivalents as previously reported in the Condensed Consolidated Statements of Cash Flows
|
$
|
91,184
|
|
$
|
101,408
|
|
|
|
Current assets - Restricted cash
|
372
|
|
106
|
|
|||
|
Restricted cash
|
1,170
|
|
1,082
|
|
|||
|
Cash, cash equivalents and restricted cash as currently reported in the Condensed Consolidated Statements of Cash Flows
|
$
|
92,726
|
|
$
|
102,596
|
|
|
As of
December 29, 2018
and
December 30, 2017
, Restricted cash was comprised primarily of funds held by our foreign subsidiaries for employee obligations, office leases and customer deposits.
76
FORMFACTOR, INC.
NOTES TO CONSOLIDATED FINANCIAL STATEMENTS (Continued)
ASU 2016-10, ASU 2015-14 and ASU 2014-09
In May 2014, the Financial Accounting Standard Board ("FASB") issued ASU No. 2014-09, "
Revenue from Contracts with Customers,
" ("
ASC 606
"). ASU 2014-09 requires an entity to recognize revenue to depict the transfer of goods or services to customers in an amount that reflects the consideration to which an entity expects to be entitled in exchange for those goods or services. The guidance also requires expanded disclosures relating to the nature, amount, timing, and uncertainty of revenue and cash flows arising from contracts with customers. Additionally, qualitative and quantitative disclosures are required about customer contracts, significant judgments and changes in judgments, and assets recognized from the costs to obtain or fulfill a contract. The standard permits the use of either the retrospective or modified retrospective transition methods. We adopted ASC 606 on December 31, 2017, the first day of fiscal 2018, using the modified retrospective method. We applied ASC 606 to all contracts not completed as of the date of adoption in order to determine any adjustment to the opening balance of retained earnings. Under the modified retrospective adoption method, the comparative financial information has not been restated and continues to be reported under the accounting standards in effect for those periods, ASC 605, "
Revenue Recognition
", which is also referred to herein as "legacy GAAP."
The adoption of ASC 606 did not have a material impact on our consolidated financial statements as of December 31, 2017. No adjustment was recorded to accumulated deficit as of the adoption date and reported revenue would not have been different under legacy GAAP.
ASU 2016-02, ASU 2018-10 and ASU 2018-11
In February 2016, the FASB issued ASU 2016-02, "
Leases (Topic 842)
," which requires the recognition of right-of-use assets and lease liabilities for all long-term leases, including operating leases, on the balance sheet. ASU 2016-02 was amended in July 2018 by both ASU 2018-10, "
Codification Improvements to Topic 842, Leases
," and ASU 2018-11, "
Leases (Topic 842): Targeted Improvements
." ASU 2016-02 provides additional guidance on the measurement of the right-of-use assets and lease liabilities and will require enhanced disclosures about our leasing arrangements. Under current accounting standards, substantially all of our leases are considered operating leases and, as such, are not recognized on the Consolidated Balance Sheet. This new standard is effective for us beginning on December 30, 2018, with early adoption permitted. As initially issued, the standard required a “modified retrospective” adoption, meaning the standard is applied to leases existing at, or entered into after, the beginning of the earliest comparative period presented in the financial statements. As amended, the standard allows an additional transition method that permits a company to use its effective date as the date of initial application, and therefore, not restate comparative prior period financial information. Upon adoption we will use the modified transition method. We are currently assessing the impact on our Consolidated Financial Statements, which includes assessing the discount rate to be applied to these valuations. We expect that the primary impact upon adoption will be the recognition, on a discounted basis, of our minimum commitments under noncancelable operating leases to our Consolidated Balance Sheets resulting in the recording of right-of-use assets in the range of
$30.3 million
to
$35.5 million
and lease liabilities in the range of
$35.8 million
to
$40.9 million
.
77
EXHIBIT INDEX
|
Incorporated by Reference
|
||||||||||||||||
|
Exhibit
Number
|
Exhibit Description
|
Form
|
File No
|
Date of
First Filing
|
Exhibit
Number
|
Filed
Herewith
|
||||||||||
|
Agreement and Plan of Merger, dated February 3, 2016, by and among Cascade Microtech, Inc., FormFactor, Inc. and Cardinal Merger Subsidiary, Inc.
|
8-K
|
|
000-50307
|
|
2/9/2016
|
|
2.1
|
|
||||||||
|
Amended and Restated Certificate of Incorporation of the Registrant as filed with the Delaware Secretary of State on June 17, 2003
|
S-1
|
|
333-109815
|
|
10/20/2003
|
|
3.01
|
|
||||||||
|
Amended and Restated Bylaws of the Registrant
|
8-K
|
|
000-50307
|
|
7/22/2016
|
|
3.2
|
|
||||||||
|
Specimen Common Stock Certificate
|
S-1/A
|
|
333-86738
|
|
5/28/2002
|
|
4.01
|
|
||||||||
|
Credit Agreement among FormFactor, Inc. as Borrower, the Guarantors that are from time to time parties thereto, HSBC Bank USA, National Association, as Administrative Agent, Lead Lender, Co-Lead Arranger, Sole Bookrunner, Syndication Agent and Lender, the Lenders that are from time to time parties thereto, and Silicon Valley Bank, as Co-Lead Arranger and Documentation Agent, dated as of June 24, 2016
|
8-K
|
|
000-50307
|
|
6/28/2016
|
|
10.1
|
|
|
|||||||
|
First Amendment to Credit Agreement dated April 19, 2017 among FormFactor, Inc. and HSBC Bank USA, National Association.
|
10-K
|
|
000-50307
|
|
2/27/2018
|
|
10.2
|
|
||||||||
|
10.3
+
|
Form of Indemnity Agreement
|
S-1/A
|
|
333-86738
|
|
5/28/2002
|
|
10.01
|
|
|||||||
|
10.4
+
|
Form of Change of Control Severance Agreement
|
10-K
|
|
000-50307
|
|
3/14/2005
|
|
10.48
|
|
|||||||
|
10.5
+
|
Incentive Option Plan, and form of option grant
|
S-1
|
|
333-86738
|
|
4/22/2002
|
|
10.04
|
|
|||||||
|
10.6
+
|
Management Incentive Option Plan, and form of option grant
|
S-1
|
|
333-86738
|
|
4/22/2002
|
|
10.05
|
|
|||||||
|
10.7
+
|
2002 Equity Incentive Plan, as amended, and forms of plan agreements
|
10-Q
|
|
000-50307
|
|
5/4/2011
|
|
10.06
|
|
|||||||
|
10.8
+
|
2002 Employee Stock Purchase Plan, as amended
|
10-Q
|
|
000-50307
|
|
8/7/2007
|
|
10.01
|
|
|||||||
|
10.9
+
|
Key Employee Bonus Plan, as amended
|
10-Q
|
|
000-50307
|
|
5/7/2007
|
|
10.01
|
|
|||||||
|
10.10
+
|
Equity Incentive Plan, as amended and restated effective May 26, 2017, and forms of plan agreements
|
S-8
|
|
333-222551
|
|
1/16/2018
|
|
99.1
|
|
|||||||
|
10.11
+
|
Employee Stock Purchase Plan, as amended and restated May 18, 2018
|
DEF 14A
|
|
000-50307
|
|
4/3/2018
|
|
Appendix A
|
|
|
||||||
|
Pacific Corporate Center Lease (Building 1) by and between Greenville Holding Company LLC (successor to Greenville Investors, L.P.) ("Greenville") and the Registrant dated May 3, 2001
|
S-1/A
|
|
333-86738
|
|
6/10/2003
|
|
10.18
|
|
|
|||||||
|
First Amendment to Pacific Corporate Center Lease (Building 1) by and between Greenville and the Registrant dated January 31, 2003
|
S-1/A
|
|
333-86738
|
|
5/7/2003
|
|
10.18.1
|
|
|
|||||||
|
Pacific Corporate Center Lease (Building 2) by and between Greenville and the Registrant dated May 3, 2001
|
S-1/A
|
|
333-86738
|
|
6/10/2003
|
|
10.19
|
|
||||||||
|
First Amendment to Pacific Corporate Center Lease (Building 2) by and between Greenville and the Registrant dated January 31, 2003
|
S-1/A
|
|
333-86738
|
|
5/7/2003
|
|
10.19.1
|
|
||||||||
|
Pacific Corporate Center Lease (Building 3) by and between Greenville and the Registrant dated May 3, 2001
|
S-1/A
|
|
333-86738
|
|
6/10/2003
|
|
10.20
|
|
||||||||
|
10.17
+
|
First Amendment to Pacific Corporate Center Lease (Building 3) by and between Greenville and the Registrant dated January 31, 2003
|
S-1/A
|
|
333-86738
|
|
5/7/2003
|
|
10.20.1
|
|
|||||||
|
Third Amendment, dated December 19, 2016, between FormFactor, Inc. and MOHR PCC, LP, to Pacific Corporate Center Leases (Buildings 1, 2 and 3), dated May 3, 2001, by and between Greenville Investors, L.P. and FormFactor, Inc., as amended
|
8-K
|
|
000-50307
|
|
12/23/2016
|
|
10.2
|
|
||||||||
|
10.19
+
|
Pacific Corporate Center Lease by and between Greenville and the Registrant dated September 7, 2004., as amended by First Amendment to Building 6 Lease dated August 16, 2006
|
10-Q
|
|
000-50307
|
|
11/7/2006
|
|
10.01
|
|
|||||||
|
Second Amendment, dated December 19, 2016, between FormFactor, Inc. and MOHR PCC, LP, to Pacific Corporate Center Lease, dated October 5, 2004, by and between Greenville Investors, L.P. and FormFactor, Inc., as amended
|
8-K
|
|
000-50307
|
|
12/23/2016
|
|
10.1
|
|
||||||||
78
|
Third Amendment, dated October 1, 2018, between FormFactor, Inc. and MOHR PCC, LP, to Pacific Corporate Center Lease, dated October 5, 2004, by and between Greenville Investors, L.P. and FormFactor, Inc., as amended
|
8-K
|
|
000-50307
|
|
10/2/2018
|
|
10.1
|
|
||||||||
|
Fourth Amendment, dated October 1, 2018, between FormFactor, Inc. and MOHR PCC, LP, to Pacific Corporate Center Lease, dated October 5, 2004, by and between Greenville Investors, L.P. and FormFactor, Inc., as amended
|
8-K
|
|
000-50307
|
|
10/2/2018
|
|
10.2
|
|
||||||||
|
Lease Agreements I and II between Amberjack, Ltd. And Cascade Microtech, Inc. dated August 20, 1997, and Amendment No. 2 to Lease Agreement I dated July 23, 1998, and Amendment No. 2 to Lease Agreement II dated April 12, 1999.
|
S-1
|
|
333-47100
|
|
10/2/2000
|
|
10.9
|
|
||||||||
|
Third Amendment dated August 11, 2006 to Lease Agreement I dated August 20, 1997 between Amberjack, LTD. and Cascade Microtech, Inc.
|
10-Q
|
|
000-51072
|
|
11/9/2006
|
|
10.2
|
|
||||||||
|
Third Amendment dated August 11, 2006 to Lease Agreement II dated August 20, 1997 between Amberjack, LTD. and Cascade Microtech, Inc.
|
10-Q
|
|
000-51072
|
|
11/9/2006
|
|
10.3
|
|
||||||||
|
Assignment, Assumption and Amendment of Lease dated as of September 22, 2011 by and among Cascade Microtech, Inc. and R&D Sockets, Inc.
|
8-K
|
|
000-51072
|
|
9/26/2011
|
|
10.1
|
|
||||||||
|
Rental Agreement by and between Cascade Microtech Dresden GmbH and Süss Grundstücksverwaltungs GbR dated as of June 17, 2011.
|
10-Q
|
|
000-51072
|
|
8/10/2011
|
|
10.3
|
|
||||||||
|
Lease dated April 2, 1999 between Spieker Properties, L.P. and Cascade Microtech, Inc.
|
S-1
|
|
333-47100
|
|
10/2/2000
|
|
10.8
|
|
||||||||
|
First amendment to Lease dated January 10, 2007, between Nimbus Center LLC (as successor in interest to Spieker Properties, L.P.) and Cascade Microtech, Inc.
|
10-Q
|
|
000-51072
|
|
5/9/2014
|
|
10.1
|
|
||||||||
|
Second amendment to Lease dated February 25, 2013, between Nimbus Center LLC and Cascade Microtech, Inc.
|
10-Q
|
|
000-51072
|
|
5/8/2013
|
|
10.2
|
|
||||||||
|
Third amendment to Lease dated January 23, 2014, between Nimbus Center LLC and Cascade Microtech, Inc.
|
10-Q
|
|
000-51072
|
|
5/9/2014
|
|
10.2
|
|
||||||||
|
Fourth amendment to Lease dated March 31, 2014, between Nimbus Center LLC and Cascade Microtech, Inc.
|
10-Q
|
|
000-51072
|
|
5/9/2014
|
|
10.3
|
|
||||||||
|
Fifth amendment to Lease dated September 24, 2014, between Nimbus Center LLC and Cascade Microtech, Inc.
|
10-K
|
|
000-51072
|
|
3/72016
|
|
10.22
|
|
||||||||
|
Sixth amendment to Lease dated July 8, 2015, between Nimbus Center LLC and Cascade Microtech, Inc.
|
10-K
|
|
000-51072
|
|
3/72016
|
|
10.23
|
|
||||||||
|
10.35
+
|
Employment Offer Letter, dated August 29, 2012 to Mike Slessor
|
10-K
|
|
000-50307
|
|
3/13/2013
|
|
10.19+
|
|
|||||||
|
10.36
+
|
Tax withholding reimbursement letter between Mike Slessor and the Registrant dated December 30, 2013
|
10-K
|
|
000-50307
|
|
3/6/2015
|
|
10.20
|
|
|||||||
|
10.37
+
|
CEO Change of Control and Severance Agreement, dated April 28, 2016 by and between Mike Slessor and the Registrant
|
10-K
|
|
000-50307
|
|
3/15/2017
|
|
10.35
|
|
|||||||
|
10.38
+
|
Change of Control and Severance Agreement, dated April 28, 2016 by and between Michael Ludwig and the Registrant
|
10-K
|
|
000-50307
|
|
3/15/2017
|
|
10.36
|
|
|||||||
|
10.39
+
|
Employment Offer Letter, dated February 15, 2018 to Shai Shahar
|
10-Q
|
|
000-50307
|
|
5/8/2018
|
|
10.1
|
|
|||||||
|
Code of Business conduct of FormFactor, Inc.
|
8-K
|
|
000-50307
|
|
9/13/2017
|
|
14.1
|
|
||||||||
|
List of Registrant's subsidiaries
|
—
|
|
—
|
|
—
|
|
—
|
|
X
|
|||||||
|
Consent of Independent Registered Public Accounting Firm - KPMG
|
—
|
|
—
|
|
—
|
|
—
|
|
X
|
|||||||
|
Power of Attorney (included on the signature page of this Form 10-K)
|
—
|
|
—
|
|
—
|
|
—
|
|
X
|
|||||||
|
Certification of Chief Executive Officer pursuant to 15 U.S.C. Section 7241, as adopted pursuant to Section 302 of the Sarbanes-Oxley Act of 2002
|
—
|
|
—
|
|
—
|
|
—
|
|
X
|
|||||||
|
Certification of Chief Financial Officer pursuant to 15 U.S.C. Section 7241, as adopted pursuant to Section 302 of the Sarbanes-Oxley Act of 2002
|
—
|
|
—
|
|
—
|
|
—
|
|
X
|
|||||||
79
|
32.1
*
|
Certification of Chief Executive Officer and Chief Financial Officer pursuant to 18 U.S.C. Section 1350, as adopted pursuant to Section 906 of the Sarbanes-Oxley Act of 2002
|
—
|
|
—
|
|
—
|
|
—
|
|
X
|
||||||
|
101.INS**
|
XBRL Instance Document
|
—
|
|
—
|
|
—
|
|
—
|
|
X
|
||||||
|
101.SCH**
|
XBRL Taxonomy Extension Schema Document
|
—
|
|
—
|
|
—
|
|
—
|
|
X
|
||||||
|
101.CAL**
|
XBRL Taxonomy Extension Calculation Linkbase Document
|
—
|
|
—
|
|
—
|
|
—
|
|
X
|
||||||
|
101.DEF**
|
XBRL Taxonomy Extension Definition Linkbase Document
|
—
|
|
—
|
|
—
|
|
—
|
|
X
|
||||||
|
101.LAB**
|
XBRL Taxonomy Extension Label Linkbase Document
|
—
|
|
—
|
|
—
|
|
—
|
|
X
|
||||||
|
101.PRE**
|
XBRL Taxonomy Extension Presentation Linkbase Document
|
—
|
|
—
|
|
—
|
|
—
|
|
X
|
||||||
|
*
|
This exhibit shall not be deemed "filed" for purposes of Section 18 of the Securities Exchange Act of 1934 or otherwise subject to the liabilities of that section, nor shall it be deemed incorporated by reference in any filing under the Securities Act of 1933 or the Securities Exchange Act of 1934, whether made before or after the date hereof and irrespective of any general incorporation language in any filings.
|
|
**
|
Pursuant to Rule 406T of Regulation S-T, these interactive data files are deemed not filed or part of a registration statement or prospectus for purposes of Sections 11 or 12 of the Securities Act of 1933 or Section 18 of the Securities Exchange Act of 1934 and otherwise are not subject to liability.
|
|
***
|
The schedules, exhibits, and annexes to this exhibit have been omitted in reliance on Item 601(b)(2) of Regulation S-K and will be furnished supplementally to the SEC upon request.
|
|
+
|
Indicates a management contract or compensatory plan or arrangement.
|
80
TABLE OF CONTENTS
Part IItem 1: BusinessItem 1A: Risk FactorsItem 1B: Unresolved Staff CommentsItem 2: PropertiesItem 3: Legal ProceedingsItem 4: Mine Safety DisclosuresPart IIItem 5: Market For Registrant's Common Equity, Related Stockholder Matters and Issuer Purchases Of Equity SecuritiesItem 6: Selected Financial DataItem 7: Management's Discussion and Analysis Of Financial Condition and Results Of OperationsItem 7A: Quantitative and Qualitative Disclosures About Market RiskItem 8: Financial Statements and Supplementary DataItem 9: Changes in and Disagreements with Accountants on Accounting and Financial DisclosureItem 9A: Controls and ProceduresItem 9B: Other InformationPart IIIItem 10: Directors, Executive Officers and Corporate GovernanceItem 11: Executive CompensationItem 12: Security Ownership Of Certain Beneficial Owners and Management and Related Stockholder MattersItem 13: Certain Relationships and Related Transactions, and Director IndependenceItem 14: Principal Accounting Fees and ServicesPart IVItem 15: Exhibits, Financial Statement SchedulesItem 16: Form 10-k SummaryNote 1 Formation and Nature Of BusinessNote 2 Summary Of Significant Accounting PoliciesNote 3 Balance Sheet ComponentsNote 4 AcquisitionNote 5 DebtNote 6 Restructuring ChargesNote 7 Impairment Of Long-lived AssetsNote 8 Derivative Financial InstrumentsNote 9 Fair ValueNote 10 Goodwill and Intangible AssetsNote 11 Commitments and ContingenciesNote 12 Stockholders' EquityNote 13 Stock-based CompensationNote 14 Income TaxesNote 15 Employee Benefit PlansNote 16 Segments and Geographic InformationNote 17 Selected Quarterly Financial Data (unaudited)Note 18 New Accounting Pronouncements