FIRST INDUSTRIAL REALTY TRUST INC
10-Ks and 10-Qs
|
|
|
|
|
|
|
|
|
|
|
|
|
|
|
|
|
|
|
|
|
|
|
|
|
|
|
|
|
|
|
|
|
|
|
|
|
|
|
|
|
|
|
|
|
|
|
|
|
|
|
|
|
|
|
|
UNITED STATES
SECURITIES AND EXCHANGE COMMISSION
Washington, D.C. 20549
_______________________________
Form 10-K
_______________________________
|
ý
|
ANNUAL REPORT PURSUANT TO SECTION 13 OR 15(d) OF THE SECURITIES EXCHANGE ACT OF 1934
|
For the fiscal year ended December 31, 2018
or
|
¨
|
TRANSITION REPORT PURSUANT TO SECTION 13 OR 15(d) OF THE SECURITIES EXCHANGE ACT OF 1934
|
For the transition period from to
Commission File Number: 1-13102 (First Industrial Realty Trust, Inc.)
333-21873 (First Industrial, L.P.)
_______________________________
FIRST INDUSTRIAL REALTY TRUST, INC.
FIRST INDUSTRIAL, L.P.
(Exact name of Registrant as specified in its Charter)
|
Maryland (First Industrial Realty Trust, Inc.)
|
36-3935116 (First Industrial Realty Trust, Inc.)
|
|
|
Delaware (First Industrial, L.P.)
|
36-3924586 (First Industrial, L.P.)
|
|
|
(State or other jurisdiction of
incorporation or organization)
|
(I.R.S. Employer
Identification No.)
|
|
|
1 N. Wacker Drive,
Suite 4200, Chicago, Illinois
|
60606
|
|
|
(Address of principal executive offices)
|
(Zip Code)
|
|
(312) 344-4300
(Registrant's telephone number, including area code)
Securities registered pursuant to Section 12(b) of the Act:
Common Stock (First Industrial Realty Trust, Inc.)
(Title of Class)
New York Stock Exchange
(Name of exchange on which registered)
Securities registered pursuant to Section 12(g) of the Act:
None
_______________________________
Indicate by check mark if the registrant is a well-known seasoned issuer, as defined in Rule 405 of the Securities Act.
|
First Industrial Realty Trust, Inc.
|
Yes
þ
No
o
|
|
First Industrial, L.P.
|
Yes
þ
No
o
|
Indicate by check mark if the registrant is not required to file reports pursuant to Section 13 or 15(d) of the Securities Exchange Act of 1934.
|
First Industrial Realty Trust, Inc.
|
Yes
o
No
þ
|
|
First Industrial, L.P.
|
Yes
o
No
þ
|
Indicate by check mark whether the registrant (1) has filed all reports required to be filed by Section 13 or 15(d) of the Securities Exchange Act of 1934 during the preceding 12 months (or for such shorter period that the registrant was required to file such reports), and (2) has been subject to such filing requirements for the past 90 days.
|
First Industrial Realty Trust, Inc.
|
Yes
þ
No
o
|
|
First Industrial, L.P.
|
Yes
þ
No
o
|
Indicate by check mark whether the registrant has submitted electronically and posted on its corporate Web site, if any, every Interactive Data File required to be submitted and posted pursuant to Rule 405 of Regulation S-T (§ 232.405 of this chapter) during the preceding 12 months (or for such shorter period that the registrant was required to submit and post such files).
|
First Industrial Realty Trust, Inc.
|
Yes
þ
No
o
|
|
First Industrial, L.P.
|
Yes
þ
No
o
|
Indicate by check mark if disclosure of delinquent filers pursuant to Item 405 of Regulation S-K is not contained herein, and will not be contained, to the best of registrant's knowledge, in definitive proxy or information statements incorporated by reference in Part III of this Form 10-K or any amendment to this Form 10-K.
o
Indicate by check mark whether the registrant is a large accelerated filer, an accelerated filer, a non-accelerated filer, a smaller reporting company, or an emerging growth company. See the definitions of "large accelerated filer," "accelerated filer," "smaller reporting company," and "emerging growth company" in Rule 12b-2 of the Exchange Act. (Check one):
|
First Industrial Realty Trust, Inc.:
|
|||||||
|
Large accelerated filer
|
þ
|
Accelerated filer
|
o
|
||||
|
Non-accelerated filer
|
o
|
Smaller reporting company
|
o
|
||||
|
(Do not check if a smaller reporting company)
|
Emerging growth company
|
o
|
|||||
|
First Industrial, L.P.:
|
|||||||
|
Large accelerated filer
|
o
|
Accelerated filer
|
þ
|
||||
|
Non-accelerated filer
|
o
|
Smaller reporting company
|
o
|
||||
|
(Do not check if a smaller reporting company)
|
Emerging growth company
|
o
|
|||||
If an emerging growth company, indicate by check mark if the registrant has elected not to use the extended transition period for complying with any new or revised financial accounting standards provided pursuant to Section 13(a) of the Exchange Act.
|
First Industrial Realty Trust, Inc.
|
o
|
|
First Industrial, L.P.
|
o
|
Indicate by check mark whether the registrant is a shell company (as defined in Rule 12b-2 of the Exchange Act).
|
First Industrial Realty Trust, Inc.
|
Yes
o
No
þ
|
|
First Industrial, L.P.
|
Yes
o
No
þ
|
The aggregate market value of the voting and non-voting stock held by non-affiliates of First Industrial Realty Trust, Inc. was approximately
$4,144.6 million
based on the closing price on the New York Stock Exchange for such stock on June 30, 2018.
At
February 15, 2019
, 126,594,152 shares of First Industrial Realty Trust, Inc.'s Common Stock, $0.01 par value, were outstanding.
_______________________________
DOCUMENTS INCORPORATED BY REFERENCE
Part III incorporates certain information by reference to First Industrial Realty Trust, Inc.'s definitive proxy statement expected to be filed with the Securities and Exchange Commission no later than 120 days after the end of First Industrial Realty Trust, Inc.'s fiscal year.
EXPLANATORY NOTE
This report combines the Annual Reports on Form 10-K for the period ended December 31, 2018 of First Industrial Realty Trust, Inc., a Maryland corporation (the "Company"), and First Industrial, L.P., a Delaware limited partnership (the "Operating Partnership"). Unless stated otherwise or the context otherwise requires, the terms "we," "our" and "us" refer to the Company and its subsidiaries, including the Operating Partnership and its consolidated subsidiaries.
The Company is a real estate investment trust and the general partner of the Operating Partnership. At December 31, 2018, the Company owned an approximate 98.0% common general partnership interest in the Operating Partnership. The remaining approximate 2.0% common limited partnership interests in the Operating Partnership are owned by certain limited partners. As the sole general partner of the Operating Partnership, the Company exercises exclusive and complete discretion over the Operating Partnership's day-to-day management and control and can cause it to enter into certain major transactions, including acquisitions, dispositions and refinancings. The management of the Company consists of the same members as the management of the Operating Partnership.
The Company and the Operating Partnership are managed and operated as one enterprise. The financial results of the Operating Partnership are consolidated into the financial statements of the Company. The Company has no significant assets other than its investment in the Operating Partnership. Substantially all of the Company's assets are held by, and its operations are conducted through, the Operating Partnership and its subsidiaries. Therefore, the assets and liabilities of the Company and the Operating Partnership are substantially the same.
We believe it is important to understand the differences between the Company and the Operating Partnership in the context of how the Company and the Operating Partnership operate as an interrelated, consolidated company. The main areas of difference between the consolidated financial statements of the Company and those of the Operating Partnership are:
|
•
|
Stockholders' Equity, Noncontrolling Interest and Partners' Capital.
The 2.0% equity interest in the Operating Partnership held by entities other than the Company are classified within partners' capital in the Operating Partnership's financial statements and as a noncontrolling interest in the Company's financial statements.
|
|
•
|
Relationship to Other Real Estate Partnerships.
The Company's operations are conducted primarily through the Operating Partnership and its subsidiaries, though operations are also conducted through eight other limited partnerships, which are referred to as the "Other Real Estate Partnerships." The Operating Partnership is a limited partner, holding at least a 99% interest, and the Company is a general partner, holding at least a .01% general partnership interest through eight separate wholly-owned corporations, in each of the Other Real Estate Partnerships. The Other Real Estate Partnerships are variable interest entities that both the Company and the Operating Partnership consolidate. The Company's direct general partnership interest in the Other Real Estate Partnerships is reflected as noncontrolling interest within the Operating Partnership's financial statements.
|
|
•
|
Relationship to Service Subsidiary.
The Company has a direct wholly-owned subsidiary that does not own any real estate but provides services to various other entities owned by the Company. Since the Operating Partnership does not have an ownership interest in this entity, its operations are reflected in the consolidated results of the Company but not the Operating Partnership. Also, this entity owes certain amounts to the Operating Partnership, for which a receivable is included on the Operating Partnership's balance sheet but is eliminated on the Company's consolidated balance sheet, since both this entity and the Operating Partnership are fully consolidated by the Company.
|
We believe combining the Company's and Operating Partnership's annual reports into this single report results in the following benefits:
|
•
|
enhances investors' understanding of the Company and the Operating Partnership by enabling them to view the business as a whole and in the same manner as management views and operates the business;
|
|
•
|
creates time and cost efficiencies through the preparation of one combined report instead of two separate reports; and
|
|
•
|
eliminates duplicative disclosures and provides a more streamlined and readable presentation for our investors to review since a substantial portion of the Company's disclosure applies to both the Company and the Operating Partnership.
|
To help investors understand the differences between the Company and the Operating Partnership, this report provides the following separate disclosures for each of the Company and the Operating Partnership:
|
•
|
consolidated financial statements;
|
|
•
|
a single set of consolidated notes to such financial statements that includes separate discussions of each entity's stockholders' equity or partners' capital, as applicable; and
|
|
•
|
a combined Management's Discussion and Analysis of Financial Condition and Results of Operations section that includes distinct information related to each entity.
|
This report also includes separate Part II, Item 9A, Controls and Procedures sections and separate Exhibits 31 and 32 certifications for the Company and the Operating Partnership in order to establish that the requisite certifications have been made and that the Company and the Operating Partnership are both compliant with Rule 13a-15 and Rule 15d-15 of the Securities Exchange Act of 1934, as amended, and 18 U.S.C. §1350.
FIRST INDUSTRIAL REALTY TRUST, INC.
FIRST INDUSTRIAL, L.P.
TABLE OF CONTENTS
|
|
|
Page
|
|
Item 1.
|
||
|
Item 1A.
|
||
|
Item 1B.
|
||
|
Item 2.
|
||
|
Item 3.
|
||
|
Item 4.
|
||
|
Item 5.
|
||
|
Item 6.
|
||
|
Item 7.
|
||
|
Item 7A.
|
||
|
Item 8.
|
||
|
Item 9.
|
||
|
Item 9A.
|
||
|
Item 9B.
|
||
|
Item 10.
|
||
|
Item 11.
|
||
|
Item 12.
|
||
|
Item 13.
|
||
|
Item 14.
|
||
|
Item 15.
|
||
|
Item 16.
|
||
2
FORWARD-LOOKING STATEMENTS
This report may contain forward-looking statements within the meaning of Section 27A of the Securities Act of 1933, and Section 21E of the Securities Exchange Act of 1934 (the "Exchange Act"). We intend for such forward-looking statements to be covered by the safe harbor provisions for forward-looking statements contained in the Private Securities Litigation Reform Act of 1995. Forward-looking statements are based on certain assumptions and describe our future plans, strategies and expectations, and are generally identifiable by use of the words "believe," "expect," "plan," "intend," "anticipate," "estimate," "project," "seek," "target," "potential," "focus," "may," "will," "should" or similar words. Although we believe the expectations reflected in forward-looking statements are based upon reasonable assumptions, we can give no assurance that our expectations will be attained or that results will not materially differ. Factors which could have a materially adverse effect on our operations and future prospects include, but are not limited to:
|
•
|
changes in national, international, regional and local economic conditions generally and real estate markets specifically;
|
|
•
|
changes in legislation/regulation (including changes to laws governing the taxation of real estate investment trusts) and actions of regulatory authorities;
|
|
•
|
our ability to qualify and maintain our status as a real estate investment trust;
|
|
•
|
the availability and attractiveness of financing (including both public and private capital) and changes in interest rates;
|
|
•
|
the availability and attractiveness of terms of additional debt repurchases;
|
|
•
|
changes in our credit agency ratings;
|
|
•
|
our ability to comply with applicable financial covenants;
|
|
•
|
our competitive environment;
|
|
•
|
changes in supply, demand and valuation of industrial properties and land in our current and potential market areas;
|
|
•
|
difficulties in identifying and consummating acquisitions and dispositions;
|
|
•
|
our ability to manage the integration of properties we acquire;
|
|
•
|
potential liability relating to environmental matters;
|
|
•
|
defaults on or non-renewal of leases by our tenants;
|
|
•
|
decreased rental rates or increased vacancy rates;
|
|
•
|
higher-than-expected real estate construction costs and delays in development or lease-up schedules;
|
|
•
|
changes in general accounting principles, policies and guidelines applicable to real estate investment trusts; and
|
|
•
|
other risks and uncertainties described in Item 1A, "Risk Factors" and elsewhere in this report as well as those risks and uncertainties discussed from time to time in our other Exchange Act reports and in our other public filings with the Securities and Exchange Commission (the "SEC").
|
We caution you not to place undue reliance on forward-looking statements, which reflect our outlook only and speak only as of the date of this report. We assume no obligation to update or supplement forward-looking statements.
3
PART I
THE COMPANY
|
Item 1.
|
Business
|
Background
First Industrial Realty Trust, Inc. is a self-administered and fully integrated real estate company which owns, manages, acquires, sells, develops and redevelops industrial real estate. The Company is a Maryland corporation organized on August 10, 1993 and a real estate investment trust ("REIT") as defined in the Internal Revenue Code of 1986 (the "Code"). As of December 31, 2018, our in-service portfolio consisted of 171 bulk warehouse properties, 93 regional warehouse properties, 152 light industrial properties and 31 R&D/flex properties, containing an aggregate of approximately 60.7 million square feet of gross leasable area ("GLA") located in 21 states. Our in-service portfolio includes all properties that have reached stabilized occupancy (generally defined as properties that are 90% leased), developed and redeveloped properties one year from the date construction is completed and acquired properties that are at least 75% occupied at acquisition or one year from the acquisition date.
We began operations on July 1, 1994. The Company's operations are conducted primarily through the Operating Partnership, a Delaware limited partnership formed on November 23, 1993 of which the Company is the sole general partner (the "General Partner"), with an approximate 98.0% and 96.8% ownership interest ("General Partner Units") at December 31, 2018 and 2017, respectively. The Operating Partnership also conducts operations through the Other Real Estate Partnerships, numerous limited liability companies ("LLCs") and certain taxable REIT subsidiaries ("TRSs"), the operating data of which, together with that of the Operating Partnership, is consolidated with that of the Company as presented herein. The Company does not have any significant assets or liabilities other than its investment in the Operating Partnership and its 100% ownership interest in the general partners of the Other Real Estate Partnerships. Noncontrolling interest in the Operating Partnership of approximately 2.0% and 3.2% at December 31, 2018 and 2017, respectively, represents the aggregate partnership interest held by the limited partners thereof ("Limited Partner Units" and together with the General Partner Units, the "Units").
Profits, losses and distributions of the Operating Partnership, the LLCs, the Other Real Estate Partnerships and the TRSs are allocated to the general partner and the limited partners, the members or the shareholders, as applicable, of such entities in accordance with the provisions contained within their respective organizational documents.
We also own a 49% equity interest in, and provide various services to, a joint venture (the "Joint Venture") through a wholly owned subsidiary of the Operating Partnership. The Joint Venture is accounted for under the equity method of accounting. The operating data of the Joint Venture is not consolidated with that of the Company or the Operating Partnership as presented herein.
We utilize an operating approach which combines the effectiveness of decentralized, locally based property management, acquisition, sales and development functions with the cost efficiencies of centralized acquisition, sales and development support, capital markets expertise, asset management and fiscal control systems. At December 31, 2018, we had 145 employees.
Available Information
We maintain a website at www.firstindustrial.com. Information on this website shall not constitute part of this Form 10-K. Copies of our respective annual reports on Form 10-K, quarterly reports on Form 10-Q, current reports on Form 8-K and amendments to such reports are available without charge on our website as soon as reasonably practicable after such reports are filed with or furnished to the SEC. You may also read and copy any document filed at the public reference facilities of the SEC at 100 F Street, N.E., Washington, D.C. 20549. Please call the SEC at (800) SEC-0330 for further information about the public reference facilities. These documents also may be accessed through the SEC's Interactive Data Electronic Application via the SEC's home page on the Internet (www.sec.gov). In addition, the Company's Corporate Governance Guidelines, Code of Business Conduct and Ethics, Audit Committee Charter, Compensation Committee Charter and Nominating/Corporate Governance Committee Charter, along with supplemental financial and operating information prepared by us, are all available without charge on the Company's website or upon request to the Company. Amendments to, or waivers from, our Code of Business Conduct and Ethics that apply to our executive officers or directors will also be posted to our website. We also post or otherwise make available on our website from time to time other information that may be of interest to our investors. Please direct requests as follows:
First Industrial Realty Trust, Inc.
1 N. Wacker Drive, Suite 4200
Chicago, IL 60606
Attention: Investor Relations
4
Business Objectives and Growth Plans
Our fundamental business objective is to maximize the total return to the Company's stockholders and the Operating Partnership's partners through an increase in cash flows and increases in the value of our properties and operations. Our long-term business growth plans include the following elements:
|
•
|
Internal Growth.
We seek to grow internally by (i) increasing revenues by renewing or re-leasing spaces subject to expiring leases at higher rental levels; (ii) contractual rent escalations on our long-term leases; (iii) increasing occupancy levels at properties where vacancies exist and maintaining occupancy elsewhere; (iv) controlling and minimizing property operating and general and administrative expenses; and (v) renovating existing properties.
|
|
•
|
External Growth.
We seek to grow externally through (i) the development of industrial properties; (ii) the acquisition of portfolios of industrial properties or individual properties which meet our investment parameters within our target markets; (iii) the expansion of our properties; and (iv) possible additional joint venture investments.
|
|
•
|
Portfolio Enhancement.
We continually seek to upgrade our overall portfolio via new investments as well as through the sale of select assets that we believe do not exhibit favorable characteristics for long-term cash flow growth.
|
Our ability to pursue our long-term growth plans is affected by market conditions and our financial condition and operating capabilities. See "Summary of Significant Transactions in 2018" under Item 7,"Management's Discussion and Analysis of Financial Condition and Results of Operations."
Business Strategies
We utilize the following six strategies in connection with the operation of our business:
|
•
|
Organizational Strategy.
We implement our decentralized property operations strategy through the deployment of experienced regional management teams and local property managers. We provide acquisition, development and financing assistance, asset management oversight and financial reporting functions from our headquarters in Chicago, Illinois to support our regional operations. We believe the size of our portfolio enables us to realize operating efficiencies by spreading overhead among many properties and by negotiating purchasing discounts.
|
|
•
|
Market Strategy.
Our market strategy is to concentrate on the top industrial real estate markets in the United States. These markets have one or more of the following characteristics: (i) favorable industrial real estate fundamentals, including improving industrial demand and constrained supply that can lead to long-term rent growth; (ii) warehouse distribution markets with favorable economic and business environments that should benefit from increases in distribution activity driven by growth in global trade and local consumption; and (iii) sufficient size to provide ample opportunity for growth through incremental investments as well as offer asset liquidity.
|
|
•
|
Leasing and Marketing Strategy.
We have an operational management strategy designed to enhance tenant satisfaction and portfolio performance. We pursue an active leasing strategy, which includes broadly marketing available space, seeking to renew existing leases at higher rents per square foot and seeking leases which provide for the pass-through of property-related expenses to the tenant. We also have local and national marketing programs which focus on the business and real estate brokerage communities and multi-national tenants.
|
|
•
|
Acquisition/Development Strategy.
Our acquisition/development strategy is to invest in industrial properties in the top industrial real estate markets in the United States through the deployment of experienced regional management teams.
|
|
•
|
Disposition Strategy.
We continually evaluate local market conditions and property-related factors in all of our markets for purposes of identifying assets suitable for disposition.
|
|
•
|
Financing Strategy.
To finance acquisitions, developments and debt maturities, as market conditions permit, we may utilize a portion of proceeds from property sales, unsecured debt offerings, term loans, mortgage financings and line of credit borrowings under our $725.0 million unsecured revolving credit agreement (the "Unsecured Credit Facility"), and proceeds from the issuance, when and as warranted, of additional equity securities. We also continually evaluate joint venture arrangements as another source of capital to finance acquisitions and developments. As of
February 15, 2019
, we had approximately $713.4 million available for additional borrowings under the Unsecured Credit Facility.
|
5
Future Property Acquisitions, Developments and Property Sales
We have acquisition and development programs through which we seek to identify portfolio and individual industrial property acquisitions and developments. We also sell properties based on market conditions and property related factors. As a result, we are currently engaged in negotiations relating to the possible acquisition, development or sale of certain industrial properties in our portfolio.
When evaluating potential industrial property acquisitions and developments, as well as potential industrial property sales, we will consider such factors as: (i) the geographic area and type of property; (ii) the location, construction quality, condition and design of the property; (iii) the terms of tenant leases, including the potential for rent increases; (iv) the potential for economic growth and the general business, tax and regulatory environment of the area in which the property is located; (v) the occupancy and demand by tenants for properties of a similar type in the vicinity; (vi) competition from existing properties and the potential for the construction of new properties in the area; (vii) the potential for capital appreciation of the property; (viii) the ability to improve the property's performance through renovation; and (ix) the potential for expansion of the physical layout of the property and/or the number of sites.
Industry
Industrial properties are typically used for the design, assembly, packaging, storage and distribution of goods and/or the provision of services. As a result, the demand for industrial space in the United States is related to the level of economic output and consumption, including e-commerce fulfillment. Accordingly, the competition we face to lease our existing properties and acquire or develop new properties varies with the levels of these factors.
6
|
Item 1A.
|
Risk Factors
|
Our operations involve various risks that could adversely affect our business, including our financial condition, our results of operations, our cash flow, our liquidity, our ability to make distributions to holders of the Company's common stock and the Operating Partnership's Units, the market price of the Company's common stock and the market value of the Units. These risks, among others contained in our other filings with the SEC, include:
Disruptions in the financial markets could affect our ability to obtain financing and may negatively impact our liquidity, financial condition and operating results.
A significant amount of our existing indebtedness was issued through capital markets transactions. We anticipate that the capital markets could be a source of refinancing of our existing indebtedness in the future. This source of refinancing may not be available if volatility in or disruption of the capital markets occurs. From time to time, the capital and credit markets in the United States and other countries experience significant price volatility, dislocations and liquidity disruptions, which can cause the market prices of many securities and the spreads on prospective debt financings to fluctuate substantially. These circumstances can materially impact liquidity in the financial markets, making terms for certain financings less attractive, and in some cases result in the unavailability of financing. Furthermore, we could potentially lose access to available liquidity under our Unsecured Credit Facility if one or more participating lenders were to default on their commitments. If our ability to issue additional debt or equity securities or to borrow money under our Unsecured Credit Facility were to be impaired by volatility in or disruption of the capital markets, it could have a material adverse effect on our liquidity and financial condition.
In addition, price volatility in the capital and credit markets could make the valuation of our properties more difficult. There may be significant uncertainty in the valuation, or in the stability of the value, of our properties that could result in a substantial decrease in the value of our properties. As a result, we may not be able to recover the carrying amount of our properties, which may require us to recognize an impairment loss in earnings.
Real estate investments fluctuate in value depending on conditions in the general economy and the real estate industry. These conditions may limit our revenues and available cash.
The factors that affect the value of our real estate and the revenues we derive from our properties include, among other things:
|
•
|
general economic conditions;
|
|
•
|
local, regional, national and international economic conditions and other events and occurrences that affect the markets in which we own properties;
|
|
•
|
local conditions such as oversupply or a reduction in demand in an area;
|
|
•
|
increasing labor and material costs;
|
|
•
|
the ability to collect on a timely basis all rents from tenants;
|
|
•
|
changes in tenant operations, real estate needs and credit;
|
|
•
|
changes in interest rates and in the availability, cost and terms of mortgage funding;
|
|
•
|
zoning or other regulatory restrictions;
|
|
•
|
competition from other available real estate;
|
|
•
|
operating costs, including maintenance, insurance premiums and real estate taxes; and
|
|
•
|
other factors that are beyond our control.
|
Our investments in real estate assets are concentrated in the industrial sector, and the demand for industrial space in the United States is related to the level of economic output. Accordingly, reduced economic output may lead to lower occupancy rates for our properties. In addition, if any of our tenants experiences a downturn in its business that weakens its financial condition, delays lease commencement, fails to make rental payments when due, becomes insolvent or declares bankruptcy, the result could be a termination of the tenant's lease, which could adversely affect our cash flow from operations. These factors may be amplified by a disruption of financial markets or more general economic conditions.
7
Many real estate costs are fixed, even if income from properties decreases.
Our financial results depend on leasing space to tenants on terms favorable to us. Our income and funds available for distribution to our stockholders and Unitholders will decrease if a significant number of our tenants cannot pay their rent or we are unable to lease properties on favorable terms. In addition, if a tenant does not pay its rent, we may not be able to enforce our rights as landlord without delays and we may incur substantial legal costs. Costs associated with real property, such as real estate taxes and maintenance costs, generally are not reduced when circumstances cause a reduction in income from the property.
We may be unable to acquire properties on advantageous terms or acquisitions may not perform as we expect.
We have routinely acquired properties from third parties as conditions warrant and, as part of our business, we intend to continue to do so. The acquisition of properties entails various risks, including risks that our investments may not perform as expected and that our cost estimates for bringing an acquired property up to market standards, if necessary, may prove inaccurate. Further, we face significant competition for attractive investment opportunities from other well-capitalized real estate investors, including publicly-traded REITs and private investors. This competition increases as investments in real estate become attractive relative to other forms of investment. As a result of competition, we may be unable to acquire additional properties and purchase prices may increase. In addition, we expect to finance future acquisitions through a combination of borrowings under the Unsecured Credit Facility, proceeds from equity or debt offerings and debt originations and proceeds from property sales, which may not be available. Any of the above risks could adversely affect our financial condition, results of operations, cash flow and ability to make distributions to our stockholders and Unitholders, the market price of the Company's common stock and the market value of the Units.
We may obtain only limited warranties when we purchase a property and would have only limited recourse in the event our due diligence did not identify any issues that lower the value of our property.
The seller of a property often sells such property in its "as is" condition on a "where is" basis and "with all faults," without any warranties of merchantability or fitness for a particular use or purpose. In addition, purchase agreements may contain only limited warranties, representations and indemnifications that will only survive for a limited period after the closing. The purchase of properties with limited warranties increases the risk that we may lose some or all of our invested capital in the property as well as the loss of rental income from that property.
We may be unable to sell properties when appropriate or at all because real estate investments are not as liquid as certain other types of assets.
Real estate investments generally cannot be sold quickly, which could limit our ability to adjust our property portfolio in response to changes in economic conditions or in the performance of the portfolio. This could adversely affect our financial condition and our ability to service debt and make distributions to our stockholders and Unitholders. In addition, like other companies qualifying as REITs under the Code, our ability to sell assets may be restricted by tax laws that potentially result in punitive taxation on asset sales that fail to meet certain safe harbor rules or other criteria established under case law.
We may be unable to sell properties on advantageous terms.
We have routinely sold properties to third parties as conditions warrant and, as part of our business, we intend to continue to do so. However, our ability to sell properties on advantageous terms depends on factors beyond our control, including competition from other sellers and the availability of attractive financing for potential buyers. If we are unable to sell properties on favorable terms or to redeploy the proceeds in accordance with our business strategy, then our financial condition, results of operations, cash flow and ability to make distributions to our stockholders and Unitholders, the market price of the Company's common stock and the market value of the Units could be adversely affected. Further, if we sell properties by providing financing to purchasers, defaults by the purchasers would adversely affect our operations and financial condition.
8
We may be unable to complete development and re-development projects on advantageous terms.
As part of our business, we develop new properties and re-develop existing properties as conditions warrant. This part of our business involves significant risks, including the following:
|
•
|
we may not be able to obtain financing for these projects on favorable terms;
|
|
•
|
we may not complete construction on schedule or within budget;
|
|
•
|
we may not be able to obtain, or may experience delays in obtaining, all necessary zoning, land-use, building, occupancy and other governmental permits and authorizations;
|
|
•
|
contractor and subcontractor disputes, strikes, labor disputes or supply chain disruptions may occur; and
|
|
•
|
properties may perform below anticipated levels, producing cash flow below budgeted amounts, which may result in us paying too much for a property, cause the property to not be profitable and limit our ability to sell such properties to third parties.
|
To the extent these risks result in increased debt service expense, construction costs and delays in budgeted leasing, they could adversely affect our financial condition, results of operations, cash flow and ability to make distributions to our stockholders and Unitholders, the market price of the Company's common stock and the market value of the Units.
We may be unable to renew leases or find other lessees on advantageous terms or at all.
We are subject to the risks that, upon expiration, leases may not be renewed, the space subject to such leases may not be relet or the terms of renewal or reletting, including the cost of required renovations, may be less favorable than the expiring lease terms. If we were unable to promptly renew a significant number of expiring leases or to promptly relet the spaces covered by such leases, or if the rental rates upon renewal or reletting were significantly lower than the current rates, our financial condition, results of operation, cash flow and ability to make distributions to our stockholders and Unitholders, the market price of the Company's common stock and the market value of the Units could be adversely affected.
The Company might fail to qualify as a REIT under existing laws and/or federal income tax laws could change.
The Company intends to operate so as to qualify as a REIT under the Code, and we believe that the Company is organized and will operate in a manner that allows us to continue to do so. However, qualification as a REIT involves the satisfaction of numerous requirements, some of which must be met on a recurring basis. These requirements are established under highly technical and complex Code provisions. There are only limited judicial and administrative interpretations of these provisions, and they involve the determination of various factual matters and circumstances not entirely within our control.
If the Company were to fail to qualify as a REIT in any taxable year, the Company would be subject to federal income tax at corporate rates. This could result in a discontinuation or substantial reduction in distributions to our stockholders and Unitholders and could reduce the cash available to pay interest and principal on debt securities that we issue. Unless entitled to relief under certain statutory provisions, the Company would be disqualified from electing treatment as a REIT for the four taxable years following the year during which the Company failed to qualify.
9
The act to provide for reconciliation pursuant to titles II and V of the concurrent resolution on the budget for fiscal year 2018 commonly known as Tax Cuts and Jobs Act (the "TCJ Act"), which generally took effect for taxable years beginning on or after January 1, 2018 (subject to certain exceptions), made many significant changes to the U.S. federal income tax laws that profoundly impacted the taxation of individuals and corporations (including both regular C corporations and corporations that have elected to be taxed as REITs). Among other changes, the TCJ Act permanently reduced the generally applicable corporate tax rate, generally reduced the tax rate applicable to individuals and other non-corporate taxpayers for tax years beginning on or after January 1, 2018 and before January 1, 2026, eliminated or modified certain previously allowed deductions (including substantially limiting interest deductibility and, for individuals, the deduction for non-business state and local taxes), and, for taxable years beginning on or after January 1, 2018 and before January 1, 2026, provides for preferential rates of taxation through a deduction of up to 20% (subject to certain limitations) on most ordinary REIT dividends and certain trade or business income of non-corporate taxpayers. The TCJ Act also imposed new limitations on the deduction of net operating losses, which may result in the Company having to make additional taxable distributions to our stockholders in order to comply with REIT distribution requirements and avoid taxes on retained income and gains. A number of changes that affect noncorporate taxpayers will expire at the end of 2025 unless Congress acts to extend them. These changes will impact us and our shareholders in various ways, some of which are adverse or potentially adverse compared to prior law. To date, the IRS has issued only limited guidance with respect to certain of the new provisions, and there are numerous interpretive issues that will require guidance. It is highly likely that technical corrections legislation will be needed to clarify certain aspects of the new law and give proper effect to Congressional intent. There can be no assurance, however, that technical clarifications or changes needed to prevent unintended or unforeseen tax consequences will be enacted by Congress in the near future.
Additionally, since the IRS, the United States Treasury Department and Congress frequently review federal income tax legislation, we cannot predict whether, when or to what extent new federal laws, regulations, interpretations or rulings will be adopted. Additional changes to tax laws are likely to continue to occur in the future and any such legislative action may prospectively or retroactively modify the Company's tax treatment and therefore, may adversely affect taxation of us and/or our stockholders and Unitholders. Any such changes could have an adverse effect on an investment in shares or on the market value or the resale potential of our properties. Stockholders and Unitholders are urged to consult with their own tax advisor with respect to the impact of recent legislation, the status of legislative, regulatory, or administrative developments and proposals, and their potential effect on ownership of our shares.
Certain property transfers may generate prohibited transaction income, resulting in a penalty tax on the gain attributable to the transaction.
As part of our business, we sell properties to third parties as opportunities arise. Under the Code, a 100% penalty tax could be assessed on the tax gain recognized from sales of properties that are deemed to be prohibited transactions. The question of what constitutes a prohibited transaction is based on the facts and circumstances surrounding each transaction. The IRS could contend that certain sales of properties by us are prohibited transactions. While we have implemented controls to avoid prohibited transactions, if a dispute were to arise that was successfully argued by the IRS, the 100% penalty tax could be assessed against the Company's profits from these transactions.
The REIT distribution requirements may limit our ability to retain capital and require us to turn to external financing sources.
As a REIT, the Company must distribute to its stockholders at least 90% of its taxable income each year. The Company could, in certain instances, have taxable income without sufficient cash to enable it to meet this requirement. In that situation, we could be required to borrow funds or sell properties on adverse terms in order to do so. The distribution requirement could also limit our ability to accumulate capital to provide capital resources for our ongoing business, and to satisfy our debt repayment obligations and other liquidity needs, we may be more dependent on outside sources of financing, such as debt financing or issuances of additional capital stock, which may or may not be available on favorable terms. Additional debt financings may substantially increase our leverage and additional equity offerings may result in substantial dilution of stockholders' and Unitholders' interests.
We face possible state and local tax audits.
Because the Company is organized and qualifies as a REIT, we are generally not subject to federal income taxes, but we are subject to certain state and local taxes. In the normal course of business, certain entities through which we own real estate have undergone tax audits. Collectively, tax deficiency notices received to date from the jurisdictions conducting previous audits have not been material. However, there can be no assurance that future audits will not occur with increased frequency or that the ultimate result of such audits will not have a material adverse effect on our results of operations.
10
Failure to hedge effectively against interest rate changes may adversely affect our results of operations.
Subject to maintaining the Company's qualification as a REIT, we may seek to manage our exposure to interest rate volatility by using interest rate hedging arrangements, such as interest cap agreements, interest rate swap agreements and treasury locks. These agreements may fail to protect or could adversely affect us because, among other things:
|
•
|
interest rate hedging can be expensive, particularly during periods of rising and volatile interest rates;
|
|
•
|
available interest rate hedges may not correspond directly with the interest rate risk for which protection is sought;
|
|
•
|
the duration of the hedge may not match the duration of the related liability;
|
|
•
|
the amount of income that a REIT may earn from hedging transactions (other than through taxable REIT subsidiaries) is limited by U.S. federal tax provisions governing REITs;
|
|
•
|
the credit quality of the party owing money on the hedge may be downgraded to such an extent that it impairs our ability to sell or assign our side of the hedging transaction;
|
|
•
|
the party owing money in the hedging transaction may default on its obligation to pay;
|
|
•
|
we could incur significant costs associated with the settlement of the agreements;
|
|
•
|
the underlying transactions could fail to qualify as highly-effective cash flow hedges under generally accepted accounting practices; and
|
|
•
|
a court could rule that such an agreement is not legally enforceable.
|
We have adopted a practice relating to the use of derivative financial instruments to hedge interest rate risks related to our borrowings. This practice requires the Company's Board of Directors to authorize our use of derivative financial instruments to fix the interest rate on anticipated offerings of unsecured debt and to manage the interest rates on our variable rate borrowings. Our practice is that we do not use derivatives for speculative or trading purposes and intend only to enter into contracts with major financial institutions based on their credit rating and other factors, but the Company's Board of Directors may choose to change these practices in the future. Hedging may reduce the overall returns on our investments, which could reduce our cash available for distribution to our stockholders and Unitholders. Failure to hedge effectively against interest rate changes may materially adversely affect our financial condition, results of operations and cash flow.
Debt financing, the degree of leverage and rising interest rates could reduce our cash flow.
We use debt to increase the rate of return to our stockholders and Unitholders and to allow us to make more investments than we otherwise could. Our use of leverage presents an additional element of risk in the event that the cash flow from our properties is insufficient to meet both debt payment obligations and the distribution requirements of the REIT provisions of the Code. In addition, rising interest rates would reduce our cash flow by increasing the amount of interest due on our floating rate debt and on our fixed rate debt as it matures and is refinanced. Certain of our variable rate debt, including our revolving credit facility, currently uses LIBOR as a benchmark for establishing the interest rate. LIBOR is the subject of recent proposals for reform. Any changes to the methods by which LIBOR is determined, or any other reforms to LIBOR which may be enacted in the United Kingdom, the European Union or elsewhere may result in, among other things, a sudden or prolonged increase or decrease in LIBOR, a delay in the publication of LIBOR, and changes in the rules or methodologies in LIBOR, which may discourage market participants from continuing to administer or to participate in LIBOR’s determination, and, in certain situations, could result in LIBOR no longer being determined and published. If a published U.S. dollar LIBOR rate becomes unavailable for any reason, the interest rates on our debt which is indexed to LIBOR would be determined using various alternative methods, any of which may result in interest obligations which are more than or do not otherwise correlate over time with the payments that would have been made on such debt if U.S. dollar LIBOR was available in its current form. Further, the same costs and risks that may lead to the discontinuation or unavailability of U.S. dollar LIBOR may make one or more of the alternative methods impossible or impracticable to determine. Any of these proposals or consequences could have a material adverse effect on our financing costs. Our organizational documents do not contain any limitation on the amount or percentage of indebtedness we may incur.
11
Failure to comply with covenants in our debt agreements could adversely affect our financial condition.
The terms of our agreements governing our indebtedness require that we comply with a number of financial and other covenants, such as maintaining debt service coverage and leverage ratios and maintaining insurance coverage. Complying with such covenants may limit our operational flexibility. Our failure to comply with these covenants could cause a default under the applicable debt agreement even if we have satisfied our payment obligations. Consistent with our prior practice, we will continue to interpret and certify our performance under these covenants in a good faith manner that we deem reasonable and appropriate. However, these financial covenants are complex and there can be no assurance that these provisions would not be interpreted by the noteholders or lenders in a manner that could impose and cause us to incur material costs. Our ability to meet our financial covenants may be adversely affected if economic and credit market conditions limit our ability to reduce our debt levels consistent with, or result in net operating income below, our current expectations. Under our Unsecured Credit Facility, an event of default can also occur if the lenders, in their good faith judgment, determine that a material adverse change has occurred that could prevent timely repayment or materially impair our ability to perform our obligations under the loan agreement.
Upon the occurrence of an event of default, we would be subject to higher finance costs and fees, and the lenders under our Unsecured Credit Facility will not be required to lend any additional amounts to us. In addition, our indebtedness, together with accrued and unpaid interest and fees, could be accelerated and declared to be immediately due and payable. Furthermore, our Unsecured Credit Facility, our unsecured term loans and the indentures governing our senior unsecured notes contain certain cross-default provisions that may be triggered in the event that our other material indebtedness is in default. These cross-default provisions may require us to repay or restructure our Unsecured Credit Facility, our unsecured term loans or our senior unsecured notes (which includes our private placement notes), depending on which is in default, and such restructuring could adversely affect our financial condition, results of operations, cash flow and ability to make distributions to our stockholders and Unitholders, the market price of the Company's common stock and the market value of the Units. If repayment of any of our indebtedness is accelerated, we cannot provide assurance that we would be able to borrow sufficient funds to refinance such indebtedness or that we would be able to sell sufficient assets to repay such indebtedness. Even if we were able to obtain new financing, it may not be on commercially reasonable terms, or terms that are acceptable to us.
Cross-collateralization of mortgage loans could result in foreclosure on a significant portion of our properties if we are unable to service its indebtedness.
Certain of our mortgages were issued on a cross-collateralized basis. Cross-collateralization makes all of the subject properties available to the lender in order to satisfy the debt. To the extent indebtedness is cross-collateralized, lenders may seek to foreclose upon properties that do not comprise the primary collateral for a loan, which may, in turn, result in acceleration of other indebtedness collateralized by such properties. Foreclosure of properties would result in a loss of income and asset value to us, making it difficult for us to meet both debt payment obligations and the distribution requirements of the REIT provisions of the Code.
We may have to make lump-sum payments on our existing indebtedness.
We are required to make lump-sum or "balloon" payments under the terms of some of our indebtedness. Our ability to make required payments of principal on outstanding indebtedness, whether at maturity or otherwise, may depend on our ability to refinance the applicable indebtedness or to sell properties. Currently, we have no commitments to refinance any of our indebtedness.
Our mortgages may impact our ability to sell encumbered properties on advantageous terms or at all.
Certain of our mortgages contain, and some future mortgages may contain, substantial prepayment premiums that we would have to pay upon the sale of a property, thereby reducing the net proceeds to us from the sale of any such property. As a result, our willingness to sell certain properties and the price at which we may desire to sell a property may be impacted. If we are unable to sell properties on favorable terms or redeploy the proceeds of property sales in accordance with our business strategy, then our financial condition, results of operations, cash flow and ability to make distributions to our stockholders and Unitholders, the market price of the Company's common stock and the market value of the Units could be adversely affected.
Adverse market and economic conditions could cause us to recognize impairment charges.
We regularly review our real estate assets for impairment indicators, such as a decline in a property's occupancy rate, decline in general market conditions or a change in the expected hold period of an asset. If we determine that indicators of impairment are present, we review the properties affected by these indicators to determine whether an impairment charge is required. As a result, we may be required to recognize asset impairment, which could materially and adversely affect our business, financial condition and results of operations. We use considerable judgment in making determinations about impairments, from analyzing whether there are indicators of impairment, to the assumptions used in calculating the fair value of the investment. Accordingly, our subjective estimates and evaluations may not be accurate, and such estimates and evaluations are subject to change or revision.
12
Earnings and cash dividends, asset value and market interest rates affect the price of the Company's common stock.
The market value of the Company's common stock is based in large part upon the market's perception of the growth potential of the Company's earnings and cash dividends. The market value of the Company's common stock is also based upon the value of the Company's underlying real estate assets. For this reason, shares of the Company's common stock may trade at prices that are higher or lower than the Company's net asset value per share. To the extent that the Company retains operating cash flow for investment purposes, working capital reserves, or other purposes, these retained funds, while increasing the value of the Company's underlying assets, may not correspondingly increase the market price of the Company's common stock. The Company's failure to meet the market's expectations with regard to future earnings and the payment of cash dividends/distributions likely would adversely affect the market price of the Company's common stock. Further, the distribution yield on the common stock (as a percentage of the price of the common stock) relative to market interest rates may also influence the market price of the Company's common stock. An increase in market interest rates might lead prospective purchasers of the Company's common stock to expect a higher distribution yield, which would adversely affect the market price of the Company's common stock. Any reduction in the market price of the Company's common stock would, in turn, reduce the market value of the Units.
We may become subject to litigation.
We may become subject to litigation, including claims relating to our operations, offerings, and otherwise in the ordinary course of business. Some of these claims may result in significant defense costs and potentially significant judgments against us, some of which are not, or cannot be, insured against. Resolution of these types of matters could adversely impact our financial condition, results of operations and cash flow. Certain litigation or the resolution of certain litigation may affect the availability or cost of some of our insurance coverage, which could adversely impact our results of operations and cash flows, expose us to increased risks that would be uninsured, and/or adversely impact our ability to attract officers and directors.
We may incur unanticipated costs and liabilities due to environmental problems.
Under various federal, state and local laws, ordinances and regulations, we may, as an owner or operator of real estate, be liable for the costs of clean-up of certain conditions relating to the presence of hazardous or toxic materials on, in or emanating from a property and any related damages to natural resources. Environmental laws often impose liability without regard to whether the owner or operator knew of, or was responsible for, the presence of hazardous or toxic materials. The presence of such materials, or the failure to address those conditions properly, may adversely affect our ability to rent or sell a property or to borrow using a property as collateral. The disposal or treatment of hazardous or toxic materials, or the arrangement of such disposal or treatment, may cause us to be liable for the costs of clean-up of such materials or for related natural resource damages occurring at or emanating from an off-site disposal or treatment facility, whether or not the facility is owned or operated by us. No assurance can be given that existing environmental assessments with respect to any of our properties reveal all environmental liabilities, that any prior owner or operator of any of our properties did not create any material environmental condition not known to us or that a material environmental condition does not otherwise exist as to any of our properties. Moreover, there can be no assurance that (i) changes to existing laws, ordinances or regulations to address, among other things, climate change, will not impose any material environmental liability or (ii) the current environmental condition of our properties will not be affected by customers, by the condition of land or operations in the vicinity of our properties (such as releases from underground storage tanks), or by third-parties unrelated to us.
All of our properties were subject to a Phase I or similar environmental assessment by independent environmental consultants at the time of acquisition. Phase I assessments are intended to discover and evaluate information regarding the environmental condition of the surveyed property and surrounding properties. Phase I assessments generally include a historical review, a public records review, an investigation of the surveyed site and surrounding properties, and preparation and issuance of a written report, but do not include soil sampling or subsurface investigations and typically do not include an asbestos survey. While some of these assessments have led to further investigation and sampling, none of our environmental assessments of our properties have revealed an environmental liability that we believe would have a material adverse effect on our business, financial condition or results of operations taken as a whole. However, we cannot give any assurance that such conditions do not exist or may not arise in the future. Material environmental conditions, liabilities or compliance concerns may arise after the environmental assessment has been completed.
Environmental laws in the U.S. also require that owners or operators of buildings containing asbestos properly manage and maintain the asbestos, adequately inform or train those who may come into contact with asbestos and undertake special precautions, including removal or other abatement, in the event that asbestos is disturbed during building renovation or demolition. These laws may impose fines and penalties on building owners or operators who fail to comply with these requirements and may allow third-parties to seek recovery from owners or operators for personal injury associated with exposure to asbestos. Some of our properties may contain asbestos-containing building materials.
13
We invest in properties historically used for industrial, manufacturing and commercial purposes. Some of these properties contain, or may have contained, underground storage tanks for the storage of petroleum products and other hazardous or toxic substances. All of these operations create a potential for the release of petroleum products or other hazardous or toxic substances. Some of our properties are adjacent to or near other properties that may have contained or currently contain underground storage tanks used to store petroleum products, or other hazardous or toxic substances. In addition, previous or current occupants of our properties and adjacent properties may have engaged, or may in the future engage, in activities that may release petroleum products or other hazardous or toxic substances.
We have a portfolio environmental insurance policy that provides coverage for potential environmental liabilities, subject to the policy's coverage conditions and limitations, for most of our properties. From time to time, we may acquire properties or interests in properties, with known adverse environmental conditions where we believe that the environmental liabilities associated with these conditions are quantifiable and that the acquisition will yield a superior risk-adjusted return. In such an instance, we underwrite the costs of environmental investigation, clean-up and monitoring into the cost. Further, in connection with property dispositions, we may agree to remain responsible for, and to bear the cost of, remediating or monitoring certain environmental conditions on the properties.
Our insurance coverage does not include all potential losses.
Real property is subject to casualty risk including damage, destruction, or loss resulting from events that are unusual, sudden and unexpected. Some of our properties are located in areas where casualty risk is higher due to earthquake, wind and/or flood risk. We carry comprehensive insurance coverage to mitigate our casualty risk, in amounts and of a kind that we believe are appropriate for the markets where each of our properties and their business operations are located. Among other coverage, we carry property, boiler and machinery, general liability, cyber liability, fire, flood, terrorism, earthquake, extended coverage and rental loss insurance. Our coverage includes policy specifications and limits customarily carried for similar properties and business activities. We evaluate our level of insurance coverage and deductibles using analysis and modeling, as is customary in our industry. However, we do not insure against all types of casualty, and we may not fully insure against certain perils such as earthquake and cyber risk, either because coverage is not available or because we do not deem it to be economically feasible or prudent to do so. As a result, we could experience a significant loss of capital or revenues, and be exposed to obligations under recourse debt associated with a property. This could occur due to an uninsured or high deductible loss, a loss in excess of insured limits, or a loss not paid due to insurer insolvency.
We may incur significant costs complying with various federal, state and local laws, regulations and covenants that are applicable to our properties and, in particular, costs associated with complying with regulations such as the Americans with Disabilities Act of 1990 (the "ADA") may result in unanticipated expenses.
The properties in our portfolio are subject to various covenants and U.S. federal, state and local laws and regulatory requirements, including permitting and licensing requirements. Local regulations, including municipal or local ordinances, zoning restrictions and restrictive covenants imposed by community developers may restrict our use of our properties and may require us to obtain approval from local officials or restrict our use of our properties and may require us to obtain approval from local officials of community standards organizations at any time with respect to our properties, including prior to acquiring a property or when undertaking renovations of any of our existing properties. Among other things, these restrictions may relate to fire and safety, seismic or hazardous material abatement requirements. There can be no assurance that existing laws and regulatory policies will not adversely affect us or the timing or cost of any future acquisitions or renovations, or that additional regulation will not be adopted that increase such delays or result in additional costs. Our growth strategy may be affected by our ability to obtain permits, licenses and zoning relief. Our failure to obtain such permits, licenses and zoning relief or to comply with applicable laws could have an adverse effect on our financial condition, results of operations and cash flow.
In addition, under the ADA, all places of public accommodation are required to meet certain U.S. federal requirements related to access and use by disabled persons. Noncompliance with the ADA could result in an order to correct any non-complying feature, which could result in substantial capital expenditures. We do not conduct audits or investigations of all of these properties to determine their compliance and we cannot predict the ultimate cost of compliance with the ADA, or other legislation. If one or more of our properties in which we invest is not in compliance with the ADA, or other legislation, then we would be required to incur additional costs to bring the property into compliance. If we incur substantial costs to comply with the ADA or other legislation, our financial condition, results of operations, cash flow, our ability to satisfy debt service obligations and to make distributions to our stockholders and Unitholders, the market price of the Company's common stock and the market value of the Units could be adversely affected.
14
Terrorist attacks and other acts of violence or war may affect the market for the Company's common stock, the industry in which we conduct our operations and our profitability.
Acts of violence, including terrorist attacks could occur in the localities in which we conduct business. More generally, these events could cause consumer confidence and spending to decrease or result in increased volatility in the worldwide financial markets and economy. These attacks or armed conflicts may adversely impact our operations or financial condition. In addition, losses resulting from these types of events may be uninsurable.
We face risks relating to cybersecurity attacks that could cause loss of confidential information and other business
disruptions.
We rely extensively on computer systems to manage our business, and our business is at risk from and may be impacted by cybersecurity attacks and security breaches. These could include attempts to gain unauthorized access to our data and computer systems through malware, computer viruses, attachments to e-mails, persons inside our Company or persons with access to systems inside our Company, and other significant disruptions of our information technology networks and related systems.
The risk of a cybersecurity breach or disruption, particularly through a cyber incident, including by computer hackers, foreign governments and cyber terrorists, has generally increased as the number, intensity and sophistication of attempted attacks and intrusions from around the world have increased. Although we employ a number of measures to prevent, detect and mitigate these threats, which include password protection, frequent password change events, firewall detection systems, frequent backups, a redundant data system for core applications and annual penetration testing, even the most well protected information, networks, systems and facilities remain potentially vulnerable because the techniques used in such attempted security breaches evolve and generally are not recognized until launched against a target, and in some cases are designed to not be detected and, in fact, may not be detected. Accordingly, we may be unable to anticipate these techniques or to implement adequate security barriers or other preventative measures, and thus it is impossible for us to entirely mitigate this risk.
Moreover, although we maintain some of our own critical information technology systems, we also depend on third parties to provide important information technology services relating to, for instance, payroll, electronic communications and certain finance functions. The security measures employed by such third party service providers may prove to be ineffective at preventing breaches of their systems.
A successful cybersecurity attack could, among other things:
|
•
|
compromise the confidential information of our employees, tenants and vendors;
|
|
•
|
disrupt the proper functioning of our networks and systems, and therefore our operations and/or those of certain of our tenants;
|
|
•
|
result in our inability to maintain the building systems relied upon by our tenants for the efficient use of their leased space;
|
|
•
|
result in the unauthorized access to, and destruction, loss, theft, misappropriation or release of proprietary, confidential, sensitive or otherwise valuable information of ours or others, which others could use to compete against us or for disruptive, destructive or otherwise harmful purposes and outcomes;
|
|
•
|
result in misstated financial reports, violations of loan covenants and/or missed reporting deadlines;
|
|
•
|
result in our inability to properly monitor our compliance with the rules and regulations regarding our qualification as a REIT;
|
|
•
|
require significant management attention and resources to remedy any damages that result;
|
|
•
|
subject us to claims for breach of contract, damages, credits, penalties or termination of leases or other agreements; or
|
|
•
|
damage our reputation among our tenants, investors and associates.
|
15
Adverse changes in our credit ratings could negatively affect our liquidity and business operations.
The credit ratings of our senior unsecured notes are based on our operating performance, liquidity and leverage ratios, overall financial position and other factors employed by the credit rating agencies in their rating analyses. Our credit ratings can affect the availability, terms and pricing of any indebtedness we may incur or preferred stock that we might issue going forward. There can be no assurance that we will be able to maintain any credit rating and, in the event any credit rating is downgraded, we could incur higher borrowing costs or may be unable to access certain or any capital markets.
Our business could be adversely impacted if we have deficiencies in our disclosure controls and procedures or internal control over financial reporting.
The design and effectiveness of our disclosure controls and procedures and internal control over financial reporting may not prevent all errors, misstatements or misrepresentations. While management will continue to review the effectiveness of our disclosure controls and procedures and internal control over financial reporting, there can be no guarantee that our internal control over financial reporting will be effective in accomplishing all control objectives all of the time. Deficiencies, including any material weakness, in our internal control over financial reporting which may occur could result in misstatements of our results of operations, restatements of our financial statements, a decline in the price/value of our securities, or otherwise materially adversely affect our business, reputation, results of operations, financial condition or liquidity.
The Company is authorized to issue preferred stock. The issuance of preferred stock could adversely affect the holders of the Company's common stock issued pursuant to its public offerings.
Our declaration of trust authorizes the Company to issue 225,000,000 shares, of which 10,000,000 shares are designated as preferred stock. Subject to approval by the Company's Board of Directors, the Company may issue preferred stock with rights, preferences and privileges that are more beneficial than the rights, preferences and privileges of its common stock. Holders of the Company's common stock do not have preemptive rights to acquire any shares issued by the Company in the future. If the Company ever creates and issues preferred stock with a distribution preference over common stock, payment of any distribution preferences on outstanding preferred stock would reduce the amount of funds available for the payment of distributions to our common stockholders and Unitholders. In addition, holders of preferred stock are normally entitled to receive a preference payment in the event of liquidation, dissolution or winding up before any payment is made to our common stockholders, which would reduce the amount our common stockholders and Unitholders, might otherwise receive upon such an occurrence. Also, under certain circumstances, the issuance of preferred stock may have the effect of delaying or preventing a change in control of the Company.
The Company's Board of Directors may change its strategies, policies or procedures without stockholder approval, which may subject us to different and more significant risks in the future.
Our investment, financing, leverage and distribution policies and our policies with respect to all other activities, including growth, debt, capitalization and operations, are determined by the Company's Board of Directors. These policies may be amended or revised at any time and from time to time at the discretion of the Company's Board of Directors without notice to or a vote of its stockholders. This could result in us conducting operational matters, making investments or pursuing different business or growth strategies. Under these circumstances, we may expose ourselves to different and more significant risks in the future, which could have a material adverse effect on our business and growth. In addition, the Company's Board of Directors may change its governance policies provided that such changes are consistent with applicable legal requirements. A change in these policies could have an adverse effect on our financial condition, results of operations, cash flow, ability to satisfy our principal and interest obligations, ability to make distributions to our stockholders and Unitholders, the market price of the Company's common stock and the market value of the Units.
We may be unable to retain and attract key management personnel.
We may be unable to retain and attract talented executives. In the event of the loss of key management personnel or upon unexpected death, disability or retirement, we may not be able to find replacements with comparable skill, ability and industry expertise. Until suitable replacements are identified and retained, if at all, our operating results and financial condition could be materially and adversely affected.
16
We could be subject to risks and liabilities in connection with joint venture arrangements.
Our organizational documents do not limit the amount of available funds that we may invest in joint ventures. We have in the past and may in the future selectively acquire, own and/or develop properties through joint ventures with other persons or entities when we deem such transactions are warranted by the circumstances. Joint venture investments, in general, involve certain risks not present where we act alone, including:
|
•
|
joint venturers may share certain approval rights over major decisions, which might (i) significantly delay or make impossible actions and decisions we believe are necessary or advisable with respect to properties owned through a joint venture, and/or (ii) adversely affect our ability to develop, finance, lease or sell properties owned through a joint venture at the most advantageous time for us, if at all;
|
|
•
|
joint venturers might become bankrupt or otherwise fail to fund their share of any required capital contributions;
|
|
•
|
joint venturers might have economic or other business interests or goals that are competitive or inconsistent with our business interests or goals that would affect our ability to develop, finance, lease, operate, manage or sell any properties owned by the applicable joint venture;
|
|
•
|
joint venturers may have the power to act contrary to our instructions, requests, policies or objectives, including our current policy with respect to maintaining the Company's qualification as a REIT;
|
|
•
|
joint venture agreements often restrict the transfer of a member’s or joint venturer’s interest or may otherwise restrict our ability to sell our interest when we would like to or on advantageous terms;
|
|
•
|
disputes between us and our joint venturers may result in litigation or arbitration that would increase our expenses and prevent our officers and directors from focusing their time and effort on our business and subject the properties owned by the applicable joint venture to additional risk; and
|
|
•
|
we may in certain circumstances be liable for the actions of our joint venturers.
|
The occurrence of one or more of the events described above could adversely affect our financial condition, results of operations, cash flow and ability to make distributions to our stockholders and Unitholders, the market price of the Company's common stock and the market value of the Units.
|
Item 1B.
|
Unresolved SEC Comments
|
None.
|
Item 2.
|
Properties
|
General
At December 31, 2018, we owned 447 in-service industrial properties containing an aggregate of approximately 60.7 million square feet of GLA in 21 states, with a diverse base of more than 1,150 tenants engaged in a wide variety of businesses, including distribution, wholesale trade, professional services, manufacturing and retail. The average annual base rent per square foot on a portfolio basis, calculated at December 31, 2018, was $5.22. The properties are generally located in business parks that have convenient access to interstate highways and/or rail and air transportation. We maintain insurance on our properties that we believe is adequate.
We classify our properties into four industrial categories: bulk warehouse, regional warehouse, light industrial and R&D/flex. While some properties may have characteristics which fall under more than one property type, we use what we believe is the most dominant characteristic to categorize the property. Individual properties may be reclassified over time due to changes in building characteristics such as tenant use and office space build-out.
17
The following describes, generally, the different industrial categories:
|
•
|
Bulk warehouse buildings are of more than 100,000 square feet, have a ceiling height of at least 22 feet and are comprised of 5%-15% of office space;
|
|
•
|
Regional warehouses are of less than 100,000 square feet, have a ceiling height of at least 22 feet and are comprised of 5%-15% of office space;
|
|
•
|
Light industrial properties are of less than 100,000 square feet, have a ceiling height of 16-21 feet and are comprised of 5%-50% of office space; and
|
|
•
|
R&D/flex buildings are of less than 100,000 square feet, have a ceiling height of less than 16 feet and are comprised of 50% or more of office space.
|
The following tables summarize, by market, certain information as of December 31, 2018, with respect to the in-service properties.
In-Service Property Summary Totals
|
|
Bulk Warehouse
|
Regional
Warehouse
|
Light Industrial
|
R&D/Flex
|
Total
|
|||||||||||||||||||||||||||
|
Metropolitan Area
|
GLA
(in 000's) |
Number of
Properties
|
GLA
(in 000's) |
Number of
Properties
|
GLA
(in 000's) |
Number of
Properties
|
GLA
(in 000's) |
Number of
Properties
|
GLA
(in 000's) |
Number of
Properties
|
Occupancy
at 12/31/18
|
|||||||||||||||||||||
|
Atlanta, GA
|
3,859
|
|
13
|
|
340
|
|
4
|
|
347
|
|
5
|
|
—
|
|
—
|
|
4,546
|
|
22
|
|
94.5
|
%
|
||||||||||
|
Baltimore, MD
|
1,579
|
|
5
|
|
—
|
|
—
|
|
315
|
|
5
|
|
52
|
|
1
|
|
1,946
|
|
11
|
|
100.0
|
%
|
||||||||||
|
Central/Eastern PA
(A)
|
5,957
|
|
14
|
|
580
|
|
6
|
|
346
|
|
7
|
|
—
|
|
—
|
|
6,883
|
|
27
|
|
96.4
|
%
|
||||||||||
|
Chicago, IL
|
4,737
|
|
14
|
|
326
|
|
6
|
|
255
|
|
5
|
|
—
|
|
—
|
|
5,318
|
|
25
|
|
98.9
|
%
|
||||||||||
|
Cincinnati, OH
|
683
|
|
3
|
|
311
|
|
3
|
|
278
|
|
5
|
|
100
|
|
2
|
|
1,372
|
|
13
|
|
98.0
|
%
|
||||||||||
|
Cleveland, OH
|
1,128
|
|
6
|
|
—
|
|
—
|
|
—
|
|
—
|
|
—
|
|
—
|
|
1,128
|
|
6
|
|
100.0
|
%
|
||||||||||
|
Dallas/Ft. Worth, TX
|
3,781
|
|
24
|
|
483
|
|
6
|
|
971
|
|
17
|
|
—
|
|
—
|
|
5,235
|
|
47
|
|
98.6
|
%
|
||||||||||
|
Denver, CO
|
579
|
|
4
|
|
632
|
|
6
|
|
986
|
|
21
|
|
156
|
|
5
|
|
2,353
|
|
36
|
|
99.4
|
%
|
||||||||||
|
Detroit, MI
|
399
|
|
3
|
|
509
|
|
11
|
|
652
|
|
27
|
|
136
|
|
3
|
|
1,696
|
|
44
|
|
100.0
|
%
|
||||||||||
|
Houston, TX
|
2,592
|
|
12
|
|
377
|
|
5
|
|
470
|
|
8
|
|
—
|
|
—
|
|
3,439
|
|
25
|
|
99.9
|
%
|
||||||||||
|
Indianapolis, IN
|
1,968
|
|
6
|
|
603
|
|
7
|
|
125
|
|
4
|
|
20
|
|
1
|
|
2,716
|
|
18
|
|
99.3
|
%
|
||||||||||
|
Miami, FL
|
315
|
|
2
|
|
345
|
|
7
|
|
72
|
|
1
|
|
—
|
|
—
|
|
732
|
|
10
|
|
96.8
|
%
|
||||||||||
|
Milwaukee, WI
|
873
|
|
4
|
|
90
|
|
1
|
|
—
|
|
—
|
|
—
|
|
—
|
|
963
|
|
5
|
|
100.0
|
%
|
||||||||||
|
Minneapolis/St. Paul, MN
|
2,779
|
|
13
|
|
145
|
|
2
|
|
322
|
|
4
|
|
406
|
|
5
|
|
3,652
|
|
24
|
|
96.9
|
%
|
||||||||||
|
Nashville, TN
|
979
|
|
3
|
|
—
|
|
—
|
|
164
|
|
2
|
|
—
|
|
—
|
|
1,143
|
|
5
|
|
100.0
|
%
|
||||||||||
|
New Jersey
(A)
|
1,239
|
|
5
|
|
—
|
|
—
|
|
781
|
|
14
|
|
172
|
|
3
|
|
2,192
|
|
22
|
|
98.9
|
%
|
||||||||||
|
Orlando, FL
|
427
|
|
3
|
|
180
|
|
2
|
|
79
|
|
1
|
|
—
|
|
—
|
|
686
|
|
6
|
|
100.0
|
%
|
||||||||||
|
Phoenix, AZ
|
2,197
|
|
7
|
|
395
|
|
6
|
|
38
|
|
1
|
|
—
|
|
—
|
|
2,630
|
|
14
|
|
99.9
|
%
|
||||||||||
|
Seattle, WA
|
101
|
|
1
|
|
162
|
|
3
|
|
—
|
|
—
|
|
—
|
|
—
|
|
263
|
|
4
|
|
100.0
|
%
|
||||||||||
|
Southern California
(A)
|
6,383
|
|
21
|
|
1,156
|
|
18
|
|
825
|
|
21
|
|
—
|
|
—
|
|
8,364
|
|
60
|
|
99.6
|
%
|
||||||||||
|
St. Louis, MO
|
1,238
|
|
2
|
|
—
|
|
—
|
|
65
|
|
1
|
|
192
|
|
2
|
|
1,495
|
|
5
|
|
98.9
|
%
|
||||||||||
|
Tampa, FL
|
210
|
|
1
|
|
—
|
|
—
|
|
83
|
|
3
|
|
217
|
|
9
|
|
510
|
|
13
|
|
95.1
|
%
|
||||||||||
|
Other
(B)
|
1,440
|
|
5
|
|
—
|
|
—
|
|
—
|
|
—
|
|
—
|
|
—
|
|
1,440
|
|
5
|
|
100.0
|
%
|
||||||||||
|
Total
|
45,443
|
|
171
|
|
6,634
|
|
93
|
|
7,174
|
|
152
|
|
1,451
|
|
31
|
|
60,702
|
|
447
|
|
98.5
|
%
|
||||||||||
|
Occupancy by Industrial Property Type
|
98.6
|
%
|
99.5
|
%
|
97.1
|
%
|
94.7
|
%
|
98.5
|
%
|
||||||||||||||||||||||
_______________
|
(A)
|
Central/Eastern PA includes the markets of Central Pennsylvania and Philadelphia. New Jersey includes the markets of Northern and Southern New Jersey. Southern California includes the markets of Los Angeles, the Inland Empire and San Diego.
|
|
(B)
|
Properties are located in Kansas City, MO; Jefferson County, KY; Greenville, KY; Winchester, VA; and Salt Lake City, UT.
|
Indebtedness
As of December 31, 2018, 102 of our 447 in-service industrial properties, with a net carrying value of $459.2 million, are pledged as collateral under our mortgage financings, totaling $297.7 million, excluding unamortized debt issuance costs. See Note 4 to the Consolidated Financial Statements and the accompanying Schedule III beginning on page S-1 for additional information.
18
Property Acquisitions
During the year ended December 31, 2018, we acquired ten industrial properties and several land parcels for an aggregate purchase price of approximately $167.5 million. The industrial properties were acquired at an expected stabilized capitalization rate of approximately 5.7%. The capitalization rate for these industrial property acquisitions was calculated using the estimated stabilized net operating income (excluding straight-line rent and above and below market lease amortization) and dividing it by the sum of the purchase price plus closing costs and estimated costs to stabilize the properties. The acquired industrial properties have the following characteristics:
|
Metropolitan Area
|
Number of
Properties
|
GLA
|
Property Type
|
Occupancy
at 12/31/18
|
||||||||
|
Houston, TX
|
2
|
|
334,360
|
|
Bulk Warehouse
|
10
|
%
|
(A)
|
||||
|
New Jersey
|
1
|
|
119,922
|
|
Bulk Warehouse
|
100
|
%
|
|||||
|
Orlando, FL
|
1
|
|
93,608
|
|
Regional Warehouse
|
100
|
%
|
|||||
|
Seattle, WA
|
2
|
|
91,468
|
|
Regional Warehouse
|
38
|
%
|
|||||
|
Southern California
|
4
|
|
396,045
|
|
Bulk Warehouse, Regional Warehouse
|
57
|
%
|
|||||
|
Total
|
10
|
|
1,035,403
|
|
||||||||
(A)
As of December 31, 2018, percentage leased was 92%.
Development Activity
During the year ended December 31, 2018, we completed and placed in-service eight developments totaling approximately 3.5 million square feet of GLA at a total cost of approximately $226.6 million. Included in the total cost is $11.7 million of leasing commissions. The capitalization rate for these development projects, calculated using the estimated stabilized net operating income (excluding straight-line rent adjustments) divided by the total investment in the developed property is 7.9%. The placed in-service development projects have the following characteristics:
|
Metropolitan Area
|
Number of
Properties
|
GLA
|
Property Type
|
Occupancy
at 12/31/18
|
|||||||
|
Chicago, IL
|
1
|
|
602,348
|
|
Bulk Warehouse
|
100
|
%
|
||||
|
Phoenix, AZ
|
1
|
|
643,798
|
|
Bulk Warehouse
|
100
|
%
|
||||
|
Southern California
|
6
|
|
2,208,414
|
|
Bulk Warehouse, Regional Warehouse
|
100
|
%
|
||||
|
Total
|
8
|
|
3,454,560
|
|
|||||||
As of December 31, 2018, we substantially completed six developments totaling approximately 1.8 million square feet of GLA. The estimated total investment for the six developments is approximately $129.2 million, of which $115.3 million has been incurred as of December 31, 2018. There can be no assurance that the actual completion cost for these developments will not exceed the estimated completion cost. The substantially completed developments have the following characteristics:
|
Metropolitan Area
|
Number of
Properties
|
GLA
|
Property Type
|
Occupancy
at 12/31/18
|
||||||
|
Central/Eastern PA
|
2
|
|
988,920
|
|
Bulk Warehouse
|
0%
|
||||
|
Chicago, IL
|
1
|
|
355,199
|
|
Bulk Warehouse
|
0%
|
||||
|
Houston, TX
|
1
|
|
126,250
|
|
Bulk Warehouse
|
0%
|
||||
|
Southern California
|
2
|
|
358,065
|
|
Bulk Warehouse
|
0%
|
||||
|
Total
|
6
|
|
1,828,434
|
|
||||||
19
As of December 31, 2018, we have seven development projects that are under construction totaling approximately 2.8 million square feet of GLA. The estimated total investment for the seven development projects under construction is $189.4 million, of which $61.0 million has been incurred as of December 31, 2018. There can be no assurance that the actual completion cost for these developments will not exceed the estimated completion cost. The development projects under construction have the following characteristics:
|
Metropolitan Area
|
Number of
Properties
|
GLA
|
Property Type
|
Anticipated Quarter of Building Completion
|
||||||
|
Seattle, WA
|
1
|
|
66,751
|
|
Regional Warehouse
|
Q2 2019
|
||||
|
Dallas/Fort Worth, TX
|
2
|
|
345,280
|
|
Bulk Warehouse
|
Q2 2019
|
||||
|
Denver, CO
|
1
|
|
555,840
|
|
Bulk Warehouse
|
Q3 2019
|
||||
|
Southern California
|
1
|
|
239,950
|
|
Bulk Warehouse
|
Q3 2019
|
||||
|
Atlanta, GA
|
1
|
|
703,080
|
|
Bulk Warehouse
|
Q3 2019
|
||||
|
Dallas/Fort Worth, TX
|
1
|
|
863,328
|
|
Bulk Warehouse
|
Q4 2019
|
||||
|
Total
|
7
|
|
2,774,229
|
|
||||||
Property Sales
During the year ended December 31, 2018, we sold 53 industrial properties comprising approximately 2.6 million square feet of GLA, at a weighted average capitalization rate of 6.3%, and several land parcels for total gross sales proceeds of approximately $192.0 million. The capitalization rate for the 53 industrial property sales is calculated by taking revenues of the property (excluding straight-line rent, lease inducement amortization, above and below market lease amortization and insurance proceeds, other than business interruption insurance proceeds) less operating expenses of the property for a period of the last twelve full months prior to sale and dividing the sum by the sales price of the property. The sold industrial properties have the following characteristics:
|
Metropolitan Area
|
Number of
Properties
|
GLA
|
Property Type
|
|||||
|
Atlanta, GA
|
1
|
|
364,000
|
|
Regional Warehouse
|
|||
|
Baltimore/Washington
|
7
|
|
322,239
|
|
R & D/Flex, Regional Warehouse, Light Industrial
|
|||
|
Chicago, IL
|
1
|
|
85,955
|
|
R & D/Flex
|
|||
|
Dallas/Ft. Worth, TX
|
18
|
|
445,559
|
|
R & D/Flex, Regional Warehouse, Light Industrial
|
|||
|
Denver, CO
|
4
|
|
145,700
|
|
Light Industrial
|
|||
|
Detroit, MI
|
2
|
|
29,006
|
|
Light Industrial
|
|||
|
Indianapolis, IN
|
1
|
|
54,000
|
|
Light Industrial
|
|||
|
Miami, FL
(A)
|
1
|
|
9,500
|
|
Light Industrial
|
|||
|
New Jersey
|
2
|
|
196,026
|
|
Regional Warehouse, Light Industrial
|
|||
|
Phoenix, AZ
|
2
|
|
210,417
|
|
Bulk Warehouse, Regional Warehouse
|
|||
|
Southern California
|
2
|
|
142,241
|
|
Regional Warehouse, Light Industrial
|
|||
|
St. Louis, MO
|
4
|
|
317,109
|
|
Light Industrial
|
|||
|
Tampa, FL
|
8
|
|
266,362
|
|
R & D/Flex, Light Industrial
|
|||
|
Total
|
53
|
|
2,588,114
|
|
||||
(A)
Partial sale of a 0.1 million square-foot industrial property.
20
Tenant and Lease Information
We have a diverse base of more than 1,150 tenants engaged in a wide variety of businesses including distribution, wholesale trade, professional services, manufacturing and retail. At December 31, 2018, our leases have a weighted average lease length of 6.8 years and the majority provide for periodic rent increases that are either fixed or based on changes in the Consumer Price Index. Industrial tenants typically have net or semi-net leases and pay as additional rent their percentage of the property's operating costs, including the costs of common area maintenance, utilities, property taxes and insurance. As of December 31, 2018, approximately 98.5% of the GLA of our in-service properties was leased, and no single tenant or group of related tenants accounted for more than 2.6% of our rent revenues, nor did any single tenant or group of related tenants occupy more than 2.3% of the total GLA of our in-service properties.
Leasing Activity
The following table provides a summary of our leasing activity for the year ended December 31, 2018. The table does not include month-to-month leases or leases with terms less than twelve months.
|
Number of
Leases
Commenced
|
Square Feet
Commenced
(in 000's)
|
Net Rent Per
Square Foot
(A)
|
Straight Line Basis
Rent Growth
(B)
|
Weighted
Average Lease
Term
(C)
|
Lease Costs
Per Square
Foot
(D)
|
Weighted
Average Tenant
Retention
(E)
|
||||||||||||||||
|
New Leases
|
128
|
|
2,342
|
|
$
|
5.82
|
|
21.1
|
%
|
6.2
|
|
$
|
5.10
|
|
N/A
|
|
||||||
|
Renewal Leases
|
187
|
|
7,421
|
|
$
|
5.11
|
|
20.4
|
%
|
4.5
|
|
$
|
1.43
|
|
82.8
|
%
|
||||||
|
Development / Acquisition Leases
|
18
|
|
3,485
|
|
$
|
5.39
|
|
N/A
|
|
8.8
|
|
N/A
|
|
N/A
|
|
|||||||
|
Total / Weighted Average
|
333
|
|
13,248
|
|
$
|
5.31
|
|
20.6
|
%
|
5.9
|
|
$
|
2.31
|
|
82.8
|
%
|
||||||
_______________
|
(A)
|
Net rent is the average base rent calculated in accordance with GAAP, over the term of the lease.
|
|
(B)
|
Straight Line basis rent growth is a ratio of the change in net rent (including straight-line rent adjustments) on a new or renewal lease compared to the net rent (including straight-line rent adjustments) of the comparable lease. New leases where there were no prior comparable leases are excluded.
|
|
(C)
|
The lease term is expressed in years. Assumes no exercise of lease renewal options, if any.
|
|
(D)
|
Lease costs are comprised of the costs incurred or capitalized for improvements of vacant and renewal spaces, as well as the commissions paid and costs capitalized for leasing transactions. Lease costs per square foot represent the total turnover costs expected to be incurred on the leases signed during the period and do not reflect actual expenditures for the period.
|
|
(E)
|
Represents the weighted average square feet of tenants renewing their respective leases.
|
The following table provides a summary of our leases that commenced during the year ended December 31, 2018, which included rent concessions during the lease term.
|
Number of
Leases
With Rent Concessions
|
Square Feet
(in 000's)
|
Rent Concessions ($)
|
|||||||
|
New Leases
|
74
|
|
1,601
|
|
$
|
2,071
|
|
||
|
Renewal Leases
|
12
|
|
422
|
|
$
|
688
|
|
||
|
Development / Acquisition Leases
|
17
|
|
3,467
|
|
$
|
7,392
|
|
||
|
Total
|
103
|
|
5,490
|
|
$
|
10,151
|
|
||
21
Lease Expirations
Fundamentals for the United States industrial real estate market remained favorable in 2018, as continued growth in the general economy, including e-commerce supply chain activity, drove additional demand for space. New industrial space continued to be developed in response to this growth in demand. Incremental demand exceeded new supply in 2018, with net absorption exceeding 200 million square feet nationally for the sixth consecutive year. National vacancy levels remained low and the overall industry conditions resulted in environments supportive of rental rate growth in virtually all of our markets. Based on our recent experience, a new supply/demand environment near equilibrium, and the 2019 forecast from a leading national research company, we expect our average net rental rates for renewal leases on a cash basis to be higher than the expiring rates. For 2019, net rental rates for new leases on a cash basis on average are also expected to be higher than the comparative prior leases, primarily due to the improvement in market conditions as compared to the conditions prevailing when the comparative leases were structured. The following table shows scheduled lease expirations for all leases for our in-service properties as of December 31, 2018.
|
Year of Expiration
(A)
|
Number of
Leases
Expiring
|
GLA
Expiring
(B)
|
Percentage
of GLA
Expiring
(B)
|
Annualized Base Rent
Under
Expiring
Leases
(In thousands)
(C)
|
Percentage
of Total
Annualized
Base Rent
Expiring
(C)
|
|||||||||||
|
2019
|
158
|
|
4,250,316
|
|
7
|
%
|
$
|
21,729
|
|
7
|
%
|
|||||
|
2020
|
222
|
|
7,290,840
|
|
12
|
%
|
38,731
|
|
13
|
%
|
||||||
|
2021
|
240
|
|
10,170,890
|
|
17
|
%
|
51,266
|
|
17
|
%
|
||||||
|
2022
|
163
|
|
6,363,198
|
|
11
|
%
|
32,996
|
|
11
|
%
|
||||||
|
2023
|
174
|
|
7,929,705
|
|
13
|
%
|
40,506
|
|
14
|
%
|
||||||
|
2024
|
100
|
|
5,973,426
|
|
10
|
%
|
29,181
|
|
10
|
%
|
||||||
|
2025
|
48
|
|
4,707,745
|
|
8
|
%
|
22,478
|
|
7
|
%
|
||||||
|
2026
|
38
|
|
4,086,190
|
|
7
|
%
|
17,432
|
|
6
|
%
|
||||||
|
2027
|
16
|
|
2,720,602
|
|
5
|
%
|
13,992
|
|
5
|
%
|
||||||
|
2028
|
12
|
|
1,765,484
|
|
3
|
%
|
8,445
|
|
3
|
%
|
||||||
|
Thereafter
|
24
|
|
3,894,574
|
|
7
|
%
|
20,637
|
|
7
|
%
|
||||||
|
Total
|
1,195
|
|
59,152,970
|
|
100
|
%
|
$
|
297,393
|
|
100
|
%
|
|||||
_______________
|
(A)
|
Includes leases that expire on or after January 1, 2019 and assumes tenants do not exercise existing renewal, termination or purchase options.
|
|
(B)
|
Does not include existing vacancies of 931,314 aggregate square feet and December 31, 2018 move outs of 618,032 aggregate square feet.
|
|
(C)
|
Annualized base rent is calculated as monthly base rent (cash basis) per the terms of the lease, as of December 31, 2018, multiplied by 12. If free rent is granted, then the first positive rent value is used.
|
|
Item 3.
|
Legal Proceedings
|
We are involved in legal proceedings arising in the ordinary course of business. All such proceedings, taken together, are not expected to have a material impact on our results of operations, financial position or liquidity.
|
Item 4.
|
Mine Safety Disclosures
|
None.
22
PART II
|
Item 5.
|
Market for Registrant's Common Equity / Partners' Capital, Related Stockholder / Unitholder Matters and Issuer Purchases of Equity Securities
|
Market Information
The following table sets forth, for the periods indicated, the high and low closing prices per share of the Company's common stock, which trades on the New York Stock Exchange under the trading symbol "FR" and the dividends declared per share for the Company's common stock and the distributions declared per Unit for the Operating Partnership's Units. There is no established public trading market for the Units.
|
Quarter Ended
|
Closing High
|
Closing Low
|
Dividend/Distribution
Declared
|
|||||||||
|
December 31, 2018
|
$
|
32.40
|
|
$
|
27.60
|
|
$
|
0.2175
|
|
|||
|
September 30, 2018
|
$
|
33.87
|
|
$
|
30.78
|
|
$
|
0.2175
|
|
|||
|
June 30, 2018
|
$
|
33.67
|
|
$
|
28.58
|
|
$
|
0.2175
|
|
|||
|
March 31, 2018
|
$
|
31.17
|
|
$
|
27.75
|
|
$
|
0.2175
|
|
|||
|
December 31, 2017
|
$
|
32.82
|
|
$
|
30.49
|
|
$
|
0.2100
|
|
|||
|
September 30, 2017
|
$
|
31.74
|
|
$
|
28.21
|
|
$
|
0.2100
|
|
|||
|
June 30, 2017
|
$
|
30.04
|
|
$
|
26.88
|
|
$
|
0.2100
|
|
|||
|
March 31, 2017
|
$
|
28.66
|
|
$
|
25.35
|
|
$
|
0.2100
|
|
|||
As of February 15, 2019, the Company had 397 common stockholders of record. The number of holders does not include individuals or entities who beneficially own shares but whose shares are held of record by a broker or clearing agency, but does include each such broker or clearing agency as one record holder. The Operating Partnership had 117 holders of record of Units registered with our transfer agent.
In order to comply with the REIT requirements of the Code, the Company is generally required to make common share distributions and preferred share distributions (other than capital gain distributions) to its shareholders in amounts that together at least equal i) the sum of a) 90% of the Company's "REIT taxable income" computed without regard to the dividends paid deduction and net capital gains and b) 90% of net income (after tax), if any, from foreclosure property, minus ii) certain excess non-cash income.
Our dividend/distribution policy is determined by the Company's Board of Directors and is dependent on multiple factors, including cash flow and capital expenditure requirements, as well as ensuring that the Company meets the minimum distribution requirements set forth in the Code. The Company met the minimum distribution requirements with respect to 2018.
Holders of Units are entitled to receive distributions when, as and if declared by the Company's Board of Directors, after the priority distributions required under the Operating Partnership's partnership agreement have been made with respect to preferred partnership interests in the Operating Partnership out of any funds legally available for that purpose.
During the year ended December 31, 2018, the Operating Partnership did not issue any Limited Partner Units.
Subject to certain lock-up periods, holders of Limited Partner Units can redeem their Units by providing written notification to the General Partner of the Operating Partnership. Unless the General Partner provides notice of a redemption restriction to the holder, redemption must be made within seven business days after receipt of the holder's notice. The redemption can be effectuated, as determined by the General Partner, either by exchanging the Limited Partner Units for shares of common stock of the Company on a one-for-one basis, subject to adjustment, or by paying cash equal to the fair market value of such shares. Prior requests for redemption have generally been fulfilled with shares of common stock of the Company, and the Operating Partnership intends to continue this practice. If each Limited Partner Unit of the Operating Partnership were redeemed as of December 31, 2018, the Operating Partnership could satisfy its redemption obligations by making an aggregate cash payment of approximately $75.7 million or by issuing 2,624,167 shares of the Company's common stock.
23
Performance Graph
The following graph provides a comparison of the cumulative total stockholder return among the Company, the FTSE NAREIT Equity REIT Total Return Index (the "NAREIT Index") and the Standard & Poor's 500 Index ("S&P 500"). The NAREIT Index represents the performance of our publicly traded industrial REIT peers. The historical information set forth below is not necessarily indicative of future performance.
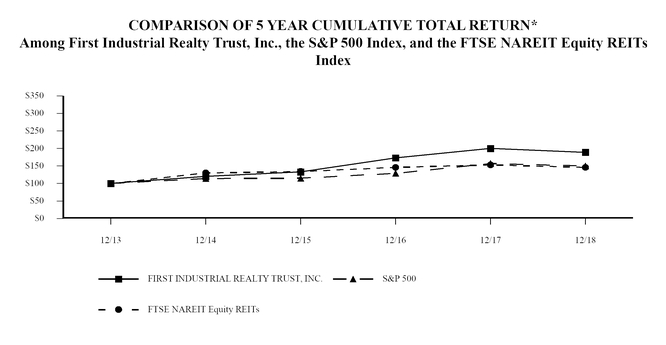
|
*
|
$100 invested on 12/31/13 in stock or index, including reinvestment of dividends. Fiscal year ending December 31.
|
|
|
12/13
|
12/14
|
12/15
|
12/16
|
12/17
|
12/18
|
|||||||||||||||||
|
FIRST INDUSTRIAL REALTY TRUST, INC.
|
$
|
100.00
|
|
$
|
120.39
|
|
$
|
132.80
|
|
$
|
173.25
|
|
$
|
200.06
|
|
$
|
188.79
|
|
|||||
|
S&P 500
|
$
|
100.00
|
|
$
|
113.69
|
|
$
|
115.26
|
|
$
|
129.05
|
|
$
|
157.22
|
|
$
|
150.33
|
|
|||||
|
FTSE NAREIT Equity REITs
|
$
|
100.00
|
|
$
|
130.14
|
|
$
|
134.30
|
|
$
|
145.74
|
|
$
|
153.36
|
|
$
|
146.27
|
|
|||||
_______________
|
*
|
The information provided in this performance graph shall not be deemed to be “soliciting material,” to be “filed” or to be incorporated by reference into any filing under the Securities Act of 1933 or the Securities Exchange Act of 1934 unless specifically treated as such.
|
24
|
Item 6.
|
Selected Financial Data
|
The following tables set forth the selected financial and operating data for the Company and the Operating Partnership on a consolidated basis. The following selected consolidated financial data should be read in conjunction with the Consolidated Financial Statements and Notes thereto and Management's Discussion and Analysis of Financial Condition and Results of Operations included elsewhere in this Form 10-K.
The Company
|
Year Ended
12/31/18
|
Year Ended
12/31/17
|
Year Ended
12/31/16
|
Year Ended
12/31/15
|
Year Ended
12/31/14
|
|||||||||||||||
|
|
(In thousands, except per share data)
|
||||||||||||||||||
|
Statement of Operations Data:
|
|||||||||||||||||||
|
Total Revenues
|
$
|
403,954
|
|
$
|
396,402
|
|
$
|
378,020
|
|
$
|
365,823
|
|
$
|
346,709
|
|
||||
|
Income from Continuing Operations
|
167,334
|
|
208,301
|
|
125,684
|
|
76,705
|
|
23,182
|
|
|||||||||
|
Net Income Available to First Industrial Realty Trust, Inc.'s Common Stockholders and Participating Securities
|
163,239
|
|
201,456
|
|
121,232
|
|
73,802
|
|
46,629
|
|
|||||||||
|
Basic Per Share Data:
|
|||||||||||||||||||
|
Income from Continuing Operations Available to First Industrial Realty Trust, Inc.'s Common Stockholders
|
$
|
1.31
|
|
$
|
1.70
|
|
$
|
1.05
|
|
$
|
0.67
|
|
$
|
0.18
|
|
||||
|
Net Income Available to First Industrial Realty Trust, Inc.'s Common Stockholders
|
1.31
|
|
1.70
|
|
1.05
|
|
0.67
|
|
0.42
|
|
|||||||||
|
Diluted Per Share Data:
|
|||||||||||||||||||
|
Income from Continuing Operations Available to First Industrial Realty Trust, Inc.'s Common Stockholders
|
$
|
1.31
|
|
$
|
1.69
|
|
$
|
1.05
|
|
$
|
0.66
|
|
$
|
0.18
|
|
||||
|
Net Income Available to First Industrial Realty Trust, Inc.'s Common Stockholders
|
1.31
|
|
1.69
|
|
1.05
|
|
0.66
|
|
0.42
|
|
|||||||||
|
Dividends/Distributions Per Share
|
$
|
0.87
|
|
$
|
0.84
|
|
$
|
0.76
|
|
$
|
0.51
|
|
$
|
0.41
|
|
||||
|
Basic Weighted Average Shares
|
123,804
|
|
118,272
|
|
115,030
|
|
110,352
|
|
109,922
|
|
|||||||||
|
Diluted Weighted Average Shares
|
124,191
|
|
118,787
|
|
115,370
|
|
110,781
|
|
110,325
|
|
|||||||||
|
Balance Sheet Data (End of Period):
|
|||||||||||||||||||
|
Real Estate, Before Accumulated Depreciation
|
$
|
3,673,644
|
|
$
|
3,495,745
|
|
$
|
3,384,914
|
|
$
|
3,293,968
|
|
$
|
3,183,369
|
|
||||
|
Total Assets
|
3,142,691
|
|
2,941,062
|
|
2,793,263
|
|
2,709,808
|
|
2,574,911
|
|
|||||||||
|
Indebtedness
|
1,297,783
|
|
1,296,997
|
|
1,347,092
|
|
1,434,168
|
|
1,342,762
|
|
|||||||||
|
Total Equity
|
1,679,911
|
|
1,475,877
|
|
1,284,625
|
|
1,115,135
|
|
1,090,827
|
|
|||||||||
|
Cash Flow Data:
|
|||||||||||||||||||
|
Cash Flow From Operating Activities
|
$
|
210,495
|
|
$
|
192,562
|
|
$
|
173,889
|
|
$
|
162,149
|
|
$
|
137,609
|
|
||||
|
Cash Flow From Investing Activities
|
(223,398
|
)
|
(82,495
|
)
|
(122,395
|
)
|
(175,898
|
)
|
(67,240
|
)
|
|||||||||
|
Cash Flow From Financing Activities
|
16,794
|
|
(85,046
|
)
|
(57,025
|
)
|
29,426
|
|
(66,599
|
)
|
|||||||||
|
Other Data:
|
|||||||||||||||||||
|
Funds from Operations Available to First Industrial Realty Trust, Inc.'s Common Stockholders and Participating Securities
(A)
|
$
|
199,391
|
|
$
|
186,496
|
|
$
|
167,811
|
|
$
|
140,841
|
|
$
|
127,890
|
|
||||
_______________
|
(A)
|
Funds from operations ("FFO") is a non-GAAP measure used in the real estate industry. See definition and a complete reconciliation of FFO to Net Income Available to First Industrial Realty Trust, Inc.'s Common Stockholders and Participating Securities under the caption "Supplemental Earnings Measure" under Item 7, "Management's Discussion and Analysis of Financial Condition and Results of Operations."
|
25
The Operating Partnership
|
Year Ended
12/31/18
|
Year Ended
12/31/17
|
Year Ended
12/31/16
|
Year Ended
12/31/15
|
Year Ended
12/31/14
|
|||||||||||||||
|
|
(In thousands, except per Unit data)
|
||||||||||||||||||
|
Statement of Operations Data:
|
|||||||||||||||||||
|
Total Revenues
|
$
|
403,954
|
|
$
|
396,402
|
|
$
|
378,020
|
|
$
|
365,823
|
|
$
|
346,709
|
|
||||
|
Income from Continuing Operations
|
167,334
|
|
208,301
|
|
125,684
|
|
76,820
|
|
23,434
|
|
|||||||||
|
Net Income Available to Unitholders and Participating Securities
|
167,246
|
|
208,158
|
|
125,547
|
|
76,682
|
|
48,704
|
|
|||||||||
|
Basic Per Unit Data:
|
|||||||||||||||||||
|
Income from Continuing Operations Available to Unitholders
|
$
|
1.31
|
|
$
|
1.70
|
|
$
|
1.05
|
|
$
|
0.67
|
|
$
|
0.18
|
|
||||
|
Net Income Available to Unitholders
|
1.31
|
|
1.70
|
|
1.05
|
|
0.67
|
|
0.42
|
|
|||||||||
|
Diluted Per Unit Data:
|
|||||||||||||||||||
|
Income from Continuing Operations Available to Unitholders
|
$
|
1.31
|
|
$
|
1.69
|
|
$
|
1.05
|
|
$
|
0.66
|
|
$
|
0.18
|
|
||||
|
Net Income Available to Unitholders
|
1.31
|
|
1.69
|
|
1.05
|
|
0.66
|
|
0.42
|
|
|||||||||
|
Distributions Per Unit
|
$
|
0.87
|
|
$
|
0.84
|
|
$
|
0.76
|
|
$
|
0.51
|
|
$
|
0.41
|
|
||||
|
Basic Weighted Average Units
|
126,921
|
|
122,306
|
|
119,274
|
|
114,709
|
|
114,388
|
|
|||||||||
|
Diluted Weighted Average Units
|
127,308
|
|
122,821
|
|
119,614
|
|
115,138
|
|
114,791
|
|
|||||||||
|
Balance Sheet Data (End of Period):
|
|||||||||||||||||||
|
Real Estate, Before Accumulated Depreciation
|
$
|
3,673,644
|
|
$
|
3,495,745
|
|
$
|
3,384,914
|
|
$
|
3,293,968
|
|
$
|
3,183,369
|
|
||||
|
Total Assets
|
3,152,799
|
|
2,951,180
|
|
2,803,701
|
|
2,720,523
|
|
2,585,624
|
|
|||||||||
|
Indebtedness
|
1,297,783
|
|
1,296,997
|
|
1,347,092
|
|
1,434,168
|
|
1,342,762
|
|
|||||||||
|
Total Partners' Capital
|
1,690,019
|
|
1,485,995
|
|
1,295,063
|
|
1,125,850
|
|
1,101,590
|
|
|||||||||
|
Cash Flow Data:
|
|||||||||||||||||||
|
Cash Flow From Operating Activities
|
$
|
210,505
|
|
$
|
192,881
|
|
$
|
174,166
|
|
$
|
162,286
|
|
$
|
138,352
|
|
||||
|
Cash Flow From Investing Activities
|
(223,398
|
)
|
(82,494
|
)
|
(122,395
|
)
|
(175,898
|
)
|
(67,895
|
)
|
|||||||||
|
Cash Flow From Financing Activities
|
16,784
|
|
(85,366
|
)
|
(57,302
|
)
|
29,304
|
|
(66,687
|
)
|
|||||||||
26
|
Item 7.
|
Management's Discussion and Analysis of Financial Condition and Results of Operations
|
The following discussion and analysis of our financial condition and results of operations should be read in conjunction with the sections of this Form 10-K titled "Forward-Looking Statements" and "Selected Financial Data" and the Consolidated Financial Statements and Notes thereto appearing elsewhere in this Form 10-K.
Business Overview
The Company is a self-administered and fully integrated real estate company which owns, manages, acquires, sells, develops and redevelops industrial real estate. The Company is a Maryland corporation organized on August 10, 1993 and a real estate investment trust as defined in the Code.
We believe our financial condition and results of operations are, primarily, a function of our performance in four key areas: leasing of industrial properties, acquisition and development of additional industrial properties, disposition of industrial properties and access to external capital.
We generate revenue primarily from rental income and tenant recoveries from operating leases of our industrial properties. Such revenue is offset by certain property specific operating expenses, such as real estate taxes, repairs and maintenance, property management, utilities and insurance expenses, along with certain other costs and expenses, such as depreciation and amortization costs and general and administrative and interest expenses. Our revenue growth is dependent, in part, on our ability to: (i) increase rental income, through increasing either or both occupancy rates and rental rates at our properties; (ii) maximize tenant recoveries; and (iii) minimize operating and certain other expenses. Revenues generated from rental income and tenant recoveries are a significant source of funds, in addition to income generated from gains on the sale of our properties (as discussed below), for our liquidity. The leasing of property, in general, and occupancy rates, rental rates, operating expenses and certain non-operating expenses, in particular, are impacted, variously, by property specific, market specific, general economic and other conditions, many of which are beyond our control. The leasing of property also entails various risks, including the risk of tenant default. If we were unable to maintain or increase occupancy rates and rental rates at our properties or to maintain tenant recoveries and operating and certain other expenses consistent with historical levels and proportions, our revenue would decline. Further, if a significant number of our tenants were unable to pay rent (including tenant recoveries) or if we were unable to rent our properties on favorable terms, our financial condition, results of operations, cash flow and ability to make distributions to our stockholders and Unitholders, the market price of the Company's common stock and the market value of the Units would be adversely affected.
Our revenue growth is also dependent, in part, on our ability to acquire existing, and develop new industrial properties on favorable terms. We seek to identify opportunities to acquire existing industrial properties on favorable terms, and, when conditions permit, also seek to acquire and develop new industrial properties on favorable terms. Existing properties, as they are acquired, and acquired and developed properties, as they are leased, generate revenue from rental income, tenant recoveries and fees, income from which, as discussed above, is a source of funds for our distributions to our stockholders and Unitholders. The acquisition and development of properties is impacted, variously, by property specific, market specific, general economic and other conditions, many of which are beyond our control. The acquisition and development of properties also entails various risks, including the risk that our investments may not perform as expected. For example, acquired existing and acquired and developed new properties may not sustain and/or achieve anticipated occupancy and rental rate levels. With respect to acquired and developed new properties, we may not be able to complete construction on schedule or within budget, resulting in increased debt service expense and construction costs and delays in leasing the properties. Also, we face significant competition for attractive acquisition and development opportunities from other well-capitalized real estate investors, including publicly-traded REITs and private investors. Further, as discussed below, we may not be able to finance the acquisition and development opportunities we identify. If we were unable to acquire and develop sufficient additional properties on favorable terms, or if such investments did not perform as expected, our revenue growth would be limited and our financial condition, results of operations, cash flow and ability to make distributions to our stockholders and Unitholders, the market price of the Company's common stock and the market value of the Units would be adversely affected.
27
We also generate income from the sale of our properties (including existing buildings, buildings which we have developed or re-developed on a merchant basis and land). The gain or loss on, and fees from, the sale of such properties are included in our income and can be a significant source of funds, in addition to revenues generated from rental income and tenant recoveries. Proceeds from sales are used to repay outstanding debt and, market conditions permitting, may be used to fund the acquisition of existing industrial properties, and the acquisition and development of new industrial properties. The sale of properties is impacted, variously, by property specific, market specific, general economic and other conditions, many of which are beyond our control. The sale of properties also entails various risks, including competition from other sellers and the availability of attractive financing for potential buyers of our properties. Further, our ability to sell properties is limited by safe harbor rules applying to REITs under the Code which relate to the number of properties that may be disposed of in a year, their tax bases and the cost of improvements made to the properties, along with other tests which enable a REIT to avoid punitive taxation on the sale of assets. If we are unable to sell properties on favorable terms, our income growth would be limited and our financial condition, results of operations, cash flow and ability to make distributions to our stockholders and Unitholders, the market price of the Company's common stock and the market value of the Units could be adversely affected.
We utilize a portion of the net sales proceeds from property sales, borrowings under our Unsecured Credit Facility and proceeds from the issuance, when and as warranted, of additional debt and equity securities to refinance debt and finance future acquisitions and developments. Access to external capital on favorable terms plays a key role in our financial condition and results of operations, as it impacts our cost of capital and our ability and cost to refinance existing indebtedness as it matures and our ability to fund acquisitions and developments. Our ability to access external capital on favorable terms is dependent on various factors, including general market conditions, interest rates, credit ratings on our debt, the market's perception of our growth potential, our current and potential future earnings and cash distributions and the market price of the Company's common stock. If we were unable to access external capital on favorable terms, our financial condition, results of operations, cash flow and ability to make distributions to our stockholders and Unitholders, the market price of the Company's common stock and the market value of the Units could be adversely affected.
Summary of Significant Transactions During 2018
During 2018, we completed the following significant transactions and financing activities:
|
•
|
We acquired 10 industrial properties comprised of approximately 1.0 million square feet of GLA located in our Seattle, Orlando, Southern California, New Jersey and Houston markets for an aggregate purchase price of $124.9 million.
|
|
•
|
We acquired 271.7 acres of land for development located in our Dallas, Denver, Seattle, Southern California, New Jersey and Miami markets for an aggregate purchase price of $42.6 million.
|
|
•
|
We developed, placed in-service and leased at 100%, 8 industrial properties comprising approximately 3.5 million square feet of GLA located in Southern California, Chicago and Phoenix at an estimated total cost of $226.6 million.
|
|
•
|
We sold 53 industrial properties comprised of approximately 2.6 million square feet of GLA and several land parcels for total gross sales proceeds of $192.0 million.
|
|
•
|
We entered into the Joint Venture with a third party and acquired, for a purchase price of $49.0 million, approximately 532 net developable acres of land located in Phoenix for the purpose of developing, selling, leasing and operating industrial properties.
|
|
•
|
We issued $150.0 million of ten-year private placement notes at a rate of 3.86% and $150.0 million of twelve-year private placement notes at a rate of 3.96%.
|
|
•
|
We issued 4,800,000 shares of the Company's common stock in an underwritten public offering. Proceeds to the Company, net of the underwriter's discount, were $145.6 million.
|
|
•
|
We paid off $157.8 million in mortgage loans payable.
|
|
•
|
We declared an annual cash dividend of $0.87 per common share or Unit, an increase of 3.6% from 2017.
|
28
Results of Operations
Comparison of Year Ended December 31, 2018 to Year Ended December 31, 2017
Our net income was $167.3 million and $208.3 million for the years ended December 31, 2018 and 2017, respectively.
The tables below summarize our revenues, property expenses and depreciation and other amortization by various categories for the years ended December 31, 2018 and 2017. Same store properties are properties owned prior to January 1, 2017 and held as an in-service property through December 31, 2018 and developments and redevelopments that were placed in service prior to January 1, 2017 or were substantially completed for the 12 months prior to January 1, 2017. Properties which are at least 75% occupied at acquisition are placed in service, unless we anticipate the tenants to move out within the first two years of ownership. Acquisitions that are less than 75% occupied at the date of acquisition, developments and redevelopments are placed in service as they reach the earlier of a) stabilized occupancy (generally defined as 90% occupied), or b) one year subsequent to acquisition or development/redevelopment construction completion. Acquired properties with occupancy greater than 75% at acquisition, but with tenants that we anticipate will move out in the first year of ownership, will be placed in service upon the earlier of reaching 90% occupancy or twelve months after move out. Properties are moved from the same store classification to the redevelopment classification when capital expenditures for a project are estimated to exceed 25% of the undepreciated gross book value of the property. Acquired properties are properties that were acquired subsequent to December 31, 2016 and held as an operating property through December 31, 2018. Sold properties are properties that were sold subsequent to December 31, 2016. (Re)Developments include developments and redevelopments that were not: a) substantially complete 12 months prior to January 1, 2017; or b) stabilized prior to January 1, 2017. Other revenues are derived from the operations of properties not placed in service under one of the categories discussed above, the operations of our maintenance company and other miscellaneous revenues. Other property expenses are derived from the operations of properties not placed in service under one of the categories discussed above, the operations of our maintenance company, vacant land expenses and other miscellaneous regional expenses.
During the year ended December 31, 2018, one industrial property, comprising approximately 0.1 million square feet of GLA, was taken out of service for redevelopment. As a result of taking this industrial property out of service, the results of operations were reclassified from the same store property classification to the re(development) classification. During the year ended December 31, 2018, we completed the redevelopment of this property and the property is 100% occupied. This property will return to the same store classification in the first quarter 2020.
During the year ended December 31, 2017, one industrial property, comprising approximately 0.1 million square feet of GLA, was taken out of service due to a fire which caused major damage to the building. During the year ended December 31, 2018, we recognized $1.3 million of insurance proceeds, inclusive of business interruption proceeds, within other income. Also, during the year ended December 31, 2018, we sold the remaining property and as such, the results of this property are included in the sold classification.
During the year ended December 31, 2016, one industrial property, comprising approximately 28 thousand square feet of GLA, was taken out of service due to a fire which caused complete destruction of the building. The results of this property are included in the (re) development classification. We anticipate the rebuild of this property will be complete during the first quarter 2019 and as of December 31, 2018, the property is 100% pre-leased. This property will return to the same store classification in the first quarter 2021.
Our future financial condition and results of operations, including rental revenues, may be impacted by the future acquisition, (re)development and sale of properties. Our future revenues and expenses may vary materially from historical rates.
For the years ended December 31, 2018 and 2017, the average occupancy rates of our same store properties were 97.5% and 96.2%, respectively.
29
|
|
2018
|
2017
|
$ Change
|
% Change
|
||||||||||
|
|
(In thousands)
|
|||||||||||||
|
REVENUES
|
||||||||||||||
|
Same Store Properties
|
$
|
365,873
|
|
$
|
349,196
|
|
$
|
16,677
|
|
4.8
|
%
|
|||
|
Acquired Properties
|
12,462
|
|
4,243
|
|
8,219
|
|
193.7
|
%
|
||||||
|
Sold Properties
|
11,354
|
|
36,484
|
|
(25,130
|
)
|
(68.9
|
)%
|
||||||
|
(Re) Developments
|
11,393
|
|
4,626
|
|
6,767
|
|
146.3
|
%
|
||||||
|
Other
|
2,872
|
|
1,853
|
|
1,019
|
|
55.0
|
%
|
||||||
|
Total Revenues
|
$
|
403,954
|
|
$
|
396,402
|
|
$
|
7,552
|
|
1.9
|
%
|
|||
Revenues from same store properties increased $16.7 million due primarily to an increase in occupancy and rental rates as well as tenant recoveries. Revenues from acquired properties increased $8.2 million due to the 18 industrial properties acquired subsequent to December 31, 2016 totaling approximately 2.1 million square feet of GLA. Revenues from sold properties decreased $25.1 million due to the 113 industrial properties sold subsequent to December 31, 2016 totaling approximately 7.2 million square feet of GLA. Revenues from (re)developments increased $6.8 million due to
an increase in occupancy. Revenues from other
increased $1.0 million primarily due to
an increase in interest income earned on our cash equivalents, as well as an increase in occupancy related to one property acquired in 2016 and placed in service during 2017.
|
|
2018
|
2017
|
$ Change
|
% Change
|
||||||||||
|
|
(In thousands)
|
|||||||||||||
|
PROPERTY EXPENSES
|
||||||||||||||
|
Same Store Properties
|
$
|
97,053
|
|
$
|
91,417
|
|
$
|
5,636
|
|
6.2
|
%
|
|||
|
Acquired Properties
|
3,850
|
|
1,105
|
|
2,745
|
|
248.4
|
%
|
||||||
|
Sold Properties
|
3,461
|
|
11,695
|
|
(8,234
|
)
|
(70.4
|
)%
|
||||||
|
(Re) Developments
|
4,090
|
|
1,392
|
|
2,698
|
|
193.8
|
%
|
||||||
|
Other
|
8,400
|
|
7,885
|
|
515
|
|
6.5
|
%
|
||||||
|
Total Property Expenses
|
$
|
116,854
|
|
$
|
113,494
|
|
$
|
3,360
|
|
3.0
|
%
|
|||
Property expenses include real estate taxes, repairs and maintenance, property management, utilities, insurance and other property related expenses. Property expenses from same store properties increased $5.6 million primarily due to an increase in real estate taxes, snow removal costs, and insurance expense. Property expenses from acquired properties increased $2.7 million due to properties acquired subsequent to December 31, 2016. Property expenses from sold properties decreased $8.2 million due to properties sold subsequent to December 31, 2016. Property expenses from (re)developments increased $2.7 million primarily due to the substantial completion of developments. Property expenses from other increased $0.5 million due to an increase in real estate taxes
.
General and administrative expense remained relatively unchanged. However, during the three months ended March 31, 2018, we incurred $1.3 million of severance expense. The increase in severance expense is offset by an increase in the capitalization of compensation of certain development personnel due to an increase in development activities as well as a decrease in amortization of restricted stock, which decrease is primarily due to immediate recognition of $1.6 million of expense related to the issuance of restricted stock to our former CEO during the three months ended March 31, 2017.
30
|
|
2018
|
2017
|
$ Change
|
% Change
|
||||||||||
|
|
(In thousands)
|
|||||||||||||
|
DEPRECIATION AND OTHER AMORTIZATION
|
||||||||||||||
|
Same Store Properties
|
$
|
100,525
|
|
$
|
101,770
|
|
$
|
(1,245
|
)
|
(1.2
|
)%
|
|||
|
Acquired Properties
|
7,293
|
|
2,476
|
|
4,817
|
|
194.5
|
%
|
||||||
|
Sold Properties
|
2,703
|
|
9,388
|
|
(6,685
|
)
|
(71.2
|
)%
|
||||||
|
(Re) Developments
|
4,571
|
|
1,582
|
|
2,989
|
|
188.9
|
%
|
||||||
|
Corporate Furniture, Fixtures and Equipment and Other
|
1,367
|
|
1,148
|
|
219
|
|
19.1
|
%
|
||||||
|
Total Depreciation and Other Amortization
|
$
|
116,459
|
|
$
|
116,364
|
|
$
|
95
|
|
0.1
|
%
|
|||
Depreciation and other amortization from same store properties decreased by $1.2 million due to certain leasing intangibles becoming fully amortized during the year ended December 31, 2017 partially offset by accelerated depreciation and amortization taken during the year ended December 31, 2018 attributable to certain tenants who terminated their leases early. Depreciation and other amortization from acquired properties increased $4.8 million due to properties acquired subsequent to December 31, 2016. Depreciation and other amortization from sold properties decreased $6.7 million due to properties sold subsequent to December 31, 2016. Depreciation and other amortization from (re)developments increased $3.0 million primarily due to an increase in depreciation and amortization related to completed developments.
Dep
reciation from corporate furniture, fixtures and equipment and other increased $0.2 mill
ion primarily due to capital expenditures incurred at one property that was acquired in 2016 and placed in service in 2017.
The impairment charge for the year ended December 31, 2018 of $2.8 million was due to marketing a property and a land parcel for sale and our assessment of the likelihood of potential sales transaction. The property and the land parcel for which impairment was recorded were sold later during the year ended December 31, 2018.
For the year ended December 31, 2018, we recognized $81.6 million of gain on sale of real estate related to the sale of 53 industrial properties comprising approximately 2.6 million square feet of GLA and several land parcels. For the year ended December 31, 2017, we recognized $131.3 million of gain on sale of real estate related to the sale of 60 industrial properties comprising approximately 4.6 million square feet of GLA and one land parcel.
Interest expense decreased $6.4 million, or 11.2%, primarily due to a decrease in the weighted average debt balance outstanding for the year ended December 31, 2018 ($1,334.8 million) as compared to the year ended December 31, 2017 ($1,392.2 million), a decrease in the weighted average interest rate for the year ended December 31, 2018 (4.24%) as compared to the year ended December 31, 2017 (4.42%), and an increase in capitalized interest of $1.5 million for the year ended December 31, 2018 as compared to the year ended December 31, 2017 due to an increase in development activities.
Amortization of debt issuance costs increased $0.2 million, or 7.7%, primarily due to additional amortization from fees incurred related to the amendment to our credit facility and term loans in October 2017 and the issuance of the 2028 and 2030 Private Placement Notes in February 2018, offset by less amortization due to the payoffs of the 2017 Notes, the 2017 II Notes and certain mortgage loans.
During the year ended December 31, 2017, we recorded $1.9 million of settlement gain on derivative instruments. In September 2017, we entered into treasury locks (the "2017 Treasury Locks") in order to fix the interest rate on an anticipated unsecured debt offering. The 2017 Treasury Locks were settled during the fourth quarter of 2017. We did not elect to designate the Treasury Locks as hedges and, as such, we recorded the full change in the fair value of the 2017 Treasury Locks within the consolidated statement of operations.
For the year ended December 31, 2017, we recognized a loss from retirement of debt of $1.8 million due to prepayment penalties related to the early payoff of certain mortgage loans and the write-off of unamortized debt issuance costs on these mortgage loans as well as the write-off of unamortized debt issuance costs related to an exiting lender on our revolving line of credit and one of our unsecured term loans.
Equity in loss of Joint Venture was not significant.
For the year ended December 31, 2018, the income tax benefit was not significant. For the year ended December 31, 2017, we recognized a tax provision of $1.2 million primarily related to taxable gain from the sale of real estate from one of our TRSs.
31
Comparison of Year Ended December 31, 2017 to Year Ended December 31, 2016
The Company's net income was $208.3 million and $125.7 million for the years ended December 31, 2017 and 2016, respectively.
The tables below summarize our revenues, property expenses and depreciation and other amortization by various categories for the years ended December 31, 2017 and 2016. Same store properties are properties owned prior to January 1, 2016 and held as an in-service property through December 31, 2017 and developments and redevelopments that were placed in service prior to January 1, 2016 or were substantially completed for the 12 months prior to January 1, 2016. Properties which are at least 75% occupied at acquisition are placed in service, unless we anticipate the tenants to move out within the first two years of ownership. Acquisitions that are less than 75% occupied at the date of acquisition, developments and redevelopments are placed in service as they reach the earlier of a) stabilized occupancy (generally defined as 90% occupied), or b) one year subsequent to acquisition or development/redevelopment construction completion. Acquired properties with occupancy greater than 75% at acquisition, but with tenants that we anticipate will move out in the first year of ownership, will be placed in service upon the earlier of reaching 90% occupancy or twelve months after move out. Properties are moved from the same store classification to the redevelopment classification when capital expenditures for a project are estimated to exceed 25% of the undepreciated gross book value of the property. Acquired properties are properties that were acquired subsequent to December 31, 2015 and held as an operating property through December 31, 2017. Sold properties are properties that were sold subsequent to December 31, 2015. (Re)Developments include developments and redevelopments that were not: a) substantially complete 12 months prior to January 1, 2016; or b) stabilized prior to January 1, 2016. Other revenues are derived from the operations of properties not placed in service under one of the categories discussed above, the operations of our maintenance company and other miscellaneous revenues. Other property expenses are derived from the operations of properties not placed in service under one of the categories discussed above, the operations of our maintenance company, vacant land expenses and other miscellaneous regional expenses.
During the year ended December 31, 2016, one industrial property, comprising approximately 28 thousand square feet of GLA, was taken out of service due to a fire which caused complete destruction of the building. The results of this property are included in the (re) development classification. We anticipate the rebuild of this property will be complete during the first quarter 2019 and as of December 31, 2018, the property is 100% pre-leased. This property will return to the same store classification in the first quarter 2021.
During the year ended December 31, 2017, one industrial property, comprising approximately 0.1 million square feet of GLA, was taken out of service due to a fire which caused major damage to the building. The results of this property are included in the (re) development classification. During the year ended December 31, 2018, we sold the remaining land parcel.
Our future financial condition and results of operations, including rental revenues, may be impacted by the future acquisition, (re)development and sale of properties. Our future revenues and expenses may vary materially from historical rates.
For the years ended December 31, 2017 and 2016, the average occupancy rates of our same store properties were 96.2% and 96.4%, respectively.
32
|
|
2017
|
2016
|
$ Change
|
% Change
|
||||||||||
|
|
(In thousands)
|
|||||||||||||
|
REVENUES
|
||||||||||||||
|
Same Store Properties
|
$
|
339,403
|
|
$
|
329,704
|
|
$
|
9,699
|
|
2.9
|
%
|
|||
|
Acquired Properties
|
9,021
|
|
2,409
|
|
6,612
|
|
274.5
|
%
|
||||||
|
Sold Properties
|
17,010
|
|
33,260
|
|
(16,250
|
)
|
(48.9
|
)%
|
||||||
|
(Re) Developments
|
26,850
|
|
10,036
|
|
16,814
|
|
167.5
|
%
|
||||||
|
Other
|
4,118
|
|
2,611
|
|
1,507
|
|
57.7
|
%
|
||||||
|
Total Revenues
|
$
|
396,402
|
|
$
|
378,020
|
|
$
|
18,382
|
|
4.9
|
%
|
|||
Revenues from same store properties increased $9.7 million due primarily to an increase in rental rates and tenant recoveries, slightly offset by a decrease in occupancy. Revenues from acquired properties increased $6.6 million due to the 14 industrial properties acquired subsequent to December 31, 2015 totaling approximately 1.8 million square feet of GLA. Revenues from sold properties decreased $16.3 million due to the 123 industrial properties sold subsequent to December 31, 2015 totaling approximately 8.6 million square feet of GLA. Revenues from (re)developments increased $16.8 million due to an increase in occupancy. Revenues from other increased $1.5 million primarily due to an increase in occupancy related to three properties acquired in the year ended December 31, 2015 that were placed in service during the year ended December 31, 2016.
|
|
2017
|
2016
|
$ Change
|
% Change
|
||||||||||
|
|
(In thousands)
|
|||||||||||||
|
PROPERTY EXPENSES
|
||||||||||||||
|
Same Store Properties
|
$
|
90,755
|
|
$
|
88,218
|
|
$
|
2,537
|
|
2.9
|
%
|
|||
|
Acquired Properties
|
2,462
|
|
600
|
|
1,862
|
|
310.3
|
%
|
||||||
|
Sold Properties
|
5,527
|
|
11,684
|
|
(6,157
|
)
|
(52.7
|
)%
|
||||||
|
(Re) Developments
|
5,797
|
|
2,449
|
|
3,348
|
|
136.7
|
%
|
||||||
|
Other
|
8,953
|
|
9,373
|
|
(420
|
)
|
(4.5
|
)%
|
||||||
|
Total Property Expenses
|
$
|
113,494
|
|
$
|
112,324
|
|
$
|
1,170
|
|
1.0
|
%
|
|||
Property expenses include real estate taxes, repairs and maintenance, property management, utilities, insurance and other property related expenses. Property expenses from same store properties increased $2.5 million primarily due to an increase in real estate tax expense caused by higher assessed values on our properties and real estate tax abatements expiring. Property expenses from acquired properties increased $1.9 million due to properties acquired subsequent to December 31, 2015. Property expenses from sold properties decreased $6.2 million due to properties sold subsequent to December 31, 2015. Property expenses from (re)developments increased $3.3 million primarily due to the substantial completion of developments. Property expenses from other decreased $0.4 million due to a decrease in certain miscellaneous expenses.
General and administrative expense increased $1.4 million, or 5.2%, primarily due to an increase in incentive compensation during the year ended December 31, 2017 as compared to the year ended December 31, 2016.
As discussed in Note 2 to the Consolidated Financial Statements, on January 1, 2017 we adopted a new accounting standard relating to the definition of a business. As a result of this adoption, our acquisitions of real estate during the year ended December 31, 2017 did not meet the definition of a business combination and thus the closing costs, which historically have been expensed, were capitalized as part of the basis of the real estate assets acquired. For the year ended December 31, 2016, we recognized $0.5 million of expenses related to costs associated with acquiring industrial properties from third parties.
33
|
|
2017
|
2016
|
$ Change
|
% Change
|
||||||||||
|
|
(In thousands)
|
|||||||||||||
|
DEPRECIATION AND OTHER AMORTIZATION
|
||||||||||||||
|
Same Store Properties
|
$
|
97,516
|
|
$
|
98,909
|
|
$
|
(1,393
|
)
|
(1.4
|
)%
|
|||
|
Acquired Properties
|
4,874
|
|
1,358
|
|
3,516
|
|
258.9
|
%
|
||||||
|
Sold Properties
|
4,305
|
|
9,352
|
|
(5,047
|
)
|
(54.0
|
)%
|
||||||
|
(Re) Developments
|
7,223
|
|
5,404
|
|
1,819
|
|
33.7
|
%
|
||||||
|
Corporate Furniture, Fixtures and Equipment and Other
|
2,446
|
|
2,259
|
|
187
|
|
8.3
|
%
|
||||||
|
Total Depreciation and Other Amortization
|
$
|
116,364
|
|
$
|
117,282
|
|
$
|
(918
|
)
|
(0.8
|
)%
|
|||
Depreciation and other amortization from same store properties decreased by $1.4 million due to accelerated depreciation and amortization taken during the year ended December 31, 2016 attributable to certain tenants who terminated their leases early. Depreciation and other amortization from acquired properties increased $3.5 million due to properties acquired subsequent to December 31, 2015. Depreciation and other amortization from sold properties decreased $5.0 million due to properties sold subsequent to December 31, 2015. Depreciation and other amortization from (re)developments increased $1.8 million primarily due to an increase in depreciation and amortization related to completed developments offset by accelerated depreciation on one property in Rancho Dominguez, CA which was razed during the year ended December 31, 2016. Depreciation from corporate furniture, fixtures and equipment and other increased $0.2 million due to higher depreciation related to incurred leasing costs at three properties acquired in the year ended December 31, 2015 that were placed in service during the year ended December 31, 2016.
For the year ended December 31, 2017, we recognized $131.3 million of gain on sale of real estate related to the sale of 60 industrial properties comprising approximately 4.6 million square feet of GLA and one land parcel. For the year ended December 31, 2016, we recognized $68.2 million of gain on sale of real estate related to the sale of 63 industrial properties comprising approximately 3.9 million square feet of GLA and several land parcels.
Interest expense decreased $2.2 million, or 3.8%, primarily due to a decrease in the weighted average interest rate for the year ended December 31, 2017 (4.42%) as compared to the year ended December 31, 2016 (4.50%), a decrease in the weighted average debt balance outstanding for the year ended December 31, 2017 ($1,392.2 million) as compared to the year ended December 31, 2016 ($1,400.5 million) and an increase in capitalized interest of $0.8 million for the year ended December 31, 2017 as compared to the year ended December 31, 2016 due to an increase in development activities.
Amortization of debt issuance costs remained relatively unchanged.
During the year ended December 31, 2017, we recorded $1.9 million of settlement gain on derivative instruments. In September 2017, we entered into the 2017 Treasury Locks in order to fix the interest rate on an anticipated unsecured debt offering. The 2017 Treasury Locks were settled during the fourth quarter of 2017.
For the year ended December 31, 2017, we recognized a loss from retirement of debt of $1.8 million due to prepayment penalties related to the early payoff of certain mortgage loans and the write-off of unamortized debt issuance costs on these mortgage loans as well as the write-off of unamortized debt issuance costs related to an exiting lender on our revolving line of credit and one of our unsecured term loans.
The income tax provision remained relatively unchanged.
34
Critical Accounting Policies
We believe the following critical accounting policies relate to the more significant judgments and estimates used in the preparation of our consolidated financial statements. Refer to Note 2 to the Consolidated Financial Statements for further detail on our critical accounting policies, which are as follows:
|
•
|
Acquisitions of Real Estate Assets:
We allocate the purchase price of acquired real estate, including real estate acquired as a portfolio, to the fair value of tangible assets (land, building, and improvements) by valuing the real estate as if it were vacant. The determination of fair value includes estimates such as discount rates, terminal capitalization rates and market rent assumptions. Above-market and below-market lease and below market ground lease obligation values are recorded based on the present value (using a discount rate which reflects the risks associated with the leases acquired) of the difference between (i) the contractual amounts to be paid pursuant to each in-place lease and (ii) our estimate of fair market lease rents for each corresponding in-place lease. The purchase price is further allocated to leasing commissions, in-place lease and tenant relationship values based on our evaluation of the specific characteristics of each tenant's lease and our overall relationship with the respective tenant. The value allocated to tenant relationships is amortized to depreciation and amortization expense over the expected term of the relationship, which includes an estimate of the probability of lease renewal and its estimated term.
|
|
•
|
Impairment of Real Estate Assets:
We review our real estate assets for possible impairment whenever events or changes in circumstances indicate that their carrying amounts may not be recoverable. The judgments regarding the existence of indicators of impairment are based on the operating performance, market conditions, as well as our ability to hold and our intent with regard to each property. The judgments regarding whether the carrying amounts of these assets may not be recoverable are based on estimates of future undiscounted cash flows from properties which include estimates of future operating performance and market conditions. If any real estate investment is considered impaired, a loss is recorded to reduce the carrying value of the property to its estimated fair value.
|
Liquidity and Capital Resources
At December 31, 2018, our cash and cash equivalents and restricted cash were approximately $43.1 million and $7.3 million, respectively. Restricted cash is comprised of gross proceeds from the sales of certain industrial properties. These sale proceeds will be disbursed as we exchange industrial properties under Section 1031 of the Code. We also had $720.6 million available for additional borrowings under our Unsecured Credit Facility as of December 31, 2018.
We have considered our short-term (through December 31, 2019) liquidity needs and the adequacy of our estimated cash flow from operations and other expected liquidity sources to meet these needs. We have $107.9 million in mortgage loans payable outstanding at December 31, 2018 that we anticipate prepaying prior to December 31, 2019. Historically, we have utilized various sources of capital to satisfy similar payment obligations, including borrowings under our Unsecured Credit Facility and issuances of debt and equity securities, and we expect to satisfy these payment obligations on or prior to the maturity dates using one or more of these sources of capital. With the exception of these payment obligations, we believe that our principal short-term liquidity needs are to fund normal recurring expenses, property acquisitions, developments, renovations, expansions and other nonrecurring capital improvements, debt service requirements, the minimum distributions required to maintain the Company's REIT qualification under the Code and distributions approved by the Company's Board of Directors. We anticipate that these needs will be met with cash flows provided by operating activities as well as the disposition of select assets. These needs may also be met by the issuance of additional equity or debt securities or long-term unsecured indebtedness, subject to market conditions and contractual restrictions or borrowings under our Unsecured Credit Facility.
We expect to meet long-term (after December 31, 2019) liquidity requirements such as property acquisitions, developments, scheduled debt maturities, major renovations, expansions and other nonrecurring capital improvements through the disposition of select assets, long-term unsecured and secured indebtedness and the issuance of additional equity or debt securities, subject to market conditions.
As of
February 15, 2019
we had approximately $713.4 million available for additional borrowings under our Unsecured Credit Facility. Our Unsecured Credit Facility contains certain financial covenants including limitations on incurrence of debt and debt service coverage. Our access to borrowings may be limited if we fail to meet any of these covenants. We believe that we were in compliance with our financial covenants as of December 31, 2018, and we anticipate that we will be able to operate in compliance with our financial covenants in 2019.
35
As of December 31, 2018, our senior unsecured notes have been assigned credit ratings from Standard & Poor's, Moody's and Fitch Ratings of BBB/Stable, Baa2/Stable and BBB/Stable, respectively. A securities rating is not a recommendation to buy, sell or hold securities and is subject to revision or withdrawal at any time by the rating organization. In the event of a downgrade, we believe we would continue to have access to sufficient capital; however, our cost of borrowing would increase and our ability to access certain financial markets may be limited.
Cash Flow Activity
The following table summarizes our cash flow activity for the Company for the years ended December 31, 2018 and 2017:
|
Year Ended December 31,
|
||||||||
|
2018
|
2017
|
|||||||
|
(In thousands)
|
||||||||
|
Net cash provided by operating activities
|
$
|
210,495
|
|
$
|
192,562
|
|
||
|
Net cash used in investing activities
|
(223,398
|
)
|
(82,495
|
)
|
||||
|
Net cash provided by (used in) financing activities
|
16,794
|
|
(85,046
|
)
|
||||
The following table summarizes our cash flow activity for the Operating Partnership for the years ended December 31, 2018 and 2017:
|
Year Ended December 31,
|
||||||||
|
2018
|
2017
|
|||||||
|
(In thousands)
|
||||||||
|
Net cash provided by operating activities
|
$
|
210,505
|
|
$
|
192,881
|
|
||
|
Net cash used in investing activities
|
(223,398
|
)
|
(82,494
|
)
|
||||
|
Net cash provided by (used in) financing activities
|
16,784
|
|
(85,366
|
)
|
||||
Changes in cash flow for the year ended December 31, 2018, compared to the prior year are described as follows:
Operating Activities:
Cash provided by operating activities increased $17.9 million for the Company (increased by $17.6 million for the Operating Partnership), primarily due to the following:
|
•
|
Decrease in interest expense of $6.4 million;
|
|
•
|
Increase in cash NOI from same store properties, acquired properties, and recently developed properties offset by decreases in cash NOI due to building disposals for a net total increase of approximately $6.8 million;
|
|
•
|
Increase in accounts payable, accrued expenses and other liabilities as well as a decrease in other assets due to timing of cash payments and cash receipts.
|
Investing Activities:
Cash used in investing activities increased $140.9 million, primarily due to the following:
|
•
|
Increase in cash used of $78.5 million related to non-acquisition additions and improvements to real estate primarily due to an increase in development expenditures in 2018;
|
|
•
|
Increase in cash used of $23.4 million related to our net contributions to the Joint Venture in 2018;
|
|
•
|
Decrease in cash received of $43.3 million related to the disposition of real estate in 2018;
|
|
•
|
Decrease in cash received of $9.2 million related to insurance proceeds on casualty losses;
|
Offset by:
|
•
|
Decrease in cash used to acquire real estate in 2018 of $17.5 million.
|
36
Financing Activities:
Cash provided by financing activities increased $101.8 million for the Company (increased $102.2 million for the Operating Partnership), primarily due to the following:
|
•
|
Increase in cash provided of $100.0 million related to the issuance of unsecured notes in a private placement in 2018;
|
|
•
|
Increase in cash provided of $70.7 million related to the proceeds received from the issuance of common stock in an underwritten public offering in 2018 compared to 2017;
|
|
•
|
The payoff of senior unsecured notes during 2017 in the amount of $156.9 million;
|
Offset by:
|
•
|
Increase in repayments of mortgage loans payable of $118.8 million;
|
|
•
|
Increase in net repayments of our Unsecured Credit Facility of $99.5 million; and
|
|
•
|
Increase in dividend and unit distributions of $9.1 million primarily due to the Company raising the dividend rate in 2018.
|
Contractual Obligations and Commitments
The following table lists our contractual obligations and commitments as of December 31, 2018:
|
|
Payments Due by Period
(In thousands)
|
||||||||||||||||||
|
|
Total
|
Less Than
1 Year
|
1-3 Years
|
3-5 Years
|
Over 5 Years
|
||||||||||||||
|
Operating and Ground Leases
(A)
|
$
|
36,322
|
|
$
|
1,464
|
|
$
|
3,039
|
|
$
|
2,794
|
|
$
|
29,025
|
|
||||
|
Real Estate Development Costs
(A)(B)
|
140,300
|
|
140,300
|
|
—
|
|
—
|
|
—
|
|
|||||||||
|
Long Term Debt
|
1,306,181
|
|
79,600
|
|
326,159
|
|
341,873
|
|
558,549
|
|
|||||||||
|
Interest Expense on Long Term Debt
(A)(C)
|
309,800
|
|
52,505
|
|
84,322
|
|
56,460
|
|
116,513
|
|
|||||||||
|
Unsecured Credit Facility
(D)
|
3,118
|
|
1,103
|
|
2,015
|
|
—
|
|
—
|
|
|||||||||
|
Total
|
$
|
1,795,721
|
|
$
|
274,972
|
|
$
|
415,535
|
|
$
|
401,127
|
|
$
|
704,087
|
|
||||
_______________
|
(A)
|
Not on balance sheet.
|
|
(B)
|
Represents estimated remaining costs on the completion of development projects under construction. Estimated remaining costs include costs for leasing the building and could extend beyond one year.
|
|
(C)
|
Includes interest expense on our unsecured term loans, inclusive of the impact of interest rate swaps which effectively swap the variable interest rate to a fixed interest rate. Excludes interest expense on our Unsecured Credit Facility.
|
|
(D)
|
Represents fees on our Unsecured Credit Facility which has a contractual maturity in October 2021.
|
Off-Balance Sheet Arrangements
At December 31, 2018, we had letters of credit and performance bonds outstanding amounting to $18.6 million in the aggregate. The letters of credit and performance bonds are not reflected as liabilities on our balance sheet. We have no other off-balance sheet arrangements, as defined in Item 303 of Regulation S-K, other than those disclosed on the Contractual Obligations and Commitments table above that have or are reasonably likely to have a current or future effect on our financial condition, results of operation or liquidity and capital resources.
Environmental
We paid approximately $0.4 million and $0.4 million during the years ended December 31, 2018 and 2017, respectively, related to environmental expenditures. We estimate 2019 expenditures of approximately $0.3 million. We estimate that the aggregate expenditures which need to be expended in 2019 and beyond with regard to currently identified environmental issues will not exceed approximately $0.9 million.
Inflation
For the last several years, inflation has not had a significant impact on us because of the relatively low inflation rates in our markets of operation. Most of our leases require the tenants to pay their share of operating expenses, including common area maintenance, real estate taxes and insurance, thereby reducing our exposure to increases in costs and operating expenses resulting from inflation. In addition, our leases have a weighted average lease length of 6.8 years which may enable us to replace existing leases with new leases at higher base rentals if rents of existing leases are below the then-existing market rate.
37
Market Risk
The following discussion about our risk-management activities includes "forward-looking statements" that involve risk and uncertainties. Actual results could differ materially from those projected in the forward-looking statements. Our business subjects us to market risk from interest rates, as described below.
Interest Rate Risk
The following analysis presents the hypothetical gain or loss in earnings, cash flows or fair value of the financial instruments and derivative instruments which are held by us at December 31, 2018 that are sensitive to changes in interest rates. While this analysis may have some use as a benchmark, it should not be viewed as a forecast.
In the normal course of business, we also face risks that are either non-financial or non-quantifiable. Such risks principally include credit risk and legal risk and are not represented in the following analysis.
At December 31, 2018, 100.0% of our total debt was fixed rate debt. This includes $460.0 million of variable-rate debt that has been effectively swapped to a fixed rate through the use of derivative instruments. At December 31, 2017, $1,160.3 million or 88.9% of our total debt, excluding unamortized debt issuance costs, was fixed rate debt. This includes $460.0 million of variable-rate debt that has been effectively swapped to a fixed rate through the use of derivative instruments. As of the same date, $144.5 million or 11.1% of our total debt, excluding unamortized debt issuance costs, was variable rate debt.
For fixed rate debt, changes in interest rates generally affect the fair value of the debt, but not our earnings or cash flows. Conversely, for variable rate debt, changes in the base interest rate used to calculate the all-in interest rate generally do not impact the fair value of the debt, but would affect our future earnings and cash flows. The interest rate risk and changes in fair market value of fixed rate debt generally do not have a significant impact on us until we are required to refinance such debt. See Note 4 to the Consolidated Financial Statements for a discussion of the maturity dates of our various fixed rate debt.
Our variable rate debt is subject to risk based upon prevailing market interest rates. If the LIBOR rates relevant to our variable rate debt were to have increased 10%, we estimate that our interest expense during the years ended December 31, 2018 and 2017 would have increased by approximately $0.07 million and $0.26 million, respectively, based on our average outstanding floating-rate debt during the years ended December 31, 2018 and 2017. Additionally, if weighted average interest rates on our fixed rate debt were to have increased by 10% due to refinancing, interest expense would have increased by approximately $5.6 million and $5.8 million during the years ended December 31, 2018 and 2017.
As of December 31, 2018 and 2017, the estimated fair value of our debt was approximately $1,312.4 million and $1,341.5 million, respectively, based on our estimate of the then-current market interest rates.
The use of derivative financial instruments allows us to manage risks of increases in interest rates with respect to the effect these fluctuations would have on our earnings and cash flows. As of December 31, 2018 and 2017, we had derivative instruments with a notional aggregate amount outstanding of $460.0 million which mitigate our exposure to our unsecured term loans' variable interest rates, which are based upon LIBOR ("Term Loan Swaps"). Additionally, during December 2018 in anticipation of issuing long term debt in the future, we entered into two treasury locks with an aggregate notional value of $100.0 million to manage our exposure to changes in the ten year U.S. Treasury rate (the "2018 Treasury Locks"). The 2018 Treasury Locks fix the ten year U.S. Treasury rate at a weighted average of 2.93% and cash settle on or before April 30, 2019. We designated both the Term Loan Swaps and the 2018 Treasury Locks as cash flow hedges. During the year ended December 31, 2017, we settled certain derivative instruments, which were entered into in September 2017, to maintain our flexibility to pursue an offering of unsecured debt ("2017 Treasury Locks"). We did not designate the 2017 Treasury Locks as cash flow hedges. We received a settlement payment of $1.9 million from our derivative counterparties and recognized such payment as settlement gain on derivative instruments. See Note 12 to the Consolidated Financial Statements for a more detailed discussion of these derivative instruments. Currently, we do not enter into financial instruments for trading or other speculative purposes.
38
Supplemental Earnings Measure
Investors in and industry analysts following the real estate industry utilize funds from operations ("FFO") and net operating income ("NOI") as supplemental operating performance measures of an equity REIT. Historical cost accounting for real estate assets in accordance with accounting principles generally accepted in the United States of America ("GAAP") implicitly assumes that the value of real estate assets diminishes predictably over time through depreciation. Since real estate values instead have historically risen or fallen with market conditions, many industry analysts and investors prefer to supplement operating results that use historical cost accounting with measures such as FFO and NOI, among others. We provide information related to FFO and same store NOI ("SS NOI") both because such industry analysts are interested in such information, and because our management believes FFO and SS NOI are important performance measures. FFO and SS NOI are factors used by management in measuring our performance, including for purposes of determining the compensation of our executive officers under our 2018 incentive compensation plan.
Neither FFO nor SS NOI should be considered as a substitute for net income, or any other measures derived in accordance with GAAP. Neither FFO nor SS NOI represents cash generated from operating activities in accordance with GAAP and neither should be considered as an alternative to cash flow from operating activities as a measure of our liquidity, nor is either indicative of funds available for our cash needs, including our ability to make cash distributions.
Funds From Operations
The National Association of Real Estate Investment Trusts ("NAREIT") has recognized and defined for the real estate industry a supplemental measure of REIT operating performance, FFO, that excludes historical cost depreciation, among other items, from net income determined in accordance with GAAP. FFO is a non-GAAP financial measure. FFO is calculated by us in accordance with the definition adopted by the Board of Governors of NAREIT and therefore may not be comparable to other similarly titled measures of other companies.
Management believes that the use of FFO available to common stockholders and participating securities, combined with net income (which remains the primary measure of performance), improves the understanding of operating results of REITs among the investing public and makes comparisons of REIT operating results more meaningful. Management believes that, by excluding gains or losses related to sales of previously depreciated real estate assets, real estate asset depreciation and amortization and impairment of depreciable real estate, investors and analysts are able to identify the operating results of the long-term assets that form the core of a REIT's activity and use these operating results for assistance in comparing these operating results between periods or to those of different companies.
The following table shows a reconciliation of net income available to common stockholders and participating securities to the calculation of FFO available to common stockholders and participating securities for the years ended December 31, 2018, 2017, 2016, 2015, and 2014.
|
|
Year Ended December 31,
|
||||||||||||||||||
|
|
2018
|
2017
|
2016
|
2015
|
2014
|
||||||||||||||
|
|
(In thousands)
|
||||||||||||||||||
|
Net Income
Available to First Industrial Realty Trust, Inc.'s Common Stockholders and Participating Securities
|
$
|
163,239
|
|
$
|
201,456
|
|
$
|
121,232
|
|
$
|
73,802
|
|
$
|
46,629
|
|
||||
|
Adjustments:
|
|||||||||||||||||||
|
Depreciation and Other Amortization of Real Estate
|
115,659
|
|
115,617
|
|
116,506
|
|
113,126
|
|
111,371
|
|
|||||||||
|
Depreciation and Other Amortization of Real Estate Included in Discontinued Operations
|
—
|
|
—
|
|
—
|
|
—
|
|
2,388
|
|
|||||||||
|
Equity in Depreciation and Other Amortization of Joint Ventures
|
—
|
|
—
|
|
—
|
|
17
|
|
117
|
|
|||||||||
|
Impairment of Depreciable Real Estate
|
2,285
|
|
—
|
|
—
|
|
626
|
|
—
|
|
|||||||||
|
Gain on Sale of Depreciable Real Estate
|
(80,909
|
)
|
(131,058
|
)
|
(68,202
|
)
|
(44,022
|
)
|
(25,988
|
)
|
|||||||||
|
Gain on Sale of Depreciable Real Estate from Joint Ventures
|
—
|
|
—
|
|
—
|
|
(63
|
)
|
(3,346
|
)
|
|||||||||
|
Noncontrolling Interest Share of Adjustments
|
(883
|
)
|
481
|
|
(1,725
|
)
|
(2,645
|
)
|
(3,281
|
)
|
|||||||||
|
Funds from Operations Available to First Industrial Realty Trust, Inc.'s Common Stockholders and Participating Securities
|
$
|
199,391
|
|
$
|
186,496
|
|
$
|
167,811
|
|
$
|
140,841
|
|
$
|
127,890
|
|
||||
39
In December 2018, NAREIT issued a white paper restating the definition of FFO. The purpose of the restatement was not to change the fundamental definition of FFO, but to clarify existing NAREIT guidance. The restated definition of FFO is as follows: Net Income (calculated in accordance with GAAP), excluding: (i) Depreciation and amortization related to real estate, (ii) Gains and losses from the sale of certain real estate assets, (iii) Gain and losses from change in control, and (iv) Impairment write-downs of certain real estate assets and investments in entities when the impairment is directly attributable to decreases in the value of depreciable real estate held by the entity. This restated definition provides an option to include or exclude gains and losses as well as impairment of non-depreciable real estate if the sales are deemed incidental. We currently include gains and losses on sales and impairment of our non-depreciable real estate in our calculation of NAREIT FFO. Commencing on January 1, 2019 we will adopt the restated definition of NAREIT FFO on a prospective basis and will exclude gains and losses on sales and impairment of our non-depreciable real estate that we deem incidental.
Same Store Net Operating Income
SS NOI is a non-GAAP financial measure that provides a measure of rental operations and, as calculated by us, that does not factor in depreciation and amortization, general and administrative expense, acquisition costs, interest expense, impairment charges, equity in income and loss from joint venture, income tax benefit and expense, gains and losses on retirement of debt, gains and losses on the sale of real estate and settlement gain on derivative instruments. We define SS NOI as revenues minus property expenses such as real estate taxes, repairs and maintenance, property management, utilities, insurance and other expenses, minus the NOI of properties that are not same store properties and minus the impact of straight-line rent, the amortization of lease inducements, the amortization of above/below market rent and lease termination fees. As so defined, SS NOI may not be comparable to same store net operating income or similar measures reported by other REITs that define same store properties or NOI differently. The major factors influencing SS NOI are occupancy levels, rental rate increases or decreases and tenant recoveries increases or decreases. Our success depends largely upon our ability to lease space and to recover the operating costs associated with those leases from our tenants.
The following table shows a reconciliation of the same store revenues and property expenses disclosed in the results of operations (and reconciled to revenues and expenses reflected on the statements of operations) to SS NOI for the years ended December 31, 2018 and 2017.
|
Year Ended December 31,
|
|||||||
|
|
2018
|
2017
|
|||||
|
|
(In thousands)
|
||||||
|
Same Store Revenues
|
$
|
365,873
|
|
$
|
349,196
|
|
|
|
Same Store Property Expenses
|
97,053
|
|
91,417
|
|
|||
|
Same Store Net Operating Income Before Same Store Adjustments
|
$
|
268,820
|
|
$
|
257,779
|
|
|
|
Same Store Adjustments:
|
|||||||
|
Straight-line Rent
|
1,020
|
|
(2,971
|
)
|
|||
|
Above / Below Market Rent Amortization
|
(817
|
)
|
(988
|
)
|
|||
|
Lease Termination Fees
|
(1,213
|
)
|
(773
|
)
|
|||
|
Same Store Net Operating Income
|
$
|
267,810
|
|
$
|
253,047
|
|
|
Subsequent Events
On January 25, 2019 we acquired one land parcel for a purchase price of $1.8 million, excluding costs incurred in conjunction with the acquisition.
On February 4, 2019 we acquired one industrial property for a purchase price of $12.3 million, excluding costs incurred in conjunction with the acquisition.
|
Item 7A.
|
Quantitative and Qualitative Disclosures About Market Risk
|
Response to this item is included in Item 7 "Management's Discussion and Analysis of Financial Condition and Results of Operations" above.
40
|
Item 8.
|
Financial Statements and Supplementary Data
|
See Index to Financial Statements and Financial Statement Schedule included in Item 15.
|
Item 9.
|
Changes in and Disagreements with Accountants on Accounting and Financial Disclosure
|
None.
|
Item 9A.
|
Controls and Procedures
|
First Industrial Realty Trust, Inc.
Evaluation of Disclosure Controls and Procedures
The Company maintains disclosure controls and procedures that are designed to ensure that information required to be disclosed in its periodic reports pursuant to the Exchange Act is recorded, processed, summarized and reported within the time periods specified in the SEC's rules and forms, and that such information is accumulated and communicated to management, including the Company's principal executive officer and principal financial officer, as appropriate, to allow timely decisions regarding required financial disclosure.
The Company carried out an evaluation, under the supervision and with the participation of management, including the Company's principal executive officer and principal financial officer, of the effectiveness of the design and operation of its disclosure controls and procedures pursuant to Exchange Act Rule 13a-15(b) as of the end of the period covered by this report. Based upon this evaluation, the Company's principal executive officer and principal financial officer concluded that its disclosure controls and procedures were effective as of the end of the period covered by this report.
Management's Report on Internal Control Over Financial Reporting
Management is responsible for establishing and maintaining adequate internal control over financial reporting. The Company's internal control over financial reporting is a process designed to provide reasonable assurance regarding the reliability of financial reporting and the preparation of financial statements for external purposes in accordance with generally accepted accounting principles.
Management has assessed the effectiveness of the Company's internal control over financial reporting as of December 31, 2018. In making its assessment of internal control over financial reporting, management used the
Internal Control-Integrated Framework (2013)
set forth by the Committee of Sponsoring Organizations of the Treadway Commission.
Management has concluded that, as of December 31, 2018, the Company's internal control over financial reporting was effective.
The effectiveness of the Company's internal control over financial reporting as of December 31, 2018 has been audited by PricewaterhouseCoopers LLP, an independent registered public accounting firm, as stated in their report which appears herein within Item 15. See Report of Independent Registered Public Accounting Firm.
Changes in Internal Control Over Financial Reporting
There has been no change in the Company's internal control over financial reporting that occurred during the fourth quarter of 2018 that has materially affected, or is reasonably likely to materially affect, the Company's internal control over financial reporting.
41
First Industrial, L.P.
Evaluation of Disclosure Controls and Procedures
The Operating Partnership maintains disclosure controls and procedures that are designed to ensure that information required to be disclosed in its periodic reports pursuant to the Exchange Act is recorded, processed, summarized and reported within the time periods specified in the SEC's rules and forms, and that such information is accumulated and communicated to management, including the Company's principal executive officer and principal financial officer, on behalf of the Company in its capacity as the general partner of the Operating Partnership, as appropriate, to allow timely decisions regarding required financial disclosure.
The Operating Partnership carried out an evaluation, under the supervision and with the participation of management, including the Company's principal executive officer and principal financial officer, on behalf of the Company in its capacity as the general partner of the Operating Partnership, of the effectiveness of the design and operation of the Operating Partnership's disclosure controls and procedures pursuant to Exchange Act Rule 13a-15(b) as of the end of the period covered by this report. Based upon this evaluation, the Company's principal executive officer and principal financial officer, on behalf of the Company in its capacity as the general partner of the Operating Partnership, concluded that the Operating Partnership's disclosure controls and procedures were effective as of the end of the period covered by this report.
Management's Report on Internal Control Over Financial Reporting
Management is responsible for establishing and maintaining adequate internal control over financial reporting. The Operating Partnership's internal control over financial reporting is a process designed to provide reasonable assurance regarding the reliability of financial reporting and the preparation of financial statements for external purposes in accordance with generally accepted accounting principles.
Management has assessed the effectiveness of the Operating Partnership's internal control over financial reporting as of December 31, 2018. In making its assessment of internal control over financial reporting, management used the
Internal Control-Integrated Framework (2013)
set forth by the Committee of Sponsoring Organizations of the Treadway Commission.
Management has concluded that, as of December 31, 2018, the Operating Partnership's internal control over financial reporting was effective.
The effectiveness of the Operating Partnership's internal control over financial reporting as of December 31, 2018 has been audited by PricewaterhouseCoopers LLP, an independent registered public accounting firm, as stated in their report which appears herein within Item 15. See Report of Independent Registered Public Accounting Firm.
Changes in Internal Control Over Financial Reporting
There has been no change in the Operating Partnership's internal control over financial reporting that occurred during the fourth quarter of 2018 that has materially affected, or is reasonably likely to materially affect, the Operating Partnership's internal control over financial reporting.
|
Item 9B.
|
Other Information
|
None.
42
PART III
|
Item 10, 11, 12, 13 and 14.
|
Directors, Executive Officers and Corporate Governance, Executive Compensation, Security Ownership of Certain Beneficial Owners and Management and Related Stockholder Matters, Certain Relationships and Related Transactions and Director Independence and Principal Accountant Fees and Services
|
The information required by Item 10, Item 11, Item 12, Item 13 and Item 14 is hereby incorporated or furnished, solely to the extent required by such item, from the Company's definitive proxy statement, which is expected to be filed with the SEC no later than 120 days after the end of the Company's fiscal year. Information from the Company's definitive proxy statement shall not be deemed to be "filed" or "soliciting material," or subject to liability for purposes of Section 18 of the Securities Exchange Act of 1934 to the maximum extent permitted under the Exchange Act.
PART IV
|
Item 15.
|
Exhibits and Financial Statement Schedules
|
(a)
Financial Statements, Financial Statement Schedule and Exhibits
(1 & 2) See Index to Financial Statements and Financial Statement Schedule.
(3) Exhibits: The Exhibits required by Item 601 of Regulation S-K are listed in the Exhibit Index on page 45 to 47 of this report, which is incorporated herein by reference.
43
EXHIBIT INDEX
|
Exhibits
|
Description
|
|
|
10.1
|
Contribution Agreement, dated March 19, 1996, among FR Acquisitions, Inc. and the parties listed on the signature pages thereto (incorporated by reference to Exhibit 10.1 of the Form 8-K of the Company, dated April 3, 1996, File No. 1-13102)
|
|
44
|
Exhibits
|
Description
|
|
|
|
||
|
|
||
45
|
Exhibits
|
Description
|
|
|
101.1*
|
The following financial statements from First Industrial Realty Trust, Inc.'s and First Industrial L.P.'s Annual Report on Form 10-K for the year ended December 31, 2018, formatted in XBRL: (i) Consolidated Balance Sheets (audited), (ii) Consolidated Statements of Operations (audited), (iii) Consolidated Statements of Comprehensive Income (audited), (iv) Consolidated Statement of Changes in Stockholders' Equity / Consolidated Statement of Changes in Partners' Capital (audited), (v) Consolidated Statements of Cash Flows (audited) and (vi) Notes to Consolidated Financial Statements (audited)
|
|
_______________
|
*
|
Filed herewith.
|
|
**
|
Furnished herewith.
|
|
†
|
Indicates a compensatory plan or arrangement contemplated by Item 15 a (3) of Form 10-K.
|
|
Item 16.
|
Form 10-K Summary
|
Not applicable.
46
FIRST INDUSTRIAL REALTY TRUST, INC.
FIRST INDUSTRIAL, L.P.
INDEX TO FINANCIAL STATEMENTS AND FINANCIAL STATEMENT SCHEDULE
|
Page
|
|
|
First Industrial Realty Trust, Inc. and First Industrial, L.P.
|
|
|
CONSOLIDATED FINANCIAL STATEMENTS
|
|
|
First Industrial Realty Trust, Inc.
|
|
|
First Industrial, L.P.
|
|
|
First Industrial Realty Trust, Inc. and First Industrial, L.P.
|
|
|
FINANCIAL STATEMENT SCHEDULE
|
|
|
First Industrial Realty Trust, Inc. and First Industrial, L.P.
|
|
|
Schedule III: Real Estate and Accumulated Depreciation
at December 31, 2018
|
|
47
Report of Independent Registered Public Accounting Firm
To the Board of Directors and Stockholders of
First Industrial Realty Trust, Inc.:
Opinions on the Financial Statements and Internal Control over Financial Reporting
We have audited the accompanying consolidated balance sheets of First Industrial Realty Trust, Inc.
and its subsidiaries (the "Company")
as of December 31, 2018 and 2017, and the related consolidated statements of operations, of comprehensive income, of changes in stockholders' equity and of cash flows for each of the three years in the period ended December 31, 2018, including the related notes and financial statement schedule listed in the accompanying index (collectively referred to as the "consolidated financial statements").
We also have audited the Company's internal control over financial reporting as of December 31, 2018, based on criteria established in
Internal Control - Integrated Framework
(2013)
issued by the Committee of Sponsoring Organizations of the Treadway Commission (COSO).
In our opinion, the consolidated financial statements referred to above present fairly, in all material respects, the financial position of the Company as of December 31, 2018, and the results of their operations and their cash flows for each of the three years in the period ended December 31, 2018 in conformity with accounting principles generally accepted in the United States of America. Also in our opinion, the Company maintained, in all material respects, effective internal control over financial reporting as of December 31, 2018, based on criteria established in
Internal Control - Integrated Framework
(2013) issued by the COSO.
Basis for Opinions
The Company's management is responsible for these consolidated financial statements, for maintaining effective internal control over financial reporting, and for its assessment of the effectiveness of internal control over financial reporting, included in Management's Report on Internal Control over Financial Reporting appearing under item 9A. Our responsibility is to express opinions on the Company's consolidated
financial statements and on the Company's internal control over financial reporting based on our audits. We are a public accounting firm registered with the Public Company Accounting Oversight Board (United States) ("PCAOB") and are required to be independent with respect to the Company in accordance with the U.S. federal securities laws and the applicable rules and regulations of the Securities and Exchange Commission and the PCAOB.
We conducted our audits in accordance with the standards of the PCAOB. Those standards require that we plan and perform the audits to obtain reasonable assurance about whether the consolidated financial statements are free of material misstatement, whether due to error or fraud, and whether effective internal control over financial reporting was maintained in all material respects.
Our audits of the consolidated financial statements included performing procedures to assess the risks of material misstatement of the consolidated financial statements, whether due to error or fraud, and performing procedures that respond to those risks. Such procedures included examining, on a test basis, evidence regarding the amounts and disclosures in the consolidated financial statements. Our audits also included evaluating the accounting principles used and significant estimates made by management, as well as evaluating the overall presentation of the consolidated financial statements. Our audit of internal control over financial reporting included obtaining an understanding of internal control over financial reporting, assessing the risk that a material weakness exists, and testing and evaluating the design and operating effectiveness of internal control based on the assessed risk. Our audits also included performing such other procedures as we considered necessary in the circumstances. We believe that our audits provide a reasonable basis for our opinions.
48
Definition and Limitations of Internal Control over Financial Reporting
A company's internal control over financial reporting is a process designed to provide reasonable assurance regarding the reliability of financial reporting and the preparation of financial statements for external purposes in accordance with generally accepted accounting principles. A company's internal control over financial reporting includes those policies and procedures that (i) pertain to the maintenance of records that, in reasonable detail, accurately and fairly reflect the transactions and dispositions of the assets of the company; (ii) provide reasonable assurance that transactions are recorded as necessary to permit preparation of financial statements in accordance with generally accepted accounting principles, and that receipts and expenditures of the company are being made only in accordance with authorizations of management and directors of the company; and (iii) provide reasonable assurance regarding prevention or timely detection of unauthorized acquisition, use, or disposition of the company's assets that could have a material effect on the financial statements.
Because of its inherent limitations, internal control over financial reporting may not prevent or detect misstatements. Also, projections of any evaluation of effectiveness to future periods are subject to the risk that controls may become inadequate because of changes in conditions, or that the degree of compliance with the policies or procedures may deteriorate.
/s/PricewaterhouseCoopers LLP
Chicago, Illinois
February 19, 2019
We have served as the Company's auditor since 1993.
49
Report of Independent Registered Public Accounting Firm
To the Partners of
First Industrial, L.P.:
Opinions on the Financial Statements and Internal Control over Financial Reporting
We have audited the accompanying consolidated balance sheets of First Industrial, L.P. and its subsidiaries (the "Operating Partnership") as of December 31, 2018 and 2017 and the related consolidated statements of operations, of comprehensive income, of changes in partners' capital and of cash flows for each of the three years in the period ended December 31, 2018, including the related notes and financial statement schedule listed in the accompanying index (collectively referred to as the "consolidated financial statements"). We also have audited the Company's internal control over financial reporting as of December 31, 2018, based on criteria established in
Internal Control - Integrated Framework
(2013) issued by the Committee of Sponsoring Organizations of the Treadway Commission (COSO).
In our opinion, the consolidated financial statements referred to above present fairly, in all material respects, the financial position of the Operating Partnership as of December 31, 2018 and the results of their operations and their cash flows for each of the three years in the period ended December 31, 2018 in conformity with accounting principles generally accepted in the United States of America. Also in our opinion, the Operating Partnership maintained, in all material respects, effective internal control over financial reporting as of December 31, 2018, based on criteria established in
Internal Control - Integrated Framework
(2013) issued by the COSO.
Basis for Opinions
The Operating Partnership's management is responsible for these consolidated financial statements, for maintaining effective internal control over financial reporting, and for its assessment of the effectiveness of internal control over financial reporting, included in Management's Report on Internal Control over Financial Reporting appearing under Item 9A. Our responsibility is to express opinions on the Operating Partnership's consolidated financial statements and on the Company's internal control over financial reporting based on our audits. We are a public accounting firm registered with the Public Company Accounting Oversight Board (United States) ("PCAOB") and are required to be independent with respect to the Company in accordance with the U.S. federal securities laws and the applicable rules and regulations of the Securities and Exchange Commission and the PCAOB.
We conducted our audits in accordance with the standards of the PCAOB. Those standards require that we plan and perform the audits to obtain reasonable assurance about whether the consolidated financial statements are free of material misstatement, whether due to error or fraud, and whether effective internal control over financial reporting was maintained in all material respects.
Our audits of the consolidated financial statements included performing procedures to assess the risks of material misstatement of the consolidated financial statements, whether due to error or fraud, and performing procedures that respond to those risks. Such procedures included examining, on a test basis, evidence regarding the amounts and disclosures in the consolidated financial statements. Our audits also included evaluating the accounting principles used and significant estimates made by management, as well as evaluating the overall presentation of the consolidated financial statements. Our audit of internal control over financial reporting included obtaining an understanding of internal control over financial reporting, assessing the risk that a material weakness exists, and testing and evaluating the design and operating effectiveness of internal control based on the assessed risk. Our audits also included performing such other procedures as we considered necessary in the circumstances. We believe that our audits provide a reasonable basis for our opinions.
50
Definition and Limitations of Internal Control over Financial Reporting
A company's internal control over financial reporting is a process designed to provide reasonable assurance regarding the reliability of financial reporting and the preparation of financial statements for external purposes in accordance with generally accepted accounting principles. A company's internal control over financial reporting includes those policies and procedures that (i) pertain to the maintenance of records that, in reasonable detail, accurately and fairly reflect the transactions and dispositions of the assets of the company; (ii) provide reasonable assurance that transactions are recorded as necessary to permit preparation of financial statements in accordance with generally accepted accounting principles, and that receipts and expenditures of the company are being made only in accordance with authorizations of management and directors of the company; and (iii) provide reasonable assurance regarding prevention or timely detection of unauthorized acquisition, use, or disposition of the company's assets that could have a material effect on the financial statements.
Because of its inherent limitations, internal control over financial reporting may not prevent or detect misstatements. Also, projections of any evaluation of effectiveness to future periods are subject to the risk that controls may become inadequate because of changes in conditions, or that the degree of compliance with the policies or procedures may deteriorate.
/s/ PricewaterhouseCoopers LLP
Chicago, Illinois
February 19, 2019
We have served as the Operating Partnership's auditor since 1996.
51
FIRST INDUSTRIAL REALTY TRUST, INC.
CONSOLIDATED BALANCE SHEETS
|
December 31, 2018
|
December 31, 2017
|
||||||
|
|
(In thousands, except share and per share data)
|
||||||
|
ASSETS
|
|||||||
|
Assets:
|
|||||||
|
Investment in Real Estate:
|
|||||||
|
Land
|
$
|
909,318
|
|
$
|
864,813
|
|
|
|
Buildings and Improvements
|
2,704,850
|
|
2,521,457
|
|
|||
|
Construction in Progress
|
59,476
|
|
109,475
|
|
|||
|
Less: Accumulated Depreciation
|
(811,784
|
)
|
(789,919
|
)
|
|||
|
Net Investment in Real Estate
|
2,861,860
|
|
2,705,826
|
|
|||
|
Cash and Cash Equivalents
|
43,102
|
|
21,146
|
|
|||
|
Restricted Cash
|
7,271
|
|
25,336
|
|
|||
|
Tenant Accounts Receivable, Net
|
5,185
|
|
4,873
|
|
|||
|
Investment in Joint Venture
|
23,326
|
|
—
|
|
|||
|
Deferred Rent Receivable, Net
|
71,079
|
|
70,254
|
|
|||
|
Deferred Leasing Intangibles, Net
|
29,678
|
|
30,481
|
|
|||
|
Prepaid Expenses and Other Assets, Net
|
101,190
|
|
83,146
|
|
|||
|
Total Assets
|
$
|
3,142,691
|
|
$
|
2,941,062
|
|
|
|
LIABILITIES AND EQUITY
|
|||||||
|
Liabilities:
|
|||||||
|
Indebtedness:
|
|||||||
|
Mortgage Loans Payable, Net
|
$
|
296,470
|
|
$
|
450,056
|
|
|
|
Senior Unsecured Notes, Net
|
544,504
|
|
246,673
|
|
|||
|
Unsecured Term Loans, Net
|
456,809
|
|
455,768
|
|
|||
|
Unsecured Credit Facility
|
—
|
|
144,500
|
|
|||
|
Accounts Payable, Accrued Expenses and Other Liabilities
|
78,665
|
|
86,532
|
|
|||
|
Deferred Leasing Intangibles, Net
|
9,560
|
|
10,355
|
|
|||
|
Rents Received in Advance and Security Deposits
|
47,927
|
|
44,285
|
|
|||
|
Dividends and Distributions Payable
|
28,845
|
|
27,016
|
|
|||
|
Total Liabilities
|
1,462,780
|
|
1,465,185
|
|
|||
|
Commitments and Contingencies
|
—
|
|
—
|
|
|||
|
Equity:
|
|||||||
|
First Industrial Realty Trust Inc.'s Stockholders' Equity:
|
|||||||
|
Common Stock ($0.01 par value, 225,000,000 shares authorized and 126,307,431 and 119,883,180 shares issued and outstanding)
|
1,263
|
|
1,199
|
|
|||
|
Additional Paid-in-Capital
|
2,131,556
|
|
1,967,110
|
|
|||
|
Distributions in Excess of Accumulated Earnings
|
(490,807
|
)
|
(541,847
|
)
|
|||
|
Accumulated Other Comprehensive Income
|
3,502
|
|
1,338
|
|
|||
|
Total First Industrial Realty Trust, Inc.'s Stockholders' Equity
|
1,645,514
|
|
1,427,800
|
|
|||
|
Noncontrolling Interest
|
34,397
|
|
48,077
|
|
|||
|
Total Equity
|
1,679,911
|
|
1,475,877
|
|
|||
|
Total Liabilities and Equity
|
$
|
3,142,691
|
|
$
|
2,941,062
|
|
|
The accompanying notes are an integral part of the consolidated financial statements.
52
FIRST INDUSTRIAL REALTY TRUST, INC.
CONSOLIDATED STATEMENTS OF OPERATIONS
|
Year Ended December 31, 2018
|
Year Ended December 31, 2017
|
Year Ended December 31, 2016
|
|||||||||
|
|
(In thousands, except per share data)
|
||||||||||
|
Revenues:
|
|||||||||||
|
Rental Income
|
$
|
306,406
|
|
$
|
303,874
|
|
$
|
289,858
|
|
||
|
Tenant Recoveries and Other Income
|
97,548
|
|
92,528
|
|
88,162
|
|
|||||
|
Total Revenues
|
403,954
|
|
396,402
|
|
378,020
|
|
|||||
|
Expenses:
|
|||||||||||
|
Property Expenses
|
116,854
|
|
113,494
|
|
112,324
|
|
|||||
|
General and Administrative
|
27,749
|
|
28,079
|
|
26,703
|
|
|||||
|
Depreciation and Other Amortization
|
116,459
|
|
116,364
|
|
117,282
|
|
|||||
|
Impairment of Real Estate
|
2,756
|
|
—
|
|
—
|
|
|||||
|
Acquisition Costs
|
—
|
|
—
|
|
491
|
|
|||||
|
Total Expenses
|
263,818
|
|
257,937
|
|
256,800
|
|
|||||
|
Other Income (Expense):
|
|||||||||||
|
Gain on Sale of Real Estate
|
81,600
|
|
131,269
|
|
68,202
|
|
|||||
|
Interest Expense
|
(50,775
|
)
|
(57,199
|
)
|
(59,430
|
)
|
|||||
|
Amortization of Debt Issuance Costs
|
(3,404
|
)
|
(3,162
|
)
|
(3,219
|
)
|
|||||
|
Settlement Gain on Derivative Instruments
|
—
|
|
1,896
|
|
—
|
|
|||||
|
Loss from Retirement of Debt
|
(39
|
)
|
(1,775
|
)
|
—
|
|
|||||
|
Total Other Income (Expense)
|
27,382
|
|
71,029
|
|
5,553
|
|
|||||
|
Income from Operations Before Equity in Loss of Joint Venture and Income Tax Provision
|
167,518
|
|
209,494
|
|
126,773
|
|
|||||
|
Equity in Loss of Joint Venture
|
(276
|
)
|
—
|
|
—
|
|
|||||
|
Income Tax Benefit (Provision)
|
92
|
|
(1,193
|
)
|
(1,089
|
)
|
|||||
|
Net Income
|
167,334
|
|
208,301
|
|
125,684
|
|
|||||
|
Less: Net Income Attributable to the Noncontrolling Interest
|
(4,095
|
)
|
(6,845
|
)
|
(4,452
|
)
|
|||||
|
Net Income Available to First Industrial Realty Trust, Inc.'s Common Stockholders and Participating Securities
|
163,239
|
|
201,456
|
|
121,232
|
|
|||||
|
Basic Earnings Per Share:
|
|||||||||||
|
Net Income Available to First Industrial Realty Trust, Inc.'s Common Stockholders
|
$
|
1.31
|
|
$
|
1.70
|
|
$
|
1.05
|
|
||
|
Diluted Earnings Per Share:
|
|||||||||||
|
Net Income Available to First Industrial Realty Trust, Inc.'s Common Stockholders
|
$
|
1.31
|
|
$
|
1.69
|
|
$
|
1.05
|
|
||
|
Dividends/Distributions Per Share
|
$
|
0.87
|
|
$
|
0.84
|
|
$
|
0.76
|
|
||
|
Weighted Average Shares Outstanding - Basic
|
123,804
|
|
118,272
|
|
115,030
|
|
|||||
|
Weighted Average Shares Outstanding - Diluted
|
124,191
|
|
118,787
|
|
115,370
|
|
|||||
The accompanying notes are an integral part of the consolidated financial statements.
53
FIRST INDUSTRIAL REALTY TRUST, INC.
CONSOLIDATED STATEMENTS OF COMPREHENSIVE INCOME
|
Year Ended December 31, 2018
|
Year Ended December 31, 2017
|
Year Ended December 31, 2016
|
|||||||||
|
|
(In thousands)
|
||||||||||
|
Net Income
|
$
|
167,334
|
|
$
|
208,301
|
|
$
|
125,684
|
|
||
|
Mark-to-Market Gain on Derivative Instruments
|
2,096
|
|
5,981
|
|
4,849
|
|
|||||
|
Amortization of Derivative Instruments
|
96
|
|
205
|
|
390
|
|
|||||
|
Comprehensive Income
|
169,526
|
|
214,487
|
|
130,923
|
|
|||||
|
Comprehensive Income Attributable to Noncontrolling Interest
|
(4,149
|
)
|
(6,642
|
)
|
(4,638
|
)
|
|||||
|
Comprehensive Income Attributable to First Industrial Realty Trust, Inc.
|
$
|
165,377
|
|
$
|
207,845
|
|
$
|
126,285
|
|
||
The accompanying notes are an integral part of the consolidated financial statements.
54
FIRST INDUSTRIAL REALTY TRUST, INC.
CONSOLIDATED STATEMENTS OF CHANGES IN STOCKHOLDERS' EQUITY
|
Common
Stock
|
Additional
Paid-in-
Capital
|
Distributions
in Excess of
Accumulated
Earnings
|
Accumulated
Other
Comprehensive
(Loss) Income
|
Noncontrolling
Interest
|
Total
|
||||||||||||||||||
|
|
|||||||||||||||||||||||
|
Balance as of December 31, 2015
|
$
|
1,111
|
|
$
|
1,756,415
|
|
$
|
(674,759
|
)
|
$
|
(9,667
|
)
|
$
|
42,035
|
|
$
|
1,115,135
|
|
|||||
|
Net Income
|
—
|
|
—
|
|
121,232
|
|
—
|
|
4,452
|
|
125,684
|
|
|||||||||||
|
Other Comprehensive Income
|
—
|
|
—
|
|
—
|
|
5,053
|
|
186
|
|
5,239
|
|
|||||||||||
|
Issuance of Common Stock, Net of Issuance Costs
|
56
|
|
124,528
|
|
—
|
|
—
|
|
—
|
|
124,584
|
|
|||||||||||
|
Stock Based Compensation Activity
|
2
|
|
5,516
|
|
(217
|
)
|
—
|
|
—
|
|
5,301
|
|
|||||||||||
|
Common Stock Dividends and Unit Distributions
|
—
|
|
—
|
|
(88,115
|
)
|
—
|
|
(3,203
|
)
|
(91,318
|
)
|
|||||||||||
|
Conversion of Limited Partner Units to Common Stock
|
3
|
|
2,859
|
|
—
|
|
—
|
|
(2,862
|
)
|
—
|
|
|||||||||||
|
Reallocation—Additional Paid-in-Capital
|
—
|
|
(2,547
|
)
|
—
|
|
—
|
|
2,547
|
|
—
|
|
|||||||||||
|
Reallocation—Other Comprehensive Income
|
—
|
|
—
|
|
—
|
|
(29
|
)
|
29
|
|
—
|
|
|||||||||||
|
Balance as of December 31, 2016
|
$
|
1,172
|
|
$
|
1,886,771
|
|
$
|
(641,859
|
)
|
$
|
(4,643
|
)
|
$
|
43,184
|
|
$
|
1,284,625
|
|
|||||
|
Net Income
|
—
|
|
—
|
|
201,456
|
|
—
|
|
6,845
|
|
208,301
|
|
|||||||||||
|
Other Comprehensive Income
|
—
|
|
—
|
|
—
|
|
6,389
|
|
(203
|
)
|
6,186
|
|
|||||||||||
|
Issuance of Common Stock, Net of Issuance Costs
|
25
|
|
74,636
|
|
—
|
|
—
|
|
—
|
|
74,661
|
|
|||||||||||
|
Stock Based Compensation Activity
|
2
|
|
6,932
|
|
(724
|
)
|
—
|
|
—
|
|
6,210
|
|
|||||||||||
|
Common Stock Dividends and Unit Distributions
|
—
|
|
—
|
|
(100,720
|
)
|
—
|
|
(3,386
|
)
|
(104,106
|
)
|
|||||||||||
|
Conversion of Limited Partner Units to Common Stock
|
—
|
|
364
|
|
—
|
|
—
|
|
(364
|
)
|
—
|
|
|||||||||||
|
Reallocation—Additional Paid-in-Capital
|
—
|
|
(1,593
|
)
|
—
|
|
—
|
|
1,593
|
|
—
|
|
|||||||||||
|
Reallocation—Other Comprehensive Income
|
—
|
|
—
|
|
—
|
|
(408
|
)
|
408
|
|
—
|
|
|||||||||||
|
Balance as of December 31, 2017
|
$
|
1,199
|
|
$
|
1,967,110
|
|
$
|
(541,847
|
)
|
$
|
1,338
|
|
$
|
48,077
|
|
$
|
1,475,877
|
|
|||||
|
Net Income
|
—
|
|
—
|
|
163,239
|
|
—
|
|
4,095
|
|
167,334
|
|
|||||||||||
|
Other Comprehensive Income
|
—
|
|
—
|
|
—
|
|
2,138
|
|
54
|
|
2,192
|
|
|||||||||||
|
Issuance of Common Stock, Net of Issuance Costs
|
48
|
|
145,360
|
|
—
|
|
—
|
|
—
|
|
145,408
|
|
|||||||||||
|
Stock Based Compensation Activity
|
3
|
|
4,791
|
|
(3,282
|
)
|
—
|
|
—
|
|
1,512
|
|
|||||||||||
|
Common Stock Dividends and Unit Distributions
|
—
|
|
—
|
|
(108,917
|
)
|
—
|
|
(2,561
|
)
|
(111,478
|
)
|
|||||||||||
|
Conversion of Limited Partner Units to Common Stock
|
13
|
|
16,592
|
|
—
|
|
—
|
|
(16,605
|
)
|
—
|
|
|||||||||||
|
Retirement of Limited Partner Units
|
—
|
|
—
|
|
—
|
|
—
|
|
(934
|
)
|
(934
|
)
|
|||||||||||
|
Reallocation—Additional Paid-in-Capital
|
—
|
|
(2,297
|
)
|
—
|
|
—
|
|
2,297
|
|
—
|
|
|||||||||||
|
Reallocation—Other Comprehensive Income
|
—
|
|
—
|
|
—
|
|
26
|
|
(26
|
)
|
—
|
|
|||||||||||
|
Balance as of December 31, 2018
|
$
|
1,263
|
|
$
|
2,131,556
|
|
$
|
(490,807
|
)
|
$
|
3,502
|
|
$
|
34,397
|
|
$
|
1,679,911
|
|
|||||
The accompanying notes are an integral part of the consolidated financial statements.
55
|
FIRST INDUSTRIAL REALTY TRUST, INC.
CONSOLIDATED STATEMENTS OF CASH FLOWS
|
|||||||||||
|
Year Ended December 31, 2018
|
Year Ended December 31, 2017
|
Year Ended December 31, 2016
|
|||||||||
|
|
(In thousands)
|
||||||||||
|
CASH FLOWS FROM OPERATING ACTIVITIES:
|
|||||||||||
|
Net Income
|
$
|
167,334
|
|
$
|
208,301
|
|
$
|
125,684
|
|
||
|
Adjustments to Reconcile Net Income to Net Cash Provided by Operating Activities:
|
|||||||||||
|
Depreciation
|
94,626
|
|
94,078
|
|
95,514
|
|
|||||
|
Amortization of Debt Issuance Costs
|
3,404
|
|
3,162
|
|
3,219
|
|
|||||
|
Other Amortization, including Stock Based Compensation
|
26,976
|
|
29,252
|
|
28,403
|
|
|||||
|
Impairment of Real Estate
|
2,756
|
|
—
|
|
—
|
|
|||||
|
Provision for Bad Debt
|
350
|
|
177
|
|
563
|
|
|||||
|
Equity in Loss of Joint Venture
|
276
|
|
—
|
|
—
|
|
|||||
|
Gain on Sale of Real Estate
|
(81,600
|
)
|
(131,269
|
)
|
(68,202
|
)
|
|||||
|
Loss from Retirement of Debt
|
39
|
|
1,775
|
|
—
|
|
|||||
|
Gain on Casualty and Involuntary Conversion
|
(392
|
)
|
(1,321
|
)
|
—
|
|
|||||
|
(Increase) Decrease in Tenant Accounts Receivable, Prepaid Expenses and Other Assets, Net
|
(4,199
|
)
|
(5,829
|
)
|
965
|
|
|||||
|
Increase in Deferred Rent Receivable, Net
|
(2,165
|
)
|
(5,299
|
)
|
(6,602
|
)
|
|||||
|
Increase (Decrease) in Accounts Payable, Accrued Expenses, Other Liabilities, Rents Received in Advance and Security Deposits
|
3,090
|
|
(465
|
)
|
(5,655
|
)
|
|||||
|
Net Cash Provided by Operating Activities
|
210,495
|
|
192,562
|
|
173,889
|
|
|||||
|
CASH FLOWS FROM INVESTING ACTIVITIES:
|
|||||||||||
|
Acquisitions of Real Estate
|
(157,787
|
)
|
(175,303
|
)
|
(107,484
|
)
|
|||||
|
Additions to Investment in Real Estate and Non-Acquisition Tenant Improvements and Lease Costs
|
(224,466
|
)
|
(146,003
|
)
|
(179,994
|
)
|
|||||
|
Net Proceeds from Sales of Investments in Real Estate
|
184,783
|
|
228,102
|
|
163,435
|
|
|||||
|
Proceeds from Casualty and Involuntary Conversion
|
906
|
|
10,094
|
|
—
|
|
|||||
|
Contributions to and Investments in Joint Venture
|
(25,190
|
)
|
—
|
|
—
|
|
|||||
|
Distributions from Joint Venture
|
1,829
|
|
—
|
|
—
|
|
|||||
|
Other Investing Activity
|
(3,473
|
)
|
615
|
|
1,648
|
|
|||||
|
Net Cash Used in Investing Activities
|
(223,398
|
)
|
(82,495
|
)
|
(122,395
|
)
|
|||||
|
CASH FLOWS FROM FINANCING ACTIVITIES:
|
|||||||||||
|
Debt and Equity Issuance Costs
|
(2,975
|
)
|
(6,864
|
)
|
(375
|
)
|
|||||
|
Proceeds from the Issuance of Common Stock, Net of Underwriter's Discount
|
145,584
|
|
74,880
|
|
124,936
|
|
|||||
|
Repurchase and Retirement of Restricted Stock
|
(6,020
|
)
|
(2,401
|
)
|
(5,242
|
)
|
|||||
|
Common Stock Dividends and Unit Distributions Paid
|
(109,649
|
)
|
(100,524
|
)
|
(82,696
|
)
|
|||||
|
Repayments on Mortgage Loans Payable
|
(165,646
|
)
|
(46,832
|
)
|
(70,969
|
)
|
|||||
|
Prepayments of Penalties Associated with Retirement of Debt
|
—
|
|
(1,453
|
)
|
(554
|
)
|
|||||
|
Proceeds from Senior Unsecured Notes
|
300,000
|
|
200,000
|
|
—
|
|
|||||
|
Repayments of Senior Unsecured Notes
|
—
|
|
(156,852
|
)
|
(159,125
|
)
|
|||||
|
Proceeds from Unsecured Credit Facility
|
237,000
|
|
429,000
|
|
442,000
|
|
|||||
|
Repayments on Unsecured Credit Facility
|
(381,500
|
)
|
(474,000
|
)
|
(305,000
|
)
|
|||||
|
Net Cash Provided by (Used in) Financing Activities
|
16,794
|
|
(85,046
|
)
|
(57,025
|
)
|
|||||
|
Net Increase (Decrease) in Cash, Cash Equivalents and Restricted Cash
|
3,891
|
|
25,021
|
|
(5,531
|
)
|
|||||
|
Cash, Cash Equivalents and Restricted Cash, Beginning of Year
|
46,482
|
|
21,461
|
|
26,992
|
|
|||||
|
Cash, Cash Equivalents and Restricted Cash, End of Year
|
$
|
50,373
|
|
$
|
46,482
|
|
$
|
21,461
|
|
||
|
FIRST INDUSTRIAL REALTY TRUST, INC.
CONSOLIDATED STATEMENTS OF CASH FLOWS (Continued)
|
|||||||||||
|
Year Ended December 31, 2018
|
Year Ended December 31, 2017
|
Year Ended December 31, 2016
|
|||||||||
|
|
(In thousands)
|
||||||||||
|
SUPPLEMENTAL INFORMATION TO STATEMENTS OF CASH FLOWS:
|
|||||||||||
|
Interest Paid, Net of Interest Expense Capitalized in Connection with Development Activity
|
$
|
47,408
|
|
$
|
56,844
|
|
$
|
63,600
|
|
||
|
Interest Expense Capitalized in Connection with Development Activity
|
$
|
5,869
|
|
$
|
4,353
|
|
$
|
3,523
|
|
||
|
Income Taxes Paid
|
$
|
457
|
|
$
|
769
|
|
$
|
1,358
|
|
||
|
Supplemental Schedule of Non-Cash Investing and Financing Activities:
|
|||||||||||
|
Common Stock Dividends and Unit Distributions Payable
|
$
|
28,845
|
|
$
|
27,016
|
|
$
|
23,434
|
|
||
|
Exchange of Limited Partnership Units for Common Stock:
|
|||||||||||
|
Noncontrolling Interest
|
$
|
(16,605
|
)
|
$
|
(364
|
)
|
$
|
(2,862
|
)
|
||
|
Common Stock
|
13
|
|
—
|
|
3
|
|
|||||
|
Additional Paid-in-Capital
|
16,592
|
|
364
|
|
2,859
|
|
|||||
|
Total
|
$
|
—
|
|
$
|
—
|
|
$
|
—
|
|
||
|
Assumption of Indebtedness and Other Liabilities in Connection with the Acquisition of Real Estate
|
$
|
11,878
|
|
$
|
1,269
|
|
$
|
5,405
|
|
||
|
Accounts Payable Related to Construction in Progress and Additions to Investment in Real Estate
|
$
|
31,545
|
|
$
|
38,597
|
|
$
|
32,712
|
|
||
|
Write-off of Fully Depreciated Assets
|
$
|
(43,654
|
)
|
$
|
(35,560
|
)
|
$
|
(44,080
|
)
|
||
The accompanying notes are an integral part of the consolidated financial statements.
56
FIRST INDUSTRIAL, L.P.
CONSOLIDATED BALANCE SHEETS
|
December 31, 2018
|
December 31, 2017
|
||||||
|
|
(In thousands, except Unit data)
|
||||||
|
ASSETS
|
|||||||
|
Assets:
|
|||||||
|
Investment in Real Estate:
|
|||||||
|
Land
|
$
|
909,318
|
|
$
|
864,813
|
|
|
|
Buildings and Improvements
|
2,704,850
|
|
2,521,457
|
|
|||
|
Construction in Progress
|
59,476
|
|
109,475
|
|
|||
|
Less: Accumulated Depreciation
|
(811,784
|
)
|
(789,919
|
)
|
|||
|
Net Investment in Real Estate (including $260,528 and $270,708 related to consolidated variable interest entities, see Note 5)
|
2,861,860
|
|
2,705,826
|
|
|||
|
Cash and Cash Equivalents
|
43,102
|
|
21,146
|
|
|||
|
Restricted Cash
|
7,271
|
|
25,336
|
|
|||
|
Tenant Accounts Receivable, Net
|
5,185
|
|
4,873
|
|
|||
|
Investment in Joint Venture
|
23,326
|
|
—
|
|
|||
|
Deferred Rent Receivable, Net
|
71,079
|
|
70,254
|
|
|||
|
Deferred Leasing Intangibles, Net
|
29,678
|
|
30,481
|
|
|||
|
Prepaid Expenses and Other Assets, Net
|
111,298
|
|
93,264
|
|
|||
|
Total Assets
|
$
|
3,152,799
|
|
$
|
2,951,180
|
|
|
|
LIABILITIES AND PARTNERS' CAPITAL
|
|||||||
|
Liabilities:
|
|||||||
|
Indebtedness:
|
|||||||
|
Mortgage Loans Payable, Net (including $20,497 and $61,256 related to consolidated variable interest entities, see Note 5)
|
$
|
296,470
|
|
$
|
450,056
|
|
|
|
Senior Unsecured Notes, Net
|
544,504
|
|
246,673
|
|
|||
|
Unsecured Term Loans, Net
|
456,809
|
|
455,768
|
|
|||
|
Unsecured Credit Facility
|
—
|
|
144,500
|
|
|||
|
Accounts Payable, Accrued Expenses and Other Liabilities
|
78,665
|
|
86,532
|
|
|||
|
Deferred Leasing Intangibles, Net
|
9,560
|
|
10,355
|
|
|||
|
Rents Received in Advance and Security Deposits
|
47,927
|
|
44,285
|
|
|||
|
Distributions Payable
|
28,845
|
|
27,016
|
|
|||
|
Total Liabilities
|
1,462,780
|
|
1,465,185
|
|
|||
|
Commitments and Contingencies
|
—
|
|
—
|
|
|||
|
Partners' Capital:
|
|||||||
|
First Industrial L.P.'s Partners' Capital:
|
|||||||
|
General Partner Units (126,307,431 and 119,883,180 units outstanding)
|
1,619,342
|
|
1,401,583
|
|
|||
|
Limited Partners Units (2,624,167 and 4,008,221 units outstanding)
|
66,246
|
|
82,251
|
|
|||
|
Accumulated Other Comprehensive Income
|
3,574
|
|
1,382
|
|
|||
|
Total First Industrial L.P.'s Partners' Capital
|
1,689,162
|
|
1,485,216
|
|
|||
|
Noncontrolling Interest
|
857
|
|
779
|
|
|||
|
Total Partners' Capital
|
1,690,019
|
|
1,485,995
|
|
|||
|
Total Liabilities and Partners' Capital
|
$
|
3,152,799
|
|
$
|
2,951,180
|
|
|
The accompanying notes are an integral part of the consolidated financial statements.
57
FIRST INDUSTRIAL L.P.
CONSOLIDATED STATEMENTS OF OPERATIONS
|
Year Ended December 31, 2018
|
Year Ended December 31, 2017
|
Year Ended December 31, 2016
|
|||||||||
|
|
(In thousands, except per Unit data)
|
||||||||||
|
Revenues:
|
|||||||||||
|
Rental Income
|
$
|
306,406
|
|
$
|
303,874
|
|
$
|
289,858
|
|
||
|
Tenant Recoveries and Other Income
|
97,548
|
|
92,528
|
|
88,162
|
|
|||||
|
Total Revenues
|
403,954
|
|
396,402
|
|
378,020
|
|
|||||
|
Expenses:
|
|||||||||||
|
Property Expenses
|
116,854
|
|
113,494
|
|
112,324
|
|
|||||
|
General and Administrative
|
27,749
|
|
28,079
|
|
26,703
|
|
|||||
|
Depreciation and Other Amortization
|
116,459
|
|
116,364
|
|
117,282
|
|
|||||
|
Impairment of Real Estate
|
2,756
|
|
—
|
|
—
|
|
|||||
|
Acquisition Costs
|
—
|
|
—
|
|
491
|
|
|||||
|
Total Expenses
|
263,818
|
|
257,937
|
|
256,800
|
|
|||||
|
Other Income (Expense):
|
|||||||||||
|
Gain on Sale of Real Estate
|
81,600
|
|
131,269
|
|
68,202
|
|
|||||
|
Interest Expense
|
(50,775
|
)
|
(57,199
|
)
|
(59,430
|
)
|
|||||
|
Amortization of Debt Issuance Costs
|
(3,404
|
)
|
(3,162
|
)
|
(3,219
|
)
|
|||||
|
Settlement Gain on Derivative Instruments
|
—
|
|
1,896
|
|
—
|
|
|||||
|
Loss from Retirement of Debt
|
(39
|
)
|
(1,775
|
)
|
—
|
|
|||||
|
Total Other Income (Expense)
|
27,382
|
|
71,029
|
|
5,553
|
|
|||||
|
Income from Operations Before Equity in Loss of Joint Venture and Income Tax Provision
|
167,518
|
|
209,494
|
|
126,773
|
|
|||||
|
Equity in Loss of Joint Ventures
|
(276
|
)
|
—
|
|
—
|
|
|||||
|
Income Tax Benefit (Provision)
|
92
|
|
(1,193
|
)
|
(1,089
|
)
|
|||||
|
Net Income
|
167,334
|
|
208,301
|
|
125,684
|
|
|||||
|
Less: Net Income Attributable to the Noncontrolling Interest
|
(88
|
)
|
(143
|
)
|
(137
|
)
|
|||||
|
Net Income Available to Unitholders and Participating Securities
|
$
|
167,246
|
|
$
|
208,158
|
|
$
|
125,547
|
|
||
|
Basic Earnings Per Unit:
|
|
|
|
||||||||
|
Net Income Available to Unitholders
|
$
|
1.31
|
|
$
|
1.70
|
|
$
|
1.05
|
|
||
|
Diluted Earnings Per Unit:
|
|||||||||||
|
Net Income Available to Unitholders
|
$
|
1.31
|
|
$
|
1.69
|
|
$
|
1.05
|
|
||
|
Distributions Per Unit
|
$
|
0.87
|
|
$
|
0.84
|
|
$
|
0.76
|
|
||
|
Weighted Average Units Outstanding - Basic
|
126,921
|
|
122,306
|
|
119,274
|
|
|||||
|
Weighted Average Units Outstanding - Diluted
|
127,308
|
|
122,821
|
|
119,614
|
|
|||||
The accompanying notes are an integral part of the consolidated financial statements.
58
FIRST INDUSTRIAL L.P.
CONSOLIDATED STATEMENTS OF COMPREHENSIVE INCOME
|
Year Ended December 31, 2018
|
Year Ended December 31, 2017
|
Year Ended December 31, 2016
|
|||||||||
|
|
(In thousands)
|
||||||||||
|
Net Income
|
$
|
167,334
|
|
$
|
208,301
|
|
$
|
125,684
|
|
||
|
Mark-to-Market Gain on Derivative Instruments
|
2,096
|
|
5,981
|
|
4,849
|
|
|||||
|
Amortization of Derivative Instruments
|
96
|
|
205
|
|
390
|
|
|||||
|
Comprehensive Income
|
$
|
169,526
|
|
$
|
214,487
|
|
$
|
130,923
|
|
||
|
Comprehensive Income Attributable to Noncontrolling Interest
|
(88
|
)
|
(143
|
)
|
(137
|
)
|
|||||
|
Comprehensive Income Attributable to Unitholders
|
$
|
169,438
|
|
$
|
214,344
|
|
$
|
130,786
|
|
||
The accompanying notes are an integral part of the consolidated financial statements.
59
FIRST INDUSTRIAL, L.P.
CONSOLIDATED STATEMENTS OF CHANGES IN PARTNERS' CAPITAL
|
General
Partner
Units
|
Limited
Partner
Units
|
Accumulated
Other
Comprehensive
(Loss) Income
|
Noncontrolling Interest
|
Total
|
|||||||||||||||
|
|
|||||||||||||||||||
|
Balance as of December 31, 2015
|
$
|
1,054,028
|
|
$
|
80,769
|
|
$
|
(10,043
|
)
|
$
|
1,096
|
|
$
|
1,125,850
|
|
||||
|
Net Income
|
121,095
|
|
4,452
|
|
—
|
|
137
|
|
125,684
|
|
|||||||||
|
Other Comprehensive Income
|
—
|
|
—
|
|
5,239
|
|
—
|
|
5,239
|
|
|||||||||
|
Contribution of General Partner Units, Net of Issuance Costs
|
124,584
|
|
—
|
|
—
|
|
—
|
|
124,584
|
|
|||||||||
|
Stock Based Compensation Activity
|
5,301
|
|
—
|
|
—
|
|
—
|
|
5,301
|
|
|||||||||
|
Unit Distributions
|
(88,115
|
)
|
(3,203
|
)
|
—
|
|
—
|
|
(91,318
|
)
|
|||||||||
|
Conversion of Limited Partner Units to General Partner Units
|
2,862
|
|
(2,862
|
)
|
—
|
|
—
|
|
—
|
|
|||||||||
|
Contributions from Noncontrolling Interest
|
—
|
|
—
|
|
—
|
|
123
|
|
123
|
|
|||||||||
|
Distributions to Noncontrolling Interest
|
—
|
|
—
|
|
—
|
|
(400
|
)
|
(400
|
)
|
|||||||||
|
Balance as of December 31, 2016
|
$
|
1,219,755
|
|
$
|
79,156
|
|
$
|
(4,804
|
)
|
$
|
956
|
|
$
|
1,295,063
|
|
||||
|
Net Income
|
201,313
|
|
6,845
|
|
—
|
|
143
|
|
208,301
|
|
|||||||||
|
Other Comprehensive Income
|
—
|
|
—
|
|
6,186
|
|
—
|
|
6,186
|
|
|||||||||
|
Contribution of General Partner Units, Net of Issuance Costs
|
74,661
|
|
—
|
|
—
|
|
—
|
|
74,661
|
|
|||||||||
|
Stock Based Compensation Activity
|
6,210
|
|
—
|
|
—
|
|
—
|
|
6,210
|
|
|||||||||
|
Unit Distributions
|
(100,720
|
)
|
(3,386
|
)
|
—
|
|
—
|
|
(104,106
|
)
|
|||||||||
|
Conversion of Limited Partner Units to General Partner Units
|
364
|
|
(364
|
)
|
—
|
|
—
|
|
—
|
|
|||||||||
|
Contributions from Noncontrolling Interest
|
—
|
|
—
|
|
—
|
|
40
|
|
40
|
|
|||||||||
|
Distributions to Noncontrolling Interest
|
—
|
|
—
|
|
—
|
|
(360
|
)
|
(360
|
)
|
|||||||||
|
Balance as of December 31, 2017
|
$
|
1,401,583
|
|
$
|
82,251
|
|
$
|
1,382
|
|
$
|
779
|
|
$
|
1,485,995
|
|
||||
|
Net Income
|
163,151
|
|
4,095
|
|
—
|
|
88
|
|
167,334
|
|
|||||||||
|
Other Comprehensive Income
|
—
|
|
—
|
|
2,192
|
|
—
|
|
2,192
|
|
|||||||||
|
Contribution of General Partner Units, Net of Issuance Costs
|
145,408
|
|
—
|
|
—
|
|
—
|
|
145,408
|
|
|||||||||
|
Stock Based Compensation Activity
|
1,512
|
|
—
|
|
—
|
|
—
|
|
1,512
|
|
|||||||||
|
Unit Distributions
|
(108,917
|
)
|
(2,561
|
)
|
—
|
|
—
|
|
(111,478
|
)
|
|||||||||
|
Conversion of Limited Partner Units to General Partner Units
|
16,605
|
|
(16,605
|
)
|
—
|
|
—
|
|
—
|
|
|||||||||
|
Retirement of Limited Partner Units
|
—
|
|
(934
|
)
|
—
|
|
—
|
|
(934
|
)
|
|||||||||
|
Contributions from Noncontrolling Interest
|
—
|
|
—
|
|
—
|
|
126
|
|
126
|
|
|||||||||
|
Distributions to Noncontrolling Interest
|
—
|
|
—
|
|
—
|
|
(136
|
)
|
(136
|
)
|
|||||||||
|
Balance as of December 31, 2018
|
$
|
1,619,342
|
|
$
|
66,246
|
|
$
|
3,574
|
|
$
|
857
|
|
$
|
1,690,019
|
|
||||
The accompanying notes are an integral part of the consolidated financial statements.
60
|
FIRST INDUSTRIAL, L.P.
CONSOLIDATED STATEMENTS OF CASH FLOWS
|
|||||||||||
|
Year Ended December 31, 2018
|
Year Ended December 31, 2017
|
Year Ended
December 31, 2016 |
|||||||||
|
|
(In thousands)
|
||||||||||
|
CASH FLOWS FROM OPERATING ACTIVITIES:
|
|||||||||||
|
Net Income
|
$
|
167,334
|
|
$
|
208,301
|
|
$
|
125,684
|
|
||
|
Adjustments to Reconcile Net Income to Net Cash Provided by Operating Activities:
|
|||||||||||
|
Depreciation
|
94,626
|
|
94,078
|
|
95,514
|
|
|||||
|
Amortization of Debt Issuance Costs
|
3,404
|
|
3,162
|
|
3,219
|
|
|||||
|
Other Amortization, including Stock Based Compensation
|
26,976
|
|
29,252
|
|
28,403
|
|
|||||
|
Impairment of Real Estate
|
2,756
|
|
—
|
|
—
|
|
|||||
|
Provision for Bad Debt
|
350
|
|
177
|
|
563
|
|
|||||
|
Equity in Loss of Joint Venture
|
276
|
|
—
|
|
—
|
|
|||||
|
Gain on Sale of Real Estate
|
(81,600
|
)
|
(131,269
|
)
|
(68,202
|
)
|
|||||
|
Loss from Retirement of Debt
|
39
|
|
1,775
|
|
—
|
|
|||||
|
Gain on Casualty and Involuntary Conversion
|
(392
|
)
|
(1,321
|
)
|
—
|
|
|||||
|
(Increase) Decrease in Tenant Accounts Receivable, Prepaid Expenses and Other Assets, Net
|
(4,189
|
)
|
(5,510
|
)
|
1,242
|
|
|||||
|
Increase in Deferred Rent Receivable, Net
|
(2,165
|
)
|
(5,299
|
)
|
(6,602
|
)
|
|||||
|
Increase (Decrease) in Accounts Payable, Accrued Expenses, Other Liabilities, Rents Received in Advance and Security Deposits
|
3,090
|
|
(465
|
)
|
(5,655
|
)
|
|||||
|
Net Cash Provided by Operating Activities
|
210,505
|
|
192,881
|
|
174,166
|
|
|||||
|
CASH FLOWS FROM INVESTING ACTIVITIES:
|
|||||||||||
|
Acquisitions of Real Estate
|
(157,787
|
)
|
(175,303
|
)
|
(107,484
|
)
|
|||||
|
Additions to Investment in Real Estate and Non-Acquisition Tenant Improvements and Lease Costs
|
(224,466
|
)
|
(146,003
|
)
|
(179,994
|
)
|
|||||
|
Net Proceeds from Sales of Investments in Real Estate
|
184,783
|
|
228,102
|
|
163,435
|
|
|||||
|
Proceeds from Casualty and Involuntary Conversion
|
906
|
|
10,094
|
|
—
|
|
|||||
|
Contributions to and Investments in Joint Venture
|
(25,190
|
)
|
—
|
|
—
|
|
|||||
|
Distributions from Joint Venture
|
1,829
|
|
—
|
|
—
|
|
|||||
|
Other Investing Activity
|
(3,473
|
)
|
616
|
|
1,648
|
|
|||||
|
Net Cash Used in Investing Activities
|
(223,398
|
)
|
(82,494
|
)
|
(122,395
|
)
|
|||||
|
CASH FLOWS FROM FINANCING ACTIVITIES:
|
|||||||||||
|
Debt and Equity Issuance Costs
|
(2,975
|
)
|
(6,864
|
)
|
(375
|
)
|
|||||
|
Contribution of General Partner Units
|
145,584
|
|
74,880
|
|
124,936
|
|
|||||
|
Repurchase and Retirement of Restricted Units
|
(6,020
|
)
|
(2,401
|
)
|
(5,242
|
)
|
|||||
|
Unit Distributions Paid
|
(109,649
|
)
|
(100,524
|
)
|
(82,696
|
)
|
|||||
|
Contributions from Noncontrolling Interests
|
126
|
|
40
|
|
123
|
|
|||||
|
Distributions to Noncontrolling Interests
|
(136
|
)
|
(360
|
)
|
(400
|
)
|
|||||
|
Repayments on Mortgage Loans Payable
|
(165,646
|
)
|
(46,832
|
)
|
(70,969
|
)
|
|||||
|
Prepayments of Penalties Associated with Retirement of Debt
|
—
|
|
(1,453
|
)
|
(554
|
)
|
|||||
|
Proceeds from Senior Unsecured Notes
|
300,000
|
|
200,000
|
|
—
|
|
|||||
|
Repayments of Senior Unsecured Notes
|
—
|
|
(156,852
|
)
|
(159,125
|
)
|
|||||
|
Proceeds from Unsecured Credit Facility
|
237,000
|
|
429,000
|
|
442,000
|
|
|||||
|
Repayments on Unsecured Credit Facility
|
(381,500
|
)
|
(474,000
|
)
|
(305,000
|
)
|
|||||
|
Net Cash Provided by (Used in) Financing Activities
|
16,784
|
|
(85,366
|
)
|
(57,302
|
)
|
|||||
|
Net Increase (Decrease) in Cash, Cash Equivalents and Restricted Cash
|
3,891
|
|
25,021
|
|
(5,531
|
)
|
|||||
|
Cash, Cash Equivalents and Restricted Cash, Beginning of Year
|
46,482
|
|
21,461
|
|
26,992
|
|
|||||
|
Cash, Cash Equivalents and Restricted Cash, End of Year
|
$
|
50,373
|
|
$
|
46,482
|
|
$
|
21,461
|
|
||
61
|
FIRST INDUSTRIAL, L.P.
CONSOLIDATED STATEMENTS OF CASH FLOWS (Continued)
|
|||||||||||
|
Year Ended December 31, 2018
|
Year Ended December 31, 2017
|
Year Ended
December 31, 2016 |
|||||||||
|
|
(In thousands)
|
||||||||||
|
SUPPLEMENTAL INFORMATION TO STATEMENTS OF CASH FLOWS:
|
|||||||||||
|
Interest Paid, Net of Interest Expense Capitalized in Connection with Development Activity
|
$
|
47,408
|
|
$
|
56,844
|
|
$
|
63,600
|
|
||
|
Interest Expense Capitalized in Connection with Development Activity
|
$
|
5,869
|
|
$
|
4,353
|
|
$
|
3,523
|
|
||
|
Income Taxes Paid
|
$
|
457
|
|
$
|
769
|
|
$
|
1,358
|
|
||
|
Supplemental Schedule of Non-Cash Investing and Financing Activities:
|
|||||||||||
|
General and Limited Partner Unit Distributions Payable
|
$
|
28,845
|
|
$
|
27,016
|
|
$
|
23,434
|
|
||
|
Exchange of Limited Partner Units for General Partner Units:
|
|||||||||||
|
Limited Partner Units
|
$
|
(16,605
|
)
|
$
|
(364
|
)
|
$
|
(2,862
|
)
|
||
|
General Partner Units
|
16,605
|
|
364
|
|
2,862
|
|
|||||
|
Total
|
$
|
—
|
|
$
|
—
|
|
$
|
—
|
|
||
|
Assumption of Indebtedness and Other Liabilities in Connection with the Acquisition of Real Estate
|
$
|
11,878
|
|
$
|
1,269
|
|
$
|
5,405
|
|
||
|
Accounts Payable Related to Construction in Progress and Additions to Investment in Real Estate
|
$
|
31,545
|
|
$
|
38,597
|
|
$
|
32,712
|
|
||
|
Write-off of Fully Depreciated Assets
|
$
|
(43,654
|
)
|
$
|
(35,560
|
)
|
$
|
(44,080
|
)
|
||
The accompanying notes are an integral part of the consolidated financial statements.
62
FIRST INDUSTRIAL REALTY TRUST, INC. AND FIRST INDUSTRIAL, L.P.
NOTES TO CONSOLIDATED FINANCIAL STATEMENTS
(Dollars in thousands, except per share and Unit data)
1. Organization
First Industrial Realty Trust, Inc. (the "Company") is a self-administered and fully integrated real estate company which owns, manages, acquires, sells, develops and redevelops industrial real estate. The Company is a Maryland corporation organized on August 10, 1993 and a real estate investment trust ("REIT") as defined in the Internal Revenue Code of 1986 (the "Code"). Unless stated otherwise or the context otherwise requires, the terms "we," "our" and "us" refer to the Company and its subsidiaries, including its operating partnership, First Industrial, L.P. (the "Operating Partnership"), and its consolidated subsidiaries.
We began operations on July 1, 1994. The Company's operations are conducted primarily through the Operating Partnership, of which the Company is the sole general partner (the "General Partner"), with an approximate
98.0%
and
96.8%
ownership interest ("General Partner Units") at December 31, 2018 and 2017, respectively. The Operating Partnership also conducts operations through
eight
other limited partnerships (the "Other Real Estate Partnerships"), numerous limited liability companies ("LLCs") and certain taxable REIT subsidiaries ("TRSs"), the operating data of which, together with that of the Operating Partnership, is consolidated with that of the Company as presented herein. The Operating Partnership holds at least a
99%
limited partnership interest in each of the Other Real Estate Partnerships. The general partners of the Other Real Estate Partnerships are separate corporations, wholly-owned by the Company, each with at least a
.01%
general partnership interest in the Other Real Estate Partnerships. The Company does not have any significant assets or liabilities other than its investment in the Operating Partnership and its
100%
ownership interest in the general partners of the Other Real Estate Partnerships. Noncontrolling interest in the Operating Partnership of approximately
2.0%
and
3.2%
at December 31, 2018 and 2017, respectively, represents the aggregate partnership interest held by the limited partners thereof ("Limited Partner Units" and together with the General Partner Units, the "Units") .
We also own a
49%
equity interest in, and provide various services to, a joint venture (the "Joint Venture") through a wholly owned subsidiary of the Operating Partnership. The Joint Venture is accounted for under the equity method of accounting. The operating data of the Joint Venture is not consolidated with that of the Company or the Operating Partnership as presented herein.
Profits, losses and distributions of the Operating Partnership, the LLCs, the Other Real Estate Partnerships and the TRSs are allocated to the general partner and the limited partners, the members or the shareholders, as applicable, of such entities in accordance with the provisions contained within their respective organizational documents.
As of December 31, 2018, we owned
458
industrial properties located in
21
states, containing an aggregate of approximately
63.1 million
square feet of gross leasable area ("GLA").
Of the 458 properties owned on a consolidated basis, none of them are directly owned by the Company.
Any references to the number of industrial properties and square footage in the financial statement footnotes are unaudited.
2. Summary of Significant Accounting Policies
Basis of Presentation
The accompanying consolidated financial statements at December 31, 2018 and 2017 and for each of the years ended December 31, 2018, 2017 and 2016 include the accounts and operating results of the Company and the Operating Partnership. All intercompany transactions have been eliminated in consolidation.
Use of Estimates
In order to conform with generally accepted accounting principles ("GAAP"), in preparation of our consolidated financial statements we are required to make estimates and assumptions that affect the reported amounts of assets and liabilities and disclosure of contingent assets and liabilities as of December 31, 2018 and 2017, and the reported amounts of revenues and expenses for each of the years ended December 31, 2018, 2017 and 2016. Actual results could differ from those estimates.
Cash and Cash Equivalents
Cash and cash equivalents include all cash and liquid investments with an initial maturity of
three months or less
. The carrying amount approximates fair value due to the short term maturity of these investments.
63
Restricted Cash
Restricted cash includes cash held in escrow in connection with gross proceeds from the sales of certain industrial properties. These sales proceeds will be disbursed as we exchange into properties under Section 1031 of the Code. The carrying amount approximates fair value due to the short term maturity of these investments. For purposes of our consolidated statements of cash flows, changes in restricted cash are aggregated with cash and cash equivalents.
Investment in Real Estate and Depreciation
Investment in real estate is carried at cost, less accumulated depreciation and amortization. We review our properties on a quarterly basis for impairment and provide a provision if impairments exist. To determine if an impairment may exist, we review our properties and identify those that have had either an event of change or event of circumstances warranting further assessment of recoverability (such as a decrease in occupancy, a decline in general market conditions or a change in the expected hold period of an asset or asset group). If further assessment of recoverability is needed, we estimate the future net cash flows expected to result from the use of the property and its eventual disposition. If the sum of the expected future net cash flows (undiscounted and without interest charges) is less than the carrying amount of the property or group of properties, we will recognize an impairment loss based upon the estimated fair value of the property or group of properties. For properties we consider held for sale, we cease depreciating the properties and value the properties at the lower of depreciated cost or fair value, less costs to dispose. If circumstances arise that were previously considered unlikely, and, as a result, we decide not to sell a property or group of properties previously classified as held for sale, we will reclassify the properties as held and used. Properties are measured at the lower of their carrying amounts (adjusted for any depreciation and amortization expense that would have been recognized had the properties been continuously classified as held and used) or fair value at the date of the subsequent decision not to sell. We classify properties as held for sale when all criteria within the Financial Accounting Standards Board's (the "FASB") guidance on the impairment or disposal of long-lived assets are met.
Interest costs, real estate taxes, compensation costs of development personnel and other directly related costs incurred during construction periods are capitalized and depreciated commencing with the date the property is substantially completed. Upon substantial completion, we reclassify construction in progress to building, tenant improvements and leasing commissions. Such costs begin to be capitalized to the development projects from the point we are undergoing necessary activities to get the development ready for its intended use and cease when the development projects are substantially completed and held available for occupancy. Interest is capitalized using the weighted average borrowing rate during the period.
Depreciation expense is computed using the straight-line method based on the following useful lives:
|
|
Years
|
|
Buildings and Improvements
|
7 to 50
|
|
Land Improvements
|
5 to 20
|
|
Furniture, Fixtures and Equipment
|
3 to 10
|
|
Tenant Improvements
|
Lease Term
|
Construction expenditures for tenant improvements, leasehold improvements and leasing commissions (inclusive of compensation costs of personnel attributable to leasing) are capitalized and amortized over the terms of each specific lease. Capitalized compensation costs of personnel attributable to leasing relate to time directly attributable to originating leases with tenants that result directly from and are essential to originating those leases and would not have been incurred had these leasing transactions not occurred. Repairs and maintenance are charged to expense when incurred. Expenditures for improvements are capitalized.
Upon acquisition of a property, we allocate the purchase price of the property based upon the fair value of the assets acquired and liabilities assumed, which generally consists of land, buildings, tenant improvements, leasing commissions and intangible assets including in-place leases, above market and below market leases, below market ground lease obligations and tenant relationships. We allocate the purchase price to the fair value of the tangible assets of an acquired property by valuing the property as if it were vacant. Acquired above and below market leases and below market ground lease obligations are valued based on the present value of the difference between prevailing market rates and the in-place rates measured over a period equal to the remaining term of the lease for above market leases and below market ground lease obligations, and the initial term plus the term of any below market fixed rate renewal options for below market leases. The above market lease values are amortized as a reduction of rental revenue over the remaining term of the respective leases, and the below market lease values are amortized as an increase to base rental revenue over the remaining initial terms plus the terms of any below market fixed rate renewal options of the respective leases.
64
The purchase price is further allocated to in-place lease values and tenant relationships based on our evaluation of the specific characteristics of each tenant's lease and our overall relationship with the respective tenant. The value of in-place lease intangibles and tenant relationships, which are included in the line item
Deferred Leasing Intangibles, Net
are amortized over the remaining lease term (and expected renewal periods of the respective lease for tenant relationships) as adjustments to depreciation and other amortization expense. If a tenant terminates its lease early, the unamortized portion of the tenant improvements, leasing commissions, above and below market leases, the in-place lease value and tenant relationships is immediately accelerated and fully amortized on the date of the termination.
As defined by GAAP, a business is an integrated set of activities and assets that is capable of being conducted and managed for the purpose of providing a return in the form of dividends, lower costs or other economic benefits directly to investors or other owners, members or participants. We expect most acquisitions to be treated as asset acquisitions rather than business combinations as our typical acquisitions consist of properties whereby substantially all the fair value of gross assets acquired is concentrated in a single asset (land, building, and in-place leases), which is treated as an asset acquisition. Commencing January 1, 2017, acquisition costs related to asset acquisitions are capitalized to the basis of the acquired asset.
Deferred leasing intangibles, net of accumulated amortization, included in our total assets and total liabilities consist of the following:
|
December 31,
2018 |
December 31,
2017 |
||||||
|
In-Place Leases
|
$
|
19,971
|
|
$
|
19,921
|
|
|
|
Above Market Leases
|
2,569
|
|
2,298
|
|
|||
|
Below Market Ground Lease Obligation
|
1,643
|
|
1,688
|
|
|||
|
Tenant Relationships
|
5,495
|
|
6,574
|
|
|||
|
Total Included in Total Assets, Net of $26,337 and $29,604 of Accumulated Amortization
|
$
|
29,678
|
|
$
|
30,481
|
|
|
|
Below Market Leases
|
$
|
9,560
|
|
$
|
10,355
|
|
|
|
Total Included in Total Liabilities, Net of $11,356 and $10,578 of Accumulated Amortization
|
$
|
9,560
|
|
$
|
10,355
|
|
|
Amortization expense related to in-place leases and tenant relationships was
$6,267
,
$6,648
and
$6,717
for the years ended December 31, 2018, 2017 and 2016, respectively. Rental revenues increased by
$1,095
,
$1,116
and
$996
related to net amortization of above and below market leases. We will recognize net amortization expense related to deferred leasing intangibles over the next five years, for properties owned as of December 31, 2018 as follows:
|
Estimated
Amortization
of In-Place
Leases and Tenant
Relationships
|
Estimated Net
Increase to
Rental Revenues
Related to
Above and Below
Market Leases
|
||||||
|
2019
|
$
|
5,779
|
|
$
|
1,048
|
|
|
|
2020
|
$
|
4,988
|
|
$
|
943
|
|
|
|
2021
|
$
|
3,391
|
|
$
|
808
|
|
|
|
2022
|
$
|
3,013
|
|
$
|
784
|
|
|
|
2023
|
$
|
2,615
|
|
$
|
533
|
|
|
Debt Issuance Costs
Debt issuance costs include fees and costs incurred to obtain long-term financing. These fees and costs are being amortized over the terms of the respective loans. Unamortized debt issuance costs are written-off when debt is retired before the maturity date. Debt issuance costs are presented as a direct deduction from the carrying amount of the respective debt liability, consistent with debt discounts. The debt issuance costs related to the unsecured credit facility are included in the line item
Prepaid Expenses and Other Assets, Net
on the consolidated balance sheets.
65
Investment in Joint Venture
Investment in joint venture represents a noncontrolling equity interest in one joint venture. We account for our investment in this joint venture under the equity method of accounting, as we did not have a majority voting interest, operational control or financial control. Control is determined using accounting standards related to the consolidation of joint ventures and variable interest entities ("VIEs"). Under the equity method of accounting, our share of earnings or losses of a joint venture is reflected in income as earned and contributions or distributions increase or decrease our investment in joint venture as paid or received, respectively. Differences between our carrying value of our investment in this joint venture and our underlying equity in such joint venture are amortized and included as an adjustment to our equity in income (loss).
On a periodic basis, management assesses whether there are any indicators that the value of our investment in this joint venture may be impaired. An investment is impaired only if our estimate of the fair value of the investment is less than the carrying value of the investment, and such decline in value is deemed to be other than temporary. To the extent impairment has occurred, the loss shall be measured as the excess of the carrying value of the investment over the value of the investment.
Limited Partner Units
Limited Partner Units are reported within Partners' Capital in the Operating Partnership's balance sheet as of December 31, 2018 and 2017 because they are not redeemable for cash or other assets (a) at a fixed or determinable date, (b) at the option of the Unitholder or (c) upon the occurrence of an event that is not solely within the control of the Operating Partnership. Redemption can be effectuated, as determined by the General Partner, either by exchanging the Units for shares of common stock of the Company on a one-for-one basis, subject to adjustment, or by paying cash equal to the fair market value of such shares.
The Operating Partnership is the only significant asset of the Company and economic, fiduciary and contractual means align the interests of the Company and the Operating Partnership. The Company's Board of Directors and officers of the Company direct the Company to act when acting in its capacity as sole general partner of the Operating Partnership. Because of this, the Operating Partnership is deemed to have effective control of the form of redemption consideration. As of December 31, 2018, all criteria were met for the Operating Partnership to control the actions or events necessary to issue the maximum number of the Company's common shares required to be delivered upon redemption of all remaining Limited Partner Units.
Stock Based Compensation
We measure compensation cost for all stock-based awards at fair value on the date of grant and recognize compensation expense over the service period for awards expected to vest.
Net income is allocated to common stockholders or Unitholders and participating securities based upon their proportionate share of weighted average shares or Units plus weighted average participating securities. Participating securities are unvested share-based payment awards that contain non-forfeitable rights to dividends or dividend equivalents. Restricted stock or restricted Unit awards granted to employees and directors are considered participating securities as they receive non-forfeitable dividend or dividend equivalents at the same rate as common stock or Units.
Revenue Recognition
Rental income is recognized on a straight-line method under which contractual rent increases are recognized evenly over the lease term. Tenant recovery income includes payments from tenants for real estate taxes, insurance and other property operating expenses and is recognized as revenue in the same period the related expenses are incurred by us.
If the lease provides for tenant improvements, we determine whether the tenant improvements are owned by the tenant or us. When we are the owner of the tenant improvements, any tenant improvements funded by the tenant are treated as lease payments which are deferred and amortized into income over the lease term. When the tenant is the owner of the tenant improvements, we record any tenant improvement allowance funded as a lease inducement and amortize it as a reduction of revenue over the lease term.
Revenue is generally recognized on payments received from tenants for early lease terminations upon the effective termination of a tenant's lease and when we have no further obligations under the lease.
We provide an allowance for doubtful accounts against the portion of tenant accounts receivable including deferred rent receivable, which is estimated to be uncollectible. The
Tenant Accounts Receivable
line item is shown net of an allowance for doubtful accounts of
$545
and
$310
as of December 31, 2018 and 2017, respectively. The
Deferred Rent Receivable
line item is shown net of an allowance for doubtful accounts of
$1,444
and
$1,557
as of December 31, 2018 and 2017, respectively. For accounts receivable we deem uncollectible, we use the direct write-off method.
66
Gain on Sale of Real Estate
Asset sales are generally recognized when control of the asset being sold is transferred to the buyer. As the assets are sold, their costs and related accumulated depreciation, if any, are derecognized with resulting gains or losses reflected in net income. Estimated future costs to be incurred by us after completion of each sale are accrued and included in the determination of the gain on sales.
Income Taxes
The Company has elected to be taxed as a REIT under the Code. To qualify as a REIT, the Company must meet a number of organizational and operational requirements, including a requirement to distribute at least
90%
of its adjusted taxable income to its stockholders. Management intends to continue to adhere to these requirements and to maintain the Company's REIT status. As a REIT, the Company is entitled to a tax deduction for some or all of the dividends it pays to shareholders. Accordingly, the Company generally will not be subject to federal income taxes as long as it currently distributes to shareholders an amount equal to or in excess of the Company's taxable income. If the Company fails to qualify as a REIT in any taxable year, it will be subject to federal income taxes and may not be able to qualify as a REIT for four subsequent taxable years.
REIT qualification reduces, but does not eliminate, the amount of state and local taxes we pay. In addition, certain activities that we undertake may be conducted by entities which have elected to be treated as a TRS. TRSs are subject to both federal and state income taxes.
We may also be subject to certain federal excise and franchise taxes if we engage in certain types of transactions. A benefit or provision has been made for federal, state and local income taxes in the accompanying consolidated financial statements. The provision for excise and franchise taxes has been reflected in general and administrative expense in the consolidated statements of operations and has not been separately stated due to its insignificance.
In accordance with partnership taxation, each of the partners of the Operating Partnership is responsible for reporting their share of taxable income or loss.
Earnings Per Share and Earnings Per Unit ("EPS" and "EPU")
Basic net income per common share or Unit is computed by dividing net income available to common shareholders or Unitholders by the weighted average number of common shares or Units outstanding for the period.
Diluted net income per common share or Unit is computed by dividing net income available to common shareholders or Unitholders by the sum of the weighted average number of common shares or Units outstanding and any dilutive non-participating securities for the period.
Derivative Financial Instruments
During the normal course of business, we have used derivative instruments for the purpose of managing interest rate risk on anticipated offerings of long term debt. Receipts or payments that result from the settlement of derivative instruments used to fix the interest rate on anticipated offerings of senior unsecured notes are amortized over the life of the derivative or the life of the debt and is included in interest expense. Receipts or payments resulting from derivative instruments used to convert floating rate debt to fixed rate debt are recognized as a component of interest expense.
To qualify for hedge accounting, derivative instruments used for risk management purposes must effectively reduce the risk exposure that they are designed to hedge. In addition, at inception of a qualifying cash flow hedging relationship, the underlying transaction or transactions, must be, and are expected to remain, probable of occurring in accordance with our related assertions. We recognize all derivative instruments in the line items
Prepaid Expenses and Other Assets, Net
or
Accounts Payable, Accrued Expenses and Other Liabilities
at fair value. Changes in fair value of derivative instruments that are not designated in hedging relationships or that do not meet the criteria of hedge accounting are recognized in earnings. For derivative instruments designated in qualifying cash flow hedging relationships, changes in fair value related to the effective portion of the derivative instruments are recognized in accumulated other comprehensive income (loss), whereas changes in fair value of the ineffective portion are recognized in earnings. If it is determined that a derivative instrument ceases to be highly effective as a hedge, or that it is probable the underlying forecasted transaction will not occur, we discontinue its cash flow hedge accounting prospectively and records the appropriate adjustment to earnings based on the current fair value of the derivative instrument. The credit risks associated with derivative instruments are controlled through the evaluation and monitoring of the creditworthiness of the counterparty. In the event that the counterparty fails to meet the terms of the derivative instruments, our exposure is limited to the fair value of agreements, not the notional amounts.
67
Fair Value
GAAP establishes a framework for measuring fair value and requires disclosures about fair value measurements. Fair value is defined as the price that would be received to sell an asset or paid to transfer a liability (an exit price) in an orderly transaction between market participants. The guidance establishes a hierarchy for inputs used in measuring fair value based on observable and unobservable inputs by requiring that the most observable inputs be used when available. Observable inputs are based on market data obtained from independent sources. Unobservable inputs are inputs that reflect our assumptions of pricing the asset or liability based on the best information available in the circumstances. We estimate fair value using available market information and valuation methodologies we believe to be appropriate for these purposes. The fair value hierarchy consists of the following three broad levels:
|
•
|
Level 1 - quoted prices in active markets for identical assets or liabilities that the entity can access at the measurement date;
|
|
•
|
Level 2 - inputs other than quoted prices within Level 1 that are either directly or indirectly observable for the asset or liability; and
|
|
•
|
Level 3 - unobservable inputs in which little or no market data exists for the asset or liability.
|
Our assets and liabilities that are measured at fair value are classified in their entirety based on the lowest level of input that is significant to their fair value measurement. Considerable judgment and a high degree of subjectivity are involved in developing these estimates and, accordingly, they are not necessarily indicative of amounts that we would realize on disposition.
Discontinued Operations and Assets Held for Sale
We report results of operations from real estate assets that are sold or classified as held for sale as discontinued operations provided the disposal represents a strategic shift that has (or will have) a major effect on our operations and financial results.
We generally classify certain properties and related assets and liabilities as held for sale when the sale of an asset has been duly approved by management, a legally enforceable contract has been executed and the buyer's due diligence period, if any, has expired. At such time, the respective assets and liabilities are presented separately on the consolidated balance sheets. Assets held for sale are reported at the lower of carrying value or estimated fair value less estimated costs to sell.
Segment Reporting
Management views the Company, inclusive of the Operating Partnership, as a single segment based on its method of internal reporting.
Recent Accounting Pronouncements
New Accounting Standards Adopted
In May 2014, the FASB issued Accounting Standards Update ("ASU") No. 2014-09, "Revenue from Contracts with Customers" ("ASU 2014-09"). ASU 2014-09 requires entities to recognize revenue when they transfer promised goods or services to customers in an amount that reflects the consideration to which the entity expects to be entitled to in exchange for those goods or services. ASU 2014-09 is effective for annual periods beginning after December 15, 2017. We adopted the new standard effective January 1, 2018. The adoption of the standard did not impact our financial position or results of operations.
In August 2016 and November 2016, the FASB issued new ASUs impacting the statement of cash flows. ASU No. 2016-15, "Statement of Cash Flows (Topic 230): Classification of Certain Cash Receipts and Cash Payments" intends to reduce the diversity in practice in how certain cash receipts and cash payments are presented and classified in the statement of cash flows. ASU No. 2016-18, "Statement of Cash Flows (Topic 230): Restricted Cash" requires restricted cash be added to cash and cash equivalents on the consolidated statements of cash flows. We adopted both standards on January 1, 2018 on a retrospective basis. For the years ended December 31, 2017 and 2016,
$25,336
and
$11,602
of restricted cash was included in "Cash, Cash Equivalents and Restricted Cash" in our Consolidated Statements of Cash Flows. Also, we reclassified
$1,453
of prepayment penalties relating to the payoff of certain mortgage loans from operating activities to financing activities for the year ended December 31, 2017.
68
The following table presents a reconciliation of cash, cash equivalents and restricted cash reported within our Consolidated Balance Sheets to amounts reported within our Consolidated Statements of Cash Flows for the years ended December 31, 2018 and 2017:
|
2018
|
2017
|
||||||
|
Cash and Cash Equivalents
|
$
|
43,102
|
|
$
|
21,146
|
|
|
|
Restricted Cash
|
7,271
|
|
25,336
|
|
|||
|
Total Cash, Cash Equivalents and Restricted Cash
|
$
|
50,373
|
|
$
|
46,482
|
|
|
New Accounting Standards Issued but not yet Adopted
In February 2016, the FASB issued ASU No. 2016-02, "Leases" ("ASU 2016-02"), which amends the existing accounting standards for lease accounting. ASU 2016-02 will require lessees, at lease commencement to record a right-of-use asset and a lease liability for all leases with terms longer than twelve months. We are a lessee on a limited number of ground and office leases. The expense pattern for these leases will be consistent with that of our historical recognition. The accounting for lessors will remain largely unchanged from existing GAAP standards with the underlying leased asset being reported and recognized as a real estate asset and rental income being recognized on a straight line basis over the lease term. However, ASU 2016-02 requires lessors to expense certain initial direct costs that are not incremental in negotiating a lease as incurred. We anticipate this change will reduce our EPS/EPU on an annual basis by approximately
$0.01
.
ASU 2016-02 is effective for us on January 1, 2019. We expect to adopt the practical expedients available for implementation under the standard. By adopting these practical expedients, we will not be required to reassess (1) whether an expired or existing contract meets the definition of a lease; (2) the lease classification for expired or existing leases; or (3) costs previously capitalized as initial direct costs. Furthermore, the FASB finalized an amendment to ASU 2016-02 which will allow us an optional election to not separate non-lease components from related lease components that otherwise would have been accounted for separately under the new standard. Upon adoption of ASU 2016-02, we will be required to recognize a right-of-use asset and a lease liability on our consolidated balance sheets equal to the present value of the minimum lease payments required under our ground and office leases, which we believe will be approximately
$12,500
. We are finalizing our discount rate analysis which is a key determinant in the measurement of the right-of-use asset and lease liability. Details of our future minimum rental payments under ground and office leases at December 31, 2018 are disclosed in Note 14. We plan to implement this guidance on a prospective basis.
In August 2017, the FASB issued ASU 2017-12, "Derivatives and Hedging (Topic 815): Targeting Improvements to Accounting for Hedging Activities" ("ASU 2017-12"). ASU 2017-12 eliminates the requirement to separately measure and report hedge ineffectiveness and generally requires the entire change in the fair value of a hedging instrument to be presented in the same income statement line as the hedged item when the hedged item affects earnings. ASU 2017-12 is required to be adopted in 2019 using a modified retrospective approach. We do not expect the adoption of ASU 2017-12 to have a material impact on our financial condition or results of operations.
69
3. Investment in Real Estate
Acquisitions
The following table summarizes our acquisition of industrial properties from third parties for the years ended December 31, 2018, 2017 and 2016. The revenue and net income associated with the acquisition of the industrial properties, since their respective acquisition dates, are not significant for years ended December 31, 2018, 2017 or 2016.
|
Year Ended December 31,
|
|||||||||||
|
2018
|
2017
|
2016
|
|||||||||
|
Number of Industrial Properties Acquired
|
10
|
|
8
|
|
6
|
|
|||||
|
GLA (in millions)
|
1.0
|
|
1.1
|
|
0.7
|
|
|||||
|
Purchase Price
(A)
|
$
|
167,546
|
|
$
|
174,209
|
|
$
|
111,130
|
|
||
(A)
Purchase price includes the acquisition of several land parcels for the years ended December 31, 2018, 2017 and 2016 and excludes closing costs incurred with the acquisition of the industrial properties and land parcels.
The following table summarizes the fair value of amounts recognized for each major class of asset and liability for the industrial properties and land parcels acquired during the years ended December 31, 2018 and 2017:
|
Year Ended December 31,
|
|||||||
|
2018
|
2017
|
||||||
|
Land
|
$
|
79,347
|
|
$
|
92,810
|
|
|
|
Building and Improvements
|
81,747
|
|
73,028
|
|
|||
|
Other Assets
|
1,225
|
|
1,659
|
|
|||
|
In-Place Leases
|
5,302
|
|
7,905
|
|
|||
|
Above Market Leases
|
662
|
|
227
|
|
|||
|
Below Market Leases
|
(737
|
)
|
(1,420
|
)
|
|||
|
Total Purchase Price
|
$
|
167,546
|
|
$
|
174,209
|
|
|
|
Assumed Mortgage Loan (See Note 4)
|
(11,654
|
)
|
—
|
|
|||
|
Total Net Assets Acquired
|
$
|
155,892
|
|
$
|
174,209
|
|
|
Sales
The following table summarizes our property dispositions for the years ended December 31, 2018, 2017 and 2016:
|
Year Ended December 31,
|
|||||||||||
|
2018
|
2017
|
2016
|
|||||||||
|
Number of Industrial Properties Sold
(A)
|
53
|
|
60
|
|
63
|
|
|||||
|
GLA (in millions)
|
2.6
|
|
4.6
|
|
3.9
|
|
|||||
|
Gross Proceeds from the Sale of Real Estate
(B)
|
$
|
192,047
|
|
$
|
236,059
|
|
$
|
169,911
|
|
||
|
Gain on Sale of Real Estate
(B)
|
$
|
81,600
|
|
$
|
131,269
|
|
$
|
68,202
|
|
||
(A)
The year ended December 31, 2018 includes a partial sale of a 0.1 million square-foot industrial property.
(B)
Gross proceeds and gain on sale of real estate include the sale of several land parcels for the years ended December 31, 2018, 2017 and 2016.
Impairment Charges
The impairment charges of
$2,756
recorded during the year ended December 31, 2018 were due to marketing
one
industrial property and
one
land parcel for sale and our assessment of the likelihood and timing of a potential sale transaction. The fair market values were determined using third party offers. Valuations based on third party offers included bona fide contract prices and letter of intent amounts that we believe were indicative of fair value and fall into Level 3 of the fair value hierarchy. The property and the land parcel for which impairment was recorded were sold later during the year ended December 31, 2018.
70
4. Indebtedness
The following table discloses certain information regarding our indebtedness:
|
|
Outstanding Balance at
|
Interest
Rate at
December 31,
2018
|
Effective
Interest
Rate at
Issuance
|
Maturity
Date
|
|||||||||
|
|
December 31, 2018
|
December 31, 2017
|
|||||||||||
|
Mortgage Loans Payable, Gross
|
$
|
297,610
|
|
$
|
451,602
|
|
4.03% – 8.26%
|
3.82% – 8.26%
|
July 2019 –
August 2028
|
||||
|
Unamortized Debt Issuance Costs
|
(1,246
|
)
|
(1,806
|
)
|
|||||||||
|
Unamortized Premiums
|
106
|
|
260
|
|
|||||||||
|
Mortgage Loans Payable, Net
|
$
|
296,470
|
|
$
|
450,056
|
|
|||||||
|
Senior Unsecured Notes, Gross
|
|||||||||||||
|
2027 Notes
|
6,070
|
|
6,070
|
|
7.15%
|
7.11%
|
5/15/2027
|
||||||
|
2028 Notes
|
31,901
|
|
31,901
|
|
7.60%
|
8.13%
|
7/15/2028
|
||||||
|
2032 Notes
|
10,600
|
|
10,600
|
|
7.75%
|
7.87%
|
4/15/2032
|
||||||
|
2027 Private Placement Notes
|
125,000
|
|
125,000
|
|
4.30%
|
4.30%
|
4/20/2027
|
||||||
|
2028 Private Placement Notes
|
150,000
|
|
—
|
|
3.86%
|
3.86%
|
2/15/2028
|
||||||
|
2029 Private Placement Notes
|
75,000
|
|
75,000
|
|
4.40%
|
4.40%
|
4/20/2029
|
||||||
|
2030 Private Placement Notes
|
150,000
|
|
—
|
|
3.96%
|
3.96%
|
2/15/2030
|
||||||
|
Subtotal
|
$
|
548,571
|
|
$
|
248,571
|
|
|||||||
|
Unamortized Debt Issuance Costs
|
(3,990
|
)
|
(1,814
|
)
|
|||||||||
|
Unamortized Discounts
|
(77
|
)
|
(84
|
)
|
|||||||||
|
Senior Unsecured Notes, Net
|
$
|
544,504
|
|
$
|
246,673
|
|
|||||||
|
Unsecured Term Loans, Gross
|
|||||||||||||
|
2014 Unsecured Term Loan
(A)
|
$
|
200,000
|
|
$
|
200,000
|
|
3.39%
|
N/A
|
1/29/2021
|
||||
|
2015 Unsecured Term Loan
(A)
|
260,000
|
|
260,000
|
|
2.89%
|
N/A
|
9/12/2022
|
||||||
|
Subtotal
|
$
|
460,000
|
|
$
|
460,000
|
|
|||||||
|
Unamortized Debt Issuance Costs
|
(3,191
|
)
|
(4,232
|
)
|
|||||||||
|
Unsecured Term Loans, Net
|
$
|
456,809
|
|
$
|
455,768
|
|
|
|
|
||||
|
Unsecured Credit Facility
(B)
|
$
|
—
|
|
$
|
144,500
|
|
N/A
|
N/A
|
10/29/2021
|
||||
(A)
During the year ended December 31, 2018, pursuant to the agreements for our unsecured term loans entered into in 2014 and 2015 (collectively, the "Unsecured Term Loans"), we elected to have the interest spread calculated based on our investment grade rating resulting in a
10 basis point
reduction in the credit spread compared to the prior rate. The interest rate at December 31, 2018 also reflects the derivative instruments we entered into to effectively convert the variable rate to a fixed rate. See Note 12.
(B)
The maturity date may be extended an additional year at our election, subject to certain restrictions. Amounts exclude unamortized debt issuance costs of
$3,554
and
$4,781
as of December 31, 2018 and 2017, respectively, which are included in the line item
Prepaid Expenses and Other Assets, Net
.
71
Mortgage Loans Payable, Net
During the years ended December 31, 2018 and 2017, we paid off mortgage loans in the amount of
$157,782
and
$36,108
, respectively. In connection with the mortgage loans paid off during the years ended December 31, 2018 and 2017, we recognized
$39
and
$1,653
within the line item
Loss from Retirement of Debt
representing the write-off of unamortized debt issuance costs offset by the write off of an unamortized premium.
During the year ended December 31, 2018, we assumed a mortgage loan in the amount of
$11,654
in conjunction with the acquisition of
three
industrial properties, totaling approximately
0.2
million square feet of GLA. The mortgage loan bears interest at a fixed rate of
4.17%
, principal payments are amortized over
30
years and the loan matures in August 2028.
As of December 31, 2018, mortgage loans payable are collateralized, and in some instances cross-collateralized, by industrial properties with a net carrying value of
$459,225
. We believe the Operating Partnership and the Company were in compliance with all covenants relating to mortgage loans as of December 31, 2018.
Senior Unsecured Notes, Net
During the year ended December 31, 2018, the Operating Partnership issued
$150,000
of
3.86%
Series C Guaranteed Senior Notes due February 15, 2028 (the "2028 Private Placement Notes") and
$150,000
of
3.96%
Series D Guaranteed Senior Notes due February 15, 2030 (the "2030 Private Placement Notes") in a private placement pursuant to a Note and Guaranty Agreement dated December 12, 2017.
During the year ended December 31, 2017, the Operating Partnership issued
$125,000
of
4.30%
Series A Guaranteed Senior Notes due April 20, 2027 (the "2027 Private Placement Notes") and
$75,000
of
4.40%
Series B Guaranteed Senior Notes due April 20, 2029 (the "2029 Private Placement Notes") in private placement pursuant to a Note and Guaranty Agreement dated February 21, 2017.
The 2028 Private Placement Notes, the 2030 Private Placement Notes, the 2027 Private Placement Notes and the 2029 Private Placement Notes (collectively, the "Private Placement Notes") are unsecured obligations of the Operating Partnership that are fully and unconditionally guaranteed by the Company and require semi-annual interest payments.
During the year ended December 31, 2017, we paid off and retired our 2017 II and 2017 Notes, at maturity, in the amounts of
$101,871
and
$54,981
, respectively.
Unsecured Term Loans, Net
On January 29, 2014, we entered into a
seven
-year,
$200,000
unsecured loan (the "2014 Unsecured Term Loan") with a syndicate of financial institutions. At December 31, 2018, the 2014 Unsecured Term Loan requires interest only payments and bears interest at a variable rate based on
LIBOR plus 110 basis points
. During the year ended December 31, 2017, we recognized
$51
within the line item
Loss from Retirement of Debt
related to the write-off of unamortized debt issuance costs related to a lender that opted out of its position and whose position was replaced by other lenders.
On September 11, 2015, we entered into a
seven
-year,
$260,000
unsecured loan (the "2015 Unsecured Term Loan"; together with the 2014 Unsecured Term Loan, the "Unsecured Term Loans") with a syndicate of financial institutions. At December 31, 2018, the 2015 Unsecured Term Loan requires interest only payments and bears interest at a variable rate based on
LIBOR plus 110 basis points
. The interest rates on the Unsecured Term Loans vary based on the Company's leverage ratio or, at our election, the Company's credit ratings.
Unsecured Credit Facility
On October 31, 2017, we amended and restated our
$625,000
revolving credit agreement (the "Old Credit Facility") with a new
$725,000
revolving credit agreement (as amended and restated, the "Unsecured Credit Facility"). We may request that the borrowing capacity under the Unsecured Credit Facility be increased to
$1,000,000
, subject to certain restrictions. The Unsecured Credit Facility matures on October 29, 2021, with an option to extend an additional
one
year at our election, subject to certain restrictions. At December 31, 2017, the Unsecured Credit Facility provides for interest only payments at
LIBOR plus 110 basis points
. The interest rate on the Unsecured Credit Facility varies based on our leverage ratio. During the year ended December 31, 2017, in connection with the amendment, we recognized
$71
within the line item
Loss from Retirement of Debt
related to the write-off of unamortized debt issuance costs related to a lender that opted out of its position and whose position was replaced by other lenders.
72
Indebtedness
The following is a schedule of the stated maturities and scheduled principal payments of our indebtedness, exclusive of premiums, discounts and debt issuance costs, for the next five years as of December 31, and thereafter:
|
|
Amount
|
||
|
2019
|
$
|
79,600
|
|
|
2020
|
59,046
|
|
|
|
2021
|
267,113
|
|
|
|
2022
|
341,552
|
|
|
|
2023
|
321
|
|
|
|
Thereafter
|
558,549
|
|
|
|
Total
|
$
|
1,306,181
|
|
The Unsecured Credit Facility, the Unsecured Term Loans, the Private Placement Notes and the indentures governing our senior unsecured notes contain certain financial covenants, including limitations on incurrence of debt and debt service coverage. Under the Unsecured Credit Facility and the Unsecured Term Loans, an event of default can occur if the lenders, in their good faith judgment, determine that a material adverse change has occurred which could prevent timely repayment or materially impair our ability to perform our obligations under the loan agreements. We believe that the Operating Partnership and the Company were in compliance with all covenants relating to the Unsecured Credit Facility, the Unsecured Term Loans, the Private Placement Notes and indentures governing our senior unsecured notes as of December 31, 2018. However, these financial covenants are complex and there can be no assurance that these provisions would not be interpreted by our lenders and noteholders in a manner that could impose and cause us to incur material costs.
Fair Value
At December 31, 2018 and 2017, the fair value of our indebtedness was as follows:
|
|
December 31, 2018
|
December 31, 2017
|
|||||||||||||
|
|
Carrying
Amount
(A)
|
Fair
Value
|
Carrying
Amount
(A)
|
Fair
Value
|
|||||||||||
|
Mortgage Loans Payable, Net
|
$
|
297,716
|
|
$
|
304,508
|
|
$
|
451,862
|
|
$
|
467,303
|
|
|||
|
Senior Unsecured Notes, Net
|
548,494
|
|
546,607
|
|
248,487
|
|
269,731
|
|
|||||||
|
Unsecured Term Loans
|
460,000
|
|
461,317
|
|
460,000
|
|
460,000
|
|
|||||||
|
Unsecured Credit Facility
|
—
|
|
—
|
|
144,500
|
|
144,500
|
|
|||||||
|
Total
|
$
|
1,306,210
|
|
$
|
1,312,432
|
|
$
|
1,304,849
|
|
$
|
1,341,534
|
|
|||
(A)
The carrying amounts include unamortized premiums and discounts and exclude unamortized debt issuance costs.
The fair values of our mortgage loans payable were determined by discounting the future cash flows using the current rates at which similar loans would be made based upon similar remaining maturities. The current market rates we utilized were internally estimated. The fair value of the senior unsecured notes were determined by using rates, as advised by our bankers, that are based upon recent trades within the same series of the senior unsecured notes, recent trades for senior unsecured notes with comparable maturities, recent trades for fixed rate unsecured notes from companies with profiles similar to ours, as well as overall economic conditions. The fair value of the Unsecured Credit Facility and the Unsecured Term Loans was determined by discounting the future cash flows using current rates at which similar loans would be made to borrowers with similar credit ratings and for the same remaining term, assuming no repayment until maturity. We have concluded that our determination of fair value for each of our mortgage loans payable, senior unsecured notes, the Unsecured Term Loans and the Unsecured Credit Facility was primarily based upon Level 3 inputs.
73
5. Variable Interest Entities
The Other Real Estate Partnerships are VIEs of the Operating Partnership and the Operating Partnership is the primary beneficiary, thus causing the Other Real Estate Partnerships to be consolidated by the Operating Partnership. In addition, the Operating Partnership is a VIE of the Company and the Company is the primary beneficiary.
The following table summarizes the assets and liabilities of the Other Real Estate Partnerships included in our consolidated balance sheets:
|
December 31, 2018
|
December 31, 2017
|
||||||
|
ASSETS
|
|||||||
|
Assets:
|
|||||||
|
Net Investment in Real Estate
|
$
|
260,528
|
|
$
|
270,708
|
|
|
|
Other Assets, Net
|
25,059
|
|
23,530
|
|
|||
|
Total Assets
|
$
|
285,587
|
|
$
|
294,238
|
|
|
|
LIABILITIES AND PARTNERS' CAPITAL
|
|||||||
|
Liabilities:
|
|||||||
|
Mortgage Loans Payable, Net
|
$
|
20,497
|
|
$
|
61,256
|
|
|
|
Other Liabilities, Net
|
9,045
|
|
9,283
|
|
|||
|
Partners' Capital
|
256,045
|
|
223,699
|
|
|||
|
Total Liabilities and Partners' Capital
|
$
|
285,587
|
|
$
|
294,238
|
|
|
Joint Venture
During the second quarter of 2018, we entered into the Joint Venture with a third party partner for the purpose of developing, leasing, operating and potentially selling approximately
532
net developable acres of land located in the Phoenix, Arizona metropolitan area. The purchase price for the land was
$49,000
, which amount was funded by the Joint Venture via cash equity contributions from us and our joint venture partner. Through a wholly-owned subsidiary of the Operating Partnership, we own a
49%
interest in the Joint Venture.
Under the Joint Venture's operating agreement, we act as the managing member of the Joint Venture and are entitled to receive fees for providing management, leasing, development, construction supervision, disposition and asset management services to the Joint Venture. In addition, the Joint Venture's operating agreement provides us the ability to earn an incentive fee based on the ultimate financial performance of the Joint Venture.
As part of our assessment of the appropriate accounting treatment for the Joint Venture, we reviewed the operating agreement of the Joint Venture in order to determine our rights and the rights of our joint venture partner, including whether those rights are protective or participating. The operating agreement contains certain protective rights, such as the requirement of member approval to sell, finance or refinance the property and to pay capital expenditures and operating expenditures outside of the approved budget. However, we and our Joint Venture partner jointly (i) approve the annual budget, (ii) approve certain expenditures, (iii) review and approve the Joint Venture's tax return before filing and (iv) approve each lease at a developed property. We consider the latter rights substantive participation rights that result in shared, joint power over the activities that most significantly impact the performance of the Joint Venture. As such, we concluded to account for our investment in the Joint Venture under the equity method of accounting.
6. Stockholders' Equity of the Company and Partners' Capital of the Operating Partnership
Operating Partnership Units
The Operating Partnership has issued General Partner Units, Limited Partner Units and preferred general partnership Units. The General Partner Units resulted from capital contributions from the Company. The Limited Partner Units are issued in conjunction with the acquisition of certain properties. Subject to certain lock-up periods, holders of Limited Partner Units can redeem their Units by providing written notification to the General Partner. Unless the General Partner provides notice of a redemption restriction to the holder, redemption must be made within seven business days after receipt of the holder's notice. The redemption can be effectuated, as determined by the General Partner, either by exchanging the Limited Partner Units for shares of common stock of the Company on a one-for-one basis, subject to adjustment, or by paying cash equal to the fair market value
74
of such shares. Prior requests for redemption have generally been fulfilled with shares of common stock of the Company, and the Operating Partnership intends to continue this practice. If each Limited Partner Unit of the Operating Partnership were redeemed as of December 31, 2018, the Operating Partnership could satisfy its redemption obligations by making an aggregate cash payment of approximately
$75,733
or by issuing
2,624,167
shares of the Company's common stock.
Preferred Stock or General Partner Preferred Units
The Company has
10,000,000
shares of preferred stock authorized. As of December 31, 2018 and 2017, there were no preferred shares or general partner preferred Units outstanding.
Shares of Common Stock or Unit Contributions
The following table is a roll-forward of the Company's shares of common stock outstanding and the Operating Partnership's Units outstanding, including unvested restricted stock or restricted Unit awards (see Note 11), for the three years ended December 31, 2018:
|
|
Shares of
Common Stock
Outstanding
|
General Partner and Limited Partner Units Outstanding
|
|||
|
Balance at December 31, 2015
|
111,027,225
|
|
115,332,932
|
|
|
|
Issuance of Common Stock/Contribution of General Partner Units
(A)
|
5,600,000
|
|
5,600,000
|
|
|
|
Issuance of Restricted Stock/Restricted Unit Awards
|
322,833
|
|
322,833
|
|
|
|
Repurchase and Retirement of Restricted Stock/Restricted Unit Awards
|
(108,644
|
)
|
(108,644
|
)
|
|
|
Conversion of Limited Partner Units
(B)
|
266,332
|
|
—
|
|
|
|
Balance at December 31, 2016
|
117,107,746
|
|
121,147,121
|
|
|
|
Issuance of Common Stock/Contribution of General Partner Units
(A)
|
2,560,000
|
|
2,560,000
|
|
|
|
Issuance of Restricted Stock/Restricted Unit Awards
|
275,793
|
|
275,793
|
|
|
|
Repurchase and Retirement of Restricted Stock/Restricted Unit Awards
|
(91,513
|
)
|
(91,513
|
)
|
|
|
Conversion of Limited Partner Units
(B)
|
31,154
|
|
—
|
|
|
|
Balance at December 31, 2017
|
119,883,180
|
|
123,891,401
|
|
|
|
Issuance of Common Stock/Contribution of General Partner Units
(A)
|
4,800,000
|
|
4,800,000
|
|
|
|
Issuance of Restricted Stock/Restricted Unit Awards
|
227,059
|
|
227,059
|
|
|
|
Vesting of LTIP Unit Awards (as defined in Note 11)
|
150,772
|
|
150,772
|
|
|
|
Repurchase and Retirement of Restricted Stock/Restricted Unit Awards
|
(104,301
|
)
|
(104,301
|
)
|
|
|
Conversion of Limited Partner Units
(B)
|
1,350,721
|
|
—
|
|
|
|
Retirement of Limited Partner Units
(C)
|
—
|
|
(33,333
|
)
|
|
|
Balance at December 31, 2018
|
126,307,431
|
|
128,931,598
|
|
|
(A)
During the years ended December 31, 2018, 2017 and 2016, the Company issued
4,800,000
,
2,560,000
, and
5,600,000
shares of the Company's common stock in an underwritten public offering. Proceeds to the Company, net of the underwriter's discount, were
$145,584
,
$74,880
, and
$124,936
. The proceeds were contributed to the Operating Partnership in exchange for General Partner Units and are reflected in the Operating Partnership's financial statements as a general partner contribution.
(B)
For the years ended December 31, 2018, 2017 and 2016,
1,350,721
,
31,154
and
266,332
Limited Partner Units, respectively, were converted into an equivalent number of shares of common stock of the Company, resulting in a reclassification of
$16,605
,
$364
and
$2,862
, respectively, of noncontrolling interest to the Company's stockholders' equity.
(C)
During the twelve months ended December 31, 2018,
33,333
Limited Partner Units were forfeited by a unitholder and were retired by the Operating Partnership.
75
ATM Program
On March 13, 2014, we entered into distribution agreements with sales agents to sell up to
13,300,000
shares of the Company's common stock, for up to
$200,000
aggregate gross sales proceeds, from time to time in "at-the-market" offerings (the "2014 ATM Program"). The distribution agreements entered into with respect to the 2014 ATM Program expired by their terms on March 13, 2017 and, on March 16, 2017, we entered into distribution agreements with sales agents to sell up to
8,000,000
shares of the Company's common stock, for up to
$200,000
aggregate gross sales proceeds, from time to time in "at-the-market" offerings (the "2017 ATM Program"). Under the terms of the 2014 ATM Program and the 2017 ATM Program, sales were or are to be made primarily in transactions that are deemed to be "at-the-market" offerings, including sales made directly on the New York Stock Exchange or sales made through a market maker other than on an exchange or by privately negotiated transactions. During the years ended December 31, 2018, 2017 and 2016, the Company did not issue any shares of common stock under the 2014 ATM Program or the 2017 ATM Program.
Dividends/Distributions
The following table summarizes dividends/distributions accrued during the past three years:
|
|
2018 Total
Dividend/
Distribution
|
2017 Total
Dividend/
Distribution
|
2016 Total
Dividend/
Distribution
|
||||||||
|
Common Stock/Operating Partnership Units
|
$
|
111,478
|
|
$
|
104,106
|
|
$
|
91,318
|
|
||
76
7. Accumulated Other Comprehensive Income
The following table summarizes the changes in accumulated other comprehensive income by component for the years ended December 31, 2018 and 2017:
|
Derivative Instruments
|
Total for Operating Partnership
|
Comprehensive Loss (Income) Attributable to Noncontrolling Interest
|
Total for Company
|
||||||||||||
|
Balance as of December 31, 2016
|
$
|
(4,804
|
)
|
$
|
(4,804
|
)
|
$
|
161
|
|
$
|
(4,643
|
)
|
|||
|
Other Comprehensive Income Before Reclassifications
|
1,645
|
|
1,645
|
|
(205
|
)
|
1,440
|
|
|||||||
|
Amounts Reclassified from Accumulated Other Comprehensive Income
|
4,541
|
|
4,541
|
|
—
|
|
4,541
|
|
|||||||
|
Net Current Period Other Comprehensive Income
|
6,186
|
|
6,186
|
|
(205
|
)
|
5,981
|
|
|||||||
|
Balance as of December 31, 2017
|
$
|
1,382
|
|
$
|
1,382
|
|
$
|
(44
|
)
|
$
|
1,338
|
|
|||
|
Other Comprehensive Income Before Reclassifications
|
1,987
|
|
1,987
|
|
(28
|
)
|
1,959
|
|
|||||||
|
Amounts Reclassified from Accumulated Other Comprehensive Income
|
205
|
|
205
|
|
—
|
|
205
|
|
|||||||
|
Net Current Period Other Comprehensive Income
|
2,192
|
|
2,192
|
|
(28
|
)
|
2,164
|
|
|||||||
|
Balance as of December 31, 2018
|
$
|
3,574
|
|
$
|
3,574
|
|
$
|
(72
|
)
|
$
|
3,502
|
|
|||
The following table summarizes the reclassifications out of accumulated other comprehensive income for the years ended December 31, 2018, 2017 and 2016:
|
Amount Reclassified from Accumulated Other Comprehensive Loss (Income)
|
||||||||||||||
|
Accumulated Other Comprehensive Loss Components
|
Year Ended December 31, 2018
|
Year Ended December 31, 2017
|
Year Ended December 31, 2016
|
Affected Line Items in the Consolidated Statements of Operations
|
||||||||||
|
Derivative Instruments:
|
||||||||||||||
|
Amortization of Previously Settled Derivative Instruments
|
96
|
|
205
|
|
390
|
|
Interest Expense
|
|||||||
|
Net Settlement Payments to our Counterparties
|
109
|
|
4,336
|
|
7,123
|
|
Interest Expense
|
|||||||
|
$
|
205
|
|
$
|
4,541
|
|
$
|
7,513
|
|
Total
|
|||||
The effective portion of changes in the fair value of derivatives designated and that qualify as cash flow hedges is recorded in other comprehensive income and is subsequently reclassified to earnings through interest expense over the life of the derivative or over the life of the debt. In the next 12 months, we expect to amortize approximately
$96
into net income by increasing interest expense for derivative instruments we settled in previous periods. Additionally, recurring settlement payments or receipts related to the 2014 Swaps and 2015 Swaps (as defined in Note 12) will also be reclassified to interest expense. See Note 12 for more information about our derivatives.
77
8. Earnings Per Share and Earnings Per Unit (EPS/EPU)
The computation of basic and diluted EPS of the Company is presented below:
|
Year Ended December 31, 2018
|
Year Ended December 31, 2017
|
Year Ended December 31, 2016
|
|||||||||
|
Numerator:
|
|||||||||||
|
Net Income Available to First Industrial Realty Trust, Inc.'s Common Stockholders and Participating Securities
|
$
|
163,239
|
|
$
|
201,456
|
|
$
|
121,232
|
|
||
|
Net Income Allocable to Participating Securities
|
(513
|
)
|
(646
|
)
|
(411
|
)
|
|||||
|
Net Income Available to First Industrial Realty Trust, Inc.'s Common Stockholders
|
$
|
162,726
|
|
$
|
200,810
|
|
$
|
120,821
|
|
||
|
Denominator (In Thousands):
|
|||||||||||
|
Weighted Average Shares - Basic
|
123,804
|
|
118,272
|
|
115,030
|
|
|||||
|
Effect of Dilutive Securities:
|
|||||||||||
|
LTIP Unit Awards (as defined in Note 11)
|
387
|
|
515
|
|
340
|
|
|||||
|
Weighted Average Shares - Diluted
|
124,191
|
|
118,787
|
|
115,370
|
|
|||||
|
Basic EPS:
|
|||||||||||
|
Net Income Available to First Industrial Realty Trust, Inc.'s Common Stockholders
|
$
|
1.31
|
|
$
|
1.70
|
|
$
|
1.05
|
|
||
|
Diluted EPS:
|
|
|
|
||||||||
|
Net Income Available to First Industrial Realty Trust, Inc.'s Common Stockholders
|
$
|
1.31
|
|
$
|
1.69
|
|
$
|
1.05
|
|
||
The computation of basic and diluted EPU of the Operating Partnership is presented below:
|
Year Ended December 31, 2018
|
Year Ended December 31, 2017
|
Year Ended December 31, 2016
|
|||||||||
|
Numerator:
|
|||||||||||
|
Net Income Available to Unitholders and Participating Securities
|
167,246
|
|
208,158
|
|
125,547
|
|
|||||
|
Net Income Allocable to Participating Securities
|
(513
|
)
|
(646
|
)
|
(410
|
)
|
|||||
|
Net Income Available to Unitholders
|
$
|
166,733
|
|
$
|
207,512
|
|
$
|
125,137
|
|
||
|
Denominator (In Thousands):
|
|||||||||||
|
Weighted Average Units - Basic
|
126,921
|
|
122,306
|
|
119,274
|
|
|||||
|
Effect of Dilutive Securities that Result in the Issuance of General Partner Units:
|
|||||||||||
|
LTIP Unit Awards (as defined in Note 11)
|
387
|
|
515
|
|
340
|
|
|||||
|
Weighted Average Units - Diluted
|
127,308
|
|
122,821
|
|
119,614
|
|
|||||
|
Basic EPS:
|
|||||||||||
|
Net Income Available to Unitholders
|
$
|
1.31
|
|
$
|
1.70
|
|
$
|
1.05
|
|
||
|
Diluted EPU:
|
|||||||||||
|
Net Income Available to Unitholders
|
$
|
1.31
|
|
$
|
1.69
|
|
$
|
1.05
|
|
||
Participating securities include
405,436
,
408,248
and
406,855
of unvested restricted stock or restricted Unit awards outstanding at December 31, 2018, 2017 and 2016, respectively, which participate in non-forfeitable distributions. Under the two class method, participating security holders are allocated income, in proportion to total weighted average shares or Units outstanding, based upon the greater of net income or common stock dividends or Unit distributions declared.
78
9. Income Taxes
Our Consolidated Financial Statements include the operations of our TRSs, which are not entitled to the dividends paid deduction and are subject to federal, state and local income taxes on its taxable income. During the years ended December 31, 2018, 2017 and 2016, the Company qualified as a REIT and incurred no federal income tax expense; accordingly, the only federal income taxes included in the accompanying Consolidated Financial Statements relate to activities of our TRSs.
The components of the income tax benefit (provision) for the years ended December 31, 2018, 2017 and 2016 are comprised of the following:
|
Year Ended December 31,
|
|||||||||||
|
|
2018
|
2017
|
2016
|
||||||||
|
Current:
|
|||||||||||
|
Federal
|
$
|
22
|
|
$
|
(859
|
)
|
$
|
(656
|
)
|
||
|
State
|
(310
|
)
|
(344
|
)
|
(251
|
)
|
|||||
|
Deferred:
|
|||||||||||
|
Federal
|
400
|
|
—
|
|
—
|
|
|||||
|
State
|
(20
|
)
|
10
|
|
(182
|
)
|
|||||
|
Total Income Tax Benefit (Provision)
|
$
|
92
|
|
$
|
(1,193
|
)
|
$
|
(1,089
|
)
|
||
Deferred income taxes represent the tax effect of the temporary differences between the book and tax basis of assets and liabilities. Deferred income tax assets and liabilities include the following as of December 31, 2018 and 2017:
|
Year Ended December 31,
|
|||||||
|
|
2018
|
2017
|
|||||
|
Impairment of Real Estate
|
$
|
1,107
|
|
$
|
1,267
|
|
|
|
Other - Temporary Differences
|
584
|
|
233
|
|
|||
|
Valuation Allowance
|
(840
|
)
|
(984
|
)
|
|||
|
Total Deferred Income Tax Assets, Net of Allowance
|
$
|
851
|
|
$
|
516
|
|
|
|
Straight-line Rent
|
$
|
(39
|
)
|
$
|
(40
|
)
|
|
|
Basis Difference - Real Estate Properties
|
(424
|
)
|
(488
|
)
|
|||
|
Other - Temporary Differences
|
(192
|
)
|
(172
|
)
|
|||
|
Total Deferred Income Tax Liabilities
|
$
|
(655
|
)
|
$
|
(700
|
)
|
|
|
Total Net Deferred Income Tax Assets (Liabilities)
|
$
|
196
|
|
$
|
(184
|
)
|
|
A valuation allowance is recorded if we believe it is more likely than not that all or some portion of our deferred income tax assets will not be realized. We do not have projections of future taxable income or other sources of taxable income in one of the TRSs significant enough to allow us to believe it is more likely than not that we will realize our deferred income tax assets. Therefore, we have recorded a valuation allowance against the deferred income tax assets within that TRS. An increase or decrease in the valuation allowance that results from a change in circumstances, and which causes a change in our judgment about the realizability of the related deferred income tax assets, is included in the current income tax provision.
79
The income tax benefit (provision) pertaining to income before taxes of the TRSs differs from the amounts computed by applying the applicable federal statutory rate as follows for the years ended December 31, 2018, 2017 and 2016:
|
Year Ended December 31,
|
|||||||||||
|
|
2018
|
2017
|
2016
|
||||||||
|
Tax Benefit (Provision) at Federal Rate
|
$
|
436
|
|
$
|
(1,416
|
)
|
$
|
(1,764
|
)
|
||
|
Change in Federal Tax Rate
|
—
|
|
(609
|
)
|
—
|
|
|||||
|
State Tax Provision, Net of Federal Benefit
|
(417
|
)
|
(376
|
)
|
(462
|
)
|
|||||
|
Change in Valuation Allowance
|
144
|
|
1,197
|
|
1,256
|
|
|||||
|
Other
|
(71
|
)
|
11
|
|
(119
|
)
|
|||||
|
Net Income Tax Benefit (Provision)
|
$
|
92
|
|
$
|
(1,193
|
)
|
$
|
(1,089
|
)
|
||
We evaluate tax positions taken in the financial statements on a quarterly basis under the interpretation for accounting for uncertainty in income taxes. As a result of this evaluation, we may recognize a tax benefit from an uncertain tax position only if it is "more-likely-than-not" that the tax position will be sustained on examination by taxing authorities. As of December 31, 2018, we do not have any unrecognized tax benefits.
We file income tax returns in the U.S. and various states. The statute of limitations for income tax returns is generally three years. As such, our tax returns that are subject to examination would be primarily from 2015 and thereafter.
Federal Income Tax Treatment of Common Dividends
For the years ended December 31, 2018, 2017 and 2016, the dividends paid to the Company's common shareholders per common share for income tax purposes were characterized as follows:
|
2018
|
As a
Percentage
of
Distributions
|
2017
|
As a
Percentage
of
Distributions
|
2016
|
As a
Percentage
of
Distributions
|
|||||||||||||||
|
Ordinary Income
(A)
|
$
|
0.6858
|
|
78.83
|
%
|
$
|
0.6552
|
|
74.23
|
%
|
$
|
0.6935
|
|
82.53
|
%
|
|||||
|
Unrecaptured Section 1250 Gain
|
0.1497
|
|
17.21
|
%
|
0.1627
|
|
18.43
|
%
|
0.1130
|
|
13.45
|
%
|
||||||||
|
Capital Gain
|
0.0330
|
|
3.79
|
%
|
0.0648
|
|
7.34
|
%
|
0.0066
|
|
0.78
|
%
|
||||||||
|
Qualified Dividend
|
0.0015
|
|
0.17
|
%
|
—
|
|
0.00
|
%
|
—
|
|
0.00
|
%
|
||||||||
|
Return of Capital
|
—
|
|
0.00
|
%
|
—
|
|
0.00
|
%
|
0.0272
|
|
3.24
|
%
|
||||||||
|
$
|
0.8700
|
|
100.00
|
%
|
$
|
0.8827
|
|
100.00
|
%
|
$
|
0.8403
|
|
100.00
|
%
|
||||||
(A)
For the year ended December 31, 2018, the Code Section 199A dividend is equal to the total ordinary income dividend.
The income tax characterization of dividends to common shareholders is based on the calculation of Taxable Earnings and Profits, as defined in the Code. Taxable Earnings and Profits differ from regular taxable income due primarily to differences in the estimated useful lives and methods used to compute depreciation and in the recognition of gains and losses on the sale of real estate assets.
80
10. Future Rental Revenues
Our properties are leased to tenants under net and semi-net operating leases. Future minimum rental receipts, excluding tenant reimbursements of expenses, under non-cancelable operating leases executed as of December 31, 2018 are approximately as follows:
|
2019
|
$
|
305,689
|
|
|
2020
|
288,817
|
|
|
|
2021
|
244,743
|
|
|
|
2022
|
205,097
|
|
|
|
2023
|
169,243
|
|
|
|
Thereafter
|
451,151
|
|
|
|
Total
|
$
|
1,664,740
|
|
11. Benefit Plans
Stock Based Compensation
The Company maintains a stock incentive plan (the "Stock Incentive Plan"), which is administered by the Compensation Committee of the Board of Directors. Officers, certain employees and the Company's independent directors generally are eligible to participate in the Stock Incentive Plan. Awards made under the Stock Incentive Plan can be in the form of restricted stock awards, restricted stock unit awards, performance share awards, dividend equivalent rights, non-statutory stock options and stock appreciation rights. Special provisions apply to awards granted under the Stock Incentive Plan in the event of a change in control in the Company. As of December 31, 2018, awards covering
1.6
million shares of common stock were available to be granted under the Stock Incentive Plan.
Restricted Stock or Restricted Unit Awards
For the years ended December 31, 2018, 2017 and 2016, the Company awarded
211,890
,
260,685
and
308,373
shares, respectively, of restricted stock awards to certain employees, which had a fair value of
$6,068
,
$6,871
and
$6,047
on the date such awards were approved by either the Compensation Committee of the Board of Directors or the Company's stockholders of the Stock Incentive Plan, as the case may be. These restricted stock awards were granted based upon the achievement of certain corporate performance goals and generally vest over a period of
three
years. Additionally, during the years ended December 31, 2018, 2017 and 2016, the Company awarded
15,169
,
15,108
and
14,460
shares, respectively, of restricted stock to non-employee members of the Board of Directors, which had a fair value of
$490
,
$420
and
$350
on the date of approval. These restricted stock awards vest over a
one
-year period. The Operating Partnership issued restricted Unit awards to the Company in the same amount for both restricted stock awards.
Compensation expense is charged to earnings over the vesting periods for the restricted stock or restricted Unit awards expected to vest except if the recipient is not required to provide future service in exchange for vesting of such restricted stock or restricted Unit awards. If vesting of a recipient's restricted stock or restricted Unit awards is not contingent upon future service, the expense is recognized immediately at the date of grant. During the years ended December 31, 2017 and 2016, we recognized
$1,590
and
$1,710
, respectively, of compensation expense related to restricted stock or restricted Unit awards granted to our former Chief Executive Officer for which future service was not required.
LTIP Unit Awards
For the years ended December 31, 2018 and 2017, the Company granted to certain employees
179,288
and
195,951
Long-Term Incentive Program ("LTIP") performance units ("LTIP Unit Awards"), which had a fair value of
$2,381
and
$2,473
on the grant date. The LTIP Unit Awards vest based upon the relative total shareholder return ("TSR") of the Company's common stock compared to the TSRs of the MSCI US REIT Index and the NAREIT Industrial Index over a performance period of
three
years. Compensation expense is charged to earnings on a straight-line basis over the respective performance periods. At the end of the respective performance periods each participant will be issued shares of the Company's common stock equal to the maximum shares issuable to the participant for the performance period multiplied by a percentage, ranging from
0%
to
100%
, based on the Company's TSR as compared to the TSRs of the MSCI US REIT Index and the NAREIT Industrial Index. The participant is also entitled to dividend equivalents for shares issued pursuant to vested LTIP Unit Awards. The Operating Partnership issues General Partner Units to the Company in the same amounts for vested LTIP Unit Awards.
81
The fair values of the LTIP Unit Awards at issuance were determined by a lattice-binomial option-pricing model based on Monte Carlo simulations using the following assumptions:
|
Year Ended December 31, 2018
|
Year Ended December 31, 2017
|
||||
|
Expected dividend yield
|
2.67
|
%
|
2.71
|
%
|
|
|
Expected volatility - range used
|
15.83% - 17.87%
|
|
21.50% - 21.80%
|
|
|
|
Expected volatility - weighted average
|
17.02
|
%
|
21.68
|
%
|
|
|
Risk-free interest rate
|
1.57% - 2.04%
|
|
0.66% - 1.58%
|
|
|
Outstanding Restricted Stock or Restricted Unit Awards and LTIP Unit Awards
For the years ended December 31, 2018, 2017 and 2016, we recognized
$7,586
,
$8,611
and
$7,371
, respectively, in amortization related to restricted stock or restricted Unit awards and LTIP Unit Awards. Restricted stock or restricted Unit award and LTIP Unit Award amortization capitalized in connection with development activities was
$472
for the year ended December 31, 2018 and was not significant for the years ended December 31, 2017 and 2016. At December 31, 2018, we had
$8,306
in unrecognized compensation related to unvested restricted stock or restricted Unit awards and LTIP Unit Awards. The weighted average period that the unrecognized compensation is expected to be recognized is
0.88
years.
Restricted stock or restricted Unit award and LTIP Unit Award transactions for the year ended December 31, 2018 are summarized as follows:
|
Awards
|
Weighted
Average
Grant Date
Fair Value
|
|||||
|
Outstanding at December 31, 2017
|
1,112,828
|
|
$
|
15.31
|
|
|
|
Issued
|
406,347
|
|
$
|
22.00
|
|
|
|
Forfeited
|
(48,823
|
)
|
$
|
17.47
|
|
|
|
Vested
|
(469,533
|
)
|
$
|
15.55
|
|
|
|
Outstanding at December 31, 2018
|
1,000,819
|
|
$
|
17.81
|
|
|
401(k)/Profit Sharing Plan
Under the Company's 401(k)/Profit Sharing Plan, all eligible employees may participate by making voluntary contributions and the Company may make, but is not required to make, matching contributions, which are funded by the Operating Partnership. For the years ended December 31, 2018, 2017 and 2016, total expense related to matching contributions was
$688
,
$518
and
$509
, respectively.
12. Derivative Instruments
Our objectives in using derivatives are to add stability to interest expense and to manage our cash flow volatility and exposure to interest rate movements. To accomplish this objective, we primarily use derivative instruments as part of our interest rate risk management strategy. Derivative instruments designated as cash flow hedges involve the receipt of variable-rate amounts from a counterparty in exchange for fixed-rate payments over the life of the agreements without exchange of the underlying notional amount.
During December 2018, in anticipation of issuing long-term debt in the future, we entered into
two
treasury locks with an aggregate notional value of
$100,000
to manage our exposure to changes in the
ten year U.S. Treasury
rate (the "2018 Treasury Locks"). The 2018 Treasury Locks fix the
ten year U.S. Treasury
rate at a weighted average of
2.93%
and cash settle on or before April 30, 2019. We designated the 2018 Treasury Locks as cash flow hedges.
In connection with the originations of the Unsecured Term Loans (see Note 4), we entered into interest rate swaps to manage our exposure to changes in the
one month LIBOR
rate. The
four
interest rate swaps, which fix the variable rate of the 2014 Unsecured Term Loan, have an aggregate notional value of
$200,000
, mature on January 29, 2021 and fix the LIBOR rate at a weighted average rate of
2.29%
(the "2014 Swaps"). The
six
interest rate swaps, which fix the variable rate of the 2015 Unsecured Term Loan, have an aggregate notional value of
$260,000
, mature on September 12, 2022 and fix the LIBOR rate at a weighted average rate of
1.79%
(the "2015 Swaps"). We designated the 2014 Swaps and 2015 Swaps as cash flow hedges.
82
In September 2017, we entered into
two
treasury locks (the "2017 Treasury Locks"), with an aggregate notional value of
$100,000
, in order to fix the interest rate on an anticipated unsecured debt offering. The Treasury Locks fixed the
ten year U.S. Treasury
rate at a weighted average rate of approximately
2.18%
. Since we did not designate the 2017 Treasury Locks as hedges the change in the fair value of the 2017 Treasury Locks was recorded within the consolidated statement of operations. During the year ended December 31, 2017 we settled the 2017 Treasury Locks and recognized
$1,896
in the line item
Settlement Gain on Derivative Instruments
.
Our agreements with our derivative counterparties contain provisions where if we default on any of our indebtedness, then we could also be declared in default on our derivative obligations subject to certain thresholds. As of December 31, 2018, we had not posted any collateral related to these agreements and were not in breach of any of the provisions of these agreements. If we had breached these agreements, we could have been required to settle our obligations under the agreements at their termination value.
The following table sets forth our financial assets and liabilities related to the 2014 Swaps, the 2015 Swaps and the 2018 Treasury Locks, which are included in the line items
Prepaid Expenses and Other Assets, Net or Accounts Payable, Accrued Expenses and Other Liabilities
and are accounted for at fair value on a recurring basis as of December 31, 2018:
|
|
|
Fair Value Measurements at Reporting Date Using:
|
||||||||||||
|
Description
|
Fair Value
|
Quoted Prices in
Active Markets for
Identical Assets
(Level 1)
|
Significant Other
Observable Inputs
(Level 2)
|
Unobservable
Inputs
(Level 3)
|
||||||||||
|
Derivatives designated as a hedging instrument:
|
||||||||||||||
|
Assets:
|
||||||||||||||
|
2014 Swaps
|
$
|
751
|
|
—
|
|
$
|
751
|
|
—
|
|
||||
|
2015 Swaps
|
$
|
5,893
|
|
—
|
|
$
|
5,893
|
|
—
|
|
||||
|
Liabilities:
|
||||||||||||||
|
2018 Treasury Locks
|
$
|
(2,162
|
)
|
—
|
|
$
|
(2,162
|
)
|
—
|
|
||||
There was no ineffectiveness recorded on the 2014 Swaps, the 2015 Swaps and the 2018 Treasury Locks during the year ended December 31, 2018.
The estimated fair value of the 2014 Swaps, the 2015 Swaps and the 2018 Treasury Locks was determined using the market standard methodology of netting the discounted fixed cash payments and the discounted expected variable cash receipts. The variable cash receipts are based on an expectation of interest rates (forward curves) derived from observable market interest rate curves. In addition, credit valuation adjustments are incorporated in the fair value to account for potential non-performance risk, including our own non-performance risk and the respective counterparty's non-performance risk. We determined that the significant inputs used to value the 2014 Swaps, the 2015 Swaps and the 2018 Treasury Locks fell within Level 2 of the fair value hierarchy.
13. Related Party Transactions
During the year ended December 31, 2018, we recognized fees of
$113
from the Joint Venture related to asset management services provided to the Joint Venture. At December 31, 2018, we had a receivable from the Joint Venture of
$38
.
At December 31, 2018 and 2017, the Operating Partnership had receivable balances of
$10,118
and
$10,129
, respectively, from a direct wholly-owned subsidiary of the Company.
83
14. Commitments and Contingencies
In the normal course of business, we are involved in legal actions arising from the ownership of our industrial properties. In our opinion, the liabilities, if any, that may ultimately result from such legal actions are not expected to have a materially adverse effect on our consolidated financial position, operations or liquidity.
Five
properties have leases granting the tenants options to purchase the property. Such options are exercisable at various times at appraised fair market value or at a fixed purchase price. None of the tenant purchase options have been exercised.
At December 31, 2018, we had outstanding letters of credit and performance bonds in the aggregate amount of
$18,573
.
In conjunction with the development of industrial properties, we have entered into agreements with general contractors for the construction of industrial properties. At December 31, 2018, we had
seven
industrial properties totaling approximately
2.8
million square feet of GLA under construction. The estimated total investment as of December 31, 2018 is approximately
$189,400
(unaudited). Of this amount, approximately
$140,300
(unaudited) remains to be funded. There can be no assurance that the actual completion cost will not exceed the estimated total investment.
Ground and Operating Lease Commitments
For the years ended December 31, 2018, 2017 and 2016, we recognized
$1,566
,
$1,419
and
$1,380
, respectively, in operating and ground lease expense.
Future minimum rental payments under the terms of all non-cancelable ground and operating leases under which we are the lessee as of December 31, 2018 are as follows:
|
2019
|
$
|
1,464
|
|
|
2020
|
1,536
|
|
|
|
2021
|
1,503
|
|
|
|
2022
|
1,465
|
|
|
|
2023
|
1,329
|
|
|
|
Thereafter
|
29,025
|
|
|
|
Total
|
$
|
36,322
|
|
15. Subsequent Events
On January 25, 2019 we acquired
one
land parcel for a purchase price of
$1,760
, excluding costs incurred in conjunction with the acquisition.
On February 4, 2019 we acquired
one
industrial property for a purchase price of
$12,258
, excluding costs incurred in conjunction with the acquisition.
84
16. Quarterly Financial Information (unaudited)
The following tables summarize the Company's unaudited quarterly financial information for each of the years ended December 31, 2018 and 2017.
|
|
Year Ended December 31, 2018
|
||||||||||||||
|
|
First
Quarter
|
Second
Quarter
|
Third
Quarter
|
Fourth
Quarter
|
|||||||||||
|
Total Revenues
|
$
|
99,771
|
|
$
|
98,845
|
|
$
|
100,256
|
|
$
|
105,082
|
|
|||
|
Net Income Available to First Industrial Realty Trust, Inc.'s Common Stockholders and Participating Securities
|
$
|
36,292
|
|
$
|
45,209
|
|
$
|
30,911
|
|
$
|
50,827
|
|
|||
|
Net Income Allocable to Participating Securities
|
(97
|
)
|
(151
|
)
|
(101
|
)
|
(164
|
)
|
|||||||
|
Net Income Available to First Industrial Realty Trust, Inc.'s Common Stockholders
|
$
|
36,195
|
|
$
|
45,058
|
|
$
|
30,810
|
|
$
|
50,663
|
|
|||
|
Basic EPS:
|
|||||||||||||||
|
Net Income Available to First Industrial Realty Trust, Inc.'s Common Stockholders
|
$
|
0.30
|
|
$
|
0.36
|
|
$
|
0.24
|
|
$
|
0.40
|
|
|||
|
Diluted EPS:
|
|||||||||||||||
|
Net Income Available to First Industrial Realty Trust, Inc.'s Common Stockholders
|
$
|
0.30
|
|
$
|
0.36
|
|
$
|
0.24
|
|
$
|
0.40
|
|
|||
|
Weighted Average Shares Basic/Diluted (In Thousands):
|
|||||||||||||||
|
Weighted Average Shares - Basic
|
119,846
|
|
123,616
|
|
125,768
|
|
125,897
|
|
|||||||
|
Weighted Average Shares - Diluted
|
120,211
|
|
124,085
|
|
126,130
|
|
126,249
|
|
|||||||
|
|
Year Ended December 31, 2017
|
||||||||||||||
|
|
First
Quarter
|
Second
Quarter
|
Third
Quarter
|
Fourth
Quarter
|
|||||||||||
|
Total Revenues
|
$
|
97,383
|
|
$
|
97,579
|
|
$
|
99,310
|
|
$
|
102,130
|
|
|||
|
Net Income Available to First Industrial Realty Trust, Inc.'s Common Stockholders and Participating Securities
|
$
|
22,709
|
|
$
|
37,562
|
|
$
|
43,198
|
|
$
|
97,987
|
|
|||
|
Net Income Allocable to Participating Securities
|
(67
|
)
|
(129
|
)
|
(145
|
)
|
(331
|
)
|
|||||||
|
Net Income Available to First Industrial Realty Trust, Inc.'s Common Stockholders
|
$
|
22,642
|
|
$
|
37,433
|
|
$
|
43,053
|
|
$
|
97,656
|
|
|||
|
Basic EPS:
|
|
|
|
|
|||||||||||
|
Net Income Available to First Industrial Realty Trust, Inc.'s Common Stockholders
|
$
|
0.19
|
|
$
|
0.32
|
|
$
|
0.36
|
|
$
|
0.82
|
|
|||
|
Diluted EPS:
|
|
|
|
|
|||||||||||
|
Net Income Available to First Industrial Realty Trust, Inc.'s Common Stockholders
|
$
|
0.19
|
|
$
|
0.32
|
|
$
|
0.36
|
|
$
|
0.81
|
|
|||
|
Weighted Average Shares Basic/Diluted (In Thousands):
|
|||||||||||||||
|
Weighted Average Shares - Basic
|
116,837
|
|
117,299
|
|
119,446
|
|
119,462
|
|
|||||||
|
Weighted Average Shares - Diluted
|
117,261
|
|
117,779
|
|
119,990
|
|
120,076
|
|
|||||||
85
The following tables summarize the Operating Partnership's unaudited quarterly financial information for each of the years ended December 31, 2018 and 2017.
|
|
Year Ended December 31, 2018
|
||||||||||||||
|
|
First
Quarter
|
Second
Quarter
|
Third
Quarter
|
Fourth
Quarter
|
|||||||||||
|
Total Revenues
|
$
|
99,771
|
|
$
|
98,845
|
|
$
|
100,256
|
|
$
|
105,082
|
|
|||
|
Net Income Available to Unitholders and Participating Securities
|
$
|
37,443
|
|
$
|
46,382
|
|
$
|
31,508
|
|
$
|
51,913
|
|
|||
|
Net Income Allocable to Participating Securities
|
(97
|
)
|
(151
|
)
|
(101
|
)
|
(164
|
)
|
|||||||
|
Net Income Available to Unitholders
|
$
|
37,346
|
|
$
|
46,231
|
|
$
|
31,407
|
|
$
|
51,749
|
|
|||
|
Basic EPU:
|
|||||||||||||||
|
Net Income Available to Unitholders
|
$
|
0.30
|
|
$
|
0.36
|
|
$
|
0.24
|
|
$
|
0.40
|
|
|||
|
Diluted EPU:
|
|||||||||||||||
|
Net Income Available to Unitholders
|
$
|
0.30
|
|
$
|
0.36
|
|
$
|
0.24
|
|
$
|
0.40
|
|
|||
|
Weighted Average Units Basic/Diluted (In Thousands):
|
|||||||||||||||
|
Weighted Average Units - Basic
|
123,729
|
|
126,832
|
|
128,526
|
|
128,526
|
|
|||||||
|
Weighted Average Units - Diluted
|
124,094
|
|
127,301
|
|
128,888
|
|
128,878
|
|
|||||||
|
|
Year Ended December 31, 2017
|
||||||||||||||
|
|
First
Quarter
|
Second
Quarter
|
Third
Quarter
|
Fourth
Quarter
|
|||||||||||
|
Total Revenues
|
$
|
97,383
|
|
$
|
97,579
|
|
$
|
99,310
|
|
$
|
102,130
|
|
|||
|
Net Income Available to Unitholders and Participating Securities
|
$
|
23,464
|
|
$
|
38,827
|
|
$
|
44,613
|
|
$
|
101,254
|
|
|||
|
Net Income Allocable to Participating Securities
|
(66
|
)
|
(129
|
)
|
(145
|
)
|
(331
|
)
|
|||||||
|
Net Income Available to Unitholders
|
$
|
23,398
|
|
$
|
38,698
|
|
$
|
44,468
|
|
$
|
100,923
|
|
|||
|
Basic EPU:
|
|
|
|
|
|||||||||||
|
Net Income Available to Unitholders
|
$
|
0.19
|
|
$
|
0.32
|
|
$
|
0.36
|
|
$
|
0.82
|
|
|||
|
Diluted EPU:
|
|
|
|
|
|||||||||||
|
Net Income Available to Unitholders
|
$
|
0.19
|
|
$
|
0.32
|
|
$
|
0.36
|
|
$
|
0.81
|
|
|||
|
Weighted Average Units Basic/Diluted (In Thousands):
|
|||||||||||||||
|
Weighted Average Units - Basic
|
120,877
|
|
121,339
|
|
123,483
|
|
123,483
|
|
|||||||
|
Weighted Average Units - Diluted
|
121,301
|
|
121,819
|
|
124,027
|
|
124,097
|
|
|||||||
86
|
FIRST INDUSTRIAL REALTY TRUST, INC. AND FIRST INDUSTRIAL, L.P.
SCHEDULE III: REAL ESTATE AND ACCUMULATED DEPRECIATION
As of December 31, 2018
|
||||||||||||||||||||||||||||
|
|
|
|
|
Initial Cost
|
Costs
Capitalized
Subsequent to
Acquisition or
Completion
and Valuation
Provision
|
Gross Amount Carried
At Close of Period 12/31/18 |
Year
Acquired/
Constructed
|
|||||||||||||||||||||
|
Building Address
|
|
Location
(City/State)
|
(a)
Encumbrances
|
Land
|
Buildings and
Improvements
|
Land
|
Buildings and
Improvements
|
Total
|
Accumulated
Depreciation
12/31/2018
|
|||||||||||||||||||
|
Properties (b)
|
|
|
(In thousands)
|
|
||||||||||||||||||||||||
|
Atlanta
|
||||||||||||||||||||||||||||
|
1650 Highway 155
|
McDonough, GA
|
—
|
|
779
|
|
4,544
|
|
(669
|
)
|
345
|
|
4,309
|
|
4,654
|
|
2,573
|
|
1994
|
||||||||||
|
4051 Southmeadow Parkway
|
Atlanta, GA
|
—
|
|
726
|
|
4,130
|
|
1,666
|
|
726
|
|
5,796
|
|
6,522
|
|
3,072
|
|
1994
|
||||||||||
|
4071 Southmeadow Parkway
|
Atlanta, GA
|
—
|
|
750
|
|
4,460
|
|
1,929
|
|
828
|
|
6,311
|
|
7,139
|
|
3,522
|
|
1994
|
||||||||||
|
4081 Southmeadow Parkway
|
Atlanta, GA
|
—
|
|
1,012
|
|
5,918
|
|
2,088
|
|
1,157
|
|
7,861
|
|
9,018
|
|
4,320
|
|
1994
|
||||||||||
|
5570 Tulane Drive
|
Atlanta, GA
|
2,055
|
|
527
|
|
2,984
|
|
1,255
|
|
546
|
|
4,220
|
|
4,766
|
|
2,114
|
|
1996
|
||||||||||
|
955 Cobb Place
|
Kennesaw, GA
|
2,688
|
|
780
|
|
4,420
|
|
1,032
|
|
804
|
|
5,428
|
|
6,232
|
|
2,783
|
|
1997
|
||||||||||
|
1005 Sigman Road
|
Conyers, GA
|
2,125
|
|
566
|
|
3,134
|
|
1,226
|
|
574
|
|
4,352
|
|
4,926
|
|
1,804
|
|
1999
|
||||||||||
|
2050 East Park Drive
|
Conyers, GA
|
—
|
|
452
|
|
2,504
|
|
860
|
|
459
|
|
3,357
|
|
3,816
|
|
1,476
|
|
1999
|
||||||||||
|
3060 South Park Blvd
|
Ellenwood, GA
|
—
|
|
1,600
|
|
12,464
|
|
3,202
|
|
1,604
|
|
15,662
|
|
17,266
|
|
5,925
|
|
2003
|
||||||||||
|
175 Greenwood Industrial Parkway
|
McDonough, GA
|
3,987
|
|
1,550
|
|
—
|
|
7,695
|
|
1,550
|
|
7,695
|
|
9,245
|
|
2,824
|
|
2004
|
||||||||||
|
5095 Phillip Lee Drive
|
Atlanta, GA
|
—
|
|
735
|
|
3,627
|
|
447
|
|
740
|
|
4,069
|
|
4,809
|
|
3,405
|
|
2005
|
||||||||||
|
6514 Warren Drive
|
Norcross, GA
|
—
|
|
510
|
|
1,250
|
|
127
|
|
513
|
|
1,374
|
|
1,887
|
|
610
|
|
2005
|
||||||||||
|
6544 Warren Drive
|
Norcross, GA
|
—
|
|
711
|
|
2,310
|
|
332
|
|
715
|
|
2,638
|
|
3,353
|
|
1,309
|
|
2005
|
||||||||||
|
5356 E. Ponce De Leon
|
Stone Mountain, GA
|
—
|
|
604
|
|
3,888
|
|
572
|
|
610
|
|
4,454
|
|
5,064
|
|
2,515
|
|
2005
|
||||||||||
|
5390 E. Ponce De Leon
|
Stone Mountain, GA
|
—
|
|
397
|
|
1,791
|
|
529
|
|
402
|
|
2,315
|
|
2,717
|
|
1,053
|
|
2005
|
||||||||||
|
1755 Enterprise Drive
|
Buford, GA
|
1,127
|
|
712
|
|
2,118
|
|
(217
|
)
|
716
|
|
1,897
|
|
2,613
|
|
890
|
|
2006
|
||||||||||
|
4555 Atwater Court
|
Buford, GA
|
1,980
|
|
881
|
|
3,550
|
|
161
|
|
885
|
|
3,707
|
|
4,592
|
|
1,517
|
|
2006
|
||||||||||
|
80 Liberty Industrial Parkway
|
McDonough, GA
|
—
|
|
756
|
|
3,695
|
|
(1,560
|
)
|
467
|
|
2,424
|
|
2,891
|
|
1,037
|
|
2007
|
||||||||||
|
596 Bonnie Valentine
|
Pendergrass, GA
|
—
|
|
2,580
|
|
21,730
|
|
2,890
|
|
2,594
|
|
24,606
|
|
27,200
|
|
7,718
|
|
2007
|
||||||||||
|
11415 Old Roswell Road
|
Alpharetta, GA
|
—
|
|
2,403
|
|
1,912
|
|
808
|
|
2,428
|
|
2,695
|
|
5,123
|
|
1,032
|
|
2008
|
||||||||||
|
1281 Highway 155 S.
|
McDonough, GA
|
—
|
|
2,501
|
|
—
|
|
17,056
|
|
2,502
|
|
17,055
|
|
19,557
|
|
1,149
|
|
2016
|
||||||||||
|
Baltimore
|
||||||||||||||||||||||||||||
|
22520 Randolph Drive
|
Dulles, VA
|
—
|
|
3,200
|
|
8,187
|
|
187
|
|
3,208
|
|
8,366
|
|
11,574
|
|
2,466
|
|
2004
|
||||||||||
|
22630 Dulles Summit Court
|
Dulles, VA
|
—
|
|
2,200
|
|
9,346
|
|
(903
|
)
|
2,206
|
|
8,437
|
|
10,643
|
|
2,723
|
|
2004
|
||||||||||
|
11204 McCormick Road
|
Hunt Valley, MD
|
—
|
|
1,017
|
|
3,132
|
|
195
|
|
1,038
|
|
3,306
|
|
4,344
|
|
1,776
|
|
2005
|
||||||||||
|
11110 Pepper Road
|
Hunt Valley, MD
|
—
|
|
918
|
|
2,529
|
|
476
|
|
938
|
|
2,985
|
|
3,923
|
|
1,470
|
|
2005
|
||||||||||
|
11100-11120 Gilroy Road
|
Hunt Valley, MD
|
—
|
|
901
|
|
1,455
|
|
67
|
|
919
|
|
1,504
|
|
2,423
|
|
762
|
|
2005
|
||||||||||
|
10709 Gilroy Road
|
Hunt Valley, MD
|
1,777
|
|
913
|
|
2,705
|
|
(86
|
)
|
913
|
|
2,619
|
|
3,532
|
|
1,740
|
|
2005
|
||||||||||
|
10707 Gilroy Road
|
Hunt Valley, MD
|
—
|
|
1,111
|
|
3,819
|
|
795
|
|
1,136
|
|
4,589
|
|
5,725
|
|
2,402
|
|
2005
|
||||||||||
|
38 Loveton Circle
|
Sparks, MD
|
—
|
|
1,648
|
|
2,151
|
|
(192
|
)
|
1,690
|
|
1,917
|
|
3,607
|
|
1,051
|
|
2005
|
||||||||||
S-1
|
FIRST INDUSTRIAL REALTY TRUST, INC. AND FIRST INDUSTRIAL, L.P.
SCHEDULE III: REAL ESTATE AND ACCUMULATED DEPRECIATION
as of December 31, 2018
|
||||||||||||||||||||||||||||
|
|
|
|
|
Initial Cost
|
Costs
Capitalized
Subsequent to
Acquisition or
Completion
and Valuation
Provision
|
Gross Amount Carried
At Close of Period 12/31/18 |
Year
Acquired/
Constructed
|
|||||||||||||||||||||
|
Building Address
|
|
Location
(City/State)
|
(a)
Encumbrances
|
Land
|
Buildings and
Improvements
|
Land
|
Buildings and
Improvements
|
Total
|
Accumulated
Depreciation
12/31/2018
|
|||||||||||||||||||
|
|
|
|
(In thousands)
|
|
||||||||||||||||||||||||
|
1225 Bengies Road
|
Baltimore, MD
|
—
|
|
2,640
|
|
270
|
|
13,331
|
|
2,823
|
|
13,418
|
|
16,241
|
|
4,486
|
|
2008
|
||||||||||
|
400 Old Post Road
|
Aberdeen, MD
|
—
|
|
3,411
|
|
17,144
|
|
1,514
|
|
3,411
|
|
18,658
|
|
22,069
|
|
2,614
|
|
2015
|
||||||||||
|
500 Old Post Road
|
Aberdeen, MD
|
—
|
|
5,959
|
|
30,533
|
|
146
|
|
5,959
|
|
30,679
|
|
36,638
|
|
3,926
|
|
2015
|
||||||||||
|
Central/Eastern Pennsylvania
|
|
|
|
|
|
|
|
|
|
|
||||||||||||||||||
|
1214-B Freedom Road
|
Cranberry Township, PA
|
—
|
|
31
|
|
994
|
|
613
|
|
200
|
|
1,438
|
|
1,638
|
|
1,385
|
|
1994
|
||||||||||
|
401 Russell Drive
|
Middletown, PA
|
—
|
|
262
|
|
857
|
|
1,829
|
|
287
|
|
2,661
|
|
2,948
|
|
2,243
|
|
1994
|
||||||||||
|
2700 Commerce Drive
|
Middletown, PA
|
—
|
|
196
|
|
997
|
|
800
|
|
206
|
|
1,787
|
|
1,993
|
|
1,587
|
|
1994
|
||||||||||
|
2701 Commerce Drive
|
Middletown, PA
|
—
|
|
141
|
|
859
|
|
1,399
|
|
164
|
|
2,235
|
|
2,399
|
|
1,692
|
|
1994
|
||||||||||
|
2780 Commerce Drive
|
Middletown, PA
|
—
|
|
113
|
|
743
|
|
1,209
|
|
209
|
|
1,856
|
|
2,065
|
|
1,604
|
|
1994
|
||||||||||
|
350 Old Silver Spring Road
|
Mechanicsburg, PA
|
—
|
|
510
|
|
2,890
|
|
5,936
|
|
541
|
|
8,795
|
|
9,336
|
|
4,223
|
|
1997
|
||||||||||
|
16522 Hunters Green Parkway
|
Hagerstown, MD
|
—
|
|
1,390
|
|
13,104
|
|
5,656
|
|
1,863
|
|
18,287
|
|
20,150
|
|
6,151
|
|
2003
|
||||||||||
|
18212 Shawley Drive
|
Hagerstown, MD
|
—
|
|
1,000
|
|
5,847
|
|
2,800
|
|
1,016
|
|
8,631
|
|
9,647
|
|
2,544
|
|
2004
|
||||||||||
|
37 Valley View Drive
|
Jessup, PA
|
—
|
|
542
|
|
—
|
|
3,205
|
|
532
|
|
3,215
|
|
3,747
|
|
1,099
|
|
2004
|
||||||||||
|
14 McFadden Road
|
Palmer, PA
|
—
|
|
600
|
|
1,349
|
|
(274
|
)
|
625
|
|
1,050
|
|
1,675
|
|
401
|
|
2004
|
||||||||||
|
431 Railroad Avenue
|
Shiremanstown, PA
|
—
|
|
1,293
|
|
7,164
|
|
2,035
|
|
1,341
|
|
9,151
|
|
10,492
|
|
5,281
|
|
2005
|
||||||||||
|
6951 Allentown Blvd
|
Harrisburg, PA
|
—
|
|
585
|
|
3,176
|
|
(27
|
)
|
601
|
|
3,133
|
|
3,734
|
|
1,324
|
|
2005
|
||||||||||
|
320 Reliance Road
|
Washington, PA
|
—
|
|
201
|
|
1,819
|
|
(348
|
)
|
178
|
|
1,494
|
|
1,672
|
|
943
|
|
2005
|
||||||||||
|
2801 Red Lion Road
|
Philadelphia, PA
|
—
|
|
950
|
|
5,916
|
|
7
|
|
964
|
|
5,909
|
|
6,873
|
|
3,168
|
|
2005
|
||||||||||
|
1351 Eisenhower Blvd., Bldg. 1
|
Harrisburg, PA
|
—
|
|
382
|
|
2,343
|
|
3
|
|
387
|
|
2,341
|
|
2,728
|
|
855
|
|
2006
|
||||||||||
|
1351 Eisenhower Blvd., Bldg. 2
|
Harrisburg, PA
|
—
|
|
436
|
|
1,587
|
|
(233
|
)
|
443
|
|
1,347
|
|
1,790
|
|
513
|
|
2006
|
||||||||||
|
200 Cascade Drive, Bldg. 1
|
Allentown, PA
|
—
|
|
2,133
|
|
17,562
|
|
338
|
|
2,769
|
|
17,264
|
|
20,033
|
|
7,704
|
|
2007
|
||||||||||
|
200 Cascade Drive, Bldg. 2
|
Allentown, PA
|
—
|
|
310
|
|
2,268
|
|
68
|
|
316
|
|
2,330
|
|
2,646
|
|
907
|
|
2007
|
||||||||||
|
1490 Dennison Circle
|
Carlisle, PA
|
—
|
|
1,500
|
|
—
|
|
13,198
|
|
2,341
|
|
12,357
|
|
14,698
|
|
3,816
|
|
2008
|
||||||||||
|
298 First Avenue
|
Covington Twp, PA
|
—
|
|
7,022
|
|
—
|
|
57,053
|
|
7,019
|
|
57,056
|
|
64,075
|
|
14,712
|
|
2008
|
||||||||||
|
225 Cross Farm Lane
|
York, PA
|
—
|
|
4,718
|
|
—
|
|
23,163
|
|
4,715
|
|
23,166
|
|
27,881
|
|
6,520
|
|
2008
|
||||||||||
|
6300 Bristol Pike
|
Levittown, PA
|
—
|
|
1,074
|
|
2,642
|
|
(110
|
)
|
964
|
|
2,642
|
|
3,606
|
|
2,276
|
|
2008
|
||||||||||
|
2455 Boulevard of Generals
|
Norristown, PA
|
2,997
|
|
1,200
|
|
4,800
|
|
950
|
|
1,226
|
|
5,724
|
|
6,950
|
|
2,370
|
|
2008
|
||||||||||
|
105 Steamboat Blvd
|
Manchester, PA
|
—
|
|
4,085
|
|
14,464
|
|
11
|
|
4,070
|
|
14,490
|
|
18,560
|
|
4,034
|
|
2012
|
||||||||||
|
20 Leo Lane
|
York County, PA
|
—
|
|
6,884
|
|
—
|
|
27,480
|
|
6,889
|
|
27,475
|
|
34,364
|
|
3,411
|
|
2013
|
||||||||||
|
3895 Eastgate Blvd, Bldg. A
|
Easton, PA
|
—
|
|
4,855
|
|
—
|
|
17,824
|
|
4,388
|
|
18,291
|
|
22,679
|
|
1,637
|
|
2015
|
||||||||||
|
3895 Eastgate Blvd, Bldg. B
|
Easton, PA
|
—
|
|
3,459
|
|
—
|
|
13,818
|
|
3,128
|
|
14,149
|
|
17,277
|
|
1,419
|
|
2015
|
||||||||||
|
112 Bordnersville Road
|
Jonestown, PA
|
—
|
|
13,702
|
|
—
|
|
30,341
|
|
13,724
|
|
30,319
|
|
44,043
|
|
179
|
|
2018
|
||||||||||
S-2
|
FIRST INDUSTRIAL REALTY TRUST, INC. AND FIRST INDUSTRIAL, L.P.
SCHEDULE III: REAL ESTATE AND ACCUMULATED DEPRECIATION As of December 31, 2018 |
||||||||||||||||||||||||||||
|
|
|
|
|
Initial Cost
|
Costs
Capitalized
Subsequent to
Acquisition or
Completion
and Valuation
Provision
|
Gross Amount Carried
At Close of Period 12/31/18 |
Year
Acquired/
Constructed
|
|||||||||||||||||||||
|
Building Address
|
|
Location
(City/State)
|
(a)
Encumbrances
|
Land
|
Buildings and
Improvements
|
Land
|
Buildings and
Improvements
|
Total
|
Accumulated
Depreciation 12/31/2018 |
|||||||||||||||||||
|
|
|
|
(In thousands)
|
|
||||||||||||||||||||||||
|
122 Bordnersville Road
|
Jonestown, PA
|
—
|
|
3,165
|
|
—
|
|
10,937
|
|
3,171
|
|
10,931
|
|
14,102
|
|
—
|
|
2018
|
||||||||||
|
Chicago
|
|
|
||||||||||||||||||||||||||
|
720-730 Landwehr Drive
|
Northbrook, IL
|
—
|
|
521
|
|
2,982
|
|
911
|
|
521
|
|
3,893
|
|
4,414
|
|
2,201
|
|
1994
|
||||||||||
|
1385 101st Street
|
Lemont, IL
|
3,465
|
|
967
|
|
5,554
|
|
1,513
|
|
968
|
|
7,066
|
|
8,034
|
|
3,907
|
|
1994
|
||||||||||
|
2300 Windsor Court
|
Addison, IL
|
—
|
|
688
|
|
3,943
|
|
761
|
|
696
|
|
4,696
|
|
5,392
|
|
2,660
|
|
1994
|
||||||||||
|
305-311 Era Drive
|
Northbrook, IL
|
—
|
|
200
|
|
1,154
|
|
1,299
|
|
205
|
|
2,448
|
|
2,653
|
|
1,128
|
|
1994
|
||||||||||
|
800 Business Drive
|
Mount Prospect, IL
|
—
|
|
631
|
|
3,493
|
|
328
|
|
666
|
|
3,786
|
|
4,452
|
|
1,720
|
|
2000
|
||||||||||
|
580 Slawin Court
|
Mount Prospect, IL
|
716
|
|
233
|
|
1,292
|
|
(27
|
)
|
162
|
|
1,336
|
|
1,498
|
|
735
|
|
2000
|
||||||||||
|
1005 101st Street
|
Lemont, IL
|
4,761
|
|
1,200
|
|
6,643
|
|
1,619
|
|
1,220
|
|
8,242
|
|
9,462
|
|
3,321
|
|
2001
|
||||||||||
|
175 Wall Street
|
Glendale Heights, IL
|
1,509
|
|
427
|
|
2,363
|
|
709
|
|
433
|
|
3,066
|
|
3,499
|
|
1,113
|
|
2002
|
||||||||||
|
251 Airport Road
|
North Aurora, IL
|
3,491
|
|
983
|
|
—
|
|
6,403
|
|
983
|
|
6,403
|
|
7,386
|
|
2,485
|
|
2002
|
||||||||||
|
400 Crossroads Pkwy
|
Bolingbrook, IL
|
5,108
|
|
1,178
|
|
9,453
|
|
1,212
|
|
1,181
|
|
10,662
|
|
11,843
|
|
4,568
|
|
2005
|
||||||||||
|
7801 W. Industrial Drive
|
Forest Park, IL
|
—
|
|
1,215
|
|
3,020
|
|
1,314
|
|
1,220
|
|
4,329
|
|
5,549
|
|
2,061
|
|
2005
|
||||||||||
|
725 Kimberly Drive
|
Carol Stream, IL
|
—
|
|
793
|
|
1,395
|
|
255
|
|
801
|
|
1,642
|
|
2,443
|
|
894
|
|
2005
|
||||||||||
|
17001 S. Vincennes
|
Thornton, IL
|
—
|
|
497
|
|
504
|
|
3
|
|
513
|
|
491
|
|
1,004
|
|
417
|
|
2005
|
||||||||||
|
2900 W. 166th Street
|
Markham, IL
|
—
|
|
1,132
|
|
4,293
|
|
(881
|
)
|
1,134
|
|
3,410
|
|
4,544
|
|
1,275
|
|
2007
|
||||||||||
|
555 W. Algonquin Road
|
Arlington Heights, IL
|
1,849
|
|
574
|
|
741
|
|
1,951
|
|
579
|
|
2,687
|
|
3,266
|
|
1,086
|
|
2007
|
||||||||||
|
1501 Oakton Street
|
Elk Grove Village, IL
|
4,843
|
|
3,369
|
|
6,121
|
|
134
|
|
3,482
|
|
6,142
|
|
9,624
|
|
2,128
|
|
2008
|
||||||||||
|
16500 W. 103rd Street
|
Woodridge, IL
|
—
|
|
744
|
|
2,458
|
|
487
|
|
762
|
|
2,927
|
|
3,689
|
|
1,089
|
|
2008
|
||||||||||
|
8505 50th Street
|
Kenosha, WI
|
—
|
|
3,212
|
|
—
|
|
32,956
|
|
3,212
|
|
32,956
|
|
36,168
|
|
9,086
|
|
2008
|
||||||||||
|
4100 Rock Creek Blvd
|
Joliet, IL
|
—
|
|
4,476
|
|
16,061
|
|
807
|
|
4,476
|
|
16,868
|
|
21,344
|
|
3,744
|
|
2013
|
||||||||||
|
10100 58th Place
|
Kenosha, WI
|
—
|
|
4,201
|
|
17,604
|
|
74
|
|
4,201
|
|
17,678
|
|
21,879
|
|
3,836
|
|
2013
|
||||||||||
|
401 Airport Road
|
North Aurora, IL
|
—
|
|
534
|
|
1,957
|
|
12
|
|
534
|
|
1,969
|
|
2,503
|
|
381
|
|
2014
|
||||||||||
|
3737 84th Avenue
|
Somers, WI
|
—
|
|
1,943
|
|
—
|
|
24,116
|
|
1,943
|
|
24,116
|
|
26,059
|
|
1,652
|
|
2016
|
||||||||||
|
81 Paragon Drive
|
Romeoville, IL
|
—
|
|
1,787
|
|
7,252
|
|
1,340
|
|
1,787
|
|
8,592
|
|
10,379
|
|
678
|
|
2016
|
||||||||||
|
10680 88th Avenue
|
Pleasant Prairie, WI
|
—
|
|
1,376
|
|
4,757
|
|
—
|
|
1,376
|
|
4,757
|
|
6,133
|
|
234
|
|
2017
|
||||||||||
|
8725 31st Street
|
Somers, WI
|
—
|
|
2,133
|
|
—
|
|
26,451
|
|
2,134
|
|
26,450
|
|
28,584
|
|
1,467
|
|
2017
|
||||||||||
|
3500 Channahon Road
|
Joliet, IL
|
—
|
|
2,595
|
|
—
|
|
16,729
|
|
2,598
|
|
16,726
|
|
19,324
|
|
141
|
|
2018
|
||||||||||
|
Cincinnati
|
||||||||||||||||||||||||||||
|
4700-4750 Creek Road
|
Blue Ash, OH
|
—
|
|
1,080
|
|
6,118
|
|
1,508
|
|
1,109
|
|
7,597
|
|
8,706
|
|
3,954
|
|
1996
|
||||||||||
|
4436 Muhlhauser Road
|
Hamilton, OH
|
—
|
|
630
|
|
—
|
|
5,294
|
|
630
|
|
5,294
|
|
5,924
|
|
2,102
|
|
2002
|
||||||||||
|
4438 Muhlhauser Road
|
Hamilton, OH
|
—
|
|
779
|
|
—
|
|
6,407
|
|
779
|
|
6,407
|
|
7,186
|
|
2,606
|
|
2002
|
||||||||||
|
420 Wards Corner Road
|
Loveland, OH
|
—
|
|
600
|
|
1,083
|
|
1,165
|
|
606
|
|
2,242
|
|
2,848
|
|
944
|
|
2003
|
||||||||||
S-3
|
FIRST INDUSTRIAL REALTY TRUST, INC. AND FIRST INDUSTRIAL, L.P.
SCHEDULE III: REAL ESTATE AND ACCUMULATED DEPRECIATION As of December 31, 2018 |
||||||||||||||||||||||||||||
|
|
|
|
|
Initial Cost
|
Costs
Capitalized
Subsequent to
Acquisition or
Completion
and Valuation
Provision
|
Gross Amount Carried
At Close of Period 12/31/18 |
Year
Acquired/
Constructed
|
|||||||||||||||||||||
|
Building Address
|
|
Location
(City/State)
|
(a)
Encumbrances
|
Land
|
Buildings and
Improvements
|
Land
|
Buildings and
Improvements
|
Total
|
Accumulated
Depreciation 12/31/2018 |
|||||||||||||||||||
|
|
|
|
(In thousands)
|
|
||||||||||||||||||||||||
|
422 Wards Corner Road
|
Loveland, OH
|
—
|
|
600
|
|
1,811
|
|
443
|
|
592
|
|
2,262
|
|
2,854
|
|
878
|
|
2003
|
||||||||||
|
4663 Dues Drive
|
Westchester, OH
|
—
|
|
858
|
|
2,273
|
|
606
|
|
875
|
|
2,862
|
|
3,737
|
|
1,859
|
|
2005
|
||||||||||
|
9345 Princeton-Glendale Road
|
Westchester, OH
|
1,228
|
|
818
|
|
1,648
|
|
380
|
|
840
|
|
2,006
|
|
2,846
|
|
1,678
|
|
2006
|
||||||||||
|
9525 Glades Drive
|
Westchester, OH
|
—
|
|
347
|
|
1,323
|
|
240
|
|
355
|
|
1,555
|
|
1,910
|
|
669
|
|
2007
|
||||||||||
|
9774-9792 Windisch Road
|
Westchester, OH
|
—
|
|
392
|
|
1,744
|
|
163
|
|
394
|
|
1,905
|
|
2,299
|
|
534
|
|
2007
|
||||||||||
|
9808-9830 Windisch Road
|
Westchester, OH
|
—
|
|
395
|
|
2,541
|
|
447
|
|
397
|
|
2,986
|
|
3,383
|
|
1,063
|
|
2007
|
||||||||||
|
9842-9862 Windisch Road
|
Westchester, OH
|
—
|
|
506
|
|
3,148
|
|
202
|
|
508
|
|
3,348
|
|
3,856
|
|
1,165
|
|
2007
|
||||||||||
|
9872-9898 Windisch Road
|
Westchester, OH
|
—
|
|
546
|
|
3,039
|
|
285
|
|
548
|
|
3,322
|
|
3,870
|
|
1,254
|
|
2007
|
||||||||||
|
9902-9922 Windisch Road
|
Westchester, OH
|
—
|
|
623
|
|
4,003
|
|
1,104
|
|
627
|
|
5,103
|
|
5,730
|
|
2,408
|
|
2007
|
||||||||||
|
Cleveland
|
||||||||||||||||||||||||||||
|
30311 Emerald Valley Parkway
|
Glenwillow, OH
|
6,203
|
|
681
|
|
11,838
|
|
603
|
|
691
|
|
12,431
|
|
13,122
|
|
5,315
|
|
2006
|
||||||||||
|
30333 Emerald Valley Parkway
|
Glenwillow, OH
|
—
|
|
466
|
|
5,447
|
|
(615
|
)
|
475
|
|
4,823
|
|
5,298
|
|
1,898
|
|
2006
|
||||||||||
|
7800 Cochran Road
|
Glenwillow, OH
|
3,598
|
|
972
|
|
7,033
|
|
338
|
|
991
|
|
7,352
|
|
8,343
|
|
3,145
|
|
2006
|
||||||||||
|
7900 Cochran Road
|
Glenwillow, OH
|
3,382
|
|
775
|
|
6,244
|
|
137
|
|
792
|
|
6,364
|
|
7,156
|
|
2,789
|
|
2006
|
||||||||||
|
7905 Cochran Road
|
Glenwillow, OH
|
3,627
|
|
920
|
|
6,174
|
|
114
|
|
922
|
|
6,286
|
|
7,208
|
|
2,464
|
|
2006
|
||||||||||
|
8181 Darrow Road
|
Twinsburg, OH
|
—
|
|
2,478
|
|
6,791
|
|
465
|
|
2,496
|
|
7,238
|
|
9,734
|
|
3,825
|
|
2008
|
||||||||||
|
Dallas/Ft. Worth
|
||||||||||||||||||||||||||||
|
2406-2416 Walnut Ridge
|
Dallas, TX
|
—
|
|
178
|
|
1,006
|
|
1,140
|
|
172
|
|
2,152
|
|
2,324
|
|
743
|
|
1997
|
||||||||||
|
2401-2419 Walnut Ridge
|
Dallas, TX
|
—
|
|
148
|
|
839
|
|
416
|
|
142
|
|
1,261
|
|
1,403
|
|
615
|
|
1997
|
||||||||||
|
900-906 Great Southwest Parkway
|
Arlington, TX
|
—
|
|
237
|
|
1,342
|
|
479
|
|
270
|
|
1,788
|
|
2,058
|
|
893
|
|
1997
|
||||||||||
|
3000 West Commerce
|
Dallas, TX
|
—
|
|
456
|
|
2,584
|
|
1,156
|
|
469
|
|
3,727
|
|
4,196
|
|
1,959
|
|
1997
|
||||||||||
|
405-407 113th
|
Arlington, TX
|
—
|
|
181
|
|
1,026
|
|
456
|
|
185
|
|
1,478
|
|
1,663
|
|
717
|
|
1997
|
||||||||||
|
816 111th Street
|
Arlington, TX
|
—
|
|
251
|
|
1,421
|
|
172
|
|
258
|
|
1,586
|
|
1,844
|
|
796
|
|
1997
|
||||||||||
|
1602-1654 Terre Colony
|
Dallas, TX
|
—
|
|
458
|
|
2,596
|
|
864
|
|
468
|
|
3,450
|
|
3,918
|
|
1,559
|
|
2000
|
||||||||||
|
2220 Merritt Drive
|
Garland, TX
|
—
|
|
352
|
|
1,993
|
|
407
|
|
316
|
|
2,436
|
|
2,752
|
|
987
|
|
2000
|
||||||||||
|
2485-2505 Merritt Drive
|
Garland, TX
|
—
|
|
431
|
|
2,440
|
|
546
|
|
443
|
|
2,974
|
|
3,417
|
|
1,282
|
|
2000
|
||||||||||
|
2110 Hutton Drive
|
Carrolton, TX
|
—
|
|
374
|
|
2,117
|
|
404
|
|
255
|
|
2,640
|
|
2,895
|
|
1,312
|
|
2001
|
||||||||||
|
2025 McKenzie Drive
|
Carrolton, TX
|
—
|
|
437
|
|
2,478
|
|
568
|
|
442
|
|
3,041
|
|
3,483
|
|
1,238
|
|
2001
|
||||||||||
|
2019 McKenzie Drive
|
Carrolton, TX
|
—
|
|
502
|
|
2,843
|
|
625
|
|
507
|
|
3,463
|
|
3,970
|
|
1,372
|
|
2001
|
||||||||||
|
2029-2035 McKenzie Drive
|
Carrolton, TX
|
—
|
|
306
|
|
1,870
|
|
356
|
|
306
|
|
2,226
|
|
2,532
|
|
928
|
|
2001
|
||||||||||
|
2015 McKenzie Drive
|
Carrolton, TX
|
1,830
|
|
510
|
|
2,891
|
|
471
|
|
516
|
|
3,356
|
|
3,872
|
|
1,497
|
|
2001
|
||||||||||
S-4
|
FIRST INDUSTRIAL REALTY TRUST, INC. AND FIRST INDUSTRIAL, L.P.
SCHEDULE III: REAL ESTATE AND ACCUMULATED DEPRECIATION As of December 31, 2018 |
||||||||||||||||||||||||||||
|
|
|
|
|
Initial Cost
|
Costs
Capitalized
Subsequent to
Acquisition or
Completion
and Valuation
Provision
|
Gross Amount Carried
At Close of Period 12/31/18 |
Year
Acquired/
Constructed
|
|||||||||||||||||||||
|
Building Address
|
|
Location
(City/State)
|
(a)
Encumbrances
|
Land
|
Buildings and
Improvements
|
Land
|
Buildings and
Improvements
|
Total
|
Accumulated
Depreciation 12/31/2018 |
|||||||||||||||||||
|
|
|
|
(In thousands)
|
|
||||||||||||||||||||||||
|
2009 McKenzie Drive
|
Carrolton, TX
|
1,734
|
|
476
|
|
2,699
|
|
494
|
|
481
|
|
3,188
|
|
3,669
|
|
1,389
|
|
2001
|
||||||||||
|
900-1100 Avenue S
|
Grand Prairie, TX
|
—
|
|
623
|
|
3,528
|
|
1,118
|
|
629
|
|
4,640
|
|
5,269
|
|
1,749
|
|
2002
|
||||||||||
|
Plano Crossing Bus. Park
|
Plano, TX
|
6,682
|
|
1,961
|
|
11,112
|
|
1,062
|
|
1,981
|
|
12,154
|
|
14,135
|
|
4,912
|
|
2002
|
||||||||||
|
825-827 Avenue H
|
Arlington, TX
|
2,012
|
|
600
|
|
3,006
|
|
393
|
|
604
|
|
3,395
|
|
3,999
|
|
1,703
|
|
2004
|
||||||||||
|
1013-31 Avenue M
|
Grand Prairie, TX
|
—
|
|
300
|
|
1,504
|
|
257
|
|
302
|
|
1,759
|
|
2,061
|
|
811
|
|
2004
|
||||||||||
|
1172-84 113th Street
|
Grand Prairie, TX
|
—
|
|
700
|
|
3,509
|
|
(40
|
)
|
704
|
|
3,465
|
|
4,169
|
|
1,393
|
|
2004
|
||||||||||
|
1200-16 Avenue H
|
Arlington, TX
|
—
|
|
600
|
|
2,846
|
|
852
|
|
604
|
|
3,694
|
|
4,298
|
|
1,412
|
|
2004
|
||||||||||
|
1322-66 W. North Carrier Parkway
|
Grand Prairie, TX
|
3,776
|
|
1,000
|
|
5,012
|
|
1,491
|
|
1,006
|
|
6,497
|
|
7,503
|
|
2,662
|
|
2004
|
||||||||||
|
2401-2407 Centennial Drive
|
Arlington, TX
|
1,781
|
|
600
|
|
2,534
|
|
634
|
|
604
|
|
3,164
|
|
3,768
|
|
1,485
|
|
2004
|
||||||||||
|
3111 West Commerce Street
|
Dallas, TX
|
3,111
|
|
1,000
|
|
3,364
|
|
1,818
|
|
1,011
|
|
5,171
|
|
6,182
|
|
2,483
|
|
2004
|
||||||||||
|
13800 Senlac Drive
|
Farmers Branch, TX
|
2,416
|
|
823
|
|
4,042
|
|
(63
|
)
|
825
|
|
3,977
|
|
4,802
|
|
2,003
|
|
2005
|
||||||||||
|
801-831 S Great Southwest Parkway
|
Grand Prairie, TX
|
—
|
|
2,581
|
|
16,556
|
|
367
|
|
2,586
|
|
16,918
|
|
19,504
|
|
11,279
|
|
2005
|
||||||||||
|
801 Heinz Way
|
Grand Prairie, TX
|
—
|
|
599
|
|
3,327
|
|
339
|
|
601
|
|
3,664
|
|
4,265
|
|
1,901
|
|
2005
|
||||||||||
|
901-937 Heinz Way
|
Grand Prairie, TX
|
—
|
|
493
|
|
2,758
|
|
56
|
|
481
|
|
2,826
|
|
3,307
|
|
1,628
|
|
2005
|
||||||||||
|
3301 Century Circle
|
Irving, TX
|
—
|
|
760
|
|
3,856
|
|
(142
|
)
|
771
|
|
3,703
|
|
4,474
|
|
1,260
|
|
2007
|
||||||||||
|
3901 W Miller Road
|
Garland, TX
|
—
|
|
1,912
|
|
—
|
|
15,135
|
|
1,947
|
|
15,100
|
|
17,047
|
|
4,926
|
|
2008
|
||||||||||
|
1251 North Cockrell Hill Road
|
Dallas, TX
|
—
|
|
2,064
|
|
—
|
|
13,553
|
|
1,073
|
|
14,544
|
|
15,617
|
|
1,625
|
|
2015
|
||||||||||
|
1171 North Cockrell Hill Road
|
Dallas, TX
|
—
|
|
1,215
|
|
—
|
|
10,972
|
|
632
|
|
11,555
|
|
12,187
|
|
1,171
|
|
2015
|
||||||||||
|
3996 Scientific Drive
|
Arlington, TX
|
—
|
|
1,301
|
|
—
|
|
8,082
|
|
1,349
|
|
8,034
|
|
9,383
|
|
1,147
|
|
2015
|
||||||||||
|
750 Gateway Boulevard
|
Coppell, TX
|
—
|
|
1,452
|
|
4,679
|
|
80
|
|
1,452
|
|
4,759
|
|
6,211
|
|
556
|
|
2015
|
||||||||||
|
2250 East Bardin Road
|
Arlington, TX
|
—
|
|
1,603
|
|
—
|
|
10,465
|
|
1,603
|
|
10,465
|
|
12,068
|
|
1,041
|
|
2016
|
||||||||||
|
Denver
|
||||||||||||||||||||||||||||
|
4785 Elati
|
Denver, CO
|
—
|
|
173
|
|
981
|
|
396
|
|
175
|
|
1,375
|
|
1,550
|
|
586
|
|
1997
|
||||||||||
|
4770 Fox Street
|
Denver, CO
|
—
|
|
132
|
|
750
|
|
321
|
|
134
|
|
1,069
|
|
1,203
|
|
492
|
|
1997
|
||||||||||
|
3851-3871 Revere
|
Denver, CO
|
—
|
|
361
|
|
2,047
|
|
483
|
|
368
|
|
2,523
|
|
2,891
|
|
1,291
|
|
1997
|
||||||||||
|
4570 Ivy Street
|
Denver, CO
|
—
|
|
219
|
|
1,239
|
|
111
|
|
220
|
|
1,349
|
|
1,569
|
|
702
|
|
1997
|
||||||||||
|
5855 Stapleton Drive North
|
Denver, CO
|
—
|
|
288
|
|
1,630
|
|
183
|
|
290
|
|
1,811
|
|
2,101
|
|
952
|
|
1997
|
||||||||||
|
5885 Stapleton Drive North
|
Denver, CO
|
—
|
|
376
|
|
2,129
|
|
327
|
|
380
|
|
2,452
|
|
2,832
|
|
1,285
|
|
1997
|
||||||||||
|
5977 North Broadway
|
Denver, CO
|
—
|
|
268
|
|
1,518
|
|
518
|
|
271
|
|
2,033
|
|
2,304
|
|
1,005
|
|
1997
|
||||||||||
|
5952-5978 North Broadway
|
Denver, CO
|
—
|
|
414
|
|
2,346
|
|
704
|
|
422
|
|
3,042
|
|
3,464
|
|
1,552
|
|
1997
|
||||||||||
|
4721 Ironton Street
|
Denver, CO
|
—
|
|
232
|
|
1,313
|
|
352
|
|
236
|
|
1,661
|
|
1,897
|
|
831
|
|
1997
|
||||||||||
S-5
|
FIRST INDUSTRIAL REALTY TRUST, INC. AND FIRST INDUSTRIAL, L.P.
SCHEDULE III: REAL ESTATE AND ACCUMULATED DEPRECIATION As of December 31, 2018 |
||||||||||||||||||||||||||||
|
|
|
|
|
Initial Cost
|
Costs
Capitalized
Subsequent to
Acquisition or
Completion
and Valuation
Provision
|
Gross Amount Carried
At Close of Period 12/31/18 |
Year
Acquired/
Constructed
|
|||||||||||||||||||||
|
Building Address
|
|
Location
(City/State)
|
(a)
Encumbrances
|
Land
|
Buildings and
Improvements
|
Land
|
Buildings and
Improvements
|
Total
|
Accumulated
Depreciation 12/31/2018 |
|||||||||||||||||||
|
|
|
|
(In thousands)
|
|
||||||||||||||||||||||||
|
7003 E 47th Ave Drive
|
Denver, CO
|
—
|
|
441
|
|
2,689
|
|
19
|
|
441
|
|
2,708
|
|
3,149
|
|
1,472
|
|
1997
|
||||||||||
|
9500 West 49th Street - A
|
Wheatridge, CO
|
992
|
|
283
|
|
1,625
|
|
189
|
|
287
|
|
1,810
|
|
2,097
|
|
947
|
|
1997
|
||||||||||
|
9500 West 49th Street - B
|
Wheatridge, CO
|
822
|
|
225
|
|
1,272
|
|
241
|
|
227
|
|
1,511
|
|
1,738
|
|
739
|
|
1997
|
||||||||||
|
9500 West 49th Street - C
|
Wheatridge, CO
|
2,131
|
|
600
|
|
3,409
|
|
498
|
|
601
|
|
3,906
|
|
4,507
|
|
2,022
|
|
1997
|
||||||||||
|
9500 West 49th Street - D
|
Wheatridge, CO
|
1,029
|
|
246
|
|
1,537
|
|
394
|
|
247
|
|
1,930
|
|
2,177
|
|
1,013
|
|
1997
|
||||||||||
|
451-591 East 124th Avenue
|
Thornton, CO
|
—
|
|
383
|
|
2,145
|
|
392
|
|
383
|
|
2,537
|
|
2,920
|
|
1,371
|
|
1997
|
||||||||||
|
6547 South Racine Circle
|
Centennial, CO
|
2,614
|
|
739
|
|
4,241
|
|
486
|
|
739
|
|
4,727
|
|
5,466
|
|
2,384
|
|
1997
|
||||||||||
|
11701 East 53rd Avenue
|
Denver, CO
|
—
|
|
416
|
|
2,355
|
|
297
|
|
422
|
|
2,646
|
|
3,068
|
|
1,372
|
|
1997
|
||||||||||
|
5401 Oswego
|
Denver, CO
|
—
|
|
273
|
|
1,547
|
|
234
|
|
278
|
|
1,776
|
|
2,054
|
|
942
|
|
1997
|
||||||||||
|
445 Bryant Street
|
Denver, CO
|
7,511
|
|
1,829
|
|
10,219
|
|
2,878
|
|
1,829
|
|
13,097
|
|
14,926
|
|
6,083
|
|
1998
|
||||||||||
|
12055 E 49th Ave/4955 Peoria
|
Denver, CO
|
—
|
|
298
|
|
1,688
|
|
505
|
|
305
|
|
2,186
|
|
2,491
|
|
1,066
|
|
1998
|
||||||||||
|
4940-4950 Paris
|
Denver, CO
|
—
|
|
152
|
|
861
|
|
260
|
|
156
|
|
1,117
|
|
1,273
|
|
529
|
|
1998
|
||||||||||
|
7367 South Revere Parkway
|
Centennial, CO
|
—
|
|
926
|
|
5,124
|
|
1,196
|
|
934
|
|
6,312
|
|
7,246
|
|
3,114
|
|
1998
|
||||||||||
|
8200 East Park Meadows Drive
|
Lone Tree, CO
|
4,955
|
|
1,297
|
|
7,348
|
|
1,202
|
|
1,304
|
|
8,543
|
|
9,847
|
|
3,682
|
|
2000
|
||||||||||
|
3250 Quentin Street
|
Aurora, CO
|
—
|
|
1,220
|
|
6,911
|
|
897
|
|
1,230
|
|
7,798
|
|
9,028
|
|
3,445
|
|
2000
|
||||||||||
|
8020 Southpark Circle
|
Littleton, CO
|
—
|
|
739
|
|
—
|
|
3,170
|
|
781
|
|
3,128
|
|
3,909
|
|
1,276
|
|
2000
|
||||||||||
|
8810 W. 116th Circle
|
Broomfield, CO
|
—
|
|
312
|
|
—
|
|
1,789
|
|
370
|
|
1,731
|
|
2,101
|
|
718
|
|
2001
|
||||||||||
|
8820 W. 116th Circle
|
Broomfield, CO
|
—
|
|
338
|
|
1,918
|
|
343
|
|
372
|
|
2,227
|
|
2,599
|
|
887
|
|
2003
|
||||||||||
|
8835 W. 116th Circle
|
Broomfield, CO
|
—
|
|
1,151
|
|
6,523
|
|
1,139
|
|
1,304
|
|
7,509
|
|
8,813
|
|
3,081
|
|
2003
|
||||||||||
|
18150 E. 32nd Place
|
Aurora, CO
|
—
|
|
563
|
|
3,188
|
|
175
|
|
572
|
|
3,354
|
|
3,926
|
|
1,401
|
|
2004
|
||||||||||
|
3400 Fraser Street
|
Aurora, CO
|
1,948
|
|
616
|
|
3,593
|
|
(134
|
)
|
620
|
|
3,455
|
|
4,075
|
|
1,439
|
|
2005
|
||||||||||
|
7005 E. 46th Avenue Drive
|
Denver, CO
|
1,323
|
|
512
|
|
2,025
|
|
229
|
|
517
|
|
2,249
|
|
2,766
|
|
830
|
|
2005
|
||||||||||
|
4001 Salazar Way
|
Frederick, CO
|
3,340
|
|
1,271
|
|
6,508
|
|
(713
|
)
|
1,276
|
|
5,790
|
|
7,066
|
|
1,996
|
|
2006
|
||||||||||
|
5909-5915 N. Broadway
|
Denver, CO
|
—
|
|
495
|
|
1,268
|
|
129
|
|
500
|
|
1,392
|
|
1,892
|
|
856
|
|
2006
|
||||||||||
|
21301 E. 33rd Drive
|
Aurora, CO
|
6,526
|
|
2,860
|
|
8,202
|
|
924
|
|
2,859
|
|
9,127
|
|
11,986
|
|
821
|
|
2017
|
||||||||||
|
Detroit
|
||||||||||||||||||||||||||||
|
47461 Clipper
|
Plymouth Township, MI
|
—
|
|
122
|
|
723
|
|
159
|
|
122
|
|
882
|
|
1,004
|
|
498
|
|
1994
|
||||||||||
|
449 Executive Drive
|
Troy, MI
|
—
|
|
125
|
|
425
|
|
984
|
|
218
|
|
1,316
|
|
1,534
|
|
1,220
|
|
1994
|
||||||||||
|
1416 Meijer Drive
|
Troy, MI
|
—
|
|
94
|
|
394
|
|
477
|
|
121
|
|
844
|
|
965
|
|
725
|
|
1994
|
||||||||||
|
1624 Meijer Drive
|
Troy, MI
|
—
|
|
236
|
|
1,406
|
|
1,093
|
|
373
|
|
2,362
|
|
2,735
|
|
2,241
|
|
1994
|
||||||||||
|
1972 Meijer Drive
|
Troy, MI
|
—
|
|
315
|
|
1,301
|
|
787
|
|
372
|
|
2,031
|
|
2,403
|
|
1,859
|
|
1994
|
||||||||||
|
1707 Northwood Drive
|
Troy, MI
|
—
|
|
95
|
|
262
|
|
1,409
|
|
239
|
|
1,527
|
|
1,766
|
|
1,352
|
|
1994
|
||||||||||
|
1826 Northwood Drive
|
Troy, MI
|
—
|
|
55
|
|
208
|
|
472
|
|
103
|
|
632
|
|
735
|
|
566
|
|
1994
|
||||||||||
S-6
|
FIRST INDUSTRIAL REALTY TRUST, INC. AND FIRST INDUSTRIAL, L.P.
SCHEDULE III: REAL ESTATE AND ACCUMULATED DEPRECIATION As of December 31, 2018 |
||||||||||||||||||||||||||||
|
|
|
|
|
Initial Cost
|
Costs
Capitalized
Subsequent to
Acquisition or
Completion
and Valuation
Provision
|
Gross Amount Carried
At Close of Period 12/31/18 |
Year
Acquired/
Constructed
|
|||||||||||||||||||||
|
Building Address
|
|
Location
(City/State)
|
(a)
Encumbrances
|
Land
|
Buildings and
Improvements
|
Land
|
Buildings and
Improvements
|
Total
|
Accumulated
Depreciation 12/31/2018 |
|||||||||||||||||||
|
|
|
|
(In thousands)
|
|
||||||||||||||||||||||||
|
1864 Northwood Drive
|
Troy, MI
|
—
|
|
57
|
|
190
|
|
489
|
|
107
|
|
629
|
|
736
|
|
580
|
|
1994
|
||||||||||
|
2730 Research Drive
|
Rochester Hills, MI
|
—
|
|
903
|
|
4,215
|
|
831
|
|
903
|
|
5,046
|
|
5,949
|
|
4,707
|
|
1994
|
||||||||||
|
2791 Research Drive
|
Rochester Hills, MI
|
—
|
|
557
|
|
2,731
|
|
687
|
|
560
|
|
3,415
|
|
3,975
|
|
2,810
|
|
1994
|
||||||||||
|
2871 Research Drive
|
Rochester Hills, MI
|
—
|
|
324
|
|
1,487
|
|
412
|
|
327
|
|
1,896
|
|
2,223
|
|
1,610
|
|
1994
|
||||||||||
|
2870 Technology Drive
|
Rochester Hills, MI
|
—
|
|
275
|
|
1,262
|
|
356
|
|
279
|
|
1,614
|
|
1,893
|
|
1,488
|
|
1994
|
||||||||||
|
2900 Technology Drive
|
Rochester Hills, MI
|
—
|
|
214
|
|
977
|
|
723
|
|
219
|
|
1,695
|
|
1,914
|
|
1,153
|
|
1994
|
||||||||||
|
2930 Technology Drive
|
Rochester Hills, MI
|
—
|
|
131
|
|
594
|
|
432
|
|
138
|
|
1,019
|
|
1,157
|
|
802
|
|
1994
|
||||||||||
|
2950 Technology Drive
|
Rochester Hills, MI
|
—
|
|
178
|
|
819
|
|
368
|
|
185
|
|
1,180
|
|
1,365
|
|
986
|
|
1994
|
||||||||||
|
23014 Commerce Drive
|
Farmington Hills, MI
|
—
|
|
39
|
|
203
|
|
189
|
|
56
|
|
375
|
|
431
|
|
346
|
|
1994
|
||||||||||
|
23035 Commerce Drive
|
Farmington Hills, MI
|
—
|
|
71
|
|
355
|
|
291
|
|
93
|
|
624
|
|
717
|
|
544
|
|
1994
|
||||||||||
|
23093 Commerce Drive
|
Farmington Hills, MI
|
—
|
|
211
|
|
1,024
|
|
1,337
|
|
295
|
|
2,277
|
|
2,572
|
|
1,982
|
|
1994
|
||||||||||
|
23135 Commerce Drive
|
Farmington Hills, MI
|
—
|
|
146
|
|
701
|
|
312
|
|
158
|
|
1,001
|
|
1,159
|
|
936
|
|
1994
|
||||||||||
|
23163 Commerce Drive
|
Farmington Hills, MI
|
—
|
|
111
|
|
513
|
|
393
|
|
138
|
|
879
|
|
1,017
|
|
819
|
|
1994
|
||||||||||
|
23177 Commerce Drive
|
Farmington Hills, MI
|
—
|
|
175
|
|
1,007
|
|
689
|
|
254
|
|
1,617
|
|
1,871
|
|
1,496
|
|
1994
|
||||||||||
|
4400 Purks Drive
|
Auburn Hills, MI
|
—
|
|
602
|
|
3,410
|
|
3,774
|
|
612
|
|
7,174
|
|
7,786
|
|
3,730
|
|
1995
|
||||||||||
|
12707 Eckles Road
|
Plymouth Township, MI
|
—
|
|
255
|
|
1,445
|
|
241
|
|
267
|
|
1,674
|
|
1,941
|
|
896
|
|
1996
|
||||||||||
|
32975 Capitol Avenue
|
Livonia, MI
|
—
|
|
135
|
|
748
|
|
(65
|
)
|
77
|
|
741
|
|
818
|
|
362
|
|
1998
|
||||||||||
|
11923 Brookfield Avenue
|
Livonia, MI
|
—
|
|
120
|
|
665
|
|
(306
|
)
|
32
|
|
447
|
|
479
|
|
305
|
|
1998
|
||||||||||
|
47711 Clipper Street
|
Plymouth Township, MI
|
—
|
|
539
|
|
2,983
|
|
579
|
|
575
|
|
3,526
|
|
4,101
|
|
1,733
|
|
1998
|
||||||||||
|
12874 Westmore Avenue
|
Livonia, MI
|
—
|
|
137
|
|
761
|
|
(234
|
)
|
58
|
|
606
|
|
664
|
|
369
|
|
1998
|
||||||||||
|
1775 Bellingham
|
Troy, MI
|
—
|
|
344
|
|
1,902
|
|
439
|
|
367
|
|
2,318
|
|
2,685
|
|
1,119
|
|
1998
|
||||||||||
|
1785 East Maple
|
Troy, MI
|
—
|
|
92
|
|
507
|
|
210
|
|
98
|
|
711
|
|
809
|
|
341
|
|
1998
|
||||||||||
|
980 Chicago Road
|
Troy, MI
|
—
|
|
206
|
|
1,141
|
|
333
|
|
220
|
|
1,460
|
|
1,680
|
|
706
|
|
1998
|
||||||||||
|
1885 Enterprise Drive
|
Rochester Hills, MI
|
—
|
|
209
|
|
1,158
|
|
589
|
|
223
|
|
1,733
|
|
1,956
|
|
945
|
|
1998
|
||||||||||
|
1935-55 Enterprise Drive
|
Rochester Hills, MI
|
—
|
|
1,285
|
|
7,144
|
|
1,342
|
|
1,371
|
|
8,400
|
|
9,771
|
|
4,244
|
|
1998
|
||||||||||
|
5500 Enterprise Court
|
Warren, MI
|
—
|
|
675
|
|
3,737
|
|
772
|
|
721
|
|
4,463
|
|
5,184
|
|
2,227
|
|
1998
|
||||||||||
|
750 Chicago Road
|
Troy, MI
|
—
|
|
323
|
|
1,790
|
|
404
|
|
345
|
|
2,172
|
|
2,517
|
|
1,107
|
|
1998
|
||||||||||
|
800 Chicago Road
|
Troy, MI
|
—
|
|
283
|
|
1,567
|
|
380
|
|
302
|
|
1,928
|
|
2,230
|
|
963
|
|
1998
|
||||||||||
|
850 Chicago Road
|
Troy, MI
|
—
|
|
183
|
|
1,016
|
|
279
|
|
196
|
|
1,282
|
|
1,478
|
|
623
|
|
1998
|
||||||||||
|
4872 S. Lapeer Road
|
Lake Orion Twsp, MI
|
—
|
|
1,342
|
|
5,441
|
|
481
|
|
1,412
|
|
5,852
|
|
7,264
|
|
2,884
|
|
1999
|
||||||||||
|
1400 Allen Drive
|
Troy, MI
|
—
|
|
209
|
|
1,154
|
|
393
|
|
212
|
|
1,544
|
|
1,756
|
|
658
|
|
2000
|
||||||||||
S-7
|
FIRST INDUSTRIAL REALTY TRUST, INC. AND FIRST INDUSTRIAL, L.P.
SCHEDULE III: REAL ESTATE AND ACCUMULATED DEPRECIATION As of December 31, 2018 |
||||||||||||||||||||||||||||
|
|
|
|
|
Initial Cost
|
Costs
Capitalized
Subsequent to
Acquisition or
Completion
and Valuation
Provision
|
Gross Amount Carried
At Close of Period 12/31/18 |
Year
Acquired/
Constructed
|
|||||||||||||||||||||
|
Building Address
|
|
Location
(City/State)
|
(a)
Encumbrances
|
Land
|
Buildings and
Improvements
|
Land
|
Buildings and
Improvements
|
Total
|
Accumulated
Depreciation 12/31/2018 |
|||||||||||||||||||
|
|
|
|
(In thousands)
|
|
||||||||||||||||||||||||
|
1408 Allen Drive
|
Troy, MI
|
—
|
|
151
|
|
834
|
|
104
|
|
153
|
|
936
|
|
1,089
|
|
416
|
|
2000
|
||||||||||
|
28435 Automation Blvd
|
Wixom, MI
|
—
|
|
621
|
|
—
|
|
3,661
|
|
628
|
|
3,654
|
|
4,282
|
|
1,284
|
|
2004
|
||||||||||
|
32200 North Avis Drive
|
Madison Heights, MI
|
—
|
|
503
|
|
3,367
|
|
(921
|
)
|
195
|
|
2,754
|
|
2,949
|
|
917
|
|
2005
|
||||||||||
|
100 Kay Industrial Drive
|
Orion Township, MI
|
—
|
|
677
|
|
2,018
|
|
175
|
|
685
|
|
2,185
|
|
2,870
|
|
1,263
|
|
2005
|
||||||||||
|
42555 Merrill Road
|
Sterling Heights, MI
|
—
|
|
1,080
|
|
2,300
|
|
3,415
|
|
1,090
|
|
5,705
|
|
6,795
|
|
2,842
|
|
2006
|
||||||||||
|
200 Northpointe Drive
|
Orion Township, MI
|
—
|
|
723
|
|
2,063
|
|
(456
|
)
|
734
|
|
1,596
|
|
2,330
|
|
748
|
|
2006
|
||||||||||
|
Houston
|
||||||||||||||||||||||||||||
|
3351 Rauch Street
|
Houston, TX
|
—
|
|
272
|
|
1,541
|
|
641
|
|
278
|
|
2,176
|
|
2,454
|
|
1,019
|
|
1997
|
||||||||||
|
3801-3851 Yale Street
|
Houston, TX
|
—
|
|
413
|
|
2,343
|
|
1,499
|
|
425
|
|
3,830
|
|
4,255
|
|
1,603
|
|
1997
|
||||||||||
|
3337-3347 Rauch Street
|
Houston, TX
|
—
|
|
227
|
|
1,287
|
|
444
|
|
233
|
|
1,725
|
|
1,958
|
|
813
|
|
1997
|
||||||||||
|
8505 North Loop East
|
Houston, TX
|
—
|
|
439
|
|
2,489
|
|
613
|
|
449
|
|
3,092
|
|
3,541
|
|
1,535
|
|
1997
|
||||||||||
|
4749-4799 Eastpark Drive
|
Houston, TX
|
—
|
|
594
|
|
3,368
|
|
1,220
|
|
611
|
|
4,571
|
|
5,182
|
|
2,317
|
|
1997
|
||||||||||
|
4851 Homestead Road
|
Houston, TX
|
2,198
|
|
491
|
|
2,782
|
|
1,377
|
|
504
|
|
4,146
|
|
4,650
|
|
2,055
|
|
1997
|
||||||||||
|
3365-3385 Rauch Street
|
Houston, TX
|
—
|
|
284
|
|
1,611
|
|
486
|
|
290
|
|
2,091
|
|
2,381
|
|
999
|
|
1997
|
||||||||||
|
5050 Campbell Road
|
Houston, TX
|
—
|
|
461
|
|
2,610
|
|
1,078
|
|
470
|
|
3,679
|
|
4,149
|
|
1,790
|
|
1997
|
||||||||||
|
4300 Pine Timbers
|
Houston, TX
|
2,235
|
|
489
|
|
2,769
|
|
1,183
|
|
499
|
|
3,942
|
|
4,441
|
|
1,844
|
|
1997
|
||||||||||
|
2500-2530 Fairway Park Drive
|
Houston, TX
|
—
|
|
766
|
|
4,342
|
|
2,200
|
|
792
|
|
6,516
|
|
7,308
|
|
2,866
|
|
1997
|
||||||||||
|
6550 Longpointe
|
Houston, TX
|
—
|
|
362
|
|
2,050
|
|
924
|
|
370
|
|
2,966
|
|
3,336
|
|
1,399
|
|
1997
|
||||||||||
|
1815 Turning Basin Drive
|
Houston, TX
|
—
|
|
487
|
|
2,761
|
|
2,105
|
|
531
|
|
4,822
|
|
5,353
|
|
2,106
|
|
1997
|
||||||||||
|
1819 Turning Basin Drive
|
Houston, TX
|
—
|
|
231
|
|
1,308
|
|
899
|
|
251
|
|
2,187
|
|
2,438
|
|
1,007
|
|
1997
|
||||||||||
|
1805 Turning Basin Drive
|
Houston, TX
|
—
|
|
564
|
|
3,197
|
|
2,699
|
|
616
|
|
5,844
|
|
6,460
|
|
2,698
|
|
1997
|
||||||||||
|
11505 State Highway 225
|
La Porte, TX
|
—
|
|
940
|
|
4,675
|
|
10
|
|
940
|
|
4,685
|
|
5,625
|
|
1,785
|
|
2005
|
||||||||||
|
1500 East Main Street
|
La Porte, TX
|
—
|
|
201
|
|
1,328
|
|
(91
|
)
|
204
|
|
1,234
|
|
1,438
|
|
1,147
|
|
2005
|
||||||||||
|
7230-7238 Wynnwood
|
Houston, TX
|
—
|
|
254
|
|
764
|
|
249
|
|
259
|
|
1,008
|
|
1,267
|
|
602
|
|
2007
|
||||||||||
|
7240-7248 Wynnwood
|
Houston, TX
|
—
|
|
271
|
|
726
|
|
333
|
|
276
|
|
1,054
|
|
1,330
|
|
556
|
|
2007
|
||||||||||
|
7250-7260 Wynnwood
|
Houston, TX
|
—
|
|
200
|
|
481
|
|
1,501
|
|
203
|
|
1,979
|
|
2,182
|
|
690
|
|
2007
|
||||||||||
|
6400 Long Point
|
Houston, TX
|
—
|
|
188
|
|
898
|
|
132
|
|
188
|
|
1,030
|
|
1,218
|
|
475
|
|
2007
|
||||||||||
|
7967 Blankenship
|
Houston, TX
|
—
|
|
307
|
|
1,166
|
|
374
|
|
307
|
|
1,540
|
|
1,847
|
|
676
|
|
2010
|
||||||||||
|
8800 City Park Loop East
|
Houston, TX
|
—
|
|
3,717
|
|
19,237
|
|
(535
|
)
|
3,717
|
|
18,702
|
|
22,419
|
|
5,561
|
|
2011
|
||||||||||
|
4800 West Greens Road
|
Houston, TX
|
—
|
|
3,350
|
|
—
|
|
16,757
|
|
3,312
|
|
16,795
|
|
20,107
|
|
2,497
|
|
2014
|
||||||||||
|
611 East Sam Houston Parkway S
|
Pasadena, TX
|
—
|
|
1,970
|
|
7,431
|
|
1,313
|
|
2,013
|
|
8,701
|
|
10,714
|
|
824
|
|
2015
|
||||||||||
S-8
|
FIRST INDUSTRIAL REALTY TRUST, INC. AND FIRST INDUSTRIAL, L.P.
SCHEDULE III: REAL ESTATE AND ACCUMULATED DEPRECIATION As of December 31, 2018 |
||||||||||||||||||||||||||||
|
|
|
|
|
Initial Cost
|
Costs
Capitalized
Subsequent to
Acquisition or
Completion
and Valuation
Provision
|
Gross Amount Carried
At Close of Period 12/31/18 |
Year
Acquired/
Constructed
|
|||||||||||||||||||||
|
Building Address
|
|
Location
(City/State)
|
(a)
Encumbrances
|
Land
|
Buildings and
Improvements
|
Land
|
Buildings and
Improvements
|
Total
|
Accumulated
Depreciation 12/31/2018 |
|||||||||||||||||||
|
|
|
|
(In thousands)
|
|
||||||||||||||||||||||||
|
619 East Sam Houston Parkway S
|
Pasadena, TX
|
—
|
|
2,879
|
|
11,713
|
|
778
|
|
2,876
|
|
12,494
|
|
15,370
|
|
1,203
|
|
2015
|
||||||||||
|
6913 Guhn Road
|
Houston, TX
|
—
|
|
1,367
|
|
—
|
|
6,301
|
|
1,367
|
|
6,301
|
|
7,668
|
|
—
|
|
2018
|
||||||||||
|
607 East Sam Houston Parkway
|
Pasedena, TX
|
—
|
|
2,076
|
|
11,674
|
|
—
|
|
2,076
|
|
11,674
|
|
13,750
|
|
2
|
|
2018
|
||||||||||
|
615 East Sam Houston Parkway
|
Pasedena, TX
|
—
|
|
4,265
|
|
11,983
|
|
—
|
|
4,265
|
|
11,983
|
|
16,248
|
|
—
|
|
2018
|
||||||||||
|
Indianapolis
|
||||||||||||||||||||||||||||
|
2900 North Shadeland Avenue
|
Indianapolis, IN
|
—
|
|
2,057
|
|
13,565
|
|
7,351
|
|
2,057
|
|
20,916
|
|
22,973
|
|
10,005
|
|
1996
|
||||||||||
|
1445 Brookville Way
|
Indianapolis, IN
|
—
|
|
459
|
|
2,603
|
|
1,421
|
|
476
|
|
4,007
|
|
4,483
|
|
1,978
|
|
1996
|
||||||||||
|
1440 Brookville Way
|
Indianapolis, IN
|
—
|
|
665
|
|
3,770
|
|
956
|
|
685
|
|
4,706
|
|
5,391
|
|
2,454
|
|
1996
|
||||||||||
|
1240 Brookville Way
|
Indianapolis, IN
|
—
|
|
247
|
|
1,402
|
|
465
|
|
258
|
|
1,856
|
|
2,114
|
|
952
|
|
1996
|
||||||||||
|
1345 Brookville Way
|
Indianapolis, IN
|
—
|
|
586
|
|
3,321
|
|
1,718
|
|
601
|
|
5,024
|
|
5,625
|
|
2,584
|
|
1996
|
||||||||||
|
1350 Brookville Way
|
Indianapolis, IN
|
—
|
|
205
|
|
1,161
|
|
513
|
|
212
|
|
1,667
|
|
1,879
|
|
791
|
|
1996
|
||||||||||
|
1335 Sadlier Circle East
|
Indianapolis, IN
|
—
|
|
81
|
|
460
|
|
244
|
|
86
|
|
699
|
|
785
|
|
341
|
|
1996
|
||||||||||
|
6951 East 30th Street
|
Indianapolis, IN
|
—
|
|
256
|
|
1,449
|
|
507
|
|
265
|
|
1,947
|
|
2,212
|
|
962
|
|
1996
|
||||||||||
|
6701 East 30th Street
|
Indianapolis, IN
|
—
|
|
78
|
|
443
|
|
98
|
|
82
|
|
537
|
|
619
|
|
301
|
|
1996
|
||||||||||
|
6737 East 30th Street
|
Indianapolis, IN
|
—
|
|
385
|
|
2,181
|
|
669
|
|
398
|
|
2,837
|
|
3,235
|
|
1,455
|
|
1996
|
||||||||||
|
6555 East 30th Street
|
Indianapolis, IN
|
—
|
|
484
|
|
4,760
|
|
2,699
|
|
484
|
|
7,459
|
|
7,943
|
|
3,530
|
|
1996
|
||||||||||
|
7901 West 21st Street
|
Indianapolis, IN
|
—
|
|
1,048
|
|
6,027
|
|
426
|
|
1,048
|
|
6,453
|
|
7,501
|
|
3,358
|
|
1997
|
||||||||||
|
1225 Brookville Way
|
Indianapolis, IN
|
—
|
|
60
|
|
—
|
|
432
|
|
68
|
|
424
|
|
492
|
|
218
|
|
1997
|
||||||||||
|
6751 East 30th Street
|
Indianapolis, IN
|
—
|
|
728
|
|
2,837
|
|
457
|
|
741
|
|
3,281
|
|
4,022
|
|
1,716
|
|
1997
|
||||||||||
|
6575 East 30th Street
|
Indianapolis, IN
|
—
|
|
118
|
|
—
|
|
2,160
|
|
128
|
|
2,150
|
|
2,278
|
|
980
|
|
1998
|
||||||||||
|
6585 East 30th Street
|
Indianapolis, IN
|
—
|
|
196
|
|
—
|
|
3,223
|
|
196
|
|
3,223
|
|
3,419
|
|
1,618
|
|
1998
|
||||||||||
|
14425 Bergen Blvd
|
Noblesville, IN
|
—
|
|
647
|
|
—
|
|
3,595
|
|
743
|
|
3,499
|
|
4,242
|
|
1,094
|
|
2007
|
||||||||||
|
6635 East 30th Street
|
Indianapolis, IN
|
—
|
|
466
|
|
3,093
|
|
82
|
|
466
|
|
3,175
|
|
3,641
|
|
352
|
|
2016
|
||||||||||
|
Miami
|
||||||||||||||||||||||||||||
|
4700 NW 15th Avenue
|
Ft. Lauderdale, FL
|
—
|
|
908
|
|
1,883
|
|
207
|
|
912
|
|
2,086
|
|
2,998
|
|
823
|
|
2007
|
||||||||||
|
4710 NW 15th Avenue
|
Ft. Lauderdale, FL
|
—
|
|
830
|
|
2,722
|
|
27
|
|
834
|
|
2,745
|
|
3,579
|
|
910
|
|
2007
|
||||||||||
|
4720 NW 15th Avenue
|
Ft. Lauderdale, FL
|
—
|
|
937
|
|
2,455
|
|
255
|
|
942
|
|
2,705
|
|
3,647
|
|
999
|
|
2007
|
||||||||||
|
4740 NW 15th Avenue
|
Ft. Lauderdale, FL
|
—
|
|
1,107
|
|
3,111
|
|
50
|
|
1,112
|
|
3,156
|
|
4,268
|
|
1,064
|
|
2007
|
||||||||||
|
4750 NW 15th Avenue
|
Ft. Lauderdale, FL
|
—
|
|
947
|
|
3,079
|
|
359
|
|
951
|
|
3,434
|
|
4,385
|
|
1,108
|
|
2007
|
||||||||||
|
4800 NW 15th Avenue
|
Ft. Lauderdale, FL
|
—
|
|
1,092
|
|
3,308
|
|
60
|
|
1,097
|
|
3,363
|
|
4,460
|
|
1,046
|
|
2007
|
||||||||||
|
6891 NW 74th Street
|
Medley, FL
|
—
|
|
857
|
|
3,428
|
|
3,874
|
|
864
|
|
7,295
|
|
8,159
|
|
2,729
|
|
2007
|
||||||||||
S-9
|
FIRST INDUSTRIAL REALTY TRUST, INC. AND FIRST INDUSTRIAL, L.P.
SCHEDULE III: REAL ESTATE AND ACCUMULATED DEPRECIATION As of December 31, 2018 |
||||||||||||||||||||||||||||
|
|
|
|
|
Initial Cost
|
Costs
Capitalized
Subsequent to
Acquisition or
Completion
and Valuation
Provision
|
Gross Amount Carried
At Close of Period 12/31/18 |
Year
Acquired/
Constructed
|
|||||||||||||||||||||
|
Building Address
|
|
Location
(City/State)
|
(a)
Encumbrances
|
Land
|
Buildings and
Improvements
|
Land
|
Buildings and
Improvements
|
Total
|
Accumulated
Depreciation
12/31/2018
|
|||||||||||||||||||
|
|
|
|
(In thousands)
|
|
||||||||||||||||||||||||
|
12601 &12605 NW 115th Avenue
|
Medley, FL
|
—
|
|
2,039
|
|
—
|
|
344
|
|
674
|
|
1,709
|
|
2,383
|
|
421
|
|
2008
|
||||||||||
|
1351 NW 78th Avenue
|
Doral, FL
|
—
|
|
3,111
|
|
4,634
|
|
10
|
|
3,111
|
|
4,644
|
|
7,755
|
|
512
|
|
2016
|
||||||||||
|
2500 NW 19th Street
|
Pompano Beach, FL
|
—
|
|
8,824
|
|
11,660
|
|
229
|
|
8,824
|
|
11,889
|
|
20,713
|
|
939
|
|
2017
|
||||||||||
|
Milwaukee
|
||||||||||||||||||||||||||||
|
5355 South Westridge Drive
|
New Berlin, WI
|
4,135
|
|
1,630
|
|
7,058
|
|
(39
|
)
|
1,646
|
|
7,003
|
|
8,649
|
|
2,293
|
|
2004
|
||||||||||
|
17005 West Ryerson Road
|
New Berlin, WI
|
2,247
|
|
403
|
|
3,647
|
|
415
|
|
405
|
|
4,060
|
|
4,465
|
|
2,383
|
|
2005
|
||||||||||
|
1500 Peebles Drive
|
Richland Center, WI
|
—
|
|
1,577
|
|
1,018
|
|
(441
|
)
|
1,528
|
|
626
|
|
2,154
|
|
567
|
|
2005
|
||||||||||
|
16600 West Glendale Avenue
|
New Berlin, WI
|
1,577
|
|
704
|
|
1,923
|
|
710
|
|
715
|
|
2,622
|
|
3,337
|
|
2,031
|
|
2006
|
||||||||||
|
N58W15380 Shawn Circle
|
Menomonee Falls, WI
|
—
|
|
1,188
|
|
—
|
|
17,020
|
|
1,204
|
|
17,004
|
|
18,208
|
|
5,186
|
|
2008
|
||||||||||
|
Minneapolis/St. Paul
|
||||||||||||||||||||||||||||
|
6201 West 111th Street
|
Bloomington, MN
|
1,645
|
|
1,358
|
|
8,622
|
|
13,263
|
|
1,519
|
|
21,724
|
|
23,243
|
|
13,901
|
|
1994
|
||||||||||
|
1030 Lone Oak Road
|
Eagan, MN
|
1,877
|
|
456
|
|
2,703
|
|
813
|
|
456
|
|
3,516
|
|
3,972
|
|
2,025
|
|
1994
|
||||||||||
|
1060 Lone Oak Road
|
Eagan, MN
|
2,438
|
|
624
|
|
3,700
|
|
834
|
|
624
|
|
4,534
|
|
5,158
|
|
2,608
|
|
1994
|
||||||||||
|
5400 Nathan Lane
|
Plymouth, MN
|
—
|
|
749
|
|
4,461
|
|
869
|
|
757
|
|
5,322
|
|
6,079
|
|
3,038
|
|
1994
|
||||||||||
|
6655 Wedgewood Road
|
Maple Grove, MN
|
—
|
|
1,466
|
|
8,342
|
|
6,232
|
|
1,466
|
|
14,574
|
|
16,040
|
|
7,621
|
|
1994
|
||||||||||
|
10120 West 76th Street
|
Eden Prairie, MN
|
—
|
|
315
|
|
1,804
|
|
1,043
|
|
315
|
|
2,847
|
|
3,162
|
|
1,554
|
|
1995
|
||||||||||
|
12155 Nicollet Avenue
|
Burnsville, MN
|
—
|
|
286
|
|
—
|
|
1,957
|
|
288
|
|
1,955
|
|
2,243
|
|
1,037
|
|
1995
|
||||||||||
|
5775 12th Avenue
|
Shakopee, MN
|
3,251
|
|
590
|
|
—
|
|
5,871
|
|
590
|
|
5,871
|
|
6,461
|
|
2,176
|
|
1998
|
||||||||||
|
1157 Valley Park Drive
|
Shakopee, MN
|
4,061
|
|
760
|
|
—
|
|
7,734
|
|
888
|
|
7,606
|
|
8,494
|
|
3,203
|
|
1999
|
||||||||||
|
9600 West 76th Street
|
Eden Prairie, MN
|
1,918
|
|
1,000
|
|
2,450
|
|
67
|
|
1,034
|
|
2,483
|
|
3,517
|
|
893
|
|
2004
|
||||||||||
|
9700 West 76th Street
|
Eden Prairie, MN
|
2,223
|
|
1,000
|
|
2,709
|
|
368
|
|
1,038
|
|
3,039
|
|
4,077
|
|
995
|
|
2004
|
||||||||||
|
7600 69th Avenue
|
Greenfield, MN
|
—
|
|
1,500
|
|
8,328
|
|
(468
|
)
|
1,510
|
|
7,850
|
|
9,360
|
|
2,322
|
|
2004
|
||||||||||
|
5017 Boone Avenue North
|
New Hope, MN
|
—
|
|
1,000
|
|
1,599
|
|
600
|
|
1,009
|
|
2,190
|
|
3,199
|
|
1,400
|
|
2005
|
||||||||||
|
1087 Park Place
|
Shakopee, MN
|
2,939
|
|
1,195
|
|
4,891
|
|
(246
|
)
|
1,198
|
|
4,642
|
|
5,840
|
|
1,646
|
|
2005
|
||||||||||
|
5391 12th Avenue SE
|
Shakopee, MN
|
—
|
|
1,392
|
|
8,149
|
|
13
|
|
1,395
|
|
8,159
|
|
9,554
|
|
2,660
|
|
2005
|
||||||||||
|
4701 Valley Industrial Blvd S
|
Shakopee, MN
|
4,167
|
|
1,296
|
|
7,157
|
|
(172
|
)
|
1,299
|
|
6,982
|
|
8,281
|
|
3,733
|
|
2005
|
||||||||||
|
6455 City West Parkway
|
Eden Prairie, MN
|
—
|
|
659
|
|
3,189
|
|
1,273
|
|
665
|
|
4,456
|
|
5,121
|
|
2,102
|
|
2006
|
||||||||||
|
7035 Winnetka Avenue North
|
Brooklyn Park, MN
|
4,218
|
|
1,275
|
|
—
|
|
7,545
|
|
1,343
|
|
7,477
|
|
8,820
|
|
2,305
|
|
2007
|
||||||||||
|
139 Eva Street
|
St. Paul, MN
|
—
|
|
2,132
|
|
3,105
|
|
(286
|
)
|
2,175
|
|
2,776
|
|
4,951
|
|
914
|
|
2008
|
||||||||||
|
21900 Dodd Boulevard
|
Lakeville, MN
|
—
|
|
2,289
|
|
7,952
|
|
—
|
|
2,289
|
|
7,952
|
|
10,241
|
|
3,062
|
|
2010
|
||||||||||
|
375 Rivertown Drive
|
Woodbury, MN
|
6,993
|
|
2,635
|
|
8,157
|
|
1,224
|
|
2,635
|
|
9,381
|
|
12,016
|
|
2,184
|
|
2014
|
||||||||||
S-10
|
FIRST INDUSTRIAL REALTY TRUST, INC. AND FIRST INDUSTRIAL, L.P.
SCHEDULE III: REAL ESTATE AND ACCUMULATED DEPRECIATION As of December 31, 2018 |
||||||||||||||||||||||||||||
|
|
|
|
|
Initial Cost
|
Costs
Capitalized
Subsequent to
Acquisition or
Completion
and Valuation
Provision
|
Gross Amount Carried
At Close of Period 12/31/18 |
Year
Acquired/
Constructed
|
|||||||||||||||||||||
|
Building Address
|
|
Location
(City/State)
|
(a)
Encumbrances
|
Land
|
Buildings and
Improvements
|
Land
|
Buildings and
Improvements
|
Total
|
Accumulated
Depreciation
12/31/2018
|
|||||||||||||||||||
|
|
|
|
(In thousands)
|
|
||||||||||||||||||||||||
|
935 Aldrin Drive
|
Eagan, MN
|
5,188
|
|
2,096
|
|
7,884
|
|
439
|
|
2,096
|
|
8,323
|
|
10,419
|
|
1,652
|
|
2014
|
||||||||||
|
7050 Winnetka Avenue North
|
Brooklyn Park, MN
|
—
|
|
1,623
|
|
—
|
|
7,567
|
|
1,634
|
|
7,556
|
|
9,190
|
|
818
|
|
2014
|
||||||||||
|
7051 West Broadway
|
Brooklyn Park, MN
|
3,358
|
|
1,275
|
|
—
|
|
5,828
|
|
1,279
|
|
5,824
|
|
7,103
|
|
592
|
|
2014
|
||||||||||
|
Nashville
|
||||||||||||||||||||||||||||
|
1931 Air Lane Drive
|
Nashville, TN
|
—
|
|
489
|
|
2,785
|
|
635
|
|
493
|
|
3,416
|
|
3,909
|
|
1,649
|
|
1997
|
||||||||||
|
4640 Cummings Park
|
Nashville, TN
|
—
|
|
360
|
|
2,040
|
|
689
|
|
365
|
|
2,724
|
|
3,089
|
|
1,197
|
|
1999
|
||||||||||
|
1740 River Hills Drive
|
Nashville, TN
|
2,537
|
|
848
|
|
4,383
|
|
652
|
|
888
|
|
4,995
|
|
5,883
|
|
2,669
|
|
2005
|
||||||||||
|
211 Ellery Court
|
Nashville, TN
|
1,658
|
|
606
|
|
3,192
|
|
(289
|
)
|
616
|
|
2,893
|
|
3,509
|
|
1,052
|
|
2007
|
||||||||||
|
130 Maddox Road
|
Mount Juliet, TN
|
—
|
|
1,778
|
|
—
|
|
23,914
|
|
1,778
|
|
23,914
|
|
25,692
|
|
5,963
|
|
2008
|
||||||||||
|
New Jersey
|
||||||||||||||||||||||||||||
|
14 World's Fair Drive
|
Franklin, NJ
|
—
|
|
483
|
|
2,735
|
|
858
|
|
503
|
|
3,573
|
|
4,076
|
|
1,682
|
|
1997
|
||||||||||
|
12 World's Fair Drive
|
Franklin, NJ
|
—
|
|
572
|
|
3,240
|
|
838
|
|
593
|
|
4,057
|
|
4,650
|
|
2,032
|
|
1997
|
||||||||||
|
22 World's Fair Drive
|
Franklin, NJ
|
—
|
|
364
|
|
2,064
|
|
582
|
|
375
|
|
2,635
|
|
3,010
|
|
1,270
|
|
1997
|
||||||||||
|
26 World's Fair Drive
|
Franklin, NJ
|
—
|
|
361
|
|
2,048
|
|
606
|
|
377
|
|
2,638
|
|
3,015
|
|
1,314
|
|
1997
|
||||||||||
|
24 World's Fair Drive
|
Franklin, NJ
|
—
|
|
347
|
|
1,968
|
|
530
|
|
362
|
|
2,483
|
|
2,845
|
|
1,252
|
|
1997
|
||||||||||
|
20 World's Fair Drive Lot 13
|
Somerset, NJ
|
—
|
|
9
|
|
—
|
|
2,630
|
|
691
|
|
1,948
|
|
2,639
|
|
847
|
|
1999
|
||||||||||
|
45 Route 46
|
Pine Brook, NJ
|
—
|
|
969
|
|
5,491
|
|
1,032
|
|
978
|
|
6,514
|
|
7,492
|
|
2,799
|
|
2000
|
||||||||||
|
43 Route 46
|
Pine Brook, NJ
|
—
|
|
474
|
|
2,686
|
|
472
|
|
479
|
|
3,153
|
|
3,632
|
|
1,409
|
|
2000
|
||||||||||
|
39 Route 46
|
Pine Brook, NJ
|
—
|
|
260
|
|
1,471
|
|
256
|
|
262
|
|
1,725
|
|
1,987
|
|
765
|
|
2000
|
||||||||||
|
26 Chapin Road
|
Pine Brook, NJ
|
—
|
|
956
|
|
5,415
|
|
519
|
|
965
|
|
5,925
|
|
6,890
|
|
2,635
|
|
2000
|
||||||||||
|
30 Chapin Road
|
Pine Brook, NJ
|
—
|
|
960
|
|
5,440
|
|
514
|
|
970
|
|
5,944
|
|
6,914
|
|
2,638
|
|
2000
|
||||||||||
|
20 Hook Mountain Road
|
Pine Brook, NJ
|
—
|
|
1,507
|
|
8,542
|
|
1,401
|
|
1,534
|
|
9,916
|
|
11,450
|
|
4,442
|
|
2000
|
||||||||||
|
30 Hook Mountain Road
|
Pine Brook, NJ
|
—
|
|
389
|
|
2,206
|
|
317
|
|
396
|
|
2,516
|
|
2,912
|
|
1,113
|
|
2000
|
||||||||||
|
16 Chapin Road
|
Pine Brook, NJ
|
—
|
|
885
|
|
5,015
|
|
659
|
|
901
|
|
5,658
|
|
6,559
|
|
2,491
|
|
2000
|
||||||||||
|
20 Chapin Road
|
Pine Brook, NJ
|
—
|
|
1,134
|
|
6,426
|
|
692
|
|
1,154
|
|
7,098
|
|
8,252
|
|
3,106
|
|
2000
|
||||||||||
|
2500 Main Street
|
Sayreville, NJ
|
—
|
|
944
|
|
—
|
|
4,475
|
|
944
|
|
4,475
|
|
5,419
|
|
1,768
|
|
2002
|
||||||||||
|
2400 Main Street
|
Sayreville, NJ
|
—
|
|
996
|
|
—
|
|
5,435
|
|
996
|
|
5,435
|
|
6,431
|
|
1,940
|
|
2003
|
||||||||||
|
7851 Airport Highway
|
Pennsauken, NJ
|
—
|
|
160
|
|
508
|
|
328
|
|
162
|
|
834
|
|
996
|
|
429
|
|
2003
|
||||||||||
|
309-313 Pierce Street
|
Somerset, NJ
|
2,818
|
|
1,300
|
|
4,628
|
|
606
|
|
1,309
|
|
5,225
|
|
6,534
|
|
2,005
|
|
2004
|
||||||||||
|
400 Cedar Lane
|
Florence Township, NJ
|
—
|
|
9,730
|
|
—
|
|
26,209
|
|
9,730
|
|
26,209
|
|
35,939
|
|
1,486
|
|
2016
|
||||||||||
|
301 Bordentown Hedding Road
|
Bordentown, NJ
|
—
|
|
3,983
|
|
15,881
|
|
9
|
|
3,984
|
|
15,889
|
|
19,873
|
|
806
|
|
2017
|
||||||||||
S-11
|
FIRST INDUSTRIAL REALTY TRUST, INC. AND FIRST INDUSTRIAL, L.P.
SCHEDULE III: REAL ESTATE AND ACCUMULATED DEPRECIATION As of December 31, 2018 |
||||||||||||||||||||||||||||
|
|
|
|
|
Initial Cost
|
Costs
Capitalized
Subsequent to
Acquisition or
Completion
and Valuation
Provision
|
Gross Amount Carried
At Close of Period 12/31/18 |
Year
Acquired/
Constructed
|
|||||||||||||||||||||
|
Building Address
|
|
Location
(City/State)
|
(a)
Encumbrances
|
Land
|
Buildings and
Improvements
|
Land
|
Buildings and
Improvements
|
Total
|
Accumulated
Depreciation
12/31/2018
|
|||||||||||||||||||
|
|
|
|
(In thousands)
|
|
||||||||||||||||||||||||
|
302 Bordentown Hedding Road
|
Bordentown, NJ
|
—
|
|
2,738
|
|
8,190
|
|
—
|
|
2,738
|
|
8,190
|
|
10,928
|
|
89
|
|
2018
|
||||||||||
|
Orlando
|
||||||||||||||||||||||||||||
|
6301 Hazeltine National Drive
|
Orlando, FL
|
—
|
|
909
|
|
4,613
|
|
237
|
|
920
|
|
4,839
|
|
5,759
|
|
1,803
|
|
2005
|
||||||||||
|
8751 Skinner Court
|
Orlando, FL
|
4,243
|
|
1,691
|
|
7,249
|
|
(5
|
)
|
1,692
|
|
7,243
|
|
8,935
|
|
694
|
|
2016
|
||||||||||
|
4473 Shader Road
|
Orlando, FL
|
—
|
|
2,094
|
|
10,444
|
|
56
|
|
2,094
|
|
10,500
|
|
12,594
|
|
924
|
|
2016
|
||||||||||
|
550 Gills Drive
|
Orlando, FL
|
—
|
|
1,321
|
|
6,176
|
|
4
|
|
1,321
|
|
6,180
|
|
7,501
|
|
311
|
|
2017
|
||||||||||
|
450 Gills Drive
|
Orlando, FL
|
—
|
|
1,031
|
|
6,406
|
|
—
|
|
1,031
|
|
6,406
|
|
7,437
|
|
231
|
|
2017
|
||||||||||
|
4401 Shader Road
|
Orlando, FL
|
—
|
|
1,037
|
|
7,116
|
|
4
|
|
1,037
|
|
7,120
|
|
8,157
|
|
158
|
|
2018
|
||||||||||
|
Phoenix
|
||||||||||||||||||||||||||||
|
1045 South Edward Drive
|
Tempe, AZ
|
—
|
|
390
|
|
2,160
|
|
627
|
|
396
|
|
2,781
|
|
3,177
|
|
1,248
|
|
1999
|
||||||||||
|
50 South 56th Street
|
Chandler, AZ
|
—
|
|
1,206
|
|
3,218
|
|
1,379
|
|
1,252
|
|
4,551
|
|
5,803
|
|
2,112
|
|
2004
|
||||||||||
|
245 West Lodge
|
Tempe, AZ
|
—
|
|
898
|
|
3,066
|
|
(2,153
|
)
|
362
|
|
1,449
|
|
1,811
|
|
536
|
|
2007
|
||||||||||
|
1590 East Riverview Drive
|
Phoenix, AZ
|
—
|
|
1,293
|
|
5,950
|
|
(267
|
)
|
1,292
|
|
5,684
|
|
6,976
|
|
1,478
|
|
2008
|
||||||||||
|
14131 N. Rio Vista Boulevard
|
Peoria, AZ
|
5,439
|
|
2,563
|
|
9,388
|
|
(445
|
)
|
2,563
|
|
8,943
|
|
11,506
|
|
2,206
|
|
2008
|
||||||||||
|
8716 West Ludlow Drive
|
Peoria, AZ
|
6,721
|
|
2,709
|
|
10,970
|
|
540
|
|
2,709
|
|
11,510
|
|
14,219
|
|
2,942
|
|
2008
|
||||||||||
|
3815 W. Washington Street
|
Phoenix, AZ
|
—
|
|
1,675
|
|
4,514
|
|
316
|
|
1,719
|
|
4,786
|
|
6,505
|
|
1,489
|
|
2008
|
||||||||||
|
9180 W. Buckeye Road
|
Tolleson, AZ
|
—
|
|
1,904
|
|
6,805
|
|
3,124
|
|
1,923
|
|
9,910
|
|
11,833
|
|
2,890
|
|
2008
|
||||||||||
|
8644 West Ludlow Drive
|
Peoria, AZ
|
—
|
|
1,726
|
|
7,216
|
|
—
|
|
1,726
|
|
7,216
|
|
8,942
|
|
1,072
|
|
2014
|
||||||||||
|
8606 West Ludlow Drive
|
Peoria, AZ
|
—
|
|
956
|
|
2,668
|
|
123
|
|
956
|
|
2,791
|
|
3,747
|
|
433
|
|
2014
|
||||||||||
|
8679 West Ludlow Drive
|
Peoria, AZ
|
—
|
|
672
|
|
2,791
|
|
—
|
|
672
|
|
2,791
|
|
3,463
|
|
423
|
|
2014
|
||||||||||
|
94th Avenue & Buckeye Road
|
Tolleson, AZ
|
—
|
|
4,315
|
|
—
|
|
16,645
|
|
4,315
|
|
16,645
|
|
20,960
|
|
1,306
|
|
2015
|
||||||||||
|
16601 West Sells Drive
|
Goodyear, AZ
|
—
|
|
24,743
|
|
—
|
|
19,087
|
|
24,803
|
|
19,027
|
|
43,830
|
|
873
|
|
2017
|
||||||||||
|
16560 West Sells Drive
|
Goodyear, AZ
|
—
|
|
6,259
|
|
—
|
|
23,287
|
|
6,269
|
|
23,277
|
|
29,546
|
|
406
|
|
2018
|
||||||||||
|
Seattle
|
||||||||||||||||||||||||||||
|
1901 Raymond Ave SW
|
Renton, WA
|
—
|
|
4,458
|
|
2,659
|
|
532
|
|
4,594
|
|
3,055
|
|
7,649
|
|
1,074
|
|
2008
|
||||||||||
|
19014 64th Avenue South
|
Kent, WA
|
2,770
|
|
1,990
|
|
3,979
|
|
456
|
|
2,042
|
|
4,383
|
|
6,425
|
|
1,820
|
|
2008
|
||||||||||
|
18640 68th Avenue South
|
Kent, WA
|
—
|
|
1,218
|
|
1,950
|
|
310
|
|
1,258
|
|
2,220
|
|
3,478
|
|
995
|
|
2008
|
||||||||||
|
6407 S 210th Street
|
Kent, WA
|
—
|
|
1,737
|
|
3,508
|
|
—
|
|
1,737
|
|
3,508
|
|
5,245
|
|
128
|
|
2018
|
||||||||||
|
1402 Puyallup Street
|
Sumner, WA
|
—
|
|
3,766
|
|
4,457
|
|
—
|
|
3,766
|
|
4,457
|
|
8,223
|
|
—
|
|
2018
|
||||||||||
|
Southern California
|
||||||||||||||||||||||||||||
|
1944 Vista Bella Way
|
Rancho Dominguez, CA
|
2,697
|
|
1,746
|
|
3,148
|
|
465
|
|
1,822
|
|
3,537
|
|
5,359
|
|
1,861
|
|
2005
|
||||||||||
|
2000 Vista Bella Way
|
Rancho Dominguez, CA
|
1,174
|
|
817
|
|
1,673
|
|
232
|
|
853
|
|
1,869
|
|
2,722
|
|
996
|
|
2005
|
||||||||||
|
2835 East Ana Street
|
Rancho Dominguez, CA
|
2,288
|
|
1,682
|
|
2,750
|
|
409
|
|
1,772
|
|
3,069
|
|
4,841
|
|
1,674
|
|
2005
|
||||||||||
|
665 N. Baldwin Park Boulevard
|
City of Industry, CA
|
4,263
|
|
2,124
|
|
5,219
|
|
2,542
|
|
2,143
|
|
7,742
|
|
9,885
|
|
2,100
|
|
2006
|
||||||||||
S-12
|
FIRST INDUSTRIAL REALTY TRUST, INC. AND FIRST INDUSTRIAL, L.P.
SCHEDULE III: REAL ESTATE AND ACCUMULATED DEPRECIATION As of December 31, 2018 |
||||||||||||||||||||||||||||
|
|
|
|
|
Initial Cost
|
Costs
Capitalized
Subsequent to
Acquisition or
Completion
and Valuation
Provision
|
Gross Amount Carried
At Close of Period 12/31/18 |
Year
Acquired/
Constructed
|
|||||||||||||||||||||
|
Building Address
|
|
Location
(City/State)
|
(a)
Encumbrances
|
Land
|
Buildings and
Improvements
|
Land
|
Buildings and
Improvements
|
Total
|
Accumulated
Depreciation
12/31/2018
|
|||||||||||||||||||
|
|
|
|
(In thousands)
|
|
||||||||||||||||||||||||
|
27801 Avenue Scott
|
Santa Clarita, CA
|
5,086
|
|
2,890
|
|
7,020
|
|
196
|
|
2,902
|
|
7,204
|
|
10,106
|
|
2,889
|
|
2006
|
||||||||||
|
2610 & 2660 Columbia Street
|
Torrance, CA
|
3,927
|
|
3,008
|
|
5,826
|
|
271
|
|
3,031
|
|
6,074
|
|
9,105
|
|
2,376
|
|
2006
|
||||||||||
|
433 Alaska Avenue
|
Torrance, CA
|
—
|
|
681
|
|
168
|
|
3
|
|
684
|
|
168
|
|
852
|
|
111
|
|
2006
|
||||||||||
|
6305 El Camino Real
|
Carlsbad, CA
|
—
|
|
1,590
|
|
6,360
|
|
7,730
|
|
1,590
|
|
14,090
|
|
15,680
|
|
5,239
|
|
2006
|
||||||||||
|
2325 Camino Vida Roble
|
Carlsbad, CA
|
1,785
|
|
1,441
|
|
1,239
|
|
594
|
|
1,446
|
|
1,828
|
|
3,274
|
|
692
|
|
2006
|
||||||||||
|
2335 Camino Vida Roble
|
Carlsbad, CA
|
979
|
|
817
|
|
762
|
|
216
|
|
821
|
|
974
|
|
1,795
|
|
448
|
|
2006
|
||||||||||
|
2345 Camino Vida Roble
|
Carlsbad, CA
|
637
|
|
562
|
|
456
|
|
151
|
|
565
|
|
604
|
|
1,169
|
|
270
|
|
2006
|
||||||||||
|
2355 Camino Vida Roble
|
Carlsbad, CA
|
556
|
|
481
|
|
365
|
|
174
|
|
483
|
|
537
|
|
1,020
|
|
287
|
|
2006
|
||||||||||
|
2365 Camino Vida Roble
|
Carlsbad, CA
|
1,022
|
|
1,098
|
|
630
|
|
146
|
|
1,102
|
|
772
|
|
1,874
|
|
418
|
|
2006
|
||||||||||
|
2375 Camino Vida Roble
|
Carlsbad, CA
|
1,213
|
|
1,210
|
|
874
|
|
140
|
|
1,214
|
|
1,010
|
|
2,224
|
|
458
|
|
2006
|
||||||||||
|
6451 El Camino Real
|
Carlsbad, CA
|
—
|
|
2,885
|
|
1,931
|
|
733
|
|
2,895
|
|
2,654
|
|
5,549
|
|
1,075
|
|
2006
|
||||||||||
|
13100 Gregg Street
|
Poway, CA
|
2,889
|
|
1,040
|
|
4,160
|
|
913
|
|
1,073
|
|
5,040
|
|
6,113
|
|
2,344
|
|
2007
|
||||||||||
|
21730-21748 Marilla Street
|
Chatsworth, CA
|
2,518
|
|
2,585
|
|
3,210
|
|
44
|
|
2,608
|
|
3,231
|
|
5,839
|
|
1,374
|
|
2007
|
||||||||||
|
8015 Paramount
|
Pico Rivera, CA
|
—
|
|
3,616
|
|
3,902
|
|
(510
|
)
|
3,657
|
|
3,351
|
|
7,008
|
|
1,444
|
|
2007
|
||||||||||
|
3365 E. Slauson
|
Vernon, CA
|
—
|
|
2,367
|
|
3,243
|
|
(559
|
)
|
2,396
|
|
2,655
|
|
5,051
|
|
1,144
|
|
2007
|
||||||||||
|
3015 East Ana
|
Rancho Dominguez, CA
|
—
|
|
19,678
|
|
9,321
|
|
6,305
|
|
20,144
|
|
15,160
|
|
35,304
|
|
5,539
|
|
2007
|
||||||||||
|
1250 Rancho Conejo Boulevard
|
Thousand Oaks, CA
|
—
|
|
1,435
|
|
779
|
|
45
|
|
1,441
|
|
818
|
|
2,259
|
|
364
|
|
2007
|
||||||||||
|
1260 Rancho Conejo Boulevard
|
Thousand Oaks, CA
|
—
|
|
1,353
|
|
722
|
|
(722
|
)
|
675
|
|
678
|
|
1,353
|
|
272
|
|
2007
|
||||||||||
|
1270 Rancho Conejo Boulevard
|
Thousand Oaks, CA
|
—
|
|
1,224
|
|
716
|
|
(2
|
)
|
1,229
|
|
709
|
|
1,938
|
|
315
|
|
2007
|
||||||||||
|
1280 Rancho Conejo Boulevard
|
Thousand Oaks, CA
|
2,326
|
|
2,043
|
|
3,408
|
|
(59
|
)
|
2,051
|
|
3,341
|
|
5,392
|
|
894
|
|
2007
|
||||||||||
|
1290 Rancho Conejo Boulevard
|
Thousand Oaks, CA
|
1,957
|
|
1,754
|
|
2,949
|
|
(165
|
)
|
1,761
|
|
2,777
|
|
4,538
|
|
746
|
|
2007
|
||||||||||
|
100 West Sinclair Street
|
Perris, CA
|
—
|
|
4,894
|
|
3,481
|
|
(5,233
|
)
|
1,819
|
|
1,323
|
|
3,142
|
|
721
|
|
2007
|
||||||||||
|
14050 Day Street
|
Moreno Valley, CA
|
—
|
|
2,538
|
|
2,538
|
|
574
|
|
2,565
|
|
3,084
|
|
5,649
|
|
1,244
|
|
2008
|
||||||||||
|
12925 Marlay Avenue
|
Fontana, CA
|
—
|
|
6,072
|
|
7,891
|
|
303
|
|
6,090
|
|
8,176
|
|
14,266
|
|
4,319
|
|
2008
|
||||||||||
|
18201-18291 Santa Fe
|
Rancho Dominguez, CA
|
—
|
|
6,720
|
|
—
|
|
9,457
|
|
6,897
|
|
9,280
|
|
16,177
|
|
2,523
|
|
2008
|
||||||||||
|
1011 Rancho Conejo
|
Thousand Oaks, CA
|
4,341
|
|
7,717
|
|
2,518
|
|
(169
|
)
|
7,752
|
|
2,313
|
|
10,065
|
|
1,109
|
|
2008
|
||||||||||
|
20700 Denker Avenue
|
Torrance, CA
|
5,290
|
|
5,767
|
|
2,538
|
|
1,397
|
|
5,964
|
|
3,739
|
|
9,703
|
|
2,384
|
|
2008
|
||||||||||
|
18408 Laurel Park Road
|
Rancho Dominguez, CA
|
—
|
|
2,850
|
|
2,850
|
|
913
|
|
2,874
|
|
3,739
|
|
6,613
|
|
1,426
|
|
2008
|
||||||||||
|
19021 S. Reyes Avenue
|
Rancho Dominguez, CA
|
—
|
|
8,183
|
|
7,501
|
|
233
|
|
8,545
|
|
7,372
|
|
15,917
|
|
1,745
|
|
2008
|
||||||||||
|
24870 Nandina Avenue
|
Moreno Valley, CA
|
—
|
|
13,543
|
|
—
|
|
21,277
|
|
6,482
|
|
28,338
|
|
34,820
|
|
4,772
|
|
2012
|
||||||||||
|
6185 Kimball Avenue
|
Chino, CA
|
—
|
|
6,385
|
|
—
|
|
12,343
|
|
6,382
|
|
12,346
|
|
18,728
|
|
2,789
|
|
2013
|
||||||||||
|
5553 Bandini Boulevard
|
Bell, CA
|
—
|
|
32,536
|
|
—
|
|
21,620
|
|
32,540
|
|
21,616
|
|
54,156
|
|
2,925
|
|
2013
|
||||||||||
|
16875 Heacock Street
|
Moreno Valley, CA
|
—
|
|
—
|
|
6,831
|
|
(58
|
)
|
—
|
|
6,773
|
|
6,773
|
|
1,577
|
|
2014
|
||||||||||
|
4710 Guasti Road
|
Ontario, CA
|
5,072
|
|
2,846
|
|
6,564
|
|
213
|
|
2,846
|
|
6,777
|
|
9,623
|
|
1,020
|
|
2014
|
||||||||||
S-13
|
FIRST INDUSTRIAL REALTY TRUST, INC. AND FIRST INDUSTRIAL, L.P.
SCHEDULE III: REAL ESTATE AND ACCUMULATED DEPRECIATION As of December 31, 2018 |
||||||||||||||||||||||||||||
|
|
|
|
|
Initial Cost
|
Costs
Capitalized
Subsequent to
Acquisition or
Completion
and Valuation
Provision
|
Gross Amount Carried
At Close of Period 12/31/18 |
Year
Acquired/
Constructed
|
|||||||||||||||||||||
|
Building Address
|
|
Location
(City/State)
|
(a)
Encumbrances
|
Land
|
Buildings and
Improvements
|
Land
|
Buildings and
Improvements
|
Total
|
Accumulated
Depreciation
12/31/2018
|
|||||||||||||||||||
|
|
|
|
(In thousands)
|
|
||||||||||||||||||||||||
|
17100 Perris Boulevard
|
Moreno Valley, CA
|
—
|
|
6,388
|
|
—
|
|
25,810
|
|
6,395
|
|
25,803
|
|
32,198
|
|
3,379
|
|
2014
|
||||||||||
|
13414 S. Figueroa
|
Los Angeles, CA
|
3,914
|
|
1,701
|
|
—
|
|
6,580
|
|
1,887
|
|
6,394
|
|
8,281
|
|
727
|
|
2014
|
||||||||||
|
3841 Ocean Ranch Boulevard
|
Oceanside, CA
|
—
|
|
4,400
|
|
—
|
|
8,040
|
|
4,400
|
|
8,040
|
|
12,440
|
|
1,014
|
|
2015
|
||||||||||
|
3831 Ocean Ranch Boulevard
|
Oceanside, CA
|
—
|
|
2,693
|
|
—
|
|
4,584
|
|
2,694
|
|
4,583
|
|
7,277
|
|
560
|
|
2015
|
||||||||||
|
3821 Ocean Ranch Boulevard
|
Oceanside, CA
|
—
|
|
2,792
|
|
—
|
|
4,469
|
|
2,792
|
|
4,469
|
|
7,261
|
|
528
|
|
2015
|
||||||||||
|
145 West 134th Street
|
Los Angeles, CA
|
—
|
|
2,901
|
|
2,285
|
|
173
|
|
2,901
|
|
2,458
|
|
5,359
|
|
397
|
|
2015
|
||||||||||
|
6150 Sycamore Canyon Boulevard
|
Riverside, CA
|
—
|
|
3,182
|
|
10,643
|
|
1
|
|
3,182
|
|
10,644
|
|
13,826
|
|
1,257
|
|
2015
|
||||||||||
|
17825 Indian Street
|
Moreno Valley, CA
|
—
|
|
5,034
|
|
22,095
|
|
54
|
|
5,034
|
|
22,149
|
|
27,183
|
|
2,433
|
|
2015
|
||||||||||
|
24901 San Michele Road
|
Moreno Valley, CA
|
—
|
|
1,274
|
|
—
|
|
11,556
|
|
1,274
|
|
11,556
|
|
12,830
|
|
826
|
|
2016
|
||||||||||
|
1445 Engineer Street
|
Vista, CA
|
—
|
|
6,816
|
|
4,417
|
|
3
|
|
6,816
|
|
4,420
|
|
11,236
|
|
600
|
|
2016
|
||||||||||
|
19067 Reyes Avenue
|
Rancho Dominguez, CA
|
—
|
|
9,281
|
|
3,920
|
|
3,474
|
|
9,381
|
|
7,294
|
|
16,675
|
|
446
|
|
2016
|
||||||||||
|
10586 Tamarind Avenue
|
Fontana, CA
|
—
|
|
4,275
|
|
8,275
|
|
228
|
|
4,275
|
|
8,503
|
|
12,778
|
|
424
|
|
2017
|
||||||||||
|
2777 Loker Avenue West
|
Carlsbad, CA
|
11,028
|
|
7,599
|
|
13,267
|
|
122
|
|
7,599
|
|
13,389
|
|
20,988
|
|
822
|
|
2017
|
||||||||||
|
7105 Old 215 Frontage Road
|
Riverside, CA
|
—
|
|
4,900
|
|
—
|
|
12,742
|
|
4,900
|
|
12,742
|
|
17,642
|
|
540
|
|
2017
|
||||||||||
|
28545 Livingston Avenue
|
Valencia, CA
|
—
|
|
9,813
|
|
10,954
|
|
644
|
|
9,813
|
|
11,598
|
|
21,411
|
|
335
|
|
2018
|
||||||||||
|
3801 Ocean Ranch Boulevard
|
Oceanside, CA
|
3,046
|
|
2,907
|
|
6,151
|
|
1
|
|
2,909
|
|
6,150
|
|
9,059
|
|
174
|
|
2018
|
||||||||||
|
3809 Ocean Ranch Boulevard
|
Oceanside, CA
|
3,279
|
|
3,140
|
|
6,964
|
|
(2
|
)
|
3,141
|
|
6,961
|
|
10,102
|
|
180
|
|
2018
|
||||||||||
|
3817 Ocean Ranch Boulevard
|
Oceanside, CA
|
5,132
|
|
5,438
|
|
10,278
|
|
209
|
|
5,442
|
|
10,483
|
|
15,925
|
|
281
|
|
2018
|
||||||||||
|
24385 Nandina Avenue
|
Moreno Valley, CA
|
—
|
|
17,023
|
|
—
|
|
57,083
|
|
17,066
|
|
57,040
|
|
74,106
|
|
237
|
|
2018
|
||||||||||
|
14999 Summit Drive
|
Eastvale, CA
|
—
|
|
1,508
|
|
—
|
|
3,120
|
|
1,508
|
|
3,120
|
|
4,628
|
|
51
|
|
2018
|
||||||||||
|
14969 Summit Drive
|
Eastvale, CA
|
—
|
|
3,847
|
|
—
|
|
11,211
|
|
3,847
|
|
11,211
|
|
15,058
|
|
299
|
|
2018
|
||||||||||
|
14939 Summit Drive
|
Eastvale, CA
|
—
|
|
3,107
|
|
—
|
|
8,273
|
|
3,107
|
|
8,273
|
|
11,380
|
|
138
|
|
2018
|
||||||||||
|
14909 Summit Drive
|
Eastvale, CA
|
—
|
|
7,099
|
|
—
|
|
19,177
|
|
7,099
|
|
19,177
|
|
26,276
|
|
317
|
|
2018
|
||||||||||
|
14940 Summit Drive
|
Eastvale, CA
|
—
|
|
5,423
|
|
—
|
|
13,334
|
|
5,423
|
|
13,334
|
|
18,757
|
|
194
|
|
2018
|
||||||||||
|
14910 Summit Drive
|
Eastvale, CA
|
—
|
|
1,873
|
|
—
|
|
5,290
|
|
1,873
|
|
5,290
|
|
7,163
|
|
77
|
|
2018
|
||||||||||
|
St. Louis
|
||||||||||||||||||||||||||||
|
6821-6857 Hazelwood Avenue
|
Berkeley, MO
|
4,289
|
|
985
|
|
6,205
|
|
1,333
|
|
985
|
|
7,538
|
|
8,523
|
|
3,075
|
|
2003
|
||||||||||
|
13701 Rider Trail North
|
Earth City, MO
|
—
|
|
800
|
|
2,099
|
|
552
|
|
804
|
|
2,647
|
|
3,451
|
|
1,154
|
|
2003
|
||||||||||
|
1908-2000 Innerbelt
|
Overland, MO
|
6,587
|
|
1,590
|
|
9,026
|
|
1,464
|
|
1,591
|
|
10,489
|
|
12,080
|
|
5,236
|
|
2004
|
||||||||||
|
21-25 Gateway Commerce Center
|
Edwardsville, IL
|
—
|
|
1,874
|
|
31,958
|
|
378
|
|
1,921
|
|
32,289
|
|
34,210
|
|
10,970
|
|
2006
|
||||||||||
|
Tampa
|
||||||||||||||||||||||||||||
|
5525 Johns Road
|
Tampa, FL
|
—
|
|
192
|
|
1,086
|
|
274
|
|
200
|
|
1,352
|
|
1,552
|
|
719
|
|
1997
|
||||||||||
|
5709 Johns Road
|
Tampa, FL
|
—
|
|
192
|
|
1,086
|
|
207
|
|
200
|
|
1,285
|
|
1,485
|
|
664
|
|
1997
|
||||||||||
|
5711 Johns Road
|
Tampa, FL
|
—
|
|
243
|
|
1,376
|
|
184
|
|
255
|
|
1,548
|
|
1,803
|
|
796
|
|
1997
|
||||||||||
S-14
|
FIRST INDUSTRIAL REALTY TRUST, INC. AND FIRST INDUSTRIAL, L.P.
SCHEDULE III: REAL ESTATE AND ACCUMULATED DEPRECIATION
As of December 31, 2018
|
|||||||||||||||||||||||||||||
|
|
|
|
|
Initial Cost
|
Costs
Capitalized
Subsequent to
Acquisition or
Completion
and Valuation
Provision
|
Gross Amount Carried
At Close of Period 12/31/18
|
Year
Acquired/
Constructed
|
||||||||||||||||||||||
|
Building Address
|
|
Location
(City/State)
|
(a)
Encumbrances
|
Land
|
Buildings and
Improvements
|
Land
|
Buildings and
Improvements
|
Total
|
Accumulated
Depreciation
12/31/2018
|
||||||||||||||||||||
|
|
|
|
(In thousands)
|
|
|||||||||||||||||||||||||
|
5455 W Waters Avenue
|
Tampa, FL
|
—
|
|
307
|
|
1,742
|
|
370
|
|
326
|
|
2,093
|
|
2,419
|
|
1,056
|
|
1997
|
|
||||||||||
|
5553 W Waters Avenue
|
Tampa, FL
|
—
|
|
307
|
|
1,742
|
|
310
|
|
326
|
|
2,033
|
|
2,359
|
|
1,037
|
|
1997
|
|
||||||||||
|
5501 W Waters Avenue
|
Tampa, FL
|
—
|
|
215
|
|
871
|
|
403
|
|
242
|
|
1,247
|
|
1,489
|
|
587
|
|
1997
|
|
||||||||||
|
5503 W Waters Avenue
|
Tampa, FL
|
—
|
|
98
|
|
402
|
|
197
|
|
110
|
|
587
|
|
697
|
|
291
|
|
1997
|
|
||||||||||
|
5555 W Waters Avenue
|
Tampa, FL
|
—
|
|
213
|
|
1,206
|
|
552
|
|
221
|
|
1,750
|
|
1,971
|
|
761
|
|
1997
|
|
||||||||||
|
5557 W Waters Avenue
|
Tampa, FL
|
—
|
|
59
|
|
335
|
|
51
|
|
62
|
|
383
|
|
445
|
|
197
|
|
1997
|
|
||||||||||
|
5463 W Waters Avenue
|
Tampa, FL
|
—
|
|
497
|
|
2,751
|
|
1,462
|
|
560
|
|
4,150
|
|
4,710
|
|
1,892
|
|
1998
|
|
||||||||||
|
5461 W Waters Avenue
|
Tampa, FL
|
—
|
|
261
|
|
—
|
|
1,322
|
|
265
|
|
1,318
|
|
1,583
|
|
662
|
|
1998
|
|
||||||||||
|
5481 W Waters Avenue
|
Tampa, FL
|
—
|
|
558
|
|
—
|
|
3,570
|
|
561
|
|
3,567
|
|
4,128
|
|
1,161
|
|
1999
|
|
||||||||||
|
4908 Tampa West Boulevard
|
Tampa, FL
|
—
|
|
2,622
|
|
8,643
|
|
(814
|
)
|
2,635
|
|
7,816
|
|
10,451
|
|
3,924
|
|
2005
|
|
||||||||||
|
Other
|
|||||||||||||||||||||||||||||
|
1815-1957 South 4650 West
|
Salt Lake City, UT
|
6,045
|
|
1,707
|
|
10,873
|
|
62
|
|
1,713
|
|
10,929
|
|
12,642
|
|
3,980
|
|
2006
|
|
||||||||||
|
3200 Pond Station
|
Jefferson County, KY
|
—
|
|
2,074
|
|
—
|
|
9,681
|
|
2,120
|
|
9,635
|
|
11,755
|
|
2,822
|
|
2007
|
|
||||||||||
|
581 Welltown Road/Tyson Boulevard
|
Winchester, VA
|
—
|
|
2,320
|
|
—
|
|
11,109
|
|
2,401
|
|
11,028
|
|
13,429
|
|
3,158
|
|
2007
|
|
||||||||||
|
7501 NW 106th Terrace
|
Kansas City, MO
|
—
|
|
4,152
|
|
—
|
|
13,697
|
|
|
4,228
|
|
13,621
|
|
|
17,849
|
|
3,481
|
|
2008
|
|
||||||||
|
600 Greene Drive
|
Greenville, KY
|
—
|
|
294
|
|
8,570
|
|
(727
|
)
|
|
296
|
|
7,841
|
|
|
8,137
|
|
6,453
|
|
2008
|
|
||||||||
|
Developments in Process
|
|||||||||||||||||||||||||||||
|
First Park Fairburn
|
Fairburn, GA
|
—
|
|
3,650
|
|
—
|
|
5,284
|
|
3,650
|
|
5,284
|
|
8,934
|
|
—
|
|
2014
|
|
||||||||||
|
First Perry Logistics Center
|
Perris, CA
|
—
|
|
1,780
|
|
—
|
|
4,550
|
|
1,788
|
|
4,542
|
|
6,330
|
|
—
|
|
2016
|
|
||||||||||
|
First Mountain Creek Distribution Center
|
Dallas, TX
|
—
|
|
4,675
|
|
—
|
|
7,468
|
|
4,779
|
|
7,364
|
|
12,143
|
|
—
|
|
2015
|
|
||||||||||
|
First Park 121 Building I
|
Lewisville, TX
|
—
|
|
3,963
|
|
—
|
|
3,421
|
|
3,963
|
|
3,421
|
|
7,384
|
|
—
|
|
2018
|
|
||||||||||
|
First Park 121 Building II
|
Lewisville, TX
|
—
|
|
2,243
|
|
—
|
|
1,938
|
|
2,243
|
|
1,938
|
|
4,181
|
|
—
|
|
2018
|
|
||||||||||
|
First Aurora Commerce Center Bldg D
|
Aurora, CO
|
—
|
|
4,881
|
|
—
|
|
8,021
|
|
4,886
|
|
8,016
|
|
12,902
|
|
—
|
|
2018
|
|
||||||||||
|
First Glacier Logistics Center
|
Sumner, WA
|
—
|
|
2,643
|
|
—
|
|
4,023
|
|
2,643
|
|
4,023
|
|
6,666
|
|
—
|
|
2018
|
|
||||||||||
|
Land Parcels
|
|||||||||||||||||||||||||||||
|
Land Parcels
|
2,473
|
|
167,785
|
|
3,225
|
|
33,539
|
|
163,868
|
|
|
40,681
|
|
|
204,549
|
|
4,341
|
|
—
|
|
|||||||||
|
Total
|
297,716
|
|
919,414
|
|
1,526,633
|
|
1,227,597
|
|
|
909,318
|
|
2,764,326
|
|
3,673,644
|
|
811,784
|
|
||||||||||||
S-15
FIRST INDUSTRIAL REALTY TRUST, INC. AND FIRST INDUSTRIAL, L.P.
SCHEDULE III: REAL ESTATE AND ACCUMULATED DEPRECIATION
As of December 31, 2018
NOTES:
|
(a)
|
See description of encumbrances in Note 4 of the Notes to Consolidated Financial Statements. For purposes of this schedule the total principal balance of a mortgage loan payable that is collateralized by a pool of properties is allocated among the properties in the pool based on each property's carrying balance.
|
|
(b)
|
Depreciation is computed based upon the following estimated lives:
|
|
Buildings and Improvements
|
7 to 50 years
|
|
Land Improvements
|
5 to 20 years
|
|
Tenant Improvements
|
Lease Term
|
At December 31, 2018, the aggregate cost of land and buildings and equipment for federal income tax purpose was approximately
$3.5 billion
(excluding construction in progress).
The changes in investment in real estate for the three years ended December 31, are as follows:
|
|
2018
|
2017
|
2016
|
||||||||
|
|
(In thousands)
|
||||||||||
|
Balance, Beginning of Year
|
$
|
3,495,745
|
|
$
|
3,388,611
|
|
$
|
3,297,649
|
|
||
|
Acquisition of Real Estate Assets
|
162,769
|
|
168,517
|
|
108,538
|
|
|||||
|
Construction Costs and Improvements
|
190,383
|
|
137,361
|
|
167,342
|
|
|||||
|
Disposition of Real Estate Assets
|
(148,408
|
)
|
(170,928
|
)
|
(153,364
|
)
|
|||||
|
Impairment of Real Estate
|
(2,756
|
)
|
—
|
|
—
|
|
|||||
|
Write-off of Fully Depreciated and Other Assets
|
(24,089
|
)
|
(27,816
|
)
|
(31,554
|
)
|
|||||
|
Balance, End of Year Including Real Estate Held for Sale
|
$
|
3,673,644
|
|
$
|
3,495,745
|
|
$
|
3,388,611
|
|
||
|
Real Estate Held for Sale
|
—
|
|
—
|
|
(3,697
|
)
|
|||||
|
Balance, End of Year Excluding Real Estate Held for Sale
|
$
|
3,673,644
|
|
$
|
3,495,745
|
|
$
|
3,384,914
|
|
||
S-16
The changes in accumulated depreciation for the three years ended December 31, are as follows:
|
|
2018
|
2017
|
2016
|
||||||||
|
|
(In thousands)
|
||||||||||
|
Balance, Beginning of Year
|
$
|
789,919
|
|
$
|
797,919
|
|
$
|
792,501
|
|
||
|
Depreciation for Year
|
94,626
|
|
94,078
|
|
95,514
|
|
|||||
|
Disposition of Real Estate Assets
|
(49,144
|
)
|
(78,844
|
)
|
(62,634
|
)
|
|||||
|
Write-off of Fully Depreciated and Other Assets
|
(23,617
|
)
|
(23,234
|
)
|
(27,462
|
)
|
|||||
|
Balance, End of Year Including Real Estate Held for Sale
|
$
|
811,784
|
|
$
|
789,919
|
|
$
|
797,919
|
|
||
|
Real Estate Held for Sale
|
—
|
|
—
|
|
(1,427
|
)
|
|||||
|
Balance, End of Year Excluding Real Estate Held for Sale
|
$
|
811,784
|
|
$
|
789,919
|
|
$
|
796,492
|
|
||
S-17
SIGNATURES
Pursuant to the requirements of Section 13 or 15 (d) of the Securities Exchange Act of 1934, the registrant has duly caused this report to be signed on its behalf by the undersigned, thereunto duly authorized.
|
FIRST INDUSTRIAL REALTY TRUST, INC.
|
||
|
By:
|
/
S
/
P
ETER
E. B
ACCILE
|
|
|
|
Peter E. Baccile
President, Chief Executive Officer and Director (Principal Executive Officer)
|
|
Date:
February 19, 2019
|
By:
|
/
S
/
S
COTT
A. M
USIL
|
|
|
|
Scott A. Musil
Chief Financial Officer
(Principal Financial Officer)
|
|
Date:
February 19, 2019
|
By:
|
/
S
/ S
ARA
E. N
IEMIEC
|
|
|
|
Sara E. Niemiec
Chief Accounting Officer
(Principal Accounting Officer)
|
|
Date:
February 19, 2019
Pursuant to the requirements of the Securities Exchange Act of 1934, this report has been signed below by the following persons on behalf of the Registrant and in the capacities and on the dates indicated.
|
Signature
|
Title
|
Date
|
||
|
/
S
/ B
RUCE
W. D
UNCAN
|
Chairman of the Board of Directors
|
February 19, 2019
|
||
|
Bruce W. Duncan
|
||||
|
/
S
/ P
ETER
E. B
ACCILE
|
President, Chief Executive Officer and Director
|
February 19, 2019
|
||
|
Peter E. Baccile
|
||||
|
/
S
/ J
OHN
R
AU
|
Lead Independent Director
|
February 19, 2019
|
||
|
John Rau
|
||||
|
/
S
/ M
ATTHEW
S. D
OMINSKI
|
Director
|
February 19, 2019
|
||
|
Matthew S. Dominski
|
||||
|
/
S
/ H. P
ATRICK
H
ACKETT
, J
R
.
|
Director
|
February 19, 2019
|
||
|
H. Patrick Hackett, Jr.
|
||||
|
/
S
/ D
ENISE
A. O
LSEN
|
Director
|
February 19, 2019
|
||
|
Denise A. Olsen
|
||||
|
/
S
/ L. P
ETER
S
HARPE
|
Director
|
February 19, 2019
|
||
|
L. Peter Sharpe
|
||||
|
/
S
/ W. E
DWIN
T
YLER
|
Director
|
February 19, 2019
|
||
|
W. Edwin Tyler
|
||||
S-18
SIGNATURES
Pursuant to the requirements of Section 13 or 15 (d) of the Securities Exchange Act of 1934, the registrant has duly caused this report to be signed on its behalf by the undersigned, thereunto duly authorized.
|
FIRST INDUSTRIAL, L.P.
|
||
|
By:
|
FIRST INDUSTRIAL REALTY TRUST, INC.
|
|
|
as general partner
|
||
|
By:
|
/
S
/ P
ETER
E. B
ACCILE
|
|
|
|
Peter E. Baccile
President, Chief Executive Officer and Director (Principal Executive Officer)
|
|
Date:
February 19, 2019
|
By:
|
/
S
/ S
COTT
A. M
USIL
|
|
|
|
Scott A. Musil
Chief Financial Officer
(Principal Financial Officer)
|
|
Date:
February 19, 2019
|
By:
|
/
S
/
S
ARA
E. N
IEMIEC
|
|
|
|
Sara E. Niemiec
Chief Accounting Officer
(Principal Accounting Officer)
|
|
Date:
February 19, 2019
Pursuant to the requirements of the Securities Exchange Act of 1934, this report has been signed below by the following persons on behalf of the Registrant and in the capacities and on the dates indicated.
|
Signature
|
Title
|
Date
|
||
|
/
S
/ B
RUCE
W. D
UNCAN
|
Chairman of the Board of Directors
|
February 19, 2019
|
||
|
Bruce W. Duncan
|
||||
|
/
S
/ P
ETER
E. B
ACCILE
|
President, Chief Executive Officer and Director
|
February 19, 2019
|
||
|
Peter E. Baccile
|
||||
|
/
S
/ J
OHN
R
AU
|
Lead Independent Director
|
February 19, 2019
|
||
|
John Rau
|
||||
|
/
S
/ M
ATTHEW
S. D
OMINSKI
|
Director
|
February 19, 2019
|
||
|
Matthew S. Dominski
|
||||
|
/
S
/ H. P
ATRICK
H
ACKETT
, J
R
.
|
Director
|
February 19, 2019
|
||
|
H. Patrick Hackett, Jr.
|
||||
|
/
S
/ D
ENISE
A. O
LSEN
|
Director
|
February 19, 2019
|
||
|
Denise A. Olsen
|
||||
|
/
S
/ L. P
ETER
S
HARPE
|
Director
|
February 19, 2019
|
||
|
L. Peter Sharpe
|
||||
|
/
S
/ W. E
DWIN
T
YLER
|
Director
|
February 19, 2019
|
||
|
W. Edwin Tyler
|
||||
S-19
TABLE OF CONTENTS
Part IItem 1. BusinessItem 1A. Risk FactorsItem 1B. Unresolved Sec CommentsItem 2. PropertiesItem 3. Legal ProceedingsItem 4. Mine Safety DisclosuresPart IIItem 6. Selected Financial DataItem 7. Management's Discussion and Analysis Of Financial Condition and Results Of OperationsItem 7A. Quantitative and Qualitative Disclosures About Market RiskItem 8. Financial Statements and Supplementary DataItem 9. Changes in and Disagreements with Accountants on Accounting and Financial DisclosureItem 9A. Controls and ProceduresItem 9B. Other InformationPart IIIItem 10, 11, 12, 13 and 14Part IVItem 15. Exhibits and Financial Statement SchedulesItem 16. Form 10-k Summary