FREEZE TAG, INC.
10-Ks and 10-Qs
UNITED STATES
SECURITIES AND EXCHANGE COMMISSION
Washington, D.C. 20549
Form 10-K
| x |
ANNUAL REPORT UNDER SECTION 13 OR 15(d) OF THE SECURITIES EXCHANGE ACT OF 1934
|
For the fiscal year ended December 31, 2012
OR
| o |
TRANSITION REPORT UNDER SECTION 13 OR 15(d) OF THE SECURITIES EXCHANGE ACT OF 1934
|
For the transition period from_____________ to _____________.
Commission file number
000-54267
FREEZE TAG, INC.
(Exact name of registrant as specified in its charter)
|
Delaware
|
20-4532392
|
|
|
(State or other jurisdiction of
incorporation or organization)
|
(I.R.S. Employer
Identification No.)
|
|
|
228 W. Main Street, 2nd Floor
Tustin, California
|
92780
|
|
|
(Address of principal executive offices)
|
(Zip Code)
|
Registrant’s telephone number, including area code
(714) 210-3850
Securities registered pursuant to Section 12(b) of the Act:
|
Title of each class
|
Name of each exchange on which registered
|
|
|
None
|
None
|
Securities registered pursuant to Section 12(g) of the Act:
Common Stock, par value $0.001
(Title of class)
Indicate by check mark if the registrant is a well-known seasoned issuer, as defined in Rule 405 of the Securities Act. Yes
o
No
x
Indicate by check mark if the registrant is not required to file reports pursuant to Section 13 or 15(d) of the Act. Yes
x
No
o
Indicate by check mark whether the registrant (1) has filed all reports required to be filed by Section 13 or 15(d) of the Securities Exchange Act of 1934 during the preceding 12 months (or for such shorter period that the registrant was required to file such reports), and (2) has been subject to such filing requirements for the past 90 days. Yes
x
No
o
Indicate by check mark whether the registrant has submitted electronically and posted on its corporate Website, if any, every Interactive Data File required to be submitted and posted pursuant to Rule 405 of Regulation S-T (§232.405 of this chapter) during the preceding 12 months (or for such shorter period that the registrant was required to and post such files). Yes
x
No
o
Indicate by check mark if disclosure of delinquent filers pursuant to Item 405 of Regulation S-K is not contained herein, and will not be contained, to the best of registrant's knowledge, in definitive proxy or information statements incorporated by reference in Part III of this Form 10-K or any amendment to this Form 10-K.
o
Indicate by check mark whether the registrant is a large accelerated filer, an accelerated filer, a non-accelerated filer, or a smaller reporting company. See definitions of “large accelerated filer,” “accelerated filer” and “smaller reporting company” in Rule 12b-2 of the Exchange Act. (Check one):
| Large accelerated filer | o | Accelerated filer | o |
| Non-accelerated filer | o | Smaller reporting company | x |
Indicate by check mark whether the registrant is a shell company (as defined in Rule 12b-2 of the Act). Yes
o
No
x
Aggregate market value of the voting stock held by non-affiliates as of June 30, 2012:
$184,550
as based on the closing price of $0.0048 on June 29, 2012 of our common stock. The voting stock held by non-affiliates on that date consisted of 38,447,871 shares of common stock.
Applicable Only to Registrants Involved in Bankruptcy Proceedings During the Preceding Five Years:
Indicate by check mark whether the registrant has filed all documents and reports required to be filed by Sections 12, 13 or 15(d) of the Exchange Act of 1934 subsequent to the distribution of securities under a plan confirmed by a court. Yes
o
No
o
Indicate the number of shares outstanding of each of the registrant’s classes of common stock, as of the latest practicable date. As of March 29, 2013, there were
77,724,404
shares of common stock, par value $0.001, issued and outstanding.
Documents Incorporated by Reference
List hereunder the following documents if incorporated by reference and the Part of the Form 10-K (e.g., Part I, Part II, etc.) into which the document is incorporated: (1) Any annual report to security holders; (2) Any proxy or information statement; and (3) Any prospectus filed pursuant to rule 424(b) or (c) of the Securities Act of 1933. The listed documents should be clearly described for identification purposes (e.g., annual report to security holders for fiscal year ended December 24, 1980).
None.
Freeze Tag, Inc.
TABLE OF CONTENTS
| PART I | |||||
| ITEM 1 – |
BUSINESS
|
3 | |||
| ITEM 1A – |
RISK FACTORS
|
12 | |||
| ITEM 1B – |
UNRESOLVED STAFF COMMENTS
|
23 | |||
| ITEM 2 – |
PROPERTIES
|
23 | |||
| ITEM 3 – |
LEGAL PROCEEDINGS
|
23 | |||
| ITEM 4 – |
MINE SAFETY DISCLOSURES
|
23 | |||
| PART II | |||||
| ITEM 5 – |
MARKET FOR REGISTRANT’S COMMON EQUITY, RELATED STOCKHOLDER MATTERS AND ISSUER PURCHASES OF EQUITY SECURITIES
|
24 | |||
| ITEM 6 – |
SELECTED FINANCIAL DATA
|
27 | |||
| ITEM 7 – |
MANAGEMENT’S DISCUSSION AND ANALYSIS OF FINANCIAL CONDITION AND RESULTS OF OPERATION
|
28 | |||
| ITEM 7A – |
QUANTITATIVE AND QUALITATIVE DISCLOSURES ABOUT MARKET RISK
|
38 | |||
| ITEM 8 – |
FINANCIAL STATEMENTS AND SUPPLEMENTARY DATA
|
39 | |||
| ITEM 9 – |
CHANGES IN AND DISAGREEMENTS WITH ACCOUNTANTS ON ACCOUNTING AND FINANCIAL DISCLOSURE
|
40 | |||
| ITEM 9A – |
CONTROLS AND PROCEDURES
|
41 | |||
| ITEM 9B – |
OTHER INFORMATION
|
43 | |||
| PART III | |||||
| ITEM 10 – |
DIRECTORS, EXECUTIVE OFFICERS AND CORPORATE GOVERNACE
|
44 | |||
| ITEM 11 – |
EXECUTIVE COMPENSATION
|
46 | |||
| ITEM 12 – |
SECURITY OWNERSHIP OF CERTAIN BENEFICIAL OWNERS AND MANAGEMENT AND RELATED STOCKHOLDER MATTERS
|
48 | |||
| ITEM 13 – |
CERTAIN RELATIONSHIPS AND RELATED TRANSACTIONS, AND DIRECTOR INDEPENDENCE
|
48 | |||
| ITEM 14 – |
PRINCIPAL ACCOUNTING FEES AND SERVICES
|
50 | |||
| PART IV | |||||
| ITEM 15 – |
EXHIBITS, FINANCIAL STATEMENT SCHEDULES
|
51 | |||
PRINTER TO PAGINATE DOCUMENT, UPDATE THE INDEX ABOVE,
AND THEN REMOVE THIS NOTE BEFORE FILING
2
Explanatory Note
This Annual Report includes forward-looking statements within the meaning of the Securities Exchange Act of 1934 (the “Exchange Act”). These statements are based on management’s beliefs and assumptions, and on information currently available to management. Forward-looking statements include the information concerning possible or assumed future results of operations of the Company set forth under the heading “Management's Discussion and Analysis of Financial Condition or Plan of Operation.” Forward-looking statements also include statements in which words such as “expect,” “anticipate,” “intend,” “plan,” “believe,”
“estimate,” “consider” or similar expressions are used.
Forward-looking statements are not guarantees of future performance. They involve risks, uncertainties and assumptions. The Company's future results and shareholder values may differ materially from those expressed in these forward-looking statements. Readers are cautioned not to put undue reliance on any forward-looking statements.
Corporate History
We were incorporated as
Freeze Tag, Inc. in February 2006 in the State of Delaware. In March 2006, Freeze Tag, LLC, our predecessor which was formed in October 2005, was merged with and into Freeze Tag, Inc.
Business Overview
We are in the business of acquiring or developing and publishing casual games. We obtain games through three main sources: licenses, creation of original games, and the use of third-party developers. Most of the games with which we are involved are published in one or more of two platforms, or methods of distribution. These platforms are
PC/Mac downloads, and mobile.
Developing Casual Games
We acquire and develop games through licensing arrangements, the creation of our own original games, and through the use of third-party game developers.
Licensed Games
We may develop a game around a well known brand pursuant a license agreement from the owner of that brand. For example, we have a license agreement with the Ohio Art Company that allowed us to develop and distribute a game around their Etch A Sketch® brand. In exchange for the license, we pay a royalty to the Ohio Art Company based on our revenues from that product.
Our cost to develop a “licensed game” is the same as our cost to develop Freeze Tag original game plus royalty payments to the licensor, some of which may be paid in the form of non-refundable up-front royalty advances. The costs involved in developing original content games can range from $25,000 to $250,000 depending on the platform (iPhone/iPad vs. PC) and complexity of the game (simple puzzle vs. complex adventure genre). The average cost to develop an iPhone/iPad game is $200,000. The average cost to develop a PC/Mac game is $250,000. For a “licensed game” in addition to these development costs we usually have a royalty payment owed to the licensor of the intellectual property,
which is usually 10% to 20% of the revenue collected from the game. At times we pay a portion of this royalty in the form of an up-front, non-refundable royalty advance, which typically is in the range of $5,000 to $20,000, but varies by game and is negotiated on a case-by-case basis with the owner of the intellectual property.
3
Our gross profit margins may be lower on a licensed game compared to an original game because of the royalty payment we pay to the licensor, which is usually 10% to 20% of the revenue from such game, but the sales can be much higher because of the recognition of the licensed title or brand by the casual game consumer. Brand names that are familiar to a casual game consumer create a sense of trust and familiarity that often increases sales.
In the past, our licensed games included Etch a Sketch®, Concentration, Nertz, Can You See What I See?, Can You See What I See? Dream Machine, Amelia Earhart. Going forward (2013), we have a current licensing agreement with Ohio Art Company (Etch A Sketch).
Freeze Tag Original Content
We have created, and will continue to create, original games to put in our portfolio. In the past we hired one or more contract engineers on a “work-for-hire” basis to create the game for us, and we pay that engineer or engineers a fixed fee for their work, known as a development fee. This development fee
can range from $15,000 to as much as $250,000, depending on the amount and
complexity of the work involved. While we still rely on contract engineers to develop some of our games, during 2012 we also hired in-house software
engineers to develop games based on our own content. When we distribute the game, all of the revenues are ours to keep, unless we have negotiated a revenue share (or royalty) with the contract engineer(s).
The costs involved in developing Freeze Tag original content games can range from $25,000 to $250,000, depending on the development platform (iPhone/iPad vs. PC) and complexity of the game (simple vs. complex). The average cost to develop an iPhone game is $200,000. The average cost to develop a PC/Mac game is $250,000.
Our gross profit margins are usually highest when we distribute our own original content, but we also assume all of the risk because we have paid to develop the game in advance, without knowing whether it will be a success or not. In addition, because there is no existing brand associated with an original game, we have to create the market for the game ourselves.
Our original content games are
Grimm Reaper®: Hidden Tales
,
Victorian Mysteries®: The Yellow Room, Victorian Mysteries®: The Moonstone
,
Victorian Mysteries®: Woman in White
,
Unsolved Mystery Club®: Ancient Astronauts, Unsolved Mystery Club®: Amelia Earhart
,
The Conjurer
(rights sold to Real Networks, and
Real Detectives
(rights sold to Real Networks). We are currently working on the next games in the
Victorian Mysteries
and
Unsolved Mystery Club
series
.
In 2013, we will be launching additional games we hope will become franchises or series in the future.
Publishing Third-Party Developer Titles
We often have a variety of independent developers working with us to build licensed and original titles for us. During the course of our working relationship, these developers sometimes bring a concept or a partially finished game to us for consideration. If we believe the title has merit and the potential to generate significant revenues, then we will contract with the developer to finish the game to our specifications. We will guide them through the development process and, most often, we will own certain intellectual property rights to the finished game. If we don’t own the game code, then we will at least own significant components of the intellectual
property such as the name or character likeness.
Third party developers are attracted to working with us because we provide them creative guidance to ensure their game is market-ready, development funds to help them finish their game, and marketing expertise and distribution relationships to get their game to market and create an ongoing revenue stream. These developers often underestimate how much time and money is required in order to complete development of a game. They approach us to help them fund the completion of their game (usually an amount far less than the cost for Freeze Tag to develop an original title), in exchange for a percentage of the revenue generated by the game over a period of time and the transfer of certain intellectual property
rights to us.
4
The risks are lower with third party games because the amount of upfront money required tends to be less than if we were developing the entire game. On occasion, there are games that are 90% finished when they come to us and they only require a small amount of development money to complete. In these circumstances, we can purchase rights in or ownership of a game or portion of the intellectual property (such as the name of the game) in exchange for very little out-of-pocket costs. However, the gross margin is lower than the margin generated by original titles because the developer not only shares in the risk (by having incurred a greater portion of the development costs themselves), but also generally receives a
royalty on the back end, usually 20% to 50% of net sales.
Compared to the costs incurred by in-house development projects, our development costs involved in creating games by third party developers are generally low due to the fact that typically when developers bring products to us for publishing consideration, they have already completed or partially completed developing the game. Therefore, we only incur partial development costs in order to acquire distribution rights to publish the third party title. These costs are usually associated with “finishing” final stages of development, which range anywhere from $5,000 to $25,000 per title.
Our third-party developer titles include
Xango Tango
(we own the Intellectual Property (IP)),
Paper Chase
(we own the IP), and
Letter Lab
(we own the IP).
Distributing Casual Games
Once a game is developed, we distribute it through one of three methods. The majority of our games are downloaded onto a PC or Mac computer over the Internet. A smaller but growing percentage of our games are distributed over the Apple or Android platforms.
Try-before-you-buy
All of our games are available for a limited period of time for free. This is the standard format in the industry, and applies to all three of our methods of distribution. Once required to purchase a game, the purchase price ranges from $2.99 to $19.99. On (industry) average, 1% of the users purchase a game after they try it. Our games are purchased by an average of 4% to 5% of the users who try it.
PC/Mac Downloadable Distribution
All of our games are available for PC or Mac download.
Most of the time, our customers find our games through a game website, such as
www.bigfishgames.com
or some other retail site such as
www.amazon.com
. Our distribution partners include, but are not limited, the following: Yahoo!, MSN Games, Amazon.com, Big Fish Games, Steam, Exent/Verizon, Apple, Game House, Shockwave, and Oberon.
Mobile Distribution – High Growth Opportunities
At the current time, Apple is leading the way in mobile gaming devices with its iPhone (smartphone) and iPad (tablet) products. However, smartphones and tablets based on Google’s Android operating system are proliferating rapidly. Our Etch A Sketch® application was one of the first 500 applications introduced at the same time as the iPhone (2008), so we have been working with Apple since the launch of the iPhone. In 2012, we developed several new applications for mobile devices like iPhone, iPad, and Android devices, including the new “tablet” devices, which we plan to launch in 2013.
5
The most promising area of growth (for gaming companies) in mobile distribution is the new wave of “tablet” devices that appear to be very popular with consumers. The first tablet, Apple’s iPad, has been wildly successful, selling millions of units. Following Apple, many manufacturers, including Motorola (Xoom), Samsung (Galaxy), and RIM (Playbook) have launched tablet devices. With larger screen sizes, crisp colorful graphics capabilities and speedy processors, these tablets offer tremendous opportunities for games and other entertainment applications (such as electronic books and videos) that consumers enjoy.
In addition to the rapid growth that we believe will continue in the smartphone arena (iOS and Android), we believe that the growth in tablet devices will fuel a whole new wave of increased revenue opportunities in the casual gaming market. We intend to create games that will work on these new smartphone and tablet platforms now and in the future.
Free-to-Play (Freemium) Business Model
Research shows that more games are being played on mobile devices than ever before. Key market factors have emerged which have dramatically increased the addressable market for our products:
|
·
|
The release of more free games has brought more players;
|
|
·
|
The portability/convenience of mobile devices has engaged more people who did not play games before;
|
|
·
|
The introduction of lower priced mobile devices have resulted in high demand for tablets and smartphones.
|
Thus, more players plus more devices equals a large addressable market.
Free-to-play gaming describes games that are available to be downloaded and played for free, and generate revenue from sources such as in-game purchases (which unlock items and allow the user to progress more quickly), advertising and cross promotion of other titles. The majority of the top grossing games on the Apple and Android app stores are free-to-play or freemium games.
During the course of the last 12 months, we have made a strategy shift to begin designing and developing these games. They have a longer development lifecycle, which is highlighted by releasing a game into the market, testing it based on metrics such as conversion rates, user spending, and other key metrics, and then making changes to the game based on the feedback and preferences of customers.
Business Strategy
Our strategy is to first develop and publish original casual game content on the high growth platforms and devices such as smartphones and tablets (Apple and Android), and then follow with PC/Mac digital download versions.
In addition to attacking the high growth devices and digital distribution channels, we are creating original intellectual property. Wherever possible, we own registered trademark protection for properties we develop. As the digital markets evolve, there are and will continue to be many competitors who will imitate successful game properties. To date, we have received registered trademark approval from the United States Patent and Trademark Office for the following marks: Unsolved Mystery®, Unsolved Mystery Club®, Ancient Astronauts® and Victorian Mysteries®, Grimm Reaper®, Rocket Weasel® for all gaming platforms; and received
preliminary approval on Party Animals™. These marks will enable us to defend against copycats who may try to incorporate these keywords into their game titles. We are continuously creating, researching and investigating new intellectual property (names and marks) that will not only provide us with unique and valuable marketing assets but also help us defend against unauthorized use or infringement.
6
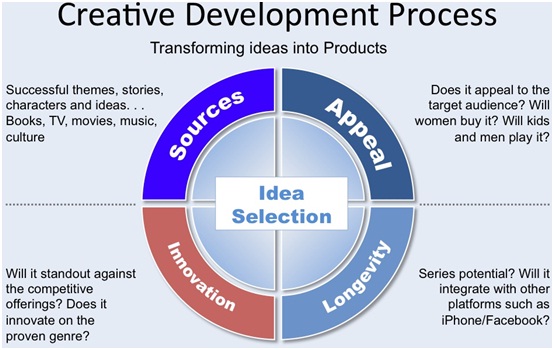
Our Production Process – How Do We Make a Game?
We have learned that establishing and following a rigid process is essential to producing commercially successful products, regardless of the platform. The process all begins with the creative development process. The chart below describes the approach we use to filter ideas and make final decisions on which games we will actually produce. After choosing the game that we will focus on, we write a detailed design document. A thorough design document insures that all of those involved in the creation of the game have a common reference source throughout the production process. Also critical to producing high quality games, a test plan accompanies every design document. Not only do we test for bugs, but also we test
the game for usability. Since most casual gamers do not want to read instructions, it is critical that the finished game be easy to play by just pointing and clicking at objects on the screen. This is the way most casual gamers discover games.
As a publisher and developer of games, we have developed expertise in three core aspects of game production. These core competencies help to give us a competitive advantage in the industry. They are listed below, with the resulting benefit also identified.
|
1.
|
Create High Quality Products (including art and sound assets). Benefit: Provides high value to distribution partners and consumers, resulting in increased downloads and purchases.
|
|
2.
|
Maintain Flexible Engineering Tools and Processes. Benefit: Decreases time-to-market delivery of products.
|
|
3.
|
Minimize Risk by doing the following: 1) selecting proven genres, 2) keeping development costs low, and 3) modifying designs “on the fly” based on consumer feedback. Benefit: Increases the number of games released per year and decreases reliance on any one title’s success, ultimately improving return on investment for each game.
|
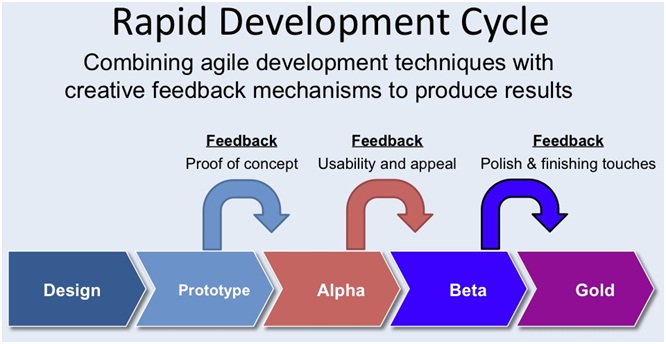
How Long Does it Take to Develop a Casual Game?
We use a team of development professionals located all over the world, including South America and Europe. We use a development methodology referred to as agile development, which focuses on short development and feedback cycles, leading to shortened development times. Because of this, our costs are reduced, and the availability of an almost unlimited number of engineers and programmers makes our development time shorter than most development studios. In addition, we own a proprietary development framework that we call “Popsicle”. This framework is built on the Python programming language, and allows us to build games that will run on multiple
platforms, including PC, Mac, Apple iOS and Android.
7
The Casual Games Market
The Casual Games Association
The Casual Games Association is the international trade association for casual games professionals. The association has more than 4,000 paid members, including gaming executives, publishers, and developers. The association hosts conferences and publishes research reports on the industry. Their website is
(
http://casualgamesassociation.org/
).
The following statistics are published by the Casual Games Association:
|
·
|
the global market for casual games was $2.25 billion in 2007, and is expected to grow 20% per year in established markets;
|
|
·
|
an estimated 200 million people are playing casual games over the Internet each month in 2007;
|
|
·
|
in 2007, 49% of casual game players were men, and 51% were women. However, in that year, women accounted for 74% of paying casual game players.
|
|
·
|
in 2007, casual game players who paid for a subscription averaged 7 to 15 hours of playing per week. The heaviest times were right after dinner from 7pm – 9pm, and during lunch hours from 11am – 2pm.
|
|
·
|
in 2007, the average play time was short, from five minutes to 20 minutes – though it was common for people to play one game after another for many hours.
|
8
The Competition
Publishers
Casual game industry publishers typically provide funding, development guidance and distribution for casual games for online, retail and mobile platforms. Some of the largest casual game publishers are:
Rovio
(creators of
Angry Birds
) Esbo, Finland
PopCap Games
– acquired by Electronic Arts (creators of
Bejeweled
) Seattle, Washington
Big Fish Games
(creators of
Mystery Case Files
) Seattle, Washington
Zynga
(creators of
Farmville
)
, San Francisco, California
Playdom
, Mountain View, CA (acquired by Disney)
GameHouse
Partners
(division of RealNetworks) Seattle, Washington
iWin
San Francisco, California
Chillingo
, United Kingdom (acquired by Electronic Arts)
Supercell
(creaters of Clash of Clans) Helsinki, Finland
Iplay
(
Oberon Media
) Seattle, Washington & NYC
PlayFirst
San Francisco, California
Distributors
Casual game industry online, retail and mobile distributors typically provide aggregation services for retail distributors. Some online distributors provide tools and services for online retailers to assist them in interfacing with consumers. Some of the largest casual game distributors and retailers of casual games are:
Online Retailers (Portals)
Big Fish Games
Seattle, Washington
RealGames
Seattle, Washington
Oberon Media
Seattle, Washington & NYC
Amazon.com
Seattle, Washington
WildTangent
Redmond, Washington
Exent
Tel Aviv, Israel
Shockwave
San Francisco, California
Yahoo! Games
Santa Monica, California
Mobile Distribution
Apple Computer
(iTunes), Cupertino, California
Google
(Android Market Place), Mountain View, California
Amazon
(Android App Store)
Verizon Wireless
(Android App Store)
Barnes and Noble
(Nook App Store)
Brick and Mortar Distributors
Activision
Santa Monica, California
Encore USA
Los Angeles, California
Focus Multimedia
England, UK
Brick and Mortar Retailers
Gamestop
Grapevine, Texas
Wal-Mart
Bentonville, Arkansas
Best Buy
Minneapolis, Minnesota
Target
Minneapolis, Minnesota
9
Our Intellectual Property
Our intellectual property is an essential element of our business. We use a combination of trademark, patent, copyright, trade secret and other intellectual property laws, confidentiality agreements and license agreements to protect our intellectual property. We have also registered a number of domain names, which we believe will be important to the branding and success of our games. Our employees and independent contractors are required to sign agreements acknowledging that all inventions, trade secrets, works of authorship, developments and other processes generated by them on our behalf are our property, and assigning to us any ownership that they may claim in those works. Despite our precautions, it may
be possible for third parties to obtain and use without consent intellectual property that we own or license. Unauthorized use of our intellectual property by third parties, and the expenses incurred in protecting our intellectual property rights, may adversely affect our business.
We intend to register ownership of software copyrights in the United States as well as seek registration of various trademarks associated with the Company’s name and casual games that we will develop.
In addition, many of our applications are based on or incorporate intellectual properties that we license from third parties. We have both exclusive and non-exclusive licenses to use these properties for terms of up to three years. Our licensed brands include, among others, Etch A Sketch
®
, Amelia Earhart, and Nertz. Our licensors include a number of well-established video game publishers and major media companies, including The Ohio Art Company and Nertz Company.
In addition to attacking the high growth devices and digital distribution channels, we are creating original intellectual property. Wherever possible, we own registered trademark protection for properties we develop. As the digital markets evolve, there are and will continue to be many competitors who will imitate successful game properties. We are investing in trademark protection to create game brands and protect them. For example, we have received approval from the United States Patent and Trademark office to register Unsolved Mystery®, Unsolved Mystery Club®, Ancient Astronauts®, Victorian Mysteries®, Grimm Reaper® and Rocket
Weasel® for all gaming platforms and preliminary approval on Party Animals™. These marks will enable us to defend against copycats who may try to incorporate these terms into their game titles.
From time to time, we may encounter disputes over rights and obligations concerning intellectual property. While we believe that our product and service offerings do not infringe the intellectual property rights of any third party, we cannot assure you that we will prevail in any intellectual property dispute. If we do not prevail in such disputes, we may lose some or all of our intellectual property protection, be enjoined from further sales of the applications determined to infringe the rights of others, and/or be forced to pay substantial royalties to a third party.
Business Acquisitions
In addition to our current operations, we propose to seek, investigate and, if warranted, acquire an interest in one or more businesses. However, as of the date hereof, we have no business opportunities or ventures under contemplation for acquisition or merger. We propose to investigate potential opportunities, particularly focusing upon existing privately held businesses whose owners are willing to consider merging their businesses into our company in order to establish a public trading market for their common stock, and whose managements are willing to operate the acquired businesses as divisions or subsidiaries of our company. The businesses we acquire may or may not need an injection of cash to
facilitate their future operations.
We are primarily interested in other technology opportunities , but we currently do not intend to restrict our search for investment opportunities to any particular industry or geographical location and may, therefore, engage in essentially any business. Our executive officers will review material furnished to them by the proposed merger or acquisition candidates and will ultimately decide if a merger or acquisition is in our best interests and the interests of our shareholders. We intend to source business opportunities through our officers and directors and their contacts. Those contacts include professional advisors such as attorneys and accountants,
securities broker dealers, venture capitalists, members of the financial community, other businesses and others who may present solicited and unsolicited proposals. Management believes that business opportunities and ventures may become available to it due to a number of factors, including, among others: (1) management’s willingness to consider a wide variety of businesses; (2) management’s contacts and acquaintances; and (3) our flexibility with respect to the manner in which we may be able to structure, finance, merge with or acquire any business opportunity.
10
The analysis of new business opportunities will be undertaken by or under the supervision of our executive officers and directors. Inasmuch as we will have limited funds available to search for business opportunities and ventures, we will not be able to expend significant funds on a complete and exhaustive investigation of such business or opportunity. We will, however, investigate, to the extent believed reasonable by our management, such potential business opportunities or ventures by conducting a so-called “due diligence investigation”.
In a so-called “due diligence investigation”, we intend to obtain and review materials regarding the business opportunity. Typically such materials will include information regarding a target business’ products, services, contracts, management, ownership, and financial information. In addition, we intend to cause our officers or agents to meet personally with management and key personnel of target businesses, ask questions regarding our prospects, tour facilities, and conduct other reasonable investigation of the target business to the extent of our limited financial resources and management and technical expertise.
Our Employees
We have 10 employees and/or contractors, 2 of which are our officers, 7 of which are engaged in art production, publishing and development, and 1 of which is engaged in administrative functions. We have a team of over 40 engineers, artists, and developers available to us on an independent contract basis around the world.
Description of Property
Our executive offices are located in Tustin, California, at 228 W. Main Street, 2nd Floor, Tustin, CA 92780. Our office space is approximately 2,000 square feet and the lease is month-to-month at a rate of $1,900 per month.
Available Information
We are a fully reporting issuer, subject to the Securities Exchange Act of 1934. Our Quarterly Reports, Annual Reports, and other filings can be obtained from the SEC’s Public Reference Room at 100 F Street, NE., Washington, DC 20549, on official business days during the hours of 10 a.m. to 3 p.m. You may also obtain information on the operation of the Public Reference Room by calling the Commission at 1-800-SEC-0330. The Commission maintains an Internet site that contains reports, proxy and information statements, and other information regarding issuers that file electronically with the Commission at
http://www.sec.gov
.
Our Internet website address is http://www.freezetag.com.
11
As a smaller reporting company we are not required to provide a statement of risk factors. However, we believe this information may be valuable to our shareholders for this filing. We reserve the right to not provide risk factors in our future filings.
We face risks in developing our games and products and eventually bringing them to market. The following risks are material risks that we face. If any of these risks occur, our business, our ability to achieve revenues, our operating results and our financial condition could be seriously harmed.
Our primary risk factors and other considerations
include:
Risk Factors Related to the Business of the Company
We have a limited operating history and limited historical financial information upon which you may evaluate our performance.
You should consider, among other factors, our prospects for success in light of the risks and uncertainties encountered by companies that, like us, are in their early stages of development. We may not successfully address these risks and uncertainties or successfully implement our existing and new products and services. If we fail to do so, it could materially harm our business and impair the value of our common stock. Even if we accomplish these objectives, we may not generate the positive cash flows or profits we anticipate in the future. We were incorporated in Delaware in February 2006. In March 2006 we merged with Freeze Tag, LLC, our predecessor, which was formed in October 2005. Unanticipated
problems, expenses and delays are frequently encountered in establishing a new business and developing new products and services. These include, but are not limited to, inadequate funding, lack of consumer acceptance, competition, product development, and inadequate sales and marketing. The failure by us to meet any of these conditions would have a materially adverse effect upon us and may force us to reduce or curtail operations. No assurance can be given that we can or will ever operate profitably.
If we are unable to meet our future capital needs, we may be required to reduce or curtail operations.
To date we have relied on cash flow from operations, funding from our founders, and debt financing to fund operations. We have extremely limited cash liquidity and capital resources. Our cash on hand as of December 31, 2012, was $32,744, and our monthly cash flow burn rate is approximately $65,000. For the year ended December 31, 2012, our revenue was $448,924.
Our future capital requirements will depend on many factors, including our ability to market our products successfully, cash flow from operations, and competing market developments. Based on our current financial situation we may have difficulty continuing our operations at their current level, or at all, if we do not receive additional financing in the near future. Consequently, although we currently have no specific plans or arrangements for financing, we intend to raise funds through private placements, public offerings or other financings. Any equity financings would result in dilution to our then-existing stockholders. Sources of debt financing may result in higher interest expense. Any financing, if
available, may be on unfavorable terms. If adequate funds are not obtained, we may be required to reduce or curtail operations. We anticipate that our existing capital resources will not be adequate to satisfy our operating expenses and capital requirements for any length of time. However, this estimate of expenses and capital requirements may prove to be inaccurate.
Debt financing is difficult to obtain in the current credit markets. This difficulty may make future acquisitions either unlikely, or too difficult and expensive. This could materially adversely affect our company and the trading price of our Stock.
12
Raising capital by borrowing could be risky
If we were to raise capital by borrowing to fund our operations or acquisitions, it could be risky. Borrowing typically results in less dilution than in connection with equity financings, but it also would increase our risk, in that cash is required to service the debt, ongoing covenants are typically employed which can restrict the way in which we operate our business, and if the debt comes due either upon maturity or an event of default, we may lack the resources at that time to either pay off or refinance the debt, or if we are able to refinance, the refinancing may be on terms that are less favorable than those originally in place, and may require additional equity or quasi equity accommodations. These
risks could materially adversely affect our company and the trading price of our Stock.
Our financing decisions may be made without Stockholder approval
Our financing decisions and related decisions regarding levels of debt, capitalization, distributions, acquisitions and other key operating parameters, are determined by our board of directors in its discretion, in many cases without any notice to or vote by our Stockholders. This could materially adversely affect our company and the trading price of our Stock.
Our independent registered public accounting firm has expressed doubts about our ability to continue as a going concern.
As a result of our financial condition, we have received a report from our independent registered public accounting firm for our financial statements for the year ended December 31, 2012 that includes an explanatory paragraph describing the uncertainty as to our ability to continue as a going concern. In order to continue as a going concern we must effectively balance many factors and increase our revenues to a point where we can fund our operations from our sales and revenues. If we are not able to do this we may not be able to continue as an operating company.
Because we face intense competition, we may not be able to operate profitably in our markets.
The market for casual games is highly competitive and is becoming more so, which could hinder our ability to successfully market our products. We may not have the resources, expertise or other competitive factors to compete successfully in the future. We expect to face additional competition from existing competitors and new market entrants in the future. Many of our competitors have greater name recognition and more established relationships in the industry than we do. As a result, these competitors may be able to:
|
·
|
develop and expand their product offerings more rapidly;
|
|
·
|
adapt to new or emerging changes in customer requirements more quickly;
|
|
·
|
take advantage of acquisition and other opportunities more readily; and
|
|
·
|
devote greater resources to the marketing and sale of their products and adopt more aggressive pricing policies than we can.
|
If we are unable to maintain brand image or product quality, our business may suffer.
Our success depends on our ability to maintain and build brand image for our existing products, new products and brand extensions. We have no assurance that our advertising, marketing and promotional programs will have the desired impact on our products’ brand image and on consumer preferences.
If we are unable to attract and retain key personnel, we may not be able to compete effectively in our market.
Our success will depend, in part, on our ability to attract and retain key management, including primarily Craig Holland and Mick Donahoo, technical experts, and sales and marketing personnel. We attempt to enhance our management and technical expertise by recruiting qualified individuals who possess desired skills and experience in certain targeted areas. Our inability to retain employees and attract and retain sufficient additional employees, and information technology, engineering and technical support resources, could have a material adverse effect on our business, financial condition, results of operations and cash flows. The loss of key personnel could limit our ability to develop and market our
products.
13
Because our officers and directors control a large percentage of our common stock, they have the ability to influence matters affecting our shareholders.
As of December 31, 2012, our officers and directors beneficially own over 51% of our outstanding common stock. As a result, they have the ability to influence matters affecting our shareholders, including the election of our directors, the acquisition or disposition of our assets, and the future issuance of our shares. Because they control such shares, investors may find it difficult to replace our management if they disagree with the way our business is being operated. Because the influence by these insiders could result in management making decisions that are in the best interest of those insiders and not in the best interest of the investors, you may lose some or all of the value of your investment in our
common stock.
Our business may be negatively impacted by a slowing economy or by unfavorable economic conditions or developments in the United States and/or in other countries in which we operate.
A general slowdown in the economy in the United States or unfavorable economic conditions or other developments may result in decreased consumer demand, business disruption, supply constraints, foreign currency devaluation, inflation or deflation. A slowdown in the economy or unstable economic conditions in the United States or in the countries in which we operate could have an adverse impact on our business results or financial condition.
We may not be able to effectively manage our growth and operations, which could materially and adversely affect our business
.
We may experience rapid growth and development in a relatively short period of time by aggressively marketing our casual games. The management of this growth will require, among other things, continued development of our financial and management controls and management information systems, stringent control of costs, increased marketing activities, the ability to attract and retain qualified management personnel and the training of new personnel. We intend to hire additional personnel in order to manage our expected growth and expansion. Failure to successfully manage our possible growth and development could have a material adverse effect on our business and the value of our common stock.
Failure to renew our existing licenses or to obtain additional licenses could harm our business.
Some of our game products are or will be based on or incorporate intellectual properties that we license from third parties. Our current licenses to use these properties do not extend beyond terms of two to three years. We may be unable to renew these licenses on terms favorable to us, or at all, and we may be unable to secure alternatives in a timely manner. We expect that licenses we obtain in the future may impose development, distribution and marketing obligations on us. If we breach our obligations, our licensors may have the right to terminate the license or change an exclusive license to a non-exclusive license.
Competition for licenses may also increase the advances, guarantees and royalties that we must pay to the licensor, which could significantly increase our costs. Failure to maintain our existing licenses or obtain additional licenses with significant commercial value could impair our ability to introduce new applications or continue our current game products and applications, which could materially harm our business.
14
If we fail to develop and introduce new casual games and other applications that achieve market acceptance, our sales could suffer.
Our business depends on providing casual games and applications that consumers want to buy. We must invest significant resources in research and development to enhance our offering of casual games and other applications and introduce new games and other applications. Our operating results would suffer if our games and other applications are not responsive to the preferences of our customers or are not effectively brought to market.
The planned timing or introduction of new casual games is subject to risks and uncertainties. Unexpected technical, operational, deployment, distribution or other problems could delay or prevent the introduction of new casual games, which could result in a loss of, or delay in, revenues or damage to our reputation and brand. If any of our applications is introduced with defects, errors or failures, we could experience decreased sales, loss of customers and damage to our reputation and brand. In addition, new applications may not achieve sufficient market acceptance to offset the costs of development. Our success depends, in part, on unpredictable and volatile factors beyond our control, including customer
preferences, competing applications and the availability of other entertainment activities. A shift in Internet or mobile device usage or the entertainment preferences of our customers could cause a decline in our applications' popularity that could materially reduce our revenues and harm our business.
We intend to continuously develop and introduce new games and other applications for use on next-generation Internet and mobile devices. We must make product development decisions and commit significant resources well in advance of the anticipated introduction of new mobile devices. New mobile devices for which we will develop applications may be delayed, may not be commercially successful, may have a shorter life cycle than anticipated or may not be adequately promoted by wireless carriers or the manufacturer. If the mobile devices for which we are developing games and other applications are not released when expected or do not achieve broad market penetration, our potential revenues will be limited and our
business will suffer.
If our independent, third-party developers cease development of new applications for us and we are unable to find comparable replacements, our competitive position may be adversely impacted.
We rely on independent third-party developers to develop some of our game products which subjects us to the following risks:
|
·
|
key developers who work for us may choose to work for or be acquired by our competitors;
|
|
·
|
developers currently under contract may try to renegotiate our agreements with them on terms less favorable to us; and
|
|
·
|
our developers may be unable or unwilling to allocate sufficient resources to complete our applications on a timely or satisfactory basis or at all.
|
If our developers terminate their relationships with us or negotiate agreements with terms less favorable to us, we may have to increase our internal development staff, which would be a time consuming and potentially costly process. If we are unable to increase our internal development staff in a cost-effective manner or if our current internal development staff fails to create successful applications, our earnings could be materially diminished.
In addition, although we require our third-party developers to sign agreements acknowledging that all inventions, trade secrets, works of authorship, development and other processes generated by them are our property and to assign to us any ownership they may have in those works, it may still be possible for third parties to obtain and use our intellectual properties without our consent.
15
Our industry is experiencing consolidation that may cause us to lose key relationships and intensify competition.
The Internet and media distribution industries are undergoing substantial change, which has resulted in increasing consolidation and formation of strategic relationships. We expect this consolidation and strategic partnering to continue. Acquisitions or other consolidating transactions could harm us in a number of ways, including:
|
|
•
|
we could lose strategic relationships if our strategic partners are acquired by or enter into relationships with a competitor (which could cause us to lose access to distribution, content, technology and other resources);
|
|
|
•
|
we could lose customers if competitors or users of competing technologies consolidate with our current or potential customers; and
|
|
|
•
|
our current competitors could become stronger, or new competitors could form, from consolidations.
|
Any of these events could put us at a competitive disadvantage, which could cause us to lose customers, revenue and market share. Consolidation could also force us to expend greater resources to meet new or additional competitive threats, which could also harm our operating results.
We rely on the continued reliable operation of third parties’ systems and networks and, if these systems and networks fail to operate or operate poorly, our business and operating results will be harmed.
Our operations are in part dependent upon the continued reliable operation of the information systems and networks of third parties. If these third parties do not provide reliable operation, our ability to service our customers will be impaired and our business, reputation and operating results could be harmed.
The Internet and our network are subject to security risks that could harm our business and reputation and expose us to litigation or liability.
Online commerce and communications depend on the ability to transmit confidential information and licensed intellectual property securely over private and public networks. Any compromise of our ability to transmit and store such information and data securely, and any costs associated with preventing or eliminating such problems, could damage our business, hurt our ability to distribute products and services and collect revenue, threaten the proprietary or confidential nature of our technology, harm our reputation, and expose us to litigation or liability. We also may be required to expend significant capital or other resources to protect against the threat of security breaches or hacker attacks or to
alleviate problems caused by such breaches or attacks. Any successful attack or breach of our security could hurt consumer demand for our products and services, expose us to consumer class action lawsuits and harm our business.
We may be unable to adequately protect our proprietary rights.
Our ability to compete partly depends on the superiority, uniqueness and value of our intellectual property and technology, including both internally developed technology and technology licensed from third parties. To the extent we are able to do so, in order to protect our proprietary rights, we will rely on a combination of trademark, copyright and trade secret laws, confidentiality agreements with our employees and third parties, and protective contractual provisions and licensing agreement. Despite these efforts, any of the following occurrences may reduce the value of our intellectual property:
|
|
•
|
Our applications for trademarks and copyrights relating to our business may not be granted and, if granted, may be challenged or invalidated;
|
|
|
•
|
Issued trademarks and registered copyrights may not provide us with any competitive advantages;
|
|
|
•
|
Our efforts to protect our intellectual property rights may not be effective in preventing misappropriation of our technology;
|
|
|
•
|
Our efforts may not prevent the development and design by others of products or technologies similar to or competitive with, or superior to those we develop; or
|
|
|
•
|
Another party may obtain a blocking patent and we would need to either obtain a license or design around the patent in order to continue to offer the contested feature or service in our products.
|
16
We may be forced to litigate to defend our intellectual property rights, or to defend against claims by third parties against us relating to intellectual property rights.
We may be forced to litigate to enforce or defend our intellectual property rights, to protect our trade secrets or to determine the validity and scope of other parties’ proprietary rights. Any such litigation could be very costly and could distract our management from focusing on operating our business. The existence and/or outcome of any such litigation could harm our business.
Interpretation of existing laws that did not originally contemplate the Internet could harm our business and operating results.
The application of existing laws governing issues such as property ownership, copyright and other intellectual property issues to the Internet is not clear. Many of these laws were adopted before the advent of the Internet and do not address the unique issues associated with the Internet and related technologies. In many cases, the relationship of these laws to the Internet has not yet been interpreted. New interpretations of existing laws may increase our costs, require us to change business practices or otherwise harm our business.
It is not yet clear how laws designed to protect children that use the Internet may be interpreted, and such laws may apply to our business in ways that may harm our business.
The Child Online Protection Act and the Child Online Privacy Protection Act impose civil and criminal penalties on persons distributing material harmful to minors (e.g., obscene material) over the Internet to persons under the age of 17, or collecting personal information from children under the age of 13. We do not knowingly distribute harmful materials to minors or collect personal information from children under the age of 13. The manner in which these Acts may be interpreted and enforced cannot be fully determined, and future legislation similar to these Acts could subject us to potential liability if we were deemed to be non-compliant with such rules and regulations, which in turn could harm our
business.
We may be subject to market risk and legal liability in connection with the data collection capabilities of our products and services.
Many of our products are interactive Internet applications that by their very nature require communication between a client and server to operate. To provide better consumer experiences and to operate effectively, our products send information to our servers. Many of the services we provide also require that a user provide certain information to us. We post an extensive privacy policy concerning the collection, use and disclosure of user data involved in interactions between our client and server products.
Risk Factors Relating to Future Acquisitions
We may not be able to identify, negotiate, finance or close future acquisitions
A significant component of our growth strategy focuses on acquiring additional companies or assets. We may not, however, be able to identify, audit, or acquire companies or assets on acceptable terms if at all. Additionally, we may need to finance all or a portion of the purchase price for an acquisition by incurring indebtedness. There can be no assurance that we will be able to obtain financing on terms that are favorable, if at all, which will limit our ability to acquire additional companies or assets in the future. Failure to acquire additional companies or assets on acceptable terms, if at all, would have a material adverse effect on our ability to increase assets, revenues and net income and on the
trading price of our common Stock.
17
We may acquire businesses without any apparent synergies with our casual games related operations
In an effort to diversify our sources of revenue and profits, we may decide to acquire businesses without any apparent synergies with our casual games related operations. For example, we believe that the acquisition of technologies unrelated to games and leisure may be an important way for us to enhance our Stockholder value. Notwithstanding the critical importance of diversification, some members of the investment community and research analysts would prefer that micro-cap or small-cap companies restrict the scope of their activity to a single line of business, and may not be willing to make an investment in, or recommend an investment in, a micro-cap or
small-cap company that undertakes multiple lines of business. This situation could materially adversely impact our company and the trading price of our Stock.
We may not be able to properly manage multiple businesses
We may not be able to properly manage multiple businesses. Managing multiple businesses would be more complicated than managing a single line of business, and would require that we hire and manage executives with experience and expertise in different fields. We can provide no assurance that we will be able to do so successfully. A failure to properly manage multiple businesses could materially adversely affect our company and the trading price of our Stock.
We may not be able to successfully integrate new acquisitions
Even if we are able to acquire additional companies or assets, we may not be able to successfully integrate those companies or assets. For example, we may need to integrate widely dispersed operations with different corporate cultures, operating margins, competitive environments, computer systems, compensation schemes, business plans and growth potential requiring significant management time and attention. In addition, the successful integration of any companies we acquire will depend in large part on the retention of personnel critical to our combined business operations due to, for example, unique technical skills or management expertise. We may be unable to retain existing management, finance,
engineering, sales, customer support, and operations personnel that are critical to the success of the integrated company, resulting in disruption of operations, loss of key information, expertise or know-how, unanticipated additional recruitment and training costs, and otherwise diminishing anticipated benefits of these acquisitions, including loss of revenue and profitability. Failure to successfully integrate acquired businesses could have a material adverse effect on our company and the trading price of our Stock.
Our acquisitions of businesses may be extremely risky and we could lose all of our investments
We may invest in software companies, other technology businesses, or other risky industries. An investment in these companies may be extremely risky because, among other things, the companies we are likely to focus on: (1) typically have limited operating histories, narrower product lines and smaller market shares than larger businesses, which tend to render them more vulnerable to competitors’ actions and market conditions, as well as general economic downturns; (2) tend to be privately-owned and generally have little publicly available information and, as a result, we may not learn all of the material information we need to know regarding these
businesses; (3) are more likely to depend on the management talents and efforts of a small group of people; and, as a result, the death, disability, resignation or termination of one or more of these people could have an adverse impact on the operations of any business that we may acquire; (4) may have less predicable operating results; (5) may from time to time be parties to litigation; (6) may be engaged in rapidly changing businesses with products subject to a substantial risk of obsolescence; and (7) may require substantial additional capital to support their operations, finance expansion or maintain their competitive position. Our failure to make acquisitions efficiently and profitably could have a material adverse effect on our business, results of operations, financial condition and the trading price of our Stock.
18
Future acquisitions may fail to perform as expected
Future acquisitions may fail to perform as expected. We may overestimate cash flow, underestimate costs, or fail to understand risks. This could materially adversely affect our company and the trading price of our Stock.
Competition may result in overpaying for acquisitions
Other investors with significant capital may compete with us for attractive investment opportunities. These competitors may include publicly traded companies, private equity firms, privately held buyers, individual investors, and other types of investors. Such competition may increase the price of acquisitions, or otherwise adversely affect the terms and conditions of acquisitions. This could materially adversely affect our company and the trading price of our Stock.
We may have insufficient resources to cover our operating expenses and the expenses of raising money and consummating acquisitions
We have limited cash to cover our operating expenses and to cover the expenses incurred in connection with money raising and a business combination. It is possible that we could incur substantial costs in connection with money raising or a business combination. If we do not have sufficient proceeds available to cover our expenses, we may be forced to obtain additional financing, either from our management or third parties. We may not be able to obtain additional financing on acceptable terms, if at all, and neither our management nor any third party is obligated to provide any financing. This could have a negative impact on our company and our Stock
price.
The nature of our proposed future operations is speculative and will depend to a great extent on the businesses which we acquire
While management typically intends to seek a merger or acquisition of privately held entities with established operating histories, there can be no assurance that we will be successful in locating an acquisition candidate meeting such criteria. In the event we complete a merger or acquisition transaction, of which there can be no assurance, our success if any will be dependent upon the operations, financial condition and management of the acquired company, and upon numerous other factors beyond our control. If the operations, financial condition or management of the acquired company were to be disrupted or otherwise negatively impacted following an acquisition, our company and our Stock price would be
negatively impacted.
We may make actions that will not require our stockholders’ approval
The terms and conditions of any acquisition could require us to take actions that would not require your approval. In order to acquire certain companies or assets, we may issue additional shares of common or preferred stock, borrow money or issue debt instruments including debt convertible into capital stock. Not all of these actions would require your approval even if these actions dilute your economic or voting interest as a shareholder.
Our investigation of potential acquisitions will be limited
Our analysis of new business opportunities will be undertaken by or under the supervision of our executive officers and directors. Inasmuch as we will have limited funds available to search for business opportunities and ventures, we will not be able to expend significant funds on a complete and exhaustive investigation of such business or opportunity. We will, however, investigate, to the extent believed reasonable by our management, such potential business opportunities or ventures by conducting a so-called “due diligence investigation”. In a so-called “due diligence investigation”, we intend to obtain and review materials regarding
the business opportunity. Typically such materials will include information regarding a target business’ products, services, contracts, management, ownership, and financial information. In addition, we intend to cause our officers or agents to meet personally with management and key personnel of target businesses, ask questions regarding the company’s prospects, tour facilities, and conduct other reasonable investigation of the target business to the extent of our limited financial resources and management and technical expertise. Any failure of our typical “due diligence investigation” to uncover issues and problems relating to potential acquisition candidates could materially adversely affect our company and the trading price of our Stock.
19
We will have only a limited ability to evaluate the directors and management of potential acquisitions
We may make a determination that our current directors and officers should not remain, or should reduce their roles, following money raising or a business combination, based on an assessment of the experience and skill sets of new directors and officers and the management of target businesses. We cannot assure you that our assessment of these individuals will prove to be correct. This could have a negative impact on our company and our Stock price.
We will be dependent on outside advisors to assist us
In order to supplement the business experience of management, we may employ accountants, technical experts, appraisers, attorneys or other consultants or advisors. The selection of any such advisors will be made by management and without any control from shareholders. Additionally, it is anticipated that such persons may be engaged by us on an independent basis without a continuing fiduciary or other obligation to us.
We may be unable to protect or enforce the intellectual property rights of any target business that we acquire or the target business may become subject to claims of intellectual property infringement
After completing a business combination, the
procurement and protection of trademarks, copyrights, patents, domain names, and trade secrets may be critical to our success.
We will likely rely on a combination of copyright, trademark, trade secret laws and contractual restrictions to protect any proprietary technology and rights that we may acquire. Despite our efforts to protect those proprietary technology and rights, we may not be able to prevent misappropriation of those proprietary rights or deter
independent development of technologies that compete with the business we acquire. Litigation may be necessary in the future to enforce our intellectual property rights, to protect our trade secrets, or to determine the validity and scope of the proprietary rights of others. It is also possible that third parties may claim we have infringed their patent, trademark, copyright or other proprietary rights. Claims or litigation, with or without merit, could result in substantial costs and diversions of resources, either of which could have an adverse effect on our competitive position and business. Further, depending on the target business or businesses that we acquire, it is likely that we will have to protect trademarks, patents, and domain names in an increasing number of jurisdictions, a process that is expensive and may not be successful in every location. These factors could
negatively impact our company and the trading price of our Stock.
Integrating acquired businesses may divert our management’s attention away from our day-to-day operations and harm our business
Acquisitions generally involve significant risks, including the risk of overvaluation of potential acquisitions and risks in regard to the assimilation of personnel, operations, products, services, technologies, and corporate culture of acquired companies. Dealing with these risks may place a significant burden on our management and other internal resources. This could materially adversely affect our business and the trading price of our Stock.
We may fail to manage our growth effectively
Future growth through acquisitions and organic expansion would place a significant strain on our managerial, operational, technical, training, systems and financial resources. We can give you no assurance that we will be able to manage our expanding operations properly or cost effectively. A failure to properly and cost-effectively manage our expansion could materially adversely affect our company and the trading price of our Stock.
20
The management of companies we acquire may lose their enthusiasm or entrepreneurship after the sale of their businesses
We can give no assurance that the management of future companies we acquire will have the same level of enthusiasm for the operation of their businesses following their acquisition by us, or if they cease performing services for the acquired businesses that we will be able to install replacement management with the same skill sets and determination. There also is always a risk that management will attempt to reenter the market and possibly seek to recruit some of the former employees of the business, who may continue to be key employees of ours. This could materially adversely affect our business and the trading price of our Stock.
If we are deemed to be an investment company, we may be required to institute burdensome compliance requirements and our activities may be restricted, which may make it difficult for us to complete a business combination
We believe we will not be subject to regulation under
the Investment Company Act insofar as we will not be engaged in the business of investing or trading in securities. However, in the event that we engage in business
combinations which result in us holding passive investment interests in a number of entities, we may become subject to regulation under the Investment Company Act. In such event, we may be required to register as an investment company and may incur significant registration and compliance
costs. We have obtained no formal determination from the government as to our status under the Investment Company Act, and consequently, any violation of such Act might subject us to material adverse consequences.
Risks Related To Our Common Stock
A DTC “Chill” On Electronic Clearing Of Trades In Our Common Stock May Affect The Liquidity Of Our Stock And Our Ability To Raise Capital.
On March 14, 2013, The Depositary Trust Company (DTC) notified us that it had unilaterally placed a "chill" on the electronic clearing of trades in our shares. The result of this action is likely to result in some brokerage firms to be unwilling to accept certificates and/or electronic deposits of our stock and some may refuse to accept trades in our shares completely. We immediately filed an objection letter with the DTC within days of our receipt of their notice to us and have sought advice from third parties on removal of the DTC chill. We also intend to initiate a dialogue with the DTC in order to seek resolution, but can make no assurances when and/or if the “chill” we be lifted.
The DTC chill affects the liquidity of our shares which may make it difficult to purchase or sell shares in the open market. It may also have an adverse effect on our ability to raise capital since investors may be unable to resell shares into the market. Our inability to raise capital on terms acceptable to us, if at all, could have a material and adverse effect on our business and operations.
There is a limited public trading market for our common stock, which may impede our shareholders’ ability to sell our shares
.
Currently, there is a limited trading market for our common stock, and there can be no assurance that a more robust market will be achieved in the future. There can be no assurance that an investor will be able to liquidate his or her investment without considerable delay, if at all. If the trading market for our common stock does increase, the price may be highly volatile. Factors discussed herein may have a significant impact on the market price of our shares. Moreover, due to the relatively low price of our securities, many brokerage firms may not effect transactions in our common stock if a market is established. Rules enacted by the SEC increase the likelihood that most brokerage firms will not
participate in a potential future market for our common stock. Those rules require, as a condition to brokers effecting transactions in certain defined securities (unless such transaction is subject to one or more exemptions), that the broker obtain from its customer or client a written representation concerning the customer’s financial situation, investment experience and investment objectives. Compliance with these procedures tends to discourage most brokerage firms from participating in the market for certain low-priced securities.
21
If we are unable to pay the costs associated with being a public, reporting company, we may not be able to continue trading on the OTC Bulletin Board and/or we may be forced to discontinue operations.
We have significant costs associated with being a public, reporting company, which adds to the substantial doubt about our ability to continue trading on the OTC Bulletin Board and/or continue as a going concern. These costs include compliance with the Sarbanes-Oxley Act of 2002, which will be difficult given the limited size of our management, and we will have to rely on outside consultants. Accounting controls, in particular, are difficult and can be expensive to comply with.
Our ability to continue trading on the OTC Bulletin Board and/or continue as a going concern will depend on positive cash flow, if any, from future operations and on our ability to raise additional funds through equity or debt financing. If we are unable to achieve the necessary product sales or raise or obtain needed funding to cover the costs of operating as a public, reporting company, our common stock may be deleted from the OTC Bulletin Board and/or we may be forced to discontinue operations.
We do not intend to pay dividends in the foreseeable future.
We do not intend to pay any dividends in the foreseeable future. We do not plan on making any cash distributions in the manner of a dividend or otherwise. Our Board presently intends to follow a policy of retaining earnings, if any.
We have the right to issue additional common stock and preferred stock without consent of stockholders. This would have the effect of diluting investors’ ownership and could decrease the value of their investment.
We have additional authorized, but unissued shares of our common stock that may be issued by us for any purpose without the consent or vote of our stockholders that would dilute stockholders’ percentage ownership of our company.
In addition, our certificate of incorporation authorizes the issuance of shares of preferred stock, the rights, preferences, designations and limitations of which may be set by the Board of Directors. Our certificate of incorporation has authorized issuance of up to 10,000,000 shares of preferred stock in the discretion of our Board. The shares of authorized but undesignated preferred stock may be issued upon filing of an amended certificate of incorporation and the payment of required fees; no further stockholder action is required. If issued, the rights, preferences, designations and limitations of such preferred stock would be set by our Board and could operate to the disadvantage of the outstanding
common stock. Such terms could include, among others, preferences as to dividends and distributions on liquidation.
As of the end of the period covered by this report, we have current outstanding non-affiliate debt obligations totaling approximately $50,000, which are convertible into our common stock. In the event the holder(s) of such instruments convert amounts owed to them into common stock and/or we default on the convertible instruments, significant dilution could occur to the other holders of our common stock and could significantly decrease the value of our common stock.
As of the end of the period covered by this report, we have outstanding non-affiliate debt obligations totaling approximately $50,000, which are convertible into our common stock. Although under the terms of the agreement, the number of shares of common stock issuable upon the conversion of any portion of the notes, cannot exceed an amount that would cause the beneficial ownership of the debt holder and its affiliates to own more than 4.99% of our outstanding shares of Common Stock, the issuance of almost 5% of our outstanding common stock in a short period time, possibly happening multiple times, would cause substantial dilution to our shareholders. In the event the holder(s) of such instruments convert
amounts owed to them into common stock and/or we default on the convertible instruments, significant dilution could occur to the other holders of our common stock and could significantly decrease the value of our common stock. We evaluated the convertible notes and determined that the shares issuable pursuant to the conversion option were determinate due to the Fixed Conversion Price and, as such, do not constitute a derivative liability as we have obtained authorization from a majority of our shareholders such that should conversion occur at the Fixed Conversion Price the appropriate number of shares will be made available or issuable for settlement to occur.
22
Sales of our Stock could cause the trading price of our Stock to fall
Sellers of our Stock might include convertible debt securities as discussed above, our existing stockholders who have held our Stock for years, persons and entities who acquire our stock as consideration for services they provide to our company, or our directors, officers or employees who might receive and then exercise stock options and simultaneously sell our Stock. Since the trading volume of our Stock is very low, any sales or attempts to sell our Stock, or the perception that sales or attempts to sell our Stock could occur, could adversely affect the trading price of our Stock.
Our common stock is governed under The Securities Enforcement and Penny Stock Reform Act of 1990.
The Securities Enforcement and Penny Stock Reform Act of 1990 requires additional disclosure relating to the market for penny stocks in connection with trades in any stock defined as a penny stock. The Commission has adopted regulations that generally define a penny stock to be any equity security that has a market price of less than $5.00 per share, subject to certain exceptions. Such exceptions include any equity security listed on NASDAQ and any equity security issued by an issuer that has (i) net tangible assets of at least $2,000,000, if such issuer has been in continuous operation for three years, (ii) net tangible assets of at least $5,000,000,
if such issuer has been in continuous operation for less than three years, or (iii) average annual revenue of at least $6,000,000, if such issuer has been in continuous operation for less than three years. Unless an exception is available, the regulations require the delivery, prior to any transaction involving a penny stock, of a disclosure schedule explaining the penny stock market and the risks associated therewith.
This Item is not applicable to us as we are not an accelerated filer, a large accelerated filer, or a well-seasoned issuer; however, we have not received written comments from the Commission staff regarding our periodic or current reports under the Securities Exchange Act of 1934 within the last 180 days before the end of our last fiscal year.
Our executive offices are located in Tustin, California, at 228 W. Main Street, 2nd Floor, Tustin, CA 92780. Our office space is approximately 2,000 square feet and the lease is month-to-month at a rate of $1,900 per month.
We are not a party to or otherwise involved in any legal proceedings.
In the ordinary course of business, we are from time to time involved in various pending or threatened legal actions. The litigation process is inherently uncertain and it is possible that the resolution of such matters might have a material adverse effect upon our financial condition and/or results of operations. However, in the opinion of our management, other than as set forth herein, matters currently pending or threatened against us are not expected to have a material adverse effect on our financial position or results of operations.
There is no information required to be disclosed by this Item.
23
Market Information
Our common stock has been listed for trading on the OTC Bulletin Board since June 2011. Our current trading symbol is “FRZT.” Since our stock has been listed there have been a limited number of trades of our common stock.
The following table sets forth the high and low bid information for each quarter within the fiscal year ended December 31, 2012, as provided by the Nasdaq Stock Markets, Inc. The information reflects prices between dealers, and does not include retail markup, markdown, or commission, and may not represent actual transactions.
|
Bid Prices
|
||||||||||
|
Fiscal Year
Ended
December 31,
|
Period
|
High
|
Low
|
|||||||
|
2011
|
First Quarter
|
$ | 0 | $ | 0 | |||||
|
Second Quarter
|
$ | 0.35 | $ | 0.35 | ||||||
|
Third Quarter
|
$ | 0.35 | $ | 0.14 | ||||||
|
Fourth Quarter
|
$ | 0.14 | $ | 0.03 | ||||||
|
2012
|
First Quarter
|
$ | 0.0499 | $ | 0.03 | |||||
|
Second Quarter
|
$ | 0.08 | $ | 0.0048 | ||||||
|
Third Quarter
|
$ | 0.0056 | $ | 0.0011 | ||||||
|
Fourth Quarter
|
$ | 0.0399 | $ | 0.0016 | ||||||
The Securities Enforcement and Penny Stock Reform Act of 1990 requires additional disclosure relating to the market for penny stocks in connection with trades in any stock defined as a penny stock. The Commission has adopted regulations that generally define a penny stock to be any equity security that has a market price of less than $5.00 per share, subject to a few exceptions which we do not meet. Unless an exception is available, the regulations require the delivery, prior to any transaction involving a penny stock, of a disclosure schedule explaining the penny stock market and the risks associated therewith.
Holders
As of December 31, 2012, there were 70,301,915 shares of our common stock outstanding held by approximately 127 holders of record of our common stock. As of March 29, 2013, there were 77,724,404 shares of our common stock outstanding held by over 127 holders of record of our common stock. Of these 77,724,404 shares outstanding at March 29, 2013, 38,447,871 are held by non-affiliates. On the cover page of this filing we value these shares at $184,550. These shares were valued at $0.0048 per share, based on the closing price on June 29, 2012 of our common stock as listed on the OTC Bulletin Board.
24
Dividends
We have not declared or paid a cash dividend on our capital stock in our last two fiscal years and we do not expect to pay cash dividends on our common stock in the foreseeable future. We currently intend to retain our earnings, if any, for use in our business. Any dividends declared in the future will be at the discretion of our Board of Directors and subject to any restrictions that may be imposed by our lenders.
Securities Authorized for Issuance Under Equity Compensation Plans
There are currently 560,000 options outstanding, to purchase shares of our common stock.
Non-Qualified Stock Option Plan
On March 20, 2006, our Board of Directors and shareholders approved the Freeze Tag, Inc. 2006 Stock Plan. Pursuant to the Plan, we reserved 2,920,500 shares (post-split) of our common stock to be issued to employees and consultants for services rendered to the company. As of December 31, 2008, we had issued options to acquire a total of 1,247,850 shares (post-split) of our common stock to seven of our employees and/or consultants. Effective as of October 15, 2009, all seven of the option holders converted their options into a total of 1,123,065 shares of our common stock.
Because of the 5.31-for-one forward stock split of our common stock on October 15, 2009, there are
now 1,512,650 shares available for issuance as a part of this stock plan. As of the period ended December 31, 2011, there were 560,000 options outstanding to purchase shares of common stock, and no shares of common stock had been issued pursuant to stock purchase rights under the 2006 Plan.
Under the 2006 Plan, options may be granted to employees, directors, and consultants. Only employees may receive “incentive stock options,” which are intended to qualify for certain tax treatment, and consultants and directors may receive “non-statutory stock options,” which do not qualify for such treatment. A holder of more than 10% of the outstanding voting shares may only be granted options with an exercise price of at least 110% of the fair market value of the underlying stock on the date of the grant, and if such holder has incentive stock options, the term of the options must not exceed five years.
Options and stock purchase rights granted under the 2006 Plan generally vest ratably over a four year period (typically 1⁄4 or 25% of the shares vest after the 1st year and 1/48 of the remaining shares vest each month thereafter); however, alternative vesting schedules may be approved by our Board of Directors in its sole discretion. Any unvested portion of an option or stock purchase right will accelerate and become fully vested if a holder’s service with the company is terminated by us without cause within twelve months following a Change in Control (as defined in the 2006 Plan).
All options must be exercised within ten years after the date of grant. Upon a holder’s termination of service for any reason prior to a Change in Control, we may repurchase any shares issued to such holder upon the exercise of options or stock purchase rights. The Board of Directors may amend the 2006 Plan at any time. The 2006 Plan will terminate in 2016, unless terminated sooner by the Board of Directors.
As of December 31, 2012, we had the following options outstanding:
|
Plan Category
|
Number of Securities to be issued upon exercise of outstanding options, warrants and rights
|
Weighted-average exercise price of outstanding options, warrants and rights
|
Number of securities remaining available for future issuance under equity compensation plans (excluding securities reflected in column (a))
|
|||||||||
|
(a)
|
(b)
|
(c)
|
||||||||||
|
Equity compensation plans approved by security holders
|
560,000 | 0.10 | 952,650 | |||||||||
|
Equity compensation plans not approved by security holders
|
- 0 - | - 0 - | - 0 - | |||||||||
|
Total
|
560,000 | 0.10 | 952,650 | |||||||||
25
Recent Issuance of Unregistered Securities
Unless otherwise noted, the use of proceeds for the following sales of equity securities was to sustain our business operations.
In September and October of 2012, we issued an aggregate of 7,000,000 shares of our common stock to Asher Enterprises, Inc. upon the conversion by Asher of an aggregate of $55,500 of debt we owe to them under an 8% Convertible Promissory Note in default.
In May and June of 2012, we issued an aggregate of 6,858,133 shares of our common stock to Asher Enterprises, Inc. upon the conversion by Asher of an aggregate of $55,500 of debt we owe to them under an 8% Convertible Promissory Note in default.
On March 30, 2012, we issued 24,000 shares of our common stock, restricted in accordance with Rule 144, to an unaffiliated thirty party as consideration under the Technology Transfer Agreement entered into on June 22, 2011. These were two quarterly installment issuances under that agreement. The issuance of the shares was exempt from the registration requirements of the Securities Act of 1933 pursuant to Section 4(2) thereof. The shareholder was a sophisticated investor, familiar with our operations, and there was no solicitation.
On March 2, 2012, we issued 3,000,000 shares of our common stock, restricted in accordance with Rule 144, to Crucible Capital Group, Inc. as consideration for public and financial relations services. The issuance of the shares was exempt from the registration requirements of the Securities Act of 1933 pursuant to Section 4(2) thereof. The consultant was an accredited and sophisticated investor, familiar with our operations, and there was no solicitation.
On February 2, 2012, we issued 1,807,229 shares of our common stock to Asher Enterprises, Inc. upon the conversion by Asher of $1,500 of debt we owe to them under an 8% Convertible Promissory Note. The issuance of the shares was exempt from the registration requirements of the Securities Act of 1933 pursuant to Section 4(2) thereof. The consultant was an accredited and sophisticated investor, familiar with our operations, and there was no solicitation.
On September 21, 2011, we issued 100,000 shares of our common stock, restricted in accordance with Rule 144, to Empire Relations Group, Inc. as consideration under a consulting agreement dated September 16, 2011 for public and financial relations services. The issuance of the shares was exempt from the registration requirements of the Securities Act of 1933 pursuant to Section 4(2) thereof. The consultant was an accredited and sophisticated investor, familiar with our operations, and there was no solicitation.
On September 21, 2011, we issued 12,000 shares of our common stock, restricted in accordance with Rule 144, to an unaffiliated thirty party as consideration under the Technology Transfer Agreement entered into on June 22, 2011. This is the first of eight identical quarterly installments of shares to be issued. The issuance of the shares was exempt from the registration requirements of the Securities Act of 1933 pursuant to Section 4(2) thereof. The shareholder was a sophisticated investor, familiar with our operations, and there was no solicitation.
26
On July 21, 2011, we entered into a Securities Purchase Agreement with Asher Enterprises, Inc., pursuant to which we sold to Asher an 8% Convertible Promissory Note in the original principal amount of $62,500 (the “Note”). The Note has a maturity date of April 25, 2012, and is convertible into our common stock at the greater of (i) the Variable Conversion Price and (ii) the Fixed Conversion Price. The “Variable Conversion Price” shall mean 55% multiplied by the Market Price (representing a discount rate of 45%). “Market Price” means the average of the lowest three (3) Trading Prices for the Common Stock during the ten (10) Trading Day period ending on the latest complete
Trading Day prior to the Conversion Date. “Fixed Conversion Price” shall mean $0.00009. The shares of common stock issuable upon conversion of the Note will be restricted securities as defined in Rule 144 promulgated under the Securities Act of 1933. The purchase and sale of the Note closed on August 1, 2011, the date that the purchase price was delivered to us.
The issuance of the Note was exempt from the registration requirements of the Securities Act of 1933 pursuant to Rule 506 of Regulation D promulgated thereunder. The purchaser was an accredited and sophisticated investor, familiar with our operations, and there was no solicitation.
On September 16, 2011, we entered into a Securities Purchase Agreement with Asher Enterprises, Inc., pursuant to which we sold to Asher an 8% Convertible Promissory Note in the original principal amount of $40,000 (the “Note”). The Note has a maturity date of June 20, 2012, and is convertible into our common stock at the greater of (i) the Variable Conversion Price and (ii) the Fixed Conversion Price. The “Variable Conversion Price” shall mean 55% multiplied by the Market Price (representing a discount rate of 45%). “Market Price” means the average of the lowest three (3) Trading Prices for the Common Stock during the ten (10) Trading Day period ending on the latest
complete Trading Day prior to the Conversion Date. “Fixed Conversion Price” shall mean $0.00009. The shares of common stock issuable upon conversion of the Note will be restricted securities as defined in Rule 144 promulgated under the Securities Act of 1933. The purchase and sale of the Note closed on September 22, 2011, the date that the purchase price was delivered to us.
On November 29, 2011, we issued 125,000 shares of our common stock, restricted in accordance with Rule 144, to Michael Southworth for consulting services.
All of the issuances of securities described above were restricted share issuances and deemed to be exempt from registration in reliance on Rule 506 of Regulation D and/or Section 4(2) of the Securities Act as transactions by an issuer not involving a public offering. Many investors represented that they were accredited investors, as defined in Rule 501 of Regulation D and, there was no general solicitation or general advertising used to market the securities. In most cases, we made available to each investor with disclosure of all aspects of our business, including providing the investor with press releases, access to our auditors, and other financial,
business, and corporate information. All securities issued were restricted with an appropriate restrictive legend on certificates issued stating that the securities have not been registered under the Securities Act and cannot be sold or otherwise transferred without an effective registration or an exemption therefrom.
If our stock is listed on an exchange we will be subject to the Securities Enforcement and Penny Stock Reform Act of 1990 requires additional disclosure relating to the market for penny stocks in connection with trades in any stock defined as a penny stock. The Commission has adopted regulations that generally define a penny stock to be any equity security that has a market price of less than $5.00 per share, subject to a few exceptions which we do not meet. Unless an exception is available, the regulations require the delivery, prior to any transaction involving a penny stock, of a disclosure schedule explaining the penny stock market and the risks associated
therewith.
As a smaller reporting company we are not required to provide the information required by this Item.
27
Forward-Looking Statements
This annual report on Form 10-K of Freeze Tag, Inc. for the year ended December 31, 2012 contains forward-looking statements, principally in this Section and “Business.” Generally, you can identify these statements because they use words like “anticipates,” “believes,” “expects,” “future,” “intends,” “plans,” and similar terms. These statements reflect only our current expectations. Although we do not make forward-looking statements unless we believe we have a reasonable basis for doing so, we cannot guarantee their accuracy and actual results may differ materially from those we anticipated due to a number of uncertainties, many
of which are unforeseen, including, among others, the risks we face as described in this filing. You should not place undue reliance on these forward-looking statements which apply only as of the date of this annual report. These forward-looking statements are within the meaning of Section 27A of the Securities Act of 1933, as amended, and section 21E of the Securities Exchange Act of 1934, as amended, and are intended to be covered by the safe harbors created thereby. To the extent that such statements are not recitations of historical fact, such statements constitute forward-looking statements that, by definition, involve risks and uncertainties. In any forward-looking statement where we express an expectation or belief as to future results or events, such expectation or belief is expressed in good faith and believed to have a reasonable basis, but there can be no assurance that the
statement of expectation of belief will be accomplished.
We believe it is important to communicate our expectations to our investors. There may be events in the future; however, that we are unable to predict accurately or over which we have no control. The risk factors listed in this filing, as well as any cautionary language in this annual report, provide examples of risks, uncertainties and events that may cause our actual results to differ materially from the expectations we describe in our forward-looking statements. Factors that could cause actual results or events to differ materially from those anticipated, include, but are not limited to: distributors not accepting our games; price reductions; unforeseen delays in game production; changes in product strategies;
general economic, financial and business conditions; changes in and compliance with governmental regulations; changes in various tax laws; and the availability of key management and other personnel.
Summary Overview
We are a casual online games publisher that develops and markets games across the major digital distribution platforms including PC/Mac downloadable (Web), mobile (including smartphones and tablets), and emerging platforms like social networking sites (including Facebook). We focus on casual games because of our belief that they appeal to a significant portion of the population.
During our most recent fiscal year ended December 31, 2012, we generated revenues of $448,924 from the sales our games compared to $732,591 for the year ended December 31, 2011. During the year ended December 31, 2012, we launched 7 games on various platforms, compared to two for the year ended December 31, 2011. During 2013, we anticipate we will publish up to six to eight games for various platforms. In 2013 and going forward we plan to continue the trend we started in 2009 of developing games based on intellectual property we own or purchase from third parties, rather than license intellectual property that belongs to certain third parties, for which we then have
to pay royalties to the owner of the intellectual property. We believe this will further enable us to decrease the costs associated with developing and publishing games and increase our gross margins over time.
28
Critical Accounting Estimates
Revenue Recognition
Our revenues are derived primarily by licensing software products in the form of online and downloadable games for PC, Mac and smartphone and tablet platforms. We distribute our products primarily through online games portals and smartphone device manufacturers (“distribution partners”), which market the games to end users. The nature of our business is such that we sell games basically through four distribution outlets – WEB portals, brick and mortar retail distributors, mobile distributors and publishers, and our own web portal, www.freezetag.com.
Product Sales (web and mobile revenues)
We recognize revenue from the sale of our products upon the transfer of title and risk of loss to our customers, and once any performance obligations have been completed. Revenue from product sales is recognized after deducting the estimated allowance for returns and price protection.
Licensing Revenues (retail revenues- royalties)
Third-party licensees distribute games under license agreements with us. We receive royalties from the licensees as a result. We recognize these royalties as revenues upon receipt of the monthly or quarterly (varies per distribution partner) revenue reports provided by the partner. Revenue from licensing/royalties is recognized after deducting the estimated allowance for returns and price protection.
Some license agreements require a royalty advance from the licensee/distributor in which case the original advance is recognized as a liability and royalty revenue is deducted from the advance as earned.
Other Revenues
Other revenues primarily include Ad game revenue and work-for-hire game related revenue.
We derive our advertising game revenue from certain of our partners that offer our games free of charge to consumers in exchange for the consumers being exposed to advertising embedded in our games. In this way, we do not receive revenue for the sale of our games, but rather a percentage of the “advertising” revenue generated by these player views. This method of generating revenue is essentially the same as traditional radio or television advertising where consumers are allowed to enjoy content for “free” but are forced to watch (or listen) to advertising before,
in between and at the end of the programming content.
Additionally, we derive some revenue from “work-for-hire” projects. Some of our partners occasionally ask us to render “work-for-hire” services for them such as preparing packaging materials. For example, a retail game and DVD publisher hired us to create several designs for printed packages that were used for games published by the publisher but not developed by us. For this work, we charge a one-time, fixed fee for each package design.
We recognize this revenue once all performance obligations have been completed. In addition, persuasive evidence of an arrangement must exist and collection of the related receivable must be probable.
We recognize revenue in accordance with current accounting standards when an arrangement exists, delivery has occurred, the price is fixed and determinable, and collectability is probable.
29
Cash and Cash Equivalents
For purposes of the Statement of Cash Flows, we consider liquid investments with an original maturity of three months or less to be cash equivalents. We place our cash and cash equivalents with large commercial banks. The Federal Deposit Insurance Corporation (“FDIC”) insures these balances, up to $250,000. All of our cash balances at December 31, 2012 and December 31, 2011 were insured. At December 31, 2012 and December 31, 2011 there were no cash equivalents.
Allowances for Returns, Price Protection, and Doubtful Accounts
Because the majority of our business is derived through online portals (such as Big Fish Games) and wireless online app stores (such as Apple), there is no physical product, other than the downloadable bits of our games that is involved in the customer purchase. In the digital environment, the customer cannot ‘return’ a digital download product. Therefore, there are no returns. The customer can ask for a refund of a digital product, and if there are any, then they are reconciled or netted out by our distribution partners before we receive the corresponding payments and royalty statements. As such, we do not allow for returns, bad debts or price protection of digital download products.
However, we derive a small portion of our revenues from sales of physical packaged software for personal computers through distribution partners who sell through traditional retail channels. Product revenue is recognized net of allowances for price protection and returns and various customer discounts. Our distribution partners who sell to retailers may allow returns for our packaged personal computer products; these partners may decide to provide price protection or allow returns for personal computer products after they analyze: (1) inventory remaining in the retail channel, (2) the rate of inventory sell-through in the retail channel, and (3) the remaining inventory on hand of our games. To allow for these
returns, price protection and various customer discounts, some of our distribution partners who sell to retailers will hold back a percentage of our revenue. These “hold-back” amounts, typically a percentage of revenue, are then reconciled on a quarterly basis and detailed on the statements we receive from our distribution partners. As of December 31, 2012 and December 31, 2011; the allowance for doubtful accounts was $5,600 and $9,934, respectively.
Property and Equipment
Property and equipment are recorded at cost and are depreciated using the straight-line method over the estimated useful lives of the related assets. All assets are currently depreciated over 3 years. Maintenance and repairs are charged to expense as incurred. Renewals and improvements of a major nature are capitalized. At the time of retirement or other disposition of property and equipment, the cost and accumulated depreciation are removed from the accounts, and any resulting gains or losses are reflected in the statement of operations.
Concentrations of Credit Risk, Major Customers and Major Vendors
Our customers are the end-consumers that purchase its games from the websites where we have our games listed for sale. Therefore, we do not have any individual customers that represent any more than a fraction of its revenue. However, we do have primary distribution partners, which are the owners of the websites where it sells its games. Under our distribution agreements we are not obligated to make, distribute or sell any games. However, for any games we do make and wish to distribute we can list them on one or more of these websites under a revenue sharing arrangement where we shares the revenue from any of our games that sell. The sharing arrangement varies greatly depending on the distributor with the Company
generally keeping between 35% and 70% of the revenue and the distributor keeping the remainder of the revenue generated by each sale. At times we enter into “exclusivity options” whereby if a distributor wishes to have an exclusive period carrying our games (normally 30-90 days) we will agree to that in exchange for the distributor marketing the game in their newsletter and other marketing programs. Due to the fact we have a number of distribution partners and a variety of different websites where we can sell our games, we are not substantially dependent on any of our distribution partners or agreements. In addition to the distribution agreements, we currently have licensing agreements with Ohio Art Company and CMG Worldwide, which allow us to develop and distribute games around third party intellectual property in exchange for paying royalty payments. We are not
substantially dependent on either of those licensing agreements.
At December 31, 2012, our primary distributors that represented 10% or more of our revenues were: Big Fish Games – 36.89% and Exent – 10.02%. At December 31, 2011, the Company’s primary distributors that represented 10% or more of its revenues were: Big Fish Games – 37.54% and Exent – 13.07%.
30
At December 31, 2012, our primary distributors and partners that represented 10% or more of our accounts receivable were: Exent - 30.01%, Big Fish Games – 20.62%. At December 31, 2011, our primary distributors and partners that represented 10% or more of our accounts receivable were: Exent - 25.17%, Big Fish Games – 18.26%, and Avanquest – 11.06%.
Income Taxes
We account for income taxes using ASC Topic 740, Income Taxes. Under ASC Topic 740, income taxes are accounted for under the asset and liability method. Deferred tax assets and liabilities are recognized for the future tax consequences attributable to differences between the financial statement carrying amounts of existing assets and liabilities and their respective tax bases and operating loss and tax credit carry forwards. Deferred tax assets and liabilities are measured using enacted tax rates expected to apply to taxable income in the years in which those temporary differences are expected to be recovered or settled. The effect on deferred tax assets and liabilities of a change in tax rates is recognized in
income in the period that includes the enactment date.
ASC Topic 740 includes accounting guidance which clarifies the accounting for the uncertainty in recognizing income taxes in an organization by providing detailed guidance for financial statement recognition, measurement and disclosure involving uncertain tax positions. This guidance requires an uncertain tax position to meet a more-likely-than-not recognition threshold at the effective date to be recognized both upon the adoption of the related guidance and in subsequent periods.
We have no uncertain tax positions at any of the dates presented.
Foreign Currency Translation
We derive a portion of our revenue from foreign countries, which report to us in foreign currency, but pay in U.S. Dollars. Because of the fluctuations between the reporting time and the payment period (up to 60 days), it is necessary to make adjustments to our accounting records. These adjustments are recorded under a Foreign Currency Translation expense account, and shown in the Statement of Operations as a General & Administrative expense.
Accounting for Stock-Based Compensation
We account for stock-based compensation in accordance with ASC Topic 718-10, Compensation-Stock Compensation and ASC Subtopic 505-50, Equity-Based Payments to Non-Employees ("ASC stock-based compensation guidance"). Stock-based compensation expense recognized during the requisite services period is based on the value of share-based payment awards after reduction for estimated forfeitures. Forfeitures are estimated at the time of grant and are revised, if necessary, in subsequent periods if actual forfeitures differ from those estimates.
Stock-based compensation expense recognized in our statement of operations for the year ended December 31, 2012 was $144,496, and $63,503 for the year ended December 31, 2011.
Impairment of Long-Lived Assets
We have adopted Accounting Standards Codification subtopic 360-10, Property, Plant and Equipment ("ASC 360-10"). ASC 360-10 requires that long-lived assets and certain identifiable intangibles held and used by us be reviewed for impairment whenever events or changes in circumstances indicate that the carrying amount of an asset may not be recoverable. We evaluate our long-lived assets for impairment annually or more often if events and circumstances warrant. Events relating to recoverability may include significant unfavorable changes in business conditions, recurring losses or a forecasted inability to achieve break-even operating results over an extended period. We evaluate the recoverability of long-lived
assets based upon forecasted undiscounted cash flows. Should impairment in value be indicated, the carrying value of long-lived assets will be adjusted, based on estimates of future discounted cash flows resulting from the use and ultimate disposition of the asset. ASC 360-10 also requires assets to be disposed of be reported at the lower of the carrying amount or the fair value less costs to sell.
31
Fair Value of Financial Instruments
Effective January 1, 2009, we adopted Accounting Standards Codification subtopic 820-10, Fair Value Measurements and Disclosures (“ASC 820-10”) and Accounting Standards Codification subtopic 825-10, Financial Instruments (“ASC 825-10”), which permits entities to choose to measure many financial instruments and certain other items at fair value. Neither of these statements had an impact on our financial position, results of operations or cash flows. The carrying value of cash and cash equivalents, accounts payable, accrued expenses and notes payable, as reflected in the balance sheets, approximate fair value because of the short-term maturity of these instruments.
Inputs used in the valuation to derive fair value are classified based on a fair value hierarchy which distinguishes between assumptions based on market data (observable inputs) and an entity’s own assumptions (unobservable inputs). The hierarchy consists of three levels:
|
|
●
Level one — Quoted market prices in active markets for identical assets or liabilities;
|
|
|
●
Level two — Inputs other than level one inputs that are either directly or indirectly observable; and
|
|
|
●
Level three — Unobservable inputs developed using estimates and assumptions, which are developed by the reporting entity and reflect those assumptions that a market participant would use.
|
Determining the category in which an asset or liability falls within the hierarchy requires significant judgment. The Company evaluates its hierarchy disclosures each period.
Use of Estimates
The preparation of financial statements and related disclosures in conformity with U.S. generally accepted accounting principles (“U.S. GAAP”) requires our management to make judgments, assumptions and estimates that affect the amounts reported in its consolidated financial statements and accompanying notes. Management bases its estimates on historical experience and on various other assumptions it believes to be reasonable under the circumstances, the results of which form the basis for making judgments about the carrying values of assets and liabilities. Actual results may differ from these estimates and these differences may be material.
Research and Development Costs
We charge costs related to research & development of products to general and administrative expense as incurred. The types of costs included in research and development expenses include research materials, salaries, contractor fees, and support materials.
Software Development Costs
Software development costs include direct costs incurred for internally developed products and payments made to independent software developers and/or contract engineers and artists. We account for software development costs in accordance with the FASB guidance for the costs of computer software to be sold, leased, or otherwise marketed ("ASC Subtopic 985-20"). Software development costs are capitalized once the technological feasibility of a product is established and such costs are determined to be recoverable. Technological feasibility of a product encompasses both technical design documentation and game design documentation, or the completed and tested product design and working model. Software
development costs are capitalized once technological feasibility of a product is established and such costs are determined to be recoverable against future revenues. For products where proven game engine technology exists (as is the case for most of our products), this may occur early in the development cycle. Significant management judgments and estimates are utilized in the assessment of when technological feasibility is established. For most of our PC/Mac products, technological feasibility is established when a detailed game design document containing sufficient technical specifications written for a proven game engine or framework technology has been created and approved by management. However, technological feasibility is evaluated on a product-by-product basis. Amounts related to software development that are not capitalized are charged immediately to the appropriate expense
account. Amounts that are considered ‘research and development’ that are not capitalized are immediately charged to general and administrative expense.
32
Prior to a product's release, we expense, as part of "Cost of Sales—Product Development", capitalized costs when we believe such amounts are not recoverable. Capitalized costs for those products that are cancelled or abandoned are charged to product development expense in the period of cancellation.
Commencing upon product release, capitalized software development costs are amortized to “Cost of Sales—Product Development” based on the straight-line method over either a twenty-four month period for traditional pay-to-play apps, or a thirty-six month period for free-to-play apps.
We evaluate the future recoverability of capitalized software development costs and intellectual property licenses on an annual basis. For products that have been released in prior years, the primary evaluation criterion is actual title performance. For products that are scheduled to be released in future years, recoverability is evaluated based on the expected performance of the specific products to which the costs relate or in which the licensed trademark or copyright is to be used. Criteria used to evaluate expected product performance include: historical performance of comparable products developed with comparable technology; orders for the product prior to its release; and, for any sequel product, estimated
performance based on the performance of the product on which the sequel is based.
Impairment expense, related to capitalized software development costs, recognized in our statement of operations for the years ended December 31, 2012 and 2011 were $68,628 and $0, respectively.
Based on current trends in our business, management has determined the expected shelf life of the majority of a game’s revenue will be realized over a three year period for free-to-play apps. Therefore, we have determined the appropriate amortization period for expensing capitalized production costs to be three years or thirty six months from date of the initial release, or first sale of the product for a specific technology platform. It is possible that the same game developed on different technology platforms (such as PC and Mac, or iOS and Android) will be launched on different release dates because product development cycles may differ and distribution partner release policies may differ.
At December 31, 2012, and December 31, 2011, current and long-term capitalized software development costs on the balance sheet were $831,980 and $786,331 respectively.
Intellectual Property Licenses (Prepaid Royalties)
Intellectual property license costs represent license fees paid to intellectual property rights holders for use of their trademarks or copyrights in the development of the Company's products. Intellectual property license costs represent license fees paid to intellectual property rights holders for use of their trademarks, copyrights, software, technology, music or other intellectual property or proprietary rights in the development of our products. Depending upon the agreement with the rights holder, we may obtain the rights to use acquired intellectual property in multiple products over multiple years, or alternatively, for a single product. Minimum guaranteed royalty payments for intellectual property licenses
are initially recorded as an asset (prepaid royalties or prepaid licensing fees), and a current liability, (accrued royalties payable) at the contractual amount upon execution of the contract when no significant performance remains with the licensor. Commencing upon the related product's release date, intellectual property licenses costs are amortized to “Cost of Sales – Licensing” based upon the percentage of revenue outlined in the contract with each specific licensor. Generally, our intellectual property licensing contracts call for licensors to be paid a percentage of revenue actually received by us, with allowances for minimum guarantees. Sometimes, the terms of the specific licensing contracts allow for us to re-capture expenses before licensing out royalties are calculated.
Capitalized intellectual property costs for those products that are cancelled or abandoned are charged to product development expense in the period of cancellation.
For the year ended December 31, 2012 and the year ended December 31, 2011, prepaid royalties (or prepaid licensing fees) were $7,252, and $12,046 respectively.
33
Recent Accounting Pronouncements
In October 2012, the Financial Accounting Standards Board (“FASB”) issued Accounting Standards Update (“ASU”) 2012-04, “Technical Corrections and Improvements” in Accounting Standards Update No. 2012-04. The amendments in this update cover a wide range of Topics in the Accounting Standards Codification. These amendments include technical corrections and improvements to the Accounting Standards Codification and conforming amendments related to fair value measurements. The amendments in this update will be effective for fiscal periods beginning after December 15, 2012. The adoption of ASU 2012-04 is not expected to have a material
impact on our financial position or results of operations.
In August 2012, the FASB issued ASU 2012-03, “Technical Amendments and Corrections to SEC Sections: Amendments to SEC Paragraphs Pursuant to SEC Staff Accounting Bulletin (“SAB”) No. 114, Technical Amendments Pursuant to SEC Release No. 33-9250, and Corrections Related to FASB Accounting Standards Update 2010-22 (SEC Update)” in Accounting Standards Update No. 2012-03. This update amends various SEC paragraphs pursuant to the issuance of SAB No. 114. The adoption of ASU 2012-03 is not expected to have a material impact on our financial position or results of operations.
In July 2012, the FASB issued ASU 2012-02, “Intangibles – Goodwill and Other (Topic 350): Testing Indefinite-Lived Intangible Assets for Impairment” in Accounting Standards Update No. 2012-02. This update amends ASU 2011-08, Intangibles – Goodwill and Other (Topic 350): Testing Indefinite-Lived Intangible Assets for Impairment and permits an entity first to assess qualitative factors to determine whether it is more likely than not that an indefinite-lived intangible asset is impaired as a basis for determining whether it is necessary to perform the quantitative impairment test in accordance with Subtopic 350-30, Intangibles – Goodwill and Other - General Intangibles Other than
Goodwill. The amendments are effective for annual and interim impairment tests performed for fiscal years beginning after September 15, 2012. Early adoption is permitted, including for annual and interim impairment tests performed as of a date before July 27, 2012, if a public entity’s financial statements for the most recent annual or interim period have not yet been issued or, for nonpublic entities, have not yet been made available for issuance. The adoption of ASU 2012-02 is not expected to have a material impact on our financial position or results of operations.
In December 2011, FASB issued ASU No. 2011-11, “Balance Sheet – Disclosures about Offsetting Assets and Liabilities” (ASU 2011-11) to enhance disclosure requirements relating to the offsetting of assets and liabilities on an entity's balance sheet. The update requires enhanced disclosures regarding assets and liabilities that are presented net or gross in the statement of financial position when the right of offset exists, or that are subject to an enforceable master netting arrangement. The new disclosure requirements relating to this update are retrospective and effective for annual and interim periods beginning on or after January 1, 2013. The update only requires additional disclosures, as
such, we do not expect that the adoption of this standard will have a material impact on our results of operations, cash flows or financial condition.
In September 2011, the FASB issued ASU No. 2011-08, “Intangibles – Goodwill and Other” (ASU 2011-08). ASU 2011-08 allows a qualitative assessment of whether it is more likely than not that a reporting unit’s fair value is less than its carrying amount before applying the two-step goodwill impairment test. If it is more likely than not that the fair value of a reporting unit is less than its carrying amount, then the two-step impairment test would be performed. ASU 2011-08 is effective for annual and interim goodwill impairment tests performed for fiscal years beginning after December 15, 2011, and early adoption is permitted.
In May 2011, the FASB issued ASU No. 2011-04, Fair Value Measurement (Topic 820): Amendments to Achieve Common Fair Value Measurement and Disclosure Requirements in U.S. GAAP and IFRSs. This update clarifies the application of certain existing fair value measurement guidance and expands the disclosures for fair value measurements that are estimated using significant unobservable (Level 3) inputs. This update is effective on a prospective basis for annual and interim reporting periods beginning on or after December 15, 2011, which for the Company is January 1, 2012.
34
Year Ended December 31, 2012 compared to Year Ended December 31, 2011
Results of Operations
Summary of Results of Operations
|
Year Ended December 31,
|
||||||||||||
|
2012
|
2011
|
%Change
|
||||||||||
|
Revenue
|
$ | 448,924 | $ | 732,591 | (39 | %) | ||||||
|
Costs and expenses:
|
||||||||||||
|
Cost of sales – product development
|
399,984 | 276,320 | 45 | % | ||||||||
|
Cost of sales – licensing
|
39,631 | 96,344 | (59 | %) | ||||||||
|
General and administrative
|
829,979 | 505,775 | 64 | % | ||||||||
|
Sales and marketing
|
12,343 | 11,930 | 3 | % | ||||||||
|
Amortization and Depreciation
|
92,848 | 50,928 | 82 | % | ||||||||
|
Total expenses
|
1,374,785 | 941,297 | 46 | % | ||||||||
|
Operating loss
|
(925,861 | ) | (208,706 | ) | 344 | % | ||||||
|
Loss on Debt Extinguishment
|
(34,577 | ) | - | N/A | ||||||||
|
Interest income/expense, net
|
(58,006 | ) | (18,551 | ) | 213 | % | ||||||
|
Income tax expense
|
1,343 | 2,926 | (54 | %) | ||||||||
|
Net loss
|
$ | (1,019,787 | ) | $ | (230,183 | ) | 343 | % | ||||
Operating Loss; Net Loss
Our net loss increased by $789,604, from ($230,183) to ($1,019,787), from the year ended 2011 compared to 2012. Our operating loss increased by $717,155, from ($208,706) to ($925,861) for the same period. The increase in operating loss and net loss of 344% and 343%, respectively, compared to the prior year is primarily a result of our increase in expenses at the same time experiencing a decline in revenues (39% decline in revenues). In the last year, free-to-play (freemium) games with in-app purchases have dominated the “top grossing” charts in both the Apple and Android mobile app stores, comprising as much as 70% of the charts of the highest earning
titles. During the last 12 months, Freeze Tag has successfully transitioned its entire production team to design and produce free-to-play (freemium) games. We continued porting and localizing previously released titles to maintain revenue. However, our main focus was to structure our studio to develop successful titles for the free-to-play (freemium) market, which lead to a decrease in revenues and increase in Research and Development expenses.
Though the cost of licensing decreased by $56,713 our cost of sales related to product development (increased by $123,664) and general and administrative expenses increased by $324,204 due to stock based compensation expense (non cash) increase of $80,993 (increase of 128%), payroll expense increase of 62%, and an increase in healthcare related expenses of 32%. Likewise there was an increase in amortization and depreciation of $42,550, as well as a loss on debt extinguishmentof $34,577.
35
Revenue
.
Our 2012 revenue decreased by $283,667, or 39%, to $448,924 compared to $732,591 for the year ended December 31, 2011, primarily due to the industry change in the revenue generation model with free-to- play games (freemium) becoming the dominant monetization business model. That change and the constriction in retail games sector affected our revenue. As a result, in particular web related revenue decreased by $209,720 and retail decreased by $118,519. This was offset by an increase in sales of our Mobile games. Furthermore several games in production were originally expected to debut within the 2012 year but were delayed affecting total revenue expectations.
Cost of Sales – Product Development
.
Our cost of sales for product development is comprised of the direct costs we incur in creating and publishing a game based on our own or licensed intellectual property. Our 2012 cost of sales for product development increased by $123,664, or 45%, to $399,984, due to the fact we were working on more of our own games. Furthermore, we incurred a one-time adjustment of $68,628 as a result of an underperforming title. We believe our product development costs will continue to increase as we develop and publish more games based on our own intellectual property.
Cost of Sales –Licensing
.
Our cost of sales for licensing is comprised of royalty payments we make to third parties for the use of their intellectual property and other related costs. Our 2012 cost of sales for licensing decreased by $56,713, or 59%, to $39,631, due to the fact we sold less games based on licensing arrangements and more of our own titles which resulted in less royalty payments owed. We believe these costs will continue to decrease as we focus on creating our own intellectual property on which our games are based, alleviating the need to pay a royalty payment to the owner of the intellectual property.
General and Administrative Expenses
.
General and administrative expenses increased by $324,204, or 64%, to $829,979 for the year ended December 31, 2012, primarily due to an increase of approximately $251,425 in our employee related expenses (payroll, vacation, payroll taxes, health insurance and stock based Compensation, etc.).
Interest Income/Expense; Net
.
Interest income/expense, net increased by $39,455, or 213%, to $58,006, and is primarily attributable to the interest expense associated with the notes held by note holders.
Liquidity and Capital Resources
Introduction
During the years ended December 31, 2012 and 2011, because of our operating losses, we did not generate positive operating cash flows. Our cash on hand as of December 31, 2012 was approximately $32,744 and our monthly cash flow burn rate is approximately $65,000. As a result, we have significant short term cash needs. These needs are being satisfied through cash flows from our operations, as well as proceeds from the sales of our securities. We currently do not believe we will be able to satisfy our cash needs from our revenues for some time. In March of 2013, we were forced to reduce staff to conserve cash, and reduce operating expenses. During February and March, and for at least the next month, the CEO and CFO
have not taken cash compensation.
36
Our cash, current assets, total assets, current liabilities, and total liabilities as of December 31, 2012 and 2011, respectively, are as follows:
|
December 31,
2012
|
December 31,
2011
|
Change
|
||||||||||
|
Cash
|
$ | 32,744 | $ | 26,588 | $ | 6,156 | ||||||
|
Total Current Assets
|
414,984 | 305,587 | 109,397 | |||||||||
|
Total Assets
|
954,560 | 983,658 | (29,098 | ) | ||||||||
|
Total Current Liabilities
|
1,740,022 | 1,092,398 | 647,624 | |||||||||
|
Total Liabilities
|
$ | 1,740,022 | $ | 1,099,697 | $ | 640,325 | ||||||
Our current assets increased by $109,327 as of December 31, 2012 as compared to December 31, 2011. However, a decrease in our total assets between the two periods was primarily attributed to a significant decrease in the capitalized production costs reduced for impairment of production costs of $68,628 for one of our titles due to adjusted performance expectations.
Our current liabilities increased by $647,624, or over 68%, as of December 31, 2012 as compared to December 31, 2011. A smaller portion of this was an increase in our accrued interest of $30,202 and Accounts Payable of $35,640. Mainly, we had a significant increase in our current note payable to a related party, $745,000 in 2012 compared to $130,000 in 2011, which is due to an increase in the amount we owe under the promissory notes held by The Holland Family Trust, an entity controlled by Craig Holland, one of our officers and directors.
Our total liabilities increased by $640,325, or over 58%, as of December 31, 2012 as compared to December 31, 2011, all due to the increase in our current liabilities as described above.
In order to repay our obligations in full or in part when due, we will be required to raise significant capital from other sources. There is no assurance, however, that we will be successful in these efforts.
Cash Requirements
We had cash available as of December 31, 2012 of $32,744 and $26,588 on December 31, 2011. Based on our revenues, cash on hand and current monthly burn rate, around $65,000 per month, we will need to continue borrowing from our shareholders and other related parties, and/or raise money from the sales of our securities, to fund operations.
Sources and Uses of Cash
Operations
We had net cash provided (used) by operating activities of ($589,209) for the year ended December 31, 2012, as compared to ($238,081) for the year ended December 31, 2011. In 2012, the net cash used in operating activities consisted primarily of our net income (loss) of ($1,019,787), capitalized production costs of ($491,061), and unearned royalties of ($5,788), offset by accounts receivable of $51,230, amortization of production costs of $376,784, accounts payable of $45,658, stock based compensation of $144,494, prepaid royalties of $4,794, and accrued expenses of $81,931. In addition, we had an impairment of production costs of $68,628 and loss on debt
modification to a related party of $34,577. In 2011, the net cash provided by operating activities consisted primarily of our net income (loss) of ($230,183), capitalized production costs of ($571,809), and accounts payable of ($21,796), partially offset by amortization of capitalized production costs of $264,721, prepaid royalties of $9,042, accrued expenses of $98,407, unearned royalties of $45,997, and stock based compensation of $16,003.
37
Investments
We had net cash provided (used) by investing activities of ($7,500) in 2012, compared to ($12,600) in 2011. The amounts in 2012 and 2011 all relate to cash used for purchasing fixed assets.
Financing
Our net cash provided (used) by financing activities for the year ended December 31, 2012 was $602,865, compared to $141,061 for the year ended December 31, 2011. For 2012, our financing activities related to payments for private placement memorandum costs of repayments of debt of ($85,000) offset by borrowings of debt of $687,865. For 2011, our financing activities consisted of payments for private placement memorandum costs of ($6,364), ($18,300) in repayments of debt, offset by borrowings of debt of $165,725.
Contractual Obligations
December 31, 2012:
|
|
2013
|
2014
|
2015
|
2016
|
2017
|
Total
|
||||||||||||||||||
|
Debt obligations
|
$
|
745,000
|
$
|
-
|
$
|
-
|
$
|
-
|
$
|
-
|
$
|
745,000
|
||||||||||||
|
$
|
745,000
|
$
|
-
|
$
|
-
|
$
|
-
|
$
|
-
|
$
|
745,000
|
|||||||||||||
Off Balance Sheet Arrangements
We have no off balance sheet arrangements.
As a smaller reporting company we are not required to provide the information required by this Item.
38
|
Report of Independent Registered Public Accounting Firm
|
F-1 | |||
|
Consolidated Balance Sheets as of December 31, 2012 and 2011
|
F-2 | |||
|
Consolidated Statements of Operations for the years
ended December 31, 2012 and 2011
|
F-3 | |||
|
Consolidated Statements of Shareholders’
Equity (Deficit) for the years ended December 31, 2012 and 2011
|
F-4 | |||
|
Consolidated Statements of Cash Flows for the years ended December 31, 2012 and 2011
|
F-5 | |||
|
Notes to Consolidated Financial Statements
|
F-6 |
39
REPORT OF INDEPENDENT REGISTERED PUBLIC ACCOUNTING FIRM
To the Board of Directors and
Shareholders of Freeze Tag, Inc.
We have audited the accompanying balance sheets of Freeze Tag, Inc. (“the “Company”) as of December 31, 2012 and 2011 and the related statements of operations, cash flows and shareholders’ equity for the years then ended. These financial statements are the responsibility of the Company’s management. Our responsibility is to express an opinion on these financial statements based on our audits.
We conducted our audits in accordance with standards of the Public Company Accounting Oversight Board (United States). Those standards require that we plan and perform the audit to obtain reasonable assurance about whether the financial statements are free of material misstatement. The Company is not required to have, nor were we engaged to perform, an audit of its internal control over financial reporting. Our audits included consideration of internal control over financial reporting as a basis for designing audit procedures that are appropriate in the circumstances, but not for the purpose of expressing an opinion on the effectiveness of the Company’s internal control over financial reporting. Accordingly,
we express no such opinion. An audit includes examining, on a test basis, evidence supporting the amounts and disclosures in the financial statements, assessing the accounting principles used and significant estimates made by management, as well as evaluating the overall financial statement presentation. We believe that our audits provide a reasonable basis for our opinion.
In our opinion, the financial statements referred to above present fairly, in all material respects, the financial position of Freeze Tag, Inc. as of December 31, 2012 and 2011, and the results of its operations and its cash flows for the years then ended in conformity with U.S. generally accepted accounting principles.
The accompanying financial statements have been prepared assuming that the Company will continue as a going concern. As discussed in Note 3 to the financial statements, the Company has insufficient working capital and reoccurring losses from operations, all of which raises substantial doubt about its ability to continue as a going concern. Management's plans regarding those matters also are described in Note 3. The financial statements do not include any adjustments that might result from the outcome of this uncertainty.
|
/s/ M&K CPAS, PLLC
|
|
|
www.mkacpas.com
|
|
|
Houston, Texas
|
|
|
April 1, 2013
|
F-1
FREEZE TAG, INC.
(A DELAWARE CORPORATION)
BALANCE SHEETS
|
December 31, 2012
|
December 31, 2011
|
|||||||
|
ASSETS
|
||||||||
|
Current Assets
|
||||||||
|
Cash
|
32,744 | $ | 26,588 | |||||
|
Accounts Receivable, Net
|
40,812 | 92,042 | ||||||
|
(Net of Allowance of $5,600 and $9,934 as of December 31, 2012 and 2011, respectively)
|
||||||||
|
Capitalized Production Costs, Net
|
332,508 | 171,450 | ||||||
|
Prepaid Royalties
|
7,252 | 12,046 | ||||||
|
Prepaid Expenses
|
1,668 | 3,461 | ||||||
|
Total Current Assets
|
414,984 | 305,587 | ||||||
|
Fixed Assets, Net
|
2,849 | 4,870 | ||||||
|
(Net of depreciation of $6,928 and $4,907 as of December 31, 2012 and 2011, respectively)
|
||||||||
|
Other Long-term Assets, Net
|
37,255 | 58,320 | ||||||
|
(Net of amortization of $52,532 and $29,332 as of December 31, 2012 and 2011, respectively)
|
||||||||
|
Capitalized Production Costs, Net
|
499,472 | 614,881 | ||||||
|
TOTAL ASSETS
|
$ | 954,560 | $ | 983,658 | ||||
|
LIABILITIES & EQUITY
|
||||||||
|
Liabilities
|
||||||||
|
Current Liabilities
|
||||||||
|
Accounts Payable
|
107,811 | 72,171 | ||||||
|
Accrued Compensation
|
168,621 | 157,263 | ||||||
|
Accrued Royalties
|
388,323 | 354,736 | ||||||
|
Accrued Interest
|
41,805 | 11,603 | ||||||
|
Accrued Expenses
|
614 | 2,878 | ||||||
|
Current Technology Payable
|
17,787 | 18,000 | ||||||
|
Unearned Royalties
|
270,061 | 275,849 | ||||||
|
Current Convertible Note Payable, Net
|
- | 69,898 | ||||||
|
(Net of debt discount of $0 and $90,827 as of December 31, 2012 and 2011, respectively)
|
||||||||
|
Current Convertible Note Payable, In Default
|
50,000 | - | ||||||
|
Current Convertible Note Payable, Related Party
|
100,000 | 75,000 | ||||||
|
Current Note Payable - Related Party
|
595,000 | 55,000 | ||||||
|
Total Current Liabilities
|
1,740,022 | 1,092,398 | ||||||
|
Long Term Technology Payable,net
|
- | 7,299 | ||||||
|
Total Liabilities
|
1,740,022 | 1,099,697 | ||||||
|
Equity (Deficit)
|
||||||||
|
Preferred Stock
|
- | - | ||||||
|
$0.001 par value per share, 10,000,000 shares authorized, 0 shares issued and outstanding as of December 31, 2012 and 2011
|
||||||||
|
Common Stock
|
70,302 | 39,276 | ||||||
|
$0.001 par value per share, 100,000,000 shares authorized, 70,301,915 and 39,275,720 shares issued and outstanding as of December 31, 2012 and 2011, respectively
|
||||||||
|
Additional Paid-In Capital
|
1,369,407 | 1,037,469 | ||||||
|
Common Stock Payable
|
16,800 | 29,400 | ||||||
|
Retained Deficit
|
(2,241,971 | ) | (1,222,184 | ) | ||||
|
Total Equity (Deficit)
|
(785,462 | ) | (116,039 | ) | ||||
|
TOTAL LIABILITIES & EQUITY (DEFICIT)
|
$ | 954,560 | $ | 983,658 | ||||
The accompanying notes are an integral part of the financial statements
F-2
FREEZE TAG, INC.
(A DELAWARE CORPORATION)
|
Twelve months ended December 31,
|
||||||||
|
2012
|
2011
|
|||||||
|
Revenues
|
$ | 448,924 | $ | 732,591 | ||||
|
Costs and Expenses:
|
||||||||
|
Cost of Sales - Product Development
|
399,984 | 276,320 | ||||||
|
Cost of Sales - Licensing
|
39,631 | 96,344 | ||||||
|
General & Administrative
|
829,979 | 505,775 | ||||||
|
Sales & Marketing
|
12,343 | 11,930 | ||||||
|
Amortization & Depreciation
|
92,848 | 50,928 | ||||||
|
Total Expense
|
1,374,785 | 941,297 | ||||||
|
Net Ordinary Income/Loss
|
(925,861 | ) | (208,706 | ) | ||||
|
Loss on Debt Extinguishment
|
(34,577 | ) | - | |||||
|
Interest Income/(Expense), net
|
(58,006 | ) | (18,551 | ) | ||||
|
Net Income/Loss before taxes
|
(1,018,444 | ) | (227,257 | ) | ||||
|
Income Tax Expense
|
1,343 | 2,926 | ||||||
|
Net Income/Loss
|
$ | (1,019,787 | ) | $ | (230,183 | ) | ||
|
Weighted number of common shares outstanding-basic and fully diluted
|
51,204,951 | 39,082,041 | ||||||
|
Income/ (Loss) per share-basic and fully diluted
|
$ | (0.02 | ) | $ | (0.01 | ) | ||
The accompanying notes are an integral part of the financial statements
F-3
FREEZE TAG, INC.
(A DELAWARE CORPORATION)
Statement of Shareholders' Equity (Deficit)
| Convertible Preferred Stock | Common Stock |
Common
Stock
|
Additional
Paid In
|
Accumulated
|
||||||||||||||||||||||||||||
|
Shares
|
Amount
|
Shares
|
Amount
|
Payable | Capital | Deficit |
Total
|
|||||||||||||||||||||||||
|
Balances as of December 31, 2010
|
39,038,720 | $ | - | 39,038,720 | $ | 39,039 | $ | 832,989 | $ | (992,001 | ) | $ | (119,973 | ) | ||||||||||||||||||
|
Capitalized cost of equity offering
|
- | $ | - | - | $ | - | $ | - | $ | (6,364 | ) | $ | - | $ | (6,364 | ) | ||||||||||||||||
|
Stock based compensation
|
- | - | - | - | - | 16,003 | - | 16,003 | ||||||||||||||||||||||||
|
Stock issued for Marishco Technology
|
- | - | 12,000 | 12 | 29,400 | 4,188 | - | 33,600 | ||||||||||||||||||||||||
|
Discount on Technology Payable
|
- | - | - | - | - | 2,834 | - | 2,834 | ||||||||||||||||||||||||
|
Stock issued for Services
|
- | - | 225,000 | 225 | - | 47,275 | - | 47,500 | ||||||||||||||||||||||||
|
BCF on Convertible Notes
|
- | - | - | - | - | 140,544 | - | 140,544 | ||||||||||||||||||||||||
|
Net Loss
|
- | - | - | - | - | - | (230,183 | ) | (230,183 | ) | ||||||||||||||||||||||
|
Balances as of December 31, 2011
|
39,038,720 | $ | - | 39,275,720 | 39,276 | 29,400 | 1,037,469 | (1,222,184 | ) | (116,039 | ) | |||||||||||||||||||||
|
Stock issued for Marishco Technology
|
- | $ | - | 36,000 | $ | 36 | $ | (12,600 | ) | $ | 12,564 | $ | - | $ | - | |||||||||||||||||
|
Stock issued for Services
|
- | - | 3,849,871 | 3,850 | - | 140,646 | - | 144,496 | ||||||||||||||||||||||||
|
Stock issued for Conversion of Accounts Payable
|
- | - | 230,375 | 230 | - | 11,288 | - | 11,518 | ||||||||||||||||||||||||
|
Stock issued for Conversion of Related Party Debt
|
- | - | 5,577,356 | 5,577 | - | 69,423 | - | 75,000 | ||||||||||||||||||||||||
|
Stock issued for Conversion of Related Party Accrued Interest
|
5,103,000 | 5,103 | - | 5,103 | ||||||||||||||||||||||||||||
|
Stock issued for Conversion of Third Party Debt
|
- | - | 13,729,593 | 13,730 | - | 61,995 | - | 75,725 | ||||||||||||||||||||||||
|
Stock issued for Conversion of Third Party Accrued Interest
|
- | - | 2,500,000 | 2,500 | - | 1,445 | - | 3,945 | ||||||||||||||||||||||||
|
Loss on Related Party Debt Modification
|
- | - | - | - | - | 34,577 | - | 34,577 | ||||||||||||||||||||||||
|
Net Loss
|
- | - | - | - | - | - | (1,019,787 | ) | (1,019,787 | ) | ||||||||||||||||||||||
|
Balances as of December 31, 2012
|
39,038,720 | $ | - | 70,301,915 | $ | 70,302 | $ | 16,800 | $ | 1,369,407 | $ | (2,241,971 | ) | $ | (785,462 | ) | ||||||||||||||||
The accompanying notes are an integral part of the financial statements
F-4
FREEZE TAG, INC.
(A DELAWARE CORPORATION)
|
Year Ended
December 31,
2012
|
Year Ended
December 31,
2011
|
|||||||
|
Cash flows from operating activities:
|
||||||||
|
Net Income/(Loss)
|
$ | (1,019,787 | ) | $ | (230,183 | ) | ||
|
Adjustments to reconcile net loss to net cash
|
||||||||
|
provided (used) by operating activities:
|
||||||||
|
Depreciation expense
|
2,021 | 1,211 | ||||||
|
Amortization expense
|
24,688 | 12,732 | ||||||
|
Amortization of capitalized production costs
|
376,784 | 264,721 | ||||||
|
Amortization on debt discount
|
90,827 | 49,717 | ||||||
|
Impairment of production costs
|
68,628 | - | ||||||
|
Loss on debt modification - related party
|
34,577 | - | ||||||
|
Stock based compensation
|
- | 16,003 | ||||||
|
Stock issued for services
|
144,496 | 47,500 | ||||||
|
Changes in operating assets and liabilities:
|
||||||||
|
Accounts receivable
|
51,230 | 41,385 | ||||||
|
Capitalized Production Costs
|
(491,061 | ) | (571,809 | ) | ||||
|
Prepaid Royalties
|
4,794 | 9,042 | ||||||
|
Prepaid Expenses
|
1,793 | (1,008 | ) | |||||
|
Accounts Payable
|
45,658 | (21,796 | ) | |||||
|
Accrued Expenses
|
81,931 | 98,407 | ||||||
|
Unearned royalties
|
(5,788 | ) | 45,997 | |||||
|
Net cash used in operating activities
|
$ | (589,209 | ) | $ | (238,081 | ) | ||
|
Cash flows from Investing activities:
|
||||||||
|
Cash used for purchasing other assets
|
(7,500 | ) | (12,600 | ) | ||||
|
Net cash used in investing activities
|
$ | (7,500 | ) | $ | (12,600 | ) | ||
|
Cash flows from financing activities:
|
||||||||
|
Payments for PPM costs
|
- | (6,364 | ) | |||||
|
Borrowings of debt - third party
|
50,000 | 160,725 | ||||||
|
Borrowings of debt - related party
|
637,865 | 5,000 | ||||||
|
Repayments of debt - third party
|
(85,000 | ) | (18,300 | ) | ||||
|
Net cash provided by financing activities
|
$ | 602,865 | $ | 141,061 | ||||
|
Net increase (decrease) in cash
|
6,156 | (109,620 | ) | |||||
|
Cash at the beginning of the period
|
26,588 | 136,208 | ||||||
|
Cash at the end of the period
|
$ | 32,744 | $ | 26,588 | ||||
|
Non-cash transactions
|
||||||||
|
Debt discount on convertible notes payable - third party
|
$ | - | $ | 140,544 | ||||
|
Conversion of accrued interest into common stock - third party
|
$ | 3,945 | $ | - | ||||
|
Conversion of accrued interest into common stock - related party
|
$ | 5,103 | $ | - | ||||
|
Conversion of debt into common stock - related party
|
$ | 75,000 | $ | - | ||||
|
Conversion of debt into common stock - third party
|
$ | 75,725 | $ | - | ||||
|
Conversion of accounts payable into common stock - third party
|
$ | 11,518 | $ | - | ||||
|
Intangible assets purchased
|
$ | - | $ | 69,600 | ||||
|
Debt issued for intangible asset purchase,net
|
$ | - | $ | 33,166 | ||||
|
Stock issued for subscription payable
|
$ | 12,600 | $ | 33,600 | ||||
The accompanying notes are an integral part of the financial statements
F-5
FREEZE TAG, INC.
(A DELAWARE CORPORATION)
NOTES TO THE FINANCIAL STATEMENTS
Nature of Business
The Company develops family-friendly casual games for tablets and smartphones. The Company’s core belief is that games should be enjoyed as a family activity, and not limited to any one demographic. The Company focuses on casual games because it believes that these games have a wider appeal to the majority of the population, which means that the Company’s revenue potential is large. The Company targets mobile devices, such as tablets and smartphones, because research shows that more games are being played on mobile devices than ever before. The release of more free games, the portability/convenience of mobile devices, and the introduction of lower priced models have resulted in high demand for
tablets and smartphones, dramatically increasing the addressable market for the Company’s games. The Company’s management believes Freeze Tag is well positioned to take advantage of these important trends.
Revenue Recognition
The Company’s revenues are derived primarily by licensing software products in the form of online and downloadable games for PC, Mac and smartphone platforms. The Company distributes its products primarily through online games portals and smartphone device manufacturers (“distribution partners”), which market the games to end-users. The nature of our business is such that we sell games basically through four distribution outlets – WEB portals, brick and mortar retail distributors, mobile distributors and publishers, and our own web portal, www.freezetag.com.
Product Sales (web and mobile revenues)
The Company recognizes revenue from the sale of our products upon the transfer of title and risk of loss to its customers, and once any performance obligations have been completed. Revenue from product sales is recognized after deducting the estimated allowance for returns and price protection.
Licensing Revenues (retail revenues- royalties)
Third-party licensees distribute games under license agreements with the Company. We receive royalties from the licensees as a result. We recognize these royalties as revenues upon receipt of the monthly or quarterly (varies per distribution partner) revenue reports provided by the partner. Revenue from licensing/royalties is recognized after deducting the estimated allowance for returns and price protection.
Some license agreements require a royalty advance from the licensee/distributor in which case the original advance is recognized as a liability and royalty revenue is deducted from the advance as earned.
Other Revenues
Other revenues primarily include Ad game revenue and work-for-hire game related revenue. We derive our advertising game revenue from certain of our partners that offer our games free of charge to consumers in exchange for the consumers being exposed to advertising embedded in our games. In this way, we do not receive revenue for the sale of our games, but rather a percentage of the “advertising” revenue generated by these player views. This method of generating revenue is essentially the same as traditional radio or television advertising where consumers are allowed to enjoy content for “free” but are forced to watch (or listen) to advertising before, in between and at the end of the
programming content.
F-6
FREEZE TAG, INC.
(A DELAWARE CORPORATION)
NOTES TO THE FINANCIAL STATEMENTS
Additionally, we derive some revenue from “work-for-hire” projects. Some of our partners occasionally ask us to render “work-for-hire” services for them such as preparing packaging materials. For example, a retail game and DVD publisher hired us to create several designs for printed packages that were used for games published by the publisher but not developed by us. For this work, we charge a one-time, fixed fee for each package design.
The Company recognizes this revenue once all performance obligations have been completed. In addition, persuasive evidence of an arrangement must exist and collection of the related receivable must be probable.
The Company recognizes revenue in accordance with current accounting standards when an arrangement exists, delivery has occurred, the price is fixed and determinable, and collectability is probable.
Cash and Cash Equivalents
For purposes of the Statement of Cash Flows, the Company considers liquid investments with an original maturity of three months or less to be cash equivalents. The Company places its cash and cash equivalents with large commercial banks. The Federal Deposit Insurance Corporation (“FDIC”) insures these balances, up to $250,000. All of the Company’s cash balances at December 31, 2012 and December 31, 2011 were insured.
At December 31, 2012 and December 31, 2011 there were no cash equivalents.
Allowances for Returns, Price Protection, and Doubtful Accounts
Because the majority of the Company’s business is derived through online portals (such as Big Fish Games) and wireless online app stores (such as Apple), there is no physical product, other than the downloadable bits of our games that is involved in the customer purchase. In the digital environment, the customer cannot ‘return’ a digital download product. Therefore, there are no returns. The customer can ask for a refund of a digital product, and if there are any, then they are reconciled or netted out by our distribution partners before we receive the corresponding payments and royalty statements. As such, we do not allow for returns, bad debts or price protection of digital download
products.
However, the Company derives a small portion of our revenues from sales of physical packaged software for personal computers through distribution partners who sell through traditional retail channels. Product revenue is recognized net of allowances for price protection and returns and various customer discounts. Our distribution partners who sell to retailers may allow returns for our packaged personal computer products; these partners may decide to provide price protection or allow returns for personal computer products after they analyze: (1) inventory remaining in the retail channel, (2) the rate of inventory sell-through in the retail channel, and (3) the remaining inventory on hand of our games. To allow
for these returns, price protection and various customer discounts, some of our distribution partners who sell to retailers will hold back a percentage of our revenue. These “hold-back” amounts, typically a percentage of revenue, are then reconciled on a quarterly basis and detailed on the statements we receive from our distribution partners. As of December 31, 2012 and December 31, 2011; the allowance for doubtful accounts was $5,600 and $9,934, respectively.
Property and Equipment
Property and equipment are recorded at cost and are depreciated using the straight-line method over the estimated useful lives of the related assets. All assets are currently depreciated over 3 years. Maintenance and repairs are charged to expense as incurred. Renewals and improvements of a major nature are capitalized. At the time of retirement or other disposition of property and equipment, the cost and accumulated depreciation are removed from the accounts, and any resulting gains or losses are reflected in the statement of operations.
F-7
FREEZE TAG, INC.
(A DELAWARE CORPORATION)
NOTES TO THE FINANCIAL STATEMENTS
Concentrations of Credit Risk, Major Customers and Major Vendors
The Company’s customers are the end-consumers that purchase its games from the websites where the Company has its games listed for sale. Therefore, the Company does not have any individual customers that represent any more than a fraction of its revenue. However, the Company does have primary distribution partners, which are the owners of the websites where it sells its games. Under the Company’s distribution agreements it is not obligated to make, distribute or sell any games. However, for any games the Company does make and wishes to distribute it can list them on one or more of these websites under a revenue sharing arrangement where it shares the revenue from any of its games that sell. The
sharing arrangement varies greatly depending on the distributor with the Company generally keeping between 35% and 70% of the revenue and the distributor keeping the remainder of the revenue generated by each sale. At times the Company enters into “exclusivity options” whereby if a distributor wishes to have an exclusive period carrying the Company’s games (normally 30-90 days) it will agree to that in exchange for the distributor marketing the game in their newsletter and other marketing programs. Due to the fact the Company has a number of distribution partners and a variety of different websites where it can sell its games, the Company is not substantially dependent on any of its distribution partners or agreements. In addition to the distribution agreements, the Company currently has licensing agreements with Ohio Art Company and CMG Worldwide, which allow it to
develop and distribute games around third party intellectual property in exchange for paying royalty payments. The Company is not substantially dependent on either of those licensing agreements.
At December 31, 2012, the Company’s primary distributors that represented 10% or more of its revenues were: Big Fish Games – 36.89% and Exent – 10.02%. At December 31, 2011, the Company’s primary distributors that represented 10% or more of its revenues were: Big Fish Games – 37.54% and Exent – 13.07%.
At December 31, 2012, the Company’s primary distributors and partners that represented 10% or more of its accounts receivable were: Exent - 30.01%, Big Fish Games – 20.62%. At December 31, 2011, the Company’s primary distributors and partners that represented 10% or more of its accounts receivable were: Exent - 25.17%, Big Fish Games – 18.26%, and Avanquest – 11.06%.
Income Taxes
We account for income taxes using ASC Topic 740, Income Taxes. Under ASC Topic 740, income taxes are accounted for under the asset and liability method. Deferred tax assets and liabilities are recognized for the future tax consequences attributable to differences between the financial statement carrying amounts of existing assets and liabilities and their respective tax bases and operating loss and tax credit carry forwards. Deferred tax assets and liabilities are measured using enacted tax rates expected to apply to taxable income in the years in which those temporary differences are expected to be recovered or settled. The effect on deferred tax assets and liabilities of a change in tax rates is recognized
in income in the period that includes the enactment date.
ASC Topic 740 includes accounting guidance which clarifies the accounting for the uncertainty in recognizing income taxes in an organization by providing detailed guidance for financial statement recognition, measurement and disclosure involving uncertain tax positions. This guidance requires an uncertain tax position to meet a more-likely-than-not recognition threshold at the effective date to be recognized both upon the adoption of the related guidance and in subsequent periods.
The Company has no uncertain tax positions at any of the dates presented.
F-8
FREEZE TAG, INC.
(A DELAWARE CORPORATION)
NOTES TO THE FINANCIAL STATEMENTS
Foreign Currency Translation
The Company derives a portion of its revenue from foreign countries, which report to the Company in foreign currency, but pay in U.S. Dollars. Because of the fluctuations between the reporting time and the payment period (up to 60 days), it is necessary to make adjustments to the Company’s accounting records. These adjustments are recorded under a Foreign Currency Translation expense account, and shown in the Statement of Operations as a General& Administrative expense.
Accounting for Stock-Based Compensation
The Company accounts for stock-based compensation in accordance with ASC Topic 718-10, Compensation-Stock Compensation and ASC Subtopic 505-50, Equity-Based Payments to Non-Employees ("ASC stock-based compensation guidance"). Stock-based compensation expense recognized during the requisite services period is based on the value of share-based payment awards after reduction for estimated forfeitures. Forfeitures are estimated at the time of grant and are revised, if necessary, in subsequent periods if actual forfeitures differ from those estimates.
Stock-based compensation expense recognized in the Company’s statements of operations for the years ended December 31, 2012 and 2011 were $144,496 and $63,503, respectively.
Impairment of Long-Lived Assets
The Company has adopted Accounting Standards Codification subtopic 360-10, Property, Plant and Equipment ("ASC 360-10"). ASC 360-10 requires that long-lived assets and certain identifiable intangibles held and used by the Company be reviewed for impairment whenever events or changes in circumstances indicate that the carrying amount of an asset may not be recoverable. The Company evaluates its long-lived assets for impairment annually or more often if events and circumstances warrant. Events relating to recoverability may include significant unfavorable changes in business conditions, recurring losses or a forecasted inability to achieve break-even operating results over an extended period. The Company
evaluates the recoverability of long-lived assets based upon forecasted undiscounted cash flows. Should impairment in value be indicated, the carrying value of long-lived assets will be adjusted, based on estimates of future discounted cash flows resulting from the use and ultimate disposition of the asset. ASC 360-10 also requires assets to be disposed of be reported at the lower of the carrying amount or the fair value less costs to sell.
Fair Value of Financial Instruments
Effective January 1, 2009, the Company adopted Accounting Standards Codification subtopic 820-10, Fair Value Measurements and Disclosures (“ASC 820-10”) and Accounting Standards Codification subtopic 825-10, Financial Instruments (“ASC 825-10”), which permits entities to choose to measure many financial instruments and certain other items at fair value. Neither of these statements had an impact on the Company’s financial position, results of operations or cash flows. The carrying value of cash and cash equivalents, accounts payable, accrued expenses and notes payable, as reflected in the balance sheets, approximate fair value because of the short-term maturity of these
instruments.
F-9
FREEZE TAG, INC.
(A DELAWARE CORPORATION)
NOTES TO THE FINANCIAL STATEMENTS
Inputs used in the valuation to derive fair value are classified based on a fair value hierarchy which distinguishes between assumptions based on market data (observable inputs) and an entity’s own assumptions (unobservable inputs). The hierarchy consists of three levels:
|
·
|
Level one — Quoted market prices in active markets for identical assets or liabilities;
|
|
·
|
Level two — Inputs other than level one inputs that are either directly or indirectly observable; and
|
|
·
|
Level three — Unobservable inputs developed using estimates and assumptions, which are developed by the reporting entity and reflect those assumptions that a market participant would use.
|
Determining the category in which an asset or liability falls within the hierarchy requires significant judgment. The Company evaluates its hierarchy disclosures each period.
Use of Estimates
The preparation of financial statements and related disclosures in conformity with U.S. generally accepted accounting principles (“U.S. GAAP”) requires the Company’s management to make judgments, assumptions and estimates that affect the amounts reported in its financial statements and accompanying notes. Management bases its estimates on historical experience and on various other assumptions it believes to be reasonable under the circumstances, the results of which form the basis for making judgments about the carrying values of assets and liabilities. Actual results may differ from these estimates and these differences may be material.
Research and Development Costs
The Company charges costs related to research & development of products to general and administrative expense as incurred. The types of costs included in research and development expenses include research materials, salaries, contractor fees, and support materials.
F-10
FREEZE TAG, INC.
(A DELAWARE CORPORATION)
NOTES TO THE FINANCIAL STATEMENTS
Software Development Costs
Software development costs include direct costs incurred for internally developed products and payments made to independent software developers and/or contract engineers and artists. The Company accounts for software development costs in accordance with the FASB guidance for the costs of computer software to be sold, leased, or otherwise marketed (“ASC Subtopic 985-20”). Software development costs are capitalized once the technological feasibility of a product is established and such costs are determined to be recoverable. Technological feasibility of a product encompasses both technical design documentation and game design documentation, or the completed and tested product design and working
model. Software development costs are capitalized once technological feasibility of a product is established and such costs are determined to be recoverable against future revenues. For products where proven game engine technology exists (as is the case for most of the Company’s products), this may occur early in the development cycle. Significant management judgments and estimates are utilized in the assessment of when technological feasibility is established. For most of the PC/Mac and iOS/Android products, technological feasibility is established when a detailed game design document containing sufficient technical specifications written for a proven game engine or framework technology has been created and approved by management. However, technological feasibility is evaluated on a product-by-product basis. Amounts related to software development that are not capitalized are
charged immediately to the appropriate expense account. Amounts that are considered ‘research and development’ that are not capitalized are immediately charged to general and administrative expense.
Prior to a product’s release, the Company expense, as part of “Cost of Sales—Product Development”, capitalized costs when the Company believes such amounts are not recoverable. Capitalized costs for those products that are cancelled or abandoned are charged to product development expense in the period of cancellation. Commencing upon product release, capitalized software development costs are amortized to “Cost of Sales—Product Development” based on the straight-line method over either a twenty-four month period for traditional pay-to-play apps, or a thirty-six month period for free-to-play apps.
The Company evaluates the future recoverability of capitalized software development costs and intellectual property licenses on an annual basis. For products that have been released in prior years, the primary evaluation criterion is actual title performance. For products that are scheduled to be released in future years, recoverability is evaluated based on the expected performance of the specific products to which the costs relate or in which the licensed trademark or copyright is to be used. Criteria used to evaluate expected product performance include: historical performance of comparable products developed with comparable technology; orders for the product prior to its release; and, for any sequel
product, estimated performance based on the performance of the product on which the sequel is based.
Impairment expense, related to capitalized software development costs, recognized in the Company’s statements of operations for the years ended December 31, 2012 and 2011 were $68,628 and $0, respectively.
F-11
FREEZE TAG, INC.
(A DELAWARE CORPORATION)
NOTES TO THE FINANCIAL STATEMENTS
Based on current trends in the Company’s business, management has determined the expected shelf life of the majority of a game’s revenue will be realized over a three year period for free-to-play apps. Therefore, the Company has determined the appropriate amortization period for expensing capitalized production costs to be three years or thirty-six months from date of the initial release, or first sale of the product for a specific technology platform. It is possible that the same game developed on different technology platforms (such as PC and Mac, or iOS and Android) will be launched on different release dates because product development cycles may differ and distribution partner release
policies may differ.
At December 31, 2012 and 2011, current and long-term capitalized software development costs on the balance sheet were $831,980 and $786,331 respectively.
Intellectual Property Licenses (Prepaid Royalties)
Intellectual property license costs represent license fees paid to intellectual property rights holders for use of their trademarks or copyrights in the development of the Company’s products. Intellectual property license costs represent license fees paid to intellectual property rights holders for use of their trademarks, copyrights, software, technology, music or other intellectual property or proprietary rights in the development of the Company’s products. Depending upon the agreement with the rights holder, the Company may obtain the rights to use acquired intellectual property in multiple products over multiple years, or alternatively, for a single product. Minimum guaranteed royalty payments
for intellectual property licenses are initially recorded as an asset (prepaid royalties or prepaid licensing fees), and a current liability, (accrued royalties payable) at the contractual amount upon execution of the contract when no significant performance remains with the licensor. Commencing upon the related product’s release date, intellectual property licenses costs are amortized to “Cost of Sales – Licensing” based upon the percentage of revenue outlined in the contract with each specific licensor. Generally, the Company’s intellectual property licensing contracts call for licensors to be paid a percentage of revenue actually received by the Company, with allowances for minimum guarantees. Sometimes, the terms of the specific licensing contracts allow for the Company to re-capture expenses before licensing out royalties are calculated.
Capitalized intellectual property costs for those products that are cancelled or abandoned are charged to product development expense in the period of cancellation.
As of December 31, 2012 and 2011, prepaid royalties (or prepaid licensing fees) were $7,252 and $12,046, respectively.
Recent Accounting Pronouncements
In October 2012, the Financial Accounting Standards Board (“FASB”) issued Accounting Standards Update (“ASU”) 2012-04, “Technical Corrections and Improvements” in Accounting Standards Update No. 2012-04. The amendments in this update cover a wide range of Topics in the Accounting Standards Codification. These amendments include technical corrections and improvements to the Accounting Standards Codification and conforming amendments related to fair value measurements. The amendments in this update will be effective for fiscal periods beginning after December 15, 2012. The adoption of ASU 2012-04 is not expected to have a material impact on our financial position or results
of operations.
In August 2012, the FASB issued ASU 2012-03, “Technical Amendments and Corrections to SEC Sections: Amendments to SEC Paragraphs Pursuant to SEC Staff Accounting Bulletin (“SAB”) No. 114, Technical Amendments Pursuant to SEC Release No. 33-9250, and Corrections Related to FASB Accounting Standards Update 2010-22 (SEC Update)” in Accounting Standards Update No. 2012-03. This update amends various SEC paragraphs pursuant to the issuance of SAB No. 114. The adoption of ASU 2012-03 is not expected to have a material impact on our financial position or results of operations.
F-12
FREEZE TAG, INC.
(A DELAWARE CORPORATION)
NOTES TO THE FINANCIAL STATEMENTS
In July 2012, the FASB issued ASU 2012-02, “Intangibles – Goodwill and Other (Topic 350): Testing Indefinite-Lived Intangible Assets for Impairment” in Accounting Standards Update No. 2012-02. This update amends ASU 2011-08, Intangibles – Goodwill and Other (Topic 350): Testing Indefinite-Lived Intangible Assets for Impairment and permits an entity first to assess qualitative factors to determine whether it is more likely than not that an indefinite-lived intangible asset is impaired as a basis for determining whether it is necessary to perform the quantitative impairment test in accordance with Subtopic 350-30, Intangibles – Goodwill and Other - General Intangibles Other than
Goodwill. The amendments are effective for annual and interim impairment tests performed for fiscal years beginning after September 15, 2012. Early adoption is permitted, including for annual and interim impairment tests performed as of a date before July 27, 2012, if a public entity’s financial statements for the most recent annual or interim period have not yet been issued or, for nonpublic entities, have not yet been made available for issuance. The adoption of ASU 2012-02 is not expected to have a material impact on our financial position or results of operations.
In December 2011, FASB issued ASU No. 2011-11, “Balance Sheet – Disclosures about Offsetting Assets and Liabilities” (ASU 2011-11) to enhance disclosure requirements relating to the offsetting of assets and liabilities on an entity's balance sheet. The update requires enhanced disclosures regarding assets and liabilities that are presented net or gross in the statement of financial position when the right of offset exists, or that are subject to an enforceable master netting arrangement. The new disclosure requirements relating to this update are retrospective and effective for annual and interim periods beginning on or after January 1, 2013. The update only requires additional disclosures,
as such, we do not expect that the adoption of this standard will have a material impact on our results of operations, cash flows or financial condition.
In September 2011, the FASB issued ASU No. 2011-08, “Intangibles – Goodwill and Other” (ASU 2011-08). ASU 2011-08 allows a qualitative assessment of whether it is more likely than not that a reporting unit’s fair value is less than its carrying amount before applying the two-step goodwill impairment test. If it is more likely than not that the fair value of a reporting unit is less than its carrying amount, then the two-step impairment test would be performed. ASU 2011-08 is effective for annual and interim goodwill impairment tests performed for fiscal years beginning after December 15, 2011, and early adoption is permitted.
In May 2011, the FASB issuedASU No. 2011-04, Fair Value Measurement (Topic 820): Amendments to Achieve Common Fair Value Measurement and Disclosure Requirements in U.S. GAAP and IFRSs. This update clarifies the application of certain existing fair value measurement guidance and expands the disclosures for fair value measurements that are estimated using significant unobservable (Level 3) inputs. This update is effective on a prospective basis for annual and interim reporting periods beginning on or after December 15, 2011, which for the Company is January 1, 2012.
As shown in the accompanying financial statements for the years ending December 31, 2012 and December 31, 2011, we have incurred net losses of $1,019,787 and $230,183, respectively. As of December 31, 2012 our retained deficit is $2,241,971. During fiscal 2012, we continued to experience close to neutral cash flows from operations largely due to our continued investment spending for product development of game titles for the PC and other popular gaming platforms that are expected to benefit future periods. Those facts, along with our lack of access to a significant bank credit facility, create an uncertainty about our ability to continue as a going concern. Accordingly, we are currently evaluating our
alternatives to secure financing sufficient to support the operating requirements of our current business plan, as well as continuing to execute our business strategy of distributing our game titles to digital distribution outlets, including mobile gaming app stores, online PC and Mac gaming portals, and opportunities for new devices such as tablet (mobile internet device) applications, mobile gaming platforms and international licensing opportunities.
F-13
FREEZE TAG, INC.
(A DELAWARE CORPORATION)
NOTES TO THE FINANCIAL STATEMENTS
Our ability to continue as a going concern is dependent upon our success in securing sufficient financing and to successfully execute our plans to return to positive cash flows during fiscal 2013. Our financial statements do not include any adjustments that might be necessary if we were unable to continue as a going concern.
Capitalized Production Costs, Net consists of the following at:
|
December 31,
2012
|
December 31,
2011
|
|||||||
|
Capitalized Production Costs
|
2,042,257 | 1,551,196 | ||||||
|
Accumulated Production Costs Amortization
|
(1,141,649 | ) | (764,865 | ) | ||||
|
Impairment of Production Costs
|
(68,628 | ) | - | |||||
|
Total Capitalized Production Costs, Net
|
831,980 | $ | 786,331 | |||||
|
Current
|
332,508 | 171,450 | ||||||
|
Long Term
|
499,472 | 614,881 | ||||||
The Company recognized amortization expense of $376,784 and $264,721 for the years ended December 31, 2012 and 2011, respectively.
The Company evaluates the future recoverability of capitalized software development costs and intellectual property licenses on an annual basis. For products that have been released in prior years, the primary evaluation criterion is actual title performance. For products that are scheduled to be released in future years, recoverability is evaluated based on the expected performance of the specific products to which the costs relate or in which the licensed trademark or copyright is to be used. Criteria used to evaluate expected product performance include: historical performance of comparable products developed with comparable technology; orders for the product prior to its release; and, for any sequel
product, estimated performance based on the performance of the product on which the sequel is based.
Impairment expense, related to capitalized software development costs, recognized in the Company’s statements of operations for the years ended December 31, 2012 and 2011 were $68,628 and $0, respectively.
F-14
FREEZE TAG, INC.
(A DELAWARE CORPORATION)
NOTES TO THE FINANCIAL STATEMENTS
On June 22, 2011, the Company entered into a technology transfer agreement with an unaffiliated third party, which included a liability in the amount of $36,000 (Note 9) and 96,000 shares of common stock (Note 11) in exchange for the right, title, and interest in the Marishco Game Engine. The liability is payable in 24 installments of $1,500 per installment. The common stock is payable in eight quarterly installments of 12,000 shares per installment. During the years ended December 31, 2012 and 2011, the Company paid cash of $7,500 and $12,600, respectively. During the years ended December 31, 2012 and 2011, the Company issued common shares of 36,000 and 12,000, respectively, to the unaffiliated third party
and reduced common stock payable accordingly.
The game engine will be amortized on a straight-line basis over the useful life of three years. For the years ended December 31, 2012 and 2011 amortization expense was $23,200 and $11,600, respectively.
Fixed assets, Net, consists of the following at:
|
December 31
,
2012
|
December 31,
2011
|
|||||||
|
Computer Equipment
|
5,347 | 5,347 | ||||||
|
Communications Equipment
|
830 | 830 | ||||||
|
Software
|
3,600 | 3,600 | ||||||
|
Accumulated Depreciation
|
(6,928 | ) | (4,907 | ) | ||||
|
Total Fixed Assets, Net
|
$ | 2,849 | $ | 4,870 | ||||
Property and equipment are recorded at cost and are depreciated using the straight-line method over the estimated useful lives of the related assets. All assets are currently depreciated over three years. For the years ended December 31, 2012 and 2011, depreciation expense was $2,021 and $1,211, respectively.
Accrued Compensation Consists of the following at:
|
December 31
,
2012
|
December 31,
2011
|
|||||||
|
Accrued Vacation
|
$ | 75,021 | $ | 63,663 | ||||
|
Accrued Salary
|
93,600 | 93,600 | ||||||
|
Total Accrued Compensation
|
$ | 168,621 | $ | 157,263 | ||||
F-15
FREEZE TAG, INC.
(A DELAWARE CORPORATION)
NOTES TO THE FINANCIAL STATEMENTS
Accrued Royalties consists of money owed to other parties with whom we have revenue-sharing agreements or from whom we license certain trademarks or copy writes.
Unearned Royalties consists of royalties received from licensees, which have not yet been earned.
Accrued and Unearned Royalties consists of the following at:
|
December 31,
2012
|
December 31,
2011
|
|||||||
|
Accrued Royalties
|
$ | 388,323 | $ | 354,736 | ||||
|
Unearned Royalties
|
270,061 | 275,849 | ||||||
|
Total Accrued and Unearned Royalties
|
$ | 658,384 | $ | 630,585 | ||||
Leases
The Company has been residing in its current building at 228 W. Main Street, Tustin, California since 2006. Since that time, the Company has paid rent on a month-to-month basis. As such, the Company is free to leave the current premises at any time with 30 days courtesy notice but the Company does not have a lease agreement with the property owner. This is the Company’s preference since it is the Company’s desire to be able to quickly expand to alternative office space should the Company’s growth require additional square footage than the current offices. The Company or Company employees or contractors own all of the computer and office equipment that is used in the course of business. The
Company does not have any lease agreements for any office equipment.
Technology Payable
On June 22, 2011, the Company entered into a technology transfer agreement with an unaffiliated third party which included a liability in the amount of $36,000 and 96,000 shares of common stock (Note 11) in exchange for the right, title, and interest in the Marishco Game Engine. The liability is payable in 24 installments of $1,500 per installment and there is no stated interest rate. Therefore the balance of $36,000 was recorded as a liability, net of a discount of $2,834 with the discount to be amortized over the life of the liability using the effective interest method.
As of December 31, 2012 and 2011, the Company recognized a current liability of $17,787 and $18,000, respectively, and a long-term liability of $0 and $7,299. During the years ended December 31, 2012 and 2011, the Company recorded amortization of the debt discount of $1,488 and $1,133, respectively. As of December 31, 2012 and 2011, the remaining debt discounts were $213 and $1,701, respectively.
F-16
FREEZE TAG, INC.
(A DELAWARE CORPORATION)
NOTES TO THE FINANCIAL STATEMENTS
|
Debt consists of the following at:
|
||||||||
|
December 31
,
2012
|
December 31,
2011
|
|||||||
|
Notes Payable *
|
$ | 595,000 | $ | 55,000 | ||||
|
Notes Payable – Convertible *
|
100,000 | 75,000 | ||||||
|
Notes Payable – Convertible, in default
|
50,000 | - | ||||||
|
Notes Payable – Convertible
|
- | 160,725 | ||||||
|
Discounts on Convertible Notes Payable
|
- | (90,827 | ) | |||||
|
Total Debt, Net of Discounts
|
745,000 | 199,898 | ||||||
|
Less: Current, Net of Discounts
|
745,000 | 199,898 | ||||||
|
Long Term, Net of Discounts
|
$ | - | $ | - | ||||
* Related Party
Convertible Note Payable
On July 21, 2011, the Company entered into a Securities Purchase Agreement with Asher Enterprises, Inc., pursuant to which the Company sold to Asher an 8% Convertible Promissory Note in the original principal amount of $62,500 (the “First Asher Note”). The First Asher Note has a maturity date of April 25, 2012, and is convertible into Company common stock at the greater of (i) the Variable Conversion Price and (ii) the Fixed Conversion Price. The “Variable Conversion Price” shall mean 55% multiplied by the Market Price (representing a discount rate of 45%). “Market Price” means the average of the lowest three (3) Trading Prices for the Common Stock during the ten (10)
Trading Day period ending on the latest complete Trading Day prior to the Conversion Date. “Fixed Conversion Price” shall mean $0.00009. The shares of common stock issuable upon conversion of the First Asher Note will be restricted securities as defined in Rule 144 promulgated under the Securities Act of 1933. The purchase and sale of the First Asher Note closed on August 1, 2011, the date that the purchase price was delivered to the Company. The issuance of the First Asher Note was exempt from the registration requirements of the Securities Act of 1933 pursuant to Rule 506 of Regulation D promulgated there under. The purchaser was an accredited and sophisticated investor, familiar with our operations, and there was no solicitation.
The Company evaluated the First Asher Note and determined that the shares issuable pursuant to the conversion option were determinate due to the Fixed Conversion Price and, as such, does not constitute a derivative liability as the Company has obtained authorization from a majority of shareholders such that should conversion occur at the Fixed Conversion Price the appropriate number of shares will be available or issuable for settlement to occur. The beneficial conversion feature discount resulting from the conversion price of $0.1375 below the market price on July 21, 2011 of $0.25 provided a value of $51,136. During the years ended December 31, 2012 and 2011, $21,261 and $29,875, respectively, of the debt
discount was amortized.
During the twelve months ended December 31, 2012, eight conversions of the First Asher Note, totaling 15,665,363 shares, occurred between prices of $0.0083 to $0.0110 per share, in order to convert $62,500 in principal and $2,500 in accrued interest all in accordance with the Variance Conversion Price. As a result of these transactions, the note was considered paid off during October 2012. Accrued interest remaining after the conversions of $2,984 was paid in cash during November 2012.
F-17
FREEZE TAG, INC.
(A DELAWARE CORPORATION)
NOTES TO THE FINANCIAL STATEMENTS
On September 16, 2011, the Company entered into a Securities Purchase Agreement with Asher Enterprises, Inc., pursuant to which the Company sold to Asher an 8% Convertible Promissory Note in the original principal amount of $40,000 (the “Second Asher Note”). The Second Asher Note has a maturity date of June 20, 2012, and is convertible into Company common stock at the greater of (i) the Variable Conversion Price and (ii) the Fixed Conversion Price. The “Variable Conversion Price” shall mean 55% multiplied by the Market Price (representing a discount rate of 45%). “Market Price” means the average of the lowest three (3) Trading Prices for the Common Stock during the ten (10)
Trading Day period ending on the latest complete Trading Day prior to the Conversion Date. “Fixed Conversion Price” shall mean $0.00009. The shares of common stock issuable upon conversion of the Second Asher Note will be restricted securities as defined in Rule 144 promulgated under the Securities Act of 1933. The purchase and sale of the Second Asher Note closed on September 22, 2011, the date that the purchase price was delivered to the Company.
The Company evaluated the Second Asher Note and determined that the shares issuable pursuant to the conversion option were determinate due to the Fixed Conversion Price and, as such, does not constitute a derivative liability as the Company has obtained authorization from a majority of shareholders such that should conversion occur at the Fixed Conversion Price the appropriate number of shares will be available or issuable for settlement to occur. The beneficial conversion feature discount resulting from the conversion price of $0.11917 below the market price on September 16, 2011 of $0.30 provided a value of $40,000. During the years ended December 31, 2012 and 2011, $24,748 and $15,252, respectively, of the
debt discount was amortized. During November 2012, principal of $40,000 and accrued interest of $3,157 was paid in cash thus retiring the Second Asher Note.
On November 17, 2011, for value received, the Company gave a convertible promissory note to The Lebrecht Group, APLC, in the original principal amount of $13,225 (the “Lebrecht Note”). The Lebrecht Note has a maturity date of November 18, 2012, and principle and accrued interest at the rate of ten percent (10%) are due at that time. The note holder has an option to convert the note into Common Stock to be issued upon each conversion of the Lebrecht Note and shall be determined by dividing the Conversion Amount by the Conversion Price, which shall be equal to the greater of (i) the Fixed Conversion Price, which is $0.001 per share, and (ii) the Variable Conversion Price, which is seventy five
percent (75%) of the closing bid price for the Common Stock on the trading day immediately preceding the conversion, (the Fixed Conversion Price and the Variable Conversion Price, as applicable, shall be referred to as the “Conversion Price”).
The Company evaluated the Lebrecht Note and determined that the shares issuable pursuant to the conversion option were determinate due to the Fixed Conversion Price and, as such, does not constitute a derivative liability as the Company has obtained authorization from a majority of shareholders such that should conversion occur at the Fixed Conversion Price the appropriate number of shares will be available or issuable for settlement to occur. The beneficial conversion feature discount resulting from the conversion price of $0.10125 below the market price on November 17, 2011 of $0.135 provided a value of $4,408. During the years ended December 31, 2012 and 2011, $3,279 and $529, respectively, of the debt
discount was amortized. On December 20, 2012, 564,230 shares were issued, in accordance with the conversion terms, in order to convert $13,225 of principal and $1,445 of accrued interest into common shares, thus retiring the Lebrecht Note.
On December 6, 2011, the Company entered into a Securities Purchase Agreement with Asher Enterprises, Inc., pursuant to which the Company sold to Asher an 8% Convertible Promissory Note in the original principal amount of $45,000 (the “Third Asher Note”). The Third Asher Note has a maturity date of September 8, 2012, and is convertible into Company common stock at the greater of (i) the Variable Conversion Price and (ii) the Fixed Conversion Price. The “Variable Conversion Price” shall mean 55% multiplied by the Market Price (representing a discount rate of 45%). “Market Price” means the average of the lowest three (3) Trading Prices for the Common Stock during the ten (10)
Trading Day period ending on the latest complete Trading Day prior to the Conversion Date. “Fixed Conversion Price” shall mean $0.00009. The shares of common stock issuable upon conversion of the Third Asher Note will be restricted securities as defined in Rule 144 promulgated under the Securities Act of 1933. The purchase and sale of the Third Asher Note closed on December 8, 2011, the date that the purchase price was delivered to the Company.
F-18
FREEZE TAG, INC.
(A DELAWARE CORPORATION)
NOTES TO THE FINANCIAL STATEMENTS
The Company evaluated the Third Asher Note and determined that the shares issuable pursuant to the conversion option were determinate due to the Fixed Conversion Price and, as such, does not constitute a derivative liability as the Company has obtained authorization from a majority of shareholders such that should conversion occur at the Fixed Conversion Price the appropriate number of shares will be available or issuable for settlement to occur. The beneficial conversion feature discount resulting from the conversion price of $0.0605 below the market price on December 6, 2011 of $0.14 provided a value of $45,000. During the years ended December 31, 2012 and 2011, $40,939 and $4,061, respectively, of the debt
discount was amortized. During November 2012, principal of $45,000 and accrued interest of $2,661 was paid in cash thus retiring the Third Asher Note.
The remaining cash paid towards the extinguishment of the First, Second and Third Asher notes was $34,577 which was recorded in the statement of operations as a loss on debt extinguishment.
On April 2, 2012, a convertible note loan from Robert Cowdell was secured for $50,000 in cash. The promissory note is convertible into the Company’s common stock at a rate of $0.04 per share. The convertible promissory note bears interest at the rate of 12% per annum and matures 6 months from the date the purchase installment was received. Accrued interest as of December 31, 2012 was $4,251. As of December 31, 2012, the note was in default.
The Company evaluated this convertible note for derivative liability treatment noting that if the shares were converted at a fixed price of $0.04 per share, and the principal value of $50,000, this would result in 1,250,000 additional shares which is approximately 2.5% of the authorized share count; therefore, the number of shares is determinate and in conclusion, the note is not considered a derivative liability. In addition, the Company evaluated this related party convertible note for a beneficial conversion feature noting that the conversion price of $0.04 which was exactly the same as the market price of $0.04 on the date of issuance; therefore, no beneficial conversion feature was created during
issuance of this note.
In summary, the First, Second and Third Asher Notes and the Lebrecht Note resulted in beneficial conversion feature amortization during the years ended December 31, 2012 and 2011, of $90,827 and $49,717, respectively.
Total Accrued interest at December 31, 2012 and 2011, for the above convertible notes is $4,251 and $3,436, respectively.
Convertible Note Payable – Related Party
On July 2, 2010, a convertible note loan from Holland Family Trust, (whose sole trustee is Franklena Holland, mother of Company president Craig Holland), was secured for $100,000. The Company has received $75,000 of the purchase price, with the remaining $25,000 to be paid at a later date. The promissory note is convertible into the Company’s common stock at a rate of $0.10 per share. The convertible promissory note bears interest at the rate of 10% per annum and matures 12 months from the date each purchase installment was received. Interest on the notes is paid each month at the first of the month as such there was no accrued interest as of December 31, 2011. On November 6, 2012, the Company modified
the note, such that its conversion rate was $0.0038 instead of $0.1000; which resulted in an increase to additional paid in capital and interest expense of 34,577. Also on November 6, 2012, the Company converted $75,000 in principal and $5,103 in accrued interest into 10,680,356 common shares (5,577,356 for related party principal and 5,103,000 for related party accrued interest) in accordance with the modified convertible note.
F-19
FREEZE TAG, INC.
(A DELAWARE CORPORATION)
NOTES TO THE FINANCIAL STATEMENTS
The Company evaluated this related party convertible note for derivative liability treatment noting that if the shares were converted at a fixed price of $0.10 per share, and the principal value of $75,000, this would result in 750,000 additional shares which is less than 1% of the authorized share count; therefore, the number of shares is determinate and in conclusion, the note is not considered a derivative liability. In addition, the Company evaluated this related party convertible note for a beneficial conversion feature noting that the conversion price of $0.10 which was exactly the same as the market price of $0.10 during the 2009-2010 fiscal years when the common shares were being sold to private
purchasers consistently at this price; therefore, no beneficial conversion feature was created during issuance of this note.
On January 26, 2012, a convertible note loan from Holland Family Trust, (whose sole trustee is Franklena Holland, mother of Company president Craig Holland), was secured for $100,000. The promissory note is convertible into the Company’s common stock at a rate of $0.05 per share. The convertible promissory note bears interest at the rate of 10% per annum and matures 12 months from the date each purchase installment was received. On April 19, 2012, Franklena E. Holland passed away. The terms of the Holland Family Trust indicate that Craig B. Holland becomes the Successor Trustee after Franklena's passing. As of April 19, 2012, Mr. Holland is now acting as the Trustee of the Holland Family Trust. As of
December 31, 2012 and 2011, accrued interest was $8,333 and $0, respectively.
The Company evaluated this related party convertible note for derivative liability treatment noting that if the shares were converted at a fixed price of $0.05 per share, and the principal value of $100,000, this would result in 2,000,000 additional shares which is approximately 2% of the authorized share count; therefore, the number of shares is determinate and in conclusion, the note is not considered a derivative liability. In addition, the Company evaluated this related party convertible note for a beneficial conversion feature noting that the conversion price of $0.05 which was exactly the same as the market price of $0.05 on the date of issuance; therefore, no beneficial conversion feature was created
during issuance of this note.
Note Payable - Related Party
As of July 1, 2010, there is a note payable to Craig Holland and Mick Donahoo for $25,000 each (a total of $50,000 notes payable) for money that was loaned to the Company to secure the Sunwest Bank debt. The money was loaned to the Company at a rate of 10% interest compounded annually and matures on June 20, 2013. As of December 31, 2012 and 2011, accrued interest was $13,024 and $7,954, respectively.
As of October 19, 2011, there is a note payable to Mick Donahoo for $5,000 for money that was loaned to the Company to secure equipment. The money was loaned to the Company at a rate of 10% interest compounded annually and matures on October 19, 2013. As of December 31, 2012 and 2011, accrued interest was $600 and $82, respectively.
F-20
FREEZE TAG, INC.
(A DELAWARE CORPORATION)
NOTES TO THE FINANCIAL STATEMENTS
As of April 11, 2012, there is a note payable to Mick Donahoo for $15,000 for money that was loaned to the Company. The money was loaned to the Company at a rate of 10% interest compounded annually and matures on July 11, 2013. As of December 31, 2012 and 2011, accrued interest was $1,205 and $0, respectively.
As of April 25, 2012, there is a note payable to Craig Holland and Mick Donahoo for $10,000 each (a total of $20,000 notes payable) for money that was loaned to the Company. The money was loaned to the Company at a rate of 10% interest compounded annually and matures on July 25, 2013. As of December 31, 2012 and 2011, accrued interest was $1,398 and $0, respectively.
As of June 21, 2012, there is a note payable to the Holland Family Trust for $40,000 for money that was loaned to the Company. The money was loaned to the company at a rate of 10% interest compounded annually and matures on July 24, 2013. As of December 31, 2012 and 2011, accrued interest was $2,115 and $0, respectively.
As of August 13, 2012, there is a note payable to the Holland Family Trust for $70,000 for money that was loaned to the Company. The money was loaned to the Company at a rate of 10% interest compounded annually and matures on August 13, 2013. As of December 31, 2012 and 2011, accrued interest was $2,685 and $0, respectively.
As of September 12, 2012, there is a note payable to the Holland Family Trust for $65,000 for money that was loaned to the Company. The money was loaned to the Company at a rate of 10% interest compounded annually and matures on September 12, 2013. As of December 31, 2012 and 2011, accrued interest was $1,959 and $0, respectively.
As of October 11, 2012, there is a note payable to the Holland Family Trust for $50,000 for money that was loaned to the Company. The money was loaned to the Company at a rate of 10% interest compounded annually and matures on April 11, 2013. As of December 31, 2012 and 2011, accrued interest was $1,107 and $0, respectively.
On November 1, 2012, there was a note payable issued to the Holland Family Trust for $130,000. The money was loaned to the Company to pay off the debt associated with the two remaining Asher Enterprises, Inc. convertible promissory notes, and was loaned to the Company at a rate of 10% interest compounded annually and matures on May 1, 2013. As of December 31, 2012 and 2011, accrued interest was $2,137 and $0, respectively.
As of November 13, 2012, there is a note payable to the Holland Family Trust for $75,000 for money that was loaned to the Company. The money was loaned to the Company at a rate of 10% interest compounded annually and matures on May 13, 2013. As of December 31, 2012 and 2011, accrued interest was $986 and $0, respectively.
As of December 10, 2012, there is a note payable to the Holland Family Trust for $75,000 for money that was loaned to the Company. The money was loaned to the Company at a rate of 10% interest compounded annually and matures on June 10, 2013. As of December 31, 2012 and 2011, accrued interest was $432 and $0, respectively.
For the years ended December 31, 2012 and 2011, the Company recorded interest expense of $37,295 and $13,030, respectively related to the related party notes payable and related party convertible notes above.
F-21
FREEZE TAG, INC.
(A DELAWARE CORPORATION)
NOTES TO THE FINANCIAL STATEMENTS
The Company recorded total interest expense, including beneficial conversion feature amortization, for all debt of $147,345 and $67,135 for the year ended December 31, 2012, and 2011, respectively. However, the beneficial conversion feature amortization of $90,827 and $49,717 recorded during the years ended December 31, 2012 and 2011, respectively, were not recorded in interest expense; rather, they were recorded in depreciation and amortization expense.
Stock Issuance
The Company is authorized to issue up to 100,000,000 shares of its $0.001 par value common stock, and up to 10,000,000 shares of its $0.001 par value preferred stock.
On June 22, 2011, the Company entered into a technology transfer agreement with an unaffiliated third party included a liability in the amount of $36,000 (Note 9) and 96,000 shares of common stock. The liability of $36,000 was recorded net of a debt discount of $2,834 which was included in additional paid in capital at June 30, 2011. The common stock is payable in eight quarterly installments of 12,000 shares per installment. The first installment was delivered effective September 16, 2011. As the third party has no future performance obligation, the Company valued the 96,000 shares at $33,600 based on the closing price of $0.35 per share on the measurement date. The amount is recorded in common stock payable
as of June 30, 2011. As of December 31, 2012 and 2011, stock payables were $16,800 and $29,400, respectively, due to the issuance of 36,000 and 12,000 shares during the years ended December 31, 2012 and 2011, respectively. The Company considered ASC 718-10-25-20 concluding that June 22, 2011 is the appropriate measurement date as the Company has received the goods, there is no significant disincentive to perform, and there is no future performance/service obligation on the part of the third party.
On September 21, 2011, the Company issued 100,000 shares of Company common stock, restricted in accordance with Rule 144, to Empire Relations Group, Inc. as consideration under a consulting agreement dated September 16, 2011 for public and financial relations services. The fair value was $30,000 based on the closing stock price of $0.30 per share on the measurement date as the shares are non-refundable and no future performance obligation exists. The issuance of the shares was exempt from the registration requirements of the Securities Act of 1933 pursuant to Section 4(2) thereof. The consultant was an accredited and sophisticated investor, familiar with our operations, and there was no
solicitation.
On September 21, 2011, the Company issued 12,000 shares of Company common stock, restricted in accordance with Rule 144, to an unaffiliated thirty party as consideration under the Technology Transfer Agreement entered into on June 22, 2011. This is the first of eight identical quarterly installments of shares to be issued. The fair value of $4,200 based on the closing price of $0.35 per share on the measurement date was deducted from common stock payable. The issuance of the shares was exempt from the registration requirements of the Securities Act of 1933 pursuant to Section 4(2) thereof. The shareholder was a sophisticated investor, familiar with our operations, and there was no solicitation.
On November 29, 2011, the Company issued 125,000 shares of Company common stock, restricted in accordance with Rule 144, to Michael Southworth as additional consideration under a consulting agreement dated November 29, 2011 for public and financial relations services. The fair value was $17,500 based on the closing stock price of $0.14 per share on the measurement date of November 29, 2011. The issuance of the shares was exempt from the registration requirements of the Securities Act of 1933 pursuant to Section 4(2) thereof. The consultant was an accredited and sophisticated investor, familiar with our operations, and there was no solicitation.
F-22
FREEZE TAG, INC.
(A DELAWARE CORPORATION)
NOTES TO THE FINANCIAL STATEMENTS
During the twelve months ended December 31, 2012, eight conversions of the First Asher Note, totaling 15,665,363 shares, occurred between prices of $0.0083 to $0.0110 per share, in order to convert $62,500 in principal and $2,500 in accrued interest all in accordance with the Variance Conversion Price. As a result of these transactions, the note was considered paid off during October 2012. Accrued interest remaining after the conversions of $2,984 was paid in cash during November 2012.
On March 2, 2012, the Company issued 3,000,000 shares of Company common stock, restricted in accordance with Rule 144, to Crucible Capital Group, Inc. in lieu of a cash retainer for services pursuant to a letter agreement dated February 29, 2012; as the agreement did not allow for return of shares, the amount of $102,000 was expensed upon the date granted. The issuance was exempt from registration pursuant to Section 4(2) of the Securities Act of 1933, and the investor was accredited and sophisticated, familiar with our operations, and there was no solicitation. The shares were valued at $102,000 based on the closing stock price of $0.34 for the date of the letter agreement dated February 29,
2012.
On December 20, 2012, 564,231 shares were issued, in accordance with the conversion terms, in order to convert $13,225 of principal and $1,445 of accrued interest into common shares, thus retiring the Lebrecht Note.
Also on November 6, 2012, the Company converted $75,000 in principal and $5,103 in accrued interest into 10,680,356 common shares in accordance with the modified convertible note due to Craig Holland.
During the year ended December 31, 2012, the Company issued 36,000 shares of Company common stock, restricted in accordance with Rule 144, to an unaffiliated thirty party as consideration under the Technology Transfer Agreement entered into on June 22, 2011. This is the second, third and fourth of eight identical quarterly installments of shares to be issued. The fair value of $12,600 based on the closing price of $0.35 per share on the measurement date was deducted from common stock payable. The issuance of the shares was exempt from the registration requirements of the Securities Act of 1933 pursuant to Section 4(2) thereof. The shareholder was a sophisticated investor, familiar with our operations, and
there was no solicitation.
On May 29, 2012, the Company issued 1,080,246 shares of Company common stock, restricted in accordance with Rule 144, to various employees and contractors for services rendered. The shares were valued based on the closing stock price for the date of the grant dated May 29, 2012. 230,375 of these shares were issued as a conversion of accounts payable; the fair value on the date of grant of May 29, 2012, was compared with the fair value of the amounts payable, noting the difference was zero; therefore, no gain or loss was booked as a result of this conversion. The amounts were properly classified as non-cash reconciling items to net income due to the fact that the accounts payable amounts were expensed during
the six-months ended June 30, 2012.
Discussion of 2006 Stock Option plan
The 2006 Stock Option Plan was adopted by our Board of Directors in March of 2006. A total of 550,000 shares of Common Stock have been reserved for issuance to employees, consultants and directors upon exercise of incentive and non-statutory options and stock purchase rights which may be granted under the Company’s 2006 Stock Plan (the “2006 Plan”). On October 15, 2009, 235,000 of those options were exercised, leaving 315,000 shares available for issuance to employees. Because of the 5.31-for-one forward stock split of the Company’s common stock on October 15, 2009, there are now 1,512,650 shares available for issuance as a part of this stock plan. As of the periods ended December 31,
2012 and 2011, there were 560,000 options outstanding to purchase shares of Common Stock, and no shares of Common Stock had been issued pursuant to stock purchase rights under the 2006 Plan.
F-23
FREEZE TAG, INC.
(A DELAWARE CORPORATION)
NOTES TO THE FINANCIAL STATEMENTS
Under the 2006 Plan, options may be granted to employees, directors, and consultants. Only employees may receive “incentive stock options,” which are intended to qualify for certain tax treatment, and consultants and directors may receive “non-statutory stock options,” which do not qualify for such treatment. A holder of more than 10% of the outstanding voting shares may only be granted options with an exercise price of at least 110% of the fair market value of the underlying stock on the date of the grant, and if such holder has incentive stock options, the term of the options must not exceed five years.
Options and stock purchase rights granted under the 2006 Plan generally vest ratably over a four year period (typically 1⁄4 or 25% of the shares vest after the 1st year and 1/48 of the remaining shares vest each month thereafter); however, alternative vesting schedules may be approved by the Board of Directors in its sole discretion. Any unvested portion of an option or stock purchase right will accelerate and become fully vested if a holder’s service with the Company is terminated by the Company without cause within twelve months following a Change in Control (as defined in the 2006 Plan).
All options must be exercised within ten years after the date of grant. Upon a holder’s termination of service for any reason prior to a Change in Control, the Company may repurchase any shares issued to such holder upon the exercise of options or stock purchase rights. The Board of Directors may amend the 2006 Plan at any time. The 2006 Plan will terminate in 2016, unless terminated sooner by the Board of Directors.
The Company granted 560,000 stock options during the year ended December 31, 2010. As of December 31, 2011, the stock options became fully vested and expensed accordingly. The Company did not grant any stock options for the periods ended December 31, 2012 and 2011. The weighted average assumptions used in the model are outlined in the following table:
|
December 31,
2010
|
||||
|
Risk-free rate of interest
|
1.81 | % | ||
|
Dividend yield
|
0 | % | ||
|
Volatility of common stock
|
321.74 | % | ||
|
Expected term
|
5.3125 years
|
|||
Stock-based compensation expense recognized in our statement of operations for the year ended December 31, 2012 and 2011, were $144,496 and $63,503, respectively.
The Company did not grant any warrants during years ended December 31, 2012 and 2011.
Exercising of Stock Warrants and Options
For the years ended December 31, 2012 and 2011, no shares of common stock were issued on the cashless exercise of warrants or options.
F-24
FREEZE TAG, INC.
(A DELAWARE CORPORATION)
NOTES TO THE FINANCIAL STATEMENTS
A summary of the status of the warrants and options issued by the Company as of December 31, 2012 and 2011 are as follows:
|
December 31, 2012
|
December 31, 2011
|
|||||||||||||||
|
Number of Warrants & Options
|
Weighted Average Exercise Price
|
Number of Warrants & Options
|
Weighted Average Exercise Price
|
|||||||||||||
|
Outstanding at beginning of year
|
560,000 | $ | 0.10 | 560,000 | $ | 0.10 | ||||||||||
|
Granted
|
- | - | - | - | ||||||||||||
|
Exercised for cash
|
- | - | - | - | ||||||||||||
|
Exercised for cashless
|
- | - | - | - | ||||||||||||
|
Expired and cancelled
|
- | - | - | - | ||||||||||||
|
Outstanding, end of period
|
560,000 | $ | 0.10 | 560,000 | $ | 0.10 | ||||||||||
The Company accounts for income taxes in accordance with standards of disclosure propounded by the FASB, and any related interpretations of those standards sanctioned by the FASB. Accordingly, deferred tax assets and liabilities are determined based on differences between the financial statement and tax bases of assets and liabilities, as well as a consideration of net operating loss and credit carry forwards, using enacted tax rates in effect for the period in which the differences are expected to impact taxable income. A valuation allowance is established, when necessary, to reduce deferred tax assets to the amount that is more likely than not to be realized. Due to the uncertainty as to the utilization of
net operating loss carry forwards, a valuation allowance has been made to the extent of any tax benefit that net operating losses may generate.
Income tax expense consists of California minimum franchise taxes of $1,600, Delaware state taxes of $489, and back taxes owed of $837. For Federal and California income tax purposes, the Company has net operating loss carry forwards that expire through 2027. The net operating loss as of December 31, 2012 and 2011 were $427,295 and $149,529, respectively. No tax benefit has been reported in the financial statements because after evaluating our own potential tax uncertainties, the Company has determined that there are no material uncertain tax positions that have a greater than 50% likelihood of reversal if the Company were to be audited.
Deferred tax asset and the valuation account consists of the following at:
|
December 31,
2012
|
December 31,
2011
|
|||||||
|
Deferred Tax Asset
|
$ | 145,280 | $ | 50,840 | ||||
|
Valuation Allowances
|
(145,280 | ) | (50,840 | ) | ||||
|
Total:
|
- | - | ||||||
F-25
FREEZE TAG, INC.
(A DELAWARE CORPORATION)
NOTES TO THE FINANCIAL STATEMENTS
Basic loss per share is calculated based on the weighted-average number of outstanding common shares. Diluted loss per share is calculated based on the weighted-average number of outstanding common shares plus the effect of dilutive potential common shares.
Net loss per share for the year ending:
|
December 31,
2012
|
December 31,
2011
|
|||||||
|
Net Income/Loss
|
$ | ( 1,019,787 | ) | $ | ( 230,183 | ) | ||
|
Weighted number of common shares outstanding - basic
|
51,204,951 | 39,082,041 | ||||||
|
Loss per share - basic
|
$ | (0.02 | ) | $ | (0.01 | ) | ||
|
Weighted number of common shares outstanding - fully diluted
|
74,111,915 | 43,009,541 | ||||||
|
Loss per share - fully diluted
|
$ | (0.01 | ) | $ | (0.01 | ) | ||
On August 2, 2010, the Company granted Craig Holland, its President, Chief Executive Officer, and a Director, options to purchase up to 115,000 shares of Company common stock at an exercise price of $0.11 per share. The options were granted under the Freeze Tag, Inc. 2006 Stock Plan. As of December 31, 2012, the stock options are fully expensed and included in stock based compensation of $16,003.
As of July 1, 2010, there is a note payable to Craig Holland and Mick Donahoo for $25,000 each (a total of $50,000 notes payable) for money that was loaned to the Company to secure the Sunwest Bank debt. The money was loaned to the Company at a rate of 10% interest compounded annually and matures on June 20, 2013. As of December 31, 2012 and 2011, accrued interest was $13,024 and $7,954, respectively.
As of October 19, 2011, there is a note payable to Mick Donahoo for $5,000 for money that was loaned to the Company to secure equipment. The money was loaned to the Company at a rate of 10% interest compounded annually and matures on October 19, 2013. As of December 31, 2012 and 2011, accrued interest was $600 and $82, respectively.
As of April 11, 2012, there is a note payable to Mick Donahoo for $15,000 for money that was loaned to the Company. The money was loaned to the Company at a rate of 10% interest compounded annually and matures
on July 11, 2013. As of December 31, 2012 and 2011, accrued interest was $1,205 and $0, respectively.
As of April 25, 2012, there is a note payable to Craig Holland and Mick Donahoo for $10,000 each (a total of $20,000 notes payable) for money that was loaned to the Company. The money was loaned to the Company at a rate of 10% interest compounded annually and matures on July 25, 2013. As of December 31, 2012 and 2011, accrued interest was $1,398 and $0, respectively.
F-26
FREEZE TAG, INC.
(A DELAWARE CORPORATION)
NOTES TO THE FINANCIAL STATEMENTS
As of June 21, 2012, there is a note payable to the Holland Family Trust for $40,000 for money that was loaned to the Company. The money was loaned to the company at a rate of 10% interest compounded annually and matures on July 24, 2013. As of December 31, 2012 and 2011, accrued interest was $2,115 and $0, respectively.
As of August 13, 2012, there is a note payable to the Holland Family Trust for $70,000 for money that was loaned to the Company. The money was loaned to the Company at a rate of 10% interest compounded annually and matures on August 13, 2013. As of December 31, 2012 and 2011, accrued interest was $2,685 and $0, respectively.
As of September 12, 2012, there is a note payable to the Holland Family Trust for $65,000 for money that was loaned to the Company. The money was loaned to the Company at a rate of 10% interest compounded annually and matures on September 12, 2013. As of December 31, 2012 and 2011, accrued interest was $1,959 and $0, respectively.
As of October 11, 2012, there is a note payable to the Holland Family Trust for $50,000 for money that was loaned to the Company. The money was loaned to the Company at a rate of 10% interest compounded annually and matures on April 11, 2013. As of December 31, 2012 and 2011, accrued interest was $1,107 and $0, respectively.
On November 1, 2012, there was a note payable issued to the Holland Family Trust for $130,000. The money was loaned to the Company to pay off the debt associated with the two remaining Asher Enterprises, Inc. convertible promissory notes, and was loaned to the Company at a rate of 10% interest compounded annually and matures on May 1, 2013. As of December 31, 2012 and 2011, accrued interest was $2,137 and $0, respectively.
As of November 13, 2012, there is a note payable to the Holland Family Trust for $75,000 for money that was loaned to the Company. The money was loaned to the Company at a rate of 10% interest compounded annually and matures on May 13, 2013. As of December 31, 2012 and 2011, accrued interest was $986 and $0, respectively.
As of December 10, 2012, there is a note payable to the Holland Family Trust for $75,000 for money that was loaned to the Company. The money was loaned to the Company at a rate of 10% interest compounded annually and matures on June 10, 2013. As of December 31, 2012 and 2011, accrued interest was $432 and $0, respectively.
On July 2, 2010, a convertible note loan from Holland Family Trust, (whose sole trustee is Franklena Holland, mother of Company president Craig Holland), was secured for $100,000. The Company has received $75,000 of the purchase price, with the remaining $25,000 to be paid at a later date. The promissory note is convertible into the Company’s common stock at a rate of $0.10 per share. The convertible promissory note bears interest at the rate of 10% per annum and matures 12 months from the date each purchase installment was received. Interest on the notes is paid each month at the first of the month as such there was no accrued interest as of December 31, 2011. On November 6, 2012, the Company modified the note, such that its conversion rate was $0.0038 instead of $0.1000; which resulted in an increase to additional paid in capital and interest expense of 34,577. Also on November 6, 2012, the Company converted $75,000 in principal and $5,103 in accrued interest into 10,680,356 common shares in accordance with the modified convertible note.
F-27
FREEZE TAG, INC.
(A DELAWARE CORPORATION)
NOTES TO THE FINANCIAL STATEMENTS
The Company evaluated this related party convertible note for derivative liability treatment noting that if the shares were converted at a fixed price of $0.10 per share, and the principal value of $75,000, this would result in 750,000 additional shares which is less than 1% of the authorized share count; therefore, the number of shares is determinate and in conclusion, the note is not considered a derivative liability. In addition, the Company evaluated this related party convertible note for a beneficial conversion feature noting that the conversion price of $0.10 which was exactly the same as the market price of $0.10 during the 2009-2010 fiscal years when the common shares were being sold to private
purchasers consistently at this price; therefore, no beneficial conversion feature was created during issuance of this note.
On January 26, 2012, a convertible note loan from Holland Family Trust, (whose sole trustee is Franklena Holland, mother of Company president Craig Holland), was secured for $100,000. The promissory note is convertible into the Company’s common stock at a rate of $0.05 per share. The convertible promissory note bears interest at the rate of 10% per annum and matures 12 months from the date each purchase installment was received. On April 19, 2012, Franklena E. Holland passed away. The terms of the Holland Family Trust indicate that Craig B. Holland becomes the Successor Trustee after Franklena's passing. As of April 19, 2012, Mr. Holland is now acting as the Trustee of the Holland Family Trust. As of
December 31, 2012 and 2011, accrued interest was $8,333 and $0, respectively.
The Company evaluated this related party convertible note for derivative liability treatment noting that if the shares were converted at a fixed price of $0.05 per share, and the principal value of $100,000, this would result in 2,000,000 additional shares which is approximately 2% of the authorized share count; therefore, the number of shares is determinate and in conclusion, the note is not considered a derivative liability. In addition, the Company evaluated this related party convertible note for a beneficial conversion feature noting that the conversion price of $0.05 which was exactly the same as the market price of $0.05 on the date of issuance; therefore, no beneficial conversion feature was created
during issuance of this note.
The Company adopted FASB ASC 820 on October 1, 2008. Under this FASB, fair value is defined as the price that would be received to sell an asset or paid to transfer a liability in an orderly transaction between market participants at the measurement date (an exit price). The standard outlines a valuation framework and creates a fair value hierarchy in order to increase the consistency and comparability of fair value measurements and the related disclosures. Under GAAP, certain assets and liabilities must be measured at fair value, and FASB ASC 820-10-50 details the disclosures that are required for items measured at fair value.
The Company has various financial instruments that must be measured under the new fair value standard including: cash and debt. The Company currently does not have non-financial assets or non-financial liabilities that are required to be measured at fair value on a recurring basis. The Company’s financial assets and liabilities are measured using inputs from the three levels of the fair value hierarchy. The three levels are as follows:
Level 1 - Inputs are unadjusted quoted prices in active markets for identical assets or liabilities that the Company has the ability to access at the measurement date. The fair value of the Company’s cash is based on quoted prices and therefore classified as Level 1.
F-28
FREEZE TAG, INC.
(A DELAWARE CORPORATION)
NOTES TO THE FINANCIAL STATEMENTS
Level 2 - Inputs include quoted prices for similar assets and liabilities in active markets, quoted prices for identical or similar assets or liabilities in markets that are not active, inputs other than quoted prices that are observable for the asset or liability (e.g., interest rates, yield curves, etc.), and inputs that are derived principally from or corroborated by observable market data by correlation or other means (market corroborated inputs).
Level 3 - Unobservable inputs that reflect our assumptions about the assumptions that market participants would use in pricing the asset or liability.
Cash, accounts receivable, capitalized production costs, prepaid royalties, prepaid expenses, accounts payable, accrued compensation, accrued royalties, accrued interest, accrued expenses, unearned royalties, notes payable – related party and technology payables reported on the balance sheet are estimated by management to approximate fair market value due to their short term nature.
The following tables provide a summary of the fair values of assets and liabilities measured on a non-recurring basis:
|
Fair Value Measurements at
|
||||||||||||||||
|
December 31
, 2012
|
||||||||||||||||
|
Carrying Value
|
||||||||||||||||
|
December 31
, 2012
|
Level 1
|
Level 2
|
Level 3
|
|||||||||||||
|
Liabilities:
|
||||||||||||||||
|
Convertible notes payable, in default
|
$ | 50,000 | $ | - | $ | - | $ | 50,000 | ||||||||
|
Convertible notes payable *
|
$ | 100,000 | $ | - | $ | - | $ | 100,000 | ||||||||
|
Fair Value Measurements at
|
||||||||||||||||
|
December 31, 2011
|
||||||||||||||||
|
Carrying Value
|
||||||||||||||||
|
December 31, 2011
|
Level 1
|
Level 2
|
Level 3
|
|||||||||||||
|
Liabilities:
|
||||||||||||||||
|
Convertible notes payable
|
$ | 62,625 | $ | - | $ | - | $ | 62,625 | ||||||||
|
Convertible notes payable *
|
$ | 75,000 | $ | - | $ | - | $ | 75,000 | ||||||||
* - Related Party
The Company believes that the market rate of interest as of December 31, 2012 and December 31, 2011 was not materially different to the rate of interest at which the convertible notes payable were issued. Accordingly, the Company believes that the fair value of the convertible notes payable approximated their carrying value at December 31, 2012 and December 31, 2011.
F-29
FREEZE TAG, INC.
(A DELAWARE CORPORATION)
NOTES TO THE FINANCIAL STATEMENTS
On January 10, 2013, there was a note payable issued to the Holland Family Trust for $25,000 for money that was loaned to the Company. The money was loaned to the Company at a rate of 10% interest compounded annually and matures on July 10, 2013.
On January 29, 2013, there was a note payable issued to the Holland Family Trust for $17,000 for money that was loaned to the Company. The money was loaned to the Company at a rate of 10% interest compounded annually and matures on July 29, 2013.
On January 29, 2013, the Company entered into a 12% Convertible Promissory Note in the principal amount of $50,000 with Magna (the “Magna Note”). The Magna Note matures on January 29, 2014 and bears interest at a rate of 12% per annum. Magna is entitled, at its option and at any time, to convert all or any portion of the outstanding principal amount and accrued interest into the Company’s common stock, subject to a 4.99% conversion limitation, at a conversion price for each share equal to a price which is a 45% discount from the lowest trading price in the five (5) trading days prior to the day that Magna requests conversion, however, in no event shall the conversion price be lower than
$0.00005 per share.
On January 29, 2013, the Company entered into a Securities Purchase Agreement (the “Agreement”) with Hanover Holdings, LLC (“Hanover”) pursuant to which the Company sold a Convertible Promissory Note in the principal amount of $21,500 (the “Hanover Note”). The Hanover Note matures on September 29, 2013 and bears interest at a rate of 12% per annum. Hanover is entitled, at its option and at any time, to convert all or any portion of the outstanding principal amount and accrued interest into our common stock, subject to a 4.99% conversion limitation, at a conversion price for each share equal to a price which is a 45% discount from the lowest trading price for the
Company’s common stock during the five (5) trading days prior to the day that Hanover requests conversion, however, in no event will the conversion price be less than $0.00005 per share.
On February 4, 2013, a convertible note (in default) from Robert Cowdell was converted into a convertible promissory note with principal of $55,429 ($50,000 in cash and $5,429 in converted interest from the previous convertible note). The promissory note is convertible into the Company’s common stock at a rate of the closing market price on February 4, 2013 ($0.03 per share). The convertible promissory note bears interest at the rate of 12% per annum and matures on August 4, 2013.
F-30
There are no items required to be reported under this Item.
40
(a) Evaluation of Disclosure Controls and Procedures
We carried out an evaluation, under the supervision and with the participation of our management, including our Chief Executive Officer and Chief Financial Officer, of the effectiveness of our disclosure controls and procedures (as defined) in Exchange Act Rules 13a – 15(c) and 15d – 15(e)). Based upon that evaluation, our Chief Executive Officer and Chief Financial Officer, who are our principal executive officer and principal financial officers, respectively, concluded that, as of the end of the period ended December 31, 2012, our disclosure controls and procedures were not effective (
1) to ensure that information required to be disclosed by us in reports that we file
or submit under the Exchange Act is recorded, processed, summarized and reported, within the time periods specified in the SEC’s rules and forms and (2) to ensure that information required to be disclosed by us in the reports that we file or submit under the Exchange Act is accumulated and communicated to us, including our chief executive and chief financial officers, as appropriate to allow timely decisions regarding required disclosure.
Our Chief Executive Officer and Chief Financial Officer do not expect that our disclosure controls or internal controls will prevent all error and all fraud. No matter how well conceived and operated, our disclosure controls and procedures can provide only a reasonable level of assurance regarding the reliability of financial reporting and the preparation of financial statements for external purposes in accordance with generally accepted accounting principles. Further, the design of a control system must reflect the fact that there are resource constraints, and the benefits of controls must be considered relative to their costs. Because of the inherent limitations in all control systems, no evaluation of controls
can provide absolute assurance that all control issues and instances of fraud, if any, within the Company have been detected. These inherent limitations include the realities that judgments in decision-making can be faulty, and that breakdowns can occur because of a simple error or mistake. Additionally, controls can be circumvented if there exists in an individual a desire to do so. There can be no assurance that any design will succeed in achieving its stated goals under all potential future conditions.
Furthermore, smaller reporting companies face additional limitations. Smaller reporting companies employ fewer individuals and find it difficult to properly segregate duties. Often, one or two individuals control every aspect of the company's operation and are in a position to override any system of internal control. Additionally, smaller reporting companies tend to utilize general accounting software packages that lack a rigorous set of software controls.
(b)
Management’s Annual Report on Internal Control Over Financial Reporting
Our management is responsible for establishing and maintaining adequate internal control over financial reporting. Internal control over financial reporting is defined in Rules 13a-15(f) and 15d-15(f) promulgated under the Exchange Act, as amended, as a process designed by, or under the supervision of, our Chief Executive Officer and Chief Financial Officer, and effected by our board of directors, management and other personnel, to provide reasonable assurance regarding the reliability of financial reporting and the preparation of financial statements for external purposes in accordance with generally accepted accounting principles in the United States and includes those policies and procedures that:
|
•
|
Pertain to the maintenance of records that in reasonable detail accurately and fairly reflect our transactions and any disposition of our assets;
|
|
|
•
|
Provide reasonable assurance that transactions are recorded as necessary to permit preparation of financial statements in accordance with generally accepted accounting principles, and that our receipts and expenditures are being made only in accordance with authorizations of our management and directors; and
|
|
•
|
Provide reasonable assurance regarding prevention or timely detection of unauthorized acquisition, use or disposition of our assets that could have a material effect on the financial statements.
|
41
A material weakness is a deficiency, or a combination of deficiencies, in internal control over financial reporting, such that there is a reasonable possibility that a material misstatement of our annual or interim financial statements will not be prevented or detected on a timely basis. Our management assessed the effectiveness of our internal control over financial reporting as of December 31, 2012. In making this assessment, our management used the criteria set forth by the Committee of Sponsoring Organizations of the Treadway Commission (COSO) in Internal Control-Integrated Framework. Based on this assessment, Management has identified the following four material weaknesses that have caused management to
conclude that, as of December 31, 2012, our disclosure controls and procedures, and our internal control over financial reporting, were not effective at the reasonable assurance level:
1. We do not have sufficient segregation of duties within accounting functions, which is a basic internal control. Due to our size and nature, segregation of all conflicting duties may not always be possible and may not be economically feasible. However, to the extent possible, the initiation of transactions, the custody of assets and the recording of transactions should be performed by separate individuals. Management evaluated the impact of our failure to have segregation of duties on our assessment of our disclosure controls and procedures and has concluded that the control deficiency that resulted represented a material weakness.
2. We have not documented our internal controls. We have limited policies and procedures that cover the recording and reporting of financial transactions and accounting provisions. As a result we may be delayed in our ability to calculate certain accounting provisions. While we believe these provisions are accounted for correctly in the attached audited financial statements our lack of internal controls could lead to a delay in our reporting obligations. We were required to provide written documentation of key internal controls over financial reporting beginning with our fiscal year ending December 31, 2009. Management evaluated the impact of our failure to have written documentation of our internal controls and
procedures on our assessment of our disclosure controls and procedures and has concluded that the control deficiency that resulted represented a material weakness.
3. E
ffective controls over the control environment were not maintained. Specifically, a formally adopted written code of business conduct and ethics that governs our employees, officers, and directors was not in place. Additionally, management has not developed and effectively communicated to our employees its accounting policies and procedures. This has resulted in inconsistent practices. Further, our Board of Directors does not currently have any independent members and no director qualifies as an audit committee financial expert as defined in Item 407(d)(5)(ii) of Regulation S-K. Since these entity level programs have a pervasive effect across the organization, management has
determined that these circumstances constitute a material weakness.
4. Effective controls over transactions were not maintained. Specifically, controls were not designed and in place to ensure that contingencies were properly reflected. Accordingly, management has determined that this control deficiency constitutes a material weakness.
To address these material weaknesses, management performed additional analyses and other procedures to ensure that the financial statements included herein fairly present, in all material respects, our financial position, results of operations and cash flows for the periods presented. Accordingly, we believe that the consolidated financial statements included in this report fairly present, in all material respects, our financial condition, results of operations and cash flows for the periods presented.
42
(c) Remediation of Material Weaknesses
To remediate the material weakness in our documentation, evaluation and testing of internal controls we hope to engage a third-party firm to assist us in remedying this material weakness.
(d) Changes in Internal Control over Financial Reporting
There are no changes to report during our fiscal quarter ended December 31, 2012
.
There are no events required to be disclosed by the Item.
43
Directors and Executive Officers
The following table sets forth the names, ages, and biographical information of each of our current directors and executive officers, and the positions with the Company held by each person, and the date such person became a director or executive officer of the Company. Our executive officers are elected annually by the Board of Directors. The directors serve one-year terms until their successors are elected. The executive officers serve terms of one year or until their death, resignation or removal by the Board of Directors. Family relationships among any of the directors and officers are described below.
|
Name
|
Age
|
Position
|
||
|
Craig Holland
|
52
|
President, Chief Executive Officer, Chief Creative Officer, and Director
|
||
|
Mick Donahoo
|
43
|
Chief Operating Officer, Secretary, Chief Financial Officer, Treasurer, and Director
|
Craig Holland
co-founded Freeze Tag in October 2005. Prior to founding Freeze Tag, Craig founded Thumbworks, a publisher of mobile gaming applications, in January 2002 and served as the CEO of Thumbworks from its formation until its acquisition by In-Fusio, a mobile game publisher and mobile entertainment platform provider in January 2005. As CEO of Thumbworks, Mr. Holland drove the organization's strategic direction, overseeing carrier relations, business development and licensing initiatives which led to partnerships with some of the world's leading brands such as Etch A Sketch
®
, Nickelodeon, Suzuki, Paramount
Pictures, and Honda. Prior to founding Thumbworks, Mr. Holland founded Nine Dots, an interactive marketing firm in North America whose clients included a number of high profile consumer brands such as Nestle, Quaker Oats, Qualcomm and General Motors, in 1992. Mr. Holland served as the CEO of Nine Dots from its formation until its sale to CyberSight, a Canadian-based interactive marketing company, in September 2000. Mr. Holland holds an MBA with an emphasis in Marketing from the University of Southern California (USC) and a Bachelor of Arts in English Literature from the University of California at Los Angeles (UCLA).
44
Mick Donahoo
co-founded Freeze Tag in October 2005 and in his role as COO, Mr. Donahoo oversees product planning, design, and software development of all games and technology. With over 15 years of technology experience, Mr. Donahoo has produced over 25 mobile games distributed via 20 worldwide wireless carriers. Prior to founding Freeze Tag, Mr. Donahoo led North American development for Thumbworks and following its acquisition, In-Fusio, and oversaw overseas engineering teams located in Taiwan, Thailand, India, Russia, and Korea. Prior to In-Fusio, Mick was a consulting executive at Ernst & Young, LLP in the Financial Services and Aerospace and Defense
industries architecting and developing large-scale, three-tiered client/server applications. Mick holds a Bachelor of Science degree in Business and Management Information Systems from Brigham Young University.
Family Relationships
There are no family relationships among any of our officers, directors, or shareholders.
Historical Compensation of Directors
Other than as set forth herein no compensation has been given to any of the directors, although they may be reimbursed for any pre-approved out-of-pocket expenses.
Compliance with Section 16(a) of the Securities Exchange Act of 1934
Section 16(a) of the Securities Exchange Act of 1934 requires the Company’s directors and executive officers and persons who own more than ten percent of a registered class of the Company’s equity securities to file with the SEC initial reports of ownership and reports of changes in ownership of common stock and other equity securities of the Company. Officers, directors and greater than ten percent shareholders are required by SEC regulations to furnish the Company with copies of all Section 16(a) forms they file.
During the most recent fiscal year, to the Company’s knowledge, the following delinquencies occurred:
|
Name
|
No. of Late
Reports
|
No. of Transactions
Reported Late
|
No. of
Failures to File
|
|
Craig Holland
|
0
|
0
|
0
|
|
Mick Donahoo
|
0
|
0
|
0
|
Board Meetings and Committees
During the 2012 fiscal year to date, the Board of Directors met on a regular basis and took written action on numerous other occasions. All the members of the Board attended the meetings. The written actions were by unanimous consent.
45
Code of Ethics
We have not adopted a written code of ethics, because we believe and understand that our officers and directors adhere to and follow ethical standards without the necessity of a written policy.
Audit Committee
We do not currently have an audit committee.
Compensation Committee
We do not currently have a compensation committee.
Executive Officers and Directors
We do not currently have written employment agreements with our executives, Craig Holland and Mick Donahoo. Both are at-will employees whose compensation is set forth in the Summary Compensation Table below.
The following table sets forth information with respect to compensation earned by our Chief Executive Officer and Chief Financial Officer for the fiscal years ended December 31, 2012, 2011 and 2010.
|
Name and
Principal Position
|
Year
|
Salary
($)
|
Bonus
($)
|
Stock
Awards
($)
|
Option Awards
($)
|
Non-Equity Incentive Plan Compensation ($)
|
Nonqualified Deferred Compensation ($)
|
All Other
Compensation
($)
|
Total
($)
|
|||||||||||||||||||||||||
|
Craig Holland
|
2012
|
159,600 | - | - | - | - | - | - | 159,600 | |||||||||||||||||||||||||
|
President, CEO
|
2011
|
159,600 | - | - | - | - | - | - | 159,600 | |||||||||||||||||||||||||
|
2010
|
154,119 | - | - | 11,494 | (1) | - | - | 1,287 | 159,237 | (1) | ||||||||||||||||||||||||
|
Mick Donahoo
|
2012
|
159,600 | - | - | - | - | - | - | 159,600 | |||||||||||||||||||||||||
|
COO, VP
|
2011
|
159,600 | - | - | - | - | - | - | 159,600 | |||||||||||||||||||||||||
|
2010
|
154,119 | - | - | - | - | - | 1,287 | 155,406 | ||||||||||||||||||||||||||
______________
(1) On August 2, 2010, Mr. Holland was issued options to purchase 115,000 shares of our common stock with an exercise price of $0.11 per share, valued at $11,494 of which the Company has recognized a total stock based compensation expense of $9,579 as of December 31, 2010. The remaining stock based compensation expense of $1,916 was recognized during the first quarter of the year ended December 31, 2011.
46
Director Compensation
The following table sets forth director compensation as of for the fiscal year ended December 31, 2012:
|
Name
|
Fees Earned or Paid in Cash
($)
|
Stock Awards
($)
|
Option Awards
($)
|
Non-Equity Incentive Plan Compensation
($)
|
Nonqualified Deferred Compensation Earnings
($)
|
All Other Compensation
($)
|
Total
($)
|
|||||||||||||||||||||
|
Craig Holland
|
- | - | - | - | - | - | - | |||||||||||||||||||||
|
Mick Donahoo
|
- | - | - | - | - | - | - | |||||||||||||||||||||
Outstanding Equity Awards at Fiscal Year-End
On March 20, 2006, our Board of Directors and shareholders approved the Freeze Tag, Inc. 2006 Stock Plan. Pursuant to the Plan, we reserved 2,920,500 shares (post-split) of our common stock to be issued to employees and consultants for services rendered to the company. As of December 31, 2008, we had issued options to acquire a total of 1,247,850 shares (post-split) of our common stock to seven of our employees and/or consultants. Effective as of October 15, 2009, all seven of the option holders converted their options into a total of 1,123,065 shares of our common stock.
The following table sets forth certain information concerning outstanding stock awards held by the Named Executive Officers as of December 31, 2011:
|
Option Awards
|
Stock Awards
|
||||||||||||||||||||||||||||||||
|
Name
|
Number of Securities Underlying Unexercised Options
(#)
Exercisable
|
Number of Securities Underlying Unexercised Options
(#)
Unexercisable
|
Equity Incentive Plan Awards: Number of Securities Underlying Unexercised Unearned Options
(#)
|
Option Exercise Price
($)
|
Option Expiration Date
|
Number of Shares or Units of Stock That Have Not Vested
(#)
|
Market Value of Shares or Units of Stock That Have Not Vested
($)
|
Equity Incentive Plan Awards: Number of Unearned Shares, Units or Other Rights That Have Not Vested
(#)
|
Equity Incentive Plan Awards: Market or Payout Value of Unearned Shares, Units or Other Rights That Have Not Vested
($)
|
||||||||||||||||||||||||
|
Craig Holland
|
- | 115,000 | - | 0.11 |
8/02/20
|
- | - | - | - | ||||||||||||||||||||||||
|
Mick Donahoo
|
- | - | - | - |
-
|
- | - | - | - | ||||||||||||||||||||||||
47
The following table sets forth, as of March 29, 2013, certain information with respect to the Company’s equity securities owned of record or beneficially by (i) each Officer and Director of the Company; (ii) each person who owns beneficially more than 5% of each class of the Company’s outstanding equity securities; and (iii) all Directors and Executive Officers as a group.
Common Stock
|
Title of Class
|
Name and Address
of Beneficial Owner (3)
|
Amount and Nature of
Beneficial Ownership
|
Percent
of Class (1)
|
|||||||
|
Common Stock
|
Craig Holland (2)
|
13,987,375 | (4) | 17.9 | % (4) | |||||
|
Common Stock
|
Mick Donahoo (2)
|
11,828,025 | 15.2 | % | ||||||
|
Common Stock
|
Holland Family Trust (5)
|
10,680,356 | (5) | 13.7 | % (5) | |||||
|
Common Stock
|
All Directors and Officers
As a Group (2 persons)
|
36,495,756 | (4) | 46.8 | % (4)(5) | |||||
|
|
(1)
|
Unless otherwise indicated, based on 77,724,404 shares of common stock issued and outstanding. Shares of common stock subject to options or warrants currently exercisable, or exercisable within 60 days, are deemed outstanding for purposes of computing the percentage of the person holding such options or warrants, but are not deemed outstanding for the purposes of computing the percentage of any other person.
|
|
|
(2)
|
Indicates one of our officers or directors.
|
|
|
(3)
|
Unless indicated otherwise, the address of the shareholder is Freeze Tag, Inc., 228 W. Main Street, 2nd Floor, Tustin, California 92780.
|
|
|
(4)
|
Includes options to purchase 115,000 shares of common stock that are exercisable on February 2, 2011.
|
|
|
(5)
|
The trustee for the Holland Family Trust is Craig Holland.
|
We are not aware of any person who owns of record, or is known to own beneficially, five percent or more of the outstanding securities of any class of the issuer, other than as set forth above. We are not aware of any person who controls the issuer as specified in Section 2(a)(1) of the 1940 Act. There are no classes of stock other than common stock issued or outstanding. We do not have an investment advisor.
There are no current arrangements which will result in a change in control.
As of July 1, 2010, there is a note payable to Craig Holland and Mick Donahoo for $25,000 each (a total of $50,000 notes payable) for money that was loaned to the Company to secure the Sunwest Bank debt. The money was loaned to the Company at a rate of 10% interest compounded annually and matures on June 20, 2013. As of December 31, 2012 and 2011, accrued interest was $13,024 and $7,954, respectively.
48
As of October 19, 2011, there is a note payable to Mick Donahoo for $5,000 for money that was loaned to the Company to secure equipment. The money was loaned to the Company at a rate of 10% interest compounded annually and matures on October 19, 2013. As of December 31, 2012 and 2011, accrued interest was $600 and $82, respectively.
As of April 11, 2012, there is a note payable to Mick Donahoo for $15,000 for money that was loaned to the Company. The money was loaned to the Company at a rate of 10% interest compounded annually and matures on July 11, 2013. As of December 31, 2012 and 2011, accrued interest was $1,205 and $0, respectively.
As of April 25, 2012, there is a note payable to Craig Holland and Mick Donahoo for $10,000 each (a total of $20,000 notes payable) for money that was loaned to the Company. The money was loaned to the Company at a rate of 10% interest compounded annually and matures on July 25, 2013. As of December 31, 2012 and 2011, accrued interest was $1,398 and $0, respectively.
On January 26, 2012, a convertible note loan from Holland Family Trust, (whose sole trustee is Franklena Holland, mother of Company president Craig Holland), was secured for $100,000. The promissory note is convertible into the Company’s common stock at a rate of $0.05 per share. The convertible promissory note bears interest at the rate of 10% per annum and matures 12 months from the date each purchase installment was received. On April 19, 2012, Franklena E. Holland passed away. The terms of the Holland Family Trust indicate that Craig B. Holland becomes the Successor Trustee after Franklena's passing. As of April 19, 2012, Mr. Holland is now acting as the Trustee of the Holland Family Trust. As of
December 31, 2012 and 2011, accrued interest was $8,333 and $0, respectively.
As of June 21, 2012, there is a note payable to the Holland Family Trust for $40,000 for money that was loaned to the Company. The money was loaned to the company at a rate of 10% interest compounded annually and matures on July 24, 2013. As of December 31, 2012 and 2011, accrued interest was $2,115 and $0, respectively.
As of August 13, 2012, there is a note payable to the Holland Family Trust for $70,000 for money that was loaned to the Company. The money was loaned to the Company at a rate of 10% interest compounded annually and matures on August 13, 2013. As of December 31, 2012 and 2011, accrued interest was $2,685 and $0, respectively.
As of September 12, 2012, there is a note payable to the Holland Family Trust for $65,000 for money that was loaned to the Company. The money was loaned to the Company at a rate of 10% interest compounded annually and matures on September 12, 2013. As of December 31, 2012 and 2011, accrued interest was $1,959 and $0, respectively.
As of October 11, 2012, there is a note payable to the Holland Family Trust for $50,000 for money that was loaned to the Company. The money was loaned to the Company at a rate of 10% interest compounded annually and matures on April 11, 2013. As of December 31, 2012 and 2011, accrued interest was $1,107 and $0, respectively.
On November 1, 2012, there was a note payable issued to the Holland Family Trust for $130,000. The money was loaned to the Company to pay off the debt associated with the two remaining Asher Enterprises, Inc. convertible promissory notes, and was loaned to the Company at a rate of 10% interest compounded annually and matures on May 1, 2013. As of December 31, 2012 and 2011, accrued interest was $2,137 and $0, respectively.
49
As of November 13, 2012, there is a note payable to the Holland Family Trust for $75,000 for money that was loaned to the Company. The money was loaned to the Company at a rate of 10% interest compounded annually and matures on May 13, 2013. As of December 31, 2012 and 2011, accrued interest was $986 and $0, respectively.
As of December 10, 2012, there is a note payable to the Holland Family Trust for $75,000 for money that was loaned to the Company. The money was loaned to the Company at a rate of 10% interest compounded annually and matures on June 10, 2013. As of December 31, 2012 and 2011, accrued interest was $432 and $0, respectively.
Audit and Related Fees
During the year ended December 31, 2012, M&K CPAS, PLLC charged us $29,950, in fees for professional services for the audit of our financial statements included in our annual report and for reviews of our quarterly reports. During the year ended December 31, 2011, M&K CPAS, PLLC charged us $24,650, in fees for professional services for the audit of our financial statements included in our annual report and for reviews of our quarterly reports.
Tax Fees
During the year ended December 31, 2012, M&K CPAS, PLLC charged $0 for professional services for tax preparation. This was the same as for the year ended December 31, 2011.
All Other Fees
During the year ended December 31, 2012, M&K CPAS, PLLC charged $0 for any other fees. This was the same for the year ended December 31, 2012.
Of the fees described above for the year ended December 31, 2012, 100% were approved by the entire Board of Directors.
50
(a)(1) Financial Statements
The following financial statements are filed as part of this report:
|
Report of Independent Registered Public Accounting Firm
|
F-1 | |||
|
Consolidated Balance Sheets as of December 31, 2012 and 2011
|
F-2 | |||
|
Consolidated Statements of Operations for the years
ended December 31, 2012 and 2011
|
F-3 | |||
|
Consolidated Statement of Shareholders’
Equity (Deficit) for the years ended December 31, 2012 and 2011
|
F-4 | |||
|
Consolidated Statements of Cash Flows for the years ended December 31, 2012 and 2011
|
F-5 | |||
|
Notes to Consolidated Financial Statements
|
F-6 |
(a)(2) Financial Statement Schedules
We do not have any financial statement schedules required to be supplied under this Item.
(a)(3) Exhibits
Refer to (b) below.
51
(b) Exhibits
|
3.1 (1)
|
Articles of Incorporation of Freeze Tag, Inc.
|
|
|
3.2 (1)
|
Articles of Amendment to Articles of Incorporation
|
|
|
3.3 (1)
|
Bylaws of Freeze Tag, Inc.
|
|
|
4.1 (1)
|
Freeze Tag, Inc. 2006 Stock Plan
|
|
|
10.1 (1)
|
10% Convertible Promissory Note dated July 1, 2010 with The Holland Family Trust
|
|
|
10.2 (1)
|
Support Services Agreement with Cardiff Partners, LLC dated October 12, 2009
|
|
|
10.3 (1)
|
Amendment No. 1 to Support Services Agreement with Cardiff Partners, LLC dated March 2, 2010
|
|
|
10.4 (1)
|
Amendment No. 2 to Support Services Agreement with Cardiff Partners, LLC dated March 3, 2010
|
|
|
10.5 (1)
|
Form of Conversion Agreement for October 2009 Conversions
|
|
|
10.6 (1)
|
Form of Option Conversion Agreement for October 2009 Conversions
|
|
|
10.7 (1)
|
Placement Agent and Advisory Services Agreement with Monarch Bay Associates, LLC dated October 12, 2009
|
|
|
10.8 (1)
|
Corporate Communications Consulting Agreement Michael Southworth dated September 25, 2009
|
|
|
10.9 (1)
|
Lock-Up Agreement dated November 10, 2009
|
|
|
10.10 (2)
|
Loan Agreement with Sunwest Bank dated October 20, 2006, as amended
|
|
|
10.11 (3)
|
Securities Purchase Agreement with Asher Enterprises, Inc. dated July 21, 2011
|
|
|
10.12 (3)
|
Convertible Promissory Note with Asher Enterprises, Inc. dated July 21, 2011
|
52
|
10.13 (4)
|
Technology Transfer Agreement dated June 22, 2011
|
|
|
10.14 (5)
|
Securities Purchase Agreement with Asher Enterprises, Inc. dated September 16, 2011
|
|
|
10.15 (5)
|
Convertible Promissory Note with Asher Enterprises, Inc. dated September 16, 2011
|
|
|
10.16 (6)
|
Securities Purchase Agreement with Asher Enterprises, Inc. dated December 6, 2011
|
|
|
10.16 (6)
|
Convertible Promissory Note with Asher Enterprises, Inc. dated December 6, 2011
|
|
|
10.17 (7)
|
Letter Agreement with Crucible Capital, Inc. dated February 29, 2012
|
|
|
10.18(8)
|
Amendment No. 1 to Securities Purchase Agreement with Asher Enterprises, Inc. dated July 21, 2011
|
|
|
10.19(8)
|
Amendment No. 1 to Securities Purchase Agreement with Asher Enterprises, Inc. dated September 16, 2011
|
|
|
10.20(8)
|
Amendment No. 1 to Securities Purchase Agreement with Asher Enterprises, Inc. dated December 6, 2011
|
|
|
10.21(8)
|
Amendment No. 1 to Promissory Note with The Lebrecht Group, APLC dated November 17, 2011
|
|
|
31.1*
|
Rule 13a-14(a)/15d-14(a) Certification of Chief Executive Officer
|
|
|
31.2*
|
Rule 13a-14(a)/15d-14(a) Certification of Chief Financial Officer
|
|
|
32.1*
|
Section 1350 Certification of Chief Executive Officer
|
|
|
32.2*
|
Section 1350 Certification of Chief Financial Officer.
|
|
| 101.INS** | XBRL Instance Document | |
| 101.SCH** | XBRL Taxonomy Extension Schema Document | |
| 101.CAL** | XBRL Taxonomy Extension Calculation Linkbase Document | |
| 101.DEF** | XBRL Taxonomy Extension Definition Linkbase Document | |
| 101.LAB** | XBRL Taxonomy Extension Label Linkbase Document | |
| 101.PRE** | XBRL Taxonomy Extension Presentation Linkbase Document |
|
*
|
Filed herewith
.
|
53
|
**
|
Pursuant to Rule 406T of Regulation S-T, these interactive data files are deemed not filed or part of a registration statement or prospectus for purposes of Sections 11 or 12 of the Securities Act of 1933 or Section 18 of the Securities Act of 1934 and otherwise are not subject to liability.
|
(1) Incorporated by reference from our Registration Statement on Form S-1, filed with the Commission on August 16, 2010.
(2) Incorporated by reference from Amendment No. 2 to our Registration Statement on Form S-1/A2, filed with the Commission on October 25, 2010.
(3) Incorporated by reference from Current Report on Form 8-K filed with the Commission on August 3, 2011.
(4) Incorporated by reference from Quarterly Report on Form 10-Q for the period ended June 30, 2011 filed with the Commission on August 15, 2011.
(5) Incorporated by reference from Current Report on Form 8-K filed with the Commission on September 21, 2011.
(6) Incorporated by reference from Current Report on Form 8-K filed with the Commission on December 23, 2011.
(7) Incorporated by reference from Current Report on Form 8-K filed with the Commission on March 8, 2012.
(8) Incorporated by reference from Annual Report on Form 10-K filed with the Commission on March 30, 2012.
54
SIGNATURES
In accordance with Section 13 or 15(d) of the Exchange Act, the registrant caused this report to be signed on its behalf by the undersigned, thereunto duly authorized.
|
Freeze Tag, Inc.
|
|||
|
Dated:
April 1, 2013
|
By: |
/s/ Craig Holland
|
|
|
Craig Holland
|
|||
|
|
President and Chief Executive Officer
|
||
|
Dated:
April 1, 2013
|
By: |
/s/ Mick Donahoo
|
|
|
Mick Donahoo
|
|||
|
|
Chief Financial Officer, Chief Accounting Officer, Chief Operating Officer
|
||
In accordance with the Exchange Act, this report has been signed below by the following persons on behalf of the registrant and in the capacities and on the dates indicated.
|
Dated:
April 1, 2013
|
By: |
/s/ Craig Holland
|
|
|
Craig Holland
|
|||
|
|
Director, President and Chief Executive Officer
|
||
|
Dated:
April 1, 2013
|
By: |
/s/ Mick Donahoo
|
|
|
Mick Donahoo
|
|||
|
|
Director, Chief Financial Officer, Chief Accounting Officer, Chief Operating Officer
|
55
TABLE OF CONTENTS
Part IItem 1 BusinessItem 1A. Risk FactorsItem 1B Unresolved Staff CommentsItem 2 PropertiesItem 3 Legal ProceedingsItem 4 Mine Safety DisclosuresPart IIItem 5 - Market For Registrant S Common Equity, Related Stockholder Matters and Issuer Purchases Of Equity SecuritiesItem 6 Selected Financial DataItem 7 - Management S Discussion and Analysis Of Financial Condition and Results Of OperationItem 7A Quantitative and Qualitative Disclosures About Market RiskItem 8 Financial Statements and Supplementary DataNote 1 The CompanyNote 2 Summary Of Significant Accounting PoliciesNote 3 Going ConcernNote 4 Capitalized Production CostsNote 5 Other AssetsNote 6 Fixed AssetsNote 7 Accrued CompensationNote 8 Accrued Royalties and Unearned RoyaltiesNote 9 Commitments and ContingenciesNote 10 DebtNote 11 Stockholders EquityNote 12 Income TaxesNote 13 Earnings (loss) Per Common ShareNote 14 Related Party TransactionsNote 15 Fair Value Of Financial InstrumentsNote 16 Subsequent EventsItem 9 Changes in and Disagreements with Accountants on Accounting and Financial DisclosureItem 9A Controls and ProceduresItem 9B Other InformationPart IIIItem 10 Directors, Executive Officers and Corporate GovernanceItem 11 Executive CompensationItem 12 Security Ownership Of Certain Beneficial Owners and Management and Related Stockholder MattersItem 13 Certain Relationships and Related Transactions, and Director IndependenceItem 14 Principal Accounting Fees and ServicesPart IVItem 15 Exhibits, Financial Statement Schedules