FIRST SOLAR, INC.
10-Ks and 10-Qs
|
|
|
|
|
|
|
|
|
|
|
|
|
|
|
|
|
|
|
|
|
|
|
|
|
|
|
|
|
|
|
|
|
|
|
|
|
|
|
|
|
|
|
|
|
|
|
|
|
|
UNITED
STATES SECURITIES AND EXCHANGE COMMISSION
Washington, D.C.
20549
Form 10-K
|
(Mark
One)
|
|
|
þ
|
ANNUAL
REPORT PURSUANT TO SECTION 13 OR 15(d) OF THE SECURITIES EXCHANGE ACT
OF 1934
|
|
For
the fiscal year ended December 26, 2009
|
|
|
or
|
|
|
o
|
TRANSITION
REPORT PURSUANT TO SECTION 13 OR 15(d) OF THE SECURITIES EXCHANGE ACT
OF 1934
|
|
For
the transition period
from to
|
|
Commission
file number: 001-33156
First
Solar, Inc
.
(Exact
name of registrant as specified in its charter)
|
Delaware
|
20-4623678
|
|
(State
or other jurisdiction of
|
(I.R.S.
Employer
|
|
incorporation
or organization)
|
Identification
No.)
|
350 West
Washington Street, Suite 600
Tempe,
Arizona 85281
(Address
of principal executive offices, including zip code)
(602) 414-9300
(Registrant’s
telephone number, including area code)
Securities
registered pursuant to Section 12(b) of the Act:
|
Title of each class
|
Name of each exchange on which
registered
|
|
Common
stock, $0.001 par value
|
The
NASDAQ Stock Market LLC
|
Securities
registered pursuant to Section 12(g) of the Act:
None
Indicate
by check mark if the registrant is a well-known seasoned issuer, as defined in
Rule 405 of the Securities Act. Yes
þ
No
o
Indicate
by check mark if the registrant is not required to file reports pursuant to
Section 13 or Section 15(d) of the Exchange
Act. Yes
o
No
þ
Indicate
by check mark whether the registrant: (1) has filed all reports required to
be filed by Section 13 or 15(d) of the Securities Exchange Act of 1934
during the preceding 12 months (or for such shorter period that the
registrant was required to file such reports) and (2) has been subject to
such filing requirements for the past 90 days. Yes
þ
No
o
Indicate
by check mark whether the registrant has submitted electronically and posted on
its corporate Web site, if any, every Interactive Data File required to be
submitted and posted pursuant to Rule 405 of Regulation S-T during the preceding
12 months (or for such shorter period that the registrant was required to submit
and post such files). Yes
R
No
£
Indicate
by check mark if disclosure of delinquent filers pursuant to Item 405 of
Regulation S-K is not contained herein and will not be contained, to the
best of registrant’s knowledge, in definitive proxy or information statements
incorporated by reference in Part III of this Form 10-K or any
amendment to this Form 10-K.
£
Indicate
by check mark whether the registrant is a large accelerated filer, an
accelerated filer, a non-accelerated filer, or a smaller reporting company. See
the definitions of “large accelerated filer,” “accelerated filer” and “smaller
reporting company” in Rule 12b-2 of the Exchange Act. (Check one):
| Large accelerated filer þ | Accelerated filer o | Non-accelerated filer o | Smaller reporting company o |
| (Do not check if a smaller reporting company) |
Indicate
by check mark whether the registrant is a shell company (as defined in
Rule 12b-2 of the Exchange Act). Yes
o
No
þ
The
aggregate market value of the registrant’s common stock, $0.001 par value
per share, held by non-affiliates of the registrant on June 27, 2009, the
last business day of the registrant’s most recently completed second fiscal
quarter, was approximately $7,360,781,207 (based on the closing sales price of
the registrant’s common stock on that date). Shares of the registrant’s common
stock held by each officer and director and each person who owns 5% or more of
the outstanding common stock of the registrant are not included in that amount,
because such persons may be deemed to be affiliates of the registrant. This
determination of affiliate status is not necessarily a conclusive determination
for other purposes. As of February 12, 2010, 85,229,228 shares of the
registrant’s common stock, $0.001 par value per share, were issued and
outstanding.
DOCUMENTS
INCORPORATED BY REFERENCE
The
information required by Part III of this Annual Report on Form 10-K,
to the extent not set forth herein, is incorporated by reference from the
registrant’s definitive proxy statement relating to the Annual Meeting of
Shareholders to be held in 2010, which will be filed with the Securities and
Exchange Commission within 120 days after the end of the fiscal year to
which this Annual Report on Form 10-K relates.
FIRST
SOLAR, INC. AND SUBSIDIARIES
FORM 10-K
FOR THE FISCAL YEAR ENDED DECEMBER 26, 2009
TABLE
OF CONTENTS
|
|
|
Page
|
|
PART I
|
||
|
Item
1:
|
Business
|
1
|
|
Executive
Officers of the Registrant
|
11
|
|
|
Item
1A:
|
Risk
Factors
|
13
|
|
Item
1B:
|
Unresolved
Staff Comments
|
28
|
|
Item
2:
|
Properties
|
29
|
|
Item
3:
|
Legal
Proceedings
|
29
|
|
Item
4:
|
Submission
of Matters to a Vote of Security Holders
|
29
|
|
PART II
|
||
|
Item
5:
|
Market
for Registrant’s Common Equity, Related Stockholder Matters and Issuer
Purchases of Equity Securities
|
30
|
|
Item
6:
|
Selected
Consolidated Financial Data
|
34
|
|
Item
7:
|
Management’s
Discussion and Analysis of Financial Condition and Results of
Operations
|
35
|
|
Item
7A:
|
Quantitative
and Qualitative Disclosures about Market Risk
|
54
|
|
Item
8:
|
Financial
Statements and Supplementary Data
|
57
|
|
Item
9:
|
Changes
in and Disagreements with Accountants on Accounting and Financial
Disclosure
|
58
|
|
Item
9A:
|
Controls
and Procedures
|
58
|
|
Item
9B:
|
Other
Information
|
59
|
|
PART III
|
||
|
Item
10:
|
Directors,
Executive Officers and Corporate Governance
|
59
|
|
Item
11:
|
Executive
Compensation
|
59
|
|
Item
12:
|
Security
Ownership of Certain Beneficial Owners and Management and Related
Stockholder Matters
|
59
|
|
Item
13:
|
Certain
Relationships and Related Transactions, and Director
Independence
|
60
|
|
Item
14:
|
Principal
Accountant Fees and Services
|
60
|
|
PART IV
|
||
|
Item
15:
|
Exhibits
and Financial Statement Schedules
|
60
|
|
Signatures
|
61
|
|
|
Consolidated
Financial Statements
|
63
|
|
|
Index
to Exhibits
|
107
|
|
Throughout
this Annual Report on Form 10-K, we refer to First Solar, Inc. and its
consolidated subsidiaries as “First Solar,” the “Company,” “we,” “us,” and
“our.” Our fiscal years end on the last Saturday in December. Our last three
fiscal years ended on December 26, 2009, December 27, 2008 and
December 29, 2007.
NOTE REGARDING
FORWARD-LOOKING STATEMENTS
This
Annual Report on Form 10-K contains forward-looking statements within the
meaning of the Securities Exchange Act of 1934 and the Securities Act of 1933,
which are subject to risks, uncertainties and assumptions that are difficult to
predict. All statements in this Annual Report on Form 10-K, other than
statements of historical fact, are forward-looking statements. These
forward-looking statements are made pursuant to safe harbor provisions of the
Private Securities Litigation Reform Act of 1995. The forward-looking statements
include statements, among other things, concerning our business strategy,
including anticipated trends and developments in and management plans for, our
business and the markets in which we operate; future financial results,
operating results, revenues, gross profit, operating expenses, products,
projected costs and capital expenditures; research and development programs;
sales and marketing initiatives; and competition. In some cases, you can
identify these statements by forward-looking words, such as “estimate,”
“expect,” “anticipate,” “project,” “plan,” “intend,” “believe,” “forecast,”
“foresee,” “likely,” “may,” “should,” “goal,” “target,” “might,” “will,”
“could,” “predict” and “continue,” the negative or plural of these words and
other comparable terminology. Our forward-looking statements are only
predictions based on our current expectations and our projections about future
events. All forward-looking statements included in this Annual Report on
Form 10-K are based upon information available to us as of the filing date
of this Annual Report on Form 10-K. You should not place undue reliance on
these forward-looking statements. We undertake no obligation to update any of
these forward-looking statements for any reason. These forward-looking
statements involve known and unknown risks, uncertainties and other factors that
may cause our actual results, levels of activity, performance, or achievements
to differ materially from those expressed or implied by these statements. These
factors include the matters discussed in the section entitled “Item 1A:
Risk Factors” and elsewhere in this Annual Report on Form 10-K. You should
carefully consider the risks and uncertainties described under this
section.
Overview
We
manufacture and sell solar modules with an advanced thin film semiconductor
technology, and we design, construct and sell photovoltaic (PV) solar power
systems.
In
addressing a growing global demand for PV solar electricity, we target markets
with varying approaches depending on the underlying economics, market
requirements and distribution channels. In subsidized feed-in tariff (FiT)
markets, such as Germany, we have historically sold most of our solar modules to
solar project developers, system integrators and independent power
producers. In other markets, such as the United States, the demand for
solar has been primarily driven by renewable portfolio standards requiring
regulated utilities to supply a portion of their total electricity from
renewable energy sources such as solar power. To meet the needs of these
markets and enable balance of system cost reductions, we have developed a fully
integrated systems business that can provide low-cost turn-key utility-scale PV
system solutions for system owners and low cost electricity to utility
end-users. By building a fully integrated systems business, we believe we
are in a position to expand our business in transitional, and eventually
economically sustainable markets (in which subsidies or incentives are minimal),
which are expected to develop in areas with abundant solar resources and sizable
electricity demand, such as the United States, China, India and parts of Europe.
In the long-term, we plan on competing on an economic basis with conventional
fossil fuel based peaking power generation.
In
furtherance of our goal of delivering the lowest cost of solar energy and
achieving price parity with conventional fossil-fuel based peak electricity
generation, we are continually focused on reducing PV system costs in three
primary areas: module manufacturing, Balance of System (BoS) costs (consisting
of costs of components of a solar power system other than the solar modules,
including inverters, mounting hardware, grid interconnection equipment, wiring
and other devices, and installation labor costs), and cost of capital. First,
with respect to our module manufacturing costs, our advanced technology has
allowed us to reduce our average module manufacturing costs to the lowest in the
world, based on publicly available information. In 2009, our total average
manufacturing costs were $0.87 per watt, which we believe is significantly less
than those of traditional crystalline silicon solar module manufacturers. By
continuing to improve conversion efficiency and production line throughput,
lower material cost and drive volume scale to further decrease overhead costs,
we believe that we can further reduce our manufacturing costs per watt and
maintain our cost advantage over traditional crystalline silicon solar module
manufacturers. Second, by continuing to improve conversion efficiency, leverage
volume procurement around standardized hardware platforms, and accelerate
installation time, we believe we can continue to make substantial reductions in
BoS costs, which represent over half of all costs associated with a typical
utility-scale PV solar power system. Finally, we believe that continuing to
strengthen our financial position, including our balance sheet and credit
profile, will enable us to continue to lower the cost of capital associated with
our solar power systems, thereby further enhancing the economic viability of our
projects and lowering the cost of electricity generated by solar power systems
that incorporate our modules and technology.
Page
1
We
are the world's largest PV solar module manufacturer and produced more than 1.1
gigawatts (GW) of solar modules in 2009, becoming the first PV company to attain
this production volume in a single year. We manufacture our solar modules on
high-throughput production lines and perform all manufacturing steps ourselves
in an automated, proprietary, continuous process. Our solar modules employ a
thin layer of semiconductor material to convert sunlight into electricity. Our
manufacturing process eliminates the multiple supply chain operators and
expensive and time consuming batch processing steps that are used to produce a
crystalline silicon solar module. Currently, we manufacture our solar modules at
our Perrysburg, Ohio, Frankfurt/Oder, Germany and Kulim, Malaysia manufacturing
facilities (with additional manufacturing facilities planned for construction in
Kulim, Malaysia and France) and conduct our research and development activities
primarily at our Perrysburg, Ohio manufacturing facility.
Our
fully integrated solar power systems business includes (i) project development,
(ii) engineering, procurement and construction (EPC) services, (iii) operating
and maintenance (O&M) services, and (iv) project finance expertise, all as
described in more detail below.
|
·
|
Our
project development group obtains land and land rights for the development
of solar power plants incorporating our modules, negotiates long-term
power purchase agreements (PPA) with potential purchasers of the
electricity to be generated by those plants, manages the interconnection
and transmission process, negotiates agreements to interconnect the plant
to the electric grid and obtains the permits which are required prior to
the construction of the plant, including applicable environmental and land
use permits. Our project development portfolio and capabilities have grown
significantly primarily as a result of our acquisition of the project
development business of OptiSolar Inc. in April 2009, and our acquisition
of certain assets from Edison Mission Group’s utility-scale solar project
development pipeline in January 2010. We sell developed projects or
projects under development to system operators who wish to own generating
facilities, such as utilities, or to investors who are looking for
long-term investment vehicles that are expected to generate consistent
returns.
|
|
·
|
We
provide EPC services to projects developed by our project development
business, projects developed by independent solar power project
developers, and directly to system owners such as utilities. The
procurement component of our EPC services includes deployment of our
modules as well as balance of system components that we procure from third
parties.
|
|
·
|
For
solar power plants which we have developed and built, we may provide
ongoing O&M services to the system owner under long-term service
agreements. These O&M services may include overseeing the day-to-day
operation of the system, safety and security, maximizing energy
production, and management of reliability, site services, power purchase
agreement and other contractual compliance, environmental and permit
compliance, regulatory requirements, recordkeeping, forecasting, warranty,
preventative and scheduled maintenance, and spare parts inventory and may
also include certain additional guarantees relating to the
project.
|
|
·
|
Our
project finance group is primarily responsible for negotiating and
executing the sale of utility-scale power plant systems
incorporating our modules which allows us to optimize the value of
our project development portfolio. This group is experienced
in structuring non-recourse project debt financing in the bank
loan market and institutional debt capital markets and raising
project equity capital from tax oriented and strategic industry equity
investors.
|
We
believe that combining our reliable, low cost module manufacturing capability
with our systems business enables us to more rapidly reduce the price of solar
electricity, to accelerate the adoption of our technology in large scale systems
and to further our mission to create enduring value by enabling a world powered
by clean, affordable solar electricity.
Segment
Information
We operate our business in two segments. Our components segment designs,
manufactures and sells solar modules to solar project developers and system
integrators. Through our systems segment, we have the capability to provide a
complete PV solar power system for utility-scale or large commercial systems,
which includes project development, EPC, O&M services and, when required,
project finance. We view the sale of solar modules from the components segment
as the core driver of our profitability, return on net assets and cash
throughput, and we view our systems segment as an enabler to drive module
throughput.
As
of December 26, 2009, our systems segment had not met the quantitative criteria
for disclosure as a separate reporting segment.
See also Note 22.
“Segment and Geographic Information” to our consolidated financial statements
included in this Annual Report on Form 10-K.
Page
2
Components
Business
Our
components segment, which is our principal business, involves the design,
manufacture and sale of solar modules which convert sunlight to
electricity.
Solar Modules
Each
solar module is approximately 2ft × 4ft (60cm × 120cm) and had an average rated
power of approximately 75 watts, 73 watts, and 70 watts for 2009, 2008 and 2007,
respectively. Our solar module is a single-junction polycrystalline thin film
structure that uses cadmium telluride as the absorption layer and cadmium
sulfide as the window layer. Cadmium telluride has absorption properties that
are highly matched to the solar spectrum and has the potential to deliver
competitive conversion efficiencies using only about 1% of the semiconductor
material used by traditional crystalline silicon solar modules. Our thin film
technology also has relatively high energy performance in low light and high
temperature environments compared with traditional crystalline silicon solar
modules.
Manufacturing
Process
We
have integrated our manufacturing processes into a continuous, integrated
production line with the following three stages: the “deposition” stage, the
“cell definition” stage, and the “assembly and test” stage. In the deposition
stage, panels of treated glass are robotically loaded onto the production line
where they are cleaned, heated and coated with a layer of cadmium sulfide
followed by a layer of cadmium telluride using our proprietary vapor transport
deposition technology, after which the semiconductor-coated plates are cooled
rapidly to increase strength. In our cell definition stage, we use high speed
lasers to transform the large single semiconductor-coated plate into a series of
interconnected cells that deliver the desired current and voltage output. Our
proprietary laser scribing technology is capable of accomplishing accurate and
complex scribes at high speeds. Finally, in the assembly and test stage, we
apply busbars, laminate, a rear glass cover sheet and termination wires, seal
the joint box and subject each solar module to a solar simulator and current
leakage test. The final assembly stage is the only stage in our production line
that requires manual processing.
Our
manufacturing facilities in Perrysburg, Ohio, Frankfurt/Oder, Germany and Kulim,
Malaysia have each received both an ISO 9001:2000 quality system certification
and ISO 14001:2004 environmental system certification. We anticipate that our
additional manufacturing facilities, planned for construction in France and
Kulim, Malaysia, will also obtain these certifications in 2011. During 2009, our
Perrysburg facility also received the Occupational Health and Safety Standards
(OHSAS) 18001 certification, an international occupational health and safety
management system specification.
Research, Development and
Engineering
We
continue to devote a substantial amount of resources to research and development
with the primary objective of lowering the per watt cost of electricity
generated by photovoltaic systems using our solar modules. Within our
components business, we focus our research and development activities on, among
other areas, continuing to increase the conversion efficiency of our solar
modules and improving manufacturing efficiencies (including volume ramp,
throughput improvement and material cost reduction). We believe the most
promising ways of increasing the conversion efficiency of our solar modules
include maximizing the number of photons that reach the absorption layer of the
semiconductor material to facilitate conversion into electrons, thereby
maximizing the number of electrons that reach the surface of the semiconductor
and minimizing the electrical losses between the semiconductor layer and the
back metal conductor.
In the course of our research and
development activities, we continuously explore and research new technologies in
our efforts to sustain competitive differentiation in our modules. We typically
qualify process and product improvements for full production at our Ohio plant
and then use our “Copy Smart” process to propagate them to our other production
lines. We believe that this systematic approach to research and development will
provide continuous improvements and ensure uniform adoption across our
production lines. In addition, our production lines are replicas of each other
using our “Copy Smart” process, and as a result, a process or production
improvement on one line can be rapidly deployed to other production
lines.
Customers
With
respect to our components business, during 2009, we sold most of our
solar modules to solar project developers and system integrators headquartered
in Germany, France, Spain and Italy. Our customers typically develop, construct,
own and operate solar power plants or sell turnkey solar power plants to
end-users that include owners of land, owners of agricultural buildings, owners
of commercial warehouses, offices and industrial buildings, public agencies,
municipal government authorities, utility companies and financial investors that
desire to own large scale solar power plant projects.
Page
3
As
of December 26, 2009, we had long-term supply contracts for the sale of solar
modules with fourteen principal customers (Long-Term Supply Contracts)
headquartered throughout the European Union. We also have a five-year agreement
with a solar power system project developer and system integrator in the United
States, which is a related party. Together, these contracts account for a
significant portion of our planned module production over the period from 2010
through 2013 and therefore will significantly affect our overall financial
performance. We have in the past amended pricing and other terms in our
Long-Term Supply Contracts in order to remain competitive, as described below,
and we may decide in the future to further amend such contracts in order to
address the highly competitive environment. In addition, we enter into module
sale agreements or standard purchase orders with customers for specific
projects.
During
the first quarter of 2009, we amended our Long-Term Supply Contracts with
certain customers to further reduce the sales price per watt under these
contracts in 2009 and 2010 in exchange for increases in the volume of solar
modules to be delivered under the contracts. We also extended the payment terms
for certain customers under these contracts from net 10 days to net 45 days to
increase liquidity in our sales channel and to reflect longer module shipment
times from our manufacturing plants in Malaysia. During the third quarter of
2009, we amended our Long-Term Supply Contracts with certain of our customers to
implement a program which extends a price rebate to certain of these customers
for solar modules purchased from us and installed in Germany. The intent of this
program is to enable our customers to successfully compete in our core segments
in Germany. The rebate program applies a specified rebate rate to solar modules
sold for solar power projects in Germany at the beginning of each quarter for
the upcoming quarter. The rebate program is subject to periodic review and we
adjust the rebate rate quarterly upward or downward as appropriate. The rebate
period commenced during the third quarter of 2009 and terminates at the end of
the fourth quarter of 2010. Customers need to meet certain requirements in order
to be eligible for and benefit from this program.
During
2009, principal customers of our components business were Blitzstrom GmbH, EDF
EN Development, Gehrlicher Solar AG, Juwi Solar GmbH, and Phoenix Solar AG.
During 2009, each of these five customers individually accounted for between 10%
and 19% of our component segment’s net sales. All of our other customers
individually accounted for less than 10% of our net sales during 2009. The loss
of any of our major customers could have an adverse effect on our business. As
we expand our manufacturing capacity, we are seeking to develop additional
customer relationships in other markets and regions, which would reduce our
customer and geographic concentration and dependence.
While
our Long-Term Supply Contracts have certain firm purchase commitments, these
contracts are subject to amendments made by us or requested by our customers,
such as the above mentioned amendments entered into during 2009. These
amendments decreased the expected revenue under our Long-Term Supply Contracts
during 2009. In addition, our Long-Term Supply Contracts are substantially
denominated in euros and therefore are subject to exchange rate fluctuations
between the euro and U.S. dollar. The strengthening of the euro compared to the
U.S. dollar during 2009 partially offset the decrease in the expected revenue
under our Long-Term Contracts resulting from the 2009 amendments.
As
of December 26, 2009, the Long-Term Supply Contracts in the aggregate allowed
for approximately $3.8 billion (3.3 billion denominated in euro at an
assumed exchange rate of $1.15/€1.00 and 0.2 billion denominated in USD) in
sales from 2010 to 2013. As of December 27, 2008, the Long-Term Supply Contracts
in the aggregate allowed for approximately $5.8 billion (4.9 billion
denominated in euro at an assumed exchange rate of $1.15/€1.00 and
0.2 billion denominated in USD) in sales from 2009 to 2013. The
above-referenced dollar amounts relating to the Long-Term Supply Contracts
declined from 2008 to 2009, primarily due to revenue recognized for contracted
volumes sold in 2009, module pricing adjustments, the impact of the rebate
program implemented in 2009 as described above, and pre-set price reductions
under the terms of the Long-Term Supply Contracts.
We
anticipate that approximately 55% of the aggregate contracted revenue under the
Long-Term Supply Contracts as of December 26, 2009, will not be fulfilled in
2010 because they are associated with deliveries to be made in 2011 and later
periods. We believe that the aggregate dollar amount associated with the
Long-Term Supply Contracts at any particular date is not necessarily a
meaningful indicator of future revenue for any particular period because the
fulfillment of such amount is subject to a variety of factors, including the
factors described above.
Competition
The
renewable energy, solar energy and solar module sectors are highly competitive
and continually evolving as participants strive to distinguish themselves within
their markets and compete within the larger electric power industry. We expect
to face continued competition, which may result in price reductions, reduced
margins or loss of market share. With respect to our components business, we
believe that our main sources of competition are crystalline silicon solar
module manufacturers, silicon and non-silicon based thin film module
manufacturers and companies developing solar thermal and concentrated
photovoltaic technologies. Among photovoltaic module and cell manufacturers, the
principal methods of competition are price per watt, production capacity,
conversion efficiency, reliability, warranty terms and finance ability. At
December 26, 2009, the global photovoltaic industry consisted of more than 150
manufacturers of solar cells and modules.
Page
4
In
addition, we expect to compete with future entrants to the photovoltaic industry
that offer new technological solutions. We may also face competition from
semiconductor manufacturers and semiconductor equipment manufacturers or their
customers, several of which have already announced their intention to start
production of photovoltaic cells, solar modules or turnkey production lines.
Some of these competitors may be part of larger corporations and have greater
financial resources and greater brand name recognition than we do and may, as a
result, be better positioned to adapt to changes in the industry or the economy
as a whole.
We
also face competition from companies that currently offer or are developing
other renewable energy technologies (including wind, hydropower, geothermal,
biomass and tidal technologies) and other power generation sources that burn
conventional fossil fuels.
Raw
Materials
Our
manufacturing process uses approximately 20 types of raw materials and
components to construct a complete solar module. One critical raw material in
our production process is cadmium telluride. Of the other raw materials and
components, the following eight are also critical to our manufacturing process:
front glass coated with thermal conductive oxide, cadmium sulfide, photo resist,
laminate, tempered back glass, cord plate/cord plate cap, lead wire and solar
connectors. Before we use these materials and components in our manufacturing
process, a supplier must undergo a qualification process that can last up to
12 months, depending on the type of raw material or component. Although we
continually evaluate new suppliers and currently are qualifying several new
suppliers, a few of our critical materials or components are sole sourced and
most others are supplied by a limited number of suppliers.
Collection
and Recycling Program
Consistent
with the environmental philosophy of extended producer responsibility, we have
established the solar industry's first comprehensive, prefunded module
collection and recycling program. The program is designed to maximize the
recovery of valuable materials for use in new modules or other new products and
minimize the environmental impacts associated with our modules at the end of
their useful life. Approximately 90% of each collected First Solar module is
recycled into new products, including new modules. End-users can request
collection and recycling of their solar modules by us at any time at no cost. We
pre-fund the estimated collection and recycling cost at the time of sale,
assuming for this purpose a minimum service life of approximately 25 years for
our solar modules. In addition to achieving substantial environmental benefits,
our solar module collection and recycling program may provide us the opportunity
to resell or redistribute working modules or recover certain raw materials and
components for reuse in our manufacturing process. We currently have recycling
facilities operating at each manufacturing facility (for manufacturing scrap,
warranty returns and modules collected at the end of their useful life) that
produce glass suitable for use in the production of new glass products and
extract metals that will be further processed by a third party supplier to
produce semiconductor materials for reuse in our solar modules.
To
ensure that the pre-funded amounts are available regardless of our financial
status in the future, a trust structure has been established; funds are put into
custodial accounts in the name of a trustee. Only the trustee can distribute
funds from the custodial accounts and these funds cannot be accessed for any
purpose other than for administering module collection and recycling, either by
us or a third party executing the collection and recycling services. To provide
further assurance that sufficient funds will be available, our module collection
and recycling program, including the financing arrangement, is audited
periodically by an independent third-party auditor.
Solar Module
Warranty
We
provide a limited warranty against defects in materials and workmanship under
normal use and service conditions for five years following delivery to the
owners of our solar modules. We also warrant to the owners of our solar modules
that solar modules installed in accordance with agreed-upon specifications will
produce at least 90% of their power output rating during the first 10 years
following their installation and at least 80% of their power output rating
during the following 15 years. In resolving claims under both the defects
and power output warranties, we have the option of either repairing or replacing
the covered solar module or, under the power output warranty, providing
additional solar modules to remedy the power shortfall. Our warranties are
automatically transferred from the original purchasers of our solar modules to
subsequent purchasers. As of December 26, 2009, our accrued warranty
liability was $22.6 million, of which $8.2 million was classified as
current and $14.4 million was classified as noncurrent.
Page
5
Systems
Business
Through
our fully integrated systems business, we provide a complete PV solar power
system solution, which includes project development, EPC services, O&M
services and, when required, project finance.
Our
systems business has grown over the past several years through a combination of
business acquisitions and organic growth. On November 30, 2007, we
completed the acquisition of Turner Renewable Energy, LLC, a privately held
company which provided EPC services for commercial solar power projects in the
United States. On April 3, 2009, we completed the acquisition of the project
development business of OptiSolar Inc., which included a multi-gigawatt project
pipeline. In January 2010, we completed the acquisition of certain assets from
Edison Mission Group's solar project development pipeline consisting of
utility-scale solar projects located primarily on private land in California and
the Southwest.
Project
Development
Our
systems business is dependent upon successful completion of project development
activities including: site selection and acquisition, obtaining in a timely
manner the requisite interconnection and transmission studies, environmental and
land use permits, maintaining effective site control, and entering into a power
purchase agreement with an off-taker of the power to be generated by the
project. These activities culminate in receiving the right to construct and
operate a solar power system. Power purchase agreements define the price and
terms the utility customer will pay for power produced from a
project. Entering into a power purchase agreement generally provides the
underlying economics needed to advance the construction, finance and eventual
sale of the project to the long-term site owner and power producer subject to
obtaining all necessary permits. Depending primarily on the location and other
site attributes, the development cycle can range from one to five years or
longer in some circumstances. We may be required to spend significant sums for
preliminary engineering, permitting, legal and other expenses before we can
determine whether a project is feasible, economically attractive, or capable of
being built. If there is a delay in obtaining any required regulatory approvals,
we may be forced to incur additional costs and/or the right of the off-taker
under the power purchase agreement to terminate may be triggered.
Our
project development activities are currently focused on markets in North
America, Europe and Asia.
In
North America, we have entered into approximately 1.25GW of power purchase
agreements with utilities in the southwestern U.S. and have a pipeline of
approximately 150 megawatts (MW) of projects in Canada governed under
Ontario’s Renewable Energy Standard Offer Program (RESOP), for a total pipeline
of 1.4GW of projects in North America that we expect to develop between 2010 and
2014.
In
Europe, we are engaged in project development activities with respect to certain
projects in France and Italy that we acquired as part of the OptiSolar pipeline,
and we are actively evaluating additional project opportunities in
Europe.
In
Asia, our project development activities include our initiatives in China. In
September 2009, we entered into a Memorandum of Understanding with the Ordos,
China City Government outlining a long-term strategic relationship between the
parties pursuant to which we would, through an appropriate business model,
develop and construct a 2000MW photovoltaic power plant located within the Ordos
New Energy Industry Demonstration Zone in China. In November 2009, we entered
into a Cooperation Framework Agreement with the Ordos government outlining
additional project details, timing and local support for the 2000MW power
plant. The Memorandum of Understanding and the Corporation Framework
Agreements set forth the agreement in principle of the parties concerning the
project and related activities, and final agreement between the parties is
subject to the negotiation and execution of definitive agreements among the
parties.
In
the fourth quarter of 2009, we sold our 20MW solar project in Sarnia, Ontario,
Canada to Enbridge Inc. The power output of the Sarnia facility will be sold to
the Ontario Power Authority pursuant to a 20-year power purchase agreement under
the terms of the Ontario RESOP program. Later in the fourth quarter of 2009, we
entered into an agreement with Enbridge Inc. to expand the Sarnia facility from
20MW to 80MW. When completed later in 2010, the Sarnia facility is expected to
be the largest PV solar facility in North America. In the fourth quarter of
2009, we also sold our 21MW solar project in Blythe, California to NRG Energy,
Inc. Electricity generated by the Blythe facility, which is currently
California’s largest PV solar generation facility, is being sold to Southern
California Edison under a 20-year power purchase agreement.
Page
6
Customers
With
respect to our systems business, our customers consist of investor owned
utilities, independent power developers and producers, commercial and industrial
companies, and other system owners who purchase completed solar power plants,
EPC services and/or operation and maintenance services from us.
Competition
With
respect to our systems business, we face competition from other providers of
renewable energy solutions, including developers of photovoltaic, solar thermal
and concentrated solar power systems and developers of other forms of renewable
energy projects, including wind, hydropower, geothermal, biomass and tidal
projects. To the extent other solar module manufacturers become more vertically
integrated, we expect to face increased competition from such companies as well.
We also face competition from other EPC companies and joint ventures between EPC
companies and solar companies.
Sales
and Marketing
Historically,
the majority of our module sales have been for grid-connected ground or
commercial roof mounted solar power systems in Germany and other European Union
countries with feed-in tariff subsidies. These feed-in tariff subsidies have
been critical for the development of the solar industry because they provided
the demand visibility required for module manufacturers and other participants
in the solar value chain to reduce costs and drive scale. In 2007, we began to
identify and target certain key transition markets, such as the United States,
that had the potential to bridge the gap from the existing feed-in tariff
markets to sustainable markets. Within these transition markets, our strategy is
to advocate for market structures and policies that drive demand for solar power
systems and to identify and break constraints to the successful migration to
sustainable solar markets. In furtherance of this objective, we have
developed a fully integrated systems business to increase module throughput,
drive cost reduction across the value chain, identify and break constraints to
sustainable markets and to deliver the most compelling solutions to our
customers and end- users.
Economic
Incentives
Government
subsidies, economic incentives and other support for solar electricity
generation generally include feed-in tariffs, net metering programs, renewable
portfolio standards, tax incentives, loan guarantees, grants, rebates, low
interest loans and grid access initiatives.
Under
a feed-in tariff subsidy, the government sets prices that regulated utilities
are required to pay for renewable electricity generated by end-users. The prices
are set above market rates and may differ based on system size or application.
Net metering programs enable end-users to sell excess solar electricity to their
local utility in exchange for a credit against their utility bills. The policies
governing net metering vary by state and utility. Some utilities pay the
end-user upfront, while others credit the end-user’s bill.
Under
a renewable portfolio standard (RPS), the government requires regulated
utilities to supply a portion of their total electricity in the form of
renewable electricity. Some programs further specify that a portion of the
renewable energy quota must be from solar electricity, while others provide no
specific technology requirement for renewable electricity generation. RPS-type
mechanisms have been adopted in a majority of U.S. states. Regulations vary
from state to state, and currently there is no federal RPS mandate. The state of
California’s RPS goal of 33% of electricity from renewable sources by 2020 is
currently the most significant RPS program in the United States in magnitude,
and it is contributing to the expansion of the utility-scale solar systems
market in that state.
Page
7
Tax
incentive programs exist in the United States at both the federal and state
level and can take the form of investment and production tax credits,
accelerated depreciation and sales and property tax exemptions. At the federal
level, investment tax credits for business and residential solar systems have
gone through several cycles of enactment and expiration since the 1980’s. In
October 2008, the United States Congress extended the 30% federal investment tax
credit (ITC) for both residential and commercial solar installations for eight
years, through December 31, 2016. The ITC is a primary economic driver of
solar installations in the United States. Its extension through 2016 has
contributed to greater medium term demand visibility in the U.S.; however, its
expiration at the end of 2016 (unless extended) underscores the need for the
levelized cost of electricity from solar systems to continue to decline toward
grid parity. In February 2009, the American Recovery and Reinvestment Act
of 2009 (ARRA) was signed into law. In addition to adopting certain fiscal
stimulus measures that could benefit on-grid solar electricity applications,
ARRA created a new program, through the Department of the Treasury, which
provides cash grants equal to 30% of the cost of the system for solar
installations that are placed into service during 2009 and 2010 and for certain
solar installations for which construction begins prior to December 31,
2010. This cash grant is available in lieu of receiving the 30% federal
investment tax credit. The intent of this program was to ensure that investors
who had historically supported the renewable energy programs would not be
constrained from investing in these transactions by tax losses they may have
suffered during the recent credit crisis. Other measures adopted by ARRA that
could benefit on-grid solar electricity generation include the following:
(1) a Department of Energy loan guarantee program for renewable energy
projects, renewable energy manufacturing facilities and electric power
transmission projects and (2) a 50% bonus depreciation for solar
installations placed in service during 2009. Various legislation has been
proposed to extend and slightly modify the ITC incentives to continue to ensure
short-term investor tax positions do not limit future investment in renewable
energy projects. In addition, legislation is being proposed which could extend
the bonus depreciation benefit for projects completed in 2010. However,
enactment of the extension or enhancement of such incentives is highly
uncertain.
Rebate
programs for solar installations in California and several other states have
increased the quantity of solar energy from distributed photovoltaic systems
(typically smaller non-utility scale PV systems co-located with residential or
commercial rooftop end-users) and have contributed to demand for PV solar
modules and systems.
Regulations
and policies relating to electricity pricing and interconnection also stimulate
demand for distributed generation from photovoltaic systems. PV systems generate
most of their electricity during mid-day and the early afternoon hours when the
demand for and cost of electricity is highest. As a result, electricity
generated by PV systems mainly competes with expensive peak hour electricity,
rather than the lower average price of electricity. Modifications to the peak
hour pricing policies of utilities, such as to a flat rate, would require PV
systems to achieve lower prices in order to compete with the price of
electricity.
In
Europe, renewable energy targets in conjunction with feed-in tariffs
have contributed to the growth in PV solar markets. Renewable energy
targets prescribe how much energy consumption must come from renewable
sources, while FiT policies are intended to support new supply development
by providing investor certainty. A 2001 European Union
(EU) directive for promoting renewable energy use in electricity generation
(Directive 2001/77/EC) had set varying national indicative targets for
renewable energy production from individual member states. A 2009 EU directive
on renewable energy (Directive 2009/28/EC), which replaces the 2001
directive, sets varying targets for all EU member states in support of the
directive’s goal of a 20% share of energy from renewable sources in the EU by
2020 and requires national action plans that establish pathways for the
development of renewable energy sources. The following is a description of FiT
policies adopted in certain critical EU markets in support of renewable
energy targets.
Currently,
Germany, which accounted for approximately 65% of our 2009 net sales, is the
most significant market for our modules, and the recent proposed changes to
German feed-in tariffs are likely to affect our results of operations. The
German Renewable Energy Law, or the EEG, was last modified by the German
government in 2008 with effect on January 1, 2009. At that time, feed-in tariffs
were significantly reduced from earlier levels. Further, under the current
legislation, Germany feed-in tariffs declined 9% for roof mounted applications
and 11% for ground mounted applications on January 1, 2010 and will decline on
January 1, 2011 a further 8% to 10% (based on the volume of PV modules deployed
in Germany during the 12 months ending on September 30, 2010 and the type of PV
system). This compares to an annual decline of between 5% and 6.5% under the
prior legislation. The next review of feed-in tariffs for all types of renewable
energy was scheduled for 2012. However, following the 2009 election of a new
center-right-liberal government in Germany, a further reduction in the PV
feed-in tariff is currently under discussion and will most likely come into
effect in the second or third quarter of 2010. Such a reduction in the feed-in
tariff, including any potential further reductions, could result in a
significant decline in demand and price levels for photovoltaic products in
Germany, which could have a material adverse effect on our business, financial
condition or results of operations.
In
France, which accounted for approximately 12% of our 2009 net sales and where we
have announced plans to build a two-line manufacturing plant, the government
amended its feed-in tariff on January 12, 2010. The new decree became effective
January 14, 2010 and does not have an expiry date but can be amended at any
time. The new feed-in tariff provides a lower rate than the prior feed-in tariff
for all applications while introducing, among other things, a departmental bonus
which makes free field projects in the northern regions of France more
attractive. In addition, the inflation index that increases the feed-in tariff
received by a PV project after its first year of operation was also reduced. The
current feed-in tariff will have a 10% annual digression starting on January 1,
2012.
Page
8
In
Italy, which accounted for approximately 6% of our 2009 net sales, the current
legislation provides that the existing feed-in tariff will be in effect until
the expiration of a 14 month transition period that will begin once 1.2GW of
photovoltaic systems are installed under the existing feed-in tariff. Any
photovoltaic system that is interconnected before the expiration of the
transition period will also receive the feed-in tariff currently in effect. It
is expected that the 1.2GW threshold will be reached in 2010. It is further
expected that the Italian government will propose and enact a new reduced
feed-in tariff before the end of 2010.
In
Spain, which accounted for approximately 3% of our 2009 net sales, the
government published the feed-in tariff currently in effect for PV systems in
September 2008. This feed-in tariff introduced a mechanism that requires a
PV system to be registered in a national registry in order to obtain the Spanish
feed-in tariff. Critically, under the legislation, only a certain number of MWs
of PV systems so registered are granted a feed-in tariff each quarter. Other PV
systems applying for a feed-in tariff remain in a queue and will be awarded a
feed-in tariff in accordance with their place in the queue. For 2010 and 2011,
the legislation limits the number of MW of PV systems that are awarded a feed-in
tariff to 560MW and 500MW, respectively. The current legislation is
scheduled to be reviewed by January 1, 2012.
In
Ontario, Canada, a new feed-in tariff program was introduced in September 2009
and replaced the Renewable Energy Standard Offer Program (RESOP) as the primary
subsidy program for future renewable energy projects. In order to participate in
the Ontario feed-in tariff program, certain provisions relating to minimum
required domestic content and land use restrictions for solar installations must
be satisfied. The new domestic content and land restriction rules do not apply
to our Sarnia solar projects and the other projects governed by RESOP contracts
that we acquired in connection with our acquisition of the solar power project
development business of OptiSolar Inc. in April 2009. However, PV solar power
systems incorporating our modules would not satisfy the domestic content
requirement under the new feed-in tariff program currently in
effect.
In
Australia, which accounted for approximately 1% of our 2009 net sales, the solar
industry is driven by several regulatory initiatives that support the
installation of solar PV modules in both rooftop and free-field applications,
including the nationwide Renewable Energy Target Scheme that has set a renewable
energy goal for Australia of 20% by 2020. In July 2009, the Solar Homes and
Communities Plan, which previously provided the primary incentive for rooftop
installations, was replaced with the less lucrative Solar Credits
Scheme.
In
China, governmental authorities have not adopted a feed-in tariff policy and
currently award solar projects through either a project tendering process or
bi-lateral negotiations. We did not have sales in China in 2009; however, in
September 2009, we entered into a Memorandum of Understanding with the Ordos,
China City Government relating to the construction of a 2GW PV power plant
located within the Ordos New Energy Industry Demonstration Zone in China. See
“Item 1: Business — Segment Information —Systems Business — Project
Development.”
In
2009, India announced its National Solar Mission, which includes a goal of
installing 20GW of solar by 2022. India is expected to announce a feed-in tariff
for the first phase of the National Solar Mission in 2010. We did not have
any sales in India in 2009.
For
more information about risks related to economic incentives, please see
“Item 1A: Risk Factors — Reduced growth in or the reduction, elimination or
expiration of government subsidies, economic incentives and other support for
on-grid solar electricity applications, including the anticipated feed-in tariff
reductions in Germany and certain other core markets, could reduce demand and/or
price levels for our solar modules, limit our growth or lead to a reduction in
our net sales, and adversely impact our operating results.”
Intellectual
Property
Our success depends, in part, on our
ability to maintain and protect our proprietary technology and to conduct our
business without infringing on the proprietary rights of others. We rely
primarily on a combination of patents, trademarks and trade secrets, as well as
associate and third party confidentiality agreements, to safeguard our
intellectual property. As of December 26, 2009, we held 22 patents in the
United States, which will expire at various times between 2012 and 2026, and had
96 patent applications pending. We also held 28 patents and had over 100 patent
applications pending in foreign jurisdictions. Our patent applications and any
future patent applications might not result in a patent being issued with the
scope of the claims we seek, or at all, and any patents we may receive may be
challenged, invalidated or declared unenforceable. We continually assess
appropriate occasions for seeking patent protection for those aspects of our
technology, designs and methodologies and processes that we believe provide
significant competitive advantages.
As
of December 26, 2009, we used two trademarks, “First Solar” and “First
Solar and Design,” in the United States and other
countries.
Page
9
With
respect to proprietary know-how that is not patentable and processes for which
patents are difficult to enforce, we rely on, among other things, trade secret
protection and confidentiality agreements to safeguard our interests. We believe
that many elements of our photovoltaic manufacturing process, including our
unique materials sourcing, involve proprietary know-how, technology or data that
are not covered by patents or patent applications, including technical
processes, equipment designs, algorithms and procedures. We have taken security
measures to protect these elements. All of our research and development
personnel have entered into confidentiality and proprietary information
agreements with us. These agreements address intellectual property protection
issues and require our associates to assign to us all of the inventions, designs
and technologies they develop during the course of employment with us. We also
require our customers and business partners to enter into confidentiality
agreements before we disclose any sensitive aspects of our modules, technology
or business plans.
We
have not been subject to any material intellectual property claims.
Environmental
Matters
Our
manufacturing operations include the use, handling, storage, transportation,
generation and disposal of hazardous materials. We are subject to various
federal, state, local and international laws and regulations relating to the
protection of the environment, including those governing the discharge of
pollutants into the air and water, the use, management and disposal of hazardous
materials and wastes, occupational health and safety, and the cleanup of
contaminated sites. Therefore, we could incur substantial costs, including
cleanup costs, fines and civil or criminal sanctions and costs arising from
third party property damage or personal injury claims, as a result of violations
of or liabilities under environmental laws or non-compliance with environmental
permits required at our facilities. We believe we are currently in substantial
compliance with applicable environmental requirements and do not expect to incur
material capital expenditures for environmental controls in the foreseeable
future. However, future developments such as more aggressive enforcement
policies, the implementation of new, more stringent laws and regulations or the
discovery of unknown environmental conditions may require expenditures that
could have a material adverse effect on our business, results of operations
and/or financial condition. See “Item 1A: Risk Factors — Environmental
obligations and liabilities could have a substantial negative impact on our
financial condition, cash flows and profitability.”
Corporate
History
In
February 2006 we were incorporated as a Delaware corporation. Our common stock
has been listed on The NASDAQ Global Select Market under the symbol “FSLR” since
our initial public offering in November 2006. In October 2009, our common stock
was added to the S&P 500 Index, making First Solar the first, and currently
only, pure-play renewable energy company in the index.
Associates
As
of February 12, 2010, we had approximately 4,700 associates (our term for full
and part-time employees), including approximately 3,900 in manufacturing. The
remainder of our associates are in research and development, sales and marketing
and general and administrative positions, including associates who are engaged
in or support our systems business. None of our associates are currently
represented by labor unions or covered by a collective bargaining agreement. As
we expand domestically and internationally, however, we may encounter associates
who desire union representation or a collective bargaining agreement. We believe
that our relations with our associates are good.
Information
About Geographic Areas
We
have significant marketing, distribution and manufacturing operations both
within and outside the United States. Currently, we manufacture our solar
modules at our Perrysburg, Ohio, Frankfurt/Oder, Germany and Kulim, Malaysia
manufacturing facilities (with additional manufacturing facilities planned for
construction in Kulim, Malaysia and France beginning in 2010). In 2009, 86% of
our net sales were generated from customers headquartered in the European Union.
We are in the process of expanding our operations, particularly with respect to
our systems business, to numerous countries worldwide, including other European
and Asian countries and Australia. As a result, we will be subject to the legal,
tax, political, social and regulatory requirements and economic conditions of
many jurisdictions. The international nature of our operations subject us to a
number of risks, including fluctuations in exchange rates, adverse changes in
foreign laws or regulatory requirements, and tariffs, taxes and other trade
restrictions. See “Item 1A: Risk Factors — Our substantial
international operations subject us to a number of risks, including unfavorable
political, regulatory, labor and tax conditions in foreign countries.” See also
Note 22. “Segment and Geographical Information” to our consolidated
financial statements included in this Annual Report on Form 10-K for
information about our net sales and long-lived assets by geographic region for
the years ended December 26, 2009, December 27, 2008 and
December 29, 2007. See also “Item 7: Management’s Discussion and Analysis
of Financial Condition and Results of Operations” for other information about
our operations and activities in various geographic regions.
Page
10
Available
Information
We
maintain a website at
http://www.firstsolar.com
.
We make available free of charge on our website our annual reports on
Form 10-K, quarterly reports on Form 10-Q, current reports on
Form 8-K, proxy statements and any amendments to those reports filed or
furnished pursuant to Section 13(a) or 15(d) of the Exchange Act, as soon
as reasonably practicable after we electronically file these materials with, or
furnish them to, the SEC. The information contained in or connected to our
website is not incorporated by reference into this report. We use our website as
one means of disclosing material non-public information and for complying with
our disclosure obligations under the SEC’s Regulation FD. Such disclosures will
typically be included within the Investor Relations section of our website
(
http://investor.firstsolar.com
).
Accordingly, investors should monitor such portions of our website, in addition
to following our press releases, SEC filings and public conference calls and
webcasts.
The
public may also read and copy any materials that we file with the SEC at the
SEC’s Public Reference Room at 100 F Street, NE, Washington, D.C.
20549. The public may obtain information on the operation of the Public
Reference Room by calling the SEC at 1-800-SEC-0330. The SEC also maintains an
Internet website that contains reports and other information regarding issuers,
such as First Solar, that file electronically with the SEC. The SEC’s Internet
website is located at
http://www.sec.gov
.
Executive
Officers of the Registrant
Our
executive officers and their ages and positions as of February 19, 2010, were as
follows:
|
Name
|
Age
|
Position
|
||
|
Michael
J. Ahearn
|
53
|
Executive
Chairman
|
||
|
Robert
J. Gillette
|
49
|
Chief
Executive Officer
|
||
|
Bruce
Sohn
|
48
|
President
|
||
|
Jens
Meyerhoff
|
45
|
Chief
Financial Officer
|
||
|
Mary
Beth Gustafsson
|
50
|
Executive
Vice President, General Counsel and Secretary
|
||
|
TK
Kallenbach
|
50
|
Executive
Vice President, Marketing and Product Management
|
||
|
David
Eaglesham
|
48
|
Chief
Technology Officer
|
||
|
Carol
Campbell
|
58
|
Executive
Vice President, Human Resources
|
||
|
James
Zhu
|
48
|
Chief
Accounting Officer
|
Michael
J. Ahearn serves as Executive Chairman of First Solar and served as CEO from
August 2000 to September 2009. Prior to First Solar, he was Partner and
President of the equity investment firm, JWMA (formerly True North Partners,
L.L.C.). Prior to joining JWMA, Mr. Ahearn practiced law as a partner in the
firm of Gallagher & Kennedy. Mr. Ahearn has served on the boards of Arizona
Technology Enterprises, Arizona State University Research Park, Homeward Bound,
the Arizona Science Museum and currently serves on the board of the German
Marshall Fund of the United States. Mr. Ahearn holds a B.A. in Finance and a
J.D. from Arizona State University.
Robert
J. Gillette joined First Solar in October 2009 as Chief Executive Officer. Prior
to joining First Solar, Mr. Gillette served as President and Chief Executive
Officer of Honeywell Aerospace since January 2005. Honeywell Aerospace,
headquartered in Phoenix, Arizona, is Honeywell International's largest business
group with current sales of more than $12 billion annually. In this role, Mr.
Gillette led Honeywell Aerospace's three main businesses—Air Transport &
Regional, Business & General Aviation, and Defense & Space—with more
than 40,000 associates at nearly 100 worldwide manufacturing and service sites.
Prior to this assignment, Mr. Gillette had served as President and Chief
Executive Officer of Honeywell Transportation Systems since July 2001. Mr.
Gillette holds a bachelor's of science degree in Finance from Indiana
University.
Bruce
Sohn has served as President of First Solar since March 2007. Mr. Sohn served as
a director of First Solar from July 2003 until June 2009. Prior to joining First
Solar as President, Mr. Sohn worked at Intel Corporation for 24 years.
He is a senior member of IEEE and a certified Jonah. Mr. Sohn has been a
guest lecturer at several universities, including the Massachusetts Institute of
Technology and Stanford University. Mr. Sohn holds a degree in Materials Science
and Engineering from the Massachusetts Institute of Technology.
Page
11
Jens
Meyerhoff joined First Solar in May 2006 as Chief Financial Officer. Prior to
joining First Solar, Mr. Meyerhoff was the Chief Financial Officer of
Virage Logic Corporation, a provider of embedded memory intellectual property
for the design of integrated circuits, from January 2006 to May 2006.
Mr. Meyerhoff was employed by FormFactor, Inc., a manufacturer of advanced
wafer probe cards, as Chief Operating Officer from April 2004 to July 2005,
Senior Vice President of Operations from January 2003 to April 2004 and Chief
Financial Officer from August 2000 to March 2005. Mr. Meyerhoff holds a
German Wirtschaftsinformatiker degree, which is the equivalent of a Finance and
Information Technology degree, from Daimler Benz’s Executive Training
Program.
Mary
Beth Gustafsson joined First Solar in October 2008 as Vice President, General
Counsel. She was named Executive Vice President, General Counsel and Secretary
in November 2009. Prior to joining First Solar, Ms. Gustafsson was the
Senior Vice President, General Counsel and Secretary of Trane Inc. (formerly
American Standard Companies Inc.) from January 2005 through June 2008. From June
2008 through September 2008, Ms. Gustafsson was Vice President and Deputy
General Counsel of Ingersoll-Rand Ltd., following Ingersoll-Rand’s acquisition
of Trane. From 2001 through 2005, Ms. Gustafsson held positions of
increasing responsibility at American Standard Companies Inc., including Chief
Corporate Counsel and General Counsel for the company’s global air conditioning
business. Ms. Gustafsson holds a B.A. in English Literature from Boston
University, and a J.D. from The University of Michigan Law School.
TK
Kallenbach joined First Solar in December 2009 as Executive Vice President of
Marketing and Product Management. Prior to joining First Solar, Mr. Kallenbach
was a senior executive at Honeywell Aerospace where he led strategic planning,
product marketing, product management, mergers and acquisitions and marketing
communications. His organization created and drove Honeywell Aerospace strategy
through product portfolio integration and product line management. Mr.
Kallenbach began his career at Honeywell (formerly AlliedSignal) in 1979, where
he held a variety of senior technical leadership positions, including Vice
President of Engineering and Technology for Aerospace Electronics, Defense &
Space Electronic Systems, and Propulsion Engines and Systems, and senior
business leadership positions including Vice President of Business Aviation,
Director of HTF7000 Propulsion System, and Director of Helicopter Engines. Mr.
Kallenbach holds both a B.S. in Mechanical & Aerospace Engineering and a
Masters of Business Administration from Arizona State University.
David
Eaglesham joined First Solar in June 2006 as Vice President Technology and
became Chief Technology Officer in November 2009. Prior to joining First Solar,
he was Director of Advanced Technologies at Applied Materials. He also
previously worked as Chief Technologist at Lawrence Livermore and as Director of
Electronic Device Research at Bell Labs. He was Materials Research Society
President in 2005. Mr. Eaglesham has a PhD in Physics from the University of
Bristol.
Carol
Campbell joined First Solar in March 2006 as Director of Human Resources and was
named Vice President of Human Resources in March 2007. She became the Company’s
Executive Vice President of Human Resources in November 2009. Prior to joining
First Solar, she was the Regional Director of Human Resources for North America
at the Dana Corporation, where she was responsible for all Dana plants in the
United States, Canada, and Mexico. Ms. Campbell was with Dana for 20 years,
progressing through levels of greater responsibility in the Legal and Human
Resource Departments. Ms. Campbell holds a Professional Human Resources
certification through the Society of Human Resources Management and has
extensive experience successfully developing and running highly effective HR
organizations in complex and rapidly changing environments. Ms. Campbell holds a
B.A. in Business from Heidelberg College.
James
Zhu serves as First Solar’s Chief Accounting Officer. Mr. Zhu joined the company
as Vice President, Corporate Controller in June 2007. Prior to joining First
Solar, Mr. Zhu served as Assistant Controller and then Vice President, Corporate
Controller for Salesforce.com from May 2004 to May 2007. From July 1999 through
April 2004, Mr. Zhu held positions of increasing responsibility at Chiron
Corporation (acquired by Novartis International AG in April 2006), including
Associate Director and Accounting Manager. Prior to joining Chiron Corporation,
Mr. Zhu worked at KPMG, LLP. Mr. Zhu is a Certified Public Accountant and holds
a B.A. in Economics from China and an M.B.A. in Accounting from Golden Gate
University.
Page
12
An
investment in our stock involves a high degree of risk. You should carefully
consider the following information, together with the other information in this
Annual Report on Form 10-K, before buying shares of our stock. If any of
the following risks or uncertainties occur, our business, financial condition
and results of operations could be materially and adversely affected and the
trading price of our stock could decline.
Risks
Related to Our Markets and Customers
If
photovoltaic technology is not suitable for widespread adoption, or if
sufficient demand for solar modules does not develop or takes longer to develop
than we anticipate, our net sales and profit may flatten or decline and we may
be unable to sustain profitability.
The
solar energy market is at a relatively early stage of development and the extent
to which solar modules will be widely adopted is uncertain. If photovoltaic
technology proves unsuitable for widespread adoption or if demand for solar
modules fails to develop sufficiently, we may be unable to grow our business or
generate sufficient net sales to sustain profitability. In addition, demand for
solar modules in our targeted markets — including Germany, Italy, Spain,
France, the United States, Canada, China and Australia — may not develop or
may develop to a lesser extent than we anticipate. Many factors may affect the
viability of widespread adoption of photovoltaic technology and demand for solar
modules, including the following:
|
·
|
cost-effectiveness
of the electricity generated by photovoltaic power systems compared to
conventional energy sources and products, including conventional energy
sources, such as natural gas, and other non-solar renewable energy
sources, such as wind;
|
|
·
|
availability
and substance of government subsidies, incentives and renewable portfolio
standards to support the development of the solar energy
industry;
|
|
·
|
performance
and reliability of PV systems and thin film technology compared to
conventional and other non-solar renewable energy sources and
products;
|
|
·
|
success
of other renewable energy generation technologies, such as hydroelectric,
tidal, wind, geothermal, solar thermal, concentrated photovoltaic, and
biomass;
|
|
·
|
fluctuations
in economic and market conditions that affect the price of, and demand
for, conventional and non-solar renewable energy sources, such as
increases or decreases in the price of oil, natural gas and other fossil
fuels; and
|
|
·
|
fluctuations
in capital expenditures by end-users of solar modules, which tend to
decrease when the economy slows and interest rates
increase.
|
Reduced
growth in or the reduction, elimination or expiration of government subsidies,
economic incentives and other support for on-grid solar electricity
applications, including the anticipated feed-in tariff reductions in Germany and
certain other core markets, could reduce demand and/or price levels for our
solar modules, and limit our growth or lead to a reduction in our net sales, and
adversely impact our operating results.
We
believe that the near-term growth of the market for on-grid applications, where
solar energy is used to supplement the electricity a consumer purchases from the
utility network, depends significantly on the availability and size of
government subsidies and economic incentives. Federal, state and local
governmental bodies in many countries, most notably Germany, Italy, Spain,
France, the United States, Canada, China, India, Australia, Greece and Portugal
have provided subsidies in the form of feed-in tariffs, rebates, tax incentives
and other incentives to end-users, distributors, systems integrators and
manufacturers of photovoltaic products. Many of these jurisdictions, including
the majority of U.S. states and numerous European Union countries, have adopted
renewable portfolio standards in which the government requires jurisdictions or
regulated utilities to supply a portion of their total electricity from
specified sources of renewable energy, such as solar, wind and hydroelectric
power. Many of these government incentives expire, phase out over time, require
renewal by the applicable authority or may be amended. A summary of recent
developments in the major government subsidy programs in our core markets
follows. We expect the feed-in tariff in Germany and certain other core markets
to be reduced earlier than previously expected, and such reductions could reduce
demand and/or price levels for our solar modules, lead to a reduction in our net
sales and adversely impact our operating results.
German
feed-in tariffs will be adjusted earlier than previously expected, and any
downwards adjustment could reduce demand for our solar modules, lead to a
reduction in our net sales and adversely impact our operating
results. Currently, Germany, which accounted for approximately 65% of our
net sales in 2009, is the largest market for our modules, and thus recently
proposed changes to German feed-in tariffs could significantly impact our
results of operations. A reduction in the PV feed-in tariff is currently under
discussion and will most likely come into effect in the second or third quarter
of 2010. The amount of the FiT reductions are expected to vary among
roof-mounted applications, non-agricultural land free field applications and
agricultural land free field applications. A significant reduction in the FiT
for agricultural land free field applications in particular would likely cause a
significant decline in demand for PV solar systems on agricultural land in
Germany and contribute to a migration toward roof mounted applications and
non-agricultural land free field applications. Overall, reductions in the German
feed-in tariffs, including any potential further reductions, could result in a
significant decline in demand and price levels for photovoltaic products in
Germany, which could have a material adverse effect on our business, financial
condition or results of operations.
Page
13
In
France, a new decree effective January 2010 provides for lower feed-in tariffs
for all applications (including, as in Germany, varying reductions for rooftop
applications and free field applications) while introducing, among other things,
a departmental bonus which makes free field projects in the northern regions of
France more attractive. The new decree does not have an expiry date, but can be
amended at any time.
In
Italy, the current legislation provides that the existing feed-in tariff will be
in effect until the expiration of a 14 month transition period that will begin
once 1.2GW of photovoltaic systems are installed under the existing feed-in
tariff. It is expected that the Italian government will propose and enact a new
feed-in tariff before the end of 2010. Current proposals reflect significant FiT
reductions, particularly for ground mounted applications. We cannot be
certain of the level of such new feed-in tariff. If the level of such feed-in
tariff is not adequate to promote the development of the PV industry or PV
projects in Italy, our ability to pursue an expansion strategy in Italy would be
adversely affected.
In
Spain, the current legislation is scheduled to be reviewed by January 1, 2012;
however, an earlier FiT adjustment is possible.
In
the United States, California has been the state where the majority of solar
installations and solar power module and system sales have taken place during
the past five years. The state of California’s RPS goal of 33% of electricity
from renewable sources by 2020, currently in the form of an executive order from
the Governor’s office, is the most significant RPS program in the United States
in magnitude and is contributing to the expansion of the utility-scale solar
systems market in that state. However, the continued effectiveness of this RPS
program could be negatively impacted if the RPS goal is not passed by the CA
legislature and signed into law. See “Item 1A: Risk Factors — Our ability to
pursue an expansion strategy in California beyond existing projects may be
adversely affected if California is unable to achieve a 33% renewable mandate
through law” below.
The
American Recovery and Reinvestment Act of 2009 provides for certain measures
intended to benefit on-grid solar electricity generation and other renewable
energy initiatives, including (1) a cash grant in lieu of the 30% federal
investment tax credit for solar installations that are placed into service
during 2009 and 2010 or that begin construction prior to December 31, 2010 and
are placed into service by January 1, 2017, and (2) a 50% bonus depreciation for
installations placed in service during 2009. Various legislation has been
proposed to extend or enhance the 30% grant in lieu of the tax credit as well as
bonus depreciation. However, enactment of the extension or enhancement of such
incentives is highly uncertain. The failure to extend or enhance these programs
may reduce tax equity availability (in the case of the grant expiration) which
may adversely affect our ability to arrange financing for utility-scale projects
and may otherwise adversely affect the attractiveness of the U.S. solar
market.
In
Ontario, Canada, a new feed-in tariff program was introduced in September 2009
and replaced the Renewable Energy Standard Offer Program (RESOP) as the primary
subsidy program for future renewable energy projects. In order to participate in
the Ontario feed-in tariff program, certain provisions relating to minimum
required domestic content and land use restrictions for solar installations must
be satisfied. The new domestic content and land restriction rules do not
apply to our Sarnia solar project and the other projects governed by RESOP
contracts that we acquired in connection with our acquisition of the solar power
project development business of OptiSolar Inc. in April 2009. However, our
Ontario projects in earlier stages of development that are not governed by RESOP
contracts, as well as any potential new projects in Ontario, will be subject to
such domestic content and land restriction rules. As these rules are currently
written, we will be unable to fully satisfy such rules (in particular the
domestic content requirement rules), thus projects incorporating our modules
will not qualify for the Ontario feed-in tariff. In the event the Ontario
domestic content and land use restriction rules are not sufficiently modified,
our ability to participate in the Ontario feed-in tariff program for future
projects will be substantially reduced and possibly completely eliminated, and
thus our ability to pursue an expansion strategy in Ontario, Canada beyond our
existing RESOP projects would be adversely affected.
In
China, governmental authorities have not adopted a feed-in tariff policy and
currently award solar projects through either a project tendering process or
bi-lateral negotiations. While the solar industry generally anticipates that
China will adopt a solar feed-in tariff, there is no guarantee this will occur
in a timely manner or at all or that any feed-in tariff will be economically
viable. Without a feed-in tariff, the size and attractiveness of China’s solar
market may be limited and we may be unable to sell into China at an attractive
price, limiting one of our anticipated growth markets.
In
Australia, the large-scale solar industry is in its infancy, and despite several
encouraging government funded initiatives to promote large-scale solar
generation, it is uncertain whether such programs can be successfully
executed.
In
2009, India announced its National Solar Mission, which includes a goal of
installing 20GW of solar by 2022. India is expected to announce a feed-in tariff
for the first phase of the National Solar Mission in 2010. There is no guarantee
that India will maintain its current 20GW by 2022 goal or adopt the required
policies to meet that goal, without which, the size and attractiveness of
India’s solar market may be limited and we may be unable to sell modules or
systems in India at an attractive price, limiting one of our anticipated growth
markets.
Emerging
subsidy programs may require an extended period of time to attain effectiveness
because the applicable permitting and grid connection processes associated with
these programs can be lengthy and administratively burdensome.
Page
14
In
addition, if any of these statutes or regulations is found to be
unconstitutional, or is reduced or discontinued for other reasons, sales prices
and/or volumes of our solar modules in these countries could decline
significantly, which could have a material adverse effect on our business,
financial condition and results of operations.
Electric
utility companies or generators of electricity from fossil fuels or other
renewable energy sources could also lobby for a change in the relevant
legislation in their markets to protect their revenue streams.
Reduced
growth in or the reduction, elimination or expiration of government subsidies
and economic incentives for on-grid solar energy applications, especially those
in our target markets, could limit our growth or cause our net sales to decline
and materially and adversely affect our business, financial condition and
results of operations.
Our
ability to pursue an expansion strategy in California beyond existing projects
may be adversely affected if California is unable to achieve a 33% renewable
mandate through law.
California
currently requires its investor-owned utilities (IOUs) to procure 20% of their
electricity supplies through eligible renewable energy resources by 2010. In
addition, California, through Executive Order has established a utility
procurement goal of 33% renewable electricity by 2020. Due to the threat of
penalties under the current law, investor-owned utilities have the incentive to
comply and have therefore signed long-term contracts to meet the 20% procurement
requirement. However, since the 33% procurement of renewable electricity by 2020
goal is not enforceable through law, it is conceivable that renewable energy
procurement in California could peak around 20% of the IOU’s electricity retail
sales in 2010. If the state legislature and Governor’s office are unable to
adopt legislation that could be signed into law by the end of 2010, the
viability of the 33% RPS program would remain at risk. California’s current
financial difficulties could contribute to an environment in which the 33% RPS
program could be questioned. In addition, any weakening or delay of the 33% RPS
program could contribute to, or be accompanied by, increased project execution
risks, delay, or costs relating to California authorities, such as the
California Independent System Operator. Under such a scenario, our ability to
execute a long-term expansion plan to develop additional large-scale PV projects
in California could be adversely affected.
An
increase in interest rates or lending rates or tightening of the supply of
capital in the global financial markets (including a reduction in total tax
equity availability) could make it difficult for end-users to finance the cost
of a PV system and could reduce the demand for our solar modules and/or lead to
a reduction in the average selling price for photovoltaic modules.
Many
of our customers and our systems business depend on debt financing to fund the
initial capital expenditure required to develop, build and purchase a PV system.
As a result, an increase in interest rates or lending rates could make it
difficult for our customers or our systems business to secure the financing
necessary to develop, build, purchase or install a PV system on favorable terms,
or at all, and thus lower demand for our solar modules which could limit our
growth or reduce our net sales. Due to the overall economic outlook, our
end-users may change their decision or change the timing of their decision to
develop, build, purchase or install a PV system. In addition, we believe that a
significant percentage of our end-users install PV systems as an investment,
funding the initial capital expenditure through a combination of equity and
debt. An increase in interest rates and/or lending rates could lower an
investor’s return on investment in a PV system, increase equity return
requirements or make alternative investments more attractive relative to
PV systems, and, in each case, could cause these end-users to seek
alternative investments. A reduction in the supply of project debt financing or
tax equity investments could reduce the number of solar projects that receive
financing and thus lower demand for solar modules. As described above under
“Item 1: Business — Sales and Marketing — Economic Incentives,” the 30% grant in
lieu of the federal investment tax credit under the ARRA is set to expire and
unless extended, will not be available for solar installations that begin
construction on or after January 1, 2011. If such program is not extended, total
tax equity availability could be reduced which may adversely affect our ability
to arrange financing for utility-scale projects and may adversely affect the
attractiveness of the U.S. solar market.
We
currently sell a substantial portion of our solar modules under Long-Term Supply
Contracts, and we allocate a significant amount of our production to satisfy our
obligations under these contracts. These customers buy our modules with the
expectation that they will be able to resell them in connection with the
development of PV systems. As discussed above, many of these projects depend on
the availability of debt and equity financing. A prolonged, material disruption
to the supply of project finance could adversely affect our customers’ ability
to perform under these agreements. In the event of default by one or more of
these customers, we may be unable to sell these modules at the prices specified
in our Long-Term Supply Contracts, especially if demand for PV systems softens
or supply of solar modules increases. Also, we may decide to lower our average
selling price to certain customers in certain markets in response to changes in
economic circumstances of our customers, their end markets or the capital
markets. See “Item 1: Business — Segment Information — Components
Business — Customers” for a description of previous pricing adjustments
under our Long-Term Supply Contracts.
Page
15
We
currently depend on a limited number of customers, with five customers
accounting for a majority of our components business’ net sales last year. The
loss of, or a significant reduction in orders from, any of these customers could
significantly reduce our net sales and negatively impact our operating
results.
We
currently sell substantially all of our solar modules to customers headquartered
throughout the European Union. During 2009, our five largest customers for our
components business each accounted for between 10% and 19% of our component
business’ net sales. Our customer base within our components business is
currently concentrated to a significant extent in Germany, and therefore the
likely additional German feed-in tariff reductions currently under discussion
could reduce demand and/or price levels for our modules sold to these customers.
The loss of any of our large customers, their inability to perform under their
contracts, or their default in payment could significantly reduce our net sales
and adversely impact our operating results. Our customers face significant
challenges under current economic conditions, including lack of capital to
finance solar projects and rising costs associated with leasing or otherwise
acquiring land and rooftops for solar projects. We believe that we can mitigate
this risk by re-allocating modules to other customers if the need arises, but we
may be unable, in whole or in part, to mitigate the reduced demand for our
modules. In the event that we determine that our planned production of solar
modules exceeds the demand we anticipate, we may decide to reduce or halt
production of solar modules in our manufacturing facilities. However, we may be
unable to anticipate and respond to the oversupply of solar modules because we
have limited visibility into our customers’ inventories.
Risks
Related to Regulations
Existing
regulations and policies and changes to these regulations and policies may
present technical, regulatory and economic barriers to the purchase and use of
photovoltaic products, which may significantly reduce demand for our solar
modules.
The
market for electricity generation products is heavily influenced by foreign,
federal, state and local government regulations and policies concerning the
electric utility industry, as well as policies promulgated by electric
utilities. These regulations and policies often relate to electricity pricing
and technical interconnection of customer-owned electricity generation. In the
United States and in a number of other countries, these regulations and policies
have been modified in the past and may be modified again in the future. These
regulations and policies could deter end-user purchases of photovoltaic products
and investment in the research and development of photovoltaic technology. For
example, without a mandated regulatory exception for photovoltaic systems,
utility customers are often charged interconnection or standby fees for putting
distributed power generation on the electric utility grid. If these
interconnection standby fees were applicable to PV systems, it is likely that
they would increase the cost to our end-users of using PV systems which could
make them less desirable, thereby harming our business, prospects, results of
operations and financial condition. In addition, electricity generated by PV
systems mostly competes with expensive peak hour electricity, rather than the
less expensive average price of electricity. Modifications to the peak hour
pricing policies of utilities, such as to a flat rate for all times of the day,
would require PV systems to achieve lower prices in order to compete with the
price of electricity from other sources.
We
anticipate that our solar modules and their installation will be subject to
oversight and regulation in accordance with national and local ordinances
relating to building codes, safety, environmental protection, utility
interconnection and metering and related matters. It is difficult to track the
requirements of individual states and design equipment to comply with the
varying standards. Any new government regulations or utility policies pertaining
to our solar modules may result in significant additional expenses to us, our
resellers and their customers and, as a result, could cause a significant
reduction in demand for our solar modules.
Environmental
obligations and liabilities could have a substantial negative impact on our
financial condition, cash flows and profitability.
Our
operations involve the use, handling, generation, processing, storage,
transportation and disposal of hazardous materials and are subject to extensive
environmental laws and regulations at the national, state, local and
international level. These environmental laws and regulations include those
governing the discharge of pollutants into the air and water, the use,
management and disposal of hazardous materials and wastes, the cleanup of
contaminated sites and occupational health and safety. We have incurred and will
continue to incur significant costs and capital expenditures in complying with
these laws and regulations. In addition, violations of, or liabilities under,
environmental laws or permits may result in restrictions being imposed on our
operating activities or in our being subjected to substantial fines, penalties,
criminal proceedings, third party property damage or personal injury claims,
cleanup costs or other costs. While we believe we are currently in substantial
compliance with applicable environmental requirements, future developments such
as more aggressive enforcement policies, the implementation of new, more
stringent laws and regulations, or the discovery of presently unknown
environmental conditions may require expenditures that could have a material
adverse effect on our business, results of operations and financial
condition.
Page
16
In
addition, our products contain cadmium telluride and cadmium sulfide. Elemental
cadmium and certain of its compounds are regulated as hazardous due to the
adverse health effects that may arise from human exposure. Although the risks of
exposure to cadmium telluride are not believed to be as serious as those
relating to exposure to elemental cadmium, the chemical, physical and
toxicological properties of cadmium telluride have not been thoroughly
investigated and reported. We maintain engineering controls to minimize our
associates’ exposure to cadmium or cadmium compounds and require our associates
who handle cadmium compounds to follow certain safety procedures, including the
use of personal protective equipment such as respirators, chemical goggles and
protective clothing. In addition, we believe the risk of exposure to cadmium or
cadmium compounds from our end-products is limited by the fully encapsulated
nature of these materials in our products, the physical properties of cadmium
compounds used in our products and the implementation in 2005 of our collection
and recycling program for our solar modules. While we believe that these factors
and procedures are sufficient to protect our associates, end-users and the
general public from cadmium exposure, we cannot assure that human or
environmental exposure to cadmium or cadmium compounds used in our products will
not occur. Any such exposure could result in future third-party claims against
us, as well as damage to our reputation and heightened regulatory scrutiny of
our products, which could limit or impair our ability to sell and distribute our
products. The occurrence of future events such as these could have a material
adverse effect on our business, financial condition or results of
operations.
The
use of cadmium in various products is also coming under increasingly stringent
governmental regulation. Future regulation in this area could impact the
manufacture, sale, collection and recycling of solar modules and could require
us to make unforeseen environmental expenditures or limit our ability to sell
and distribute our products. For example, European Union Directive 2002/95/EC on
the Restriction of the Use of Hazardous Substances in electrical and electronic
equipment (RoHS Directive), restricts the use of certain hazardous substances,
including cadmium, in specified products. Other jurisdictions, such as China
have adopted similar legislation or are considering doing so. Currently, PV
solar modules are not subject to the RoHS Directive; however, the RoHS Directive
allows for future amendments subjecting additional products to the requirements
and the scope. Applicability and the products included in the Directive may also
change. In December 2008, the European Commission issued its proposed
revision of the RoHS Directive. This proposed revision did not include
photovoltaic solar modules in the scope of RoHS, but is now being amended by
both the European Parliament and the European Union Members States as part of
the normal European Union legislative process. The European Council and the
European Parliament are currently considering an “open scope” approach to the
RoHS Directive under which all Electrical and Electronic Equipment (EEE)
products would be included in the scope of the RoHS Directive unless
specifically excluded or exempted from coverage. As part of these discussions,
exclusion for PV panels from the RoHS Directive is being considered. A final
legislative agreement on the RoHS Directive is not expected until 2011 at the
earliest. If PV modules are included in the scope of RoHS without an exemption
or exclusion, we would be required to redesign our solar modules to eliminate
cadmium in order to continue to offer them for sale within the European Union,
which would be impractical. In such event, the European Union market would be in
effect closed to us, which could have a material adverse effect on our business,
financial condition and results of operations. In 2009, 86% of our total net
sales were generated from module sales in the European Union. In addition, some
of our competitors are increasingly focusing on our modules’ use of cadmium
telluride in an attempt to gain a competitive advantage over us. If such actions
are successful, they could result in a loss of sales and potentially limit our
growth.
Risks
Related to our Operations, Manufacturing and Technology
Our
limited operating history may not serve as an adequate basis to judge our future
prospects and results of operations.
We
have a limited operating history. Although we began developing our predecessor
technology in 1987, we did not launch commercial operations until we qualified
our pilot production line in January 2002. We qualified the first production
line at our Ohio plant in November 2004, the second and third production lines
at our Ohio plant in August 2006, our German plant in the third quarter of 2007,
and our Malaysian plants in 2008 and 2009. Because these production lines have
only been in operation for a limited period of time, our historical operating
results may not provide a meaningful basis for evaluating our business,
financial performance and prospects. While our net sales grew from $135.0
million in 2006 to $2.1 billion in 2009, we may be unable to achieve similar
growth, or grow at all, in future periods. Our ability to achieve similar growth
in future periods is also affected by current economic conditions. Our past
results occurred in an environment where, among other things, capital was
generally more accessible to our customers to finance the cost of developing
solar projects and economic incentives for solar power in certain core markets
(such as the German feed-in tariff) were more favorable. Accordingly, you should
not rely on our results of operations for any prior period as an indication of
our future performance. See “Item 1: Business — Segment Information —
Components Business — Customers” for a description of previous pricing
adjustments under our Long-Term Supply Contracts.
We
face intense competition from manufacturers of crystalline silicon solar
modules, thin film solar modules and solar thermal and concentrated photovoltaic
systems; if global supply exceeds global demand, it could lead to a reduction in
the average selling price for photovoltaic modules.
The
solar energy and renewable energy industries are both highly competitive and
continually evolving as participants strive to distinguish themselves within
their markets and compete with the larger electric power industry. Within the
global photovoltaic industry, we face competition from crystalline silicon solar
module manufacturers, other thin film solar module manufacturers and companies
developing solar thermal and concentrated photovoltaic
technologies.
Page
17
Even
if demand for solar modules continues to grow, the rapid expansion plans of many
solar cell and module manufacturers could create periods where supply exceeds
demand. In addition, we believe the significant decrease in the cost of silicon
feedstock will provide significant reductions in the manufacturing cost of
crystalline silicon solar modules and lead to pricing pressure for solar modules
and potentially the oversupply of solar modules, including in key markets such
as Germany and Spain.
During
any such period, our competitors could decide to reduce their sales price in
response to competition, even below their manufacturing cost, in order to
generate sales. As a result, we may be unable to sell our solar modules at
attractive prices, or for a profit, during any period of excess supply of solar
modules, which would reduce our net sales and adversely affect our results of
operations. Also, we may decide to lower our average selling price to certain
customers in certain markets in response to competition.
Thin
film technology has a short history and our thin film technology and solar
modules may perform below expectations; problems with product quality or
performance may cause us to incur warranty expenses, damage our market
reputation and prevent us from maintaining or increasing our market
share.
Researchers
began developing thin film semiconductor technology over 20 years ago, but
were unable to integrate the technology into a solar module production line
until recently. Our oldest active production line has been in operation since
November 2004, and the oldest solar modules manufactured during the
qualification of our pilot line have been in use since 2001. As a result, our
thin film technology and solar modules do not have a sufficient operating
history to confirm how our solar modules will perform over their estimated
25-year useful life. We perform a variety of quality and life tests under
different conditions. However, if our thin film technology and solar modules
perform below expectations, we could lose customers and face substantial
warranty expense.
Our
solar modules are sold with a five-year materials and workmanship warranty for
technical defects and a 25-year warranty against declines of more than 10% of
their initial rated power in the first 10 years following their
installation and 20% of initial rated power in the following 15 years,
respectively. As a result, we bear the risk of extensive warranty claims long
after we have sold our solar modules and recognized net sales. As of
December 26, 2009, our accrued warranty liability was $22.6 million,
of which, $8.2 million was classified as current and $14.4 million was
classified as noncurrent.
While
our power output warranty extends for 25 years, our oldest solar modules
manufactured during the qualification of our pilot production line have only
been in use since 2001. Because of the limited operating history of our solar
modules, we have been required to make assumptions regarding the durability and
reliability of our solar modules. Our assumptions could prove to be materially
different from the actual performance of our solar modules, causing us to incur
substantial expense to repair or replace defective solar modules in the future.
For example, our glass-on-glass solar modules could break, delaminate or
experience power degradation in excess of expectations, our manufacturing
operations could be subject to process variations that could cause affected
modules to underperform compared to our expectations. Any widespread product
failures may damage our market reputation and cause our sales to decline and
require us to repair or replace the defective modules, which could have a
material adverse effect on our financial results.
If
our estimates regarding the future cost of collecting and recycling our solar
modules are incorrect, we could be required to accrue additional expenses at and
from the time we realize our estimates are incorrect and face a significant
unplanned cash burden.
We
pre-fund our estimated future obligation for collecting and recycling our solar
modules based on the present value of the expected future cost of collecting and
recycling the modules, which includes the cost of packaging the solar modules
for transport, the cost of freight from the solar module’s installation site to
a recycling center, the material, labor and capital costs of the recycling
process and an estimated third-party profit margin and return on risk for
collection and recycling. We base our estimate on our experience collecting and
recycling solar modules that do not pass our quality control tests and solar
modules returned under our warranty and on our expectations about future
developments in recycling technologies and processes and economic conditions at
the time the solar modules will be collected and recycled. If our estimates
prove incorrect, we could be required to accrue additional expenses at and from
the time we realize our estimates are incorrect and also face a significant
unplanned cash burden at the time we realize our estimates are incorrect or
end-users return their solar modules, which could harm our operating results. In
addition, our end-users can return their solar modules at any time. As a result,
we could be required to collect and recycle our solar modules earlier than we
expect and before recycling technologies and processes improve.
Page
18
Our
failure to further refine our technology and develop and introduce improved
photovoltaic products could render our solar modules uncompetitive or obsolete
and reduce our net sales and market share.
We
will need to invest significant financial resources in research and development
to continue to improve our module conversion efficiency and to otherwise keep
pace with technological advances in the solar energy industry. However, research
and development activities are inherently uncertain and we could encounter
practical difficulties in commercializing our research results. We seek to
continuously improve our products and processes, and the resulting changes carry
potential risks in the form of delays, additional costs or other unintended
contingencies. In addition, our significant expenditures on research and
development may not produce corresponding benefits. Other companies are
developing a variety of competing photovoltaic technologies, including copper
indium gallium diselenide and amorphous silicon, which could produce solar
modules that prove more cost-effective or have better performance than our solar
modules. In addition, other companies could potentially develop a highly
reliable renewable energy system that mitigates the intermittent power
production drawback of many renewable energy systems, or offers other
value-added improvements from the perspective of utilities and other system
owners, in which case such companies could compete with us even if the levelized
cost of electricity associated with such new system is higher than that of our
systems. As a result, our solar modules may be rendered obsolete by the
technological advances of our competitors, which could reduce our net sales and
market share.
In
addition, we often forward price our products and services (including through
our Long-Term Supply Contracts and power purchase agreements) in anticipation of
future cost reductions, and thus an inability to further refine our technology
and execute our long-term cost reduction objectives could adversely affect our
margins and operating results.
Our
failure to protect our intellectual property rights may undermine our
competitive position and litigation to protect our intellectual property rights
or defend against third-party allegations of infringement may be
costly.
Protection
of our proprietary processes, methods and other technology is critical to our
business. Failure to protect and monitor the use of our existing intellectual
property rights could result in the loss of valuable technologies. We rely
primarily on patents, trademarks, trade secrets, copyrights and contractual
restrictions to protect our intellectual property. As of December 26, 2009,
we held 22 patents in the United States, which will expire at various times
between 2012 and 2026, and had 96 patent applications pending. We also held 28
patents and had over 100 patent applications pending in foreign jurisdictions.
Our existing patents and future patents could be challenged, invalidated,
circumvented or rendered unenforceable. Our pending patent applications may not
result in issued patents, or if patents are issued to us, such patents may not
be sufficient to provide meaningful protection against competitors or against
competitive technologies.
We
also rely upon unpatented proprietary manufacturing expertise, continuing
technological innovation and other trade secrets to develop and maintain our
competitive position. While we generally enter into confidentiality agreements
with our associates and third parties to protect our intellectual property, such
confidentiality agreements are limited in duration and could be breached and may
not provide meaningful protection for our trade secrets or proprietary
manufacturing expertise. Adequate remedies may not be available in the event of
unauthorized use or disclosure of our trade secrets and manufacturing expertise.
In addition, others may obtain knowledge of our trade secrets through
independent development or legal means. The failure of our patents or
confidentiality agreements to protect our processes, equipment, technology,
trade secrets and proprietary manufacturing expertise, methods and compounds
could have a material adverse effect on our business. In addition, effective
patent, trademark, copyright and trade secret protection may be unavailable or
limited in some foreign countries, especially any developing countries into
which we may expand our operations. In some countries we have not applied for
patent, trademark or copyright protection.
Third
parties may infringe or misappropriate our proprietary technologies or other
intellectual property rights, which could have a material adverse effect on our
business, financial condition and operating results. Policing unauthorized use
of proprietary technology can be difficult and expensive. Also, litigation may
be necessary to enforce our intellectual property rights, protect our trade
secrets or determine the validity and scope of the proprietary rights of others.
We cannot assure you that the outcome of such potential litigation will be in
our favor. Such litigation may be costly and may divert management attention and
other resources away from our business. An adverse determination in any such
litigation may impair our intellectual property rights and may harm our
business, prospects and reputation. In addition, we have no insurance coverage
against litigation costs and would have to bear all costs arising from such
litigation to the extent we are unable to recover them from other
parties.
Page
19
Many
of our key raw materials and components are either sole-sourced or sourced by a
limited number of third-party suppliers and their failure to perform could cause
manufacturing delays and impair our ability to deliver solar modules to
customers in the required quality and quantities and at a price that is
profitable to us.
Our
failure to obtain raw materials and components that meet our quality, quantity
and cost requirements in a timely manner could interrupt or impair our ability
to manufacture our solar modules or increase our manufacturing cost. Many of our
key raw materials and components are either sole-sourced or sourced by a limited
number of third-party suppliers. As a result, the failure of any of our
suppliers to perform could disrupt our supply chain and impair our operations.
In addition, many of our suppliers are small companies that may be unable to
supply our increasing demand for raw materials and components as we implement
our planned rapid expansion. We may be unable to identify new suppliers or
qualify their products for use on our production lines in a timely manner and on
commercially reasonable terms. Raw materials and components from new suppliers
may also be less suited for our technology and yield solar modules with lower
conversion efficiencies, higher failure rates and higher rates of degradation
than solar modules manufactured with the raw materials from our current
suppliers. A constraint on our production may cause us to be unable to meet our
obligations under our Long-Term Supply Contracts, which would have an adverse
impact on our financial results.
A
disruption in our supply chain for cadmium telluride, our semiconductor
material, could interrupt or impair our ability to manufacture solar
modules.
A
key raw material we use in our production process is a cadmium telluride
compound. Tellurium is mainly produced as a by-product of copper refining, and
its supply is therefore largely dependent upon demand for copper. Currently, we
purchase these raw materials from a limited number of suppliers. If our current
suppliers or any of our future suppliers are unable to perform under their
contracts or purchase orders, our operations could be interrupted or impaired.
In addition, because our suppliers must undergo a lengthy qualification process,
we may be unable to replace a lost supplier in a timely manner and on
commercially reasonable terms. Our supply of cadmium telluride could also be
limited if any of our current suppliers or any of our future suppliers are
unable to acquire an adequate supply of tellurium in a timely manner or at
commercially reasonable prices. If our competitors begin to use or increase
their demand for cadmium telluride, supply could be reduced and prices could
increase. If our current suppliers or any of our future suppliers cannot obtain
sufficient tellurium, they could substantially increase prices or be unable to
perform under their contracts. We may be unable to pass increases in the cost of
our raw materials through to our customers because our customer contracts do not
adjust for raw material price increases and are generally for a longer term than
our raw material supply contracts. A reduction in our production could result in
our inability to meet our commitments under our Long-Term Supply Contracts, all
of which would have an adverse impact on our financial results.
Our
future success depends on our ability to build new manufacturing plants and add
production lines in a cost-effective manner, both of which are subject to risks
and uncertainties.
Our
future success depends on our ability to significantly increase both our
manufacturing capacity and production throughput in a cost-effective and
efficient manner. If we cannot do so, we may be unable to expand our business,
decrease our cost per watt, maintain our competitive position, satisfy our
contractual obligations or sustain profitability. Our ability to expand
production capacity is subject to significant risks and uncertainties, including
the following:
|
·
|
making
changes to our production process that are not properly qualified or that
may cause problems with the quality of our solar
modules;
|
|
·
|
delays
and cost overruns as a result of a number of factors, many of which may be
beyond our control, such as our inability to secure successful contracts
with equipment vendors;
|
|
·
|
our
custom-built equipment taking longer and costing more to manufacture than
expected and not operating as
designed;
|
|
·
|
delays
or denial of required approvals by relevant government
authorities;
|
|
·
|
being
unable to hire qualified
staff;
|
|
·
|
failure
to execute our expansion plans effectively;
and
|
|
·
|
manufacturing
concentration risk resulting from an expected 24 out of 34 announced
production lines worldwide by the end of 2012 being located in one
geographic area, Malaysia.
|
Page
20
If
our future production lines are not built in line with our committed schedules
it may impair our growth plans, if our future production lines do not achieve
operating metrics similar to our existing production lines, our solar modules
could perform below expectations and cause us to lose customers.
Currently,
our production lines have a limited history of operating at full capacity.
Future production lines could produce solar modules that have lower
efficiencies, higher failure rates and higher rates of degradation than solar
modules from our existing production lines, and we could be unable to determine
the cause of the lower operating metrics or develop and implement solutions to
improve performance. Although we will be using the same systematic replication
process to build our French manufacturing center and expand our Malaysian
manufacturing center that we successfully used when building and expanding our
existing German and Malaysian production facilities, our replication risk in
connection with building production lines at our French manufacturing center and
other future manufacturing plants could be higher than our replication risk was
in building and expanding our existing German and Malaysian production
facilities because two of these new production lines are located in a new
geographic area for us, which could entail other factors that may lower their
operating metrics. If we are unable to systematically replicate our production
lines to meet our committed schedules and achieve and sustain similar operating
metrics in our future production lines as we have achieved at our existing
production lines, our manufacturing capacity could be substantially constrained,
our manufacturing costs per watt could increase, and this may impair our growth
plans and/or cause us to lose customers, resulting in lower net sales, higher
liabilities and lower net income than we anticipate. In addition, we might be
unable to produce enough solar modules to satisfy our contractual requirements
under our Long-Term Supply Contracts.
Some
of our manufacturing equipment is customized and sole sourced. If our
manufacturing equipment fails or if our equipment suppliers fail to perform
under their contracts, we could experience production disruptions and be unable
to satisfy our contractual requirements.
Some
of our manufacturing equipment is customized to our production lines based on
designs or specifications that we provide to the equipment manufacturer, which
then undertakes a specialized process to manufacture the custom equipment. As a
result, the equipment is not readily available from multiple vendors and would
be difficult to repair or replace if it were to become damaged or stop working.
If any piece of equipment fails, production along the entire production line
could be interrupted and we could be unable to produce enough solar modules to
satisfy our contractual requirements under our Long-Term Supply Contracts. In
addition, the failure of our equipment suppliers to supply equipment in a timely
manner or on commercially reasonable terms could delay our expansion plans and
otherwise disrupt our production schedule or increase our manufacturing costs,
all of which would adversely impact our financial results.
If
we are unable to further increase the number of sellable watts per solar module
and reduce our manufacturing cost per watt, we will be in default under certain
of our Long-Term Supply Contracts and our profitability could
decline.
Our Long-Term Supply Contracts either
(1) require us to increase the minimum average number of watts per module
over the term of the contract or (2) have a price adjustment for increases
or decreases in the number of watts per module relative to a base number of
watts per module. Our failure to achieve these metrics could reduce our
profitability or allow some of our customers to terminate their contracts. In
addition, all of our Long-Term Supply Contracts in Europe specify a sales price
per watt that declines at the beginning of each year through the expiration date
of each contract in 2012. Our profitability could decline if we are unable to
reduce our manufacturing cost per watt by at least the same rate at which our
contractual prices decrease. Furthermore, our failure to reduce cost per watt by
increasing our efficiency may impair our ability to enter new markets that we
believe will require lower cost per watt for us to be competitive and may impair
our growth plans.
We
may be unable to manage the expansion of our operations
effectively.
We expect to continue to expand our
business in order to meet our contractual obligations, satisfy demand for our
solar modules and maintain or increase market share. However, depending on the
amount of additional contractual obligations we enter into and our ability to
expand our manufacturing capabilities in accordance with our expectations, we
might be unable to produce enough solar modules to satisfy our contractual
requirements under our Long-Term Supply Contracts and other commitments, in
which case we could be in default under such agreements and our operating
results may be adversely affected.
Following
the completion of our expansion of our Ohio plant in 2010, we will have grown
from one production line in Ohio in 2005 to 24 production lines with an annual
global manufacturing capacity of approximately 1282MW (based on the fourth
quarter of 2009 average per line run rate at our existing plants). Construction
of our two-line French manufacturing facility is expected to begin in the second
half of 2010 and a full annual production capacity of more than 100MW is
expected to be reached in early 2012. Our eight-line Malaysian expansion is
expected to start production in the first half of 2011.
Page
21
To
manage the continued rapid expansion of our operations, we will be required to
continue to improve our operational and financial systems, procedures and
controls and expand, train and manage our growing associate base. Our management
will also be required to maintain and expand our relationships with customers,
suppliers and other third parties and attract new customers and suppliers. In
addition, our current and planned operations, personnel, systems and internal
procedures and controls might be inadequate to support our future growth. If we
cannot manage our growth effectively, we may be unable to take advantage of
market opportunities, execute our business strategies or respond to competitive
pressures.
Implementing a new enterprise resource
planning system could interfere with our business or operations and could
adversely impact our financial position, results of operations and cash
flows.
We are in the process of implementing
a new enterprise resource planning (ERP) system. We expect to complete Phase 1
of this implementation in the second half of 2010. This project requires
significant investment of capital and human resources, the re-engineering of
many processes of our business, and the attention of many associates and
managers who would otherwise be focused on other aspects of our business. Any
disruptions, delays or deficiencies in the design and implementation of the new
ERP system could result in potentially much higher costs than we had anticipated
and could adversely affect our ability to process customer orders, ship
products, provide services and support to customers, bill and track our
customers, fulfill contractual obligations, file SEC reports in a timely manner
and/or otherwise operate our business, or otherwise impact our controls
environment, and any of these consequences could have an adverse effect on our
financial position, results of operations and cash flows.
Our
substantial international operations subject us to a number of risks, including
unfavorable political, regulatory, labor and tax conditions in foreign
countries.
We
have significant marketing, distribution and manufacturing operations both
within and outside the United States. In 2009, 86% of our net sales were
generated from customers headquartered in the European Union. In the future, we
expect to expand our operations into China, India and other countries in Europe,
Asia and the Middle East and elsewhere; as a result, we will be subject to the
legal, political, social and regulatory requirements and economic conditions of
many jurisdictions. Risks inherent to international operations, include, but are
not limited to, the following:
|
·
|
difficulty
in enforcing agreements in foreign legal
systems;
|
|
·
|
foreign
countries may impose additional income and withholding taxes or otherwise
tax our foreign operations, impose tariffs or adopt other restrictions on
foreign trade and investment, including currency exchange
controls;
|
|
·
|
fluctuations
in exchange rates may affect product demand and may adversely affect our
profitability in U.S. dollars to the extent the price of our solar
modules and cost of raw materials, labor and equipment is denominated in a
foreign currency;
|
|
·
|
inability
to obtain, maintain or enforce intellectual property
rights;
|
|
·
|
risk
of nationalization of private
enterprises;
|
|
·
|
changes
in general economic and political conditions in the countries in which we
operate, including changes in the government incentives we are relying
on;
|
|
·
|
unexpected
adverse changes in foreign laws or regulatory requirements, including
those with respect to environmental protection, export duties and
quotas;
|
|
·
|
opaque
approval processes in which the lack of transparency may cause delays and
increase the uncertainty of project
approvals;
|
|
·
|
difficulty
in staffing and managing widespread
operations;
|
|
·
|
difficulty
in repatriating earnings;
|
Page
22
|
·
|
difficulty
in negotiating a successful collective bargaining agreement in France or
other jurisdictions;
|
|
·
|
trade
barriers such as export requirements, tariffs, taxes, local content
requirements and other restrictions and expenses, which could increase the
price of our solar modules and make us less competitive in some
countries; and
|
|
·
|
difficulty
of and costs relating to compliance with the different commercial and
legal requirements of the overseas countries in which we offer and sell
our solar modules.
|
Our
business in foreign markets requires us to respond to rapid changes in market
conditions in these countries. Our overall success as a global business depends,
in part, on our ability to succeed in differing legal, regulatory, economic,
social and political conditions. We may not be able to develop and implement
policies and strategies that will be effective in each location where we do
business.
Risks
Related to Our Systems Business
Project
development or construction activities may not be successful and projects under
development may not receive required permits or construction may not commence as
scheduled, which could increase our costs and impair our ability to recover our
investments.
The
development and construction of solar power electric generation facilities and
other energy infrastructure projects involve numerous risks. We may be required
to spend significant sums for preliminary engineering, permitting, legal, and
other expenses before we can determine whether a project is feasible,
economically attractive or capable of being built. Success in developing a
particular project is contingent upon, among other things:
|
·
|
negotiation
of satisfactory engineering, procurement and construction
agreements;
|
|
·
|
receipt
of required governmental permits and approvals, including the right to
interconnect to the electric grid;
|
|
·
|
payment
of interconnection and other deposits (some of which are
non-refundable);
|
|
·
|
obtaining
construction financing; and
|
|
·
|
timely
implementation and satisfactory completion of
construction.
|
Successful
completion of a particular project may be adversely affected by numerous
factors, including:
|
·
|
delays
in obtaining required governmental permits and
approvals;
|
|
·
|
uncertainties
relating to land costs for projects on land subject to Bureau of Land
Management procedures;
|
|
·
|
unforeseen
engineering problems;
|
|
·
|
construction
delays and contractor performance
shortfalls;
|
Page
23
|
·
|
work
stoppages;
|
|
·
|
cost
over-runs
|
|
·
|
equipment
and materials supply;
|
|
·
|
adverse
weather conditions; and
|
|
·
|
environmental
and geological conditions.
|
If
we are unable to complete the development of a solar power facility, or fail to
meet one or more agreed target construction milestone dates, we may be subject
to liquidated damages and/or penalties under the EPC agreement or other
agreements relating to the project, and we typically will not be able to recover
our investment in the project. Some of these investments are included as assets
on our balance under the line item “project assets.” If we are unable to
complete the development of a solar power project, we may write-down or
write-off some or all of these capitalized investments, which would have an
adverse impact on our net income in the period in which the loss is recognized.
In 2010, we expect to invest a significant amount of capital to develop projects
owned by us or third parties.
We
may enter into fixed price EPC contracts in which we act as the general
contractor for our customers in connection with the installation of our solar
power systems. All essential costs are estimated at the time of entering into
the EPC contract for a particular project, and these are reflected in the
overall price that we charge our customers for the project. These cost estimates
are preliminary and may or may not be covered by contracts between us or the
subcontractors, suppliers and other parties to the project. In addition, we
require qualified, licensed subcontractors to install most of our systems.
Shortages of such skilled labor could significantly delay a project or otherwise
increase our costs. Should miscalculations in planning a project or delays in
execution occur and we are unable to increase commensurately the EPC sales
price, we may not achieve our expected margins or we may be required to
record a loss in the relevant fiscal period.
We
may be unable to acquire or lease land and/or obtain the approvals, licenses and
permits necessary to build and operate PV power plants in a timely and cost
effective manner, and regulatory agencies, local communities or labor unions may
delay, prevent or increase the cost of construction and operation of the PV
plants we intend to build.
In
order to construct and operate our PV plants, we need to acquire or lease land
and obtain all necessary local, county, state and federal approvals, licenses
and permits. We may be unable to acquire the land or lease interests needed, may
not receive or retain the requisite approvals, permits and licenses or may
encounter other problems which could delay or prevent us from successfully
constructing and operating PV plants. For instance, the California Independent
System Operator has recently modified its transmission interconnection rules,
phasing out a serial process in favor of a cluster process for new projects,
and may further modify its rules in a manner that could negatively impact
our favorable position in transmission queues. Certain of our California
projects under development will remain subject to the serial process while other
projects in earlier stages of development, as well as new projects on a
going-forward basis, will be subject to the cluster process. Although the
transition to the cluster process is still evolving and its ultimate impact is
not yet fully known, our project transmission cost could be materially higher
than previously estimated under the serial process and our projects could be
delayed or subject to transmission planning timing uncertainties. We also may be
required to post interconnection deposits (which may not be refundable) sooner
than previously estimated under the serial process.
Many
of our proposed PV plants are located on or require access through public lands
administered by federal and state agencies pursuant to competitive public
leasing and right-of-way procedures and processes. The authorization for the
use, construction and operation of PV plants and associated transmission
facilities on federal, state and private lands will also require the assessment
and evaluation of mineral rights, private rights-of-way and other easements;
environmental, agricultural, cultural, recreational and aesthetic impacts; and
the likely mitigation of adverse impacts to these and other resources and uses.
The inability to obtain the required permits and, potentially, excessive delay
in obtaining such permits due, for example, to litigation, could prevent us from
successfully constructing and operating PV plants and could result in a
potential forfeiture of any deposit we have made with respect to a given
project. Moreover, project approvals subject to project modifications and
conditions, including mitigation requirements and costs, could affect the
financial success of a given project.
In
addition, local labor unions may increase the cost of, and/or lower the
productivity of, project development in Canada and California.
In
China our projects are subject to a number of government approvals, including
the approval of a pre-feasibility and feasibility study. Individually, the
pre-feasibility and feasibility study require many different government
approvals at the national, provincial and local levels, and the approval process
is discretionary and not fully transparent.
Page
24
Lack
of transmission capacity availability, potential upgrade costs to the
transmission grid and other systems constraints could significantly impact our
ability to build PV plants and generate solar electricity power
sales.
In order to deliver electricity from
our PV plants to our customers, our projects need to connect to the transmission
grid. The lack of available capacity on the transmission grid could
substantially impact our projects and cause reductions in project size, delays
in project implementation, increases in costs from transmission upgrades and
potential forfeitures of any deposit we have made with respect to a given
project. These transmission issues, as well as issues relating to the
availability of large systems such as transformers and switch gear, could
significantly impact our ability to build PV plants and generate solar
electricity sales.
Our
systems business is largely dependent on us and third parties arranging
financing from various sources, which may not be available or may only be
available on unfavorable terms or in insufficient amounts.
The
construction of our large utility-scale solar power projects under development
by us is expected in many cases to require project financing, including
non-recourse project debt financing in the bank loan market and institutional
debt capital markets. Uncertainties exist as to whether our projects will be
able to access the debt markets in a sufficient magnitude to finance their
construction. If we are unable to arrange such financing or if it is only
available on unfavorable terms, we may be unable to fully execute our systems
business plan. In addition, we generally expect to sell our projects by raising
project equity capital from tax oriented, strategic industry and other equity
investors. Such equity sources may not be available or may only be available in
insufficient amounts, in which case our ability to sell our projects may be
delayed or limited and our business, financial condition or results of
operations may be adversely affected.
In
addition, for projects in which we provide EPC services but are not the project
developer, our EPC activities are in many cases dependent on the ability of
third parties to purchase our PV plant projects, which, in turn, is dependent on
their ability to obtain financing for such purchases. Depending on prevailing
conditions in the credit markets and other factors, such financing may not be
available or may only be available on unfavorable terms or in insufficient
amounts. If third parties are limited in their ability to access financing to
support their purchase of PV power plant projects from us, we may not realize
the cash flows that we expect from such sales, and this could adversely affect
our ability to invest in our business and/or generate revenue. See also the risk
factor above entitled “
An
increase in interest rates or lending rates or tightening of the supply of
capital in the global financial markets (including a reduction in total tax
equity availability) could make it difficult for end-users to finance the cost
of a PV system and could reduce the demand for our solar modules and/or lead to
a reduction in the average selling price for photovoltaic
modules.
”
Developing
solar power projects may require significant upfront investment prior to the
signing of a power purchase agreement or an EPC contract, which could adversely
affect our business and results of operations.
Our
solar power project development cycles, which span the time between the
identification of land and the commercial operation of a PV power plant project,
vary substantially and can take many months or years to mature. As a result of
these long project cycles, we may need to make significant upfront investments
of resources (including, for example, large transmission deposits or other
payments, which may be non-refundable) in advance of the signing of PPAs and EPC
contracts and the receipt of any revenue, much of which is not recognized for
several additional months or years following contract signing. Our potential
inability to enter into sales contracts with potential customers after making
such upfront investments could adversely affect our business and results of
operations.
Our
liquidity may be adversely affected to the extent the project sale market
weakens and we are unable to sell our solar projects on pricing, terms and
timing commercially acceptable to us.
Other
Risks
We
may not realize the anticipated benefits of past or future acquisitions, and
integration of these acquisitions may disrupt our business and
management.
In
April 2009, we acquired the solar power project development business of
OptiSolar Inc. and in the future, we may acquire additional companies, project
pipelines, products or technologies or enter into joint ventures or other
strategic initiatives. We may not realize the anticipated benefits of an
acquisition and each acquisition has numerous risks. These risks include the
following:
|
·
|
difficulty
in assimilating the operations and personnel of the acquired
company;
|
Page
25
|
·
|
difficulty
in effectively integrating the acquired technologies or products with our
current products and technologies;
|
|
·
|
difficulty
in maintaining controls, procedures and policies during the transition and
integration;
|
|
·
|
disruption
of our ongoing business and distraction of our management and associates
from other opportunities and challenges due to integration
issues;
|
|
·
|
difficulty
integrating the acquired company’s accounting, management information and
other administrative systems;
|
|
·
|
inability
to retain key technical and managerial personnel of the acquired
business;
|
|
·
|
inability
to retain key customers, vendors and other business partners of the
acquired business;
|
|
·
|
inability
to achieve the financial and strategic goals for the acquired and combined
businesses;
|
|
·
|
incurring
acquisition-related costs or amortization costs for acquired intangible
assets that could impact our operating
results;
|
|
·
|
potential
impairment of our relationships with our associates, customers, partners,
distributors or third party providers of technology or
products;
|
|
·
|
potential
failure of the due diligence processes to identify significant issues with
product quality, architecture and development or legal and financial
liabilities, among other things;
|
|
·
|
potential
inability to assert that internal controls over financial reporting are
effective;
|
|
·
|
potential
inability to obtain, or obtain in a timely manner, approvals from
governmental authorities, which could delay or prevent such
acquisitions; and
|
|
·
|
potential
delay in customer purchasing decisions due to uncertainty about the
direction of our product offerings.
|
Mergers
and acquisitions of companies are inherently risky, and ultimately, if we do not
complete the integration of acquired businesses successfully and in a timely
manner, we may not realize the anticipated benefits of the acquisitions to the
extent anticipated, which could adversely affect our business, financial
condition or results of operations.
Our
future success depends on our ability to retain our key associates and to
successfully integrate them into our management team.
We
are dependent on the services of Michael J. Ahearn, our Executive Chairman,
Robert J. Gillette, our Chief Executive Officer, Bruce Sohn, our President, Jens
Meyerhoff, our Chief Financial Officer, Mary Beth Gustafsson, our Executive Vice
President, General Counsel and Corporate Secretary, Carol Campbell, our
Executive Vice President, Human Resources, TK Kallenbach, our Executive Vice
President, Marketing and Product Management, David Eaglesham, our Chief
Technology Officer, and James Zhu, our Chief Accounting Officer and other
members of our senior management team. The loss of Ahearn, Gillette, Sohn,
Meyerhoff, Gustafsson, Campbell, Kallenbach, Eaglesham, Zhu or any other member
of our senior management team could have a material adverse effect on us. There
is a risk that we will not be able to retain or replace these key associates.
Several of our current key associates, including Ahearn, Gillette, Sohn,
Meyerhoff, Gustafsson, Campbell, Kallenbach, Eaglesham and Zhu are subject to
employment conditions or arrangements that contain post-employment
non-competition provisions. However, these arrangements permit the associates to
terminate their employment with us upon little or no notice and the
enforceability of the non-competition provisions is uncertain.
Page
26
If
we are unable to attract, train and retain key personnel, our business may be
materially and adversely affected.
Our
future success depends, to a significant extent, on our ability to attract,
train and retain management, operations and technical personnel. Recruiting and
retaining capable personnel, particularly those with expertise in the
photovoltaic industry and thin film technology, are vital to our success. There
is substantial competition for qualified technical personnel and there can be no
assurance that we will be able to attract or retain our technical personnel. If
we are unable to attract and retain qualified associates, our business may be
materially and adversely affected.
We
may be exposed to infringement or misappropriation claims by third parties,
which, if determined adversely to us, could cause us to pay significant damage
awards or prohibit us from the manufacture and sale of our solar modules or the
use of our technology.
Our
success depends largely on our ability to use and develop our technology and
know-how without infringing or misappropriating the intellectual property rights
of third parties. The validity and scope of claims relating to photovoltaic
technology patents involve complex scientific, legal and factual considerations
and analysis and, therefore, may be highly uncertain. We may be subject to
litigation involving claims of patent infringement or violation of intellectual
property rights of third parties. The defense and prosecution of intellectual
property suits, patent opposition proceedings and related legal and
administrative proceedings can be both costly and time consuming and may
significantly divert the efforts and resources of our technical and management
personnel. An adverse determination in any such litigation or proceedings to
which we may become a party could subject us to significant liability to third
parties, require us to seek licenses from third parties, which may not be
available on reasonable terms, or at all, or pay ongoing royalties, require us
to redesign our solar module, or subject us to injunctions prohibiting the
manufacture and sale of our solar modules or the use of our technologies.
Protracted litigation could also result in our customers or potential customers
deferring or limiting their purchase or use of our solar modules until the
resolution of such litigation.
Currency
translation and transaction risk may negatively affect our net sales, cost of
sales and gross margins and could result in exchange losses.
Although
our reporting currency is the U.S. dollar, we conduct our business and
incur costs in the local currency of most countries in which we operate. As a
result, we are subject to currency translation and transaction risk. For
example, 86% and 95% of our net sales were denominated in euro for the years
ended December 26, 2009 and December 27, 2008, respectively, and we expect
a large percentage of our net sales to be outside the United States and
denominated in foreign currencies in the future. In addition, our operating
expenses for our plants located outside the U.S. (currently Germany and
Malaysia) and our operations for our systems business in Canada and other
European countries will be denominated in the local currency. Changes in
exchange rates between foreign currencies and the U.S. dollar could affect
our net sales and cost of sales and could result in exchange gains or losses.
For example, the weakening of the euro reduced our net sales by $116.1 million
during fiscal 2009 compared with fiscal 2008. In addition, we incur currency
transaction risk whenever one of our operating subsidiaries enters into either a
purchase or a sales transaction using a different currency from our reporting
currency. For example, our European Long-Term Supply Contracts specify fixed
pricing in euros through 2012 and do not adjust for changes in the
U.S. dollar to euro exchange rate. We cannot accurately predict the impact
of future exchange rate fluctuations on our results of operations.
We
could also expand our business into emerging markets, many of which have an
uncertain regulatory environment relating to currency policy. Conducting
business in such emerging markets could cause our exposure to changes in
exchange rates to increase.
Our
ability to hedge foreign currency exposure is dependent on our credit profile
with the banks that are willing and able to do business with us. Deterioration
in our credit position or a significant tightening of the credit market
conditions could limit our ability to hedge our foreign currency exposure; and
therefore, result in exchange losses.
The
Estate of John T. Walton and its affiliates have significant control over us and
their interests may conflict with or differ from interests of other
stockholders.
Our
largest stockholder, the Estate of John T. Walton and its affiliates, including
JCL Holdings, LLC and JTW Trust No. 1 UAD 9/19/02 (collectively, the Estate),
owned approximately 35% of our outstanding common stock at December 31,
2009. As a result, the Estate has substantial influence over all matters
requiring stockholder approval, including the election of our directors and the
approval of significant corporate transactions such as mergers, tender offers
and the sale of all or substantially all of our assets. The interests of the
Estate could conflict with or differ from interests of other stockholders. For
example, the concentration of ownership held by the Estate could delay, defer or
prevent a change of control of our company or impede a merger, takeover or other
business combination which a majority of stockholders may view
favorably.
If
our goodwill, investment in a related party or project assets become impaired,
we may be required to record a significant charge to earnings.
We
may be required to record a significant charge to earnings in our financial
statements should we determine that our goodwill, investment in a related party
or project assets are impaired. Such a charge might have a significant impact on
our financial position and results of operations.
Page
27
As
required by accounting rules, we review our goodwill, investment in a related
party and project assets for impairment when events or changes in our business
or circumstances indicate that their fair value might be less than their
carrying value. Factors that may be considered a change in circumstances
indicating that the carrying value of our goodwill might not be recoverable
include a significant decline in our stock price and market capitalization, a
significant decline in projections of future cash flows and significantly slower
growth rates in our industry. We are also required to test goodwill for
impairment at least annually. We would write down project assets, which are
capitalized on the balance sheet for certain solar power projects, should we
determine that the project is not commercially viable.
Unanticipated
changes in our tax provisions, the adoption of a new U.S. tax legislation or
exposure to additional income tax liabilities could affect our
profitability.
We
are subject to income taxes in the United States and the foreign jurisdictions
in which we operate. Our tax liabilities are affected by the amounts we charge
for inventory, services, licenses, funding and other items in intercompany
transactions. We are subject to potential tax examinations in these various
jurisdictions. Tax authorities may disagree with our intercompany charges,
cross-jurisdictional transfer pricing or other tax positions and assess
additional taxes. We regularly assess the likely outcomes of these examinations
in order to determine the appropriateness of our tax provision. However, there
can be no assurance that we will accurately predict the outcomes of these
potential examinations, and the amounts ultimately paid upon resolution of
examinations could be materially different from the amounts previously included
in our income tax expense and therefore could have a material impact on our tax
provision, net income and cash flows. In addition, our future effective tax rate
could be adversely affected by changes to our operating structure, loss of our
Malaysian tax holiday, changes in the mix of earnings in countries with tax
holidays or differing statutory tax rates, changes in the valuation of deferred
tax assets and liabilities, changes in tax laws and the discovery of new
information in the course of our tax return preparation process. In addition,
President Obama's administration has recently announced proposals for new
U.S. tax legislation that, if adopted, could adversely affect our tax rate. Any
of these changes could affect our results of operations.
Our
credit agreements contain covenant restrictions that may limit our ability to
operate our business.
We
may be unable to respond to changes in business and economic conditions, engage
in transactions that might otherwise be beneficial to us, and obtain additional
financing, if needed, because our revolving credit agreement with JPMorgan Chase
and our Malaysian facility agreement contain, and any of our other future debt
agreements may contain, covenant restrictions that limit our ability to, among
other things:
|
·
|
incur
additional debt, assume obligations in connection with letters of credit,
or issue guarantees;
|
|
·
|
create
liens;
|
|
·
|
enter
into certain transactions with our
affiliates;
|
|
·
|
sell
certain assets; and
|
|
·
|
declare
or pay dividends, make other distributions to stockholders or make other
restricted payments.
|
Under
our revolving credit facility with JPMorgan Chase and our Malaysian facility
agreement, we are also subject to certain financial condition covenants. Our
ability to comply with covenants under our credit agreements is dependent on our
future performance, which will be subject to many factors, some of which are
beyond our control, including prevailing economic conditions. In addition, our
failure to comply with these covenants could result in a default under these
agreements and any of our other future debt agreements, which could permit the
holders thereof to accelerate such debt. If any of our debt is accelerated, we
may in the future not have sufficient funds available to repay such debt, which
could materially and negatively affect our financial condition and results of
operation.
None.
Page
28
As
of February 12, 2010, our principal properties consisted of the
following:
|
Nature
|
Number
of Production Lines
|
Location
|
Held
|
Major
Encumbrances
|
||||
|
Manufacturing
Plant
|
3
|
Perrysburg,
Ohio, United States
|
Own
|
State
of Ohio Loan (1)
|
||||
|
Manufacturing
Plant
|
4
|
Frankfurt/Oder,
Germany
|
Own
|
None
|
||||
|
Manufacturing
Plants
|
16
|
Kulim,
Kedah, Malaysia
|
Lease
Land/
Own
Buildings
|
n/a
|
||||
|
Corporate
Headquarters
|
n/a
|
Tempe,
Arizona, United States
|
Lease
|
n/a
|
||||
|
Administrative
Office
|
n/a
|
Oakland,
California, United States
|
Lease
|
n/a
|
||||
|
Administrative
Office
|
n/a
|
Bridgewater,
New Jersey, United States
|
Lease
|
n/a
|
||||
|
Administrative
Office
|
n/a
|
New
York, New York, United States
|
Lease
|
n/a
|
||||
|
Administrative
Office
|
n/a
|
Mainz,
Germany
|
Lease
|
n/a
|
|
(1)
|
See
Note 13. “Debt” to our consolidated financial statements for additional
information.
|
In
addition, we lease office space in several other U.S. and international
locations.
As
of February 12, 2010, all of our manufacturing plants are at full productive
capacity and operate 24 hours a day, seven days a week. In the first quarter of
2010, we expect to complete the addition of one production line to our
Perrysburg, Ohio manufacturing facility, after which time our 24 production
lines will have an annual global manufacturing capacity of 1.3GW, assuming the
fourth quarter of 2009 average per line run rate. We can increase annual
production by increasing current factory throughput and expanding or adding new
factories. On July 23, 2009, we announced a venture to build France's largest
solar panel manufacturing plant. The plant will have an initial annual capacity
of more than 100MWp and is projected to be at full production by the first
quarter of 2012. On December 16, 2009, we announced plans to invest $365.0
million to add eight production lines at our manufacturing center in
Kulim, Malaysia, starting production in the first half of 2011. These
expansions, once completed will increase our manufacturing capacity to 34
production lines, or 1.8GW of annual capacity at the fourth quarter of 2009
average per line run rate at our existing plants.
General
In
the ordinary conduct of our business, we are subject to periodic lawsuits,
investigations and claims, including, but not limited to, routine employment
matters. Although we cannot predict with certainty the ultimate resolution of
lawsuits, investigations and claims asserted against us, we do not believe that
any currently pending legal proceeding to which we are a party will have a
material adverse effect on our business, results of operations, cash flows or
financial condition.
None.
Page
29
Price
Range of Common Stock
Our
common stock has been listed on The NASDAQ Global Select Market under the symbol
“FSLR” since November 17, 2006. Prior to this time, there was no public
market for our common stock. The following table sets forth the range of high
and low sales prices per share as reported on The NASDAQ Global Select Market
for the periods indicated.
|
|
High
|
Low
|
||||||
|
Fiscal
Year 2009
|
||||||||
|
First
Quarter
|
$ | 165.20 | $ | 100.90 | ||||
|
Second
Quarter
|
207.51 | 129.78 | ||||||
|
Third
Quarter
|
176.05 | 112.09 | ||||||
|
Fourth
Quarter
|
162.20 | 115.09 | ||||||
|
Fiscal
Year 2008
|
||||||||
|
First
Quarter
|
$ | 273.73 | $ | 143.31 | ||||
|
Second
Quarter
|
317.00 | 225.82 | ||||||
|
Third
Quarter
|
301.30 | 186.82 | ||||||
|
Fourth
Quarter
|
202.93 | 85.28 | ||||||
The
closing sales price of our common stock on The NASDAQ Global Select Market was
$115.10 per share on February 12, 2010. As of February 12, 2010 there were 60
record holders of our common stock. This figure does not reflect the beneficial
ownership of shares held in nominee names.
Dividend
Policy
We
have never paid, and it is our present intention for the foreseeable future not
to pay, dividends on our common stock. Our revolving credit facility imposes
restrictions on our ability to declare or pay dividends. The declaration and
payment of dividends is subject to the discretion of our board of directors and
depends on various factors, including the continued applicability of the
above-referenced restrictions under our revolving credit facility, our net
income, financial condition, cash requirements, future prospects and other
factors deemed relevant by our board of directors.
Page
30
Equity
Compensation Plans
The
following table sets forth certain information, as of December 26, 2009,
concerning securities authorized for issuance under all equity compensation
plans of our company:
|
Plan
Category
|
Number
of Securities
to
be Issued
Upon
Exercise of
Outstanding
Options
and
Rights(a)(1)
|
Weighted-Average
Exercise
Price of
Outstanding
Options
and
Rights(b)(2)
|
Number
of Securities
Remaining
Available
for
Future Issuance
Under
Equity
Compensation
Plans
(Excluding Securities
Reflected
in Column(a))(c)
|
|||||||||
|
Equity
compensation plans approved by our stockholders (3)
|
2,104,939 | $ | 60.63 | 4,705,302 | ||||||||
|
Equity
compensation plans not approved by our stockholders
|
— | — | — | |||||||||
|
Total
|
2,104,939 | $ | 60.63 | 4,705,302 | ||||||||
|
(1)
|
Includes
1,126,238 shares issuable upon vesting of RSUs granted under the 2006
Omnibus Incentive Compensation Plan. The remaining balance consists of
outstanding stock option grants.
|
|
(2)
|
The
weighted average exercise price does not take into account the shares
issuable upon vesting of outstanding RSUs, which have no exercise
price.
|
|
(3)
|
Includes
our 2003 Unit Option Plan and 2006 Omnibus Incentive Compensation
Plan.
|
Stock
Price Performance Graph
The
following graph compares the cumulative 37-month total return on our common
stock with the cumulative total returns of the S&P 500 Index and a peer
group consisting of six comparable issuers: SunPower Corporation, Suntech Power
Holdings Co., Ltd., Trina Solar Ltd., Yingli Green Energy Hold. Co. Ltd.,
SolarWorld AG and Q-Cells AG. We believe that a peer group consisting of
comparable issuers is more representative of the solar industry as a whole, and
we will therefore discontinue comparison against the NASDAQ Clean Edge Green
Energy U.S. Index in future filings (formerly known as the NASDAQ Clean
Edge U.S. Liquid Series Index). Also, in light of our addition to the
S&P 500 Index during 2009, our exclusive comparative broad market index will
be the S&P 500 Index, and we will therefore discontinue comparison against
the Russell 2000 Index in future filings. In the stock price performance graph
included below, an investment of $100 (with reinvestment of all dividends) is
assumed to have been made in our common stock and in each index on
November 17, 2006 and its relative performance is tracked through
December 26, 2009. No cash dividends have been declared on shares of our
common stock. This performance graph is not “soliciting material,” is not deemed
filed with the SEC and is not to be incorporated by reference in any filing by
us under the Securities Act of 1933, as amended (the “Securities Act”), or the
Exchange Act, whether made before or after the date hereof and irrespective of
any general incorporation language in any such filing. The stock price
performance shown on the graph represents past performance and should not be
considered an indication of future price performance.
Page
31
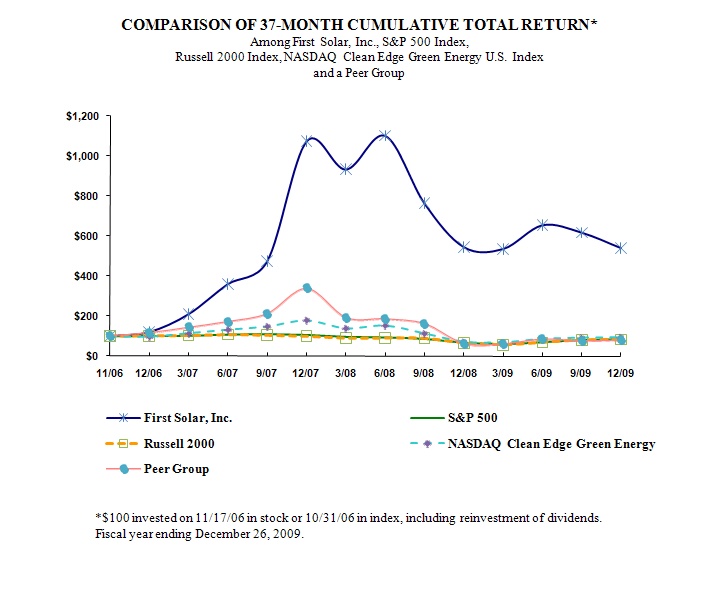
| 11/06 | 12/06 | 3/07 | 6/07 | 9/07 | 12/07 | 3/08 | 6/08 | 9/08 | 12/08 | 3/09 | 6/09 | 9/09 | 12/09 | |||||||||||||||||||||||||||||||||||||||||||
|
First
Solar, Inc.
|
100.00 | 120.61 | 210.23 | 360.91 | 475.91 | 1079.79 | 934.28 | 1102.75 | 763.58 | 545.72 | 536.38 | 655.30 | 617.87 | 540.82 | ||||||||||||||||||||||||||||||||||||||||||
|
S&P
500
|
100.00 | 101.40 | 102.05 | 108.46 | 110.66 | 106.97 | 96.87 | 94.23 | 86.34 | 67.40 | 59.97 | 69.53 | 80.38 | 85.23 | ||||||||||||||||||||||||||||||||||||||||||
|
Russell
2000
|
100.00 | 100.33 | 102.29 | 106.80 | 103.50 | 98.76 | 88.99 | 89.51 | 88.51 | 65.39 | 55.62 | 67.12 | 80.06 | 83.16 | ||||||||||||||||||||||||||||||||||||||||||
|
NASDAQ
Clean Edge Green Energy
|
100.00 | 96.90 | 114.68 | 132.73 | 149.31 | 180.39 | 139.71 | 154.07 | 113.28 | 70.75 | 67.77 | 85.64 | 91.69 | 94.33 | ||||||||||||||||||||||||||||||||||||||||||
|
Peer
Group
|
100.00 | 116.03 | 142.79 | 172.08 | 212.03 | 337.73 | 191.78 | 185.18 | 161.13 | 61.63 | 59.43 | 83.75 | 74.93 | 79.33 |
The stock price performance included
in this graph is not necessarily indicative of
future stock price
performance.
Page
32
As
previously reported in a Current Report on Form 8-K filed with the Securities
and Exchange Commission on April 9, 2009, on April 3, 2009, we completed the
acquisition of the solar power project development business (the Project
Business) of OptiSolar Inc., a Delaware corporation (OptiSolar). Pursuant to an
Agreement and Plan of Merger (the Merger Agreement) dated as of March 2, 2009 by
and among First Solar, First Solar Acquisition Corp., a Delaware corporation
(Merger Sub), OptiSolar and OptiSolar Holdings LLC, a Delaware limited liability
company (OptiSolar Holdings), Merger Sub merged with and into OptiSolar, with
OptiSolar surviving as a wholly-owned subsidiary of First Solar (the Merger).
Pursuant to the Merger, all the outstanding shares of common stock of OptiSolar
held by OptiSolar Holdings were exchanged for the Merger Shares. The Merger
Shares consisted of 2,972,420 shares of First Solar common stock, par value
$0.001 per share, including (i) 732,789 shares that have been issued and
deposited with an escrow agent to support certain indemnification obligations of
OptiSolar Holdings, and (ii) 355,096 shares that were issuable upon satisfaction
of conditions relating to the satisfaction of certain then existing liabilities
of OptiSolar (the Holdback Shares). The Merger Shares and certain Holdback
Shares were issued, and any remaining Holdback Shares will be issued in a
private placement exempt from registration pursuant to Section 4(2) of the
Securities Act of 1933, as amended. First Solar has prepared and filed with the
Securities and Exchange Commission a registration statement under the Securities
Act covering the resale of 2,801,435 of the Merger Shares.
As
of December 26, 2009, 333,932 Holdback Shares had been issued to OptiSolar
Holdings and a total of 2,951,256 Merger Shares had been issued. The period
during which claims for indemnification from the escrow fund may be initiated
commenced on April 3, 2009, and will end on April 3,
2011.
Purchases
of Equity Securities by the Issuer and Affiliate Purchases
None.
Page
33
The
following table sets forth our selected consolidated financial data for the
periods and at the dates indicated.
The
selected consolidated financial information for the fiscal years ended
December 26, 2009, December 27, 2008, and December 29, 2007 have
been derived from the audited consolidated financial statements included
elsewhere in this Annual Report on Form 10-K. The selected consolidated
financial data for the fiscal years ended December 30, 2006 and
December 31, 2005 have been derived from audited consolidated financial
statements not included in this Annual Report on Form 10-K. The information
presented below should be read in conjunction with “Item 7: Management’s
Discussion and Analysis of Financial Condition and Results of Operations” and
our consolidated financial statements and the related notes.
|
Years
Ended
|
||||||||||||||||||||
|
|
Dec 26,
2009
|
Dec 27,
2008
|
Dec 29,
2007
|
Dec 30,
2006
|
Dec 31,
2005
|
|||||||||||||||
|
(In
thousands, except per share amounts)
|
||||||||||||||||||||
|
Statement
of Operations:
|
||||||||||||||||||||
|
Net
sales
|
$ | 2,066,200 | $ | 1,246,301 | $ | 503,976 | $ | 134,974 | $ | 48,063 | ||||||||||
|
Cost
of sales
|
1,021,618 | 567,908 | 252,573 | 80,730 | 31,483 | |||||||||||||||
|
Gross
profit
|
1,044,582 | 678,393 | 251,403 | 54,244 | 16,580 | |||||||||||||||
|
Research
and development
|
78,161 | 33,517 | 15,107 | 6,361 | 2,372 | |||||||||||||||
|
Selling,
general and administrative
|
272,898 | 174,039 | 82,248 | 33,348 | 15,825 | |||||||||||||||
|
Production
start-up
|
13,908 | 32,498 | 16,867 | 11,725 | 3,173 | |||||||||||||||
|
Operating
income (loss)
|
679,615 | 438,339 | 137,181 | 2,810 | (4,790 | ) | ||||||||||||||
|
Foreign
currency gain (loss)
|
5,207 | 5,722 | 1,881 | 5,544 | (1,715 | ) | ||||||||||||||
|
Interest
income
|
9,735 | 21,158 | 20,413 | 2,648 | 316 | |||||||||||||||
|
Interest
expense, net
|
(5,258 | ) | (509 | ) | (2,294 | ) | (1,023 | ) | (418 | ) | ||||||||||
|
Other
expense, net
|
(2,985 | ) | (934 | ) | (1,219 | ) | (799 | ) | 56 | |||||||||||
|
Income
tax expense (benefit)
|
46,176 | 115,446 | (2,392 | ) | 5,206 | — | ||||||||||||||
|
Income
(loss) before cumulative effect of change in accounting
principle
|
640,138 | 348,330 | 158,354 | 3,974 | (6,551 | ) | ||||||||||||||
|
Cumulative
effect of change in accounting for share-based
compensation
|
— | — | — | — | 89 | |||||||||||||||
|
Net
income (loss)
|
$ | 640,138 | $ | 348,330 | $ | 158,354 | $ | 3,974 | $ | (6,462 | ) | |||||||||
|
Net
income (loss) per share data:
|
||||||||||||||||||||
|
Basic
net income (loss) per share:
|
||||||||||||||||||||
|
Net
income (loss) per share
|
$ | 7.67 | $ | 4.34 | $ | 2.12 | $ | 0.07 | $ | (0.13 | ) | |||||||||
|
Weighted
average shares
|
83,500 | 80,178 | 74,701 | 56,310 | 48,846 | |||||||||||||||
|
Diluted
net income (loss) per share:
|
||||||||||||||||||||
|
Net
income (loss) per share
|
$ | 7.53 | $ | 4.24 | $ | 2.03 | $ | 0.07 | $ | (0.13 | ) | |||||||||
|
Weighted
average shares
|
85,044 | 82,124 | 77,971 | 58,255 | 48,846 | |||||||||||||||
|
Cash
dividends declared per common share
|
$ | — | $ | — | $ | — | $ | — | $ | — | ||||||||||
|
Years
Ended
|
||||||||||||||||||||
|
|
Dec 26,
2009
|
Dec 27,
2008
|
Dec 29,
2007
|
Dec 30,
2006
|
Dec 31,
2005
|
|||||||||||||||
|
(In
thousands)
|
||||||||||||||||||||
|
Cash
Flow Data:
|
||||||||||||||||||||
|
Net
cash provided by (used in) operating activities
|
$ | 675,193 | $ | 463,067 | $ | 205,951 | $ | (576 | ) | $ | 5,040 | |||||||||
|
Net
cash used in investing activities
|
(701,690 | ) | (308,441 | ) | (547,250 | ) | (159,994 | ) | (43,832 | ) | ||||||||||
|
Net
cash (used in) provided by financing activities
|
(22,021 | ) | 177,549 | 430,421 | 451,550 | 51,663 | ||||||||||||||
Page
34
|
Years
Ended
|
||||||||||||||||||||
|
|
Dec 26,
2009
|
Dec 27,
2008
|
Dec 29,
2007
|
Dec 30,
2006
|
Dec 31,
2005
|
|||||||||||||||
|
(In
thousands)
|
||||||||||||||||||||
|
Balance
Sheet Data:
|
||||||||||||||||||||
|
Cash
and cash equivalents
|
$ | 664,499 | $ | 716,218 | $ | 404,264 | $ | 308,092 | $ | 16,721 | ||||||||||
|
Marketable
securities, current and noncurrent
|
449,844 | 105,601 | 265,399 | 323 | 312 | |||||||||||||||
|
Accounts
receivable, net
|
226,826 | 61,703 | 18,165 | 27,123 | 882 | |||||||||||||||
|
Inventories,
current and noncurrent
|
174,516 | 121,554 | 40,204 | 16,510 | 6,917 | |||||||||||||||
|
Property,
plant and equipment, net
|
988,782 | 842,622 | 430,104 | 178,868 | 73,778 | |||||||||||||||
|
Project
assets, current and noncurrent
|
132,496 | — | — | — | — | |||||||||||||||
|
Deferred
tax assets, current and noncurrent
|
152,194 | 71,247 | 55,701 | — | — | |||||||||||||||
|
Total
assets
|
3,349,512 | 2,114,502 | 1,371,312 | 578,510 | 101,884 | |||||||||||||||
|
Long-term
debt
|
174,958 | 198,470 | 108,165 | 80,697 | 48,723 | |||||||||||||||
|
Accrued
collection and recycling liabilities
|
92,799 | 35,238 | 13,079 | 3,724 | 917 | |||||||||||||||
|
Total
liabilities
|
696,725 | 601,460 | 274,045 | 116,844 | 63,490 | |||||||||||||||
|
Total
stockholders’ equity
|
2,652,787 | 1,513,042 | 1,097,267 | 411,440 | 13,129 | |||||||||||||||
The following discussion and
analysis of our financial condition and results of
operations should be read in
conjunction with our consolidated financial statements
and the related notes included
elsewhere in this Annual Report on
Form 10-K. In addition to
historical consolidated financial information,
the following discussion and
analysis contains forward-looking statements that
involve risks, uncertainties, and
assumptions as described under the “Note Regarding
Forward-Looking Statements,” that
appears earlier in this Annual Report on
Form 10-K. Our actual results
could differ materially from those
anticipated by these forward-looking
statements as a result of many factors,
including those discussed under
“Item 1A: Risk Factors” and elsewhere in this
Annual Report on
Form 10-K.
Overview
We
manufacture and sell solar modules with an advanced thin film semiconductor
technology, and we design, construct and sell photovoltaic (PV) solar power
systems.
In
furtherance of our goal of delivering the lowest cost of solar energy and
achieving price parity with conventional fossil-fuel based peak electricity
generation, we are continually focused on reducing PV system costs in three
primary areas: module manufacturing, Balance of System (BoS) costs (consisting
of costs of components of a solar power system other than the solar modules,
including inverters, mounting hardware, grid interconnection equipment, wiring
and other devices, and installation labor costs), and cost of
capital. First, with respect to our module manufacturing costs, our
advanced technology has allowed us to reduce our average module manufacturing
costs to the lowest in the world, based on publicly available information. In
2009, our total average manufacturing costs were $0.87 per watt, which we
believe is significantly less than those of traditional crystalline silicon
solar module manufacturers. By continuing to improve conversion efficiency and
line throughput, lower material cost and drive volume scale to further decrease
overhead costs, we believe that we can further reduce our manufacturing costs
per watt and maintain our cost advantage over traditional crystalline silicon
solar module manufacturers. Second, by continuing to improve conversion
efficiency, leverage volume procurement around standardized hardware platforms,
and accelerate installation time, we believe we can continue to make substantial
reductions in BoS costs, which represent over half of all costs associated with
a typical utility-scale PV solar power system. Finally, we believe that
continuing to strengthen our financial position, including our balance sheet and
credit profile, will enable us to continue to lower the cost of capital
associated with our solar power systems, thereby further enhancing the economic
viability of our projects and lowering the cost of electricity generated by
solar power systems, which incorporate our modules and
technology.
Page
35
We
believe that combining our reliable, low cost module manufacturing capability
with our systems business enables us to more rapidly reduce the price of solar
electricity, to accelerate the adoption of our technology in large scale systems
and to further our mission to create enduring value by enabling a world powered
by clean, affordable solar electricity.
On
February 22, 2006, we were incorporated as a Delaware corporation. Prior to
that date, we operated as a Delaware limited liability company.
Our
fiscal year ends on the Saturday on or before December 31. All references
to fiscal year 2009 relate to the 52 weeks ended December 26, 2009;
all references to fiscal year 2008 relate to the 52 weeks ended
December 27, 2008; and all references to fiscal year 2007 relate to the
52 weeks ended December 29, 2007. We use a 13 week fiscal
quarter.
Manufacturing
Capacity
As
of December 26, 2009, we operated 23 production lines with an annual global
manufacturing capacity of approximately 1228MW (based on the fourth quarter of
2009 average per line run rate at our existing plants) at our manufacturing
plants in Perrysburg, Ohio, Frankfurt/Oder, Germany and Kulim, Malaysia. We
expect to add an additional production line to our Perrysburg, Ohio
manufacturing facility in 2010, resulting in a 53.4MW increase in manufacturing
capacity (based on the fourth quarter of 2009 average per line run rate at our
existing plants). We expect to increase our manufacturing capacity to 34
production lines by 2012, with an annual global manufacturing capacity of
approximately 1.8GW (based on the fourth quarter of 2009 average per line run
rate at our existing plants).
Market
Overview
We
project the global market for PV solar modules to have a 35% compound annual
growth rate through 2012, increasing demand to approximately 12GW
worldwide. We expect approximately 7.5GW of global demand in 2010. In
addressing a growing global need for PV solar electricity, we target markets
with varying approaches depending on the underlying economics, market
requirements and distribution channels. In subsidized feed-in tariff markets,
such as Germany, we have historically sold most of solar modules to solar
project developers, system integrators and independent power producers. In
other markets, such as the United States, the demand for solar has been
primarily driven by renewable portfolio standards requiring regulated utilities
to supply a portion of their total electricity from renewable energy sources
such as solar power. To meet the needs of these markets and enable balance
of system cost reductions, we have developed a fully integrated systems business
that can provide a low-cost turn-key utility-scale PV system solution for system
owners and low cost electricity to utility end-users. By building a fully
integrated systems business, we believe we are in position to expand our
business in transitional, and eventually economically sustainable markets (in
which subsidies or incentives are minimal), that are expected to develop in
areas with abundant solar resources and sizable electricity demand, such as the
United States, China, India and parts of Europe. In the long-term, we plan on
competing on an economic basis with conventional fossil fuel-based peaking power
generation.
In
2009, the solar industry moved from a supply driven to a demand driven
environment, with increasing competitive pressure as the photovoltaic industry’s
total manufacturing capacity to produce solar modules exceeded demand for those
products. We expect that the photovoltaic industry’s total manufacturing
capacity to produce solar modules will continue to exceed demand in 2010. Our
customers faced significant challenges under the prevailing economic conditions,
including tight liquidity and extended cash realization cycles, weakened balance
sheets, constrained working capital, a volatile pricing environment leading to
deferred project equity investments, constrained project finance outside of
Germany and capital preservation within U.S. utilities during the year. We
extended our payment terms with certain customers from 10 days to 45 days from
the date of invoice and reduced prices under our Long-Term Contracts in response
to the economic conditions.
During
the second half of 2009, German installation activity was stronger than in the
first half of 2009, driven by a combination of anticipation of reduced 2010
German feed-in tariffs, seasonal demand, customer participation in our rebate
program and improving project finance, tax equity and corporate finance
conditions. The first half of 2009 in comparison had been characterized by
project and channel competition with aggressive crystalline silicon module
pricing, deferred project equity investment based on anticipation of further
reductions, project debt constraints and delays and construction financing
delays.
To
the extent the challenging conditions mentioned above return as seasonal
strength subsides, our results of operations could be adversely affected by
declines in the selling prices of our modules, decreases in sales volumes of our
modules and/or increases in our solar module inventories. We expect that demand
for our solar modules in Germany in the first half of 2010 will increase due to
the uncertainty around the German subsidies. The German feed-in tariffs are
currently under review by the government and certain proposals under discussion
would further reduce these tariffs in the second quarter and later dates in
2010.
Page
36
In
2009, we continued to expand into certain key transition markets, such as the
United States, within which affordable solar electricity solutions could be
developed and ultimately evolve into economically sustainable markets. Our
acquisition of the project development business of OptiSolar Inc. in April 2009
furthered our development of solar electricity solutions for utility companies
in the United States that are seeking cost-effective renewable energy solutions
for the purpose of meeting renewable portfolio standard requirements. In January
2010, we completed the acquisition of certain assets from Edison Mission Group's
solar project development pipeline consisting of utility-scale solar projects
located primarily on private land in California and the southwestern United
States.
In
the PV module segment, we face intense competition from manufacturers of
crystalline silicon solar modules and other types of solar modules and
photovoltaic systems. Solar module manufacturers compete with one another in
several product performance attributes, including reliability, module cost per
watt and levelized cost of electricity (LCOE), meaning the net present value of
total life cycle costs of the solar power project divided by the quantity of
energy which is expected to be produced over the system’s life. We are the
lowest cost PV module manufacturer in the solar industry, based on publicly
available information, as evidenced by the further reduction in our average
manufacturing cost per watt from $1.23 during 2007 to $0.87 during 2009. This
cost advantage is reflected in the price at which we sell our modules or fully
integrated systems and enables our systems to compete favorably in respect of
their LCOE. Our cost competitiveness is based in large part on our proprietary
technology (which enables conversion efficiency improvements and permits a
continuous highly automated industrial manufacturing process), our scale and our
operational excellence. In addition, our modules use approximately 1% of the
amount of semiconductor material that is used to manufacture traditional
crystalline silicon solar modules. The cost of polysilicon is a significant
driver of the manufacturing cost of crystalline silicon solar modules. The
current spot market price of polysilicon of approximately between $55 and $63
per kilogram (Kg) enables us to remain one of the lowest cost module
manufacturers in the solar industry. However, the timing and rate of decrease in
the cost of silicon feedstock could lead to pricing pressure for solar modules.
Although we are not a crystalline silicon module manufacturer, we estimate based
on industry research and public disclosures of our competitors, that a $10 per
Kg increase or decrease in the price of polysilicon could increase or decrease,
respectively, our competitors’ manufacturing cost per watt by approximately
$0.07. Given the lower conversion efficiency of our modules compared to
crystalline silicon modules, there are higher balance-of-system costs associated
with systems using our modules. Thus, to compete effectively on the basis of
LCOE our modules need to maintain a certain cost advantage per watt compared to
crystalline silicon based modules. Our cost reduction roadmap anticipates
manufacturing cost per watt reductions for our modules of 10% per year. During
the twelve months ended December 26, 2009, we reduced our manufacturing cost per
watt by 19% from our cost per watt in the fourth quarter of fiscal
2008.
While
our modules currently enjoy competitive advantages in these product performance
attributes, there can be no guarantee that these advantages will continue to
exist in the future to the same extent or at all. Any declines in the
competitiveness of our products could result in margin compression, a decline in
average selling prices of our solar modules, erosion in our market share for
modules, a decrease in the rate of revenue growth and/or a decline in overall
revenues. We have taken, and continue to take, several actions to mitigate the
potential impact resulting from competitive pressures, including adjusting our
pricing policies as necessary in core markets to drive module volumes,
continuously making progress along our cost reduction roadmap and focusing our
research and development on increasing the conversion efficiency of our solar
modules.
As
we expand our systems business into transition and sustainable markets, we can
offer value beyond the PV module, reduce our exposure to module-only competition
and provide comprehensive utility-scale photovoltaic systems solutions that
significantly reduce solar electricity costs. Thus, our systems business allows
us to play a more active role than many of our competitors in managing the
demand for, and manufacturing throughput of our solar modules. Finally, we seek
to form and develop strong partner relationships with our customers and continue
to develop our range of offerings, including EPC capabilities and operating and
maintenance services, in order to enhance the competitiveness of systems using
our solar modules.
Financial
Operations Overview
The
following describes certain line items in our statement of operations and some
of the factors that affect our operating results.
Net
Sales
Components
Business
Currently,
the majority of our net sales is generated from the sale of solar modules. We
currently price and sell our solar modules per watt of power. As a result, our
net sales can fluctuate based on our output of sellable watts or price. During
2009, we sold almost all of our solar modules to solar power system project
developers, system integrators and operators headquartered in Germany, France,
Spain and Italy, which either resell our solar modules to end-users or integrate
them into power plants that they own or operate or sell.
Page
37
As
of December 26, 2009, we had Long-Term Supply Contracts for the sale of solar
modules expiring at the end of 2012 with fourteen European solar power system
project developers and system integrators. We also have an agreement expiring in
2013 with a solar power system project developer and system integrator in the
United States, which is a related party. These contracts account for a
significant portion of our planned production over the period from 2010 through
2012, and therefore, will significantly affect our overall financial
performance. We have the right to terminate certain Long-Term Supply Contracts
upon 12 months notice and the payment of a termination fee if we determine
that certain material adverse changes have occurred. In addition, our customers
are entitled to certain remedies in the event of missed deliveries of kilowatt
volume. These delivery commitments are established through rolling four quarter
forecasts that are agreed to with each of the customers within the parameters
established in the Long-Term Supply Contracts and define the specific quantities
to be purchased on a quarterly basis and the schedules of the individual
shipments to be made to the customers. In the case of a late delivery, certain
of our customers are entitled to a maximum charge representing a percentage of
the delinquent revenue. If we do not meet our annual minimum volume shipments,
our customers also have the right to terminate these contracts on a prospective
basis.
Certain
of our Long-Term Supply Contracts require us to deliver solar modules that, in
total, meet or exceed specified minimum average number of watts per module for
the year or specify an annual decline in the sales price per watt under these
contracts. As a result, our profitability could decline if we are unable to
reduce our manufacturing cost per watt by at least the same rate as the
contractual sales prices decrease. Because the sales prices under our Long-Term
Supply Contracts are fixed and have the built-in decline each year, we cannot
pass along any increases in manufacturing costs to these customers. Although we
believe that our total manufacturing costs per watt will decline at the same
rate or more rapidly than our prices under the Long-Term Supply Contracts, our
failure to achieve our manufacturing cost per watt targets could result in a
reduction of our gross profit.
Our
sales prices under the Long-Term Supply Contracts are denominated in euro,
exposing us to risks from currency exchange rate fluctuations. During the year
ended December 26, 2009, 86% of our sales were denominated in euro and subject
to fluctuation in the exchange rate between the euro and
U.S. dollar.
We
have in the past amended pricing and other terms in our Long-Term Supply
Contracts in order to remain competitive, as described below, and we may decide
in the future to further amend these contracts in order to address the highly
competitive environment. For example, during the three months ended March 28,
2009, we amended our Long-Term Supply Contracts with certain customers to
further reduce the sales price per watt under these contracts in 2009 and 2010
in exchange for increases in the volume of solar modules to be delivered under
the contracts. We also extended the payment terms for certain customers under
these contracts from net 10 days to net 45 days to increase liquidity in our
sales channel and to reflect longer module shipment times from our manufacturing
plants in Malaysia.
During
the third quarter of 2009, we amended our Long-Term Supply Contracts with
certain of our customers to implement a program which provides a price rebate to
certain of these customers for solar modules purchased from us. The intent of
this program is to enable our customers to successfully compete in our core
segments in Germany. The rebate program applies a specified rebate rate to solar
modules sold for solar power projects in Germany at the beginning of each
quarter for the upcoming quarter. The rebate program is subject to periodic
review, and we will adjust the rebate rate quarterly upward or downward as
appropriate. The rebate period commenced during the third quarter of 2009 and
terminates at the end of the fourth quarter of 2010. Customers need to meet
certain requirements in order to be eligible for and benefit from this
program.
We
account for rebates as a reduction to the selling price of our solar modules and
therefore as a reduction in revenue. No rebates granted under this program can
be claimed in cash, and all rebates will be applied to reduce outstanding
accounts receivable balances. During the year ended December 26, 2009, we
extended rebates to customers in the amount of €87.1 million ($128.9 million at
an average exchange rate of $1.48/€1.00).
We
also enter into one-time module sale agreements with customers for specific
projects.
Under
our customer contracts we transfer title and risk of loss to the customer and
recognize revenue upon shipment. Our customers do not have extended payment
terms or rights of return under these contracts.
During
2009, principal customers of our components business were Blitzstrom GmbH, EDF
EN Development, Gehrlicher Solar AG, Juwi Solar GmbH, and Phoenix Solar AG.
During 2009, each of these five customers individually accounted for between 10%
and 19% of our component segment’s net sales. All of our other customers
individually accounted for less than 10% of our component business net sales
during the year ended December 26, 2009.
Page
38
Systems
Business
Through
our fully integrated systems business we provide a complete solar power system
solution, which includes project development, EPC services, O&M services
and, when required, project finance.
Net
sales from our systems segment are comprised of the following types of
transactions:
|
Transaction
|
Description
|
|
|
Engineer
and Procure (EP) Contract
|
Design
of a solar electricity generation system for a customer that uses our
solar modules; includes the procurement of all other required balance of
system (BOS) components from third party suppliers.
|
|
|
Engineer,
Procure and Construct (EPC) Contract
|
Design
and construction for a customer of a turnkey solar electricity generation
system that uses our solar modules; includes the procurement of all other
BOS components from third party suppliers.
|
|
|
Sale
of Project Assets
|
Sale
of project assets to a customer at various stages of
development. This generally includes a single project consisting of
costs incurred for permits, land or land rights or power off-take
agreements.
|
|
|
Operating
and Maintenance (O&M) Agreement
|
Typically
a fixed-priced long-term services
agreement.
|
During
the year ended December 26, 2009, net sales from our systems business resulted
primarily from the sale of two utility scale solar power systems in the fourth
fiscal quarter to utilities in the United States and Canada. Our systems
business does not currently meet the quantitative criteria for disclosures as a
separate reporting segment. On April 3, 2009, we completed the acquisition of
the solar power project development business of OptiSolar Inc. and we have
integrated this business into our systems business.
Net
sales from our systems segment are impacted by numerous factors, including the
magnitude and effectiveness of renewable portfolio standards, economic
incentives (such as European feed-in tariffs or the federal investment tax
credit in the United States) and other PV system demand drivers.
For
a given solar power project, we recognize revenue for our systems business
either after execution of an EPC agreement with a third party, specifying the
terms and conditions of the construction of the solar power plant; by applying
the provisions for real estate accounting; by applying the
percentage-of-completion method of accounting; or upon the sale of the complete
system solution, as appropriate for the particular facts and circumstances
related to the project and its sale.
At any given point in time, aggregate
contracted sales amounts with respect to the systems segment generally consist
of the uncompleted portion of contracted projects where we have entered into a
definitive EPC agreement with the customer.
Cost
of sales
Components
Business
Our
cost of sales includes the cost of raw materials and components for
manufacturing solar modules, such as tempered back glass, transparent conductive
oxide coated front glass, cadmium telluride, laminate, connector assemblies,
laminate edge seal, and other items. Our cost of sales also includes direct
labor for the manufacturing of solar modules and manufacturing overhead such as
engineering expense, equipment maintenance, environmental health and safety
expenses, quality and production control and procurement. Cost of sales also
includes depreciation of manufacturing plants and equipment and facility-related
expenses. In addition, we accrue warranty and solar module collection and
recycling costs to our cost of sales.
Page
39
We
implemented a program in 2005 to collect and recycle our solar modules after
their use. Under our solar module collection and recycling program, we enter
into an agreement with the end-users of the solar power systems that use our
solar modules. In the agreement, we commit, at our expense, to collect the solar
modules from the installation site at the end of their useful life and transport
them to a processing center where the solar module materials and components will
be either refurbished and resold as used solar modules or recycled to recover
some of the raw materials. In return, the owner agrees not to dispose of the
solar modules except through our module collection and recycling program or any
other program that we might approve of. The owner is also responsible for
disassembling the solar modules and packaging them in containers that we
provide. At the time we sell a solar module, we record an expense in cost of
sales equal to the fair value of the estimated future module collection and
recycling obligation. We subsequently record accretion expense on this future
obligation, which we classify within selling, general and administrative
expense.
Overall,
we expect our cost of sales per watt to decrease over the next several years due
to an increase of sellable watts per solar module, an increase in unit output
per production line, continued geographic expansion into lower-cost
manufacturing regions and more efficient absorption of fixed costs driven by
economies of scale.
Systems
Business
Within
our systems business, project-related costs include standard EPC costs
(consisting primarily of balance of system costs for inverters, electrical and
mounting hardware, project management and engineering costs, and installation
labor costs), site specific costs, and development costs (including transmission
upgrade costs, interconnection fees and permitting costs). As further described
in Note 22. “Segment Reporting,” at the time when the revenue recognition
criteria are met, we include the sale of our solar modules manufactured by our
components business and used by our systems business as net sales of our
components business. Therefore, the related cost of sales will also be included
within our components business.
Deferred
project costs represent capitalized costs related to the deferred revenue for
project development or project construction activities sold to a third party
typically under an EPC agreement, for which the revenue recognition criteria
have not been met. We recognize these costs as we recognize the revenue for
these projects. Deferred project costs at December 26, 2009 and December 27,
2008 were $36.7 million and $0.7 million, respectively.
Gross
profit
Gross
profit is affected by numerous factors, including our average selling prices,
foreign exchange rates, our manufacturing costs and the effective utilization of
our production facilities. Gross profit is also subject to competitive
pressures, and we have in the past and may in the future decide to amend our
Long-Term Supply Contracts, which specify our sales price per watt. Other
factors impacting gross profits are the ramp of production on new plants due to
a reduced ability to absorb fixed costs until full production volumes are
reached, the mix of net sales generated by our components and systems businesses
coupled with a geographic factor. Gross profit margin is affected by our systems
business, which generally operates at a lower gross profit margin due to the
pass-through nature of certain balance of system components procured from third
parties. Gross profit for our systems business excludes cost of sales for solar
modules, that are included in the gross profit of our components
business.
Research
and development
Research
and development expense consists primarily of salaries and personnel-related
costs and the cost of products, materials and outside services used in our
process and product research and development activities. We acquire equipment
for general use in further process developments and record the depreciation of
this equipment as research and development expense.
We
maintain a number of programs and activities to improve our technology and
processes in order to enhance the performance and reduce the costs of our solar
modules and PV systems using our modules. We maintain active collaborations with
the National Renewable Energy Laboratory (a division of the United States
Department of Energy), Brookhaven National Laboratory and several universities.
We report our research and development expense net of grant funding. We received
$0.9 million and $1.8 million of grant funding during the years ended
December 27, 2008 and December 29, 2007, respectively, that we applied
towards our research and development programs. We did not receive any grant
funding during the year ended December 26, 2009. We expect our research and
development expense to increase in absolute terms in the future as we increase
personnel and research and development activity. Over time, we expect research
and development expense to decline as a percentage of net sales and on a cost
per watt basis as a result of economies of scale.
Page
40
Selling,
general and administrative
Selling,
general and administrative expense consists primarily of salaries and other
personnel-related costs, professional fees, insurance costs, travel expense and
other selling expenses. We expect these expenses to increase in the near term,
both in absolute dollars and as a percentage of net sales, in order to support
the growth of our business as we expand our sales and marketing efforts, improve
our information processes and systems and implement the financial reporting,
compliance and other infrastructure required for an expanding public company.
Over time, we expect selling, general and administrative expense to decline as a
percentage of net sales and on a cost per watt basis as our net sales and our
total watts produced increase.
Production
start-up
Production
start-up expense consists primarily of salaries and personnel-related costs and
the cost of operating a production line before it has been qualified for full
production, including the cost of raw materials for solar modules run through
the production line during the qualification phase. It also includes all
expenses related to the selection of a new site and the related legal and
regulatory costs and the costs to maintain our plant replication program, to the
extent we cannot capitalize these expenditures. We incurred production start-up
expense of $16.9 million during the year ended December 29, 2007 in
connection with the qualification of our German plant and the planning and
preparation of our plants at our Malaysian manufacturing center. We incurred
production start-up expense of $32.5 million during the year ended December
27, 2008 in connection with the planning and preparation of our plants at the
Malaysian manufacturing center. Production start-up expense for the year ended
December 26, 2009 was $13.9 million and related to plant four of our Malaysian
manufacturing center and our Ohio plant expansion. In general, we expect
production start-up expense per production line to be higher when we build an
entirely new manufacturing facility compared with the addition of new production
lines at an existing manufacturing facility, primarily due to the additional
infrastructure investment required when building an entirely new facility. Over
time, we expect production start-up expense to decline as a percentage of net
sales and on a cost per watt basis as a result of economies of
scale.
Foreign
currency gain (loss)
Foreign
currency gain (loss) consists of gains and losses resulting from holding assets
and liabilities and conducting transactions denominated in currencies other than
our functional currencies.
Interest
income
Interest
income is earned on our cash, cash equivalents, marketable securities and
restricted cash and investments.
Interest
expense, net
Interest
expense, net of amounts capitalized, is incurred on various debt
financings.
Income
Tax Expense
Income
taxes are imposed on our income by the taxing authorities in the various
jurisdictions in which we operate, principally the United States, Germany and
Malaysia. The statutory federal tax rate in the United States is 35% while the
tax rate in Germany and Malaysia is approximately 28.5% and 25%, respectively.
In Malaysia we have been granted a long-term tax holiday, pursuant to which
substantially all our income earned in Malaysia is exempt from income
tax.
Page
41
Critical
Accounting Estimates
In
preparing our financial statements in conformity with generally accepted
accounting principles in the United States (GAAP), we make estimates and
assumptions about future events that affect the amounts of reported assets,
liabilities, revenues and expenses, as well as the disclosure of contingent
liabilities in our financial statements and the related notes thereto. Some of
our accounting policies require the application of significant judgment by
management in the selection of appropriate assumptions for making these
estimates. By their nature, these judgments are subject to an inherent degree of
uncertainty. We base our judgments and estimates on our historical experience,
on our forecasts and on other available information, as appropriate. Our
significant accounting policies are described in Note 2. “Summary of
Significant Accounting Policies” to our consolidated financial statements for
the year ended December 26, 2009 included elsewhere in this Annual Report
on Form 10-K.
Our
critical accounting estimates, which require the most significant management
estimates and judgment in determining amounts reported in our consolidated
financial statements included elsewhere in this Annual Report on Form 10-K,
are as follows:
Solar module collection and
recycling.
At the time of sale, we recognize an expense for the estimated
fair value of our future obligation for collecting and recycling the solar
modules that we have sold when they have reached the end of their useful lives.
We base our estimate of the fair value of our collection and recycling
obligations on the present value of the expected future cost of collecting and
recycling the solar modules, which includes the cost of packaging the solar
modules for transport, the cost of freight from the solar modules’ installation
sites to a recycling center, the material, labor and capital costs of the
recycling process and an estimated third-party profit margin and return on risk
for collection and recycling services. We base this estimate on our experience
collecting and recycling our solar modules and on our expectations about future
developments in recycling technologies and processes, about economic conditions
at the time the solar modules will be collected and recycled and about the
timing of solar modules returns for recycling. In the periods between the time
of our sales and our settlement of the collection and recycling obligations, we
accrete the carrying amount of the associated liability by applying the discount
rate used for its initial measurement. At December 26, 2009, our estimate
of the fair value of our liability for collecting and recycling solar modules
was $92.8 million. A 10% decrease in our estimate of the future cost of
collecting and recycling a solar module would reduce this estimated liability by
$9.0 million, to $83.8 million; a 10% increase in our estimate of the
future cost of collecting and recycling a solar module would increase this
estimated liability by $9.1 million, to $101.9 million.
Product warranties.
We
provide a limited warranty for defects in materials and workmanship under normal
use and service conditions for five years following delivery to the owner of our
solar modules. We also warrant to the owner of our solar modules that solar
modules installed in accordance with agreed-upon specifications will produce at
least 90% of their initial power output rating during the first 10 years
following their installation and at least 80% of their initial power output
rating during the following 15 years. Our warranties are automatically
transferred from the original purchaser of our solar modules to a subsequent
purchaser. We accrue warranty costs when we recognize sales, using amounts
estimated based on our historical experience with warranty claims, our
monitoring of field installation sites and in-house testing.
Accounting for Income Taxes.
We are subject to the income tax laws of the United States, its states
and municipalities and those of the foreign jurisdictions in which we have
significant business operations. These tax laws are complex and subject to
different interpretations by the taxpayer and the relevant governmental taxing
authorities. We must make judgments and interpretations about the application of
these inherently complex tax laws when determining our provision for income
taxes and must also make estimates about when in the future certain items affect
taxable income in the various tax jurisdictions. Disputes over interpretations
of the tax laws may be settled with the taxing authority upon examination or
audit. We regularly assess the likelihood of assessments in each of the taxing
jurisdictions resulting from current and subsequent years’ examinations, and we
record tax liabilities as appropriate.
We
establish liabilities for potential additional taxes that may arise out of tax
audits in accordance with ASC 740,
Income Taxes
. Once
established, we adjust the liabilities when additional information becomes
available or when an event occurs requiring an adjustment. Significant judgment
is required in making these estimates, and the actual cost of a legal claim, tax
assessment or regulatory fine or penalty may ultimately be materially different
from our recorded liabilities, if any.
In
preparing our consolidated financial statements, we calculate our income tax
expense based on our interpretation of the tax laws in the various jurisdictions
where we conduct business. This requires us to estimate our current tax
obligations and the realizability of uncertain tax positions and to assess
temporary differences between the financial statement carrying amounts and the
tax bases of assets and liabilities. These temporary differences result in
deferred tax assets and liabilities, the net current amount of which we show as
a component of current assets or current liabilities and the net noncurrent
amount of which we show as other assets or other liabilities on our consolidated
balance sheet.
We
must also assess the likelihood that each of our deferred tax assets will be
realized. To the extent we believe that realization of any of our deferred tax
assets is not more likely than not, we establish a valuation allowance. When we
establish a valuation allowance or increase this allowance in a reporting
period, we generally record a corresponding tax expense in our consolidated
statement of operations. Conversely, to the extent circumstances indicate that a
valuation allowance is no longer necessary, that portion of the valuation
allowance is reversed, which generally reduces our overall income tax
expense.
Page
42
We
also consider the earnings of our foreign subsidiaries and determine whether
such amounts are indefinitely reinvested outside the United States. We have
concluded that all such accumulated earnings are currently indefinitely
reinvested. Accordingly, no additional taxes have been accrued that might be
incurred if such amounts were repatriated to the United States. If our intention
to permanently reinvest the earnings of our foreign subsidiaries changes,
additional taxes may be required to be accrued. See Note 18. “Income Taxes” to
our consolidated financial statements for additional information.
Goodwill.
Goodwill represents
the excess of the purchase price of acquired companies over the estimated fair
value assigned to the identifiable assets acquired and liabilities assumed. We
do not amortize goodwill, but instead test goodwill for impairment at least
annually in the fourth quarter and, if necessary, we would record any impairment
in accordance with ASC 350,
Intangibles
-
Goodwill and Other.
We will
perform an impairment review between scheduled annual tests if facts and
circumstances indicate that it is more likely than not that the fair value of a
reporting unit that has goodwill is less than its carrying value. In the process
of our annual impairment review, we primarily use the income approach of
valuation, which includes the discounted cash flow method, and the market
approach of valuation, which considers values of comparable businesses, to
determine the fair value of our goodwill. Significant management judgment is
required in the forecasts of future operating results and the discount rates
that we used in the discounted cash flow method of valuation and in the
selection of comparable businesses that we used in the market
approach.
We
reported $286.5 million of goodwill at December 26, 2009, which
represents the excess of the purchase price over the fair value of the
identifiable net tangible and intangible assets that we acquired from Turner
Renewable Energy, LLC and OptiSolar Inc. In accordance with ASC 350,
Intangibles – Goodwill and
Other,
we performed our annual test of our goodwill for impairment in the
fourth quarter of the year ended December 26, 2009 and concluded that it
was not impaired. Testing goodwill for impairment involves two steps. The first
step is comparing the fair value of a reporting unit containing goodwill to its
carrying value. If the fair value of the reporting unit is less than its
carrying value, impairment is indicated and step two of the test must be
performed. That step involves determining the implied fair value of the
reporting unit’s goodwill by allocating the fair value of the reporting unit to
the fair values of its identifiable assets and liabilities. Any excess of the
fair value of the reporting unit over the net fair values of its identifiable
assets and liabilities is attributed to goodwill, and any amount by which the
carrying value of goodwill exceeds this implied fair value is written off as an
impairment loss. The fair value of our goodwill substantially exceeded the
carrying value and therefore we concluded that there was no indication that our
goodwill was impaired and that performing step two of the goodwill impairment
test was not applicable.
Results
of Operations
The
following table sets forth our consolidated statements of operations as a
percentage of net sales for the years ended December 26, 2009,
December 27, 2008 and December 29, 2007:
|
Years
Ended
|
||||||||||||
|
|
December 26,
2009
|
December 27,
2008
|
December 29,
2007
|
|||||||||
|
Net
sales
|
100.0 | % | 100.0 | % | 100.0 | % | ||||||
|
Cost
of sales
|
49.4 | % | 45.6 | % | 50.1 | % | ||||||
|
Gross
profit
|
50.6 | % | 54.4 | % | 49.9 | % | ||||||
|
Research
and development
|
3.8 | % | 2.7 | % | 3.0 | % | ||||||
|
Selling,
general and administrative
|
13.2 | % | 14.0 | % | 16.4 | % | ||||||
|
Production
start-up
|
0.7 | % | 2.6 | % | 3.3 | % | ||||||
|
Operating
income
|
32.9 | % | 35.1 | % | 27.2 | % | ||||||
|
Foreign
currency gain
|
0.3 | % | 0.5 | % | 0.4 | % | ||||||
|
Interest
income
|
0.5 | % | 1.7 | % | 4.1 | % | ||||||
|
Interest
expense, net
|
(0.3 | )% | 0.0 | % | (0.5 | )% | ||||||
|
Other
expense, net
|
(0.1 | )% | (0.1 | )% | (0.3 | )% | ||||||
|
Income
tax expense (benefit)
|
2.2 | % | 9.3 | % | (0.5 | )% | ||||||
|
Net
income
|
31.1 | % | 27.9 | % | 31.4 | % | ||||||
Page
43
Fiscal
Years Ended December 26, 2009 and December 27, 2008
Net
sales
|
Years
Ended
|
Year
Over
|
|||||||||||||||
|
(Dollars
in thousands)
|
2009
|
2008
|
Year
Change
|
|||||||||||||
|
Net
sales
|
$ | 2,066,200 | $ | 1,246,301 | $ | 819,899 | 66 | % | ||||||||
The
increase in our net sales was primarily driven by price elasticity that resulted
in strong demand for our solar modules as prices declined, resulting in a 114%
increase in the MW volume of solar modules sold during 2009 compared with 2008,
and from an increase in business activity associated with our systems segment
business, partially offset by a decrease in our module average selling price.
Revenue recognized for our systems business during 2009 was $115.0 million and
resulted primarily from the sale of two utility scale solar power systems to
utilities in the United States and Canada. The increase in MW volume of solar
modules sold is attributable to the full production ramp of all four plants at
our Malaysian manufacturing center, continued improvements to our manufacturing
process and the growth in our systems business. In addition, we increased the
average conversion efficiency by approximately 3% during 2009 compared with
2008. Our average selling price decreased by approximately 25% during 2009
compared with 2008. Approximately 20% of the decline in our average selling
price was primarily due to competitive pressure, including the commencement of a
customer rebate program in the third quarter of 2009. Additionally, our average
selling price was adversely impacted by approximately 4% due to a decrease in
the foreign exchange rate between the U.S. dollar and the euro and by
approximately 1% due to a shift in customer mix. During 2009 and 2008, 65% and
74%, respectively, of our net sales resulted from sales of solar modules to
customers headquartered in Germany.
Cost
of sales
|
Years
Ended
|
Year
Over
|
|||||||||||||||
|
(Dollars
in thousands)
|
2009
|
2008
|
Year
Change
|
|||||||||||||
|
Cost
of sales
|
$ | 1,021,618 | $ | 567,908 | $ | 453,710 | 80 | % | ||||||||
|
%
of net sales
|
49.4 | % | 45.6 | % | ||||||||||||
The
increase in our cost of sales was due to higher production and sales volumes,
which resulted from the commencement of production at all of our four plants at
our Malaysian manufacturing center, production ramp of our Perrysburg, Ohio
expansion, and an increase in business activity associated with our systems
segment business. The increased production and sales volumes in our components
business and increased volume sold through our systems business had the
following effects: a $278.7 million increase in direct material expense
(including an $8.2 million amortization of project assets acquired through our
OptiSolar acquisition), a $41.0 million increase in warranty expense and
accruals for the estimated future costs associated with the collection and
recycling of our solar modules due to increased sales, a $13.8 million
increase in sales freight and other costs, and a $120.2 million increase in
manufacturing overhead costs. The increase in manufacturing overhead costs was
due to a $35.3 million increase in salaries and personnel related expenses
(including a $4.9 million increase in share-based compensation expense), a
$32.9 million increase in facility and related expenses and a $52.0 million
increase in depreciation expense. Each of these manufacturing overhead cost
increases primarily resulted from increased infrastructure associated with the
build out of our Malaysian manufacturing center and start-up of our systems
business. Our average manufacturing cost per watt declined by $0.21 per watt, or
19%, from $1.08 in 2008 to $0.87 in 2009 and included $0.01 of ramp penalty
associated with the ramp and qualification of our Malaysian and Perrysburg
manufacturing facilities and $0.01 of non-cash stock based
compensation.
Gross
profit
|
Years
Ended
|
Year
Over
|
|||||||||||||||
|
(Dollars
in thousands)
|
2009
|
2008
|
Year
Change
|
|||||||||||||
|
Gross
profit
|
$ | 1,044,582 | $ | 678,393 | $ | 366,189 | 54 | % | ||||||||
|
%
of net sales
|
50.6 | % | 54.4 | % | ||||||||||||
Gross
profit as a percentage of net sales decreased by 3.8% percentage points in
2009 compared with 2008 due to a decline in our average selling prices by
approximately 21%, partially offset by continued manufacturing cost per watt
reduction of 19.4%. The decline in the exchange rate between the U.S. dollar and
the euro adversely impacted our gross profit by 2.2%. We expect that gross
profit will be impacted in future periods by the volatility of the exchange rate
between the U.S. dollar and the euro and product mix between our components and
systems businesses.
Page
44
Research
and development
|
Years
Ended
|
Year
Over
|
|||||||||||||||
|
(Dollars
in thousands)
|
2009
|
2008
|
Year
Change
|
|||||||||||||
|
Research
and development
|
$ | 78,161 | $ | 33,517 | $ | 44,644 | 133 | % | ||||||||
|
%
of net sales
|
3.8 | % | 2.7 | % | ||||||||||||
The
increase in our research and development expense was due to a $14.2 million
increase in personnel related expense (including a $2.3 million increase in
share-based compensation expense) resulting from increased headcount. In
addition, testing and qualification material costs increased by $18.0 million,
consulting and other expenses increased by $11.5 million and grants received
decreased by $0.9 million during 2009 compared with 2008. During fiscal
2009, we continued the development of solar modules with increased efficiencies
at converting sunlight into electricity and we increased the conversion
efficiency of our modules by approximately 3% in comparison to fiscal
2008.
Selling,
general and administrative
|
Years
Ended
|
Year
Over
|
|||||||||||||||
|
(Dollars
in thousands)
|
2009
|
2008
|
Year
Change
|
|||||||||||||
|
Selling,
general and administrative
|
$ | 272,898 | $ | 174,039 | $ | 98,859 | 57 | % | ||||||||
|
%
of net sales
|
13.2 | % | 14.0 | % | ||||||||||||
The
increase in selling, general and administrative expense was due to a
$66.0 million increase in salaries and personnel-related expenses
(including a $23.0 million increase in share-based compensation expense, of
which, $15.7 million were one-time charges associated with our executive
management team). In addition, legal and professional service fees increased by
$13.3 million; and other expenses increased by $19.6 million and included
$6.9 million of one-time charges, of which, $5.5 million of costs related to the
acquisition, integration and operation of the solar power project development
business of OptiSolar, which we acquired on April 3, 2009.
Production
start-up
|
Years
Ended
|
Year
Over
|
|||||||||||||||
|
(Dollars
in thousands)
|
2009
|
2008
|
Year
Change
|
|||||||||||||
|
Production
start-up
|
$ | 13,908 | $ | 32,498 | $ | (18,590 | ) | (57 | )% | |||||||
|
%
of net sales
|
0.7 | % | 2.6 | % | ||||||||||||
During
2009, we incurred $13.9 million of production start-up expenses for our
Malaysian and Perrysburg manufacturing expansions, including legal, regulatory
and personnel costs, compared with $32.5 million of production start-up
expenses for our Malaysian manufacturing expansion during 2008. Production
start-up expenses are comprised of the cost of labor and material and
depreciation expense to run and qualify the production lines, related facility
expenses, management of our replication process and legal and regulatory
costs.
Page
45
Foreign
currency gain
|
Years
Ended
|
Year
Over
|
|||||||||||||||
|
(Dollars
in thousands)
|
2009
|
2008
|
Year
Change
|
|||||||||||||
|
Foreign
currency gain
|
$ | 5,207 | $ | 5,722 | $ | (515 | ) | (9 | )% | |||||||
Foreign
currency gain decreased primarily due to a decrease in our net foreign currency
denominated assets and liabilities.
Interest
income
|
Years
Ended
|
Year
Over
|
|||||||||||||||
|
(Dollars
in thousands)
|
2009
|
2008
|
Year
Change
|
|||||||||||||
|
Interest
income
|
$ | 9,735 | $ | 21,158 | $ | (11,423 | ) | (54 | )% | |||||||
Interest
income decreased primarily due to a substantial decline in interest
rates.
Interest
expense, net
|
Years
Ended
|
Year
Over
|
|||||||||||||||
|
(Dollars
in thousands)
|
2009
|
2008
|
Year
Change
|
|||||||||||||
|
Interest
expense, net
|
$ | 5,258 | $ | 509 | $ | 4,749 | 933 | % | ||||||||
Interest
expense, net of amounts capitalized, increased primarily due to lower amounts of
interest expense capitalized during 2009. In addition, interest expense, net for
2009 includes a $2.4 million expense related to the termination of the interest
rate swaps for our German debt facility. We fully repaid this facility on June
30, 2009.
Other
expense, net
|
Years
Ended
|
Year
Over
|
|||||||||||||||
|
(Dollars
in thousands)
|
2009
|
2008
|
Year
Change
|
|||||||||||||
|
Other
expense, net
|
$ | 2,985 | $ | 934 | $ | 2,051 | 220 | % | ||||||||
Other
expense, net, increased primarily due to expenses associated with our credit
default swaps, which expired in the second quarter of 2009.
Page
46
Income
tax expense
|
Years
Ended
|
Year
Over
|
|||||||||||||||
|
(Dollars
in thousands)
|
2009
|
2008
|
Year
Change
|
|||||||||||||
|
Income
tax expense
|
$ | 46,176 | $ | 115,446 | $ | (69,270 | ) | (60 | )% | |||||||
|
Effective
tax rate
|
6.7 | % | 24.9 | % | ||||||||||||
Income
tax expense decreased primarily due to the effect of our tax holiday in
Malaysia. During 2009, a significant amount of our pre-tax income was generated
in Malaysia where we have a 16.5 year tax holiday. In addition, we recognized an
$11.5 million tax benefit during 2009 related to the reversal of 2008 Malaysian
tax due to the pull-forward of the tax holiday to 2008, which was granted in
2009. See also Note 18. “Income Taxes” to our condensed consolidated financial
statements for more information.
Fiscal
Years Ended December 27, 2008 and December 29, 2007
Net
sales
|
Years
Ended
|
Year
Over
|
|||||||||||||||
|
(Dollars
in thousands)
|
2008
|
2007
|
Year
Change
|
|||||||||||||
|
Net
sales
|
$ | 1,246,301 | $ | 503,976 | $ | 742,325 | 147 | % | ||||||||
The
increase in our net sales was due primarily to a 148% increase in the MW volume
of solar modules sold during 2008 compared with 2007 due to strong demand for
our solar modules in Europe. The increase in MW volume of solar modules sold was
attributable to the full production ramp of our German plant, commencement of
product shipments at the first two plants at our Malaysian manufacturing center
and continued improvements to our manufacturing process. In addition, we
increased the average number of sellable watts per solar module by approximately
4% during 2008 compared with 2007. Our average selling price decreased by
approximately 1% during 2008 compared with 2007, mainly due to a 6.5%
contractual price decline, partially offset by a 6% increase related to a
favorable foreign exchange rate between the U.S. dollar and the euro.
Approximately 74% of our net sales during 2008 resulted from sales of solar
modules to customers headquartered in Germany.
Cost
of sales
|
Years
Ended
|
Year
Over
|
|||||||||||||||
|
(Dollars
in thousands)
|
2008
|
2007
|
Year
Change
|
|||||||||||||
|
Cost
of sales
|
$ | 567,908 | $ | 252,573 | $ | 315,335 | 125 | % | ||||||||
|
%
of net sales
|
45.6 | % | 50.1 | % | ||||||||||||
The
increase in our cost of sales was due to higher production and sales volumes,
which resulted from the full production ramp of our German facility and
commencement of production at our first three plants at our Malaysian
manufacturing center. These factors caused a $191.1 million increase in
direct material expense, a $13.8 million increase in warranty and accruals
for the estimated future costs associated with the collection and recycling of
our solar modules, a $9.4 million increase in sales freight and other costs
and a $101.0 million increase in manufacturing overhead costs. The increase
in manufacturing overhead costs was due to a $40.5 million increase in
salaries and personnel related expenses, including a $2.4 million increase
in share-based compensation expense, a $30.7 million increase in facility
and related expenses and a $29.8 million increase in depreciation
expense, in each case primarily resulting from increased infrastructure
associated with our German and Malaysian expansions.
Gross
profit
|
Years
Ended
|
Year
Over
|
|||||||||||||||
|
(Dollars
in thousands)
|
2008
|
2007
|
Year
Change
|
|||||||||||||
|
Gross
profit
|
$ | 678,393 | $ | 251,403 | $ | 426,990 | 170 | % | ||||||||
|
%
of net sales
|
54.4 | % | 49.9 | % | ||||||||||||
As
a percentage of sales, gross profit increased 4.5 percentage points from
2007 to 2008, representing increased leverage of our fixed cost infrastructure
and scalability associated with our German and Malaysian expansions, which drove
a 148% increase in the number of megawatts sold. Our average manufacturing cost
per watt decreased by 9% during 2008, while our average selling prices decreased
by 1%. During 2008, foreign currency gains due to a favorable exchange rate
between the U.S. dollar and the euro and increased leverage of our fixed
cost infrastructure contributed approximately 1.9% and 5.6%, respectively, to
our gross profit, partially offset by a 3.0% decline in our average selling
prices.
Page
47
Research
and development
|
Years
Ended
|
Year
Over
|
|||||||||||||||
|
(Dollars
in thousands)
|
2008
|
2007
|
Year
Change
|
|||||||||||||
|
Research
and development
|
$ | 33,517 | $ | 15,107 | $ | 18,410 | 122 | % | ||||||||
|
%
of net sales
|
2.7 | % | 3.0 | % | ||||||||||||
The
increase in our research and development expense was due to a $13.7 million
increase in personnel related expense (including a $1.2 million increase in
share-based compensation expense) due to increased headcount and additional
share-based compensation awards. In addition, consulting and other expenses
increased by $3.8 million and grant revenue increased by $0.9 million
during 2008 compared with 2007.
Selling,
general and administrative
|
Years
Ended
|
Year
Over
|
|||||||||||||||
|
(Dollars
in thousands)
|
2008
|
2007
|
Year
Change
|
|||||||||||||
|
Selling,
general and administrative
|
$ | 174,039 | $ | 82,248 | $ | 91,791 | 112 | % | ||||||||
|
%
of net sales
|
14.0 | % | 16.4 | % | ||||||||||||
The
increase in selling, general and administrative expense was due to a
$62.0 million increase in salaries and personnel-related
expenses (including a $15.5 million increase in share-based
compensation). In addition, legal and professional service fees increased by
$13.0 million and other expenses increased by $16.8 million during
2008. The increase resulted primarily from the expansion of our solar power
system and project development business as well as operating a global
manufacturing business.
Page
48
Production
start-up
|
Years
Ended
|
Year
Over
|
|||||||||||||||
|
(Dollars
in thousands)
|
2008
|
2007
|
Year
Change
|
|||||||||||||
|
Production
start-up
|
$ | 32,498 | $ | 16,867 | $ | 15,631 | 93 | % | ||||||||
|
%
of net sales
|
2.6 | % | 3.3 | % | ||||||||||||
During
2008, we incurred $32.5 million of production start-up expenses for our
Ohio and Malaysian manufacturing expansion, including legal, regulatory and
personnel costs, compared with $16.9 million of production start-up
expenses for our German and Malaysian plant expansions during 2007. Production
start-up expenses are primarily the cost of labor and material and depreciation
expense to run and qualify the production lines, related facility expenses,
management of our replication process and legal and regulatory
costs.
Foreign
currency gain
|
Years
Ended
|
Year
Over
|
|||||||||||||||
|
(Dollars
in thousands)
|
2008
|
2007
|
Year
Change
|
|||||||||||||
|
Foreign
currency gain
|
$ | 5,722 | $ | 1,881 | $ | 3,841 | 204 | % | ||||||||
Foreign
exchange gain increased by $3.8 million during 2008 due to a substantial
increase in our foreign currency denominated assets and liabilities and the high
volatility of the U.S. dollar relative to other currencies, in particular
the euro.
Interest
income
|
Years
Ended
|
Year
Over
|
|||||||||||||||
|
(Dollars
in thousands)
|
2008
|
2007
|
Year
Change
|
|||||||||||||
|
Interest
income
|
$ | 21,158 | $ | 20,413 | $ | 745 | 4 | % | ||||||||
Interest
income remained relatively flat primarily as a result of higher cash, cash
equivalents and marketable securities balances during 2008, offset by a decline
in interest rates.
Interest
expense, net
|
Years
Ended
|
Year
Over
|
|||||||||||||||
|
(Dollars
in thousands)
|
2008
|
2007
|
Year
Change
|
|||||||||||||
|
Interest
expense, net
|
$ | 509 | $ | 2,294 | $ | (1,785 | ) | (78 | )% | |||||||
Interest
expense, net of amounts capitalized, decreased primarily as a result of higher
amounts of interest expense capitalized due to the construction of our Malaysian
manufacturing center.
Page
49
Other
expense, net
|
Years
Ended
|
Year
Over
|
|||||||||||||||
|
(Dollars
in thousands)
|
2008
|
2007
|
Year
Change
|
|||||||||||||
|
Other
expense, net
|
$ | 934 | $ | 1,219 | $ | (285 | ) | (23 | )% | |||||||
Other
expense, net consisted mainly of financing fees related to our credit
facilities. During 2008, other expense was reduced by a mark-to-market gain of
$0.6 million associated with our credit default swap.
Income
tax expense (benefit)
|
Years
Ended
|
Year
Over
|
|||||||||||||||
|
(Dollars
in thousands)
|
2008
|
2007
|
Year
Change
|
|||||||||||||
|
Income
tax expense (benefit)
|
$ | 115,446 | $ | (2,392 | ) | $ | 117,838 | N.M. | ||||||||
|
Effective
tax rate
|
24.9 | % | (1.5 | )% | ||||||||||||
Income
tax expense increased by $117.8 million, primarily due to the increase in
pre-tax income of $307.8 million, as well as the reversal of a valuation
allowance in 2007 of $54.9 million.
Our
Malaysian subsidiary has been granted a tax holiday for a period of
16.5 years, which was originally scheduled to commence on January 1,
2009, which generally provides for a 100% exemption from Malaysian income tax.
Subsequent to year end, we received formal approval granting our request to pull
forward this previously approved tax holiday by one year. Due to the fact that
this approval was granted subsequent to the end of 2008, we concluded that the
financial impact should be reflected in our 2009 financial results.
Liquidity
and Capital Resources
As
of December 26, 2009, we had $1,114.3 million in cash, cash
equivalents and marketable securities, compared with $821.8 million as of
December 27, 2008. We believe that our current cash, cash equivalents,
marketable securities, cash flows from operating activities and our revolving
credit facility will be sufficient to meet our working capital and capital
expenditure needs for at least the next 12 months. However, if our
financial results or operating plans change from our current assumptions, we may
not have sufficient resources to support our business plan.
Our
expanding systems business is expected to have increasing liquidity requirements
in the future. Solar power project development cycles, which span the time
between the identification of land and the commercial operation of a
photovoltaic power plant project, vary substantially and can take many months or
years to mature. As a result of these long project cycles, we may need to make
significant up front investments of resources in advance of the signing of power
purchase agreements and EPC contracts and the receipt of any revenue. We have
historically financed these up front investments primarily using working capital
and cash on hand. In the future, we may also engage in one or more debt or
equity financings. Such financings could result in increased expenses or
dilution to our existing stockholders. If we are unable to obtain debt or equity
financing on reasonable terms, we may be unable to execute our expansion
strategy.
The
unprecedented disruption in the credit markets over the past two years has had a
significant adverse impact on a number of financial institutions. As of December
26, 2009, our liquidity and investments have not been materially adversely
impacted by the current credit environment and we believe that they will not be
materially adversely impacted in the near future. We will continue to closely
monitor our liquidity and the credit markets. However, we cannot predict with
any certainty the impact to us of any further disruption in the credit
environment.
Page
50
Cash
Flows
The
following table summarizes the key cash flow metrics for the years ended
December 26, 2009, December 27, 2008 and December 29, 2007 (in
thousands):
|
Years
Ended
|
||||||||||||
|
|
2009
|
2008
|
2007
|
|||||||||
|
Net
cash provided by operating activities
|
$ | 675,193 | $ | 463,067 | $ | 205,951 | ||||||
|
Net
cash used in investing activities
|
(701,690 | ) | (308,441 | ) | (547,250 | ) | ||||||
|
Net
cash (used in) provided by financing activities
|
(22,021 | ) | 177,549 | 430,421 | ||||||||
|
Effect
of exchange rates on cash flows
|
(3,201 | ) | (20,221 | ) | 7,050 | |||||||
|
Net
increase (decrease) in cash and cash equivalents
|
$ | (51,719 | ) | $ | 311,954 | $ | 96,172 | |||||
Operating
activities
Cash
provided by operating activities was $675.2 million during 2009 compared with
$463.1 million during 2008. Net cash provided by operating activities during
2009 resulted primarily from an increase in net income and the impact of
non-cash items that were recorded on our statements of operations, primarily
depreciation and amortization expense and stock-based compensation expense,
offset by an increase in operating assets, primarily accounts receivable and
deferred project costs.
Cash
received from customers increased to $1,957.6 million during 2009 compared with
$1,203.8 million during 2008, primarily due to an increase in net sales,
offset by an increase in accounts receivable of $122.2 million. The increase in
accounts receivable was primarily due to the amendment of certain of our
customers’ Long-Term Supply Contracts to extend their payment terms from net 10
days to net 45 days primarily to increase liquidity in our sales channel and to
reflect longer module shipment times from our manufacturing plants in Malaysia
and due to additional volume shipped during 2009. Our net sales increased from
$1,246.3 million during 2008 to $2,066.2 million during 2009.
Cash
paid to suppliers and associates increased to $1,123.7 million during 2009 from
$723.1 million during 2008, mainly due to an increase in raw material and
component purchases, an increase in personnel-related costs due to higher
headcount and other costs supporting our growth. Inventory increased by $52.1
million, of which $32.2 million related to an increase in finished goods
inventory as a result of inventory requirements for utility scale projects in
North America.
Income
taxes paid, net of refunds during 2009, were $147.8 million compared to $2.0
million during 2008.
Cash
provided by operating activities was $463.1 million during 2008 compared
with $206.0 million during 2007. Net cash provided by operating activities
during 2008 resulted primarily from an increase in net income, accounts payable
and accrued expenses in this period as well as the impact of non-cash items that
were recorded on our statements of operations, primarily depreciation and
amortization expense and stock-based compensation expense, offset by increases
in accounts receivable and inventories to support growth. Our inventories
increased by $84.8 million during 2008 compared with 2007 primarily due to
an increase in raw materials and work in process as a result of revenue
growth.
Cash
received from customers increased to $1,203.8 million during 2008 from
$516.0 million during 2007 primarily due to an increase in net sales. Our
net sales increased from $504.0 million during 2007 to
$1,246.3 million in 2008. This increase was partially offset by cash paid
to suppliers and associates of $723.1 million during 2008 compared with
cash paid to suppliers and associates of $276.5 million during 2007, mainly
due to an increase in raw material and component purchases, an increase in
personnel-related costs due to higher headcount and other costs supporting our
global expansion.
Page
51
Investing
activities
Cash
used in investing activities was $701.7 million during 2009 compared with
$308.4 million during 2008. Cash used in investing activities during 2009
resulted primarily from the net purchase of marketable securities of $342.5
million, the net investment in notes receivable of $74.2 million to fund
construction of various photovoltaic power generation facilities, capital
expenditures of $279.9 million, and an increase of $4.2 million in restricted
investments to fund our solar module collection and recycling program. Capital
expenditures during 2009 related primarily to the expansion of our plant in
Perrysburg, Ohio and completion of construction of our new plants in
Malaysia. See Note 11. “Notes Receivable” to our consolidated financial
statements for more information regarding the above-referenced notes
receivable.
On
April 3, 2009, we completed the acquisition of the solar power project
development business of OptiSolar Inc. The total consideration consisted of
2,972,420 shares of our common stock, of which 355,096 shares represented a
contingent consideration. The total purchase price based on the closing price of
our common stock on April 3, 2009 of $134.38 per share was $399.4 million. See
also Note 3. “Acquisitions” to our consolidated financial
statements.
We
expect to spend up to $550.0 million in capital expenditures for 2010,
including expenditures related to the eight-line expansion of our manufacturing
facility in Malaysia. A majority of our capital expenditures for 2010 will be
incurred in foreign currency; and therefore, are subject to fluctuations in
currency exchange rates.
At
the beginning of each fiscal year we pre-fund our estimated solar module
collection and recycling costs for solar modules that we sold during the prior
fiscal year through a custodial account with a large bank as investment advisor,
in the name of a trust, for which First Solar, Inc., First Solar Malaysia Sdn.
Bhd, and First Solar Manufacturing GmbH are grantors. For this purpose we assume
a minimum service life of 25 years for our solar modules. Prior to June 2009, we
pre-funded our estimated solar module collection and recycling costs through a
financial services company. At December 26, 2009, we had $36.5 million in the
new custodial account, which we classified in our restricted investments on our
balance sheet. See Note 6. “Restricted Cash and Investments” to our consolidated
financial statements for additional information
Cash
used in investing activities was $308.4 million during 2008 compared with $547.3
million during 2007. Cash used in investing activities during 2008 was primarily
due to capital expenditures of $459.3 million related to the construction of our
plants in Malaysia and Germany, an investment of $25.0 million in the preferred
stock of a United States company that supplies solar power systems to commercial
and residential customers and an increase in our restricted investments of $15.6
million to fund our solar module collection and recycling program, offset by the
net sale of marketable securities of $191.4 million.
On
November 30, 2007, we completed the acquisition of Turner Renewable Energy, LLC,
a privately held company which designed and deployed commercial solar power
systems in the United States. The total consideration for the transaction was
$34.3 million (excluding exit and transaction costs of $0.7 million); consisting
of $28.0 million in common stock and $6.3 million in cash. See also Note 3.
“Acquisitions” to our consolidated financial statements.
Financing
activities
Cash
used in financing activities was $22.0 million during 2009 compared with cash
provided by financing activities of $177.5 million during 2008. Cash used in
financing activities during 2009 resulted primarily from the repayment of
long-term debt of $78.2 million, which was partially offset by (i) proceeds
of $44.7 million from the issuance of debt, net of issuance cost, related to the
equipment export financing agreement for our Malaysian manufacturing center,
(ii) proceeds from the issuance of common stock of $6.0 million during
2009 mainly due to the exercise of employee stock options and, (iii)
excess tax benefits from share-based compensation arrangements of $4.9
million.
Cash
provided by financing activities was $177.5 million during 2008 compared
with $430.4 million during 2007. Cash provided by financing activities
during 2008 resulted primarily from an increase in investment incentives
related to the
construction of our plant in Frankfurt/Oder, Germany of $35.7 million and
proceeds from the issuance of debt, net of issuance cost, of $138.9 million
related to the equipment export facility agreement for our Malaysian
manufacturing center. See Note 13. “Debt” to our consolidated financial
statements for more information about these credit facilities. This increase was
partially offset by the repayment of long-term debt of $41.7 million in 2008.
Excess tax benefits from share-based compensation arrangements during 2008 were
$28.7 million.
Proceeds
from the issuance of common stock during 2007 were $376.1 million mainly
due to the receipt of $366.0 million in net proceeds from the issuance of
our common stock as a result of our follow-on offering and $10.2 million of
proceeds received from the exercise of employee stock options.
Page
52
Contractual
Obligations
The
following table presents our contractual obligations as of December 26,
2009, which consists of legal commitments requiring us to make fixed or
determinable cash payments, regardless of contractual requirements with the
vendor to provide future goods or services. We purchase raw materials for
inventory, services and manufacturing equipment from a variety of vendors.
During the normal course of business, in order to manage manufacturing lead
times and help assure adequate supply, we enter into agreements with suppliers
that either allow us to procure goods and services when we choose or that
establish purchase requirements.
|
Payments
Due by Year
|
||||||||||||||||||||
|
Contractual
Obligations
|
Total
|
Less
Than
1 Year
|
1
- 3
Years
|
3
- 5
Years
|
More
Than
5 Years
|
|||||||||||||||
|
(In
thousands)
|
||||||||||||||||||||
|
Long-term
debt obligations (1)
|
$ | 196,388 | $ | 35,895 | $ | 65,995 | $ | 62,586 | $ | 31,912 | ||||||||||
|
Capital
lease obligations
|
2 | 2 | — | — | — | |||||||||||||||
|
Operating
lease obligations
|
72,183 | 8,392 | 20,719 | 13,988 | 29,084 | |||||||||||||||
|
Purchase
obligations (2)
|
416,373 | 161,106 | 229,469 | 17,518 | 8,280 | |||||||||||||||
|
Recycling
obligations
|
92,799 | — | — | — | 92,799 | |||||||||||||||
|
Total
|
$ | 777,745 | $ | 205,395 | $ | 316,183 | $ | 94,092 | $ | 162,075 | ||||||||||
|
(1)
|
Includes
estimated cash interest to be paid over the remaining terms of the
debt.
|
|
(2)
|
Purchase
obligations are agreements to purchase goods or services that are
enforceable and legally binding on us and that specify all significant
terms, including fixed or minimum quantities to be purchased, fixed
minimum, or variable price provisions and the approximate timing of
transactions.
|
In
addition to the amounts shown in the table above, we have recorded
$37.2 million of unrecognized tax benefits as liabilities in accordance
with ASC 740, and we are uncertain as to if or when such amounts may be
settled.
Debt
and Credit Sources
Revolving
Credit Facility
On
September 4, 2009, we entered into a revolving credit facility pursuant to
a Credit Agreement among First Solar, Inc., certain designated Borrowing
Subsidiaries (consisting of First Solar Manufacturing GmbH, a German subsidiary,
and other subsidiaries of our Company who may in the future be designated as
borrowers pursuant to the Credit Agreement) and several lenders. JPMorgan
Chase Bank, N.A. and Bank of America served as Joint-Lead Arrangers and
Bookrunners, with JPMorgan also acting as Administrative Agent. The Credit
Agreement provides us and the borrowing subsidiaries with a senior secured
three-year revolving credit facility in an aggregate available amount of $300.0
million, a portion of which is available for letters of credit and swingline
loans. Subject to certain conditions, we have the right to request an
increase in the aggregate commitments under the facility up to $400.0 million.
In connection with the Credit Agreement, we also entered into a guarantee and
collateral agreement and foreign security agreements.
At
December 26, 2009, we had no borrowings outstanding and $46.0 million in
letters of credit drawn on the revolving credit facility, leaving approximately
$254.0 million in capacity available under the revolving credit facility, $29.0
million of which may be used for letters of credit. As of this date, based
on applicable indices, the all-in effective three months LIBOR borrowing rate
under the facility was 3.47%. See also Note 13. “Debt” to our consolidated
financial statements.
Page
53
Malaysian
Facility Agreement
On
May 6, 2008, in connection with the plant expansion at our Malaysian
manufacturing center, First Solar Malaysia Sdn. Bhd. (FS Malaysia), our indirect
wholly owned subsidiary, entered into an export financing facility agreement
(Malaysian Facility Agreement) with a consortium of banks. The total available
loan amount was €134.0 million ($193.0 million at the balance sheet close
rate on December 26, 2009 of $1.44/€1.00). Pursuant to the Malaysia Facility
Agreement, we began semi-annual repayments of the principal balances of these
credit facilities during 2008. Amounts repaid under this credit facility cannot
be re-borrowed. At December 26, 2009, we had $168.3 million of borrowings
outstanding, with no additional borrowing capacity available under this credit
facility. See also Note 13. “Debt” to our consolidated financial
statements.
Off-Balance
Sheet Arrangements
We
had no off-balance sheet arrangements as of December 26, 2009.
Recent
Accounting Pronouncements
See
Note 2. “Summary of Significant Accounting Policies” to our consolidated
financial statements filed with this Annual Report on Form 10-K for a
summary of recent accounting pronouncements.
Foreign
Currency Exchange Risk
Our
international operations accounted for 93% of our net sales during 2009 and 95%
of our net sales during 2008; of which, 92% and 100% of these international
sales, respectively, were denominated in euros. As a result, we have exposure to
foreign exchange risk with respect to almost all of our net sales. Fluctuations
in exchange rates, particularly in the U.S. dollar to euro exchange rate,
affect our gross and net profit margins and could result in foreign exchange and
operating losses. In the past, most of our exposure to foreign exchange risk has
related to currency gains and losses between the times we sign and settle our
sales contracts. For example, our Long-Term Supply Contracts obligate us to
deliver solar modules at a fixed price in euros per watt and do not adjust for
fluctuations in the U.S. dollar to euro exchange rate. For the year ended
December 26, 2009, a 10% change in the euro exchange rates would have
impacted our net euro sales by $177.7 million. For our manufacturing
operations in Germany and Malaysia, many of our operating expenses for the
plants in these countries are denominated in the local currency.
Our
primary foreign currency exposures are transaction exposure, cash flow exposure
and earnings translation exposure.
Transaction Exposure:
Many
components of our business have assets and liabilities (primarily receivables,
investments, accounts payable, debt, solar module collection and recycling
liabilities and inter-company transactions) that are denominated in currencies
other than the relevant entity’s functional currency. Changes in the exchange
rates between our components’ functional currencies and the currencies in which
these assets and liabilities are denominated can create fluctuations in our
reported consolidated financial position, results of operations and cash flows.
We may enter into foreign exchange forward contracts or other financial
instruments to hedge assets and liabilities against the short-term effects of
currency exchange rate fluctuations. The gains and losses on the foreign
exchange forward contracts will offset all or part of the transaction gains and
losses that we recognize in earnings on the related foreign currency assets and
liabilities. As of December 26, 2009, the total unrealized loss on our foreign
exchange forward contracts was $6.8 million. These contracts have
maturities of less than two months.
Since
our acquisition of the solar power project development business of OptiSolar on
April 3, 2009, we have also become exposed to currency exchange rate
fluctuations between the U.S. dollar and Canadian dollar.
Page
54
As
of December 26, 2009, the total notional value of our foreign exchange forward
contracts was as follows (notional amounts and U.S. dollar equivalents in
millions):
|
Transaction
|
Currency
|
Notional
Amount
|
U.S.
Equivalent
|
Balance
sheet close rate on December 26, 2009
|
||||
|
Purchase
|
Euro
|
€229.1
|
$329.9
|
$1.44/€1.00
|
||||
|
Sell
|
Euro
|
€109.9
|
$158.3
|
$1.44/€1.00
|
||||
|
Sell
|
U.S.
dollar for Euro
|
$27.2
|
$27.2
|
n/a
|
||||
|
Purchase
|
Malaysian
ringgits
|
MYR
104.5
|
$30.3
|
$0.29/MYR1.00
|
||||
|
Sell
|
Malaysian
ringgits
|
MYR
22.8
|
$6.6
|
$0.29/MYR1.00
|
||||
|
Purchase
|
Japanese
yen
|
JPY
275.0
|
$2.8
|
$0.01/JPY1.00
|
||||
|
Sell
|
Japanese
yen
|
JPY
70.0
|
$0.7
|
$0.01/JPY1.00
|
||||
|
Purchase
|
Canadian
dollar
|
CAD
108.4
|
$103.0
|
$0.95/CAD1.00
|
||||
|
Sell
|
Canadian
dollar
|
CAD
120.1
|
$114.1
|
$0.95/CAD1.00
|
If
the U.S. dollar would have weakened by 10% against the euro, Malaysian
ringgit, Canadian dollar and Japanese yen, the favorable impact on our income
before income taxes related to our foreign exchange contracts to purchase and
sell euro, Malaysian ringgit, Canadian dollars and Japanese yen would have been
$0.5 million.
Cash Flow Exposure:
We expect
many of the components of our business to have material future cash flows,
including revenues and expenses, which will be denominated in currencies other
than the components’ functional currency. Our primary cash flow exposures are
future customer collections and vendor payments. Changes in the exchange rates
between our components’ functional currency and the other currencies in which
they transact business will cause fluctuations in the cash flows we expect to
receive when these cash flows are realized or settled. Accordingly, we may enter
into foreign exchange forward contracts to hedge the value of a portion of these
forecasted cash flows. We account for these foreign exchange contracts as cash
flow hedges. We initially report the effective portion of the derivative’s gain
or loss in accumulated other comprehensive income (loss) and subsequently
reclassify amounts into earnings when the hedged transaction is
realized.
Most
of our German plant’s operating expenses are denominated in euros, creating
natural hedges against the currency risk in our net sales. In addition, we
purchased foreign exchange forward contracts to hedge the exchange risk on
forecasted cash flows denominated in euro. As of December 26, 2009, the
unrealized loss on these contracts was $15.9 million and the total notional
value of the contracts was €361.0 million ($519.8 million at the
balance sheet close rate on December 26, 2009 of $1.44/€1.00). The weighted
average forward exchange rate for these contracts was $1.40/€1.00 at December
26, 2009.
Earnings Translation
Exposure:
Fluctuations in foreign currency exchange rates create
volatility in our reported results of operations because we are required to
consolidate financial statements of our foreign currency denominated
subsidiaries. We may decide to purchase forward exchange contracts or other
instruments to offset this impact from currency fluctuations. These contracts
would be marked-to-market on a monthly basis and any unrealized gain or loss
would be recorded in interest and other income, net. We do not hedge translation
exposure at this time, but may do so in the future.
In
the past, currency exchange rate fluctuations have had an impact on our business
and results of operations. For example, currency exchange rate fluctuations
negatively impacted our cash flows by $3.2 million and $20.2 million
in the years ended December 26, 2009 and December 27, 2008, respectively.
Although we cannot predict the impact of future currency exchange rate
fluctuations on our business or results of operations, we believe that we will
continue to have risk associated with currency exchange rate fluctuations in the
future.
Page
55
Interest
Rate Risk
We
are exposed to interest rate risk because many of our customers depend on debt
and equity financing to purchase and install a solar power system. Although the
useful life of a solar electricity generation system is considered to be
approximately 25 years, end-users of our solar modules must pay the entire
cost of the system at the time of installation. As a result, many of our
customers rely on debt financing to fund their up-front capital expenditures. An
increase in interest rates could make it difficult for our end-users to secure
the financing necessary to purchase and install a system. This could lower
demand for our solar modules and system development services and reduce our net
sales. In addition, we believe that a significant percentage of our end-users
install solar power systems as an investment, funding the initial capital
expenditure through a combination of equity and debt. An increase in interest
rates could lower an investor’s return on investment in a system or make
alternative investments more attractive relative to solar power systems, which,
in each case, could cause these end-users to seek alternative investments that
promise higher returns.
During
2006, we entered into a credit facility with a consortium of banks for the
financing of our German plant, which bore interest at the Euro Interbank Offered
Rate (Euribor) plus 1.6%. We had interest rate swap contracts with a financial
institution that effectively converted to fixed rates the variable rate of
Euribor on the term loan portion of this credit facility. These swap contracts
were required under the credit facility agreement which we repaid and terminated
on June 30, 2009. Therefore, we terminated these interest rate swap contracts on
June 26, 2009 and consequently recognized interest expense of €1.7 million
($2.4 million at the balance sheet close rate on December 26, 2009 of
$1.44/€1.00). The termination of the interest rate swap contracts settled on
June 30, 2009.
During
May 2008, we entered into a euro-denominated credit facility to finance some of
the equipment cost for our Malaysian manufacturing center. The loans under the
fixed-rate portion of the credit facility bear interest on the outstanding
unpaid principal balance at an annual rate of 4.54%. The loans under the
floating-rate portion of the credit facility bear interest on the outstanding
unpaid principal balance at Euribor plus a margin of 0.55%. On May 29, 2009, we
entered into an interest rate swap contract with a notional value of
€57.3 million ($82.5 million at the balance sheet close rate on
December 26, 2009 of $1.44/€1.00) to receive a six-month floating interest rate,
equal to Euribor, and pay a fixed rate of 2.80%. This contract became effective
on September 30, 2009. The notional amount of the interest rate swap contract is
scheduled to decline in correspondence to our scheduled principal payments on
the underlying hedged debt.
In
addition, we invest in debt securities, which exposes us to interest rate risk.
The primary objective of our investment activities is to preserve principal and
provide liquidity on demand, while at the same time maximizing the income we
receive from our investments without significantly increasing risk. Some of the
securities in which we invest may be subject to market risk. This means that a
change in prevailing interest rates may cause the market value of the investment
to fluctuate. For example, if we hold a security that was issued with an
interest rate fixed at the then-prevailing rate and the prevailing interest rate
later rises, the market value of our investment will probably decline. To
minimize this risk, we maintain our portfolio of cash equivalents and marketable
securities in a variety of securities, including money market mutual funds,
government and non-government debt securities and certificates of deposit. As of
December 26, 2009, our fixed-income investments earned a pre-tax yield of 1.08%,
with a weighted average maturity of 7.2 months. If interest rates were to
instantaneously increase (decrease) by 100 basis points, the market value
of our total investment portfolio could decrease (increase) by
$4.8 million. The direct risk to us associated with fluctuating interest
rates is limited to our investment portfolio and we do not believe that a 10%
change in interest rates would have a significant impact on our financial
position, results of operations or cash flows. As of December 26, 2009, all of
our investments were in money market mutual funds, federal and foreign agency
debt, supranational debt, corporate debt securities, foreign government
obligations and asset backed securities.
Commodity
and Component Risk
We
are exposed to price risks for the raw materials, components and energy costs
used in the manufacture and transportation of our solar modules. Also, some of
our raw materials and components are sourced from a limited number of suppliers
or a sole supplier. We endeavor to qualify multiple suppliers, a process which
could take up to 12 months if successful, but some suppliers are unique and
it may not be feasible to qualify second source suppliers. In some cases, we
also enter into long-term supply contracts for raw materials and components, but
these arrangements are normally of shorter duration than the term of our
Long-Term Supply Contracts with our customers. As a result, we remain exposed to
price changes in the raw materials and components used in our solar modules. In
addition, a failure by a key supplier could disrupt our supply chain which could
result in higher prices for our raw materials and components and even a
disruption in our manufacturing process. Since our selling price under our
Long-Term Supply Contracts does not adjust in the event of price changes in our
underlying raw materials or components and since our Long-Term Supply Contracts
require minimum deliveries of our products during their terms, we are unable to
pass along changes in the cost of the raw materials and components for our
products and may be in default of our delivery obligations if we experience a
manufacturing disruption.
Page
56
Credit
Risk
We
have certain financial and derivative instruments that subject us to credit
risk. These consist primarily of cash, cash equivalents, investments, trade
accounts receivable, interest rate swap contracts and foreign exchange forward
contracts. We are exposed to credit losses in the event of nonperformance by the
counterparties to our financial and derivative instruments. We place cash, cash
equivalents, investments, interest rate swap contracts and foreign exchange
forward contracts with various high-quality financial institutions and limit the
amount of credit risk from any one counterparty. We continuously evaluate the
credit standing of our counterparty financial institutions.
Consolidated
Financial Statements
Our
consolidated financial statements as required by this item are included in “Item
15: Exhibits and Financial Statement Schedules - Consolidated Financial
Statements” of this Annual Report on Form 10-K. See Item 15(a) for a
list of our consolidated financial statements.
Selected
Quarterly Financial Data (Unaudited)
The
following selected quarterly financial date should be read in conjunction with
our consolidated financial statements, the related notes and “Item 7:
Management’s Discussion and Analysis of Financial Condition and Results of
Operations.” This information has been derived from our unaudited consolidated
financial statements that, in our opinion, reflect all recurring adjustments
necessary to fairly present this information when read in conjunction with our
consolidated financial statements and the related notes appearing in the section
entitled “Consolidated Financial Statements.” The results of operations for any
quarter are not necessarily indicative of the results to be expected for any
future period.
|
Quarters
Ended
|
||||||||||||||||||||||||||||||||
|
|
Dec 26,
2009
|
Sep 26,
2009
|
Jun 27,
2009
|
Mar 28,
2009
|
Dec 27,
2008
|
Sep 27,
2008
|
Jun 28,
2008
|
Mar 29,
2008
|
||||||||||||||||||||||||
|
(In
thousands, except per share amounts)
|
||||||||||||||||||||||||||||||||
|
Net
sales
|
$ | 641,265 | $ | 480,851 | $ | 525,876 | $ | 418,208 | $ | 433,651 | $ | 348,694 | $ | 267,041 | $ | 196,915 | ||||||||||||||||
|
Cost
of sales
|
375,056 | 235,858 | 227,780 | 182,924 | 199,725 | 153,251 | 122,341 | 92,591 | ||||||||||||||||||||||||
|
Gross
profit
|
266,209 | 244,993 | 298,096 | 235,284 | 233,926 | 195,443 | 144,700 | 104,324 | ||||||||||||||||||||||||
|
Operating
expenses:
|
||||||||||||||||||||||||||||||||
|
Research
and development
|
23,716 | 24,136 | 18,605 | 11,704 | 11,080 | 9,952 | 7,725 | 4,760 | ||||||||||||||||||||||||
|
Selling,
general and administrative
|
96,667 | 53,990 | 72,926 | 49,315 | 52,747 | 48,995 | 43,626 | 28,671 | ||||||||||||||||||||||||
|
Production
start-up
|
1,099 | 4,076 | 2,524 | 6,209 | 8,771 | 6,344 | 4,622 | 12,761 | ||||||||||||||||||||||||
|
Total
operating expenses
|
121,482 | 82,202 | 94,055 | 67,228 | 72,598 | 65,291 | 55,973 | 46,192 | ||||||||||||||||||||||||
|
Operating
income
|
144,727 | 162,791 | 204,041 | 168,056 | 161,328 | 130,152 | 88,727 | 58,132 | ||||||||||||||||||||||||
|
Foreign
currency gain (loss)
|
3,020 | 114 | 239 | 1,834 | 6,190 | (1,889 | ) | 647 | 774 | |||||||||||||||||||||||
|
Interest
and other income (loss) , net
|
2,570 | 2,062 | (2,982 | ) | (158 | ) | 4,094 | 4,836 | 4,482 | 6,303 | ||||||||||||||||||||||
|
Income
before income taxes
|
150,317 | 164,967 | 201,298 | 169,732 | 171,612 | 133,099 | 93,856 | 65,209 | ||||||||||||||||||||||||
|
Income
tax expense
|
8,697 | 11,623 | 20,719 | 5,137 | 38,841 | 33,830 | 24,185 | 18,590 | ||||||||||||||||||||||||
|
Net
income
|
$ | 141,620 | $ | 153,344 | $ | 180,579 | $ | 164,595 | $ | 132,771 | $ | 99,269 | $ | 69,671 | $ | 46,619 | ||||||||||||||||
|
Net
income per share:
|
||||||||||||||||||||||||||||||||
|
Basic
|
$ | 1.68 | $ | 1.82 | $ | 2.16 | $ | 2.01 | $ | 1.63 | $ | 1.23 | $ | 0.87 | $ | 0.59 | ||||||||||||||||
|
Diluted
|
$ | 1.65 | $ | 1.79 | $ | 2.11 | $ | 1.99 | $ | 1.61 | $ | 1.20 | $ | 0.85 | $ | 0.57 | ||||||||||||||||
|
Weighted-average
number of shares used in per share calculations:
|
||||||||||||||||||||||||||||||||
|
Basic
|
84,413 | 84,179 | 83,723 | 81,685 | 81,345 | 80,430 | 79,877 | 79,059 | ||||||||||||||||||||||||
|
Diluted
|
86,004 | 85,892 | 85,668 | 82,612 | 82,450 | 82,436 | 82,004 | 81,607 | ||||||||||||||||||||||||
Page
57
None.
(a)
Evaluation of Disclosure Controls and Procedures
We
maintain “disclosure controls and procedures,” as such term is defined in
Rule 13a-15(e) and 15d-15(e) under the Exchange Act, that are designed to
ensure that information required to be disclosed by us in reports that we file
or submit under the Exchange Act is recorded, processed, summarized and reported
within the time periods specified in SEC rules and forms, and that such
information is accumulated and communicated to our management, including our
Chief Executive Officer and Chief Financial Officer, as appropriate to allow
timely decisions regarding required disclosure. In designing and evaluating our
disclosure controls and procedures, management recognized that disclosure
controls and procedures, no matter how well conceived and operated, can provide
only reasonable, not absolute, assurance that the objectives of the disclosure
controls and procedures are met. Additionally, in designing disclosure controls
and procedures, our management was required to apply its judgment in evaluating
the cost-benefit relationship of possible disclosure controls and procedures.
The design of any disclosure control and procedure also is based in part upon
certain assumptions about the likelihood of future events, and there can be no
assurance that any design will succeed in achieving its stated goals under all
potential future conditions.
Based
on their evaluation as of the end of the period covered by this Annual Report on
Form 10-K, our Chief Executive Officer and Chief Financial Officer have
concluded that our disclosure controls and procedures were effective at the
reasonable assurance level.
(b)
Management’s Report on Internal Control over Financial Reporting
Our
management is responsible for establishing and maintaining adequate “internal
control over financial reporting,” as such term is defined in Exchange Act
Rules 13a-15(f) and 15d-15(f). Under the supervision and with the
participation of our management, including our Chief Executive Officer and Chief
Financial Officer, we conducted an evaluation of the effectiveness of our
internal control over financial reporting as of December 26, 2009 based on the
criteria established in
Internal Control — Integrated
Framework
issued by the Committee of Sponsoring Organizations of the
Treadway Commission (COSO). Our internal control over financial reporting is a
process designed to provide reasonable assurance regarding the reliability of
financial reporting and the preparation of financial statements for external
purposes in accordance with generally accepted accounting principles in the
United States of America.
Based
on the results of our evaluation, our management concluded that our internal
control over financial reporting was effective as of December 26,
2009.
The
effectiveness of our internal control over financial reporting as of December
26, 2009 has been audited by PricewaterhouseCoopers LLP, an independent
registered public accounting firm, as stated in their report which appears
herein.
(c)
Changes in Internal Control over Financial Reporting
There
was no change in our internal control over financial reporting that occurred
during the fourth quarter ended December 26, 2009 covered by this Annual Report
on Form 10-K that has materially affected, or is reasonably likely to
materially affect, our internal control over financial
reporting.
Page
58
(d)
Inherent Limitations on Effectiveness of Controls
Our
management, including our Chief Executive Officer and Chief Financial Officer,
do not expect that our disclosure controls or our internal control over
financial reporting will prevent all errors and all fraud. A control system, no
matter how well conceived and operated, can provide only reasonable, not
absolute, assurance that the objectives of the control system are met. Further,
the design of a control system must reflect the fact that there are resource
constraints, and the benefits of controls must be considered relative to their
costs. Because of the inherent limitations in all control systems, no evaluation
of controls can provide absolute assurance that all control issues and instances
of fraud, if any, within our Company have been detected. These inherent
limitations include the realities that judgments in decision-making can be
faulty, and that breakdowns can occur because of a simple error or mistake.
Additionally, controls can be circumvented by the individual acts of some
persons, by collusion of two or more people or by management override of the
controls. The design of any system of controls also is based in part upon
certain assumptions about the likelihood of future events, and there can be no
assurance that any design will succeed in achieving its stated goals under all
potential future conditions; over time, controls may become inadequate because
of changes in conditions, or the degree of compliance with policies or
procedures may deteriorate. Because of the inherent limitations in a
cost-effective control system, misstatements due to error or fraud may occur and
not be detected.
None.
Information
concerning our board of directors and audit committee will appear in our 2010
Proxy Statement, under the section entitled “Directors.” The information in that
portion of the Proxy Statement is incorporated in this Annual Report on
Form 10-K by reference.
For
information with respect to our executive officers, see “Item 1: Business –
Executive Officers of the Registrant.” of this Annual Report on Form
10-K.
Information
concerning Section 16(a) beneficial ownership reporting compliance will
appear in our 2010 Proxy Statement under the section entitled
“Section 16(a) Beneficial Ownership Reporting Compliance.” The information
in that portion of the Proxy Statement is incorporated in this Annual Report on
Form 10-K by reference.
We
have adopted a Code of Business Conduct and Ethics that applies to all
directors, officers and associates of First Solar. Information concerning this
code will appear in our 2010 Proxy Statement under the section entitled
“Proposal No. 1 — Election of Directors — Corporate
Governance.” The information in that portion of the Proxy Statement is
incorporated in this Annual Report on Form 10-K by reference.
Information
concerning executive compensation and related information will appear in our
2010 Proxy Statement under the section entitled “Executive Compensation and
Related Information.” The information in that portion of the Proxy Statement is
incorporated in this Annual Report on Form 10-K by reference.
Information
concerning the security ownership of certain beneficial owners and management
and related stockholder matters, including information regarding our equity
compensation plans, will appear in our 2010 Proxy Statement under the section
entitled “Security Ownership of Certain Beneficial Owners and Management and
Related Stockholder Matters.” The information in that portion of the Proxy
Statement is incorporated in this Annual Report on Form 10-K by
reference.
Page
59
Information
concerning certain relationships and related party transactions will appear in
our 2010 Proxy Statement under the section entitled “Certain Relationships and
Related Party Transactions.” The information in that portion of the Proxy
Statement is incorporated in this Annual Report on Form 10-K by
reference.
Information
concerning principal accountant fees and services and the audit committee’s
pre-approval policies and procedures will appear in our 2010 Proxy Statement
under the section entitled “Principal Accountant Fees and Services.” The
information in that portion of the Proxy Statement is incorporated in this
Annual Report on Form 10-K by reference.
(a) The
following documents are filed as part of this Annual Report on
Form 10-K:
(1) Consolidated
Financial Statements
|
Report
of Independent Registered Public Accounting Firm
|
|
Financial
Statements
|
|
Consolidated
Balance Sheets
|
|
Consolidated
Statements of Operations
|
|
Consolidated
Statements of Stockholders’ Equity and Comprehensive
Income
|
|
Consolidated
Statements of Cash Flows
|
|
Notes
to Consolidated Financial Statements
|
|
(2)
Financial Statement Schedule:
|
|
Schedule II —
Valuation and Qualifying Accounts
|
SCHEDULE II:
VALUATION AND QUALIFYING ACCOUNTS
For
the Years Ended December 26, 2009, December 27, 2008 and
December 29, 2007
|
Description
|
Balance
at
Beginning
of
Year
|
Additions
|
Deductions
|
Balance
at
End of
Year
|
||||||||||||
|
(In
thousands)
|
||||||||||||||||
|
Allowance
for doubtful accounts receivable
|
||||||||||||||||
|
Year
ended December 29, 2007
|
$ | 4 | $ | 5 | $ | (4 | ) | $ | 5 | |||||||
|
Year
ended December 27, 2008
|
$ | 5 | $ | 711 | $ | (716 | ) | $ | — | |||||||
|
Year
ended December 26, 2009
|
$ | — | $ | 6,990 | $ | (6,000 | ) | $ | 990 | |||||||
|
Provision
for inventory reserve
|
||||||||||||||||
|
Year
ended December 29, 2007
|
$ | 11 | $ | 45 | $ | (11 | ) | $ | 45 | |||||||
|
Year
ended December 27, 2008
|
$ | 45 | $ | 2,548 | $ | (1,617 | ) | $ | 976 | |||||||
|
Year
ended December 26, 2009
|
$ | 976 | $ | — | $ | (976 | ) | $ | — | |||||||
|
Valuation
allowance against our deferred tax assets
|
||||||||||||||||
|
Year
ended December 29, 2007
|
$ | 54,890 | $ | 596 | $ | (54,890 | ) | $ | 596 | |||||||
|
Year
ended December 27, 2008
|
$ | 596 | $ | 1,097 | $ | (596 | ) | $ | 1,097 | |||||||
|
Year
ended December 26, 2009
|
$ | 1,097 | $ | 2,093 | $ | — | $ | 3,190 | ||||||||
(3) Exhibits:
See Item 15(b) below.
(b) Exhibits:
The exhibits listed on the accompanying Index to Exhibits on this Form 10-K
are filed, or incorporated into this Form 10-K by reference.
(c) Financial
Statement Schedule: See Item 15(a) above.
Page
60
SIGNATURES
Pursuant
to the requirements of Section 13 or 15(d) of the Securities Exchange Act
of 1934, as amended, the registrant has duly caused this Annual Report to be
signed on its behalf by the undersigned, thereunto duly authorized on February
19, 2010.
| FIRST SOLAR, INC. |
|
By:
/s/
JAMES
ZHU
|
| James Zhu |
| Principal Accounting Officer |
Pursuant
to the requirements of the Securities Exchange Act of 1934, this report has been
signed below by the following persons on behalf of the Registrant and in the
capacities and on the dates indicated.
| Signature | Title | Date |
| /s/ MICHAEL J. AHEARN | Executive Chairman and Chairman of the Board of Directors | February 19, 2010 |
| Michael J. Ahearn | ||
| /s/ ROBERT J. GILLETTE | Chief Executive Officer and Director | February 19, 2010 |
| Robert J. Gillette | ||
| /s/ JENS MEYERHOFF | Chief Financial Officer | February 19, 2010 |
| Jens Meyerhoff | ||
| /s/ JAMES Z HU | Vice President, Chief Accounting Officer | February 19, 2010 |
| James Zhu | (Principal Accounting Officer) | |
| Additional Directors: | ||
| /s/ JAMES F. NOLAN | Director | February 19, 2010 |
| James F. Nolan | ||
| /s/ J. THOMAS PRESBY | Director | February 19, 2010 |
| J. Thomas Presby | ||
| /s/ PAUL H. STEBBINS | Director | February 19, 2010 |
| Paul H. Stebbins | ||
| /s/ MICHAEL SWEENEY | Director | February 19, 2010 |
| Michael Sweeney | ||
| /s/ CRAIG KENNEDY | Director | February 19, 2010 |
| Craig Kennedy | ||
| /s/ JOSE VILLARREAL | Director | February 19, 2010 |
| Jose Villarreal |
Page
61
REPORT
OF INDEPENDENT REGISTERED PUBLIC ACCOUNTING FIRM
To
the Board of Directors and Stockholders of First Solar, Inc.
In our
opinion, the consolidated financial statements listed in the index appearing
under Item 15(a)(1) present fairly, in all material respects, the financial
position of First Solar, Inc. and its subsidiaries at December 26, 2009 and
December 27, 2008, and the results of their operations and their cash flows for
each of the three years in the period ended December 26, 2009 in conformity with
accounting principles generally accepted in the United States of
America. In addition, in our opinion, the financial statement
schedule listed in the index appearing under Item 15(a)(2) presents fairly, in
all material respects, the information set forth therein when read in
conjunction with the related consolidated financial statements. Also in our
opinion, the Company maintained, in all material respects, effective internal
control over financial reporting as of December 26, 2009, based on criteria
established in
Internal
Control - Integrated Framework
issued by the Committee of Sponsoring
Organizations of the Treadway Commission (COSO). The Company's
management is responsible for these financial statements and financial statement
schedule, for maintaining effective internal control over financial reporting
and for its assessment of the effectiveness of internal control over financial
reporting, included in Management's Report on Internal Control over Financial
Reporting appearing under Item 9A. Our responsibility is to express
opinions on these financial statements, on the financial statement schedule, and
on the Company's internal control over financial reporting based on our
integrated audits. We conducted our audits in accordance with the
standards of the Public Company Accounting Oversight Board (United
States). Those standards require that we plan and perform the audits
to obtain reasonable assurance about whether the financial statements are free
of material misstatement and whether effective internal control over financial
reporting was maintained in all material respects. Our audits of the
financial statements included examining, on a test basis, evidence supporting
the amounts and disclosures in the financial statements, assessing the
accounting principles used and significant estimates made by management, and
evaluating the overall financial statement presentation. Our audit of
internal control over financial reporting included obtaining an understanding of
internal control over financial reporting, assessing the risk that a material
weakness exists, and testing and evaluating the design and operating
effectiveness of internal control based on the assessed risk. Our
audits also included performing such other procedures as we considered necessary
in the circumstances. We believe that our audits provide a reasonable basis for
our opinions.
A company’s
internal control over financial reporting is a process designed to provide
reasonable assurance regarding the reliability of financial reporting and the
preparation of financial statements for external purposes in accordance with
generally accepted accounting principles. A company’s internal
control over financial reporting includes those policies and procedures that
(i) pertain to the maintenance of records that, in reasonable detail,
accurately and fairly reflect the transactions and dispositions of the assets of
the company; (ii) provide reasonable assurance that transactions are
recorded as necessary to permit preparation of financial statements in
accordance with generally accepted accounting principles, and that receipts and
expenditures of the company are being made only in accordance with
authorizations of management and directors of the company; and
(iii) provide reasonable assurance regarding prevention or timely detection
of unauthorized acquisition, use, or disposition of the company’s assets that
could have a material effect on the financial statements.
Because of
its inherent limitations, internal control over financial reporting may not
prevent or detect misstatements. Also, projections of any evaluation
of effectiveness to future periods are subject to the risk that controls may
become inadequate because of changes in conditions, or that the degree of
compliance with the policies or procedures may deteriorate.
/s/ PricewaterhouseCoopers LLP
Phoenix,
Arizona
February
19, 2010
Page
62
FIRST
SOLAR, INC. AND SUBSIDIARIES
CONSOLIDATED
BALANCE SHEETS
(In
thousands, except share data)
|
|
December
26,
2009
|
December 27,
2008
|
||||||
|
ASSETS
|
||||||||
|
Current
assets:
|
||||||||
|
Cash
and cash equivalents
|
$ | 664,499 | $ | 716,218 | ||||
|
Marketable
securities
|
120,236 | 76,042 | ||||||
|
Accounts
receivable, net
|
226,826 | 61,703 | ||||||
|
Inventories
|
152,821 | 121,554 | ||||||
|
Project
assets
|
1,081 | — | ||||||
|
Deferred
tax asset, net
|
21,679 | 9,922 | ||||||
|
Prepaid
expenses and other current assets
|
164,129 | 91,962 | ||||||
|
Total
current assets
|
1,351,271 | 1,077,401 | ||||||
|
Property,
plant and equipment, net
|
988,782 | 842,622 | ||||||
|
Project
assets
|
131,415 | — | ||||||
|
Deferred
tax asset, net
|
130,515 | 61,325 | ||||||
|
Marketable
securities
|
329,608 | 29,559 | ||||||
|
Restricted
cash and investments
|
36,494 | 30,059 | ||||||
|
Investment
in related party
|
25,000 | 25,000 | ||||||
|
Goodwill
|
286,515 | 33,829 | ||||||
|
Inventories
|
21,695 | — | ||||||
|
Other
assets
|
48,217 | 14,707 | ||||||
|
Total
assets
|
$ | 3,349,512 | $ | 2,114,502 | ||||
|
LIABILITIES
AND STOCKHOLDERS’ EQUITY
|
||||||||
|
Current
liabilities:
|
||||||||
|
Accounts
payable
|
$ | 75,744 | $ | 46,251 | ||||
|
Income
tax payable
|
8,740 | 99,938 | ||||||
|
Accrued
expenses
|
186,682 | 140,899 | ||||||
|
Current
portion of long-term debt
|
28,559 | 34,951 | ||||||
|
Other
current liabilities
|
95,202 | 59,738 | ||||||
|
Total
current liabilities
|
394,927 | 381,777 | ||||||
|
Accrued
solar module collection and recycling liability
|
92,799 | 35,238 | ||||||
|
Long-term
debt
|
146,399 | 163,519 | ||||||
|
Other
liabilities
|
62,600 | 20,926 | ||||||
|
Total
liabilities
|
696,725 | 601,460 | ||||||
|
Stockholders’
equity:
|
||||||||
|
Common
stock, $0.001 par value per share; 500,000,000 shares
authorized; 85,208,199 and 81,596,810 shares issued and outstanding
at December 26, 2009 and December 27, 2008,
respectively
|
85 | 82 | ||||||
|
Additional
paid-in capital
|
1,658,091 | 1,176,156 | ||||||
|
Contingent
consideration
|
2,844 | — | ||||||
|
Accumulated
earnings
|
1,001,363 | 361,225 | ||||||
|
Accumulated
other comprehensive loss
|
(9,596 | ) | (24,421 | ) | ||||
|
Total
stockholders’ equity
|
2,652,787 | 1,513,042 | ||||||
|
Total
liabilities and stockholders’ equity
|
$ | 3,349,512 | $ | 2,114,502 | ||||
See
accompanying notes to these consolidated financial statements.
Page
63
FIRST
SOLAR, INC. AND SUBSIDIARIES
CONSOLIDATED
STATEMENTS OF OPERATIONS
(In
thousands, except per share amounts)
|
Years
Ended
|
||||||||||||
|
|
December 26,
2009
|
December 27,
2008
|
December 29,
2007
|
|||||||||
|
Net
sales
|
$ | 2,066,200 | $ | 1,246,301 | $ | 503,976 | ||||||
|
Cost
of sales
|
1,021,618 | 567,908 | 252,573 | |||||||||
|
Gross
profit
|
1,044,582 | 678,393 | 251,403 | |||||||||
|
Operating
expenses:
|
||||||||||||
|
Research
and development
|
78,161 | 33,517 | 15,107 | |||||||||
|
Selling,
general and administrative
|
272,898 | 174,039 | 82,248 | |||||||||
|
Production
start-up
|
13,908 | 32,498 | 16,867 | |||||||||
|
Total
operating expenses
|
364,967 | 240,054 | 114,222 | |||||||||
|
Operating
income
|
679,615 | 438,339 | 137,181 | |||||||||
|
Foreign
currency gain
|
5,207 | 5,722 | 1,881 | |||||||||
|
Interest
income
|
9,735 | 21,158 | 20,413 | |||||||||
|
Interest
expense, net
|
(5,258 | ) | (509 | ) | (2,294 | ) | ||||||
|
Other
expense, net
|
(2,985 | ) | (934 | ) | (1,219 | ) | ||||||
|
Income
before income taxes
|
686,314 | 463,776 | 155,962 | |||||||||
|
Income
tax expense (benefit)
|
46,176 | 115,446 | (2,392 | ) | ||||||||
|
Net
income
|
$ | 640,138 | $ | 348,330 | $ | 158,354 | ||||||
|
Net
income per share:
|
||||||||||||
|
Basic
|
$ | 7.67 | $ | 4.34 | $ | 2.12 | ||||||
|
Diluted
|
$ | 7.53 | $ | 4.24 | $ | 2.03 | ||||||
|
Weighted-average
number of shares used in per share calculations:
|
||||||||||||
|
Basic
|
83,500 | 80,178 | 74,701 | |||||||||
|
Diluted
|
85,044 | 82,124 | 77,971 | |||||||||
See
accompanying notes to these consolidated financial statements.
Page
64
FIRST
SOLAR, INC. AND SUBSIDIARIES
CONSOLIDATED
STATEMENTS OF STOCKHOLDERS’ EQUITY AND COMPREHENSIVE INCOME
(In
thousands)
|
Accumulated
|
||||||||||||||||||||||||||||
|
Additional
|
Accumulated
|
Other
|
||||||||||||||||||||||||||
|
Common
Stock
|
Paid-In
|
Contingent
|
Earnings
|
Comprehensive
|
Total
|
|||||||||||||||||||||||
|
Shares
|
Amount
|
Capital
|
Consideration
|
(Deficit)
|
Income
(Loss)
|
Equity
|
||||||||||||||||||||||
|
Balance,
December 30, 2006
|
72,332 | 72 | 555,749 | — | (145,403 | ) | 1,022 | 411,440 | ||||||||||||||||||||
|
Components
of comprehensive income, net of tax:
|
||||||||||||||||||||||||||||
|
Net
income
|
— | — | — | — | 158,354 | — | 158,354 | |||||||||||||||||||||
|
Foreign
currency translation adjustments
|
— | — | — | — | — | 5,116 | 5,116 | |||||||||||||||||||||
|
Unrealized
loss on derivative instruments, net of tax
|
— | — | — | — | — | (1,648 | ) | (1,648 | ) | |||||||||||||||||||
|
Unrealized
gain on marketable securities, net of tax
|
— | — | — | — | — | 28 | 28 | |||||||||||||||||||||
|
Total
comprehensive income
|
161,850 | |||||||||||||||||||||||||||
|
Cumulative
effect of the adoption of accounting for the uncertainty in income
taxes
|
— | — | — | — | (56 | ) | — | (56 | ) | |||||||||||||||||||
|
Exercise
of stock options, including tax benefits
|
2,048 | 2 | 40,367 | — | — | — | 40,369 | |||||||||||||||||||||
|
Issuance
of restricted and unrestricted stock
|
77 | — | — | — | — | — | — | |||||||||||||||||||||
|
Common
stock issued for acquisition
|
118 | 1 | 28,066 | — | — | — | 28,067 | |||||||||||||||||||||
|
Common
stock issued in secondary offering, net of offering costs
|
4,000 | 4 | 365,965 | — | — | — | 365,969 | |||||||||||||||||||||
|
Share-based
compensation
|
— | — | 39,402 | — | — | — | 39,402 | |||||||||||||||||||||
|
Reclassifications
from employee stock options on redeemable shares
|
— | — | 50,226 | — | — | — | 50,226 | |||||||||||||||||||||
|
Balance,
December 29, 2007
|
78,575 | 79 | 1,079,775 | — | 12,895 | 4,518 | 1,097,267 | |||||||||||||||||||||
|
Components
of comprehensive income, net of tax:
|
||||||||||||||||||||||||||||
|
Net
income
|
— | — | — | — | 348,330 | — | 348,330 | |||||||||||||||||||||
|
Foreign
currency translation adjustments
|
— | — | — | — | — | (13,943 | ) | (13,943 | ) | |||||||||||||||||||
|
Unrealized
loss on derivative instruments, net of tax
|
— | — | — | — | — | (15,230 | ) | (15,230 | ) | |||||||||||||||||||
|
Unrealized
gain on marketable securities, net of tax
|
— | — | — | — | — | 234 | 234 | |||||||||||||||||||||
|
Total
comprehensive income
|
319,391 | |||||||||||||||||||||||||||
|
Exercise
of stock options, including tax benefits
|
2,980 | 3 | 44,694 | — | — | — | 44,697 | |||||||||||||||||||||
|
Issuance
of restricted and unrestricted stock
|
42 | — | (7,040 | ) | — | — | — | (7,040 | ) | |||||||||||||||||||
|
Share-based
compensation
|
— | — | 58,727 | — | — | — | 58,727 | |||||||||||||||||||||
|
Balance,
December 27, 2008
|
81,597 | 82 | 1,176,156 | — | 361,225 | (24,421 | ) | 1,513,042 | ||||||||||||||||||||
|
Components
of comprehensive income, net of tax:
|
||||||||||||||||||||||||||||
|
Net
income
|
— | — | — | — | 640,138 | — | 640,138 | |||||||||||||||||||||
|
Foreign
currency translation adjustments
|
— | — | — | — | — | 13,303 | 13,303 | |||||||||||||||||||||
|
Unrealized
loss on derivative instruments, net of tax
|
— | — | — | — | — | (167 | ) | (167 | ) | |||||||||||||||||||
|
Unrealized
gain on marketable securities, net of tax
|
— | — | — | — | — | 1,689 | 1,689 | |||||||||||||||||||||
|
Total
comprehensive income
|
654,963 | |||||||||||||||||||||||||||
|
Exercise
of stock options, including excess tax benefits
|
537 | 1 | 7,272 | — | — | — | 7,273 | |||||||||||||||||||||
|
Issuance
of restricted and unrestricted stock
|
123 | — | (11,387 | ) | — | — | — | (11,387 | ) | |||||||||||||||||||
|
Share-based
compensation
|
— | — | 89,463 | — | — | — | 89,463 | |||||||||||||||||||||
|
Common
stock issued for acquisition
|
2,951 | 2 | 396,587 | 2,844 | — | — | 399,433 | |||||||||||||||||||||
|
Balance,
December 26, 2009
|
85,208 | 85 | 1,658,091 | 2,844 | 1,001,363 | (9,596 | ) | 2,652,787 | ||||||||||||||||||||
See
accompanying notes to these consolidated financial statements.
Page
65
FIRST
SOLAR, INC. AND SUBSIDIARIES
CONSOLIDATED
STATEMENTS OF CASH FLOWS
(In
thousands)
|
Years
Ended
|
||||||||||||
|
|
December 26,
2009
|
December 27,
2008
|
December 29,
2007
|
|||||||||
|
Cash
flows from operating activities:
|
||||||||||||
|
Cash
received from customers
|
$ | 1,957,604 | $ | 1,203,822 | $ | 515,994 | ||||||
|
Cash
paid to suppliers and associates
|
(1,123,746 | ) | (723,123 | ) | (276,525 | ) | ||||||
|
Interest
received
|
6,147 | 19,138 | 19,965 | |||||||||
|
Interest
paid
|
(10,550 | ) | (4,629 | ) | (2,294 | ) | ||||||
|
Income
taxes paid, net of refunds
|
(147,843 | ) | (1,975 | ) | (19,002 | ) | ||||||
|
Excess
tax benefit from share-based compensation arrangements
|
(4,892 | ) | (28,661 | ) | (30,196 | ) | ||||||
|
Other
operating activities
|
(1,527 | ) | (1,505 | ) | (1,991 | ) | ||||||
|
Net
cash provided by operating activities
|
675,193 | 463,067 | 205,951 | |||||||||
|
Cash
flows from investing activities:
|
||||||||||||
|
Purchases
of property, plant and equipment
|
(279,941 | ) | (459,271 | ) | (242,371 | ) | ||||||
|
Purchases
of marketable securities
|
(607,356 | ) | (334,818 | ) | (1,081,154 | ) | ||||||
|
Proceeds
from maturities of marketable securities
|
149,076 | 107,450 | 787,783 | |||||||||
|
Proceeds
from sales of marketable securities
|
115,805 | 418,762 | — | |||||||||
|
Investment
in notes receivable
|
(99,637 | ) | — | — | ||||||||
|
Payments
received on notes receivable
|
25,447 | — | — | |||||||||
|
Increase
in restricted investments
|
(4,150 | ) | (15,564 | ) | (6,008 | ) | ||||||
|
Investment
in related party
|
— | (25,000 | ) | — | ||||||||
|
Acquisitions,
net of cash acquired
|
318 | — | (5,500 | ) | ||||||||
|
Other
investing activities
|
(1,252 | ) | — | — | ||||||||
|
Net
cash used in investing activities
|
(701,690 | ) | (308,441 | ) | (547,250 | ) | ||||||
|
Cash
flows from financing activities:
|
||||||||||||
|
Proceeds
from stock option exercises
|
5,961 | 16,036 | 10,173 | |||||||||
|
Proceeds
from issuance of common stock
|
— | — | 365,969 | |||||||||
|
Repayment
of long-term debt
|
(78,224 | ) | (41,691 | ) | (34,757 | ) | ||||||
|
Proceeds
from issuance of debt, net of issuance costs
|
44,739 | 138,887 | 49,368 | |||||||||
|
Excess
tax benefit from share-based compensation arrangements
|
4,892 | 28,661 | 30,196 | |||||||||
|
Proceeds
from economic development funding
|
615 | 35,661 | 9,475 | |||||||||
|
Other
financing activities
|
(4 | ) | (5 | ) | (3 | ) | ||||||
|
Net
cash (used in) provided by financing activities
|
(22,021 | ) | 177,549 | 430,421 | ||||||||
|
Effect
of exchange rate changes on cash and cash equivalents
|
(3,201 | ) | (20,221 | ) | 7,050 | |||||||
|
Net
increase (decrease) in cash and cash equivalents
|
(51,719 | ) | 311,954 | 96,172 | ||||||||
|
Cash
and cash equivalents, beginning of the period
|
716,218 | 404,264 | 308,092 | |||||||||
|
Cash
and cash equivalents, end of the period
|
$ | 664,499 | $ | 716,218 | $ | 404,264 | ||||||
|
Supplemental
disclosure of noncash investing and financing activities:
|
||||||||||||
|
Property,
plant and equipment acquisitions funded by liabilities
|
$ | — | $ | 19,449 | $ | 38,320 | ||||||
See
accompanying notes to these consolidated financial statements.
Page
66
FIRST
SOLAR, INC. AND SUBSIDIARIES
NOTES
TO CONSOLIDATED FINANCIAL STATEMENTS
We
design, manufacture and sell solar electric power modules, which we produce at
our plants in Perrysburg, Ohio, Frankfurt/Oder, Germany and Kulim, Malaysia. We
also develop sites or other solar power project sites for building solar power
systems using our solar modules and provide engineering, procurement and
construction services. First Solar Holdings, LLC was formed as a Delaware
limited liability company in May 2003 to act as the holding company for First
Solar, LLC — which was formed in 1999 and renamed First Solar US
Manufacturing, LLC in the second quarter of 2006, and other subsidiaries formed
during 2003 and later. On February 22, 2006, First Solar Holdings, LLC was
incorporated in Delaware as First Solar Holdings, Inc. and, also during the
first quarter of 2006, was renamed First Solar, Inc. Upon our change in
corporate organization on February 22, 2006, our membership units became
common stock shares and our unit options became share options on a one-for-one
basis.
Basis of presentation.
Certain
prior period amounts have been reclassified to conform to the current
presentation. We reclassified certain segment amounts as information provided to
our Chief Operating Decision Maker has changed. Our Chief Operating Decision
Maker consists of senior executive staff. This change was primarily due to how
they view our systems segment as an enabler to drive module throughput for our
components business with the objective of achieving break-even results before
income taxes for our systems segment. See also Note 22. “Segment Information” to
our consolidated financial statements for additional information. These
reclassifications had no impact on our consolidated statement of operations,
consolidated balance sheet or consolidated statement of cash
flows.
Principles of consolidation.
These consolidated financial statements are prepared in accordance with
accounting principles generally accepted in the United States of America
(U.S. GAAP) and include the accounts of First Solar, Inc. and all of its
subsidiaries. We eliminated all intercompany transactions and balances during
consolidation.
Fiscal periods.
We report the
results of our operations using a 52 or 53 week fiscal year, which ends on
the Saturday on or before December 31. Fiscal 2009 ended on
December 26, 2009; fiscal 2008 ended on December 27, 2008; and fiscal
2007 ended on December 29, 2007; all of these fiscal years included
52 weeks. Our fiscal quarters end on the Saturday on or before the end of
the applicable calendar quarter.
Use of estimates.
The
preparation of consolidated financial statements in conformity with
U.S. GAAP requires us to make estimates and assumptions that affect the
amounts reported in our consolidated financial statements and the accompanying
notes. Significant estimates in these consolidated financial statements include
revenue recognition, allowances for doubtful accounts receivable, inventory
write-downs, estimates of future cash flows from and the economic useful lives
of long-lived assets, asset impairments, certain accrued liabilities, income
taxes and tax valuation allowances, accrued warranty expenses, accrued
collection and recycling expense, share-based compensation costs and fair value
estimates. Actual results could differ materially from these estimates under
different assumptions and conditions.
Business Combinations.
We
account for business acquisitions using the acquisition method of accounting and
record definite lived intangible assets separate from goodwill. Intangible
assets are recorded at their fair value based on estimates as at the date of
acquisition. Goodwill is recorded as the residual amount of the purchase price
less the fair value assigned to the individual assets acquired and liabilities
assumed as of the date of acquisition.
Goodwill.
Goodwill represents
the excess of the purchase price of acquired businesses over the estimated fair
value assigned to the individual assets acquired and liabilities assumed. We do
not amortize goodwill, but instead test goodwill for impairment at least
annually in the fourth quarter, and, if necessary, we would record any
impairment in accordance with FASB Accounting Standards Codification Topic (ASC)
350,
Intangibles
-
Goodwill and Other
. We
will perform an impairment test between scheduled annual tests if facts and
circumstances indicate that it is more likely than not that the fair value of a
reporting unit that has goodwill is less than its carrying value. In the process
of our annual impairment review, we primarily use the income approach
methodology of valuation, which includes the discounted cash flow method, and
the market approach methodology of valuation, which considers values of
comparable businesses to determine the fair value of our goodwill. Significant
management judgment is required in the forecasts of future operating results and
the discount rates that we use in the discounted cash flow method of valuation
and in the selection of comparable businesses that we used in the market
approach.
Page
67
Investment in related party.
We own equity investments of another company in an amount that is not
sufficient to provide us with significant influence over the investee’s
operations. Since the fair values of these equity investments are not readily
determinable, they are not within the scope of the accounting guidance at ASC
320,
Investments – Debt and
Equity Securities
, and we account for these equity investments using the
cost method of accounting. Under the cost method of accounting, we report
investments at their acquisition cost on our consolidated balance sheet and
would only adjust these carrying values if we sell the investments or acquire
more, or if the investments become other-than-temporarily impaired.
Receivables and Allowance for
doubtful accounts
. Trade accounts receivable are recorded at the invoiced
amount as the result of transactions with customers. We maintain allowances
for doubtful accounts for uncollectible accounts receivable. We estimate
anticipated losses from doubtful accounts based on days past due, historical
collection history and other factors.
Fair Value of Financial Instruments.
We measure certain financial assets and liabilities at fair value based
on the price that would be received for an asset or paid to transfer a liability
in the principal or most advantageous market for the asset or liability in an
orderly transaction between market participants. Our financial instruments
consist principally of cash and cash equivalents, marketable securities, notes
receivable, restricted investments other than the deposit with the financial
services company, investment in related party, derivative contracts, accounts
payable, accrued expenses and income tax payable. See also Note 9: “Fair Value
Measurement” to our consolidated financial statements for further information on
the fair value of our financial
instruments.
Foreign currency translation.
The functional currencies of our European and Mexican subsidiaries are
their local currency. Accordingly, we apply the period end exchange rate to
translate their assets and liabilities and the weighted average exchange rate
for the period to translate their revenues, expenses, gains and losses into
U.S. dollars. We include the translation adjustments as a separate
component of accumulated other comprehensive income within stockholders’ equity.
The functional currency of our subsidiaries in Canada, Malaysia and Singapore is
the U.S. dollar; therefore, we do not translate their financial
statements.
Cash and cash equivalents.
We
consider all highly liquid investments with original maturities of 90 days
or less at the time of purchase to be cash equivalents.
Marketable securities — current
and noncurrent.
Marketable securities with maturities greater than
90 days, but less than one year at purchase, are recorded as marketable
securities — current. Marketable securities with maturities greater than
one year are recorded as marketable securities — noncurrent. We have
classified our marketable securities as “available-for-sale.” These marketable
securities are recorded at fair value and unrealized gains and losses are
recorded to accumulated other comprehensive income (loss) until realized.
Realized gains and losses on sales of all these securities are reported in
earnings, computed using the specific identification cost method. All of our
available-for-sale marketable securities are subject to a periodic impairment
review. We consider a marketable debt security to be impaired when its fair
value is less than its carrying cost. We subject investments identified as being
impaired to further review to determine if the investment is other than
temporarily impaired, in which case, we write the investment down to its
impaired value, which establishes a new cost basis.
Inventories — current and noncurrent
.
We report our inventories at the lower of cost or market. We determine
cost on a first-in, first-out basis and include both the costs of acquisition
and the costs of manufacturing in our inventory costs. These costs include
direct material, direct labor and fixed and variable indirect manufacturing
costs, including depreciation and amortization.
We
also regularly review the cost of inventory against its estimated market value
and record a lower of cost or market write-down if any inventories have a cost
in excess of estimated market value. For example, we regularly evaluate the
quantity and value of our inventory in light of current market conditions and
market trends and record write-downs for any quantities in excess of demand and
for any product obsolescence. This evaluation considers historical usage,
expected demand, anticipated sales price, new product development schedules, the
effect new products might have on the sale of existing products, product
obsolescence, customer concentrations, product merchantability and other
factors. Market conditions are subject to change and actual consumption of our
inventory could differ from forecasted demand. Our inventories have a long life
cycle and obsolescence has not historically been a significant factor in their
valuation.
We
classify inventories, primarily raw materials, not used within our normal
operating cycle as inventory noncurrent.
Project assets — current and
noncurrent.
Project assets represent capitalized costs prior to the sale
of the solar power plant to a third party for project development or project
construction activities. Project assets consist primarily of costs for land and
costs for developing and constructing a solar power plant. Development costs can
include legal, consulting, permitting costs as well as other development costs.
Once we enter into a definitive sales agreement, we reclassify these costs to
deferred project costs until we are able to recognize the sale of the project
assets as revenue. Project assets which are not expected to be sold within the
next 12 months are classified as project assets noncurrent.
Deferred project costs.
Deferred project costs represent capitalized costs associated with
revenue that we have deferred for project development or project construction
contracts signed with third parties typically under an EPC agreement or other
contractual arrangements, where the revenue recognition criteria have not been
met. Deferred project costs which are not expected to be recognized within the
next 12 months are classified as deferred project costs noncurrent, which are
classified with other liabilities – noncurrent on our consolidated balance
sheets.
Page
68
Property, plant and equipment.
We report our property, plant and equipment at cost, less accumulated
depreciation. Cost includes the price paid to acquire or construct the assets,
including interest capitalized during the construction period and any
expenditures that substantially add to the value of or substantially extend the
useful life of an existing asset. We expense repair and maintenance costs at the
time we incur them.
We
compute depreciation expense using the straight-line method over the estimated
useful lives of the assets, as presented in the table below. We amortize
leasehold improvements over the shorter of their estimated useful lives or the
remaining term of the lease.
|
|
|
Useful
Lives
in
Years
|
|
Buildings
|
40
|
|
|
Manufacturing
machinery and equipment
|
5 – 7
|
|
|
Furniture,
fixtures, computer hardware and computer software
|
3 – 5
|
|
|
Leasehold
improvements
|
up
to 15
|
Interest Capitalization
. We
capitalize interest cost as part of the historical cost acquiring or
constructing certain assets during the period of time required to get the asset
ready for its intended use. During 2009, these assets consisted primarily of
property, plant and equipment and project assets, including deferred project
costs. We capitalize interest to the extent that expenditures to acquire or
construct an asset have occurred and interest cost has been
incurred.
Long-lived assets.
We account
for any impairment of our long-lived, tangible assets and definite-lived
intangible assets in accordance with ASC 360,
Property, Plant and Equipment.
As a result, we assess long-lived assets classified as “held and used,”
including our property, plant and equipment, for impairment whenever events or
changes in business circumstances arise that may indicate that the carrying
amount of our long-lived assets may not be recoverable. These events would
include significant current period operating or cash flow losses associated with
the use of a long-lived asset or group of assets combined with a history of such
losses, significant changes in the manner of use of assets and significant
negative industry or economic trends. We evaluated our long-lived assets for
impairment during 2009 and did not note any events or changes in circumstances
indicating that the carrying values of our material long-lived asset are not
recoverable.
Product warranties.
We
provide a limited warranty to the original purchasers of our solar modules for
five years against defects in materials and workmanship under normal use and
service conditions following the date of sale, and we provide a warranty that
the modules will produce at least 90% of their power output rating during the
first 10 years following the date of sale and at least 80% of their power
output rating during the following 15 years. In resolving claims under both
the defects and power output warranties, we have the option of either repairing
or replacing the covered module or, under the power output warranty, providing
additional modules to remedy the power shortfall. Our warranties are
automatically transferred from the original purchaser of our modules to a
subsequent purchaser. When we recognize revenue for module sales, we accrue a
liability for the estimated future costs of meeting our warranty obligations for
those modules. We make and revise this estimate based on the number of solar
modules under warranty at customer locations, our historical experience with
warranty claims, our monitoring of field installation sites, our in-house
testing of our solar modules and our estimated per-module replacement
cost.
Accrued solar module collection and
recycling liability.
We recognize an expense for the estimated fair value
of our future obligations for collecting and recycling the solar modules that we
have sold at the time they reach the end of their useful lives.
Derivative Instruments.
We
recognize derivative instruments on our balance sheet at their fair value. On
the date that we enter into a derivative contract, we designate the derivative
instrument as fair-value hedge; a cash-flow hedge; a foreign currency fair value
or cash flow hedge; a hedge of a net investment in a foreign operations or a
derivative instrument that will not be accounted for using any of the
specialized “hedge-accounting” methods specified in ASC 815,
Derivatives and Hedging
. As
of December 26, 2009 and December 27, 2008, all of our derivative
instruments were designated either as cash-flow hedges or as derivative
instruments not accounted for using hedge-accounting methods.
We
record changes in the fair value of a derivative instrument that is highly
effective and that is designated and qualifies as a cash flow hedge, to the
extent that the hedge is effective, in other comprehensive income until our
earnings are affected by the variability of cash flows of the hedged transaction
(that is, until we record periodic settlements of a variable-rate asset or
liability in earnings). We record any hedge ineffectiveness, which represents
the amount by which the changes in the fair value of the derivative instrument
exceed the variability in the cash flows of the forecasted transaction, in
current-period earnings. We report changes in the fair values of derivative
instruments not accounted for using hedge-accounting in current-period
earnings.
Page
69
We
formally document all relationships between hedging instruments and hedged
items, as well as our risk-management objective and strategy for undertaking
various hedge transactions at inception of the hedge. We support all our
derivatives by documentation specifying the underlying exposure being hedged. We
also formally assess (both at the hedge’s inception and on an ongoing basis)
whether the derivative instruments that we use in hedging transactions have been
highly effective in offsetting changes in the fair value or cash flows of hedged
items and whether those derivatives are expected to remain highly effective in
future periods. When we determine that a derivative instrument is not (or has
ceased to be) highly effective as a hedge, we discontinue hedge accounting
prospectively. In all situations in which we discontinue hedge accounting and
the derivative instrument remains outstanding, we will carry the derivative
instrument at its fair value on our balance sheet and recognize subsequent
changes in its fair value in our current period earnings.
Revenue recognition – Components
Business.
We sell our solar modules directly to solar power system
integrators and operators and recognize revenue when persuasive evidence of an
arrangement exists, delivery of the product has occurred and title and risk of
loss have passed to the customer, the sales price is fixed or determinable and
collectability of the resulting receivable is reasonably assured. Under this
policy, we record a trade receivable for the selling price of our product and
reduce inventory for the cost of goods sold when delivery occurs in accordance
with the terms of the sales contracts. We do not offer extended payment terms or
rights of return for our products. We account for price rebates granted to
certain customers under our Long-Term Supply Contracts as a reduction to the
selling price of our solar modules; and therefore, as a reduction to
revenue.
Revenue recognition – Systems
Business.
We provide a complete solar power system solution, which
includes project development, EPC services, O&M services and, when required,
project finance.
Standalone EPC Contracts.
For
projects where we provide engineering, procurement and constructions services
under an EPC contract, which are typically cost-type or fixed-fee contracts, we
recognize revenue using the percentage-of-completion method of accounting using
the cost-to-cost methodology. We use this method because we consider costs
incurred to be the best available measure of progress on these contracts. We
make estimates of the costs to complete a contract and recognize revenue based
on the estimated progress to completion. We periodically revise our profit
estimates based on changes in facts, and we immediately recognize any losses
that we identify on contracts. Incurred costs include all direct material,
labor, subcontractor cost, and those indirect costs related to contract
performance, such as indirect labor, supplies and tools. We recognize job
material costs as incurred costs when the job materials have been installed.
When contracts specify that title to job materials transfers to the customer
before installation has been performed, we defer revenue and associated costs
and recognize it upon installation, using the percentage-of-completion method of
accounting. We consider job materials to be installed materials when they are
permanently attached or fitted to the solar power systems as required by the
engineering design.
Sale of Project Assets.
Revenue recognition for a given solar power project is dependent on the
structure of the agreement and whether we have gained control of land or land
rights. If we have not gained control of land or land rights prior to the
execution of an EPC contract, we account for any costs incurred, that are
directly related to the development or construction of the solar power project,
as pre-contract cost and capitalize these costs in project assets on our balance
sheet.
Upon
the execution of the EPC contract, we recognize project assets in cost of sales,
utilizing a percentage-of-completion method of accounting using the cost-to-cost
methodology similar to standalone EPC Contracts.
If
we have gained control of land or land rights, we account for the project
following the provisions of real estate accounting. Under the provisions of real
estate accounting we recognize revenue and the corresponding costs once the sale
is consummated, the buyer’s initial and any continuing investments are adequate,
the resulting receivables are not subject to subordination and we have
transferred the customary risk and rewards of ownership to the buyer. In
general, the sale is consummated upon the execution of an agreement documenting
the terms of the sale and a minimum initial payment by the buyer to substantiate
the transfer of risk to the buyer. As a result, depending on the value of the
initial and continuing payment commitment by the buyer, we generally align our
revenue recognition and release of project assets to cost of sale with the
receipt of payment from the buyer.
Our
liability for “billings in excess of costs and estimated earnings,” which is
part of the balance sheet caption “Other current liabilities,” was
$6.6 million and $2.2 million as of December 26, 2009 and
December 27, 2008, respectively. This liability represents our billings in
excess of revenues recognized on our contracts, which results from differences
between contractual billing schedules and the timing of revenue recognition
under our revenue recognition accounting policies.
For
revenue arrangements that include multiple deliverables, we determine whether
these arrangements have more than one unit of accounting. Deliverable elements
in a revenue arrangement with multiple deliverables are separate units of
accounting if the elements have standalone value to the customer, if objective
and reliable evidence of the fair value of undelivered elements is available,
and if the arrangement does not include a general right of return related to
delivered items. We apply the appropriate revenue recognition principles to the
identified elements.
In
accordance with ASC 605,
we present taxes
assessed by governmental authorities that are both imposed on and concurrent
with specific revenue-producing transactions between us and our customers (such
as sales, use and value-added taxes) on a net basis and excluded from
revenues.
Page
70
Shipping and handling costs.
We classify shipping and handling costs for solar modules shipped to our
customers as a component of cost of sales. We record customer payments of
shipping and handling costs as a component of net sales.
Share-based compensation.
We
account for share-based compensation arrangements in accordance with ASC 718,
Compensation – Stock
Compensation.
Our significant accounting policies related to share-based
compensation arrangements are described at Note 16. “Share-Based Compensation”
to our consolidated financial statements.
Research and development expense.
We incur research and development costs during the process of researching
and developing new products and enhancing our existing products, technologies
and manufacturing processes. Our research and development costs consist
primarily of compensation and related costs for personnel, materials, supplies,
equipment depreciation and consultant and laboratory testing costs. We expense
these costs as incurred until the resulting product has been completed and
tested and is ready for commercial manufacturing.
We
may be party to research grant contracts with the United States federal
government under which we receive reimbursements for specified costs incurred
for certain of our research projects. We record amounts recoverable from these
grants as an offset to research and development expense when the related
research and development costs are incurred, which is consistent with the timing
of our contractual right to receive the cost reimbursements. During the year
ended December 26, 2009, we did not have any grant proceeds included as
offsets to research and development expense. We have included grant proceeds of
$0.9 million and $1.8 million as offsets to research and development
expense during the years ended December 27, 2008 and December 29,
2007, respectively.
Production start-up.
Production start-up expense consists primarily of salaries and
personnel-related costs and the cost of operating a production line before it
has been qualified for full production, including the cost of raw materials for
solar modules run through the production line during the qualification phase. It
also includes all expenses related to the selection of a new site and the
related legal and regulatory costs, to the extent we cannot capitalize the
expenditure.
Income taxes.
We account for
income taxes in accordance with ASC 740,
Income Taxes,
which
prescribes the use of the asset and liability method whereby we calculate the
deferred tax asset or liability account balances at the balance sheet date using
tax laws and rates in effect at that time. We establish valuation allowances,
when necessary, to reduce deferred tax assets to the extent it is
more
likely than not
that such
deferred tax assets will not be realized. We do not provide deferred taxes
related to the U.S. GAAP basis in excess of the U.S. tax basis in the
investment in our foreign subsidiaries to the extent such amounts relate to
permanently reinvested earnings and profits of such foreign
subsidiaries.
In
accordance with ASC 740, income tax expense includes (i) deferred tax
expense, which generally represents the net change in the deferred tax asset or
liability balance during the year plus any change in valuation allowances and
(ii) current tax expense, which represents the amount of tax currently
payable to or receivable from a taxing authority. We only recognize tax benefits
related to uncertain tax positions to the extent they satisfy the recognition
and measurement criteria under ASC 740. Only those uncertain tax positions that
are more likely than not of being sustained upon examination satisfy the
recognition criteria. For those positions that satisfy the recognition criteria,
the amount of tax benefit that we recognize is the largest amount of tax benefit
that is more than fifty percent likely of being sustained on ultimate settlement
of such uncertain tax position.
Per share data.
Basic income
per share is based on the weighted effect of all common shares outstanding and
is calculated by dividing net income by the weighted average number of common
shares outstanding during the period. Diluted income per share is based on the
weighted effect of all common shares and dilutive potential common shares
outstanding and is calculated by dividing net income by the weighted average
number of common shares and dilutive potential common shares outstanding during
the period.
Advertising Costs.
Advertising costs are expensed as incurred. Advertising costs during the
years ended December 26, 2009, December 27, 2008 and December 29,
2007 were $1.1 million, $1.0 million and $0.6 million,
respectively.
Comprehensive income.
Our
comprehensive income consists of our net income, changes in unrealized gains or
losses on derivative instruments that we hold and that qualify as and that we
have designated as cash flow hedges and the effects on our consolidated
financial statements of translating the financial statements of our subsidiaries
that operate in foreign currencies. In addition, other comprehensive income
includes unrealized gains or losses on available-for-sale securities, the impact
of which has been excluded from net income. We present our comprehensive income
in combined consolidated statements of members’/stockholders’ equity and
comprehensive income. Our accumulated other comprehensive income is presented as
a component of equity in our consolidated balance sheets and consists of the
cumulative amount of net financial statement translation adjustments, unrealized
gains or losses on cash flow hedges and unrealized gains or losses on available
for sale marketable securities that we have incurred since the inception of our
business.
Recent accounting
pronouncements.
In August 2009, the FASB issued Accounting Standards
Update (ASU) 2009-05,
Fair
Value Measurements and Disclosures (Topic 820) -
Measuring Liabilities at Fair
Value
. The fair value measurement of a liability assumes transfer to a
market participant on the measurement date, not a settlement of the liability
with the counterparty. ASU 2009-05 describes various valuation methods that can
be applied to estimating the fair values of liabilities, requires the use of
observable inputs and minimizes the use of unobservable valuation inputs. ASU
2009-05 is effective for the fourth quarter of 2009. The adoption of ASU 2009-05
did not have a material impact on our financial position, results of operations
or cash flows.
Page
71
In
September 2009, the FASB issued ASU 2009-06,
Income Taxes (Topic 740)
-
Implementation Guidance on
Accounting for Uncertainty in Income Taxes and Disclosure Amendments for
Nonpublic Entities.
ASU 2009-06 provides guidance on how to account for
uncertainty in income taxes, especially for attribution of income taxes between
a pass through entity and its owners. In addition, ASU 2009-06 clarifies
management’s determination of the taxable status of an entity and amends certain
disclosure requirements. ASU 2009-06 is effective for the third quarter of 2009.
The adoption of ASU 2009-06 had no impact on our financial position, results of
operations or cash flows.
In
October 2009, the FASB issued ASU 2009-13,
Revenue Recognition (Topic 605)
-
Multiple-Deliverable
Revenue Arrangements
. ASU 2009-13 revises certain accounting for revenue
arrangements with multiple deliverables. In particular when vendor specific
objective evidence or third party evidence for deliverables in an arrangement
cannot be determined, ASU 2009-13 allows use of a best estimate of the selling
price to allocate the arrangement consideration among them. ASU 2009-13 is
effective for the first quarter of 2011, with early adoption permitted. We do
not expect that the adoption of ASU 2009-13 will have a material impact on our
financial position, results of operations or cash flows.
In
October 2009, the FASB issued ASU 2009-14,
Software (Topic 985)
-
Certain Revenue Arrangements That
Include Software Elements
. ASU 2009-14 changes the accounting model for
revenue arrangements that involve a combination of tangible products and
software. Tangible products containing software components and non-software
components that function together to deliver the tangible product’s essential
functionality are no longer within the scope of the software revenue recognition
guidance in ASC 985. ASU 2009-14 is effective prospectively for revenue
arrangements entered into or materially modified in fiscal years beginning on or
after June 15, 2010 with early adoption permitted. We do not expect that the
adoption of ASU 2009-14 will have a material impact on our financial position,
results of operations or cash flows.
In
October 2009, the FASB issued ASU 2009-15,
Accounting for Own-Share Lending
Arrangements in Contemplation of Convertible Debt Issuance or Other
Financing
. ASU 2009-15 amends the accounting and reporting guidance for
debt (and certain preferred stock) with specific conversion features or other
options. ASU 2009-15 is effective for fiscal years beginning on or after
December 15, 2009. We don’t expect that the adoption of ASU 2009-15 will have a
material impact on our financial position, results of operations or cash
flows.
In
December 2009, the FASB issued ASU 2009-16,
Transfers and Servicing (Topic 860)
– Accounting for Transfers of Financial Assets
. ASU 2009-16 amends the
accounting for transfers of financials assets and will require more information
about transfers of financial assets, including securitizations, and where
entities have continuing exposure to the risks related to transferred financial
assets. ASU 2009-16 is effective at the start of a reporting entity’s first
fiscal year beginning after November 15, 2009, with early adoption not
permitted. We do not expect that the adoption of ASU 2009-16 will have a
material impact on our financial position, results of operations or cash
flows
In
December 2009, the FASB issued ASU 2009-17,
Consolidations (Topic 810) –
Improvements to Financial Reporting by Enterprises Involved with Variable
Interest Entities
. ASU 2009-17 changes how a reporting entity determines
when an entity that is insufficiently capitalized or is not controller through
voting (or similar rights) should be consolidated. ASU 2009-17 also requires a
reporting entity to provide additional disclosures about its involvement with
variable interest entities and any significant changes in risk exposure due to
that involvement. ASU 2009-17 is effective at the start of a reporting entity’s
first fiscal year beginning after November 15, 2009, or January 1, 2010, for a
calendar year entity. Early adoption is not permitted. We do not expect that the
adoption of ASU 2009-17 will have a material impact on our financial position,
results of operations or cash flows.
In
January 2010, the FASB issued ASU 2010-01,
Equity (Topic 505) – Accounting for
Distributions to Shareholders with Components of Stock and Cash
. ASU
2010-01 clarifies that the stock portion of a distribution to shareholders that
allows them to elect to receive cash or shares with a potential limitation on
the amount of cash that all shareholders can elect to receive is considered a
share issuance. ASU 2010-01 is effective for interim and annual periods ending
on or after December 15, 2009 and should be applied on a retrospective basis.
The adoption of ASU 2010-01 did not have any impact on our financial position,
results of operations or cash flows.
In
January 2010, the FASB issued ASU 2010-02,
Consolidation (Topic 810) –
Accounting and Reporting for Decreases in Ownership of a Subsidiary – A Scope
Clarification
. ASU 2010-02 clarifies the scope of the decrease in
ownership provisions of Subtopic 810 and expands the disclosure requirements
about deconsolidation of a subsidiary or de-recognition of a group of assets.
ASU 2010-02 is effective beginning in the first interim of annual reporting
period ending on or after December 15, 2009. The amendments in ASU 2010-02 must
be applied retrospectively to the first period that an entity adopted SFAS 160.
The adoption of ASU 2010-02 did not have any impact on our financial position,
results of operations or cash flows.
In
January 2010, the FASB issued ASU 2010-06,
Fair Value Measurements and
Disclosures (Topic 820) – Improving Disclosures about Fair Value
Measurements
. This ASU requires new disclosures and clarifies certain
existing disclosure requirements about fair value measurements. ASU 2010-06
requires a reporting entity to disclose significant transfers in and out of
Level 1 and Level 2 fair value measurements, to describe the reasons for the
transfers and to present separately information about purchases, sales,
issuances and settlements for fair value measurements using significant
unobservable inputs. ASU 2010-06 is effective for interim and annual reporting
periods beginning after December 15, 2009, except for the disclosures about
purchases, sales, issuances and settlements in the roll forward of activity in
Level 3 fair value measurements, which is effective for interim and annual
reporting periods beginning after December 15, 2010; early adoption is
permitted. We do not expect that the adoption of ASU 2010-06 will have a
material impact on our financial position, results of operations or cash
flows.
Page
72
OptiSolar
On
April 3, 2009, we completed the acquisition of the solar power project
development business (the Project Business) of OptiSolar Inc. (OptiSolar).
Pursuant to an Agreement and Plan of Merger (the Merger Agreement) dated March
2, 2009, by and among First Solar, Inc., First Solar Acquisition Corp. (Merger
Sub), OptiSolar and OptiSolar Holdings LLC (OptiSolar Holdings), Merger Sub
merged with and into OptiSolar, with OptiSolar surviving as a wholly-owned
subsidiary of First Solar, Inc. (the Merger). Pursuant to the Merger, all the
outstanding shares of common stock of OptiSolar held by OptiSolar Holdings were
exchanged for 2,972,420 shares of First Solar common stock, par value $0.001 per
share (the Merger Shares), of which 732,789 shares were issued and deposited
with an escrow agent to support certain indemnification obligations of OptiSolar
Holdings. Also, 355,096 shares were holdback shares as further described below
under “Contingent Consideration” (the “Holdback Shares”). As of December 26,
2009, 2,951,256 Merger Shares had been issued. The period during which claims
for indemnification from the escrow fund may be initiated began on April 3, 2009
and will end on April 3, 2011.
Purchase
Price Consideration
The
total consideration for this acquisition, based on the closing price of our
common stock on April 3, 2009 of $134.38 per share, was $399.4
million.
Contingent
Consideration
Pursuant
to the Merger Agreement, of the 2,972,420 Merger Shares, as of April 3, 2009,
355,096 shares were Holdback Shares that were issuable to OptiSolar Holdings
upon satisfaction of conditions relating to certain then-existing liabilities of
OptiSolar. As of December 26, 2009, 333,932 Holdback Shares had been issued to
OptiSolar Holdings. The estimated fair value of the 21,164 Holdback Shares
remaining to be issued at December 26, 2009 was $2.8 million and has been
classified separately within stockholders’ equity on our balance
sheet.
Purchase
Price Allocation
We
accounted for this acquisition using the acquisition method in accordance with
ASC 805. Accordingly, we allocated the purchase price to the acquired assets and
liabilities based on their estimated fair values at the acquisition date of
April 3, 2009, as summarized in the following table (in thousands):
|
Tangible
assets acquired
|
$ | 10,175 | ||
|
Project
assets
|
103,888 | |||
|
Deferred
tax assets, net
|
35,195 | |||
|
Goodwill
|
250,176 | |||
|
Total
purchase consideration
|
$ | 399,434 |
The
fair value of net tangible assets acquired on April 3, 2009 consisted of the
following (in thousands):
|
Cash
|
$ | 318 | ||
|
Prepaid
expenses and other current assets
|
5,003 | |||
|
Property,
plant and equipment
|
165 | |||
|
Project
assets – Land
|
6,100 | |||
|
Total
identifiable assets acquired
|
11,586 | |||
|
Accounts
payable and other liabilities
|
(1,411 | ) | ||
|
Total
liabilities assumed
|
(1,411 | ) | ||
|
Net
identifiable assets acquired
|
$ | 10,175 |
Page
73
Goodwill
We
recorded the excess of the acquisition date fair value of consideration
transferred over the estimated fair value of the net tangible assets and
intangible assets acquired as goodwill. Subsequent to the acquisition of
OptiSolar, we adjusted goodwill downward by $8.5 million as additional
information relating to acquired deferred tax assets became available. We have
allocated $ 251.3 million and $1.4 million of this goodwill to our components
reporting segment and our systems segment (reported under “Other” in our
disclosure of segment operating results), respectively. This goodwill is not
deductible for tax purposes.
Acquired project assets
Management
engaged a third-party valuation firm to assist in the determination of the fair
value of the acquired project development business. In our determination of the
fair value of the project assets acquired, we considered among other factors,
three generally accepted valuation approaches: the income approach, market
approach and cost approach. We selected the approaches that are most indicative
of fair value of the assets acquired. We used the income approach to calculate
the fair value of the acquired projects assets based on estimates and
assumptions of future performance of these projects assets provided by
OptiSolar’s and our management. We used the market approach to determine the
fair value of the land acquired with those assets.
Pro
Forma Information
The acquired OptiSolar business has
been engaged in the development and construction of solar power projects. The
costs related to these activities are largely capitalized, and not charged
against earnings until the respective solar power project is sold to a customer,
constructed for a customer or we determine that the project is no longer
commercially viable; during the fourth quarter of 2009 we sold one of the
projects in the portfolio that we acquired from OptiSolar.
If the OptiSolar acquisition had been completed on December 28, 2008 (the
beginning of our fiscal year 2009) our total revenue, net income, and basic and
diluted earnings per common share would have not materially changed from the
amounts that we have previously reported.
Turner
Renewable Energy LLC
On
November 30, 2007, we acquired 100% of the outstanding membership interests
of Turner Renewable Energy, LLC. The acquisition provided us with solar power
project engineering and project management skills that enable us to deploy cost
effective solar electricity solutions for utility companies seeking to meet
renewable energy portfolio standard requirements in markets in the United
States. In connection with this acquisition we issued an aggregate of
118,346 shares of our common stock to the members of Turner Renewable
Energy, LLC in satisfaction of a portion of the purchase price. The fair value
of our common stock issued was determined based on the closing price of our
common stock on November 30, 2007. The results of Turner Renewable Energy,
LLC have been included in our consolidated results of operations since
December 1, 2007.
Goodwill
On
November 30, 2007, we acquired 100% of the outstanding membership interests
of Turner Renewable Energy, LLC. Under the purchase method of accounting, we
allocated $33.4 million to goodwill through December 29, 2007, which
represents the excess of the purchase price over the fair value of the
identifiable net tangible and intangible assets of Turner Renewable Energy, LLC.
All of this goodwill was allocated to our systems segment (reported under
“Other” in our disclosure of segment operating results). At December 26, 2009
and December 27, 2008, the carrying amount of this goodwill was $33.8
million.
On
April 3, 2009, we acquired the solar power project development business of
OptiSolar. Under the acquisition method of accounting, we allocated $261.1
million to goodwill (excluding subsequent adjustments of $8.5 million), which
primarily represents the synergies and economies of scale expected from
acquiring OptiSolar’s project pipeline and using our solar modules in the
acquired projects.
Page
74
During
2009, we adjusted goodwill downward by $8.5 million as additional information
relating to acquired deferred tax assets became available. We have allocated
$251.3 million and $1.4 million of this goodwill to our components reporting
segment and systems segment (reported under “Other” in our disclosure of segment
operating results), respectively. At December 26, 2009, the carrying amount of
this goodwill was $252.7 million. See Note 3. “Acquisitions” to our consolidated
financial statements for additional information about this
acquisition.
The
changes in the carrying amount of goodwill for the years ended December 26, 2009
and December 27, 2008 were as follows (in thousands):
|
Components
|
Systems
|
Consolidated
|
||||||||||
|
Beginning
balance, December 29, 2007
|
$ | — | $ | 33,449 | $ | 33,449 | ||||||
|
Goodwill
adjustment (1)
|
— | 380 | 380 | |||||||||
|
Beginning
balance, December 27, 2008
|
— | 33,829 | 33,829 | |||||||||
|
Goodwill
from 2009 acquisition
|
259,722 | 1,411 | 261,133 | |||||||||
|
Goodwill
adjustment (2)
|
(8,447 | ) | — | (8,447 | ) | |||||||
|
Ending
balance, December 26, 2009
|
$ | 251,275 | $ | 35,240 | $ | 286,515 | ||||||
|
(1)
|
The
goodwill adjustment of $0.4 million, which we made during 2008, was
primarily the result of adjustments made to the opening balance sheet for
acquisition-related intangible assets and related deferred
taxes.
|
|
(2)
|
The
goodwill adjustments were primarily the result of adjustments to the
amount of acquired deferred tax
assets.
|
ASC
350,
Intangibles – Goodwill
and Other,
requires us to test goodwill for impairment at least annually,
or sooner, if facts or circumstances between scheduled annual tests indicate
that it is more likely than not that the fair value of a reporting unit that has
goodwill might be less than its carrying value. We performed our goodwill
impairment test in the fourth fiscal quarter of the year ended December 26, 2009
and determined that the fair value of our goodwill substantially exceeded the
carrying value. Based on the test, we concluded that our goodwill was not
impaired. We have also concluded that there have been no changes in facts and
circumstances since the date of that test, that would trigger an interim
goodwill impairment test.
Acquisition
Related Intangible Assets
In
connection with the acquisition of Turner Renewable Energy, LLC, we identified
intangible assets that represent customer contracts already in progress and
future customer contracts not yet started at the time of acquisition. We
amortize the acquisition date fair values of these assets using the
percentage-of-completion method.
Information
regarding our acquisition-related intangible assets that were being amortized
was as follows (in thousands):
|
As
of December 26, 2009
|
As
of December 27, 2008
|
|||||||||||||||||||||||
|
|
Gross
Carrying
Amount
|
Accumulated
Amortization
|
Net
Carrying
Value
|
Gross
Carrying
Amount
|
Accumulated
Amortization
|
Net
Carrying
Value
|
||||||||||||||||||
|
Customer
contracts in progress at the acquisition date
|
$ | 62 | $ | 62 | $ | — | $ | 62 | $ | 58 | $ | 4 | ||||||||||||
|
Customer
contracts executed after the acquisition date
|
394 | 394 | — | 394 | 242 | 152 | ||||||||||||||||||
|
Total
|
$ | 456 | $ | 456 | $ | — | $ | 456 | $ | 300 | $ | 156 | ||||||||||||
During
2008, we concluded that the carrying amount of certain customer intangible
assets would not be realized due to our not pursuing certain projects that did
not fit our overall business strategy. We recognized the resulting impairment
loss of $1.3 million in cost of sales. Amortization expense for
acquisition-related intangible assets was $0.2 million and $0.3 million for
the years ended December 26, 2009 and December 27, 2008,
respectively.
Page
75
Project
Assets
In connection with the acquisition of
the solar power project development business of OptiSolar, we measured at fair
value certain acquired project assets based on the varying development stages of
each project asset on the acquisition date. Once we enter into a definitive
sales agreement, we reclassify these costs to deferred project costs. We expense
these project assets to cost of sales as each respective project asset or solar
power system is sold to a customer, constructed for a customer (matching the
underlying revenue recognition method) or if we determine that the project is
commercially not viable. See also Note 7. “Consolidated Balance Sheet
Details” to our consolidated financial statements about balances for project
assets.
Other
Intangible Assets
Included
in other noncurrent assets on our consolidated balance sheets are
internally-generated intangible assets, substantially all of which are patents
on technologies related to our products and production processes. We record an
asset for patents, after the patent has been issued, based on the legal, filing
and other costs incurred to secure them and amortize these costs on a
straight-line basis over estimated useful lives ranging from 4 to 20 years.
These intangible assets have a weighted-average useful life of approximately ten
years.
Amortization
expense for our patents was $0.1 million for the years ended
December 26, 2009 and December 27, 2008, respectively, and was less
than $0.1 million for the year ended December 29, 2007. These
intangible assets consisted of the following at December 26, 2009 and
December 27, 2008 (in thousands):
|
|
December
26,
2009
|
December 27,
2008
|
||||||
|
Intangible
assets, gross
|
$ | 1,472 | $ | 1,472 | ||||
|
Accumulated
amortization
|
(1,224 | ) | (1,199 | ) | ||||
|
Intangible
assets, net
|
$ | 248 | $ | 273 | ||||
Estimated
future amortization expense for our patents is as follows at December 26,
2009 (in thousands):
|
2010
|
$ | 25 | ||
|
2011
|
$ | 25 | ||
|
2012
|
$ | 25 | ||
|
2013
|
$ | 25 | ||
|
2014
|
$ | 25 | ||
|
Thereafter
|
$ | 123 | ||
|
Total
estimated future patent amortization expense
|
$ | 248 |
Page
76
Cash,
cash equivalents and marketable securities consisted of the following at
December 26, 2009 and December 27, 2008 (in thousands):
|
|
December
26,
2009
|
December 27,
2008
|
||||||
|
Cash
and cash equivalents:
|
||||||||
|
Cash
|
$ | 269,068 | $ | 603,434 | ||||
|
Cash
equivalents:
|
||||||||
|
Federal
agency debt
|
— | 38,832 | ||||||
|
Money
market mutual fund
|
395,431 | 73,952 | ||||||
|
Total
cash and cash equivalents
|
664,499 | 716,218 | ||||||
|
Marketable
securities:
|
||||||||
|
Federal
agency debt
|
78,911 | 68,086 | ||||||
|
Foreign
agency debt
|
168,963 | 6,977 | ||||||
|
Supranational
debt
|
71,050 | — | ||||||
|
Corporate
debt securities
|
115,248 | 30,538 | ||||||
|
Foreign
government obligations
|
10,128 | — | ||||||
|
Asset
backed securities
|
5,544 | — | ||||||
|
Total
marketable securities
|
449,844 | 105,601 | ||||||
|
Total
cash, cash equivalents and marketable securities
|
$ | 1,114,343 | $ | 821,819 | ||||
We
have classified our marketable securities as “available-for-sale.” Accordingly,
we record them at fair value and account for net unrealized gains and losses as
part of accumulated other comprehensive income until realized. We report
realized gains and losses on the sale of our marketable securities in earnings,
computed using the specific identification method. During the year ended
December 26, 2009, we realized $0.2 million in gains and an immaterial amount in
losses on our marketable securities. During the year ended December 27,
2008, we realized $0.6 million in gains and $0.4 million in losses on
our marketable securities. During the year ended December 29, 2007 we did
not realize any gains or losses on our marketable securities. See Note 9. “Fair
Value Measurement” to our consolidated financial statements for information
about the fair value measurement of our marketable securities.
All
of our available-for-sale marketable securities are subject to a periodic
impairment review. We consider a marketable debt security to be impaired when
its fair value is less than its carrying cost, in which case we would further
review the investment to determine whether it is other-than-temporarily
impaired. When we evaluate an investment for other-than-temporary impairment, we
review factors such as the length of time and extent to which fair value has
been below cost basis, the financial condition of the issuer and any changes
thereto, our intent to sell, and whether it is more likely than not we will be
required to sell the investment before we have recovered its cost basis. If an
investment is other-than-temporarily impaired, we write it down through earnings
to its impaired value and establish that as a new cost basis for the investment.
We did not identify any of our marketable securities as other-than-temporarily
impaired at December 26, 2009 and December 27, 2008.
Page
77
The
following table summarizes unrealized gains and losses related to our
investments in marketable securities designated as available-for-sale by major
security type (in thousands):
|
As
of December 26, 2009
|
||||||||||||||||
|
Security Type
|
Amortized
Cost
|
Gross
Unrealized
Gains
|
Gross
Unrealized
Losses
|
Estimated
Fair
Value
|
||||||||||||
|
Federal
agency debt
|
$ | 78,803 | $ | 108 | $ | — | $ | 78,911 | ||||||||
|
Foreign
agency debt
|
168,541 | 588 | 166 | 168,963 | ||||||||||||
|
Supranational
debt
|
70,807 | 269 | 26 | 71,050 | ||||||||||||
|
Corporate
debt securities
|
114,912 | 475 | 139 | 115,248 | ||||||||||||
|
Foreign
government obligations
|
10,057 | 71 | — | 10,128 | ||||||||||||
|
Asset
backed securities
|
5,528 | 19 | 3 | 5,544 | ||||||||||||
|
Total
|
$ | 448,648 | $ | 1,530 | $ | 334 | $ | 449,844 | ||||||||
|
As
of December 27, 2008
|
||||||||||||||||
|
Security Type
|
Amortized
Cost
|
Gross
Unrealized
Gains
|
Gross
Unrealized
Losses
|
Estimated
Fair
Value
|
||||||||||||
|
Federal
agency debt
|
$ | 67,813 | $ | 273 | $ | — | $ | 68,086 | ||||||||
|
Foreign
agency debt
|
6,990 | — | 13 | 6,977 | ||||||||||||
|
Corporate
debt securities
|
30,425 | 129 | 16 | 30,538 | ||||||||||||
|
Total
|
$ | 105,228 | $ | 402 | $ | 29 | $ | 105,601 | ||||||||
Contractual
maturities of our available-for-sale marketable securities as of December 26,
2009 and December 27, 2008 were as follows (in thousands):
|
As
of December 26, 2009
|
||||||||||||||||
|
Maturity
|
Amortized
Cost
|
Gross
Unrealized
Gains
|
Gross
Unrealized
Losses
|
Estimated
Fair
Value
|
||||||||||||
|
One
year or less
|
$ | 119,911 | $ | 327 | $ | 2 | $ | 120,236 | ||||||||
|
One
year to two years
|
269,488 | 963 | 185 | 270,266 | ||||||||||||
|
Two
years to three years
|
59,249 | 240 | 147 | 59,342 | ||||||||||||
|
Total
|
$ | 448,648 | $ | 1,530 | $ | 334 | $ | 449,844 | ||||||||
Page
78
|
As
of December 27, 2008
|
||||||||||||||||
|
Maturity
|
Amortized
Cost
|
Gross
Unrealized
Gains
|
Gross
Unrealized
Losses
|
Estimated
Fair
Value
|
||||||||||||
|
One
year or less
|
$ | 75,856 | $ | 199 | $ | 13 | $ | 76,042 | ||||||||
|
One
year to two years
|
29,372 | 203 | 16 | 29,559 | ||||||||||||
|
Total
|
$ | 105,228 | $ | 402 | $ | 29 | $ | 105,601 | ||||||||
The
net unrealized gain of $1.2 million and $0.4 million as of December
26, 2009 and December 27, 2008, respectively, on our available-for-sale
marketable securities was primarily the result of changes in interest rates. We
typically invest in highly-rated securities with low probabilities of default.
Our investment policy requires investments to be rated single A or better and
limits the security types, issuer concentration and duration of the
investments.
The
following table shows gross unrealized losses and estimated fair values for
those investments that were in an unrealized loss position as of December 26,
2009 and December 27, 2008, aggregated by investment category and the
length of time that individual securities have been in a continuous loss
position (in thousands):
|
As
of December 26, 2009
|
||||||||||||||||||||||||
|
In
Loss Position for
Less
Than 12 Months
|
In
Loss Position for
12
Months or Greater
|
Total
|
||||||||||||||||||||||
|
Security Type
|
Estimated
Fair
Value
|
Gross
Unrealized
Losses
|
Estimated
Fair
Value
|
Gross
Unrealized
Losses
|
Estimated
Fair
Value
|
Gross
Unrealized
Losses
|
||||||||||||||||||
|
Foreign
agency debt
|
$ | 45,329 | $ | 166 | $ | — | $ | — | $ | 45,329 | $ | 166 | ||||||||||||
|
Supranational
debt
|
7,201 | 26 | — | — | 7,201 | 26 | ||||||||||||||||||
|
Corporate
debt securities
|
32,303 | 139 | — | — | 32,303 | 139 | ||||||||||||||||||
|
Asset
backed securities
|
2,868 | 3 | — | — | 2,868 | 3 | ||||||||||||||||||
|
Total
|
$ | 87,701 | $ | 334 | $ | — | $ | — | $ | 87,701 | $ | 334 | ||||||||||||
|
As
of December 27, 2008
|
||||||||||||||||||||||||
|
In
Loss Position for
Less
Than 12 Months
|
In
Loss Position for
12
Months or Greater
|
Total
|
||||||||||||||||||||||
|
Security Type
|
Estimated
Fair
Value
|
Gross
Unrealized
Losses
|
Estimated
Fair
Value
|
Gross
Unrealized
Losses
|
Estimated
Fair
Value
|
Gross
Unrealized
Losses
|
||||||||||||||||||
|
Foreign
agency debt
|
$ | 6,977 | $ | 13 | $ | — | $ | — | $ | 6,977 | $ | 13 | ||||||||||||
|
Corporate
debt securities
|
9,088 | 16 | — | — | 9,088 | 16 | ||||||||||||||||||
|
Total
|
$ | 16,065 | $ | 29 | $ | — | $ | — | $ | 16,065 | $ | 29 | ||||||||||||
Page
79
Restricted
cash and investments consisted of the following at December 26, 2009 and
December 27, 2008 (in thousands):
|
|
December
26,
2009
|
December 27,
2008
|
||||||
|
Restricted
cash
|
$ | 27 | $ | 4,218 | ||||
|
Restricted
investments
|
36,467 | — | ||||||
|
Deposit
with financial services company
|
— | 25,841 | ||||||
|
Total
restricted cash and investments— noncurrent
|
$ | 36,494 | $ | 30,059 | ||||
At
December 26, 2009, our restricted investments consisted of long-term marketable
securities that we hold through a custodial account to fund future costs of our
solar module collection and recycling program. At December 27, 2008, our
restricted investments consisted of a funding arrangement for our solar module
collection and recycling program (See Note 12. “Module Collection and Recycling
Liability” to our consolidated financial statements), a debt service reserve
account of $4.2 million for our credit facility with a consortium of banks
led by IKB Deutsche Industriebank AG (See Note 13. “Debt” to our consolidated
financial statements) and cash held by a financial institution as collateral for
a letter of credit.
We
pre-fund our estimated solar module collection and recycling costs at the time
of module sale through a custodial account with a large bank as investment
advisor in the name of a trust, for which First Solar Inc., First Solar Malaysia
Sdn. Bhd. and First Solar Manufacturing GmbH are grantors. We fund this
custodial account within 60 days of the beginning of a fiscal year for the prior
year module sales, assuming for this purpose a minimum service life of 25 years
for our solar modules. Prior to June 2009, we pre-funded our estimated solar
module collection and recycling costs through a financial services company. At
December 27, 2008, the cumulative amount of deposits made was
$25.8 million (including the investment returns earned through that
date). We commuted this deposit with the financial services company during
the year ended December 26, 2009 and invested the proceeds in the restricted
investments.
The
following table summarizes unrealized gains and losses related to our restricted
investments in marketable securities designated as available-for-sale by major
security type (in thousands):
|
As
of December 26, 2009
|
||||||||||||||||
|
Security Type
|
Amortized
Cost
|
Gross
Unrealized
Gains
|
Gross
Unrealized
Losses
|
Estimated
Fair
Value
|
||||||||||||
|
U.S.
government obligations
|
$ | 783 | $ | — | $ | 27 | $ | 756 | ||||||||
|
Foreign
government obligations
|
34,403 | 1,308 | — | 35,711 | ||||||||||||
|
Total
|
$ | 35,186 | $ | 1,308 | $ | 27 | $ | 36,467 | ||||||||
As
of December 26, 2009, the contractual maturities of these available-for-sale
marketable securities were between 18 and 26 years. We did not have any
restricted investments in marketable securities as of December 27,
2008.
Page
80
Accounts
receivable, net
Accounts
receivable, net consisted of the following at December 26, 2009 and December 27,
2008 (in thousands):
|
|
December
26,
2009
|
December
27,
2008
|
||||||
|
Accounts
receivable, gross
|
$ | 227,816 | $ | 61,703 | ||||
|
Allowance
for doubtful account
|
(990 | ) | — | |||||
|
Accounts
receivable, net
|
$ | 226,826 | $ | 61,703 | ||||
The
increase in accounts receivable was mainly due to the amendment of certain of
our customers’ Long-Term Supply Contracts to extend their payment terms from net
10 days to net 45 days at the end of the first quarter of 2009 primarily to
increase liquidity in our sales channel and to reflect longer shipment times
from our plants in Malaysia and due to higher volumes shipped during the year
ended December 26, 2009.
During
2009, we amended our Long-Term Supply Contracts with certain of our customers to
implement a program which extends a price rebate to certain of these customers
for solar modules purchased from us. The intent of this program is to enable our
customers to successfully compete in our core segments in Germany. The rebate
program applies a specified rebate rate to solar modules sold for solar power
projects in Germany at the beginning of each quarter for the upcoming quarter.
The rebate program is subject to periodic review and we will adjust the rebate
rate quarterly upward or downward as appropriate. The rebate period began during
the third quarter of 2009 and ends at the end of the fourth quarter of 2010.
Customers need to meet certain requirements in order to be eligible for and
benefit from this program.
We
account for these rebates as a reduction to the selling price of our solar
modules and therefore as a reduction in revenue at the time of sale. No rebates
granted under this program can be claimed in cash and all will be applied to
reduce outstanding accounts receivable balances. During the year ended December
26, 2009, we extended rebates to customers in the amount of €87.1 million
($128.9 million at the average exchange rate of $1.48/€1.00). At December 26,
2009 we had €54.3 million ($78.2 million at the balance sheet close rate on
December 26, 2009 of $1.44/€1.00) of rebate claims accrued, which reduced our
accounts receivable accordingly.
In
June 2009, we provided an allowance for doubtful accounts receivable in the
amount of $7.0 million due to the collectability of the outstanding accounts
receivable from a specific customer. As of December 26, 2009, we had collected
$6.0 million of the overdue accounts receivable from this specific customer and
reduced our allowance for the doubtful account accordingly.
Inventories
Inventories
consisted of the following at December 26, 2009 and December 27, 2008 (in
thousands):
|
|
December
26,
2009
|
December
27,
2008
|
||||||
|
Raw
materials
|
$ | 122,282 | $ | 103,725 | ||||
|
Work
in process
|
6,248 | 4,038 | ||||||
|
Finished
goods
|
45,986 | 13,791 | ||||||
|
Total
inventories
|
$ | 174,516 | $ | 121,554 | ||||
|
Inventory
— current
|
$ | 152,821 | $ | 121,554 | ||||
|
Inventory
— noncurrent (1)
|
$ | 21,695 | $ | — | ||||
|
(1)
|
Raw
materials not used within our normal operating cycle are classified as
inventory - noncurrent.
|
Page
81
Prepaid
expenses and other current assets
Prepaid
expenses and other current assets consisted of the following at December 26,
2009 and December 27, 2008 (in thousands):
|
December
26,
2009
|
December
27,
2008
|
|||||||
|
Prepaid
expenses
|
$ | 33,095 | $ | 32,158 | ||||
|
Deferred
project costs
|
36,670 | 710 | ||||||
|
Notes
receivable (See Note 11. “Notes Receivable”)
|
50,531 | — | ||||||
|
Derivative
instruments
|
7,909 | 34,931 | ||||||
|
Other
current assets
|
35,924 | 24,163 | ||||||
|
Total
prepaid expenses and other current assets
|
$ | 164,129 | $ | 91,962 | ||||
Project
Assets – Current and Noncurrent
Project
assets – current and noncurrent consisted of the following at December 26, 2009
and December 27, 2008 (in thousands):
|
December
26,
2009
|
December
27,
2008
|
|||||||
|
Project
assets acquired through OptiSolar
|
$ | 71,037 | $ | — | ||||
|
Project
assets — land
|
1,452 | — | ||||||
|
Project
assets — other
|
60,007 | — | ||||||
|
Total
project assets
|
$ | 132,496 | $ | — | ||||
|
Total
project assets — current
|
$ | 1,081 | $ | — | ||||
|
Total
project assets — noncurrent
|
$ | 131,415 | $ | — | ||||
Project
assets consist primarily of costs relating to solar power projects in various
stages of development that we capitalize prior to the sale of the solar power
project to a third party for project development or project construction
activities. These costs include costs for land and costs for developing and
constructing a solar power plant. Development costs can include legal,
consulting, permitting costs as well as other development costs. Once we enter
into a definitive sales agreement, we reclassify these costs to deferred project
costs until we are able to recognize the sale of the project assets as revenue.
Project assets acquired in connection with the acquisition of OptiSolar were
measured at fair value on the acquisition date. Subsequent to the acquisition of
OptiSolar, we incurred additional costs to further develop these
projects.
We
expense these project assets to cost of sales as each respective project asset
or solar power system is sold to a customer, constructed for a customer
(matching the underlying revenue recognition method) or if we determine that the
project is commercially not viable. See also Note 4. “Goodwill and Intangible
Assets” to our consolidated financial statements for further
information.
Property,
plant and equipment, net
Property,
plant and equipment, net consisted of the following at December 26, 2009 and
December 27, 2008 (in thousands):
|
December
26,
2009
|
December
27,
2008
|
|||||||
|
Buildings
and improvements
|
$ | 239,088 | $ | 137,116 | ||||
|
Machinery
and equipment
|
813,281 | 559,566 | ||||||
|
Office
equipment and furniture
|
38,845 | 22,842 | ||||||
|
Leasehold
improvements
|
15,870 | 11,498 | ||||||
|
Depreciable
property, plant and equipment, gross
|
1,107,084 | 731,022 | ||||||
|
Accumulated
depreciation
|
(225,790 | ) | (100,939 | ) | ||||
|
Depreciable
property, plant and equipment, net
|
881,294 | 630,083 | ||||||
|
Land
|
4,995 | 5,759 | ||||||
|
Construction
in progress
|
102,493 | 206,780 | ||||||
|
Property,
plant and equipment, net
|
$ | 988,782 | $ | 842,622 | ||||
Depreciation
of property, plant and equipment was $124.6 million, $61.1 million and
$24.8 million for the years ended December 26, 2009, December 27, 2008 and
December 29, 2007, respectively.
Page
82
Capitalized
Interest
We
incurred interest cost and capitalized a portion of it (into our property, plant
and equipment and project assets) as follows during the years ended December 26,
2009, December 27, 2008 and December 29, 2007 (in
thousands):
|
2009
|
2008
|
2007
|
||||||||||
|
Interest
cost incurred
|
$ | 11,902 | $ | 7,394 | $ | 6,065 | ||||||
|
Interest
cost capitalized – property, plant and equipment
|
(3,310 | ) | (6,885 | ) | (3,771 | ) | ||||||
|
Interest
cost capitalized – project assets
|
(3,334 | ) | — | — | ||||||||
|
Interest
expense, net
|
$ | 5,258 | $ | 509 | $ | 2,294 | ||||||
Accrued
expenses
Accrued
expenses consisted of the following at December 26, 2009 and December 27, 2008
(in thousands):
|
December
26,
2009
|
December
27,
2008
|
|||||||
|
Accrued
compensation and benefits
|
$ | 53,856 | $ | 32,145 | ||||
|
Accrued
property, plant and equipment
|
35,811 | 44,115 | ||||||
|
Accrued
inventory
|
27,542 | 31,438 | ||||||
|
Product
warranty liability
|
8,216 | 4,040 | ||||||
|
Other
accrued expenses
|
61,257 | 29,161 | ||||||
|
Total
accrued expenses
|
$ | 186,682 | $ | 140,899 | ||||
Other
current liabilities
Other
current liabilities consisted of the following at December 26, 2009 and December
27, 2008 (in thousands):
|
December
26,
2009
|
December
27,
2008
|
|||||||
|
Deferred
revenue (1)
|
$ | 31,127 | $ | — | ||||
|
Derivative
instruments
|
30,781 | 50,733 | ||||||
|
Other
current liabilities
|
33,294 | 9,005 | ||||||
|
Total
other current liabilities
|
$ | 95,202 | $ | 59,738 | ||||
|
(1)
|
Deferred
revenue will be recognized once all revenue recognition criteria have been
met.
|
Page
83
As
a global company, we are exposed in the normal course of business to interest
rate and foreign currency risks that could affect our net assets, financial
position, results of operations and cash flows. We use derivative instruments to
hedge against certain risks, such as these, and we only hold derivative
instruments for hedging purposes, not for speculative or trading purposes. Our
use of derivative instruments is subject to strict internal controls based on
centrally defined, performed and controlled policies and
procedures.
Depending
on the terms of the specific derivative instruments and market conditions, some
of our derivative instruments may be assets and others liabilities at any
particular point in time. As required by ASC 815,
Derivatives and Hedging
, we
report all of our derivative instruments at fair value on our balance sheet.
Depending on the substance of the hedging purpose for our derivative
instruments, we account for changes in the fair value of some of them using
cash-flow-hedge accounting pursuant to ASC 815 and of others by recording the
changes in fair value directly to current earnings (so-called “economic
hedges”). These accounting approaches and the various classes of risk that we
are exposed to in our business and the risk management systems using derivative
instruments that we apply to these risks are described below. See Note 9. “Fair
Value Measurement” to our consolidated financial statements for information
about the techniques we use to measure the fair value of our derivative
instruments.
The
following table presents the fair values of derivative instruments included in
our consolidated balance sheet as of December 26, 2009 (in
thousands):
|
December
26, 2009
|
||||||||||||||||
|
Other
Assets -
Current
|
Other
Assets -
Noncurrent
|
Other
Liabilities -
Current
|
Other
Liabilities - Noncurrent
|
|||||||||||||
|
Derivatives
designated as hedging instruments under ASC 815:
|
||||||||||||||||
|
Foreign
exchange forward contracts
|
$ | 3,781 | $ | — | $ | 19,723 | $ | — | ||||||||
|
Interest
rate swap contracts
|
— | — | 178 | 905 | ||||||||||||
|
Total
derivatives designated as hedging instruments
|
$ | 3,781 | $ | — | $ | 19,901 | $ | 905 | ||||||||
|
Derivatives
not designated as hedging instruments under ASC 815:
|
||||||||||||||||
|
Foreign
exchange forward contracts
|
$ | 4,128 | $ | — | $ | 10,880 | $ | — | ||||||||
|
Total
derivatives not designated as hedging instruments
|
$ | 4,128 | $ | — | $ | 10,880 | $ | — | ||||||||
|
Total
derivative instruments
|
$ | 7,909 | $ | — | $ | 30,781 | $ | 905 | ||||||||
The
following tables present the amounts related to derivative instruments affecting
our consolidated statement of operations for the year ended December 26, 2009
(in thousands):
|
Amount
of Gain (Loss) Recognized in Other Comprehensive Income on
Derivatives
|
Amount
of Gain (Loss) Reclassified from Accumulated Other Comprehensive Income
into Income
|
||||||||
|
Derivative
Type
|
Year
Ended
December
26, 2009
|
Location
of Gain (Loss) Reclassified from Accumulated Other Comprehensive Income
into Income
|
Year
Ended
December
26, 2009
|
||||||
|
Derivatives
designated as cash flow hedges under ASC 815:
|
|||||||||
|
Foreign
exchange forward contracts
|
$ | (396 | ) |
Net
sales
|
$ | (20,048 | ) | ||
|
Interest
rate swaps
|
294 |
Interest
income (expense)
|
(2,990 | ) | |||||
|
Total
derivatives designated as cash flow hedges
|
$ | (102 | ) | $ | (23,038 | ) | |||
Page
84
|
Amount
of Gain (Loss) on Derivatives Recognized in Income
|
|||||
|
Derivative
Type
|
Year
Ended
December
26, 2009
|
Location
of Gain (Loss) Recognized in Income on Derivatives
|
|||
|
Derivatives
designated as cash flow hedges under ASC 815:
|
|||||
|
Foreign
exchange forward contracts
|
$ | (20,048 | ) |
Net
sales
|
|
|
Interest
rate swaps
|
$ | (2,990 | ) |
Interest
income (expense)
|
|
|
Derivatives
not designated as hedging instruments under ASC 815:
|
|||||
|
Foreign
exchange forward contracts
|
$ | (9,870 | ) |
Other
income (expense)
|
|
|
Foreign
exchange forward contracts
|
$ | 1,844 |
Cost
of sales
|
||
|
Foreign
exchange forward contracts
|
$ | (2,069 | ) |
Revenue
|
|
|
Credit
default swaps
|
$ | (1,459 | ) |
Other
income (expense)
|
|
Interest
Rate Risk
We
use interest rate swap agreements to mitigate our exposure to interest rate
fluctuations associated with certain of our debt instruments; we do not use such
swap agreements for speculative or trading purposes. We had interest rate swap
contracts with a financial institution that effectively converted to fixed rates
the variable rate of the Euro Interbank Offered Rate (Euribor) on the term loan
portion of our credit facility with a consortium of banks for the financing of
our German plant. These swap contracts were required under the credit facility
agreement, which we repaid and terminated on June 30, 2009. Therefore, we
terminated these interest rate swap contracts on June 26, 2009 and consequently
recognized an interest expense of €1.7 million ($2.4 million at the
balance sheet close rate on December 26, 2009 of $1.44/€1.00). The termination
of the interest rate swap contracts settled on June 30, 2009. The total notional
value of the interest rate swaps was €39.1 million ($56.3 million at
the balance sheet close rate on December 26, 2009 of $1.44/€1.00) on
December 27, 2008. As of December 27, 2008, the weighted average
interest rate for the interest rate swaps was 4.12%.
On
May 29, 2009, we entered into an interest rate swap contract to hedge a portion
of the floating rate loans under our Malaysian credit facility, which became
effective on September 30, 2009 with a notional value of €57.3 million
($82.5 million at the balance sheet close rate on December 26, 2009 of
$1.44/€1.00) and pursuant to which we are entitled to receive a six-month
floating interest rate, the Euro Interbank Offered Rate (Euribor), and pay a
fixed rate of 2.80%. The notional amount of the interest rate swap contract is
scheduled to decline in correspondence to our scheduled principal payments on
the underlying hedged debt. This derivative instrument qualifies for accounting
as a cash flow hedge in accordance with FASB ASC 815,
Derivatives and Hedging
, and
we designated it as such. We determined that our interest rate swap contract was
highly effective as a cash flow hedge at December 26, 2009.
Foreign
Currency Exchange Risk
Cash
Flow Exposure
We
expect many of the components of our business to have material future cash
flows, including revenues and expenses that will be denominated in currencies
other than the component’s functional currency. Our primary cash flow exposures
are customer collections and vendor payments. Changes in the exchange rates
between our components’ functional currencies and the other currencies in which
they transact will cause fluctuations in the cash flows we expect to receive
when these cash flows are realized or settled. Accordingly, we enter into
foreign exchange forward contracts to hedge the value of a portion of these
forecasted cash flows. As of December 26, 2009, these foreign exchange contracts
hedge our forecasted future cash flows for up to 18 months. These foreign
exchange contracts qualified for accounting as cash flow hedges in accordance
with ASC 815, and we designated them as such. We initially report the effective
portion of the derivative’s gain or loss in accumulated other comprehensive
income (loss) and subsequently reclassify amounts into earnings when the hedged
transaction is settled. We determined that these derivative financial
instruments were highly effective as cash flow hedges at December 26, 2009 and
December 27, 2008. In addition, during 2009, we did not discontinue any
cash flow hedges because it was probable that a forecasted transaction would not
occur.
Page
85
During
2009 and 2008, we purchased foreign exchange forward contracts to hedge the
exchange risk on forecasted cash flows denominated in euro. As of December 26,
2009, the unrealized loss on these contracts was $15.9 million and the
total notional value of the contracts was €361.0 million
($519.8 million at the balance sheet close rate on December 26, 2009 of
$1.44/€1.00). The weighted average forward exchange rate for these contracts was
$1.40/€1.00 at December 26, 2009. As of December 27, 2008, the unrealized
loss of these forward contracts was $15.5 million and the total notional
value of the forward contracts was €625.1 million ($900.1 million at
the balance sheet close rate on December 26, 2009 of $1.44/€1.00). The weighted
average forward exchange rate for these contracts was $1.37/€1.00 at
December 27, 2008.
We
expect to reclassify $15.9 million of net unrealized losses related to these
forward contracts that are included in accumulated other comprehensive loss at
December 26, 2009 to earnings in the following 12 months as we realize the
earnings effect of the related forecasted transactions. The amount we ultimately
record to earnings will be contingent upon the actual exchange rate when we
realize the related forecasted transaction. During 2009, we realized a loss of
$23.0 million related to our cash flow hedges.
Transaction
Exposure
Many
components of our business have assets and liabilities (primarily receivables,
investments, accounts payable, debt, solar module collection and recycling
liabilities and inter-company transactions) that are denominated in currencies
other than the relevant entity’s functional currency. Changes in the exchange
rates between our components’ functional currencies and the currencies in which
these assets and liabilities are denominated can create fluctuations in our
reported consolidated financial position, results of operations and cash flows.
We may enter into foreign exchange forward contracts or other financial
instruments to hedge assets and liabilities against the short-term effects of
currency exchange rate fluctuations. The gains and losses on the foreign
exchange forward contracts will offset all or part of the transaction gains and
losses that we recognize in earnings on the related foreign currency assets and
liabilities.
Since
our acquisition of the solar power project development business of OptiSolar on
April 3, 2009, we have also become exposed to currency exchange rate
fluctuations between the U.S. dollar and Canadian dollar.
During
2009, we purchased foreign exchange forward contracts to hedge balance sheet
exposures related to transactions with third parties. We recognize gains or
losses from the fluctuation in foreign exchange rates and the valuation of these
hedging contracts in cost of sales and foreign currency gain (loss) on our
consolidated statements of operations depending on where the gain or loss from
the hedged item is classified on our consolidated statement of operations. As of
December 26, 2009, the total unrealized loss on our foreign exchange forward
contracts was $6.8 million. These contracts have maturities of less than
two months.
As
of December 26, 2009, the total notional value of our foreign exchange forward
contracts was as follows (notional amounts and U.S. dollar equivalents in
millions):
|
Transaction
|
Currency
|
Notional
Amount
|
U.S.
Equivalent
|
Balance
sheet close rate on December 26, 2009
|
||||
|
Purchase
|
Euro
|
€229.1
|
$329.9
|
$1.44/€1.00
|
||||
|
Sell
|
Euro
|
€109.9
|
$158.3
|
$1.44/€1.00
|
||||
|
Sell
|
U.S.
dollar for Euro
|
$27.2
|
$27.2
|
n/a
|
||||
|
Purchase
|
Malaysian
ringgits
|
MYR
104.5
|
$30.3
|
$0.29/MYR1.00
|
||||
|
Sell
|
Malaysian
ringgits
|
MYR
22.8
|
$6.6
|
$0.29/MYR1.00
|
||||
|
Purchase
|
Japanese
yen
|
JPY
275.0
|
$2.8
|
$0.01/JPY1.00
|
||||
|
Sell
|
Japanese
yen
|
JPY
70.0
|
$0.7
|
$0.01/JPY1.00
|
||||
|
Purchase
|
Canadian
dollar
|
CAD
108.4
|
$103.0
|
$0.95/CAD1.00
|
||||
|
Sell
|
Canadian
dollar
|
CAD
120.1
|
$114.1
|
$0.95/CAD1.00
|
Credit
Risk
We
have certain financial and derivative instruments that subject us to credit
risk. These consist primarily of cash, cash equivalents, investments, trade
accounts receivable, interest rate swap contracts and foreign exchange forward
contracts. We are exposed to credit losses in the event of nonperformance by the
counterparties to our financial and derivative instruments. We place cash, cash
equivalents, investments, interest rate swap contracts and foreign exchange
forward contracts with various high-quality financial institutions and limit the
amount of credit risk from any one counterparty. We continuously evaluate the
credit standing of our counterparty financial institutions.
Page
86
On
December 30, 2007, the beginning of our 2008 fiscal year, we adopted ASC
820,
Fair Value Measurements
and Disclosures
. ASC 820 defines fair value, establishes a framework for
measuring fair value in accordance with generally accepted accounting principles
and expands financial statement disclosure requirements for fair value
measurements. Our initial adoption of ASC 820 was limited to our fair value
measurements of financial assets and financial liabilities, as permitted by ASC
820. On December 28, 2008, the beginning of our fiscal year 2009, we adopted ASC
820 for the remainder of our fair value measurements. The implementation of the
fair value measurement guidance of ASC 820 did not result in any material
changes to the carrying values of our assets and liabilities.
ASC
820 defines fair value as the price that would be received from the sale of an
asset or paid to transfer a liability (an exit price) on the measurement date in
an orderly transaction between market participants in the principal or most
advantageous market for the asset or liability. ASC 820 specifies a hierarchy of
valuation techniques, which is based on whether the inputs into the valuation
technique are observable or unobservable. The hierarchy is as
follows:
|
|
•
|
Level 1 —
Valuation techniques in which all significant inputs are unadjusted quoted
prices from active markets for assets or liabilities that are identical to
the assets or liabilities being
measured.
|
|
|
•
|
Level 2 —
Valuation techniques in which significant inputs include quoted prices
from active markets for assets or liabilities that are similar to the
assets or liabilities being measured and/or quoted prices for assets or
liabilities that are identical or similar to the assets or liabilities
being measured from markets that are not active. Also, model-derived
valuations in which all significant inputs and significant value drivers
are observable in active markets are Level 2 valuation
techniques.
|
|
|
•
|
Level 3 —
Valuation techniques in which one or more significant inputs or
significant value drivers are unobservable. Unobservable inputs are
valuation technique inputs that reflect our own assumptions about the
assumptions that market participants would use in pricing an asset or
liability.
|
When
available, we use quoted market prices to determine the fair value of an asset
or liability. If quoted market prices are not available, we measure fair value
using valuation techniques that use, when possible, current market-based or
independently-sourced market parameters, such as interest rates and currency
rates. Following is a description of the valuation techniques that we use to
measure the fair value of assets and liabilities that we measure and report at
fair value on a recurring or on a one-time basis:
|
|
•
|
Cash equivalents.
At
December 26, 2009, our cash equivalents consisted of money market mutual
funds. We value our cash equivalents using observable inputs that reflect
quoted prices for securities with identical characteristics, and
accordingly, we classify the valuation techniques that use these inputs as
Level 1.
|
|
|
•
|
Marketable securities.
At December 26, 2009, our marketable securities consisted of
federal and foreign agency debt, supranational debt, corporate debt
securities, foreign government obligations and asset backed securities. We
value our marketable securities using quoted prices for securities with
similar characteristics and other observable inputs (such as interest
rates that are observable at commonly quoted intervals), and accordingly,
we classify the valuation techniques that use these inputs as
Level 2. We also consider the effect of our counterparties’ credit
standings in these fair value
measurements.
|
|
|
•
|
Derivative assets and
liabilities.
At December 26, 2009, our derivative assets and
liabilities consisted of foreign exchange forward contracts involving
major currencies and interest rate swap contracts involving benchmark
interest rates. Since our derivative assets and liabilities are not traded
on an exchange, we value them using valuation models. Interest rate yield
curves and foreign exchange rates are the significant inputs into these
valuation models. These inputs are observable in active markets over the
terms of the instruments we hold, and accordingly, we classify these
valuation techniques as Level 2. We consider the effect of our own
credit standing and that of our counterparties in our valuations of our
derivative assets and liabilities.
|
|
|
•
|
Module collection and
recycling liability.
We account for our obligation to collect and
recycle the solar modules that we sell in a similar manner to the
accounting for asset retirement obligations that is prescribed by ASC 410,
Asset Retirement and
Environmental Obligations
. When we sell solar modules, we initially
record our liability for collecting and recycling those particular solar
modules at the fair value of this liability, and then in subsequent
periods, we accrete this fair value to the estimated future cost of
collecting and recycling the solar modules. Therefore, this is a one-time
nonrecurring fair value measurement of the collection and recycling
liability associated with each particular solar module
sold.
|
|
|
Since
there is not an established market for collecting and recycling our solar
modules, we value our liability using a valuation model (an income
approach). This fair value measurement requires us to use significant
unobservable inputs, which are primarily estimates of collection and
recycling process costs and estimates of future changes in costs due to
inflation and future currency exchange rates. Accordingly, we classify
these valuation techniques as Level 3. We estimate collection and
recycling process costs based on analyses of the collection and recycling
technologies that we are currently developing; we estimate future
inflation costs based on analysis of historical trends; and we estimate
future currency exchange rates based on current rate information. We
consider the effect of our own credit standing in our measurement of the
fair value of this liability.
|
Page
87
At
December 26, 2009 and December 27, 2008, information about inputs into the fair
value measurements of our assets and liabilities that we make on a recurring
basis was as follows (in thousands):
|
As
of December 26, 2009
|
||||||||||||||||
|
Fair
Value Measurements at Reporting
Date
Using
|
||||||||||||||||
|
|
Total
Fair
Value
and
Carrying
Value
on Our
Balance
Sheet
|
Quoted
Prices
in
Active
Markets
for
Identical
Assets
(Level
1)
|
Significant
Other
Observable
Inputs
(Level
2)
|
Significant
Unobservable
Inputs
(Level
3)
|
||||||||||||
|
Assets:
|
||||||||||||||||
|
Cash
equivalents:
|
||||||||||||||||
|
Money
market mutual funds
|
$ | 395,431 | $ | 395,431 | $ | — | $ | — | ||||||||
|
Marketable
securities:
|
||||||||||||||||
|
Federal
agency debt
|
78,911 | — | 78,911 | — | ||||||||||||
|
Foreign
agency debt
|
168,963 | — | 168,963 | — | ||||||||||||
|
Supranational
debt
|
71,050 | — | 71,050 | — | ||||||||||||
|
Corporate
debt securities
|
115,248 | — | 115,248 | — | ||||||||||||
|
Foreign
government obligations
|
10,128 | — | 10,128 | — | ||||||||||||
|
Asset
backed securities
|
5,544 | — | 5,544 | — | ||||||||||||
|
Derivative
assets
|
7,909 | — | 7,909 | — | ||||||||||||
|
Total
assets
|
$ | 853,184 | $ | 395,431 | $ | 457,753 | $ | — | ||||||||
|
Liabilities:
|
||||||||||||||||
|
Derivative
liabilities
|
$ | 31,686 | $ | — | $ | 31,686 | $ | — | ||||||||
|
As
of December 27, 2008
|
||||||||||||||||
|
Fair
Value Measurements at Reporting
Date
Using
|
||||||||||||||||
|
|
Total
Fair
Value
and
Carrying
Value
on Our
Balance
Sheet
|
Quoted
Prices
in
Active
Markets
for
Identical
Assets
(Level
1)
|
Significant
Other
Observable
Inputs
(Level
2)
|
Significant
Unobservable
Inputs
(Level
3)
|
||||||||||||
|
Assets:
|
||||||||||||||||
|
Cash
equivalents:
|
||||||||||||||||
|
Federal
agency debt
|
$ | 38,832 | $ | — | $ | 38,832 | $ | — | ||||||||
|
Money
market mutual funds
|
73,952 | 73,952 | — | — | ||||||||||||
|
Marketable
securities:
|
||||||||||||||||
|
Federal
agency debt
|
68,086 | — | 68,086 | — | ||||||||||||
|
Foreign
agency debt
|
6,977 | — | 6,977 | — | ||||||||||||
|
Corporate
debt securities
|
30,538 | — | 30,538 | — | ||||||||||||
|
Derivative
assets
|
34,931 | — | 34,931 | — | ||||||||||||
|
Total
assets
|
$ | 253,316 | $ | 73,952 | $ | 179,364 | $ | — | ||||||||
|
Liabilities:
|
||||||||||||||||
|
Derivative
liabilities
|
$ | 51,787 | $ | — | $ | 51,787 | $ | — | ||||||||
Page
88
Fair
Value of Financial Instruments
The
carrying values and fair values of our financial instruments at December 26,
2009 and December 27, 2008 were as follows (in thousands):
|
December
26, 2009
|
December
27, 2008
|
|||||||||||||||
|
|
Carrying
Value
|
Fair
Value
|
Carrying
Value
|
Fair
Value
|
||||||||||||
|
Assets:
|
||||||||||||||||
|
Marketable
securities, current and noncurrent
|
$ | 449,844 | $ | 449,844 | $ | 105,601 | $ | 105,601 | ||||||||
|
Notes
receivable — current
|
$ | 50,531 | $ | 50,531 | $ | — | $ | — | ||||||||
|
Credit
default swaps
|
$ | — | $ | — | $ | 896 | $ | 896 | ||||||||
|
Foreign
exchange forward contract assets
|
$ | 7,909 | $ | 7,909 | $ | 34,035 | $ | 34,035 | ||||||||
|
Deposit
with financial services company (restricted investment)
|
$ | — | $ | — | $ | 25,841 | $ | 13,039 | ||||||||
|
Restricted investments
|
$ | 36,467 | $ | 36,467 | $ | — | $ | — | ||||||||
|
Investment
in related party
|
$ | 25,000 | $ | 25,000 | $ | 25,000 | $ | 25,000 | ||||||||
|
Notes
receivable — noncurrent
|
$ | 25,241 | $ | 25,332 | $ | — | $ | — | ||||||||
|
Liabilities:
|
||||||||||||||||
|
Long-term
debt, including current maturities
|
$ | 174,958 | $ | 178,900 | $ | 198,470 | $ | 204,202 | ||||||||
|
Interest
rate swaps
|
$ | 1,083 | $ | 1,083 | $ | 1,377 | $ | 1,377 | ||||||||
|
Foreign
exchange forward contract liabilities
|
$ | 30,603 | $ | 30,603 | $ | 50,410 | $ | 50,410 | ||||||||
The
carrying values on our balance sheet of our cash and cash equivalents, accounts
receivable, restricted cash, accounts payable, income tax payable and accrued
expenses approximate their fair values due to their short maturities; therefore,
we exclude them from the table above.
We
estimated the fair value of our long-term debt in accordance with ASC 820 using
a discounted cash flows approach (an income approach) and we incorporated the
credit risk of our counterparty for asset fair value measurements and our credit
risk for liability fair value measurements.
In
October 2008, we made an investment, at a total cost of $25.0 million, in the
preferred stock of a company based in the United States that supplies and
installs solar power systems to commercial and residential customers. This
investment represents an ownership of approximately 11% of the voting
interest in this company at December 26, 2009 and is our only equity interest in
that entity. Since our ownership interest in this company is less than 20% and
we do not have significant influence over it, we account for this investment
using the cost method. We performed a valuation assessment and have determined
that the carrying value of this investment equals the fair value at
December 26, 2009. See Note 9. “Fair Value Measurement” to our consolidated
financial statements for information about the fair value measurement of our
investment in a related party.
In
the fourth fiscal quarter of 2008, we also entered into a long-term solar module
supply agreement with this related party. During the year ended December 26,
2009, we recognized $18.5 million in net sales to this related party. At
December 26, 2009 we had accounts receivable from this related party of $7.0
million. During 2008, we did not have any material revenue transactions with
this related party.
Page
89
On
April 8, 2009 we entered into a credit facility agreement with a solar project
entity of one of our customers for an available amount of €17.5 million
($25.2 million at the balance sheet close rate on December 26, 2009 of
$1.44/€1.00) to provide financing for a photovoltaic power generation facility.
The credit facility replaced a bridge loan that we had made to this entity. The
credit facility bears interest at 8% per annum and is due on December 31, 2026.
As of December 26, 2009, this credit facility was fully drawn. The outstanding
amount of this credit facility has been included within Other assets –
noncurrent on our consolidated balance sheets.
On
April 21, 2009, we entered into a revolving VAT financing facility agreement for
an available amount of €9.0 million ($13.0 million at the balance sheet close
rate on December 26, 2009 of $1.44/€1.00) with the same solar project entity
with which we entered into the credit facility agreement on April 8, 2009. The
VAT facility agreement pre-finances the amounts of German value added tax (VAT)
and any other tax obligations of similar nature during the construction phase of
the photovoltaic power generation facility. Borrowings under this facility are
short-term in nature, since the facility is repaid when VAT amounts are
reimbursed by the government. The VAT facility agreement bears interest at the
rate of Euribor plus 1.2% and matures on December 31, 2010. As of December 26,
2009 the balance on this credit facility was €1.4 million ($2.0 million at
the balance sheet close rate on December 26, 2009 of $1.44/€1.00). The
outstanding amount of this credit facility is included within Prepaid expenses
and other current assets on our consolidated balance sheets.
In
October 2009, we entered into a fixed rate note with a solar power project
entity to finance construction and start-up costs of a photovoltaic facility in
Germany. This note provides funding in the amount of €19.2 million ($27.6
million at the balance sheet close rate on December 26, 2009 of $1.44/€1.00).
The fixed rate note is due on May 31, 2010 and bears interest at 7% per annum.
The fixed rate note is collateralized by a bank account pledge agreement, a
security assignment agreement, a partnership interest pledge agreement and a
share pledge agreement. The outstanding amount of this financing agreement is
included within Prepaid expenses and other current assets on our consolidated
balance sheets.
In
October 2009, we entered into a fixed rate note with another solar power project
entity to finance construction and start-up costs of a photovoltaic facility in
Germany. This note provides funding in the amount of €14.5 million ($20.9
million at the balance sheet close rate on December 26, 2009 of $1.44/€1.00).
The fixed rate note is due on May 31, 2010 and bears interest at 7% per annum.
This fixed rate note is collateralized by a bank account pledge agreement, a
security assignment agreement, a guarantee agreement and share pledge agreement.
The outstanding amount of this financing agreement is included within Prepaid
expenses and other current assets on our consolidated balance
sheets.
Legislative
initiatives in Europe hold manufacturers responsible for the collection and
recycling of certain electrical products. The legislation passed to date does
not include solar modules. However, based on our commitment to the environment,
we have determined that we should ensure the collection and recycling of the
modules that we sell worldwide. As a result, we include a solar module
collection and recycling arrangement in our standard sales contracts. Under this
arrangement, we agree to provide for the collection and recycling of the
materials in our solar modules and the system owners agree to notify us,
disassemble their solar power systems, package the solar modules for shipment
and revert ownership rights over the modules back to us at the end of the
modules’ service lives.
At
the time of sale, we have recorded accrued collection and recycling liabilities
for the estimated fair value of our obligations for the collection and recycling
of our solar modules that we have sold and we have made associated charges to
cost of sales. We based our estimate of the fair value of our collection and
recycling obligations on the present value of the expected future cost of
collecting and recycling the modules, which includes the cost of packaging the
modules for transport, the cost of freight from the module installation sites to
a recycling center and the material, labor, and capital costs of the recycling
process. We based this estimate on our experience collecting and recycling our
solar modules and on our expectations about future developments in recycling
technologies and processes and about economic conditions at the time the modules
will be collected and recycled. In the periods between the time of our sales and
our settlement of the collection and recycling obligations, we accrete the
carrying amount of the associated liability by applying the discount rate used
for its initial measurement. We classify accretion expense as an other operating
expense within selling, general and administrative on our consolidated statement
of operations.
Our
module collection and recycling liabilities totaled $92.8 million at
December 26, 2009 and $35.2 million at December 27, 2008. We
charged $52.4 million, $22.2 million and $8.9 million to cost of sales
for the fair value of our collection and recycling obligation for modules sold
during the years ended December 26, 2009, December 27, 2008 and
December 29, 2007, respectively. The accretion expense on our collection
and recycling obligations was $2.4 million, $0.9 million and
$0.3 million during the years ended December 26, 2009,
December 27, 2008 and December 29, 2007, respectively.
Page
90
Our
long-term debt at December 26, 2009 and December 27, 2008 consisted of the
following (in thousands):
|
Type
|
December
26,
2009
|
December
27,
2008
|
||||||
|
Malaysian
Facility Agreement – Fixed rate term loan
|
$ | 84,166 | $ | 66,975 | ||||
|
Malaysian
Facility Agreement – Floating rate term loan (1)
|
84,166 | 66,975 | ||||||
|
Director
of Development of the State of Ohio
|
9,994 | 11,694 | ||||||
|
Director
of Development of the State of Ohio
|
139 | 1,528 | ||||||
|
German
Facility Agreement
|
— | 54,982 | ||||||
|
Capital
lease obligations
|
2 | 5 | ||||||
| 178,467 | 202,159 | |||||||
|
Less
unamortized discount
|
(3,509 | ) | (3,689 | ) | ||||
|
Total
long-term debt
|
174,958 | 198,470 | ||||||
|
Less
current portion
|
(28,559 | ) | (34,951 | ) | ||||
|
Noncurrent
portion
|
$ | 146,399 | $ | 163,519 | ||||
|
(1)
|
We
entered into an interest rate swap contract related to this loan. See Note
8. “Derivative Instruments” to our consolidated financial
statements.
|
We
did not have any short-term debt at December 26, 2009 and December 27,
2008.
Revolving
Credit Facility
On
September 4, 2009, we entered into a revolving credit facility pursuant to
a Credit Agreement among First Solar, Inc., certain designated Borrowing
Subsidiaries (consisting of First Solar Manufacturing GmbH, a German subsidiary,
and other subsidiaries of our Company who may in the future be designated as
borrowers pursuant to the Credit Agreement) and several lenders. JPMorgan
Chase Bank, N.A. and Bank of America served as Joint-Lead Arrangers and
Bookrunners, with JPMorgan also acting as Administrative Agent. The Credit
Agreement provides First Solar, Inc. and the Borrowing Subsidiaries with a
senior secured three-year revolving credit facility in an aggregate available
amount of $300.0 million, a portion of which is available for letters of credit
and swingline loans. Subject to certain conditions, we have the right to
request an increase in the aggregate commitments under the Credit Facility up to
$400.0 million. In connection with the Credit Agreement, we also entered into a
guarantee and collateral agreement and foreign security agreements.
Borrowings
under the Credit Agreement currently bear interest at (i) LIBOR (adjusted for
eurocurrency reserve requirements) plus a margin of 2.75% or (ii) a base rate as
defined in the Credit Agreement plus a margin of 1.75%, depending on the type of
borrowing requested by us. These margins are subject to adjustments
depending on our consolidated leverage ratio and the credit rating of the
facility provided by Moody’s Investors Service, Inc. and Standard and Poor’s
Rating Services.
At
December 26, 2009, we had no borrowings outstanding and $46.0 million in
letters of credit drawn on the revolving credit facility, leaving approximately
$254.0 million in capacity available under the revolving credit facility, $29.0
million of which may be used for letters of credit. As of December 26,
2009, based on applicable indices, the all-in effective three months LIBOR
borrowing rate was 3.47%.
In
addition to paying interest on outstanding principal under the Credit Agreement,
we are required to pay a commitment fee currently at the rate of 0.375% per
annum to the lenders based on the average daily unutilized commitments under the
facility. The commitment fee may also be adjusted due to changes in our
consolidated leverage ratio.
Page
91
We
will also pay a letter of credit fee equal to the applicable margin for
eurocurrency revolving loans on the face amount of each letter of credit and a
fronting fee. Proceeds from the credit facility may be used for working
capital and other general corporate purposes.
The
Credit Agreement contains various financial condition covenants which we must
comply with, including a debt to EBITDA ratio covenant, a minimum EBITDA
covenant and a minimum liquidity covenant. Under the Credit Agreement we
are also subject to customary non-financial covenants including limitations in
secured indebtedness and limitations on dividends and other restricted payments.
We were in compliance with these covenants through December 26,
2009.
Malaysian
Facility Agreement
On
May 6, 2008, in connection with the plant expansion at our Malaysian
manufacturing center, First Solar Malaysia Sdn. Bhd. (FS Malaysia), our indirect
wholly owned subsidiary, entered into an export financing facility agreement
(Malaysian Facility Agreement) with a consortium of banks. The total available
loan amount was €134.0 million ($193.0 million at the balance sheet close
rate on December 26, 2009 of $1.44/€1.00). Pursuant to the Malaysian Facility
Agreement, we began semi-annual repayments of the principal balances of these
credit facilities during 2008. Amounts repaid under this credit facility cannot
be re-borrowed. These credit facilities consisted of the following (in
thousands):
|
Malaysian
Borrowings
|
Denomination
|
Interest
Rate
|
Maturity
|
Outstanding
at
December
26,
2009
|
|||||||||||||
|
Fixed-rate
euro-denominated term loan
|
EUR
|
4.54% | 2016 | $ | 84,166 | ||||||||||||
|
Floating-rate
euro-denominated term loan
|
EUR
|
Euribor plus 0.55%
|
2016 | 84,166 | |||||||||||||
|
Total
|
$ | 168,332 | (1) | ||||||||||||||
|
(1)
|
€116.9
million outstanding at December 26, 2009 ($168.3 million at the balance
sheet close rate on December 26, 2009 of
$1.44/€1.00)
|
At
December 26, 2009, equipment with a net book value of $189.5 million was
pledged as collateral for these loans.
These
credit facilities were used by FS Malaysia for the purpose of (1) partially
financing the purchase of certain equipment to be used at our Malaysian
manufacturing center and (2) financing fees to be paid to Euler-Hermes
Kreditversicherungs-AG (Euler-Hermes), the German Export Credit Agency of
Hamburg, Federal Republic of Germany, which guarantees 95% of FS Malaysia’s
obligations related to the Malaysian credit facilities (Hermes Guaranty). In
addition, FS Malaysia’s obligations related to the Malaysian credit facilities
are guaranteed, on an unsecured basis, by First Solar, Inc., pursuant to a
guaranty agreement.
FS
Malaysia is obligated to pay commitment fees at an annual rate of 0.375% on the
unused portions of the fixed rate credit facilities and at an annual rate of
0.350% on the unused portions of the floating rate credit facilities. In
addition, FS Malaysia is obligated to pay certain underwriting, management and
agency fees in connection with the credit facilities.
In
connection with the credit facilities, First Solar, Inc. entered into a first
demand guaranty agreement dated May 6, 2008 in favor of the lenders.
Thereby FS Malaysia’s obligations related to the Malaysian Facility Agreement
are guaranteed, on an unsecured basis, by First Solar, Inc.
In
connection with the credit facilities, all of FS Malaysia’s obligations are
secured by a first party, first legal charge over the equipment financed by the
credit facilities and the other documents, contracts and agreements related to
that equipment. Also in connection with the Malaysian credit facilities, any
payment claims of First Solar, Inc. against FS Malaysia are subordinated to the
claims of the lenders.
The
Malaysian Facility Agreement contains various financial covenants with which we
must comply, such as debt to equity ratios, total leverage ratios, interest
coverage ratios and debt service coverage ratios. We must calculate and submit
these ratios related to the financial covenants for the first time at the end of
fiscal 2009. The Malaysian Facility Agreement also contains various customary
non-financial covenants with which FS Malaysia must comply, including submitting
various financial reports and business forecasts to the lenders, maintaining
adequate insurance, complying with applicable laws and regulations, and
restrictions on FS Malaysia’s ability to sell or encumber assets or make loan
guarantees to third parties. We were in compliance with these covenants through
December 26, 2009.
Certain
of our indebtedness under the Malaysian credit facilities bears interest at
rates based on the Euro Interbank Offered Rate (Euribor). Euribor is the primary
interbank lending rate within the Euro zone, with maturities ranging from one
week to one year. A disruption of the credit environment could negatively impact
interbank lending and therefore negatively impact the Euribor rate. An increase
in the Euribor rate would not impact our cost of borrowing under the Malaysian
Facility Agreement as we entered into an interest rate swap agreement to
mitigate such risk.
Page
92
State
of Ohio Loans
During
the years ended December 25, 2004 and December 31, 2005, we received the
following loans from the Director of Development of the State of Ohio (in
thousands):
|
Ohio
Borrowings
|
Original
Loan Amount
|
Denomination
|
Interest
Rate
|
Maturity
|
Outstanding
at
December
26,
2009
|
||||||||||||
|
Director
of Development of the State of Ohio
|
$ | 15,000 |
USD
|
2.25% | 2015 | $ | 9,994 | ||||||||||
|
Director
of Development of the State of Ohio
|
$ | 5,000 |
USD
|
0.25% — 3.25% | 2009 | $ | 139 | ||||||||||
|
Total
|
$ | 20,000 | $ | 10,133 | |||||||||||||
At
December 26, 2009, land and buildings, and machinery and equipment with net
book values of $21.1 million and $7.7 million, respectively, was
pledged as collateral for these loans.
German
Facility Agreement
On
July 27, 2006, First Solar Manufacturing GmbH, a wholly owned indirect
subsidiary of First Solar, Inc., entered into a credit facility agreement with a
consortium of banks under which First Solar Manufacturing GmbH could draw up to
€102.0 million ($146.9 million at the balance sheet close rate on December
26, 2009 of $1.44/€1.00) to fund costs of constructing and starting up our
German plant. First Solar Manufacturing GmbH repaid the entire outstanding
principal amount of this credit facility and all accrued interest on June 30,
2009 and concurrently terminated this facility.
Future
Principal Payments
At
December 26, 2009, future principal payments on our long-term debt,
excluding payments related to capital leases, which are disclosed in
Note 14 to our consolidated financial statements, were due as follows (in
thousands):
|
2010
|
$ | 29,576 | ||
|
2011
|
29,329 | |||
|
2012
|
29,365 | |||
|
2013
|
29,401 | |||
|
2014
|
29,480 | |||
|
Thereafter
|
31,314 | |||
|
Total
long-term debt future principal payments
|
$ | 178,465 |
Our
debt-financing agreements bear interest at the Euro Interbank Offered Rate
(Euribor) and London Interbank Offered Rate (LIBOR). A disruption of the credit
environment, as previously experienced, could negatively impact interbank
lending and therefore negatively impact both floating rates. An increase in the
LIBOR rate would increase our cost of borrowing under our Revolving Credit
Facility. An increase in the Euribor rate would not impact our cost of borrowing
under our Malaysian Facility Agreement as we entered into an interest rate swap
agreement to mitigate such risk.
Financial
guarantees
In
the normal course of business, we occasionally enter into agreements with third
parties under which we guarantee the performance of our subsidiaries related to
certain service contracts, which may include services such as development,
engineering, procurement of permits and equipment, construction management and
monitoring and maintenance. These agreements meet the definition of a guarantee
according to ASC 460,
Guarantees
. As of December
26, 2009 and December 27, 2008, none of these guarantees were material to
our financial position.
Page
93
Loan
guarantees
In
connection with the Malaysian Facility Agreement, First Solar, Inc. entered into
a first demand guaranty agreement dated May 6, 2008 in favor of IKB, NZD,
NLB and the other lenders under the Malaysian Facility Agreement. FS Malaysia’s
obligations related to the Malaysian Facility Agreement are guaranteed, on an
unsecured basis, by First Solar Inc. pursuant to this guaranty agreement. See
Note 13. “Debt” to our consolidated financial statements for additional
information.
In
connection with our revolving credit facility, we entered into a guarantee and
collateral agreement and various foreign security agreements. Loans made to
First Solar Manufacturing GmbH (a borrowing subsidiary under the credit
facility) are (i) guaranteed by First Solar, Inc. pursuant to the guarantee and
collateral agreement, (ii) guaranteed by certain of First Solar, Inc.’s direct
and indirect subsidiaries organized under the laws of Germany, pursuant to a
German guarantee agreement, (iii) secured by share pledge agreements, (iv)
secured by a security interest in intercompany receivables held by First Solar
Holdings GmbH, First Solar GmbH, and First Solar Manufacturing GmbH, pursuant to
assignment agreements and (v) subject to a security trust agreement, which sets
forth additional terms regarding the foregoing German security documents and
arrangements. See Note 13. “Debt” to our consolidated financial statements for
additional information.
Commercial
commitments
During
the year ended December 26, 2009, we entered into 46 commercial commitments in
the form of letters of credit related to our systems business in the amount of
$41.6 million; of which, $13.0 million will expire between 2011 and 2015 and
$28.6 million has an initial expiration in 2010 and automatically extends for
one year annually unless our counterparty elects not to extend the letter of
credit beyond its then current expiration date. We also increased two of our
previously held bank guarantees for energy supply agreements by MYR 5.6 million
($1.6 million at the balance sheet close rate on December 26, 2009 of
$0.29/MYR1.00), for a total commitment of MYR 11.8 million ($3.4 million at
the balance sheet close rate on December 26, 2009 of $0.29/MYR1.00). As of
December 26, 2009, we had an additional outstanding bank guarantee of MYR
3.0 million dated September 2008 for Malaysian custom and excise tax
($0.9 million at the balance sheet close rate on December 26, 2009 of
$0.29/MYR1.00).
Lease
commitments
We
lease our corporate headquarters in Tempe, Arizona and administrative, business
and marketing development, customer support and government affairs offices
throughout the United States and Europe under non-cancelable operating leases.
These leases require us to pay property taxes, common area maintenance and
certain other costs in addition to base rent. We also lease certain machinery
and equipment and office furniture and equipment under operating and capital
leases. Future minimum payments under all of our non-cancelable leases are as
follows as of December 26, 2009 (in thousands):
|
|
Capital
Leases
|
Operating
Leases
|
Total
|
|||||||||
|
2010
|
$ | 2 | $ | 8,392 | $ | 8,394 | ||||||
|
2011
|
— | 13,334 | 13,334 | |||||||||
|
2012
|
— | 7,385 | 7,385 | |||||||||
|
2013
|
— | 7,178 | 7,178 | |||||||||
|
2014
|
— | 6,810 | 6,810 | |||||||||
|
Thereafter
|
— | 29,084 | 29,084 | |||||||||
|
Total
minimum lease payments
|
2 | $ | 72,183 | $ | 72,185 | |||||||
|
Less
amounts representing interest
|
— | |||||||||||
|
Present
value of minimum lease payments
|
2 | |||||||||||
|
Less
current portion of obligations under capital leases
|
— | |||||||||||
|
Noncurrent
portion of obligations under capital leases
|
$ | 2 | ||||||||||
Our
rent expense was $9.6 million, $6.2 million and $1.2 million in each
of the years ended December 26, 2009, December 27, 2008 and
December 29, 2007, respectively.
Page
94
Purchase
commitments
We
purchase raw materials for inventory, services and manufacturing equipment from
a variety of vendors. During the normal course of business, in order to manage
manufacturing lead times and help assure adequate supply, we enter into
agreements with suppliers that either allow us to procure goods and services
when we choose or that establish purchase requirements. In certain instances,
these latter agreements allow us the option to cancel, reschedule, or adjust our
requirements based on our business needs prior to firm orders being placed.
Consequently, only a portion of our recorded purchase commitments are firm,
non-cancelable and unconditional. At December 26, 2009, our obligations
under firm, non-cancelable and unconditional agreements were
$416.4 million, of which, $14.5 million was for commitments related to
plant construction and maintenance. $161.1 million of our purchase
obligations are due in fiscal 2010.
Product
warranties
We
offer warranties on our products and record an estimate of the associated
liability based on the following factors: number of solar modules under warranty
at customer locations, historical experience with warranty claims, monitoring of
field installation sites, in-house testing of our solar modules and estimated
per-module replacement cost.
Product
warranty activity during the years ended December 26, 2009 and
December 27, 2008 was as follows (in thousands):
|
December
26,
2009
|
December
27,
2008
|
December
29,
2007
|
||||||||||
|
Product
warranty liability, beginning of period
|
$ | 11,905 | $ | 7,276 | $ | 2,764 | ||||||
|
Accruals
for new warranties issued (warranty expense)
|
16,654 | 8,525 | 4,831 | |||||||||
|
Additional
warranty from acquisition
|
— | — | 398 | |||||||||
|
Settlements
|
(2,431 | ) | (404 | ) | (258 | ) | ||||||
|
Change
in estimate of warranty liability
|
(3,545 | ) | (3,492 | ) | (459 | ) | ||||||
|
Product
warranty liability, end of period
|
$ | 22,583 | $ | 11,905 | $ | 7,276 | ||||||
|
Current
portion of warranty liability
|
$ | 8,216 | $ | 4,040 | $ | 2,094 | ||||||
|
Noncurrent
portion of warranty liability
|
$ | 14,367 | $ | 7,865 | $ | 5,182 | ||||||
Legal
matters
We
are a party to legal matters and claims that are normal in the course of our
operations. While we believe that the ultimate outcome of these matters will not
have a material adverse effect on our financial position, results of operations
or cash flows, the outcome of these matters is not determinable with certainty
and negative outcomes may adversely affect us.
Sales
Agreements
We
entered into long-term contracts for the sale of our solar modules with certain
European and North American solar power system project developers, system
integrators and operators. Under these contracts, we agree to provide each
customer with solar modules totaling certain amounts of power generation
capability during specified time periods. Our customers are entitled to certain
remedies in the event of missed deliveries of the total kilowatt volume. These
delivery commitments are established through a rolling four quarter forecast
that defines the specific quantities to be purchased on a quarterly basis and
schedules the individual shipments to be made to our customers. In the case of a
late delivery, our customers are entitled to a maximum charge of up to 6% of the
delinquent revenue. If we do not meet our annual minimum volume shipments or a
stipulated minimum average watts per module, our customers also have the right
to terminate these contracts on a prospective basis.
Page
95
Preferred
stock
We
have authorized 30,000,000 shares of undesignated preferred stock,
$0.001 par value, none of which was issued and outstanding at
December 26, 2009. Our board of directors is authorized to determine the
rights, preferences and restrictions on any series of preferred stock that we
may issue.
Common
stock
We
have authorized 500,000,000 shares of common stock, $0.001 par value,
of which 85,208,199 shares were issued and outstanding at December 26,
2009. Each share of common stock has the right to one vote. We have not declared
or paid any dividends through December 26, 2009.
We
measure share-based compensation cost at the grant date based on the fair value
of the award and recognize this cost as an expense over the grant recipients’
requisite service periods, in accordance with ASC 718,
Compensation-Stock
Compensation
. The share-based compensation expense that we recognized in
our consolidated statements of operations for the years ended December 26,
2009, December 27, 2008 and December 29, 2007 was as follows (in
thousands):
|
2009
|
2008
|
2007
|
||||||||||
|
Share-based
compensation expense included in:
|
||||||||||||
|
Cost
of sales
|
$ | 17,145 | $ | 12,216 | $ | 9,524 | ||||||
|
Research
and development
|
8,230 | 5,967 | 4,719 | |||||||||
|
Selling,
general and administrative
|
61,904 | 38,926 | 23,393 | |||||||||
|
Production
start-up
|
1,466 | 1,835 | 1,430 | |||||||||
|
Total
share-based compensation expense
|
$ | 88,745 | $ | 58,944 | $ | 39,066 | ||||||
The
increase in share-based compensation expense was primarily the result of new
awards.
The
following table presents our share-based compensation expense by type of award
for the years ended December 26, 2009, December 27, 2008 and
December 29, 2007 (in thousands):
|
2009
|
2008
|
2007
|
||||||||||
|
Stock
options
|
$ | 14,552 | $ | 15,983 | $ | 25,153 | ||||||
|
Restricted
stock units
|
71,130 | 42,418 | 13,977 | |||||||||
|
Unrestricted
stock
|
3,700 | 325 | 297 | |||||||||
|
Net
amount absorbed into inventory
|
(637 | ) | 218 | (361 | ) | |||||||
|
Total
share-based compensation expense
|
$ | 88,745 | $ | 58,944 | $ | 39,066 | ||||||
Share-based
compensation cost capitalized in our inventory was $1.0 million,
$0.3 million and $0.6 million at December 26, 2009,
December 27, 2008 and December 29, 2007, respectively. As of December
26, 2009, we had $3.4 million of unrecognized share-based compensation cost
related to unvested stock option awards, which we expect to recognize as an
expense over a weighted-average period of approximately 0.8 year, and $123.9
million of unrecognized share-based compensation cost related to unvested
restricted stock units, which we expect to recognize as an expense over a
weighted-average period of approximately 1.9 years. On April 30, 2007, we
modified 474,374 of our share options to change their vesting dates from
August 31, 2008 to August 31, 2007 and 1,171,060 of our share options
to change their vesting dates from August 31, 2008 to January 15,
2008. These modifications did not affect the fair value of these share options
that we used to calculate our share-based compensation expense, but the
modifications did shorten the requisite service period over which we recognized
that compensation expense.
Page
96
The
share-based compensation expense that we recognize in our results of operations
is based on the number of awards expected to ultimately vest; therefore, the
actual award amounts have been reduced for estimated forfeitures. ASC 718
requires us to estimate the number of awards that we expect to vest at the time
the awards are granted and revise those estimates, if necessary, in subsequent
periods. We estimate the number of awards that we expect to vest based on our
historical experience with forfeitures of our awards, giving consideration to
whether future forfeiture behavior might be expected to differ from past
behavior. We recognize compensation cost for awards with graded vesting
schedules on a straight-line basis over the requisite service periods for each
separately vesting portion of the awards as if each award was in substance
multiple awards.
During
the years ended December 26, 2009 and December 27, 2008, we recognized
an income tax benefit in our statement of operations of $27.9 million and
$17.1 million, respectively, for share-based compensation costs incurred
during those years. During the year ended December 29, 2007, we recognized
an income tax benefit in our statement of operations of $13.8 million for
share-based compensation costs incurred during that year and an income tax
benefit of $6.7 million related to share-based compensation costs incurred
during prior years as a result of reversing the valuation allowance on our
deferred tax assets.
Share-based
Compensation Plans
During
2003, we adopted our 2003 Unit Option Plan (the “2003 Plan”). In connection with
our February 2006 conversion from a limited liability company to a corporation,
we converted each outstanding option to purchase one limited liability
membership unit under the 2003 Plan into an option to purchase one share of our
common stock, in each case at the same exercise price and subject to the other
terms and conditions of the outstanding option. Under the 2003 Plan, we may
grant non-qualified options to purchase common shares of First Solar, Inc. to
associates of First Solar, Inc. (including any of its subsidiaries) and
non-employee individuals and entities that provide services to First Solar, Inc.
or any of its subsidiaries. The 2003 Plan is administered by a committee
appointed by our board of directors, which is authorized to, among other things,
determine who will receive grants and determine the exercise price and vesting
schedule of the options. The maximum number of new shares of our common stock
that may be delivered by awards granted under the 2003 Plan is 6,847,060, and
the shares underlying forfeited, expired, terminated, or cancelled awards become
available for new award grants. Our board of directors may amend, modify, or
terminate the 2003 Plan without the approval of our stockholders. We may not
grant awards under the 2003 Plan after 2013, which is the tenth anniversary of
the plan’s approval by our stockholders. At December 26, 2009,
1,914,879 shares were available for grant under the 2003 Plan.
During
2006, we adopted our 2006 Omnibus Incentive Compensation Plan (the “2006 Plan”).
Under the 2006 Plan, directors, associates and consultants of First Solar, Inc.
(including any of its subsidiaries) are eligible to participate. The 2006 Plan
is administered by the compensation committee of our board of directors (or any
other committee designated by our board of directors), which is authorized to,
among other things, determine who will receive grants and determine the exercise
price and vesting schedule of the awards made under the plan. The 2006 Plan
provides for the grant of incentive stock options, non-qualified stock options,
stock appreciation rights, restricted stock units, performance units, cash
incentive awards and other equity-based and equity-related awards. The maximum
number of new shares of our common stock that may be delivered by awards granted
under the 2006 Plan is 5,820,000, of which the maximum number that may be
delivered by incentive stock options is 5,820,000 and the maximum number that
may be delivered as restricted stock awards is 2,910,000. Also, the shares
underlying forfeited, expired, terminated, or cancelled awards become available
for new award grants. Our board of directors may amend, modify, or terminate the
2006 Plan without the approval of our stockholders, except stockholder approval
is required for amendments that would increase the maximum number of shares of
our common stock available for awards under the plan, increase the maximum
number of shares of our common stock that may be delivered by incentive stock
options or modify the requirements for participation in the 2006 Plan. We may
not grant awards under the 2006 Plan after 2016, which is the tenth anniversary
of the plan’s approval by our stockholders. At December 26, 2009,
2,790,423 shares were available for grant under the 2006 Plan.
Stock
Options
Following
is a summary of our stock options as of December 26, 2009 and changes
during the year then ended:
|
|
Weighted
Average
|
|||||||||||||||
|
|
Number
of Shares
Under
Option
|
Exercise
Price
|
Remaining
Contractual
Term
(Years)
|
Aggregate
Intrinsic
Value
|
||||||||||||
|
Options
outstanding at December 27, 2008
|
1,536,310 | $ | 39.63 | |||||||||||||
|
Options
granted
|
34,084 | $ | 160.00 | |||||||||||||
|
Options
exercised
|
(537,526 | ) | $ | 11.09 | ||||||||||||
|
Options
forfeited or expired
|
(54,167 | ) | $ | 19.18 | ||||||||||||
|
Options
outstanding at December 26, 2009
|
978,701 | $ | 60.63 | 3.8 | $ | 88,370,746 | ||||||||||
|
Options
vested and exercisable at December 26, 2009
|
463,810 | $ | 89.10 | 3.5 | $ | 35,553,538 | ||||||||||
Page
97
Stock
options granted under the 2003 Plan and 2006 Plan have various vesting
provisions. Some cliff-vest, some vest ratably following the grant date, some
vest at different rates during different portions of their vesting periods and
some vested on the date of grant. The total fair value of stock options vesting
during the years ended December 26, 2009, December 27, 2008 and
December 29, 2007 were $13.4 million, $33.9 million, and
$5.4 million, respectively. During the years ended December 26, 2009,
December 27, 2008 and December 29, 2007, we received net cash proceeds
of $6.0 million, $16.0 million and $10.2 million, respectively, from
the exercise of employee options on our stock. The total intrinsic value of
employee stock options exercised was $71.0 million, $675.5 million and
$230.2 million during the years ended December 26, 2009,
December 27, 2008 and December 29, 2007, respectively.
The
following table presents exercise price and remaining life information about
options outstanding at December 26, 2009:
|
Options
Outstanding
|
||||||||||||||||||||||
|
Weighted
Average
|
||||||||||||||||||||||
|
Weighted
|
Remaining
|
Options
Exercisable
|
||||||||||||||||||||
|
Number
of
|
Average
|
Contractual
Term
|
Number
of
|
Weighted
Average
|
||||||||||||||||||
|
Exercise Price Range
|
Shares
|
Exercise
Price
|
(Years)
|
Shares
|
Exercise
Price
|
|||||||||||||||||
| $ | 2.06 - $4.54 | 141,237 | $ | 3.36 | 4.9 | 98,800 | $ | 2.89 | ||||||||||||||
| $ | 20.00 | 480,595 | $ | 20.00 | 3.7 | 138,585 | $ | 20.00 | ||||||||||||||
| $ | 27.28 - $32.81 | 35,388 | $ | 28.95 | 4.0 | 9,783 | $ | 29.46 | ||||||||||||||
| $ | 32.81 - $120.28 | 152,397 | $ | 58.04 | 4.3 | 74,892 | $ | 55.99 | ||||||||||||||
| $ | 120.28 - $266.90 | 69,084 | $ | 183.35 | 7.1 | 41,750 | $ | 169.43 | ||||||||||||||
| $ | 267.14 | 100,000 | $ | 267.14 | — | 100,000 | $ | 267.14 | ||||||||||||||
| 978,701 | $ | 60.63 | 3.8 | 463,810 | $ | 89.10 | ||||||||||||||||
We
estimated the fair value of each stock option awarded on its grant date using
the Black-Scholes-Merton closed-form option valuation formula, using the
assumptions documented in the following table for the years ended
December 26, 2009, December 27, 2008 and December 29,
2007:
|
|
2009
|
2008
|
2007
|
|||||||||
|
Price
of our stock on grant date
|
$ | 160.00 | $ | 181.77 - $266.90 | $ | 32.81 - $120.28 | ||||||
|
Stock
option exercise price
|
$ | 160.00 | $ | 181.77 - $267.14 | $ | 32.81 - $120.28 | ||||||
|
Expected
life of option
|
5.0 years
|
4.0
- 6.0 years
|
3.9
- 6.0 years
|
|||||||||
|
Expected
volatility of our stock
|
71% | 70% | 70% - 75% | |||||||||
|
Risk-free
interest rate
|
2.2% | 2.6% - 3.4% | 4.4% - 4.8% | |||||||||
|
Expected
dividend yield of our stock
|
0.0% | 0.0% | 0.0% | |||||||||
The
weighted-average estimated grant-date fair value of the stock options that we
granted during the years ended December 26, 2009, December 27, 2008
and December 29, 2007 were $95.35, $113.01 and $34.93,
respectively.
Our
stock options expire seven to ten years from their grant date. We estimated the
expected life, which represents our best estimate of the period of time from the
grant date that we expect the stock options to remain outstanding, of all of our
stock options for all periods presented using the simplified method specified in
ASC 718. Under this method, we estimate the expected life of our stock options
as the mid-point between their time to vest and their contractual terms. We
applied the simplified method because we do not have sufficient historical
exercise data to provide a reasonable basis upon which to estimate expected life
due to the limited period of time our equity shares have been publicly traded
and the significant differences in vesting and contractual terms between the
majority of our options that have been exercised through December 26, 2009
and the options that we granted during the year ended on that
date.
Page
98
Because
our stock is newly publicly traded, we do not have a meaningful observable
share-price volatility; therefore, we based our estimate of the expected
volatility of our future stock price on that of similar publicly-traded
companies, and we expect to continue to estimate our expected stock price
volatility in this manner until such time as we might have adequate historical
data to refer to from our own traded share prices. We used U.S. Treasury
rates in effect at the time of the grants for the risk-free rates.
None
of our stock options were granted outside of either the 2003 Plan or the 2006
Plan.
Restricted
Stock Units
We
began issuing restricted stock units in the second quarter of 2007 and all have
been granted under the 2006 Plan. We issue shares to the holders of restricted
units on the date the restricted stock units vest. The majority of shares issued
are net of the statutory withholding requirements, which we will pay on behalf
of our associates. As a result, the actual number of shares issued will be less
than the number of restricted stock units granted. Prior to vesting, restricted
stock units do not have dividend equivalent rights and do not have voting
rights, and the shares underlying the restricted stock units are not considered
issued and outstanding.
Following
is a summary of our restricted stock units as of December 26, 2009 and
changes during the year then ended:
|
|
Number
of Shares
|
Weighted
Average
Grant-Date
Fair
Value
|
||||||
|
Restricted
stock units outstanding at December 27, 2008
|
650,254 | $ | 201.32 | |||||
|
Restricted
stock units granted
|
732,067 | $ | 150.79 | |||||
|
Restricted
stock units vesting
|
(174,789 | ) | $ | 200.14 | ||||
|
Restricted
stock units forfeited or expired
|
(81,294 | ) | $ | 173.46 | ||||
|
Restricted
stock units outstanding at December 26, 2009
|
1,126,238 | $ | 170.67 | |||||
We
estimate the fair value of our restricted stock unit awards as our stock price
on the grant date.
Stock
Awards
During
the years ended December 26, 2009, December 27, 2008 and
December 29, 2007, we awarded 3,126, 1,384 and 4,845, respectively, fully
vested, unrestricted shares of our common stock to the independent members of
our board of directors. We recognized $0.5 million share-based compensation
expense for these awards during the year ended December 26, 2009 and
$0.3 million of share-based compensation expense for these awards during
each of the years ended December 27, 2008 and December 29,
2007.
During
the year ended December 26, 2009, we awarded 20,313 fully vested,
unrestricted shares of our common stock to our new Chief Executive Officer as
part of his employment agreement. We withheld 8,327 shares to satisfy certain
tax withholding obligations, and as a result, issued 11,986 net shares. We
recognized $3.3 million share-based compensation expense for this
award.
We
offer a 401(k) retirement savings plan into which all of our
U.S. associates (our term for employees) can voluntarily contribute a
portion of their annual salaries and wages, subject to legally prescribed dollar
limits. Our contributions to our associates’ plan accounts are made at the
discretion of our board of directors and are based on a percentage of the
participating associates’ contributions. During 2008, we matched half of the
first 8% of the compensation that our associates contributed to the 401(k) Plan.
Effective January 1, 2009, associate contributions were matched
dollar-for-dollar up to the first 4%. Our contributions to the plans were $4.5
million, $2.0 million and $0.6 million million for the years ended
December 26, 2009, December 27, 2008 and December 29, 2007,
respectively. None of these benefit plans offered participants an option to
invest in our common stock.
In
addition, effective fiscal 2008, we offered certain retirement savings plans to
associates at our foreign subsidiaries in Europe. These plans are managed in
accordance with applicable local statutes and practices and are defined
contribution plans. Our contributions to these plans were $0.3 million and
$0.4 million during the years ended December 26, 2009 and December 27,
2008, respectively.
Page
99
The
components of our income tax expense (benefit) were as follows (in
thousands):
|
|
December
26, 2009
|
December
27, 2008
|
December
29, 2007
|
|||||||||
|
Current
expense (benefit):
|
||||||||||||
|
Federal
|
$ | 20,872 | $ | 27,328 | $ | 25,163 | ||||||
|
State
|
123 | 1,312 | 828 | |||||||||
|
Foreign
|
60,210 | 99,780 | 27,498 | |||||||||
|
Total
current expense (benefit)
|
81,205 | 128,420 | 53,489 | |||||||||
|
Deferred
expense (benefit):
|
||||||||||||
|
Federal
|
(34,296 | ) | (14,388 | ) | (49,888 | ) | ||||||
|
State
|
(5,732 | ) | (163 | ) | (148 | ) | ||||||
|
Foreign
|
4,999 | 1,577 | (5,845 | ) | ||||||||
|
Total
deferred expense (benefit)
|
(35,029 | ) | (12,974 | ) | (55,881 | ) | ||||||
|
Total
income tax expense (benefit)
|
$ | 46,176 | $ | 115,446 | $ | (2,392 | ) | |||||
The
current tax expense listed above does not reflect income tax benefits of
$1.3 million, $28.7 million and $26.6 million for the years ended
December 26, 2009, December 27, 2008 and December 29, 2007,
respectively, related to excess tax deductions on share-based compensation
because we recorded these benefits directly to additional paid-in capital,
pursuant to ASC 740 and ASC 718.
The
U.S. and non-U.S. components of our income before income taxes were as
follows (in thousands):
|
|
December
26, 2009
|
December
27, 2008
|
December
29, 2007
|
|||||||||
|
U.S.
(loss) income
|
$ | (25,588 | ) | $ | 42,917 | $ | 72,976 | |||||
|
Non-U.S.
income
|
711,902 | 420,859 | 82,986 | |||||||||
|
Income
before income taxes
|
$ | 686,314 | $ | 463,776 | $ | 155,962 | ||||||
Our
Malaysian subsidiary was granted a tax holiday for a period of 16.5 years,
originally set to begin on January 1, 2009, which provides for an income
tax exemption on 100% of statutory income provided that certain criteria are
met. The net impact of this tax holiday was to increase our net earnings by
$132.8 million. In addition, we recognized an income tax benefit of
$11.5 million during the year ended December 26, 2009, related to the
Malaysian Government’s granting of our request to pull forward the previously
approved tax holiday by one year.
Our
income tax results differed from the amount computed by applying the
U.S. statutory federal income tax rate of 35% to our income before income
taxes for the following reasons (in thousands):
|
December
26,
2009
|
December
27,
2008
|
December
29,
2007
|
||||||||||||||||||||||
|
|
Tax
|
Percent
|
Tax
|
Percent
|
Tax
|
Percent
|
||||||||||||||||||
|
Statutory
income tax expense
|
$ | 240,210 | 35.0 | % | $ | 162,322 | 35.0 | % | $ | 54,587 | 35.0 | % | ||||||||||||
|
Economic
development funding benefit
|
— | 0.0 | — | 0.0 | (3,122 | ) | (2.0 | ) | ||||||||||||||||
|
Non-deductible
expenses
|
6,443 | 0.9 | 4,590 | 1.0 | 1,398 | 0.9 | ||||||||||||||||||
|
State
tax, net of federal benefit
|
(5,200 | ) | (0.8 | ) | (500 | ) | (0.1 | ) | 778 | 0.5 | ||||||||||||||
|
Effect
of tax holiday
|
(132,823 | ) | (19.2 | ) | (20,464 | ) | (4.4 | ) | — | 0.0 | ||||||||||||||
|
Pull
forward of Malaysian tax holiday
|
(11,519 | ) | (1.7 | ) | — | 0.0 | — | 0.0 | ||||||||||||||||
|
Foreign
tax rate differential
|
(45,657 | ) | (6.7 | ) | (31,347 | ) | (6.8 | ) | 4,216 | 2.7 | ||||||||||||||
|
Tax
credits
|
(5,567 | ) | (0.8 | ) | (4,736 | ) | (1.0 | ) | (1,503 | ) | (1.0 | ) | ||||||||||||
|
Non-taxable
income
|
(41 | ) | 0.0 | (205 | ) | 0.0 | (3,373 | ) | (2.1 | ) | ||||||||||||||
|
Other
|
(1,763 | ) | (0.3 | ) | 5,285 | 1.1 | (1,079 | ) | (0.7 | ) | ||||||||||||||
|
Impact
of changes in valuation allowance
|
2,093 | 0.3 | 501 | 0.1 | (54,294 | ) | (34.8 | ) | ||||||||||||||||
|
Reported
income tax expense (benefit)
|
$ | 46,176 | 6.7 | % | $ | 115,446 | 24.9 | % | $ | (2,392 | ) | (1.5 | )% | |||||||||||
Page
100
For
the year ended December 26, 2009, the tax benefit from the foreign tax rate
differential primarily relates to our income generated in Germany and Malaysia
calculated at statutory tax rates of 28.5% and 25%, respectively, compared to
the US statutory tax rate of 35%. For the year ended December 27, 2008, the
tax benefit from the foreign tax rate differential primarily relates to our
income generated in Germany and Malaysia calculated at statutory tax rates of
28.4% and 26.0%, respectively, compared to the US statutory tax rate of 35%. The
2008 tax benefit from the effect of the Malaysian tax holiday on deferred taxes
relates to the deferred tax impact of taxable temporary differences, primarily
attributable to accelerated tax depreciation, which we anticipate will reverse
in a tax-free manner during the tax holiday.
Deferred
income taxes reflect the net tax effects of temporary differences between the
carrying amounts of assets and liabilities calculated for financial reporting
purposes and the amounts calculated for preparing our income tax returns in
accordance with tax regulations and of the net tax effects of operating loss and
tax credit carryforwards. The items that gave rise to our deferred taxes were as
follows (in thousands):
|
|
December
26, 2009
|
December
27, 2008
|
||||||
|
Deferred
tax assets:
|
||||||||
|
Goodwill
|
$ | 30,909 | $ | 32,736 | ||||
|
Economic
development funding
|
6,301 | 6,550 | ||||||
|
Share-based
compensation
|
33,179 | 18,937 | ||||||
|
Accrued
expenses
|
12,596 | 10,104 | ||||||
|
Tax
credits
|
25,225 | 13,200 | ||||||
|
Net
operating losses
|
58,317 | 1,097 | ||||||
|
Inventory
|
6,411 | 1,744 | ||||||
|
Deferred
expenses
|
10,044 | — | ||||||
|
Other
|
1,139 | 725 | ||||||
|
Deferred
tax assets, gross
|
184,121 | 85,093 | ||||||
|
Valuation
allowance
|
(3,190 | ) | (1,097 | ) | ||||
|
Deferred
tax assets, net of valuation allowance
|
180,931 | 83,996 | ||||||
|
Deferred
tax liabilities:
|
||||||||
|
Capitalized
interest
|
(2,920 | ) | (1,400 | ) | ||||
|
Property,
plant and equipment
|
(13,804 | ) | (13,566 | ) | ||||
|
Basis
difference
|
(25,697 | ) | — | |||||
|
Other
|
(19 | ) | — | |||||
|
Deferred
tax liabilities
|
(42,440 | ) | (14,966 | ) | ||||
|
Net
deferred tax assets and liabilities
|
$ | 138,491 | $ | 69,030 | ||||
Changes
in our valuation allowance against our deferred tax assets were as follows
during the years ended December 26, 2009 and December 27, 2008 (in
thousands):
|
|
2009
|
2008
|
||||||
|
Valuation
allowance, beginning of year
|
$ | 1,097 | $ | 596 | ||||
|
Additions
|
2,093 | 1,097 | ||||||
|
Reversals
|
— | (596 | ) | |||||
|
Valuation
allowance, end of year
|
$ | 3,190 | $ | 1,097 | ||||
We
maintained a valuation allowance of $3.2 million and $1.1 million as
of December 26, 2009 and December 27, 2008, respectively, against
certain of our deferred tax assets, as it is more likely than not that such
amounts will not be fully realized. During the year ended December 26,
2009, we increased our valuation allowance related primarily to foreign and
state net operating loss carryforwards. During the year ended December 27,
2008, we reversed our valuation allowance in the amount of $0.6 million
related to Malaysian net deferred tax assets and increased our valuation
allowance related to state net operating loss carryforwards.
Page
101
We
have not provided for $240.6 million of deferred income taxes on
$974.3 million of undistributed earnings from non-U.S. subsidiaries
because such amounts are indefinitely invested outside the United States as of
December 26, 2009. These taxes would be required to be recognized when and if we
determine that these amounts are not indefinitely reinvested outside the
U.S.
At
December 26, 2009, we had federal and aggregate state net operating
loss carryforwards of $849.3 million and $138.8 million, respectively.
These federal and aggregate state net operating loss carryforwards include
$120.5 million and $22.6 million, respectively, from the acquisition of
OptiSolar Inc. At December 27, 2008, we had federal and aggregate state net
operating loss carryforwards of $683.7 million and $97.2 million,
respectively. If not used, the federal net operating loss will expire beginning
in 2027 and the state net operating loss will begin to expire in 2012. The
utilization of a portion of our net operating loss carryforwards is subject to
an annual limitation under Section 382 of the Internal Revenue Code due to
a change of ownership. However, we do not believe such annual limitation will
impact our realization of the net operating loss carryforwards. Our deferred tax
assets at December 26, 2009 do not include $261.6 million related to
$728.8 million of excess tax deductions from employee stock option
exercises and vested restricted stock units that comprise our net operating loss
carryovers. Our equity will be increased by up to $261.6 million if and
when we ultimately realize these excess tax benefits.
At
December 26, 2009 we had federal research and developmental credit
carryovers of $12.9 million and foreign tax credit carryovers of
$12.0 million available to reduce future income tax liabilities. If not
used, the research and development credits and foreign tax credits will begin to
expire in 2027 through 2029 and 2017 through 2019, respectively.
We
account for uncertain tax positions pursuant to the recognition and measurement
criteria under ASC 740.
A
reconciliation of the beginning and ending amount of liabilities associated with
uncertain tax positions is as follows (in thousands):
|
|
December
26, 2009
|
December
27, 2008
|
December
29, 2007
|
|||||||||
|
Unrecognized
tax benefits, beginning of year
|
$ | 7,534 | $ | 2,465 | $ | 56 | ||||||
|
Increases
related to prior year tax positions
|
6,560 | 777 | 413 | |||||||||
|
Decreases
related to prior year tax positions
|
— | (1,677 | ) | — | ||||||||
|
Decreases
related to settlements
|
— | (469 | ) | — | ||||||||
|
Increase
due to business combination
|
2,170 | — | — | |||||||||
|
Increases
related to current tax positions
|
20,958 | 6,438 | 1,996 | |||||||||
|
Unrecognized
tax benefits, end of year
|
$ | 37,222 | $ | 7,534 | $ | 2,465 | ||||||
The
entire amount of unrecognized tax benefits, if recognized, would reduce our
annual effective tax rate. The amounts of unrecognized tax benefits listed above
are based on the recognition and measurement criteria of FIN 48, now
codified in ASC 740. However, due to the uncertain and complex application of
tax regulations, it is possible that the ultimate resolution of uncertain tax
positions may result in liabilities which could be materially different from
these estimates. In such an event, we will record additional tax expense or tax
benefit in the period in which such resolution occurs. Our policy is to
recognize any interest and penalties that we might incur related to our tax
positions as of component of income tax expense. We did not accrue any potential
penalties and interest related to these unrecognized tax benefits during 2009 or
2008. We do not believe it is reasonably possible our unrecognized tax benefits
will significantly change within the next twelve months for tax positions taken
or to be taken for periods through December 26, 2009.
The
following table summarizes the tax years that are either currently under audit
or remain open and subject to examination by the tax authorities in the most
significant jurisdictions in which we operate:
|
|
Tax
Years
|
|||
|
Germany
|
2007 – 2009 | |||
|
Malaysia
|
2007 - 2009 | |||
|
United
States
|
2006 - 2009 | |||
In
certain of the jurisdictions noted above, we operate through more than one legal
entity, each of which has different open years subject to examination. The table
above presents the open years subject to examination for the most material of
the legal entities in each jurisdiction. Additionally, it is important to note
that tax years are technically not closed until the statute of limitations in
each jurisdiction expires. In the jurisdictions noted above, the statute of
limitations can extend beyond the open years subject to
examination.
Page
102
Basic
net income per share is computed by dividing net income by the weighted-average
number of common shares outstanding for the period. Diluted net income per share
is computed giving effect to all potential dilutive common stock, including
employee stock options and restricted stock units.
The
calculation of basic and diluted net income per share for the years ended
December 26, 2009, December 27, 2008 and December 29, 2007 was as
follows (in thousands, except per share amounts):
|
2009
|
2008
|
2007
|
||||||||||
|
Basic
net income per share
|
||||||||||||
|
Numerator:
|
||||||||||||
|
Net
income
|
$ | 640,138 | $ | 348,330 | $ | 158,354 | ||||||
|
Denominator:
|
||||||||||||
|
Weighted-average
common shares outstanding
|
83,500 | 80,178 | 74,701 | |||||||||
|
Diluted
net income per share
|
||||||||||||
|
Denominator:
|
||||||||||||
|
Weighted-average
common shares outstanding
|
83,500 | 80,178 | 74,701 | |||||||||
|
Effect
of stock options , restricted stock units outstanding and contingent
issuable shares
|
1,544 | 1,946 | 3,270 | |||||||||
|
Weighted-average
shares used in computing diluted net income per share
|
85,044 | 82,124 | 77,971 | |||||||||
|
|
2009
|
2008
|
2007
|
|||||||||
|
Per
share information – basic:
|
||||||||||||
|
Net
income per share
|
$ | 7.67 | $ | 4.34 | $ | 2.12 | ||||||
|
Per
share information - diluted
|
||||||||||||
|
Net
income per share
|
$ | 7.53 | $ | 4.24 | $ | 2.03 | ||||||
The
following number of outstanding employee stock options and restricted stock
units were excluded from the computation of diluted net income per share for the
years ended December 26, 2009, December 27, 2008 and December 29, 2007
as they would have had an antidilutive effect (in thousands):
|
|
2009
|
2008
|
2007
|
|||||||||
|
Restricted
stock units and options to purchase common stock
|
216 | 192 | 2,632 | |||||||||
Comprehensive
income, which includes foreign currency translation adjustments, unrealized
gains and losses on derivative instruments designated and qualifying as cash
flow hedges and unrealized gains and losses on available-for-sale securities,
the impact of which has been excluded from net income and reflected as
components of stockholders’ equity, was as follows for the years ended December
26, 2009, December 27, 2008 and December 29, 2007 (in thousands):
|
|
2009
|
2008
|
2007
|
|||||||||
|
Net
income
|
$ | 640,138 | $ | 348,330 | $ | 158,354 | ||||||
|
Foreign
currency translation adjustments
|
13,303 | (13,943 | ) | 5,116 | ||||||||
|
Change
in unrealized gain on marketable securities, net of tax of $(377) for
2009
|
1,689 | 234 | 28 | |||||||||
|
Change
in unrealized loss on derivative instruments, net of tax of $(65) for
2009
|
(167 | ) | (15,230 | ) | (1,648 | ) | ||||||
|
Comprehensive
income
|
$ | 654,963 | $ | 319,391 | $ | 161,850 | ||||||
Components
of accumulated other comprehensive income (loss) at December 26, 2009 and
December 27, 2008 were as follows (in thousands):
|
|
2009
|
2008
|
||||||
|
Foreign
currency translation adjustments
|
$ | 5,478 | $ | (7,825 | ) | |||
|
Unrealized
gain on marketable securities, net of tax of $520 for 2009 and $144 for
2008
|
1,951 | 262 | ||||||
|
Unrealized
loss on derivative instruments, net of tax of $0 for 2009 and $65 for
2008
|
(17,025 | ) | (16,858 | ) | ||||
|
Accumulated
other comprehensive loss
|
$ | (9,596 | ) | $ | (24,421 | ) | ||
Page
103
The
following table presents a reconciliation of net income to net cash provided by
operating activities for the years ended December 26, 2009,
December 27, 2008 and December 29, 2007 (in thousands):
|
|
2009
|
2008
|
2007
|
|||||||||
|
Net
income
|
$ | 640,138 | $ | 348,330 | $ | 158,354 | ||||||
|
Adjustments
to reconcile net income to cash provided by (used in) operating
activities:
|
||||||||||||
|
Depreciation
and amortization
|
129,628 | 59,518 | 24,481 | |||||||||
|
Impairment
of intangible assets
|
— | 1,335 | — | |||||||||
|
Share-based
compensation
|
88,744 | 58,944 | 38,965 | |||||||||
|
Remeasurement
of monetary assets and liabilities
|
(2,696 | ) | 32 | — | ||||||||
|
Deferred
income taxes
|
(35,043 | ) | (12,974 | ) | (55,881 | ) | ||||||
|
Excess
tax benefits from share-based compensation arrangements
|
(4,892 | ) | (28,661 | ) | (30,196 | ) | ||||||
|
Loss
on disposal of property and equipment
|
1,118 | 993 | 321 | |||||||||
|
Provision
for doubtful accounts receivable
|
990 | (5 | ) | — | ||||||||
|
Inventory
reserve
|
— | 2,548 | 34 | |||||||||
|
Gain
on sales of investments, net
|
(110 | ) | (189 | ) | — | |||||||
|
Other
|
1,566 | — | — | |||||||||
|
Changes
in operating assets and liabilities:
|
||||||||||||
|
Accounts
receivable
|
(122,185 | ) | (40,852 | ) | 10,975 | |||||||
|
Inventories
|
(52,058 | ) | (84,762 | ) | (19,832 | ) | ||||||
|
Project
assets
|
(12,546 | ) | — | — | ||||||||
|
Deferred
project costs
|
(35,960 | ) | 1,933 | 2,333 | ||||||||
|
Prepaid
expenses and other current assets
|
7,484 | (47,988 | ) | (7,359 | ) | |||||||
|
Costs
and estimated earnings in excess of billings
|
56 | (108 | ) | 28 | ||||||||
|
Other
assets
|
(5,320 | ) | (4,935 | ) | (4,179 | ) | ||||||
|
Billings
in excess of costs and estimated earnings
|
— | 10 | (1,992 | ) | ||||||||
|
Accounts
payable and accrued expenses
|
76,279 | 209,898 | 89,899 | |||||||||
|
Total
adjustments
|
35,055 | 114,737 | 47,597 | |||||||||
|
Net
cash provided by operating activities
|
$ | 675,193 | $ | 463,067 | $ | 205,951 | ||||||
Page
104
ASC
280,
Segment Reporting
,
establishes standards for companies to report in their financial statements
information about operating segments, products, services, geographic areas and
major customers. The method of determining what information to report is based
on the way that management organizes the operating segments within the company
for making operating decisions and assessing financial performance.
Our
components segment is our principal business and involves the design,
manufacture and sale of solar modules which convert sunlight into electricity.
Customers of our components segment include project developers, system
integrators and operators of renewable energy projects.
Through
our fully integrated systems business, we provide a complete PV solar power
system, which includes project development, EPC services, O&M services and,
when required, project finance. Our systems segment sells solar power systems
directly to investor owned utilities, independent power developers and
producers, commercial and industrial companies, and other system owners who
purchase completed solar power plants, EPC services and/or operation and
maintenance services from us.
Our Chief
Operating Decision Maker consisting of senior executive staff views the sale of
solar modules from the components segment as the core driver of our
profitability, return on net assets and cash throughput, and as a result, we
view our systems segment as an enabler to drive module throughput. Therefore, we
operate our systems segment with the objective to achieve break-even
results before income taxes. We include the sale of our solar modules
manufactured by the components segment and installed in projects sold by our
systems segment in “net sales” of our components business. Our systems segment
does not currently meet the quantitative criteria for disclosure as a separate
reporting segment, and therefore, we classify it in the “Other” category in the
following tables. Reported net sales, gross profit, income before income taxes
and assets for the fiscal year ended December 27, 2008, have been reclassified
to conform to the revised presentation of segment information.
Financial information about our
segments was as follows (in thousands):
|
Fiscal
Year Ended
|
Fiscal
Year Ended
|
|||||||||||||||||||||||
|
December 26,
2009
|
December 27,
2008
|
|||||||||||||||||||||||
|
Components
|
Other
|
Total
|
Components
|
Other
|
Total
|
|||||||||||||||||||
|
Net
sales
|
$ | 1,951,227 | $ | 114,973 | $ | 2,066,200 | $ | 1,195,803 | $ | 50,498 | $ | 1,246,301 | ||||||||||||
|
Gross
profit
|
$ | 1,023,211 | $ | 21,372 | $ | 1,044,583 | $ | 660,160 | $ | 18,233 | $ | 678,393 | ||||||||||||
| Income before income taxes | $ | 686,314 | $ | — | $ | 686,314 | $ | 463,776 | $ | — | $ | 463,776 | ||||||||||||
|
Goodwill
|
$ | 251,275 | $ | 35,240 | $ | 286,515 | $ | — | $ | 33,829 | $ | 33,829 | ||||||||||||
|
Assets
|
$ | 3,027,703 | $ | 321,809 | $ | 3,349,512 | $ | 2,029,220 | $ | 85,282 | $ | 2,114,502 | ||||||||||||
The
following table presents net sales for the years ended December 26, 2009,
December 27, 2008 and December 29, 2007 by geographic region, which is
based on the customer country of invoicing (in thousands):
|
|
2009
|
2008
|
2007
|
|||||||||
|
United
States
|
$ | 136,944 | $ | 63,117 | $ | 5,837 | ||||||
|
Germany
|
1,334,061 | 919,335 | 457,332 | |||||||||
|
France
|
249,313 | 109,962 | 33,792 | |||||||||
|
All
other foreign countries
|
345,882 | 153,887 | 7,015 | |||||||||
|
Net
sales
|
$ | 2,066,200 | $ | 1,246,301 | $ | 503,976 | ||||||
The
following table presents long-lived assets, excluding financial instruments,
deferred tax assets, investment in related party, goodwill and intangible
assets, at December 26, 2009, December 27, 2008 and December 29,
2007 by geographic region, based on the physical location of the assets (in
thousands):
|
|
2009
|
2008
|
2007
|
|||||||||
|
United
States
|
$ | 383,343 | $ | 162,651 | $ | 101,335 | ||||||
|
Germany
|
91,692 | 87,709 | 96,470 | |||||||||
|
Malaysia
|
568,534 | 592,262 | 232,299 | |||||||||
|
All
other foreign countries
|
76,628 | — | — | |||||||||
|
Long-lived
assets
|
$ | 1,120,197 | $ | 842,622 | $ | 430,104 | ||||||
Page
105
Customer concentration.
The
following customers each comprised 10% or more of our total net sales during the
years ended December 26, 2009, December 27, 2008 and December 29,
2007 (dollars in thousands):
|
2009
|
2008
|
2007
|
||||||||||||||||||||||
|
|
Net
Sales
|
%
of Total
|
Net
Sales
|
%
of Total
|
Net
Sales
|
%
of Total
|
||||||||||||||||||
|
Customer
#1
|
$ | * | * | % | $ | 138,822 | 11.1 | % | $ | 74,465 | 14.8 | % | ||||||||||||
|
Customer
#2
|
$ | * | * | % | $ | 135,232 | 10.9 | % | $ | 51,989 | 10.3 | % | ||||||||||||
|
Customer
#3
|
$ | 264,744 | 12.8 | % | $ | 143,857 | 11.5 | % | $ | 76,669 | 15.2 | % | ||||||||||||
|
Customer
#4
|
$ | 356,068 | 17.2 | % | $ | 231,557 | 18.6 | % | $ | 113,664 | 22.6 | % | ||||||||||||
|
Customer
#5
|
$ | * | * | % | $ | 149,946 | 12.0 | % | $ | 68,492 | 13.6 | % | ||||||||||||
|
Customer
#6
|
$ | * | * | % | $ | * | * | % | $ | 65,352 | 13.0 | % | ||||||||||||
|
Customer
#7
|
$ | 261,314 | 12.6 | % | $ | * | * | % | $ | * | * | % | ||||||||||||
|
*
|
Net sales to these customers were less than 10% of our total net sales
during this period.
|
Credit risk.
Financial
instruments that potentially subject us to concentrations of credit risk are
primarily cash, cash equivalents, investments, trade accounts receivable,
interest rate swap agreements and derivative instruments. We place cash, cash
equivalents and investments with high-credit quality institutions and limit the
amount of credit risk from any one counterparty. As previously noted, our net
sales are primarily concentrated among three customers. We monitor the financial
condition of our customers and perform credit evaluations whenever deemed
necessary. As of December 26, 2009, we had received letters of credit from
nine of our customers securing accounts receivable as required by our Long-Term
Supply Contracts. Further, we amended certain of our customers’ long-term supply
contracts to extend their payment terms from net 10 days to net 45 days at the
end of the first quarter of 2009. We have generally not required collateral for
our sales on account.
Geographic risk.
Our solar
modules are presently predominantly sold to our customers for use in solar power
systems concentrated in a single geographic region, Germany. This concentration
of our sales in one geographic region exposes us to local economic risks and
local public policy and regulatory risk in Germany.
Production.
Our products
include components that are available from a limited number of suppliers or
sources. Shortages of essential components could occur due to interruptions of
supply or increases in demand and could impair our ability to meet demand for
our products. Our modules are presently produced in facilities in Perrysburg,
Ohio, Frankfurt/Oder, Germany and Kulim, Malaysia. Damage to or disruption of
facilities could interrupt our business and impair our ability to generate
sales.
International operations.
During 2009, we derived 93% of our net sales from sales outside our
country of domicile, the United States. Therefore, our financial performance
could be affected by events such as changes in foreign currency exchange rates,
trade protection measures, long accounts receivable collection patterns and
changes in regional or worldwide economic or political conditions.
We
have evaluated subsequent events through February 19, 2010, the date that these
financial statements were issued.
On
January 8, 2010, we accepted an offer to lease 61 acres (25 hectares) of land
adjacent to our existing solar module manufacturing plant in Malaysia. We expect
to enter into a lease agreement for the land during the first quarter of our
fiscal year 2010, and we plan to make a non-refundable deposit of an initial
lease payment of MYR 3.4 million ($1.0 million at the balance sheet close rate
on December 26, 2009 of $0.29/MYR1.00) upon accepting the lease
offer.
During
2009, we applied for a federal renewable energy manufacturing tax credit in the
amount of $16.3 million that was enacted under the American Recovery and
Reinvestment Act of 2009. The tax credit request relates to the recent expansion
of our module manufacturing facility in Perrysburg, Ohio. On January 7, 2010,
the U.S. Department of the Treasury accepted our application and approved the
$16.3 credit request, subject to additional administrative measures. No benefit
was recorded in our financial results for the year ended December 26, 2009 since
the Treasury’s approval did not occur until after the end of the fiscal
year.
Page
106
INDEX
TO EXHIBITS
Set
forth below is a list of exhibits that are being filed or incorporated by
reference into this Annual Report on Form 10-K:
|
|
Incorporated by Reference
|
|
|
|||||||||||||||||
|
Exhibit
Number
|
Exhibit
Description
|
Form
|
File No.
|
Date of
First Filing
|
Exhibit
Number
|
Filed
Herewith
|
||||||||||||||
| 3.1 |
Amended
and Restated Certificate of Incorporation of First Solar,
Inc.
|
S-1/A | 333-135574 |
9/18/06
|
3.1 | |||||||||||||||
| 3.2 |
By-Laws
of First Solar, Inc.
|
S-1/A | 333-135574 |
11/16/06
|
3.1 | |||||||||||||||
| 4.1 |
Loan
Agreement dated December 1, 2003, among First Solar US Manufacturing, LLC,
First Solar Property, LLC and the Director of Development of the State of
Ohio.
|
S-1/A | 333-135574 |
9/18/06
|
4.2 | |||||||||||||||
| 4.2 |
Loan
Agreement dated July 1, 2005, among First Solar US Manufacturing, LLC,
First Solar Property, LLC and Director of Development of the State of
Ohio.
|
S-1/A | 333-135574 |
9/18/06
|
4.3 | |||||||||||||||
| 4.3 |
Facility
Agreement dated July 27, 2006, between First Solar Manufacturing GmbH,
subject to the joint and several liability of First Solar Holdings GmbH
and First Solar GmbH and IKB Deutsche Industriebank AG.
|
S-1/A | 333-135574 |
9/18/06
|
4.11 | |||||||||||||||
| 4.4 |
Addendum
No. 1 to Facility Agreement dated July 27, 2006, between First Solar
Manufacturing GmbH, subject to the joint and several liability of First
Solar Holdings GmbH and First Solar GmbH and IKB Deutsche Industriebank
AG.
|
S-1/A | 333-135574 |
9/18/06
|
4.12 | |||||||||||||||
| 4.5 |
Waiver
Letter dated June 5, 2006, from the Director of Development of the State
of Ohio.
|
S-1/A | 333-135574 |
10/10/06
|
4.16 | |||||||||||||||
| 4.6 |
Amendment
No. 3 to the Facility Agreement dated July 27, 2006 between First Solar
Manufacturing GmbH and IKB Deutsche Industriebank AG dated March 31,
2008
|
10-Q | 001-33156 |
5/02/08
|
4.1 | |||||||||||||||
| 4.7 | † |
Facility
Agreement dated May 6, 2008 between First Solar Malaysia Sdn. Bhd., as
borrower, and IKB Deutsche Industriebank AG, as arranger, NATIXIS
Zweigniederlassung Deutschland, as facility agent and original lender, AKA
Ausfuhrkredit-Gesellschaft mbH, as original lender, and NATIXIS Labuan
Branch as security agent
|
8-K | 001-33156 |
5/12/08
|
10.1 | ||||||||||||||
| 4.8 |
First
Demand Guaranty dated May 6, 2008 by First Solar Inc, as guarantor, in
favor of IKB Deutsche Industriebank AG, NATIXIS Zweigniederlassung
Deutschland, AKA Ausfuhrkredit-Gesellschaft mbH and NATIXIS Labuan
Branch
|
8-K | 001-33156 |
5/12/08
|
10.2 | |||||||||||||||
| 4.9 |
Credit
Agreement, dated as of September 4, 2009, among First Solar, Inc., First
Solar Manufacturing GmbH, the lenders party thereto, JPMorgan Chase Bank,
N.A., as Administrative Agent, Bank of America and The Royal Bank of
Scotland plc, as Documentation Agents, and Credit Suisse, Cayman Islands
Branch, as Syndication Agent
|
8-K | 001-33156 |
9/10/09
|
10.1 | |||||||||||||||
| 4.10 |
Charge
of Company Shares, dated as of September 4, 2009, between First Solar,
Inc., as Chargor, and JPMorgan Chase Bank, N.A., as Security Agent,
relating to 66% of the shares of First Solar FE Holdings Pte. Ltd.
(Singapore)
|
8-K | 001-33156 |
9/10/09
|
10.2 | |||||||||||||||
| 4.11 |
German
Share Pledge Agreements, dated as of September 4, 2009, between First
Solar, Inc., First Solar Holdings GmbH, First Solar Manufacturing GmbH,
First Solar GmbH, and JPMorgan Chase Bank, N.A., as Administrative
Agent
|
8-K | 001-33156 |
9/10/09
|
10.3 | |||||||||||||||
| 4.12 |
Guarantee
and Collateral Agreement, dated as of September 4, 2009, by First
Solar, Inc. in favor of JPMorgan Chase Bank, N.A., as Administrative
Agent
|
8-K | 001-33156 |
9/10/09
|
10.4 | |||||||||||||||
| 4.13 |
Guarantee,
dated as of September 8, 2009, between First Solar Holdings GmbH,
First Solar GmbH, First Solar Manufacturing GmbH, as German Guarantors,
and JPMorgan Chase Bank, N.A., as Administrative Agent
|
8-K | 001-33156 |
9/10/09
|
10.5 | |||||||||||||||
| 4.14 |
Assignment
Agreement, dated as of September 4, 2009, between First Solar
Holdings GmbH and JPMorgan Chase Bank, N.A., as Administrative
Agent
|
8-K | 001-33156 |
9/10/09
|
10.6 | |||||||||||||||
| 4.15 |
Assignment
Agreement, dated as of September 4, 2009, between First Solar GmbH
and JPMorgan Chase Bank, N.A., as Administrative Agent
|
8-K | 001-33156 |
9/10/09
|
10.7 | |||||||||||||||
| 4.16 |
Assignment
Agreement, dated as of September 8, 2009, between First Solar
Manufacturing GmbH and JPMorgan Chase Bank, N.A., as Administrative
Agent
|
8-K | 001-33156 |
9/10/09
|
10.8 | |||||||||||||||
| 4.17 |
Security
Trust Agreement, dated as of September 4, 2009, between First Solar,
Inc., First Solar Holdings GmbH, First Solar GmbH, First Solar
Manufacturing GmbH, as Security Grantors, JPMorgan Chase Bank, N.A., as
Administrative Agent, and the other Secured Parties party
thereto
|
8-K | 001-33156 |
9/10/09
|
10.9 | |||||||||||||||
| 10.1 | † |
Framework
Agreement on the Sale and Purchase of Solar Modules dated April 10, 2006,
between First Solar GmbH and Blitzstrom GmbH.
|
S-1/A | 333-135574 |
11/8/06
|
10.1 | ||||||||||||||
| 10.2 | † |
Amendment
to the Framework Agreement dated April 10, 2006 on the Sale and Purchase
of Solar Modules between First Solar GmbH and Blitzstrom
GmbH.
|
10-K | 001-33156 |
3/16/07
|
10.02 | ||||||||||||||
| 10.3 | † |
Framework
Agreement on the Sale and Purchase of Solar Modules dated April 11, 2006,
between First Solar GmbH and Conergy AG.
|
S-1/A | 333-135574 |
11/8/06
|
10.2 | ||||||||||||||
| 10.4 | † |
Amendment
to the Framework Agreement dated April 11, 2006 on the Sale and Purchase
of Solar Modules between First Solar GmbH and Conergy AG.
|
10-K | 001-33156 |
3/16/07
|
10.04 | ||||||||||||||
| 10.5 | † |
Framework
Agreement on the Sale and Purchase of Solar Modules dated April 5, 2006,
between First Solar GmbH and Gehrlicher Umweltschonende Energiesysteme
GmbH.
|
S-1/A | 333-135574 |
11/8/06
|
10.3 | ||||||||||||||
| 10.6 | † |
Amendment
to the Framework Agreement dated April 5, 2006 on the Sale and Purchase of
Solar Modules between First Solar GmbH and Gehrlicher Umweltschonende
Energiesysteme GmbH.
|
10-K | 001-33156 |
3/16/07
|
10.06 | ||||||||||||||
| 10.7 | † |
Framework
Agreement on the Sale and Purchase of Solar Modules dated April 9, 2006,
among First Solar GmbH, Juwi Holding AG, JuWi Handels Verwaltungs GmbH
& Co. KG and juwi solar GmbH.
|
S-1/A | 333-135574 |
11/8/06
|
10.4 | ||||||||||||||
| 10.8 | † |
Amendment
to the Framework Agreement dated April 9, 2006 on the Sale and Purchase of
Solar Modules among First Solar GmbH, Juwi Holding AG, JuWi Handels
Verwaltungs GmbH & Co. KG and juwi solar GmbH.
|
10-K | 001-33156 |
3/16/07
|
10.08 | ||||||||||||||
| 10.9 | † |
Framework
Agreement on the Sale and Purchase of Solar Modules dated March 30, 2006,
between First Solar GmbH and Phönix Sonnenstrom AG.
|
S-1/A | 333-135574 |
11/8/06
|
10.5 | ||||||||||||||
| 10.10 | † |
Amendment
to the Framework Agreement dated March 30, 2006 on the Sale and Purchase
of Solar Modules between First Solar GmbH and Phönix Sonnenstrom
AG.
|
10-K | 001-33156 |
3/16/07
|
10.10 | ||||||||||||||
| 10.11 | † |
Framework
Agreement on the Sale and Purchase of Solar Modules dated April 7, 2006,
between First Solar GmbH and Colexon Energy AG.
|
S-1/A | 333-135574 |
11/8/06
|
10.6 | ||||||||||||||
| 10.12 | † |
Amendment
to the Framework Agreement dated April 7, 2006 on the Sale and Purchase of
Solar Modules between First Solar GmbH and Colexon Energy
AG.
|
10-K | 001-33156 |
3/16/07
|
10.12 | ||||||||||||||
| 10.13 |
Guarantee
Agreement between Michael J. Ahearn and IKB Deutsche Industriebank
AG.
|
S-1/A | 333-135574 |
9/18/06
|
10.7 | |||||||||||||||
| 10.14 |
Grant
Decision dated July 26, 2006, between First Solar Manufacturing GmbH and
InvestitionsBank des Landes Brandenburg.
|
S-1/A | 333-135574 |
10/10/06
|
10.9 | |||||||||||||||
| 10.15 |
2003
Unit Option Plan.
|
S-1/A | 333-135574 |
9/18/06
|
4.14 | |||||||||||||||
| 10.16 |
Form
of 2003 Unit Option Plan Agreement.
|
S-1/A | 333-135574 |
9/18/06
|
4.15 | |||||||||||||||
| 10.17 |
Amended
and Restated 2006 Omnibus Incentive Compensation Plan.
|
10-Q | 001-33156 |
5/1/09
|
10.2 | |||||||||||||||
| 10.18 |
Form
of Change in Control Severance Agreement.
|
S-1/A | 333-135574 |
10/25/06
|
10.15 | |||||||||||||||
| 10.19 |
Guaranty
dated February 5, 2003.
|
S-1/A | 333-135574 |
10/25/06
|
10.16 | |||||||||||||||
| 10.20 |
Form
of Director and Officer Indemnification Agreement.
|
S-1/A | 333-135574 |
10/25/06
|
10.17 | |||||||||||||||
| 10.21 |
Amended
and Restated Employment Agreement and Amended and Restated Change in
Control Agreement dated November 3, 2008, between First Solar, Inc. and
Michael J. Ahearn.
|
10-Q | 001-33156 |
10/31/08
|
10.01 | |||||||||||||||
| 10.22 |
Amended
and Restated Employment Agreement and Amended and Restated Change in
Control Agreement dated November 3, 2008, between First Solar, Inc. and
John Carrington.
|
10-Q | 001-33156 |
10/31/08
|
10.02 | |||||||||||||||
| 10.23 |
Amended
and Restated Employment Agreement and Amended and Restated Change in
Control Agreement dated November 11, 2008, between First Solar, Inc. and
Bruce Sohn.
|
10-K | 001-33156 |
2/25/09
|
10.33 | |||||||||||||||
| 10.24 |
Amended
and Restated Employment Agreement and Amended and Restated Change in
Control Agreement dated December 29, 2008, between First Solar, Inc. and
John T. Gaffney.
|
10-K | 001-33156 |
2/25/09
|
10.34 | |||||||||||||||
| 10.25 |
Amended
and Restated Employment Agreement and Amended and Restated Change in
Control Agreement dated December 30, 2008 between First Solar, Inc. and
Jens Meyerhoff.
|
10-K | 001-33156 |
2/25/09
|
10.35 | |||||||||||||||
| 10.26 |
Employment
Agreement and Change in Control Severance Agreement, each dated February
20, 2009, between First Solar, Inc. and Mary Elizabeth
Gustafsson.
|
10-K | 001-33156 |
2/25/09
|
10.36 | |||||||||||||||
| 10.27 |
Employment
Agreement and Change in Control Severance Agreement, each dated as of
September 9, 2009, between First Solar, Inc. and Robert J.
Gillette
|
8-K | 001-33156 |
9/10/09
|
10.1 | |||||||||||||||
| 10.28 |
Amended
and Restated Employment Agreement and Amended and Restated Change in
Control Severance Agreement, each dated as of December 1, 2008, between
First Solar, Inc. and David Eaglesham
|
— | — | — | — | X | ||||||||||||||
| 10.29 |
Amended
and Restated Employment Agreement dated as of December 1, 2008,
between First, Solar Inc. and James Zhu
|
— | — | — | — | X | ||||||||||||||
| 10.30 |
Amended
and Restated Employment Agreement and Amended and Restated Change in
Control Severance Agreement, each dated as of December 15, 2008, between
First Solar Inc. and Carol Campbell
|
— | — | — | — | X | ||||||||||||||
| 10.31 |
Employment
Agreement and Change in Control Severance Agreement, each dated December
14, 2009, between First Solar, Inc. and T.L. Kallenbach
|
— | — | — | — | X | ||||||||||||||
| 10.32 |
Amendment
to Employment Agreement, effective as of July 28, 2009, between First
Solar, Inc. and Bruce Sohn
|
— | — | — | — | X | ||||||||||||||
| 10.33 |
Amendment
to Employment Agreement, effective as of July 28, 2009, between First
Solar, Inc. and Jens Meyerhoff
|
— | — | — | — | X | ||||||||||||||
| 10.34 |
Amendment
to Employment Agreement, effective as of July 28, 2009, between First
Solar, Inc. and John Carrington
|
— | — | — | — | X | ||||||||||||||
| 10.35 |
Amendment
to Employment Agreement, effective as of July 28, 2009, between First
Solar, Inc. and Mary Elizabeth Gustafsson
|
— | — | — | — | X | ||||||||||||||
| 10.36 |
Amendment
to Employment Agreement, effective as of July 28, 2009, between First
Solar, Inc. and Carol Campbell
|
— | — | — | — | X | ||||||||||||||
| 10.37 |
Amendment
to Employment Agreement, effective as of November 2, 2009, between First
Solar, Inc. and David Eaglesham
|
— | — | — | — | X | ||||||||||||||
| 10.38 |
Amendment
to Employment Agreement, effective as of November 2, 2009, between First
Solar, Inc. and Carol Campbell
|
— | — | — | — | X | ||||||||||||||
| 10.39 |
Amendment
to Employment Agreement, effective as of November 2, 2009, between First
Solar, Inc. and James Zhu
|
— | — | — | — | X | ||||||||||||||
| 10.40 |
Amendment
to Employment Agreement, effective as of November 16, 2009, between First
Solar, Inc. and Mary Elizabeth Gustafsson
|
— | — | — | — | X | ||||||||||||||
| 10.41 |
Amendment
to Employment Agreement, effective as of October 1, 2009, between First
Solar, Inc. and Michael J. Ahearn
|
— | — | — | — | X | ||||||||||||||
| 10.42 |
Agreement
and Plan of Merger dated as of March 2, 2009 by and among First Solar
Inc., First Solar Acquisition Corp., OptiSolar Inc. and OptiSolar Holdings
LLC
|
10-Q | 001-33156 |
5/1/09
|
10.1 | |||||||||||||||
| 14.1 |
Code
of Ethics
|
10-K | 001-33156 |
3/16/07
|
14 | |||||||||||||||
| 21.1 |
List
of Subsidiaries of First Solar, Inc.
|
— | — |
—
|
— | X | ||||||||||||||
| 23.1 |
Consent
of Independent Registered Public Accounting Firm.
|
— | — |
—
|
— | X | ||||||||||||||
| 31.01 |
Certification
of Chief Executive Officer pursuant to Rule 13a-14(a) and 15d-14(a), as
amended
|
— | — |
—
|
— | X | ||||||||||||||
| 31.02 |
Certification
of Chief Financial Officer pursuant to Rule 13a-14(a) and 15d-14(a), as
amended
|
— | — |
—
|
— | X | ||||||||||||||
| 32.01 | * |
Certification
of Chief Executive Officer and Chief Financial Officer pursuant to
18 U.S.C. Section 1350, as adopted pursuant to Section 906 of the
Sarbanes Oxley Act of 2002
|
— | — |
—
|
— | X | |||||||||||||
|
101.INS
|
XBRL
Instance Document
|
— | — |
—
|
— | X | ||||||||||||||
|
101.SCH
|
XBRL
Taxonomy Extension Schema Document
|
— | — |
—
|
— | X | ||||||||||||||
|
101.
DEF
|
XBRL
Definition Linkbase Document
|
— | — |
—
|
— | X | ||||||||||||||
|
101. CAL
|
XBRL
Taxonomy Extension Calculation Linkbase Document
|
— | — |
—
|
— | X | ||||||||||||||
|
101.LAB
|
XBRL
Taxonomy Label Linkbase Document
|
— | — |
—
|
— | X | ||||||||||||||
|
101.PRE
|
XBLR
Taxonomy Extension Presentation Document
|
— | — |
—
|
— | X | ||||||||||||||
|
†
|
Confidential
treatment has been requested and granted for portions of this
exhibit.
|
|
*
|
This
exhibit shall not be deemed “filed” for purposes of Section 18 of the
Securities Exchange Act of 1934 or otherwise subject to the liabilities of
that section, nor shall it be deemed incorporated by reference in any
filing under the Securities Act of 1933 or the Securities Exchange Act of
1934, whether made before or after the date hereof and irrespective of any
general incorporation language in any
filings.
|
(b) Financial
Statement Schedule:
Page
107
TABLE OF CONTENTS
Part IItem 1: BusinessItem 1A: Risk FactorsItem 1B: Unresolved Staff CommentsItem 2: PropertiesItem 3: Legal ProceedingsItem 4: Submission Of Matters To A Vote Of Security HoldersPart IIItem 5: Market For Registrant S Common Equity, Related Stockholder Matters and Issuer Purchases Of Equity SecuritiesItem 6: Selected Consolidated Financial DataItem 7: Management S Discussion and Analysis Of Financial Condition and Results Of OperationsItem 7A: Quantitative and Qualitative Disclosures About Market RiskItem 8: Financial Statements and Supplementary DataItem 9: Changes in and Disagreements with Accountants on Accounting and Financial DisclosureItem 9A: Controls and ProceduresItem 9B: Other InformationPart IIIItem 10: Directors, Executive Officers and Corporate GovernanceItem 11: Executive CompensationItem 12: Security Ownership Of Certain Beneficial Owners and Management and Related Stockholder MattersItem 13: Certain Relationships and Related Transactions, and Director IndependenceItem 14: Principal Accountant Fees and ServicesPart IVItem 15: Exhibits and Financial Statement SchedulesNote 1. First Solar and Its BusinessNote 2. Summary Of Significant Accounting PoliciesNote 3. AcquisitionsNote 4. Goodwill and Intangible AssetsNote 5. Cash and InvestmentsNote 6. Restricted Cash and InvestmentsNote 7. Consolidated Balance Sheet DetailsNote 8. Derivative InstrumentsNote 9. Fair Value MeasurementNote 10. Related Party TransactionsNote 11. Notes ReceivableNote 12. Solar Module Collection and Recycling LiabilityNote 13. DebtNote 14. Commitments and ContingenciesNote 15. Stockholders EquityNote 16. Share-based CompensationNote 17. Benefit PlansNote 18. Income TaxesNote 19. Net Income Per ShareNote 20. Comprehensive Income (loss)Note 21. Statement Of Cash FlowsNote 22. Segment and Geographical InformationNote 23. Concentrations Of Credit and Other RisksNote 24. Subsequent Events