FIRST SOLAR, INC.
10-Ks and 10-Qs
|
|
|
|
|
|
|
|
|
|
|
|
|
|
|
|
|
|
|
|
|
|
|
|
|
|
|
|
|
|
|
|
|
|
|
|
|
|
|
|
|
|
|
|
|
|
|
|
|
|
UNITED STATES SECURITIES AND EXCHANGE COMMISSION
Washington, D.C. 20549
Form 10-K
(Mark one)
|
[x]
|
ANNUAL REPORT PURSUANT TO SECTION 13 OR 15(d) OF THE SECURITIES EXCHANGE ACT OF 1934
|
|
For the fiscal year ended December 31, 2018
|
|
|
or
|
|
|
[ ]
|
TRANSITION REPORT PURSUANT TO SECTION 13 OR 15(d) OF THE SECURITIES EXCHANGE ACT OF 1934
|
|
For the transition period from to
|
|
Commission file number: 001-33156

First Solar, Inc.
(Exact name of registrant as specified in its charter)
|
Delaware
|
20-4623678
|
|
(State or other jurisdiction of incorporation or organization)
|
(I.R.S. Employer Identification No.)
|
350 West Washington Street, Suite 600
Tempe, Arizona 85281
(Address of principal executive offices, including zip code)
(602) 414-9300
(Registrant’s telephone number, including area code)
Securities registered pursuant to Section 12(b) of the Act:
|
Title of each class
|
Name of each exchange on which registered
|
|
Common stock, $0.001 par value
|
The NASDAQ Stock Market LLC
|
Securities registered pursuant to Section 12(g) of the Act:
None
Indicate by check mark if the registrant is a well-known seasoned issuer, as defined in Rule 405 of the Securities Act. Yes [x] No [ ]
Indicate by check mark if the registrant is not required to file reports pursuant to Section 13 or Section 15(d) of the Act. Yes [ ] No [x]
Indicate by check mark whether the registrant (1) has filed all reports required to be filed by Section 13 or 15(d) of the Securities Exchange Act of 1934 during the preceding 12 months (or for such shorter period that the registrant was required to file such reports), and (2) has been subject to such filing requirements for the past 90 days. Yes [x] No [ ]
Indicate by check mark whether the registrant has submitted electronically every Interactive Data File required to be submitted pursuant to Rule 405 of Regulation S-T (§232.405 of this chapter) during the preceding 12 months (or for such shorter period that the registrant was required to submit such files). Yes [x] No [ ]
Indicate by check mark if disclosure of delinquent filers pursuant to Item 405 of Regulation S-K (§229.405 of this chapter) is not contained herein, and will not be contained, to the best of registrant’s knowledge, in definitive proxy or information statements incorporated by reference in Part III of this Form 10-K or any amendment to this Form 10-K. [ ]
Indicate by check mark whether the registrant is a large accelerated filer, an accelerated filer, a non-accelerated filer, a smaller reporting company, or an emerging growth company. See the definitions of “large accelerated filer,” “accelerated filer,” “smaller reporting company,” and “emerging growth company” in Rule 12b-2 of the Exchange Act.
|
Large accelerated filer [x]
|
Accelerated filer [ ]
|
Non-accelerated filer [ ]
|
|
Smaller reporting company [ ]
|
Emerging growth company [ ]
|
|
If an emerging growth company, indicate by check mark if the registrant has elected not to use the extended transition period for complying with any new or revised financial accounting standards provided pursuant to Section 13(a) of the Exchange Act. [ ]
Indicate by check mark whether the registrant is a shell company (as defined in Rule 12b-2 of the Act). Yes [ ] No [x]
The aggregate market value of the registrant’s common stock held by non-affiliates of the registrant as of
June 30, 2018
, the last business day of the registrant’s most recently completed second fiscal quarter, was approximately
$4.3 billion
(based on the closing sales price of the registrant’s common stock on that date). As of
February 15, 2019
,
104,894,572
shares of the registrant’s common stock, $0.001 par value per share, were outstanding.
DOCUMENTS INCORPORATED BY REFERENCE
The information required by Part III of this Form 10-K, to the extent not set forth herein, is incorporated by reference from the registrant’s definitive proxy statement relating to the Annual Meeting of Shareholders to be held in
2019
, which will be filed with the Securities and Exchange Commission within 120 days after the end of the fiscal year to which this Form 10-K relates.
FIRST SOLAR, INC.
FORM 10-K FOR THE YEAR ENDED
DECEMBER 31, 2018
TABLE OF CONTENTS
|
Page
|
||
|
PART I
|
||
|
Item 1.
|
||
|
Item 1A.
|
||
|
Item 1B.
|
||
|
Item 2.
|
||
|
Item 3.
|
||
|
Item 4.
|
||
|
PART II
|
||
|
Item 5.
|
||
|
Item 6.
|
||
|
Item 7.
|
||
|
Item 7A.
|
||
|
Item 8.
|
||
|
Item 9.
|
||
|
Item 9A.
|
||
|
Item 9B.
|
||
|
PART III
|
||
|
Item 10.
|
||
|
Item 11.
|
||
|
Item 12.
|
||
|
Item 13.
|
||
|
Item 14.
|
||
|
PART IV
|
||
|
Item 15.
|
||
|
Item 16.
|
||
Throughout this Annual Report on Form 10-K, we refer to First Solar, Inc. and its consolidated subsidiaries as “First Solar,” “the Company,” “we,” “us,” and “our.” When referring to our manufacturing capacity, total sales, and solar module sales, the unit of electricity in watts for megawatts (“MW”) and gigawatts (“GW”) is direct current (“DC” or “
DC
”) unless otherwise noted. When referring to our projects or systems, the unit of electricity in watts for MW and GW is alternating current (“AC” or “
AC
”) unless otherwise noted.
NOTE REGARDING FORWARD-LOOKING STATEMENTS
This Annual Report on Form 10-K contains forward-looking statements within the meaning of the Securities Exchange Act of 1934, as amended (the “Exchange Act”), and the Securities Act of 1933, as amended (the “Securities Act”), which are subject to risks, uncertainties, and assumptions that are difficult to predict. All statements in this Annual Report on Form 10-K, other than statements of historical fact, are forward-looking statements. These forward-looking statements are made pursuant to safe harbor provisions of the Private Securities Litigation Reform Act of 1995. The forward-looking statements include statements, among other things, concerning: effects resulting from certain module manufacturing changes and associated restructuring activities; our business strategy, including anticipated trends and developments in and management plans for our business and the markets in which we operate; future financial results, operating results, revenues, gross margin, operating expenses, products, projected costs (including estimated future module collection and recycling costs), warranties, solar module technology and cost reduction roadmaps, restructuring, product reliability, investments, business acquisitions, and capital expenditures; our ability to continue to reduce the cost per watt of our solar modules; the impact of public policies, such as tariffs or other trade remedies imposed on solar cells and modules; effects resulting from pending litigation; our ability to expand manufacturing capacity worldwide; our ability to reduce the costs to develop and construct photovoltaic (“PV”) solar power systems; research and development (“R&D”) programs and our ability to improve the wattage of our solar modules; sales and marketing initiatives; and competition. In some cases, you can identify these statements by forward-looking words, such as “estimate,” “expect,” “anticipate,” “project,” “plan,” “intend,” “seek,” “believe,” “forecast,” “foresee,” “likely,” “may,” “should,” “goal,” “target,” “might,” “will,” “could,” “predict,” “continue,” and the negative or plural of these words, and other comparable terminology. Forward-looking statements are only predictions based on our current expectations and our projections about future events. All forward-looking statements included in this Annual Report on Form 10-K are based upon information available to us as of the filing date of this Annual Report on Form 10-K and therefore speak only as of the filing date. You should not place undue reliance on these forward-looking statements. We undertake no obligation to update any of these forward-looking statements for any reason, whether as a result of new information, future developments, or otherwise. These forward-looking statements involve known and unknown risks, uncertainties, and other factors that may cause our actual results, levels of activity, performance, or achievements to differ materially from those expressed or implied by these statements, including, but not limited to:
|
•
|
structural imbalances in global supply and demand for PV solar modules;
|
|
•
|
the market for renewable energy, including solar energy;
|
|
•
|
our competitive position and other key competitive factors;
|
|
•
|
reduction, elimination, or expiration of government subsidies, policies, and support programs for solar energy projects;
|
|
•
|
our ability to execute on our long-term strategic plans;
|
|
•
|
our ability to execute on our solar module technology and cost reduction roadmaps;
|
|
•
|
interest rate fluctuations and both our and our customers’ ability to secure financing;
|
|
•
|
our ability to attract new customers and to develop and maintain existing customer and supplier relationships;
|
|
•
|
our ability to successfully develop and complete our systems business projects;
|
|
•
|
our ability to convert existing or construct production facilities to support new product lines, such as Series 6
TM
(“Series 6”) modules;
|
1
|
•
|
general economic and business conditions, including those influenced by U.S., international, and geopolitical events;
|
|
•
|
environmental responsibility, including with respect to cadmium telluride (“CdTe”) and other semiconductor materials;
|
|
•
|
claims under our limited warranty obligations;
|
|
•
|
changes in, or the failure to comply with, government regulations and environmental, health, and safety requirements;
|
|
•
|
future collection and recycling costs for solar modules covered by our module collection and recycling program;
|
|
•
|
our ability to protect our intellectual property;
|
|
•
|
our ability to prevent and/or minimize the impact of cyber-attacks or other breaches of our information systems;
|
|
•
|
our continued investment in R&D;
|
|
•
|
the supply and price of components and raw materials, including CdTe;
|
|
•
|
our ability to attract and retain key executive officers and associates; and
|
|
•
|
all other matters discussed in Item 1A. “Risk Factors” and elsewhere in this Annual Report on Form 10-K, our subsequently filed Quarterly Reports on Form 10-Q, and our other filings with the Securities and Exchange Commission (the “SEC”).
|
You should carefully consider the risks and uncertainties described under this section.
2
PART I
Item 1.
Business
Company Overview
We are a leading global provider of comprehensive PV solar energy solutions. We design, manufacture, and sell PV solar modules with an advanced thin film semiconductor technology and also develop, design, construct, and sell PV solar power systems that primarily use the modules we manufacture. Additionally, we provide operations and maintenance (“O&M”) services to system owners. We have substantial, ongoing R&D efforts focused on module and system-level innovations. We are the world’s largest thin film PV solar module manufacturer and one of the world’s largest PV solar module manufacturers.
In addressing the overall global demand for electricity, our high-efficiency CdTe modules, led by our Series 6 module technology, and fully integrated systems provide competitively priced utility-scale PV solar energy solutions, which compete on an economic basis in many climates with traditional forms of energy generation and provide low cost electricity to end-users. Our vertically-integrated capabilities enable us to provide such solutions, accelerate the adoption of our technology, and successfully sell into key markets around the world. We seek to offer leadership across the entire solar value chain, resulting in more reliable and cost effective energy solutions for our customers.
Business Strategy
We believe the following strategies and points of differentiation provide the foundation for our leading industry position and enable us to remain one of the preferred providers of PV solar energy solutions.
Differentiated Technology
As a field-proven technology, our CdTe solar modules offer certain advantages over conventional crystalline silicon based solar modules by delivering competitive efficiency, higher real-world energy yield, and long-term reliability. Proven to deliver up to
8%
more usable energy per nameplate watt than conventional technologies in certain geographic markets and with a record of reliable system performance, our CdTe technology delivers more energy, more consistently, over the lifetime of a PV solar power system. Our Series 6 module technology, with its combination of high wattage, low manufacturing costs, a larger form factor, and balance of systems (“BoS”) component compatibility, has further enhanced our competitive position since the launch of such technology in 2018. We expect our continued transition to Series 6 module technology to enable us to maximize the intrinsic cost advantage of CdTe thin film technology versus crystalline silicon.
In terms of energy yield, in many climates our CdTe solar modules provide a significant energy production advantage over most crystalline silicon solar modules of equivalent efficiency rating. For example, our CdTe solar modules provide a superior temperature coefficient, which results in stronger system performance in typical high insolation climates as the majority of a system’s generation, on average, occurs when module temperatures are well above 25°C (standard test conditions). In addition, our CdTe solar modules provide a superior spectral response in humid environments where atmospheric moisture alters the solar spectrum relative to laboratory standards. Our CdTe solar modules also provide a better shading response than conventional crystalline silicon solar modules, which may lose up to three times as much power as CdTe solar modules when shading occurs. As a result of these factors, our PV solar power systems typically produce more annual energy in real world field conditions than conventional systems with the same nameplate capacity.
Manufacturing Process
Our modules are manufactured in a high-throughput, automated environment that integrates all manufacturing steps into a continuous flow line. Such manufacturing process eliminates the multiple supply chain operators and expensive and time-consuming batch processing steps that are used to produce crystalline silicon solar modules. At the outset of
3
the production of our modules, a sheet of glass enters the production line and in less than
3.5
hours is transformed into a completed module, which is flash tested, packaged, and ready for shipment. With more than
20
GW
DC
of modules sold worldwide, we have a demonstrated history of manufacturing success and innovation. We have a global manufacturing footprint with facilities based in Perrysburg, Ohio; Kulim, Malaysia; and Ho Chi Minh City, Vietnam.
As we continue to transition our manufacturing capacity to Series 6 module technology, we expect to ramp down substantially all production of our Series 4
TM
(“Series 4”) modules in 2019. Although this transition process has resulted in a temporary reduction in production capacity, the process has allowed us to use our existing manufacturing infrastructure to more quickly and cost effectively deploy our Series 6 module technology to best position us for long-term competitiveness and growth.
Vertical Integration
We are vertically integrated across substantially the entire solar value chain. Many of the efficiencies, cost reductions, and capabilities that we deliver to our customers are not easily replicable for other industry participants that are not vertically integrated in a similar manner. Accordingly, our operational model offers PV solar energy solutions that benefit from our wide range of capabilities, including advanced PV solar module manufacturing, project development, engineering and plant optimization, grid integration and plant control systems, procurement and construction services, and O&M services.
Financial Viability
We are committed to creating long-term shareholder value through a decision-making framework that delivers a balance of growth, profitability, and liquidity. This framework has enabled us to fund our Series 6 transition and capacity expansion initiatives using cash flows generated by our operations despite substantial downward pressure on the price of solar modules and systems due to pricing competition, demand fluctuations, and significant overcapacity in the industry. Our financial viability provides strategic optionality as we evaluate how to invest in our business and generate returns for our shareholders. Our financial viability and bankability also enable us to offer meaningful module and system warranties after installation, which provide us with a competitive advantage relative to some of our peers in the solar industry in the context of project financing and offering PV solar energy solutions to long-term owners. Furthermore, we expect our financial discipline and ability to manage operating costs to enhance our profitability as we continue to scale our business.
Sustainability
In addition to our financial commitments, we are also committed to minimizing the environmental impacts and enhancing the social and economic benefits of our products across their life cycle, from raw material sourcing through end-of-life module recycling. Accordingly, our modules and systems provide an ecologically leading solution to climate change, energy security, and water scarcity, which also enables our customers to achieve their sustainability objectives. On a lifecycle basis, our thin film module technology has the smallest carbon footprint, fastest energy payback time, and lowest water use of any PV solar technology on the market.
As a result of our specialized manufacturing process, the carbon footprint of our modules is up to six times lower than conventional crystalline silicon modules and a fraction of the carbon footprint of conventional energy sources. Furthermore, our technology displaces up to
98%
of greenhouse gas emissions and other air pollutants when replacing traditional forms of energy generation. Our manufacturing process also facilitates the fastest energy payback time (which is the amount of time a system must operate to recover the energy required to produce it) of all PV solar technologies. In less than six months under high irradiance conditions, our systems produce more energy than was required to create them, which represents a 50-fold energy return on investment over a 25-year system lifetime and an abundant net energy gain to the electricity grid. Our modules also use up to
400
times less water per MW hour than conventional energy and up to
24
times less water than other PV solar technologies. In addition, our industry-leading
4
recycling process further enhances our sustainability advantage by recovering approximately
90%
of the glass for reuse in new glass products and over
90%
of the semiconductor material for reuse in new modules.
Offerings and Capabilities
We are focusing on markets and energy applications in which solar power can be a least-cost, best-fit energy solution, particularly in regions with high solar resources, significant current or projected electricity demand, and/or relatively high existing electricity prices. We differentiate our product offerings by geographic market and localize the solution, as needed. Our consultative approach to our customers’ solar energy needs and capabilities results in customized solutions to meet their economic goals. As a result, we have designed our product and service offerings according to the following business areas:
|
•
|
PV Solar Modules
. Our modules couple our leading-edge CdTe technology with the manufacturing excellence and quality control that comes from being one of the world’s most experienced producers of advanced PV solar modules. Our technology demonstrates a proven performance advantage over conventional crystalline silicon solar modules of equivalent efficiency rating by delivering higher real-world energy yield and long-term reliability. We are able to provide such product performance, quality, and reliability to our customers due, in large part, to investing more in R&D than most other solar companies in the world.
|
|
•
|
Utility-Scale Power Plant
. We have extensive, proven experience in developing and constructing reliable grid-connected power systems for utility-scale generation. Our grid-connected systems diversify the energy portfolio, reduce fossil-fuel consumption, mitigate the risk of fuel price volatility, and save costs, proving that centralized solar generation can deliver dependable and affordable solar electricity to the grid around the world. Our plant control systems provide reliability services, such as frequency control, voltage control, ramping capacity, and automated generation control, which enable expanded integration of PV solar power systems into the power grid. Such reliability services also help balance the grid during times of high renewable energy generation. Our solar energy systems also offer a meaningful value proposition by eliminating commodity price risks thereby providing a long-term fixed price with relatively low operating costs. When compared to the price of power derived from a conventional source of energy, a fixed price cannot be achieved unless the cost of hedging is included. Hedging costs of a commodity such as natural gas, along with the costs of credit support required for a long-term hedge, can significantly increase conventional energy costs. Additional benefits of our grid-connected power systems include reductions of fuel imports and improvements in energy security, enhanced peaking generation and faster time-to-power, and managed variability through accurate forecasting.
|
|
•
|
EPC Services
. We provide engineering, procurement, and construction (“EPC”) services to projects developed by us and other system owners such as utilities, independent power producers, and commercial and industrial companies. EPC services include engineering design and related services, BoS procurement, advanced development of grid integration solutions, and construction contracting and management. Depending on the customer and market needs, we may provide our full EPC services or any combination of individual products and services within our EPC capabilities. Our vertical integration combined with our partner collaboration enables us to identify and make system-level innovations, which creates further value for our customers.
|
|
•
|
Battery Storage
. To further enhance the operational capabilities of utility-scale systems, we also provide storage solutions using advanced battery technology. Such storage solutions enable system owners to better align the delivery of energy with periods of peak demand, thereby increasing a system’s overall value. Storage capabilities also allow PV solar plants to meet or exceed the peaking capabilities of fossil fuel-based plants at potentially lower costs. Our advanced plant control systems manage the operations of both the PV solar plant and its storage capabilities to ensure accurate delivery of requested power to the grid. As part of our storage solutions, we also provide proprietary algorithms to design and simulate the optimal dispatch of a system depending on the customer and market needs, including site-specific weather conditions.
|
5
|
•
|
O&M Services
. By leveraging our extensive experience in plant optimization and advanced diagnostics, we have developed one of the largest and most advanced O&M programs in the industry, including more than 8 GW
DC
of utility-scale PV solar power systems, while maintaining an average fleet system effective availability greater than
99%
. Utilizing a state of the art global operations center, our team of O&M associates provide a variety of services to optimize system performance and comply with power purchase agreements (“PPA”), other project agreements, and regulations. Our products and services are engineered to enable the maximization of energy output and revenue for our customers while significantly reducing their unplanned maintenance costs. Plant owners benefit from predictable expenses over the life of the contract and reduced risk of energy loss. Our O&M program is compliant with the North American Electric Reliability Corporation (“NERC”) standards and is designed to scale to accommodate the growing O&M needs of customers worldwide. We offer our O&M services to solar power plant owners that use either our solar modules or modules manufactured by third-parties.
|
Market Overview
Solar energy is one of the fastest growing forms of renewable energy with numerous economic and environmental benefits that make it an attractive complement to and/or substitute for traditional forms of energy generation. In recent years, the price of PV solar power systems, and accordingly the cost of producing electricity from such systems, has dropped to levels that are competitive with or even below the wholesale price of electricity in many markets. This rapid price decline has opened new possibilities to develop systems in some locations with limited or no financial incentives. Other technological developments in the industry, such as the development of storage capabilities, have further enhanced the prospects of solar energy as a competitive alternative to traditional forms of energy generation. Furthermore, the fact that a PV solar power system requires no fuel provides a unique and valuable hedging benefit to owners of such systems relative to traditional energy generation assets. Once installed, PV solar power systems can function for 25 or more years with relatively less maintenance or oversight compared to many other forms of generation. In addition to these economic benefits, solar energy has substantial environmental benefits. For example, PV solar power systems generate no greenhouse gas or other emissions and use minimal amounts of water compared to traditional energy generation assets. Worldwide solar markets continue to develop, aided by the above factors as well as demand elasticity resulting from declining industry average selling prices, both at the module and system level, which have made solar power one of the most economical sources of energy.
Module average selling prices in global markets have experienced an accelerated decline in recent years and are expected to continue to decline to some degree in the future. In the aggregate, we believe manufacturers of solar cells and modules have significant installed production capacity, relative to global demand, and the ability for additional capacity expansion. We believe the solar industry may from time to time experience periods of structural imbalance between supply and demand (i.e., where production capacity exceeds global demand), and that such periods will continue to put pressure on pricing. We believe the solar industry is currently in such a period, due in part to recent developments in China, which include feed-in-tariff reductions causing deferment of in-country project development. Additionally, intense competition at the system level may result in an environment in which pricing falls rapidly, thereby further increasing demand for solar energy solutions but constraining the ability for project developers, EPC companies, and vertically-integrated companies such as First Solar to sustain meaningful and consistent profitability. In light of such market realities, we are focusing on our strategies and points of differentiation, which include our advanced module and system technologies, our manufacturing process, our vertically-integrated business model, our financial viability, and the sustainability advantage of our modules and systems.
Global Markets
We have established and are continuing to develop a global business presence. Energy markets are by their nature localized, with different drivers and market forces impacting electricity generation and demand in a particular region or for a particular application. Accordingly, our business is evolving worldwide and is shaped by the varying ways in which our PV solar energy solutions can be a compelling and economically viable solution to energy needs in different markets and applications. The following markets represent the key markets for our PV solar modules and systems.
6
The Americas
United States.
Multiple markets within the United States, which accounted for
66%
of our
2018
net sales, exemplify favorable characteristics for a solar market, including (i) sizeable electricity demand, particularly around growing population centers and industrial areas; (ii) strong demand for renewable energy generation; and (iii) abundant solar resources. In those areas and applications in which these factors are more pronounced, our PV solar energy solutions compete favorably on an economic basis with traditional forms of energy generation. The market penetration of PV solar is also impacted by certain federal and state support programs, including the current
30%
federal investment tax credit, as described under “Support Programs.” We have significant experience and a market leadership position in developing, engineering, constructing, and maintaining utility-scale power plants in the United States, particularly in California and other southwestern states, and increasingly in southeastern states. Currently, our solar projects in the United States represent the majority of the advanced-stage pipeline of projects that we are either currently constructing or expect to construct. See Item 7. “Management’s Discussion and Analysis of Financial Condition and Results of Operations – Systems Project Pipeline” for more information about these projects.
Other Americas.
Outside the United States, we have drawn on our industry expertise and module technology advantages to make inroads in certain Central and South American markets. Accordingly, we continue to pursue module sale opportunities in Mexico and Brazil while monitoring opportunities in other countries with high growth potential.
Asia-Pacific
Australia.
Australia is a promising region for PV solar energy with strong growth expected to continue over the next several years. In September 2018, we completed the sale of our 49 MW
AC
Manildra project located in New South Wales, and in July 2018, we executed definitive sale agreements for the sale of our 87 MW
AC
Beryl project also located in New South Wales. The region’s strong growth is being driven by several factors, including an increased demand for PPAs from Australian commercial and industrial companies, certain government programs, and continued procurement from local utilities as well as the emergence of a merchant power market. We continue to focus our efforts in the region on utility-scale project development, including our self-developed projects in Queensland, New South Wales, and Victoria, while increasing our O&M services and third-party module sales.
Japan.
Japan’s electricity markets have various characteristics, which make them attractive markets for PV solar energy. In particular, Japan has few domestic fossil fuel resources and relies heavily on fossil fuel imports. Following the Fukushima earthquake in 2011, the country introduced certain initiatives to limit its reliance on nuclear power. Accordingly, the Japanese government announced a long-term goal of dramatically increasing installed solar power capacity and provided various incentives for solar power installations. In recent years, we have partnered with local companies to develop, construct, and operate PV solar power systems, which will further mitigate Japan’s dependence on fossil fuel imports and nuclear power. In 2018, we completed the sale of multiple projects in Japan totaling
62
MW
AC
and expect to continue providing O&M services to such projects in the future. Separately, we began operating a
59
MW
AC
project in Ishikawa prefecture and commenced construction of a
40
MW
AC
project in Miyagi prefecture. We continue to pursue other utility-scale project development, O&M, and module sale opportunities in the region.
Europe, the Middle East, and India
Europe
. Many markets across Europe reflect strong demand for PV solar energy due to its ability to compete economically with more traditional forms of energy generation. In particular, France, Germany, Greece, the Netherlands, and Spain are all running tenders in which utility-scale PV solar projects can bid for capacity. Such tenders and other recent market developments indicate the potential for further growth in the demand for PV solar energy beyond the region’s installed generation capacity of approximately 120 GW
DC
. We continue to pursue module sales activities in multiple countries, such as France and Turkey, while working with certain local partners for the distribution of our modules.
7
The Middle East.
The market potential for solar energy in the Middle East continues to be driven by a combination of strong economic fundamentals, aggressive tariff pricing, abundant solar resources, and robust policy. The United Arab Emirates (the “UAE”), Saudi Arabia, Egypt, and Jordan have established utility-scale solar programs, which are at varying degrees of maturity. The UAE and Jordan lead the region with policy mechanisms designed to ramp up the amount of renewable energy in their generation portfolios. Oman, Qatar, and Kuwait are also promising markets with indicators of future potential for solar energy. While there are several motives for investing in solar energy, including energy security, diversification of generation portfolios, and the minimization of domestic consumption of hydrocarbons, the common factor is that the economics of PV solar energy have made it a compelling energy generation source. We have sold approximately 350 MW
DC
of modules in the region and continue to pursue additional module sales opportunities.
India.
India continues to represent one of the largest and fastest growing markets for PV solar energy with an installed generation capacity of nearly 25 GW
DC
, another 12 GW
DC
of projects in development or construction, and over 20 GW
DC
of new procurement programs announced. In addition, the government has established aggressive renewable energy targets, which include increasing the country’s solar capacity to 100 GW
DC
by 2022. These targets, along with various policy and regulatory measures, help create significant and sustained demand for PV solar energy. Accordingly, we expect to continue selling modules to local integrators and operators of systems to address the region’s energy needs. In March 2018, we completed the sale of our Winsol and Hindupur projects located in Andhra Pradesh, which total 155 MW
AC
. We also own and operate two additional projects located in Karnataka, totaling 40 MW
AC
, for which we have secured rights to sell power under separate 25-year PPAs to state owned electricity distribution companies. In addition, we continue to maintain our strong module presence in the region with approximately 2 GW
DC
of installed modules.
Support Programs
Although we compete in many markets that do not require solar-specific government subsidies or support programs, our net sales and profits remain subject, in the near term, to regulation and variability based on the availability and size of government subsidies and economic incentives, such as quotas, renewable portfolio standards, and tendering systems. In addition to these support programs, financial incentives for PV solar energy generation may include tax incentives, grants, loans, rebates, and production incentives. Although we expect to become less impacted by, and less dependent on these forms of government support over time, such programs will continue to play varying roles in accelerating the adoption of PV solar power systems around the world.
In Europe, renewable energy targets, in conjunction with tenders for utility-scale PV solar and other support measures, have contributed to the growth in PV solar markets. Renewable energy targets prescribe how much energy consumption must come from renewable sources, while incentive policies and competitive tender policies are intended to support new supply development by providing certainty to investors. Various European Union (“EU”) directives on renewable energy have set targets for all EU member states in support of the goal of a
32%
share of energy from renewable sources in the EU by
2030
.
Tax incentive programs exist in the United States at both the federal and state level and can take the form of investment and production tax credits, accelerated depreciation, and sales and property tax exemptions and abatements. At the federal level, investment tax credits for business and residential solar systems have gone through several cycles of enactment and expiration since the 1980s. In 2015, the U.S. Congress extended the
30%
federal energy investment tax credit (“ITC”) for both residential and commercial solar installations through 2019. In February 2018, the Bipartisan Budget Act of 2018 modified the ITC by replacing the requirement to place solar projects in service by a certain date with a requirement to begin construction by a certain date. In June 2018, the Internal Revenue Service (“IRS”) released new guidance to determine when construction has begun on a solar project. Accordingly, projects that commence construction in 2019 will be eligible for the
30%
ITC. The credit will step down to
26%
for projects that commence construction in 2020,
22%
for projects that commence construction in 2021, and
10%
for projects that commence construction thereafter. The ITC has been an important economic driver of solar installations in the United States, and its extension has contributed to greater medium-term demand visibility. The positive impact of the ITC depends to a
8
large degree on the availability of tax equity for project financing, and any significant reduction in the availability of tax equity in the future could make it more difficult to develop and construct projects requiring financing. The eventual step-down of the ITC to
10%
underscores the need for the levelized cost of electricity (“LCOE”), meaning the net present value of a system’s total life cycle costs divided by the quantity of energy that is expected to be produced over the system’s life, of solar systems to continue to remain competitive with other sources of energy generation.
In October 2017, the United States Environmental Protection Agency (“U.S. EPA”) issued a Notice of Proposed Rulemaking proposing to repeal the previous U.S. presidential administration’s Clean Power Plan, which established standards to limit carbon dioxide emissions from existing power generation facilities. In August 2018, the U.S. EPA proposed the Affordable Clean Energy (“ACE”) rule which would establish emission guidelines for states to develop plans to address greenhouse gas emissions from existing coal-fired power plants. The ACE rule would replace the Clean Power Plan, which the U.S. EPA has proposed to repeal. Accordingly, there is significant uncertainty regarding what effects, if any, the ACE rule may have on PV solar markets.
The majority of states in the United States have also enacted legislation adopting Renewable Portfolio Standard (“RPS”) mechanisms. Under a RPS, regulated utilities and other load serving entities are required to procure a specified percentage of their total retail electricity sales to end-user customers from eligible renewable resources, such as solar energy generation facilities, by a specified date. Some programs may further require that a specified portion of the total percentage of renewable energy must come from solar generation facilities or other technologies. RPS legislation and implementing regulations vary significantly from state to state, particularly with respect to the percentage of renewable energy required to achieve the state’s RPS, the definition of eligible renewable energy resources, and the extent to which renewable energy credits (certificates representing the generation of renewable energy) qualify for RPS compliance.
Measured in terms of the volume of renewable electricity required to meet its RPS mandate, California’s RPS program is the most significant in the United States, and the California market for renewable energy has dominated the western United States region for the past several years. First enacted in
2002
, California’s RPS statute has been amended several times to increase the overall percentage requirement as well as to accelerate the target date for program compliance. Pursuant to amendments enacted by the California Legislature in
2015
, the California RPS program now requires utilities and other obligated load serving entities to procure
50%
of their total retail electricity demand from eligible renewable resources by
2030
. In
2018
, approximately
38%
of our total net sales were derived from module and system sales in California.
Various proposed and contemplated environmental and tax policies may create regulatory uncertainty in the renewable energy sector, including the solar energy sector, and may lead to a reduction or removal of various clean energy programs and initiatives designed to curtail climate change. For more information about the risks associated with these potential government actions, see Item 1A. “Risk Factors –
The reduction, elimination, or expiration of government subsidies, economic incentives, tax incentives, renewable energy targets, and other support for on-grid solar electricity applications, or other adverse public policies, such as tariffs or other trade remedies imposed on solar cells and modules, could negatively impact demand and/or price levels for our solar modules and systems and limit our growth or lead to a reduction in our net sales, thereby adversely impacting our operating results
.”
Business Segments
We operate our business in
two
segments. Our modules segment involves the design, manufacture, and sale of CdTe solar modules, which convert sunlight into electricity. Third-party customers of our modules segment include integrators and operators of PV solar power systems. Our second segment is our fully integrated systems segment, through which we provide complete turn-key PV solar power systems, or solar solutions, that draw upon our capabilities, which include (i) project development, (ii) EPC services, and (iii) O&M services. We may provide our full EPC services or any combination of individual products and services within our EPC capabilities depending upon the customer and market opportunity. All of our systems segment products and services are for PV solar power systems, which primarily use our solar modules, and we sell such products and services to utilities, independent power producers, commercial and
9
industrial companies, and other system owners. Additionally within our systems segment, we may temporarily own and operate certain of our systems for a period of time based on strategic opportunities or market factors.
See Note 22.
“Segment and Geographical Information
”
to our consolidated financial statements for further information regarding our business segments.
Modules Business
Solar Modules
Since the inception of First Solar, our flagship module has been manufactured using our advanced CdTe thin film technology. Each Series 6 module, the latest generation of our flagship module, is a glass laminate approximately 4ft x 6ft (123cm x 201cm) in size that encapsulates thin film semiconductor materials, and our legacy Series 4
module is approximately 2ft x 4ft (60cm x 120cm) in size with similar technology and materials. In April 2018, we commenced commercial production of our Series 6 modules, which have an average rated power per module of approximately 420 watts. Our legacy Series 4 modules had an average rated power per module of approximately
119 watts
,
118 watts
, and
114 watts
for the years ended
December 31, 2018
,
2017
, and
2016
, respectively. Our modules offer up to
8%
more energy than conventional crystalline silicon modules of equivalent efficiency rating and generally include anti-reflective coated glass, which further enhances energy production. Our module semiconductor structure is a single-junction polycrystalline thin film that uses CdTe as the absorption layer. CdTe has absorption properties that are well matched to the solar spectrum and can deliver competitive conversion efficiencies using approximately 1-2% of the amount of semiconductor material that is used to manufacture conventional crystalline silicon modules.
Manufacturing Process
We manufacture our CdTe solar modules on integrated production lines in an automated, proprietary, and continuous process. Our solar modules employ a thin layer of semiconductor material to convert sunlight into electricity. Our manufacturing process eliminates the multiple supply chain operators and expensive and time-consuming batch processing steps that are used to produce crystalline silicon solar modules. We currently manufacture solar modules at our Perrysburg, Ohio; Kulim, Malaysia; and Ho Chi Minh City, Vietnam manufacturing facilities.
Our CdTe manufacturing process includes the following three stages: (i) the deposition stage, (ii) the cell definition and treatment stage, and (iii) the assembly and test stage. In the deposition stage, panels of transparent oxide-coated glass are robotically loaded onto the production line where they are cleaned, laser-mark identified with a serial number, heated, and coated with thin layers of CdTe and other semiconductor materials using our proprietary vapor transport deposition technology, after which the semiconductor-coated plates are cooled rapidly to increase glass strength. In the cell definition and treatment stage, we use high-speed lasers to transform the large continuous semiconductor coating on the glass plate into a series of interconnected cells that deliver the desired current and voltage output. In this stage, we also treat the semiconductor film using proprietary chemistries and processes to improve the device’s performance, and we apply a metal sputtered back contact. In the assembly and test stage, we apply busbars, inter-layer material, and a rear glass cover sheet that is laminated to encapsulate the device. We then apply anti-reflective coating material to the substrate glass to further improve the module’s performance by increasing its ability to absorb sunlight. Finally, junction boxes, termination wires, and an under-mount frame (for Series 6 modules) are applied to complete the assembly.
We maintain a robust quality and reliability assurance program that monitors critical process parameters and measures product performance to ensure that industry and more stringent internal standards are met. Acceptance testing for electrical leakage, visual quality, and power measurement on a solar simulator are also conducted prior to preparing a module for shipment. The quality and reliability tests complement production surveillance with an ongoing monitoring program, subjecting production modules to accelerated life stress testing to help ensure ongoing conformance to requirements of the International Electrotechnical Commission and Underwriters Laboratories Inc. These programs help assure delivery of power and performance in the field with a high level of product quality and reliability.
10
Research and Development
Our R&D model differentiates us from much of our competition due to its vertical integration, from advanced research to product development, manufacturing, and applications. We continue to devote substantial resources to our R&D efforts, which generally focus on continually improving the wattage and energy yield of our solar modules. We also focus our R&D activities on continuously improving module durability and manufacturing efficiencies, including throughput improvement, volume ramp, and material cost reduction. Based on publicly available information, we are one of the leaders in R&D investment among PV solar module manufacturers, maintaining a rate of innovation that enables rapid wattage gains and cost reductions.
In the course of our R&D activities, we explore various technologies in our efforts to sustain competitive differentiation in our modules. We primarily conduct our R&D activities and qualify process and product improvements for full production at our Perrysburg, Ohio plant and then use a systematic process to propagate them to our other production lines. We believe that our systematic approach to technology change management provides continuous improvements and ensures uniform adoption across our production lines. In addition, our respective Series 6 and Series 4 production lines are replicas or near replicas of each other and, as a result, a process or production improvement on one line can be rapidly and reliably deployed to other production lines.
We regularly produce research cells in our laboratories, some of which are tested for performance and certified by independent labs, such as the National Renewable Energy Laboratory. Cell efficiency measures the proportion of light converted to electricity in a single solar cell at standard test conditions. Our research cells are produced using laboratory equipment and methods and are not intended to be representative of our manufacturing capability. Our module conversion efficiency has improved on average more than half a percent every year for the last ten years. We currently hold two world records for CdTe PV efficiency, achieving an independently certified research cell efficiency of
22.1%
and a full aperture area module efficiency of
18.6%
. We believe that our record cells demonstrate a potential long-term module efficiency entitlement of over
20%
using our commercial-scale manufacturing equipment.
Customers
During
2018
, we sold the majority of our solar modules (not included in our systems projects) to integrators and operators of systems in the
United States
,
Australia
, and
France
, and such third-party module sales represented approximately
22%
of our total net sales. During
2018
,
M.A. Mortenson Company
,
RCR O'Donnell Griffin Pty, Ltd
, and
Tampa Electric Company
each accounted for more than
10%
of our modules business net sales.
We continue to invest in key geographic markets, particularly in areas with abundant solar resources and sizable electricity demand, and additional customer relationships to diversify our customer base. We also collaborate with strategic partners in community solar solutions, which address the residential and small business sectors to provide a broad range of customers with access to competitively priced solar energy regardless of the suitability of their rooftops. Community solar utilizes relatively small ground-mounted installations that provide clean energy to utilities, which then offer consumers the ability to buy into a specific community installation and benefit from the solar power generated by that resource. The demand for such offerings continues to build as states across the country are enacting community solar policies, and utilities are looking to diversify their energy generation portfolio in order to meet customer demand for affordable, clean energy. We also collaborate with providers of Community Choice Aggregation programs, which allow cities and counties to purchase power on behalf of residents and businesses to provide clean energy options at competitive prices. Our expertise in module technology and utility-scale generation, paired with community solar and/or Community Choice Aggregation, allows residential power consumers to “go solar,” including those who live in apartment buildings or whose home rooftops cannot accommodate solar panels.
Competition
The solar energy and renewable energy sectors are highly competitive and continually evolving as participants in these sectors strive to distinguish themselves within their markets and compete within the larger electric power industry. We
11
face intense competition for sales of solar modules, which has resulted in and may continue to result in reduced average selling prices and loss of market share. With respect to our modules business, our primary sources of competition are crystalline silicon solar module manufacturers. In addition, we expect to compete with future entrants into the PV solar industry that offer new or differentiated technological solutions. We also face competition from semiconductor manufacturers and semiconductor equipment manufacturers or their customers that produce PV solar cells, solar modules, or turn-key production lines. Within the larger electric power industry, we also compete with companies that currently offer or are developing other renewable energy technologies (including wind, hydroelectric, geothermal, biomass, and tidal technologies), as well as traditional energy generation sources.
Certain of our existing or future competitors may have direct or indirect access to sovereign capital, which could enable such competitors to operate at minimal or negative operating margins for sustained periods of time. Among PV solar module manufacturers, the principal methods of competition include sales price per watt, conversion efficiency, energy yield, reliability, warranty terms, and customer payment terms. If competitors reduce module pricing to levels near or below their manufacturing costs, or are able to operate at minimal or negative operating margins for sustained periods of time, our results of operations could be adversely affected. We believe the solar industry may from time to time experience periods of structural imbalance between supply and demand (i.e., where production capacity exceeds global demand), and that such periods will put pressure on pricing, which could adversely affect our results of operations. We believe the solar industry is currently in such a period, due in part to recent developments in China, which include feed-in-tariff reductions causing deferment of in-country project development. For additional information, see Item 1A. “Risk Factors –
Competition in solar markets globally and across the solar value chain is intense, and could remain that way for an extended period of time. An increased global supply of PV modules has caused and may continue to cause structural imbalances in which global PV module supply exceeds demand, which could have a material adverse effect on our business, financial condition, and results of operations
.”
Raw Materials
Our CdTe module manufacturing process uses approximately 30 types of raw materials and components to construct a solar module. One critical raw material in our production process is CdTe. Of the other raw materials and components, the following are also critical to our manufacturing process: front glass coated with transparent conductive oxide, other semiconductor materials, organics such as photo resist, tempered back glass, frames, packaging components such as interlayer, cord plate/cord plate cap, lead wire, and solar connectors. Before we use these materials and components in our manufacturing process, a supplier must undergo rigorous qualification procedures, and we continually evaluate new suppliers as part of our cost reduction roadmaps. When possible, we attempt to use suppliers that can provide a raw material supply source that is near our manufacturing locations, reducing the cost and lead times for such materials. Several of our key raw materials and components are either single-sourced or sourced from a limited number of suppliers.
Solar Module Collection and Recycling
We are committed to extended producer responsibility and take into account the environmental impact of our products over their entire life cycle. As part of such efforts, we previously established the solar industry’s first comprehensive module collection and recycling program. Our module recycling process is designed to enable the recovery of valuable materials, including the glass and encapsulated semiconductor material, for use in new modules or other products and minimizes the environmental impacts associated with our modules at the end of their useful lives. Approximately
90%
of each collected First Solar module can be recycled into materials for reuse. For legacy customer sales contracts that were covered under this program, we agreed to pay the costs for the collection and recycling of qualifying solar modules, and the end-users agreed to notify us, disassemble their solar power systems, package the solar modules for shipment, and revert ownership rights over the modules back to us at the end of the modules’ service lives. We currently have recycling facilities operating at each of our manufacturing facilities in the United States, Malaysia, and Vietnam and at our former manufacturing facility location in Germany.
The EU’s Waste Electronics and Electrical Equipment (“WEEE”) directive places the obligation of recycling (including collection, treatment, and environmentally sound disposal) of electrical and electronic equipment products upon
12
producers, and such directive is applicable to PV solar modules in EU member states. For modules covered under our program that were previously sold into and installed in the EU, we continue to maintain a commitment to cover the estimated collection and recycling costs consistent with our historical program. Additionally, as a result of the transposition of the WEEE directive by the EU member states, we have adjusted our offerings, as required, in various EU member states to ensure compliance with specific EU member state WEEE regulations.
Solar Module Warranties
We provide a limited PV solar module warranty covering defects in materials and workmanship under normal use and service conditions for approximately
10
years. We also typically warrant that modules installed in accordance with agreed-upon specifications will produce at least
98%
of their labeled power output rating during the first year, with the warranty coverage reducing by
0.5%
every year thereafter throughout the approximate
25
-year limited power output warranty period. As an alternative form of our standard limited module power output warranty, we also offer to certain customers an aggregated or system-level limited module performance warranty. This system-level limited module performance warranty is designed for utility-scale systems and provides
25
-year system-level energy degradation protection. For additional information on our solar module warranty programs, refer to Item 1A. “Risk Factors –
Problems with product quality or performance, including our Series 4 modules and Series 6 modules, may cause us to incur significant and/or unexpected contractual damages and/or warranty and related expenses, damage our market reputation, and prevent us from maintaining or increasing our market share.
”
Systems Business
Project Development
Project development activities generally include (i) site selection and securing rights to acquire or use the site, (ii) obtaining the requisite interconnection and transmission studies, (iii) executing an interconnection agreement, (iv) obtaining environmental and land-use permits, (v) maintaining effective site control, and (vi) entering into a PPA with an off-taker of the power to be generated by the project. The sequence of such development activities varies by international location and, in certain locations, may begin by initially bidding for PPA or off-take agreements. These activities culminate in receiving the right to construct and operate a PV solar power system.
Depending on the market opportunity or geographic location, we may acquire projects in various stages of development or acquire project companies from developers in order to complete the development process, construct a system incorporating our modules, and sell the system to a long-term owner. We may also collaborate with local partners in connection with these project development activities. Depending on the type of project or geographic location, PPAs or FiT structures define the price and terms the utility or customer will pay for power produced from the project. Depending primarily on the location, stage of development upon our acquisition of the project, and/or other site attributes, the development cycle typically ranges from one to two years but may be as long as five years. We may be required to incur significant costs for preliminary engineering, permitting, legal, and other expenses before we can determine whether a project is feasible, economically attractive, or capable of being built. If there is a delay in obtaining any required regulatory approvals, we may be forced to incur additional costs or impair our project assets, and the termination rights of the off-taker under the PPA may be triggered.
EPC Services
EPC services include engineering design and related services, BoS procurement, advanced development of grid integration solutions, and construction contracting and management. Depending on the customer and market need, we may provide our full EPC services or any combination of individual products and services within our EPC capabilities. We conduct performance testing of a system prior to substantial completion to confirm the system meets its operational and capacity expectations noted in the EPC agreement. For PV solar power systems we construct, we typically provide limited warranties for defects in engineering design, installation, and BoS part workmanship for a period of one to two years following the substantial completion of a system or a block within the system. We may also provide an energy
13
performance test during the first or second year of a system’s operation to demonstrate that the actual energy generation for the applicable year meets or exceeds the modeled energy expectation, after certain adjustments, such as irradiance, weather, module degradation, soiling, curtailment, and other conditions that may affect a system’s energy output but are unrelated to quality, design, or construction.
O&M Services
Our typical O&M service arrangements involve the performance of standard activities associated with operating and maintaining a PV solar power system. We perform such activities pursuant to the scope of services outlined in the underlying contract. These activities are considered necessary to optimize system performance and comply with PPAs, other agreements, and regulations. Although the scope of our services may vary by contract, our O&M service arrangements generally include 24/7 system monitoring, certain PPA and other agreement compliance, NERC compliance, large generator interconnection agreement compliance, energy forecasting, performance engineering analysis, regular performance reporting, turn-key maintenance services including spare parts and corrective maintenance repair, warranty management, and environmental services. As part of our O&M services, we also typically provide an effective availability guarantee, which stipulates that a system will be available to generate a certain percentage of total possible energy during a specific period after adjusting for factors outside of our control as the service provider, such as weather, curtailment, outages, force majeure, and other conditions that may affect system availability.
Customers
Our systems customers consist of utilities, independent power producers, commercial and industrial companies, and other system owners, such as investors who are looking for long-term investment vehicles that are expected to generate consistent returns. Such customers may purchase completed systems, which include our solar modules, or any combination of development, EPC services, and/or O&M services. During
2018
, the substantial majority of our systems business sales were in the
United States
,
Japan
, and
India
, and the principal customers of our systems business were
Tampa Electric Company
, Capital Dynamics, Inc. (“
Capital Dynamics
”),
Mitsui & Co.
,
D.E. Shaw
, and
IDFC Alternatives
, who each accounted for more than
10%
of our systems business net sales.
In certain markets, the emergence of utility-owned generation has increased the number of potential project buyers as such utility customers benefit from a potentially low cost of capital available through rate-basing utility investments. Given their long-term ownership profile, utility-owned generation customers typically seek to partner with vertically-integrated companies, such as First Solar, who can provide a broad spectrum of utility-scale generation solutions, including reliable PV solar technology, project development and construction, and O&M services, thereby mitigating their long-term ownership risks.
The wholesale commercial and industrial market also represents a promising opportunity given our utility-scale PV solar power system expertise. The demand for corporate renewables is accelerating, with corporations worldwide committing to the RE100 campaign, a collaborative, global initiative of influential businesses committed to 100% renewable electricity. We believe we also have a competitive advantage in the commercial and industrial market due to many customers’ sensitivity to the experience, bankability, and financial viability of their suppliers and geographically diverse operating locations. With our strong development expertise, financial strength, and global footprint, we are well positioned to meet their needs. For example, our 227 MW
AC
Muscle Shoals project and 58 MW
AC
Cove Mountain Solar 1 project are expected to provide energy for certain Facebook, Inc. data centers through PPAs with Tennessee Valley Authority and PacifiCorp, respectively. Since our first corporate related PPA with Apple Inc., we have contracted over 700 MW
AC
of PPAs associated with corporate customers to support their renewable energy goals.
Competition
With respect to our systems business, we face competition from other providers of renewable energy solutions, including developers of PV solar power systems and developers of other forms of renewable energy projects, such as wind, hydroelectric, geothermal, biomass, and tidal projects. To the extent other solar module manufacturers become more
14
vertically integrated, we expect to face increased competition from such companies as well. We also face competition from other EPC companies and joint venture type arrangements between EPC companies and solar companies. Certain current or potential future competitors may have a low cost of capital and/or access to foreign capital. The decline in module prices over the last several years has increased interest in solar energy worldwide, and there are limited barriers to entry in certain parts of the PV solar value chain, depending on the geographic market. Accordingly, competition at the system level can be intense, thereby exerting downward pressure on system-level average selling prices industry-wide. See Item 1A. “Risk Factors –
Competition at the system level can be intense, thereby potentially exerting downward pressure on system-level profit margins industry-wide, which could reduce our profitability and adversely affect our results of operations
.”
Research and Development
Our systems related R&D activities are primarily focused on the objective of lowering the LCOE of a PV solar power system through reductions in BoS costs, improved system design, and energy yield enhancements associated with systems that use our modules. Such R&D efforts are also focused on continuing to improve our systems in terms of grid integration and reliability. We conduct our R&D activities for systems primarily in the United States. Innovations related to system design, inverters and power converters, hardware platforms and installation techniques, and know-how, among other things, can and are expected in the future to continue to reduce BoS costs, which can represent a significant portion of the costs associated with the construction of a typical utility-scale PV solar power system.
Own and Operate
From time to time, we may temporarily own and operate, or retain interests in, certain of our systems for a period of time based on strategic opportunities or market factors. The ability to do so provides certain potential benefits, including greater control over the sales process and offering a lower risk profile to project buyers. As of
December 31, 2018
, we owned and operated a number of systems in various geographic markets, including Chile, India, the United States, and the Asia-Pacific region. As an owner and operator of certain systems in the United States, we may be subject to the authority of the Federal Energy Regulatory Commission (“FERC”), as well as various other federal, state, and local regulatory bodies. For more information about risks related to owning and operating such systems, please see Item 1A. “Risk Factors –
As an owner and operator of PV solar power systems that deliver electricity to the grid, certain of our affiliated entities may be regulated as public utilities under U.S. federal and state law, which could adversely affect the cost of doing business and limit our growth
.” For more information about the economics of such ownership and the impacts on our liquidity see Item 7. “Management’s Discussion and Analysis of Financial Condition and Results of Operations – Liquidity and Capital Resources.”
Intellectual Property
Our success depends, in part, on our ability to maintain and protect our proprietary technology and to conduct our business without infringing on the proprietary rights of others. We rely primarily on a combination of patents, trademarks, and trade secrets, as well as associate and third-party confidentiality agreements, to safeguard our intellectual property. We regularly file patent applications to protect inventions arising from our R&D activities and are currently pursuing patent applications in the United States and other countries. Our patent applications and any future patent applications might not result in a patent being issued with the scope of the claims we seek, or at all, and any patents we may receive may be challenged, invalidated, or declared unenforceable. In addition, we have registered and/or have applied to register trademarks and service marks in the United States and a number of foreign countries for “First Solar.”
With respect to proprietary know-how that is not patentable and processes for which patents are difficult to enforce, we rely on, among other things, trade secret protection and confidentiality agreements to safeguard our interests. We believe that many elements of our PV solar module manufacturing processes, including our unique materials sourcing, involve proprietary know-how, technology, or data that are not covered by patents or patent applications, including technical processes, equipment designs, algorithms, and procedures. We have taken security measures to protect these elements. Our R&D personnel have entered into confidentiality and proprietary information agreements with us. These
15
agreements address intellectual property protection issues and require our associates to assign to us all of the inventions, designs, and technologies they develop during the course of their employment with us. We also require our customers and business partners to enter into confidentiality agreements before we disclose sensitive aspects of our modules, technology, or business plans. We have not been subject to any material intellectual property infringement or misappropriation claims.
Environmental, Health, and Safety Matters
Our operations include the use, handling, storage, transportation, generation, and disposal of hazardous materials and wastes. We are subject to various national, state, local, and international laws and regulations relating to the protection of the environment, including those governing the discharge of pollutants into the air and water; the use, management, and disposal of hazardous materials and wastes; occupational health and safety; and the cleanup of contaminated sites. Therefore, we could incur substantial costs, including cleanup costs, fines, and civil or criminal sanctions and costs arising from third-party property damage or personal injury claims as a result of violations of, or liabilities under, environmental and occupational health and safety laws and regulations or non-compliance with environmental permits required for our operations. We believe we are currently in substantial compliance with applicable environmental and occupational health and safety requirements and do not expect to incur material expenditures for environmental and occupational health and safety controls in the foreseeable future. However, future developments such as the implementation of new, more stringent laws and regulations, more aggressive enforcement policies, or the discovery of unknown environmental conditions may require expenditures that could have a material adverse effect on our business, financial condition, or results of operations. See Item 1A. “Risk Factors –
Environmental obligations and liabilities could have a substantial negative impact on our business, financial condition, and results of operations
.”
Corporate History
We were incorporated in Delaware in February 2006 and completed our initial public offering of common stock in November 2006.
Associates
As of
December 31, 2018
, we had approximately
6,400
associates (our term for full and part-time employees), including approximately
5,100
in our modules business and approximately
500
associates that work directly in our systems business. The remainder of our associates are in R&D, sales and marketing, and general and administrative positions. None of our associates are currently represented by labor unions or covered by a collective bargaining agreement. As we expand domestically and internationally, we may encounter either regional laws that mandate union representation or associates who desire union representation or a collective bargaining agreement. We believe that our relations with our associates are good.
Available Information
We maintain a website at www.firstsolar.com. We make available free of charge on our website our annual reports on Form 10-K, quarterly reports on Form 10-Q, current reports on Form 8-K, proxy statements, and any amendments to those reports filed or furnished pursuant to Section 13(a) or 15(d) of the Exchange Act, as soon as reasonably practicable after we electronically file such materials with, or furnish them to, the SEC. The information contained in or connected to our website is not incorporated by reference into this report. We use our website as one means of disclosing material non-public information and for complying with our disclosure obligations under the SEC’s Regulation FD. Such disclosures are typically included within the Investor Relations section of our website at investor.firstsolar.com. Accordingly, investors should monitor such portions of our website in addition to following our press releases, SEC filings, and public conference calls and webcasts. The SEC also maintains a website at www.sec.gov that contains reports and other information regarding issuers, such as First Solar, that file electronically with the SEC.
16
Executive Officers of the Registrant
Our executive officers and their ages and positions as of
February 21, 2019
were as follows:
|
Name
|
Age
|
Position
|
||
|
Mark R. Widmar
|
53
|
Chief Executive Officer
|
||
|
Alexander R. Bradley
|
37
|
Chief Financial Officer
|
||
|
Georges Antoun
|
56
|
Chief Commercial Officer
|
||
|
Philip Tymen deJong
|
59
|
Chief Operations Officer
|
||
|
Raffi Garabedian
|
52
|
Chief Technology Officer
|
||
|
Paul Kaleta
|
63
|
Executive Vice President, General Counsel and Secretary
|
||
|
Christopher R. Bueter
|
55
|
Executive Vice President, Human Resources
|
||
Mark R. Widmar was appointed Chief Executive Officer in July 2016. He joined First Solar in April 2011 as Chief Financial Officer and also served as First Solar’s Chief Accounting Officer from February 2012 through June 2015. From March 2015 to June 2016, Mr. Widmar served as the Chief Financial Officer and through June 2018, served as a director on the board of the general partner of 8point3 Energy Partners LP (“8point3”), the joint yieldco formed by First Solar and SunPower Corporation in 2015 to own and operate a portfolio of selected solar generation assets. Prior to joining First Solar, Mr. Widmar served as Chief Financial Officer of GrafTech International Ltd., a leading global manufacturer of advanced carbon and graphite materials, from May 2006 through March 2011. Prior to joining GrafTech, Mr. Widmar served as Corporate Controller of NCR Inc. from 2005 to 2006, and was a Business Unit Chief Financial Officer for NCR from November 2002 to his appointment as Controller. He also served as a Division Controller at Dell, Inc. from August 2000 to November 2002. Mr. Widmar also held various financial and managerial positions with Lucent Technologies Inc., Allied Signal, Inc., and Bristol Myers/Squibb, Inc. He began his career in 1987 as an accountant with Ernst & Young. Mr. Widmar holds a Bachelor of Science in business accounting and a Masters of Business Administration from Indiana University.
Alexander R. Bradley was appointed interim Chief Financial Officer in July 2016 and confirmed as Chief Financial Officer in October 2016. Mr. Bradley previously served as Vice President, Treasury and Project Finance for First Solar. Mr. Bradley served as a director on the board of the general partner of 8point3 from June 2016 to June 2018. From June 2015 to June 2016, Mr. Bradley served as a Vice President of Operations of the general partner of 8point3. Mr. Bradley has led or supported the structuring, sale, and financing of over $10 billion and approximately 2.7 GW
DC
of the Company’s worldwide development assets, including several of the largest PV power plant projects in North America. Mr. Bradley’s professional experience includes more than 10 years in investment banking, mergers and acquisitions, project finance, and business development in the United States and internationally. Prior to joining First Solar in May 2008, Mr. Bradley worked at HSBC in investment banking and leveraged finance, in London and New York, covering the energy and utilities sector. He received his Master of Arts from the University of Edinburgh, Scotland.
Georges Antoun was appointed Chief Commercial Officer in July 2016. He joined First Solar in July 2012 as Chief Operating Officer before being appointed as President, U.S. in July 2015. Mr. Antoun has over 30 years of operational and technical experience, including leadership positions at several global technology companies. Prior to joining First Solar, Mr. Antoun served as Venture Partner at Technology Crossover Ventures (“TCV”), a private equity and venture firm that he joined in July 2011. Before joining TCV, Mr. Antoun was the Head of Product Area IP & Broadband Networks for Ericsson, based in San Jose, California. Mr. Antoun joined Ericsson in 2007, when Ericsson acquired Redback Networks, a telecommunications equipment company, where Mr. Antoun served as the Senior Vice President of World Wide Sales & Operations. After the acquisition, Mr. Antoun was promoted to Chief Executive Officer of the Redback Networks subsidiary. Prior to Redback Networks, Mr. Antoun spent five years at Cisco Systems, where he served as Vice President of Worldwide Systems Engineering and Field Marketing, Vice President of Worldwide Optical Operations, and Vice President of Carrier Sales. Prior to Cisco Systems, he was the Director of Systems Engineering at Newbridge Networks, a data and voice networking company. Mr. Antoun started his career at Nynex (now Verizon Communications), where he was part of its Science and Technology Division. Mr. Antoun also served as a member of the board of directors of Ruckus Wireless, Inc. and Violin Memory, Inc., both publicly-traded companies. He earned a
17
Bachelor of Science degree in engineering from the University of Louisiana at Lafayette and a Master’s degree in information systems engineering from NYU Poly.
Philip Tymen deJong was appointed Chief Operating Officer in July 2015. Mr. deJong has comprehensive leadership responsibility for areas including manufacturing, EPC, operations and maintenance, quality and reliability, supply chain, product management, and information technology. Mr. deJong joined First Solar in January 2010 as Vice President, Plant Management and served in several Senior Vice President roles in manufacturing and operations prior to being appointed Senior Vice President, Manufacturing & EPC in January 2015. Prior to joining First Solar, Mr. deJong was Vice President of Assembly/Test Manufacturing for Numonyx Corporation. Prior to that, he worked for 25 years at Intel Corporation, holding various positions in engineering, manufacturing, wafer fabrication management, and assembly/test manufacturing. Mr. deJong holds a Bachelor of Science degree in industrial engineering/mechanical engineering from Oregon State University and has completed advanced study at the University of New Mexico Anderson School of Management.
Raffi Garabedian has been the Chief Technology Officer of First Solar since May 2012 and manages the Company’s research and development, including PV module and power plant system products and roadmaps. Mr. Garabedian joined First Solar in June 2008 as Director of Disruptive Technologies. Prior to First Solar, Mr. Garabedian spent over 15 years in the MEMS (micro-electro-mechanical systems) industry, developing products ranging from automotive engine control sensors to fiber optic telecommunications switching systems. He was the founding CEO of Touchdown Technologies, Inc., which was acquired by Verigy, as well as Micromachines Inc., which was acquired by Kavlico. Mr. Garabedian is named on approximately 28 issued U.S. patents. Mr. Garabedian serves as a director on the boards of Covelant Metrology and Heliotrope Technologies. Mr. Garabedian earned a Bachelor of Science degree in electrical engineering from Rensselaer Polytechnic Institute and a Master of Science degree in electrical engineering with a focus on semiconductor and microsystems technology from the University of California Davis.
Paul Kaleta joined First Solar in March 2014 as Executive Vice President & General Counsel. In February 2017, Mr. Kaleta was appointed as Corporate Secretary. Prior to joining First Solar, Mr. Kaleta was Executive Vice President, General Counsel, Shared Services & Secretary, and Chief Compliance Officer for NV Energy, Inc., which was acquired by Berkshire Hathaway’s Energy Group in December 2013. Before that, he was Vice President and General Counsel for Koch Industries, Inc., one of the world’s largest privately held companies with diverse businesses worldwide, including refining, petrochemicals, and commodity trading, among others. He also served in a number of legal and other leadership roles for Koch companies. Before joining Koch, he was Vice President and General Counsel of Niagara Mohawk Power Corporation (now part of National Grid). In private practice, Mr. Kaleta was an equity partner in the Washington D.C. law firm Swidler Berlin LLP and an associate in the Washington D.C. office of Skadden, Arps, Slate, Meagher & Flom LLP. He also served as a federal judicial clerk. Mr. Kaleta is the founding chair of the Southern Nevada Chapter of the “I Have a Dream Foundation” (now “Core Academy-powered by The Rogers Foundation”), a member of the board of directors of Advanced Energy Economy, a member of the client advisory council of Lex Mundi, and has taught both energy law and business ethics and leadership, as an adjunct professor, among other industry professional and community activities. Mr. Kaleta holds a juris doctor degree from Georgetown University Law Center and a bachelor’s degree from Hamilton College.
Christopher R. Bueter was appointed Executive Vice President, Human Resources in February 2016. Mr. Bueter joined First Solar in November 2009 as Global Director for Industrial Relations and also served as Vice President, Human Resources Global Business Development and Corporate Services, Vice President, Global Human Resources and Labor Relations, and Senior Vice President, Human Resources. Prior to joining First Solar, Mr. Bueter served as the Vice President of Global Employee Relations at Dana Corporation, an American-based worldwide supplier of powertrain components. In his 24 years at Dana Corporation, he served in a variety of roles, including Corporate Director of Employee Relations and Distribution Services Division Human Resources Manager. Mr. Bueter holds a Bachelor of Science in human resources management from the University of Toledo, and a juris doctor degree from the University of Toledo Law School.
18
Item 1A.
Risk Factors
An investment in our stock involves a high degree of risk. You should carefully consider the following information, together with the other information in this Annual Report on Form 10-K, before buying shares of our stock. If any of the following risks or uncertainties occur, our business, financial condition, and results of operations could be materially and adversely affected and the trading price of our stock could decline.
Risks Related to Our Markets and Customers
Competition in solar markets globally and across the solar value chain is intense, and could remain that way for an extended period of time. An increased global supply of PV modules has caused and may continue to cause structural imbalances in which global PV module supply exceeds demand, which could have a material adverse effect on our business, financial condition, and results of operations
.
In the aggregate, we believe manufacturers of solar cells and modules have significant installed production capacity, relative to global demand, and the ability for additional capacity expansion. For example, we estimate that in 2018 over 20 GW
DC
of capacity was added by solar module manufacturers, particularly but not exclusively in Asia. We believe the solar industry may from time to time experience periods of structural imbalance between supply and demand (i.e., where production capacity exceeds global demand), and that such periods will continue to put pressure on pricing. We believe the solar industry is currently in such a period, due in part to recent developments in China, which include feed-in-tariff reductions causing deferment of in-country project development. During the past several years, industry average selling prices per watt have declined, at times significantly, both at the module and system levels, as competitors have reduced prices to sell inventories worldwide. There may be additional pressure on global demand and average selling prices in the future resulting from fluctuating demand in certain major solar markets such as China. If our competitors reduce module pricing to levels near or below their manufacturing costs, or are able to operate at minimal or negative operating margins for sustained periods of time, or if demand for PV modules does not grow sufficiently to justify the current production supply, our business, financial condition, and results of operations could be adversely affected.
If PV solar and related technologies are not suitable for widespread adoption at economically attractive rates of return or if sufficient additional demand for solar modules, related technologies, and systems does not develop or takes longer to develop than we anticipate, our net sales and profit may flatten or decline and we may be unable to sustain profitability.
In comparison to traditional forms of energy generation, the solar energy market continues to be at a relatively early stage of development. If utility-scale PV solar technology proves unsuitable for widespread adoption at economically attractive rates of return or if additional demand for solar modules and systems fails to develop sufficiently or takes longer to develop than we anticipate, we may be unable to grow our business or generate sufficient net sales to sustain profitability. In addition, demand for solar modules, related technologies, and systems in our targeted markets may develop to a lesser extent than we anticipate. Many factors may affect the viability of widespread adoption of utility-scale PV solar technology in our targeted markets, as well as the demand for solar modules and systems generally, including the following:
|
•
|
cost-effectiveness of the electricity generated by PV solar power systems compared to conventional energy sources, such as natural gas (which fuel source may be subject to significant price fluctuations from time to time), and other renewable energy sources, such as wind, geothermal, and hydroelectric;
|
|
•
|
changes in tax, trade remedies, and other public policy, as well as changes in economic, market, and other conditions that affect the price of, and demand for, conventional energy resources, non-solar renewable energy resources (e.g., wind and hydroelectric), and energy efficiency programs and products, including increases or decreases in the prices of natural gas, coal, oil, and other fossil fuels and in the prices of competing renewable resources;
|
19
|
•
|
the extent of competition, barriers to entry, and overall conditions and timing related to the development of solar in new and emerging market segments such as commercial and industrial customers, community solar, community choice aggregators, and other customer segments;
|
|
•
|
availability, substance, and magnitude of support programs including federal, state, and local government subsidies, incentives, targets, and renewable portfolio standards, among other policies and programs, to accelerate the development of the solar industry;
|
|
•
|
performance, reliability, and availability of energy generated by PV solar power systems compared to conventional and other non-solar renewable energy sources and products, particularly conventional energy generation capable of providing 24-hour, non-intermittent baseload power;
|
|
•
|
the development, functionality, scale, cost, and timing of storage solutions; and
|
|
•
|
changes in the amount and priorities of capital expenditures by end-users of solar modules and systems (e.g., utilities), which capital expenditures tend to decrease when the economy slows or when interest rates increase, thereby resulting in redirection away from solar generation to development of competing forms of electric generation and to distribution (e.g., smart grid), transmission, and energy efficiency measures.
|
The reduction, elimination, or expiration of government subsidies, economic incentives, tax incentives, renewable energy targets, and other support for on-grid solar electricity applications, or other adverse public policies, such as tariffs or other trade remedies imposed on solar cells and modules, could negatively impact demand and/or price levels for our solar modules and systems and limit our growth or lead to a reduction in our net sales, thereby adversely impacting our operating results
.
Although we believe that solar energy will experience widespread adoption in those applications where it competes economically with traditional forms of energy without any support programs, in certain markets our net sales and profits remain subject to variability based on the availability and size of government subsidies and economic incentives. Federal, state, and local governmental bodies in many countries have provided subsidies in the form of FiTs, rebates, tax incentives, and other incentives to end-users, distributors, system integrators, and manufacturers of PV solar products. Many of these support programs expire, phase out over time, require renewal by the applicable authority, or may be amended. A summary of certain recent developments in the major government support programs that may impact our business appears under Item 1. “Business – Support Programs.” To the extent these support programs are reduced earlier than previously expected or are changed retroactively, such changes could negatively impact demand and/or price levels for our solar modules and systems, lead to a reduction in our net sales, and adversely impact our operating results. Another consideration in the U.S. market, and to a lesser extent in other global markets, is the effect of governmental land-use planning policies and environmental policies on utility-scale PV solar development. The adoption of restrictive land-use designations or environmental regulations that proscribe or restrict the siting of utility-scale solar facilities could adversely affect the marginal cost of such development.
In addition, policies of the U.S. presidential administration may create regulatory uncertainty in the renewable energy industry, including the solar industry, and our business, financial condition, and results of operations could be adversely affected. Members of the U.S. presidential administration, including representatives of the U.S. Department of Energy, have made public statements that indicate that the administration may not be supportive of various clean energy programs and initiatives designed to curtail climate change. For example, in June 2017, the U.S. President announced that the United States would withdraw from participation in the 2015 Paris Agreement on climate change mitigation. In addition, the administration has indicated that it may be supportive of overturning or modifying policies of or regulations enacted by the prior administration that placed limitations on gas and coal electricity generation, mining, and/or exploration. Additionally, in October 2017, the U.S. EPA issued a Notice of Proposed Rulemaking, proposing to repeal the previous U.S. presidential administration’s Clean Power Plan, which establishes standards to limit carbon dioxide emissions from existing power generation facilities. In August 2018, the U.S. EPA proposed the ACE rule, which would establish guidelines for states to develop plans to address greenhouse gas emissions from existing coal-fired power plants. The
20
ACE rule would replace the Clean Power Plan, which the U.S. EPA has proposed to repeal. If the current U.S. administration and/or the U.S. Congress takes action, or continues to publicly speak out about the need to take action, in furtherance of any such policies, we would be subject to significant risks, including the following:
|
•
|
a reduction or removal of clean energy programs and initiatives and the incentives they provide may diminish the market for future solar energy off-take agreements and reduce the ability for solar project developers to compete for future solar energy off-take agreements, which may reduce incentives for such parties to develop solar projects and purchase PV solar modules;
|
|
•
|
any limitations on the value or availability to potential investors of tax incentives that benefit solar energy projects such as the ITC and accelerated depreciation deductions could result in such investors generating reduced revenues and economic returns and facing a reduction in the availability of affordable financing, thereby reducing demand for PV solar modules. The ITC is a U.S. federal incentive that provides an income tax credit to the owner of the project after the project is placed in service of up to 30% of eligible basis. Under the Modified Accelerated Cost-Recovery System, owners of equipment used in a solar project may claim all of their depreciation deductions with respect to such equipment over five years, even though the useful life of such equipment is generally greater than five years. In addition, in December 2017, the U.S. government enacted comprehensive tax reform legislation commonly referred to as the Tax Cuts and Jobs Act (the “Tax Act”). Under the Tax Act, qualified property placed in service after September 22, 2017 and before January 1, 2023 is generally eligible for 100% expensing, and such property placed in service after December 31, 2022 and before January 1, 2027 is generally eligible for expensing at lower percentages. However, the Tax Act also reduced the U.S. corporate income tax rate to 21% effective January 1, 2018, which could diminish the capacity of potential investors to benefit from incentives such as the ITC and reduce the value of accelerated depreciation deductions and expensing, thereby reducing the relative attractiveness of solar projects as an investment; and
|
|
•
|
any effort to overturn federal and state laws, regulations, or policies that are supportive of solar energy generation or that remove costs or other limitations on other types of electricity generation that compete with solar energy projects could negatively impact our ability to compete with traditional forms of electricity generation and materially and adversely affect our business.
|
Application of U.S. trade laws, or trade laws of other countries, may also impact, either directly or indirectly, our operating results. For example, in January 2018, following a petition filed by a U.S.-based manufacturer of solar cells under Sections 201 and 202 of the Trade Act of 1974 for global safeguard relief with the U.S. International Trade Commission (the “USITC”), requesting, among other things, the imposition of certain tariffs on crystalline silicon solar cells imported into the United States and the establishment of a minimum price per watt on imported crystalline silicon solar modules, the U.S. President proclaimed tariffs on imported crystalline silicon modules, and a tariff-rate quota on imported crystalline silicon cells, over a four-year period, with the tariff on modules, and the tariff on cells above the first 2.5 GW
DC
of imports, starting at 30% for the February 2018 to February 2019 period and declining by five percentage points in each subsequent 12-month period. Thin film solar cell products, such as our CdTe technology, are expressly excluded from the tariffs. In addition, the USITC is expected to review developments regarding the relevant domestic industry (including its efforts to adjust to import competition) and issue a report to the U.S. President by February 2020. Such report could serve as a basis for the U.S. President to reduce, modify, or terminate the safeguard tariffs.
The United States has also imposed import tariffs in connection with other proceedings during 2018. In March 2018, the U.S. President proclaimed tariffs on certain imported aluminum and steel articles, generally at rates of 10% and 25%, respectively, under Section 232 of the Trade Expansion Act of 1962. All countries except Argentina and Australia are covered by the aluminum tariff. All countries except Argentina, Australia, Brazil, and South Korea are covered by the steel tariff, and the steel tariff rate on imports from Turkey is 50%, rather than 25%. In addition, in May 2018, the U.S. President proclaimed absolute quotas for the import of aluminum articles from Argentina and the import of steel articles from Argentina, Brazil, and South Korea. Separately, in a series of actions during 2018 that followed an investigation under Section 301 of the Trade Act of 1974, the United States imposed tariffs on various articles imported
21
from China at a rate of 25%, including silicon solar cells and modules. Certain other articles imported from China are subject to tariffs at a rate of 10%, which is scheduled to rise to 25% in March 2019 unless the United States determines not to do so based on negotiations with China.
Internationally, in July 2018, the Indian government imposed a safeguard duty on solar cells and modules imported from various countries, including member countries of the Organisation for Economic Co-operation and Development (“OECD”), China, and Malaysia, for a two-year period, starting at 25% through July 2019 and declining by five percentage points in each subsequent six-month period. Such tariffs, or any other U.S. or global trade remedies or other trade barriers, may directly or indirectly affect U.S. or global markets for solar energy and our business, financial condition, and results of operations.
These examples show that established markets for PV solar development face uncertainties arising from policy, regulatory, and governmental constraints. While the expected potential of the emerging markets we are targeting is significant, policy promulgation and market development are especially vulnerable to governmental inertia, political instability, the imposition of trade remedies and other trade barriers, geopolitical risk, fossil fuel subsidization, potentially stringent localization requirements, and limited available infrastructure.
We may be unable to fully execute on our long-term strategic plans, which could have a material adverse effect on our business, financial condition, or results of operations.
We face numerous difficulties in executing on our long-term strategic plans, particularly in new foreign jurisdictions, including the following:
|
•
|
difficulty in accurately prioritizing geographic markets that we can most effectively and profitably serve with our PV solar offerings, including miscalculations in overestimating or underestimating addressable market demand;
|
|
•
|
difficulty in competing against companies who may have greater financial resources and/or a more effective or established localized business presence and/or an ability to operate with minimal or negative operating margins for sustained periods of time;
|
|
•
|
difficulty in overcoming the inertia involved in changing local electricity ecosystems as necessary to accommodate large-scale PV solar deployment and integration;
|
|
•
|
adverse public policies in countries we operate in and/or are pursuing, including local content requirements, the imposition of trade remedies, or capital investment requirements;
|
|
•
|
business climates, such as that in China, that may have the effect of putting foreign companies at a disadvantage relative to domestic companies;
|
|
•
|
unstable economic, social, and/or operating environments in foreign jurisdictions, including social unrest, currency, inflation, and interest rate uncertainties;
|
|
•
|
the possibility of applying an ineffective commercial approach to targeted markets, including product offerings that may not meet market needs;
|
|
•
|
difficulty in generating sufficient sales volumes at economically sustainable profitability levels;
|
|
•
|
difficulty in timely identifying, attracting, training, and retaining qualified sales, technical, and other personnel in geographies targeted for expansion;
|
22
|
•
|
difficulty in maintaining proper controls and procedures as we expand our business operations both in terms of complexity and geographical reach, including transitioning certain business functions to low-cost geographies, with any material control failure potentially leading to reputational damage and loss of confidence in our financial reporting;
|
|
•
|
difficulty in competing successfully for market share in overall solar markets as a result of the success of companies participating in the global rooftop PV solar market, which is a segment in which we do not have significant historical experience;
|
|
•
|
difficulty in establishing and implementing a commercial and operational approach adequate to address the specific needs of the markets we are pursuing;
|
|
•
|
difficulty in identifying effective local partners and developing any necessary partnerships with local businesses on commercially acceptable terms; and
|
|
•
|
difficulty in balancing market demand and manufacturing production in an efficient and timely manner, potentially causing our manufacturing capacity to be constrained in some future periods or over-supplied in others.
|
In addition, please see the Risk Factors entitled “
Our substantial international operations subject us to a number of risks, including unfavorable political, regulatory, labor, and tax conditions in the United States and/or foreign countries
,” and “
The reduction, elimination, or expiration of government subsidies, economic incentives, tax incentives, renewable energy targets, and other support for on-grid solar electricity applications, or other adverse public policies, such as tariffs or other trade remedies imposed on solar cells and modules, could negatively impact demand and/or price levels for our solar modules and systems and limit our growth or lead to a reduction in our net sales, thereby adversely impacting our operating results
.”
The loss of any of our large customers, or their inability to perform under their contracts, could significantly reduce our net sales and negatively impact our results of operations.
Our customers include integrators and operators of systems, utilities, independent power producers, commercial and industrial companies, and other system owners, who may experience intense competition at the system level, thereby constraining the ability for such customers to sustain meaningful and consistent profitability. The loss of any of our large customers, their inability to perform under their contracts, or their default in payment could significantly reduce our net sales and/or adversely impact our operating results. While our contracts with customers typically have certain firm purchase commitments and may include provisions for the payment of amounts to us in certain events of contract termination, these contracts may be subject to amendments made by us or requested by our customers. These amendments may reduce the volume of modules to be sold under the contract, adjust delivery schedules, or otherwise decrease the expected revenue under these contracts. Although we believe that we can mitigate this risk, in part, by reallocating modules to other customers if the need arises, we may be unable, in whole or in part, to do so on similar terms or at all. We may also mitigate this risk by requiring some form of payment security from our customers, such as parent guarantees, bank guarantees, surety bonds, or commercial letters of credit. However, in the event the providers of such payment security fail to perform their obligations, our operating results could be adversely impacted.
We may be unable to profitably provide new solar offerings or achieve sufficient market penetration with such offerings.
We may expand our portfolio of offerings to include solutions that build upon our core competencies but for which we have not had significant historical experience, including variations in our traditional product offerings or other offerings related to commercial and industrial customers and community solar. We cannot be certain that we will be able to ascertain and allocate the appropriate financial and human resources necessary to grow these business areas. We could invest capital into growing these businesses but fail to address market or customer needs or otherwise not experience
23
a satisfactory level of financial return. Also, in expanding into these areas, we may be competing against companies that previously have not been significant competitors, such as companies that currently have substantially more experience than we do in the residential, commercial and industrial, or other targeted offerings. If we are unable to achieve growth in these areas, our overall growth and financial performance may be limited relative to our competitors and our operating results could be adversely impacted.
An increase in interest rates or tightening of the supply of capital in the global financial markets (including a reduction in total tax equity availability) could make it difficult for customers to finance the cost of a PV solar power system and could reduce the demand for our modules or systems and/or lead to a reduction in the average selling price for such offerings
.
Many of our customers and our systems business depend on debt and/or equity financing to fund the initial capital expenditure required to develop, build, and/or purchase a PV solar power system. As a result, an increase in interest rates, or a reduction in the supply of project debt financing or tax equity investments (including reductions due to a change in tax related incentives that benefit tax equity investors, such as the reduction of the U.S. corporate income tax rate to 21% under the Tax Act, which could reduce the value of these incentives), could reduce the number of solar projects that receive financing or otherwise make it difficult for our customers or our systems business to secure the financing necessary to develop, build, purchase, or install a PV solar power system on favorable terms, or at all, and thus lower demand for our solar modules, which could limit our growth or reduce our net sales. See the Risk Factor entitled “
The reduction, elimination, or expiration of government subsidies, economic incentives, tax incentives, renewable energy targets, and other support for on-grid solar electricity applications, or other adverse public policies, such as tariffs or other trade remedies imposed on solar cells and modules, could negatively impact demand and/or price levels for our solar modules and systems and limit our growth or lead to a reduction in our net sales, thereby adversely impacting our operating results
” for additional information. In addition, we believe that a significant percentage of our customers install systems as an investment, funding the initial capital expenditure through a combination of equity and debt. An increase in interest rates and the reduction of the U.S. corporate income tax rate as described above could lower an investor’s return on investment in a system, increase equity return requirements, or make alternative investments more attractive relative to PV solar power systems and, in each case, could cause these customers to seek alternative investments.
Risks Related to our Operations, Manufacturing, and Technology
Our future success depends on our ability to effectively balance manufacturing production with market demand, convert existing production facilities to support new product lines, such as our transition to Series 6 module manufacturing, and, when necessary, continue to build new manufacturing plants over time in response to such demand and add production lines in a cost-effective manner, all of which are subject to risks and uncertainties
.
Our future success depends on our ability to effectively balance manufacturing production with market demand, convert existing production facilities to support new product lines, such as our transition to Series 6 module manufacturing, and increase both our manufacturing capacity and production throughput over time in a cost-effective and efficient manner. If we cannot do so, we may be unable to expand our business, decrease our manufacturing cost per watt, maintain our competitive position, satisfy our contractual obligations, sustain profitability, or create long-term shareholder value. Our ability to expand production capacity, or to convert existing production facilities to support new product lines, such as our transition to Series 6 module manufacturing, is subject to significant risks and uncertainties, including the following:
|
•
|
delays and cost overruns as a result of a number of factors, many of which may be beyond our control, such as our inability to secure successful contracts with equipment vendors;
|
|
•
|
our custom-built equipment taking longer and costing more to manufacture than expected and not operating as designed;
|
24
|
•
|
delays or denial of required approvals by relevant government authorities;
|
|
•
|
being unable to hire qualified staff;
|
|
•
|
failure to execute our expansion or conversion plans effectively;
|
|
•
|
difficulty in balancing market demand and manufacturing production in an efficient and timely manner, potentially causing our manufacturing capacity to be constrained in some future periods or over-supplied in others; and
|
|
•
|
incurring manufacturing asset write-downs, write-offs, and other charges and costs, which may be significant, during those periods in which we idle, slow down, shut down, convert, or otherwise adjust our manufacturing capacity.
|
We face intense competition from manufacturers of crystalline silicon solar modules, as well as other thin film solar modules; if global supply exceeds global demand, it could lead to a further reduction in the average selling price for PV solar modules
,
which could reduce our net sales and adversely affect our results of operations.
The solar and renewable energy industries are highly competitive and are continually evolving as participants strive to distinguish themselves within their markets and compete with the larger electric power industry. Within the global PV solar industry, we face intense competition from crystalline silicon solar module manufacturers and other thin film solar module manufacturers. Existing or future solar module manufacturers might be acquired by larger companies with significant capital resources, thereby further intensifying competition with us. In addition, the introduction of a low cost disruptive technology could adversely affect our ability to compete, which could reduce our net sales and adversely affect our results of operations.
Even if demand for solar modules continues to grow, the rapid manufacturing capacity expansion undertaken by many module manufacturers, particularly manufacturers of crystalline silicon cells and modules, has created and may continue to cause periods of structural imbalance in which supply exceeds demand. See the Risk Factor entitled “
Competition in solar markets globally and across the solar value chain is intense, and could remain that way for an extended period of time. An increased global supply of PV modules has caused and may continue to cause structural imbalances in which global PV module supply exceeds demand, which could have a material adverse effect on our business, financial condition, and results of operations
,” for additional information. In addition, we believe any significant decrease in the cost of silicon feedstock or polysilicon would reduce the manufacturing cost of crystalline silicon modules and lead to further pricing pressure for solar modules and potentially an oversupply of solar modules. We also believe many crystalline silicon cell and wafer manufacturers continue to transition from lower efficiency Back Surface Field (“BSF”) multi-crystalline cells (the legacy technology against which we have generally competed in our markets) to higher efficiency Passivated Emitter Rear Contact (“PERC”) multi-crystalline and mono-crystalline cells at competitive cost structures. As a result, we expect that in the future, our primary competition might transition to multi-crystalline and mono-crystalline PERC based modules with higher conversion efficiencies. Additionally, while conventional solar modules, including the solar modules we produce, are monofacial, meaning their ability to produce energy is a function of direct and diffuse irradiance on their front side, certain manufacturers of mono-crystalline PERC solar modules are pursuing the commercialization of bifacial modules that also capture diffuse irradiance on the back side of a module. Such technology can improve the overall energy production of a module relative to nameplate efficiency when applied in certain applications and BoS configurations, which could potentially lower the overall LCOE of a system when compared to systems using conventional solar modules, including the modules we produce.
During any such period, our competitors could decide to reduce their sales prices in response to competition, even below their manufacturing costs, in order to generate sales, and may do so for a sustained period. Other competitors may have direct or indirect access to sovereign capital, which could enable such competitors to operate at minimal or negative operating margins for sustained periods of time. As a result, we may be unable to sell our solar modules or systems at attractive prices, or for a profit, during any period of excess supply of solar modules, which would reduce
25
our net sales and adversely affect our results of operations. Additionally, we may decide to lower our average selling prices to certain customers in certain markets in response to competition, which could also reduce our net sales and adversely affect our results of operations.
Problems with product quality or performance, including our Series 4 modules and Series 6 modules, may cause us to incur significant and/or unexpected contractual damages and/or warranty and related expenses, damage our market reputation, and prevent us from maintaining or increasing our market share.
We perform a variety of module quality and life tests under different conditions upon which we base our assessments and warranty of module performance over the duration of the warranty. However, if our thin film solar modules, including our Series 4 modules and Series 6 modules, perform below expectations, we could experience significant warranty and related expenses, damage to our market reputation, and erosion of our market share. With respect to our modules, we provide a limited warranty covering defects in materials and workmanship under normal use and service conditions for approximately 10 years. We also typically warrant that modules installed in accordance with agreed-upon specifications will produce at least
98%
of their labeled power output rating during the first year, with the warranty coverage reducing by
0.5%
every year thereafter throughout the approximate 25-year limited power output warranty period. As an alternative form of our standard limited module power output warranty, we also offer an aggregated or system-level limited module performance warranty. This system-level limited module performance warranty is designed for utility-scale systems and provides 25-year system-level energy degradation protection. This warranty represents a practical expedient to address the challenge of identifying, from the potential millions of modules installed in a utility-scale system, individual modules that may be performing below warranty thresholds by focusing on the aggregate energy generated by the system rather than the power output of individual modules. The system-level limited module performance warranty is typically calculated as a percentage of a system’s expected energy production, adjusted for certain actual site conditions, with the warranted level of performance declining each year in a linear fashion, but never falling below
80%
during the term of the warranty. As a result of these warranty programs, we bear the risk of product warranty claims long after we have sold our solar modules and recognized net sales.
If any of the assumptions used in estimating our module warranties prove incorrect, we could be required to accrue additional expenses, which could adversely impact our financial position, operating results, and cash flows. Although we have taken significant precautions to avoid a manufacturing excursion from occurring, any manufacturing excursions, including any commitments made by us to take remediation actions in respect of affected modules beyond the stated remedies in our warranties, could adversely impact our reputation, financial position, operating results, and cash flows.
Although our module performance warranties extend for 25 years, our oldest solar modules manufactured during the qualification of our pilot production line have only been in use since 2001. Accordingly, our warranties are based on a variety of quality and life tests that enable predictions of durability and future performance. These predictions, however, could prove to be materially different from the actual performance during the warranty period, causing us to incur substantial expense to repair or replace defective solar modules or provide financial remuneration in the future. For example, our solar modules, including our Series 4 modules and Series 6 modules, could suffer various failure modes, including breakage, delamination, corrosion, or performance degradation in excess of expectations, and our manufacturing operations or supply chain could be subject to materials or process variations that could cause affected modules to fail or underperform compared to our expectations. These risks could be amplified as we implement design and process changes in connection with our efforts to improve our products and accelerate module wattage as part of our long-term strategic plans and as we transition to Series 6 module manufacturing. In addition, as we increase the number of installations in extreme climates, we may experience increased failure rates due to deployment into such field conditions. Any widespread product failures may damage our market reputation, cause our net sales to decline, require us to repair or replace the defective modules or provide financial remuneration, and result in us taking voluntary remedial measures beyond those required by our standard warranty terms to enhance customer satisfaction, which could have a material adverse effect on our operating results.
In resolving claims under both the limited defect and power output warranties, we typically have the option of either repairing or replacing the covered modules or, under the limited power output warranty, providing additional modules
26
to remedy the power shortfall or making certain cash payments; however, historical versions of our module warranty did not provide a refund remedy. Consequently, we may be obligated to repair or replace the covered modules under such historical programs. As our manufacturing process may change from time-to-time in accordance with our technology roadmap, we may elect to stop production of older versions of our modules that would constitute compatible replacement modules. In some jurisdictions, our inability to provide compatible replacement modules could potentially expose us to liabilities beyond the limitations of our module warranties, which could adversely impact our reputation, financial position, operating results, and cash flows.
For PV solar power systems we construct, we typically provide limited warranties for defects in engineering design, installation, and BoS part workmanship for a period of one to two years following the substantial completion of a system or a block within the system. In resolving claims under such BoS warranties, we have the option of remedying the defect through repair or replacement. As with our modules, these warranties are based on a variety of quality and life tests that enable predictions of durability and future performance. Any failures in BoS equipment or system construction beyond our expectations may also adversely impact our reputation, financial position, operating results, and cash flows.
In addition, our contracts with customers, including contracts for the sale of Series 6 modules, may include provisions with particular product specifications, minimum wattage requirements, and specified delivery schedules. These contracts may be terminated, or we may incur significant liquidated damages or other damages, if we fail to perform our contractual obligations. In addition, our costs to perform under these contracts may exceed our estimates, which could adversely impact our profitability. We have only recently commenced commercial production of our Series 6 modules and have limited experience satisfying our obligations under the related sales arrangements. Any failures to comply with our contracts for the sale of our modules, including our Series 6 modules, could adversely impact our reputation, financial position, operating results, and cash flows.
Our failure to further refine our technology, reduce module manufacturing and BoS costs, and develop and introduce improved PV products could render our solar modules or systems uncompetitive and reduce our net sales, profitability, and/or market share.
We need to continue to invest significant financial resources in R&D to continue to improve our module conversion efficiencies, lower the LCOE of our PV solar power systems, and otherwise keep pace with technological advances in the solar industry. However, R&D activities are inherently uncertain, and we could encounter practical difficulties in commercializing our research results. We seek to continuously improve our products and processes, including, for example, our transition to Series 6 module manufacturing, and the resulting changes carry potential risks in the form of delays, performance, additional costs, or other unintended contingencies. In addition, our significant expenditures for R&D may not produce corresponding benefits. Other companies are developing a variety of competing PV technologies, including advanced multi-crystalline silicon cells, PERC or advanced p-type crystalline silicon cells, high-efficiency n-type crystalline silicon cells, copper indium gallium diselenide thin films, amorphous silicon thin films, and new emerging technologies such as hybrid perovskites, which could produce solar modules or systems that prove more cost-effective or have better performance than our solar modules or systems.
In addition, other companies could potentially develop a highly reliable renewable energy system that mitigates the intermittent power generation drawback of many renewable energy systems, or offer other value-added improvements from the perspective of utilities and other system owners, in which case such companies could compete with us even if the LCOE associated with such new systems is higher than that of our systems. As a result, our solar modules or systems may be negatively differentiated or rendered obsolete by the technological advances of our competitors, which would reduce our net sales, profitability, and/or market share. In addition, we often forward price our products and services in anticipation of future cost reductions and technology improvements, and thus, an inability to further refine our technology and execute our module technology and cost reduction roadmaps could adversely affect our operating results.
27
If our estimates regarding the future costs of collecting and recycling CdTe solar modules covered by our solar module collection and recycling program are incorrect, we could be required to accrue additional expenses and face a significant unplanned cash burden.
As necessary, we fund any incremental amounts for our estimated collection and recycling obligations on an annual basis based on the estimated costs of collecting and recycling covered modules, estimated rates of return on our restricted investments, and an estimated solar module life of 25 years less amounts already funded in prior years. We estimate the cost of our collection and recycling obligations based on the present value of the expected probability-weighted future cost of collecting and recycling the solar modules, which includes estimates for the cost of packaging materials; the cost of freight from the solar module installation sites to a recycling center; material, labor, and capital costs; the scale of recycling centers; and an estimated third-party profit margin and return on risk for collection and recycling services. We base these estimates on (i) our experience collecting and recycling our solar modules, (ii) the expected timing of when our solar modules will be returned for recycling, and (iii) the expected economic factors at the time the solar modules will be collected and recycled. If our estimates prove incorrect, we could be required to accrue additional expenses and could also face a significant unplanned cash burden at the time we realize our estimates are incorrect or end-users return their modules, which could adversely affect our operating results. In addition, participating end-users can return their modules covered under the collection and recycling program at any time. As a result, we could be required to collect and recycle covered CdTe solar modules earlier than we expect.
Our failure to protect our intellectual property rights may undermine our competitive position, and litigation to protect our intellectual property rights or defend against third-party allegations of infringement may be costly.
Protection of our proprietary processes, methods, and other technology is critical to our business. Failure to protect and monitor the use of our existing intellectual property rights could result in the loss of valuable technologies. We rely primarily on patents, trademarks, trade secrets, copyrights, and contractual restrictions to protect our intellectual property. We regularly file patent applications to protect certain inventions arising from our R&D and are currently pursuing such patent applications in various countries in accordance with our strategy for intellectual property in that jurisdiction. Our existing patents and future patents could be challenged, invalidated, circumvented, or rendered unenforceable. Our pending patent applications may not result in issued patents, or if patents are issued to us, such patents may not be sufficient to provide meaningful protection against competitors or against competitive technologies.
We also rely on unpatented proprietary manufacturing expertise, continuing technological innovation, and other trade secrets to develop and maintain our competitive position. Although we generally enter into confidentiality agreements with our associates and third parties to protect our intellectual property, such confidentiality agreements are limited in duration and could be breached and may not provide meaningful protection for our trade secrets or proprietary manufacturing expertise. Adequate remedies may not be available in the event of unauthorized use or disclosure of our trade secrets and manufacturing expertise. In addition, others may obtain knowledge of our trade secrets through independent development or legal means. The failure of our patents or confidentiality agreements to protect our processes, equipment, technology, trade secrets, and proprietary manufacturing expertise, methods, and compounds could have a material adverse effect on our business. In addition, effective patent, trademark, copyright, and trade secret protection may be unavailable or limited in some foreign countries, especially any developing countries into which we may expand our operations. In some countries, we have not applied for patent, trademark, or copyright protection.
Third parties may infringe or misappropriate our proprietary technologies or other intellectual property rights, which could have a material adverse effect on our business, financial condition, and operating results. Policing unauthorized use of proprietary technology can be difficult and expensive. Additionally, litigation may be necessary to enforce our intellectual property rights, protect our trade secrets, or determine the validity and scope of the proprietary rights of others. We cannot ensure that the outcome of such potential litigation will be in our favor, and such litigation may be costly and may divert management attention and other resources away from our business. An adverse determination in any such litigation may impair our intellectual property rights and may harm our business, prospects, and reputation. In addition, we have no insurance coverage against such litigation costs and would have to bear all costs arising from such litigation to the extent we are unable to recover them from other parties.
28
Some of our manufacturing equipment is customized and sole sourced. If our manufacturing equipment fails or if our equipment suppliers fail to perform under their contracts, we could experience production disruptions and be unable to satisfy our contractual requirements.
Some of our manufacturing equipment, including manufacturing equipment related to the production of our Series 6 modules, is customized to our production lines based on designs or specifications that we provide to equipment manufacturers, which then undertake a specialized process to manufacture the custom equipment. As a result, the equipment is not readily available from multiple vendors and would be difficult to repair or replace if it were to become delayed, damaged, or stop working. If any piece of equipment fails, production along the entire production line could be interrupted. In addition, the failure of our equipment manufacturers to supply equipment in a timely manner or on commercially reasonable terms could delay our expansion or conversion plans, otherwise disrupt our production schedule, and/or increase our manufacturing costs, all of which would adversely impact our operating results.
Several of our key raw materials and components are either single-sourced or sourced from a limited number of suppliers, and their failure to perform could cause manufacturing delays and impair our ability to deliver solar modules to customers in the required quality and quantities and at a price that is profitable to us.
Our failure to obtain raw materials and components that meet our quality, quantity, and cost requirements in a timely manner could interrupt or impair our ability to manufacture our solar modules or increase our manufacturing costs. Several of our key raw materials and components are either single-sourced or sourced from a limited number of suppliers. As a result, the failure of any of our suppliers to perform could disrupt our supply chain and adversely impact our operations. In addition, some of our suppliers are smaller companies that may be unable to supply our increasing demand for raw materials and components as we expand our business. We may be unable to identify new suppliers or qualify their products for use on our production lines in a timely manner and on commercially reasonable terms. A constraint on our production may result in our inability to meet our capacity plans and/or our obligations under our customer contracts, which would have an adverse impact on our business. Additionally, reductions in our production volume may put pressure on suppliers, resulting in increased material and component costs.
A disruption in our supply chain for CdTe could interrupt or impair our ability to manufacture solar modules and could adversely impact our profitability and long-term growth prospects.
A key raw material used in our module production process is a CdTe compound. Tellurium, one of the main components of CdTe, is mainly produced as a by-product of copper refining, and therefore, its supply is largely dependent upon demand for copper. Our supply of CdTe could be limited if any of our current suppliers or any of our future suppliers are unable to acquire an adequate supply of tellurium in a timely manner or at commercially reasonable prices. If our current suppliers or any of our future suppliers cannot obtain sufficient tellurium, they could substantially increase prices or be unable to perform under their contracts. Furthermore, if our competitors begin to use or increase their demand for tellurium, our requirements for tellurium increase, new applications for tellurium become available, or adverse trade laws or policies restrict our ability to obtain tellurium from foreign vendors or make doing so cost prohibitive, the supply of tellurium and related CdTe compounds could be reduced and prices could increase. As we may be unable to pass such increases in the costs of our raw materials through to our customers, a substantial increase in tellurium prices or any limitations in the supply of tellurium could adversely impact our profitability and long-term growth objectives.
If any future production lines are not built in line with committed schedules, it may adversely affect our future growth plans. If any future production lines do not achieve operating metrics similar to our existing production lines, our solar modules could perform below expectations and cause us to lose customers.
If we are unable to systematically replicate our production lines over time and achieve operating metrics similar to our existing production lines, our manufacturing capacity could be substantially constrained, our manufacturing costs per watt could increase, and our growth could be limited. Such factors may result in lower net sales and lower net income than we anticipate. For instance, future production lines, such as those at our manufacturing facilities in Ho Chi Minh
29
City, Vietnam and Perrysburg, Ohio, could produce solar modules that have lower conversion efficiencies, higher failure rates, and/or higher rates of degradation than solar modules from our existing production lines, and we could be unable to determine the cause of the lower operating metrics or develop and implement solutions to improve performance.
Our substantial international operations subject us to a number of risks, including unfavorable political, regulatory, labor, and tax conditions in the United States and/or foreign countries
.
We have significant manufacturing, development, construction, sales, and marketing operations both within and outside the United States and expect to continue to expand our operations worldwide. As a result, we are subject to the legal, political, social, tax, and regulatory requirements and economic conditions of many jurisdictions.
Risks inherent to international operations include, but are not limited to, the following:
|
•
|
difficulty in enforcing agreements in foreign legal systems;
|
|
•
|
difficulty in forming appropriate legal entities to conduct business in foreign countries and the associated costs of forming and maintaining those legal entities;
|
|
•
|
varying degrees of protection afforded to foreign investments in the countries in which we operate and irregular interpretations and enforcement of laws and regulations in such jurisdictions;
|
|
•
|
foreign countries may impose additional income and withholding taxes or otherwise tax our foreign operations, impose tariffs, or adopt other restrictions on foreign trade and investment, including currency exchange controls;
|
|
•
|
fluctuations in exchange rates may affect demand for our products and services and may adversely affect our profitability and cash flows in U.S. dollars to the extent that our net sales or our costs are denominated in a foreign currency and the cost associated with hedging the U.S. dollar equivalent of such exposures is prohibitive; the longer the duration of such foreign currency exposure, the greater the risk;
|
|
•
|
anti-corruption compliance issues, including the costs related to the mitigation of such risk;
|
|
•
|
risk of nationalization or other expropriation of private enterprises;
|
|
•
|
changes in general economic and political conditions in the countries in which we operate, including changes in government incentive provisions;
|
|
•
|
unexpected adverse changes in U.S. or foreign laws or regulatory requirements, including those with respect to environmental protection, import or export duties, and quotas;
|
|
•
|
opaque approval processes in which the lack of transparency may cause delays and increase the uncertainty of project approvals;
|
|
•
|
difficulty in staffing and managing widespread operations;
|
|
•
|
difficulty in repatriating earnings;
|
|
•
|
difficulty in negotiating a successful collective bargaining agreement in applicable foreign jurisdictions;
|
|
•
|
trade barriers such as export requirements, tariffs, taxes, local content requirements, anti-dumping regulations and requirements, and other restrictions and expenses, which could increase the effective price of our solar modules and make us less competitive in some countries; and
|
30
|
•
|
difficulty of, and costs relating to, compliance with the different commercial and legal requirements of the overseas countries in which we offer and sell our solar modules.
|
Our business in foreign markets requires us to respond to rapid changes in market conditions in these countries. Our overall success as a global business depends, in part, on our ability to succeed in differing legal, regulatory, economic, social, and political conditions. We may not be able to develop and implement policies and strategies that will be effective in each location where we do business.
Risks Related to Our Systems Business
Project development or construction activities may not be successful; projects under development may not receive required permits, real property rights, PPAs, interconnection, and transmission arrangements; or financing or construction may not commence or proceed as scheduled, which could increase our costs and impair our ability to recover our investments
.
The development and construction of solar energy generation facilities and other energy infrastructure projects involve numerous risks. We may be required to spend significant sums for land and interconnection rights, preliminary engineering, permitting, legal services, and other expenses before we can determine whether a project is feasible, economically attractive, or capable of being built. Success in developing a particular project is contingent upon, among other things:
|
•
|
obtaining financeable land rights, including land rights for the project site, transmission lines, and environmental mitigation;
|
|
•
|
entering into financeable arrangements for the purchase of the electrical output and renewable energy attributes generated by the project;
|
|
•
|
receipt from governmental agencies of required environmental, land-use, and construction and operation permits and approvals;
|
|
•
|
receipt of tribal government approvals for projects on tribal land;
|
|
•
|
receipt of governmental approvals related to the presence of any protected or endangered species or habitats, migratory birds, wetlands or other jurisdictional water resources, and/or cultural resources;
|
|
•
|
negotiation of development agreements, public benefit agreements, and other agreements to compensate local governments for project impacts;
|
|
•
|
negotiation of state and local tax abatement and incentive agreements;
|
|
•
|
receipt of rights to interconnect the project to the electric grid or to transmit energy;
|
|
•
|
negotiation of satisfactory EPC agreements;
|
|
•
|
securing necessary rights of way for access and transmission lines;
|
|
•
|
securing necessary water rights for project construction and operation;
|
|
•
|
securing appropriate title coverage, including coverage for mineral rights, mechanics’ liens, etc.;
|
|
•
|
obtaining financing, including debt, equity, and funds associated with the monetization of tax credits and other tax benefits;
|
31
|
•
|
payment of PPA, interconnection, and other deposits (some of which are non-refundable);
|
|
•
|
providing required payment and performance security for the development of the project, such as through the provision of letters of credit; and
|
|
•
|
timely implementation and satisfactory completion of construction.
|
Successful completion of a particular project may be adversely affected, delayed and/or rendered infeasible by numerous factors, including:
|
•
|
delays in obtaining and maintaining required governmental permits and approvals, including appeals of approvals obtained;
|
|
•
|
potential permit and litigation challenges from project stakeholders, including local residents, environmental organizations, labor organizations, tribes, and others who may oppose the project;
|
|
•
|
in connection with any such permit and litigation challenges, grants of injunctive relief to stop development and/or construction of a project;
|
|
•
|
discovery of unknown impacts to protected or endangered species or habitats, migratory birds, wetlands or other jurisdictional water resources, and/or cultural resources at project sites;
|
|
•
|
discovery of unknown title defects;
|
|
•
|
discovery of unknown environmental conditions;
|
|
•
|
unforeseen engineering problems;
|
|
•
|
construction delays and contractor performance shortfalls;
|
|
•
|
work stoppages;
|
|
•
|
cost over-runs;
|
|
•
|
labor, equipment, and material supply shortages, failures, or disruptions;
|
|
•
|
cost or schedule impacts arising from changes in federal, state, or local land-use or regulatory policies;
|
|
•
|
changes in electric utility procurement practices;
|
|
•
|
risks arising from transmission grid congestion issues;
|
|
•
|
project delays that could adversely impact our ability to maintain interconnection rights;
|
|
•
|
additional complexities when conducting project development or construction activities in foreign jurisdictions (either on a stand-alone basis or in collaboration with local business partners), including operating in accordance with the U.S. Foreign Corrupt Practices Act (the “FCPA”) and applicable local laws and customs;
|
|
•
|
unfavorable tax treatment or adverse changes to tax policy;
|
|
•
|
adverse weather conditions;
|
32
|
•
|
water shortages;
|
|
•
|
adverse environmental and geological conditions; and
|
|
•
|
force majeure and other events out of our control.
|
If we fail to complete the development of a solar energy project, fail to meet one or more agreed upon target construction milestone dates, fail to achieve system-level capacity, or fail to meet other contract terms, we may be subject to forfeiture of significant deposits under PPAs or interconnection agreements or termination of such agreements, incur significant liquidated damages, penalties, and/or other obligations under other project related agreements, and may not be able to recover our investment in the project. If we are unable to complete the development of a solar energy project, we may impair some or all of these capitalized investments, which would have an adverse impact on our net income in the period in which the loss is recognized.
We may be unable to acquire or lease land, obtain necessary interconnection and transmission rights, and/or obtain the approvals, licenses, permits, and electric transmission grid interconnection and transmission rights necessary to build and operate PV solar power systems in a timely and cost effective manner, and regulatory agencies, local communities, labor unions, tribes, or other third parties may delay, prevent, or increase the cost of construction and operation of the system we intend to build.
In order to construct and operate our PV solar power systems, we need to acquire or lease land and rights of way, obtain interconnection rights, negotiate agreements with affected transmission systems, and obtain all necessary federal, state, county, local, and foreign approvals, licenses, and permits, as well as rights to interconnect the systems to the transmission grid and transmit energy generated from the system. We may be unable to acquire the land or lease interests needed, may not obtain or maintain satisfactory interconnection rights, may have difficulty reaching agreements with affected transmission systems and/or incur unexpected network upgrade costs, may not receive or retain the requisite approvals, permits, licenses, and interconnection and transmission rights, or may encounter other problems that could delay or prevent us from successfully constructing and operating such systems.
Many of our proposed projects are located on or require access through public lands administered by federal and state agencies pursuant to competitive public leasing and right-of-way procedures and processes. Our projects may also be located on tribal land pursuant to land agreements that must be approved by tribal governments and federal agencies. The authorization for the use, construction, and operation of systems and associated transmission facilities on federal, state, tribal, and private lands will also require the assessment and evaluation of mineral rights, private rights-of-way, and other easements; environmental, agricultural, cultural, recreational, and aesthetic impacts; and the likely mitigation of adverse impacts to these and other resources and uses. The inability to obtain the required permits and other federal, state, local, and tribal approvals, and any excessive delays in obtaining such permits and approvals due, for example, to litigation or third-party appeals, could potentially prevent us from successfully constructing and operating such systems in a timely manner and could result in the potential forfeiture of any deposit we have made with respect to a given project. Moreover, project approvals subject to project modifications and conditions, including mitigation requirements and costs, could affect the financial success of a given project. Changing regulatory requirements and the discovery of unknown site conditions could also affect the financial success of a given project.
In addition, local labor unions may increase the cost of project development in California and elsewhere. We may also be subject to labor unavailability and/or increased union labor requirements due to multiple simultaneous projects in a geographic region.
Competition at the system level can be intense, thereby potentially exerting downward pressure on system-level profit margins industry-wide, which could reduce our profitability and adversely affect our results of operations
.
The significant decline in PV solar module prices over the last several years continues to create a challenging environment for module manufacturers, but it has also helped drive demand for solar electricity worldwide. Aided by such lower
33
module prices, our customers and potential customers have in many cases been willing and able to bid aggressively for new projects and PPAs, using low cost assumptions for modules, BoS parts, installation, maintenance, and other costs as the basis for such bids. Relatively low barriers to entry for solar project developers and EPC companies, including those we compete with, have led to, depending on the market and other factors, intense competition at the system level, which may result in an environment in which system-level pricing falls rapidly, thereby further increasing demand for solar energy solutions but constraining the ability for project developers, EPC companies, and vertically-integrated companies such as First Solar to sustain meaningful and consistent profitability. Accordingly, while we believe our system offerings and experience are positively differentiated in many cases from that of our competitors, we may fail to correctly identify our competitive position, we may be unable to develop or maintain a sufficient magnitude of new system projects worldwide at economically attractive rates of return, and we may not otherwise be able to achieve meaningful profitability under our long-term strategic plans.
Depending on the market opportunity, we may be at a disadvantage compared to potential system-level competitors. For example, certain of our competitors may have a stronger and/or more established localized business presence in a particular geographic region. Certain of our competitors may be larger entities that have greater financial resources and greater overall brand name recognition than we do and, as a result, may be better positioned to impact customer behavior or adapt to changes in the industry or the economy as a whole. Certain competitors may also have direct or indirect access to sovereign capital and/or other incentives, which could enable such competitors to operate at minimal or negative operating margins for sustained periods of time.
Additionally, large-scale solar systems are still in their relatively early stages of existence, and, depending on the geographic area, certain potential customers may still be in the process of educating themselves about the points of differentiation among various available providers of PV solar energy solutions, including a company’s proven overall experience and bankability, system design and optimization expertise, grid interconnection and stabilization expertise, and proven O&M capabilities. If we are unable over time to meaningfully differentiate our offerings at scale, or if available competitive pricing is prioritized over the value we believe is added through our system offerings and experience, from the viewpoint of our potential customer base, our business, financial condition, and results of operations could be adversely affected.
We may not be able to obtain long-term contracts for the sale of power produced by our projects at prices and on other terms favorable to attract financing and other investments
;
with regard to projects for which electricity is or will be sold on an open contract basis rather than under a PPA, our results of operations could be adversely affected to the extent prevailing spot electricity prices decline in an unexpected manner.
Obtaining long-term contracts for the sale of power produced by our projects at prices and on other terms favorable to us is essential for obtaining financing and commencing construction of our projects. We must compete for PPAs against other developers of solar and renewable energy projects. This intense competition for PPAs has resulted in downward pressure on PPA pricing for newly contracted projects. In addition, we believe the solar industry may experience periods of structural imbalance between supply and demand that put downward pressure on module pricing. This downward pressure on module pricing also creates downward pressure on PPA pricing for newly contracted projects. See the Risk Factor entitled “
Competition at the system level can be intense, thereby potentially exerting downward pressure on system-level profit margins industry-wide, which could reduce our profitability and adversely affect our results of operations
” for additional information. If falling PPA pricing results in forecasted project revenue that is insufficient to generate returns anticipated to be demanded in the project sale market, our business, financial condition, and results of operations could be adversely affected.
Other sources of power, such as natural gas-fired power plants, have historically been cheaper than the cost of solar power, and certain types of generation projects, such as natural gas-fired power plants, can deliver power on a firm basis. The inability to compete successfully against other power producers or otherwise enter into PPAs favorable to us would negatively affect our ability to develop and finance our projects and negatively impact our revenue. In addition, the availability of PPAs is dependent on utility and corporate energy procurement practices that could evolve and shift allocation of market risks over time. In addition, PPA availability and terms are a function of a number of economic,
34
regulatory, tax, and public policy factors, which are also subject to change. Furthermore, certain of our projects may be scheduled for substantial completion prior to the commencement of a long-term PPA with a major off-taker, in which case we would be required to enter into a stub-period PPA for the intervening time period or sell down the project. We may not be able to do either on terms that are commercially attractive to us. Finally, the electricity from certain of our projects is or is expected to be sold on an open contract basis for a period of time rather than under a PPA. If prevailing spot electricity prices relating to any such project were to decline in an unexpected manner, such project may decline in value and our results of operations could otherwise be adversely affected.
Even if we are able to obtain PPAs favorable to us, the ability of our offtake counterparties to fulfill their contractual obligations to us depends, in part, on their creditworthiness. These counterparties, such as our investor-owned utility counterparties in the state of California, which may have liability for damages associated with California’s recent wildfires, could suffer a deterioration of their creditworthiness or become, and in one case has become, subject to bankruptcy, insolvency, or liquidation proceedings or otherwise. For example, in January 2019, PG&E Corporation and Pacific Gas and Electric Company, the counterparty to our 75 MW
AC
Willow Springs 3 project, which is expected to achieve commercial operation in 2021, filed voluntary petitions for relief under chapter 11 of title 11 of the United States Code in the U.S. Bankruptcy Court for the Northern District of California. If one or more of our counterparties becomes subject to bankruptcy, insolvency, or liquidation proceedings, or if the creditworthiness of any counterparty deteriorates, we could experience an underpayment or nonpayment under PPA agreements and our ability to attract debt or equity financing for our projects could be impaired.
Lack of transmission capacity availability, potential upgrade costs to the transmission grid, and other system constraints could significantly impact our ability to build PV solar power systems and generate solar electricity power sales.
In order to deliver electricity from our PV solar power systems to our customers, our projects generally need to connect to the transmission grid. The lack of available capacity on the transmission grid could substantially impact our projects and cause reductions in project size, delays in project implementation, increases in costs from transmission upgrades, and potential forfeitures of any deposit we have made with respect to a given project. In addition, there could be unexpected costs required to complete transmission and network upgrades that adversely impact the economic viability of our PV solar power systems. These transmission and network issues and costs, as well as issues relating to the availability of large equipment such as transformers and switchgear, could significantly impact our ability to interconnect our systems to the transmission grid, build such systems, and generate solar electricity sales.
Our systems business is largely dependent on us and third parties arranging financing from various sources, which may not be available or may only be available on unfavorable terms or in insufficient amounts.
The construction of large utility-scale solar power projects in many cases requires project financing, including non-recourse project specific debt financing in the bank loan market and institutional debt capital markets. Uncertainties exist as to whether our planned projects will be able to access the debt markets in a magnitude sufficient to finance their construction. If we are unable to arrange such financing or if it is only available on unfavorable terms, we may be unable to fully execute our systems business plans. In addition, we generally expect to sell interests in our projects by raising project equity capital from tax-oriented, strategic industry, and other equity investors. Such equity sources may not be available or may only be available in insufficient amounts or on unfavorable terms, in which case our ability to sell interests in our projects may be delayed or limited, and our business, financial condition, and results of operations may be adversely affected. Uncertainty in or adverse changes to tax policy, including the amount of ITC or accelerated depreciation, and any limitations on the value or availability to potential investors of tax incentives that benefit solar energy projects such as the ITC and accelerated depreciation deductions, as well as the reduction of the U.S. corporate income tax rate to 21% under the Tax Act (which could reduce the value of these tax related incentives) may reduce project values or negatively affect our ability to timely secure equity investment for our projects. Even if such financing sources are available, the counterparty to many of our fixed-price EPC contracts, which own the projects we are constructing, are often special purpose vehicles that do not have significant assets other than their interests in the project and have pledged all or substantially all of these assets to secure the project-related debt and certain other sources of
35
financing. If the owner defaults on its payments or other obligations to us, we may face difficulties in collecting payment of amounts due to us for the costs previously incurred or for the amounts previously expended or committed to be expended to purchase equipment or supplies, or for termination payments we are entitled to under the terms of the related EPC contract. If we are unable to collect the amounts owed to us, or are unable to complete the project because of an owner default, we may be required to record certain charges related to the project, which could result in a material loss.
In addition, for projects to which we provide EPC services but are not the project developer, our EPC activities are in many cases dependent on the ability of third parties to finance their system projects on acceptable terms. Depending on prevailing conditions in the credit markets, interest rates and other factors, such financing may not be available or may only be available on unfavorable terms or in insufficient amounts. If third parties are limited in their ability to access financing to support their purchase of system construction services from us, we may not realize the cash flows that we expect from such sales, which could adversely affect our ability to invest in our business and/or generate revenue. See also the Risk Factor above entitled “
An increase in interest rates or tightening of the supply of capital in the global financial markets (including a reduction in total tax equity availability) could make it difficult for customers to finance the cost of a PV solar power system and could reduce the demand for our modules or systems and/or lead to a reduction in the average selling price for such offerings
.
”
Developing solar power projects may require significant upfront investment prior to the signing of an EPC contract and commencing construction, which could adversely affect our business and results of operations.
Solar power project development cycles, which span the time between the identification of a site location and the construction of a system, vary substantially and can take years to mature. As a result of these long project development cycles, we may need to make significant up-front investments of resources (including, for example, payments for land rights, large transmission and PPA deposits, or other payments, which may be non-refundable) in advance of the signing of EPC contracts, commencing construction, receiving cash proceeds, or recognizing any revenue. Our potential inability to enter into sales contracts with customers on favorable terms after making such upfront investments could cause us to forfeit certain nonrefundable payments or otherwise adversely affect our business and results of operations. Furthermore, we may become constrained in our ability to simultaneously fund our other business operations and these systems investments through our long project development cycles.
Our liquidity may also be adversely affected to the extent the project sales market weakens and we are unable to sell interests in our solar projects on pricing, timing, and other terms commercially acceptable to us. In such a scenario, we may choose to continue to temporarily own and operate certain solar projects for a period of time, after which interests in the projects may be sold to third parties.
We may be unable to accurately estimate costs under fixed-price EPC agreements in which we act as the general contractor for our customers in connection with the construction and installation of their PV solar power systems.
We may enter into fixed-price EPC contracts in which we act as the general contractor for our customers in connection with the installation of their PV solar power systems. All essential costs are estimated at the time of entering into the EPC contract for a particular project, and these are reflected in the overall fixed-price that we charge our customers for the project. These cost estimates are preliminary and may or may not be covered by contracts between us or the subcontractors, suppliers, and other parties to the project. In addition, we require qualified, licensed subcontractors to install many of our systems. Shortages of such skilled labor could significantly delay a project or otherwise increase our costs. Should actual results prove different from our estimates (including those due to unexpected increases in inflation, commodity prices, or labor costs) or we experience delays in execution and we are unable to commensurately increase the EPC sales price, we may not achieve our expected margins or we may be required to record a loss in the relevant period.
36
We may be subject to unforeseen costs, liabilities, or obligations when providing O&M services. In addition, certain of our O&M agreements include provisions permitting the counterparty to terminate the agreement without cause.
We may provide ongoing O&M services to system owners under separate service agreements, pursuant to which we generally perform standard activities associated with operating a PV solar power system, including 24/7 monitoring and control, compliance activities, energy forecasting, and scheduled and unscheduled maintenance. Our costs to perform these services are estimated at the time of entering into the O&M agreement for a particular project, and these are reflected in the price we charge our customers, including certain agreements which feature fixed pricing. Should our estimates of O&M costs prove inaccurate (including any unexpected serial defects, unavailability of parts, or increases in inflation, labor, or BoS costs), our growth strategy and results of operations could be adversely affected. Because of the potentially long-term nature of these O&M agreements, the adverse impacts on our results of operations could be significant, particularly if our costs are not capped under the terms of the agreements. In addition, certain of our O&M agreements include provisions permitting the counterparty to terminate the agreement without cause or for convenience. The exercise of such termination rights, or the use of such rights as leverage to re-negotiate terms and conditions of an O&M agreement, including pricing terms, could adversely impact our results of operations. We may also be subject to substantial costs in the event we do not achieve certain thresholds under the effective availability guarantees included in our O&M agreements.
Our systems business is subject to regulatory oversight and liability if we fail to operate PV solar power systems in compliance with electric reliability rules.
The ongoing O&M services that we provide for system owners may subject us to regulation by the NERC, or its designated regional representative, as a “generator operator,” or “GOP,” under electric reliability rules filed with FERC. Our failure to comply with the reliability rules applicable to GOPs could subject us to substantial fines by NERC, subject to FERC’s review. In addition, the system owners that receive our O&M services may be regulated by NERC as “generator owners,” or “GOs,” and we may incur liability for GO violations and fines levied by NERC, subject to FERC’s review, based on the terms of our O&M agreements. Finally, as a system owner and operator, we may in the future be subject to regulation by NERC as a GO.
Risks Related to Regulations
Existing regulations and policies, changes thereto, and new regulations and policies may present technical, regulatory, and economic barriers to the purchase and use of PV solar products or systems, which may significantly reduce demand for our modules, systems, or services.
The market for electricity generation products is heavily influenced by federal, state, local, and foreign government regulations and policies concerning the electric utility industry, as well as policies promulgated by electric utilities. These regulations and policies often relate to electricity pricing and interconnection of customer-owned electricity generation. In the United States and in a number of other countries, these regulations and policies have been modified in the past and may be modified again in the future. These regulations and policies could deter end-user purchases of PV solar products or systems and investment in the R&D of PV solar technology. For example, without a mandated regulatory exception for PV solar power systems, system owners are often charged interconnection or standby fees for putting distributed power generation on the electric utility grid. To the extent these interconnection standby fees are applicable to PV solar power systems, it is likely that they would increase the cost of such systems, which could make the systems less desirable, thereby adversely affecting our business, financial condition, and results of operations. In addition, with respect to utilities that utilize a peak-hour pricing policy or time-of-use pricing methods whereby the price of electricity is adjusted based on electricity supply and demand, electricity generated by PV solar power systems currently benefits from competing primarily with expensive peak-hour electricity, rather than the less expensive average price of electricity. Modifications to the peak-hour pricing policies of utilities, such as to a flat rate for all times of the day, would require PV solar power systems to have lower prices in order to compete with the price of electricity from other sources, which could adversely impact our operating results.
37
Our modules, systems, and services are often subject to oversight and regulation in accordance with national and local ordinances relating to building codes, safety, environmental protection, utility interconnection and metering, and other matters, and tracking the requirements of individual jurisdictions is complex. Any new government regulations or utility policies pertaining to our modules, systems, or services may result in significant additional expenses to us or our customers and, as a result, could cause a significant reduction in demand for our modules, systems, or services. In addition, any regulatory compliance failure could result in significant management distraction, unplanned costs, and/or reputational damage.
We could be adversely affected by any violations of the FCPA, the U.K. Bribery Act, and other foreign anti-bribery laws
.
The FCPA generally prohibits companies and their intermediaries from making improper payments to non-U.S. government officials for the purpose of obtaining or retaining business. Other countries in which we operate also have anti-bribery laws, some of which prohibit improper payments to government and non-government persons and entities, and others (e.g., the FCPA and the U.K. Bribery Act) extend their application to activities outside of their country of origin. Our policies mandate compliance with all applicable anti-bribery laws. We currently operate in, and may further expand into, key parts of the world that have experienced governmental corruption to some degree and, in certain circumstances, strict compliance with anti-bribery laws may conflict with local customs and practices. In addition, due to the level of regulation in our industry, our operations in certain jurisdictions, including China, India, South America, and the Middle East, require substantial government contact, either directly by us or through intermediaries over whom we have less direct control, such as subcontractors, agents, and partners (such as joint venture partners), where norms can differ from U.S. standards. Although we have implemented policies, procedures, and, in certain cases, contractual arrangements designed to facilitate compliance with these anti-bribery laws, our officers, directors, associates, subcontractors, agents, and partners may take actions in violation of our policies, procedures, contractual arrangements, and anti-bribery laws. Any such violation, even if prohibited by our policies, could subject us and such persons to criminal and/or civil penalties or other sanctions potentially by government prosecutors from more than one country, which could have a material adverse effect on our business, financial condition, cash flows, and reputation.
Environmental obligations and liabilities could have a substantial negative impact on our business, financial condition, and results of operations
.
Our operations involve the use, handling, generation, processing, storage, transportation, and disposal of hazardous materials and are subject to extensive environmental laws and regulations at the national, state, local, and international levels. These environmental laws and regulations include those governing the discharge of pollutants into the air and water, the use, management, and disposal of hazardous materials and wastes, the cleanup of contaminated sites, and occupational health and safety. As we expand our business into foreign jurisdictions worldwide, our environmental compliance burden may continue to increase both in terms of magnitude and complexity. We have incurred and may continue to incur significant costs in complying with these laws and regulations. In addition, violations of, or liabilities under, environmental laws or permits may result in restrictions being imposed on our operating activities or in our being subject to substantial fines, penalties, criminal proceedings, third-party property damage or personal injury claims, cleanup costs, or other costs. Such solutions could also result in substantial delay or termination of projects under construction within our systems business, which could adversely impact our results of operations. While we believe we are currently in substantial compliance with applicable environmental requirements, future developments such as more aggressive enforcement policies, the implementation of new, more stringent laws and regulations, or the discovery of presently unknown environmental conditions may require expenditures that could have a material adverse effect on our business, financial condition, and results of operations.
Our solar modules contain CdTe and other semiconductor materials. Elemental cadmium and certain of its compounds are regulated as hazardous materials due to the adverse health effects that may arise from human exposure. Based on existing research, the risks of exposure to CdTe are not believed to be as serious as those relating to exposure to elemental cadmium. In our manufacturing operations, we maintain engineering controls to minimize our associates’ exposure to cadmium or cadmium compounds and require our associates who handle cadmium compounds to follow certain safety
38
procedures, including the use of personal protective equipment such as respirators, chemical goggles, and protective clothing. Relevant studies and third-party peer review of our technology have concluded that the risk of exposure to cadmium or cadmium compounds from our end-products is negligible. In addition, the risk of exposure is further minimized by the encapsulated nature of these materials in our products, the physical properties of cadmium compounds used in our products, and the recycling or responsible disposal of our modules. While we believe that these factors and procedures are sufficient to protect our associates, end-users, and the general public from adverse health effects that may arise from cadmium exposure, we cannot ensure that human or environmental exposure to cadmium or cadmium compounds used in our products will not occur. Any such exposure could result in future third-party claims against us, damage to our reputation, and heightened regulatory scrutiny, which could limit or impair our ability to sell and distribute our products. The occurrence of future events such as these could have a material adverse effect on our business, financial condition, and results of operations.
The use of cadmium or cadmium compounds in various products is also coming under increasingly stringent governmental regulation. Future regulation in this area could impact the manufacturing, sale, collection, and recycling of solar modules and could require us to make unforeseen environmental expenditures or limit our ability to sell and distribute our products. For example, European Union Directive 2011/65/EU on the Restriction of the Use of Hazardous Substances (“RoHS”) in electrical and electronic equipment (the “RoHS Directive”) restricts the use of certain hazardous substances, including cadmium and its compounds, in specified products. Other jurisdictions, such as China, have adopted similar legislation or are considering doing so. Currently, PV solar modules are explicitly excluded from the scope of RoHS (Article 2), as adopted by the European Parliament and the Council in June 2011. The next general review of the RoHS Directive is scheduled for 2021, involving a broader discussion of the existing scope. A scope review focusing on additional exclusions was proposed by the European Commission in 2017 under the EU’s co-decision process which allows the European Parliament and the European Council to amend the European Commission’s proposal on exclusions. The co-decision procedure was completed in 2017 and the existing exclusion of PV modules was maintained. In preparation for the next RoHS revision, the European Commission has started a number of pre-regulatory studies and assessments relating to the addition of new substances to the existing RoHS framework, as well as the revision and optimization of the exemption process. It is unclear to what extent the existing scope exclusions will be discussed or maintained in future directives. If PV modules were to be included in the scope of future RoHS revisions without an exemption or exclusion, we would be required to redesign our solar modules to reduce cadmium and other affected hazardous substances to the maximum allowable concentration thresholds in the RoHS Directive in order to continue to offer them for sale within the EU. As such actions would be impractical, this type of regulatory development would effectively close the EU market to us, which could have a material adverse effect on our business, financial condition, and results of operations.
As an owner and operator of PV solar power systems that deliver electricity to the grid, certain of our affiliated entities may be regulated as public utilities under U.S. federal and state law, which could adversely affect the cost of doing business and limit our growth
.
As an owner and operator of PV solar power systems that deliver electricity to the grid, certain of our affiliated entities may be considered public utilities for purposes of the Federal Power Act, as amended (the “FPA”), and public utility companies for purposes of the Public Utility Holding Company Act of 2005 (“PUHCA 2005”), and are subject to regulation by the FERC, as well as various local and state regulatory bodies. Some of our affiliated entities may be exempt wholesale generators or qualifying facilities under the Public Utility Regulatory Policies Act of 1978, as amended (“PURPA”), and as such are exempt from regulation under PUHCA 2005. In addition, our affiliated entities may be exempt from most provisions of the FPA, as well as state laws regarding the financial or organizational regulation of public utilities. We are not directly subject to FERC regulation under the FPA. However, we are considered to be a “holding company” for purposes of Section 203 of the FPA, which regulates certain transactions involving public utilities, and such regulation could adversely affect our ability to grow the business through acquisitions. Likewise, investors seeking to acquire our public utility subsidiaries or acquire ownership interests in our securities sufficient to give them control over us and our public utility subsidiaries may require prior FERC approval to do so. Such approval could result in transaction delays or uncertainties.
39
Public utilities under the FPA are required to obtain FERC acceptance of their rate schedules for wholesale sales of electricity and to comply with various regulations. The FERC may grant our affiliated entities the authority to sell electricity at market-based rates and may also grant them certain regulatory waivers, such as waivers from compliance with FERC’s accounting regulations. These FERC orders reserve the right to revoke or revise market-based sales authority if the FERC subsequently determines that our affiliated entities can exercise market power in the sale of generation products, the provision of transmission services, or if it finds that any of the entities can create barriers to entry by competitors. In addition, if the entities fail to comply with certain reporting obligations, the FERC may revoke their power sales tariffs. Finally, if the entities were deemed to have engaged in manipulative or deceptive practices concerning their power sales transactions, they would be subject to potential fines, disgorgement of profits, and/or suspension or revocation of their market-based rate authority. If our affiliated entities were to lose their market-based rate authority, such companies would be required to obtain the FERC’s acceptance of a cost-of-service rate schedule and could become subject to the accounting, record-keeping, and reporting requirements that are imposed on utilities with cost-based rate schedules, which would impose cost and compliance burdens on us and have an adverse effect on our results of operations. In addition to the risks described above, we may be subject to additional regulatory regimes at state or foreign levels to the extent we own and operate PV solar power systems in such jurisdictions.
Other Risks
We are subject to litigation risks, including securities class actions and stockholder derivative actions, which may be costly to defend and the outcome of which is uncertain.
From time to time, we are subject to legal claims, with and without merit, that may be costly and which may divert the attention of our management and our resources in general. In addition, our projects may be subject to litigation or other adverse proceedings that may adversely impact our ability to proceed with construction or sell a given project. The results of complex legal proceedings are difficult to predict. Moreover, many of the complaints filed against us do not specify the amount of damages that plaintiffs seek, and we therefore are unable to estimate the possible range of damages that might be incurred should these lawsuits be resolved against us. Certain of these lawsuits assert types of claims that, if resolved against us, could give rise to substantial damages, and an unfavorable outcome or settlement of one or more of these lawsuits, or any future lawsuits, may result in a significant monetary judgment or award against us or a significant monetary payment by us, and could have a material adverse effect on our business, financial condition, or results of operations. Even if these lawsuits, or any future lawsuits, are not resolved against us, the costs of defending such lawsuits and of any settlement may be significant. These costs may exceed the dollar limits of our insurance policies or may not be covered at all by our insurance policies. Because the price of our common stock has been, and may continue to be, volatile, we can provide no assurance that additional securities or other litigation will not be filed against us in the future.
See Note 15. “Commitments and Contingencies – Legal Proceedings”
to our consolidated financial statements for more information on our legal proceedings, including our securities class action and derivative actions.
We may not realize the anticipated benefits of past or future business combinations or acquisition transactions, and integration of business combinations may disrupt our business and management.
We have made several acquisitions in prior years and in the future we may acquire additional companies, project pipelines, products, or technologies or enter into joint ventures or other strategic initiatives. We may not realize the anticipated benefits of such business combinations or acquisitions, and each transaction has numerous risks, which may include the following:
|
•
|
difficulty in assimilating the operations and personnel of the acquired or partner company;
|
|
•
|
difficulty in effectively integrating the acquired products or technologies with our current products or technologies;
|
|
•
|
difficulty in achieving profitable commercial scale from acquired technologies;
|
40
|
•
|
difficulty in maintaining controls, procedures, and policies during the transition and integration;
|
|
•
|
disruption of our ongoing business and distraction of our management and associates from other opportunities and challenges due to integration issues;
|
|
•
|
difficulty integrating the acquired or partner company’s accounting, management information, and other administrative systems;
|
|
•
|
difficulty managing joint ventures with our partners, potential litigation with joint venture partners, and reliance upon joint ventures that we do not control;
|
|
•
|
inability to retain key technical and managerial personnel of the acquired business;
|
|
•
|
inability to retain key customers, vendors, and other business partners of the acquired business;
|
|
•
|
inability to achieve the financial and strategic goals for the acquired and combined businesses, as a result of insufficient capital resources or otherwise;
|
|
•
|
incurring acquisition-related costs or amortization costs for acquired intangible assets that could impact our operating results;
|
|
•
|
potential impairment of our relationships with our associates, customers, partners, distributors, or third-party providers of products or technologies;
|
|
•
|
potential failure of the due diligence processes to identify significant issues with product quality, legal and financial liabilities, among other things;
|
|
•
|
potential inability to assert that internal controls over financial reporting are effective;
|
|
•
|
potential inability to obtain, or obtain in a timely manner, approvals from governmental authorities, which could delay or prevent such acquisitions; and
|
|
•
|
potential delay in customer purchasing decisions due to uncertainty about the direction of our product offerings.
|
Mergers and acquisitions of companies are inherently risky, and ultimately, if we do not complete the integration of acquired businesses successfully and in a timely manner, we may not realize the anticipated benefits of the acquisitions to the extent anticipated, which could adversely affect our business, financial condition, or results of operations. In addition, we may seek to dispose of our interests in acquired companies, project pipelines, products, or technologies. We may not recover our initial investment in such interests, in part or at all, which could adversely affect our business, financial condition, or results of operations.
Our future success depends on our ability to retain our key associates and to successfully integrate them into our management team.
We are dependent on the services of our executive officers and other members of our senior management team. The loss of one or more of these key associates or any other member of our senior management team could have a material adverse effect on our business. We may not be able to retain or replace these key associates and may not have adequate succession plans in place. Several of our current key associates including our executive officers are subject to employment conditions or arrangements that contain post-employment non-competition provisions. However, these arrangements permit the associates to terminate their employment with us upon little or no notice.
41
If we are unable to attract, train, and retain key personnel, our business may be materially and adversely affected.
Our future success depends, to a significant extent, on our ability to attract, train, and retain management, operations, sales, training, and technical personnel, including personnel in foreign jurisdictions. Recruiting and retaining capable personnel, particularly those with expertise in the PV solar industry across a variety of technologies, are vital to our success. There is substantial competition for qualified technical personnel, and while we continue to benchmark our organization against the broad spectrum of business in our market space to remain economically competitive, there can be no assurances that we will be able to attract and retain our technical personnel. If we are unable to attract and retain qualified associates, or otherwise experience unexpected labor disruptions within our business, we may be materially and adversely affected.
We may be exposed to infringement or misappropriation claims by third parties, which, if determined adversely to us, could cause us to pay significant damage awards or prohibit us from the manufacture and sale of our solar modules or the use of our technology.
Our success depends largely on our ability to use and develop our technology and know-how without infringing or misappropriating the intellectual property rights of third parties. The validity and scope of claims relating to PV solar technology patents involve complex scientific, legal, and factual considerations and analysis and, therefore, may be highly uncertain. We may be subject to litigation involving claims of patent infringement or violation of intellectual property rights of third parties. The defense and prosecution of intellectual property suits, patent opposition proceedings, and related legal and administrative proceedings can be both costly and time consuming and may significantly divert the efforts and resources of our technical and management personnel. An adverse determination in any such litigation or proceedings to which we may become a party could subject us to significant liability to third parties, require us to seek licenses from third parties, which may not be available on reasonable terms, or at all, or pay ongoing royalties, require us to redesign our solar modules, or subject us to injunctions prohibiting the manufacture and sale of our solar modules or the use of our technologies. Protracted litigation could also result in our customers or potential customers deferring or limiting their purchase or use of our solar modules until the resolution of such litigation.
Currency translation and transaction risk may negatively affect our results of operations.
Although our reporting currency is the U.S. dollar, we conduct certain business and incur costs in the local currency of most countries in which we operate. As a result, we are subject to currency translation and transaction risk. For example, certain of our net sales in
2018
were denominated in foreign currencies, such as
Japanese yen and Indian rupees
, and we expect to continue to have net sales denominated in foreign currencies in the future. Joint ventures or other business arrangements with strategic partners outside of the United States have involved, and in the future may involve, significant investments denominated in local currencies. Changes in exchange rates between foreign currencies and the U.S. dollar could affect our results of operations and result in exchange gains or losses. We cannot accurately predict the impact of future exchange rate fluctuations on our results of operations.
We could also expand our business into emerging markets, many of which have an uncertain regulatory environment relating to currency policy. Conducting business in such emerging markets could cause our exposure to changes in exchange rates to increase, due to the relatively high volatility associated with emerging market currencies and potentially longer payment terms for our proceeds.
Our ability to hedge foreign currency exposure is dependent on our credit profile with the banks that are willing and able to do business with us. Deterioration in our credit position or a significant tightening of the credit market conditions could limit our ability to hedge our foreign currency exposures; and therefore, result in exchange gains or losses.
42
Our largest stockholder has significant influence over us and his interests may conflict with or differ from interests of other stockholders.
Our largest stockholder, Lukas T. Walton (the “Significant Stockholder”), owned approximately
21%
of our outstanding common stock as of
December 31, 2018
. As a result, the Significant Stockholder has substantial influence over all matters requiring stockholder approval, including the election of our directors and the approval of significant corporate transactions such as mergers, tender offers, and the sale of all or substantially all of our assets. The interests of the Significant Stockholder could conflict with or differ from interests of other stockholders. For example, the concentration of ownership held by the Significant Stockholder could delay, defer, or prevent a change of control of our company or impede a merger, takeover, or other business combination, which other stockholders may view favorably.
If our long-lived assets or project related assets become impaired, we may be required to record significant charges to earnings.
We may be required to record significant charges to earnings should we determine that our long-lived assets or project related assets are impaired. Such charges may have a material impact on our financial position and results of operations. We review long-lived and project related assets for impairment whenever events or changes in circumstances indicate that the carrying amount of such assets may not be recoverable. We consider a project commercially viable or recoverable if it is anticipated to be sold for a profit once it is either fully developed or fully constructed or if the expected operating cash flows from future power generation exceed the cost basis of the asset. If our projects are not considered commercially viable, we would be required to impair the respective assets.
Unanticipated changes in our tax provision, the enactment of new tax legislation, or exposure to additional income tax liabilities could affect our profitability.
We are subject to income taxes in the jurisdictions in which we operate. In December 2017, the United States enacted the Tax Act. The changes included in the Tax Act are broad and complex, and the final effects of the Tax Act may differ from the amounts provided elsewhere in this Annual Report on Form 10-K, possibly materially, due to, among other things, changes in regulations related to the Tax Act, any legislative action to address questions that arise because of the Tax Act, any changes in accounting standards for income taxes or related interpretations in response to the Tax Act, or actions we may take as a result of the Tax Act. Additionally, longstanding international tax laws that determine each country’s jurisdictional tax rights in cross-border international trade continue to evolve as a result of the base erosion and profit shifting reporting requirements recommended by the OECD. As these and other tax laws and regulations change, our business, financial condition, and results of operations could be adversely affected.
We are subject to potential tax examinations in various jurisdictions, and taxing authorities may disagree with our interpretations of U.S. and foreign tax laws and may assess additional taxes. We regularly assess the likely outcomes of these examinations in order to determine the appropriateness of our tax provision; however, the outcome of tax examinations cannot be predicted with certainty. Therefore, the amounts ultimately paid upon resolution of such examinations could be materially different from the amounts previously included in our income tax provision, which could have a material impact on our results of operations and cash flows.
In addition, our future effective tax rate could be adversely affected by changes to our operating structure, losses of tax holidays, changes in the jurisdictional mix of earnings among countries with tax holidays or differing statutory tax rates, changes in the valuation of deferred tax assets and liabilities, changes in tax laws, and the discovery of new information in the course of our tax return preparation process. Any changes in our effective tax rate may materially and adversely impact our results of operations.
43
Cyber-attacks or other breaches of our information systems, or those of third parties with which we do business, could have a material adverse effect on our business, financial condition, and results of operations.
Our operations rely on our computer systems, hardware, software, and networks, as well as those of third parties with which we do business, to securely process, store, and transmit proprietary, confidential, and other information, including intellectual property. We also rely heavily on these information systems to operate our manufacturing lines and PV solar power plants. These information systems may be compromised by cyber-attacks, computer viruses, and other events that could be materially disruptive to our business operations and could put the security of our information, and that of the third parties with which we do business, at risk of misappropriation or destruction. In recent years, such cyber incidents have become increasingly frequent and sophisticated, targeting or otherwise affecting a wide range of companies. While we have instituted security measures to minimize the likelihood and impact of a cyber incident, there is no assurance that these measures, or those of the third parties with which we do business, will be adequate in the future. If these measures fail, valuable information may be lost; our manufacturing, development, construction, O&M, and other operations may be disrupted; we may be unable to fulfill our customer obligations; and our reputation may suffer. For example, any cyber incident affecting our automated manufacturing lines could adversely affect our ability to produce solar modules or otherwise affect the quality and performance of the modules produced. We may also be subject to litigation, regulatory action, remedial expenses, and financial losses beyond the scope or limits of our insurance coverage. These consequences of a failure of security measures could, individually or in the aggregate, have a material adverse effect on our business, financial condition, and results of operations.
Changes in, or any failure to comply with, privacy laws, regulations, and standards may adversely affect our business.
Personal privacy and data security have become significant issues in the United States, Europe, and in many other jurisdictions in which we operate. The regulatory framework for privacy and security issues worldwide is rapidly evolving and is likely to remain uncertain for the foreseeable future. Furthermore, federal, state, or foreign government bodies or agencies have in the past adopted, and may in the future adopt, laws and regulations affecting data privacy, all of which may be subject to invalidation by relevant foreign judicial bodies. Industry organizations also regularly adopt and advocate for new standards in this area.
In the United States, these include rules and regulations promulgated or pending under the authority of federal agencies, state attorneys general, legislatures, and consumer protection agencies. Internationally, many jurisdictions in which we operate have established their own data security and privacy legal framework with which we, relevant suppliers, and customers must comply. For example, the General Data Protection Regulation, a broad-based data privacy regime enacted by the European Parliament, which became effective in May 2018, imposes new requirements on how we collect, process, transfer, and store personal data, and also imposes additional obligations, potential penalties, and risk upon our business. In many jurisdictions, enforcement actions and consequences for noncompliance are also rising. In addition to government regulation, privacy advocates and industry groups may propose new and different self-regulatory standards that either legally or contractually apply to us. Although we have implemented policies, procedures, and, in certain cases, contractual arrangements designed to facilitate compliance with applicable privacy and data security laws and standards, any inability or perceived inability to adequately address privacy and security concerns, even if unfounded, or comply with applicable privacy and data security laws, regulations, and policies, could result in additional fines, costs, and liabilities to us, damage our reputation, inhibit sales, and adversely affect our business.
Our credit agreements contain covenant restrictions that may limit our ability to operate our business.
We may be unable to respond to changes in business and economic conditions, engage in transactions that might otherwise be beneficial to us, and obtain additional financing, if needed, because the senior secured credit facility made available under our amended and restated credit agreement with several financial institutions as lenders and JPMorgan Chase Bank, N.A. as administrative agent (the “Revolving Credit Facility”) and certain of our project financing arrangements contain, and other future debt agreements may contain, covenant restrictions that limit our ability to, among other things:
44
|
•
|
incur additional debt, assume obligations in connection with letters of credit, or issue guarantees;
|
|
•
|
create liens;
|
|
•
|
enter into certain transactions with our affiliates;
|
|
•
|
sell certain assets; and
|
|
•
|
declare or pay dividends, make other distributions to stockholders, or make other restricted payments.
|
Under our Revolving Credit Facility and certain of our project financing arrangements, we are also subject to certain financial covenants. Our ability to comply with covenants under our credit agreements is dependent on our future performance or the performance of specifically financed projects, which will be subject to many factors, some of which are beyond our control, including prevailing economic conditions. In addition, our failure to comply with these covenants could result in a default under these agreements and any of our other future debt agreements, which if not cured or waived, could permit the holders thereof to accelerate such debt and could cause cross-defaults under our other facility agreements and the possible acceleration of debt under such agreements, as well as cross-defaults under certain of our key project and operational agreements and could also result in requirements to post additional security instruments to secure future obligations. In addition, certain events that occur within the Company, or in the industry or the economy as a whole, may constitute material adverse effects under these agreements. If it is determined that a material adverse effect has occurred, the lenders can, under certain circumstances, restrict future borrowings or accelerate the due date of outstanding amounts. If any of our debt is accelerated, we may not have sufficient funds available to repay such debt and may experience cross-defaults under our other debt or operational agreements, which could materially and adversely affect our business, financial condition, and results of operations.
Item 1B.
Unresolved Staff Comments
None.
Item 2.
Properties
As of
December 31, 2018
, our principal properties consisted of the following:
|
Nature
|
Primary Segment(s) Using Property
|
Location
|
Held
|
|||
|
Corporate headquarters
|
Modules & Systems
|
Tempe, Arizona, United States
|
Lease
|
|||
|
Manufacturing plant, R&D facility, and administrative offices (1)
|
Modules
|
Perrysburg, Ohio, United States
|
Own
|
|||
|
Administrative offices
|
Systems
|
San Francisco, California, United States
|
Lease
|
|||
|
R&D facility
|
Modules & Systems
|
Santa Clara, California, United States
|
Lease
|
|||
|
Manufacturing plant and administrative offices
|
Modules
|
Kulim, Kedah, Malaysia
|
Lease land, own buildings
|
|||
|
Administrative offices
|
Modules & Systems
|
Georgetown, Penang, Malaysia
|
Lease
|
|||
|
Manufacturing plant
|
Modules
|
Ho Chi Minh City, Vietnam
|
Lease land, own buildings
|
|||
|
Manufacturing plant (2)
|
Modules
|
Frankfurt/Oder, Germany
|
Own
|
|||
——————————
|
(1)
|
Includes our manufacturing plant located in Lake Township, Ohio, a short distance from our plant in Perrysburg, Ohio.
|
|
(2)
|
In December 2012, we ceased manufacturing at our German plant. Since its closure, we have continued to market such property for sale.
|
In addition, we lease small amounts of office and warehouse space in several other U.S. and international locations.
45
Item 3.
Legal Proceedings
See Note 15. “Commitments and Contingencies – Legal Proceedings”
to our consolidated financial statements for information regarding legal proceedings and related matters.
Item 4.
Mine Safety Disclosures
None.
PART II
Item 5.
Market for Registrant’s Common Equity, Related Stockholder
Matters, and Issuer Purchases of Equity Securities
Market Information
Our common stock is listed on The Nasdaq Stock Market LLC under the symbol FSLR.
Holders
As of
February 15, 2019
, there were
48
record holders of our common stock, which does not reflect beneficial owners of our shares.
Dividend Policy
We have never paid and do not expect to pay dividends on our common stock for the foreseeable future. Furthermore, our Revolving Credit Facility imposes restrictions on our ability to declare or pay dividends. The declaration and payment of dividends is subject to the discretion of our board of directors and depends on various factors, including our net income, financial condition, cash requirements, and future prospects as well as the restrictions under our Revolving Credit Facility and other factors considered relevant by our board of directors. We expect to prioritize our working capital requirements, capacity expansion and other capital expenditure needs, project development and construction, and merger and acquisition opportunities prior to returning capital to our shareholders.
Stock Price Performance Graph
The following graph compares the five-year cumulative total return on our common stock relative to the cumulative total returns of the S&P 500 Index and the Invesco Solar ETF, which represents a peer group of solar companies. In the stock price performance graph included below, an investment of $100 (with reinvestment of all dividends) is assumed to have been made in our common stock, the S&P 500 Index, and the Invesco Solar ETF on December 31, 2013, and its relative performance is tracked through
December 31, 2018
. This performance graph is not “soliciting material,” is not deemed filed with the SEC, and is not to be incorporated by reference in any filing by us under the Securities Act or the Exchange Act, whether made before or after the date hereof, and irrespective of any general incorporation language in any such filing. The stock price performance shown on the graph represents past performance and should not be considered an indication of future price performance.
46
COMPARISON OF FIVE-YEAR CUMULATIVE TOTAL RETURN*
Among First Solar, the S&P 500 Index,
and the Invesco Solar ETF**
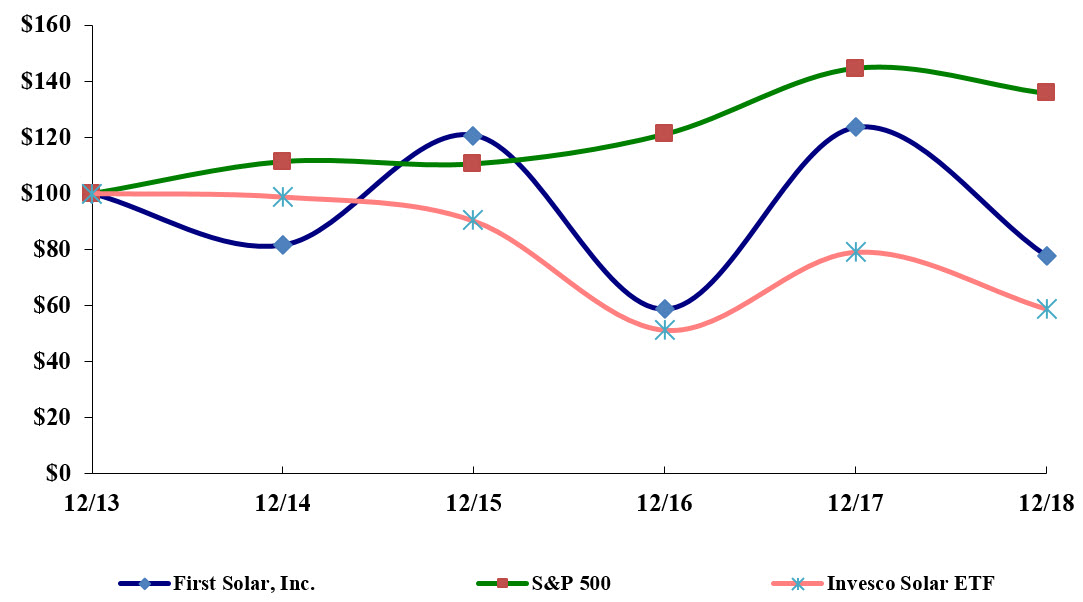
——————————
|
*
|
$100 invested on December 31, 2013 in stock or index, including reinvestment of dividends. Index calculated on a month-end basis.
|
|
**
|
In May 2018, the Guggenheim Solar ETF was reorganized into the Invesco Solar ETF subsequent to Invesco Ltd.’s acquisition of Guggenheim Capital LLC’s exchange-traded funds business. The ticker symbol and index did not change as a result of the reorganization.
|
Recent Sales of Unregistered Securities
None.
Purchases of Equity Securities by the Issuer and Affiliate Purchases
None.
47
Item 6.
Selected Financial Data
The following tables set forth our selected financial data for the periods and at the dates indicated. The selected financial data from the consolidated statements of operations and consolidated statements of cash flows for the years ended
December 31, 2018
,
2017
, and
2016
and the selected financial data from the consolidated balance sheets as of
December 31, 2018
and
2017
have been derived from the audited consolidated financial statements included in this Annual Report on Form 10-K. The selected financial data from the consolidated statements of operations and consolidated statements of cash flows for the years ended December 31, 2015 and 2014 and the selected financial data from the consolidated balance sheets as of
December 31, 2016
, 2015, and 2014 have been derived from audited consolidated financial statements not included in this Annual Report on Form 10-K. The information presented below should also be read in conjunction with our consolidated financial statements and the related notes thereto and Item 7. “Management’s Discussion and Analysis of Financial Condition and Results of Operations.”
|
|
Years Ended December 31,
|
|||||||||||||||||||
|
2018
|
2017
|
2016
|
2015
|
2014
|
||||||||||||||||
|
(In thousands, except per share amounts)
|
||||||||||||||||||||
|
Net sales
|
$
|
2,244,044
|
|
$
|
2,941,324
|
|
$
|
2,904,563
|
|
$
|
4,112,650
|
|
$
|
3,391,187
|
|
|||||
|
Gross profit
|
392,177
|
|
548,947
|
|
638,418
|
|
1,132,762
|
|
824,941
|
|
||||||||||
|
Operating income (loss)
|
40,113
|
|
177,851
|
|
(568,151
|
)
|
730,159
|
|
421,999
|
|
||||||||||
|
Net income (loss)
|
144,326
|
|
(165,615
|
)
|
(416,112
|
)
|
593,406
|
|
395,964
|
|
||||||||||
|
Net income (loss) per share:
|
|
|
|
|
|
|
|
|
|
|
||||||||||
|
Basic
|
$
|
1.38
|
|
$
|
(1.59
|
)
|
$
|
(4.05
|
)
|
$
|
5.88
|
|
$
|
3.96
|
|
|||||
|
Diluted
|
$
|
1.36
|
|
$
|
(1.59
|
)
|
$
|
(4.05
|
)
|
$
|
5.83
|
|
$
|
3.90
|
|
|||||
|
Cash dividends declared per common share
|
$
|
—
|
|
$
|
—
|
|
$
|
—
|
|
$
|
—
|
|
$
|
—
|
|
|||||
|
|
|
|
|
|
||||||||||||||||
|
Net cash (used in) provided by operating activities
|
$
|
(326,809
|
)
|
$
|
1,340,677
|
|
$
|
206,753
|
|
$
|
(325,209
|
)
|
$
|
735,516
|
|
|||||
|
Net cash (used in) provided by investing activities
|
(682,714
|
)
|
(626,802
|
)
|
144,520
|
|
(156,177
|
)
|
(387,818
|
)
|
||||||||||
|
Net cash provided by (used in) financing activities
|
255,228
|
|
192,045
|
|
(136,393
|
)
|
101,207
|
|
(46,907
|
)
|
||||||||||
|
December 31,
|
||||||||||||||||||||
|
2018
|
2017
|
2016
|
2015
|
2014
|
||||||||||||||||
|
(In thousands)
|
||||||||||||||||||||
|
Cash and cash equivalents
|
$
|
1,403,562
|
|
$
|
2,268,534
|
|
$
|
1,347,155
|
|
$
|
1,126,826
|
|
$
|
1,482,054
|
|
|||||
|
Marketable securities
|
1,143,704
|
|
720,379
|
|
607,991
|
|
703,454
|
|
509,032
|
|
||||||||||
|
Total assets
|
7,121,362
|
|
6,864,501
|
|
6,824,368
|
|
7,360,392
|
|
6,720,991
|
|
||||||||||
|
Total long-term debt
|
466,791
|
|
393,540
|
|
188,388
|
|
289,415
|
|
213,473
|
|
||||||||||
|
Total liabilities
|
1,908,959
|
|
1,765,804
|
|
1,606,019
|
|
1,741,996
|
|
1,729,504
|
|
||||||||||
|
Total stockholders’ equity
|
5,212,403
|
|
5,098,697
|
|
5,218,349
|
|
5,618,396
|
|
4,991,487
|
|
||||||||||
Item 7.
Management’s Discussion and Analysis of Financial Condition and
Results of Operations
The following discussion and analysis of our financial condition and results of operations should be read in conjunction with our consolidated financial statements and the related notes thereto included in this Annual Report on Form 10-K. In addition to historical financial information, the following discussion and analysis contains forward-looking statements that involve risks, uncertainties, and assumptions as described under the “Note Regarding Forward-Looking Statements” that appears earlier in this Annual Report on Form 10-K. Our actual results could differ materially from those anticipated by these forward-looking statements as a result of many factors, including those discussed under Item 1A. “Risk Factors,” and elsewhere in this Annual Report on Form 10-K.
48
Executive Overview
We are a leading global provider of comprehensive PV solar energy solutions. We design, manufacture, and sell PV solar modules with an advanced thin film semiconductor technology and also develop, design, construct, and sell PV solar power systems that primarily use the modules we manufacture. Additionally, we provide O&M services to system owners. We have substantial, ongoing R&D efforts focused on module and system-level innovations. We are the world’s largest thin film PV solar module manufacturer and one of the world’s largest PV solar module manufacturers.
Certain of our financial results and other key operational developments for the year ended
December 31, 2018
include the following:
|
•
|
Net sales for
2018
decreased
by
24%
to
$2.2 billion
compared to
$2.9 billion
in
2017
. The
decrease
in net sales was primarily attributable to the sale of the Moapa and Switch Station projects in
2017
, which were substantially complete when we entered into the associated sales contracts with the customers, the sale of the California Flats project in 2017 relative to revenue recognized on the project in
2018
from ongoing construction activities, and a decrease in third-party module sales, partially offset by the sale of the Willow Springs, Rosamond, Mashiko, Manildra, and certain India projects in
2018
, and the completion of substantially all construction activities on the Balm Solar, Payne Creek, and Grange Hall projects in
2018
.
|
|
•
|
Gross profit
decreased
1.2 percentage points
to
17.5%
during
2018
from
18.7%
during
2017
primarily due to higher under-utilization and certain other charges associated with the initial ramp of Series 6 manufacturing lines and a reduction to our product warranty liability in
2017
due to lower legacy module replacement costs, partially offset by the mix of higher gross profit projects sold during the period and the settlement of a tax examination with the state of California, which affected our estimates of sales and use taxes due for certain projects.
|
|
•
|
During
2018
, we commenced commercial production of Series 6 modules at our manufacturing facilities in Perrysburg, Ohio; Kulim, Malaysia; and Ho Chi Minh City, Vietnam, bringing our total installed annual nameplate production capacity across all our facilities to
5.0 GW
DC
. In early 2019, we commenced commercial production at our second manufacturing facility in Ho Chi Minh City, Vietnam.
|
|
•
|
We produced
2.7 GW
DC
of solar modules during
2018
, which represented an
18%
increase
from
2017
. The
increase
in production was primarily driven by the incremental Series 6 production capacity added in
2018
, partially offset by the ramp down of certain Series 4 production lines. We expect to produce between
5.2 GW
DC
and
5.5 GW
DC
of solar modules during 2019, including approximately
2 GW
DC
of Series 4 modules.
|
Market Overview
The solar industry continues to be characterized by intense pricing competition, both at the module and system levels. In particular, module average selling prices in global markets have experienced an accelerated decline in recent years and are expected to continue to decline to some degree in the future. In the aggregate, we believe manufacturers of solar cells and modules have significant installed production capacity, relative to global demand, and the ability for additional capacity expansion. We believe the solar industry may from time to time experience periods of structural imbalance between supply and demand (i.e., where production capacity exceeds global demand), and that such periods will continue to put pressure on pricing. We believe the solar industry is currently in such a period, due in part to recent developments in China, which include feed-in-tariff reductions causing deferment of in-country project development. Additionally, intense competition at the system level may result in an environment in which pricing falls rapidly, thereby further increasing demand for solar energy solutions but constraining the ability for project developers, EPC companies, and vertically-integrated companies such as First Solar to sustain meaningful and consistent profitability. In light of such market realities, we are focusing on our strategies and points of differentiation, which include our advanced module and system technologies, our manufacturing process, our vertically-integrated business model, our financial viability, and the sustainability advantage of our modules and systems.
49
Global solar markets continue to expand and develop, in part aided by demand elasticity resulting from declining industry average selling prices, both at the module and system levels, which make solar energy more affordable. We are developing, constructing, and operating multiple solar projects around the world as we continue to execute on our advanced-stage utility-scale project pipeline. We expect a significant portion of our future consolidated net sales, operating income, and cash flows to be derived from such projects. We also continue to develop our early-to-mid-stage project pipeline and evaluate acquisitions of projects to further expand both our early-to-mid-stage and advanced-stage pipelines. See the tables under “Management’s Discussion and Analysis of Financial Condition and Results of Operations – Systems Project Pipeline” for additional information about projects within our advanced-stage pipeline.
Lower industry module and system pricing, which presents challenges for certain module manufacturers (particularly manufacturers with higher cost structures), is expected to continue to contribute to diversification in global electricity generation and further demand for solar energy solutions. Over time, we believe that solar energy generation will experience widespread adoption as it competes economically with traditional forms of energy generation. In the near term, however, declining average selling prices are expected to adversely affect our results of operations. If competitors reduce pricing to levels below their costs; bid aggressively low prices for module sale agreements, EPC agreements, and PPAs; or are able to operate at minimal or negative operating margins for sustained periods of time, our results of operations could be further adversely affected. In certain markets in California and elsewhere, an oversupply imbalance at the grid level may further reduce short-to-medium term demand for new solar installations relative to prior years, lower PPA pricing, and lower margins on module and system sales to such markets. However, the effects of such imbalance can be mitigated by modern solar power plants that offer a flexible operating profile, thereby promoting greater grid stability and enabling a higher penetration of solar energy. We continue to mitigate these uncertainties in part by executing on our module technology improvements, including our transition to Series 6 module manufacturing, continuing the development of key markets, partnering with grid operators and utility companies, and implementing certain other cost reduction initiatives, including both manufacturing, BoS, and other operating costs.
We face intense competition from manufacturers of crystalline silicon solar modules and developers of solar power projects. Solar module manufacturers compete with one another on price and on several module value attributes, including wattage (or conversion efficiency), energy yield, and reliability, and developers of systems compete on various factors such as net present value, return on equity, and LCOE, meaning the net present value of a system’s total life cycle costs divided by the quantity of energy that is expected to be produced over the system’s life. Many crystalline silicon cell and wafer manufacturers continue to transition from lower efficiency BSF multi-crystalline cells (the legacy technology against which we have generally competed in our markets) to higher efficiency PERC multi-crystalline and mono-crystalline cells at competitive cost structures. Additionally, while conventional solar modules, including the solar modules we produce, are monofacial, meaning their ability to produce energy is a function of direct and diffuse irradiance on their front side, certain manufacturers of mono-crystalline PERC modules are pursuing the commercialization of bifacial modules that also capture diffuse irradiance on the back side of a module. We believe the cost effective manufacture of bifacial PERC modules is being enabled, in part, by the expansion of inexpensive crystal growth and diamond wire saw capacity in China. Bifaciality compromises nameplate efficiency, but by converting both front and rear side irradiance, such technology may improve the overall energy production of a module relative to nameplate efficiency when applied in certain applications, which, after considering the incremental BoS costs, could potentially lower the overall LCOE of a system when compared to systems using conventional solar modules, including the modules we produce.
We believe we are among the lowest cost module manufacturers in the solar industry on a module cost per watt basis, based on publicly available information. This cost competitiveness allows us to compete favorably in markets where pricing for modules and fully integrated PV solar power systems is highly competitive. Our cost competitiveness is based in large part on our module conversion efficiency, proprietary manufacturing technology (which enables us to produce a CdTe module in less than
3.5
hours using a continuous and highly automated industrial manufacturing process, as opposed to a batch process), and our focus on operational excellence. In addition, our CdTe modules use approximately
1-2%
of the amount of semiconductor material that is used to manufacture conventional crystalline silicon solar modules. The cost of polysilicon is a significant driver of the manufacturing cost of crystalline silicon solar modules, and the timing and rate of change in the cost of silicon feedstock and polysilicon could lead to changes in solar module pricing
50
levels. Polysilicon costs have declined in recent years, and polysilicon consumption per cell has been reduced through various initiatives, such as the adoption of diamond wire saw technology, contributing to a decline in our relative manufacturing cost competitiveness over conventional crystalline silicon module manufacturers.
Given the smaller size (sometimes referred to as form factor) of our Series 4 modules compared to certain types of crystalline silicon modules, we may incur higher labor and BoS costs associated with the construction of systems using our Series 4 modules. Thus, to compete effectively on an LCOE basis, our Series 4 modules may need to maintain a certain cost advantage per watt compared to crystalline silicon-based modules with larger form factors. Our next generation Series 6 modules have a larger form factor along with better product attributes and a lower manufacturing cost structure. Accordingly, the larger form factor and design of our Series 6 modules is expected to reduce the number of electrical connections, hardware, and labor required for system installation compared to current module technologies, including our Series 4 modules. The resulting cost savings are expected to improve project returns as BoS and labor costs represent a significant portion of the overall costs associated with the construction of a typical utility-scale system.
In terms of energy yield, in many climates, our CdTe modules provide a significant energy production advantage over most conventional crystalline silicon solar modules (including BSF and PERC technologies) of equivalent efficiency rating. For example, our CdTe solar modules provide a superior temperature coefficient, which results in stronger system performance in typical high insolation climates as the majority of a system’s generation, on average, occurs when module temperatures are well above 25°C (standard test conditions). In addition, our CdTe modules provide a superior spectral response in humid environments where atmospheric moisture alters the solar spectrum relative to laboratory standards. Our CdTe solar modules also provide a better shading response than conventional crystalline silicon solar modules, which may lose up to three times as much power as CdTe solar modules when shading occurs. As a result of these and other factors, our PV solar power systems typically produce more annual energy in real world field conditions than competing systems with the same nameplate capacity.
While our modules and systems are generally competitive in cost, reliability, and performance attributes, there can be no guarantee such competitiveness will continue to exist in the future to the same extent or at all. Any declines in the competitiveness of our products could result in additional margin compression, further declines in the average selling prices of our modules and systems, erosion in our market share for modules and systems, and/or declines in overall net sales. We continue to focus on enhancing the competitiveness of our solar modules and systems by accelerating progress along our module technology and cost reduction roadmaps, continuing to make technological advances at the system level, using innovative installation techniques and know-how, and leveraging volume procurement around standardized hardware platforms.
Certain Trends and Uncertainties
We believe that our operations may be favorably or unfavorably impacted by the following trends and uncertainties that may affect our financial condition and results of operations. See Item 1A. “Risk Factors” and elsewhere in this Annual Report on Form 10-K for a discussion of other risks that may affect our financial condition and results of operations.
Our long-term strategic plans are focused on our goal to create long-term shareholder value through a balance of growth, profitability, and liquidity. In executing such plans, we are focusing on providing utility-scale PV solar energy solutions using our modules in key geographic markets that we believe have a compelling need for mass-scale PV electricity, including markets throughout the Americas, the Asia-Pacific region, Europe, and certain other strategic markets. Additionally, we are focusing on opportunities in which our PV solar energy solutions can compete directly with traditional forms of energy generation on an LCOE or similar basis, or complement such generation offerings. Our focus on our core module and utility-scale offerings exists within a current market environment that includes rooftop and distributed generation solar, particularly in the United States. While it is unclear how rooftop and distributed generation solar might impact our core utility-scale based offerings in the next several years, we believe that utility-scale solar will continue to be a compelling solar offering for companies with technology and cost leadership and will continue to represent an increasing portion of the overall electricity generation mix. Additionally, our ability to provide
51
utility-scale offerings on economically attractive terms depends, in part, on certain market factors outside of our control, such as interest rate fluctuations, domestic or international trade policies, and government support programs. Adverse changes in these factors could increase the cost of utility-scale systems, which could reduce demand for such systems and limit the number of potential buyers.
We are closely evaluating and managing the appropriate level of resources required as we pursue the most advantageous and cost effective projects and partnerships in our key markets. We have dedicated, and intend to continue to dedicate, significant capital and human resources to reduce the total installed cost of PV solar energy, to optimize the design and logistics around our PV solar energy solutions, and to ensure that our solutions integrate well into the overall electricity ecosystem of each specific market. We expect that, over time, the majority of our consolidated net sales, operating income, and cash flows will come from solar offerings in the key geographic markets described above. The timing, execution, and financial impacts of our long-term strategic plans are subject to risks and uncertainties, as described in Item 1A. “Risk Factors,” and elsewhere in this Annual Report on Form 10-K. We are focusing our resources in those markets and energy applications in which solar power can be a least-cost, best-fit energy solution, particularly in regions with significant current or projected electricity demand, relatively high existing electricity prices, strong demand for renewable energy generation, and high solar resources.
Creating or maintaining a market position in certain strategically targeted markets and energy applications also requires us to adapt to new and changing market conditions. For example, our offerings from time to time may need to be competitively priced at levels associated with minimal gross profit margins, which may adversely affect our results of operations. We expect the profitability associated with our various sales offerings to vary from one another over time, and possibly vary from our internal long-range profitability expectations and targets, depending on the market opportunity and the relative competitiveness of our offerings compared with other energy solutions, traditional or otherwise, that are available to potential customers. In addition, as we execute on our long-term strategic plans, we will continue to monitor and adapt to any changing dynamics in emerging technologies, such as commercially viable energy storage solutions, which are expected to further enable PV solar power systems to compete with traditional forms of energy generation by shifting the delivery of energy generated by such systems to periods of greater demand. Storage solutions continue to evolve in terms of technology and cost, and cumulative global deployments of storage capacity are expected to exceed
900 GW
DC
by 2040, representing a significant increase in the potential market for renewable energy. We will also continue to monitor and adapt to changing dynamics in the market set of potential buyers of solar projects. Market environments with few potential project buyers and a higher cost of capital would generally exert downward pressure on the potential revenue from the solar projects we are developing, whereas, conversely, market environments with many potential project buyers and a lower cost of capital would likely have a favorable impact on the potential revenue from such solar projects.
On occasion, we may temporarily own and operate certain systems with the intention to sell them at a later date. We may also enter into business arrangements with strategic partners that result in us temporarily retaining an ownership interest in the underlying systems projects we develop, supply modules to, or construct, potentially for a period of up to several years. In these situations, we may retain such ownership interests in a consolidated or unconsolidated separate entity. We may also elect to construct and temporarily retain ownership interests in partially contracted or uncontracted systems for which there is a partial or no PPA with an off-taker, such as a utility, but rather an intent to sell a portion or all of the electricity produced by the system on an open contract basis until the system is sold. Expected revenue from projects without a PPA for the full offtake of the system is subject to greater variability and uncertainty based on market factors and is typically lower than projects with a PPA for the full offtake of the system. Furthermore, all system pricing is effected by the pricing of energy to be sold on an open contract basis following the termination of the PPA (i.e., merchant pricing curves), and changes in market assumptions regarding future open contract sales may also result in significant variability and uncertainty in the value of our systems projects.
We continually evaluate forecasted global demand, competition, and our addressable market and seek to effectively balance manufacturing capacity with market demand and the nature and extent of our competition. During 2018, we commenced commercial production of Series 6 modules at our manufacturing facilities in Perrysburg, Ohio; Kulim, Malaysia; and our previously idled manufacturing plant in Ho Chi Minh City, Vietnam. In early 2019, we commenced
52
commercial production at our second manufacturing facility in Ho Chi Minh City, Vietnam. We are also in the process of constructing an additional Series 6 manufacturing plant in Lake Township, Ohio, a short distance from our plant in Perrysburg, Ohio. These additional manufacturing plants, and any other potential investments to add or otherwise modify our existing manufacturing capacity in response to market demand and competition, may require significant internal and possibly external sources of liquidity, and may be subject to certain risks and uncertainties described in Item 1A. “Risk Factors,” including those described under the headings “
Our future success depends on our ability to effectively balance manufacturing production with market demand, convert existing production facilities to support new product lines, such as our transition to Series 6 module manufacturing, and, when necessary, continue to build new manufacturing plants over time in response to such demand and add production lines in a cost-effective manner, all of which are subject to risks and uncertainties
” and “
If any future production lines are not built in line with committed schedules, it may adversely affect our future growth plans. If any future production lines do not achieve operating metrics similar to our existing production lines, our solar modules could perform below expectations and cause us to lose customers.
”
Systems Project Pipeline
The following tables summarize, as of
February 21, 2019
, our approximately
2.6 GW
AC
advanced-stage project pipeline. The actual volume of modules installed in our projects will be greater than the project size in MW
AC
as module volumes required for a project are based upon MW
DC
, which will be greater than the MW
AC
size pursuant to a DC-AC ratio typically ranging from 1.2 to 1.3. Such ratio varies across different projects due to various system design factors. Projects are typically removed from our advanced-stage project pipeline tables below once we substantially complete construction of the project and after substantially all of the associated project revenue is recognized. Projects, or portions of projects, may also be removed from the tables below in the event an EPC-contracted or partner-developed project does not obtain permitting or financing, a project is not able to be sold due to the changing economics of the project or other factors, or we decide to temporarily own and operate, or retain interests in, such projects based on strategic opportunities or market factors.
Projects under Sales Agreements
(Includes uncompleted sold projects, projects under sales contracts subject to conditions precedent, and EPC agreements, including partner developed projects that we will be or are constructing.)
|
Project/Location
|
Project Size in MW
AC
|
PPA Contracted Partner
|
EPC Contract/Partner Developed Project
|
Expected Year Revenue Recognition Will Be Completed
|
% of Revenue Recognized as of December 31, 2018
|
||||||
|
Phoebe, Texas
|
250
|
|
Shell Energy North America
|
Innergix Renewable Energy
|
2019
|
12%
|
|||||
|
GA Solar 4, Georgia (1)
|
200
|
|
Georgia Power Company
|
Origis Energy USA
|
2020
|
11%
|
|||||
|
Rosamond, California
|
150
|
|
SCE
|
Clearway Energy Group
|
2019
|
57%
|
|||||
|
Willow Springs, California
|
100
|
|
SCE
|
D.E. Shaw Renewable Investments
|
2019
|
96%
|
|||||
|
Beryl, Australia
|
87
|
|
(2)
|
New Energy Solar
|
2019
|
—%
|
|||||
|
Grange Hall, Florida
|
61
|
|
(3)
|
Tampa Electric Company
|
2019
|
98%
|
|||||
|
Peace Creek, Florida
|
55
|
|
(3)
|
Tampa Electric Company
|
2019
|
70%
|
|||||
|
Troy Solar, Indiana
|
51
|
|
(3)
|
Southern Indiana Gas and Electric Company
|
2020
|
—%
|
|||||
|
Lake Hancock, Florida
|
50
|
|
(3)
|
Tampa Electric Company
|
2019
|
34%
|
|||||
|
Total
|
1,004
|
|
|||||||||
53
Projects with Executed PPAs Not under Sales Agreements
|
Project/Location
|
Project Size in MW
AC
|
PPA Contracted Partner
|
Fully Permitted
|
Expected or Actual Substantial Completion Year
|
% Complete as of December 31, 2018
|
||||||
|
Muscle Shoals, Alabama
|
227
|
|
Tennessee Valley Authority
|
No
|
2021
|
2%
|
|||||
|
Little Bear, California
|
160
|
|
Marin Clean Energy
|
No
|
2020
|
5%
|
|||||
|
Sun Streams, Arizona
|
150
|
|
SCE
|
Yes
|
2019
|
14%
|
|||||
|
Southwestern U.S.
|
150
|
|
(4)
|
Yes
|
2020/2021
|
4%
|
|||||
|
Luz del Norte, Chile
|
141
|
|
(5)
|
Yes
|
2016
|
100%
|
|||||
|
American Kings Solar, California
|
123
|
|
SCE
|
No
|
2020
|
16%
|
|||||
|
Cove Mountain Solar 2, Utah
|
122
|
|
PacifiCorp
|
No
|
2020
|
1%
|
|||||
|
Sunshine Valley, Nevada
|
100
|
|
SCE
|
Yes
|
2019
|
4%
|
|||||
|
Willow Springs 3, California
|
75
|
|
PG&E
|
Yes
|
2021
|
8%
|
|||||
|
Seabrook, South Carolina
|
73
|
|
South Carolina Electric and Gas Company
|
No
|
2019
|
3%
|
|||||
|
Sun Streams PVS, Arizona
|
65
|
|
APS
|
No
|
2020
|
2%
|
|||||
|
Ishikawa, Japan
|
59
|
|
Hokuriku Electric Power Company
|
Yes
|
2018
|
100%
|
|||||
|
Cove Mountain Solar 1, Utah
|
58
|
|
PacifiCorp
|
No
|
2020
|
1%
|
|||||
|
Japan (multiple locations)
|
44
|
|
(6)
|
No
|
2019/2020
|
9%
|
|||||
|
Miyagi, Japan
|
40
|
|
Tohoku Electric Power Company
|
Yes
|
2021
|
17%
|
|||||
|
India (multiple locations)
|
40
|
|
(7)
|
Yes
|
2017
|
100%
|
|||||
|
Total
|
1,627
|
|
|||||||||
——————————
|
(1)
|
Previously known as the Twiggs County Solar project
|
|
(2)
|
Approximately 55 MW
AC
of the plant’s capacity is contracted with Transport for NSW
|
|
(3)
|
Utility-owned generation
|
|
(4)
|
Contracted but not specified
|
|
(5)
|
Approximately 70 MW
AC
of the plant’s capacity is contracted under various PPAs
|
|
(6)
|
Tokyo Electric Power Company – 27 MW
AC
and Hokuriku Electric Power Company – 17 MW
AC
|
|
(7)
|
Gulbarga Electricity Supply Co. – 20 MW
AC
and Chamundeshwari Electricity Supply Co. – 20 MW
AC
|
54
Results of Operations
The following table sets forth our consolidated statements of operations as a percentage of net sales for the years ended
December 31, 2018
,
2017
, and
2016
:
|
|
Years Ended December 31,
|
||||||||
|
2018
|
2017
|
2016
|
|||||||
|
Net sales
|
100.0
|
%
|
100.0
|
%
|
100.0
|
%
|
|||
|
Cost of sales
|
82.5
|
%
|
81.3
|
%
|
78.0
|
%
|
|||
|
Gross profit
|
17.5
|
%
|
18.7
|
%
|
22.0
|
%
|
|||
|
Selling, general and administrative
|
7.9
|
%
|
6.9
|
%
|
9.0
|
%
|
|||
|
Research and development
|
3.8
|
%
|
3.0
|
%
|
4.3
|
%
|
|||
|
Production start-up
|
4.0
|
%
|
1.4
|
%
|
—
|
%
|
|||
|
Restructuring and asset impairments
|
—
|
%
|
1.3
|
%
|
25.6
|
%
|
|||
|
Goodwill impairment
|
—
|
%
|
—
|
%
|
2.6
|
%
|
|||
|
Operating income (loss)
|
1.8
|
%
|
6.0
|
%
|
(19.6
|
)%
|
|||
|
Foreign currency loss, net
|
—
|
%
|
(0.3
|
)%
|
(0.5
|
)%
|
|||
|
Interest income
|
2.7
|
%
|
1.2
|
%
|
0.9
|
%
|
|||
|
Interest expense, net
|
(1.2
|
)%
|
(0.9
|
)%
|
(0.7
|
)%
|
|||
|
Other income, net
|
1.8
|
%
|
0.8
|
%
|
1.4
|
%
|
|||
|
Income tax expense
|
(0.2
|
)%
|
(12.6
|
)%
|
(0.8
|
)%
|
|||
|
Equity in earnings, net of tax
|
1.5
|
%
|
0.1
|
%
|
5.0
|
%
|
|||
|
Net income (loss)
|
6.4
|
%
|
(5.6
|
)%
|
(14.3
|
)%
|
|||
Segment Overview
We operate our business in two segments. Our modules segment involves the design, manufacture, and sale of CdTe solar modules to third parties, and our systems segment includes the development, construction, operation, maintenance, and sale of PV solar power systems, including any modules installed in such systems and any revenue from energy generated by such systems.
See Note 22.
“Segment and Geographical Information
”
to our consolidated financial statements for more information on our operating segments. See also Item 7. “Management’s Discussion and Analysis of Financial Condition and Results of Operations – Systems Project Pipeline” for a description of the system projects in our advanced-stage project pipeline.
Net sales
Modules Business
We generally price and sell our solar modules per watt of nameplate power. During
2018
,
M.A. Mortenson Company
,
RCR O'Donnell Griffin Pty, Ltd
, and
Tampa Electric Company
each accounted for more than
10%
of our modules business net sales, and the majority of our solar modules were sold to integrators and operators of systems in the
United States
,
Australia
, and
France
. Substantially all of our modules business net sales during
2018
were denominated in U.S. dollars. We recognize revenue for module sales at a point in time following the transfer of control of the modules to the customer, which typically occurs upon shipment or delivery depending on the terms of the underlying contracts. The revenue recognition policies for module sales are further described in
Note 2. “Summary of Significant Accounting Policies”
to our consolidated financial statements.
55
Systems Business
During
2018
,
Tampa Electric Company
,
Capital Dynamics
,
Mitsui & Co.
,
D.E. Shaw
, and
IDFC Alternatives
each accounted for more than
10%
of our systems business net sales, and the majority of our systems business net sales were in the
United States
,
Japan
, and
India
. Substantially all of our systems business net sales during
2018
were denominated in U.S. dollars, Japanese yen, and Indian rupees. We typically recognize revenue for sales of solar power systems using cost based input methods, which result in revenue being recognized as work is performed based on the relationship between actual costs incurred compared to the total estimated costs for a given contract. We may also recognize revenue for the sale of a system after the project has been completed due to the timing of when we enter into the associated sales contract with the customer. The revenue recognition policies for our systems business are further described in
Note 2. “Summary of Significant Accounting Policies”
to our consolidated financial statements.
The following table shows net sales by reportable segment for the years ended
December 31, 2018
,
2017
, and
2016
:
|
|
Years Ended
|
Change
|
||||||||||||||||||||||||
|
(Dollars in thousands)
|
2018
|
2017
|
2016
|
2018 over 2017
|
2017 over 2016
|
|||||||||||||||||||||
|
Modules
|
$
|
502,001
|
|
$
|
806,398
|
|
$
|
675,452
|
|
$
|
(304,397
|
)
|
(38
|
)%
|
$
|
130,946
|
|
19
|
%
|
|||||||
|
Systems
|
1,742,043
|
|
2,134,926
|
|
2,229,111
|
|
(392,883
|
)
|
(18
|
)%
|
(94,185
|
)
|
(4
|
)%
|
||||||||||||
|
Net sales
|
$
|
2,244,044
|
|
$
|
2,941,324
|
|
$
|
2,904,563
|
|
$
|
(697,280
|
)
|
(24
|
)%
|
$
|
36,761
|
|
1
|
%
|
|||||||
Net sales
from our modules segment
decreased
by
$304.4 million
in
2018
primarily due to a
34%
decrease
in the volume of watts sold and a
6%
decrease
in the average selling price per watt. The decrease in the volume of watts sold in 2018 was driven by our transition to Series 6 manufacturing, which resulted in a temporary reduction in production capacity during the period. Net sales from our systems segment
decreased
by
$392.9 million
in
2018
primarily as a result of the sale of the Moapa and Switch Station projects in
2017
, which were substantially complete when we entered into the associated sales contracts with the customers, and the sale of the California Flats project in 2017 relative to revenue recognized on the project in
2018
from ongoing construction activities, partially offset by the sale of the Willow Springs, Rosamond, Mashiko, Manildra, and certain India projects in
2018
, and the completion of substantially all construction activities on the Balm Solar, Payne Creek, and Grange Hall projects in
2018
.
Net sales
from our modules segment
increased
by
$130.9 million
in
2017
primarily due to a
68%
increase
in the volume of watts sold, partially offset by a
29%
decrease
in the average selling price per watt. Net sales from our systems segment
decreased
by
$94.2 million
in
2017
primarily as a result of the completion of substantially all construction activities on a number of projects in
2016
, including the Desert Stateline, Astoria, Taylor, East Pecos, Silver State South, Butler, and McCoy projects, partially offset by the sale of the Moapa, California Flats, Switch Station, and Cuyama projects in
2017
.
Cost of sales
Modules Business
Our modules business cost of sales includes the cost of raw materials and components for manufacturing solar modules, such as glass, transparent conductive coatings, CdTe and other thin film semiconductors, laminate materials, connector assemblies, edge seal materials, and frames. In addition, our cost of sales includes direct labor for the manufacturing of solar modules and manufacturing overhead, such as engineering, equipment maintenance, quality and production control, and information technology. Our cost of sales also includes depreciation of manufacturing plant and equipment, facility-related expenses, environmental health and safety costs, and costs associated with shipping, warranties, and solar module collection and recycling (excluding accretion).
56
Systems Business
For our systems business, project-related costs include development costs (legal, consulting, transmission upgrade, interconnection, permitting, and other similar costs), EPC costs (consisting primarily of solar modules, inverters, electrical and mounting hardware, project management and engineering, and construction labor), and site specific costs.
The following table shows cost of sales by reportable segment for the years ended
December 31, 2018
,
2017
, and
2016
:
|
|
Years Ended
|
Change
|
||||||||||||||||||||||||
|
(Dollars in thousands)
|
2018
|
2017
|
2016
|
2018 over 2017
|
2017 over 2016
|
|||||||||||||||||||||
|
Modules
|
$
|
552,468
|
|
$
|
694,060
|
|
$
|
564,942
|
|
$
|
(141,592
|
)
|
(20
|
)%
|
$
|
129,118
|
|
23
|
%
|
|||||||
|
Systems
|
1,299,399
|
|
1,698,317
|
|
1,701,203
|
|
(398,918
|
)
|
(23
|
)%
|
(2,886
|
)
|
—
|
%
|
||||||||||||
|
Cost of sales
|
$
|
1,851,867
|
|
$
|
2,392,377
|
|
$
|
2,266,145
|
|
$
|
(540,510
|
)
|
(23
|
)%
|
$
|
126,232
|
|
6
|
%
|
|||||||
|
% of net sales
|
82.5
|
%
|
81.3
|
%
|
78.0
|
%
|
|
|
||||||||||||||||||
Cost of sales
decreased
$540.5 million
, or
23%
, and
increased
1.2 percentage points
as a percent of net sales when comparing
2018
with
2017
. The
decrease
in cost of sales was driven by a
$398.9 million
decrease
in our systems segment cost of sales primarily due to the size of projects sold or under construction and the timing of when all revenue recognition criteria were met. The
decrease
in cost of sales was also driven by a
$141.6 million
decrease
in our modules segment cost of sales primarily as a result of the following:
|
•
|
lower costs of
$241.4 million
from a
decrease
in the volume of modules sold;
|
|
•
|
a reduction in our module collection and recycling liability of
$25.4 million
in
2018
due to higher by-product credits for glass, lower capital costs, and adjustments to certain valuation assumptions; and
|
|
•
|
continued cost reductions in the cost per watt of our solar modules, which
decreased
cost of sales by
$22.6 million
; partially offset by
|
|
•
|
higher under-utilization and certain other charges associated with the initial ramp of certain Series 6 manufacturing lines, which
increased
cost of sales by
$113.0 million
;
|
|
•
|
a reduction to our product warranty liability of
$31.3 million
in
2017
due to lower legacy module replacement costs; and
|
|
•
|
a reduction in our module collection and recycling liability of
$13.5 million
in
2017
from updates to several valuation assumptions, including a decrease in certain inflation rates.
|
Cost of sales
increased
$126.2 million
, or
6%
, and
increased
3.3 percentage points
as a percentage of net sales when comparing
2017
with
2016
. The
increase
in cost of sales was driven by a
$129.1 million
increase in our modules segment cost of sales primarily due to the following:
|
•
|
higher costs of
$366.2 million
from the increased volume of modules sold directly to third parties; partially offset by
|
|
•
|
continued cost reductions in the cost per watt of our solar modules, which decreased cost of sales by
$182.4 million
;
|
|
•
|
the reduction in our product warranty liability of
$31.3 million
in
2017
described above;
|
|
•
|
the reduction in our module collection and recycling liability of
$13.5 million
in
2017
described above; and
|
|
•
|
lower inventory write-downs of
$9.2 million
.
|
Gross profit
Gross profit
may be affected by numerous factors, including the selling prices of our modules and systems, our manufacturing costs, project development costs, BoS costs, the capacity utilization of our manufacturing facilities, and foreign exchange rates.
Gross profit
may also be affected by the mix of net sales from our modules and systems businesses.
57
The following table shows gross profit for the years ended
December 31, 2018
,
2017
, and
2016
:
|
|
Years Ended
|
Change
|
||||||||||||||||||||||||
|
(Dollars in thousands)
|
2018
|
2017
|
2016
|
2018 over 2017
|
2017 over 2016
|
|||||||||||||||||||||
|
Gross profit
|
$
|
392,177
|
|
$
|
548,947
|
|
$
|
638,418
|
|
$
|
(156,770
|
)
|
(29
|
)%
|
$
|
(89,471
|
)
|
(14
|
)%
|
|||||||
|
% of net sales
|
17.5
|
%
|
18.7
|
%
|
22.0
|
%
|
|
|
|
|
||||||||||||||||
Gross profit
decreased
1.2 percentage points
to
17.5%
during
2018
from
18.7%
during
2017
primarily as a result of higher under-utilization and certain other charges associated with the initial ramp of Series 6 manufacturing lines and the reduction to our product warranty liability in
2017
described above, partially offset by the mix of higher gross profit projects sold during the period and the settlement of a tax examination with the state of California, which affected our estimates of sales and use taxes due for certain projects.
Gross profit
decreased
3.3 percentage points
to
18.7%
during
2017
from
22.0%
during
2016
primarily due to a mix of lower gross profit projects sold and under construction during the period and reductions in the average selling price per watt of our modules sold directly to third parties, partially offset by the reductions in our product warranty liability and our module collection and recycling liability described above.
Selling, general and administrative
Selling, general and administrative
expense consists primarily of salaries and other personnel-related costs, professional fees, insurance costs, and other business development and selling expenses.
The following table shows selling, general and administrative expense for the years ended
December 31, 2018
,
2017
, and
2016
:
|
|
Years Ended
|
Change
|
||||||||||||||||||||||||
|
(Dollars in thousands)
|
2018
|
2017
|
2016
|
2018 over 2017
|
2017 over 2016
|
|||||||||||||||||||||
|
Selling, general and administrative
|
$
|
176,857
|
|
$
|
202,699
|
|
$
|
261,994
|
|
$
|
(25,842
|
)
|
(13
|
)%
|
$
|
(59,295
|
)
|
(23
|
)%
|
|||||||
|
% of net sales
|
7.9
|
%
|
6.9
|
%
|
9.0
|
%
|
|
|
|
|
||||||||||||||||
Selling, general and administrative
expense in
2018
decreased
compared to
2017
primarily from lower employee compensation expense, lower accretion expense associated with the reduction in our module collection and recycling liability described above, lower expenses related to project sales, and lower business development expense. This decrease was partially offset by higher charges for impairments of certain project assets in
2018
.
Selling, general and administrative
expense in
2017
decreased
compared to
2016
primarily due to higher impairments of certain project assets in
2016
, lower employee compensation expense due to various restructuring activities, lower professional fees, lower infrastructure related expenses, and lower business development expenses.
Research and development
Research and development
expense consists primarily of salaries and other personnel-related costs; the cost of products, materials, and outside services used in our R&D activities; and depreciation and amortization expense associated with R&D specific facilities and equipment. We maintain a number of programs and activities to improve our technology and processes in order to enhance the performance and reduce the costs of our solar modules and systems.
The following table shows research and development expense for the years ended
December 31, 2018
,
2017
, and
2016
:
|
|
Years Ended
|
Change
|
||||||||||||||||||||||||
|
(Dollars in thousands)
|
2018
|
2017
|
2016
|
2018 over 2017
|
2017 over 2016
|
|||||||||||||||||||||
|
Research and development
|
$
|
84,472
|
|
$
|
88,573
|
|
$
|
124,762
|
|
$
|
(4,101
|
)
|
(5
|
)%
|
$
|
(36,189
|
)
|
(29
|
)%
|
|||||||
|
% of net sales
|
3.8
|
%
|
3.0
|
%
|
4.3
|
%
|
|
|
|
|
||||||||||||||||
58
Research and development
expense in
2018
decreased
compared to
2017
primarily due to lower employee compensation expense, lower facilities expense, and reduced material and module testing costs, partially offset by higher impairment charges for certain equipment.
Research and development
expense in
2017
decreased
compared to
2016
primarily due to lower costs for third-party contracted services, reduced material and module testing costs, the termination of certain R&D programs for legacy module technologies, and lower employee compensation expense resulting from reductions to our headcount as part of various restructuring activities.
Production start-up
Production start-up
expense consists primarily of employee compensation and other costs associated with operating a production line before it has been qualified for full production, including the cost of raw materials for solar modules run through the production line during the qualification phase and applicable facility related costs. Costs related to equipment upgrades and implementation of manufacturing process improvements are also included in production start-up expense as well as costs related to the selection of a new site, related legal and regulatory costs, and costs to maintain our plant replication program to the extent we cannot capitalize these expenditures. In general, we expect production start-up expense per production line to be higher when we build an entirely new manufacturing facility compared with the addition or replacement of production lines at an existing manufacturing facility, primarily due to the additional infrastructure investment required when building an entirely new facility.
The following table shows production start-up expense for the years ended
December 31, 2018
,
2017
, and
2016
:
|
|
Years Ended
|
Change
|
||||||||||||||||||||||||
|
(Dollars in thousands)
|
2018
|
2017
|
2016
|
2018 over 2017
|
2017 over 2016
|
|||||||||||||||||||||
|
Production start-up
|
$
|
90,735
|
|
$
|
42,643
|
|
$
|
1,021
|
|
$
|
48,092
|
|
113
|
%
|
$
|
41,622
|
|
4,077
|
%
|
|||||||
|
% of net sales
|
4.0
|
%
|
1.4
|
%
|
—
|
%
|
|
|
|
|
||||||||||||||||
During
2018
, we incurred production start-up expense for the commencement of Series 6 module manufacturing at our facility in Ho Chi Minh City, Vietnam. We also incurred production start-up expense for the transition to Series 6 module manufacturing at our facilities in Kulim, Malaysia and Perrysburg, Ohio in
2017
and early
2018
.
Restructuring and asset impairments
Restructuring and asset impairments
consists of expenses incurred related to material restructuring initiatives and includes any associated asset impairments, costs for employee termination benefits, costs for contract terminations and penalties, and other restructuring related costs. Such restructuring initiatives are intended to align the organization with then current business conditions and to reduce costs.
The following table shows restructuring and asset impairments for the years ended
December 31, 2018
,
2017
, and
2016
:
|
|
Years Ended
|
Change
|
||||||||||||||||||||||||
|
(Dollars in thousands)
|
2018
|
2017
|
2016
|
2018 over 2017
|
2017 over 2016
|
|||||||||||||||||||||
|
Restructuring and asset impairments
|
$
|
—
|
|
$
|
37,181
|
|
$
|
743,862
|
|
$
|
(37,181
|
)
|
(100
|
)%
|
$
|
(706,681
|
)
|
(95
|
)%
|
|||||||
|
% of net sales
|
—
|
%
|
1.3
|
%
|
25.6
|
%
|
|
|
|
|
||||||||||||||||
In November 2016, our board of directors approved a set of initiatives to accelerate our transition to Series 6 module manufacturing and restructure our operations. In June 2016, we ended production of our crystalline silicon modules to focus on our core CdTe module and utility-scale systems. As a result of these decisions, we recorded restructuring and asset impairment charges of
$41.8 million
and
$743.9 million
during
2017
and
2016
, respectively. In
2017
, we also reversed a customs tax liability associated with a prior restructuring activity, which reduced our restructuring charges by
$4.7 million
during the period.
See Note 4. “Restructuring and Asset Impairments”
to our consolidated financial statements for additional information on these matters.
59
Goodwill impairment
The following table shows goodwill impairments for the years ended
December 31, 2018
,
2017
, and
2016
:
|
|
Years Ended
|
Change
|
||||||||||||||||||||||||
|
(Dollars in thousands)
|
2018
|
2017
|
2016
|
2018 over 2017
|
2017 over 2016
|
|||||||||||||||||||||
|
Goodwill impairment
|
$
|
—
|
|
$
|
—
|
|
$
|
74,930
|
|
$
|
—
|
|
—
|
%
|
$
|
(74,930
|
)
|
(100
|
)%
|
|||||||
|
% of net sales
|
—
|
%
|
—
|
%
|
2.6
|
%
|
|
|
|
|
||||||||||||||||
As a result of our annual impairment analysis in the fourth quarter of 2016, we impaired the remaining
$68.8 million
of goodwill associated with our systems reporting unit primarily due to a strategic shift in the mix of our module and system net sales, which was approved by our board of directors in November 2016 as part of the restructuring activities described above. This shift involved an expected reduction in the annual megawatts sold through systems business projects. Other factors that contributed to the impairment included our reduced market capitalization and the challenging conditions within the solar industry as of the date of our testing. In June 2016, we also impaired the remaining
$6.1 million
of goodwill associated with our crystalline silicon modules reporting unit due to the decision to end the related manufacturing operations as further described above. See
Note 6. “Goodwill and Intangible Assets”
to our consolidated financial statements for additional information.
Foreign currency loss, net
Foreign currency loss, net
consists of the net effect of gains and losses resulting from holding assets and liabilities and conducting transactions denominated in currencies other than our subsidiaries’ functional currencies.
The following table shows foreign currency loss, net for the years ended
December 31, 2018
,
2017
, and
2016
:
|
|
Years Ended
|
Change
|
||||||||||||||||||||||||
|
(Dollars in thousands)
|
2018
|
2017
|
2016
|
2018 over 2017
|
2017 over 2016
|
|||||||||||||||||||||
|
Foreign currency loss, net
|
$
|
(570
|
)
|
$
|
(9,640
|
)
|
$
|
(14,007
|
)
|
$
|
9,070
|
|
(94
|
)%
|
$
|
4,367
|
|
(31
|
)%
|
|||||||
Foreign currency loss, net
decreased
in
2018
compared to
2017
primarily due to lower costs associated with hedging activities related to our subsidiaries in Japan, India, and Europe.
Foreign currency loss, net
decreased
in
2017
compared to
2016
primarily as a result of lower costs associated with hedging activities related to our subsidiaries in India, the weakening of the U.S. dollar relative to certain foreign currencies, and differences between our economic hedge positions and the underlying exposures.
Interest income
Interest income
is earned on our cash, cash equivalents, marketable securities, and restricted cash and investments. Interest income also includes interest earned from notes receivable and late customer payments.
The following table shows interest income for the years ended
December 31, 2018
,
2017
, and
2016
:
|
|
Years Ended
|
Change
|
||||||||||||||||||||||||
|
(Dollars in thousands)
|
2018
|
2017
|
2016
|
2018 over 2017
|
2017 over 2016
|
|||||||||||||||||||||
|
Interest income
|
$
|
59,788
|
|
$
|
35,704
|
|
$
|
25,193
|
|
$
|
24,084
|
|
67
|
%
|
$
|
10,511
|
|
42
|
%
|
|||||||
Interest income during
2018
increased
compared to
2017
primarily as a result of higher time deposit balances and increased interest rates associated with cash, cash equivalents, and marketable securities, partially offset by lower balances of cash and cash equivalents. Interest income during
2017
increased
compared to
2016
primarily due to higher cash balances during the period, higher interest rates associated with such cash balances, and a promissory note with an affiliate issued in late
2016
.
60
Interest expense, net
Interest expense is primarily comprised of interest incurred on long-term debt, settlements of interest rate swap contracts, and changes in the fair value of interest rate swap contracts that do not qualify for hedge accounting in accordance with Accounting Standards Codification (“ASC”) 815. We may capitalize interest expense into our project assets or property, plant and equipment when such costs qualify for interest capitalization, which reduces the amount of net interest expense reported in any given period.
The following table shows interest expense, net for the years ended
December 31, 2018
,
2017
, and
2016
:
|
|
Years Ended
|
Change
|
||||||||||||||||||||||||
|
(Dollars in thousands)
|
2018
|
2017
|
2016
|
2018 over 2017
|
2017 over 2016
|
|||||||||||||||||||||
|
Interest expense, net
|
$
|
(25,921
|
)
|
$
|
(25,765
|
)
|
$
|
(20,538
|
)
|
$
|
(156
|
)
|
1
|
%
|
$
|
(5,227
|
)
|
25
|
%
|
|||||||
Interest expense, net
increased
in
2018
compared to
2017
primarily due to changes in the fair value of interest rate swap contracts that do not qualify for hedge accounting and higher levels of project specific debt financings, partially offset by higher interest costs capitalized to certain projects under construction. Interest expense, net
increased
in
2017
compared to
2016
primarily due to changes in the fair value of interest rate swap contracts that do not qualify for hedge accounting and higher levels of project specific debt financings, partially offset by lower interest expense associated with certain Malaysian credit facilities that were fully repaid in
2016
.
Other income, net
Other income, net
is primarily comprised of miscellaneous items and realized gains and losses on the sale of marketable securities and restricted investments.
The following table shows other income, net for the years ended
December 31, 2018
,
2017
, and
2016
:
|
|
Years Ended
|
Change
|
||||||||||||||||||||||||
|
(Dollars in thousands)
|
2018
|
2017
|
2016
|
2018 over 2017
|
2017 over 2016
|
|||||||||||||||||||||
|
Other income, net
|
$
|
39,737
|
|
$
|
23,965
|
|
$
|
40,252
|
|
$
|
15,772
|
|
66
|
%
|
$
|
(16,287
|
)
|
(40
|
)%
|
|||||||
Other income, net
increased
in
2018
compared to
2017
primarily due to realized gains of
$55.4 million
in
2018
from the sale of certain restricted investments, partially offset by a
$26.8 million
settlement from the resolution of an outstanding matter with a former customer in
2017
and higher withholding taxes on certain payments by our foreign subsidiaries.
Other income, net
decreased
in
2017
compared to
2016
primarily due to realized gains of
$41.3 million
in
2016
from the sale of certain restricted investments and a
$7.4 million
reversal of the outstanding contingent consideration associated with our TetraSun acquisition as a result of our crystalline silicon module manufacturing restructuring in
2016
, partially offset by the customer settlement in
2017
described above.
Income tax expense
In December 2017, the U.S. President signed into law the Tax Act, which significantly revised U.S. tax law by, among other things, lowering the statutory federal corporate income tax rate from 35% to 21% effective January 1, 2018, eliminating certain deductions, imposing a transition tax on certain accumulated earnings and profits of foreign corporate subsidiaries (the “transition tax”), introducing new tax regimes, and changing how foreign earnings are subject to U.S. tax. During 2017, we recognized certain provisional tax expenses associated with the Tax Act. We completed our accounting for the Tax Act in the fourth quarter of 2018 and recorded certain adjustments to our provisional tax expenses.
Income tax expense or benefit, deferred tax assets and liabilities, and liabilities for unrecognized tax benefits reflect our best estimate of current and future taxes to be paid. We are subject to income taxes in both the United States and
61
numerous foreign jurisdictions in which we operate, principally Australia, India, and Malaysia. Significant judgments and estimates are required to determine our consolidated income tax expense. The statutory federal corporate income tax rate in the United States decreased from
35%
to
21%
beginning in January 2018. The tax rates in Australia, India, and Malaysia are
30%
,
34.9%
, and
24%
, respectively. In Malaysia, we have been granted a long-term tax holiday, scheduled to expire in
2027
, pursuant to which substantially all of our income earned in Malaysia is exempt from income tax, conditional upon our continued compliance with certain employment and investment thresholds.
The following table shows income tax expense for the years ended
December 31, 2018
,
2017
, and
2016
:
|
|
Years Ended
|
Change
|
||||||||||||||||||||||||
|
(Dollars in thousands)
|
2018
|
2017
|
2016
|
2018 over 2017
|
2017 over 2016
|
|||||||||||||||||||||
|
Income tax expense
|
$
|
(3,441
|
)
|
$
|
(371,996
|
)
|
$
|
(23,167
|
)
|
$
|
368,555
|
|
(99
|
)%
|
$
|
(348,829
|
)
|
1,506
|
%
|
|||||||
|
Effective tax rate
|
3.0
|
%
|
184.1
|
%
|
(4.3
|
)%
|
|
|
|
|
||||||||||||||||
Our tax rate is affected by recurring items, such as tax rates in foreign jurisdictions and the relative amounts of income we earn in those jurisdictions. The rate is also affected by discrete items that may occur in any given period, but are not consistent from period to period. Income tax expense
decreased
by
$368.6 million
during
2018
compared to
2017
primarily due to provisional tax expense of
$408.1 million
in 2017 related to the Tax Act and lower pretax income, partially offset by income earned in certain higher tax jurisdictions and a
$42.1 million
discrete tax benefit in 2017 associated with the acceptance of our election to classify certain of our German subsidiaries as disregarded entities of First Solar, Inc.
Income tax expense
increased
by
$348.8 million
during
2017
compared to
2016
primarily due to provisional tax expense related to the Tax Act as described above, higher pretax income, a
$35.4 million
reversal of an uncertain tax position in 2016 related to the income of a foreign subsidiary, and lower excess tax benefits associated with share-based compensation, partially offset by certain U.S. taxes in 2016 on a cash distribution received from a foreign subsidiary and a
$42.1 million
discrete tax benefit as described above.
See Note 19. “Income Taxes”
to our consolidated financial statements for additional information.
Equity in earnings, net of tax
Equity in earnings, net of tax
represents our proportionate share of the earnings or losses from equity method investments as well as any gains or losses on the sale or disposal of such investments.
The following table shows equity in earnings, net of tax for the years ended
December 31, 2018
,
2017
, and
2016
:
|
|
Years Ended
|
Change
|
||||||||||||||||||||||||
|
(Dollars in thousands)
|
2018
|
2017
|
2016
|
2018 over 2017
|
2017 over 2016
|
|||||||||||||||||||||
|
Equity in earnings, net of tax
|
$
|
34,620
|
|
$
|
4,266
|
|
$
|
144,306
|
|
$
|
30,354
|
|
712
|
%
|
$
|
(140,040
|
)
|
(97
|
)%
|
|||||||
Equity in earnings, net of tax
increased
in
2018
compared to
2017
primarily due to the sale of our ownership interests in 8point3 Operating Company, LLC (“OpCo”) in June
2018
, which resulted in a gain of
$40.3 million
, net of tax.
See Note 12. “Equity Method Investments”
to our consolidated financial statements for additional information.
Equity in earnings, net of tax
decreased
in
2017
compared to
2016
primarily due to the recognition of a gain of
$125.1 million
, net of tax, in December
2016
from the sale of our residual interest in the Desert Stateline project to OpCo and lower equity in earnings from our investment in OpCo.
62
Liquidity and Capital Resources
As of
December 31, 2018
, we believe that our cash, cash equivalents, marketable securities, cash flows from operating activities, advanced-stage project pipeline, availability under our Revolving Credit Facility (considering the minimum liquidity covenant requirements therein), and access to the capital markets will be sufficient to meet our working capital, systems project investment, and capital expenditure needs for at least the next 12 months. We monitor our working capital to ensure we have adequate liquidity, both domestically and internationally.
We intend to maintain appropriate debt levels based upon cash flow expectations, our overall cost of capital, and expected cash requirements for operations, capital expenditures, and strategic discretionary spending. In the future, we may also engage in additional debt or equity financings, including project specific debt financings. We believe that when necessary, we will have adequate access to the capital markets, although our ability to raise capital on terms commercially acceptable to us could be constrained if there is insufficient lender or investor interest due to industry-wide or company-specific concerns. Such financings could result in increased debt service expenses, dilution to our existing stockholders, or restrictive covenants, which could restrain our ability to pursue our strategic plans.
As of
December 31, 2018
, we had
$2.5 billion
in cash, cash equivalents, and marketable securities compared to
$3.0 billion
as of
December 31, 2017
. Cash, cash equivalents, and marketable securities as of
December 31, 2018
decreased primarily as a result of purchases of property, plant and equipment and operating expenditures associated with the initial ramp of certain Series 6 manufacturing lines, partially offset by proceeds associated with the sale of our interests in 8point3 and its subsidiaries and net proceeds from borrowings under project specific debt financings. As of
December 31, 2018
and
2017
,
$1.2 billion
and
$1.6 billion
, respectively, of our cash, cash equivalents, and marketable securities was held by our foreign subsidiaries and was primarily based in U.S. dollar, Euro, and Japanese yen denominated holdings.
We utilize a variety of tax planning and financing strategies in an effort to ensure that our worldwide cash is available in the locations in which it is needed. If certain international funds were needed for our operations in the United States, we may be required to accrue and pay certain U.S. and foreign taxes to repatriate such funds. We maintain the intent and ability to permanently reinvest our accumulated earnings outside of the United States, with the exception of our subsidiaries in Canada and Germany. In addition, changes to foreign government banking regulations may restrict our ability to move funds among various jurisdictions under certain circumstances, which could negatively impact our access to capital, resulting in an adverse effect on our liquidity and capital resources.
Our systems business requires significant liquidity and is expected to continue to have significant liquidity requirements in the future. The net amount of our project assets and related portion of deferred revenue, which approximates our net capital investment in the development and construction of systems projects, was
$467.3 million
as of
December 31, 2018
. Solar power project development and construction cycles, which span the time between the identification of a site location and the commercial operation of a system, vary substantially and can take many years to mature. As a result of these long project cycles and strategic decisions to finance the construction of certain projects using our working capital, we may need to make significant up-front investments of resources in advance of the receipt of any cash from the sale of such projects. Delays in construction or in completing the sale of our systems projects that we are self-financing may also impact our liquidity. In certain circumstances, we may need to finance construction costs exclusively using working capital, if project financing becomes unavailable due to market-wide, regional, or other concerns.
From time to time, we may develop projects in certain markets around the world where we may hold all or a significant portion of the equity in a project for several years. Given the duration of these investments and the currency risk relative to the U.S. dollar in some of these markets, we continue to explore local financing alternatives. Should these financing alternatives be unavailable or too cost prohibitive, we could be exposed to significant currency risk and our liquidity could be adversely impacted.
Additionally, we may elect to retain an ownership interest in certain systems projects after they become operational if we determine it would be of economic and strategic benefit to do so. If, for example, we cannot sell a systems project
63
at economics that are attractive to us or potential customers are unwilling to assume the risks and rewards typical of PV solar power system ownership, we may instead elect to temporarily own and operate such systems until we can sell the systems on economically attractive terms. The decision to retain ownership of a system impacts liquidity depending upon the size and cost of the project. As of
December 31, 2018
, we had
$308.6 million
of net PV solar power systems that had been placed in service, primarily in international markets. We have elected, and may in the future elect, to enter into temporary or long-term project financing to reduce the impact on our liquidity and working capital with regards to such projects and systems. We may also consider entering into tax equity or other arrangements with respect to ownership interests in certain of our projects, which could cause a portion of the economics of such projects to be realized over time.
The following additional considerations have impacted or may impact our liquidity in
2019
and beyond:
|
•
|
We expect to make significant capital investments over the next several years as we transition our production to Series 6 module technology and purchase the related manufacturing equipment and infrastructure. These investments also include the commencement and expansion of operations at our existing manufacturing plant in Vietnam and the construction of an additional U.S. manufacturing plant in Lake Township, Ohio. We expect the aggregate capital investment for currently planned Series 6 related programs to be approximately
$2.0 billion
, including
$1.1 billion
of capital expenditures already made as of
December 31, 2018
. These capital investments are expected to provide an annual Series 6 manufacturing capacity of approximately
6.6 GW
DC
once completed. During
2019
, we expect to spend
$650 million
to
$750 million
for capital expenditures, the majority of which is associated with the Series 6 transition. We believe these capital expenditures will, over time, increase our aggregate manufacturing capacity, reduce our manufacturing costs, and increase our solar module wattage.
|
|
•
|
Our failure to obtain raw materials and components that meet our quality, quantity, and cost requirements in a timely manner could interrupt or impair our ability to manufacture our solar modules or increase our manufacturing costs. Accordingly, we may enter into long-term supply agreements to mitigate potential risks related to the procurement of key raw materials and components, and such agreements may be noncancelable or cancelable with a significant penalty. For example, we have entered into long-term supply agreements for the purchase of certain specified minimum volumes of substrate glass and cover glass for our PV solar modules. Our actual purchases under these supply agreements are expected to be approximately $2.4 billion of substrate glass and $500 million of cover glass. We have the right to terminate these agreements upon payment of specified termination penalties (which are up to $430 million in the aggregate and decline over time during the respective supply periods).
|
|
•
|
The balance of our solar module inventories and BoS parts was
$309.3 million
as of
December 31, 2018
. As we continue to develop and construct our advanced-stage project pipeline, we must produce solar modules and procure BoS parts in volumes sufficient to support our planned construction schedules. As part of this construction cycle, we typically produce or procure these inventories in advance of receiving payment for such materials, which may temporarily reduce our liquidity. Once solar modules and BoS parts are installed in a project, they are classified as either project assets, PV solar power systems, or cost of sales depending on whether the project is subject to a definitive sales contract and whether other revenue recognition criteria have been met. We also produce significant volumes of modules for sale directly to third-parties, which requires us to carry inventories at levels sufficient to satisfy the demand of our customers and the needs of their utility-scale projects, which may also temporarily reduce our liquidity.
|
|
•
|
We may commit significant working capital over the next several years to advance the construction of various U.S. systems projects or procure the associated BoS parts by specified dates for such projects to qualify for certain federal investment tax credits. Among other requirements, such credits require projects to commence construction in 2019, which may be achieved by certain qualifying procurement activities, to receive a 30% investment tax credit. The credit will step down to 26% for projects that commence construction in 2020, 22% for projects that commence construction in 2021, and 10% for projects that commence construction thereafter.
|
64
|
•
|
We may also commit working capital to acquire solar power projects in various stages of development, including advanced-stage projects with PPAs, and to continue developing those projects as necessary. Depending upon the size and stage of development, the costs to acquire such solar power projects could be significant. When evaluating project acquisition opportunities, we consider both the strategic and financial benefits of any such acquisitions.
|
Cash Flows
The following table summarizes key cash flow activity for the years ended
December 31, 2018
,
2017
, and
2016
(in thousands):
|
|
2018
|
2017
|
2016
|
|||||||||
|
Net cash (used in) provided by operating activities
|
$
|
(326,809
|
)
|
$
|
1,340,677
|
|
$
|
206,753
|
|
|||
|
Net cash (used in) provided by investing activities
|
(682,714
|
)
|
(626,802
|
)
|
144,520
|
|
||||||
|
Net cash provided by (used in) financing activities
|
255,228
|
|
192,045
|
|
(136,393
|
)
|
||||||
|
Effect of exchange rate changes on cash, cash equivalents and restricted cash
|
(13,558
|
)
|
8,866
|
|
(6,306
|
)
|
||||||
|
Net (decrease) increase in cash, cash equivalents and restricted cash
|
$
|
(767,853
|
)
|
$
|
914,786
|
|
$
|
208,574
|
|
|||
Operating Activities
The decrease in net cash provided by operating activities during 2018 was primarily driven by lower cash proceeds from sales of systems projects, including the sales of the Moapa, California Flats, Switch Station, and Cuyama projects in 2017, higher liabilities assumed by customers as part of the consideration for certain projects sold, and operating expenditures associated with our ongoing transition to Series 6 module manufacturing. The increase in net cash provided by operating activities during
2017
was primarily driven by the sale of the projects described above, partially offset by expenditures for the construction of certain projects.
Investing Activities
The increase in net cash used in investing activities during
2018
was primarily due to higher purchases of property, plant and equipment driven by our transition to Series 6 module manufacturing and an increase in net purchases of marketable securities and restricted investments, partially offset by proceeds associated with the sale of our interests in 8point3 and its subsidiaries. The increase in net cash used in investing activities during
2017
was primarily due to (i) proceeds from sales of equity method investments in
2016
, including the sale of our remaining interest in the Desert Stateline project, (ii) an increase in purchases of property, plant and equipment driven by our transition to Series 6 module manufacturing, and (iii) net higher net purchases of marketable securities and restricted investments.
Financing Activities
The increase in net cash provided by financing activities during
2018
was primarily the result of higher net proceeds from borrowings under long-term debt arrangements associated with the construction of certain projects in Australia, Japan, and India and lower payments for contingent obligations associated with the acquisition of certain projects in Japan, partially offset by lower proceeds from commercial letters of credit for the construction of certain projects in India. The increase in net cash provided by financing activities during
2017
was primarily the result of net proceeds from borrowings under long-term debt arrangements associated with the construction of certain projects in Japan, India, and Australia and proceeds from commercial letters of credit for the construction of certain projects in India.
65
Contractual Obligations
The following table presents the payments due by fiscal year for our outstanding contractual obligations as of
December 31, 2018
(in thousands):
|
|
|
Payments Due by Year
|
||||||||||||||||||
|
Total
|
Less Than
1 Year
|
1 - 3
Years
|
3 - 5
Years
|
More Than
5 Years
|
||||||||||||||||
|
Long-term debt obligations
|
$
|
479,157
|
|
$
|
5,673
|
|
$
|
92,949
|
|
$
|
83,841
|
|
$
|
296,694
|
|
|||||
|
Interest payments (1)
|
190,760
|
|
20,091
|
|
36,678
|
|
30,403
|
|
103,588
|
|
||||||||||
|
Operating lease obligations
|
146,814
|
|
13,839
|
|
17,340
|
|
15,573
|
|
100,062
|
|
||||||||||
|
Purchase obligations (2)
|
1,388,726
|
|
875,653
|
|
186,218
|
|
164,807
|
|
162,048
|
|
||||||||||
|
Recycling obligations
|
134,442
|
|
—
|
|
—
|
|
—
|
|
134,442
|
|
||||||||||
|
Contingent consideration (3)
|
2,915
|
|
665
|
|
2,250
|
|
—
|
|
—
|
|
||||||||||
|
Transition tax obligations (4)
|
81,186
|
|
4,170
|
|
14,670
|
|
21,088
|
|
41,258
|
|
||||||||||
|
Other obligations (5)
|
20,699
|
|
4,565
|
|
9,138
|
|
6,996
|
|
—
|
|
||||||||||
|
Total
|
$
|
2,444,699
|
|
$
|
924,656
|
|
$
|
359,243
|
|
$
|
322,708
|
|
$
|
838,092
|
|
|||||
——————————
|
(1)
|
Includes estimated cash interest to be paid over the remaining terms of the underlying debt. Interest payments are based on fixed and floating rates as of
December 31, 2018
.
|
|
(2)
|
Purchase obligations represent agreements to purchase goods or services, including open purchase orders and contracts with fixed volume commitments, that are noncancelable or cancelable with a significant penalty. Purchase obligations for our long-term supply agreements for the purchase of substrate glass and cover glass represent specified termination penalties, which are up to $430 million in the aggregate under the agreements. Our actual purchases under these supply agreements are expected to be approximately $2.4 billion of substrate glass and $500 million of cover glass.
|
|
(3)
|
In connection with business or project acquisitions, we may agree to pay additional amounts to the selling parties upon achievement of certain milestones.
See Note 15. “Commitments and Contingencies”
to our consolidated financial statements for further information.
|
|
(4)
|
Transition tax obligations represent estimated payments for U.S. federal taxes associated with accumulated earnings and profits of our foreign corporate subsidiaries.
See Note 19. “Income Taxes”
to our consolidated financial statements for further information.
|
|
(5)
|
Includes expected letter of credit fees and unused revolver fees.
|
We have excluded
$72.2 million
of unrecognized tax benefits from the amounts presented above as the timing of such obligations is uncertain.
Off-Balance Sheet Arrangements
As of
December 31, 2018
, we had no off-balance sheet debt or similar obligations, other than financial assurance related instruments and operating leases, which are not classified as debt. We do not guarantee any third-party debt.
See Note 15. “Commitments and Contingencies”
to our consolidated financial statements for further information about our financial assurance related instruments.
Recent Accounting Pronouncements
See Note 3. “Recent Accounting Pronouncements”
to our consolidated financial statements for a summary of recent accounting pronouncements.
66
Critical Accounting Estimates
In preparing our consolidated financial statements in conformity with generally accepted accounting principles in the United States (“U.S. GAAP”), we make estimates and assumptions that affect the amounts of reported assets, liabilities, revenues, and expenses, as well as the disclosure of contingent liabilities. Some of our accounting policies require the application of significant judgment in the selection of the appropriate assumptions for making these estimates. By their nature, these judgments are subject to an inherent degree of uncertainty. We base our judgments and estimates on our historical experience, our forecasts, and other available information as appropriate. The actual results experienced by us may differ materially and adversely from our estimates. To the extent there are material differences between our estimates and the actual results, our future results of operations will be affected. Our significant accounting policies are described in
Note 2. “Summary of Significant Accounting Policies”
to our consolidated financial statements. The accounting policies that require the most significant judgment and estimates include the following:
Revenue Recognition – Solar Power System Sales and/or EPC Services
. We generally recognize revenue for sales of solar power systems and/or EPC services over time as our performance creates or enhances an energy generation asset controlled by the customer. Furthermore, the sale of a solar power system when combined with EPC services represents a single performance obligation for the development and construction of a single generation asset. For such sale arrangements, we recognize revenue using cost based input methods, which recognize revenue and gross profit as work is performed based on the relationship between actual costs incurred compared to the total estimated costs of the contract
. For sales of solar power systems in which we obtain an interest in the project sold to the customer, we recognize all of the revenue for the consideration received, including the fair value of the noncontrolling interest we obtained, and defer any profit associated with the interest obtained through “
Equity in earnings, net of tax
.” We may also recognize revenue for the sale of a solar power system after it has been completed due to the timing of when we enter into the associated sales contract with the customer.
Estimating the fair value of a noncontrolling interest we obtain begins with the valuation of the entire solar project (i.e., solar power system) being sold to the customer. Such valuation generally uses an income based valuation technique in which relevant cash flows are discounted to estimate the expected economic earnings capacity of the project. Typical factors considered in a project’s valuation include expected energy generation, the duration and pricing of the PPA, the pricing of energy to be sold on an open contract basis following the termination of the PPA (i.e., merchant pricing curves), other offtake agreements, the useful life of the system, tax attributes such as accelerated depreciation and tax credits, sales of renewable energy certificates, interconnection rights, operating agreements, and the cost of capital. Once the overall project valuation is agreed upon with the customer, we determine the relative value related to our specific ownership interests conveyed through the transaction agreements, including the membership interest purchase and sale agreement and the limited liability company agreement (or equivalent) of the project or its holding company.
In applying cost based input methods of revenue recognition, we use the actual costs incurred relative to the total estimated costs (including solar module costs) to determine our progress towards contract completion and to calculate the corresponding amount of revenue and gross profit to recognize. Cost based input methods of revenue recognition are considered a faithful depiction of our efforts to satisfy long-term construction contracts and therefore reflect the transfer of goods to a customer under such contracts. Costs incurred that do not contribute to satisfying our performance obligations (“inefficient costs”) are excluded from our input methods of revenue recognition as the amounts are not reflective of our transferring control of the system to the customer. Costs incurred towards contract completion may include costs associated with solar modules, direct materials, labor, subcontractors, and other indirect costs related to contract performance. We recognize solar module and direct material costs as incurred when such items have been installed in a system. Cost based input methods of revenue recognition require us to make estimates of net contract revenues and costs to complete our projects. In making such estimates, significant judgment is required to evaluate assumptions related to the amount of net contract revenues, including the impact of any performance incentives, liquidated damages, and other payments to customers. Significant judgment is also required to evaluate assumptions related to the costs to complete our projects, including materials, labor, contingencies, and other system costs.
67
If the estimated total costs on any contract, including any inefficient costs, are greater than the net contract revenues, we recognize the entire estimated loss in the period the loss becomes known. The cumulative effect of revisions to estimates related to net contract revenues or costs to complete contracts are recorded in the period in which the revisions to estimates are identified and the amounts can be reasonably estimated. The effect of the changes on future periods are recognized as if the revised estimates had been used since revenue was initially recognized under the contract. Such revisions could occur in any reporting period, and the effects may be material depending on the size of the contracts or the changes in estimates.
As part of our solar power system sales, we conduct performance testing of a system prior to substantial completion to confirm the system meets its operational and capacity expectations noted in the EPC agreement. In addition, we may provide an energy performance test during the first or second year of a system’s operation to demonstrate that the actual energy generation for the applicable period meets or exceeds the modeled energy expectation, after certain adjustments. These tests are based on meteorological, energy, and equipment performance data measured at the system’s location as well as certain projections of such data over the remaining measurement period. In certain instances, a bonus payment may be received at the end of the applicable test period if the system performs above a specified level. Conversely, if there is an underperformance event with regards to these tests, we may incur liquidated damages as a percentage of the EPC contract price. Such performance guarantees represent a form of variable consideration and are estimated at contract inception at their most likely amount and updated at the end of each reporting period as additional performance data becomes available and only to the extent that it is probable that a significant reversal of any incremental revenue will not occur.
Revenue Recognition – Operations and Maintenance.
We recognize revenue for standard, recurring O&M services over time as customers receive and consume the benefits of such services. Costs of O&M services are expensed in the period in which they are incurred. As part of our O&M service offerings, we typically offer an effective availability guarantee, which stipulates that a system will be available to generate a certain percentage of total possible energy during a specific period after adjusting for factors outside of our control as the service provider. These tests are based on meteorological, energy, and equipment performance data measured at the system’s location as well as certain projections of such data over the remaining measurement period. If system availability exceeds a contractual threshold, we may receive a bonus payment, or if system availability falls below a separate threshold, we may incur liquidated damages for certain lost energy under the PPA. Such bonuses or liquidated damages represent a form of variable consideration and are estimated and recognized over time as customers receive and consume the benefits of the O&M services.
Accrued Solar Module Collection and Recycling Liability.
When applicable, we recognize expense at the time of sale for the estimated cost of our obligations to collect and recycle solar modules covered by our solar module collection and recycling program. We estimate the cost of our collection and recycling obligations based on the present value of the expected probability-weighted future cost of collecting and recycling the solar modules, which includes estimates for the cost of packaging materials; the cost of freight from the solar module installation sites to a recycling center; material, labor, and capital costs; the scale of recycling centers; and an estimated third-party profit margin and return on risk for collection and recycling services. We base these estimates on (i) our experience collecting and recycling our solar modules, (ii) the expected timing of when our solar modules will be returned for recycling, and (iii) the expected economic factors at the time the solar modules will be collected and recycled. In the periods between the time of sale and the related settlement of the collection and recycling obligation, we accrete the carrying amount of the associated liability by applying the discount rate used for its initial measurement. We periodically review our estimates of expected future recycling costs and may adjust our liability accordingly.
Product Warranties.
We provide a limited PV solar module warranty covering defects in materials and workmanship under normal use and service conditions for approximately
10
years. We also typically warrant that modules installed in accordance with agreed-upon specifications will produce at least
98%
of their labeled power output rating during the first year, with the warranty coverage reducing by
0.5%
every year thereafter throughout the approximate
25
-year limited power output warranty period.
68
As an alternative form of our standard limited module power output warranty, we also offer an aggregated or system-level limited module performance warranty. This system-level limited module performance warranty is designed for utility-scale systems and provides
25
-year system-level energy degradation protection. This warranty represents a practical expedient to address the challenge of identifying, from the potential millions of modules installed in a utility-scale system, individual modules that may be performing below warranty thresholds by focusing on the aggregate energy generated by the system rather than the power output of individual modules. The system-level limited module performance warranty is typically calculated as a percentage of a system’s expected energy production, adjusted for certain actual site conditions, with the warranted level of performance declining each year in a linear fashion, but never falling below
80%
during the term of the warranty.
In addition to our limited solar module warranties described above, for PV solar power systems we construct, we typically provide limited warranties for defects in engineering design, installation, and BoS part workmanship for a period of one to two years following the substantial completion of a system or a block within the system.
When we recognize revenue for module or system sales, we accrue liabilities for the estimated future costs of meeting our limited warranty obligations. We make and revise these estimates based primarily on the number of our solar modules under warranty installed at customer locations, our historical experience with warranty claims, our monitoring of field installation sites, our internal testing of and the expected future performance of our solar modules and BoS parts, and our estimated per-module replacement costs. As a result of such factors, we estimate our limited product warranties based on warranty return rates of approximately
1%
to
3%
for modules covered under warranty, depending on the series of module technology.
Income Taxes.
We are subject to the income tax laws of the United States, its states and municipalities, and those of the foreign jurisdictions in which we have significant business operations. Such tax laws are complex and subject to different interpretations by the taxpayer and the relevant taxing authorities. We make judgments and interpretations regarding the application of these inherently complex tax laws when determining our provision for income taxes and also make estimates about when in the future certain items are expected to affect taxable income in the various tax jurisdictions. Disputes over interpretations of tax laws may be settled with the relevant taxing authority upon examination or audit. We regularly evaluate the likelihood of assessments in each of our taxing jurisdictions resulting from current and future examinations, and we record tax liabilities as appropriate.
In preparing our consolidated financial statements, we calculate our income tax provision based on our interpretation of the tax laws and regulations in the various jurisdictions where we conduct business. This requires us to estimate our current tax obligations, assess uncertain tax positions, and assess temporary differences between the financial statement carrying amounts and the tax basis of assets and liabilities. These temporary differences result in deferred tax assets and liabilities. We must also assess the likelihood that each of our deferred tax assets will be realized. To the extent we believe that realization of any of our deferred tax assets is not more likely than not, we establish a valuation allowance. When we establish a valuation allowance or increase this allowance in a reporting period, we generally record a corresponding tax expense. Conversely, to the extent circumstances indicate that a valuation allowance is no longer necessary, that portion of the valuation allowance is reversed, which generally reduces our overall income tax expense.
We establish liabilities for potential additional taxes based on our assessment of the outcome of our tax positions. Once established, we adjust these liabilities when additional information becomes available or when an event occurs requiring an adjustment. Significant judgment is required in making these estimates and the actual cost of a tax assessment, fine, or penalty may ultimately be materially different from our recorded liabilities, if any.
We continually explore initiatives to better align our tax and legal entity structure with the footprint of our global operations and recognize the tax impact of these initiatives, including changes in the assessment of uncertain tax positions, indefinite reinvestment exception assertions, and the realizability of deferred tax assets, in the period when we believe all necessary internal and external approvals associated with such initiatives have been obtained, or when the initiatives are materially complete.
69
Asset Impairments.
We assess long-lived assets classified as “held and used,” including our property, plant and equipment; project assets; PV solar power systems; and intangible assets for impairment whenever events or changes in circumstances arise, including consideration of technological obsolescence, that may indicate that the carrying amount of such assets may not be recoverable, and these assessments require significant judgment in determining whether such events or changes have occurred. Relevant considerations may include a significant decrease in the market price of a long-lived asset; a significant adverse change in the extent or manner in which a long-lived asset is being used or in its physical condition; a significant adverse change in the business climate that could affect the value of a long-lived asset; an accumulation of costs significantly in excess of the amount originally expected for the acquisition or construction of a long-lived asset; a current-period operating or cash flow loss combined with a history of such losses or a projection of future losses associated with the use of a long-lived asset; or a current expectation that, more likely than not, a long-lived asset will be sold or otherwise disposed of significantly before the end of its previously estimated useful life. For purposes of recognition and measurement of an impairment loss, long-lived assets are grouped with other assets and liabilities at the lowest level for which identifiable cash flows are largely independent of the cash flows of other assets and liabilities, and we must also exercise judgment in assessing such groupings and levels.
When impairment indicators are present, we compare undiscounted future cash flows, including the eventual disposition of the asset group at market value, to the asset group’s carrying value to determine if the asset group is recoverable. If the carrying value of the asset group exceeds the undiscounted future cash flows, we measure any impairment by comparing the fair value of the asset group to its carrying value. Fair value is generally determined by considering (i) internally developed discounted cash flows for the asset group, (ii) third-party valuations, and/or (iii) information available regarding the current market value for such assets. If the fair value of an asset group is determined to be less than its carrying value, an impairment in the amount of the difference is recorded in the period that the impairment indicator occurs. Estimating future cash flows requires significant judgment, and such projections may vary from the cash flows eventually realized.
Goodwill.
Goodwill represents the excess of the purchase price of acquired businesses over the estimated fair value assigned to the individual assets acquired and liabilities assumed. We do not amortize goodwill, but instead are required to test goodwill for impairment at least annually. We perform impairment tests between the scheduled annual test in the fourth quarter if facts and circumstances indicate that it is more likely than not that the fair value of a reporting unit that has goodwill is less than its carrying value.
We may first make a qualitative assessment of whether it is more likely than not that a reporting unit’s fair value is less than its carrying value to determine whether it is necessary to perform a quantitative goodwill impairment test. Such qualitative impairment test considers various factors, including macroeconomic conditions, industry and market considerations, cost factors, the overall financial performance of a reporting unit, and any other relevant events affecting our company or a reporting unit. If we determine through the qualitative assessment that a reporting unit’s fair value is more likely than not greater than its carrying value, the quantitative impairment test is not required. If the qualitative assessment indicates it is more likely than not that a reporting unit’s fair value is less than its carrying value, we perform a quantitative impairment test. We may also elect to proceed directly to the quantitative impairment test without considering qualitative factors.
The quantitative impairment test is the comparison of the fair value of a reporting unit with its carrying amount, including goodwill. Our reporting units consist of our modules business and our fully integrated systems business. We define the fair value of a reporting unit as the price that would be received to sell the unit as a whole in an orderly transaction between market participants at the measurement date. We primarily use an income approach to estimate the fair value of our reporting units. Significant judgment is required when estimating the fair value of a reporting unit, including the forecasting of future operating results and the selection of discount and expected future growth rates used to determine projected cash flows. If the estimated fair value of a reporting unit exceeds its carrying value, goodwill is not impaired, and no further analysis is required. Conversely, if the carrying value of a reporting unit exceeds its estimated fair value, we record an impairment loss equal to the excess, not to exceed the total amount of goodwill allocated to the reporting unit.
70
Item 7A.
Quantitative and Qualitative Disclosures about Market Risk
Foreign Currency Exchange Risk
Cash Flow Exposure.
We expect certain of our subsidiaries to have future cash flows that will be denominated in currencies other than the subsidiaries’ functional currencies. Changes in the exchange rates between the functional currencies of our subsidiaries and the other currencies in which they transact will cause fluctuations in the cash flows we expect to receive or pay when these cash flows are realized or settled. Accordingly, we enter into foreign exchange forward contracts to hedge a portion of these forecasted cash flows. These foreign exchange forward contracts qualify for accounting as cash flow hedges in accordance with ASC 815 and we designated them as such. We initially report the effective portion of a derivative’s unrealized gain or loss in “
Accumulated other comprehensive (loss) income
” and subsequently reclassify amounts into earnings when the hedged transaction occurs and impacts earnings. For additional details on our derivative hedging instruments and activities, see
Note 10. “Derivative Financial Instruments”
to our consolidated financial statements.
Certain of our international operations, such as our manufacturing facilities in Malaysia and Vietnam, pay a portion of their operating expenses, including associate wages and utilities, in local currencies, which exposes us to foreign currency exchange risk for such expenses. Our manufacturing facilities are also exposed to foreign currency exchange risk for purchases of certain equipment from international vendors. As we expand into new markets worldwide, particularly emerging markets, our total foreign currency exchange risk, in terms of both size and exchange rate volatility, and the number of foreign currencies we are exposed to could increase significantly.
For the year ended
December 31, 2018
,
23%
of our net sales were denominated in foreign currencies, including
Japanese yen and Indian rupees
. As a result, we have exposure to foreign currencies with respect to our net sales, which has historically represented one of our primary foreign currency exchange risks. A 10% change in the U.S. dollar to Japanese yen and U.S dollar to Indian rupee exchange rates would have had an aggregate impact on our net sales of
$38.4 million
, excluding the effect of our hedging activities.
Transaction Exposure.
Many of our subsidiaries have assets and liabilities (primarily cash, receivables, marketable securities, deferred taxes, payables, accrued expenses, and solar module collection and recycling liabilities) that are denominated in currencies other than the subsidiaries’ functional currencies. Changes in the exchange rates between the functional currencies of our subsidiaries and the other currencies in which these assets and liabilities are denominated will create fluctuations in our reported consolidated statements of operations and cash flows. We may enter into foreign exchange forward contracts or other financial instruments to economically hedge assets and liabilities against the effects of currency exchange rate fluctuations. The gains and losses on such foreign exchange forward contracts will economically offset all or part of the transaction gains and losses that we recognize in earnings on the related foreign currency denominated assets and liabilities. For additional details on our economic hedging instruments and activities, see
Note 10. “Derivative Financial Instruments”
to our consolidated financial statements.
As of
December 31, 2018
, a 10% change in the U.S. dollar to Vietnamese dong exchange rate, which represented one of our primary foreign currency exposures, would impact our net foreign currency loss by
$2.8 million
, including the effect of our hedging activities.
Interest Rate Risk
Variable Rate Debt Exposure.
We are exposed to interest rate risk as certain of our project specific debt financings have variable interest rates, exposing us to variability in interest expense and cash flows.
See Note 14. “Debt”
to our consolidated financial statements for additional information on our long-term debt borrowing rates. An increase in relevant interest rates would increase the cost of borrowing under certain of our project specific debt financings. If such variable interest rates changed by 100 basis points, our interest expense for the year ended
December 31, 2018
would have changed by
$1.0 million
, including the effect of our hedging activities.
71
Customer Financing Exposure.
We are also indirectly exposed to interest rate risk because many of our customers depend on debt financings to purchase modules or systems. An increase in interest rates could make it challenging for our customers to obtain the capital necessary to make such purchases on favorable terms, or at all. Such factors could reduce demand or lower the price we can charge for our modules and systems, thereby reducing our net sales and gross profit. In addition, we believe that a significant percentage of our customers purchase systems as an investment, funding the initial capital expenditure through a combination of equity and debt. An increase in interest rates could lower an investor’s return on investment in a system or make alternative investments more attractive relative to PV solar power systems, which, in either case, could cause these end-users to seek alternative investments with higher returns.
Marketable Securities and Restricted Investments Exposure.
We invest in various debt securities, which exposes us to interest rate risk. The primary objectives of our investment activities are to preserve principal and provide liquidity, while at the same time maximizing the return on our investments. Many of the securities in which we invest may be subject to market risk. Accordingly, a change in prevailing interest rates may cause the market value of such investments to fluctuate. For example, if we hold a security that was issued with an interest rate fixed at the then-prevailing rate and the prevailing interest rate subsequently rises, the market value of our investment may decline.
For the year ended
December 31, 2018
, our marketable securities earned a return of
2%
, including the impact of fluctuations in the price of the underlying securities, and had a weighted-average maturity of
5 months
as of the end of the period. Based on our investment positions as of
December 31, 2018
, a hypothetical 100 basis point change in interest rates would have resulted in a
$3.2 million
change in the market value of our investment portfolio. For the year ended
December 31, 2018
, our restricted investments earned a return of
4%
, including the impact of fluctuations in the price of the underlying securities, and had a weighted-average maturity of approximately
13
years as of the end of the period. Based on our restricted investment positions as of
December 31, 2018
, a hypothetical 100 basis point change in interest rates would have resulted in a
$29.4 million
change in the market value of our restricted investment portfolio.
Commodity and Component Risk
We are exposed to price risks for the raw materials, components, services, and energy costs used in the manufacturing and transportation of our solar modules and BoS parts used in our systems. Also, some of our raw materials and components are sourced from a limited number of suppliers or a single supplier. We endeavor to qualify multiple suppliers using a robust qualification process. In some cases, we also enter into long-term supply contracts for raw materials and components. Accordingly, we are exposed to price changes in the raw materials and components used in our solar modules and systems. In addition, the failure of a key supplier could disrupt our supply chain, which could result in higher prices and/or a disruption in our manufacturing or construction processes. We may be unable to pass along changes in the costs of the raw materials and components for our modules and systems to our customers and may be in default of our delivery obligations if we experience a manufacturing or construction disruption.
Credit Risk
We have certain financial and derivative instruments that subject us to credit risk. These consist primarily of cash, cash equivalents, marketable securities, accounts receivable, restricted cash and investments, notes receivable, and foreign exchange forward contracts. We are exposed to credit losses in the event of nonperformance by the counterparties to our financial and derivative instruments. We place cash, cash equivalents, marketable securities, restricted cash and investments, and foreign exchange forward contracts with various high-quality financial institutions and limit the amount of credit risk from any one counterparty. We continuously evaluate the credit standing of our counterparty financial institutions. Our net sales are primarily concentrated among a limited number of customers. We monitor the financial condition of our customers and perform credit evaluations whenever considered necessary. Depending upon the sales arrangement, we may require some form of payment security from our customers, including advance payments, parent guarantees, bank guarantees, surety bonds, or commercial letters of credit. We also have PPAs that subject us to credit risk in the event our offtake counterparties are unable to fulfill their contractual obligations, which may adversely affect our project assets and certain receivables. Accordingly, we closely monitor the credit standing of existing and potential offtake counterparties to limit such risks.
72
Item 8.
Financial Statements and Supplementary Data
Consolidated Financial Statements
Our consolidated financial statements as required by this item are included in Item 15. “Exhibits and Financial Statement Schedules.” See Item 15(a) for a list of our consolidated financial statements.
Selected Quarterly Financial Data (Unaudited)
The following selected quarterly financial data should be read in conjunction with our consolidated financial statements and the related notes thereto and Item 7. “Management’s Discussion and Analysis of Financial Condition and Results of Operations.” This information has been derived from our unaudited consolidated financial statements that, in our opinion, reflect all recurring adjustments necessary to fairly present this information when read in conjunction with our consolidated financial statements. The results of operations for any quarter are not necessarily indicative of the results to be expected for any future period.
|
|
Quarters Ended
|
|||||||||||||||||||||||||||||||
|
|
Dec 31,
2018 |
Sep 30,
2018 |
Jun 30,
2018 |
Mar 31,
2018 |
Dec 31, 2017
|
Sep 30,
2017 |
Jun 30,
2017 |
Mar 31,
2017 |
||||||||||||||||||||||||
|
|
(In thousands, except per share amounts)
|
|||||||||||||||||||||||||||||||
|
Net sales
|
$
|
691,241
|
|
$
|
676,220
|
|
$
|
309,318
|
|
$
|
567,265
|
|
$
|
339,181
|
|
$
|
1,087,026
|
|
$
|
623,326
|
|
$
|
891,791
|
|
||||||||
|
Gross profit (loss)
|
98,310
|
|
129,127
|
|
(8,058
|
)
|
172,798
|
|
62,070
|
|
291,800
|
|
110,893
|
|
84,184
|
|
||||||||||||||||
|
Production start-up
|
14,576
|
|
14,723
|
|
24,352
|
|
37,084
|
|
20,488
|
|
12,624
|
|
8,381
|
|
1,150
|
|
||||||||||||||||
|
Restructuring and asset impairments
|
—
|
|
—
|
|
—
|
|
—
|
|
(1,927
|
)
|
791
|
|
18,286
|
|
20,031
|
|
||||||||||||||||
|
Operating income (loss)
|
11,008
|
|
58,475
|
|
(103,634
|
)
|
74,264
|
|
(35,071
|
)
|
206,989
|
|
13,928
|
|
(7,995
|
)
|
||||||||||||||||
|
Net income (loss)
|
52,116
|
|
57,750
|
|
(48,491
|
)
|
82,951
|
|
(432,454
|
)
|
205,747
|
|
51,963
|
|
9,129
|
|
||||||||||||||||
|
Net income (loss) per share:
|
|
|
|
|
|
|
|
|
|
|
||||||||||||||||||||||
|
Basic
|
$
|
0.50
|
|
$
|
0.55
|
|
$
|
(0.46
|
)
|
$
|
0.79
|
|
$
|
(4.14
|
)
|
$
|
1.97
|
|
$
|
0.50
|
|
$
|
0.09
|
|
||||||||
|
Diluted
|
$
|
0.49
|
|
$
|
0.54
|
|
$
|
(0.46
|
)
|
$
|
0.78
|
|
$
|
(4.14
|
)
|
$
|
1.95
|
|
$
|
0.50
|
|
$
|
0.09
|
|
||||||||
Item 9.
Changes in and Disagreements with Accountants on Accounting and
Financial Disclosure
None.
Item 9A.
Controls and Procedures
Evaluation of Disclosure Controls and Procedures
We carried out an evaluation, under the supervision and with the participation of management, including our Chief Executive Officer and Chief Financial Officer, of the effectiveness of our “disclosure controls and procedures” as defined in Exchange Act Rule 13a-15(e) and 15d-15(e). Based on that evaluation, our Chief Executive Officer and Chief Financial Officer concluded that as of
December 31, 2018
our disclosure controls and procedures were effective to ensure that information required to be disclosed by us in reports that we file or submit under the Exchange Act is recorded, processed, summarized, and reported within the time periods specified in SEC rules and forms, and that such information is accumulated and communicated to our management, including our Chief Executive Officer and Chief Financial Officer, as appropriate, to allow timely decisions regarding required disclosure.
Management’s Report on Internal Control over Financial Reporting
Our management is responsible for establishing and maintaining adequate “internal control over financial reporting,” as defined in Exchange Act Rule 13a-15(f) and 15d-15(f). We also carried out an evaluation, under the supervision and with the participation of management, including our Chief Executive Officer and Chief Financial Officer, of the
73
effectiveness of our internal control over financial reporting as of
December 31, 2018
based on the criteria established in
Internal Control – Integrated Framework (2013)
issued by the Committee of Sponsoring Organizations of the Treadway Commission (“COSO”). Our internal control over financial reporting is a process designed to provide reasonable assurance regarding the reliability of financial reporting and the preparation of financial statements for external purposes in accordance with U.S. GAAP. Based on such evaluation, our management concluded that our internal control over financial reporting was effective as of
December 31, 2018
. The effectiveness of our internal control over financial reporting as of
December 31, 2018
has also been audited by PricewaterhouseCoopers LLP, an independent registered public accounting firm, as stated in its report which appears herein.
Changes in Internal Control over Financial Reporting
We also carried out an evaluation, under the supervision and with the participation of management, including our Chief Executive Officer and Chief Financial Officer, of our “internal control over financial reporting” to determine whether any changes in our internal control over financial reporting occurred during the quarter ended
December 31, 2018
that materially affected, or are reasonably likely to materially affect, our internal control over financial reporting. Based on that evaluation, there were no such changes in our internal control over financial reporting that occurred during the quarter ended
December 31, 2018
.
Limitations on the Effectiveness of Controls
Control systems, no matter how well designed and operated, can provide only reasonable, not absolute, assurance that the control systems’ objectives are being met. Further, the design of any system of controls must reflect the fact that there are resource constraints, and the benefits of all controls must be considered relative to their costs. Because of the inherent limitations in all control systems, no evaluation of controls can provide absolute assurance that all control issues and instances of fraud, if any, within our Company have been detected. These inherent limitations include the realities that judgments in decision-making can be faulty and that breakdowns can occur because of error or mistake. Control systems can also be circumvented by the individual acts of some persons, by collusion of two or more people, or by management override of the controls. The design of any system of controls is also based in part upon certain assumptions about the likelihood of future events, and there can be no assurance that any design will succeed in achieving its stated goals under all potential future conditions. Over time, controls may become inadequate because of changes in conditions or deterioration in the degree of compliance with policies or procedures.
Item 9B.
Other Information
None.
PART III
Item 10.
Directors, Executive Officers, and Corporate Governance
For information with respect to our executive officers, see Item 1. “Business – Executive Officers of the Registrant.” Information concerning our board of directors and audit committee of our board of directors will appear in our
2019
Proxy Statement, under the sections entitled “Directors” and “Corporate Governance,” and information concerning Section 16(a) beneficial ownership reporting compliance will appear in our
2019
Proxy Statement under the section entitled “Section 16(a) Beneficial Ownership Reporting Compliance.” We have adopted a Code of Business Conduct and Ethics that applies to all directors, officers, and associates of First Solar. Information concerning this code will appear in our
2019
Proxy Statement under the section entitled “Corporate Governance.” The information in such sections of the Proxy Statement is incorporated by reference into this Annual Report on Form 10-K.
74
Item 11.
Executive Compensation
Information concerning executive compensation and related information will appear in our
2019
Proxy Statement under the section entitled “Executive Compensation,” and information concerning the compensation committee of our board of directors will appear under “Corporate Governance” and “Compensation Committee Report.” The information in such sections of the
2019
Proxy Statement is incorporated by reference into this Annual Report on Form 10-K.
Item 12.
Security Ownership of Certain Beneficial Owners and Management
and Related Stockholder Matters
Information concerning the security ownership of certain beneficial owners and management and related stockholder matters, including certain information regarding our equity compensation plans, will appear in our
2019
Proxy Statement under the section entitled “Security Ownership of Certain Beneficial Owners and Management and Related Stockholder Matters.” The information in such section of the Proxy Statement is incorporated by reference into this Annual Report on Form 10-K.
Equity Compensation Plans
The following table sets forth certain information as of
December 31, 2018
concerning securities authorized for issuance under our equity compensation plans:
|
Plan Category
|
Number of Securities to be Issued Upon Exercise of Outstanding Options and Rights
(a)(1) |
Weighted-Average Exercise Price of Outstanding Options and Rights
(b)(2) |
Number of Securities Remaining Available for Future Issuance Under Equity Compensation Plans (Excluding Securities Reflected in Column (a))
(c)(3) |
|||||||
|
Equity compensation plans approved by stockholders
|
2,474,287
|
|
$
|
—
|
|
3,540,439
|
|
|||
|
Equity compensation plans not approved by stockholders
|
—
|
|
—
|
|
—
|
|
||||
|
Total
|
2,474,287
|
|
$
|
—
|
|
3,540,439
|
|
|||
——————————
|
(1)
|
Includes
2,474,287
shares issuable upon vesting of restricted stock units (“RSUs”) granted under our 2010 and 2015 Omnibus Incentive Compensation Plans.
|
|
(2)
|
The weighted-average exercise price does not take into account the shares issuable upon vesting of outstanding RSUs, which have no exercise price.
|
|
(3)
|
Includes
579,566
shares of common stock reserved for future issuance under our stock purchase plan for employees.
|
See Note 18. “Share-Based Compensation”
to our consolidated financial statements for further discussion on our equity compensation plans.
75
Item 13.
Certain Relationships and Related Transactions, and Director
Independence
Information concerning certain relationships and related party transactions will appear in our
2019
Proxy Statement under the section entitled “Certain Relationships and Related Party Transactions,” and information concerning director independence will appear in our
2019
Proxy Statement under the section entitled “Corporate Governance.” The information in such sections of the Proxy Statement is incorporated by reference into this Annual Report on Form 10-K.
Item 14.
Principal Accounting Fees and Services
Information concerning principal accounting fees and services and the audit committee of our board of directors’ pre-approval policies and procedures for these items will appear in our
2019
Proxy Statement under the section entitled “Principal Accounting Fees and Services.” The information in such section of the Proxy Statement is incorporated by reference into this Annual Report on Form 10-K.
PART IV
Item 15.
Exhibits and Financial Statement Schedules
|
(a)
|
Documents.
The following documents are filed as part of this Annual Report on Form 10-K:
|
Report of Independent Registered Public Accounting Firm
Consolidated Balance Sheets
Consolidated Statements of Operations
Consolidated Statements of Comprehensive Income
Consolidated Statements of Stockholders’ Equity
Consolidated Statements of Cash Flows
Notes to Consolidated Financial Statements
|
(b)
|
Exhibits.
Unless otherwise noted, the exhibits listed on the accompanying Index to Exhibits are filed with or incorporated by reference into this Annual Report on Form 10-K.
|
|
(c)
|
Financial Statement Schedules.
All financial statement schedules have been omitted as the required information is not applicable or is not material to require presentation of the schedule, or because the information required is included in the consolidated financial statements and notes thereto of this Annual Report on Form 10-K.
|
76
Report of Independent Registered Public Accounting Firm
To the Board of Directors and Stockholders of First Solar, Inc.
Opinions on the Financial Statements and Internal Control over Financial Reporting
We have audited the accompanying consolidated balance sheets of First Solar, Inc. and its subsidiaries (“the Company”) as of
December 31, 2018
and
2017
, and the related consolidated statements of operations, comprehensive income, stockholders’ equity, and cash flows for each of the three years in the period ended
December 31, 2018
, including the related notes (collectively referred to as the “consolidated financial statements”).
We also have audited the Company’s internal control over financial reporting as of
December 31, 2018
, based on criteria established in
Internal Control – Integrated Framework
(2013)
issued by the Committee of Sponsoring Organizations of the Treadway Commission (“COSO”).
In our opinion, the consolidated financial statements referred to above present fairly, in all material respects, the financial position of the Company as of
December 31, 2018
and
2017
, and the results of its operations and its cash flows for each of the three years in the period ended
December 31, 2018
in conformity with accounting principles generally accepted in the United States of America. Also in our opinion, the Company maintained, in all material respects, effective internal control over financial reporting as of
December 31, 2018
, based on criteria established in
Internal Control – Integrated Framework (2013)
issued by the COSO.
Basis for Opinions
The Company’s management is responsible for these consolidated financial statements, for maintaining effective internal control over financial reporting, and for its assessment of the effectiveness of internal control over financial reporting, included in Management’s Report on Internal Control over Financial Reporting appearing under Item 9A. Our responsibility is to express opinions on the Company’s consolidated
financial statements and on the Company’s internal control over financial reporting based on our audits. We are a public accounting firm registered with the Public Company Accounting Oversight Board (United States) (“PCAOB”) and are required to be independent with respect to the Company in accordance with the United States federal securities laws and the applicable rules and regulations of the Securities and Exchange Commission and the PCAOB.
We conducted our audits in accordance with the standards of the PCAOB. Those standards require that we plan and perform the audits to obtain reasonable assurance about whether the consolidated financial statements are free of material misstatement, whether due to error or fraud, and whether effective internal control over financial reporting was maintained in all material respects.
Our audits of the consolidated financial statements included performing procedures to assess the risks of material misstatement of the consolidated financial statements, whether due to error or fraud, and performing procedures that respond to those risks. Such procedures included examining, on a test basis, evidence regarding the amounts and disclosures in the consolidated financial statements. Our audits also included evaluating the accounting principles used and significant estimates made by management, as well as evaluating the overall presentation of the consolidated
financial statements. Our audit of internal control over financial reporting included obtaining an understanding of internal control over financial reporting, assessing the risk that a material weakness exists, and testing and evaluating the design and operating effectiveness of internal control based on the assessed risk. Our audits also included performing such other procedures as we considered necessary in the circumstances. We believe that our audits provide a reasonable basis for our opinions.
Definition and Limitations of Internal Control over Financial Reporting
A company’s internal control over financial reporting is a process designed to provide reasonable assurance regarding the reliability of financial reporting and the preparation of financial statements for external purposes in accordance
77
with generally accepted accounting principles. A company’s internal control over financial reporting includes those policies and procedures that (i) pertain to the maintenance of records that, in reasonable detail, accurately and fairly reflect the transactions and dispositions of the assets of the company; (ii) provide reasonable assurance that transactions are recorded as necessary to permit preparation of financial statements in accordance with generally accepted accounting principles, and that receipts and expenditures of the company are being made only in accordance with authorizations of management and directors of the company; and (iii) provide reasonable assurance regarding prevention or timely detection of unauthorized acquisition, use, or disposition of the company’s assets that could have a material effect on the financial statements.
Because of its inherent limitations, internal control over financial reporting may not prevent or detect misstatements. Also, projections of any evaluation of effectiveness to future periods are subject to the risk that controls may become inadequate because of changes in conditions, or that the degree of compliance with the policies or procedures may deteriorate.
/s/ PricewaterhouseCoopers LLP
Phoenix, Arizona
February 21, 2019
We have served as the Company’s or its predecessor’s auditor since 2000, which includes periods before the Company became subject to SEC reporting requirements.
78
FIRST SOLAR, INC. AND SUBSIDIARIES
CONSOLIDATED BALANCE SHEETS
(In thousands, except share data)
|
December 31,
|
||||||||
|
2018
|
2017
|
|||||||
|
ASSETS
|
||||||||
|
Current assets:
|
|
|
||||||
|
Cash and cash equivalents
|
$
|
1,403,562
|
|
$
|
2,268,534
|
|
||
|
Marketable securities
|
1,143,704
|
|
720,379
|
|
||||
|
Accounts receivable trade, net
|
128,282
|
|
211,797
|
|
||||
|
Accounts receivable, unbilled and retainage
|
458,166
|
|
174,608
|
|
||||
|
Inventories
|
387,912
|
|
172,370
|
|
||||
|
Balance of systems parts
|
56,906
|
|
28,840
|
|
||||
|
Project assets
|
37,930
|
|
77,931
|
|
||||
|
Notes receivable, affiliate
|
—
|
|
20,411
|
|
||||
|
Prepaid expenses and other current assets
|
243,061
|
|
157,902
|
|
||||
|
Total current assets
|
3,859,523
|
|
3,832,772
|
|
||||
|
Property, plant and equipment, net
|
1,756,211
|
|
1,154,537
|
|
||||
|
PV solar power systems, net
|
308,640
|
|
417,108
|
|
||||
|
Project assets
|
460,499
|
|
424,786
|
|
||||
|
Deferred tax assets, net
|
77,682
|
|
51,417
|
|
||||
|
Restricted cash and investments
|
318,390
|
|
424,783
|
|
||||
|
Equity method investments
|
3,186
|
|
217,230
|
|
||||
|
Goodwill
|
14,462
|
|
14,462
|
|
||||
|
Intangible assets, net
|
74,162
|
|
80,227
|
|
||||
|
Inventories
|
130,083
|
|
113,277
|
|
||||
|
Notes receivable, affiliates
|
22,832
|
|
48,370
|
|
||||
|
Other assets
|
95,692
|
|
85,532
|
|
||||
|
Total assets
|
$
|
7,121,362
|
|
$
|
6,864,501
|
|
||
|
LIABILITIES AND STOCKHOLDERS’ EQUITY
|
||||||||
|
Current liabilities:
|
|
|
|
|
||||
|
Accounts payable
|
$
|
233,287
|
|
$
|
120,220
|
|
||
|
Income taxes payable
|
20,885
|
|
19,581
|
|
||||
|
Accrued expenses
|
441,580
|
|
366,827
|
|
||||
|
Current portion of long-term debt
|
5,570
|
|
13,075
|
|
||||
|
Deferred revenue
|
129,755
|
|
81,816
|
|
||||
|
Other current liabilities
|
14,380
|
|
48,757
|
|
||||
|
Total current liabilities
|
845,457
|
|
650,276
|
|
||||
|
Accrued solar module collection and recycling liability
|
134,442
|
|
166,609
|
|
||||
|
Long-term debt
|
461,221
|
|
380,465
|
|
||||
|
Other liabilities
|
467,839
|
|
568,454
|
|
||||
|
Total liabilities
|
1,908,959
|
|
1,765,804
|
|
||||
|
Commitments and contingencies
|
|
|
|
|
||||
|
Stockholders’ equity:
|
||||||||
|
Common stock, $0.001 par value per share; 500,000,000 shares authorized; 104,885,261 and 104,468,460 shares issued and outstanding at December 31, 2018 and 2017, respectively
|
105
|
|
104
|
|
||||
|
Additional paid-in capital
|
2,825,211
|
|
2,799,107
|
|
||||
|
Accumulated earnings
|
2,441,553
|
|
2,297,227
|
|
||||
|
Accumulated other comprehensive (loss) income
|
(54,466
|
)
|
2,259
|
|
||||
|
Total stockholders’ equity
|
5,212,403
|
|
5,098,697
|
|
||||
|
Total liabilities and stockholders’ equity
|
$
|
7,121,362
|
|
$
|
6,864,501
|
|
||
See accompanying notes to these consolidated financial statements.
79
FIRST SOLAR, INC. AND SUBSIDIARIES
CONSOLIDATED STATEMENTS OF OPERATIONS
(In thousands, except per share amounts)
|
|
Years Ended December 31,
|
|||||||||||
|
2018
|
2017
|
2016
|
||||||||||
|
Net sales
|
$
|
2,244,044
|
|
$
|
2,941,324
|
|
$
|
2,904,563
|
|
|||
|
Cost of sales
|
1,851,867
|
|
2,392,377
|
|
2,266,145
|
|
||||||
|
Gross profit
|
392,177
|
|
548,947
|
|
638,418
|
|
||||||
|
Operating expenses:
|
||||||||||||
|
Selling, general and administrative
|
176,857
|
|
202,699
|
|
261,994
|
|
||||||
|
Research and development
|
84,472
|
|
88,573
|
|
124,762
|
|
||||||
|
Production start-up
|
90,735
|
|
42,643
|
|
1,021
|
|
||||||
|
Restructuring and asset impairments
|
—
|
|
37,181
|
|
743,862
|
|
||||||
|
Goodwill impairment
|
—
|
|
—
|
|
74,930
|
|
||||||
|
Total operating expenses
|
352,064
|
|
371,096
|
|
1,206,569
|
|
||||||
|
Operating income (loss)
|
40,113
|
|
177,851
|
|
(568,151
|
)
|
||||||
|
Foreign currency loss, net
|
(570
|
)
|
(9,640
|
)
|
(14,007
|
)
|
||||||
|
Interest income
|
59,788
|
|
35,704
|
|
25,193
|
|
||||||
|
Interest expense, net
|
(25,921
|
)
|
(25,765
|
)
|
(20,538
|
)
|
||||||
|
Other income, net
|
39,737
|
|
23,965
|
|
40,252
|
|
||||||
|
Income (loss) before taxes and equity in earnings
|
113,147
|
|
202,115
|
|
(537,251
|
)
|
||||||
|
Income tax expense
|
(3,441
|
)
|
(371,996
|
)
|
(23,167
|
)
|
||||||
|
Equity in earnings, net of tax
|
34,620
|
|
4,266
|
|
144,306
|
|
||||||
|
Net income (loss)
|
$
|
144,326
|
|
$
|
(165,615
|
)
|
$
|
(416,112
|
)
|
|||
|
Net income (loss) per share:
|
||||||||||||
|
Basic
|
$
|
1.38
|
|
$
|
(1.59
|
)
|
$
|
(4.05
|
)
|
|||
|
Diluted
|
$
|
1.36
|
|
$
|
(1.59
|
)
|
$
|
(4.05
|
)
|
|||
|
Weighted-average number of shares used in per share calculations:
|
||||||||||||
|
Basic
|
104,745
|
|
104,328
|
|
102,866
|
|
||||||
|
Diluted
|
106,113
|
|
104,328
|
|
102,866
|
|
||||||
See accompanying notes to these consolidated financial statements.
80
FIRST SOLAR, INC. AND SUBSIDIARIES
CONSOLIDATED STATEMENTS OF COMPREHENSIVE INCOME
(In thousands)
|
Years Ended December 31,
|
||||||||||||
|
2018
|
2017
|
2016
|
||||||||||
|
Net income (loss)
|
$
|
144,326
|
|
$
|
(165,615
|
)
|
$
|
(416,112
|
)
|
|||
|
Other comprehensive (loss) income:
|
||||||||||||
|
Foreign currency translation adjustments
|
(1,034
|
)
|
11,832
|
|
(7,409
|
)
|
||||||
|
Unrealized (loss) gain on marketable securities and restricted investments, net of tax of $3,735, $(588), and $2,518
|
(57,747
|
)
|
3,217
|
|
(21,713
|
)
|
||||||
|
Unrealized gain (loss) on derivative instruments, net of tax of $(996), $1,396, and $(691)
|
2,056
|
|
(2,883
|
)
|
3,735
|
|
||||||
|
Other comprehensive (loss) income
|
(56,725
|
)
|
12,166
|
|
(25,387
|
)
|
||||||
|
Comprehensive income (loss)
|
$
|
87,601
|
|
$
|
(153,449
|
)
|
$
|
(441,499
|
)
|
|||
See accompanying notes to these consolidated financial statements.
81
FIRST SOLAR, INC. AND SUBSIDIARIES
CONSOLIDATED STATEMENTS OF STOCKHOLDERS’ EQUITY
(In thousands)
|
|
Common Stock
|
Additional
Paid-In
Capital
|
Accumulated Earnings
|
Accumulated
Other
Comprehensive (Loss) Income
|
Total
Equity
|
||||||||||||||||||
|
|
Shares
|
Amount
|
|||||||||||||||||||||
|
Balance at December 31, 2015
|
101,767
|
|
$
|
102
|
|
$
|
2,748,894
|
|
$
|
2,853,920
|
|
$
|
15,480
|
|
$
|
5,618,396
|
|
||||||
|
Cumulative-effect adjustment for the adoption of ASU 2016-09
|
—
|
|
—
|
|
2,420
|
|
25,034
|
|
—
|
|
27,454
|
|
|||||||||||
|
Net loss
|
—
|
|
—
|
|
—
|
|
(416,112
|
)
|
—
|
|
(416,112
|
)
|
|||||||||||
|
Other comprehensive loss
|
—
|
|
—
|
|
—
|
|
—
|
|
(25,387
|
)
|
(25,387
|
)
|
|||||||||||
|
Common stock issued for share-based compensation
|
2,574
|
|
2
|
|
6,318
|
|
—
|
|
—
|
|
6,320
|
|
|||||||||||
|
Tax withholding related to vesting of restricted stock
|
(306
|
)
|
—
|
|
(20,407
|
)
|
—
|
|
—
|
|
(20,407
|
)
|
|||||||||||
|
Share-based compensation expense
|
—
|
|
—
|
|
28,085
|
|
—
|
|
—
|
|
28,085
|
|
|||||||||||
|
Balance at December 31, 2016
|
104,035
|
|
104
|
|
2,765,310
|
|
2,462,842
|
|
(9,907
|
)
|
5,218,349
|
|
|||||||||||
|
Net loss
|
—
|
|
—
|
|
—
|
|
(165,615
|
)
|
—
|
|
(165,615
|
)
|
|||||||||||
|
Other comprehensive income
|
—
|
|
—
|
|
—
|
|
—
|
|
12,166
|
|
12,166
|
|
|||||||||||
|
Common stock issued for share-based compensation
|
580
|
|
—
|
|
4,474
|
|
—
|
|
—
|
|
4,474
|
|
|||||||||||
|
Tax withholding related to vesting of restricted stock
|
(147
|
)
|
—
|
|
(5,137
|
)
|
—
|
|
—
|
|
(5,137
|
)
|
|||||||||||
|
Share-based compensation expense
|
—
|
|
—
|
|
34,460
|
|
—
|
|
—
|
|
34,460
|
|
|||||||||||
|
Balance at December 31, 2017
|
104,468
|
|
104
|
|
2,799,107
|
|
2,297,227
|
|
2,259
|
|
5,098,697
|
|
|||||||||||
|
Net income
|
—
|
|
—
|
|
—
|
|
144,326
|
|
—
|
|
144,326
|
|
|||||||||||
|
Other comprehensive loss
|
—
|
|
—
|
|
—
|
|
—
|
|
(56,725
|
)
|
(56,725
|
)
|
|||||||||||
|
Common stock issued for share-based compensation
|
588
|
|
1
|
|
3,425
|
|
—
|
|
—
|
|
3,426
|
|
|||||||||||
|
Tax withholding related to vesting of restricted stock
|
(171
|
)
|
—
|
|
(11,175
|
)
|
—
|
|
—
|
|
(11,175
|
)
|
|||||||||||
|
Share-based compensation expense
|
—
|
|
—
|
|
33,854
|
|
—
|
|
—
|
|
33,854
|
|
|||||||||||
|
Balance at December 31, 2018
|
104,885
|
|
$
|
105
|
|
$
|
2,825,211
|
|
$
|
2,441,553
|
|
$
|
(54,466
|
)
|
$
|
5,212,403
|
|
||||||
See accompanying notes to these consolidated financial statements.
82
FIRST SOLAR, INC. AND SUBSIDIARIES
CONSOLIDATED STATEMENTS OF CASH FLOWS
(In thousands)
|
|
Years Ended December 31,
|
|||||||||||
|
2018
|
2017
|
2016
|
||||||||||
|
Cash flows from operating activities:
|
|
|
|
|||||||||
|
Net income (loss)
|
$
|
144,326
|
|
$
|
(165,615
|
)
|
$
|
(416,112
|
)
|
|||
|
Adjustments to reconcile net income (loss) to cash (used in) provided by operating activities:
|
||||||||||||
|
Depreciation, amortization and accretion
|
130,736
|
|
115,313
|
|
230,940
|
|
||||||
|
Impairments and net losses on disposal of long-lived assets
|
8,065
|
|
35,364
|
|
838,467
|
|
||||||
|
Share-based compensation
|
34,154
|
|
35,121
|
|
28,712
|
|
||||||
|
Equity in earnings, net of tax
|
(34,620
|
)
|
(4,266
|
)
|
(144,306
|
)
|
||||||
|
Distributions received from equity method investments
|
12,394
|
|
23,042
|
|
18,562
|
|
||||||
|
Remeasurement of monetary assets and liabilities
|
8,740
|
|
(15,823
|
)
|
5,442
|
|
||||||
|
Deferred income taxes
|
(10,112
|
)
|
173,368
|
|
90,555
|
|
||||||
|
Gains on sales of marketable securities and restricted investments
|
(55,405
|
)
|
(49
|
)
|
(41,632
|
)
|
||||||
|
Noncash consideration from the sale of systems
|
—
|
|
—
|
|
(20,091
|
)
|
||||||
|
Liabilities assumed by customers for the sale of systems
|
(240,865
|
)
|
(24,203
|
)
|
—
|
|
||||||
|
Other, net
|
2,121
|
|
2,339
|
|
13,863
|
|
||||||
|
Changes in operating assets and liabilities:
|
||||||||||||
|
Accounts receivable, trade, unbilled and retainage
|
(202,298
|
)
|
85,760
|
|
178,894
|
|
||||||
|
Prepaid expenses and other current assets
|
(53,488
|
)
|
26,680
|
|
9,269
|
|
||||||
|
Inventories and balance of systems parts
|
(257,229
|
)
|
212,758
|
|
95,785
|
|
||||||
|
Project assets and PV solar power systems
|
49,939
|
|
981,273
|
|
(571,655
|
)
|
||||||
|
Other assets
|
(11,920
|
)
|
(1,269
|
)
|
(19,245
|
)
|
||||||
|
Income tax receivable and payable
|
(49,169
|
)
|
169,079
|
|
(61,383
|
)
|
||||||
|
Accounts payable
|
96,443
|
|
(47,191
|
)
|
(191,642
|
)
|
||||||
|
Accrued expenses and other liabilities
|
132,382
|
|
(258,028
|
)
|
158,693
|
|
||||||
|
Accrued solar module collection and recycling liability
|
(31,003
|
)
|
(2,976
|
)
|
3,637
|
|
||||||
|
Net cash (used in) provided by operating activities
|
(326,809
|
)
|
1,340,677
|
|
206,753
|
|
||||||
|
Cash flows from investing activities:
|
||||||||||||
|
Purchases of property, plant and equipment
|
(739,838
|
)
|
(514,357
|
)
|
(229,452
|
)
|
||||||
|
Purchases of marketable securities and restricted investments
|
(1,369,036
|
)
|
(580,971
|
)
|
(422,609
|
)
|
||||||
|
Proceeds from sales and maturities of marketable securities and restricted investments
|
1,135,984
|
|
466,309
|
|
525,515
|
|
||||||
|
Proceeds from sales of equity method investments
|
247,595
|
|
—
|
|
291,502
|
|
||||||
|
Payments received on notes receivable, affiliates
|
48,729
|
|
1,740
|
|
3,053
|
|
||||||
|
Other investing activities
|
(6,148
|
)
|
477
|
|
(23,489
|
)
|
||||||
|
Net cash (used in) provided by investing activities
|
(682,714
|
)
|
(626,802
|
)
|
144,520
|
|
||||||
|
Cash flows from financing activities:
|
||||||||||||
|
Repayment of borrowings under revolving credit facility
|
—
|
|
—
|
|
(550,000
|
)
|
||||||
|
Proceeds from borrowings under revolving credit facility
|
—
|
|
—
|
|
550,000
|
|
||||||
|
Repayment of long-term debt
|
(18,937
|
)
|
(24,078
|
)
|
(137,367
|
)
|
||||||
|
Proceeds from borrowings under long-term debt, net of discounts and issuance costs
|
290,925
|
|
215,415
|
|
26,816
|
|
||||||
|
Payments of tax withholdings for restricted shares
|
(11,175
|
)
|
(5,137
|
)
|
(20,407
|
)
|
||||||
|
Proceeds from commercial letters of credit
|
—
|
|
43,025
|
|
—
|
|
||||||
|
Contingent consideration payments and other financing activities
|
(5,585
|
)
|
(37,180
|
)
|
(5,435
|
)
|
||||||
|
Net cash provided by (used in) financing activities
|
255,228
|
|
192,045
|
|
(136,393
|
)
|
||||||
|
Effect of exchange rate changes on cash, cash equivalents and restricted cash
|
(13,558
|
)
|
8,866
|
|
(6,306
|
)
|
||||||
|
Net (decrease) increase in cash, cash equivalents and restricted cash
|
(767,853
|
)
|
914,786
|
|
208,574
|
|
||||||
|
Cash, cash equivalents and restricted cash, beginning of the period
|
2,330,476
|
|
1,415,690
|
|
1,207,116
|
|
||||||
|
Cash, cash equivalents and restricted cash, end of the period
|
$
|
1,562,623
|
|
$
|
2,330,476
|
|
$
|
1,415,690
|
|
|||
|
Supplemental disclosure of noncash investing and financing activities:
|
|
|
|
|
|
|
||||||
|
Property, plant and equipment acquisitions funded by liabilities
|
$
|
138,270
|
|
$
|
164,946
|
|
$
|
28,687
|
|
|||
|
Sale of system previously accounted for as sale-leaseback financing
|
$
|
31,992
|
|
$
|
—
|
|
$
|
—
|
|
|||
|
Acquisitions currently or previously funded by liabilities and contingent consideration
|
$
|
2,915
|
|
$
|
9,315
|
|
$
|
30,092
|
|
|||
|
Accrued interest capitalized to long-term debt
|
$
|
3,512
|
|
$
|
18,401
|
|
$
|
—
|
|
|||
|
Sale of equity method investment funded by note receivable, affiliate
|
$
|
—
|
|
$
|
—
|
|
$
|
50,000
|
|
|||
See accompanying notes to these consolidated financial statements.
83
FIRST SOLAR, INC. AND SUBSIDIARIES
NOTES TO CONSOLIDATED FINANCIAL STATEMENTS
1. First Solar and Its Business
We are a leading global provider of comprehensive PV solar energy solutions. We design, manufacture, and sell PV solar modules with an advanced thin film semiconductor technology and also develop, design, construct, and sell PV solar power systems that primarily use the modules we manufacture. Additionally, we provide O&M services to system owners. We have substantial, ongoing R&D efforts focused on module and system-level innovations. We are the world’s largest thin film PV solar module manufacturer and one of the world’s largest PV solar module manufacturers.
2. Summary of Significant Accounting Policies
Basis of Presentation.
These consolidated financial statements include the accounts of First Solar, Inc. and its subsidiaries and are prepared in accordance with U.S. GAAP. We eliminated all intercompany transactions and balances during consolidation. Certain prior year balances were reclassified to conform to the current year presentation.
Use of Estimates.
The preparation of consolidated financial statements in conformity with U.S. GAAP requires us to make estimates and assumptions that affect the amounts reported in our consolidated financial statements and the accompanying notes. On an ongoing basis, we evaluate our estimates, including those related to inputs used to recognize revenue over time, accrued solar module collection and recycling liabilities, product warranties, accounting for income taxes, long-lived asset impairments, and testing goodwill. Despite our intention to establish accurate estimates and reasonable assumptions, actual results could differ materially from such estimates and assumptions.
Fair Value Measurements.
We measure certain assets and liabilities at fair value, which is defined as the price that would be received from the sale of an asset or paid to transfer a liability (i.e., an exit price) on the measurement date in an orderly transaction between market participants in the principal or most advantageous market for the asset or liability. Our fair value measurements use the following hierarchy, which prioritizes valuation inputs based on the extent to which the inputs are observable in the market.
|
•
|
Level 1 – Valuation techniques in which all significant inputs are unadjusted quoted prices from active markets for assets or liabilities that are identical to the assets or liabilities being measured.
|
|
•
|
Level 2 – Valuation techniques in which significant inputs include quoted prices from active markets for assets or liabilities that are similar to the assets or liabilities being measured and/or quoted prices for assets or liabilities that are identical or similar to the assets or liabilities being measured from markets that are not active. Also, model-derived valuations in which all significant inputs are observable in active markets are Level 2 valuation techniques.
|
|
•
|
Level 3 – Valuation techniques in which one or more significant inputs are unobservable. Such inputs reflect our estimate of assumptions that market participants would use to price an asset or liability.
|
Cash and Cash Equivalents.
We consider highly liquid investments with original maturities of three months or less at the time of purchase to be cash equivalents with the exception of time deposits, which are presented as marketable securities.
Restricted Cash
. Restricted cash consists of cash and cash equivalents held by various banks to secure certain of our letters of credit and other such deposits designated for the construction or operation of systems projects as well as the payment of amounts related to project specific debt financings. Restricted cash also includes cash and cash equivalents held in custodial accounts to fund the estimated future costs of our solar module collection and recycling obligations.
84
Restricted cash for our letters of credit is classified as current or noncurrent based on the maturity date of the corresponding letter of credit. Restricted cash for project construction, operation, and financing is classified as current or noncurrent based on the intended use of the restricted funds. Restricted cash held in custodial accounts is classified as noncurrent to align with the nature of the corresponding collection and recycling liabilities.
Marketable Securities and Restricted Investments.
We determine the classification of our marketable securities and restricted investments at the time of purchase and reevaluate such designation at each balance sheet date. As of
December 31, 2018
and
2017
, all of our marketable securities and restricted investments were classified as available-for-sale debt securities. Accordingly, we record them at fair value and account for the net unrealized gains and losses as part of “
Accumulated other comprehensive (loss) income
” until realized. We record realized gains and losses on the sale of our marketable securities and restricted investments in “
Other income, net
” computed using the specific identification method.
We may sell marketable securities prior to their stated maturities after consideration of our liquidity requirements. We view unrestricted securities with maturities beyond 12 months as available to support our current operations and, accordingly, classify such securities as current assets under “
Marketable securities
” in the consolidated balance sheets. Restricted investments consist of long-term duration marketable securities that we hold in custodial accounts to fund the estimated future costs of our solar module collection and recycling obligations. Accordingly, we classify restricted investments as noncurrent assets under “
Restricted cash and investments
” in the consolidated balance sheets.
All of our available-for-sale marketable securities and restricted investments are subject to a periodic impairment review. We consider a marketable security or restricted investment to be impaired when its fair value is less than its cost basis, in which case we would further review the security or investment to determine if it is other-than-temporarily impaired. In performing such an evaluation, we review factors such as the length of time and the extent to which its fair value has been below its cost basis, the financial condition of the issuer and any changes thereto, our intent to sell, and whether it is more likely than not that we will be required to sell the marketable security or restricted investment before we have recovered its cost basis. If a marketable security or restricted investment were other-than-temporarily impaired, we write it down through “
Other income, net
” to its impaired value and establish that value as its new cost basis.
Accounts Receivable Trade and Allowance for Doubtful Accounts
. We record trade accounts receivable for our unconditional rights to consideration arising from our performance under contracts with customers. The carrying value of such receivables, net of the allowance for doubtful accounts, represents their estimated net realizable value. We estimate our allowance for doubtful accounts for specific trade receivable balances based on historical collection trends, the age of outstanding trade receivables, existing economic conditions, and the financial security, if any, associated with the receivables. Past-due trade receivable balances are written off when our internal collection efforts have been unsuccessful.
Our module and other equipment sales generally include up to 45-day payment terms following the transfer of control of the products to the customer. In addition, certain module and equipment sale agreements may require a down payment for a portion of the transaction price upon or shortly after entering into the agreement or related purchase order. Payment terms for sales of our solar power systems, EPC services, and operations and maintenance services vary by contract but are generally due upon demand or within several months of satisfying the associated performance obligations. As a practical expedient, we do not adjust the promised amount of consideration for the effects of a significant financing component when we expect, at contract inception, that the period between our transfer of a promised product or service to a customer and when the customer pays for that product or service will be one year or less. We typically do not include extended payment terms in our contracts with customers.
Accounts Receivable, Unbilled
. Accounts receivable, unbilled represents a contract asset for revenue that has been recognized in advance of billing the customer, which is common for long-term construction contracts. For example, we typically recognize revenue from contracts for the construction and sale of PV solar power systems over time using cost based input methods, which recognize revenue and gross profit as work is performed based on the relationship between actual costs incurred compared to the total estimated costs of the contract. Accordingly, revenue could be
85
recognized in advance of billing the customer, resulting in an amount recorded to “
Accounts receivable, unbilled and retainage
.” Once we have an unconditional right to consideration under a construction contract, we typically bill our customer and reclassify the “
Accounts receivable, unbilled and retainage
” to “
Accounts receivable trade, net
.” Billing requirements vary by contract but are generally structured around the completion of certain construction milestones. We assess our unbilled accounts receivable for impairment in accordance with the allowance for doubtful accounts policy described above.
Retainage.
Certain of our EPC contracts for PV solar power systems we build contain retainage provisions. Retainage represents a contract asset for the portion of the contract price earned by us for work performed, but held for payment by the customer as a form of security until we reach certain construction milestones. We consider whether collectibility of such retainage is reasonably assured in connection with our overall assessment of the collectibility of amounts due or that will become due under our EPC contracts. Retainage included within “
Accounts receivable, unbilled and retainage
” is expected to be billed and collected within the next 12 months. After we satisfy the EPC contract requirements and have an unconditional right to consideration, we typically bill for retainage and reclassify such amounts to “
Accounts receivable trade, net
.”
Inventories – Current and Noncurrent.
We report our inventories at the lower of cost or net realizable value. We determine cost on a first-in, first-out basis and include both the costs of acquisition and the costs of manufacturing in our inventory costs. These costs include direct materials, direct labor, and indirect manufacturing costs, including depreciation and amortization. Our capitalization of costs into inventory is based on the normal utilization of our plants. If our plant utilization is abnormally low, the portion of our indirect manufacturing costs related to the abnormal utilization level is expensed as incurred. Other abnormal manufacturing costs, such as wasted materials or excess yield losses, are also expensed as incurred. Finished goods inventory is comprised exclusively of solar modules that have not yet been installed in a PV solar power plant under construction or sold to a third-party customer.
As needed, we may purchase a critical raw material that is used in our core production process in quantities that exceed anticipated consumption within our normal operating cycle (which is 12 months). We classify such raw materials that we do not expect to consume within our normal operating cycle as noncurrent.
We regularly review the cost of inventories, including noncurrent inventories, against their estimated net realizable value and record write-downs if any inventories have costs in excess of their net realizable values. We also regularly evaluate the quantities and values of our inventories, including noncurrent inventories, in light of current market conditions and trends, among other factors, and record write-downs for any quantities in excess of demand or for any obsolescence. This evaluation considers the use of modules in our systems business, expected demand, anticipated sales prices, strategic raw material requirements, new product development schedules, product obsolescence, product merchantability, and other factors. Market conditions are subject to change, and actual consumption of our inventory could differ from forecasted demand.
Balance of Systems Parts.
BoS parts represent mounting, electrical, and other construction parts purchased for PV solar power systems to be constructed or currently under construction, which are not yet installed in a system. These construction parts include items such as posts, tilt brackets, tables, harnesses, combiner boxes, inverters, cables, tracker equipment, and other parts that we may purchase or assemble for the systems we construct. We carry these parts at the lower of cost or net realizable value and determine our BoS costs on a weighted-average basis. BoS parts do not include any solar modules that we manufacture.
Property, Plant and Equipment.
We report our property, plant and equipment at cost, less accumulated depreciation. Cost includes the price paid to acquire or construct the assets, required installation costs, interest capitalized during the construction period, and any expenditures that substantially add to the value of or substantially extend the useful life of the assets. We capitalize costs related to computer software obtained or developed for internal use, which generally includes enterprise-level business and finance software that we customize to meet our specific operational requirements. We expense repair and maintenance costs at the time we incur them.
86
We begin depreciation for our property, plant and equipment when they are placed in service. We consider such assets to be placed in service when they are both in the location and condition for their intended use. We compute depreciation expense using the straight-line method over the estimated useful lives of assets, as presented in the table below. We depreciate leasehold improvements over the shorter of their estimated useful lives or the remaining term of the lease. The estimated useful life of an asset is reassessed whenever applicable facts and circumstances indicate a change in the estimated useful life of such asset has occurred.
|
|
Useful Lives
in Years
|
|
|
Buildings and building improvements
|
25 – 40
|
|
|
Manufacturing machinery and equipment
|
5 – 10
|
|
|
Furniture, fixtures, computer hardware, and computer software
|
3 – 7
|
|
|
Leasehold improvements
|
up to 15
|
|
PV Solar Power Systems.
PV solar power systems represent project assets that we may temporarily own and operate after being placed in service. We report our PV solar power systems at cost, less accumulated depreciation. When we are entitled to incentive tax credits for our systems, we reduce the related carrying value of the assets by the amount of the tax credits, which reduces future depreciation. We begin depreciation for PV solar power systems when they are placed in service. We compute depreciation expense for the systems using the straight-line method over the shorter of the term of the related PPA or
25
years. Accordingly, our current PV solar power systems have estimated useful lives ranging from
19
to
25
years.
Project Assets.
Project assets primarily consist of costs related to solar power projects in various stages of development that are capitalized prior to the completion of the sale of the project, including projects that may have begun commercial operation under PPAs and are actively marketed and intended to be sold. These project related costs include costs for land, development, and construction of a PV solar power system. Development costs may include legal, consulting, permitting, transmission upgrade, interconnection, and other similar costs. We typically classify project assets as noncurrent due to the nature of solar power projects (long-lived assets) and the time required to complete all activities to develop, construct, and sell projects, which is typically longer than 12 months. Once we enter into a definitive sales agreement, we classify such project assets as current until the sale is completed and we have met all of the criteria to recognize the sale as revenue. Any income generated by a project while it remains within project assets is accounted for as a reduction to our basis in the project. If a project is completed and begins commercial operation prior to the closing of a sales arrangement, the completed project will remain in project assets until placed in service. We present all expenditures related to the development and construction of project assets, whether fully or partially owned, as a component of cash flows from operating activities.
We review project assets for impairment whenever events or changes in circumstances indicate that the carrying amount may not be recoverable. We consider a project commercially viable or recoverable if it is anticipated to be sold for a profit once it is either fully developed or fully constructed. We consider a partially developed or partially constructed project commercially viable or recoverable if the anticipated selling price is higher than the carrying value of the related project assets. We examine a number of factors to determine if the project is expected to be recoverable, including whether there are any changes in environmental, permitting, market pricing, regulatory, or other conditions that may impact the project. Such changes could cause the costs of the project to increase or the selling price of the project to decrease. If a project is not considered recoverable, we impair the respective project assets and adjust the carrying value to the estimated fair value, with the resulting impairment recorded within “Selling, general and administrative” expense.
Interest Capitalization
. We capitalize interest as part of the historical cost of acquiring or constructing certain assets, including property, plant and equipment; project assets; and PV solar power systems. Interest capitalized for property, plant and equipment or PV solar power systems is depreciated over the estimated useful life of the related assets when they are placed in service. We charge interest capitalized for project assets to cost of sales when such assets are sold and we have met all revenue recognition criteria. We capitalize interest to the extent that interest cost has been incurred
87
and payments have been made to acquire, construct, or develop an asset. We cease capitalization of interest for assets in development or under construction if the assets are substantially complete or if we have sold such assets.
Asset Impairments.
We assess long-lived assets classified as “held and used,” including our property, plant and equipment; project assets; PV solar power systems; and intangible assets for impairment whenever events or changes in circumstances arise, including consideration of technological obsolescence, that may indicate that the carrying amount of such assets may not be recoverable. These events and changes in circumstances may include a significant decrease in the market price of a long-lived asset; a significant adverse change in the extent or manner in which a long-lived asset is being used or in its physical condition; a significant adverse change in the business climate that could affect the value of a long-lived asset; an accumulation of costs significantly in excess of the amount originally expected for the acquisition or construction of a long-lived asset; a current-period operating or cash flow loss combined with a history of such losses or a projection of future losses associated with the use of a long-lived asset; or a current expectation that, more likely than not, a long-lived asset will be sold or otherwise disposed of significantly before the end of its previously estimated useful life. For purposes of recognition and measurement of an impairment loss, long-lived assets are grouped with other assets and liabilities at the lowest level for which identifiable cash flows are largely independent of the cash flows of other assets and liabilities.
When impairment indicators are present, we compare undiscounted future cash flows, including the eventual disposition of the asset group at market value, to the asset group’s carrying value to determine if the asset group is recoverable. If the carrying value of the asset group exceeds the undiscounted future cash flows, we measure any impairment by comparing the fair value of the asset group to its carrying value. Fair value is generally determined by considering (i) internally developed discounted cash flows for the asset group, (ii) third-party valuations, and/or (iii) information available regarding the current market value for such assets. If the fair value of an asset group is determined to be less than its carrying value, an impairment in the amount of the difference is recorded in the period that the impairment indicator occurs. Estimating future cash flows requires significant judgment, and such projections may vary from the cash flows eventually realized.
We consider a long-lived asset to be abandoned after we have ceased use of such asset and we have no intent to use or repurpose the asset in the future. Abandoned long-lived assets are recorded at their salvage value, if any.
We classify long-lived assets we plan to sell, excluding project assets and PV solar power systems, as held for sale on our consolidated balance sheets only after certain criteria have been met including: (i) management has the authority and commits to a plan to sell the asset, (ii) the asset is available for immediate sale in its present condition, (iii) an active program to locate a buyer and the plan to sell the asset have been initiated, (iv) the sale of the asset is probable within 12 months, (v) the asset is being actively marketed at a reasonable sales price relative to its current fair value, and (vi) it is unlikely that the plan to sell will be withdrawn or that significant changes to the plan will be made. We record assets held for sale at the lower of their carrying value or fair value less costs to sell. If, due to unanticipated circumstances, such assets are not sold in the 12 months after being classified as held for sale, then held for sale classification will continue as long as the above criteria are still met.
Ventures and Variable Interest Entities.
In the normal course of business, we establish wholly owned project companies which may be considered variable interest entities (“VIEs”). We consolidate wholly owned VIEs when we are considered the primary beneficiary of such entities. Additionally, we have, and may in the future form, joint venture type arrangements, including partnerships and partially owned limited liability companies or similar legal structures, with one or more third parties primarily to develop, construct, own, and/or sell solar power projects. We analyze all of our ventures and classify them into two groups: (i) ventures that must be consolidated because they are either not VIEs and we hold a majority voting interest, or because they are VIEs and we are the primary beneficiary and (ii) ventures that do not need to be consolidated because they are either not VIEs and we hold a minority voting interest, or because they are VIEs and we are not the primary beneficiary.
Ventures are considered VIEs if (i) the total equity investment at risk is not sufficient to permit the entity to finance its activities without additional subordinated financial support; (ii) as a group, the holders of the equity investment at risk
88
lack the ability to make certain decisions, the obligation to absorb expected losses, or the right to receive expected residual returns; or (iii) an equity investor has voting rights that are disproportionate to its economic interest and substantially all of the entity’s activities are conducted on behalf of that investor. Our venture agreements typically require us to fund some form of capital for the development and construction of a project, depending upon the opportunity and the market in which our ventures are located.
We are considered the primary beneficiary of and are required to consolidate a VIE if we have the power to direct the activities that most significantly impact the VIE’s economic performance and the obligation to absorb losses or the right to receive benefits of the VIE that could potentially be significant to the entity. If we determine that we do not have the power to direct the activities that most significantly impact the entity, then we are not the primary beneficiary of the VIE.
Equity Method Investments.
We use the equity method of accounting for our investments when we have the ability to significantly influence, but not control, the operations or financial activities of the investee. As part of this evaluation, we consider our participating and protective rights in the venture as well as its legal form. We record our equity method investments at cost and subsequently adjust their carrying amount each period for our share of the earnings or losses of the investee and other adjustments required by the equity method of accounting. Distributions received from our equity method investments are recorded as reductions in the carrying value of such investments and are classified on the consolidated statements of cash flows pursuant to the cumulative earnings approach. Under this approach, distributions received are considered returns on investment and are classified as cash inflows from operating activities unless our cumulative distributions received, less distributions received in prior periods that were determined to be returns of investment, exceed our cumulative equity in earnings recognized from the investment. When such an excess occurs, the current period distributions up to this excess are considered returns of investment and are classified as cash inflows from investing activities.
We monitor equity method investments for impairment and record reductions in their carrying values if the carrying amount of an investment exceeds its fair value. An impairment charge is recorded when such impairment is deemed to be other-than-temporary. To determine whether an impairment is other-than-temporary, we consider our ability and intent to hold the investment until the carrying amount is fully recovered. Circumstances that indicate an other-than-temporary impairment may have occurred include factors such as decreases in quoted market prices or declines in the operations of the investee. The evaluation of an investment for potential impairment requires us to exercise significant judgment and to make certain assumptions. The use of different judgments and assumptions could result in different conclusions. We recorded impairment losses related to our equity method investments of
$3.5 million
,
$2.0 million
, and
$0.6 million
, net of tax, during the years ended
December 31, 2018
,
2017
, and
2016
, respectively.
Goodwill.
Goodwill represents the excess of the purchase price of acquired businesses over the estimated fair value assigned to the individual assets acquired and liabilities assumed. We do not amortize goodwill, but instead are required to test goodwill for impairment at least annually. We perform impairment tests between the scheduled annual test in the fourth quarter if facts and circumstances indicate that it is more likely than not that the fair value of a reporting unit that has goodwill is less than its carrying value.
We may first make a qualitative assessment of whether it is more likely than not that a reporting unit’s fair value is less than its carrying value to determine whether it is necessary to perform a quantitative goodwill impairment test. Such qualitative impairment test considers various factors, including macroeconomic conditions, industry and market considerations, cost factors, the overall financial performance of a reporting unit, and any other relevant events affecting our company or a reporting unit. If we determine through the qualitative assessment that a reporting unit’s fair value is more likely than not greater than its carrying value, the quantitative impairment test is not required. If the qualitative assessment indicates it is more likely than not that a reporting unit’s fair value is less than its carrying value, we perform a quantitative impairment test. We may also elect to proceed directly to the quantitative impairment test without considering qualitative factors.
89
The quantitative impairment test is the comparison of the fair value of a reporting unit with its carrying amount, including goodwill. Our reporting units consist of our modules business and our fully integrated systems business. We define the fair value of a reporting unit as the price that would be received to sell the unit as a whole in an orderly transaction between market participants at the measurement date. We primarily use an income approach to estimate the fair value of our reporting units. Significant judgment is required when estimating the fair value of a reporting unit, including the forecasting of future operating results and the selection of discount and expected future growth rates used to determine projected cash flows. If the estimated fair value of a reporting unit exceeds its carrying value, goodwill is not impaired, and no further analysis is required. Conversely, if the carrying value of a reporting unit exceeds its estimated fair value, we record an impairment loss equal to the excess, not to exceed the total amount of goodwill allocated to the reporting unit.
Intangible Assets.
Intangible assets primarily include developed technologies or in-process research and development (“IPR&D”) from prior business acquisitions, certain PPAs acquired after the associated PV solar power systems were placed in service, and our internally-generated intangible assets, substantially all of which were patents on technologies related to our products and production processes. We record an asset for patents after the patent has been issued based on the legal, filing, and other costs incurred to secure it. IPR&D is initially capitalized at fair value as an intangible asset with an indefinite life and periodically assessed for impairment. When the IPR&D project is complete, it is reclassified as a definite-lived intangible asset. We amortize intangible assets on a straight-line basis over their estimated useful lives, which generally range from
10
to
20
years.
Deferred Revenue.
When we receive consideration, or such consideration is unconditionally due, from a customer prior to transferring goods or services to the customer under the terms of a sales contract, we record deferred revenue, which represents a contract liability. We recognize deferred revenue as net sales after we have transferred control of the goods or services to the customer and all revenue recognition criteria are met. As a practical expedient, we do not adjust the consideration in a contract for the effects of a significant financing component when we expect, at contract inception, that the period between a customer’s down payment and our transfer of a promised product or service to the customer will be one year or less. Additionally, we do not adjust the consideration in a contract for the effects of a significant financing component when the consideration is received as a form of performance security.
Product Warranties.
We provide a limited PV solar module warranty covering defects in materials and workmanship under normal use and service conditions for approximately 10 years. We also typically warrant that modules installed in accordance with agreed-upon specifications will produce at least
98%
of their labeled power output rating during the first year, with the warranty coverage reducing by
0.5%
every year thereafter throughout the approximate 25-year limited power output warranty period. In resolving claims under both the limited defect and power output warranties, we typically have the option of either repairing or replacing the covered modules or, under the limited power output warranty, providing additional modules to remedy the power shortfall. Our limited module warranties also include an option for us to remedy claims under such warranties, generally exercisable only after the second year of the warranty period, by making certain cash payments. Under the limited workmanship warranty, the optional cash payment will be equal to the original purchase price of the module, reduced by a degradation factor, and under the limited power output warranty, the cash payment will be equal to the shortfall in power output. Such limited module warranties are standard for module sales and may be transferred from the original purchasers of the solar modules to subsequent purchasers upon resale.
As an alternative form of our standard limited module power output warranty, we also offer an aggregated or system-level limited module performance warranty. This system-level limited module performance warranty is designed for utility-scale systems and provides
25
-year system-level energy degradation protection. This warranty represents a practical expedient to address the challenge of identifying, from the potential millions of modules installed in a utility-scale system, individual modules that may be performing below warranty thresholds by focusing on the aggregate energy generated by the system rather than the power output of individual modules. The system-level limited module performance warranty is typically calculated as a percentage of a system’s expected energy production, adjusted for certain actual site conditions, with the warranted level of performance declining each year in a linear fashion, but never falling below
80%
during the term of the warranty. In resolving claims under the system-level limited module
90
performance warranty to restore the system to warranted performance levels, we first must validate that the root cause of the issue is due to module performance; we then have the option of either repairing or replacing the covered modules, providing supplemental modules, or making a cash payment. Consistent with our limited module power output warranty, when we elect to satisfy a warranty claim by providing replacement or supplemental modules under the system-level module performance warranty, we do not have any obligation to pay for the labor to remove or install modules.
In addition to our limited solar module warranties described above, for PV solar power systems we construct, we typically provide limited warranties for defects in engineering design, installation, and BoS part workmanship for a period of one to two years following the substantial completion of a system or a block within the system. In resolving claims under such BoS warranties, we have the option of remedying the defect through repair or replacement.
When we recognize revenue for module or system sales, we accrue liabilities for the estimated future costs of meeting our limited warranty obligations. We make and revise these estimates based primarily on the number of our solar modules under warranty installed at customer locations, our historical experience with warranty claims, our monitoring of field installation sites, our internal testing of and the expected future performance of our solar modules and BoS parts, and our estimated per-module replacement costs.
Accrued Solar Module Collection and Recycling Liability.
Historically, we have recognized expense at the time of sale for the estimated cost of our future obligations for collecting and recycling solar modules covered by our solar module collection and recycling program. See
Note 13. “Solar Module Collection and Recycling Liability”
for further information.
Asset Retirement Obligations.
We develop, construct, and operate certain project assets and PV solar power systems with land lease agreements that include a requirement for the removal of the assets at the end of the lease. We also lease certain land for our manufacturing facilities and administrative offices under agreements that require the removal of our property or leasehold improvements upon termination of the lease.
We recognize such asset retirement obligations (“AROs”) in the period in which they are incurred based on the present value of estimated third-party decommissioning costs, and we capitalize the associated asset retirement costs as part of the carrying amount of the related assets. Once an asset is placed in service, the asset retirement cost is subsequently depreciated on a straight-line basis over the estimated useful life of the asset. Changes in AROs resulting from the passage of time are recognized as an increase in the carrying amount of the liability and as accretion expense. Our AROs were included within “
Other liabilities
” at
December 31, 2018
and
2017
and totaled
$18.9 million
and
$16.7 million
, respectively.
Derivative Instruments.
We recognize derivative instruments on our consolidated balance sheets at their fair value. On the date that we enter into a derivative contract, we designate the derivative instrument as a fair value hedge, a cash flow hedge, a hedge of a net investment in a foreign operation, or a derivative instrument that will not be accounted for using hedge accounting methods. As of
December 31, 2018
and
2017
, all of our derivative instruments were designated either as cash flow hedges or as derivative instruments not accounted for using hedge accounting methods.
We record changes in the fair value of a derivative instrument that is highly effective and that is designated and qualifies as a cash flow hedge in “
Accumulated other comprehensive (loss) income
” until our earnings are affected by the variability of the cash flows from the underlying hedge. We record any hedge ineffectiveness and amounts excluded from effectiveness testing in current period earnings within “
Other income, net
.” We report changes in the fair value of derivative instruments that are not designated or do not qualify for hedge accounting in current period earnings. We classify cash flows from derivative instruments on the consolidated statements of cash flows in the same category as the item being hedged or on a basis consistent with the nature of the instrument.
At the inception of a hedge, we formally document all relationships between hedging instruments and the underlying hedged items as well as our risk-management objective and strategy for undertaking the hedge transaction. We also formally assess (both at inception and on an ongoing basis) whether our derivative instruments are highly effective in
91
offsetting changes in the fair value or cash flows of the underlying hedged items and whether those derivatives are expected to remain highly effective in future periods. When we determine that a derivative instrument is not highly effective as a hedge, we discontinue hedge accounting prospectively. In all situations in which we discontinue hedge accounting and the derivative instrument remains outstanding, we carry the derivative instrument at its fair value on our consolidated balance sheets and recognize subsequent changes in its fair value in current period earnings.
Business Combinations.
We account for business combinations using the acquisition method of accounting and record intangible assets separate from goodwill. Such intangible assets are recorded at fair value based on estimates as of the date of acquisition. Goodwill is recorded as the residual amount of the purchase price consideration less the fair value assigned to the individual assets acquired and liabilities assumed as of the date of acquisition. We charge acquisition related costs that are not part of the purchase price consideration to “
Selling, general and administrative
” as they are incurred. These costs typically include transaction and integration costs, such as legal, accounting, and other professional fees. We account for any contingent consideration, which represents an obligation of the acquirer to transfer additional assets or equity interests to the former owner as part of the exchange if specified future events occur or conditions are met, at fair value either as a liability or as equity depending on the terms of the acquisition agreement.
Revenue Recognition – Module and Other Equipment Sales.
We recognize revenue for module and other equipment sales (e.g., module plus arrangements) at a point in time following the transfer of control of such products to the customer, which typically occurs upon shipment or delivery depending on the terms of the underlying contracts. For module and other equipment sales contracts that contain multiple performance obligations, such as the shipment or delivery of solar modules and other BoS parts, we allocate the transaction price to each performance obligation identified in the contract based on relative standalone selling prices, or estimates of such prices, and recognize the related revenue as control of each individual product is transferred to the customer, in satisfaction of the corresponding performance obligations.
Revenue Recognition – Solar Power System Sales and/or EPC Services
. We generally recognize revenue for sales of solar power systems and/or EPC services over time as our performance creates or enhances an energy generation asset controlled by the customer. Furthermore, the sale of a solar power system when combined with EPC services represents a single performance obligation for the development and construction of a single generation asset. For such sale arrangements, we recognize revenue using cost based input methods, which recognize revenue and gross profit as work is performed based on the relationship between actual costs incurred compared to the total estimated costs of the contract, after consideration of our customers’ commitment to perform its obligations under the contract, which is
typically measured through the receipt of cash deposits or
other forms of financial security issued by creditworthy financial institutions or parent entities
. For sales of solar power systems in which we obtain an interest in the project sold to the customer, we recognize all of the revenue for the consideration received, including the fair value of the noncontrolling interest we obtained, and defer any profit associated with the interest obtained through “
Equity in earnings, net of tax
.” We may also recognize revenue for the sale of a solar power system after it has been completed due to the timing of when we enter into the associated sales contract with the customer.
In applying cost based input methods of revenue recognition, we use the actual costs incurred relative to the total estimated costs (including solar module costs) to determine our progress towards contract completion and to calculate the corresponding amount of revenue and gross profit to recognize. Cost based input methods of revenue recognition are considered a faithful depiction of our efforts to satisfy long-term construction contracts and therefore reflect the transfer of goods to a customer under such contracts. Costs incurred that do not contribute to satisfying our performance obligations (“inefficient costs”) are excluded from our input methods of revenue recognition as the amounts are not reflective of our transferring control of the system to the customer. Costs incurred towards contract completion may include costs associated with solar modules, direct materials, labor, subcontractors, and other indirect costs related to contract performance. We recognize solar module and direct material costs as incurred when such items have been installed in a system.
Cost based input methods of revenue recognition require us to make estimates of net contract revenues and costs to complete our projects. In making such estimates, significant judgment is required to evaluate assumptions related to
92
the amount of net contract revenues, including the impact of any performance incentives, liquidated damages, and other payments to customers. Significant judgment is also required to evaluate assumptions related to the costs to complete our projects, including materials, labor, contingencies, and other system costs. If the estimated total costs on any contract, including any inefficient costs, are greater than the net contract revenues, we recognize the entire estimated loss in the period the loss becomes known. The cumulative effect of revisions to estimates related to net contract revenues or costs to complete contracts are recorded in the period in which the revisions to estimates are identified and the amounts can be reasonably estimated. The effect of the changes on future periods are recognized as if the revised estimates had been used since revenue was initially recognized under the contract. Such revisions could occur in any reporting period, and the effects may be material depending on the size of the contracts or the changes in estimates.
As part of our solar power system sales, we conduct performance testing of a system prior to substantial completion to confirm the system meets its operational and capacity expectations noted in the EPC agreement. In addition, we may provide an energy performance test during the first or second year of a system’s operation to demonstrate that the actual energy generation for the applicable period meets or exceeds the modeled energy expectation, after certain adjustments. In certain instances, a bonus payment may be received at the end of the applicable test period if the system performs above a specified level. Conversely, if there is an underperformance event with regards to these tests, we may incur liquidated damages as a percentage of the EPC contract price. Such performance guarantees represent a form of variable consideration and are estimated at contract inception at their most likely amount and updated at the end of each reporting period as additional performance data becomes available and only to the extent that it is probable that a significant reversal of any incremental revenue will not occur.
Revenue Recognition – Operations and Maintenance.
We recognize revenue for standard, recurring O&M services over time as customers receive and consume the benefits of such services, which typically include 24/7 system monitoring, certain PPA and other agreement compliance, NERC compliance, large generator interconnection agreement compliance, energy forecasting, performance engineering analysis, regular performance reporting, turn-key maintenance services including spare parts and corrective maintenance repair, warranty management, and environmental services. Other ancillary O&M services, such as equipment replacement, weed abatement, landscaping, or solar module cleaning, are recognized as revenue as the services are provided and billed to the customer. Costs of O&M services are expensed in the period in which they are incurred.
As part of our O&M service offerings, we typically offer an effective availability guarantee, which stipulates that a system will be available to generate a certain percentage of total possible energy during a specific period after adjusting for factors outside of our control as the service provider. If system availability exceeds a contractual threshold, we may receive a bonus payment, or if system availability falls below a separate threshold, we may incur liquidated damages for certain lost energy under the PPA. Such bonuses or liquidated damages represent a form of variable consideration and are estimated and recognized over time as customers receive and consume the benefits of the O&M services.
Revenue Recognition – Energy Generation.
We sell energy generated by PV solar power systems under PPAs or on an open contract basis. For energy sold under PPAs, which may qualify as a lease, we recognize revenue each period based on the volume of energy delivered to the customer (i.e., the PPA off-taker) and the price stated in the PPA. For energy sold on an open contract basis, we recognize revenue at the point in time the energy is delivered to the grid based on the prevailing spot market prices.
Shipping and Handling Costs.
We account for shipping and handling activities related to contracts with customers as costs to fulfill our promise to transfer the associated products. Accordingly, we record amounts billed for shipping and handling costs as a component of net sales, and classify such costs as a component of cost of sales.
Taxes Collected from Customers and Remitted to Governmental Authorities.
We exclude from our measurement of transaction prices all taxes
assessed by governmental authorities that are both (i) imposed on and concurrent with a specific revenue-producing transaction and (ii) collected from customers. Accordingly, such tax amounts are not included
as a component of net sales or cost of sales.
93
Research and Development Expense.
We incur research and development costs during the process of researching and developing new products and enhancing our existing products, technologies, and manufacturing processes. Our research and development costs consist primarily of employee compensation, materials, outside services, and depreciation. We expense these costs as incurred until the resulting product has been completed, tested, and made ready for commercial manufacturing.
Production Start-Up.
Production start-up expense consists primarily of employee compensation and other costs associated with operating a production line before it has been qualified for full production, including the cost of raw materials for solar modules run through the production line during the qualification phase and applicable facility related costs. Costs related to equipment upgrades and implementation of manufacturing process improvements are also included in production start-up expense as well as costs related to the selection of a new site, related legal and regulatory costs, and costs to maintain our plant replication program to the extent we cannot capitalize these expenditures.
Restructuring and Exit Activities.
We record costs associated with exit activities, such as one-time employee termination benefits, when management approves and commits to a plan of termination or over the future service period, if any. Other costs associated with exit activities may include contract termination costs, including costs related to leased facilities to be abandoned or subleased, and facility and employee relocation costs.
Share-Based Compensation.
We recognize share-based compensation expense for the estimated grant-date fair value of equity awards issued as compensation to employees over the requisite service period, which is generally
four
years. For awards with performance conditions, we recognize share-based compensation expense if it is probable that the performance conditions will be achieved. We account for forfeitures of share-based awards as such forfeitures occur. Accordingly, when an associate’s employment is terminated, all previously unvested awards granted to such associate are forfeited, which results in a benefit to share-based compensation expense in the period of such associate’s termination equal to the cumulative expense recorded through the termination date for such unvested awards. We recognize share-based compensation expense for awards with graded vesting schedules on a straight-line basis over the requisite service periods for each separately vesting portion of the award as if each award was in substance multiple awards.
Foreign Currency Translation.
The functional currencies of certain of our foreign subsidiaries are their local currencies. Accordingly, we apply period-end exchange rates to translate their assets and liabilities and daily transaction exchange rates to translate their revenues, expenses, gains, and losses into U.S. dollars. We include the associated translation adjustments as a separate component of “
Accumulated other comprehensive (loss) income
” within stockholders’ equity. The functional currency of our subsidiaries in Canada, Chile, Malaysia, Singapore, and Vietnam is the U.S. dollar; therefore, we do not translate their financial statements. Gains and losses arising from the remeasurement of monetary assets and liabilities denominated in currencies other than a subsidiary’s functional currency are included in “
Foreign currency loss, net
” in the period in which they occur.
Income Taxes.
We use the asset and liability method to account for income taxes whereby we calculate deferred tax assets or liabilities using the enacted tax rates and tax law applicable to when any temporary differences are expected to reverse. We establish valuation allowances, when necessary, to reduce deferred tax assets to the extent it is more likely than not that such deferred tax assets will not be realized. We do not provide deferred taxes related to the U.S. GAAP basis in excess of the outside tax basis in the investment in our foreign subsidiaries to the extent such amounts relate to indefinitely reinvested earnings and profits of such foreign subsidiaries.
Income tax expense includes (i) deferred tax expense, which generally represents the net change in deferred tax assets or liabilities during the year plus any change in valuation allowances, and (ii) current tax expense, which represents the amount of tax currently payable to or receivable from taxing authorities. We only recognize tax benefits related to uncertain tax positions that are more likely than not of being sustained upon examination. For those positions that satisfy such recognition criteria, the amount of tax benefit that we recognize is the largest amount of tax benefit that is more likely than not of being sustained on ultimate settlement of the uncertain tax position.
94
Per Share Data.
Basic net income or loss per share is computed by dividing net income or loss by the weighted-average number of common shares outstanding for the period. Diluted net income per share is computed giving effect to all potentially dilutive common shares, including restricted and performance stock units and stock purchase plan shares, unless there is a net loss for the period. In computing diluted net income per share, we utilize the treasury stock method.
Accumulated Other Comprehensive Income or Loss.
Our accumulated other comprehensive income or loss includes foreign currency translation adjustments, unrealized gains and losses on available-for-sale debt securities, and unrealized gains and losses on derivative instruments designated and qualifying as cash flow hedges. We record these components of accumulated other comprehensive income or loss net of tax and release such tax effects when the underlying components affect earnings.
3. Recent Accounting Pronouncements
In February 2018, the Financial Accounting Standard Board (“FASB”) issued ASU 2018-02,
Income Statement – Reporting Comprehensive Income (Topic 220) – Reclassification of Certain Tax Effects from Accumulated Other Comprehensive Income,
to allow entities to reclassify the income tax effects of the Tax Act on items within accumulated other comprehensive income to retained earnings. The adoption of ASU 2018-02 in the fourth quarter of 2018 did not have a significant impact on our consolidated financial statements and associated disclosures as we did not elect to reclassify the income tax effects of the Tax Act from accumulated other comprehensive income to retained earnings.
In August 2017, the FASB issued ASU 2017-12,
Derivatives and Hedging (Topic 815) – Targeted Improvements to Accounting for Hedging Activities
, to simplify certain aspects of hedge accounting for both non-financial and financial risks and better align the recognition and measurement of hedge results with an entity’s risk management activities. ASU 2017-12 also amends certain presentation and disclosure requirements for hedging activities and changes how an entity assesses hedge effectiveness. ASU 2017-12 is effective for fiscal years and interim periods within those years beginning after December 15, 2018, and early adoption is permitted. We are currently evaluating the impact ASU 2017-12 will have on our consolidated financial statements and associated disclosures.
In October 2016, the FASB issued ASU 2016-16,
Income Taxes (Topic 230) – Intra-Entity Transfers of Assets Other Than Inventory
. ASU 2016-16 requires the recognition of income tax consequences of intra-entity transfers of assets, other than inventory, when the transfer occurs. Two common examples of assets included in the scope of ASU 2016-16 are intellectual property and long-lived assets. The adoption of ASU 2016-16 in the first quarter of 2018 did not have a significant impact on our consolidated financial statements and associated disclosures.
In June 2016, the FASB issued ASU 2016-13,
Financial Instruments – Credit Losses (Topic 326)
, to provide financial statement users with more useful information about expected credit losses. ASU 2016-13 also changes how entities measure credit losses on financial instruments and the timing of when such losses are recorded. ASU 2016-13 is effective for fiscal years and interim periods within those years beginning after December 15, 2019, and early adoption is permitted for periods beginning after December 15, 2018. We are currently evaluating the impact ASU 2016-13 will have on our consolidated financial statements and associated disclosures.
In February 2016, the FASB issued ASU 2016-02,
Leases (Topic 842)
, to increase transparency and comparability among organizations by recognizing a right-of-use asset and a lease liability on the balance sheet for all leases with terms longer than 12 months and disclosing key information about leasing transactions. Leases will be classified as either operating or financing, with such classification affecting the pattern of expense recognition in the income statement. ASU 2016-02 is effective for fiscal years and interim periods within those years beginning after December 15, 2018, and early adoption is permitted. In July 2018, the FASB issued ASU 2018-11,
Leases (Topic 842) – Targeted Improvements
, which provided an optional transition method to apply the new lease requirements through a cumulative-effect adjustment in the period of adoption.
We expect to adopt ASU 2016-02 in the first quarter of 2019 using this optional transition method. We also expect to elect certain practical expedients permitted under the transition guidance, which, among other things, allow us to not
95
reassess prior conclusions related to contracts containing leases or lease classification. We are currently evaluating the impact ASU 2016-02 will have on our consolidated financial statements and associated disclosures and designing the related processes and internal controls. We expect the adoption to have a significant impact on our consolidated balance sheet through the recognition of right-of-use assets and lease liabilities primarily related to real estate arrangements, but do not expect the adoption to have a significant impact on our results of operations or cash flows.
4. Restructuring and Asset Impairments
Cadmium Telluride Module Manufacturing and Corporate Restructuring
In November 2016, our board of directors approved a set of initiatives intended to accelerate our transition to Series 6 module manufacturing and restructure our operations to reduce costs and better align the organization with our long-term strategic plans. Accordingly, we expect to upgrade and replace our legacy manufacturing fleet over the next several years with Series 6 manufacturing equipment, thereby enabling the production of solar modules with a larger form factor, better product attributes, and a lower cost structure.
As part of these initiatives, we incurred net charges of
$41.8 million
during the year ended
December 31, 2017
, which included (i)
$27.6 million
of charges, primarily related to net losses on the disposition of previously impaired Series 4 and Series 5 manufacturing equipment, (ii)
$7.6 million
of severance benefits to terminated employees, and (iii)
$6.7 million
of net miscellaneous charges, primarily related to contract terminations, the write-off of operating supplies, and other Series 4 manufacturing exit costs.
The commencement of this operational transition in November 2016 represented an expectation that certain of our module manufacturing assets would be sold or otherwise disposed of significantly before the end of their previously estimated useful lives. As a result, we compared the undiscounted future cash flows of our module manufacturing assets to the carrying value of the asset group and determined that the group was not recoverable. Accordingly, we measured the fair value of the asset group using a combination of income and cost valuation techniques and recorded impairment losses of
$640.3 million
for the year ended
December 31, 2016
. During the year ended
December 31, 2016
we also incurred charges of
$14.1 million
for severance benefits to terminated employees as we substantially reduced our workforce at our domestic and international facilities, including reductions in administrative and other staff, and
$8.1 million
for the closure of ancillary foreign operations, the write-off of operating supplies, and other miscellaneous charges.
Substantially all amounts associated with these restructuring and asset impairment charges related to our modules segment and were classified as “
Restructuring and asset impairments
” on the consolidated statements of operations, and substantially all of the associated liabilities were paid or settled as of
December 31, 2017
.
Crystalline Silicon Module Manufacturing Restructuring
In June 2016, our executive management elected to reallocate our crystalline silicon module production capacity to support next generation CdTe module offerings. As a result, we ended production of our crystalline silicon modules to focus on our core CdTe module technology and utility-scale PV solar power systems. The majority of our crystalline silicon module manufacturing associates were expected to be redeployed in other manufacturing operations.
In connection with these restructuring activities, we incurred charges of
$81.4 million
during the year ended
December 31, 2016
, which included (i)
$35.9 million
of impairment charges related to certain crystalline silicon module manufacturing equipment considered abandoned for accounting purposes, (ii)
$35.8 million
of impairment charges for developed technology intangible assets associated with our crystalline silicon module technology, (iii)
$8.4 million
of miscellaneous charges related to certain contract manufacturing agreements and the write-off of operating supplies, and (iv)
$1.3 million
of charges for severance benefits to terminated employees. All amounts associated with these charges related to our modules segment and were classified as “
Restructuring and asset impairments
” on the consolidated statements of operations.
96
Other Restructuring
During the year ended December 31, 2012, we recognized a liability for the expected repayment of certain customs tax benefits as part of a prior restructuring activity. In December 2017, we reversed this liability as a result of meeting certain investment certificate criteria associated with the commencement of operations at our previously announced manufacturing plant in Vietnam and recorded a
$4.7 million
benefit to “
Restructuring and asset impairments
.”
5. Business Acquisitions
Enki Technology
In October 2016, we acquired
100%
of the shares of Enki Technology, Inc. (“Enki”), a developer of advanced coating materials for the PV solar industry, for cash payments of
$10.3 million
, net of cash acquired of
$0.3 million
, and a promise to pay additional consideration of up to
$7.0 million
contingent on the achievement of certain production and module performance milestones. In connection with applying the acquisition method of accounting,
$17.3 million
of the purchase price consideration was assigned to an IPR&D intangible asset to be amortized over its useful life upon successful completion of the underlying projects,
$4.4 million
was assigned to a deferred tax liability, and
$4.4 million
was assigned to goodwill. The acquired IPR&D includes patents, technical information and know-how, and other proprietary information associated with the development and production of anti-reflective coating material that we expect to use in the production of our solar modules. Such technology is expected to improve our module conversion efficiency and overall durability at a lower cost structure compared to our current production processes.
6. Goodwill and Intangible Assets
Goodwill
The changes in the carrying amount of goodwill, by reporting unit, for the years ended
December 31, 2018
and
2017
were as follows (in thousands):
|
Balance at December 31, 2017
|
Acquisitions (Impairments)
|
Balance at December 31, 2018
|
||||||||||
|
Modules
|
$
|
407,827
|
|
$
|
—
|
|
$
|
407,827
|
|
|||
|
Accumulated impairment losses
|
(393,365
|
)
|
—
|
|
(393,365
|
)
|
||||||
|
Total
|
$
|
14,462
|
|
$
|
—
|
|
$
|
14,462
|
|
|||
|
Balance at December 31, 2016
|
Acquisitions (Impairments)
|
Balance at December 31, 2017
|
||||||||||
|
Modules
|
$
|
407,827
|
|
$
|
—
|
|
$
|
407,827
|
|
|||
|
Accumulated impairment losses
|
(393,365
|
)
|
—
|
|
(393,365
|
)
|
||||||
|
Total
|
$
|
14,462
|
|
$
|
—
|
|
$
|
14,462
|
|
|||
2018 and 2017 Goodwill Impairment Testing
We performed our annual impairment analysis in the fourth quarter of 2018 and 2017. ASC 350-20 provides that prior to performing a quantitative goodwill impairment test, companies are permitted to perform a qualitative assessment of whether it is more likely than not that a reporting unit’s fair value is less than its carrying value to determine whether it is necessary to perform a quantitative goodwill impairment test. Such qualitative assessment considers various factors, including macroeconomic conditions, industry and market considerations, cost factors, the overall financial performance of a reporting unit, and any other relevant events affecting our company or a reporting unit.
97
We performed a qualitative assessment for our modules reporting unit in each respective period and concluded that it was not more likely than not that the fair value of the reporting unit was less than its carrying amount. Accordingly, a quantitative goodwill impairment test for this reporting unit was not required in either period.
2016 Goodwill Impairment Testing
As part of our annual impairment analysis in the fourth quarter of 2016, we elected to perform a quantitative goodwill impairment test instead of first performing a qualitative goodwill impairment test. Such quantitative impairment test represented the comparison of the fair value of our reporting units with their carrying amounts, including goodwill. As of the date of our testing, our reporting units were consistent with our reportable segments: modules and systems. In determining the fair value of our reporting units, we used a combination of income and market based valuation techniques.
Significant estimates used in our income based fair value calculations included: (i) future sales volumes and average selling prices per watt; (ii) cost per watt projections for module and system sales; (iii) future effective tax rates, which we estimated to be between
10%
and
35%
; (iii) forecasts of capital expenditures and working capital requirements; (iv) discount rates, which we estimated to range between
11.5%
and
18%
; and (v) future terminal values of our reporting units, which are based on their ability to exist into perpetuity. Significant estimates used in our market based fair value calculations included business enterprise values and revenue multiples of various publicly traded companies. The underlying assumptions used in the quantitative impairment test also considered our market capitalization as of the date of our testing and then-current solar industry market conditions.
As a result of our testing, we determined that the estimated fair value of our modules reporting unit exceeded its carrying value indicating no impairment was necessary for this reporting unit. However, we determined that the estimated fair value of our systems reporting unit was less than its carrying value, which required us to determine the implied fair value of goodwill for the systems reporting unit by allocating the fair value of the systems reporting unit to its individual assets and liabilities, including any unrecognized intangible assets. Based on such calculation, the implied fair value of goodwill for the systems reporting unit was zero, and we recorded an impairment loss of
$68.8 million
. Such impairment was primarily driven by a strategic shift in the mix of our module and system net sales, which was approved by our board of directors in November 2016. This shift involved an expected reduction in the annual megawatts sold through systems business projects from approximately two gigawatts per year over the prior several years to approximately one gigawatt per year going forward. Other factors that contributed to the impairment included our reduced market capitalization and the challenging conditions within the solar industry as of the date of our testing.
In June 2016, we impaired
$6.1 million
of goodwill associated with our crystalline silicon modules reporting unit as a result of the decision to end the related manufacturing operations and dispose of the reporting unit.
See Note 4. “Restructuring and Asset Impairments”
to our consolidated financial statements for further discussion related to this restructuring activity.
Intangible Assets, Net
The following tables summarize our intangible assets at
December 31, 2018
and
2017
(in thousands):
|
December 31, 2018
|
||||||||||||
|
|
Gross Amount
|
Accumulated Amortization
|
Net Amount
|
|||||||||
|
Developed technology
|
$
|
97,714
|
|
$
|
(33,093
|
)
|
$
|
64,621
|
|
|||
|
Power purchase agreements
|
6,486
|
|
(648
|
)
|
5,838
|
|
||||||
|
Patents
|
7,408
|
|
(3,705
|
)
|
3,703
|
|
||||||
|
Total
|
$
|
111,608
|
|
$
|
(37,446
|
)
|
$
|
74,162
|
|
|||
98
|
December 31, 2017
|
||||||||||||
|
|
Gross Amount
|
Accumulated Amortization
|
Net Amount
|
|||||||||
|
Developed technology
|
$
|
76,959
|
|
$
|
(24,140
|
)
|
$
|
52,819
|
|
|||
|
Power purchase agreements
|
6,486
|
|
(324
|
)
|
6,162
|
|
||||||
|
Patents
|
7,068
|
|
(3,077
|
)
|
3,991
|
|
||||||
|
In-process research and development (1)
|
17,255
|
|
—
|
|
17,255
|
|
||||||
|
Total
|
$
|
107,768
|
|
$
|
(27,541
|
)
|
$
|
80,227
|
|
|||
——————————
|
(1)
|
During the year ended
December 31, 2018
,
$17.3 million
of in-process research and development related to our prior Enki acquisition was reclassified to developed technology and began amortizing over its useful life of
10 years
.
|
Amortization expense for our intangible assets was
$9.9 million
,
$8.3 million
, and
$10.1 million
for the years ended
December 31, 2018
,
2017
, and
2016
, respectively.
Estimated future amortization expense for our definite-lived intangible assets was as follows at
December 31, 2018
(in thousands):
|
Amortization Expense
|
||||
|
2019
|
$
|
10,436
|
|
|
|
2020
|
10,786
|
|
||
|
2021
|
10,784
|
|
||
|
2022
|
10,759
|
|
||
|
2023
|
10,474
|
|
||
|
Thereafter
|
20,923
|
|
||
|
Total amortization expense
|
$
|
74,162
|
|
|
7. Cash, Cash Equivalents, and Marketable Securities
Cash, cash equivalents, and marketable securities consisted of the following at
December 31, 2018
and
2017
(in thousands):
|
2018
|
2017
|
|||||||
|
Cash and cash equivalents:
|
||||||||
|
Cash
|
$
|
1,202,774
|
|
$
|
2,142,949
|
|
||
|
Money market funds
|
200,788
|
|
125,585
|
|
||||
|
Total cash and cash equivalents
|
1,403,562
|
|
2,268,534
|
|
||||
|
Marketable securities:
|
||||||||
|
Foreign debt
|
318,646
|
|
238,858
|
|
||||
|
Foreign government obligations
|
98,621
|
|
152,850
|
|
||||
|
U.S. debt
|
44,468
|
|
73,671
|
|
||||
|
Time deposits
|
681,969
|
|
255,000
|
|
||||
|
Total marketable securities
|
1,143,704
|
|
720,379
|
|
||||
|
Total cash, cash equivalents, and marketable securities
|
$
|
2,547,266
|
|
$
|
2,988,913
|
|
||
99
The following table provides a reconciliation of cash, cash equivalents, and restricted cash reported within our consolidated balance sheets as of
December 31, 2018
and
2017
to the total of such amounts as presented in the consolidated statements of cash flows (in thousands):
|
Balance Sheet Line Item
|
2018
|
2017
|
||||||||
|
Cash and cash equivalents
|
Cash and cash equivalents
|
$
|
1,403,562
|
|
$
|
2,268,534
|
|
|||
|
Restricted cash
–
current (1)
|
Prepaid expenses and other current assets
|
19,671
|
|
11,120
|
|
|||||
|
Restricted cash
–
noncurrent (1)
|
Restricted cash and investments
|
139,390
|
|
50,822
|
|
|||||
|
Total cash, cash equivalents, and restricted cash
|
$
|
1,562,623
|
|
$
|
2,330,476
|
|
||||
——————————
|
(1)
|
See Note 8. “Restricted Cash and Investments”
to our consolidated financial statements for discussion of our “Restricted cash” arrangements.
|
During the years ended
December 31, 2018
,
2017
, and
2016
, we sold marketable securities for proceeds of
$10.8 million
,
$118.3 million
, and
$159.2 million
, respectively, and realized gains of less than
$0.1 million
, less than
$0.1 million
, and
$0.3 million
, respectively, on such sales.
See Note 11. “Fair Value Measurements”
to our consolidated financial statements for information about the fair value of our marketable securities.
The following tables summarize the unrealized gains and losses related to our available-for-sale marketable securities, by major security type, as of
December 31, 2018
and
2017
(in thousands):
|
|
As of December 31, 2018
|
|||||||||||||||
|
Amortized
Cost
|
Unrealized
Gains
|
Unrealized
Losses
|
Fair
Value
|
|||||||||||||
|
Foreign debt
|
$
|
320,056
|
|
$
|
468
|
|
$
|
1,878
|
|
$
|
318,646
|
|
||||
|
Foreign government obligations
|
99,189
|
|
—
|
|
568
|
|
98,621
|
|
||||||||
|
U.S. debt
|
44,625
|
|
53
|
|
210
|
|
44,468
|
|
||||||||
|
Time deposits
|
681,969
|
|
—
|
|
—
|
|
681,969
|
|
||||||||
|
Total
|
$
|
1,145,839
|
|
$
|
521
|
|
$
|
2,656
|
|
$
|
1,143,704
|
|
||||
|
|
As of December 31, 2017
|
|||||||||||||||
|
Amortized
Cost
|
Unrealized
Gains
|
Unrealized
Losses
|
Fair
Value
|
|||||||||||||
|
Foreign debt
|
$
|
240,643
|
|
$
|
3
|
|
$
|
1,788
|
|
$
|
238,858
|
|
||||
|
Foreign government obligations
|
153,999
|
|
—
|
|
1,149
|
|
152,850
|
|
||||||||
|
U.S. debt
|
73,746
|
|
—
|
|
75
|
|
73,671
|
|
||||||||
|
Time deposits
|
255,000
|
|
—
|
|
—
|
|
255,000
|
|
||||||||
|
Total
|
$
|
723,388
|
|
$
|
3
|
|
$
|
3,012
|
|
$
|
720,379
|
|
||||
As of
December 31, 2018
, we identified
15
investments totaling
$207.2 million
that had been in a loss position for a period of time greater than 12 months with unrealized losses of
$1.8 million
. As of
December 31, 2017
, we identified
16
investments totaling
$210.3 million
that had been in a loss position for a period of time greater than 12 months with unrealized losses of
$1.9 million
. The unrealized losses were primarily due to increases in interest rates relative to rates at the time of purchase. Based on the underlying credit quality of the investments, we do not intend to sell these securities prior to the recovery of our cost basis. Therefore, we did not consider these securities to be other-than-temporarily impaired.
100
The following tables show unrealized losses and fair values for those marketable securities that were in an unrealized loss position as of
December 31, 2018
and
2017
, aggregated by major security type and the length of time the marketable securities have been in a continuous loss position (in thousands):
|
|
As of December 31, 2018
|
|||||||||||||||||||||||
|
|
In Loss Position for
Less Than 12 Months
|
In Loss Position for
12 Months or Greater
|
Total
|
|||||||||||||||||||||
|
Fair
Value
|
Unrealized
Losses
|
Fair
Value
|
Unrealized
Losses
|
Fair
Value
|
Unrealized
Losses
|
|||||||||||||||||||
|
Foreign debt
|
$
|
150,842
|
|
$
|
802
|
|
$
|
94,446
|
|
$
|
1,076
|
|
$
|
245,288
|
|
$
|
1,878
|
|
||||||
|
Foreign government obligations
|
—
|
|
—
|
|
98,621
|
|
568
|
|
98,621
|
|
568
|
|
||||||||||||
|
U.S. debt
|
15,356
|
|
32
|
|
14,085
|
|
178
|
|
29,441
|
|
210
|
|
||||||||||||
|
Total
|
$
|
166,198
|
|
$
|
834
|
|
$
|
207,152
|
|
$
|
1,822
|
|
$
|
373,350
|
|
$
|
2,656
|
|
||||||
|
|
As of December 31, 2017
|
|||||||||||||||||||||||
|
|
In Loss Position for
Less Than 12 Months
|
In Loss Position for
12 Months or Greater
|
Total
|
|||||||||||||||||||||
|
Fair
Value
|
Unrealized
Losses
|
Fair
Value
|
Unrealized
Losses
|
Fair
Value
|
Unrealized
Losses
|
|||||||||||||||||||
|
Foreign debt
|
$
|
119,869
|
|
$
|
735
|
|
$
|
88,919
|
|
$
|
1,053
|
|
$
|
208,788
|
|
$
|
1,788
|
|
||||||
|
Foreign government obligations
|
31,467
|
|
289
|
|
121,383
|
|
860
|
|
152,850
|
|
1,149
|
|
||||||||||||
|
U.S. debt
|
$
|
73,671
|
|
$
|
75
|
|
$
|
—
|
|
$
|
—
|
|
$
|
73,671
|
|
$
|
75
|
|
||||||
|
Total
|
$
|
225,007
|
|
$
|
1,099
|
|
$
|
210,302
|
|
$
|
1,913
|
|
$
|
435,309
|
|
$
|
3,012
|
|
||||||
The contractual maturities of our marketable securities as of
December 31, 2018
were as follows (in thousands):
|
Fair
Value
|
||||
|
One year or less
|
$
|
904,384
|
|
|
|
One year to two years
|
161,961
|
|
||
|
Two years to three years
|
77,359
|
|
||
|
Total
|
$
|
1,143,704
|
|
|
8. Restricted Cash and Investments
Restricted cash and investments consisted of the following at
December 31, 2018
and
2017
(in thousands):
|
2018
|
2017
|
|||||||
|
Restricted cash
|
$
|
139,390
|
|
$
|
50,822
|
|
||
|
Restricted investments
|
179,000
|
|
373,961
|
|
||||
|
Total restricted cash and investments (1)
|
$
|
318,390
|
|
$
|
424,783
|
|
||
——————————
|
(1)
|
There was an additional
$19.7 million
and
$11.1 million
of restricted cash included within “
Prepaid expenses and other current assets
” at
December 31, 2018
and
2017
, respectively.
|
At
December 31, 2018
and
2017
, our restricted cash consisted of deposits held by various banks to secure certain of our letters of credit and other deposits designated for the construction or operation of systems projects as well as the payment of amounts related to project specific debt financings. Restricted cash also included certain deposits held in custodial accounts to fund the estimated future costs of our solar module collection and recycling obligations.
See Note 15. “Commitments and Contingencies”
to our consolidated financial statements for further discussion relating to our letters of credit.
101
At
December 31, 2018
and
2017
, our restricted investments consisted of long-term marketable securities that were also held in custodial accounts to fund the estimated future costs of collecting and recycling modules covered under our solar module collection and recycling program. As necessary, we fund any incremental amounts for our estimated collection and recycling obligations on an annual basis based on the estimated costs of collecting and recycling covered modules, estimated rates of return on our restricted investments, and an estimated solar module life of
25 years
less amounts already funded in prior years. To ensure that amounts previously funded will be available in the future regardless of potential adverse changes in our financial condition (even in the case of our own insolvency), we have established a trust under which estimated funds are put into custodial accounts with an established and reputable bank, for which First Solar, Inc.; First Solar Malaysia Sdn. Bhd. (“FS Malaysia”); and First Solar Manufacturing GmbH are grantors. Trust funds may be disbursed for qualified module collection and recycling costs (including capital and facilities related recycling costs), payments to customers for assuming collection and recycling obligations, and reimbursements of any overfunded amounts. Investments in the trust must meet certain investment quality criteria comparable to highly rated government or agency bonds.
During the year ended
December 31, 2018
, we sold certain restricted investments for proceeds of
$231.1 million
and realized gains of
$55.4 million
on such sales as part of an effort to align the currencies of the investments with those of the corresponding collection and recycling liabilities and disburse
$143.1 million
of overfunded amounts. During the year ended
December 31, 2016
, we sold certain restricted investments for proceeds of
$118.2 million
and realized gains of
$41.3 million
on such sales as part of a separate effort to align the currencies of the investments with those of the corresponding collection and recycling liabilities.
See Note 11. “Fair Value Measurements”
to our consolidated financial statements for information about the fair value of our restricted investments.
The following tables summarize the unrealized gains and losses related to our restricted investments, by major security type, as of
December 31, 2018
and
2017
(in thousands):
|
|
As of December 31, 2018
|
|||||||||||||||
|
Amortized
Cost
|
Unrealized
Gains
|
Unrealized
Losses
|
Fair
Value
|
|||||||||||||
|
Foreign government obligations
|
$
|
73,798
|
|
$
|
14,234
|
|
$
|
235
|
|
$
|
87,797
|
|
||||
|
U.S. government obligations
|
97,223
|
|
416
|
|
6,436
|
|
91,203
|
|
||||||||
|
Total
|
$
|
171,021
|
|
$
|
14,650
|
|
$
|
6,671
|
|
$
|
179,000
|
|
||||
|
|
As of December 31, 2017
|
|||||||||||||||
|
Amortized
Cost
|
Unrealized
Gains
|
Unrealized
Losses
|
Fair
Value
|
|||||||||||||
|
Foreign government obligations
|
$
|
127,436
|
|
$
|
62,483
|
|
$
|
—
|
|
$
|
189,919
|
|
||||
|
U.S. government obligations
|
174,624
|
|
12,944
|
|
3,526
|
|
184,042
|
|
||||||||
|
Total
|
$
|
302,060
|
|
$
|
75,427
|
|
$
|
3,526
|
|
$
|
373,961
|
|
||||
As of
December 31, 2018
, we identified
six
restricted investments totaling
$87.4 million
that had been in a loss position for a period of time greater than 12 months with unrealized losses of
$6.4 million
. As of
December 31, 2017
, we identified
six
restricted investments totaling
$107.7 million
that had been in a loss position for a period of time greater than 12 months with unrealized losses of
$3.5 million
. The unrealized losses were primarily due to increases in interest rates relative to rates at the time of purchase. Based on the underlying credit quality of the investments, we do not intend to sell these securities prior to the recovery of our cost basis. Therefore, we did not consider these investments to be other-than-temporarily impaired.
102
The following tables show unrealized losses and fair values for those restricted investments that were in an unrealized loss position as of
December 31, 2018
and
2017
, aggregated by major security type and the length of time the restricted investments have been in a continuous loss position (in thousands):
|
As of December 31, 2018
|
||||||||||||||||||||||||
|
In Loss Position for
Less Than 12 Months |
In Loss Position for
12 Months or Greater |
Total
|
||||||||||||||||||||||
|
Fair
Value |
Unrealized
Losses |
Fair
Value |
Unrealized
Losses |
Fair
Value |
Unrealized
Losses |
|||||||||||||||||||
|
Foreign government obligations
|
$
|
41,335
|
|
$
|
235
|
|
$
|
—
|
|
$
|
—
|
|
$
|
41,335
|
|
$
|
235
|
|
||||||
|
U.S. government obligations
|
—
|
|
—
|
|
87,401
|
|
6,436
|
|
87,401
|
|
6,436
|
|
||||||||||||
|
Total
|
$
|
41,335
|
|
$
|
235
|
|
$
|
87,401
|
|
$
|
6,436
|
|
$
|
128,736
|
|
$
|
6,671
|
|
||||||
|
As of December 31, 2017
|
||||||||||||||||||||||||
|
In Loss Position for
Less Than 12 Months |
In Loss Position for
12 Months or Greater |
Total
|
||||||||||||||||||||||
|
Fair
Value |
Unrealized
Losses |
Fair
Value |
Unrealized
Losses |
Fair
Value |
Unrealized
Losses |
|||||||||||||||||||
|
U.S. government obligations
|
$
|
—
|
|
$
|
—
|
|
$
|
107,731
|
|
$
|
3,526
|
|
$
|
107,731
|
|
$
|
3,526
|
|
||||||
|
Total
|
$
|
—
|
|
$
|
—
|
|
$
|
107,731
|
|
$
|
3,526
|
|
$
|
107,731
|
|
$
|
3,526
|
|
||||||
As of
December 31, 2018
, the contractual maturities of our restricted investments were between
11 years
and
18 years
.
9. Consolidated Balance Sheet Details
Accounts receivable trade, net
Accounts receivable trade, net
consisted of the following at
December 31, 2018
and
2017
(in thousands):
|
|
2018
|
2017
|
||||||
|
Accounts receivable trade, gross
|
$
|
129,644
|
|
$
|
213,776
|
|
||
|
Allowance for doubtful accounts
|
(1,362
|
)
|
(1,979
|
)
|
||||
|
Accounts receivable trade, net
|
$
|
128,282
|
|
$
|
211,797
|
|
||
At
December 31, 2018
and
2017
,
$8.5 million
and
$16.8 million
, respectively, of our
accounts receivable trade, net
were secured by letters of credit, bank guarantees, or other forms of financial security issued by creditworthy financial institutions.
Accounts receivable, unbilled and retainage
Accounts receivable, unbilled and retainage
consisted of the following at
December 31, 2018
and
2017
(in thousands):
|
|
2018
|
2017
|
||||||
|
Accounts receivable, unbilled
|
$
|
441,666
|
|
$
|
172,594
|
|
||
|
Retainage
|
16,500
|
|
2,014
|
|
||||
|
Accounts receivable, unbilled and retainage
|
$
|
458,166
|
|
$
|
174,608
|
|
||
103
Inventories
Inventories consisted of the following at
December 31, 2018
and
2017
(in thousands):
|
|
2018
|
2017
|
||||||
|
Raw materials
|
$
|
224,329
|
|
$
|
148,968
|
|
||
|
Work in process
|
41,294
|
|
14,085
|
|
||||
|
Finished goods
|
252,372
|
|
122,594
|
|
||||
|
Inventories
|
$
|
517,995
|
|
$
|
285,647
|
|
||
|
Inventories – current
|
$
|
387,912
|
|
$
|
172,370
|
|
||
|
Inventories – noncurrent
|
$
|
130,083
|
|
$
|
113,277
|
|
||
Prepaid expenses and other current assets
Prepaid expenses and other current assets
consisted of the following at
December 31, 2018
and
2017
(in thousands):
|
|
2018
|
2017
|
||||||
|
Prepaid expenses
|
$
|
90,981
|
|
$
|
41,447
|
|
||
|
Prepaid income taxes
|
59,319
|
|
31,944
|
|
||||
|
Indirect tax receivables
|
26,327
|
|
26,553
|
|
||||
|
Restricted cash
|
19,671
|
|
11,120
|
|
||||
|
Derivative instruments
|
2,364
|
|
4,303
|
|
||||
|
Other current assets
|
44,399
|
|
42,535
|
|
||||
|
Prepaid expenses and other current assets
|
$
|
243,061
|
|
$
|
157,902
|
|
||
Property, plant and equipment, net
Property, plant and equipment, net
consisted of the following at
December 31, 2018
and
2017
(in thousands):
|
|
2018
|
2017
|
||||||
|
Land
|
$
|
14,382
|
|
$
|
8,181
|
|
||
|
Buildings and improvements
|
567,605
|
|
424,266
|
|
||||
|
Machinery and equipment
|
1,826,434
|
|
1,059,103
|
|
||||
|
Office equipment and furniture
|
178,011
|
|
157,512
|
|
||||
|
Leasehold improvements
|
49,055
|
|
48,951
|
|
||||
|
Construction in progress
|
405,581
|
|
641,263
|
|
||||
|
Property, plant and equipment, gross
|
3,041,068
|
|
2,339,276
|
|
||||
|
Accumulated depreciation
|
(1,284,857
|
)
|
(1,184,739
|
)
|
||||
|
Property, plant and equipment, net
|
$
|
1,756,211
|
|
$
|
1,154,537
|
|
||
Depreciation of property, plant and equipment was
$109.1 million
,
$91.4 million
, and
$211.2 million
for the years ended
December 31, 2018
,
2017
, and
2016
, respectively.
104
PV solar power systems, net
PV solar power systems, net
consisted of the following at
December 31, 2018
and
2017
(in thousands):
|
2018
|
2017
|
|||||||
|
PV solar power systems, gross
|
$
|
343,061
|
|
$
|
451,045
|
|
||
|
Accumulated depreciation
|
(34,421
|
)
|
(33,937
|
)
|
||||
|
PV solar power systems, net
|
$
|
308,640
|
|
$
|
417,108
|
|
||
Depreciation of PV solar power systems was
$15.3 million
,
$19.8 million
, and
$11.7 million
for the years ended
December 31, 2018
,
2017
, and
2016
, respectively.
Capitalized interest
The cost of constructing project assets includes interest costs incurred during the construction period. The components of interest expense and capitalized interest were as follows during the years ended
December 31, 2018
,
2017
, and
2016
(in thousands):
|
|
2018
|
2017
|
2016
|
|||||||||
|
Interest cost incurred
|
$
|
(31,752
|
)
|
$
|
(27,457
|
)
|
$
|
(26,157
|
)
|
|||
|
Interest cost capitalized – property, plant and equipment
|
—
|
|
—
|
|
1,878
|
|
||||||
|
Interest cost capitalized – project assets
|
5,831
|
|
1,692
|
|
3,741
|
|
||||||
|
Interest expense, net
|
$
|
(25,921
|
)
|
$
|
(25,765
|
)
|
$
|
(20,538
|
)
|
|||
Project assets
Project assets
consisted of the following at
December 31, 2018
and
2017
(in thousands):
|
|
2018
|
2017
|
||||||
|
Project assets – development costs, including project acquisition and land costs
|
$
|
298,070
|
|
$
|
250,590
|
|
||
|
Project assets – construction costs
|
200,359
|
|
252,127
|
|
||||
|
Project assets
|
498,429
|
|
502,717
|
|
||||
|
Project assets
–
current
|
$
|
37,930
|
|
$
|
77,931
|
|
||
|
Project assets
–
noncurrent
|
$
|
460,499
|
|
$
|
424,786
|
|
||
Other assets
Other assets
consisted of the following at
December 31, 2018
and
2017
(in thousands):
|
|
2018
|
2017
|
||||||
|
Deferred rent
|
$
|
27,249
|
|
$
|
26,760
|
|
||
|
Indirect tax receivables
|
22,487
|
|
15,253
|
|
||||
|
Notes receivable (1)
|
8,017
|
|
10,495
|
|
||||
|
Income taxes receivable
|
4,444
|
|
4,454
|
|
||||
|
Other
|
33,495
|
|
28,570
|
|
||||
|
Other assets
|
$
|
95,692
|
|
$
|
85,532
|
|
||
——————————
|
(1)
|
In
April 2009
, we entered into a credit facility agreement with a solar power project entity of one of our customers for an available amount of
€17.5 million
to provide financing for a PV solar power system. The credit facility bears interest at
8.0%
per annum, payable quarterly, with the full amount due in December 2026. As of
December 31, 2018
and
2017
, the balance outstanding on the credit facility was
€7.0 million
(
$8.0 million
and
$8.4 million
, respectively).
|
105
Accrued expenses
Accrued expenses
consisted of the following at
December 31, 2018
and
2017
(in thousands):
|
|
2018
|
2017
|
||||||
|
Accrued project costs
|
$
|
147,162
|
|
$
|
55,834
|
|
||
|
Accrued property, plant and equipment
|
89,905
|
|
133,433
|
|
||||
|
Accrued inventory
|
53,075
|
|
24,830
|
|
||||
|
Accrued compensation and benefits
|
41,937
|
|
73,985
|
|
||||
|
Product warranty liability (1)
|
27,657
|
|
28,767
|
|
||||
|
Other
|
81,844
|
|
49,978
|
|
||||
|
Accrued expenses
|
$
|
441,580
|
|
$
|
366,827
|
|
||
——————————
|
(1)
|
See Note 15. “Commitments and Contingencies”
to our consolidated financial statements for discussion of our “Product warranty liability.”
|
Other current liabilities
Other current liabilities
consisted of the following at
December 31, 2018
and
2017
(in thousands):
|
|
2018
|
2017
|
||||||
|
Derivative instruments
|
$
|
7,294
|
|
$
|
27,297
|
|
||
|
Contingent consideration (1)
|
665
|
|
6,162
|
|
||||
|
Financing liability (2)
|
—
|
|
5,161
|
|
||||
|
Indemnification liabilities (1)
|
—
|
|
2,876
|
|
||||
|
Other
|
6,421
|
|
7,261
|
|
||||
|
Other current liabilities
|
$
|
14,380
|
|
$
|
48,757
|
|
||
——————————
|
(1)
|
See Note 15. “Commitments and Contingencies”
to our consolidated financial statements for discussion of our “Contingent consideration” and “Indemnification liabilities” arrangements.
|
|
(2)
|
See Note 12. “Equity Method Investments”
to our consolidated financial statements for discussion of the financing liabilities associated with our leaseback of the Maryland Solar project.
|
Other liabilities
Other liabilities
consisted of the following at
December 31, 2018
and
2017
(in thousands):
|
|
2018
|
2017
|
||||||
|
Product warranty liability (1)
|
$
|
193,035
|
|
$
|
195,507
|
|
||
|
Other taxes payable
|
83,058
|
|
89,724
|
|
||||
|
Transition tax liability (2)
|
77,016
|
|
93,233
|
|
||||
|
Deferred revenue
|
48,014
|
|
63,257
|
|
||||
|
Derivative instruments
|
9,205
|
|
5,932
|
|
||||
|
Contingent consideration (1)
|
2,250
|
|
3,153
|
|
||||
|
Commercial letter of credit liability (1)
|
—
|
|
43,396
|
|
||||
|
Financing liability (3)
|
—
|
|
29,822
|
|
||||
|
Other
|
55,261
|
|
44,430
|
|
||||
|
Other liabilities
|
$
|
467,839
|
|
$
|
568,454
|
|
||
——————————
|
(1)
|
See Note 15. “Commitments and Contingencies”
to our consolidated financial statements for discussion of our “Product warranty liability,” “Contingent consideration,” and “Commercial letter of credit liability” arrangements.
|
106
|
(2)
|
See Note 19. “Income Taxes”
to our consolidated financial statements for discussion of the one-time transition tax on accumulated earnings of foreign subsidiaries as a result of the Tax Act.
|
|
(3)
|
See Note 12. “Equity Method Investments”
to our consolidated financial statements for discussion of the financing liabilities associated with our leaseback of the Maryland Solar project.
|
10. Derivative Financial Instruments
As a global company, we are exposed in the normal course of business to interest rate and foreign currency risks that could affect our financial position, results of operations, and cash flows. We use derivative instruments to hedge against these risks and only hold such instruments for hedging purposes, not for speculative or trading purposes.
Depending on the terms of the specific derivative instruments and market conditions, some of our derivative instruments may be assets and others liabilities at any particular balance sheet date. We report all of our derivative instruments at fair value and account for changes in the fair value of derivative instruments within “
Accumulated other comprehensive (loss) income
” if the derivative instruments qualify for hedge accounting. For those derivative instruments that do not qualify for hedge accounting (“economic hedges”), we record the changes in fair value directly to earnings.
See Note 11. “Fair Value Measurements”
to our consolidated financial statements for information about the techniques we use to measure the fair value of our derivative instruments.
The following tables present the fair values of derivative instruments included in our consolidated balance sheets as of
December 31, 2018
and
2017
(in thousands):
|
|
December 31, 2018
|
|||||||||||
|
|
Prepaid Expenses and Other Current Assets
|
Other Current Liabilities
|
Other Liabilities
|
|||||||||
|
Derivatives designated as hedging instruments:
|
|
|
||||||||||
|
Foreign exchange forward contracts
|
$
|
158
|
|
$
|
—
|
|
$
|
—
|
|
|||
|
Total derivatives designated as hedging instruments
|
$
|
158
|
|
$
|
—
|
|
$
|
—
|
|
|||
|
Derivatives not designated as hedging instruments:
|
|
|
|
|
||||||||
|
Foreign exchange forward contracts
|
$
|
2,206
|
|
$
|
7,096
|
|
$
|
—
|
|
|||
|
Interest rate swap contracts
|
—
|
|
198
|
|
9,205
|
|
||||||
|
Total derivatives not designated as hedging instruments
|
$
|
2,206
|
|
$
|
7,294
|
|
$
|
9,205
|
|
|||
|
Total derivative instruments
|
$
|
2,364
|
|
$
|
7,294
|
|
$
|
9,205
|
|
|||
|
|
December 31, 2017
|
|||||||||||
|
|
Prepaid Expenses and Other Current Assets
|
Other Current Liabilities
|
Other Liabilities
|
|||||||||
|
Derivatives designated as hedging instruments:
|
|
|
||||||||||
|
Foreign exchange forward contracts
|
$
|
252
|
|
$
|
13,240
|
|
$
|
—
|
|
|||
|
Total derivatives designated as hedging instruments
|
$
|
252
|
|
$
|
13,240
|
|
$
|
—
|
|
|||
|
Derivatives not designated as hedging instruments:
|
|
|
|
|
||||||||
|
Foreign exchange forward contracts
|
$
|
4,051
|
|
$
|
14,057
|
|
$
|
—
|
|
|||
|
Interest rate swap contracts
|
—
|
|
—
|
|
5,932
|
|
||||||
|
Total derivatives not designated as hedging instruments
|
$
|
4,051
|
|
$
|
14,057
|
|
$
|
5,932
|
|
|||
|
Total derivative instruments
|
$
|
4,303
|
|
$
|
27,297
|
|
$
|
5,932
|
|
|||
107
The following table presents the pretax amounts related to derivative instruments designated as cash flow hedges affecting accumulated other comprehensive income or loss and our consolidated statements of operations for the years ended
December 31, 2018
,
2017
, and
2016
(in thousands):
|
Foreign Exchange Forward Contracts
|
Interest Rate Swap Contract
|
Cross Currency Swap Contract
|
Total
|
|||||||||||||
|
Balance in accumulated other comprehensive (loss) income at December 31, 2015
|
$
|
162
|
|
$
|
(16
|
)
|
$
|
(2,017
|
)
|
$
|
(1,871
|
)
|
||||
|
Amounts recognized in other comprehensive (loss) income
|
2,513
|
|
(2
|
)
|
5,108
|
|
7,619
|
|
||||||||
|
Amounts reclassified to earnings impacting:
|
||||||||||||||||
|
Foreign currency loss, net
|
—
|
|
—
|
|
(4,896
|
)
|
(4,896
|
)
|
||||||||
|
Interest expense, net
|
(119
|
)
|
18
|
|
1,805
|
|
1,704
|
|
||||||||
|
Balance in accumulated other comprehensive (loss) income at December 31, 2016
|
2,556
|
|
—
|
|
—
|
|
2,556
|
|
||||||||
|
Amounts recognized in other comprehensive (loss) income
|
(4,468
|
)
|
—
|
|
—
|
|
(4,468
|
)
|
||||||||
|
Amounts reclassified to earnings impacting:
|
||||||||||||||||
|
Other income, net
|
189
|
|
—
|
|
—
|
|
189
|
|
||||||||
|
Balance in accumulated other comprehensive (loss) income at December 31, 2017
|
(1,723
|
)
|
—
|
|
—
|
|
(1,723
|
)
|
||||||||
|
Amounts recognized in other comprehensive (loss) income
|
(3,760
|
)
|
—
|
|
—
|
|
(3,760
|
)
|
||||||||
|
Amounts reclassified to earnings impacting:
|
||||||||||||||||
|
Net sales
|
1,698
|
|
—
|
|
—
|
|
1,698
|
|
||||||||
|
Cost of sales
|
212
|
|
—
|
|
—
|
|
212
|
|
||||||||
|
Foreign currency loss, net
|
5,448
|
|
—
|
|
—
|
|
5,448
|
|
||||||||
|
Other income, net
|
(546
|
)
|
—
|
|
—
|
|
(546
|
)
|
||||||||
|
Balance in accumulated other comprehensive (loss) income at December 31, 2018
|
$
|
1,329
|
|
$
|
—
|
|
$
|
—
|
|
$
|
1,329
|
|
||||
We recorded
no
amounts related to ineffective portions of our derivative instruments designated as cash flow hedges during the years ended
December 31, 2018
,
2017
, and
2016
. We recognized unrealized gains of
$0.5 million
and
$0.7 million
and unrealized losses of
$0.9 million
related to amounts excluded from effectiveness testing for our foreign exchange forward contracts designated as cash flow hedges within “
Other income, net
” during the years ended
December 31, 2018
,
2017
, and
2016
, respectively.
The following table presents gains and losses related to derivative instruments not designated as hedges affecting our consolidated statements of operations for the years ended
December 31, 2018
,
2017
, and
2016
(in thousands):
|
Amount of Gain (Loss) Recognized in Income
|
||||||||||||||
|
Income Statement Line Item
|
2018
|
2017
|
2016
|
|||||||||||
|
Foreign exchange forward contracts
|
Foreign currency loss, net
|
$
|
12,113
|
|
$
|
(33,882
|
)
|
$
|
(14,002
|
)
|
||||
|
Interest rate swap contracts
|
Interest expense, net
|
(8,643
|
)
|
(5,932
|
)
|
—
|
|
|||||||
Interest Rate Risk
We use interest rate swap contracts to mitigate our exposure to interest rate fluctuations associated with certain of our debt instruments. We do not use such swap contracts for speculative or trading purposes. During the years ended
December 31, 2018
and
2017
, all of our interest rate swap contracts related to project specific debt facilities. Such swap contracts did not qualify for accounting as cash flow hedges in accordance with ASC 815 due to our expectation to sell the associated projects before the maturity of their project specific debt financings and corresponding swap contracts. Accordingly, changes in the fair values of the swap contracts were recorded directly to “
Interest expense, net
.”
108
In December 2018, Royal Solar GK, our indirect wholly-owned subsidiary and project company, entered into an interest rate swap contract to hedge a portion of the floating rate term loan facility under the project’s Royal Solar Credit Facility (as defined in
Note 14. “Debt”
to our consolidated financial statements). Such swap had an initial notional value of
¥5.5 billion
and entitled the project to receive a six-month floating Tokyo Interbank Offered Rate (“TIBOR”) plus
0.65%
interest rate while requiring the project to pay a fixed rate of
1.34%
. The notional amount of the interest rate swap contract is scheduled to proportionately adjust with the scheduled draws and principal payments on the underlying hedged debt. In December 2018, we completed the sale of our Royal Solar project, and its interest rate swap contract and outstanding loan balance were assumed by the customer.
In August 2018, FS Japan Project 14 GK, our indirect wholly-owned subsidiary and project company, entered into an interest rate swap contract to hedge a portion of the floating rate senior loan facility under the project’s Mashiko Credit Agreement (as defined in
Note 14. “Debt”
to our consolidated financial statements). Such swap had an initial notional value of
¥5.5 billion
and entitled the project to receive a six-month floating TIBOR interest rate while requiring the project to pay a fixed rate of
0.820%
. The notional amount of the interest rate swap contract is scheduled to proportionately adjust with the scheduled draws and principal payments on the underlying hedged debt. In December 2018, we completed the sale of our Mashiko project, and its interest rate swap contract and outstanding loan balance were assumed by the customer.
In May 2018, FS NSW Project No 1 Finco Pty Ltd, our indirectly wholly-owned subsidiary and project financing company, entered into various interest rate swap contracts to hedge the floating rate construction loan facility and a portion of the floating rate term loan facility under the associated project’s Beryl Credit Facility (as defined in
Note 14. “Debt”
to our consolidated financial statements). The swaps had an initial aggregate notional value of
AUD 42.4 million
and, depending on the loan facility being hedged, entitled the project to receive one-month or three-month floating Bank Bill Swap Bid (“BBSY”) interest rates while requiring the project to pay fixed rates of
2.0615%
or
3.2020%
. The notional amounts of the interest rate swap contracts are scheduled to proportionately adjust with the scheduled draws and principal payments on the underlying hedged debt. As of
December 31, 2018
, the aggregate notional value of the interest rate swap contracts was
AUD 103.4 million
(
$72.9 million
).
In March 2017, Manildra Finco Pty Ltd, our indirect wholly-owned subsidiary and project financing company, entered into various interest rate swap contracts to hedge a portion of the floating rate construction loan facility under the associated project’s Manildra Credit Facility (as defined in
Note 14. “Debt”
to our consolidated financial statements). Such swaps had an initial aggregate notional value of
AUD 12.8 million
and entitled the project to receive a one-month or three-month floating BBSY interest rate while requiring the project to pay a fixed rate of
3.13%
. The notional amounts of the interest rate swap contracts are scheduled to proportionately adjust with the scheduled draws and principal payments on the underlying hedged debt. In September 2018, we completed the sale of our Manildra project, and its interest rate swap contracts and outstanding loan balance were assumed by the customer. As of
December 31, 2017
, the aggregate notional value of the interest rate swap contracts was
AUD 68.1 million
(
$48.0 million
).
In January 2017, FS Japan Project 12 GK, our indirect wholly-owned subsidiary and project company, entered into an interest rate swap contract to hedge a portion of the floating rate senior loan facility under the project’s Ishikawa Credit Agreement (as defined in
Note 14. “Debt”
to our consolidated financial statements). Such swap had an initial notional value of
¥5.7 billion
and entitled the project to receive a six-month floating TIBOR plus
0.75%
interest rate while requiring the project to pay a fixed rate of
1.482%
. The notional amount of the interest rate swap contract is scheduled to proportionately adjust with the scheduled draws and principal payments on the underlying hedged debt. As of
December 31, 2018
and
2017
, the notional value of the interest rate swap contract was
¥19.2 billion
(
$174.1 million
) and
¥12.8 billion
(
$115.7 million
), respectively.
109
Foreign Currency Risk
Cash Flow Exposure
We expect certain of our subsidiaries to have future cash flows that will be denominated in currencies other than the subsidiaries’ functional currencies. Changes in the exchange rates between the functional currencies of our subsidiaries and the other currencies in which they transact will cause fluctuations in the cash flows we expect to receive or pay when these cash flows are realized or settled. Accordingly, we enter into foreign exchange forward contracts to hedge a portion of these forecasted cash flows. As of
December 31, 2018
and
2017
, these foreign exchange forward contracts hedged our forecasted cash flows for periods up to
six months
and
nine months
, respectively. These foreign exchange forward contracts qualify for accounting as cash flow hedges in accordance with ASC 815, and we designated them as such. We initially report the effective portion of a derivative’s unrealized gain or loss in “
Accumulated other comprehensive (loss) income
” and subsequently reclassify amounts into earnings when the hedged transaction occurs and impacts earnings. We determined that these derivative financial instruments were highly effective as cash flow hedges as of
December 31, 2018
and
2017
.
As of
December 31, 2018
and
2017
, the notional values associated with our foreign exchange forward contracts qualifying as cash flow hedges were as follows (notional amounts and U.S. dollar equivalents in millions):
|
December 31, 2018
|
||||
|
Currency
|
Notional Amount
|
USD Equivalent
|
||
|
Australian dollar
|
AUD 8.8
|
$6.2
|
||
|
December 31, 2017
|
||||
|
Currency
|
Notional Amount
|
USD Equivalent
|
||
|
Indian rupee
|
INR 4,730.0
|
$74.1
|
||
|
Euro
|
€15.7
|
$18.8
|
||
In the following 12 months, we expect to reclassify to earnings
$1.3 million
of net unrealized gains related to these forward contracts that are included in “
Accumulated other comprehensive (loss) income
” at
December 31, 2018
as we realize the earnings effects of the related forecasted transactions. The amount we ultimately record to earnings will depend on the actual exchange rates when we realize the related forecasted transactions.
Transaction Exposure and Economic Hedging
Many of our subsidiaries have assets and liabilities (primarily cash, receivables, marketable securities, deferred taxes, payables, accrued expenses, and solar module collection and recycling liabilities) that are denominated in currencies other than the subsidiaries’ functional currencies. Changes in the exchange rates between the functional currencies of our subsidiaries and the other currencies in which these assets and liabilities are denominated will create fluctuations in our reported consolidated statements of operations and cash flows. We may enter into foreign exchange forward contracts or other financial instruments to economically hedge assets and liabilities against the effects of currency exchange rate fluctuations. The gains and losses on such foreign exchange forward contracts will economically offset all or part of the transaction gains and losses that we recognize in earnings on the related foreign currency denominated assets and liabilities.
110
We also enter into foreign exchange forward contracts to economically hedge balance sheet and other exposures related to transactions between certain of our subsidiaries and transactions with third parties. Such contracts are considered economic hedges and do not qualify for hedge accounting. Accordingly, we recognize gains or losses from the fluctuations in foreign exchange rates and the fair value of these derivative contracts in “
Foreign currency loss, net
” on our consolidated statements of operations. These contracts mature at various dates within the next
three months
. As of
December 31, 2018
and
2017
, the notional values of our foreign exchange forward contracts that do not qualify for hedge accounting were as follows (notional amounts and U.S. dollar equivalents in millions):
|
December 31, 2018
|
||||||
|
Transaction
|
Currency
|
Notional Amount
|
USD Equivalent
|
|||
|
Purchase
|
Australian dollar
|
AUD 2.1
|
$1.5
|
|||
|
Sell
|
Australian dollar
|
AUD 52.9
|
$37.3
|
|||
|
Purchase
|
Brazilian real
|
BRL 8.5
|
$2.2
|
|||
|
Sell
|
Canadian dollar
|
CAD 2.9
|
$2.1
|
|||
|
Sell
|
Chilean peso
|
CLP 3,506.6
|
$5.1
|
|||
|
Purchase
|
Euro
|
€115.2
|
$131.9
|
|||
|
Sell
|
Euro
|
€191.8
|
$219.7
|
|||
|
Sell
|
Indian rupee
|
INR 789.2
|
$11.3
|
|||
|
Purchase
|
Japanese yen
|
¥931.6
|
$8.4
|
|||
|
Sell
|
Japanese yen
|
¥23,858.8
|
$216.2
|
|||
|
Purchase
|
Malaysian ringgit
|
MYR 34.3
|
$8.3
|
|||
|
Sell
|
Malaysian ringgit
|
MYR 53.8
|
$12.9
|
|||
|
Sell
|
Mexican peso
|
MXN 37.3
|
$1.9
|
|||
|
Purchase
|
Singapore dollar
|
SGD 3.8
|
$2.8
|
|||
|
December 31, 2017
|
||||||
|
Transaction
|
Currency
|
Notional Amount
|
USD Equivalent
|
|||
|
Purchase
|
Australian dollar
|
AUD 12.7
|
$9.9
|
|||
|
Sell
|
Australian dollar
|
AUD 56.8
|
$44.4
|
|||
|
Sell
|
Canadian dollar
|
CAD 1.7
|
$1.4
|
|||
|
Sell
|
Chilean peso
|
CLP 10,180.9
|
$16.6
|
|||
|
Purchase
|
Chinese yuan
|
CNY 13.8
|
$2.1
|
|||
|
Purchase
|
Euro
|
€151.4
|
$181.6
|
|||
|
Sell
|
Euro
|
€193.2
|
$231.7
|
|||
|
Purchase
|
Indian rupee
|
INR 645.7
|
$10.1
|
|||
|
Sell
|
Indian rupee
|
INR 8,376.0
|
$131.1
|
|||
|
Sell
|
Japanese yen
|
¥23,922.2
|
$212.6
|
|||
|
Purchase
|
Malaysian ringgit
|
MYR 31.0
|
$7.7
|
|||
|
Sell
|
Malaysian ringgit
|
MYR 336.5
|
$83.1
|
|||
|
Sell
|
Singapore dollar
|
SGD 3.1
|
$2.3
|
|||
|
Purchase
|
South African rand
|
ZAR 12.5
|
$1.0
|
|||
|
Sell
|
South African rand
|
ZAR 61.1
|
$5.0
|
|||
111
11. Fair Value Measurements
The following is a description of the valuation techniques that we use to measure the fair value of assets and liabilities that we measure and report at fair value on a recurring basis:
|
•
|
Cash Equivalents.
At
December 31, 2018
and
2017
, our cash equivalents consisted of money market funds. We value our cash equivalents using observable inputs that reflect quoted prices for securities with identical characteristics, and accordingly, we classify the valuation techniques that use these inputs as Level 1.
|
|
•
|
Marketable Securities and Restricted Investments.
At
December 31, 2018
and
2017
, our marketable securities consisted of foreign debt, foreign government obligations, U.S. debt, and time deposits, and our restricted investments consisted of foreign and U.S. government obligations. We value our marketable securities and restricted investments using observable inputs that reflect quoted prices for securities with identical characteristics or quoted prices for securities with similar characteristics and other observable inputs (such as interest rates that are observable at commonly quoted intervals). Accordingly, we classify the valuation techniques that use these inputs as either Level 1 or Level 2 depending on the inputs used. We also consider the effect of our counterparties’ credit standing in these fair value measurements.
|
|
•
|
Derivative Assets and Liabilities
. At
December 31, 2018
and
2017
, our derivative assets and liabilities consisted of foreign exchange forward contracts involving major currencies and interest rate swap contracts involving major interest rates. Since our derivative assets and liabilities are not traded on an exchange, we value them using standard industry valuation models. As applicable, these models project future cash flows and discount the amounts to a present value using market-based observable inputs, including interest rate curves, credit risk, foreign exchange rates, and forward and spot prices for currencies. These inputs are observable in active markets over the contract term of the derivative instruments we hold, and accordingly, we classify the valuation techniques as Level 2. In evaluating credit risk, we consider the effect of our counterparties’ and our own credit standing in the fair value measurements of our derivative assets and liabilities, respectively.
|
At
December 31, 2018
and
2017
, the fair value measurements of our assets and liabilities measured on a recurring basis were as follows (in thousands):
|
Fair Value Measurements at Reporting
Date Using
|
||||||||||||||||
|
December 31, 2018
|
Quoted Prices
in Active
Markets for
Identical
Assets
(Level 1)
|
Significant
Other
Observable
Inputs
(Level 2)
|
Significant
Unobservable
Inputs
(Level 3)
|
|||||||||||||
|
Assets:
|
||||||||||||||||
|
Cash equivalents:
|
||||||||||||||||
|
Money market funds
|
$
|
200,788
|
|
$
|
200,788
|
|
$
|
—
|
|
$
|
—
|
|
||||
|
Marketable securities:
|
||||||||||||||||
|
Foreign debt
|
318,646
|
|
—
|
|
318,646
|
|
—
|
|
||||||||
|
Foreign government obligations
|
98,621
|
|
—
|
|
98,621
|
|
—
|
|
||||||||
|
U.S. debt
|
44,468
|
|
—
|
|
44,468
|
|
—
|
|
||||||||
|
Time deposits
|
681,969
|
|
681,969
|
|
—
|
|
—
|
|
||||||||
|
Restricted investments
|
179,000
|
|
—
|
|
179,000
|
|
—
|
|
||||||||
|
Derivative assets
|
2,364
|
|
—
|
|
2,364
|
|
—
|
|
||||||||
|
Total assets
|
$
|
1,525,856
|
|
$
|
882,757
|
|
$
|
643,099
|
|
$
|
—
|
|
||||
|
Liabilities:
|
||||||||||||||||
|
Derivative liabilities
|
$
|
16,499
|
|
$
|
—
|
|
$
|
16,499
|
|
$
|
—
|
|
||||
112
|
Fair Value Measurements at Reporting
Date Using
|
||||||||||||||||
|
December 31, 2017
|
Quoted Prices
in Active
Markets for
Identical
Assets
(Level 1)
|
Significant
Other
Observable
Inputs
(Level 2)
|
Significant
Unobservable
Inputs
(Level 3)
|
|||||||||||||
|
Assets:
|
||||||||||||||||
|
Cash equivalents:
|
||||||||||||||||
|
Money market funds
|
$
|
125,585
|
|
$
|
125,585
|
|
$
|
—
|
|
$
|
—
|
|
||||
|
Marketable securities:
|
||||||||||||||||
|
Foreign debt
|
238,858
|
|
—
|
|
238,858
|
|
—
|
|
||||||||
|
Foreign government obligations
|
152,850
|
|
—
|
|
152,850
|
|
—
|
|
||||||||
|
U.S. debt
|
73,671
|
|
—
|
|
73,671
|
|
—
|
|
||||||||
|
Time deposits
|
255,000
|
|
255,000
|
|
—
|
|
—
|
|
||||||||
|
Restricted investments
|
373,961
|
|
—
|
|
373,961
|
|
—
|
|
||||||||
|
Derivative assets
|
4,303
|
|
—
|
|
4,303
|
|
—
|
|
||||||||
|
Total assets
|
$
|
1,224,228
|
|
$
|
380,585
|
|
$
|
843,643
|
|
$
|
—
|
|
||||
|
Liabilities:
|
||||||||||||||||
|
Derivative liabilities
|
$
|
33,229
|
|
$
|
—
|
|
$
|
33,229
|
|
$
|
—
|
|
||||
Fair Value of Financial Instruments
At
December 31, 2018
and
2017
, the carrying values and fair values of our financial instruments not measured at fair value were as follows (in thousands):
|
|
December 31, 2018
|
December 31, 2017
|
||||||||||||||
|
Carrying
Value
|
Fair
Value
|
Carrying
Value
|
Fair
Value
|
|||||||||||||
|
Assets:
|
||||||||||||||||
|
Notes receivable – noncurrent
|
$
|
8,017
|
|
$
|
8,010
|
|
$
|
10,495
|
|
$
|
10,516
|
|
||||
|
Notes receivable, affiliate – current
|
—
|
|
—
|
|
20,411
|
|
23,317
|
|
||||||||
|
Notes receivable, affiliates – noncurrent
|
22,832
|
|
24,295
|
|
48,370
|
|
47,441
|
|
||||||||
|
Liabilities:
|
||||||||||||||||
|
Long-term debt, including current maturities (1)
|
$
|
479,157
|
|
$
|
470,124
|
|
$
|
406,388
|
|
$
|
416,486
|
|
||||
——————————
|
(1)
|
Excludes capital lease obligations and unamortized discounts and issuance costs.
|
The carrying values in our consolidated balance sheets of our trade accounts receivable, unbilled accounts receivable and retainage, restricted cash, accounts payable, and accrued expenses approximated their fair values due to their nature and relatively short maturities; therefore, we excluded them from the foregoing table. The fair value measurements for our notes receivable and long-term debt are considered Level 2 measurements under the fair value hierarchy.
Credit Risk
We have certain financial and derivative instruments that subject us to credit risk. These consist primarily of cash, cash equivalents, marketable securities, accounts receivable, restricted cash and investments, notes receivable, and foreign exchange forward contracts. We are exposed to credit losses in the event of nonperformance by the counterparties to our financial and derivative instruments. We place cash, cash equivalents, marketable securities, restricted cash and investments, and foreign exchange forward contracts with various high-quality financial institutions and limit the amount of credit risk from any one counterparty. We continuously evaluate the credit standing of our counterparty financial institutions. Our net sales are primarily concentrated among a limited number of customers. We monitor the
113
financial condition of our customers and perform credit evaluations whenever considered necessary. Depending upon the sales arrangement, we may require some form of payment security from our customers, including advance payments, parent guarantees, bank guarantees, surety bonds, or commercial letters of credit. We also have PPAs that subject us to credit risk in the event our offtake counterparties are unable to fulfill their contractual obligations, which may adversely affect our project assets and certain receivables. Accordingly, we closely monitor the credit standing of existing and potential offtake counterparties to limit such risks.
12. Equity Method Investments
From time to time, we may enter into investments or other strategic arrangements to expedite our penetration of certain markets and establish relationships with potential customers. We may also enter into strategic arrangements with customers or other entities to maximize the value of particular projects. Some of these arrangements may involve significant investments or other allocations of capital. Investments in unconsolidated entities for which we have significant influence, but not control, over the entities’ operating and financial activities are accounted for under the equity method of accounting. The following table summarizes our equity method investments as of
December 31, 2018
and
2017
(in thousands):
|
2018
|
2017
|
|||||||
|
8point3 Operating Company, LLC
|
$
|
—
|
|
$
|
199,477
|
|
||
|
Clean Energy Collective, LLC
|
—
|
|
6,521
|
|
||||
|
Other
|
3,186
|
|
11,232
|
|
||||
|
Equity method investments
|
$
|
3,186
|
|
$
|
217,230
|
|
||
8point3 Operating Company, LLC
In June 2015, 8point3, a limited partnership formed with SunPower Corporation (together with First Solar, the “Sponsors”), completed its initial public offering (the “IPO”) pursuant to a Registration Statement on Form S-1, as amended. As part of the IPO, the Sponsors contributed interests in various projects to OpCo in exchange for voting and economic interests in the entity, and 8point3 acquired an economic interest in OpCo using proceeds from the IPO. After the formation of 8point3, the Sponsors, from time to time, sold interests in solar projects to 8point3, which owns and operates such portfolio of solar energy generation projects.
In February 2018, we entered into an agreement with CD Clean Energy and Infrastructure V JV, LLC, an equity fund managed by Capital Dynamics and certain other co-investors and other parties, pursuant to which the purchasers agreed to acquire our interests in 8point3 and its subsidiaries. In June 2018, we completed the sale of those interests and received net proceeds of
$240.0 million
after the payment of fees, expenses, and other amounts.
We accounted for our interest in OpCo, a subsidiary of 8point3, under the equity method of accounting as we were able to exercise significant influence over 8point3 due to our representation on the board of directors of its general partner and certain of our associates serving as officers of its general partner. We recognized equity in earnings, net of tax, from our investment in OpCo of
$39.7 million
,
$9.8 million
, and
$32.6 million
for the years ended
December 31, 2018
,
2017
, and
2016
, respectively. Our equity in earnings for the year ended
December 31, 2018
included a gain of
$40.3 million
, net of tax, for the sale of our interests in 8point3 and its subsidiaries. Our equity in earnings for the year ended
December 31, 2016
included a gain of
$8.5 million
, net of tax, following OpCo’s issuance of
8,050,000
shares to 8point3 as part of its public offering of a corresponding number of shares. During the years ended
December 31, 2018
,
2017
, and
2016
, we received distributions from OpCo of
$12.4 million
,
$23.0 million
, and
$5.3 million
, respectively.
In connection with the IPO, we also entered into an agreement with a subsidiary of 8point3 to lease back one of our originally contributed projects, Maryland Solar, until December 31, 2019. Under the terms of the agreement, we make fixed rent payments to 8point3’s subsidiary and are entitled to all of the energy generated by the project. Due to certain continuing involvement with the project, we accounted for the leaseback agreement as a financing transaction until the sale of our interests in 8point3 and its subsidiaries in June 2018. Following the sale of such interests, the Maryland
114
Solar project qualified for sale-leaseback accounting, and we recognized net revenue of
$32.0 million
from the sale of the project. As of
December 31, 2017
, the financing obligation associated with the leaseback was
$35.0 million
.
In March 2018, FirstEnergy Solutions Corp. (“FirstEnergy”), the off-taker for the Maryland Solar PPA, filed for chapter 11 bankruptcy protection, and in April 2018, FirstEnergy filed a motion for entry of an order authorizing FirstEnergy and its affiliates to reject certain energy contracts, including the Maryland Solar PPA. In August 2018, the bankruptcy court granted the motion. As a result, we began selling energy generated by the Maryland Solar project on an open contract basis in October 2018.
In December 2016, we completed the sale of our remaining
34%
interest in the 300 MW
AC
Desert Stateline project located in San Bernardino County, California to OpCo and received a
$50.0 million
promissory note as part of the consideration for the sale. In June 2018, the outstanding balance on the promissory note of
$47.8 million
was repaid in conjunction with the sale of our interests in 8point3 and its subsidiaries. As of
December 31, 2017
, the balance outstanding on the promissory note was
$48.4 million
.
We provide O&M services to certain of 8point3’s partially owned project entities, including SG2 Holdings, LLC; Lost Hills Blackwell Holdings, LLC; NS Solar Holdings, LLC; Kingbird Solar A, LLC; Kingbird Solar B, LLC; and Desert Stateline LLC. Prior to the sale of our interests in 8point3 and its subsidiaries, we recognized revenue of
$5.6 million
,
$11.0 million
, and
$6.1 million
for such O&M services during the years ended
December 31, 2018
,
2017
, and
2016
, respectively.
Clean Energy Collective, LLC
In November 2014, we entered into various agreements to purchase a minority ownership interest in Clean Energy Collective, LLC (“CEC”). This investment provided us with additional access to the distributed generation market and a partner to develop and market community solar offerings to North American residential customers and businesses directly on behalf of client utility companies. As part of the investment, we also received a warrant to purchase additional ownership interests in CEC.
In addition to our equity investment, we also entered into a term loan agreement and a convertible loan agreement with CEC in November 2014 and February 2016, respectively. Our term loan bears interest at
16%
per annum, and our convertible loan bears interest at
10%
per annum. In November 2018, we amended the terms of the loan agreements to (i) extend their maturity to June 2020, (ii) waive the conversion features on our convertible loan, and (iii) increase the frequency of interest payments, subject to certain conditions. As of
December 31, 2018
and
2017
, the aggregate balance outstanding on the loans was
$22.8 million
and
$20.4 million
, respectively.
In September 2018, the board of managers of CEC evaluated restructuring proposals to address certain liquidity issues that were adversely affecting its operations. Such restructuring provided for the subsequent repayment of CEC’s outstanding debt, including our loan agreements, but indicated that a decrease in the value of our investment in CEC may have occurred that was other than temporary. Accordingly, in September 2018, we recorded an impairment loss of
$3.5 million
, net of tax, for our remaining investment in CEC based on the proposed restructuring. In September 2018, we also recorded an impairment loss of
$1.8 million
in “Other (loss) income, net” for the expected surrender of our warrant. In November 2018, the owners and lenders of CEC entered into various restructuring agreements based on the previously proposed arrangement. In January 2019, the restructuring was finalized, which resulted in a dilution of our ownership interest in CEC, the loss of representation on the company’s board of managers, and the surrender of our warrant.
As of
December 31, 2018
, CEC was considered a variable interest entity, or VIE, and our
25%
ownership interest in and loans to the company were considered variable interests. We accounted for our investment in CEC under the equity method of accounting as we were not the primary beneficiary of the company given that we did not have the power to make decisions over the activities that most significantly impact the company’s economic performance. Under the equity method of accounting, we recognized equity in earnings for our proportionate share of CEC’s net income or loss
115
including adjustments for the amortization of a basis difference resulting from the cost of our investment differing from our proportionate share of CEC’s equity. During the years ended
December 31, 2018
,
2017
, and
2016
, we recognized losses, net of tax, of
$4.3 million
,
$2.6 million
, and
$3.6 million
, respectively, from our investment in CEC, including the impairment of our remaining investment described above. During the year ended
December 31, 2017
, we sold 21 MW
DC
of solar modules to CEC and recognized revenue of
$7.6 million
.
Summarized Financial Information
The following table presents summarized financial information, in the aggregate, for our significant equity method investees, as provided to us by the investees (in thousands):
|
Fiscal 2018
|
Fiscal 2017
|
Fiscal 2016
|
||||||||||
|
Summary statement of operations information:
|
||||||||||||
|
Net sales
|
$
|
28,736
|
|
$
|
70,089
|
|
$
|
125,643
|
|
|||
|
Operating (loss) income
|
(38,606
|
)
|
24,661
|
|
55,266
|
|
||||||
|
Net (loss) income
(1)
|
(39,280
|
)
|
46,713
|
|
63,893
|
|
||||||
|
Net (loss) income attributable to equity method investees
(1) (2)
|
(45,228
|
)
|
53,183
|
|
190,240
|
|
||||||
|
As of Fiscal 2018
|
As of Fiscal 2017
|
|||||||||||
|
Summary balance sheet information:
|
||||||||||||
|
Current assets
|
$
|
—
|
|
$
|
36,744
|
|
||||||
|
Long-term assets
|
—
|
|
1,573,115
|
|
||||||||
|
Current liabilities
|
—
|
|
7,648
|
|
||||||||
|
Long-term liabilities
|
—
|
|
706,885
|
|
||||||||
|
Noncontrolling interests, including redeemable noncontrolling interests
|
—
|
|
72,945
|
|
||||||||
——————————
|
(1)
|
The difference between Net (loss) income and Net (loss) income attributable to equity method investees is due to OpCo’s tax equity financing facilities with third-party investors that hold noncontrolling ownership interests in certain of its subsidiaries. Accordingly, earnings or losses are allocated to such tax equity investors using the Hypothetical Liquidation at Book Value (or “HLBV”) method. During the fiscal 2018, 2017, and 2016 periods, OpCo allocated certain losses to such third-party investors under the HLBV method, which represented the difference between Net (loss) income and Net (loss) income attributable to equity method investees.
|
|
(2)
|
Our proportionate share of OpCo’s net loss for fiscal 2018 excluded the investee’s impairment loss related to the Maryland Solar project as we accounted for the sale-leaseback of the project as a financing transaction and the associated financing liability exceeded the carrying value of the project.
|
13. Solar Module Collection and Recycling Liability
We previously established a module collection and recycling program to collect and recycle modules sold and covered under such program once the modules reach the end of their useful lives. For legacy customer sales contracts that were covered under this program, we agreed to pay the costs for the collection and recycling of qualifying solar modules, and the end-users agreed to notify us, disassemble their solar power systems, package the solar modules for shipment, and revert ownership rights over the modules back to us at the end of the modules’ service lives. Accordingly, we recorded any collection and recycling obligations within “Cost of sales” at the time of sale based on the estimated cost to collect and recycle the covered solar modules. During the years ended
December 31, 2018
,
2017
, and
2016
, substantially all of our modules sold were not covered by our collection and recycling program as we discontinued including such program in our sales contracts.
We estimate the cost of our collection and recycling obligations based on the present value of the expected probability-weighted future cost of collecting and recycling the solar modules, which includes estimates for the cost of packaging materials; the cost of freight from the solar module installation sites to a recycling center; material, labor, and capital
116
costs; the scale of recycling centers; and an estimated third-party profit margin and return on risk for collection and recycling services. We base these estimates on (i) our experience collecting and recycling our solar modules, (ii) the expected timing of when our solar modules will be returned for recycling, and (iii) the expected economic factors at the time the solar modules will be collected and recycled. In the periods between the time of sale and the related settlement of the collection and recycling obligation, we accrete the carrying amount of the associated liability by applying the discount rate used for its initial measurement. We classify accretion as an operating expense within “
Selling, general and administrative
” expense on our consolidated statements of operations.
We periodically review our estimates of expected future recycling costs and may adjust our liability accordingly. During the year ended
December 31, 2018
, we reduced our module collection and recycling liability by
$34.2 million
primarily due to higher by-product credits for glass, lower capital costs resulting from the expanded scale of our recycling facilities, and adjustments to certain valuation assumptions driven by our increased experience with module recycling. During the year ended
December 31, 2017
, we reduced our module collection and recycling liability by
$15.8 million
primarily as a result of updates to several valuation assumptions, including a decrease in certain inflation rates.
Our module collection and recycling liability was
$134.4 million
and
$166.6 million
as of
December 31, 2018
and
2017
, respectively. During the years ended
December 31, 2018
and
2017
, we recognized net benefits of
$25.0 million
and
$13.2 million
, respectively, to cost of sales as a result of the reductions in our module collection and recycling liability described above. During the year ended
December 31, 2018
, we also recognized a net benefit of
$2.9 million
to accretion expense primarily due to the reduction in the liability. During the years ended
December 31, 2017
and
2016
, we recognized net accretion expense of
$3.9 million
and
$6.1 million
, respectively, associated with the liability. As of
December 31, 2018
, a
1%
increase in the annualized inflation rate used in our estimated future collection and recycling cost per module would increase our liability by
$25.7 million
, and a
1%
decrease in that rate would decrease our liability by
$21.7 million
. See
Note 8. “Restricted Cash and Investments”
to our consolidated financial statements for more information about our arrangements for funding this liability.
14. Debt
Our long-term debt consisted of the following at
December 31, 2018
and
2017
(in thousands):
|
Balance (USD)
|
||||||||||
|
Loan Agreement
|
Currency
|
2018
|
2017
|
|||||||
|
Revolving Credit Facility
|
USD
|
$
|
—
|
|
$
|
—
|
|
|||
|
Luz del Norte Credit Facilities
|
USD
|
188,849
|
|
185,675
|
|
|||||
|
Ishikawa Credit Agreement
|
JPY
|
157,834
|
|
121,446
|
|
|||||
|
Japan Credit Facility
|
JPY
|
—
|
|
10,710
|
|
|||||
|
Tochigi Credit Facility
|
JPY
|
25,468
|
|
—
|
|
|||||
|
Mashiko Credit Agreement
|
JPY
|
—
|
|
—
|
|
|||||
|
Royal Solar Credit Facility
|
JPY
|
—
|
|
—
|
|
|||||
|
Marikal Credit Facility
|
INR
|
—
|
|
7,384
|
|
|||||
|
Hindupur Credit Facility
|
INR
|
—
|
|
18,722
|
|
|||||
|
Anantapur Credit Facility
|
INR
|
16,101
|
|
—
|
|
|||||
|
Tungabhadra Credit Facility
|
INR
|
13,934
|
|
—
|
|
|||||
|
Manildra Credit Facility
|
AUD
|
—
|
|
62,451
|
|
|||||
|
Beryl Credit Facility
|
AUD
|
76,971
|
|
—
|
|
|||||
|
Capital lease obligations
|
Various
|
—
|
|
156
|
|
|||||
|
Long-term debt principal
|
479,157
|
|
406,544
|
|
||||||
|
Less: unamortized discounts and issuance costs
|
(12,366
|
)
|
(13,004
|
)
|
||||||
|
Total long-term debt
|
466,791
|
|
393,540
|
|
||||||
|
Less: current portion
|
(5,570
|
)
|
(13,075
|
)
|
||||||
|
Noncurrent portion
|
$
|
461,221
|
|
$
|
380,465
|
|
||||
117
Revolving Credit Facility
Our amended and restated credit agreement with several financial institutions as lenders and JPMorgan Chase Bank, N.A. as administrative agent provides us with a senior secured credit facility (the “Revolving Credit Facility”) with an aggregate borrowing capacity of
$500.0 million
, which we may increase to
$750.0 million
, subject to certain conditions.
Borrowings under the credit facility bear interest at (i) London Interbank Offered Rate (“LIBOR”), adjusted for Eurocurrency reserve requirements, plus a margin of 2.00% or (ii) a base rate as defined in the credit agreement plus a margin of 1.00% depending on the type of borrowing requested
. These margins are also subject to adjustment depending on our consolidated leverage ratio. We had no borrowings under our Revolving Credit Facility as of
December 31, 2018
and
2017
and had issued
$66.0 million
and
$57.5 million
, respectively, of letters of credit using availability under the facility. Loans and letters of credit issued under the Revolving Credit Facility are jointly and severally guaranteed by First Solar, Inc.; First Solar Electric, LLC; First Solar Electric (California), Inc.; and First Solar Development, LLC and are secured by interests in substantially all of the guarantors’ tangible and intangible assets other than certain excluded assets.
In addition to paying interest on outstanding principal under the Revolving Credit Facility, we are required to pay a commitment fee at a rate of
0.30%
per annum, based on the average daily unused commitments under the facility, which may also be adjusted due to changes in our consolidated leverage ratio. We also pay a letter of credit fee based on the applicable margin for Eurocurrency revolving loans on the face amount of each letter of credit and a fronting fee of
0.125%
. Our Revolving Credit Facility matures in July 2022.
Luz del Norte Credit Facilities
In August 2014, Parque Solar Fotovoltaico Luz del Norte SpA (“Luz del Norte”), our indirect wholly-owned subsidiary and project company, entered into credit facilities with the Overseas Private Investment Corporation (“OPIC”) and the International Finance Corporation (“IFC”) to provide limited-recourse senior secured debt financing for the design, development, financing, construction, testing, commissioning, operation, and maintenance of a 141 MW
AC
PV solar power plant located near Copiapó, Chile. At the same time, Luz del Norte also entered into a Chilean peso facility (the “VAT facility” and together with the OPIC and IFC loans, the “Luz del Norte Credit Facilities”) with Banco de Crédito e Inversiones to fund Chilean value added tax associated with the construction of the Luz del Norte project. In March 2017, we repaid the remaining balance on the VAT facility.
In March 2017, we amended the terms of the OPIC and IFC credit facilities. Such amendments (i) allowed for the capitalization of accrued and unpaid interest through March 15, 2017, along with the capitalization of certain future interest payments as variable rate loans under the credit facilities, (ii) allowed for the conversion of certain fixed rate loans to variable rate loans upon scheduled repayment, (iii) extended the maturity of the OPIC and IFC loans until June 2037, and (iv) canceled the remaining borrowing capacity under the OPIC and IFC credit facilities with the exception of the capitalization of certain future interest payments. As of
December 31, 2018
and
2017
, the balance outstanding on the OPIC loans was
$141.4 million
and
$139.0 million
, respectively. As of
December 31, 2018
and
2017
, the balance outstanding on the IFC loans was
$47.4 million
and
$46.6 million
, respectively. The OPIC and IFC loans are secured by liens over all of Luz del Norte’s assets and by a pledge of all of the equity interests in the entity. In February 2019, we received a waiver for a technical noncompliance related to the Luz Del Norte Credit Facilities as of
December 31, 2018
. We expect to cure such technical noncompliance within the waiver period, which expires in June 2019.
Ishikawa Credit Agreement
In December 2016, FS Japan Project 12 GK (“Ishikawa”), our indirect wholly-owned subsidiary and project company, entered into a credit agreement (the “Ishikawa Credit Agreement”) with Mizuho Bank, Ltd. for aggregate borrowings up to
¥27.3 billion
(
$247.4 million
) for the development and construction of a 59 MW
AC
PV solar power plant located in Ishikawa, Japan. The credit agreement consists of a
¥24.0 billion
(
$217.5 million
) senior loan facility, a
¥2.1 billion
(
$19.0 million
) consumption tax facility, and a
¥1.2 billion
(
$10.9 million
) letter of credit facility. The senior loan facility matures in October 2036, and the consumption tax facility matures in April 2020. The credit agreement is
118
secured by pledges of Ishikawa’s assets, accounts, material project documents, and by the equity interests in the entity. As of
December 31, 2018
and
2017
, the balance outstanding on the credit agreement was
$157.8 million
and
$121.4 million
, respectively.
Japan Credit Facility
In September 2015, First Solar Japan GK, our wholly-owned subsidiary, entered into a construction loan facility with Mizuho Bank, Ltd. for borrowings up to
¥4.0 billion
(
$36.3 million
) for the development and construction of utility-scale PV solar power plants in Japan (the “Japan Credit Facility”). In September 2018, First Solar Japan GK renewed the facility for an additional one-year period until September 2019. The facility is guaranteed by First Solar, Inc. and secured by pledges of certain projects’ cash accounts and other rights in the projects. As of
December 31, 2018
and
2017
, the balance outstanding on the facility was
zero
and
$10.7 million
, respectively.
Tochigi Credit Facility
In June 2017, First Solar Japan GK, our wholly-owned subsidiary, entered into a term loan facility with Mizuho Bank, Ltd. for borrowings up to
¥7.0 billion
(
$63.4 million
) for the development of utility-scale PV solar power plants in Japan (the “Tochigi Credit Facility”). The term loan facility matures in March 2021. The facility is guaranteed by First Solar, Inc. and secured by pledges of certain of First Solar Japan GK’s accounts. As of
December 31, 2018
and
2017
, the balance outstanding on the term loan facility was
$25.5 million
and
zero
, respectively.
Mashiko Credit Agreement
In March 2018, FS Japan Project 14 GK (“Mashiko”), our indirect wholly-owned subsidiary and project company, entered into a credit agreement (the “Mashiko Credit Agreement”) with Mizuho Bank, Ltd. for aggregate borrowings up to
¥9.2 billion
(
$83.4 million
) for the development and construction of a 19 MW
AC
PV solar power plant located in Tochigi, Japan. The credit agreement consisted of a
¥8.1 billion
(
$73.4 million
) senior loan facility, a
¥0.7 billion
(
$6.3 million
) consumption tax facility, and a
¥0.4 billion
(
$3.6 million
) letter of credit facility. In December 2018, we completed the sale of our Mashiko project, and the outstanding balance of the Mashiko Credit Agreement of
$57.2 million
was assumed by the customer.
Royal Solar Credit Facility
In November 2018, Royal Solar GK, our indirect wholly-owned subsidiary and project company, entered into a credit agreement (the “Royal Solar Credit Facility”) with Shinsei Bank, Ltd. for aggregate borrowings up to
¥11.8 billion
(
$106.9 million
) for the development and construction of a 25 MW
AC
PV solar power plant located in Gunma, Japan. The credit facility consisted of a
¥10.5 billion
(
$95.2 million
) term loan facility, a
¥0.9 billion
(
$8.2 million
) consumption tax facility, and a
¥0.4 billion
(
$3.6 million
) debt service reserve facility. In December 2018, we completed the sale of our Royal Solar project, and the outstanding balance of the Royal Solar Credit Facility of
$67.2 million
was assumed by the customer.
Marikal Credit Facility
In March 2015, FS India Devco Private Limited (previously known as Marikal Solar Parks Private Limited), our indirect wholly-owned subsidiary and project company, entered into a term loan facility (the “Marikal Credit Facility”) with Axis Bank as administrative agent for aggregate borrowings up to
INR 0.5 billion
(
$7.8 million
) for the development and construction of a
10 MW
AC
PV solar power plant located in Telangana, India. In May 2018, we repaid the remaining
$6.8 million
principal balance on the term loan facility. As of
December 31, 2017
, the balance outstanding on the term loan facility was
$7.4 million
.
119
Hindupur Credit Facility
In November 2016, Hindupur Solar Parks Private Limited, our indirect wholly-owned subsidiary and project company, entered into a term loan facility (the “Hindupur Credit Facility”) with Yes Bank Limited for borrowings up to
INR 4.3 billion
(
$61.4 million
) for costs related to an 80 MW
AC
portfolio of PV solar power plants located in Andhra Pradesh, India. The term loan facility had a letter of credit sub-limit of
INR 3.2 billion
(
$45.7 million
), which was used for project related costs. In March 2018, we completed the sale of our Hindupur projects, and the outstanding balance of the Hindupur Credit Facility of
$17.0 million
was assumed by the customer. As of
December 31, 2017
, we had issued
INR 2.9 billion
(
$41.4 million
) of letters of credit under the term loan facility, and the balance outstanding on the term loan facility was
$18.7 million
.
Anantapur Credit Facility
In March 2018, Anantapur Solar Parks Private Limited, our indirect wholly-owned subsidiary and project company, entered into a term loan facility (the “Anantapur Credit Facility”) with J.P. Morgan Securities India Private Limited for borrowings up to
INR 1.2 billion
(
$17.1 million
) for costs related to a 20 MW
AC
PV solar power plant located in Karnataka, India. The term loan facility matures in February 2021 and is secured by a letter of credit issued by JPMorgan Chase Bank, N.A., Singapore, in favor of the lender. Such letter of credit is secured by a cash deposit placed by First Solar FE Holdings Pte. Ltd. As of
December 31, 2018
, the balance outstanding on the term loan facility was
$16.1 million
.
Tungabhadra Credit Facility
In March 2018, Tungabhadra Solar Parks Private Limited, our indirect wholly-owned subsidiary and project company, entered into a term loan facility (the “Tungabhadra Credit Facility”) with J.P. Morgan Securities India Private Limited for borrowings up to
INR 1.0 billion
(
$14.3 million
) for costs related to a 20 MW
AC
PV solar power plant located in Karnataka, India. The term loan facility matures in February 2021 and is secured by a letter of credit issued by JPMorgan Chase Bank, N.A., Singapore, in favor of the lender. Such letter of credit is secured by a cash deposit placed by First Solar FE Holdings Pte. Ltd. As of
December 31, 2018
, the balance outstanding on the term loan facility was
$13.9 million
.
Manildra Credit Facility
In March 2017, Manildra Finco Pty Ltd, our indirect wholly-owned subsidiary and project financing company, entered into a term loan facility (the “Manildra Credit Facility”) with Société Générale S.A. and The Bank of Tokyo-Mitsubishi UFJ, Ltd. for aggregate borrowings up to
AUD 81.7 million
(
$57.6 million
) for costs related to a 49 MW
AC
PV solar power plant located in New South Wales, Australia. The credit facility consisted of an
AUD 75.7 million
(
$53.4 million
) construction loan facility and an additional
AUD 6.0 million
(
$4.2 million
) goods and service tax facility (“GST facility”) to fund certain taxes associated with the construction of the associated project. In September 2018, we completed the sale of our Manildra project, and the outstanding balance of the Manildra Credit Facility of
$56.1 million
was assumed by the customer. As of
December 31, 2017
, the balance outstanding on the credit facility was
$62.5 million
.
Beryl Credit Facility
In May 2018, FS NSW Project No 1 Finco Pty Ltd, our wholly-owned subsidiary and project financing company, entered into a term loan facility (the “Beryl Credit Facility”) with MUFG Bank, Ltd.; Société Générale, Hong Kong Branch; and Mizuho Bank, Ltd. for aggregate borrowings up to
AUD 146.4 million
(
$103.2 million
) for the development and construction of an 87 MW
AC
PV solar power plant located in New South Wales, Australia. In October 2018, the borrowing capacity on the Beryl Credit Facility was reduced to
AUD 136.4 million
(
$96.2 million
). Accordingly, the credit facility consists of an
AUD 125.4 million
(
$88.4 million
) construction loan facility, an
AUD 7.0 million
(
$4.9 million
) GST facility to fund certain taxes associated with the construction of the project, and an
AUD 4.0 million
(
$2.8 million
) letter of credit facility. Upon completion of the project’s construction, the construction loan facility will convert
120
to a term loan facility. The term loan facility matures in May 2023, and the GST facility matures in May 2020. The credit facility is secured by pledges of the borrower’s assets, accounts, material project documents, and by the equity interests in the entity. As of
December 31, 2018
, the balance outstanding on the credit facility was
$77.0 million
.
Variable Interest Rate Risk
Certain of our long-term debt agreements bear interest at prime, LIBOR, TIBOR, BBSY, or equivalent variable rates. An increase in these variable rates would increase the cost of borrowing under our Revolving Credit Facility and certain project specific debt financings. Our long-term debt borrowing rates as of
December 31, 2018
were as follows:
|
Loan Agreement
|
December 31, 2018
|
|
|
Revolving Credit Facility
|
4.50%
|
|
|
Luz del Norte Credit Facilities (1)
|
Fixed rate loans at bank rate plus 3.50%
|
|
|
Variable rate loans at 91-Day U.S. Treasury Bill Yield or LIBOR plus 3.50%
|
||
|
Ishikawa Credit Agreement
|
Senior loan facility at 6-month TIBOR plus 0.75% (2)
|
|
|
Consumption tax facility at 3-month TIBOR plus 0.5%
|
||
|
Japan Credit Facility
|
1-month TIBOR plus 0.5%
|
|
|
Tochigi Credit Facility
|
3-month TIBOR plus 1.0%
|
|
|
Anantapur Credit Facility
|
INR overnight indexed swap rate plus 1.5%
|
|
|
Tungabhadra Credit Facility
|
INR overnight indexed swap rate plus 1.5%
|
|
|
Beryl Credit Facility
|
Construction loan facility at 1-month BBSY plus 1.75% (2)
|
|
|
GST facility at 1-month BBSY plus 1.00%
|
||
——————————
|
(1)
|
Outstanding balance comprised of
$161.1 million
of fixed rate loans and
$27.7 million
of variable rate loans as of
December 31, 2018
.
|
|
(2)
|
We have entered into interest rate swap contracts to hedge portions of these variable rates.
See Note 10. “Derivative Financial Instruments”
to our consolidated financial statements for additional information.
|
During the years ended
December 31, 2018
,
2017
, and
2016
, we paid
$16.6 million
,
$10.2 million
,
$4.3 million
, respectively, of interest related to our long-term debt arrangements.
Future Principal Payments
At
December 31, 2018
, the future principal payments on our long-term debt were due as follows (in thousands):
|
Total Debt
|
||||
|
2019
|
$
|
5,673
|
|
|
|
2020
|
26,935
|
|
||
|
2021
|
66,014
|
|
||
|
2022
|
12,221
|
|
||
|
2023
|
71,620
|
|
||
|
Thereafter
|
296,694
|
|
||
|
Total long-term debt future principal payments
|
$
|
479,157
|
|
|
121
15. Commitments and Contingencies
Commercial Commitments
During the normal course of business, we enter into commercial commitments in the form of letters of credit, bank guarantees, and surety bonds to provide financial and performance assurance to third parties. Our amended and restated Revolving Credit Facility provides us with a sub-limit of
$400.0 million
to issue letters of credit, subject to certain additional limits depending on the currencies of the letters of credit, at a fee based on the applicable margin for Eurocurrency revolving loans and a fronting fee. As of
December 31, 2018
, we had
$66.0 million
in letters of credit issued under our Revolving Credit Facility, leaving
$334.0 million
of availability for the issuance of additional letters of credit. As of
December 31, 2018
, we also had
$0.6 million
of bank guarantees and letters of credit under separate agreements that were posted by certain of our foreign subsidiaries and
$281.1 million
of letters of credit issued under three bilateral facilities, of which
$44.4 million
was secured with cash, leaving
$157.9 million
of aggregate available capacity under such agreements and facilities. We also had
$57.8 million
of surety bonds outstanding, leaving
$658.5 million
of available bonding capacity under our surety lines as of
December 31, 2018
. The majority of these letters of credit, bank guarantees, and surety bonds supported our systems projects.
In addition to the commercial commitments noted above, we also issued certain commercial letters of credit, also known as letters of undertaking, under our Hindupur Credit Facility as discussed in
Note 14. “Debt”
to our consolidated financial statements. Such commercial letters of credit represented conditional commitments on the part of the issuing financial institution to provide payment on amounts drawn in accordance with the terms of the individual documents. As part of the financing of the associated systems projects, we presented these commercial letters of credit to other financial institutions, whereby we received immediate funding, and these other financial institutions agreed to settle such letters at a future date. At the time of settlement, the balance of the commercial letters of credit would be included in the balance outstanding of the credit facility. In the periods between the receipt of cash and the subsequent settlement of the commercial letters of credit, we accrued interest on the balance or otherwise accreted any discounted value of the letters to their face value and recorded such amounts as “
Interest expense, net
” on our consolidated statements of operations. In March 2018, we completed the sale of our Hindupur projects, and the outstanding letters of credit of
$43.3 million
under the Hindupur Credit Facility were assumed by the customer. As of
December 31, 2017
, we accrued
$43.4 million
for contingent obligations associated with such commercial letters of credit. These amounts were classified as “Other liabilities” on our consolidated balance sheets to align with the timing in which we expected to settle such obligations as payments under the associated credit facility.
Lease Commitments
We lease our corporate headquarters, administrative offices, R&D facilities, and warehouse space in the United States and international locations under noncancelable operating leases. We also lease land for the development and construction of certain systems projects and, in international locations, for our manufacturing facilities. These leases may require us to pay property taxes, common area maintenance, and certain other costs in addition to base rent. We also lease certain machinery and equipment. Future minimum payments under our operating leases were as follows as of
December 31, 2018
(in thousands):
|
Total Minimum Lease Payments
|
||||
|
2019
|
$
|
13,839
|
|
|
|
2020
|
9,031
|
|
||
|
2021
|
8,309
|
|
||
|
2022
|
7,824
|
|
||
|
2023
|
7,749
|
|
||
|
Thereafter
|
100,062
|
|
||
|
Total operating lease obligations
|
$
|
146,814
|
|
|
122
Our rent expense was
$18.9 million
,
$22.1 million
, and
$24.5 million
for the years ended
December 31, 2018
,
2017
, and
2016
, respectively.
Purchase Commitments
We purchase raw materials, manufacturing equipment, construction materials, and various services from a variety of vendors. During the normal course of business, in order to manage manufacturing and construction lead times and help ensure an adequate supply of certain items, we enter into agreements with suppliers that either allow us to procure goods and services when we choose or that establish purchase requirements over the term of the agreement. In certain instances, our purchase agreements allow us to cancel, reschedule, or adjust our purchase requirements based on our business needs prior to firm orders being placed. Consequently, only a portion of our purchase commitments are firm and noncancelable or cancelable with a significant penalty. At
December 31, 2018
, our obligations under such arrangements were
$1.4 billion
, of which
$335.6 million
related to capital expenditures. We expect to make
$875.7 million
of payments under these purchase obligations in
2019
.
Product Warranties
When we recognize revenue for module or system sales, we accrue liabilities for the estimated future costs of meeting our limited warranty obligations for both modules and the balance of the systems. We make and revise these estimates based primarily on the number of solar modules under warranty installed at customer locations, our historical experience with warranty claims, our monitoring of field installation sites, our internal testing and the expected future performance of our solar modules and BoS parts, and our estimated replacement costs. From time to time, we have taken remediation actions with respect to affected modules beyond our limited warranties and may elect to do so in the future, in which case we would incur additional expenses. Such potential voluntary future remediation actions beyond our limited warranty obligations may be material to our consolidated statements of operations if we commit to any such remediation actions.
Product warranty activities during the years ended
December 31, 2018
,
2017
, and
2016
were as follows (in thousands):
|
|
2018
|
2017
|
2016
|
|||||||||
|
Product warranty liability, beginning of period
|
$
|
224,274
|
|
$
|
252,408
|
|
$
|
231,751
|
|
|||
|
Accruals for new warranties issued
|
14,132
|
|
23,313
|
|
35,256
|
|
||||||
|
Settlements
|
(11,851
|
)
|
(11,329
|
)
|
(16,266
|
)
|
||||||
|
Changes in estimate of product warranty liability
|
(5,863
|
)
|
(40,118
|
)
|
1,667
|
|
||||||
|
Product warranty liability, end of period
|
$
|
220,692
|
|
$
|
224,274
|
|
$
|
252,408
|
|
|||
|
Current portion of warranty liability
|
$
|
27,657
|
|
$
|
28,767
|
|
$
|
40,079
|
|
|||
|
Noncurrent portion of warranty liability
|
$
|
193,035
|
|
$
|
195,507
|
|
$
|
212,329
|
|
|||
During the year ended December 31, 2017, we reduced our product warranty liability by
$31.3 million
as a result of a reduction in the estimated replacement cost of our modules under warranty. Such change in estimate was primarily driven by continued reductions in the manufacturing cost per watt of our solar modules.
We estimate our limited product warranty liability for power output and defects in materials and workmanship under normal use and service conditions based on warranty return rates of approximately
1%
to
3%
for modules covered under warranty, depending on the series of module technology. As of
December 31, 2018
, a
1%
change in estimated warranty return rates would change our module warranty liability by
$74.6 million
, and a
1%
change in the estimated warranty return rate for BoS parts would not have a material impact on the associated warranty liability.
Performance Guarantees
As part of our systems business, we conduct performance testing of a system prior to substantial completion to confirm the system meets its operational and capacity expectations noted in the EPC agreement. In addition, we may provide
123
an energy performance test during the first or second year of a system’s operation to demonstrate that the actual energy generation for the applicable period meets or exceeds the modeled energy expectation, after certain adjustments. If there is an underperformance event with regards to these tests, we may incur liquidated damages as specified in the EPC contract. In certain instances, a bonus payment may be received at the end of the applicable test period if the system performs above a specified level. As of
December 31, 2018
and
2017
, we accrued
$0.4 million
and
$2.1 million
, respectively, of estimated obligations under such arrangements, which were classified as “
Other current liabilities
” in our consolidated balance sheets.
As part of our O&M service offerings, we typically offer an effective availability guarantee, which stipulates that a system will be available to generate a certain percentage of total possible energy during a specific period after adjusting for factors outside of our control as the service provider, such as weather, curtailment, outages, force majeure, and other conditions that may affect system availability. Effective availability guarantees are only offered as part of our O&M services and terminate at the end of an O&M arrangement. If we fail to meet the contractual threshold for these guarantees, we may incur liquidated damages for certain lost energy under the PPA. Our O&M agreements typically contain provisions limiting our total potential losses under an agreement, including amounts paid for liquidated damages, to a percentage of O&M fees. Many of our O&M agreements also contain provisions whereby we may receive a bonus payment if system availability exceeds a separate threshold. As of
December 31, 2018
and
2017
, we did not accrue any estimated obligations under our effective availability guarantees.
Indemnifications
In certain limited circumstances, we have provided indemnifications to customers, including project tax equity investors, under which we are contractually obligated to compensate such parties for losses they suffer resulting from a breach of a representation, warranty, or covenant or a reduction in tax benefits received, including investment tax credits. Project related tax benefits are, in part, based on guidance provided by the IRS and U.S. Treasury Department, which includes assumptions regarding the fair value of qualifying PV solar power systems. For any sales contracts that have such indemnification provisions, we initially recognize a liability under ASC 460 for the estimated premium that would be required by a guarantor to issue the same indemnity in a standalone arm’s-length transaction with an unrelated party.
We typically base these estimates on the cost of insurance policies that cover the underlying risks being indemnified and may purchase such policies to mitigate our exposure to potential indemnification payments. We subsequently measure such liabilities at the greater of the initially estimated premium or the contingent liability required to be recognized under ASC 450. We recognize any indemnification liabilities as a reduction of revenue in the related transaction.
After an indemnification liability is recorded, we derecognize such amount pursuant to ASC 460-10-35-2 depending on the nature of the indemnity, which derecognition typically occurs upon expiration or settlement of the arrangement, and any contingent aspects of the indemnity are accounted for in accordance with ASC 450. As of
December 31, 2018
and
2017
, we accrued
$3.0 million
and
$4.9 million
of noncurrent indemnification liabilities, respectively, for tax related indemnifications. As of
December 31, 2017
, we also accrued
$2.9 million
of current indemnification liabilities for such matters. As of
December 31, 2018
, the maximum potential amount of future payments under our tax related and other indemnifications was
$125.3 million
, and we held insurance policies allowing us to recover up to
$84.9 million
of potential amounts paid under the indemnifications covered by the policies.
Contingent Consideration
As part of our prior acquisition of Enki, we agreed to pay additional consideration to the selling shareholders contingent upon the achievement of certain production and module performance milestones.
See Note 5. “Business Acquisitions”
to our consolidated financial statements for further discussion of this acquisition. In October 2018, we paid the remaining consideration of
$3.5 million
to the selling shareholders as a result of the achievement of the second performance milestone. As of
December 31, 2017
, we accrued
$1.8 million
of current liabilities for our contingent obligations associated with the Enki acquisition based on their estimated fair values and the expected timing of payment.
124
We continually seek to make additions to our advanced-stage project pipeline by actively developing our early-to-mid-stage project pipeline and by pursuing opportunities to acquire projects at various stages of development. In connection with such project acquisitions, we may agree to pay additional amounts to project sellers upon the achievement of certain milestones, such as obtaining a PPA, obtaining financing, or selling the project to a new owner. We recognize a project acquisition contingent liability when we determine that such a liability is both probable and reasonably estimable, and the carrying amount of the related project asset is correspondingly increased. As of
December 31, 2018
and
2017
, we accrued
$0.7 million
and
$4.4 million
of current liabilities, respectively, and
$2.3 million
and
$3.2 million
of long-term liabilities, respectively, for project related contingent obligations. Any future differences between the acquisition-date contingent obligation estimate and the ultimate settlement of the obligation are recognized as an adjustment to the project asset, as contingent payments are considered direct and incremental to the underlying value of the related project.
Legal Proceedings
Class Action
On March 15, 2012, a purported class action lawsuit titled Smilovits v. First Solar, Inc., et al., Case No. 2:12-cv-00555-DGC, was filed in the United States District Court for the District of Arizona (hereafter “Arizona District Court”) against the Company and certain of our current and former directors and officers. The complaint was filed on behalf of persons who purchased or otherwise acquired the Company’s publicly traded securities between April 30, 2008 and February 28, 2012 (the “Class Action”). The complaint generally alleges that the defendants violated Sections 10(b) and 20(a) of the Securities Exchange Act of 1934 by making false and misleading statements regarding the Company’s financial performance and prospects. The action includes claims for damages, including interest, and an award of reasonable costs and attorneys’ fees to the putative class. The Company believes it has meritorious defenses and will vigorously defend this action.
On July 23, 2012, the Arizona District Court issued an order appointing as lead plaintiffs in the Class Action the Mineworkers’ Pension Scheme and British Coal Staff Superannuation Scheme (collectively, the “Pension Schemes”). The Pension Schemes filed an amended complaint on August 17, 2012, which contains similar allegations and seeks similar relief as the original complaint. Defendants filed a motion to dismiss on September 14, 2012. On December 17, 2012, the court denied defendants’ motion to dismiss. On October 8, 2013, the Arizona District Court granted the Pension Schemes’ motion for class certification and certified a class comprised of all persons who purchased or otherwise acquired publicly traded securities of the Company between April 30, 2008 and February 28, 2012 and were damaged thereby, excluding defendants and certain related parties. Merits discovery closed on February 27, 2015.
Defendants filed a motion for summary judgment on March 27, 2015. On August 11, 2015, the Arizona District Court granted defendants’ motion in part and denied it in part, and certified an issue for immediate appeal to the Ninth Circuit Court of Appeals (the “Ninth Circuit”). First Solar filed a petition for interlocutory appeal with the Ninth Circuit, and that petition was granted on November 18, 2015. On May 20, 2016, the Pension Schemes moved to vacate the order granting the petition, dismiss the appeal, and stay the merits briefing schedule. On December 13, 2016, the Ninth Circuit denied the Pension Schemes’ motion. On January 31, 2018, the Ninth Circuit issued an opinion affirming the Arizona District Court’s order denying in part defendants’ motion for summary judgment. On March 16, 2018, First Solar filed a petition for panel rehearing or rehearing en banc with the Ninth Circuit. On May 7, 2018, the Ninth Circuit denied defendants’ petition. On August 6, 2018, defendants filed a petition for writ of certiorari to the U.S. Supreme Court. The Court has not yet ruled on that petition. Meanwhile, in the Arizona District Court, expert discovery was completed on February 5, 2019. The Arizona District Court vacated the previously scheduled trial date and all other deadlines until the outcome of the certiorari petition is clear.
This lawsuit asserts claims that, if resolved against us, could give rise to substantial damages, and an unfavorable outcome or settlement may result in a significant monetary judgment or award against us or a significant monetary payment by us, and could have a material adverse effect on our business, financial condition, and results of operations. Even if this lawsuit is not resolved against us, the costs of defending the lawsuit and of any settlement may
125
be significant. These costs would likely exceed the dollar limits of our insurance policies or may not be covered by our insurance policies. Given the uncertainties of trial, at this time we are not in a position to assess the likelihood of any potential loss or adverse effect on our financial condition or to estimate the range of potential loss, if any.
Opt-Out Action
On June 23, 2015, a suit titled Maverick Fund, L.D.C. v. First Solar, Inc., et al., Case No. 2:15-cv-01156-ROS, was filed in Arizona District Court by putative stockholders that opted out of the Class Action. The complaint names the Company and certain of our current and former directors and officers as defendants, and alleges that the defendants violated Sections 10(b) and 20(a) of the Securities Exchange Act of 1934, and violated state law, by making false and misleading statements regarding the Company’s financial performance and prospects. The action includes claims for recessionary and actual damages, interest, punitive damages, and an award of reasonable attorneys’ fees, expert fees, and costs. The Company believes it has meritorious defenses and will vigorously defend this action.
First Solar and the individual defendants filed a motion to dismiss the complaint on July 16, 2018. On November 27, 2018, the Court granted defendants’ motion to dismiss the plaintiffs’ negligent misrepresentation claim under state law, but otherwise denied defendants’ motion. This action is still in the initial stages, and there has been no discovery. Accordingly, at this time we are not in a position to assess the likelihood of any potential loss or adverse effect on our financial condition or to estimate the range of potential loss, if any.
Derivative Actions
On July 16, 2013, a derivative complaint was filed in the Superior Court of Arizona, Maricopa County, titled Bargar, et al. v. Ahearn, et al., Case No. CV2013-009938, by a putative stockholder against certain current and former directors and officers of the Company (“Bargar”). The complaint generally alleges that the defendants caused or allowed false and misleading statements to be made concerning the Company’s financial performance and prospects. The action includes claims for, among other things, breach of fiduciary duties, insider trading, unjust enrichment, and waste of corporate assets. By court order on October 3, 2013, the Superior Court of Arizona, Maricopa County granted the parties’ stipulation to defer defendants’ response to the complaint pending resolution of the Class Action or expiration of a stay issued in certain consolidated derivative actions in the Arizona District Court. On November 5, 2013, the matter was placed on the court’s inactive calendar. The parties have jointly sought and obtained multiple requests to continue the stay in this action. Most recently, on November 9, 2018, the court entered an order continuing the stay until March 29, 2019.
The Company believes that the plaintiff in the Bargar derivative action lacks standing to pursue litigation on behalf of First Solar. The Bargar derivative action is still in the initial stages and there has been no discovery. Accordingly, at this time we are not in a position to assess the likelihood of any potential loss or adverse effect on our financial condition or to estimate the range of potential loss, if any.
Other Matters and Claims
We are party to other legal matters and claims in the normal course of our operations. While we believe the ultimate outcome of such other matters and claims will not have a material adverse effect on our financial position, results of operations, or cash flows, the outcome of such matters and claims is not determinable with certainty, and negative outcomes may adversely affect us.
126
16. Revenue from Contracts with Customers
The following table represents a disaggregation of revenue from contracts with customers for the years ended
December 31, 2018
,
2017
, and
2016
along with the reportable segment for each category (in thousands):
|
Category
|
Segment
|
2018
|
2017
|
2016
|
||||||||||
|
Solar modules
|
Modules
|
$
|
502,001
|
|
$
|
806,398
|
|
$
|
675,453
|
|
||||
|
Solar power systems
|
Systems
|
1,244,175
|
|
1,927,122
|
|
1,131,961
|
|
|||||||
|
EPC services
|
Systems
|
347,560
|
|
45,525
|
|
892,814
|
|
|||||||
|
O&M services
|
Systems
|
103,186
|
|
101,024
|
|
93,476
|
|
|||||||
|
Module plus
|
Systems
|
—
|
|
3,236
|
|
84,926
|
|
|||||||
|
Energy generation (1)
|
Systems
|
47,122
|
|
58,019
|
|
25,933
|
|
|||||||
|
Net sales
|
$
|
2,244,044
|
|
$
|
2,941,324
|
|
$
|
2,904,563
|
|
|||||
——————————
|
(1)
|
During the years ended
December 31, 2017
and
2016
, the majority of energy generated and sold by our PV solar power systems was accounted for under ASC 840 consistent with the classification of the associated PPAs.
|
We recognize revenue for module sales at a point in time following the transfer of control of the modules to the customer, which typically occurs upon shipment or delivery depending on the terms of the underlying contracts. Such contracts may contain provisions that require us to make liquidated damage payments to the customer if we fail to deliver modules by scheduled dates. We recognize these liquidated damages as a reduction of revenue in the period we transfer control of the modules to the customer.
We generally recognize revenue for sales of solar power systems and/or EPC services over time using cost based input methods, in which significant judgment is required to evaluate assumptions including the amount of net contract revenues and the total estimated costs to determine our progress towards contract completion and to calculate the corresponding amount of revenue to recognize. If the estimated total costs on any contract are greater than the net contract revenues, we recognize the entire estimated loss in the period the loss becomes known. The cumulative effect of revisions to estimates related to net contract revenues or costs to complete contracts are recorded in the period in which the revisions to estimates are identified and the amounts can be reasonably estimated.
Changes in estimates for sales of systems and EPC services occur for a variety of reasons, including but not limited to (i) construction plan accelerations or delays, (ii) module cost forecast changes, (iii) cost related change orders, or (iv) changes in other information used to estimate costs. Changes in estimates may have a material effect on our consolidated statements of operations. The following table outlines the impact on revenue of net changes in estimated transaction prices and input costs for systems related sales contracts (both increases and decreases) for the years ended
December 31, 2018
,
2017
, and
2016
as well as the number of projects that comprise such changes. For purposes of the table, we only include projects with changes in estimates that have a net impact on revenue of at least
$1.0 million
during the periods presented with the exception of the sales and use tax matter described below, for which the aggregate change in estimate has been presented. Also included in the table is the net change in estimate as a percentage of the aggregate revenue for such projects.
|
|
2018
|
2017
|
2016
|
|||||||||
|
Number of projects (1)
|
24
|
|
5
|
|
12
|
|
||||||
|
Increase (decrease) in revenue from net changes in transaction prices (in thousands) (1)
|
$
|
63,361
|
|
$
|
3,579
|
|
$
|
(67,292
|
)
|
|||
|
Increase in revenue from net changes in input cost estimates (in thousands)
|
1,548
|
|
5,047
|
|
164,920
|
|
||||||
|
Net increase in revenue from net changes in estimates (in thousands)
|
$
|
64,909
|
|
$
|
8,626
|
|
$
|
97,628
|
|
|||
|
Net change in estimate as a percentage of aggregate revenue
|
0.6
|
%
|
0.6
|
%
|
1.6
|
%
|
||||||
——————————
127
|
(1)
|
During the year ended
December 31, 2018
, we settled a tax examination with the state of California regarding several matters, including certain sales and use tax payments due under lump sum EPC contracts. Accordingly, we revised our estimates of sales and use taxes due for projects in the state of California, which affected the estimated transaction prices for such contracts, and recorded an increase to revenue of
$54.6 million
.
|
The following table reflects the changes in our contract assets, which we classify as “Accounts receivable, unbilled” or “Retainage,” and our contract liabilities, which we classify as “Deferred revenue,” for the year ended
December 31, 2018
(in thousands):
|
|
2018
|
2017
|
Change
|
||||||||||||
|
Accounts receivable, unbilled
|
$
|
441,666
|
|
$
|
172,594
|
|
|||||||||
|
Retainage
|
16,500
|
|
2,014
|
|
|||||||||||
|
Accounts receivable, unbilled and retainage
|
$
|
458,166
|
|
$
|
174,608
|
|
$
|
283,558
|
|
162
|
%
|
||||
|
Deferred revenue (1)
|
$
|
177,769
|
|
$
|
145,073
|
|
$
|
32,696
|
|
23
|
%
|
||||
——————————
|
(1)
|
Includes
$48.0 million
and
$63.3 million
of long-term deferred revenue classified as “
Other liabilities
” on our consolidated balance sheets as of
December 31, 2018
and
2017
, respectively.
|
Accounts receivable, unbilled represents a contract asset for revenue that has been recognized in advance of billing the customer, which is common for long-term construction contracts. Billing requirements vary by contract but are generally structured around the completion of certain construction milestones. Some of our EPC contracts for systems we build may also contain retainage provisions. Retainage represents a contract asset for the portion of the contract price earned by us for work performed, but held for payment by the customer as a form of security until we reach certain construction milestones. When we receive consideration, or such consideration is unconditionally due, from a customer prior to transferring goods or services to the customer under the terms of a sales contract, we record deferred revenue, which represents a contract liability. Such deferred revenue typically results from billings in excess of costs incurred on long-term construction contracts and advance payments received on sales of solar modules.
For the year ended
December 31, 2018
, our contract assets increased by
$283.6 million
primarily due to certain unbilled receivables associated with ongoing construction activities at the Willow Springs and California Flats projects and the completion of the sale of the Manildra project. For the year ended
December 31, 2018
, our contract liabilities increased by
$32.7 million
primarily as a result of advance payments received for sales of solar modules, partially offset by revenue recognition for certain EPC projects in Florida, for which we received a portion of the proceeds in 2017, and the completion of the sale of certain Japan projects, for which we collected the proceeds in 2017. During the years ended
December 31, 2018
and
2017
, we recognized revenue of
$128.7 million
and
$308.6 million
, respectively, that was included in the corresponding contract liability balance at the beginning of the periods.
The following table represents our remaining performance obligations as of
December 31, 2018
for sales of solar power systems, including uncompleted sold projects, projects under sales contracts subject to conditions precedent, and EPC agreements for partner developed projects that we are constructing or expect to construct. Such table excludes remaining performance obligations for any sales arrangements that had not fully satisfied the criteria to be considered a contract with a customer pursuant to the requirements of ASC 606. We expect to recognize
$0.7 billion
of revenue for such contracts through the later of the substantial completion or the closing dates of the projects.
128
|
Project/Location
|
Project Size in MW
AC
|
Revenue Category
|
EPC Contract/Partner Developed Project
|
Expected Year Revenue Recognition Will Be Completed
|
% of Revenue Recognized
|
||||||
|
Phoebe, Texas
|
250
|
|
EPC
|
Innergix Renewable Energy
|
2019
|
12%
|
|||||
|
GA Solar 4, Georgia (1)
|
200
|
|
Solar power systems
|
Origis Energy USA
|
2020
|
11%
|
|||||
|
Rosamond, California
|
150
|
|
Solar power systems
|
Clearway Energy Group
|
2019
|
57%
|
|||||
|
Willow Springs, California
|
100
|
|
Solar power systems
|
D.E. Shaw Renewable Investments
|
2019
|
96%
|
|||||
|
Grange Hall, Florida
|
61
|
|
EPC
|
Tampa Electric Company
|
2019
|
98%
|
|||||
|
Peace Creek, Florida
|
55
|
|
EPC
|
Tampa Electric Company
|
2019
|
70%
|
|||||
|
Troy Solar, Indiana
|
51
|
|
EPC
|
Southern Indiana Gas and Electric Company
|
2020
|
—%
|
|||||
|
Lake Hancock, Florida
|
50
|
|
EPC
|
Tampa Electric Company
|
2019
|
34%
|
|||||
|
Total
|
917
|
|
|||||||||
——————————
|
(1)
|
Previously known as the Twiggs County Solar project
|
As of
December 31, 2018
, we had entered into contracts with customers for the future sale of 8.9 GW
DC
of solar modules for an aggregate transaction price of
$3.2 billion
. We expect to recognize such amounts as revenue through 2022 as we transfer control of the modules to the customers. As of
December 31, 2018
, we had also entered into long-term O&M contracts covering approximately
8 GW
DC
of utility-scale PV solar power systems. We expect to recognize
$0.5 billion
of revenue during the noncancelable term of these O&M contracts over a weighted-average period of
11.5 years
.
17. Stockholders’ Equity
Preferred Stock
We have authorized
30,000,000
shares of undesignated preferred stock,
$0.001
par value,
none
of which was issued and outstanding at
December 31, 2018
and
2017
. Our board of directors is authorized to determine the rights, preferences, and restrictions on any series of preferred stock that we may issue.
Common Stock
We have authorized
500,000,000
shares of common stock,
$0.001
par value, of which
104,885,261
and
104,468,460
shares were issued and outstanding at
December 31, 2018
and
2017
, respectively. Each share of common stock is entitled to a single vote. We have not declared or paid any dividends through
December 31, 2018
.
129
18. Share-Based Compensation
The following table presents share-based compensation expense recognized in our consolidated statements of operations for the years ended
December 31, 2018
,
2017
, and
2016
(in thousands):
|
|
2018
|
2017
|
2016
|
|||||||||
|
Cost of sales
|
$
|
6,422
|
|
$
|
6,809
|
|
$
|
7,598
|
|
|||
|
Selling, general and administrative
|
21,646
|
|
22,165
|
|
17,830
|
|
||||||
|
Research and development
|
5,714
|
|
5,740
|
|
3,284
|
|
||||||
|
Production start-up
|
372
|
|
407
|
|
—
|
|
||||||
|
Total share-based compensation expense
|
$
|
34,154
|
|
$
|
35,121
|
|
$
|
28,712
|
|
|||
The following table presents share-based compensation expense by type of award for the years ended
December 31, 2018
,
2017
, and
2016
(in thousands):
|
|
2018
|
2017
|
2016
|
|||||||||
|
Restricted and performance stock units
|
$
|
32,223
|
|
$
|
32,309
|
|
$
|
25,076
|
|
|||
|
Unrestricted stock
|
1,637
|
|
1,757
|
|
1,677
|
|
||||||
|
Stock purchase plan
|
—
|
|
394
|
|
1,332
|
|
||||||
|
33,860
|
|
34,460
|
|
28,085
|
|
|||||||
|
Net amount released from inventory
|
294
|
|
661
|
|
627
|
|
||||||
|
Total share-based compensation expense
|
$
|
34,154
|
|
$
|
35,121
|
|
$
|
28,712
|
|
|||
Share-based compensation expense capitalized in inventory was
$1.8 million
and
$2.1 million
as of
December 31, 2018
and
2017
, respectively. As of
December 31, 2018
, we had
$37.6 million
of unrecognized share-based compensation expense related to unvested restricted and performance stock units, which we expect to recognize over a weighted-average period of approximately
1.1 years
. During the years ended
December 31, 2018
,
2017
, and
2016
, we recognized an income tax benefit in our statement of operations of
$9.9 million
,
$6.2 million
, and
$32.9 million
, respectively, related to share-based compensation expense, including any excess tax benefits or deficiencies. We authorize our transfer agent to issue new shares, net of shares withheld for taxes as appropriate, for the vesting of restricted and performance stock units or grants of unrestricted stock.
Share-Based Compensation Plans
During the year ended December 31, 2015, we adopted our 2015 Omnibus Incentive Compensation Plan (“the 2015 Omnibus Plan”), under which directors, officers, employees, and consultants of First Solar (including any of its subsidiaries) are eligible to participate in various forms of share-based compensation. The 2015 Omnibus Plan is administered by the compensation committee of our board of directors (or any other committee designated by our board of directors), which is authorized to, among other things, determine the recipients of grants, the exercise price, and the vesting schedule of any awards made under the 2015 Omnibus Plan. Our board of directors may amend, modify, or terminate the 2015 Omnibus Plan without the approval of our stockholders, except for amendments that would increase the maximum number of shares of our common stock available for awards under the 2015 Omnibus Plan, increase the maximum number of shares of our common stock that may be delivered by incentive stock options, or modify the requirements for participation in the 2015 Omnibus Plan.
The 2015 Omnibus Plan provides for the grant of incentive stock options, non-qualified stock options, stock appreciation rights, restricted shares, restricted stock units, performance units, cash incentive awards, performance compensation awards, and other equity-based and equity-related awards. In addition, the shares underlying any forfeited, expired, terminated, or canceled awards, or shares surrendered as payment for taxes required to be withheld, become available for new award grants. We may not grant awards under the 2015 Omnibus Plan after
2025
, which is the tenth anniversary of the 2015 Omnibus Plan’s approval by our stockholders. As of
December 31, 2018
, we had
2,960,873
shares available for future issuance under the 2015 Omnibus Plan.
130
Restricted and Performance Stock Units
We issue shares to the holders of restricted stock units on the date the restricted units vest. The majority of shares issued are net of applicable withholding taxes, which we pay on behalf of our associates. As a result, the actual number of shares issued will be less than the number of restricted stock units granted. Prior to vesting, restricted stock units do not have dividend equivalent rights or voting rights, and the shares underlying the restricted stock units are not considered issued and outstanding.
In February 2017, the compensation committee of our board of directors approved a long-term incentive program for key executive officers and associates. The program is intended to incentivize retention of our key executive talent, provide a smooth transition from our former key senior talent equity performance program (“KSTEPP”), and align the interests of executive management and stockholders. Specifically, the program consists of (i) performance stock units to be earned over an approximately three-year performance period beginning in March 2017 and (ii) stub-year grants of separate performance stock units to be earned over an approximately two-year performance period also beginning in March 2017. Vesting of the March 2017 performance stock units is contingent upon the relative attainment of target cost per watt and operating expense metrics. In April 2018, in continuation of our long-term incentive program for key executive officers and associates, the compensation committee of our board of directors approved additional grants of performance stock units to be earned over an approximately three-year performance period beginning in May 2018. Vesting of the May 2018 performance stock units is contingent upon the relative attainment of target gross margin, operating expense, and contracted revenue metrics. Vesting of performance stock units is also contingent upon the employment of program participants through the applicable vesting dates, with limited exceptions in case of death, disability, a qualifying retirement, or a change-in-control of First Solar. Performance stock units were included in the computation of diluted net income per share for the years ended
December 31, 2018
and
2017
based on the number of shares that would be issuable if the end of the reporting period were the end of the contingency period.
Our board of directors previously approved and adopted the KSTEPP, a performance unit program under our prior 2010 Omnibus Incentive Compensation Plan applicable to our senior executives. The KSTEPP rewarded achievement of certain performance objectives aligned to the success of our long-term strategic plans. Such performance objectives included KSTEPP adjusted operating income, sales in key geographic markets, and cash adjusted return on invested capital. The KSTEPP awards were designed so that the attainment of the performance criteria required for full or partial vesting would be attained over time. In July 2016, the compensation committee of our board of directors certified the achievement of the full KSTEPP vesting conditions for the rolling annual period ended June 30, 2016. Accordingly, the remaining two-thirds of each KSTEPP award vested in 2016, and each KSTEPP participant received one share of common stock for each vested KSTEPP performance unit, net of any forfeitures.
The following is a summary of our restricted stock unit activity, including performance stock unit activity, for the year ended
December 31, 2018
:
|
|
Number of Shares
|
Weighted-Average
Grant-Date
Fair Value
|
||||
|
Unvested restricted stock units at December 31, 2017
|
2,302,906
|
$
|
38.55
|
|
||
|
Restricted stock units granted (1)
|
739,855
|
67.44
|
|
|||
|
Restricted stock units vested
|
(490,682)
|
44.46
|
|
|||
|
Restricted stock units forfeited
|
(77,792)
|
51.04
|
|
|||
|
Unvested restricted stock units at December 31, 2018
|
2,474,287
|
$
|
45.63
|
|
||
——————————
|
(1)
|
Restricted stock units granted include the maximum amount of performance stock units available for issuance under our long-term incentive program for key executive officers and associates. The actual number of shares to be issued will depend on the relative attainment of the performance metrics described above.
|
131
We estimate the fair value of our restricted stock unit awards based on our stock price at the grant date. For the years ended
December 31, 2017
and
2016
, the weighted-average grant-date fair value for restricted stock units granted in such years was
$32.81
and
$59.64
, respectively. The total fair value of restricted stock units vested during
2018
,
2017
, and
2016
was
$32.2 million
,
$14.1 million
, and
$131.0 million
, respectively.
Unrestricted Stock
During the years ended
December 31, 2018
,
2017
, and
2016
, we awarded
31,190
;
42,773
; and
38,429
, respectively, of fully vested, unrestricted shares of our common stock to the independent members of our board of directors. Accordingly, we recognized
$1.6 million
,
$1.8 million
, and
$1.7 million
of share-based compensation expense for these awards during the years ended
December 31, 2018
,
2017
, and
2016
, respectively.
Stock Purchase Plan
Our shareholders approved our stock purchase plan for employees in June 2010. The plan allows employees to purchase our common stock through payroll withholdings over a six-month offering period at a discount from the closing share price on the last day of the offering period. In April 2017, we amended our stock purchase plan to reduce the purchase discount from
15%
to
4%
. Accordingly, the plan is considered noncompensatory and no longer results in the recognition of share-based compensation expense.
132
19. Income Taxes
In December 2017, the United States enacted the Tax Act, which significantly revised U.S. tax law by, among other things, lowering the statutory federal corporate income tax rate from
35%
to
21%
effective January 1, 2018, eliminating certain deductions, imposing a transition tax on certain accumulated earnings and profits of foreign corporate subsidiaries, introducing new tax regimes, and changing how foreign earnings are subject to U.S. tax. In December 2017, the SEC issued Staff Accounting Bulletin No. 118 to (i) clarify certain aspects of accounting for income taxes under ASC 740 in the reporting period the Tax Act was signed into law when information is not yet available or complete and (ii) provide a measurement period up to one year to complete the accounting for the Tax Act. We completed our accounting for the Tax Act in the fourth quarter of 2018 and recorded certain adjustments to our provisional tax expenses.
As a result of the Tax Act, we remeasured certain deferred tax assets and liabilities based on the tax rate applicable to when the temporary differences are expected to reverse in the future, which is generally
21%
, and recorded a provisional tax expense of
$6.6 million
for the year ended
December 31, 2017
. During the year ended
December 31, 2018
, we reduced our provisional tax expense for the remeasurement of deferred tax assets and liabilities by
$2.3 million
. The transition tax of the Tax Act was based on our total post-1986 foreign earnings and profits, which we previously deferred from U.S. income taxes under prior tax law. During the year ended
December 31, 2017
, we recorded a provisional transition tax expense of
$401.5 million
, which we reduced by
$8.1 million
during the year ended
December 31, 2018
. We elected to pay the transition tax over an eight-year period, and our outstanding transition tax liability was
$81.2 million
as of
December 31, 2018
after the utilization of certain tax credits and tax losses and our initial installment payment in 2018. Our measurement period adjustments for the remeasurement of deferred tax assets and liabilities and the transition tax reduced our effective tax rate by
9.2%
for the year ended
December 31, 2018
.
Although we continue to evaluate our plans for the reinvestment or repatriation of unremitted foreign earnings, we expect to indefinitely reinvest the earnings of our foreign subsidiaries to fund our international operations, with the exception of our subsidiaries in Canada and Germany. Accordingly, we have not recorded any provision for additional U.S. or foreign withholding taxes related to the outside basis differences of our foreign subsidiaries in which we expect to indefinitely reinvest their earnings.
The Tax Act subjects a U.S. shareholder to tax on global intangible low-taxed income (“GILTI”) earned by foreign corporate subsidiaries. Accordingly, we record taxes due on future U.S. inclusions in taxable income related to GILTI as a current-period expense when incurred (i.e., “period cost method”). Such policy election did not result in any estimated GILTI inclusions in our effective tax rate for the year ended
December 31, 2018
. The base erosion anti-abuse tax (“BEAT”) provisions of the Tax Act impose a minimum tax related to certain deductible payments made to related foreign persons. In addition, the foreign-derived intangible income (“FDII”) provision of the Tax Act allows a U.S. corporation to deduct
37.5%
of its foreign-derived intangible income. The BEAT and FDII provisions of the Tax Act did not have a material impact on our income tax expense for the year ended
December 31, 2018
.
The U.S. and non-U.S. components of our income or loss before income taxes for the years ended
December 31, 2018
,
2017
, and
2016
were as follows (in thousands):
|
|
2018
|
2017
|
2016
|
|||||||||
|
U.S. income
|
$
|
(49,353
|
)
|
$
|
(22,868
|
)
|
$
|
(426,791
|
)
|
|||
|
Non-U.S. income
|
162,500
|
|
224,983
|
|
(110,460
|
)
|
||||||
|
Income (loss) before taxes and equity in earnings
|
$
|
113,147
|
|
$
|
202,115
|
|
$
|
(537,251
|
)
|
|||
133
The components of our income tax expense or benefit for the years ended
December 31, 2018
,
2017
, and
2016
were as follows (in thousands):
|
|
2018
|
2017
|
2016
|
|||||||||
|
Current (benefit) expense:
|
|
|
|
|||||||||
|
Federal
|
$
|
(44,267
|
)
|
$
|
116,956
|
|
$
|
(14,389
|
)
|
|||
|
State
|
(13,568
|
)
|
3,009
|
|
1,303
|
|
||||||
|
Foreign
|
8,788
|
|
11,099
|
|
(29,009
|
)
|
||||||
|
Total current (benefit) expense
|
(49,047
|
)
|
131,064
|
|
(42,095
|
)
|
||||||
|
Deferred expense:
|
|
|
|
|
|
|
||||||
|
Federal
|
31,530
|
|
226,570
|
|
90,319
|
|
||||||
|
State
|
2,387
|
|
5,335
|
|
(9,536
|
)
|
||||||
|
Foreign
|
18,571
|
|
9,027
|
|
(15,521
|
)
|
||||||
|
Total deferred expense
|
52,488
|
|
240,932
|
|
65,262
|
|
||||||
|
Total income tax expense
|
$
|
3,441
|
|
$
|
371,996
|
|
$
|
23,167
|
|
|||
Our Malaysian subsidiary has been granted a long-term tax holiday that expires in
2027
. The tax holiday, which generally provides for a full exemption from Malaysian income tax, is conditional upon our continued compliance with meeting certain employment and investment thresholds, which we are currently in compliance with and expect to continue to comply with through the expiration of the tax holiday in
2027
.
Our income tax results differed from the amount computed by applying the relevant U.S. statutory federal corporate income tax rate to our income or loss before income taxes for the following reasons for the years ended
December 31, 2018
,
2017
, and
2016
(in thousands):
|
|
2018
|
2017
|
2016
|
||||||||||||||||||
|
|
Tax
|
Percent
|
Tax
|
Percent
|
Tax
|
Percent
|
|||||||||||||||
|
Statutory income tax expense (benefit)
|
$
|
23,761
|
|
21.0
|
%
|
$
|
70,740
|
|
35.0
|
%
|
$
|
(188,038
|
)
|
35.0
|
%
|
||||||
|
Provisional effect of Tax Act
|
—
|
|
—
|
%
|
408,090
|
|
201.9
|
%
|
—
|
|
—
|
%
|
|||||||||
|
Changes in valuation allowance
|
19,064
|
|
16.8
|
%
|
9,534
|
|
4.7
|
%
|
2,412
|
|
(0.4
|
)%
|
|||||||||
|
Foreign tax rate differential
|
14,117
|
|
12.5
|
%
|
(22,048
|
)
|
(10.9
|
)%
|
6,833
|
|
(1.3
|
)%
|
|||||||||
|
State tax, net of federal benefit
|
(7,580
|
)
|
(6.7
|
)%
|
4,397
|
|
2.2
|
%
|
(8,655
|
)
|
1.6
|
%
|
|||||||||
|
Non-deductible expenses
|
4,636
|
|
4.1
|
%
|
2,703
|
|
1.3
|
%
|
324
|
|
—
|
%
|
|||||||||
|
Share-based compensation
|
(2,105
|
)
|
(1.9
|
)%
|
1,161
|
|
0.6
|
%
|
(23,283
|
)
|
4.3
|
%
|
|||||||||
|
Change in tax contingency
|
(6,273
|
)
|
(5.5
|
)%
|
959
|
|
0.5
|
%
|
(34,541
|
)
|
6.4
|
%
|
|||||||||
|
Foreign dividend income
|
16,570
|
|
14.6
|
%
|
540
|
|
0.3
|
%
|
248,013
|
|
(46.2
|
)%
|
|||||||||
|
Goodwill
|
—
|
|
—
|
%
|
—
|
|
—
|
%
|
22,468
|
|
(4.2
|
)%
|
|||||||||
|
Tax credits
|
(8,431
|
)
|
(7.5
|
)%
|
(18,445
|
)
|
(9.1
|
)%
|
(15,435
|
)
|
2.9
|
%
|
|||||||||
|
Return to provision adjustments
|
(25,307
|
)
|
(22.3
|
)%
|
(35,191
|
)
|
(17.4
|
)%
|
11,757
|
|
(2.2
|
)%
|
|||||||||
|
Effect of tax holiday
|
(26,277
|
)
|
(23.2
|
)%
|
(46,643
|
)
|
(23.1
|
)%
|
4,640
|
|
(0.9
|
)%
|
|||||||||
|
Other
|
1,266
|
|
1.1
|
%
|
(3,801
|
)
|
(1.9
|
)%
|
(3,328
|
)
|
0.7
|
%
|
|||||||||
|
Reported income tax expense
|
$
|
3,441
|
|
3.0
|
%
|
$
|
371,996
|
|
184.1
|
%
|
$
|
23,167
|
|
(4.3
|
)%
|
||||||
During the years ended
December 31, 2018
,
2017
, and
2016
, we made net tax payments of
$58.8 million
,
$1.2 million
, and
$1.9 million
, respectively.
In May 2017, the U.S. federal income tax authority accepted our election to classify certain of our German subsidiaries as disregarded entities of First Solar, Inc. effective January 1, 2017. Accordingly, we recorded an estimated benefit of
$42.1 million
through the tax provision to establish a deferred tax asset for excess foreign tax credits generated as a result of the associated election.
134
In July 2016, we received a letter from a foreign tax authority confirming our residency status in that jurisdiction. In accordance with the letter, we reversed a liability associated with an uncertain tax position related to the income of a foreign subsidiary. Accordingly, we recorded a benefit of
$35.4 million
through the tax provision from the reversal of such liability.
Deferred income taxes reflect the net tax effects of temporary differences between the carrying amounts of assets and liabilities calculated under U.S. GAAP and the amounts calculated for preparing our income tax returns. The items that gave rise to our deferred taxes as of
December 31, 2018
and
2017
were as follows (in thousands):
|
|
2018
|
2017
|
||||||
|
Deferred tax assets:
|
|
|
||||||
|
Net operating losses
|
$
|
108,149
|
|
$
|
124,281
|
|
||
|
Accrued expenses
|
55,754
|
|
62,345
|
|
||||
|
Property, plant and equipment
|
18,796
|
|
35,104
|
|
||||
|
Compensation
|
18,564
|
|
9,442
|
|
||||
|
Goodwill
|
9,223
|
|
12,140
|
|
||||
|
Long-term contracts
|
4,967
|
|
4,554
|
|
||||
|
Inventory
|
4,079
|
|
7,601
|
|
||||
|
Capitalized interest
|
2,948
|
|
—
|
|
||||
|
Equity in earnings
|
2,693
|
|
—
|
|
||||
|
Deferred expenses
|
2,165
|
|
2,057
|
|
||||
|
Other
|
17,373
|
|
12,584
|
|
||||
|
Deferred tax assets, gross
|
244,711
|
|
270,108
|
|
||||
|
Valuation allowance
|
(159,546
|
)
|
(143,818
|
)
|
||||
|
Deferred tax assets, net of valuation allowance
|
85,165
|
|
126,290
|
|
||||
|
Deferred tax liabilities:
|
|
|
|
|
||||
|
Restricted investments and derivatives
|
(7,586
|
)
|
(10,680
|
)
|
||||
|
Acquisition accounting / basis difference
|
(5,420
|
)
|
(5,880
|
)
|
||||
|
Investments in foreign subsidiaries
|
(4,425
|
)
|
(9,555
|
)
|
||||
|
Equity in earnings
|
—
|
|
(40,339
|
)
|
||||
|
Capitalized interest
|
—
|
|
(1,722
|
)
|
||||
|
Other
|
(3,093
|
)
|
(7,541
|
)
|
||||
|
Deferred tax liabilities
|
(20,524
|
)
|
(75,717
|
)
|
||||
|
Net deferred tax assets and liabilities
|
$
|
64,641
|
|
$
|
50,573
|
|
||
We use the deferral method of accounting for investment tax credits under which the credits are recognized as reductions in the carrying value of the related assets. The use of the deferral method also results in a basis difference from the recognition of a deferred tax asset and an immediate income tax benefit for the future tax depreciation of the related assets. Such basis differences are accounted for pursuant to the income statement method.
Changes in the valuation allowance against our deferred tax assets were as follows during the years ended
December 31, 2018
,
2017
, and
2016
(in thousands):
|
|
2018
|
2017
|
2016
|
|||||||||
|
Valuation allowance, beginning of year
|
$
|
143,818
|
|
$
|
123,936
|
|
$
|
121,524
|
|
|||
|
Additions
|
29,359
|
|
27,591
|
|
13,933
|
|
||||||
|
Reversals
|
(13,631
|
)
|
(7,709
|
)
|
(11,521
|
)
|
||||||
|
Valuation allowance, end of year
|
$
|
159,546
|
|
$
|
143,818
|
|
$
|
123,936
|
|
|||
135
We maintained a valuation allowance of
$159.5 million
and
$143.8 million
as of
December 31, 2018
and
2017
, respectively, against certain of our deferred tax assets, as it is more likely than not that such amounts will not be fully realized. During the year ended
December 31, 2018
, the valuation allowance
increased
by
$15.7 million
primarily due to current year operating losses in certain jurisdictions and an increase in deferred tax assets with a full valuation allowance due to a change in foreign exchange rates. These increases were partially offset by the release of valuation allowances in jurisdictions with current year operating income.
As of
December 31, 2018
, we had federal and aggregate state net operating loss carryforwards of
$10.3 million
and
$72.9 million
, respectively. As of
December 31, 2017
, we had federal and aggregate state net operating loss carryforwards of
$11.7 million
and
$20.3 million
, respectively. If not used, the federal net operating loss carryforwards incurred prior to 2018 will begin to expire in
2030
, and the state net operating loss carryforwards will begin to expire in
2029
. Federal net operating losses arising in tax years beginning in 2018 may be carried forward indefinitely but may not be carried back, and the associated deduction is limited to
80%
of taxable income. The utilization of our net operating loss carryforwards is also subject to an annual limitation under Section 382 of the Internal Revenue Code due to changes in ownership. Based on our analysis, we do not believe such limitation will impact our realization of the net operating loss carryforwards as we anticipate utilizing them prior to expiration. During the year ended
December 31, 2017
, we utilized substantially all of our gross federal and state R&D credit carryforwards, U.S. foreign tax credit carryforwards, and investment tax credits to reduce our transition tax liability.
A reconciliation of the beginning and ending amount of liabilities associated with uncertain tax positions for the years ended
December 31, 2018
,
2017
, and
2016
is as follows (in thousands):
|
|
2018
|
2017
|
2016
|
|||||||||
|
Unrecognized tax benefits, beginning of year
|
$
|
84,173
|
|
$
|
89,256
|
|
$
|
141,755
|
|
|||
|
Increases related to prior year tax positions
|
—
|
|
3,827
|
|
—
|
|
||||||
|
Decreases related to prior year tax positions
|
(2,979
|
)
|
—
|
|
(6,119
|
)
|
||||||
|
Decreases from lapse in statute of limitations
|
(10,704
|
)
|
(11,840
|
)
|
(14,421
|
)
|
||||||
|
Decreases relating to settlements with authorities
|
—
|
|
(2,494
|
)
|
(35,416
|
)
|
||||||
|
Increases related to current tax positions
|
1,703
|
|
5,424
|
|
3,457
|
|
||||||
|
Unrecognized tax benefits, end of year
|
$
|
72,193
|
|
$
|
84,173
|
|
$
|
89,256
|
|
|||
If recognized,
$70.4 million
of unrecognized tax benefits, excluding interest and penalties, would reduce our annual effective tax rate. Due to the uncertain and complex application of tax laws and regulations, it is possible that the ultimate resolution of uncertain tax positions may result in liabilities that could be materially different from these estimates. In such an event, we will record additional tax expense or benefit in the period in which such resolution occurs. Our policy is to recognize any interest and penalties that we may incur related to our tax positions as a component of income tax expense. During the years ended
December 31, 2018
and
2017
, we recognized interest and penalties of
$5.3 million
and
$5.5 million
, respectively, related to unrecognized tax benefits. We did not recognize any interest or penalties related to unrecognized tax benefits during
2016
. It is reasonably possible that less than
$0.1 million
of uncertain tax positions will be recognized within the next 12 months due to the expiration of the statute of limitations associated with such positions.
We are subject to audit by federal, state, local, and foreign tax authorities. During the year ended
December 31, 2017
, we settled certain examinations in Germany, which resulted in a discrete tax expense of
$2.5 million
. We are currently under examination in Chile, India, Malaysia, Singapore, and the state of California. We believe that adequate provisions have been made for any adjustments that may result from tax examinations. However, the outcome of tax examinations cannot be predicted with certainty. If any issues addressed by our tax examinations are not resolved in a manner consistent with our expectations, we could be required to adjust our provision for income taxes in the period such resolution occurs.
136
The following table summarizes the tax years that are either currently under audit or remain open and subject to examination by the tax authorities in the most significant jurisdictions in which we operate:
|
|
Tax Years
|
|
|
Australia
|
2013 - 2017
|
|
|
India
|
2013 - 2018
|
|
|
Malaysia
|
2013 - 2017
|
|
|
United States
|
2008 - 2009; 2013 - 2017
|
|
In certain of the jurisdictions noted above, we operate through more than one legal entity, each of which has different open years subject to examination. The table above presents the open years subject to examination for the most material of the legal entities in each jurisdiction. Additionally, tax years are not closed until the statute of limitations in each jurisdiction expires. In the jurisdictions noted above, the statute of limitations can extend beyond the open years subject to examination.
20. Net Income (Loss) per Share
Basic net income (loss) per share is computed by dividing net income (loss) by the weighted-average number of common shares outstanding for the period. Diluted net income per share is computed giving effect to all potentially dilutive common shares, including restricted and performance stock units and stock purchase plan shares, unless there is a net loss for the period. In computing diluted net income per share, we utilize the treasury stock method.
The calculation of basic and diluted net income (loss) per share for the years ended
December 31, 2018
,
2017
, and
2016
was as follows (in thousands, except per share amounts):
|
2018
|
2017
|
2016
|
||||||||||
|
Basic net income (loss) per share
|
|
|
|
|||||||||
|
Numerator:
|
|
|
|
|||||||||
|
Net income (loss)
|
$
|
144,326
|
|
$
|
(165,615
|
)
|
$
|
(416,112
|
)
|
|||
|
Denominator:
|
|
|
|
|
|
|
||||||
|
Weighted-average common shares outstanding
|
104,745
|
|
104,328
|
|
102,866
|
|
||||||
|
Diluted net income (loss) per share
|
|
|
|
|
|
|
||||||
|
Denominator:
|
|
|
|
|
|
|
||||||
|
Weighted-average common shares outstanding
|
104,745
|
|
104,328
|
|
102,866
|
|
||||||
|
Effect of restricted and performance stock units and stock purchase plan shares
|
1,368
|
|
—
|
|
—
|
|
||||||
|
Weighted-average shares used in computing diluted net income (loss) per share
|
106,113
|
|
104,328
|
|
102,866
|
|
||||||
|
Net income (loss) per share:
|
||||||||||||
|
Basic
|
$
|
1.38
|
|
$
|
(1.59
|
)
|
$
|
(4.05
|
)
|
|||
|
Diluted
|
$
|
1.36
|
|
$
|
(1.59
|
)
|
$
|
(4.05
|
)
|
|||
The following table summarizes the potential shares of common stock that were excluded from the computation of diluted net income per share for the years ended
December 31, 2018
,
2017
, and
2016
as such shares would have had an anti-dilutive effect (in thousands):
|
2018
|
2017
|
2016
|
||||
|
Anti-dilutive shares
|
299
|
1,021
|
753
|
|||
137
21. Accumulated Other Comprehensive (Loss) Income
The following table presents the changes in accumulated other comprehensive (loss) income, net of tax, for the year ended
December 31, 2018
(in thousands):
|
Foreign Currency Translation Adjustment
|
Unrealized Gain (Loss) on Marketable Securities and Restricted Investments
|
Unrealized Gain (Loss) on Derivative Instruments
|
Total
|
|||||||||||||
|
Balance as of December 31, 2017
|
$
|
(65,346
|
)
|
$
|
68,388
|
|
$
|
(783
|
)
|
$
|
2,259
|
|
||||
|
Other comprehensive loss before reclassifications
|
(1,034
|
)
|
(6,077
|
)
|
(3,760
|
)
|
(10,871
|
)
|
||||||||
|
Amounts reclassified from accumulated other comprehensive (loss) income
|
—
|
|
(55,405
|
)
|
6,812
|
|
(48,593
|
)
|
||||||||
|
Net tax effect
|
—
|
|
3,735
|
|
(996
|
)
|
2,739
|
|
||||||||
|
Net other comprehensive (loss) income
|
(1,034
|
)
|
(57,747
|
)
|
2,056
|
|
(56,725
|
)
|
||||||||
|
Balance as of December 31, 2018
|
$
|
(66,380
|
)
|
$
|
10,641
|
|
$
|
1,273
|
|
$
|
(54,466
|
)
|
||||
The following table presents the pretax amounts reclassified from accumulated other comprehensive (loss) income into our consolidated statements of operations for the years ended
December 31, 2018
,
2017
, and
2016
(in thousands):
|
Comprehensive Income Components
|
Income Statement Line Item
|
Amounts Reclassified for the Year Ended December 31,
|
||||||||||||
|
2018
|
2017
|
2016
|
||||||||||||
|
Unrealized gain on marketable securities and restricted investments
|
Other income, net
|
$
|
55,405
|
|
$
|
49
|
|
$
|
41,633
|
|
||||
|
Unrealized (loss) gain on derivative contracts:
|
||||||||||||||
|
Foreign exchange forward contracts
|
Net sales
|
(1,698
|
)
|
—
|
|
—
|
|
|||||||
|
Foreign exchange forward contracts
|
Cost of sales
|
(212
|
)
|
—
|
|
—
|
|
|||||||
|
Foreign exchange forward contracts
|
Foreign currency loss, net
|
(5,448
|
)
|
—
|
|
—
|
|
|||||||
|
Cross currency swap contract
|
Foreign currency loss, net
|
—
|
|
—
|
|
4,896
|
|
|||||||
|
Foreign exchange forward, interest rate, and cross currency swap contracts
|
Interest expense, net
|
—
|
|
—
|
|
(1,704
|
)
|
|||||||
|
Foreign exchange forward contracts
|
Other income, net
|
546
|
|
(189
|
)
|
—
|
|
|||||||
|
(6,812
|
)
|
(189
|
)
|
3,192
|
|
|||||||||
|
Total amount reclassified
|
$
|
48,593
|
|
$
|
(140
|
)
|
$
|
44,825
|
|
|||||
22. Segment and Geographical Information
We operate our business in
two
segments. Our modules segment involves the design, manufacture, and sale of CdTe solar modules, which convert sunlight into electricity. Third-party customers of our modules segment include integrators and operators of PV solar power systems. Our second segment is our fully integrated systems segment, through which we provide complete turn-key PV solar power systems, or solar solutions, that draw upon our capabilities, which include (i) project development, (ii) EPC services, and (iii) O&M services. We may provide our full EPC services or any combination of individual products and services within our EPC capabilities depending upon the customer and market opportunity. All of our systems segment products and services are for PV solar power systems, which primarily use our solar modules, and we sell such products and services to utilities, independent power producers, commercial and industrial companies, and other system owners. Additionally within our systems segment, we may temporarily own and operate certain of our systems for a period of time based on strategic opportunities or market factors.
138
Our segments are managed by our Chief Executive Officer, who is also considered our chief operating decision maker (“CODM”). Our CODM views sales of solar modules or systems as the primary drivers of our resource allocation, profitability, and cash flows. Our modules segment contributes to our operating results by providing the fundamental technologies and solar modules that drive our business and sales opportunities, and our systems segment contributes to our operating results by using such modules as part of a range of comprehensive PV solar energy solutions, depending on the customer and market opportunity. Our CODM generally makes decisions about allocating resources to our segments and assessing their performance based on gross profit. However, information about segment assets is not reported to the CODM for purposes of making such decisions. Accordingly, we exclude such asset information from our reportable segment financial disclosures.
The following tables present certain financial information for our reportable segments for the years ended
December 31, 2018
,
2017
, and
2016
(in thousands):
|
|
Year Ended December 31, 2018
|
|||||||||||
|
|
Modules
|
Systems
|
Total
|
|||||||||
|
Net sales
|
$
|
502,001
|
|
$
|
1,742,043
|
|
$
|
2,244,044
|
|
|||
|
Gross (loss) profit
|
(50,467
|
)
|
442,644
|
|
392,177
|
|
||||||
|
Depreciation and amortization expense
|
85,797
|
|
18,647
|
|
104,444
|
|
||||||
|
Goodwill
|
14,462
|
|
—
|
|
14,462
|
|
||||||
|
|
Year Ended December 31, 2017
|
|||||||||||
|
|
Modules
|
Systems
|
Total
|
|||||||||
|
Net sales
|
$
|
806,398
|
|
$
|
2,134,926
|
|
$
|
2,941,324
|
|
|||
|
Gross profit
|
112,338
|
|
436,609
|
|
548,947
|
|
||||||
|
Depreciation and amortization expense
|
67,597
|
|
24,302
|
|
91,899
|
|
||||||
|
Goodwill
|
14,462
|
|
—
|
|
14,462
|
|
||||||
|
|
Year Ended December 31, 2016
|
|||||||||||
|
|
Modules
|
Systems
|
Total
|
|||||||||
|
Net sales
|
$
|
675,452
|
|
$
|
2,229,111
|
|
$
|
2,904,563
|
|
|||
|
Gross profit
|
110,510
|
|
527,908
|
|
638,418
|
|
||||||
|
Depreciation and amortization expense
|
186,736
|
|
17,515
|
|
204,251
|
|
||||||
The following table presents net sales for the years ended
December 31, 2018
,
2017
, and
2016
by geographic region, based on the customer country of invoicing (in thousands):
|
|
2018
|
2017
|
2016
|
|||||||||
|
United States
|
$
|
1,478,034
|
|
$
|
2,273,774
|
|
$
|
2,418,974
|
|
|||
|
Japan
|
234,814
|
|
4,405
|
|
5,183
|
|
||||||
|
India
|
232,130
|
|
141,491
|
|
158,182
|
|
||||||
|
Australia
|
153,163
|
|
108,643
|
|
9,568
|
|
||||||
|
Turkey
|
19,354
|
|
124,433
|
|
18,809
|
|
||||||
|
Jordan
|
2,150
|
|
2,255
|
|
103,022
|
|
||||||
|
Spain
|
741
|
|
379
|
|
141,319
|
|
||||||
|
All other foreign countries
|
123,658
|
|
285,944
|
|
49,506
|
|
||||||
|
Net sales
|
$
|
2,244,044
|
|
$
|
2,941,324
|
|
$
|
2,904,563
|
|
|||
139
The following table presents long-lived assets, which include property, plant and equipment, PV solar power systems, and project assets (current and noncurrent) as of
December 31, 2018
and
2017
by geographic region, based on the physical location of the assets (in thousands):
|
|
2018
|
2017
|
||||||
|
Vietnam
|
$
|
702,071
|
|
$
|
252,417
|
|
||
|
United States
|
659,854
|
|
595,062
|
|
||||
|
Malaysia
|
532,418
|
|
483,884
|
|
||||
|
Japan
|
319,571
|
|
251,559
|
|
||||
|
Chile
|
240,495
|
|
251,208
|
|
||||
|
All other foreign countries
|
108,871
|
|
240,232
|
|
||||
|
Long-lived assets
|
$
|
2,563,280
|
|
$
|
2,074,362
|
|
||
23. Concentrations of Risks
Customer Concentration.
The following customers each comprised 10% or more of our total net sales and/or 10% or more of our total accounts receivable for the years ended
December 31, 2018
,
2017
, and
2016
:
|
|
2018
|
2017
|
2016
|
|||||||||||||||
|
|
% of Net Sales
|
% of A/R
|
% of Net Sales
|
% of A/R
|
% of Net Sales
|
% of A/R
|
||||||||||||
|
Customer #1
|
16
|
%
|
*
|
|
*
|
|
*
|
|
*
|
|
*
|
|
||||||
|
Customer #2
|
13
|
%
|
*
|
|
47
|
%
|
*
|
|
*
|
|
*
|
|
||||||
|
Customer #3
|
*
|
|
18
|
%
|
*
|
|
*
|
|
*
|
|
*
|
|
||||||
|
Customer #4
|
*
|
|
12
|
%
|
*
|
|
*
|
|
*
|
|
*
|
|
||||||
|
Customer #5
|
*
|
|
*
|
|
*
|
|
26
|
%
|
*
|
|
*
|
|
||||||
|
Customer #6
|
*
|
|
*
|
|
*
|
|
12
|
%
|
*
|
|
*
|
|
||||||
|
Customer #7
|
*
|
|
*
|
|
*
|
|
*
|
|
39
|
%
|
*
|
|
||||||
|
Customer #8
|
*
|
|
*
|
|
*
|
|
*
|
|
11
|
%
|
*
|
|
||||||
|
Customer #9
|
*
|
|
*
|
|
*
|
|
*
|
|
10
|
%
|
*
|
|
||||||
|
Customer #10
|
*
|
|
*
|
|
*
|
|
*
|
|
*
|
|
32
|
%
|
||||||
|
Customer #11
|
*
|
|
*
|
|
*
|
|
*
|
|
*
|
|
12
|
%
|
||||||
——————————
|
*
|
Net sales and/or accounts receivable for these customers were less than
10%
of our total net sales and/or accounts receivable for the period.
|
Geographic Risk.
During the year ended
December 31, 2018
, our third-party solar module and solar power system net sales were predominantly in the United States. The concentration of our net sales in a limited number of geographic regions exposes us to local economic, public policy, and regulatory risks in such regions.
Production.
Our products include components that are available from a limited number of suppliers or sources. Shortages of essential components could occur due to increases in demand or interruptions of supply, thereby adversely affecting our ability to meet customer demand for our products. Our solar modules are currently produced at our facilities in Perrysburg, Ohio; Kulim, Malaysia; and Ho Chi Minh City, Vietnam. Damage to or disruption of these facilities could interrupt our business and adversely affect our ability to generate net sales.
140
INDEX TO EXHIBITS
The following exhibits are filed with or incorporated by reference into this Annual Report on Form 10-K:
|
Incorporated by Reference
|
||||||||||
|
Exhibit
Number
|
Exhibit Description
|
Form
|
File No.
|
Date of
First Filing
|
Exhibit
Number
|
|||||
|
3.1
|
S-1/A
|
333-135574
|
10/25/06
|
3.1
|
||||||
|
3.2
|
10-Q
|
001-33156
|
5/5/17
|
3.1
|
||||||
|
10.1
|
S-1/A
|
333-135574
|
10/25/06
|
10.15
|
||||||
|
10.2
|
10-K
|
001-33156
|
2/27/13
|
10.20
|
||||||
|
10.3
|
8-K
|
001-33156
|
9/10/09
|
10.1
|
||||||
|
10.4
|
8-K
|
001-33156
|
9/10/09
|
10.2
|
||||||
|
10.5
|
8-K
|
001-33156
|
9/10/09
|
10.3
|
||||||
|
10.6
|
8-K
|
001-33156
|
9/10/09
|
10.4
|
||||||
|
10.7
|
8-K
|
001-33156
|
9/10/09
|
10.5
|
||||||
|
10.8
|
8-K
|
001-33156
|
9/10/09
|
10.6
|
||||||
|
10.9
|
8-K
|
001-33156
|
9/10/09
|
10.7
|
||||||
|
10.10
|
8-K
|
001-33156
|
9/10/09
|
10.8
|
||||||
|
10.11
|
8-K
|
001-33156
|
9/10/09
|
10.9
|
||||||
|
10.12
|
8-K
|
001-33156
|
10/20/10
|
10.1
|
||||||
|
10.13
|
DEF 14A
|
001-33156
|
4/20/10
|
App. A
|
||||||
|
10.14
|
DEF 14A
|
001-33156
|
4/20/10
|
App. B
|
||||||
141
|
Incorporated by Reference
|
||||||||||
|
Exhibit
Number
|
Exhibit Description
|
Form
|
File No.
|
Date of
First Filing
|
Exhibit
Number
|
|||||
|
10.15
|
10-Q
|
001-33156
|
5/5/11
|
10.3
|
||||||
|
10.16
|
8-K
|
001-33156
|
5/12/11
|
10.1
|
||||||
|
10.17
|
8-K
|
001-33156
|
7/14/11
|
10.1
|
||||||
|
10.18
|
10-Q
|
001-33156
|
8/3/12
|
10.1
|
||||||
|
10.19
|
8-K
|
001-33156
|
10/26/12
|
10.1
|
||||||
|
10.20
|
10-Q
|
001-33156
|
5/7/13
|
10.2
|
||||||
|
10.21
|
10-Q
|
001-33156
|
5/7/13
|
10.3
|
||||||
|
10.22
|
8-K
|
001-33156
|
7/19/13
|
10.1
|
||||||
|
10.23
|
8-K
|
001-33156
|
7/19/13
|
10.2
|
||||||
|
10.24
|
10-Q
|
001-33156
|
8/7/13
|
10.1
|
||||||
|
10.25
|
10-K
|
001-33156
|
2/26/14
|
10.1
|
||||||
|
10.26
|
10-Q
|
001-33156
|
8/6/14
|
10.2
|
||||||
|
10.27
|
DEF 14A
|
001-33156
|
4/8/15
|
App. A
|
||||||
|
10.28
|
8-K
|
001-33156
|
6/5/15
|
10.1
|
||||||
|
10.29
|
10-K
|
001-33156
|
2/24/16
|
10.23
|
||||||
142
|
Incorporated by Reference
|
||||||||||
|
Exhibit
Number
|
Exhibit Description
|
Form
|
File No.
|
Date of
First Filing
|
Exhibit
Number
|
|||||
|
10.30
|
10-K
|
001-33156
|
2/24/16
|
10.24
|
||||||
|
10.31
|
10-K
|
001-33156
|
2/24/16
|
10.26
|
||||||
|
10.32
|
10-Q
|
001-33156
|
4/28/16
|
10.1
|
||||||
|
10.33
|
10-Q
|
001-33156
|
11/3/16
|
10.1
|
||||||
|
10.34
|
8-K
|
001-33156
|
1/27/17
|
10.1
|
||||||
|
10.35
|
10-K
|
001-33156
|
2/22/17
|
10.33
|
||||||
|
10.36
|
10-Q
|
001-33156
|
5/5/17
|
10.1
|
||||||
|
10.37
|
8-K
|
001-33156
|
7/14/17
|
10.10
|
||||||
|
10.38
|
10-Q
|
001-33156
|
7/27/18
|
10.1
|
||||||
|
10.39
|
10-Q
|
001-33156
|
7/27/18
|
10.2
|
||||||
|
10.40
|
10-Q
|
001-33156
|
7/27/18
|
10.3
|
||||||
|
*10.41
|
—
|
—
|
—
|
—
|
||||||
|
*10.42
|
—
|
—
|
—
|
—
|
||||||
|
*10.43
|
—
|
—
|
—
|
—
|
||||||
|
*10.44
|
—
|
—
|
—
|
—
|
||||||
|
*10.45
|
—
|
—
|
—
|
—
|
||||||
|
*10.46
|
—
|
—
|
—
|
—
|
||||||
|
*14.1
|
—
|
—
|
—
|
—
|
||||||
|
*21.1
|
—
|
—
|
—
|
—
|
||||||
|
*23.1
|
—
|
—
|
—
|
—
|
||||||
|
*31.01
|
—
|
—
|
—
|
—
|
||||||
|
*31.02
|
—
|
—
|
—
|
—
|
||||||
|
Δ*32.01
|
—
|
—
|
—
|
—
|
||||||
|
*101.INS
|
XBRL Instance Document
|
—
|
—
|
—
|
—
|
|||||
|
*101.SCH
|
XBRL Taxonomy Extension Schema Document
|
—
|
—
|
—
|
—
|
|||||
|
*101.CAL
|
XBRL Taxonomy Extension Calculation Linkbase Document
|
—
|
—
|
—
|
—
|
|||||
|
*101.DEF
|
XBRL Definition Linkbase Document
|
—
|
—
|
—
|
—
|
|||||
|
*101.LAB
|
XBRL Taxonomy Label Linkbase Document
|
—
|
—
|
—
|
—
|
|||||
143
|
Incorporated by Reference
|
||||||||||
|
Exhibit
Number
|
Exhibit Description
|
Form
|
File No.
|
Date of
First Filing
|
Exhibit
Number
|
|||||
|
*101.PRE
|
XBLR Taxonomy Extension Presentation Document
|
—
|
—
|
—
|
—
|
|||||
——————————
|
*
|
Filed herewith.
|
|
Δ
|
This exhibit shall not be deemed “filed” for purposes of Section 18 of the Securities Exchange Act of 1934 or otherwise subject to the liabilities of that section, nor shall it be deemed incorporated by reference in any filing under the Securities Act of 1933 or the Securities Exchange Act of 1934, whether made before or after the date hereof and irrespective of any general incorporation language in any filings.
|
Item 16.
Form 10-K Summary
None.
144
SIGNATURES
Pursuant to the requirements of Section 13 or 15(d) of the Securities Exchange Act of 1934, the registrant has duly caused this report to be signed on its behalf by the undersigned, thereunto duly authorized.
|
FIRST SOLAR, INC.
|
|||
|
February 21, 2019
|
By:
|
/s/ BRYAN SCHUMAKER
|
|
|
Name:
|
Bryan Schumaker
|
||
|
Title:
|
Chief Accounting Officer
|
||
Pursuant to the requirements of the Securities Exchange Act of 1934, this report has been signed below by the following persons on behalf of the registrant and in the capacities and on the dates indicated.
|
Signature
|
Title
|
Date
|
||
|
/s/ MARK R. WIDMAR
|
Chief Executive Officer and Director
|
February 21, 2019
|
||
|
Mark R. Widmar
|
||||
|
/s/ ALEXANDER R. BRADLEY
|
Chief Financial Officer
|
February 21, 2019
|
||
|
Alexander R. Bradley
|
||||
|
/s/ MICHAEL J. AHEARN
|
Chairman of the Board of Directors
|
February 21, 2019
|
||
|
Michael J. Ahearn
|
||||
|
/s/ SHARON L. ALLEN
|
Director
|
February 21, 2019
|
||
|
Sharon L. Allen
|
||||
|
/s/ RICHARD D. CHAPMAN
|
Director
|
February 21, 2019
|
||
|
Richard D. Chapman
|
||||
|
/s/ GEORGE A. HAMBRO
|
Director
|
February 21, 2019
|
||
|
George A. Hambro
|
||||
|
/s/ MOLLY E. JOSEPH
|
Director
|
February 21, 2019
|
||
|
Molly Joseph
|
||||
|
/s/ CRAIG KENNEDY
|
Director
|
February 21, 2019
|
||
|
Craig Kennedy
|
||||
|
/s/ WILLIAM J. POST
|
Director
|
February 21, 2019
|
||
|
William J. Post
|
||||
|
/s/ PAUL H. STEBBINS
|
Director
|
February 21, 2019
|
||
|
Paul H. Stebbins
|
||||
|
|
||||
|
/s/ MICHAEL SWEENEY
|
Director
|
February 21, 2019
|
||
|
Michael Sweeney
|
||||
145
TABLE OF CONTENTS
Part IItem 1. BusinessItem 1A. Risk FactorsItem 1B. Unresolved Staff CommentsItem 2. PropertiesItem 3. Legal ProceedingsItem 4. Mine Safety DisclosuresPart IIItem 5. Market For Registrant S Common Equity, Related Stockholder Matters, and Issuer Purchases Of Equity SecuritiesItem 6. Selected Financial DataItem 7. Management S Discussion and Analysis Of Financial Condition and Results Of OperationsNote 2. Summary Of Significant Accounting PoliciesNote 6. Goodwill and Intangible AssetsItem 7A. Quantitative and Qualitative Disclosures About Market RiskNote 10. Derivative Financial InstrumentsItem 8. Financial Statements and Supplementary DataItem 9. Changes in and Disagreements with Accountants on Accounting and Financial DisclosureItem 9A. Controls and ProceduresItem 9B. Other InformationPart IIIItem 10. Directors, Executive Officers, and Corporate GovernanceItem 11. Executive CompensationItem 12. Security Ownership Of Certain Beneficial Owners and Management and Related Stockholder MattersItem 13. Certain Relationships and Related Transactions, and Director IndependenceItem 14. Principal Accounting Fees and ServicesPart IVItem 15. Exhibits and Financial Statement SchedulesNote 13. Solar Module Collection and Recycling LiabilityNote 14. DebtNote 8. Restricted Cash and InvestmentsItem 16. Form 10-k Summary