FOSTER L B CO
10-Ks and 10-Qs
|
|
|
|
|
|
|
|
|
|
|
|
|
|
|
|
|
|
|
|
|
|
|
|
|
|
|
|
|
|
|
|
|
|
|
|
|
|
|
|
|
|
|
|
|
|
|
|
|
|
|
|
|
|
|
|
|
|
|
|
|
|
UNITED STATES
SECURITIES AND EXCHANGE COMMISSION
Washington, D.C. 20549
FORM 10-K
(Mark One)
|
[X]
|
Annual Report Pursuant to Section 13 or 15 (d) of the Securities Exchange Act of 1934
For the fiscal year ended December 31, 2011
|
Or
|
[ ]
|
Transition Report Pursuant to Section 13 or 15(d) of the Securities Exchange Act of 1934
|
For the transition period from ______ to _____
|
Commission File Number
|
0-10436
|
L. B. FOSTER COMPANY
(Exact name of registrant as specified in its charter)
|
Pennsylvania
|
25-1324733
|
|
(State of Incorporation)
|
(I.R.S. Employer Identification No.)
|
|
415 Holiday Drive, Pittsburgh, Pennsylvania
|
15220
|
|
(Address of principal executive offices)
|
(Zip Code)
|
|
Registrant’s telephone number, including area code:
|
(412) 928-3417
|
Securities registered pursuant to Section 12(b) of the Act:
|
Title of Each Class
|
Name of Each Exchange On Which Registered
|
|
Common Stock, Par Value $0.01
|
NASDAQ Global Select Market
|
|
Preferred Stock Purchase Rights
|
NASDAQ Global Select Market
|
|
Securities registered pursuant to Section 12(g) of the Act:
|
None
|
|
Indicate by check mark if the registrant is a well-known seasoned issuer, as defined in Rule 405 of the Securities Act.
|
[ ] Yes
|
[X] No
|
|
Indicate by check mark if the registrant is not required to file reports pursuant to Section 13 or 15(d) of the Exchange Act.
|
[ ] Yes
|
[X] No
|
|
Indicate by check mark whether the registrant (1) has filed all reports required to be filed by Section 13 or 15(d) of the Securities Exchange Act of 1934 during the preceding 12 months (or for such shorter period that the registrant was required to file such reports) and (2) has been subject to such filing requirements for the past 90 days.
|
[X] Yes
|
[ ] No
|
|
Indicate by check mark whether the registrant has submitted electronically and posted on its corporate Web site, if any, every Interactive Data File required to be submitted and posted pursuant to Rule 405 of Regulation S-T during the preceding 12 months (or for shorter period that the registrant was required to submit and post such files).
|
[X] Yes
|
[ ] No
|
|
Indicate by check mark if disclosure of delinquent filers pursuant to Item 405 of Regulation S-K is not contained herein, and will not be contained, to the best of registrant’s knowledge, in definitive proxy or information statements incorporated by reference in Part III of this Form 10-K or any amendment to this form 10-K.
|
[ ]
|
Indicate by check mark whether the registrant is a large accelerated filer, an accelerated filer, a non-accelerated filer, or a smaller reporting company. See the definitions of “large accelerated filer,” “accelerated filer” and “smaller reporting company” in Rule 12b-2 of the Exchange Act. (Check one):
|
Large accelerated filer [ ]
|
Accelerated filer [X]
|
Non-accelerated filer [ ]
|
Smaller reporting company [ ]
|
|
(Do not check if a smaller reporting company)
|
|
Indicate by check mark whether the registrant is a shell company (as defined in Rule 12b-2 of the Exchange Act).
|
[ ] Yes
|
[X] No
|
The aggregate market value of the voting and non-voting common equity held by non-affiliates computed by reference to the price at which the common equity was last sold, or the average bid and asked price of such common equity, as of the last business day of the registrant’s most recently completed second fiscal quarter was $324,649,000.
Indicate the number of shares outstanding of each of the registrant’s classes of common stock, as of the latest practicable date.
|
Class
|
Outstanding at February 28, 2012
|
|
Common Stock, Par Value $0.01
|
10,253,438 shares
|
Documents Incorporated by Reference:
Portions of the Proxy Statement prepared for the 2012 annual meeting of stockholders are incorporated by reference in Items 10, 11, 12, 13 and 14 of Part III of this Form 10-K.
|
Certifications
|
|
EX 101
Forward Looking Statements
Disclosures in this Annual Report on Form 10-K may contain forward-looking statements that involve risks and uncertainties. Statements that do not relate strictly to historical or current facts are forward-looking. When we use the words “believe,” “intend,” “expect,” “may,” “should,” “anticipate,” “could,” “estimate,” “plan,” “predict,” “project,” or their negatives, or other similar expressions, the statements which include those words are usually forward-looking statements. Actual results could differ materially from the results anticipated in any forward-looking statement. Accordingly, investors should not place undue reliance on forward-looking statements as a prediction of actual results. The Company has based these forward-looking statements on current expectations and assumptions about future events. While the Company considers these expectations and assumptions to be reasonable, they are inherently subject to significant business, economic, competitive, regulatory and other risks and uncertainties, most of which are difficult to predict and many of which are beyond the Company’s control. The risks and uncertainties that may affect the operations, performance and results of the Company’s business and forward-looking statements include, but are not limited to, an economic slowdown in the markets we serve; a decrease in freight or passenger rail traffic; a lack of state or federal funding for new infrastructure projects; an increase in manufacturing or material costs; resolution of the product claim and the United States Department of Transportation Inspector General subpoena.
The risks and uncertainties that may affect the operations, performance and results of the Company's business and forward-looking statements include, but are not limited to, those set forth under Item 1A, "Risk Factors" and elsewhere in this Form 10-K.
The forward looking statements in this report are made as of the date of this report and we assume no obligation to update or revise any forward looking statement, whether as a result of new information, future developments or otherwise.
Summary Description of Businesses
Formed in 1902, L. B. Foster Company is a Pennsylvania corporation with its principal office in Pittsburgh, PA. L. B. Foster Company is a leading manufacturer, fabricator and distributor of products and services for the rail, construction, energy and utility markets. As used herein, “Foster” or the “Company” means L. B. Foster Company and its divisions and subsidiaries, unless the context otherwise requires. The Company classifies its activities into three business segments: Rail products, Construction products, and Tubular products. Financial information concerning the segments is set forth in Item 8, Note 2 to the financial statements included herein, which is incorporated by reference into this Item 1.
For rail markets, Foster provides a full line of new and used rail, trackwork, and accessories to railroads, mines and industry. The Company also designs and produces concrete railroad ties, insulated rail joints, power rail, track fasteners, coverboards and special accessories for mass transit and other rail systems worldwide. The Company also engineers, manufactures and assembles friction management products, railway wayside data collection and management systems and engineers and sells securement systems and related products.
For the construction industry, the Company sells steel sheet piling, H-bearing piling, pipe piling and provides rental sheet piling for foundation requirements. In addition, Foster supplies precast concrete buildings, fabricated structural steel, bridge decking, bridge railing, expansion joints and other products for highway construction and repair.
For tubular markets, the Company supplies pipe coatings for natural gas pipelines and utilities. The Company also produces threaded pipe products for industrial water well and irrigation markets.
More information concerning the Company’s liquidity and capital resources and the Company’s working capital requirements can be found in Item 7, Management’s Discussion and Analysis of Financial Condition and results of operations.
The Company has a joint venture, L B Pipe & Coupling Products, LLC, with L B Industries, Inc. The Company and L B Industries each have a 45% ownership interest. This venture manufactures, markets and sells various products for the energy, utility and construction markets. More information concerning the joint venture is set forth in Item 8, Note 8 to the financial statements included herein, which is incorporated by reference into this Item 1.
The following table shows, for the last three fiscal years, the net sales generated by each of the current business segments as a percentage of total net sales.
|
Percentage of Net Sales
|
|||
|
2011
|
2010
|
2009
|
|
|
Rail Products
|
55%
|
45%
|
46%
|
|
Construction Products
|
40
|
49
|
49
|
|
Tubular Products
|
5
|
6
|
5
|
|
100%
|
100%
|
100%
|
|
RAIL PRODUCTS
L. B. Foster Company’s rail products include heavy and light rail, relay rail, concrete ties, insulated rail joints, rail spikes, rail anchors, rail accessories, transit products and friction management products. The Company is a major rail products supplier to industrial plants, contractors, railroads, mines and mass transit systems.
The Company sells heavy rail mainly to transit authorities, industrial companies, and rail contractors for railroad sidings, plant trackage, and other carrier and material handling applications. Additionally, the Company sells some heavy rail to railroad companies and to foreign buyers. The Company sells light rail for mining and material handling applications.
Rail accessories include trackwork, ties, track spikes, bolts, angle bars and other products required to install or maintain rail lines. These products are sold to railroads, rail contractors, industrial customers, and transit agencies and are manufactured within the Company or purchased from other manufacturers.
The Company’s Allegheny Rail Products (ARP) division engineers and markets insulated rail joints and related accessories for the railroad and mass transit industries. Insulated joints are manufactured at the Company’s facilities in Pueblo, CO and Niles, OH.
The Company’s Transit Products division supplies power rail, direct fixation fasteners, coverboards and special accessories primarily for mass transit systems. Most of these products are manufactured by subcontractors and are usually sold by sealed bid to transit authorities or to rail contractors, worldwide.
The Company’s Trackwork division sells new and relay trackwork for industrial and export markets.
The Company’s Portec subsidiary, acquired on December 15, 2010, engineers, manufactures and assembles friction management products, railway wayside data collection and management systems and engineers and sells securement systems and related products. It also manufactures stick friction modifiers and related application systems.
The Company’s CXT subsidiary manufactures engineered concrete railroad ties for the railroad and transit industries at its facilities in Spokane, WA and Tucson, AZ.
CONSTRUCTION PRODUCTS
L. B. Foster Company’s construction products consist of sheet, pipe and bearing piling, fabricated highway products, and precast concrete buildings.
Sheet piling products are interlocking structural steel sections that are generally used to provide lateral support at construction sites. Bearing piling products are steel H-beam sections which, in their principal use, are driven into the ground for support of structures such as bridge piers and high-rise buildings. Piling products are sourced from various manufacturers and either sold or rented to project owners and contractors.
Other construction products consist of precast concrete buildings, sold principally to national and state parks, and fabricated highway products. Fabricated highway products consist principally of fabricated structural steel, bridge decking, aluminum and steel bridge rail and other bridge products, which are fabricated by the Company. The major purchasers of these products are contractors for state, municipal and other governmental projects.
Sales of the Company’s construction products are partly dependent upon the level of activity in the construction industry. Accordingly, sales of these products have traditionally been somewhat higher during the second and third quarters than during the first and fourth quarters of each year.
TUBULAR PRODUCTS
The Company provides fusion bond epoxy and other coatings for corrosion protection on oil, gas and other pipelines. The Company also supplies special pipe products such as water well casing, column pipe, couplings, and related products for agricultural, municipal and industrial water wells.
JOINT VENTURE
In May 2009, the Company completed the formation of a joint venture with L B Industries, Inc. for a period of 9.5 years. The Company and L B Industries each have a 45% ownership interest in the joint venture, L B Pipe & Coupling Products, LLC. The Company has made all of its mandatory capital contributions under the joint venture agreement totaling $3.0 million.
This venture commenced operations in 2010 and manufactures, markets and sells various products for the energy, utility and construction markets.
MARKETING AND COMPETITION
L. B. Foster Company generally markets its rail, construction and tubular products directly in all major industrial areas of the United States, Canada and the United Kingdom through a sales force of 74 people. The Company utilizes a network of agents across Europe, South America and Asia to supplement its internal sales force to reach current customers and cultivate potential customers in these areas. The Company maintains 15 sales offices and 21 warehouses, plant and yard facilities located throughout the United States, Canada and the United Kingdom. For the years ended 2011, 2010 and 2009, approximately 15%, 5% and 3%, respectively, of the Company’s total sales were outside the United States.
The major markets for the Company’s products are highly competitive. Product availability, quality, service and price are principal factors of competition within each of these markets. No other company provides the same product mix to the various markets the Company serves. There are one or more companies that compete with the Company in each product line. Therefore, the Company faces significant competition from different groups of companies.
RAW MATERIALS AND SUPPLIES
Most of the Company’s inventory is purchased in the form of finished or semi-finished product. The Company purchases most of its inventory from domestic and foreign steel producers. There are few domestic suppliers of new rail products and the Company could be adversely affected if a domestic supplier ceased making such material available to the Company. Additionally, the Company has an agreement with a steel mill to distribute steel sheet piling and bearing pile in North America. The Company also purchases cement and aggregate used in its concrete railroad tie and precast concrete building businesses from a variety of suppliers.
The Company’s purchases from foreign suppliers are subject to the usual risks associated with changes in international conditions and to United States laws which could impose import restrictions on selected classes of products and anti-dumping duties if products are sold in the United States below certain prices.
BACKLOG
The dollar amount of firm, unfilled customer orders at December 31, 2011 and 2010 by business segment follows:
|
December 31,
|
||||||||
|
2011
|
2010
|
|||||||
|
In thousands
|
||||||||
|
Rail Products
|
$ | 68,103 | $ | 86,404 | ||||
|
Construction Products
|
66,555 | 102,173 | ||||||
|
Tubular Products
|
10,784 | 720 | ||||||
|
Total
|
$ | 145,442 | $ | 189,297 | ||||
Approximately 2% of the December 31, 2011 backlog is related to projects that will extend beyond 2012.
RESEARCH AND DEVELOPMENT
Expenditures for research and development totaled $1.9 million in 2011 and $0.3 million in 2010. These 2011 expenditures were predominately associated with the Company’s friction management and railroad monitoring system products.
PATENTS AND TRADEMARKS
The Company owns a number of United States, Canadian and international patents and trademarks. The Company has several patents on its friction management products, such as the Protector® IV application system, along with a significant number of patents related to its friction modifier product lines at Kelsan Technologies, which are of material importance to the business as a whole. We believe that, in the aggregate, our patents and trademarks give us a competitive advantage. We also rely on a combination of trade secrets and other intellectual property laws, non-disclosure agreements and other protective measures to establish and protect our proprietary rights in intellectual property.
ENVIRONMENTAL DISCLOSURES
It is not possible to quantify the potential impact of actions regarding environmental matters, particularly for future remediation and other compliance efforts. In the opinion of management, compliance with environmental protection laws will not have a material adverse effect on the financial condition, competitive position, or capital expenditures of the Company. However, the Company’s efforts to comply with stringent environmental regulations may have an adverse effect on the Company’s future earnings.
In February 2010, the Securities and Exchange Commission published guidance regarding its existing disclosure requirements as they apply to climate change matters. A number of governments or governmental bodies have introduced or are contemplating legislative and regulatory change in response to the potential impacts of climate change including pending U.S. legislation that, if enacted, would limit and reduce greenhouse gas emissions through a “cap and trade” system of allowances and credits, among other provisions. In addition, the U. S. Environmental Protection Agency has for the first time required large emitters of greenhouse gases to collect and report data with respect to their greenhouse gas emissions. Assessments of the potential impact, either positive or negative, of future climate change legislation, regulation and international treaties and accords are uncertain, given that these regulatory mechanisms may be either voluntary or legislated and may impact our operations directly or indirectly through our suppliers or customers.
See Item 3, Legal Proceedings, for information regarding the Company’s environmental reserves.
EMPLOYEES AND EMPLOYEE RELATIONS
As of December 2011, the Company had 845 employees, of whom 88 were located in Canada, 56 were located in the United Kingdom with the remaining located in the United States. There were 419 hourly production workers and 426 salaried employees. Of these hourly production workers, approximately 190 are represented by unions. The Company has not suffered any major work stoppages during the past five years and considers its relations with its employees to be satisfactory.
Substantially all of the Company’s hourly paid employees are covered by one of the Company’s noncontributory, defined benefit plans or defined contribution plans. Substantially all of the Company’s salaried employees are covered by defined contribution plans.
FINANCIAL INFORMATION ABOUT GEOGRAPHIC AREAS
Financial information concerning information about geographic areas is set forth in Item 8, Note 2 to the financial statements included herein, which is incorporated by reference into this Item 1.
FINANCIAL INFORMATION ABOUT SEGMENTS
Financial information concerning information about segments is set forth in Item 8, Note 2 to the financial statements included herein, which is incorporated by reference into this Item 1.
AVAILABLE INFORMATION
The Company makes certain filings with the Securities and Exchange Commission (SEC), including its annual report on Form 10-K, quarterly reports on Form 10-Q, current reports on Form 8-K, and all amendments and exhibits to those reports, available free of charge through its website,
www.lbfoster.com
, as soon as reasonably practicable after they are filed with the SEC. These filings are also available through the SEC at the SEC’s Public Reference Room at 100 F Street N.E. Washington, D.C. 20549 or by calling 1-800-SEC-0330. Also, these filings are available on the internet at
www.sec.gov
. The Company’s press releases are also available on its website.
Risks and Uncertainties
We intend to pursue acquisitions, joint ventures and alliances that involve a number of inherent risks, any of which may cause us not to realize anticipated benefits.
We continue to evaluate acquisition opportunities that have the potential to support and strengthen our business. We can give no assurances that any opportunities will arise or if they do, that they will be consummated or that potential additional financing will be available. In addition, acquisitions involve inherent risks that the acquired business will not perform in accordance with our expectations. We may not be able to achieve the synergies and other benefits we expect from the integration as successfully or rapidly as projected, if at all. Our failure to integrate newly acquired operations could prevent us from realizing our expected rate of return on an acquired business and could have a material or adverse effect on our results of operations and financial condition.
Prolonged unfavorable economic and market conditions could adversely affect our business.
We could be adversely impacted by prolonged negative changes in economic conditions affecting either our suppliers or customers as well as the capital markets. No assurances can be given that we will be able to successfully mitigate various prolonged uncertainties including materials cost variability, delayed or reduced customer payments and access to available capital resources outside of operations.
We may incur increased costs due to fluctuations in interest rates and foreign currency exchange rates.
The majority of the Company’s products and services are sold in the United States, Canada and the United Kingdom. Fluctuations in the relative values of the United States dollar, Canadian dollar and British pound will require adjustments in reported earnings and operations to reflect exchange rate translation in the Company’s Canadian and United Kingdom sales and operations. If the United States dollar strengthens in value as compared to the value of the Canadian dollar or British pound, the Company’s reported earnings in dollars from sales in those currencies will be unfavorable. Conversely, a favorable result will be reported if the United States dollar weakens in value as compared to the value of the Canadian dollar or British pound.
Our business operates in a highly competitive industry.
We face strong competition in all of the markets in which we participate. Our response to competitor pricing actions and new competitor entries into our product lines, could negatively impact our overall pricing in the marketplace. Efforts to improve pricing could negatively impact our sales volume in all product categories. Significant negative developments in these areas could adversely affect our financial results and condition.
If we are unable to protect our intellectual property and prevent its improper use by third parties, our ability to compete may be harmed.
The Company owns a number of patents and trademarks under the intellectual property laws of the United States, Canada and the United Kingdom. These patent protections begin expiring in 2014. However, the Company has not perfected patent and trademark protection of our proprietary intellectual property in other countries. The failure to obtain patent and trademark protection in other countries may result in other companies copying and marketing products that are based upon the Company’s proprietary intellectual property. This could impede growth into new markets where the Company does not have such protections and result in greater supplies of similar products, which in turn could result in a loss of pricing power and reduced revenue.
We are dependent upon key customers.
The Company could be adversely affected by changes in the business or financial condition of a customer or customers. A significant decrease in capital spending by our railroad customers could negatively impact our product revenue. No assurances can be given that a significant downturn in the business or financial condition of a customer, or customers, would not impact our results of operations and/or financial condition.
In July 2011 the Union Pacific Railroad (UPRR) notified the Company and its CXT subsidiary of a warranty claim under CXT's 2005 supply contract relating to the sale of prestressed concrete railroad ties for the UPRR. Based on the non-specific nature of the UPRR’s assertion and the Company’s current inability to verify the claims, the Company is unable to determine a range of reasonably possible outcomes regarding this potential exposure matter. As a result, no accruals were made as a result of this claim as the impact, if any, cannot be reasonably estimated at this time. No assurances can be given regarding the ultimate outcome of this matter. The ultimate resolution of this matter could have a material, adverse impact on our financial statements, results of operations, liquidity and capital resources.
The Company’s CXT Rail operation and ARP division are dependent on the UPRR for a significant portion of their business. The CXT Rail operation was awarded a long-term contract in 2005 from the UPRR for the supply of prestressed concrete railroad ties. CXT Rail completed construction of a new facility in Tucson, AZ in 2006 to accommodate the contract’s requirements. UPRR has agreed to purchase minimum annual quantities from the Tucson, AZ facility through December 2012. In December 2010, the UPRR opted not to extend the supply agreement for the Grand Island, NE plant and we closed the plant in February 2012. No assurances can be given on whether the existing UPRR product warranty claim will adversely impact the Company’s ability to extend the supply agreement with the Tucson, AZ facility.
A substantial portion of our operations are heavily dependent on governmental funding of infrastructure projects. Many of these projects have “Buy America” or “Buy American” provisions. Significant changes in the level of government funding of these projects could have a favorable or unfavorable impact on our operating results. Additionally, government actions concerning “Buy America” provisions, taxation, tariffs, the environment, or other matters could impact our operating results.
A growing portion of our sales may be derived from our international operations, which exposes us to certain risks inherent in doing business on an international level.
The Company is placing increased emphasis on the expansion of our international sales opportunities. Doing business outside the United States subjects the Company to various risks, including changing economic, climate and political conditions, work stoppages, exchange controls, currency fluctuations, armed conflicts and unexpected changes in United States and foreign laws relating to tariffs, trade restrictions, transportation regulations, foreign investments and taxation. Increasing sales to foreign countries will expose the Company to increased risk of loss from foreign currency fluctuations and exchange controls as well as longer accounts receivable payment cycles. The Company has little control over most of these risks and may be unable to anticipate changes in international economic and political conditions and, therefore, unable to alter its business practices in time to avoid the adverse effect of any of these possible changes.
Certain segments of our business depend on a small number of suppliers. The loss of any such supplier could have a material adverse effect on our business, financial condition and result of operations.
In our rail and piling distributed products businesses, we rely on a limited number of suppliers for key products that we sell to our customers. No assurances can be given that a significant downturn in the business of one of these suppliers, a disruption in their manufacturing operations, an unwillingness to continue to sell to us or a disruption in the availability of existing and new piling and rail products would not adversely impact our financial results.
Fluctuations in the price, quality and availability of our primary raw materials used in our business could have a material adverse effect on our operations and profitability.
Most of Foster’s businesses utilize steel as a significant product component. The steel industry is cyclical and prices and availability are subject to these cycles as well as to international market forces. We also use significant amounts of cement and aggregate in our concrete railroad tie and our precast concrete building businesses. Cement and aggregate prices are subject to market conditions but this has not yet had a significant impact on the Company. No assurances can be given that our financial results would not be adversely affected if prices or availability of these materials were to change in a significantly unfavorable manner.
Our joint venture may require us to meet future capital commitments that may be burdensome or have a material adverse effect on our operations and profitability.
We have a joint venture with L B Industries, Inc. and another party to manufacture, market and sell various products for the energy, utility and construction markets. In connection with the joint venture agreement, we were required to make capital contributions of $3.0 million, which the Company met in 2011. No assurances can be given that additional capital contributions will not be required or that the joint venture will perform in accordance with our expectations.
Labor disputes may have a material adverse effect on our operations and profitability.
Four of the Company’s manufacturing facilities are staffed by employees represented by labor unions. These approximately 190 employees are currently working under three separate collective bargaining agreements.
In September 2011, we negotiated the renewal of the collective bargaining agreement with our Spokane, WA workforce represented by the United Steelworkers Local Number 338. This agreement, covering approximately 100 employees, expires in September 2014.
In October 2010, we negotiated the renewal of the collective bargaining agreement with our Bedford, PA workforce represented by the Shopman’s Local Union Number 527. This agreement, covering approximately 70 employees, expires in March 2014.
The collective bargaining agreement with our St. Jean, Quebec, Canada workforce is represented by the Canadian Steel Workers Union Local Number 9443. This agreement, covering approximately 20 employees, expires in August 2013.
These collective bargaining agreements forbid the respective labor organizations from endorsing any work stoppage during the life of the agreements.
An adverse outcome in any pending or future litigation could negatively impact our operations and profitability.
Changes in our expectations of the outcome of certain legal actions could vary materially from our current expectations and adversely affect our financial results and/or financial condition.
Future climate change regulation could result in increased operating costs, affecting the demand for our products or affect the ability of our critical suppliers to meet our needs.
In February 2010, the Securities and Exchange Commission published guidance regarding its existing disclosure requirements as they apply to climate change matters. A number of governments or governmental bodies have introduced or are contemplating legislative and regulatory change in response to the potential impacts of climate change including pending U.S. legislation that, if enacted, would limit and reduce greenhouse gas emissions through a “cap and trade” system of allowances and credits, among other provisions. In addition, the U. S. Environmental Protection Agency has for the first time required large emitters of greenhouse gases to collect and report data with respect to their greenhouse gas emissions. Assessments of the potential impact, both positive or negative, of future climate change legislation, regulation and international treaties and accords are uncertain, given that these regulatory mechanisms may be either voluntary or legislated and may impact our operations directly or indirectly through our suppliers or customers.
Our future performance and market value could cause future write-downs of intangible assets in future periods.
The Company is required under generally accepted accounting principles to review its intangible assets for impairment when events or changes in circumstances indicate the carrying value may not be recoverable. Goodwill is required to be tested for impairment at least annually. Factors that may be considered to be a change in circumstances indicating that the carrying value of the Company’s intangible assets may not be recoverable include, but are not limited to, a decline in stock price and market capitalization, a significant decrease in the market value of an asset or a significant decrease in operating or cash flow projections. No assurances can be given that the Company will not be required to record a significant, adverse charge to earnings during the period in which any impairment of its goodwill or intangible assets occurs.
We may not foresee or be able to control certain events that could adversely affect our business.
Unexpected events including fires or explosions at facilities, natural disasters, war, unplanned outages, equipment failures, failure to meet product specifications, or a disruption in certain of our operations may cause our operating costs to increase or otherwise impact our financial performance.
None.
The location and general description of the principal properties which are owned or leased by L. B. Foster Company, together with the segment of the Company’s business using the properties, are set forth in the following table:
|
Location
|
Function
|
Acres
|
Business Segment
|
Lease Expires
|
|
Bedford, PA
|
Bridge component fabricating plant.
|
10
|
Construction
|
Owned
|
|
Birmingham, AL
|
Pipe coating facility.
|
32
|
Tubular
|
2017
|
|
Columbia City, IN
|
Rail processing facility and yard storage.
|
22
|
Rail
|
Owned
|
|
Georgetown, MA
|
Bridge component fabricating plant.
|
11
|
Construction
|
Owned
|
|
Hillsboro, TX
|
Precast concrete facility.
|
9
|
Construction
|
Owned
|
|
Houston, TX
|
Yard storage.
|
20
|
Tubular, Rail and Construction
|
2018
|
|
Kenova, WV
|
Shipping systems facility.
|
N/A
|
Rail
|
2014
|
|
Leicester, United Kingdom
|
Material handling manufacturing plant.
|
N/A
|
Rail
|
2014
|
|
Magnolia, TX
|
Threading facility and joint venture manufacturing facility.
|
35
|
Tubular
|
Owned
|
|
Niles, OH
|
Rail fabrication. Yard storage.
|
35
|
Rail
|
Owned
|
|
Burnaby, British Columbia, Canada
|
Friction management products plant.
|
N/A
|
Rail
|
2021
|
|
Petersburg, VA
|
Piling storage facility.
|
48
|
Construction
|
Owned
|
|
Pueblo, CO
|
Rail joint manufacturing.
|
9
|
Rail
|
Owned
|
|
Saint-Jean-sur-Richelieu, Quebec, Canada
|
Rail anchors and track spikes manufacturing plant.
|
17
|
Rail
|
Owned
|
|
Sheffield, United Kingdom
|
Track component and friction management products facility.
|
N/A
|
Rail
|
2019
|
|
Spokane, WA
|
CXT concrete tie plant.
|
13
|
Rail
|
2015
|
|
Spokane, WA
|
Precast concrete facility.
|
5
|
Construction
|
2015
|
|
Tucson, AZ
|
CXT concrete tie plant.
|
19
|
Rail
|
2012
|
Included in the above property listing are locations for which there is no acreage included in the lease. These properties have been indicated as “N/A.”
The Company provided notice to the landlord of the Houston, TX facility that the Company will terminate the lease effective April 30, 2012.
The Company has entered into discussions with the UPRR in regards to extending the concrete tie supply agreement for it’s Tucson, AZ facility. This agreement and the related lease expire on December 31, 2012.
Including the properties listed above, the Company has 15 sales offices, including its headquarters in Pittsburgh, PA and four business offices acquired through the Portec acquisition, and 21 warehouses, plant and yard facilities located throughout the United States, Canada and United Kingdom. The Company’s facilities are in good condition.
The Company is not subject to any material environmental or legal proceedings. As of December 31, 2011 and 2010, the Company maintained environmental and litigation reserves approximating $2,184,000 and $2,799,000, respectively. More information regarding the Company’s other commitments and contingencies is set forth in Item 8, Note 21.
This item is not applicable to the Company.
Information concerning the executive officers of the Company is set forth below.
|
Name
|
Age
|
Position
|
|
Robert P. Bauer
|
53
|
President and Chief Executive Officer
|
|
Merry L. Brumbaugh
|
54
|
Vice President – Tubular Products
|
|
Joseph S. Cancilla
|
46
|
Vice President, General Counsel and Secretary
|
|
Samuel K. Fisher
|
59
|
Vice President – Rail Distribution
|
|
Donald L. Foster
|
56
|
Senior Vice President – Construction Products
|
|
Kevin R. Haugh
|
55
|
Vice President– CXT Concrete Products
|
|
John F. Kasel
|
47
|
Senior Vice President – Operations and Manufacturing
|
|
Brian H. Kelly
|
52
|
Vice President – Human Resources
|
|
Gregory W. Lippard
|
43
|
Vice President – Rail Product Sales
|
|
Konstantinos Papazoglou
|
59
|
Vice President – Friction Management
|
|
Linda K. Patterson
|
62
|
Controller
|
|
David J. Russo
|
53
|
Senior Vice President, Chief Financial and Accounting Officer and Treasurer
|
|
David R. Sauder
|
41
|
Vice President – Global Business Development
|
Mr. Bauer was elected President and Chief Executive Officer upon joining the Company in February 2012. Prior to joining the Company, Mr. Bauer previously served from June 1, 2011 as President of the Refrigeration Division of the Climate Technologies business of Emerson Electric Co., a diversified global manufacturing and technology company. From January 1, 2002 until May 31, 2011, Mr. Bauer served as President of Emerson Network Power’s Liebert Division.
Ms. Brumbaugh was elected Vice President – Tubular Products in November 2004, having previously served as General Manager, Coated Products since 1996. Ms. Brumbaugh has served in various capacities with the Company since her initial employment in 1980.
Mr. Cancilla was elected Vice President, General Counsel and Secretary upon joining the Company in August 2011. Prior to joining the Company, Mr. Cancilla was employed by Siemens Industry, Inc. from July 2007 until July 2011 as Counsel to the company’s water and wastewater treatment technologies and metal technologies business units. Prior to that, he was Corporate Counsel for Wheeling-Pittsburgh Steel Corporation from May 2005 to June 2007 and Associate Counsel for Alcoa Inc. from May 2003 to May 2005. He began his law career with Buchanan Ingersoll Professional Corporation as an associate attorney in the Firm’s Corporate Finance practice group from September 1999 to May 2003.
Mr. Fisher’s title was changed to Vice President – Rail Distribution effective January 2011, as part of organizational changes within the Rail Products segment, having previously served as Senior Vice President – Rail since October 2002. From June 2000 until October 2002, Mr. Fisher served as Senior Vice President – Product Management. From October 1997 until June 2000, Mr. Fisher served as Vice President – Rail Procurement. Prior to October 1997, Mr. Fisher served in various other capacities with the Company since his employment in 1977.
Mr. Donald Foster was elected Senior Vice President – Construction Products in February 2005, after having served as Vice President – Piling Products since November 2004 and General Manager of Piling since September 2004. Prior to joining the Company, Mr. Foster was President of Metalsbridge, a financed supply chain logistics entity. He served U.S. Steel Corporation as an officer from 1999 to 2003. During that time, Mr. Foster functioned as Vice President International, President of UEC Technologies and President, United States Steel International, Inc.
Mr. Haugh was elected Vice President – CXT Concrete Products in March 2008 after joining the organization in February 2008. Prior to joining the Company, Mr. Haugh served as Executive Vice President of CANAC, Inc., a subsidiary of Savage Services, and Senior Vice President of Savage Services from 2001 to 2008. His career also included President of Railserve, Inc. prior to 2001.
Mr. Kasel was elected Senior Vice President – Operations and Manufacturing in May 2005 having previously served as Vice President – Operations and Manufacturing since April 2003. Mr. Kasel served as Vice President of Operations for Mammoth, Inc., a Nortek company from 2000 to 2003. His career also included General Manager of Robertshaw Controls and Operations Manager of Shizuki America prior to 2000.
Mr. Kelly was elected Vice President, Human Resources in October 2006 after joining the organization in September 2006. Prior to joining the Company, Mr. Kelly headed Human Resources for 84 Lumber Company from June 2004. Previously, he served as a Director of Human Resources for American Greetings Corp. from June 1994 to June 2004, and he began his career with Nabisco in 1984, serving in progressively responsible generalist human resources positions in both plants and headquarters.
Mr. Lippard was elected Vice President – Rail Product Sales in June 2000. Prior to re-joining the Company in 2000, Mr. Lippard served as Vice President – International Trading for Tube City, Inc. from June 1998. Mr. Lippard served in various other capacities with the Company since his initial employment in 1991.
Mr. Papazoglou was elected Vice President – Friction Management in March 2011. Prior to joining the Company in December 2010, Mr. Papazoglou served as Executive Vice President and Chief Operating Officer for Portec Rail Products, Inc. from October 2006. Mr. Papazoglou served in various other capacities with Portec since his initial employment in 1978.
Ms. Patterson was elected Controller in February 1999, having previously served as Assistant Controller since May 1997 and Manager of Accounting since March 1988. Prior to March 1988, Ms. Patterson served in various other capacities with the Company since her employment in 1977.
Mr. Russo was elected Senior Vice President, Chief Financial and Accounting Officer and Treasurer in March 2010 having served previously as Senior Vice President, Chief Financial Officer and Treasurer since December 2002. From July 2002 to December 2002, Mr. Russo served as Vice President and Chief Financial Officer. Mr. Russo was Corporate Controller of WESCO International Inc., a distributor of electrical and industrial MRO supplies and integrated supply services, from 1999 until joining the Company in 2002. Mr. Russo also served as Corporate Controller of Life Fitness Inc., an international designer, manufacturer and distributor of aerobic and strength training fitness equipment.
Mr. Sauder was elected Vice President – Global Business Development upon joining the Company in November 2008. Prior to joining the Company, Mr. Sauder was Director, Global Business Development at Joy Mining Machinery where he was responsible for leading mergers and acquisitions and new business initiatives from December 2007. Prior to that, he was Manager, Business Development for Eaton Corporation from April 2006 to December 2007. He previously held various positions of increasing responsibility at Duquesne Light Company from August 1998 to April 2006 and PNC Bank from February 1993 to August 1998.
Officers are elected annually at the organizational meeting of the Board of Directors following the annual meeting of stockholders.
Code of Ethics
L. B. Foster Company has a legal and ethical conduct policy applicable to all directors and employees, including its Chief Executive Officer, Chief Financial Officer and Controller. This policy is posted on the Company’s website,
www.lbfoster.com
. The Company intends to satisfy the disclosure requirement regarding certain amendments to, or waivers from, provisions of its policy by posting such information on the Company’s website.
Stock Market Information
The Company had 492 common shareholders of record on February 17, 2012. Common stock prices are quoted daily through the NASDAQ Global Select Market quotation service (Symbol FSTR). The quarterly high and low bid price quotations for common shares (which represent prices between broker-dealers and do not include markup, markdown or commission and may not necessarily represent actual transactions) follow:
|
2011
|
2010
|
|||||||||||||||||||||||
|
Quarter
|
High
|
Low
|
Dividends
|
High
|
Low
|
Dividends
|
||||||||||||||||||
|
First
|
$ | 43.15 | $ | 37.76 | $ | 0.025 | $ | 32.49 | $ | 25.21 | $ | 0.00 | ||||||||||||
|
Second
|
43.58 | 30.22 | 0.025 | 32.48 | 25.92 | 0.00 | ||||||||||||||||||
|
Third
|
38.44 | 16.94 | 0.025 | 31.69 | 25.52 | 0.00 | ||||||||||||||||||
|
Fourth
|
30.18 | 21.02 | 0.025 | 41.00 | 28.09 | 0.00 | ||||||||||||||||||
Dividends
The Company’s credit facility permits it to pay dividends and distributions and make redemptions with respect to its stock providing no event of default or potential default (as defined in the facility agreement) has occurred prior to or after giving effect to the dividend, distribution, or redemption. Dividends, distributions, and redemptions are capped at $15.0 million per year when funds are drawn on the facility. If no drawings on the facility exist, dividends, distributions, and redemptions
in excess of $15.0 million per year
are subjected to a limitation of $75.0 million in aggregate. The $75.0 million aggregate limitation also includes certain loans, investments, and acquisitions.
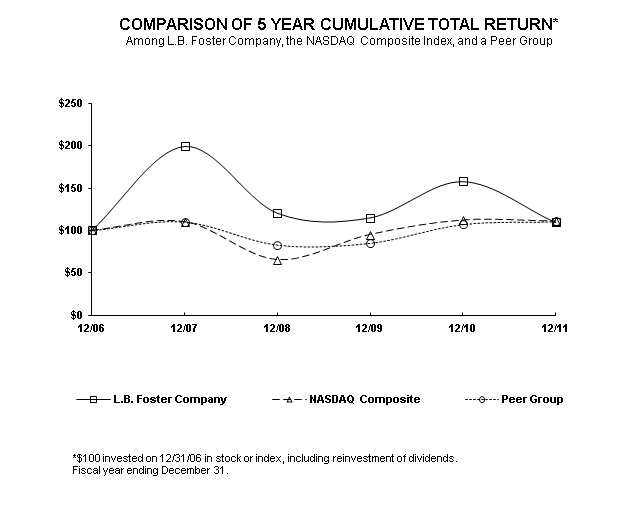
Performance Graph
The following table compares total shareholder returns for the Company over the last five years to the NASDAQ Composite Index and the Company’s Peer Group assuming a $100 investment made on December 31, 2006. Each of the three measures of cumulative total return assumes reinvestment of dividends. The stock performance shown on the graph below is not necessarily indicative of future price performance.
The Company’s Peer Group is composed of Michael Baker Corp., A.M. Castle & Co., Greenbrier Cos., Inc., Northwest Pipe Co, Texas Industries Inc. and Wabtec Corporation. The Company’s peer group was established by selecting similar companies in the rail, construction and steel industries.
|
Cumulative Total Return
|
||||||||||||||||||||||||
| 12/06 | 12/07 | 12/08 | 12/09 | 12/10 | 12/11 | |||||||||||||||||||
|
L.B. Foster Company
|
$ | 100.00 | $ | 199.65 | $ | 120.73 | $ | 115.05 | $ | 158.01 | $ | 109.55 | ||||||||||||
|
NASDAQ Composite
|
100.00 | 110.26 | 65.65 | 95.19 | 112.10 | 110.81 | ||||||||||||||||||
|
Peer Group
|
100.00 | 110.51 | 82.90 | 84.98 | 107.33 | 110.62 | ||||||||||||||||||
Securities Authorized for Issuance Under Equity Compensation Plans
The following table sets forth information as of December 31, 2011 with respect to compensation plans under which equity securities of the Company are authorized for issuance.
|
Number of securities
|
Weighted-average
|
Number of securities remaining
|
||||||||||
|
to be issued upon
|
exercise price of
|
available for future issuance
|
||||||||||
|
exercise of
|
outstanding options,
|
under equity compensation
|
||||||||||
|
outstanding options,
|
warrants and rights
|
plans (excluding securities
|
||||||||||
|
Plan Category
|
warrants and rights
|
to be issued upon exercise)
|
||||||||||
|
Equity compensation plans approved by shareholders
|
39,950 | $ | 8.94 | 321,653 | ||||||||
|
Equity compensation plans not approved by shareholders
|
- | - | - | |||||||||
|
Total
|
39,950 | $ | 8.94 | 321,653 | ||||||||
The Company awarded shares of its common stock to its outside directors on a biannual basis from June 2000 through January 2003 under an arrangement not approved by the Company’s shareholders. A total of 22,984 shares of common stock were so awarded and this program has been terminated. At the Company’s 2003 Annual Shareholders’ Meeting, a new plan was approved by the Company’s shareholders under which outside directors received 2,500 shares of the Company’s common stock at each annual shareholder meeting at which such outside director was elected or re-elected, commencing with the Company’s 2003 Annual Shareholders’ Meeting. Through 2005 there were 30,000 shares issued under this plan. This plan was discontinued on May 24, 2006 when the Company’s shareholders approved the 2006 Omnibus Incentive Plan. Under the 2006 Omnibus Incentive Plan, non-employee directors automatically are awarded 3,500 shares, or a lesser amount determined by the directors, of the Company’s common stock at each annual shareholder meeting at which such non-employee director is elected or re-elected, commencing May 24, 2006. Through December 31, 2011, there were 78,500 fully vested shares issued under the 2006 Omnibus Incentive Plan to non-employee directors. Additionally, pursuant to the 2006 Omnibus Incentive Plan, during 2011, the Company issued to its officers approximately 20,000 fully-vested shares in lieu of a cash payment earned under the Three Year Incentive Plan.
The Company will repurchase shares of restricted stock when issued to pay for withholding taxes. During 2011, the Company repurchased 5,813 shares for approximately $0.2 million. During 2010, the Company repurchased 493 shares for less than $0.1 million.
Issuer Purchases of Equity Securities
On May 23, 2011, the Board of Directors authorized the repurchase of up to $25.0 million of the Company’s common shares until December 31, 2013. The Company did not purchase any of its equity securities during the fourth quarter of 2011. During 2011, the Company purchased 278,655 shares totaling approximately $6.5 million.
The Company purchased 951,673 shares totaling approximately $28.3 million under previous authorization for repurchases under plans that expired on December 31, 2010.
|
Year Ended December 31,
|
|||||||||||||||||||||||
|
Income Statement Data
|
2011 (1) (2)
|
2010 (3)
|
2009 (4)
|
2008 (5)
|
2007 (6)
|
||||||||||||||||||
|
(All amounts are in thousands, except per share data)
|
|||||||||||||||||||||||
|
Net sales
|
$ | 590,926 | $ | 475,050 | $ | 404,020 | $ | 539,236 | $ | 528,200 | |||||||||||||
|
Operating profit
|
$ | 32,096 | $ | 31,995 | $ | 24,357 | $ | 39,249 | $ | 38,980 | |||||||||||||
|
Income from continuing operations
|
$ | 22,895 | $ | 20,492 | $ | 15,727 | $ | 27,746 | $ | 110,724 | |||||||||||||
|
Loss from discontinued
|
|||||||||||||||||||||||
|
operations, net of tax
|
- | - | - | - | (31 | ) | |||||||||||||||||
|
Net income
|
$ | 22,895 | $ | 20,492 | $ | 15,727 | $ | 27,746 | $ | 110,693 | |||||||||||||
|
Basic earnings per common share:
|
|||||||||||||||||||||||
|
Continuing operations
|
$ | 2.24 | $ | 2.01 | $ | 1.55 | $ | 2.60 | $ | 10.39 | |||||||||||||
|
Discontinued operations
|
- | - | - | - | - | ||||||||||||||||||
|
Basic earnings per common share
|
$ | 2.24 | $ | 2.01 | $ | 1.55 | $ | 2.60 | $ | 10.39 | |||||||||||||
|
Diluted earnings per common share:
|
|||||||||||||||||||||||
|
Continuing operations
|
$ | 2.22 | $ | 1.98 | $ | 1.53 | $ | 2.57 | $ | 10.09 | |||||||||||||
|
Discontinued operations
|
- | - | - | - | - | ||||||||||||||||||
|
Diluted earnings per common share
|
$ | 2.22 | $ | 1.98 | $ | 1.53 | $ | 2.57 | $ | 10.09 | |||||||||||||
| (1) |
2011 includes the results of Portec, which was acquired on December 15, 2010. More information about the acquisition of Portec can be found in Item 8, Note 3 to the financial statements included herein, which is incorporated by reference into this Item 6.
|
| (2) |
2011 includes a pre-tax gain of $577 associated with the early termination of the lease associated with the Company’s sale-leaseback transaction.
|
| (3) |
2010 includes a pre-tax gain of $1,364 associated with the remeasurement of the remaining Portec available-for-sale investment on the acquisition date.
|
| (4) |
2009 includes a pre-tax gain of $1,194 associated with the sale of available-for-sale marketable securities.
|
| (5) |
2008 includes pre-tax gains of $2,022 associated with the receipt of escrow proceeds related to the prior year sale of the Company’s Dakota, Minnesota and Eastern Railroad investment and $1,486 from the sale and lease-back of our threaded products facility in Houston, TX.
|
| (6) |
2007 includes $8,472 in dividend income and a $122,885 pre-tax gain due to the announcement and consummation, respectively, of the sale of the Company’s investment in the DM&E.
|
|
December 31,
|
||||||||||||||||||||
|
Balance Sheet Data
|
2011
|
2010
|
2009
|
2008
|
2007
|
|||||||||||||||
|
In thousands
|
||||||||||||||||||||
|
Total assets
|
$ | 379,894 | $ | 378,402 | $ | 331,594 | $ | 332,120 | $ | 330,772 | ||||||||||
|
Working capital
|
155,261 | 142,303 | 210,332 | 202,264 | 200,645 | |||||||||||||||
|
Long-term debt
|
51 | 2,399 | 13,197 | 21,734 | 28,056 | |||||||||||||||
|
Stockholders' equity
|
269,815 | 255,747 | 232,592 | 217,562 | 213,826 | |||||||||||||||
Executive Level Overview
On February 1, 2012, we welcomed Mr. Robert P. Bauer as our new President and Chief Executive Officer. Mr. Bauer replaced Stan L. Hasselbusch who, after serving as President and Chief Executive Officer for ten years, retired effective February 1, 2012.
During 2011, we undertook the following initiatives to enhance shareholder value:
|
·
|
We commenced a quarterly dividend of $0.025 per share.
|
|
·
|
We purchased 278,655 shares for $6.5 million under a $25.0 million share repurchase plan announced in May 2011.
|
In December 2010, the UPRR opted not to extend the supply agreement and lease for our Grand Island, NE tie facility. Production for the remaining orders from this facility was completed during the first quarter of 2011. We wound down operations and dismantled the facility during the first half of 2011 and closed the plant in February 2012. As a result of this closure, we recorded within cost of goods sold approximately $4.4 million in charges consisting of a $3.0 million charge to fulfill a customer contractual obligation that could not be sourced from Grand Island, NE, a $0.8 million charge for unsalable concrete ties, and a $0.6 million charge for concrete ties supplied to a Midwestern transit agency. Sales from this facility were $2.2 million in 2011 compared to $20.4 million in 2010.
In May 2011, we entered into a new $125.0 million revolving credit and security agreement with a group of four banks. The agreement provides for a five-year, unsecured revolving credit facility that permits borrowing up to $125.0 million for the US Borrowers, including a sublimit of the equivalent of $15.0 million US dollars that is available to the Canadian Borrowers. Providing no event of default exists, the agreement contains a provision that provides for an increase in the revolver facility of $50.0 million that can be allocated to existing or new Lenders if our borrowing requirements should grow. The agreement also includes a sublimit of $20.0 million for the issuance of trade and standby letters of credit.
Finally, during 2011, we made substantial progress integrating Portec into our existing businesses to leverage off of each company’s core competencies, merge certain administrative functions and reduce duplicative costs.
2011 Developments
Union Pacific Railroad Product Warranty Claim
On July 12, 2011 the Union Pacific Railroad (UPRR) notified us and our subsidiary, CXT Incorporated (CXT), of a warranty claim under CXT's 2005 supply contract relating to the sale of prestressed concrete railroad ties for the UPRR. The UPRR has asserted that a significant percentage of concrete ties manufactured in 2006 through 2010 at CXT's Grand Island, NE facility fail to meet contract specifications, have workmanship defects and are cracking and failing prematurely. Approximately 1.6 million ties were sold from Grand Island to the UPRR during the period the UPRR has claimed nonconformance. The 2005 contract calls for each concrete tie which fails to conform to the specifications or has a material defect in workmanship to be replaced with 1.5 new concrete ties, provided, that UPRR within five years of a concrete tie’s production, notifies CXT of such failure to conform or such defect in workmanship. The UPRR's notice does not specify how many ties manufactured during this period are defective nor which specifications it claims were not met or the nature of the alleged workmanship defects. CXT believes it uses sound workmanship processes in the manufacture of concrete ties and has not agreed with the assertions in the UPRR’s warranty claim notice. The UPRR has also notified CXT that ties have failed a certain test that is specified in the 2005 contract.
Since late July 2011, the Company and CXT have been working with material scientists and prestressed concrete experts, who have been testing a representative sample of Grand Island concrete ties. While this testing is not complete, we have not identified any appreciable defects in workmanship. Additionally, a customer of the UPRR has claimed that a representative sample of ties manufactured by our Grand Island facility have failed a test contained in our product specification. As a result of this specific allegation, the UPRR has informed the Company that they currently intend to remove approximately 115,000 ties from track, which are a subset of ties subject to the July 12, 2011 claim. We are reviewing this claim and, while our review is not complete, we continue to believe that these ties do not have a material deviation from our contractual specifications. We expect that the testing required to address this product specification issue will be completed sometime during the latter part of the second quarter of 2012; however, we expect that we will continue to work collaboratively with the UPRR to address their overall product claim for some time to come.
On January 11, 2012, CXT received a subpoena from the United States Department of Transportation Inspector General (“IG”) requesting records related to its manufacture of concrete railroad ties in Grand Island, Nebraska. We believe that this subpoena relates to the same set of circumstances giving rise to the UPRR product claim. CXT and the Company intend to cooperate fully with the IG. We cannot predict what impact, if any, this investigation will have on the UPRR’s product claim.
Based on the non-specific nature of the UPRR’s assertion and our current inability to verify the claims, we are unable to determine a range of reasonably possible outcomes regarding this potential exposure matter. As a result, no accruals were made as a result of this claim as the impact, if any, cannot be reasonably estimated at this time. No assurances can be given regarding the ultimate outcome of this matter. The ultimate resolution of this matter could have a material, adverse impact on our financial statements, results of operations, liquidity and capital resources.
Portec acquisition
Included in our 2011 Rail Products Segment are the results of operations for our Portec subsidiary. We acquired Portec on December 15, 2010 for approximately $113.3 million in cash. Portec reported net sales of $106.1 million, gross profit of $36.0 million, total expenses of $25.3 million and net income of $8.6 million for the year ended December 31, 2011. The 2010 acquisition period consisted of approximately two weeks from the acquisition date through December 31, 2010. Therefore, the results of operations portion of Management’s Discussion and Analysis of Financial Condition and Results of Operations will not include a substantive comparison of the Portec results. Portec contributed $4.8 million in net sales, $0.6 million in gross profit and a net loss of $(0.2) million in the two week period from the acquisition date through December 31, 2010.
Other Matters
We recorded incremental warranty charges of approximately $1.8 million during the 2011 fourth quarter, a portion of which was related to a product issue with a transit authority and the remainder for concrete ties based on historical claim experience. No charges have been recorded related specifically for the UPRR product claim dated July 12, 2011. These charges were recorded within cost of goods sold and reported through our Rail Products segment.
During 2011, we provided the lessor of our Houston, TX property with written notice of our termination of the lease in its entirety effective April 30, 2012. As a result of this termination, we recognized $577,000 of previously deferred gain. At December 31, 2011, approximately $457,000 of unrecognized deferred gain is being amortized over the remaining life of the lease.
General
L.B. Foster Company is a leading manufacturer, fabricator and distributor of products and services for the rail, construction, energy and utility markets. The Company is comprised of three business segments: Rail products, Construction products and Tubular products.
Rail Products
The Rail products segment is composed of several manufacturing and distribution businesses that provide a variety of products for railroads, transit authorities, industrial companies and mining applications throughout North America and the United Kingdom. Rail products has sales offices throughout the United States, Canada and the United Kingdom and frequently bids on rail projects where it can offer products manufactured by the Company or sourced from numerous suppliers. These products may be provided as a package to rail lines, transit authorities and construction contractors which reduces the customer’s procurement efforts and provides value added, just in time delivery.
The Rail products segment designs and manufactures bonded insulated rail joints, cuts and drills rail and manufactures concrete cross ties and turnout ties. The Company has concrete tie manufacturing facilities in Spokane, WA and Tucson, AZ. The Company also has two facilities that design, test and fabricate rail products in Atlanta, GA and Niles, OH.
Through our Portec subsidiary, we engineer, manufacture and assemble friction management products, railway wayside data collection and management systems and engineer and sell securement systems and related products.
The Rail distribution business provides our customers with access to a variety of products including stick rail, continuous welded rail, specialty trackwork, power rail and various rail accessories. This is a highly competitive business that, once specifications are met, depends heavily on pricing. The Company maintains relationships with several rail manufacturers but procures the majority of the rail it distributes from one supplier. Rail accessories are sourced from a wide variety of suppliers.
Construction Products
The Construction products segment is composed of the following business units: piling, fabricated products, and precast concrete buildings.
The piling division, via a sales force deployed throughout the United States, markets and sells piling internationally. This division offers its customers various types and dimensions of structural beam piling, sheet piling, and pipe piling. These piling products are sourced from various suppliers. The Company is the primary distributor of domestic bearing pile and sheet piling for its primary supplier.
The fabricated products unit manufactures a number of fabricated steel and aluminum products primarily for the highway, bridge and transit industries including grid reinforced concrete deck and open steel grid flooring systems, guardrails, and expansion joints and heavy structural steel fabrications.
The precast concrete buildings unit manufactures concrete buildings for national, state and municipal parks. This unit manufactures restrooms, concession stands and other protective storage buildings available in multiple designs, textures and colors. The Company believes it is the leading high-end supplier in terms of volume, product options and capabilities. The buildings are manufactured in Spokane, WA and Hillsboro, TX.
Tubular Products
The Tubular products segment has two discrete business units: coated pipe and threaded products.
The coated pipe unit, located in Birmingham, AL, coats the outer dimension and, to a lesser extent, the inner dimension of pipe primarily for the gas transmission and, to a much lesser extent, oil transmission industries. Coated pipe partners with its primary customer, a pipe manufacturer, to market fusion bonded epoxy coatings, abrasion resistant coatings and internal linings for a wide variety of pipe dimensions for pipeline projects throughout North America.
The threaded products unit, located in Magnolia, TX, cuts, threads and paints pipe primarily for water well applications for the agriculture industry and municipal water authorities.
Joint Venture
In May 2009, the Company completed the formation of a joint venture with L B Industries, Inc. for a period of 9.5 years. The Company and L B Industries each have a 45% ownership interest in the joint venture (JV), L B Pipe & Coupling Products, LLC. The Company has made all of its mandatory capital contributions under the joint venture agreement totaling $3.0 million.
This venture commenced operations in 2010 and manufactures, markets and sells various products for the energy, utility and construction markets.
Critical Accounting Policies and Estimates
The Company’s significant accounting policies are described in Note 1 to the consolidated financial statements. The accompanying consolidated financial statements have been prepared in conformity with accounting principles generally accepted in the United States. When more than one accounting principle, or the method of its application, is generally accepted, management selects the principle or method that is appropriate in the Company’s specific circumstance. Application of these accounting principles requires management to make estimates that affect the reported amount of assets, liabilities, revenues, and expenses, and the related disclosure of contingent assets and liabilities. The following critical accounting policies relate to the Company’s more significant judgments and estimates used in the preparation of its consolidated financial statements. There can be no assurance that actual results will not differ from those estimates.
Goodwill –
Goodwill is required to be tested for impairment at least annually. The Company performs its annual impairment test as of October 1
st
and more frequently when indicators of impairment are present. The goodwill impairment test involves comparing the fair value of a reporting unit to its carrying value, including goodwill. If the carrying amount of the reporting unit exceeds its fair value, a second step is required to measure the goodwill impairment loss. This step compares the implied fair value of the reporting unit’s goodwill to the carrying amount of that goodwill. If the carrying amount of the goodwill exceeds the implied fair value of the goodwill, an impairment loss equal to the excess is recorded as a component of continuing operations. The Company uses a combination of market approach and a discounted cash flow model (DCF model) to determine the current fair value of the business. A number of significant assumptions and estimates are involved in the application of the DCF model to forecast operating cash flows, including markets and market share, sales volume and pricing, costs to produce and working capital changes. The Company considers historical experience and available information at the time the fair values of its business are estimated. However, actual amounts realized may differ from those used to evaluate the impairment of goodwill.
If actual results are not consistent with our assumptions and judgments used in estimating future cash flows and asset fair values, the Company may be exposed to impairment losses that could be material to our results of operations. There were no goodwill impairments recorded during the three years ended December 31, 2011.
Asset impairment –
The Company is required to test for asset impairment whenever events or changes in circumstances indicate that the carrying value of an asset might not be recoverable. The Company applies the guidance in FASB ASC 360-10-35, and related guidance, in order to determine whether or not an asset is impaired. This guidance indicates that if the sum of the future expected cash flows associated with an asset, undiscounted and without interest charges, is less than the carrying value, an asset impairment must be recognized in the financial statements. The amount of the impairment is the difference between the fair value of the asset and the carrying value of the asset. The Company believes that the accounting estimate related to asset impairment is a “critical accounting estimate” as it is highly susceptible to change from period to period and because it requires management to make assumptions about the existence of impairment indicators and cash flows over future years. These assumptions impact the amount of an impairment, which would have an impact on the income statement. There were no asset impairments recorded during the three years ended December 31, 2011.
Allowance for Bad Debts –
The Company’s operating segments encounter risks associated with the collection of accounts receivable. As such, the Company records a monthly provision for accounts receivable that are deemed uncollectible. In order to calculate the appropriate monthly provision, the Company reviews its accounts receivable aging and calculates an allowance through application of historic reserve factors to overdue receivables. This calculation is supplemented by specific account reviews performed by the Company’s credit department. As necessary, the application of the Company’s allowance rates to specific customers is reviewed and adjusted to more accurately reflect the credit risk inherent within that customer relationship. The reserve is reviewed on a monthly basis. An account receivable is written off against the allowance when management determines it is uncollectible.
The Company believes that the accounting estimate related to the allowance for bad debts is a “critical accounting estimate” because the underlying assumptions used for the allowance can change from period to period and the allowance could potentially cause a material impact to the income statement. Specific customer circumstances and general economic conditions may vary significantly from management’s assumptions and may impact expected earnings. At December 31, 2011 and 2010, the Company maintained an allowance for bad debts of $1.8 million and $1.6 million, respectively.
Product Warranty –
The Company maintains a current warranty for the repair or replacement of defective products. For certain manufactured products, an accrual is made on a monthly basis as a percentage of cost of sales. For long-term construction projects, a warranty is established when the claim is known and quantifiable. The product warranty accrual is periodically adjusted based on the identification or resolution of known individual product warranty claims. The Company believes that this is a “critical accounting estimate” because the underlying assumptions used to calculate the warranty can change from period to period. At December 31, 2011 and 2010, the product warranty was $6.6 million and $4.4 million, respectively. For additional information regarding the Company’s product warranty, refer to Part II, Item 8, Footnote 21 “Commitments and Contingent Liabilities.”
Slow-Moving Inventory –
Slow-moving inventory is reviewed and adjusted routinely, taking into account numerous factors such as quantities-on-hand versus turnover, product knowledge, and physical inventory observations. This review is performed on a specific product basis and effectively establishes a new cost for the underlying product. The Company believes this is a “critical accounting estimate” because the underlying assumptions can change from period to period and could have a material impact on the income statement.
Revenue Recognition –
The Company’s revenues are composed of product sales and products and services provided under long-term contracts. For product sales, the Company recognizes revenue upon transfer of title to the customer. Title generally passes to the customer upon shipment. In limited cases, title does not transfer and revenue is not recognized until the customer has received the products at its physical location. Shipping and handling costs are included in cost of goods sold. Revenues for products under long-term contracts are generally recognized using the percentage-of-completion method based upon the proportion of actual costs incurred to estimated total costs. For certain products, the percentage of completion is based upon actual labor costs to estimated total labor costs. Revenues recognized using percentage of completion were less than 10% of the Company’s consolidated revenues for the year ended December 31, 2011. With the addition of Portec, the contribution of revenues recognized using percentage of completion is expected to continue to decline in future periods.
Pension Plans –
The calculation of the Company’s net periodic benefit cost (pension expense) and benefit obligation (pension liability) associated with its defined benefit pension plans (pension plans) requires the use of a number of assumptions that the Company deems to be “critical accounting estimates.” Changes in these assumptions can result in a different pension expense and liability amounts, and future actual experience can differ significantly from the assumptions. The Company believes that the two most critical assumptions are the expected long-term rate of return on plan assets and the assumed discount rate.
The expected long-term rate of return reflects the average rate of earnings expected on funds invested or to be invested in the pension plans to provide for the benefits included in the pension liability. The Company establishes the expected long-term rate of return at the beginning of each fiscal year based upon information available to the Company at that time, including the plan’s investment mix and the forecasted rates of return on these types of securities. Any differences between actual experience and assumed experience are deferred as an unrecognized actuarial gain or loss. The unrecognized actuarial gains or losses are amortized in accordance with applicable guidance, generally FASB ASC 712, “Compensation – Nonretirement postemployment benefits.” The weighted average expected long-term rate of return determined by the Company for 2011 and 2010 pension expense was 6.70% and 7.75%, respectively. Pension expense increases as the expected long-term rate of return decreases.
The assumed discount rate reflects the current rate at which the pension benefits could effectively be settled. In estimating that rate, applicable guidance requires that the Company looks to rates of return on high quality, fixed income investments. The Company’s pension liability increases as the discount rate is reduced. Therefore, the decline in the assumed discount rate has the effect of increasing the Company’s pension obligation and future pension expense. The weighted average assumed discount rate used by the Company was 4.50% and 5.50%, respectively, as of December 31, 2011 and 2010.
Deferred Tax Assets –
The recognition of deferred tax assets requires management to make judgments regarding the future realization of these assets. As prescribed by FASB ASC 740, “Income Taxes,” valuation allowances must be provided for those deferred tax assets for which it is more likely than not (a likelihood more than 50%) that some portion or all of the deferred tax assets will not be realized. This guidance requires management to evaluate positive and negative evidence regarding the recoverability of deferred tax assets. Determination of whether the positive evidence outweighs the negative and quantification of the valuation allowance requires management to make estimates and judgments of future financial results. The Company believes that these estimates and judgments are “critical accounting estimates.”
The Company evaluates all tax positions taken on the state and federal tax filings to determine if the position is more likely than not to be sustained upon examination. For positions that meet the more likely than not to be sustained criteria, an evaluation to determine the largest amount of benefit, determined on a cumulative probability basis that is more likely than not to be realized upon ultimate settlement, is determined. A previously recognized tax position is derecognized when it is subsequently determined that a tax position no longer meets the more likely than not threshold to be sustained. The evaluation of the sustainability of a tax position and the probable amount that is more likely than not is based on judgment, historical experience and on various other assumptions. The results of these estimates, that are not readily apparent from other sources, form the basis for recognizing an uncertain tax position liability. Actual results could differ from those estimates upon subsequent resolution of identified matters.
Refer to Part II, Item 8, Footnote 15, “Income Taxes.” The Company’s ability to realize these tax benefits may affect the Company’s reported income tax expense and net income.
Contingencies
– The Company is currently involved in certain legal proceedings. When a probable, estimable exposure exists, the Company accrues the estimate of the probable costs for the resolution of these matters. These estimates have been developed in consultation with legal counsel involved in the defense of these matters and are based upon an analysis of potential results, assuming a combination of litigation and settlement strategies. Future results of operations could be materially affected by changes in our assumptions or the outcome of these proceedings.
The Company’s operations are subject to national, state, foreign, provincial, and/or local laws and regulations that impose limitations and prohibitions on the discharge and emission of, and establish standards for the use, disposal, and management of, regulated materials and waste, and that impose liability for the costs of investigating and cleaning up, and damages resulting from, present and past spills, disposals, or other releases of hazardous substances or materials. Liabilities are recorded when remedial efforts are probable and the costs can be reasonably estimated. Estimates are not reduced by potential claims for recovery. Claims for recovery are recognized as agreements are reached with third parties or as amounts are received. Established reserves are periodically reviewed and adjusted to reflect current remediation progress, prospective estimates of required activity, and other factors that may be relevant, including changes in technology or regulations. As of December 31, 2011 and 2010, the Company maintained environmental and legal contingency reserves approximating $2.2 million and $2.8 million, respectively.
Refer to Part II, Item 8, Footnote 21, “Commitments and Contingent Liabilities.”
New Accounting Pronouncements
In June 2011, the FASB issued ASU No. 2011-05, “Comprehensive Income (Topic 220): Presentation of Comprehensive Income.” This guidance will require companies to present the components of net income and other comprehensive income either as one continuous statement or as two consecutive statements. It eliminates the option to present components of other comprehensive income as part of the statement of changes in stockholders’ equity. The standard does not change the items which must be reported in other comprehensive income, how such items are measured or when they must be reclassified to net income. The update is effective for interim and annual periods beginning after December 15, 2011. The guidance will have no impact on the Company’s financial condition or results of operations.
Quarterly Results of Operations
|
Three Months Ended
|
Percent of Total Net Revenues
|
Percent
|
|||||||||||||||||||
|
December 31,
|
Three Months Ended December 31,
|
Increase/(Decrease)
|
|||||||||||||||||||
|
2011
|
2010
|
2011
|
2010
|
2011 vs. 2010
|
|||||||||||||||||
|
Dollars in thousands
|
|||||||||||||||||||||
|
Net Sales:
|
|||||||||||||||||||||
|
Rail Products
|
$ | 76,054 | $ | 63,598 | 55.4 | % | 43.0 | % | 19.6 | % | |||||||||||
|
Construction Products
|
53,077 | 77,365 | 38.6 | 52.3 | (31.4 | ) | |||||||||||||||
|
Tubular Products
|
8,288 | 7,020 | 6.0 | 4.7 | 18.1 | ||||||||||||||||
|
Total Net Sales
|
$ | 137,419 | $ | 147,983 | 100.0 | % | 100.0 | % | (7.1 | ) % | |||||||||||
|
Three Months Ended
|
Gross Profit Percentage
|
Percent
|
|||||||||||||||||||
|
December 31,
|
Three Months Ended December 31,
|
Increase/(Decrease)
|
|||||||||||||||||||
| 2011 | 2010 | 2011 | 2010 |
2011 vs. 2010
|
|||||||||||||||||
|
Dollars in thousands
|
|||||||||||||||||||||
|
Gross Profit:
|
|||||||||||||||||||||
|
Rail Products
|
$ | 17,098 | $ | 7,837 | 22.5 | % | 12.3 | % | 118.2 | % | |||||||||||
|
Construction Products
|
9,015 | 11,580 | 17.0 | 15.0 | (22.2 | ) | |||||||||||||||
|
Tubular Products
|
2,706 | 1,830 | 32.6 | 26.1 | 47.9 | ||||||||||||||||
|
LIFO (Expense)/Credit
|
(1,042 | ) | 852 | (0.8 | ) | 0.6 | (222.3 | ) | |||||||||||||
|
Other (Expense)/Income
|
(165 | ) | 54 | (0.1 | ) | 0.0 | ** | ||||||||||||||
|
Total Gross Profit
|
$ | 27,612 | $ | 22,153 | 20.1 | % | 15.0 | % | 24.6 | % | |||||||||||
|
Three Months Ended
|
Percent of Total Net Revenues
|
Percent
|
|||||||||||||||||||
|
December 31,
|
Three Months Ended December 31,
|
Increase/(Decrease)
|
|||||||||||||||||||
| 2011 | 2010 | 2011 | 2010 |
2011 vs. 2010
|
|||||||||||||||||
|
Dollars in thousands
|
|||||||||||||||||||||
|
Expenses:
|
|||||||||||||||||||||
|
Selling and Administrative Expenses
|
$ | 17,548 | $ | 12,510 | 12.8 | % | 8.5 | % | 40.3 | % | |||||||||||
|
Amortization Expense
|
701 | 253 | 0.5 | 0.2 | 177.1 | ||||||||||||||||
|
Interest Expense
|
179 | 306 | 0.1 | 0.2 | (41.5 | ) | |||||||||||||||
|
Interest Income
|
(97 | ) | (108 | ) | (0.1 | ) | (0.1 | ) | (10.2 | ) | |||||||||||
|
Equity in Gains of Nonconsolidated Investments
|
(138 | ) | (59 | ) | (0.1 | ) | (0.0 | ) | ** | ||||||||||||
|
Loss on Foreign Exchange
|
248 | 82 | 0.2 | 0.1 | ** | ||||||||||||||||
|
Gain on Marketable Securities
|
0 | (1,364 | ) | 0.0 | (0.9 | ) | ** | ||||||||||||||
|
Other Income
|
(365 | ) | (79 | ) | (0.3 | ) | (0.1 | ) | ** | ||||||||||||
|
Total Expenses
|
18,076 | 11,541 | 13.2 | % | 7.8 | % | 56.6 | % | |||||||||||||
|
Income Before Income Taxes
|
9,536 | 10,612 | 6.9 | % | 7.2 | % | (10.1 | ) % | |||||||||||||
|
Income Tax Expense
|
3,433 | 4,373 | 2.5 | 3.0 | (21.5 | ) | |||||||||||||||
|
Net Income
|
$ | 6,103 | $ | 6,239 | 4.4 | % | 4.2 | % | (2.2 | ) % | |||||||||||
| ** |
Results of calculation are not meaningful for presentation purposes.
|
||||||||||||||||||||
Fourth Quarter 2011 Compared to Fourth Quarter 2010 – Company Analysis
Diluted earnings per share for the fourth quarter of 2011 were $0.60, even with diluted earnings per share for the fourth quarter of 2010. Both gross profit and gross profit margin increased due to the inclusion of Portec’s results, partially offset by an unfavorable LIFO charge to gross profit during the current period. This similar adjustment for LIFO reserve requirements had a positive impact for the prior year period.
The addition of Portec resulted in increased selling and administrative expenses of approximately $4.9 million. Exclusive of the impact of Portec, selling and administrative expenses in the 2011 period increased approximately $0.2 million due mainly to approximately $1.4 million in testing expenses for material scientists and prestressed concrete experts related to the UPRR product warranty claim.
As a result of the acquisition of Portec, amortization expense increased by approximately $0.4 million and we recognized increased transactional foreign exchange losses for the three months ended December 31, 2011 primarily related to fluctuations in the exchange rates between the Canadian dollar and the United States dollar.
Also, we recognized more previously deferred gains associated with the early termination of a lease for our threaded products facility in Houston, TX. Finally, having a positive impact in the 2010 fourth quarter was the recognition of a $1.4 million pre-tax gain associated with the remeasurement of our holding of Portec equity securities prior to our December 15, 2010 acquisition.
The effective income tax rate in the fourth quarter of 2011 was 36.0% compared to 41.2% in the prior year quarter. The decrease was primarily due to lower statutory tax rates related to the foreign operations acquired in the Portec business combination.
Results of Operations – Segment Analysis
Rail Products
|
Three Months Ended
|
Percent
|
|||||||||||||||
|
December 31,
|
Increase/(Decrease)
|
Increase/(Decrease)
|
||||||||||||||
|
2011
|
2010
|
2011 vs. 2010
|
2011 vs. 2010
|
|||||||||||||
|
Dollars in thousands
|
||||||||||||||||
|
Net Sales
|
$ | 76,054 | $ | 63,598 | $ | 12,456 | 19.6 | % | ||||||||
|
Gross Profit
|
$ | 17,098 | $ | 7,837 | $ | 9,261 | 118.2 | % | ||||||||
|
Gross Profit Percentage
|
22.5 | % | 12.3 | % | 10.2 | % | 82.4 | % | ||||||||
Fourth Quarter 2011 Compared to Fourth Quarter 2010
Exclusive of the impact of Portec ($23.1 million), our Rail Products segment 2011 sales decreased approximately $10.6 million from the 2010 fourth quarter. While our operational tie plants both experienced concrete tie volume increases in the current quarter, they did not overcome the loss of sales from the closure of our Grand Island, NE facility. Additionally, our rail distribution business experienced a reduction in volumes sold, primarily from our decision to deemphasize the relay rail business. The 2010 quarter also included a large new rail project which was completed prior to the 2011 quarter.
Portec delivered approximately $10.2 million in gross profit increases, while Foster Rail gross profit decreased by $1.0 million. Exclusive of the impact of Portec, our Rail Products gross profit margin would have increased approximately 70 basis points as compared to the 2010 quarter.
Our transit products division drove this 2011 increase due mainly to product mix compared to the prior year quarter. Additionally, while our rail distribution business had reduced volumes, offsetting this were price increases which delivered gross profit margin expansion over the prior year period. Mitigating these favorable improvements were the adverse cost of sales charges recorded by CXT. Mainly related to our now closed Grand Island, NE facility, this division recorded additional concrete tie warranty charges of approximately $1.8 million in the 2011 quarter, a portion of which was related to a product issue with a transit authority and the remainder for concrete ties based on historical claim experience. No charges have been recorded related specifically for the UPRR product claim described previously.
Construction Products
|
Three Months Ended
|
Percent
|
|||||||||||||||
|
December 31,
|
Increase/(Decrease)
|
Increase/(Decrease)
|
||||||||||||||
|
2011
|
2010
|
2011 vs. 2010
|
2011 vs. 2010
|
|||||||||||||
|
Dollars in thousands
|
||||||||||||||||
|
Net Sales
|
$ | 53,077 | $ | 77,365 | $ | (24,288 | ) | (31.4 | )% | |||||||
|
Gross Profit
|
$ | 9,015 | $ | 11,580 | $ | (2,565 | ) | (22.2 | )% | |||||||
|
Gross Profit Percentage
|
17.0 | % | 15.0 | % | 2.0 | % | 13.5 | % | ||||||||
Fourth Quarter 2011 Compared to Fourth Quarter 2010
Our Construction Products backlog has been approximately 30-35% lower over the last few quarters. Additionally, new orders in the 2011 fourth quarter have decreased approximately 26.2% from the 2010 period. These cumulative effects have resulted in negative impacts on sales and gross profit in the current quarter.
The 2011 fourth quarter sales were negatively impacted by lower piling volumes and, to a lesser extent, lower concrete buildings volumes. The loss of federal stimulus spending led to more normalized sales of concrete buildings, a decrease of approximately 48% over the 2010 quarter.
Product mix within our piling division had an unfavorable impact on the prior year quarter, but drove the overall increase in gross profit margin for the segment in 2011. This margin increase, albeit over decreased volumes, fully offset margin declines in our concrete buildings division due to increased unfavorable manufacturing variances resulting from reduced sales volumes.
Tubular Products
|
Three Months Ended
|
Percent
|
|||||||||||||||
|
December 31,
|
Increase/(Decrease)
|
Increase/(Decrease)
|
||||||||||||||
|
2011
|
2010
|
2011 vs. 2010
|
2011 vs. 2010
|
|||||||||||||
|
Dollars in thousands
|
||||||||||||||||
|
Net Sales
|
$ | 8,288 | $ | 7,020 | $ | 1,268 | 18.1 | % | ||||||||
|
Gross Profit
|
$ | 2,706 | $ | 1,830 | $ | 876 | 47.9 | % | ||||||||
|
Gross Profit Percentage
|
32.6 | % | 26.1 | % | 6.6 | % | 25.2 | % | ||||||||
Fourth Quarter 2011 Compared to Fourth Quarter 2010
The improvement in the 2011 quarter was driven by our coated pipe division. Increased sales volumes allowed us to leverage plant and other operating efficiencies in the 2011 quarter. Our threaded products division sales and gross profit were flat with the prior year period, however gross profit margin was negatively impacted by expenses associated with moving the threading operation from Houston, TX to Magnolia, TX.
Year-to-date Results of Operations
|
Twelve Months Ended
|
Percent of Total Net Revenues
|
Percent
|
|||||||||||||||||||||||||||||||
|
December 31,
|
Year Ended December 31,
|
Increase/(Decrease)
|
|||||||||||||||||||||||||||||||
|
2011
|
2010
|
2009
|
2011
|
2010
|
2009
|
2011 vs. 2010
|
2010 vs. 2009
|
||||||||||||||||||||||||||
|
Dollars in thousands
|
|||||||||||||||||||||||||||||||||
|
Net Sales:
|
|||||||||||||||||||||||||||||||||
|
Rail Products
|
$ | 323,475 | $ | 212,240 | $ | 186,401 | 54.7 | % | 44.7 | % | 46.1 | % | 52.4 | % | 13.9 | % | |||||||||||||||||
|
Construction Products
|
234,981 | 235,591 | 196,480 | 39.8 | 49.6 | 48.6 | (0.3 | ) | 19.9 | ||||||||||||||||||||||||
|
Tubular Products
|
32,470 | 27,219 | 21,139 | 5.5 | 5.7 | 5.2 | 19.3 | 28.8 | |||||||||||||||||||||||||
|
Total Net Sales
|
$ | 590,926 | $ | 475,050 | $ | 404,020 | 100.0 | % | 100.0 | % | 100.0 | % | 24.4 | % | 17.6 | % | |||||||||||||||||
|
Twelve Months Ended
|
Gross Profit Percentage
|
Percent
|
|||||||||||||||||||||||||||||||
|
December 31,
|
Year Ended December 31,
|
Increase/(Decrease)
|
|||||||||||||||||||||||||||||||
| 2011 | 2010 | 2009 | 2011 | 2010 | 2009 |
2011 vs. 2010
|
2010 vs. 2009
|
||||||||||||||||||||||||||
|
Dollars in thousands
|
|||||||||||||||||||||||||||||||||
|
Gross Profit:
|
|||||||||||||||||||||||||||||||||
|
Rail Products
|
$ | 60,263 | $ | 27,352 | $ | 16,056 | 18.6 | % | 12.9 | % | 8.6 | % | 120.3 | % | 70.4 | % | |||||||||||||||||
|
Construction Products
|
36,687 | 40,381 | 33,390 | 15.6 | 17.1 | 17.0 | (9.1 | ) | 20.9 | ||||||||||||||||||||||||
|
Tubular Products
|
8,850 | 5,782 | 1,148 | 27.3 | 21.2 | 5.4 | 53.1 | 403.7 | |||||||||||||||||||||||||
|
LIFO (Expense)/Credit
|
(2,183 | ) | 2,276 | 11,039 | (0.4 | ) | 0.5 | 2.7 | (195.9 | ) | (79.4 | ) | |||||||||||||||||||||
|
Other
|
(1,465 | ) | (1,208 | ) | (1,775 | ) | (0.2 | ) | (0.3 | ) | (0.4 | ) | 21.3 | (31.9 | ) | ||||||||||||||||||
|
Total Gross Profit
|
$ | 102,152 | $ | 74,583 | $ | 59,858 | 17.3 | % | 15.7 | % | 14.8 | % | 37.0 | % | 24.6 | % | |||||||||||||||||
|
Twelve Months Ended
|
Percent of Total Net Revenues
|
Percent
|
|||||||||||||||||||||||||||||||
|
December 31,
|
Year Ended December 31,
|
Increase/(Decrease)
|
|||||||||||||||||||||||||||||||
| 2011 | 2010 | 2009 | 2011 | 2010 | 2009 |
2011 vs. 2010
|
2010 vs. 2009
|
||||||||||||||||||||||||||
|
Dollars in thousands
|
|||||||||||||||||||||||||||||||||
|
Expenses:
|
|||||||||||||||||||||||||||||||||
|
Selling and Administrative Expenses
|
$ | 67,238 | $ | 42,143 | $ | 35,488 | 11.4 | % | 8.9 | % | 8.8 | % | 59.5 | % | 18.8 | % | |||||||||||||||||
|
Amortization Expense
|
2,818 | 445 | 13 | 0.5 | 0.1 | 0.0 | ** | ** | |||||||||||||||||||||||||
|
Interest Expense
|
622 | 1,003 | 1,292 | 0.1 | 0.2 | 0.3 | (38.0 | ) | (22.4 | ) | |||||||||||||||||||||||
|
Interest Income
|
(321 | ) | (403 | ) | (789 | ) | (0.1 | ) | (0.1 | ) | (0.2 | ) | ** | ** | |||||||||||||||||||
|
Equity in (Gains)/ Losses of Nonconsolidated Investment
|
(708 | ) | 213 | 0 | (0.1 | ) | 0.0 | 0.0 | ** | ** | |||||||||||||||||||||||
|
Gain on Marketable Securities
|
0 | (1,364 | ) | (1,194 | ) | 0.0 | (0.3 | ) | (0.3 | ) | ** | ** | |||||||||||||||||||||
|
(Gain)/Loss on Foreign Exchange
|
(245 | ) | 82 | 0 | 0.0 | 0.0 | 0.0 | ** | ** | ||||||||||||||||||||||||
|
Other Income
|
(1,191 | ) | (278 | ) | (435 | ) | (0.2 | ) | (0.1 | ) | (0.1 | ) | ** | ** | |||||||||||||||||||
|
Total Expenses
|
68,213 | 41,841 | 34,375 | 11.5 | % | 8.8 | % | 8.5 | % | 63.0 | % | 21.7 | % | ||||||||||||||||||||
|
Income Before Income Taxes
|
33,939 | 32,742 | 25,483 | 5.7 | % | 6.9 | % | 6.3 | % | 3.7 | % | 28.5 | % | ||||||||||||||||||||
|
Income Tax Expense
|
11,044 | 12,250 | 9,756 | 1.9 | 2.6 | 2.4 | (9.8 | ) | 25.6 | ||||||||||||||||||||||||
|
Net Income
|
$ | 22,895 | $ | 20,492 | $ | 15,727 | 3.9 | % | 4.3 | % | 3.9 | % | 11.7 | % | 30.3 | % | |||||||||||||||||
| ** |
Results of calculation are not material for presentation purposes.
|
||||||||||||||||||||||||||||||||
The Year 2011 Compared to the Year 2010 – Company Analysis
Diluted earnings per share for 2011 were $2.22 which compares favorably to diluted earnings per share of $1.98 for 2010. Gross Profit increased due to the inclusion of Portec’s results for the full year in 2011, partially offset by significantly reduced gross profits at our concrete buildings division and also to the charges taken related to our Grand Island concrete tie manufacturing facility.
Approximately $22.1 million of the increase in selling and administrative expenses relates to Portec. Exclusive of the impact of Portec, selling and administrative expenses in the 2011 period increased approximately $3.0 million due primarily to higher outside services expenses ($2.0 million) and higher salaries ($1.0 million). We recognized approximately $1.4 million for testing expenses associated with the UPRR product warranty claim, $1.5 million in Portec integration costs and $0.5 million associated with other outside service providers in 2011. These increased expenses offset the elimination of the approximately $2.4 million in acquisition costs we recognized during 2010.
The acquisition of Portec led to the increase in amortization expense and our recognition of transactional foreign exchange gains.
Included in net income for the current period is our 45% share of the income from our equity investment in the JV, which is reported as “Equity in (Income)/Loss of Nonconsolidated Investment.” As the JV had not yet commenced significant revenue-generating activities, we recorded our share of its start-up related expenses in 2010.
The increased amount we recognized during 2011 from the deferred gain related to a revision in the remaining term of the operating lease associated with our Houston, TX sale-leaseback transaction mitigated the reduction in pre-tax gains we recognized in connection with our acquisition of Portec.
The effective income tax rate for 2011 was 32.5% compared to 37.4% in 2010. The decrease was primarily due to lower statutory tax rates related to the foreign operations acquired in the Portec business combination, the release of $0.1 million of reserves for uncertain tax positions due to the expiration of the statute of limitations and the receipt of $0.9 million in certain state income tax refunds.
The Year 2010 Compared to the Year 2009 – Company Analysis
Net income for 2010 was $1.98 per diluted share, compared to net income of $1.53 per diluted share for 2009. While 2009 included a pre-tax gain of $1.2 million on the sale of a portion of our investment in Portec, 2010 included a pre-tax gain of $1.4 million recognized on the remaining available-for-sale investment due to the requirement to remeasure its fair value on the acquisition date. The 2010 improvement in gross profit is due, in part, to negative adjustments of approximately $5.3 million taken in the 2009 period related to concrete tie issues as well as a significant 2010 improvement in manufacturing variances. Gross profit also increased over 2009 due to a favorable $1.8 million resolution of a supply chain dispute. We account for a portion of our inventory under the LIFO method. The LIFO reserve requirements can be positively or negatively impacted by falling or rising prices. The credit to gross profit resulting from this LIFO adjustment was $8.8 million lower in 2010 than in 2009, as there was greater price volatility in the prior year.
The foremost causes of the increased selling and administrative costs for the 2010 year-to-date period were $2.4 million for acquisition costs, $2.1 million for compensation expenses and $0.8 million for bad debt expense, due to a recovery recorded in 2009.
For 2010, we recorded a $0.2 million loss from our JV equity method investment. Our effective income tax rate for the 2010 period, 37.4% decreased compared to the 2009 period, 38.3%, due to increased domestic manufacturing credits partially offset by certain acquisition costs that were not deductible for tax purposes.
Results of Operations – Segment Analysis
Rail Products
|
Twelve Months Ended
|
Percent
|
|||||||||||||||||||||||||||
|
December 31,
|
Increase/(Decrease)
|
Increase/(Decrease)
|
||||||||||||||||||||||||||
|
2011
|
2010
|
2009
|
2011 vs. 2010
|
2010 vs. 2009
|
2011 vs. 2010
|
2010 vs. 2009
|
||||||||||||||||||||||
|
Dollars in thousands
|
||||||||||||||||||||||||||||
|
|
||||||||||||||||||||||||||||
|
Net Sales
|
$ | 323,475 | $ | 212,240 | $ | 186,401 | $ | 111,235 | $ | 25,839 | 52.4 | % | 13.9 | % | ||||||||||||||
|
|
||||||||||||||||||||||||||||
|
Gross Profit
|
$ | 60,263 | $ | 27,352 | $ | 16,056 | $ | 32,911 | $ | 11,296 | 120.3 | % | 70.4 | % | ||||||||||||||
|
Gross Profit Percentage
|
18.6 | % | 12.9 | % | 8.6 | % | 5.7 | % | 4.3 | % | 44.6 | % | 49.6 | % | ||||||||||||||
The Year 2011 Compared to the Year 2010
Our acquisition of Portec increased our Rail Products segment 2011 sales by approximately $101.3 million. Exclusive of the impact of Portec, our Rail Products segment 2011 sales increased approximately $9.9 million over the 2010 period. Improved sales volumes within our rail distribution business led the segment’s sales growth. While both of our operational tie plants had volume increases yielding sales growth of at least 40.0%, they could not overcome the loss of sales due to the closure of our Grand Island, NE facility. This negative impact on segment sales partially mitigated the favorable growth from our rail distribution business.
Portec is responsible for the increase in our Rail Products segment gross profit margin. Exclusive of the impact of Portec, our Rail Products gross profit margin would have decreased to 11.2% from 12.9% in 2010. This decrease is related to the adverse charges we recorded related to our exit from Grand Island, NE and adjustments to tie warranty based on historical claim experience. While none of these charges relate to the UPRR product warranty claim dated July 12, 2011 and related matters, a summary of the 2011 charges we recorded include:
|
·
|
$3.0 million to fulfill a customer contractual obligation,
|
|
·
|
$2.3 million for concrete tie warranty reserve requirements,
|
|
·
|
$0.8 million for unsalable inventory, and
|
|
·
|
$1.2 million for concrete ties supplied to a Midwestern transit agency.
|
Excluding these charges and the accretive impact of Portec, our Rail Products segment would have reported increased gross profit.
We believe that slowly but steadily increasing rail traffic and strong forecasted spending by the Class 1 Railroads bode well for continued strong results in our Rail Products segment and we will continue to work collaboratively with the UPRR in an effort to bring it’s product warranty claim to a satisfactory resolution.
The Year 2010 Compared to the Year 2009
The leader of sales growth within our Rail Products segment was our CXT concrete tie division. In addition to increased purchases by the UPRR in 2010, prior year sales by this division were reduced by $2.8 million when the UPRR refused to accept certain ties produced at our Grand Island, NE facility due to the alleged quality of certain raw materials used in the manufacturing process. Both our ARP and transit divisions benefitted from improved volumes over the prior year period. Finally, our new Portec subsidiary contributed $4.8 million in additional net sales since the acquisition date.
Improvements in our Rail Products gross profit were due primarily to 2009 charges of $5.3 million related to concrete tie issues. Gross profit also increased over 2009 due to a favorable $1.8 million resolution of a supply chain dispute. Additionally, improvements in selling margins including improved material variances, as well as improved manufacturing variances, had a positive impact on 2010 reported results. Lastly, while Portec increased our Rail Products segment gross profit by approximately $0.6 million, it had no impact on our gross profit margin. Portec’s gross profit included an increase to cost of goods sold of $0.8 million related to recognition of a portion of the inventory step-up to fair value from Portec’s purchase price allocation.
Excluding the $5.3 million in concrete tie gross profit charges, our Rail Products segment gross profit would have increased approximately 140 basis points compared to the 2009 period.
Construction Products
|
Twelve Months Ended
|
Percent
|
|||||||||||||||||||||||||||
|
December 31,
|
Increase/(Decrease)
|
Increase/(Decrease)
|
||||||||||||||||||||||||||
|
2011
|
2010
|
2009
|
2011 vs. 2010
|
2010 vs. 2009
|
2011 vs. 2010
|
2010 vs. 2009
|
||||||||||||||||||||||
|
Dollars in thousands
|
||||||||||||||||||||||||||||
|
|
||||||||||||||||||||||||||||
|
Net Sales
|
$ | 234,981 | $ | 235,591 | $ | 196,480 | $ | (610 | ) | $ | 39,111 | (0.3 | )% | 19.9 | % | |||||||||||||
|
|
||||||||||||||||||||||||||||
|
Gross Profit
|
$ | 36,687 | $ | 40,381 | $ | 33,390 | $ | (3,694 | ) | $ | 6,991 | (9.1 | )% | 20.9 | % | |||||||||||||
|
Gross Profit Percentage
|
15.6 | % | 17.1 | % | 17.0 | % | (1.5 | )% | 0.1 | % | (8.9 | )% | 0.9 | % | ||||||||||||||
The Year 2011 Compared to the Year 2010
2011 was a mixed year for our Construction Products Segment with our piling and fabricated bridge division’s growth in sales being entirely offset by declines in our concrete buildings division. The growth in piling was almost entirely due to increased volumes while 2011 was a record sales year for our fabricated bridge division. However, in the absence of federal stimulus legislation, our concrete buildings division returned to normalized levels, having decreased approximately 40.8% from the 2010 period.
Our 2011 Construction Products Segment’s gross profit margin declined due to the flat performance reported by our piling division and due to sales volume reductions within our concrete buildings division.
We continue to have a mixed outlook for the markets we participate in under our Construction Products segment. Our Piling backlog at December 31, 2011 is approximately 34% lower than last year and, while we do see certain projects moving forward, we expect every large project to be competitively bid. While we expect another strong year in our fabricated products business, the backlog in that business is also down substantially and there can be significant lead times between winning a project and commencing production. A number of other factors that may create further headwinds in these markets include:
|
|
·
|
Approximately 42 states currently have, or are projecting to have, fiscal year 2012 budget deficits.
|
|
|
·
|
2005 federal legislation, SAFETEA-LU, authorizing transportation construction funding which expired in September 2009 and has been temporarily extended through March 31, 2012.
|
The Year 2010 Compared to the Year 2009
All of the divisions within our Construction Products segment experienced strong sales increases in 2010. Our piling division’s robust 2010 growth in sales volumes of sheet piling more than offset any pricing declines experienced by other piling products. Additionally, our concrete building division, realizing benefits from Federal spending partially due to the stimulus legislation, delivered sales growth in 2010. Finally, our fabricated products division continued to benefit from customer preference for our bridge decking solution. While sales have improved somewhat in 2010 from their 2009 levels, the backlog within this division is up approximately 52% over 2009.
Our Construction Products gross profit margin improved in all divisions with the exception of piling. Our piling division has experienced margin compression due to an intensely competitive bidding environment and a weak industrial market.
Tubular Products
|
Twelve Months Ended
|
Percent
|
|||||||||||||||||||||||||||
|
December 31,
|
Increase/(Decrease)
|
Increase/(Decrease)
|
||||||||||||||||||||||||||
|
2011
|
2010
|
2009
|
2011 vs. 2010
|
2010 vs. 2009
|
2011 vs. 2010
|
2010 vs. 2009
|
||||||||||||||||||||||
|
Dollars in thousands
|
||||||||||||||||||||||||||||
|
|
||||||||||||||||||||||||||||
|
Net Sales
|
$ | 32,470 | $ | 27,219 | $ | 21,139 | $ | 5,251 | $ | 6,080 | 19.3 | % | 28.8 | % | ||||||||||||||
|
|
||||||||||||||||||||||||||||
|
Gross Profit
|
$ | 8,850 | $ | 5,782 | $ | 1,148 | $ | 3,068 | $ | 4,634 | 53.1 | % | 403.7 | % | ||||||||||||||
|
Gross Profit Percentage
|
27.3 | % | 21.2 | % | 5.4 | % | 6.0 | % | 15.8 | % | 28.3 | % | 291.2 | % | ||||||||||||||
The Year 2011 Compared to the Year 2010
Both our threaded products and coated products divisions reported strong growth in sales over 2010. The coated products sales increase was due to increased volumes, while threaded products growth was due to volume increases from successfully penetrating new sales markets.
Our threaded products division’s improvement drove the overall increase in gross profit margin. This growth came from improved volumes which favorably impacted manufacturing expenses. To a lesser extent, this division also was negatively impacted in 2010 by a decision to exit the micropile market.
We anticipate robust activity levels in both of our Tubular Products divisions throughout 2012.
The Year 2010 Compared to the Year 2009
The Tubular Products segment sales increase was driven primarily by our coated products division that rebounded from the recession driven downturn it experienced in 2009 as well as to sales increases in our threaded products division. Our Tubular Products 2010 gross profit was significantly improved as our threaded products division returned to profitability after being negatively impacted by reductions in pipe pricing, unfavorable manufacturing variances and slow moving inventory charges in the prior year period and, to a lesser extent, sales increases in our coated products division.
Liquidity and Capital Resources
The following table sets forth L.B. Foster’s capitalization:
|
December 31,
|
||||||||
|
2011
|
2010
|
|||||||
|
Debt:
|
In millions
|
|||||||
|
Capital leases
|
$ | 1.5 | $ | 2.9 | ||||
|
IDSI acquisition notes
|
0.9 | 1.9 | ||||||
|
Total Debt
|
2.4 | 4.8 | ||||||
|
Equity
|
269.8 | 255.7 | ||||||
|
Total Capitalization
|
$ | 272.2 | $ | 260.5 | ||||
The Company’s need for liquidity relates primarily to seasonal working capital requirements, capital expenditures, joint venture capital obligations, strategic acquisitions, debt service obligations, share repurchases and dividends.
The following table summarizes the impact of these items during the past three years:
|
December 31,
|
||||||||||||
|
2011
|
2010
|
2009
|
||||||||||
|
Liquidity needs:
|
In millions
|
|||||||||||
|
Working capital and other assets and liabilities
|
$ | (7.9 | ) | $ | 28.7 | $ | 2.9 | |||||
|
Common stock purchases
|
(6.5 | ) | - | (1.9 | ) | |||||||
|
Dividends paid to common shareholders
|
(1.0 | ) | - | - | ||||||||
|
Capital expenditures
|
(11.9 | ) | (6.2 | ) | (6.1 | ) | ||||||
|
Acquisitions, net of cash acquired
|
(9.0 | ) | (90.8 | ) | - | |||||||
|
Capital contributions to JV
|
(0.8 | ) | (0.8 | ) | (1.4 | ) | ||||||
|
Repayments of term loan
|
- | (13.1 | ) | (2.9 | ) | |||||||
|
Other long-term debt repayments
|
(2.4 | ) | (10.3 | ) | (6.1 | ) | ||||||
|
Cash interest paid
|
(0.5 | ) | (0.8 | ) | (1.1 | ) | ||||||
|
Net liquidity requirements
|
(40.0 | ) | (93.3 | ) | (16.6 | ) | ||||||
|
Liquidity sources:
|
||||||||||||
|
Internally generated cash flows before interest paid
|
39.1 | 31.7 | 24.1 | |||||||||
|
Proceeds from the sale of marketable securities
|
- | - | 2.1 | |||||||||
|
Proceeds from asset sales
|
- | 10.2 | - | |||||||||
|
Equity transactions
|
0.6 | 1.4 | 0.2 | |||||||||
|
Other
|
(0.8 | ) | - | - | ||||||||
|
Net liquidity sources
|
38.9 | 43.3 | 26.4 | |||||||||
|
Net Change in Cash
|
$ | (1.1 | ) | $ | (50.0 | ) | $ | 9.8 | ||||
Cash Flow from Operating Activities
During 2011, cash provided by operations was $30.7 million compared to $59.5 million of cash provided by operations in 2010. During 2011, net income and adjustments to net income provided $38.6 million compared to providing $30.7 million in 2010. Working capital and other assets and liabilities used $7.9 million in 2011 compared to working capital and other assets and liabilities providing $28.7 million in 2010. Prior year reductions in accounts receivable and inventory, net of a reduction in accounts payable, was the main reason cash from operations decreased during 2011.
During 2010, cash flow from operations provided $59.5 million, an increase of $33.7 million compared to 2009. Net income and adjustments to net income provided $30.7 million for 2010. This amount was supplemented with cash provided by working capital and other assets and liabilities of $28.7 million. Even though 2010 fourth quarter sales increased over the prior year comparable period, we were able to reduce accounts receivable and inventory substantially, exclusive of the effects of the Portec acquisition.
During 2009, cash flow from operations provided $25.7 million, an increase of $1.6 million compared to 2008. Net income and adjustments to net income provided $22.9 million for 2009. This amount was supplemented with cash provided by working capital and other assets and liabilities of $2.9 million. Decreased 2009 fourth quarter sales from the prior year comparable period decreased accounts receivable while declining prices reduced inventory levels. Reduced incentive compensation decreased accrued payroll and employee benefits.
Cash Flow from Investing Activities
The final cash payment of $9.0 million associated with our acquisition of Portec was paid in January 2011. We incurred capital expenditures of $11.9 million in 2011 primarily for a new threading facility in Magnolia, TX, a new facility for our Kelsan friction management business in Vancouver, British Columbia, Canada, plant and yard upgrades and information technology infrastructure. Also, we contributed an additional $0.8 million to our joint venture under the amended agreement.
We expect to generate cash flows from operations in 2012 in excess of capital expenditures, scheduled debt service payments, share repurchases and dividends.
Investing activities used $87.6 million during 2010 primarily from our acquisitions of Portec and IDSI, net of Portec cash acquired. Capital expenditures totaled $6.2 million. Also, we contributed an additional $0.8 million to our joint venture. These uses were partially offset by the receipt of $10.2 million in proceeds related to the United States Department of Justice required divestiture of the Portec rail joint business.
Investing activities used $5.4 million during 2009 primarily from capital expenditures totaling $6.1 million. Also, our capital contributions to our newly formed corporate joint venture used $1.4 million in 2009. These uses were partially offset by $2.1 million in proceeds provided by the sale of a portion of our investment in marketable securities. Capital spending during 2009 was primarily for the acquisition of land and construction of a building that will be leased to our joint venture. To a lesser extent, spending was for plant and equipment maintenance and other land uses as well as information technology infrastructure improvements.
Cash Flow from Financing Activities
We declared our first regular quarterly dividend of $0.025 per share beginning in 2011. We also spent approximately $6.5 million to repurchase 278,655 common shares under the share repurchase program approved by our Board of Directors in May 2011. There remains approximately $18.5 million under the May 2011 authorization expiring on December 31, 2013.
In connection with the receipt of the Portec rail joint business divestiture proceeds, we repaid all outstanding debt of Portec, approximating $7.5 million. Additionally, we repaid our term loan of approximately $13.1 million in December 2010.
Scheduled term loan repayments totaled $2.9 million in 2009 while repayments of other debt, including the acceleration of repayment of certain other long-term debt instruments that had high interest rates and/or no prepayment penalties, totaled $6.1 million. Additionally, during 2009 we used $1.9 million to repurchase additional shares of our Common stock under share repurchase programs which began in the prior year period.
Financial Condition
As of December 31, 2011, we had approximately $73.7 million in cash and cash equivalents and a credit facility with $123.9 million of availability while carrying only $2.4 million in total debt. As of December 31, 2011 we were in compliance with all of the credit agreement’s covenants. We believe this capacity will afford us the flexibility to take advantage of opportunities as we explore both organic and external investment opportunities while successfully working to complete the integration of Portec.
Included within cash and cash equivalents are primarily investments in tax-free and taxable money market funds. The money market funds include municipal bond issuances as the underlying securities as well as government agency obligations and corporate bonds. Our priority continues to be short-term maturities and the preservation of our principal balances. Approximately $28.6 million of our cash and cash equivalents is held in non-domestic bank accounts. There are no material restrictions in converting those funds into other currencies and they are available to meet the liquidity needs of our foreign operations.
Borrowings under our Credit Agreement bear interest at rates based upon either the base rate or LIBOR based rate plus applicable margins. Applicable margins are dictated by the ratio of our indebtedness less cash on hand to our consolidated EBITDA. The base rate is the highest of (a) PNC Bank’s prime rate or (b) the Federal Funds Rate plus .50% or (c) the daily LIBOR rate plus 1.00%. The base rate spread ranges from 0.00% to 1.00%. LIBOR based rates are determined by dividing the published LIBOR rate by a number equal to 1.00 minus the percentage prescribed by the Federal Reserve for determining the maximum reserve requirements with respect to any Eurocurrency funding by banks on such day. The LIBOR based rate spread ranges from 1.00% to 2.00%.
Tabular Disclosure of Contractual Obligations
A summary of the Company’s required payments under financial instruments and other commitments at December 31, 2011 are presented in the following table:
|
Less than
|
1-3 | 4-5 |
More than
|
|||||||||||||||||
|
Total
|
1 year
|
years
|
years
|
5 years
|
||||||||||||||||
|
Contractual Cash Obligations
|
In thousands | |||||||||||||||||||
|
Capital leases
(1)
|
$ | 1,490 | $ | 1,439 | $ | 50 | $ | 1 | $ | 0 | ||||||||||
|
Interest on capital leases
(1)
|
61 | 59 | 2 | 0 | 0 | |||||||||||||||
|
Operating leases
|
12,161 | 2,993 | 4,334 | 2,828 | 2,006 | |||||||||||||||
|
Pension contributions
|
11,653 | 904 | 1,899 | 2,094 | 6,756 | |||||||||||||||
|
Purchase obligations not reflected in the financial statements
|
22,071 | 22,071 | 0 | 0 | 0 | |||||||||||||||
|
Total contractual cash obligations
|
$ | 47,436 | $ | 27,466 | $ | 6,285 | $ | 4,923 | $ | 8,762 | ||||||||||
|
Other Financial Commitments
|
||||||||||||||||||||
|
Standby letters of credit
|
$ | 1,104 | $ | 1,104 | $ | 0 | $ | 0 | $ | 0 | ||||||||||
|
(1)
|
Capital lease obligations are payable in installments through 2015 and have interest rates, payable monthly, ranging from 1.74% to 8.55%.
|
Other long-term liabilities include items such as income taxes which are not contractual obligations by nature. The Company can not estimate the settlement years for these items and has excluded them from the above table.
Management believes its internal and external sources of funds are adequate to meet anticipated needs, including those disclosed above, for the foreseeable future.
Off Balance Sheet Arrangements
The Company’s off-balance sheet arrangements include the operating leases, purchase obligations and standby letters of credit disclosed in the “Liquidity and Capital Resources” section in the contractual obligations table. These arrangements provide the Company with increased flexibility relative to the utilization and investment of cash resources.
Outlook
The Company achieved record net sales and positive earnings results despite costs incurred related to our previously disclosed issues from closing our Grand Island facility as well as with certain concrete ties manufactured by that facility. We believe that we are well positioned to benefit from strengthening rail and energy markets in which we participate but may continue to see a weakened construction market through 2012.
Class 1 Railroad capital spending increased approximately 33% in 2011 and we anticipate an additional increase of approximately 7% to 9% in 2012. North American rail traffic also increased in 2011 and thus far, slight increases have also been reported for the first nine weeks of 2012 as well, which bodes well for our rail business.
Our tubular/energy divisions ended 2011 with increased backlogs and active markets and we anticipate strong results from this segment in 2012. We will have relocated our threaded products unit to its new facility by the end of the first quarter and while we anticipate certain costs to be incurred related to relocation as well as plant start up costs, we are optimistic about the increased opportunities and efficiencies related to the modernized facility and equipment.
In Construction Products we face softer market conditions where our backlog is lower compared to last year and the renewal of favorable transportation legislation in the United States remains uncertain. Additionally, 42 out of 50 states have budget deficits that may present challenges to many of the end markets in which we sell, given our reliance on government funding. Certain of our businesses rely heavily on spending authorized by the federal highway and transportation funding bill, SAFETEA-LU, enacted in August 2005. This legislation authorized $286 billion for United States transportation improvement spending over a six-year period and expired in September 2009. In September 2011, the United States Congress extended this legislation through March 31, 2012. While certain estimates of the amounts that may be authorized under successor legislation to SAFETEA-LU range from $109 billion over two years to $470 billion over six years, there is uncertainty as to the timing of the renewal of this multi-year surface transportation legislation and how such legislation will actually be funded.
We do, however, anticipate a slowly improving economy in 2012 and we also expect to be profitable and generate cash flows in excess of our capital expenditures, debt service, dividends and share repurchases.
Although backlog is not necessarily indicative of future operating results, total Company backlog at December 31, 2011 was approximately $145.4 million. The following table provides the backlog by business segment:
|
December 31,
|
||||||||||||
|
2011
|
2010
|
2009
|
||||||||||
|
In thousands
|
||||||||||||
|
Backlog:
|
||||||||||||
|
Rail Products
|
$ | 68,103 | $ | 86,404 | $ | 54,505 | ||||||
|
Construction Products
|
66,555 | 102,173 | 120,845 | |||||||||
|
Tubular Products
|
10,784 | 720 | 3,221 | |||||||||
|
Total Backlog
|
$ | 145,442 | $ | 189,297 | $ | 178,571 | ||||||
While a considerable portion of the Foster business is somewhat backlog driven, the Portec business is less sensitive to backlog at any given time.
We are currently at approximately 80% capacity utilization for the UPRR at our Tucson, AZ facility. We hope to extend the supply agreement for this facility which expires on December 31, 2012. No assurances can be given as to whether the existing UPRR product warranty claim will adversely impact our ability to extend this supply agreement.
As of December 31, 2011, we maintained a warranty reserve approximating $4.6 million for potential warranty claims associated with concrete railroad ties. While we believe this is a reasonable estimate of our potential contingencies related to identified concrete tie warranty matters, we may incur future charges associated with new customer claims or further development of information for existing customer claims, including the July 2011 product claim by the UPRR. Thus, there can be no assurance that future potential costs pertaining to warranty claims will not have a material impact on our results of operations and financial condition.
Interest Rate Risk
The Company does not purchase or hold any derivative financial instruments for trading purposes.
At contract inception, the Company designates its derivative instruments as hedges. The Company recognizes all derivative instruments on the balance sheet at fair value. Fluctuations in the fair values of derivative instruments designated as cash flow hedges are recorded in accumulated other comprehensive income and reclassified into earnings within other income as the underlying hedged items affect earnings. To the extent that a change in a derivative does not perfectly offset the change in value of the interest rate being hedged, the ineffective portion is recognized in earnings immediately.
Foreign Currency Exchange Rate Risk
The Company is subject to exposures to changes in foreign currency exchange rates. The Company manages its exposure to changes in foreign currency exchange rates on firm sale and purchase commitments by entering into foreign currency forward contracts. The Company’s risk management objective is to reduce its exposure to the effects of changes in exchange rates on these transactions over the duration of the transactions. The Company did not engage in significant foreign currency hedging transactions during the three-year period ended December 31, 2011, and no foreign currency hedges remained outstanding as of December 31, 2011. Realized gains or losses from foreign currency hedges did not exceed $0.1 million in any of the three years ended December 31, 2011. However, with the acquisition of Portec, the Company may increase its foreign currency hedging activity in future periods.
Report of Independent Registered Public Accounting Firm
The Board of Directors and Stockholders
L. B. Foster Company
We have audited the accompanying consolidated balance sheets of L. B. Foster Company and Subsidiaries as of December 31, 2011 and 2010, and the related consolidated statements of operations, stockholders' equity, and cash flows for each of the three years in the period ended December 31, 2011. Our audits also included the financial statement schedule listed in the Index at Item 15(a). These financial statements and schedule are the responsibility of the Company's management. Our responsibility is to express an opinion on these financial statements and schedule based on our audits.
We conducted our audits in accordance with the standards of the Public Company Accounting Oversight Board (United States). Those standards require that we plan and perform the audit to obtain reasonable assurance about whether the financial statements are free of material misstatement. An audit includes examining, on a test basis, evidence supporting the amounts and disclosures in the financial statements. An audit also includes assessing the accounting principles used and significant estimates made by management, as well as evaluating the overall financial statement presentation. We believe that our audits provide a reasonable basis for our opinion.
In our opinion, the financial statements referred to above present fairly, in all material respects, the consolidated financial position of L. B. Foster Company and Subsidiaries at December 31, 2011 and 2010, and the consolidated results of their operations and their cash flows for each of the three years in the period ended December 31, 2011, in conformity with U.S. generally accepted accounting principles. Also, in our opinion, the related financial statement schedule, when considered in relation to the basic financial statements taken as a whole, presents fairly in all material respects the information set forth therein.
We also have audited, in accordance with the standards of the Public Company Accounting Oversight Board (United States), L. B. Foster Company and Subsidiaries’ internal control over financial reporting as of December 31, 2011, based on criteria established in
Internal Control-Integrated Framework
issued by the Committee of Sponsoring Organizations of the Treadway Commission and our report dated March 15, 2012, expressed an unqualified opinion thereon.
/s/ Ernst & Young LLP
Ernst & Young LLP
Pittsburgh, Pennsylvania
Report of Independent Registered Public Accounting Firm
The Board of Directors and Stockholders
L. B. Foster Company
We have audited L.B. Foster Company and Subsidiaries’ internal control over financial reporting as of December 31, 2011, based on criteria established in
Internal Control—Integrated Framework
issued by the Committee of Sponsoring Organizations of the Treadway Commission (the COSO criteria). L. B. Foster Company and Subsidiaries’ management is responsible for maintaining effective internal control over financial reporting, and for its assessment of the effectiveness of internal control over financial reporting included in the accompanying Management’s Report on Internal Control over Financial Reporting. Our responsibility is to express an opinion on the company’s internal control over financial reporting based on our audit.
We conducted our audit in accordance with the standards of the Public Company Accounting Oversight Board (United States). Those standards require that we plan and perform the audit to obtain reasonable assurance about whether effective internal control over financial reporting was maintained in all material respects. Our audit included obtaining an understanding of internal control over financial reporting, assessing the risk that a material weakness exists, testing and evaluating the design and operating effectiveness of internal control based on the assessed risk, and performing such other procedures as we considered necessary in the circumstances. We believe that our audit provides a reasonable basis for our opinion.
A company’s internal control over financial reporting is a process designed to provide reasonable assurance regarding the reliability of financial reporting and the preparation of financial statements for external purposes in accordance with generally accepted accounting principles. A company’s internal control over financial reporting includes those policies and procedures that (1) pertain to the maintenance of records that, in reasonable detail, accurately and fairly reflect the transactions and dispositions of the assets of the company; (2) provide reasonable assurance that transactions are recorded as necessary to permit preparation of financial statements in accordance with generally accepted accounting principles, and that receipts and expenditures of the company are being made only in accordance with authorizations of management and directors of the company; and (3) provide reasonable assurance regarding prevention or timely detection of unauthorized acquisition, use, or disposition of the company’s assets that could have a material effect on the financial statements.
Because of its inherent limitations, internal control over financial reporting may not prevent or detect misstatements. Also, projections of any evaluation of effectiveness to future periods are subject to the risk that controls may become inadequate because of changes in conditions, or that the degree of compliance with the policies or procedures may deteriorate.
In our opinion, L. B. Foster Company and Subsidiaries maintained, in all material respects, effective internal control over financial reporting as of December 31, 2011, based on the COSO criteria.
We also have audited, in accordance with the standards of the Public Company Accounting Oversight Board (United States), the consolidated balance sheets of L. B. Foster Company and Subsidiaries, as of December 31, 2011 and 2010, and the related consolidated statements of operations, stockholders’ equity, and cash flows for each of the three years in the period ended December 31, 2011 and our report dated March 15, 2012 expressed an unqualified opinion thereon.
/s/ Ernst & Young LLP
Ernst & Young LLP
Pittsburgh, Pennsylvania
March 15, 2012
|
CONSOLIDATED BALANCE SHEETS
|
||||||
|
DECEMBER 31, 2011 AND 2010
|
||||||
|
2011
|
2010
|
|||||
|
In thousands, except per share data
|
||||||
|
ASSETS
|
||||||
|
CURRENT ASSETS:
|
||||||
|
Cash and cash equivalents
|
$ | 73,727 | $ | 74,800 | ||
|
Accounts receivable - net
|
68,527 | 69,697 | ||||
|
Inventories - net
|
92,278 | 90,367 | ||||
|
Current deferred tax assets
|
0 | 911 | ||||
|
Prepaid income tax
|
3,684 | 972 | ||||
|
Other current assets
|
1,777 | 2,535 | ||||
|
Total Current Assets
|
239,993 | 239,282 | ||||
|
PROPERTY, PLANT AND EQUIPMENT - NET
|
48,118 | 46,216 | ||||
|
Goodwill
|
43,825 | 43,825 | ||||
|
Other intangibles - net
|
43,048 | 45,429 | ||||
|
Investments
|
3,495 | 1,987 | ||||
|
Other assets
|
1,415 | 1,663 | ||||
|
TOTAL ASSETS
|
$ | 379,894 | $ | 378,402 | ||
|
LIABILITIES AND STOCKHOLDERS' EQUITY
|
||||||
|
CURRENT LIABILITIES:
|
||||||
|
Current maturities of long-term debt
|
$ | 2,384 | $ | 2,402 | ||
|
Accounts payable - trade
|
50,277 | 45,533 | ||||
|
Deferred revenue
|
6,833 | 16,868 | ||||
|
Accrued payroll and employee benefits
|
9,678 | 9,054 | ||||
|
Current deferred tax liabilities
|
759 | 0 | ||||
|
Other accrued liabilities
|
14,801 | 23,122 | ||||
|
Total Current Liabilities
|
84,732 | 96,979 | ||||
|
LONG-TERM DEBT
|
51 | 2,399 | ||||
|
DEFERRED TAX LIABILITIES
|
11,708 | 11,389 | ||||
|
OTHER LONG-TERM LIABILITIES
|
13,588 | 11,888 | ||||
|
COMMITMENTS AND CONTINGENT LIABILITIES (Note 21)
|
||||||
|
STOCKHOLDERS' EQUITY:
|
||||||
|
Common stock,
issued 10,073,403 shares in 2011 and 10,277,138 shares in 2010
|
111 | 111 | ||||
|
Paid-in capital
|
47,349 | 47,286 | ||||
|
Retained earnings
|
255,152 | 233,279 | ||||
|
Treasury stock -
at cost, Common stock, 1,042,376 shares in 2011 and 814,249 shares in 2010
|
(28,169 | ) | (23,861 | ) | ||
|
Accumulated other comprehensive loss
|
(4,628 | ) | (1,068 | ) | ||
|
Total Stockholders' Equity
|
269,815 | 255,747 | ||||
|
TOTAL LIABILITIES AND STOCKHOLDERS' EQUITY
|
$ | 379,894 | $ | 378,402 | ||
|
See Notes to Consolidated Financial Statements.
|
||||||
|
L. B. FOSTER COMPANY AND SUBSIDIARIES
|
||||||||||||
|
CONSOLIDATED STATEMENTS OF OPERATIONS FOR
|
||||||||||||
|
THE THREE YEARS ENDED DECEMBER 31, 2011
|
||||||||||||
|
2011
|
2010
|
2009
|
||||||||||
|
In thousands, except per share data
|
||||||||||||
|
NET SALES
|
$ |
590,926
|
$ |
475,050
|
$ |
404,020
|
||||||
|
COSTS AND EXPENSES:
|
||||||||||||
|
Cost of goods sold
|
488,774
|
400,467
|
344,162
|
|||||||||
|
Selling and administrative expenses
|
67,238
|
42,143
|
35,488
|
|||||||||
|
Amortization expense
|
2,818
|
445
|
13
|
|||||||||
|
Interest expense
|
622
|
1,003
|
1,292
|
|||||||||
|
Interest income
|
(321)
|
(403)
|
(789)
|
|||||||||
|
Equity in (gains)/losses of nonconsolidated investment
|
(708)
|
213
|
0
|
|||||||||
|
(Gain)/loss on foreign exchange
|
(245)
|
82
|
0
|
|||||||||
|
Gain on marketable securities
|
0
|
(1,364)
|
(1,194)
|
|||||||||
|
Other income
|
(1,191)
|
(278)
|
(435)
|
|||||||||
|
556,987
|
442,308
|
378,537
|
||||||||||
|
INCOME BEFORE INCOME TAXES
|
33,939
|
32,742
|
25,483
|
|||||||||
|
INCOME TAX EXPENSE
|
11,044
|
12,250
|
9,756
|
|||||||||
|
NET INCOME
|
$ |
22,895
|
$ |
20,492
|
$ |
15,727
|
||||||
|
BASIC EARNINGS PER COMMON SHARE
|
$ |
2.24
|
$ |
2.01
|
$ |
1.55
|
||||||
|
DILUTED EARNINGS PER COMMON SHARE
|
$ |
2.22
|
$ |
1.98
|
$ |
1.53
|
||||||
|
DIVIDENDS PAID PER SHARE
|
$ |
0.10
|
$ |
0.00
|
$ |
0.00
|
||||||
|
See Notes to Consolidated Financial Statements.
|
||||||||||||
|
L. B. FOSTER COMPANY AND SUBSIDIARIES
|
||||||||||||
|
CONSOLIDATED STATEMENTS OF CASH FLOWS FOR
|
||||||||||||
|
THE THREE YEARS ENDED DECEMBER 31, 2011
|
||||||||||||
|
2011
|
2010
|
2009
|
||||||||||
|
In thousands
|
||||||||||||
|
CASH FLOWS FROM OPERATING ACTIVITIES:
|
||||||||||||
|
Net income
|
$ | 22,895 | $ | 20,492 | $ | 15,727 | ||||||
|
Adjustments to reconcile net income to net cash provided by operating activities:
|
||||||||||||
|
Gain on sale of marketable securities
|
0 | (1,364 | ) | (1,194 | ) | |||||||
|
Deferred income taxes
|
3,484 | 1,130 | (675 | ) | ||||||||
|
Excess tax benefit from share-based compensation
|
(425 | ) | (961 | ) | (128 | ) | ||||||
|
Depreciation and amortization
|
12,360 | 9,489 | 8,720 | |||||||||
|
Loss on sale of property, plant and equipment
|
145 | 10 | 32 | |||||||||
|
Deferred gain amortization on sale-leaseback
|
(1,081 | ) | (215 | ) | (215 | ) | ||||||
|
Equity in (gains)/ losses of nonconsolidated investments
|
(708 | ) | 213 | 0 | ||||||||
|
Stock-based compensation
|
1,958 | 1,944 | 653 | |||||||||
|
Unrealized loss on derivative mark-to-market
|
0 | 11 | 22 | |||||||||
|
Change in operating assets and liabilities:
|
||||||||||||
|
Accounts receivable
|
992 | 11,397 | 3,135 | |||||||||
|
Inventories
|
(2,071 | ) | 30,606 | 3,934 | ||||||||
|
Other current assets
|
922 | 10 | 60 | |||||||||
|
Prepaid income taxes
|
(2,239 | ) | 462 | (120 | ) | |||||||
|
Other noncurrent assets
|
(136 | ) | 88 | 40 | ||||||||
|
Accounts payable – trade
|
4,772 | (13,158 | ) | (773 | ) | |||||||
|
Deferred revenue
|
(9,609 | ) | 667 | 0 | ||||||||
|
Accrued payroll and employee benefits
|
(372 | ) | (1,396 | ) | (1,894 | ) | ||||||
|
Other current liabilities
|
(2,161 | ) | 897 | (1,379 | ) | |||||||
|
Other liabilities
|
1,944 | (840 | ) | (205 | ) | |||||||
|
Net Cash Provided by Operating Activities
|
30,670 | 59,482 | 25,740 | |||||||||
|
CASH FLOWS FROM INVESTING ACTIVITIES:
|
||||||||||||
|
Acquisitions, net of cash received
|
(8,952 | ) | (90,807 | ) | 0 | |||||||
|
Proceeds from the sale of assets, property, plant and equipment
|
41 | 10,179 | 1 | |||||||||
|
Capital expenditures on property, plant and equipment
|
(11,939 | ) | (6,160 | ) | (6,107 | ) | ||||||
|
Capital contributions to equity method investment
|
(800 | ) | (800 | ) | (1,400 | ) | ||||||
|
Proceeds from the sale of marketable securities
|
0 | 0 | 2,115 | |||||||||
|
Net Cash Used by Investing Activities
|
(21,650 | ) | (87,588 | ) | (5,391 | ) | ||||||
|
L. B. FOSTER COMPANY AND SUBSIDIARIES
|
||||||||||||
|
CONSOLIDATED STATEMENTS OF CASH FLOWS FOR
|
||||||||||||
|
THE THREE YEARS ENDED DECEMBER 31, 2011
|
||||||||||||
|
2011
|
2010
|
2009
|
||||||||||
|
In thousands
|
||||||||||||
|
CASH FLOWS FROM FINANCING ACTIVITIES:
|
||||||||||||
|
Repayments of term loan
|
0 | (13,095 | ) | (2,857 | ) | |||||||
|
Repayments of other long-term debt
|
(2,366 | ) | (10,288 | ) | (6,051 | ) | ||||||
|
Proceeds from exercise of stock options and stock awards
|
207 | 451 | 65 | |||||||||
|
Excess tax benefit from share-based compensation
|
425 | 961 | 128 | |||||||||
|
Cash dividends on common stock paid to shareholders
|
(1,022 | ) | 0 | 0 | ||||||||
|
Treasury stock acquisitions
|
(6,480 | ) | (17 | ) | (1,863 | ) | ||||||
|
Net Cash Used by Financing Activities
|
(9,236 | ) | (21,988 | ) | (10,578 | ) | ||||||
|
Effect of exchange rate changes on cash and cash equivalents
|
(857 | ) | 49 | 0 | ||||||||
|
Net (Decrease) / Increase in Cash and Cash Equivalents
|
(1,073 | ) | (50,045 | ) | 9,771 | |||||||
|
Cash and Cash Equivalents at Beginning of Year
|
74,800 | 124,845 | 115,074 | |||||||||
|
Cash and Cash Equivalents at End of Year
|
$ | 73,727 | $ | 74,800 | $ | 124,845 | ||||||
|
SUPPLEMENTAL DISCLOSURES OF CASH FLOW INFORMATION:
|
||||||||||||
|
Interest Paid
|
$ | 505 | $ | 806 | $ | 1,122 | ||||||
|
Income Taxes Paid
|
$ | 9,395 | $ | 10,805 | $ | 13,381 | ||||||
|
Portec Available-for-Sale Securities Redeemed as part of Acquisition
|
$ | 0 | $ | 2,158 | $ | 0 | ||||||
|
Capital Expenditures Funded through Capital Leases
|
$ | 0 | $ | 199 | $ | 0 | ||||||
|
Accrued Portec Purchase Price Funded in January 2011
|
$ | 0 | $ | 8,952 | $ | 0 | ||||||
|
See Notes to Consolidated Financial Statements.
|
||||||||||||
|
CONSOLIDATED STATEMENTS OF STOCKHOLDERS’ EQUITY
|
||||||||||||||||||||||||
|
FOR THE THREE YEARS ENDED DECEMBER 31, 2011
|
||||||||||||||||||||||||
|
Accumulated
|
||||||||||||||||||||||||
|
Other
|
||||||||||||||||||||||||
|
Common
|
Paid-in
|
Retained
|
Treasury
|
Comprehensive
|
||||||||||||||||||||
|
Stock
|
Capital
|
Earnings
|
Stock
|
(Loss) Income
|
Total
|
|||||||||||||||||||
|
In thousands, except share data
|
||||||||||||||||||||||||
|
Balance, January 1, 2009
|
$ | 111 | $ | 47,585 | $ | 197,060 | $ | (26,482 | ) | $ | (712 | ) | $ | 217,562 | ||||||||||
|
Net income
|
15,727 | 15,727 | ||||||||||||||||||||||
|
Other comprehensive income net of tax:
|
||||||||||||||||||||||||
|
Pension liability adjustment
|
292 | 292 | ||||||||||||||||||||||
|
Unrealized derivative loss on cash flow hedges
|
23 | 23 | ||||||||||||||||||||||
|
Market value adjustments for investments
|
5 | 5 | ||||||||||||||||||||||
|
Comprehensive income
|
16,047 | |||||||||||||||||||||||
|
Purchase of 86,141 Common shares for Treasury
|
(1,863 | ) | (1,863 | ) | ||||||||||||||||||||
|
Issuance of 24,250 Common shares, net of forfeitures
|
75 | 771 | 846 | |||||||||||||||||||||
|
Balance, December 31, 2009
|
111 | 47,660 | 212,787 | (27,574 | ) | (392 | ) | 232,592 | ||||||||||||||||
|
Net income
|
20,492 | 20,492 | ||||||||||||||||||||||
|
Other comprehensive (loss) income net of tax:
|
||||||||||||||||||||||||
|
Pension liability adjustment
|
(74 | ) | (74 | ) | ||||||||||||||||||||
|
Unrealized derivative loss on cash flow hedges
|
11 | 11 | ||||||||||||||||||||||
|
Foreign currency translation adjustment
|
117 | 117 | ||||||||||||||||||||||
|
Market value adjustments for investments
|
(730 | ) | (730 | ) | ||||||||||||||||||||
|
Comprehensive income
|
19,816 | |||||||||||||||||||||||
|
Purchase of 493 Common shares for Treasury
|
(17 | ) | (17 | ) | ||||||||||||||||||||
|
Issuance of 113,667 Common shares, net of forfeitures
|
(374 | ) | 3,730 | 3,356 | ||||||||||||||||||||
|
Balance, December 31, 2010
|
111 | 47,286 | 233,279 | (23,861 | ) | (1,068 | ) | 255,747 | ||||||||||||||||
|
Net income
|
22,895 | 22,895 | ||||||||||||||||||||||
|
Other comprehensive (loss) income net of tax:
|
||||||||||||||||||||||||
|
Pension liability adjustment
|
(2,254 | ) | (2,254 | ) | ||||||||||||||||||||
|
Foreign currency translation adjustment
|
(1,306 | ) | (1,306 | ) | ||||||||||||||||||||
|
Comprehensive income
|
19,335 | |||||||||||||||||||||||
|
Purchase of 278,655 Common shares for Treasury
|
(6,480 | ) | (6,480 | ) | ||||||||||||||||||||
|
Issuance of 50,528 Common shares, net of forfeitures
|
63 | 2,172 | 2,235 | |||||||||||||||||||||
|
Cash dividends on common stock paid to shareholders
|
(1,022 | ) | (1,022 | ) | ||||||||||||||||||||
|
Balance, December 31, 2011
|
$ | 111 | $ | 47,349 | $ | 255,152 | $ | (28,169 | ) | $ | (4,628 | ) | $ | 269,815 | ||||||||||
|
See Notes to Consolidated Financial Statements.
|
||||||||||||||||||||||||
Note 1.
Summary of Significant Accounting Policies
Basis of financial statement presentation
The consolidated financial statements include the accounts of the Company and its wholly owned subsidiaries, ventures and partnerships in which a controlling interest is held. Inter-company transactions have been eliminated. The Company utilizes the equity method of accounting for companies where its ownership is less than or equal to 50% and significant influence exists.
Cash and cash equivalents
The Company considers cash and other instruments with maturities of three months or less, when purchased, to be cash and cash equivalents.
Cash equivalents principally consist of investments in money market funds and bank certificates of deposit at December 31, 2011 and 2010. The Company invests available funds in a manner to maximize returns, preserve investment principle and maintain liquidity while seeking the highest yield available.
The following table summarizes the Company’s investment in money market funds at December 31:
|
2011
|
||||||||
|
Cost
|
Fair Value
|
|||||||
|
In thousands
|
||||||||
|
BlackRock Liquidity Temporary Fund - Institutional
|
$ | 42,273 | $ | 42,273 | ||||
| 2010 | ||||||||
|
Cost
|
Fair Value
|
|||||||
|
In thousands
|
||||||||
|
Federated Municipal Obligations - Institutional
|
$ | 41,403 | $ | 41,403 | ||||
|
BlackRock Liquidity Temporary Fund - Institutional
|
14,556 | 14,556 | ||||||
| $ | 55,959 | $ | 55,959 | |||||
The above investments are all tax-free money market funds with municipal bond issuances as the underlying securities all of which maintained AAA credit agency ratings. The carrying amounts approximate fair value because of the short maturity of the instruments.
Cash equivalents additionally consisted of investment in bank certificates of deposit of approximately $22,520,000 and $6,120,000 at December 31, 2011 and 2010, respectively. The carrying amounts approximated fair value because of the short maturity of the instruments.
Cash and cash equivalents held in non-domestic accounts was approximately $28,639,000 and $15,015,000 at December 31, 2011 and 2010, respectively.
Inventories
Certain inventories are valued at the lower of the last-in, first-out (LIFO) cost or market. Approximately 44% in 2011 and 59% in 2010, of the Company’s inventory is valued at average cost or market, whichever is lower. Slow-moving inventory is reviewed and adjusted regularly, based upon product knowledge, physical inventory observation, and the age of the inventory.
Property, plant and equipment
Maintenance, repairs and minor renewals are charged to operations as incurred. Major renewals and betterments which substantially extend the useful life of the property are capitalized at cost. Upon sale or other disposition of assets, the costs and related accumulated depreciation and amortization are removed from the accounts and the resulting gain or loss, if any, is reflected in income.
Depreciation and amortization are provided on a straight-line basis over the estimated useful lives of 25 to 40 years for buildings and 3 to 10 years for machinery and equipment. Leasehold improvements are amortized over 2 to 7 years which represent the lives of the respective leases or the lives of the improvements, whichever is shorter. The Company reviews long-lived assets for impairment whenever events or changes in circumstances indicate that the carrying amount of an asset may not be recoverable.
Allowance for doubtful accounts
The allowance for doubtful accounts is recorded to reflect the ultimate realization of the Company’s accounts receivable and includes assessment of the probability of collection and the credit-worthiness of certain customers. Reserves for uncollectible accounts are recorded as part of selling and administrative expenses on the Consolidated Statements of Operations. The Company records a monthly provision for accounts receivable that are considered to be uncollectible. In order to calculate the appropriate monthly provision, the Company reviews its accounts receivable aging and calculates an allowance through application of historic reserve factors to overdue receivables. This calculation is supplemented by specific account reviews performed by the Company’s credit department. As necessary, the application of the Company’s allowance rates to specific customers are reviewed and adjusted to more accurately reflect the credit risk inherent within that customer relationship.
Investments
Investments in companies in which the Company has the ability to exert significant influence, but not control, over operating and financial policies (generally 20% to 50% ownership) are accounted for using the equity method. Under the equity method, investments are initially recorded at cost and adjusted for dividends and undistributed earnings and losses. The equity method of accounting requires a company to recognize a loss in the value of an equity method investment that is other than a temporary decline.
Goodwill and other intangible assets
In accordance with FASB ASC 350 “Intangibles – Goodwill and Other,” and applicable guidance, goodwill is tested annually for impairment or more often if there are indicators of impairment. The goodwill impairment test involves comparing the fair value of a reporting unit to its carrying value, including goodwill. If the carrying amount of the reporting unit exceeds its fair value, a second step is required to measure the goodwill impairment loss. This step compares the implied fair value of the reporting unit’s goodwill to the carrying amount of that goodwill. If the carrying amount of the goodwill exceeds the implied fair value of the goodwill, an impairment loss equal to the excess is recorded as a component of continuing operations. The Company performs its annual impairment tests as of October 1
st
. No goodwill impairment was recognized during 2011, 2010 or 2009.
As required by applicable guidance, the Company reassessed the useful lives of its identifiable intangible assets and determined that no changes were required. The Company has no significant indefinite-lived intangible assets. All intangible assets are amortized over their useful lives ranging from 5 to 25 years, with a total weighted average amortization period of approximately twenty years, as of December 31, 2011.
See Note 4, “Goodwill and Other Intangible Assets,” for additional information regarding the Company’s goodwill and other intangible assets.
Environmental remediation and compliance
Environmental remediation costs are accrued when the liability is probable and costs are estimable. Environmental compliance costs, which principally include the disposal of waste generated by routine operations, are expensed as incurred. Capitalized environmental costs are depreciated, when appropriate, over their useful life. Reserves are not reduced by potential claims for recovery. Claims for recovery are recognized as agreements are reached with third parties or as amounts are received. Reserves are periodically reviewed and adjusted to reflect current remediation progress, prospective estimates of required activity, and other factors that may be relevant, including changes in technology or regulations. As of December 31, 2011 and 2010, the Company maintained environmental reserves approximating $2,184,000 and $2,799,000, respectively.
Earnings per share
Basic earnings per share is calculated by dividing net income by the weighted average of common shares outstanding during the year. Diluted earnings per share is calculated by using the weighted average of common shares outstanding adjusted to include the potentially dilutive effect of outstanding stock options and restricted stock utilizing the treasury stock method.
Revenue recognition
The Company’s revenues are composed of product sales and products and services provided under long-term contracts. For product sales, the Company recognizes revenue upon transfer of title to the customer. Title generally passes to the customer upon shipment. In limited cases, title does not transfer and revenue is not recognized until the customer has received the products at its physical location. Shipping and handling costs are included in cost of goods sold. Revenues for products under long-term contracts are generally recognized using the percentage-of-completion method based upon the proportion of actual costs incurred to estimated total costs. For certain products, the percentage of completion is based upon actual labor costs to estimated total labor costs. Revenues recognized using percentage of completion were less than 10% of the Company’s consolidated revenues for the year ended December 31, 2011.
Revenues from contract change orders and claims are recognized when the settlement is probable and the amount can be reasonably estimated. Contract costs include all direct material, labor, subcontract costs and those indirect costs related to contract performance. Costs in excess of billings are classified as work-in-process inventory and generally comprise less than 5% of the Company’s inventory at cost.
Fair value of financial instruments
The Company’s financial instruments consist of cash equivalents, accounts receivable, investments, accounts payable, short-term and long-term debt, and foreign currency forward contracts.
The carrying amounts of the Company’s financial instruments at December 31, 2011 and 2010 approximate fair value. See Note 19, “Fair Value Measurements,” for additional information.
Use of estimates
The preparation of financial statements in conformity with U.S. generally accepted accounting principles requires management to make estimates and assumptions that affect the amounts reported in the financial statements and accompanying notes. Actual results could differ from those estimates.
Stock-based compensation
The Company applies the provisions of FASB ASC 718, “Compensation – Stock Compensation,” to account for the Company’s share-based compensation. Under the guidance, share-based compensation cost is measured at the grant date based on the calculated fair value of the award. The expense is recognized over the employees’ requisite service period, generally the vesting period of the award.
Derivative financial instruments and hedging activities
The Company does not purchase or hold any derivative financial instruments for trading purposes.
At contract inception, the Company designates its derivative instruments as hedges. The Company recognizes all derivative instruments on the balance sheet at fair value. Fluctuations in the fair values of derivative instruments designated as cash flow hedges are recorded in accumulated other comprehensive (loss) income and reclassified into earnings within other income as the underlying hedged items affect earnings. To the extent that a change in the derivative does not perfectly offset the change in value of the risk being hedged, the ineffective portion is recognized in earnings immediately.
The Company is subject to exposures to changes in foreign currency exchange rates. The Company manages its exposure to changes in foreign currency exchange rates on firm sale and purchase commitments by entering into foreign currency forward contracts. The Company’s risk management objective is to reduce its exposure to the effects of changes in exchange rates on these transactions over the duration of the transactions. The Company did not engage in any foreign currency hedging transactions during the period ended December 31, 2011 and no foreign currency hedges remained outstanding as of December 31, 2010. Realized gains or losses from foreign currency hedges did not exceed $100,000 during the twelve month periods ended December 31, 2010 or 2009.
Product Warranty
The Company maintains a current warranty for the repair or replacement of defective products. For certain manufactured products, an accrual is made on a monthly basis as a percentage of cost of sales. For long-term construction products, a warranty is established when the claim is known and quantifiable. The product warranty accrual is periodically adjusted based on the identification or resolution of known individual product warranty claims. At December 31, 2011 and 2010, the product warranty accrual was $6,642,000 and $4,413,000, respectively. See Note 21, “Commitments and Contingencies” for additional information regarding the product warranty.
Asset retirement obligations
The Company maintains liabilities for asset retirement obligations (ARO) in conjunction with the leases of the Grand Island, NE and Tucson, AZ concrete railroad tie facilities and the Burnaby, British Columbia, Canada friction management facility.
A reconciliation of our liability for ARO’s at December 31, 2011 and 2010 follows:
|
2011
|
2010
|
|||||||
|
In thousands
|
||||||||
|
Asset retirement obligation at beginning of year
|
$ | 1,407 | $ | 912 | ||||
|
Liabilities incurred
|
(510 | ) | 0 | |||||
|
Portec acquisition
|
0 | 160 | ||||||
|
Revisions in estimated cash flows
|
0 | 287 | ||||||
|
Accretion expense
|
34 | 48 | ||||||
|
Asset retirement obligation at end of year
|
$ | 931 | $ | 1,407 | ||||
The ARO was recorded in “Other Current Liabilities” at December 31, 2011. Approximately $837,000 was recorded in “Other Current Liabilities” at December 31, 2010.
Income Taxes
The Company makes judgments regarding the recognition of deferred tax assets and the future realization of these assets. As prescribed by FASB ASC 740 “Income Taxes” and applicable guidance, valuation allowances must be provided for those deferred tax assets for which it is more likely than not (a likelihood more than 50%) that some portion or all of the deferred tax assets will not be realized. The guidance requires the Company to evaluate positive and negative evidence regarding the recoverability of deferred tax assets. Determination of whether the positive evidence outweighs the negative and quantification of the valuation allowance requires the Company to make estimates and judgments of future financial results.
The Company evaluates all tax positions taken on the state and federal tax filings to determine if the position is more likely than not to be sustained upon examination. For positions that meet the more likely than not to be sustained criteria, an evaluation to determine the largest amount of benefit, determined on a cumulative probability basis that is more likely than not to be realized upon ultimate settlement, is determined. A previously recognized tax position is derecognized when it is subsequently determined that a tax position no longer meets the more likely than not threshold to be sustained. The evaluation of the sustainability of a tax position and the probable amount that is more likely than not is based on judgment, historical experience and on various other assumptions. The results of these estimates, that are not readily apparent from other sources, form the basis for recognizing an uncertain tax position liability. Actual results could differ from those estimates upon subsequent resolution of identified matters. The Company accrues interest and penalties related to unrecognized tax benefits in its provision for income taxes.
Foreign Currency Translation
The assets and liabilities of the Company’s foreign subsidiaries are measured using the local currency as the functional currency and are translated into U.S. dollars at exchange rates as of the balance sheet date. Income statement amounts are translated at the weighted-average rates of exchange during the year. The translation adjustment is accumulated as a separate component of accumulated other comprehensive (loss) income. Foreign currency transaction gains and losses are included in determining net income. Included in net income for the year ended December 31, 2011 was a foreign currency transaction gain of approximately $245,000. Included in net income for the year ended December 31, 2010 was a foreign currency transaction loss of approximately $82,000. There were no such gains or losses for the year ended December 31, 2009.
Reclassifications
Certain accounts in the prior year consolidated financial statements have been reclassified for comparative purposes to conform with the presentation in the current year consolidated financial statements.
New accounting pronouncements
In June 2011, the FASB issued ASU No. 2011-05, “Comprehensive Income (Topic 220): Presentation of Comprehensive Income.” This guidance will require companies to present the components of net income and other comprehensive income either as one continuous statement or as two consecutive statements. It eliminates the option to present components of other comprehensive income as part of the statement of changes in stockholders’ equity. The standard does not change the items which must be reported in other comprehensive income, how such items are measured or when they must be reclassified to net income. The update is effective for interim and annual periods beginning after December 15, 2011. The guidance will have no impact on the Company’s financial condition or results of operations.
Note 2.
Business Segments
L.B. Foster Company is organized and evaluated by product group, which is the basis for identifying reportable segments.
The Company is engaged in the manufacture, fabrication and distribution of rail, construction and tubular products.
The Company’s Rail segment provides a full line of new and used rail, trackwork and accessories to railroads, mines and industry. The Rail segment also designs and produces concrete railroad ties, insulated rail joints, power rail, track fasteners, coverboards and special accessories for mass transit and other rail systems. The Company also engineers, manufactures and assembles friction management products and railway wayside data collection and management systems.
The Company’s Construction segment sells and rents steel sheet piling, H-bearing pile, and other piling products for foundation and earth retention requirements. In addition, the Company’s Fabricated Products division sells bridge decking, bridge railing, structural steel fabrications, expansion joints and other products for highway construction and repair. The Buildings division produces precast concrete buildings.
The Company’s Tubular segment supplies pipe coatings for natural gas pipelines and utilities. Additionally, this segment produces threaded pipe products for industrial water well and irrigation markets.
The Company markets its products directly in all major industrial areas of the United States, Canada and the United Kingdom, primarily through an internal sales force.
The following table illustrates net sales, profits, assets, depreciation/amortization and expenditures for long-lived assets of the Company by segment. Segment profit is the earnings before income taxes and includes internal cost of capital charges for assets used in the segment at a rate of, generally 1% per month. The accounting policies of the reportable segments are the same as those described in the summary of significant accounting policies except that the Company accounts for inventory on a First-In, First-Out (FIFO) basis at the segment level compared to a Last-In, First-Out (LIFO) basis at the consolidated level.
|
2011
|
||||||||||||||||||||
|
Expenditures
|
||||||||||||||||||||
|
Net
|
Segment
|
Segment
|
Depreciation/
|
for Long-Lived
|
||||||||||||||||
|
Sales
|
Profit
|
Assets
|
Amortization
|
Assets
|
||||||||||||||||
|
In thousands
|
||||||||||||||||||||
|
Rail Products
|
$ | 323,475 | $ | 19,798 | $ | 193,170 | $ | 8,994 | $ | 5,970 | ||||||||||
|
Construction Products
|
234,981 | 16,326 | 92,354 | 2,068 | 1,179 | |||||||||||||||
|
Tubular Products
|
32,470 | 6,810 | 11,758 | 453 | 3,995 | |||||||||||||||
|
Total
|
$ | 590,926 | $ | 42,934 | $ | 297,282 | $ | 11,515 | $ | 11,144 | ||||||||||
| 2010 | ||||||||||||||||||||
|
Expenditures
|
||||||||||||||||||||
|
Net
|
Segment
|
Segment
|
Depreciation/
|
for Long-Lived
|
||||||||||||||||
|
Sales
|
Profit
|
Assets
|
Amortization
|
Assets
|
||||||||||||||||
|
In thousands
|
||||||||||||||||||||
|
Rail Products
|
$ | 212,240 | $ | 11,904 | $ | 208,446 | $ | 6,177 | $ | 3,094 | ||||||||||
|
Construction Products
|
235,591 | 20,600 | 91,019 | 1,738 | 1,638 | |||||||||||||||
|
Tubular Products
|
27,219 | 3,949 | 6,207 | 765 | 543 | |||||||||||||||
|
Total
|
$ | 475,050 | $ | 36,453 | $ | 305,672 | $ | 8,680 | $ | 5,275 | ||||||||||
| 2009 | ||||||||||||||||||||
|
Expenditures
|
||||||||||||||||||||
|
Net
|
Segment
|
Segment
|
Depreciation/
|
for Long-Lived
|
||||||||||||||||
|
Sales
|
(Loss)/Profit
|
Assets
|
Amortization
|
Assets
|
||||||||||||||||
|
In thousands
|
||||||||||||||||||||
|
Rail Products
|
$ | 186,401 | $ | (281 | ) | $ | 86,591 | $ | 6,310 | $ | 1,197 | |||||||||
|
Construction Products
|
196,480 | 13,714 | 104,506 | 1,392 | 2,142 | |||||||||||||||
|
Tubular Products
|
21,139 | (1,086 | ) | 9,777 | 498 | 1,906 | ||||||||||||||
|
Total
|
$ | 404,020 | $ | 12,347 | $ | 200,874 | $ | 8,200 | $ | 5,245 | ||||||||||
In 2011 and 2009, one customer accounted for approximately 10.0% and 10.3%, respectively, of consolidated net sales. Sales to this customer were recorded in the Rail and Construction segments and were approximately $58,715,000 and $39,370,000 during 2011 and 2009, respectively. During 2010 no single customer accounted for more than 10% of the Company’s consolidated net sales. Sales between segments are immaterial.
Reconciliations of reportable segment net sales, profits, assets, depreciation/amortization, and expenditures for long-lived assets to the Company’s consolidated totals are illustrated as follows:
|
2011
|
2010
|
2009
|
||||||||||
|
In thousands
|
||||||||||||
|
Total for reportable segments
|
$ | 590,926 | $ | 475,050 | $ | 404,020 | ||||||
|
Other net sales
|
0 | 0 | 0 | |||||||||
|
Total
|
$ | 590,926 | $ | 475,050 | $ | 404,020 | ||||||
|
Income from Continuing Operations:
|
||||||||||||
|
Total for reportable segments
|
$ | 42,934 | $ | 36,453 | $ | 12,347 | ||||||
|
Adjustment of inventory to LIFO
|
(2,183 | ) | 2,276 | 11,039 | ||||||||
|
Unallocated interest income
|
321 | 403 | 789 | |||||||||
|
Unallocated equity in income/(losses) of nonconsolidated investments
|
708 | (213 | ) | 0 | ||||||||
|
Unallocated acquisition costs
|
0 | (2,413 | ) | (8 | ) | |||||||
|
Unallocated gain on sale of marketable securities
|
0 | 1,364 | 1,194 | |||||||||
|
Other unallocated amounts
|
(7,841 | ) | (5,128 | ) | 122 | |||||||
|
Income before income taxes
|
$ | 33,939 | $ | 32,742 | $ | 25,483 | ||||||
|
Assets:
|
||||||||||||
|
Total for reportable segments
|
$ | 297,282 | $ | 305,672 | $ | 200,874 | ||||||
|
Unallocated corporate assets
|
86,226 | 74,882 | 135,651 | |||||||||
|
LIFO and corporate inventory reserves
|
(9,743 | ) | (8,226 | ) | (10,677 | ) | ||||||
|
Unallocated property, plant and equipment
|
6,129 | 6,074 | 5,746 | |||||||||
|
Total assets
|
$ | 379,894 | $ | 378,402 | $ | 331,594 | ||||||
|
Depreciation/Amortization:
|
||||||||||||
|
Total for reportable segments
|
$ | 11,515 | $ | 8,680 | $ | 8,200 | ||||||
|
Other
|
845 | 809 | 520 | |||||||||
|
Total
|
$ | 12,360 | $ | 9,489 | $ | 8,720 | ||||||
|
Expenditures for Long-Lived Assets:
|
||||||||||||
|
Total for reportable segments
|
$ | 11,144 | $ | 5,275 | $ | 5,245 | ||||||
|
Expenditures financed under capital leases
|
0 | 199 | 0 | |||||||||
|
Other expenditures
|
795 | 686 | 862 | |||||||||
|
Total
|
$ | 11,939 | $ | 6,160 | $ | 6,107 | ||||||
The following table summarizes the Company’s sales by major geographic region in which the Company has operations:
|
2011
|
2010
|
2009
|
||||||||||
|
In thousands
|
||||||||||||
|
United States
|
$ | 499,478 | $ | 451,393 | $ | 390,792 | ||||||
|
Canada
|
41,252 | 10,008 | 4,853 | |||||||||
|
United Kingdom
|
14,728 | 627 | 0 | |||||||||
|
Other
|
35,468 | 13,022 | 8,375 | |||||||||
|
Total
|
$ | 590,926 | $ | 475,050 | $ | 404,020 | ||||||
The following table summarizes the Company’s long-lived assets by geographic region:
|
2011
|
2010
|
2009
|
||||||||||
|
In thousands
|
||||||||||||
|
United States
|
$ | 38,199 | $ | 35,942 | $ | 37,407 | ||||||
|
Canada
|
9,374 | 9,785 | 0 | |||||||||
|
United Kingdom
|
545 | 489 | 0 | |||||||||
|
Total
|
$ | 48,118 | $ | 46,216 | $ | 37,407 | ||||||
For the years ended December 31, 2011, 2010 and 2009, sales of the Company’s piling products totaled approximately $162,641,000, $146,703,000 and $124,103,000, respectively. For the years ended December 31, 2011, 2010 and 2009, sales of the Company’s rail distribution products totaled approximately $115,777,000, $102,155,000 and $102,632,000, respectively. For the years ended December 31, 2011, 2010 and 2009, sales of the Company’s CXT concrete tie products totaled approximately $48,968,000, $53,518,000 and $41,760,000. For the year ended December 31, 2011, Portec product sales totaled approximately $106,117,000.
Note 3.
Acquisitions
Portec Rail Products, Inc.
On December 15, 2010, the Company acquired Portec Rail Products, Inc. (Portec) and recorded its acquisition in accordance with ASC 805, “Business Combinations.” Pursuant to the terms of the Agreement and Plan of Merger, the Company’s subsidiary was merged with and into Portec, with Portec surviving as a wholly owned subsidiary of the Company. The merger was consummated pursuant to Section 31D-11-1105 of the West Virginia Business Corporation Act without a vote or meeting of Portec’s stockholders. All outstanding shares of common stock of Portec not owned by the Company were canceled and converted into the right to receive consideration equal to $11.80 per share (the same price paid in the tender offer), net to the holder in cash, without interest thereon. The total consideration paid in cash by the Company for the shares acquired in the merger and tender offer was approximately $113,322,000, including a final payment of $8,952,000 made in January 2011.
The Company made adjustments to the preliminary purchase price allocation during the measurement period related to the identification of certain intangible assets, asset retirement obligations associated with leased facilities and deferred tax assets and liabilities. These adjustments did not significantly impact depreciation or amortization expense.
In accordance with ASC 805, the Company has reclassified its Consolidated Balance Sheet as of December 31, 2010 to reflect these adjustments.
The following table presents the final allocation of the aggregate purchase price based on estimated fair values and adjustments made during the measurement period:
|
Preliminary
|
Final
|
|||||||||||
|
Allocation
|
Adjustments
|
Allocation
|
||||||||||
|
In thousands
|
||||||||||||
|
Cash and cash equivalents
|
$ | 16,455 | $ | 0 | $ | 16,455 | ||||||
|
Accounts receivable
|
19,857 | 0 | 19,857 | |||||||||
|
Inventories
|
21,048 | 0 | 21,048 | |||||||||
|
Assets held for sale – insulated joint business
|
10,179 | 0 | 10,179 | |||||||||
|
Other current assets
|
3,009 | 0 | 3,009 | |||||||||
|
Property, plant & equipment
|
10,998 | (120 | ) | 10,878 | ||||||||
|
Identified intangible assets
|
43,670 | 350 | 44,020 | |||||||||
|
Other assets
|
411 | 0 | 411 | |||||||||
|
Total identifiable assets acquired
|
125,627 | 230 | 125,857 | |||||||||
|
Debt obligations
|
(7,492 | ) | 0 | (7,492 | ) | |||||||
|
Accounts payable – trade
|
(10,885 | ) | 0 | (10,885 | ) | |||||||
|
Deferred revenue
|
(2,211 | ) | 0 | (2,211 | ) | |||||||
|
Accrued payroll and employee benefits
|
(4,373 | ) | 0 | (4,373 | ) | |||||||
|
Other accrued liabilities
|
(8,156 | ) | (160 | ) | (8,316 | ) | ||||||
|
Other long-term liabilities
|
(7,066 | ) | 0 | (7,066 | ) | |||||||
|
Deferred tax liabilities
|
(13,280 | ) | 472 | (12,808 | ) | |||||||
|
Net identifiable assets acquired
|
72,164 | 542 | 72,706 | |||||||||
|
Goodwill
|
41,158 | (542 | ) | 40,616 | ||||||||
|
Net assets acquired
|
$ | 113,322 | $ | 0 | $ | 113,322 | ||||||
The Company finalized purchase accounting for the Portec acquisition in the fourth quarter of 2011.
The $44,020,000 of acquired identified intangible assets will be amortized over their respective, expected useful lives. Of the amount allocated to identifiable intangible assets, $6,280,000 was assigned to trademarks (8-20 year useful lives), $19,230,000 was assigned to acquired technology (8-25 year useful lives), $18,160,000 was assigned to customer relationships (25-year useful life), and $350,000 was assigned to supplier relationships (5-year useful life).
The Company repaid all of the outstanding debt of Portec in December 2010.
The acquisition of Portec will help the Company become a strategic provider of products and services below the wheel for the Class I, transit, shortline and regional railroads and contractors in North America, as well as to governmental agencies and rail contractors globally. It will broaden the Company’s offerings by adding Portec’s friction management and wayside detection products and services. This acquisition will also assist the Company’s international expansion, as Portec currently has a strong presence in Canada and the United Kingdom, and has continued to improve its presence in Europe, Brazil, Southeast Asia, China and Australia.
The amount allocated to goodwill reflects the premium paid to acquire Portec. More information regarding goodwill can be found in Note 4, “Goodwill and Other Intangible Assets.”
The results of the operations of Portec are included in the Company’s Consolidated Statement of Operations as of December 15, 2010. Net revenues and net loss resulting from Portec that were included in the Company’s operating results were $4,822,000 and $(213,000), respectively, for the year ended December 31, 2010.
The unaudited pro forma results for the periods presented below are prepared as if the transaction occurred as of January 1, 2009. Pro forma adjustments exclude operating results of the divested rail joint business, and include depreciation and amortization and other adjustments in connection with the acquisition.
| For the year Ended December 31, | ||
| 2010 | 2009 | |
| In thousands, except per share data | ||
|
Total net sales
|
$564,028
|
$478,280
|
|
Earnings before income taxes
|
$32,557
|
$27,132
|
|
Net income
|
$21,817
|
$17,778
|
|
Basic earnings per share
|
$2.13
|
$1.75
|
|
Dilutive earnings per share
|
$2.11
|
$1.73
|
Acquisition costs of approximately $2,413,000 for the period ended December 31, 2010 were classified as “Selling and Administrative Expenses.”
Interlocking Deck Systems International, LLC
On March 23, 2010, the Company purchased, pursuant to an Asset Purchase Agreement (Purchase Agreement), certain assets of Interlocking Deck Systems International, LLC (IDSI) for $7,000,000. The purchase price was $5,050,000 in cash paid on the closing date and $1,000,000 paid on the first anniversary of the closing, as defined in the Purchase Agreement, and $950,000 payable on the second anniversary of the closing, with the deferred payment obligations being embodied in a promissory note. No liabilities were assumed in this acquisition. The pro forma results for this acquisition were not material to the Company’s financial results.
The acquisition of IDSI will strengthen the Company’s position as a leading supplier of steel bridge decking. The acquisition has been accounted for in accordance with ASC 805, “Business Combinations.” The following table presents the allocation of the aggregate purchase price based on estimated fair values:
|
In thousands
|
||||
|
Equipment
|
$ | 1,241 | ||
|
Inventory
|
918 | |||
|
Proprietary software
|
90 | |||
|
Non-compete agreements and other intangible assets
|
1,830 | |||
|
Net identifiable assets acquired
|
4,079 | |||
|
Goodwill
|
2,861 | |||
|
Net assets acquired
|
$ | 6,940 | ||
The amount allocated to goodwill reflects the premium paid for the right to control the business acquired and synergies the Company expects to realize from expanding its steel bridge decking business and from eliminating redundant selling and administrative responsibilities and workforce efficiencies. The goodwill is deductible for tax purposes and has been allocated to the Construction Products Segment. More information regarding goodwill can be found in Note 4, “Goodwill and Other Intangible Assets.”
Pursuant to the Purchase Agreement, other than the specifically identified assets included above, no other assets or liabilities of IDSI were included in the acquisition. Acquisition costs were approximately $27,000 for the period ended December 31, 2010 and were classified as “Selling and administrative expenses.”
Note 4.
Goodwill and Other Intangible Assets
The carrying amount of goodwill for the periods ended December 31, 2011 and December 31, 2010 was $43,825,000, of which $40,614,000 is attributable to the Company’s Rail Products segment and $3,211,000 is attributable to Construction Products segment.
As part of our procedures to determine fair values of all acquired assets, we determined the fair value of technology, intellectual property, goodwill and other intangible assets.
Identified intangible assets as of December 31, 2011 of $2,305,000 are attributable to the Company’s Construction Products segment and $44,457,000 are attributable to the Company’s Rail Products segment. The components of the Company’s intangible assets are as follows:
|
December 31, 2011
|
||||||||||||||||
|
Weighted Average
|
Gross
|
Net
|
||||||||||||||
|
Amortization Period
|
Carrying
|
Accumulated
|
Carrying
|
|||||||||||||
|
In Years
|
Value
|
Amortization
|
Amount
|
|||||||||||||
|
In thousands
|
||||||||||||||||
|
Non-compete agreements
|
5 | $ | 380 | $ | (361 | ) | $ | 19 | ||||||||
|
Patents
|
10 | 125 | (125 | ) | 0 | |||||||||||
|
Customer relationships
|
23 | 19,960 | (1,402 | ) | 18,558 | |||||||||||
|
Supplier relationships
|
5 | 350 | (73 | ) | 277 | |||||||||||
|
Trademarks
|
17 | 6,280 | (447 | ) | 5,833 | |||||||||||
|
Technology
|
18 | 19,667 | (1,306 | ) | 18,361 | |||||||||||
| 20 | $ | 46,762 | $ | (3,714 | ) | $ | 43,048 | |||||||||
|
December 31, 2010
|
||||||||||||||||
|
Weighted Average
|
Gross
|
Net
|
||||||||||||||
|
Amortization Period
|
Carrying
|
Accumulated
|
Carrying
|
|||||||||||||
|
In Years
|
Value
|
Amortization
|
Amount
|
|||||||||||||
|
In thousands
|
||||||||||||||||
|
Non-compete agreements
|
5 | $ | 380 | $ | (355 | ) | $ | 25 | ||||||||
|
Patents
|
10 | 125 | (113 | ) | 12 | |||||||||||
|
Customer relationships
|
23 | 19,960 | (316 | ) | 19,644 | |||||||||||
|
Supplier relationships
|
5 | 350 | (3 | ) | 347 | |||||||||||
|
Trademarks
|
17 | 6,280 | (16 | ) | 6,264 | |||||||||||
|
Technology
|
18 | 19,230 | (93 | ) | 19,137 | |||||||||||
| 20 | $ | 46,325 | $ | (896 | ) | $ | 45,429 | |||||||||
In conjunction with the acquisition of Portec, the Company recorded the fair values of the acquired intangible assets in accordance with ASC 805, Business Combinations. As part of our procedures to determine fair values of all acquired assets the Company evaluated the technology and intellectual property along with other intangible assets that could be assigned a fair value under the acquisition. The Company developed historical and projected cash flows of the technology-based product lines along with an estimate of future costs to maintain these technologies. These estimates and other assumptions were used to determine the present value of the discounted cash flows of these various technologies. In addition, the Company evaluated the future lives of the identified intangible assets to determine if they have definite or indefinite lives.
As a result of the Portec acquisition, the Company assigned a fair value of $6,280,000 to trademarks, $19,230,000 to technology-based product lines, $18,160,000 to customer relationships and $350,000 to a supplier relationship. Several factors were considered that contributed to the fair value of these intangible assets, including, but not limited to, the Company’s position within the global railway supply industry, the level of competition that exists, the life-cycle of the product categories, and the acceptance of the technologies within the global railway supply industry.
As a result of the IDSI acquisition, the Company assigned a fair value of $30,000 to non-compete agreements and $1,800,000 to customer relationships. These identified intangible assets are being amortized over their respective useful lives identified in the above table.
Intangible assets are amortized over their useful lives ranging from 5 to 25 years, with a total weighted average amortization period of approximately 20 years. Amortization expense for years ended December 31, 2011, 2010 and 2009 was approximately $2,818,000, $445,000 and $13,000, respectively.
Estimated amortization expense over the succeeding five years and thereafter is as follows:
|
In thousands
|
||||
|
2012
|
$ | 2,768 | ||
|
2013
|
2,768 | |||
|
2014
|
2,768 | |||
|
2015
|
2,489 | |||
|
2016
|
2,332 | |||
|
Thereafter
|
29,923 | |||
| $ | 43,048 | |||
Note 5.
Accounts Receivable
Accounts receivable at December 31, 2011 and 2010 are summarized as follows:
|
2011
|
2010
|
|||||||
|
In thousands
|
||||||||
|
Trade
|
$ | 68,403 | $ | 68,509 | ||||
|
Allowance for doubtful accounts
|
(1,810 | ) | (1,601 | ) | ||||
| 66,593 | 66,908 | |||||||
|
Other
|
1,934 | 2,789 | ||||||
| $ | 68,527 | $ | 69,697 | |||||
Bad debt expense/(recovery) was $261,000, $247,000 and ($564,000) in 2011, 2010 and 2009, respectively.
The Company’s customers are principally in the Rail, Construction and Tubular segments of the economy. As of December 31, 2011 and 2010, trade receivables, net of allowance for doubtful accounts, from customers in these markets were as follows:
|
2011
|
2010
|
|||||||
|
In thousands
|
||||||||
|
Rail
|
$ | 32,574 | $ | 35,687 | ||||
|
Construction
|
30,687 | 28,474 | ||||||
|
Tubular
|
3,332 | 2,747 | ||||||
| $ | 66,593 | $ | 66,908 | |||||
Credit is extended on an evaluation of the customer’s financial condition and generally collateral is not required.
Note 6.
Inventories
Inventories at December 31, 2011 and 2010 are summarized as follows:
|
2011
|
2010
|
||||||||
|
In thousands
|
|||||||||
|
Finished goods
|
$ | 73,088 | $ | 71,634 | |||||
|
Work-in-process
|
9,056 | 5,346 | |||||||
|
Raw materials
|
20,317 | 21,387 | |||||||
|
Total inventories at current costs
|
102,461 | 98,367 | |||||||
|
Less:
|
|||||||||
|
Current cost over LIFO stated values
|
(10,183 | ) | (8,000 | ) | |||||
| $ | 92,278 | $ | 90,367 | ||||||
At December 31, 2011 and 2010, the LIFO carrying value of inventories for book purposes exceeded the LIFO value for tax purposes by approximately $14,636,000 and $11,973,000, respectively. During 2011, liquidation of certain LIFO inventory layers carried at costs which were lower than the costs of current purchases. The effect of these reductions in 2011 was to decrease cost of goods sold by $33,000. During 2010, liquidation of LIFO layers carried at costs that were higher than current purchases resulted in an increase to cost of goods sold of $1,046,000. During 2009, liquidation of LIFO layers carried at costs that were lower than current purchases resulted in a decrease to cost of goods sold of $34,000.
Note 7.
Property, Plant and Equipment
Property, plant and equipment at December 31, 2011 and 2010 consist of the following:
|
2011
|
2010
|
|||||||
|
In thousands
|
||||||||
|
Land
|
$ | 5,091 | $ | 5,094 | ||||
|
Improvements to land and leaseholds
|
22,734 | 19,238 | ||||||
|
Buildings
|
12,486 | 11,445 | ||||||
|
Machinery and equipment, including equipment
|
||||||||
|
under capitalized leases
|
84,934 | 79,897 | ||||||
|
Construction in progress
|
4,285 | 3,944 | ||||||
| 129,530 | 119,618 | |||||||
|
Less accumulated depreciation and amortization,
|
||||||||
|
including accumulated amortization of capitalized leases
|
81,412 | 73,402 | ||||||
| $ | 48,118 | $ | 46,216 | |||||
Depreciation expense, including amortization of assets under capital leases, for the years ended December 31, 2011, 2010 and 2009 amounted to $9,509,000, $8,707,000, and $8,656,000, respectively.
Note 8.
Investments
Investments of the Company consist of a nonconsolidated equity method investment of $3,495,000 and $1,987,000 at December 31, 2011 and December 31, 2010, respectively.
The Company is a member of a joint venture with L B Industries, Inc. and James Legg until June 30, 2019. The Company and L B Industries, Inc. each have a 45% ownership interest in the joint venture, L B Pipe & Coupling Products, LLC (JV), which commenced operations in January 2010. The venture manufactures, markets and sells various products for the energy, utility and construction markets. Under the terms of the JV agreement, as amended, the Company was initially required to make capital contributions totaling approximately $2,200,000. The Company fulfilled these commitments during 2010. Under terms of additional amendments to the JV agreement, the Company was required to make additional capital contributions totaling approximately $800,000, bringing the Company’s total required capital contributions to $3,000,000. The Company fulfilled the additional commitments during 2011. The other JV members are required to make proportionate contributions in accordance with the ownership percentages in the JV agreement.
Under applicable guidance for variable interest entities in ASC 810, “Consolidation,” the Company determined that the JV is a variable interest entity, as the JV has not demonstrated that it has sufficient equity to support its operations without additional financial support. The Company concluded that it is not the primary beneficiary of the variable interest entity, as the Company does not have a controlling financial interest and does not have the power to direct the activities that most significantly impact the economic performance of the JV. Accordingly, the Company concluded that the equity method of accounting remains appropriate.
The Company recorded equity in the income of the JV of approximately $708,000 for 2011. The Company recorded equity in the losses of the JV of approximately $(213,000) for 2010.
The Company’s exposure to loss results from its capital contributions, net of the Company’s share of the venture’s gains or losses, and its net investment in the direct financing lease covering the facility used by the JV for its operations. The carrying amounts with the maximum exposure to loss of the Company at December 31, 2011 and 2010, respectively, are as follows:
|
2011
|
2010
|
|||||||
|
In thousands
|
||||||||
|
Equity method investment
|
$ | 3,495 | $ | 1,987 | ||||
|
Net investment in direct financing lease
|
971 | 1,018 | ||||||
| $ | 4,466 | $ | 3,005 | |||||
The Company is leasing five acres of land and the facility to the JV over a period of 9.5 years, with a 5.5 year renewal period. Monthly rent over the term of the lease is approximately $10,000, with a balloon payment of approximately $488,000 which is required to be paid either at the termination of the lease, allocated over the renewal period or during the initial term of the lease. This lease qualifies as a direct financing lease under the applicable guidance in ASC 840-30, “Leases.” The Company maintained a net investment in this direct financing lease of approximately $971,000 and $1,018,000 at December 31, 2011 and 2010, respectively.
The following is a schedule of the direct financing minimum lease payments for the next five years and thereafter:
|
In thousands
|
||||
|
2012
|
$ | 51 | ||
|
2013
|
54 | |||
|
2014
|
58 | |||
|
2015
|
63 | |||
|
2016
|
67 | |||
|
Thereafter
|
678 | |||
| $ | 971 | |||
The Company recorded its acquisition of Portec in accordance with ASC 805. (Refer to Note 3, “Acquisitions”). In connection with ASC 805-10-25, the Company remeasured its previously held equity interest in Portec at the acquisition date fair value and recognized a gain of $1,364,000 on December 15, 2010.
During 2009, the Company sold shares of its investment in Portec available-for-sale marketable equity securities with an original cost of approximately $921,000, for cash proceeds of approximately $2,115,000 and recognized a gain of approximately $1,194,000.
Note 9.
Deferred Revenue
Deferred revenue consists of customer payments received for which the sales process has been substantially completed but the right to recognize revenue has not yet been met. The Company has significantly fulfilled its obligations under the contracts and the customers have paid, but due to the Company’s continuing involvement with the material while in storage, revenue is precluded from being recognized until the customer takes possession.
Note 10.
Borrowings
United States
On May 2, 2011, the Company, its domestic subsidiaries, and certain Canadian subsidiaries entered into a new $125,000,000 Revolving Credit Facility Credit Agreement (Credit Agreement) with PNC Bank, N.A., Bank of America, N.A., Wells Fargo Bank, N.A. and Citizens Bank of Pennsylvania. This Credit Agreement replaced a prior revolving credit facility with a maximum credit line of $90,000,000 and a $20,000,000 term loan. The Credit Agreement provides for a five-year, unsecured revolving credit facility that permits borrowing up to $125,000,000 for the U.S. borrowers and a sublimit of the equivalent of $15,000,000 U.S. dollars that is available to the Canadian borrowers. Providing no event of default exists, the Credit Agreement contains a provision that provides for an increase in the revolver facility of $50,000,000 that can be allocated to existing or new lenders if the Company’s borrowing requirements should grow. The Credit Agreement includes a sublimit of $20,000,000 for the issuance of trade and standby letters of credit.
Borrowings under the Credit Agreement will bear interest at rates based upon either the base rate or LIBOR based rate plus applicable margins. Applicable margins are dictated by the ratio of the Company’s Indebtedness less cash on hand to the Company’s consolidated EBITDA, as defined in the underlying Credit Agreement. The base rate is the highest of (a) PNC Bank’s prime rate, (b) the Federal Funds Rate plus .50% or (c) the daily LIBOR, as defined in the underlying Credit Agreement, rate plus 1.00%. The base rate spread ranges from 0.00% to 1.00%. LIBOR based rates are determined by dividing the published LIBOR rate by a number equal to 1.00 minus the percentage prescribed by the Federal Reserve for determining the maximum reserve requirements with respect to any Eurocurrency funding by banks on such day. The LIBOR based rate spread ranges from 1.00% to 2.00%.
The Credit Agreement includes two financial covenants: (a) the Leverage Ratio, defined as the Company’s Indebtedness less cash on hand divided by the Company’s consolidated EBITDA, which must not exceed 3.00 to 1.00 and (b) Minimum Interest Coverage, defined as consolidated EBITDA less Capital Expenditures divided by consolidated interest expense, which must be no less than 3.00 to 1.00.
The Credit Agreement contains certain limitations regarding share repurchases, dividends, loans to other parties, and other activities when borrowings are outstanding. The Company is permitted to acquire the stock or assets of other entities with limited restrictions providing that the Leverage Ratio does not exceed 2.50 to 1.00 after giving effect to the acquisition.
Other restrictions exist at all times including, but not limited to, limitation of the Company’s sale of assets, other indebtedness incurred by either the borrowers or the non-borrower subsidiaries of the Company, guaranties, and liens.
As of December 31, 2011, the Company was in compliance with the Agreement’s covenants.
The Company had no outstanding borrowings under the revolving credit facility at December 31, 2011 and had available borrowing capacity of $123,896,000. The Company had no outstanding borrowings at December 31, 2010, under the prior revolving credit facility or prior term loan.
United Kingdom
A subsidiary of the Company has a working capital facility with NatWest Bank for its United Kingdom operations which includes an overdraft availability of £1,500,000 pounds sterling (approximately $2,331,000 at December 31, 2011). This credit facility supports the working capital requirements and is collateralized by substantially all of the assets of its United Kingdom operations. The interest rate on this facility is the financial institution’s base rate plus 1.50%. Outstanding performance bonds reduce availability under this credit facility. There were no borrowings or performance bonds outstanding on this facility as of December 31, 2011 or 2010. The expiration date of this credit facility is June 30, 2012.
The United Kingdom loan agreements contain certain financial covenants that require it to maintain senior interest and cash flow coverage ratios. The subsidiary was in compliance with these financial covenants as of December 31, 2011.
Letters of Credit
At December 31, 2011 the Company had outstanding letters of credit of approximately $1,104,000.
Note 11.
Long-term debt at December 31, 2011 and 2010 consists of the following:
|
2011
|
2010
|
|||||||
|
In thousands
|
||||||||
|
Lease obligations payable in installments through 2015 with a weighted average
|
||||||||
|
interest rate of 7.10% at December 31, 2011 and 6.97% at December 31, 2010
|
$ | 1,490 | $ | 2,881 | ||||
|
Promissory notes issued in connection with the acquisition of
|
||||||||
|
IDSI with imputed interest rates of 2.10%
|
945 | 1,920 | ||||||
| 2,435 | 4,801 | |||||||
|
Less current maturities
|
2,384 | 2,402 | ||||||
| $ | 51 | $ | 2,399 | |||||
The maturities of long-term debt for each of the succeeding four years subsequent to December 31, 2011 are as follows:
|
Year
|
In thousands
|
|||
|
2012
|
$ | 2,384 | ||
|
2013
|
31 | |||
|
2014
|
19 | |||
|
2015
|
1 | |||
|
Total
|
$ | 2,435 | ||
Note 12.
Stockholders’ Equity
At December 31, 2011 and 2010, the Company had authorized shares of 20,000,000 in Common stock and 5,000,000 in Preferred stock. No Preferred stock has been issued. The Common stock has a par value of $.01 per share. No par value has been assigned to the Preferred stock.
The Company’s Board of Directors authorized the purchase of up to $25,000,000 in shares of its Common stock through a share repurchase program announced in May 2011 at prevailing market prices or privately negotiated transactions. During 2011 the Company purchased 278,655 shares of common stock for approximately $6,480,000. This authorization expires on December 31, 2013.
The Company’s Board of Directors authorized the purchase of up to $40,000,000 in shares of its Common stock through share repurchase programs announced in 2008 at prevailing market prices or privately negotiated transactions. There were no such repurchases of common stock under these programs during 2010. During 2009 the Company purchased 86,141 shares of common stock for approximately $1,863,000. The authorization expired on December 31, 2010.
Cash dividends of approximately $1,022,000 were paid in 2011. No cash dividends on Common stock were paid in 2010 or 2009.
Note 13.
Accumulated Other Comprehensive Loss
The components of accumulated other comprehensive loss, net of tax, for the years ended December 31, 2011 and 2010, are as follows:
|
2011
|
2010
|
|||||||
|
In thousands
|
||||||||
|
Pension liability adjustment
|
$ | (3,439 | ) | $ | (1,185 | ) | ||
|
Foreign currency translation adjustments
|
(1,189 | ) | 117 | |||||
| $ | (4,628 | ) | $ | (1,068 | ) | |||
Note 14.
Earnings Per Common Share
The following table sets forth the computation of basic and diluted earnings per common share:
|
Year ended December 31,
|
||||||||||||
|
2011
|
2010
|
2009
|
||||||||||
|
(In thousands, except per share amounts)
|
||||||||||||
|
Numerator for basic and diluted earnings per common share-
|
||||||||||||
|
net income available to common stockholders:
|
$ | 22,895 | $ | 20,492 | $ | 15,727 | ||||||
|
Denominator:
|
||||||||||||
|
Weighted average shares
|
10,209 | 10,219 | 10,169 | |||||||||
|
Denominator for basic earnings per common share
|
10,209 | 10,219 | 10,169 | |||||||||
|
Effect of dilutive securities:
|
||||||||||||
|
Employee stock options
|
29 | 67 | 99 | |||||||||
|
Other stock compensation plans
|
74 | 62 | 36 | |||||||||
|
Dilutive potential common shares
|
103 | 129 | 135 | |||||||||
|
Denominator for diluted earnings per common share-adjusted
|
||||||||||||
|
weighted average shares and assumed conversions
|
10,312 | 10,348 | 10,304 | |||||||||
|
Basic earnings per common share
|
$ | 2.24 | $ | 2.01 | $ | 1.55 | ||||||
|
Diluted earnings per common share
|
$ | 2.22 | $ | 1.98 | $ | 1.53 | ||||||
There were no antidilutive shares in 2011, 2010 and 2009.
Note 15.
Income Taxes
Significant components of the Company’s deferred tax liabilities and assets as of December 31, 2011 and 2010 are as follows:
|
2011
|
2010
|
|||||||
|
Deferred tax liabilities:
|
In thousands
|
|||||||
|
Goodwill and other intangibles
|
$ | (12,884 | ) | $ | (13,452 | ) | ||
|
Depreciation
|
(3,499 | ) | (2,080 | ) | ||||
|
Inventories
|
(4,333 | ) | (2,979 | ) | ||||
|
Unrepatriated earnings of foreign subsidiary
|
(428 | ) | (428 | ) | ||||
|
Other-net
|
(174 | ) | 0 | |||||
|
Total deferred tax liabilities
|
(21,318 | ) | (18,939 | ) | ||||
|
Deferred tax assets:
|
||||||||
|
Pension liability
|
3,210 | 2,313 | ||||||
|
Warranty reserve
|
2,058 | 1,712 | ||||||
|
Deferred compensation
|
1,601 | 1,146 | ||||||
|
Accounts receivable
|
924 | 845 | ||||||
|
Long-term liabilities
|
675 | 1,410 | ||||||
|
Deferred gain on sale / leaseback
|
178 | 593 | ||||||
|
State tax incentives
|
5 | 56 | ||||||
|
Net operating loss carryforwards
|
88 | 100 | ||||||
|
Foreign tax credit carryforwards
|
112 | 196 | ||||||
|
Other-net
|
0 | 90 | ||||||
|
Total deferred tax assets
|
8,851 | 8,461 | ||||||
|
Valuation allowance for deferred tax assets
|
0 | 0 | ||||||
|
Deferred tax assets
|
8,851 | 8,461 | ||||||
|
Net deferred tax (liability) / asset
|
$ | (12,467 | ) | $ | (10,478 | ) | ||
Significant components of the provision for income taxes are as follows:
|
2011
|
2010
|
2009
|
||||||||||
|
In thousands
|
||||||||||||
|
Current:
|
||||||||||||
|
Federal
|
$ | 4,573 | $ | 10,300 | $ | 8,990 | ||||||
|
State
|
494 | 789 | 1,441 | |||||||||
|
Foreign
|
2,493 | 31 | 0 | |||||||||
|
Total current
|
7,560 | 11,120 | 10,431 | |||||||||
|
Deferred:
|
||||||||||||
|
Federal
|
3,446 | 1,204 | (783 | ) | ||||||||
|
State
|
553 | 111 | 108 | |||||||||
|
Foreign
|
(515 | ) | (185 | ) | 0 | |||||||
|
Total deferred
|
3,484 | 1,130 | (675 | ) | ||||||||
|
Total income tax expense
|
$ | 11,044 | $ | 12,250 | $ | 9,756 | ||||||
The company has unrecorded deferred income taxes on the undistributed earnings of its foreign subsidiaries because of management’s intent and practice to indefinitely reinvest such earnings. At December 31, 2011, the aggregate undistributed earnings of the foreign subsidiaries (including cumulative unrealized currency gains related to previously taxed income) amounted to approximately $40,556,000. Upon distribution of these earnings in the form of dividends or otherwise, the Company may be subject to U.S. income taxes and foreign withholding taxes. It is not practical, however, to estimate the amount of taxes that may be payable on the eventual remittance of these earnings because of the complexity of the calculation.
Income before income taxes, as shown in the accompanying consolidated statements of operations, includes the following components:
|
2011
|
2010
|
2009
|
||||||||||
|
In thousands
|
||||||||||||
|
Domestic
|
$ | 24,720 | $ | 32,845 | $ | 25,483 | ||||||
|
Foreign
|
9,219 | (103 | ) | 0 | ||||||||
|
Income before income taxes
|
$ | 33,939 | $ | 32,742 | $ | 25,483 | ||||||
The reconciliation of income tax computed at statutory rates to income tax expense is as follows:
|
2011
|
2010
|
2009
|
|
|
Statutory rate
|
35.0%
|
35.0%
|
35.0%
|
|
Rates different than statutory
|
(2.2)
|
0.0
|
0.0
|
|
State income tax
|
2.1
|
2.2
|
4.0
|
|
Nondeductible expenses
|
0.7
|
0.2
|
(1.0)
|
|
Tax credits
|
(1.9)
|
0.0
|
0.0
|
|
Other
|
(1.2)
|
0.0
|
0.3
|
|
32.5%
|
37.4%
|
38.3%
|
At December 31, 2011 and 2010, the tax benefit of net operating loss carryforwards available for state income tax purposes was approximately $88,000 and $100,000, respectively. The net operating loss carryforwards will expire in 2017 through 2024. The Company has foreign tax credit carryforwards in the amount of $112,000 that will expire in 2012 through 2016. The Company received approximately $903,000 in state tax refunds in 2011 not previously recognized by the Company as realization was not more likely than not.
The following table provides a reconciliation of unrecognized tax benefits as of December 31, 2011 and 2010:
|
2011
|
2010
|
|||||||
|
In thousands
|
||||||||
|
Unrecognized tax benefits at beginning of period:
|
$ | 645 | $ | 119 | ||||
|
Portec acquisition
|
0 | 581 | ||||||
|
Increases based on tax positions for prior periods
|
1,401 | 0 | ||||||
|
Increases based on tax positions related to current period
|
34 | 0 | ||||||
|
Decreases related to settlements with taxing authorities
|
(139 | ) | 0 | |||||
|
Decreases as a result of a lapse of the applicable statute of limitations
|
(92 | ) | (55 | ) | ||||
|
Balance at end of period
|
$ | 1,849 | $ | 645 | ||||
The total amount of unrecognized tax benefits that, if recognized, would affect the effective tax rate is $1,849,000 at December 31, 2011. The Company accrues interest and penalties related to unrecognized tax benefits in its provision for income taxes. At December 31, 2011, the Company had accrued interest and penalties related to unrecognized tax benefits of $316,000.
The Company files income tax returns in the United States and in various state, local and foreign jurisdictions. The Company is subject to federal income tax examinations for the period 2008 forward. With respect to the state, local and foreign filings, the Company is generally subject to income tax examinations for the periods 2007 forward.
Note 16.
Stock-Based Compensation
The Company applies the provisions of FASB ASC 718, “Compensation – Stock Compensation,” to account for the Company’s share-based compensation. Share-based compensation cost is measured at the grant date based on the calculated fair value of the award and is recognized over the employees’ requisite service period. The Company recorded stock compensation expense of $1,958,000, $1,944,000 and $653,000 for the periods ended December 31, 2011, 2010 and 2009, respectively, related to stock option awards, fully-vested stock awards, restricted stock awards and performance unit awards as follows.
Stock Option Awards
The Company has three equity compensation plans: The 1985 Long-Term Incentive Plan (1985 Plan), the 1998 Long-Term Incentive Plan for Officers and Directors, amended and restated in May 2011, (1998 Plan) and the 2006 Omnibus Incentive Plan, amended and restated in May 2011 (Omnibus Plan). The 1985 Plan expired on January 1, 2005. Although no further awards can be made under the 1985 Plan, prior awards are not affected by the termination of the Plan.
The 1998 Plan provides for the award of options to key employees and directors to purchase up to 900,000 shares of Common stock at no less than 100% of fair market value on the date of the grant. The 1998 Plan provides for the granting of “nonqualified options” and “incentive stock options” with a duration of not more than ten years from the date of grant. The Plan also provides that, unless otherwise set forth in the option agreement, options are exercisable in installments of up to 25% annually beginning one year from date of grant. Outside directors were automatically awarded fully vested, nonqualified stock options to acquire 5,000 shares of the Company’s Common stock on each date the outside directors were elected at an annual shareholders’ meeting to serve as directors. The 1998 Plan was amended in May 2006 to remove the automatic awarding of options to outside directors.
The Omnibus Plan allows for the issuance of 900,000 shares of Common stock through the granting of stock options or stock awards (including performance units convertible into stock) to key employees and directors at no less than 100% of fair market value on the date of the grant. The Omnibus Plan provides for the granting of “nonqualified options” with a duration of not more than ten years from the date of grant. The Omnibus Plan also provides that, unless otherwise set forth in the option agreement, options are exercisable in installments of up to 25% annually beginning one year from the date of grant. No options have been granted under the Omnibus Plan.
There was no stock compensation expense related to stock options recorded in 2011 or 2010. The Company recorded stock compensation expense related to stock option awards of $25,000 for the period ended December 31, 2009.
Certain information for the three years ended December 31, 2011 relative to employee stock options is summarized as follows:
|
2011
|
2010
|
2009
|
||
|
Number of shares under Incentive Plan:
|
||||
|
Outstanding at beginning of year
|
80,950
|
180,950
|
194,700
|
|
|
Granted
|
-
|
-
|
-
|
|
|
Canceled
|
-
|
-
|
-
|
|
|
Exercised
|
(41,000)
|
(100,000)
|
(13,750)
|
|
|
Outstanding and Exercisable at end of year
|
39,950
|
80,950
|
180,950
|
|
|
Number of shares available for future grant:
|
||||
|
Beginning of year
|
391,881
|
443,566
|
471,627
|
|
|
End of year
|
321,653
|
391,881
|
443,566
|
|
At December 31, 2011, Common stock options outstanding and exercisable under the Plans had option prices ranging from $4.23 to $14.77, with a weighted average price of $8.94. At December 31, 2010 and 2009, Common stock options outstanding and exercisable under the Plans had option prices ranging from $2.75 to $14.77, with a weighted average price of $6.95 and $5.60 per share, respectively.
The weighted average remaining contractual life of the stock options outstanding and exercisable for the three years ended December 31, 2011 are: 2011-2.8 years; 2010-2.7 years; and 2009-2.7 years.
The total intrinsic value of options outstanding and exercisable at December 31, 2011, 2010 and 2009 was $773,000, $2,751,000 and $4,381,000, respectively.
The weighted average exercise price per share of options exercised in 2011, 2010 and 2009 was $5.02, $4.51 and $4.73, respectively.
The total intrinsic value of options exercised during the years ended December 31, 2011, 2010 and 2009 was $1,112,000, $2,483,000 and $359,000, respectively.
Certain information for the year ended December 31, 2011 relative to employee stock options at
respective exercise price ranges is summarized as follows:
|
Options Outstanding and Exercisable
|
||||||||||||||
|
Range of
|
Number
|
Weighted Average
|
Weighted
|
|||||||||||
|
Exercise Prices
|
of Shares
|
Remaining Life
|
Exercise Price
|
|||||||||||
| $4.10 - $5.50 | 6,000 | 1.3 | $ | 4.21 | ||||||||||
| $7.81 - $8.97 | 20,000 | 2.9 | 8.39 | |||||||||||
| $9.29 - $14.77 | 13,950 | 3.4 | 11.75 | |||||||||||
| 39,950 | 2.8 | $ | 8.94 | |||||||||||
Shares issued as a result of stock option exercise generally will be from previously issued shares which have been reacquired by the Company and held as Treasury shares.
Fully-Vested Stock Awards
Non-employee directors are automatically awarded 3,500 fully vested shares, or a lesser amount determined by the directors, of the Company’s Common stock on each date the outside directors are elected at an annual shareholders’ meeting to serve as directors.
The outside directors were granted a total of 10,500, 12,000 and 10,500 fully vested shares for the years ended December 31, 2011, 2010 and 2009, respectively. Compensation expense recorded by the Company related to fully-vested stock awards to non-employee directors was approximately $370,000, $340,000 and $314,000 for the years ended December 31, 2011, 2010 and 2009, respectively.
In addition to the 12,000 shares of fully-vested stock granted to the outside directors in 2010, the Company granted, pursuant to the Omnibus Plan approximately 2,000 fully-vested shares to key employees. The grant date fair value of these fully-vested stock grants was $34.73. The weighted average fair value of all the fully-vested stock grants awarded was $35.24, $29.10 and $29.89 per share for 2011, 2010 and 2009, respectively.
Restricted Stock Awards
The Restricted Stock Awards granted under the Omnibus Plan generally have vesting requirements that are determined by the underlying Restricted Stock Agreement. These forfeitable Restricted Stock Awards time-vest after a four year holding period, unless indicated otherwise by the underlying Restricted Stock Agreement. Shares issued as a result of Restricted Stock Awards generally are previously issued shares which have been reacquired by the Company and held as Treasury shares or authorized but previously unissued common stock.
For the periods ended December 31, 2011, 2010 and 2009, the Company granted approximately 46,000, 40,000 and 18,000 shares, respectively, of restricted stock under the Omnibus Plan:
|
Aggregate
|
||||
|
Grant Date
|
Fair
|
|||
|
Grant Date
|
Shares
|
Fair Value
|
Value
|
Vesting Date
|
|
March 3, 2009
|
17,561
|
$20.63
|
$362,283
|
March 3, 2013
|
|
March 3, 2010
|
12,185
|
31.92
|
388,945
|
March 3, 2014
|
|
May 28, 2010
|
2,500
|
28.07
|
70,175
|
February 28, 2012
|
|
May 28, 2010
|
17,500
|
28.07
|
491,225
|
May 28, 2014
|
|
October 21, 2010
|
7,500
|
31.04
|
232,800
|
October 21, 2014
|
|
March 15, 2011
|
24,836
|
38.46
|
955,193
|
March 15, 2015
|
|
July 21, 2011
|
16,600
|
38.44
|
638,104
|
July 21, 2015
|
|
August 29, 2011
|
5,000
|
24.50
|
122,500
|
August 29, 2014
|
Certain awards of restricted stock included in the above table provide for partial vesting over a period up to the vesting date listed.
Performance Unit Awards
Annually, under separate three year long-term incentive plans, pursuant to the Omnibus Plan, the Company granted performance units during the periods ended December 31, 2011, 2010 and 2009 as follows:
|
Aggregate
|
|||||||||||||||
|
Grant Date
|
Fair
|
||||||||||||||
|
Incentive Plan
|
Grant Date
|
Units
|
Fair Value
|
Value
|
|||||||||||
| 2009 – 2011 |
March 3, 2009
|
52,672 | $20.63 | $1,086,623 | |||||||||||
| 2010 – 2012 |
March 2, 2010
|
36,541 | 31.83 | 1,163,100 | |||||||||||
| 2011 – 2013 |
March 15, 2011
|
34,002 | 38.46 | 1,307,717 | |||||||||||
In addition, in 2011 the Company awarded, pursuant to the Omnibus Plan, 1,500 special performance units to an employee director and 1,000 special performance units to an executive. Based on the fiscal 2011 performance of the Company’s newly acquired subsidiary, these units may be converted into up to 3,000 and 1,500 shares, respectively, of the Company’s common stock. The grant date fair value of these awards was $38.46 and the aggregate fair value was $58,000 and $38,000, respectively.
Performance Units are subject to forfeiture and will be converted into common stock of the Company based upon the Company’s performance relative to performance measures and conversion multiples as defined in the underlying plan. The aggregate fair value in the above table is based upon reaching 100% of the performance targets as defined in the underlying plan.
The number of shares awarded under the respective three year long-term incentive plans was determined using an average grant date fair value over a ten day period as follows:
|
Average
|
||||
|
Grant Date
|
||||
|
Incentive Plan
|
Fair Value
|
Ten Day Period
|
||
| 2009 – 2011 | $23.21 |
February 2009
|
||
| 2010 – 2012 | 29.39 |
February 2010
|
||
| 2011 – 2013 | 40.25 |
February 2011
|
Excluding the fully-vested stock awards granted to non-employee directors, the Company recorded compensation expense of $1,588,000, $1,604,000 and $314,000, respectively, for the periods ended December 31, 2011, 2010 and 2009 related to restricted stock and performance unit awards. In addition, the Company issued, pursuant to the Omnibus Plan, approximately 20,000 fully-vested shares during 2011 which were earned under the 2008 – 2010 three year long-term incentive plan. This non-cash transaction of $670,000 was reflected as a decrease to Treasury Stock in the Consolidated Balance Sheet at December 31, 2011.
Shares issued as a result of restricted stock awards generally are previously issued shares which have been reacquired by the Company and held as Treasury shares or authorized but previously unissued common stock.
The excess tax benefit realized for the tax deduction from stock-based compensation approximated $425,000, $961,000 and $128,000, for the years ended December 31, 2011, 2010 and 2009, respectively. This excess tax benefit is included in cash flows from financing activities in the Consolidated Statements of Cash Flows.
Note 17.
Retirement Plans
With the acquisition of Portec, the Company has six plans which cover its hourly and salaried employees in the United States; three defined benefit plans (one active / two frozen) and three defined contribution plans. Employees are eligible to participate in the appropriate plan based on employment classification. The Company's funding to the defined benefit and defined contribution plans are governed by the Employee Retirement Income Security Act of 1974 (ERISA), applicable plan policy and investment guidelines. The Company policy is to contribute at least the minimum funding standards of ERISA.
Portec maintains two defined contribution plans for its employees in Canada, as well as a post-retirement benefit plan. In the United Kingdom, Portec maintains both a defined contribution plan and a defined benefit plan. These plans are discussed in further detail below.
United States Defined Benefit Plans
The following tables present a reconciliation of the changes in the benefit obligation, the fair market value of the assets and the funded status of the plans:
|
2011
|
2010
|
|||||||
|
In thousands
|
||||||||
|
Changes in benefit obligation:
|
||||||||
|
Benefit obligation at beginning of year
|
$ | 14,955 | $ | 4,493 | ||||
|
Service cost
|
30 | 31 | ||||||
|
Interest cost
|
799 | 264 | ||||||
|
Actuarial losses
|
1,896 | 268 | ||||||
|
Portec acquisition
|
- | 10,051 | ||||||
|
Benefits paid
|
(694 | ) | (152 | ) | ||||
|
Benefit obligation at end of year
|
16,986 | 14,955 | ||||||
|
Change to plan assets:
|
||||||||
|
Fair value of assets at beginning of year
|
11,433 | 3,634 | ||||||
|
Actual gain on plan assets
|
266 | 342 | ||||||
|
Employer contribution
|
1,083 | 333 | ||||||
|
Portec acquisition
|
0 | 7,276 | ||||||
|
Benefits paid
|
(694 | ) | (152 | ) | ||||
|
Fair value of assets at end of year
|
12,088 | 11,433 | ||||||
|
Funded status at end of year
|
$ | (4,898 | ) | $ | (3,522 | ) | ||
|
Amounts recognized in the statement
|
||||||||
|
of financial position consist of:
|
||||||||
|
Other long-term liabilities
|
$ | (4,898 | ) | $ | (3,522 | ) | ||
|
Amounts recognized in accumulated other
|
||||||||
|
comprehensive income consist of:
|
||||||||
|
Net loss
|
$ | 4,206 | $ | 1,921 | ||||
|
Prior service cost
|
5 | 6 | ||||||
| $ | 4,211 | $ | 1,927 | |||||
The actuarial loss included in accumulated other comprehensive loss that will be recognized in net periodic pension cost during 2012 is $195,000, before taxes. The transition asset and prior service cost expected to be recognized in net periodic pension cost in 2012 is immaterial.
Net periodic pension costs for the three years ended December 31, 2011 are as follows:
|
2011
|
2010
|
2009
|
||||||||||
|
In thousands
|
||||||||||||
|
Components of net periodic benefit cost:
|
||||||||||||
|
Service cost
|
$ | 30 | $ | 31 | $ | 28 | ||||||
|
Interest cost
|
799 | 264 | 258 | |||||||||
|
Expected return on plan assets
|
(764 | ) | (286 | ) | (225 | ) | ||||||
|
Amortization of prior service cost
|
1 | 0 | 3 | |||||||||
|
Recognized net actuarial gain
|
111 | 106 | 138 | |||||||||
|
Net periodic
|
||||||||||||
|
benefit cost
|
$ | 177 | $ | 115 | $ | 202 | ||||||
The weighted average assumptions used to measure the projected benefit obligation for the years ended December 31, 2011 and 2010 are as follows:
|
2011
|
2010
|
||
|
Discount rate
|
4.50%
|
5.50%
|
The weighted average assumptions used to determine net periodic benefit costs for the three years ended December 31, 2011:
|
2011
|
2010
|
2009
|
|
|
Discount rate
|
5.48%
|
6.00%
|
6.00%
|
|
Expected rate of return on plan assets
|
6.70%
|
7.75%
|
7.75%
|
The expected long-term rate of return is based on numerous factors including the target asset allocation for plan assets, historical rate of return, long-term inflation assumptions, and current and projected market conditions. Different asset category compositions between the two defined benefit plans led to two different expected rates of return on plan assets in 2011.
Amounts applicable to the Company’s pension plans with accumulated benefit obligations in excess of plan assets are as follows:
|
2011
|
2010
|
2009
|
||||||||||
|
In thousands
|
||||||||||||
|
Projected benefit obligation
|
$ | 16,986 | $ | 14,955 | $ | 4,493 | ||||||
|
Accumulated benefit obligation
|
16,986 | 14,955 | 4,493 | |||||||||
|
Fair value of plan assets
|
12,088 | 11,433 | 3,634 | |||||||||
Plan assets consist primarily of various fixed income and equity investments. The Company’s primary investment objective is to provide long-term growth of capital while accepting a moderate level of risk. The investments are limited to cash and equivalents, bonds, preferred stocks and common stocks. The investment target ranges and actual allocation of pension plan assets by major category at December 31, 2011 and 2010 are as follows:
|
Target
|
2011
|
2010
|
|
|
Asset Category
|
|||
|
Cash and cash equivalents
|
0 – 10%
|
4%
|
6%
|
|
Total fixed income funds
|
30 – 50%
|
37
|
28
|
|
Total mutual funds / equities
|
50 – 70%
|
59
|
66
|
|
Total
|
100%
|
100%
|
In accordance with the fair value disclosure requirements with FASB ASC 820, “Fair Value Measurements and Disclosures,” the following assets were measured at fair value on a recurring basis at December 31, 2011 and 2010. Additional information regarding FASB ASC 820 and the fair value hierarchy can be found in Note 19, Fair Value Measurements.
|
December 31,
|
December 31,
|
||||||||
|
2011
|
2010
|
||||||||
| In thousands | |||||||||
|
Asset Category
|
|||||||||
|
Cash and cash equivalents
|
$ | 513 | $ | 640 | |||||
|
Fixed income funds:
|
|||||||||
|
Government bonds
|
1,342 | 1,012 | |||||||
|
Corporate bonds
|
3,146 | 2,254 | |||||||
|
Total fixed income funds
|
4,488 | 3,266 | |||||||
|
Equity funds and equities:
|
|||||||||
|
Mutual funds
|
678 | 2,161 | |||||||
|
Common stock
|
6,409 | 5,366 | |||||||
|
Total equity funds and equities
|
7,087 | 7,527 | |||||||
|
Total
|
$ | 12,088 | $ | 11,433 | |||||
Cash and cash equivalents.
The Company uses quoted market prices to determine the fair value of these investments in interest-bearing cash accounts and they are classified in Level 1 of the fair value hierarchy. The carrying amounts approximate fair value because of the short maturity of the instruments.
Fixed income funds.
Investments within the fixed income funds category consist of fixed income corporate debt and US government and various state agency obligations. The Company uses quoted market prices to determine the fair value of these fixed income funds. These instruments consist of exchange-traded government and corporate bonds and are classified in Level 1 of the fair value hierarchy.
Equity funds and equities.
The valuation of investments in registered investment companies is based on the underlying investments in securities. Securities traded on security exchanges are valued at the latest quoted sales price. Securities traded in the over-the-counter market and listed securities for which no sale was reported on that date are valued at the average of the last reported bid and ask quotations. These investments are classified in Level 1 of the fair value hierarchy.
The Company expects to contribute $740,000 to its U.S. defined benefit plans in 2012.
The following benefit payments are expected to be paid:
|
Pension
|
||||
|
Benefits
|
||||
|
In thousands
|
||||
|
2012
|
$ | 717 | ||
|
2013
|
735 | |||
|
2014
|
749 | |||
|
2015
|
761 | |||
|
2016
|
806 | |||
|
Years 2017-2021
|
4,992 | |||
Portec Rail Products (UK) Limited Pension Plan (Portec Rail Plan)
:
During 2010, the Conveyors International Limited Pension Plan (Conveyors plan) was merged with the Portec Rail Products (UK) Limited Pension Plan (Portec Rail Plan) a defined benefit pension plan in the United Kingdom. The combined Portec Rail Plan covers some current employees, former employees and retirees of the original Portec Rail Plan along with former employees of the Conveyors plan. The Portec Rail Plan has been frozen to new entrants since April 1, 1997 and also covers the former employees of the Conveyors plan after January 2002. Benefits under the Portec Rail Plan, including the former Conveyors plan, were based on years of service and eligible compensation during defined periods of service. Our funding policy for the Portec Rail Plan is to make minimum annual contributions required by applicable regulations. Contributions of $235,000 and $54,000 were made to the plan on December 31, 2011 and 2010, respectively. We expect to contribute $229,000 to the Portec Rail plan during 2012.
The funded status of the United Kingdom defined benefit plan at year end is as follows:
|
December 31,
|
December 31,
|
|||||||
|
2011
|
2010
|
|||||||
|
In thousands
|
||||||||
|
Benefit obligation at end of year
|
$ | 6,964 | $ | 6,227 | ||||
|
Fair value of assets at end of year
|
5,160 | 5,293 | ||||||
|
Funded status at end of year
|
(1,804 | ) | (934 | ) | ||||
Amounts recognized in the statement of financial position consist of:
|
2011
|
2010
|
|||||||
|
Other long-term liabilities
|
$ | (1,804 | ) | $ | (934 | ) | ||
The weighted average assumptions used to measure the benefit obligation for the years ended December 31 were as follows:
|
2011
|
2010
|
|
|
Discount rate
|
4.7%
|
5.4%
|
|
Expected rate of return
|
5.7%
|
5.2%
|
The Company has estimated the long-term rate of return on plan assets based primarily on historical returns on plan assets, adjusted for changes in target portfolio allocations and recent changes in long-term interest rates based on publicly available information.
Plan assets are invested by the trustees in accordance with a written statement of investment principles. This statement permits investment in equities, corporate bonds, United Kingdom government securities, commercial property and cash, based on certain target allocation percentages.
Asset allocation is primarily based on a strategy to provide steady growth without undue fluctuations. The target asset allocation percentages for 2011 are as follows:
|
Portec Rail
Plan
|
|
|
Equity securities
|
Up to 100%
|
|
Commercial property
|
Not to exceed 50%
|
|
U.K. Government securities
|
Not to exceed 50%
|
|
Cash
|
Up to 100%
|
Substantially all plan assets held within Portec's United Kingdom defined benefit pension plan consists of marketable securities and are classified in Level 1 of the fair value hierarchy.
The plan assets by category for the years ended December 31, are as follows:
|
December 31,
|
December 31,
|
||
|
2011
|
2010
|
||
|
Asset Category
|
|||
|
Cash and cash equivalents
|
5%
|
3%
|
|
|
Equity securities
|
43
|
44
|
|
|
Bonds
|
27
|
19
|
|
|
Commercial property
|
25
|
25
|
|
|
Other
|
0
|
9
|
|
|
Total
|
100%
|
100%
|
|
The following estimated future benefits payments are expected to be paid under the Portec Rail Plan:
|
Pension
|
||||
|
Benefits
|
||||
|
In thousands
|
||||
|
2012
|
$ | 187 | ||
|
2013
|
191 | |||
|
2014
|
224 | |||
|
2015
|
247 | |||
|
2016
|
280 | |||
|
Years 2017 – 2020
|
1,764 | |||
Defined Contribution Plans
The Company maintains a defined contribution plan for its non-union hourly and salaried employees. This defined contribution plan contains a matched savings provision that permits both pretax and after-tax employee contributions. Participants can contribute, subject to statutory limitations, between 1% and 75% of eligible pre-tax pay and 1% and 100% of eligible after-tax pay.
The Company's employer match is 100% of the first 1% of deferred eligible compensation and up to 50% of the next 6%, based on years of service, of deferred eligible compensation, for a total maximum potential match of 4%. The Company may also make discretionary contributions to the plan. The expense associated with this plan was $1,929,000 in 2011, $1,700,000 in 2010 and $1,570,000 in 2009.
Portec maintains a defined contribution plan covering all non-union employees at its Montreal, Quebec, Canada location. Under the terms of this plan, Portec may contribute 4% of each employee’s compensation as a non-elective contribution and may also contribute 30% of the first 6% of each employee’s compensation contributed to the plan. Contributions to this plan were $100,000 in 2011.
Portec also maintains a defined contribution plan covering substantially all employees of Portec Rail Products (UK) Ltd. Benefits under this plan are provided under no formal written agreement. Under the terms of the defined contribution plan, Portec may make non-elective contributions of between 3% and 10% of each employee’s compensation. Contributions to this plan were $122,000 in 2011.
In July 2009, Portec created a new defined contribution plan covering substantially all the employees of Kelsan Technologies Corp. Under the terms of this plan, Portec makes a non-elective contribution of 4% of each employee’s compensation and may also contribute 30% of the first 6% of each employee’s compensation contributed to the plan. Contributions to this plan were $106,000 in 2011.
Finally, the Company also has a defined contribution plan for union hourly employees with contributions made by both the participants and the Company based on various formulas. The expense associated with this plan was $62,000 in 2011, $34,000 in 2010 and $33,000 in 2009.
Other Post-Retirement Benefit Plan
At Portec's operation near Montreal, Quebec, Canada, it maintains a post-retirement benefit plan, which provides retiree life insurance, health care benefits and, for a closed group of employees, dental care. Retiring employees with a minimum of 10 years of service are eligible for the plan benefits. The plan is not funded. Cost of benefits earned by employees is charged to expense as services are rendered. The expense related to this plan was not material for 2011. Portec's accrued benefit obligation per the actuarial valuation was $879,000 and $759,000 as of December 31, 2011 and 2010, respectively. This amount is recognized within other long-term liabilities.
The weighted average assumptions used to measure the benefit obligation for the years ended December 31 were as follows:
|
2011
|
2010
|
|
|
Discount rate
|
5.3%
|
5.7%
|
|
Weighted average health care trend rate
|
7.0%
|
7.3%
|
The weighted average health care rate trends downward to an ultimate rate of 4.70% in 2024.
Note 18.
Rental and Lease Information
The Company has capital and operating leases for certain plant facilities, office facilities, and equipment. Rental expense for the years ended December 31, 2011, 2010 and 2009 amounted to $4,580,000, $3,674,000 and $3,672,000, respectively. Generally, land and building leases include escalation clauses.
The following is a schedule, by year, of the future minimum payments under capital and operating leases, together with the present value of the net minimum payments as of December 31, 2011:
|
Capital
|
Operating
|
|||||||
|
Leases
|
Leases
|
|||||||
|
Year ending December 31,
|
In thousands
|
|||||||
|
2012
|
$ | 1,497 | $ | 2,993 | ||||
|
2013
|
34 | 2,365 | ||||||
|
2014
|
19 | 1,969 | ||||||
|
2015
|
1 | 1,534 | ||||||
|
2016 and thereafter
|
0 | 3,300 | ||||||
|
Total minimum lease payments
|
1,551 | $ | 12,161 | |||||
|
Less amount representing interest
|
61 | |||||||
|
Total present value of minimum payments
|
1,490 | |||||||
|
Less current portion of such obligations
|
1,439 | |||||||
|
Long-term obligations with interest rates ranging from 1.74% to 8.55%
|
$ | 51 | ||||||
Assets recorded under capital leases are as follows:
|
2011
|
2010
|
|||||||
|
In thousands
|
||||||||
|
Land Improvements
|
$ | 6,372 | $ | 6,372 | ||||
|
Machinery and equipment at cost
|
6,399 | 6,355 | ||||||
|
Buildings
|
399 | 399 | ||||||
| 13,170 | 13,126 | |||||||
|
Less accumulated amortization
|
11,019 | 9,808 | ||||||
|
Net capital lease assets
|
$ | 2,151 | $ | 3,318 | ||||
Note 19.
Fair Value Measurements
FASB ASC 820, “Fair Value Measurements and Disclosures,” defines fair value, establishes a framework for measuring fair value in accordance with accounting principles generally accepted in the United States, and expands disclosures about fair value measurements. The Company applies the provisions of ASC 820 to all its assets and liabilities that are being measured and reported on a fair value basis.
ASC 820 discusses valuation techniques, such as the market approach (comparable market prices), the income approach (present value of future income or cash flow) and the cost approach (cost to replace the service capacity of an asset or replacement cost). ASC 820 enables readers of financial statements to assess the inputs used to develop those measurements by establishing a hierarchy, which prioritizes those inputs used, for ranking the quality and reliability of the information used to determine fair values. The standard requires that each asset and liability carried at fair value be classified into one of the following categories:
Level 1:
Quoted market prices in active markets for identical assets or liabilities.
Level 2:
Observable market based inputs or unobservable inputs that are corroborated by market data.
Level 3:
Unobservable inputs that are not corroborated by market data.
The Company has an established process for determining fair value for its financial assets and liabilities, principally cash and cash equivalents and IDSI acquisition notes. Fair value is based on quoted market prices, where available. If quoted market prices are not available, fair value is based on assumptions that use as inputs market-based parameters. The following sections describe the valuation methodologies used by the Company to measure different financial instruments at fair value, including an indication of the level in the fair value hierarchy in which each instrument is generally classified. Where appropriate the description includes details of the key inputs to the valuations and any significant assumptions.
Cash equivalents.
Included within “Cash and cash equivalents” are principally investments in tax-free and taxable money market funds with municipal bond issuances as the underlying securities as well as government agency obligations and corporate bonds, all of which maintain AAA credit ratings. Also included within cash equivalents were our investments in non-domestic bank certificates of deposit. The Company uses quoted market prices to determine the fair value of these investments and they are classified in Level 1 of the fair value hierarchy. The carrying amounts approximate fair value because of the short maturity of the instruments.
IDSI acquisition notes.
The Company issued non-interest bearing notes associated with its acquisition of IDSI. The Company determined the fair value of these notes by computing the present value of the note payments using an interest rate formula applicable to the Company’s long-term debt. The short-term note is included within “Current maturities of other long-term debt”, the long-term note was included within “Other long-term debt” and are classified in Level 2 of the fair value hierarchy.
The following assets and liabilities of the Company were measured at fair value on a recurring basis subject to the disclosure requirements of ASC Topic 820 at December 31, 2011 and December 31, 2010:
|
Fair Value Measurements at Reporting Date Using
|
||||||||||||||||
|
Quoted Prices in
|
Significant
|
|||||||||||||||
|
Active Markets
|
Other
|
Significant
|
||||||||||||||
|
for Identical
|
Observable
|
Unobservable
|
||||||||||||||
|
December 31,
|
Assets
|
Inputs
|
Inputs
|
|||||||||||||
|
2011
|
(Level 1)
|
(Level 2)
|
(Level 3)
|
|||||||||||||
|
In thousands
|
||||||||||||||||
|
Assets
|
||||||||||||||||
|
Domestic money market funds
|
$ | 42,273 | $ | 42,273 | $ | 0 | $ | 0 | ||||||||
|
Non domestic bank certificates of deposit
|
22,520 | 22,520 | 0 | 0 | ||||||||||||
|
Cash equivalents at fair value
|
64,793 | 64,793 | 0 | 0 | ||||||||||||
|
Total Assets
|
$ | 64,793 | $ | 64,793 | $ | 0 | $ | 0 | ||||||||
|
Liabilities
|
||||||||||||||||
|
IDSI acquisition short-term note
|
$ | (945 | ) | $ | 0 | $ | (945 | ) | $ | 0 | ||||||
|
Total current maturities of other long-term debt
|
(945 | ) | 0 | (945 | ) | 0 | ||||||||||
|
Total Liabilities
|
$ | (945 | ) | $ | 0 | $ | (945 | ) | $ | 0 | ||||||
|
Fair Value Measurements at Reporting Date Using
|
||||||||||||||||
|
Quoted Prices in
|
Significant
|
|||||||||||||||
|
Active Markets
|
Other
|
Significant
|
||||||||||||||
|
for Identical
|
Observable
|
Unobservable
|
||||||||||||||
|
December 31,
|
Assets
|
Inputs
|
Inputs
|
|||||||||||||
| 2010 |
(Level 1)
|
(Level 2)
|
(Level 3)
|
|||||||||||||
|
In thousands
|
||||||||||||||||
|
Assets
|
||||||||||||||||
|
Domestic money market funds
|
$ | 55,959 | $ | 55,959 | $ | 0 | $ | 0 | ||||||||
|
Non domestic bank certificates of deposit
|
6,120 | 6,120 | 0 | 0 | ||||||||||||
|
Cash equivalents at fair value
|
62,079 | 62,079 | 0 | 0 | ||||||||||||
|
Total Assets
|
$ | 62,079 | $ | 62,079 | $ | 0 | $ | 0 | ||||||||
|
Liabilities
|
||||||||||||||||
|
IDSI acquisition short-term note
|
$ | (955 | ) | $ | 0 | $ | (955 | ) | $ | 0 | ||||||
|
Total current maturities of other long-term debt
|
(955 | ) | 0 | (955 | ) | 0 | ||||||||||
|
IDSI acquisition long-term note
|
(925 | ) | 0 | (925 | ) | 0 | ||||||||||
|
Total other long-term debt
|
(925 | ) | 0 | (925 | ) | 0 | ||||||||||
|
Total Liabilities
|
$ | (1,880 | ) | $ | 0 | $ | (1,880 | ) | $ | 0 | ||||||
Information regarding the fair value disclosures associated with the assets of the Company’s defined benefit plans can be found in Note 17, Retirement Plans.
Note 20.
Sale-Leaseback
In 2008, the Company sold approximately 63 acres of real estate located in Houston, TX used primarily by the Company’s Tubular Products segment for approximately $6,500,000 and recorded a gain of $1,486,000.
Pursuant to this sale, the Company entered into a sale-leaseback transaction, as amended on April 30, 2008, with the purchaser of the Houston, TX real estate for approximately 20 acres of the real estate and certain other assets for a ten year term at a monthly rental rate of $1,000 per acre with annual 3% increases. The April 30, 2008 amendment added approximately nine acres of real estate (Temporary Premises) on a month to month term basis. The January 6, 2009 amendment terminated the lease of approximately four acres of the Temporary Premises. The lease is a “net” lease with the Company being responsible for taxes, maintenance, insurance and utilities. The Company uses the leased property for its threaded product operations.
This lease is being accounted for as an operating lease with an interest rate of 5.25% for the transaction. The transaction qualifies as a sale-leaseback under applicable guidance included in ASC Topic 840-40, “Leases, Sale-Leaseback Transactions,” and the Company recorded as a deferred gain the present value of the minimum lease payments of the operating lease, $2,146,000. This deferred gain was being amortized over the term of the lease, 120 months.
During 2011, the Company provided the lessor of the Houston, TX property with written notice of the Company’s termination of the lease in its entirety effective April 30, 2012. As a result of this termination, the Company recognized $577,000 of previously deferred gain and is recorded in other income in the Consolidated Statement of Operations. At December 31, 2011, approximately $457,000 of unrecognized deferred gain is being amortized over the remaining life of the lease.
Note 21.
Commitments and Contingent Liabilities
Product Liability Claims
On July 12, 2011 the Union Pacific Railroad (UPRR) notified the Company and the Company’s subsidiary, CXT Incorporated (CXT), of a warranty claim under CXT's 2005 supply contract relating to the sale of prestressed concrete railroad ties for the UPRR. The UPRR has asserted that a significant percentage of concrete ties manufactured in 2006 through 2010 at CXT's Grand Island, NE facility fail to meet contract specifications, have workmanship defects and are cracking and failing prematurely. Approximately 1.6 million ties were sold from Grand Island to the UPRR during the period the UPRR has claimed nonconformance. The 2005 contract calls for each concrete tie which fails to conform to the specifications or has a material defect in workmanship to be replaced with 1.5 new concrete ties, provided, that UPRR within five years of a concrete tie’s production, notifies CXT of such failure to conform or such defect in workmanship. The UPRR's notice does not specify how many ties manufactured during this period are defective nor which specifications it claims were not met or the nature of the alleged workmanship defects. CXT believes it uses sound workmanship processes in the manufacture of concrete ties and has not agreed with the assertions in the UPRR’s warranty claim notice. The UPRR has also notified CXT that ties have failed a certain test that is specified in the 2005 contract.
Since late July 2011, the Company and CXT have been working with material scientists and prestressed concrete experts, who have been testing a representative sample of Grand Island concrete ties. While this testing is not complete, the Company has not identified any appreciable defects in workmanship. Additionally, a customer of the UPRR has claimed that a representative sample of ties manufactured by the Company’s Grand Island facility have failed a test contained in its product specification. As a result of this specific allegation, the UPRR has informed the Company that they currently intend to remove approximately 115,000 ties from track, which are a subset of ties subject to the July 12, 2011 claim. The Company is reviewing this claim and, while its review is not complete, the Company continues to believe that these ties do not have a material deviation from its contractual specifications. The Company expects that the testing required to address this product specification issue will be completed sometime during the latter part of the second quarter of 2012; however, the Company expects that it will continue to work collaboratively with the UPRR to address their overall product claim for some time to come.
On January 11, 2012, CXT received a subpoena from the United States Department of Transportation Inspector General (“IG”) requesting records related to its manufacture of concrete railroad ties in Grand Island, Nebraska. The Company believes that this subpoena relates to the same set of circumstances giving rise to the UPRR product claim. CXT and the Company intend to cooperate fully with the IG. The Company cannot predict what impact, if any, this investigation will have on the UPRR’s product claim.
Based on the non-specific nature of the UPRR’s assertion and the Company’s current inability to verify the claims, it is unable to determine a range of reasonably possible outcomes regarding this potential exposure matter. As a result, no accruals were made as a result of this claim as the impact, if any, cannot be reasonably estimated at this time. No assurances can be given regarding the ultimate outcome of this matter. The ultimate resolution of this matter could have a material, adverse impact on the Company’s financial statements, results of operations, liquidity and capital resources.
The Company is subject to product warranty claims that arise in the ordinary course of its business. For certain manufactured products, the Company maintains a product warranty accrual which is adjusted on a monthly basis as a percentage of cost of sales. This product warranty accrual is periodically adjusted based on the identification or resolution of known individual product warranty claims. The following table sets forth the Company’s product warranty accrual:
|
In thousands
|
||||
|
Balance at December 31, 2009
|
$ | 3,367 | ||
|
Additions to warranty liability
|
2,064 | |||
|
Portec acquisition
|
1,139 | |||
|
Warranty liability utilized
|
(2,157 | ) | ||
|
Balance at December 31, 2010
|
4,413 | |||
|
Additions to warranty liability
|
4,437 | |||
|
Warranty liability utilized
|
(2,208 | ) | ||
|
Balance at December 31, 2011
|
$ | 6,642 | ||
Included within the above table are concrete tie warranty reserves of approximately $4,644,000, $1,966,000 and $2,702,000, respectively, as of December 31, 2011, 2010 and 2009. For the periods ended December 31, 2011, 2010 and 2009, the Company recorded approximately $3,469,000, $750,000 and $2,724,000, respectively, in concrete tie warranty claims within cost of goods sold. These concrete tie warranty charges primarily related to transit and industrial ties manufactured by the Company’s Grand Island, NE facility. The requirement for this reserve is based upon historical claim experience. No reserve has been recorded related specifically for the UPRR product claim dated July 12, 2011.
While the Company believes this is a reasonable estimate of these potential warranty claims, these estimates could change due to new information and future events. There can be no assurance at this point that future potential costs pertaining to these claims or other potential future claims will not have a material impact on the Company’s results of operations. The warranty accrual is included within “Other accrued liabilities” on the Company’s Condensed Consolidated Balance Sheet.
Environmental and Legal Proceedings
The Company is subject to national, state, foreign, provincial and/or local laws and regulations relating to the protection of the environment, and the Company is monitoring its potential environmental exposure related to current and former Portec facilities. The Company’s efforts to comply with environmental regulations may have an adverse effect on its future earnings. In the opinion of management, compliance with the present environmental protection laws will not have a material adverse effect on the financial condition, results of operations, cash flows, competitive position or capital expenditures of the Company.
The Company is subject to legal proceedings and claims that arise in the ordinary course of its business. In the opinion of management, the amount of ultimate liability with respect to these actions will not materially affect the financial condition or liquidity of the Company. The resolution, in any reporting period, of one or more of these matters could have a material effect on the Company’s results of operations for that period.
As of December 31, 2011 and December 31, 2010, the Company maintained environmental and litigation reserves approximating $2,184,000 and $2,799,000, respectively.
Note 22.
Quarterly Financial Information (Unaudited)
Quarterly financial information for the years ended December 31, 2011 and 2010 is presented below:
|
2011
|
||||||||||||||||||||
|
First
|
Second
|
Third
|
Fourth
|
|||||||||||||||||
|
Quarter
|
Quarter
|
Quarter (1)
|
Quarter
|
Total
|
||||||||||||||||
|
In thousands, except per share amounts
|
||||||||||||||||||||
|
Net sales
|
$ | 117,104 | $ | 173,701 | $ | 162,701 | $ | 137,420 | $ | 590,926 | ||||||||||
|
Gross profit
|
$ | 17,466 | $ | 26,293 | $ | 30,780 | $ | 27,613 | $ | 102,152 | ||||||||||
|
Net income
|
$ | 679 | $ | 6,373 | $ | 9,740 | $ | 6,103 | $ | 22,895 | ||||||||||
|
Basic earnings per common share
|
$ | 0.07 | $ | 0.62 | $ | 0.96 | $ | 0.61 | $ | 2.24 | ||||||||||
|
Diluted earnings per common share
|
$ | 0.07 | $ | 0.61 | $ | 0.95 | $ | 0.60 | $ | 2.22 | ||||||||||
|
Dividends paid per common share
|
$ | 0.00 | $ | 0.05 | $ | 0.025 | $ | 0.025 | $ | 0.10 | ||||||||||
1) Includes a pre-tax gain of $577,000 associated with the early termination of the lease associated with the Company’s sale-leaseback transaction.
|
2010
|
||||||||||||||||||||
|
First
|
Second
|
Third
|
Fourth
|
|||||||||||||||||
|
Quarter
|
Quarter
|
Quarter
|
Quarter (2)
|
Total
|
||||||||||||||||
|
In thousands, except per share amounts
|
||||||||||||||||||||
|
Net sales
|
$ | 82,002 | $ | 119,504 | $ | 125,561 | $ | 147,983 | $ | 475,050 | ||||||||||
|
Gross profit
|
$ | 12,073 | $ | 20,315 | $ | 20,042 | $ | 22,153 | $ | 74,583 | ||||||||||
|
Net income
|
$ | 1,753 | $ | 5,987 | $ | 6,513 | $ | 6,239 | $ | 20,492 | ||||||||||
|
Basic earnings per common share
|
$ | 0.17 | $ | 0.59 | $ | 0.64 | $ | 0.61 | $ | 2.01 | ||||||||||
|
Diluted earnings per common share
|
$ | 0.17 | $ | 0.58 | $ | 0.63 | $ | 0.60 | $ | 1.98 | ||||||||||
2) Includes a pre-tax gain of $1,364,000 associated with the remeasurement of the remaining Portec available-for-sale investment on the acquisition date.
None.
Evaluation of Disclosure Controls and Procedures
L. B. Foster Company (the Company) carried out an evaluation, under the supervision and with the participation of the Company’s management, including the Chief Executive Officer and the Chief Financial Officer, of the effectiveness of the design and operation of the Company’s disclosure controls and procedures (as defined in Rules 13a – 15(e) under the Securities and Exchange Act of 1934, as amended (the Exchange Act)) as of the end of the period covered by this report. Based on that evaluation, the Chief Executive Officer and Chief Financial Officer concluded that the Company’s disclosure controls and procedures were effective as of the end of the period covered by this report.
Managements’ Report on Internal Control Over Financial Reporting
The management of L. B. Foster Company is responsible for establishing and maintaining adequate internal control over financial reporting, as such term is defined in Exchange Act Rules 13a – 15(f). L. B. Foster Company’s internal control system is designed to provide reasonable assurance to the Company’s management and Board of Directors regarding the reliability of financial reporting and the preparation of financial statements for external purposes in accordance with accounting principles generally accepted in the United States. All internal control systems, no matter how well designed, have inherent limitations. Accordingly, even effective controls can provide only reasonable assurance with respect to financial statement preparation and presentation. There were no significant changes in internal control over financial reporting (as defined in Rule 13a-15(f) under the Exchange Act) that occurred during the fourth quarter of 2011 that have materially affected, or are reasonably likely to materially affect, the Company’s internal control over financial reporting.
L. B. Foster Company’s management assessed the effectiveness of the Company’s internal control over financial reporting as of December 31, 2011. In making this assessment, management used criteria set forth by the Committee of Sponsoring Organizations of the Treadway Commission (COSO) in
Internal Control-Integrated Framework
. Based on this assessment, management concluded that the Company maintained effective internal control over financial reporting as of December 31, 2011.
Ernst & Young LLP, the independent registered public accounting firm that also audited the Company’s consolidated financial statements has issued an attestation report on the Company’s internal control over financial reporting. Ernst & Young’s attestation report on the Company’s internal control over financial reporting appears in Part II, Item 8 of this Annual Report on Form 10-K and is incorporated herein by reference.
None.
The information required by this Item regarding the directors of the Company is incorporated herein by reference to the information included in the Company’s proxy statement for the 2012 annual meeting of stockholders (the “Proxy Statement”) under the caption “Election of Directors.”
The information required by this Item regarding the executive officers of the Company is set forth in Part I of this Annual Report on Form 10-K under the caption “Executive Officers of the Registrant” and is incorporated herein by reference.
The information required by this Item regarding compliance with Section 16(a) of the Securities Exchange Act of 1934 is incorporated herein by reference to the information included in the Proxy Statement under the caption “Section 16(a) Beneficial Reporting Compliance.”
The information required by this Item regarding our Code of Ethics is set forth in Part I of this Annual Report on Form 10-K under the caption “Code of Ethics” and is incorporated herein by reference.
The information required by this Item regarding our audit committee and the audit committee financial expert(s) is incorporated herein by reference to the information included in the Proxy Statement under the caption “Corporate Governance - Board Committees - Audit Committee.”
The information required by this Item regarding executive compensation is incorporated herein by reference to the information included in the Proxy Statement under the captions “Director Compensation,” “Executive Compensation,” “Summary Compensation Table (2011, 2010 and 2009),” “Grants of Plan-Based Awards in 2011,” “Outstanding Equity Awards At Fiscal Year-End (2011),” “Options Exercised and Stock Vested Table (2011),” “2011 Nonqualified Deferred Compensation,” “Change-In-Control,” “Executive Compensation - Compensation Discussion and Analysis - Overview of Compensation Framework - Consideration of Risk Within Compensation Arrangements,” “Compensation Committee Interlocks and Insider Participation,” and “Compensation Committee Report.”
The information required by this Item regarding the Company’s equity compensation plans is set forth in Part II, Item 5 of this Form 10-K under the caption “Securities Authorized for Issuance Under Equity Compensation Plans” and is incorporated herein by reference.
The information required by this Item regarding the beneficial ownership of the Company is incorporated herein by reference to the information included in the Proxy Statement under the caption “Stock Ownership.”
The information required by this Item regarding transactions with related persons is incorporated herein by reference to the information included in the Proxy Statement under the caption “Corporate Governance - Board Committees - Audit Committee.”
The information required by this Item regarding director independence is incorporated herein by reference to information included in the Proxy Statement under the caption “Corporate Governance - The Board and Board Meetings.”
The information required by this Item regarding principal accountant fees and services is incorporated herein by reference to information included in the Proxy Statement under the caption “Independent Registered Public Accountants’ Fees.”
The following documents are filed as a part of this Report:
The following Reports of Independent Registered Public Accounting Firm, consolidated financial statements, and accompanying notes are included in Item 8 of this Report:
Reports of Independent Registered Public Accounting Firm.
Consolidated Balance Sheets as of December 31, 2011 and 2010.
Consolidated Statements of Operations for the Years Ended December 31, 2011, 2010 and 2009.
Consolidated Statements of Cash Flows for the Years Ended December 31, 2011, 2010 and 2009.
Consolidated Statements of Stockholders’ Equity for the Years Ended December 2011, 2010 and 2009.
Notes to Consolidated Financial Statements.
Schedules for the Three Years Ended December 31, 2011, 2010 and 2009:
II – Valuation and Qualifying Accounts.
The remaining schedules are omitted because of the absence of conditions upon which they are required.
(a)(3).
Exhibits
The exhibits listed on the accompanying index to exhibits are filed as part of this Annual Report on Form 10-K.
|
SCHEDULE II VALUATION AND QUALIFYING ACCOUNTS
|
|||||||||||||||||||||
|
FOR THE YEARS ENDED DECEMBER 31, 2011, 2010 AND 2009
|
|||||||||||||||||||||
|
Additions
|
|||||||||||||||||||||
|
Balance at
|
Charged to
|
Balance
|
|||||||||||||||||||
|
Beginning
|
Costs and
|
(2) | (1) |
at End
|
|||||||||||||||||
|
of Year
|
Expenses
|
Other
|
Deductions
|
of Year
|
|||||||||||||||||
|
(In Thousands)
|
|||||||||||||||||||||
|
2011
|
|||||||||||||||||||||
|
Deducted from assets to which they apply:
|
|||||||||||||||||||||
|
Allowance for doubtful accounts
|
$ | 1,601 | $ | 261 | $ | - | $ | 52 | $ | 1,810 | |||||||||||
|
2010
|
|||||||||||||||||||||
|
Deducted from assets to which they apply:
|
|||||||||||||||||||||
|
Allowance for doubtful accounts
|
$ | 1,055 | $ | 247 | $ | 299 | $ | - | $ | 1,601 | |||||||||||
|
2009
|
|||||||||||||||||||||
|
Deducted from assets to which they apply:
|
|||||||||||||||||||||
|
Allowance for doubtful accounts
|
$ | 2,637 | $ | (564 | ) | $ | - | $ | 1,018 | $ | 1,055 | ||||||||||
|
(1)
|
Notes and accounts receivable written off as uncollectible.
|
||||||||||||||||||||
|
(2)
|
Other additions relate to the Portec acquisition.
|
||||||||||||||||||||
The Exhibits marked with an asterisk are filed herewith. All exhibits are incorporated herein by reference:
|
2.1
|
Agreement and Plan of Merger, dated February 16, 2010, by and among L.B. Foster Company, Foster Thomas Company and Portec Rail Products, Inc. filed as Exhibit 2.1 to Form 8-K on February 17, 2010.
|
|
2.2
|
First Amendment to Agreement and Plan of Merger, dated as of May 13, 2010, by and among Portec Rail Products, Inc., L.B. Foster Company and Foster Thomas Company filed as Exhibit 2.1 to Form 8-K on May 13, 2010.
|
|
2.3
|
Second Amendment to Agreement and Plan of Merger, dated August 30, 2010, by and among Portec Rail Products, Inc., L.B. Foster Company and Foster Thomas Company filed as Exhibit 2.1 to Form 8-K on August 30, 2010.
|
|
2.4
|
Asset Purchase Agreement between Interlocking Deck Systems International, LLC and the Registrant dated March 23, 2010 filed as Exhibit 10.25 to Form 8-K on March 29, 2010.
|
|
3.1
|
Restated Certificate of Incorporation, filed as Exhibit 3.1 to Form 10-Q for the quarter ended March 31, 2003.
|
|
*3.2
|
Bylaws of the Registrant.
|
|
4.1
|
Rights Agreement, dated as of October 24, 2006, between L. B. Foster Company and American Stock Transfer & Trust Company, including the form of Rights Certificate and the Summary of Rights attached thereto, filed as Exhibit 4B to Form 8-K on October 27, 2006.
|
| 10.1 |
$125,000,000 Revolving Credit Facility Credit Agreement dated May 2, 2011, between Registrant and PNC Bank, N.A., Bank of America, N.A., Wells Fargo Bank, N.A., and Citizens Bank of Pennsylvania, filed as Exhibit 10.0 to Form 8-K on May 4, 2011.
|
|
^10.2
|
Agreement for Purchase and Sales of Concrete Ties between CXT Incorporated and the Union Pacific Railroad dated January 24, 2005, and filed as Exhibit 10.21 to Form 10-K for the year ended December 31, 2004.
|
|
^10.3
|
Amendment to Agreement for Purchase and Sales of Concrete Ties between CXT Incorporated and the Union Pacific Railroad dated October 28, 2005, and filed as Exhibit 10.21.1 to Form 8-K on November 14, 2005.
|
|
**10.4
|
Employment Agreement with Robert P. Bauer, filed as Exhibit 10.1 to Form 8-K on January 17, 2012.
|
|
**10.5
|
Employment Agreement with Kevin R. Haugh, filed as Exhibit 10.54 to Form 10-Q on November 9, 2011.
|
|
**10.6
|
Letter Agreement with Stan Hasselbusch, filed as Exhibit 10.2 to Form 8-K on January 17, 2012.
|
|
**10.7
|
Letter agreement on Lee B. Foster II’s retirement, filed as Exhibit 10.59 to Form 8-K on April 22, 2008.
|
| **10.8 |
2006 Omnibus Plan, as amended and restated May 18, 2011, filed as Exhibit A to the Company’s Proxy Statement on Schedule 14A on April 8, 2011.
|
| **10.9 |
Form of Restricted Stock Agreement (for grants made prior to December 23, 2011), filed as Exhibit 10.1 to Form 8-K on December 21, 2011.
|
| **10.10 |
Amended Form of Restricted Stock Agreement (for grants made on or after December 23, 2011), filed as Exhibit 10.2 to Form 8-K on December 21, 2011.
|
| **10.11 |
Restricted Stock Agreement between Registrant and Stan L. Hasselbusch dated May 28, 2010 filed as Exhibit 10.61 to Form 8-K on June 1, 2010.
|
| **10.12 |
Restricted Stock Agreement between Registrant and David J. Russo dated May 28, 2010 filed as Exhibit 10.62 to Form 8-K on June 1, 2010.
|
| **10.13 |
Retention Performance Share Unit Award Agreement between Registrant and Stan L. Hasselbusch dated March 15, 2011 filed as Exhibit 10.63 to Form 8-K on March 21, 2011.
|
| **10.14 |
Retention Performance Share Unit Award Agreement between Registrant and David R. Sauder dated March 15, 2011. *
|
| **10.15 |
Form of Performance Share Unit Award Agreement (2008 - 2011). *
|
| **10.15.1 | Form of Performance Share Unit Award Agreement (2012). * |
| **10.16 |
Executive Annual Incentive Compensation Plan, filed as Exhibit 10.59 to Form 8-K on March 12, 2008.
|
| **10.17 | Key Employee Separation Plan, filed as Exhibit 10.61 to Form 8-K on December 12, 2008. |
| **10.18 |
Supplemental Executive Retirement Plan as Amended and Restated on January 1, 2009, filed as Exhibit 10.51 to Form 10-K for the year ended December 31, 2008.
|
| **10.19 |
Amended and Restated 1985 Long-Term Incentive Plan as of May 25, 2005, filed as Exhibit 10.33.2 to Form 10-K for the year ended December 31, 2010.
|
| **10.20 |
Amended and Restated 1998 Long-Term Incentive Plan as of May 25, 2005, filed as Exhibit 10.34 to Form 10-K for the year ended December 31, 2010.
|
| **10.21 |
Amendment, effective May 24, 2006, to Amended and Restated 1998 Long-Term Incentive Plan as of May 25, 2005, filed as Exhibit 10.34.1 to Form 10-K for the year ended December 31, 2010.
|
| **10.22 |
Medical Reimbursement Plan (MRP1) effective January 1, 2006, filed as Exhibit 10.45 to Form 10-K for the year ended December 31, 2010.
|
| **10.23 |
Medical Reimbursement Plan (MRP2) effective January 1, 2006, filed as Exhibit 10.45.1 to Form 10-K for the year ended December 31, 2010.
|
| **10.24 |
Amendments to MRP2 filed as Exhibit 10.45.2 to Form 10-K for the year ended December 31, 2010.
|
| **10.25 |
Leased Vehicle / Vehicle Allowance Policy, as amended and restated on September 1, 2007, filed as Exhibit 10.46 to Form 10-K for the year ended December 31, 2010.
|
| **10.26 |
Summary of Director Compensation, filed as Exhibit 10.53 to Form 10-Q for the quarter ended September 30, 2011.
|
|
*21
|
List of Subsidiaries.
|
|
*23
|
Consent of Independent Registered Public Accounting Firm.
|
|
*31.1
|
Certification of Chief Executive Officer under Section 302 of the Sarbanes-Oxley Act of 2002.
|
|
*31.2
|
Certification of Chief Financial Officer under Section 302 of the Sarbanes-Oxley Act of 2002.
|
|
*32.0
|
Certification of Chief Executive Officer and Chief Financial Officer under Section 906 of the Sarbanes-Oxley Act of 2002.
|
|
***101.INS
|
XBRL Instance Document.
|
|
***101.SCH
|
XBRL Taxonomy Extension Schema Document.
|
|
***101.CAL
|
XBRL Taxonomy Extension Calculation Linkbase Document.
|
|
***101.DEF
|
XBRL Taxonomy Extension Definition Linkbase Document.
|
|
***101.LAB
|
XBRL Taxonomy Extension Label Linkbase Document.
|
|
***101.PRE
|
XBRL Taxonomy Extension Presentation Linkbase Document.
|
|
_______________________________
|
|
|
*
|
Exhibits marked with an asterisk are filed herewith.
|
|
**
|
Identifies management contract or compensatory plan or arrangement required to be filed as an Exhibit.
|
|
***
|
In accordance with SEC Release 33-8238, the certifications contained in Exhibits 32 are being furnished and not filed. In accordance with Rule 406T of Regulation S-T promulgated by the Securities and Exchange Commission, Exhibit 101 is deemed not filed or part of a registration statement or prospectus for purposes of sections 11 or 12 of the Securities Act of 1933, is deemed not filed for purposes of section 18 of the Securities and Exchange Act of 1934, and otherwise is not subject to liability under these sections.
|
|
^
|
Portions of the exhibit have been omitted pursuant to a confidential treatment request.
|
Pursuant to the requirements of Section 13 or 15(d) of the Securities Exchange Act of 1934, the Registrant has duly caused this report to be signed on its behalf by the undersigned, thereunto duly authorized.
|
L.B. FOSTER COMPANY
|
|
|
Date: March 15, 2012
|
By:
/s/ Robert P. Bauer
|
|
(Robert P. Bauer,
|
|
|
President and Chief Executive Officer)
|
Pursuant to the requirements of the Securities Exchange Act of 1934, this report has been signed below by the following persons on behalf of the Registrant and in the capacities and on the dates indicated.
|
Name
|
Position
|
Date
|
|
|
By:
|
/s/Lee B. Foster II
|
Chairman of the Board and Director
|
March 15, 2012
|
|
(Lee B. Foster II)
|
|||
|
By:
|
/s/Robert P. Bauer
|
President, Chief Executive Officer and Director
|
March 15, 2012
|
|
(Robert P. Bauer)
|
|||
|
By:
|
/s/Peter McIlroy II
|
Director
|
March 15, 2012
|
|
(Peter McIlroy II)
|
|||
|
By:
|
/s/G. Thomas McKane
|
Director
|
March 15, 2012
|
|
(G. Thomas McKane)
|
|||
|
By:
|
/s/Diane B. Owen
|
Director
|
March 15, 2012
|
|
(Diane B. Owen)
|
|||
|
By:
|
/s/Linda K. Patterson
|
Controller
|
March 15, 2012
|
|
(Linda K. Patterson)
|
|||
|
By:
|
/s/William H. Rackoff
|
Director
|
March 15, 2012
|
|
(William H. Rackoff)
|
|||
|
By:
|
/s/Suzanne B. Rowland
|
Director
|
March 15, 2012
|
|
(Suzanne B. Rowland)
|
|||
|
By:
|
/s/David J. Russo
|
Senior Vice President, Chief Financial and Accounting Officer and Treasurer
|
March 15, 2012
|
|
(David J. Russo)
|
TABLE OF CONTENTS
Part IItem 1. BusinessItem 1A. Risk FactorsItem 1B. Unresolved Staff CommentsItem 2. PropertiesItem 3. Legal ProceedingsItem 4. Mine Safety DisclosuresPart IIItem 5. Market For Registrant S Common Equity, Related Stockholder Matters and Issuer Purchases Of Equity SecuritiesItem 6. Selected Financial DataItem 7. Management S Discussion and Analysis Of Financial Condition and Results Of OperationsItem 7A. Quantitative and Qualitative Disclosures About Market RiskItem 8. Financial Statements and Supplementary DataItem 9. Changes in and Disagreements with Accountants on Accounting and Financial DisclosureItem 9A. Controls and ProceduresItem 9B. Other InformationPart IIIItem 10. Directors, Executive Officers and Corporate GovernanceItem 11. Executive CompensationItem 12. Security Ownership Of Certain Beneficial Owners and Management and Related Stockholder MattersItem 13. Certain Relationships and Related Transactions, and Director IndependenceItem 14 . Principal Accountant Fees and ServicesPart IVItem 15. Exhibits and Financial Statement Schedules