FOSTER L B CO
10-Ks and 10-Qs
|
|
|
|
|
|
|
|
|
|
|
|
|
|
|
|
|
|
|
|
|
|
|
|
|
|
|
|
|
|
|
|
|
|
|
|
|
|
|
|
|
|
|
|
|
|
|
|
|
|
|
|
|
|
|
|
|
|
|
|
|
|
UNITED STATES SECURITIES AND EXCHANGE COMMISSION
Washington, D.C. 20549
FORM 10-K
|
(Mark One)
|
|
|
☒
|
Annual Report Pursuant to Section 13 or 15 (d) of the Securities Exchange Act of 1934
|
|
For the fiscal year ended December 31, 2017
|
|
Or
|
☐
|
Transition Report Pursuant to Section 13 or 15(d) of the Securities Exchange Act of 1934
For the transition period from to
|
Commission File Number 0-10436
L.B. FOSTER COMPANY
(Exact name of registrant as specified in its charter)
|
Pennsylvania
|
|
25-1324733
|
|
(State of Incorporation)
|
|
(I.R.S. Employer Identification No.)
|
|
415 Holiday Drive, Pittsburgh, Pennsylvania
|
|
15220
|
|
(Address of principal executive offices)
|
|
(Zip Code)
|
Registrant’s telephone number, including area code:
(412) 928-3400
Securities registered pursuant to Section 12(b) of the Act:
|
Title of Each Class
|
|
Name of Each Exchange On Which Registered
|
|
Common Stock, Par Value $0.01
|
|
NASDAQ Global Select Market
|
|
Preferred Stock Purchase Rights
|
|
NASDAQ Global Select Market
|
Securities registered pursuant to Section 12(g) of the Act:
None
Indicate by check mark if the registrant is a well-known seasoned issuer, as defined in Rule 405 of the Securities Act. ☐ Yes ☒ No
Indicate by check mark if the registrant is not required to file reports pursuant to Section 13 or 15(d) of the Exchange Act. ☐ Yes ☒ No
Indicate by check mark whether the registrant (1) has filed all reports required to be filed by Section 13 or 15(d) of the Securities Exchange Act of 1934 during the preceding 12 months (or for such shorter period that the registrant was required to file such reports) and (2) has been subject to such filing requirements for the past 90 days. ☒ Yes ☐ No
Indicate by check mark whether the registrant has submitted electronically and posted on its corporate Web site, if any, every Interactive Data File required to be submitted and posted pursuant to Rule 405 of Regulation S-T (section 232.405 of this chapter) during the preceding 12 months (or for shorter period that the registrant was required to submit and post such files). ☒ Yes ☐ No
Indicate by check mark if disclosure of delinquent filers pursuant to Item 405 of Regulation S-K is not contained herein, and will not be contained, to the best of registrant’s knowledge, in definitive proxy or information statements incorporated by reference in Part III of this Form 10-K or any amendment to this form 10-K. ☒
Indicate by check mark whether the registrant is a large accelerated filer, an accelerated filer, a non-accelerated filer, a smaller reporting company, or an emerging growth company. See the definitions of “large accelerated filer,” “accelerated filer”, “smaller reporting company”, and “emerging growth company” in Rule 12b-2 of the Exchange Act. (Check one):
|
Large accelerated filer
|
|
☐
|
Accelerated filer
|
|
☒
|
|
|
Non-accelerated filer
|
|
☐ (Do not check if a smaller reporting company)
|
Smaller reporting company
|
|
☐
|
|
|
|
Emerging growth company
|
|
☐
|
|||
If an emerging growth company, indicate by check mark if the registrant has elected not to use the extended transition period for complying with any new or revised financial accounting standards provided pursuant to Section 13(a) of the Exchange Act. ☐
Indicate by check mark whether the registrant is a shell company (as defined in Rule 12b-2 of the Exchange Act). ☐ Yes ☒ No
The aggregate market value of the voting and non-voting common equity held by non-affiliates computed by reference to the price at which the common equity was last sold, or the average bid and asked price of such common equity, as of the last business day of the registrant’s most recently completed second fiscal quarter was
$174,226,746
.
|
Class
|
|
Outstanding at February 21, 2018
|
|
Common Stock, Par Value $0.01
|
|
10,346,213 shares
|
Documents Incorporated by Reference:
Portions of the Proxy Statement prepared for the
2017
Annual Meeting of Shareholders are incorporated by reference in Items 10, 11, 12, 13 and 14 of Part III of this Form 10-K. The
2018
Proxy Statement will be filed with the U.S. Securities and Exchange Commission within 120 days after the end of the fiscal year to which this report relates.
1
TABLE OF CONTENTS
|
PART I
|
||
|
Item 1.
|
||
|
Item 1A.
|
||
|
Item 1B.
|
||
|
Item 2.
|
||
|
Item 3.
|
||
|
Item 4.
|
||
|
PART II
|
||
|
Item 5.
|
||
|
Item 6.
|
||
|
Item 7.
|
||
|
Item 7A.
|
||
|
Item 8.
|
||
|
Item 9.
|
||
|
Item 9A.
|
||
|
Item 9B.
|
||
|
PART III
|
||
|
Item 10.
|
||
|
Item 11.
|
||
|
Item 12.
|
||
|
Item 13.
|
||
|
Item 14.
|
||
|
PART IV
|
||
|
Item 15.
|
||
|
Item 16.
|
||
2
Forward-Looking Statements
This Annual Report on Form 10-K contains “forward- looking” statements within the meaning of Section 21E of the Securities Exchange Act of 1934, as amended, and Section 27A of the Securities Act of 1933, as amended. Many of the forward-looking statements are located in “Management’s Discussion and Analysis of Financial Condition and Results of Operations.” Forward-looking statements provide current expectations of future events based on certain assumptions and include any statement that does not directly relate to any historical or current fact. Sentences containing words such as “believe,” “intend,” “plan,” “may,” “expect,” “should,” “could,” “anticipate,” “estimate,” “predict,” “project,” or their negatives, or other similar expressions of a future or forward-looking nature generally should be considered forward-looking statements. Forward-looking statements in this Annual Report on Form 10-K may concern, among other things,
L.B. Foster Company’s (the “Company’s”) expectations relating to our strategy, goals, projections, and plans regarding our financial position, liquidity, capital resources, and results of operations; the outcome of litigation and product warranty claims; decisions regarding our strategic growth initiatives, market position, and product development; all of which are based on current estimates that involve inherent risks and uncertainties. The Company has based these forward-looking statements on current expectations and assumptions about future events. While the Company considers these expectations and assumptions to be reasonable, they are inherently subject to significant business, economic, competitive, regulatory, and other risks and uncertainties, most of which are difficult to predict and many of which are beyond the Company’s control. The Company cautions readers that various factors could cause the actual results of the Company to differ materially from those indicated by forward-looking statements. Accordingly, investors should not place undue reliance on forward-looking statements as a prediction of actual results. Among the factors that could cause the actual results to differ materially from those indicated in the forward-looking statements are risks and uncertainties related to: environmental matters, including any costs associated with any remediation and monitoring; a resumption of the economic slowdown we have experienced in previous years in the markets we serve; the risk of doing business in international markets; our ability to effectuate our strategy, including cost reduction initiatives, and our ability to effectively integrate acquired businesses and realize anticipated benefits; costs of and impacts associated with shareholder activism; a decrease in freight or passenger rail traffic; the timeliness and availability of materials from our major suppliers as well as the impact on our access to supplies of customer preferences as to the origin of such supplies, such as customers' concerns about conflict minerals; labor disputes; the continuing effective implementation of an enterprise resource planning system; changes in current accounting estimates and their ultimate outcomes; the adequacy of internal and external sources of funds to meet financing needs, including our ability to negotiate any additional necessary amendments to our credit agreement; the Company’s ability to manage its working capital requirements and indebtedness; domestic and international taxes, including estimates that may impact these amounts, including as a result of any interpretations, regulatory actions, and amendments to the Tax Cuts and Jobs Act; foreign currency fluctuations; inflation; domestic and foreign government regulations; economic conditions and regulatory changes caused by the United Kingdom’s pending exit from the European Union; sustained declines in energy prices; a lack of state or federal funding for new infrastructure projects; an increase in manufacturing or material costs; the ultimate number of concrete ties that will have to be replaced pursuant to the previously disclosed product warranty claim of the Union Pacific Railroad (“UPRR”) and an overall resolution of the related contract claims as well as the possible costs associated with the outcome of the lawsuit filed by the UPRR; the loss of future revenues from current customers; and risks inherent in litigation. Should one or more of these risks or uncertainties materialize, or should the assumptions underlying the forward-looking statements prove incorrect, actual outcomes could vary materially from those indicated. Significant risks and uncertainties that may affect the operations, performance, and results of the Company’s business and forward-looking statements include, but are not limited to, those set forth under Item 1A, “Risk Factors,” and elsewhere in our Annual Report on Form 10-K and our other periodic filings with the Securities and Exchange Commission.
The forward-looking statements in this report are made as of the date of this report and we assume no obligation to update or revise any forward-looking statement, whether as a result of new information, future developments, or otherwise, except as required by the federal securities laws.
3
(Dollars in thousands, except share data unless otherwise noted)
ITEM 1.
BUSINESS
Summary Description of Businesses
Formed in 1902, L.B. Foster Company is a Pennsylvania corporation with its principal office in Pittsburgh, PA. L.B. Foster Company is a leading manufacturer and distributor of products and services for the transportation and energy infrastructure with locations in North America and Europe. As used herein, “Foster,” the “Company,” “we,” “us,” and “our” or similar references refer collectively to L.B. Foster Company and its divisions and subsidiaries, unless the context otherwise requires.
The following table shows, for the last three fiscal years, the net sales generated by each business segment as a percentage of total net sales:
|
|
Percentage of Net Sales
|
||||||||
|
|
2017
|
2016
|
2015
|
||||||
|
Rail Products and Services
|
48
|
%
|
49
|
%
|
53
|
%
|
|||
|
Construction Products
|
30
|
|
30
|
|
28
|
|
|||
|
Tubular and Energy Services
|
22
|
|
21
|
|
19
|
|
|||
|
100
|
%
|
100
|
%
|
100
|
%
|
||||
Financial information concerning these segments is set forth in Part II, Item 8, Financial Statements and Supplementary Data, Note 2 Business Segments, to the Consolidated Financial Statements contained in this Annual Report on Form 10-K, which is incorporated by reference into this Item 1.
Rail Products and Services
The Company’s Rail Products and Services (“Rail”) segment is comprised of several manufacturing and distribution businesses that provide a variety of products and services for freight and passenger railroads and industrial companies throughout the world. The Rail segment has sales offices throughout the Americas and Europe, and frequently bids on rail projects where it offers products manufactured by the Company, or sourced from numerous supply chain partners, and aftermarket services. The Rail segment is comprised of the following business units: Rail Products, Rail Technologies, and CXT Concrete Ties.
Rail Products
The Rail Products business is comprised of the Company’s Rail Distribution, Allegheny Rail, and Transit divisions.
Rail Distribution sells new rail mainly to passenger and shortline freight railroads, industrial companies, and rail contractors for the replacement of existing lines or expansion of new lines. Rail accessories sold by the Rail Distribution division include track spikes, bolts, angle bars, and other products required to install or maintain rail lines. These products are manufactured by the Company or purchased from other manufacturers and distributed accordingly. Rail Distribution also sells trackwork products to Class II and III railroads, industrial, and export markets.
The Company’s Allegheny Rail Products (“ARP”) division engineers and fabricates insulated rail joints and related accessories for freight and passenger railroads and industrial customers. Insulated joints are manufactured at the Company’s facilities in Pueblo, CO and Niles, OH.
The Company’s Transit Products division supplies power rail, direct fixation fasteners, coverboards, and special accessories primarily for passenger railroad systems. These products are fabricated at Company facilities or by subcontractors and are usually sold by sealed bid to passenger railroads or to rail contractors.
Rail Technologies
The Company’s Rail Technologies business unit engineers, manufactures, and fabricates friction management products and application systems, railroad condition monitoring systems and equipment, wheel impact load detection, rail anchors and spikes, wayside data collection and management systems, epoxy and nylon-encapsulated insulated rail joints, and track fasteners, and provides aftermarket services. The Company’s friction management products control the friction at the rail/wheel interface, helping our customers reduce fuel consumption, improve operating efficiencies, extend the life of operating assets such as rail and wheels, reduce track stresses, and lower related maintenance and operating costs. Friction management products include mobile and wayside systems that apply lubricants and liquid or solid friction modifiers. These products and systems are designed, engineered, manufactured, and fabricated by certain wholly-owned subsidiaries located in the United States, Canada, United Kingdom, and Germany.
4
CXT Concrete Ties
L.B. Foster’s subsidiary, CXT Incorporated, manufactures engineered concrete railroad ties for freight and passenger railroads and industrial companies at its facility in Spokane, WA.
Construction Products
The Construction products segment is composed of the following business units: Piling Products, Fabricated Bridge Products, and Precast Concrete Products.
Piling Products
Sheet piling products are interlocking structural steel sections that are generally used to provide lateral support at construction sites. Bearing piling products are steel H-beam sections which are driven into the ground for support of structures such as bridge piers and high-rise buildings. Piling is often used in water and land applications including cellular cofferdams and OPEN CELL
®
structures in inland river systems and ports.
Piling products are sourced from various manufacturers and either sold or rented to project owners and contractors. The piling division, via a sales force deployed throughout the United States, markets and sells piling domestically and internationally. This division offers its customers various types and dimensions of structural beam piling, sheet piling, and pipe piling. The Company is the primary distributor of domestic steel sheet piling for its primary supplier.
Fabricated Bridge Products
The fabricated products facility in Bedford, PA manufactures a number of fabricated steel and aluminum products primarily for the highway, bridge, and transit industries including concrete reinforced steel grid deck, open steel grid deck, aluminum bridge railing, and stay-in-place steel bridge forms.
Precast Concrete Products
The Precast Concrete Products unit primarily manufactures concrete buildings for national, state, and municipal parks. This unit manufactures restrooms, concession stands, and other protective storage buildings available in multiple designs, textures, and colors. The Company is a leading high-end supplier in terms of volume, product options, and capabilities. The unit also manufactures various other precast products such as burial vaults, bridge beams, box culverts, septic tanks, and other custom pre-stressed and precast concrete products. The products are manufactured in Spokane, WA, Hillsboro, TX, and Waverly, WV.
Tubular and Energy Services
The Tubular and Energy Services segment has four primary business units: Protective Coatings, Threaded Products, Precision Measurement Systems, and Test and Inspection Services. The segment provides products and services predominantly to the mid and upstream oil and gas markets.
Protective Coatings
There are two pipeline service locations that make up the Protective Coatings business unit. The Birmingham, AL facility coats the outside diameter and, to a lesser extent, the inside diameter of pipe primarily for oil & gas transmission pipelines. This location partners with its primary customer, a pipe manufacturer, to market fusion bonded epoxy coatings, abrasion resistant coatings, and internal linings for a wide variety of pipe diameters for pipeline projects throughout North America. The second location is in Willis, TX. The Willis facility applies specialty outside and inside diameter coatings for a wide variety of pipe diameters for oil & gas transmission, mining, and waste water pipelines. This location also provides custom coatings for specialty fittings and connections.
Threaded Products
The Company’s Magnolia, TX facility cuts, threads, and paints pipe primarily for water well applications for the agriculture industry, municipal water authorities, and Oil Country Tubular Goods (“OCTG”) markets.
Precision Measurement Systems
The Company manufactures and provides a turnkey solution for metering and injection systems for the oil and, to a lesser extent, gas industry. The Willis, TX location operates a fabrication plant that builds metering systems for custody transfer applications including crude oil and other petroleum-based products. These systems are used at well sites, pipelines, refineries, chemical plants, and loading/unloading facilities. The Willis location also manufactures and installs additive and dye injection systems. These systems are used to inject performance additives and/or dyes into petroleum products.
Test and Inspection Services
The Company provides inspection and tubular integrity management services for the upstream oil and gas industry. Services include non-destructive testing, inspection, and other asset integrity services such as repair and threading for OCTG and drill tools. Inspection and testing of these products, which include replaceable and re-usable products such as casing,
5
production tubing, drill pipe, directional motors, drill collars, and related equipment, is a critical preventative measure to ensure personnel and well-site safety, enhance efficiency, and avoid costly equipment failures and well-site shutdowns. The Company offers these services in every major oil and gas producing region throughout the United States.
L B Pipe Joint Venture
The Company is a member of a joint venture, L B Pipe & Coupling Products, LLC (“L B Pipe JV”), in which it maintains a 45% ownership interest. L B Pipe JV manufactures, markets, and sells various machined components and precision couplings products for the energy, water well, and construction markets and is scheduled to terminate on June 30, 2019. The Company has classified its ownership interest as an asset held for sale during the current period. More information concerning L B Pipe JV is set forth in Part II, Item 8, Financial Statements and Supplementary Data, Note 8 Investments, to the Consolidated Financial Statements included herein, which is incorporated by reference into this Item 1.
Marketing and Competition
L.B. Foster Company generally markets its Rail Products and Services directly in all major industrial areas of the United States, Canada, and Europe. The Construction Products and Tubular and Energy Services are primarily marketed domestically. The Company employs a sales force of approximately
71
people that is supplemented with a network of agents across Europe, South America, and Asia to reach current customers and cultivate potential customers in these areas. For the years ended
2017
,
2016
, and
2015
, approximately
19%
,
19%
, and
16%
, respectively, of the Company’s total sales were outside the United States.
The major markets for the Company’s products are highly competitive. Product availability, quality, service, and price are principal factors of competition within each of these markets. No other company provides the same product mix to the various markets the Company serves. However, there are one or more companies that compete with the Company in each product line. Therefore, the Company faces significant competition from different groups of companies.
During
2017
,
2016
, and
2015
, no single customer accounted for more than 10% of the Company’s consolidated net sales.
Raw Materials and Supplies
Most of the Company’s products are purchased in the form of finished or semi-finished products. The Company purchases the majority of its supplies from domestic and foreign steel producers. Generally, the Company has a number of vendor options. However, the Company has an arrangement with a steel mill to distribute steel sheet piling in North America. Should sheet piling from its present supplier not be available for any reason, the Company risks not being able to provide such product to its customers.
The Company’s purchases from foreign suppliers are subject to foreign currency exchange rate changes as well as the usual risks associated with changes in international conditions and to United States and international laws that could impose import restrictions on selected classes of products and for anti-dumping duties if products are sold in the United States at prices that are below specified prices.
Backlog
The dollar amount of firm, unfilled customer orders at
December 31, 2017
and
2016
by business segment is as follows:
|
|
December 31,
|
|||||||
|
|
2017
|
2016
|
||||||
|
Rail Products and Services
|
$
|
68,850
|
|
$
|
62,743
|
|
||
|
Construction Products
|
71,318
|
|
71,954
|
|
||||
|
Tubular and Energy Services
|
26,737
|
|
12,759
|
|
||||
|
Total
|
$
|
166,905
|
|
$
|
147,456
|
|
||
Approximately
5%
of the
December 31, 2017
backlog is related to projects that will extend beyond
2018
.
Research and Development
Expenditures for research and development approximated
$2,241
,
$3,511
, and
$3,937
in
2017
,
2016
, and
2015
, respectively. These expenditures were predominately associated with expanding product lines and capabilities within the Company’s Rail Technologies business.
Patents and Trademarks
The Company owns a number of domestic and international patents and trademarks primarily related to its Rail Technologies products. Our business segments are not dependent upon any individual patent or related group of patents, or any licenses or distribution rights. We believe that, in the aggregate, the rights under our patents, trademarks, and licenses are generally important to our operations, but we do not consider any individual patent or trademark, or any licensing or distribution rights related to a specific process or product, to be of material importance in relation to our total business.
6
Environmental Disclosures
Information regarding environmental matters is included in Part II, Item 8, Financial Statements and Supplementary Data, Note 19 Commitments and Contingent Liabilities, to the Consolidated Financial Statements included herein, which is incorporated by reference into this Item 1.
Employees and Employee Relations
At
December 31, 2017
, the Company had approximately
1,475
employees,
1,282
located within the Americas and
193
located in Europe. There were
819
hourly production workers and
656
salaried employees. Of the hourly production workers, approximately
146
are represented by unions. The Company has not suffered any major work stoppages during the past five years and considers its relations with its employees to be satisfactory.
Two collective bargaining agreements covering approximately
41
and
77
employees were successfully renegotiated during 2017 and are now scheduled to expire in March 2020 and September 2021, respectively.
Substantially all of the Company’s hourly paid employees are covered by one of the Company’s noncontributory, defined benefit plans or defined contribution plans. Substantially all of the Company’s salaried employees are covered by defined contribution plans.
Financial Information about Liquidity and Capital Resources
Information concerning the Company’s liquidity and capital resources and the Company’s working capital requirements can be found in Part II, Item 7, Management’s Discussion and Analysis of Financial Condition and Results of Operations, included herein, which is incorporated by reference into this Item 1.
Financial Information about Geographic Areas
Financial information about geographic areas is set forth in Part II, Item 8, Financial Statements and Supplementary Data, Note 2 Business Segments, to the Consolidated Financial Statements included herein, which is incorporated by reference into this Item 1.
Financial Information about Segments
Financial information about segments is set forth in Part II, Item 8, Financial Statements and Supplementary Data, Note 2 Business Segments, to the Consolidated Financial Statements included herein, which is incorporated by reference into this Item 1.
Code of Ethics
L.B. Foster Company has a legal and ethical conduct policy applicable to all directors and employees, including its Chief Executive Officer, Chief Financial Officer, and Controller. This policy is posted on the Company’s website,
www.lbfoster.com
. The Company intends to satisfy the disclosure requirement regarding certain amendments to, or waivers from, provisions of its policy by posting such information on the Company’s website. In addition, our ethics hotline can also be used by employees and others for the anonymous communication of concerns about financial controls, human resource concerns, and other reporting matters.
Available Information
The Company makes certain filings with the Securities and Exchange Commission (“SEC”), including its Annual Report on Form 10-K, Quarterly Reports on Form 10-Q, Current Reports on Form 8-K, and all amendments and exhibits to those reports, available free of charge through its website,
www.lbfoster.com
, as soon as reasonably practicable after they are filed with the SEC. These filings are also available at the SEC’s Public Reference Room at 100 F Street N.E. Washington, D.C. 20549 or by calling 1-800-SEC-0330. These filings are also available on the internet at
www.sec.gov
. The Company’s press releases and recent investor presentations are also available on its website.
7
Executive Officers of the Registrant
Information concerning the executive officers of the Company is set forth below.
|
Name
|
Age
|
Position
|
||
|
Robert P. Bauer
|
59
|
President and Chief Executive Officer
|
||
|
Patrick J. Guinee
|
48
|
Vice President, General Counsel and Secretary
|
||
|
John F. Kasel
|
52
|
Senior Vice President - Rail and Construction
|
||
|
Brian H. Kelly
|
58
|
Vice President - Human Resources and Administration
|
||
|
Gregory W. Lippard
|
49
|
Vice President - Rail Sales and Products and Services
|
||
|
James P. Maloney
|
50
|
Senior Vice President, Chief Financial Officer, and Treasurer
|
||
|
Christopher T. Scanlon
|
42
|
Controller and Chief Accounting Officer
|
||
|
William F. Treacy
|
58
|
Vice President - Tubular and Energy Services
|
||
Mr. Bauer was elected President and Chief Executive Officer upon joining the Company in 2012. Prior to joining the Company, beginning in 2011, Mr. Bauer previously served as President of the Refrigeration Division of the Climate Technologies business of Emerson Electric Company, a diversified global manufacturing and technology company. From 2002 until 2011, Mr. Bauer served as President of Emerson Network Power’s Liebert Division.
Mr. Guinee was elected Vice President, General Counsel and Secretary in 2014. Prior to joining the Company, Mr. Guinee served as Vice President - Securities & Corporate and Assistant Secretary at Education Management Corporation from 2013 to early 2014, and was employed by H. J. Heinz Company from 1997 to 2013, last serving as Vice President - Corporate Governance & Securities and Assistant Secretary.
Mr. Kasel was elected Senior Vice President - Rail and Construction in September 2017, having previously served as Senior Vice President - Rail Products and Services since 2012, Senior Vice President - Operations and Manufacturing since 2005, and Vice President - Operations and Manufacturing since 2003. Mr. Kasel served as Vice President of Operations for Mammoth, Inc., a Nortek company from 2000 to 2003.
Mr. Kelly was elected Vice President - Human Resources and Administration in 2012, having previously served as Vice President, Human Resources since 2006. Prior to joining the Company, Mr. Kelly headed Human Resources for 84 Lumber Company from 2004. Previously, he served as a Director of Human Resources for American Greetings Corp. from 1994 to 2004.
Mr. Lippard was elected Vice President - Rail Sales and Products and Services in September 2017, having previously served as Vice President - Rail Product Sales since 2000. Prior to re-joining the Company in 2000, Mr. Lippard served as Vice President - International Trading for Tube City, Inc. from 1998. Mr. Lippard served in various other capacities with the Company since his initial employment in 1991.
Mr. Maloney was elected Senior Vice President, Chief Financial Officer, and Treasurer in September 2017. Prior to joining the Company, Mr. Maloney served as Chief Financial Officer of First Insight, Inc. from 2014 to 2017. Mr. Maloney served as Vice President - Global Financial Planning and Supply Chain Finance for H. J. Heinz Company from 2012 to 2014. He served as Director of Finance from 2009 to 2012 and Controller from 2005 to 2009 for Heinz North American operating unit.
Mr. Scanlon was elected Controller and Chief Accounting Officer in 2012. Prior to joining the Company, Mr. Scanlon served as the Online Higher Education Division Controller of Education Management Corporation from 2009 to 2012. Mr. Scanlon served as Manager of Central Accounting Services for Bayer Corporation from 2007 until 2009.
Mr. Treacy was elected Vice President - Tubular and Energy Services in September 2017, having previously served as Director of Technology and General Manager, Transit Products within the Rail Products and Services segment since 2013. Prior to joining the Company, Mr. Treacy served as Interim President of Tuthill Vacuum and Blower Systems from 2012 to 2013. Mr. Treacy previously served as General Manager, Crane Vending Solutions for Crane Co. from 2009 to 2011 and was employed by Parker Hannifin from 2000 to 2009, last serving as Vice President of Operations Development.
Officers are elected annually at the organizational meeting of the Board of Directors following the annual meeting of stockholders.
8
ITEM 1A.
RISK FACTORS
Risks and Uncertainties
We operate in a changing environment that involves numerous known and unknown risks and uncertainties that could have a material adverse effect on our business, financial condition, and results of operations. The following risks highlight some of the more significant factors that have affected us and could affect us in the future. We may also be affected by unknown risks or risks that we currently believe are immaterial. If any such events actually occur, our business, financial condition, and results of operations could be materially adversely affected. You should carefully consider the following factors and other information contained in this Annual Report on Form 10-K before deciding to invest in our common stock.
Our inability to successfully manage joint ventures, divestitures, and other significant transactions could harm our financial results, business, and prospects.
As part of our business strategy, we may divest businesses or assets, enter into strategic alliances and joint ventures, and make investments to realize anticipated benefits, which actions involve a number of inherent risks and uncertainties. We can give no assurances that the opportunities will be consummated or that financing will be available. We may not be able to achieve the synergies and other benefits we expect from strategic transactions as successfully or rapidly as projected, if at all.
Our future performance and market value could cause additional write-downs of long-lived and intangible assets in future periods.
We are required under U.S. generally accepted accounting principles to review intangible assets for impairment when events or changes in circumstances indicate that the carrying value may not be recoverable. Goodwill is required to be tested for impairment at least annually. Factors that may be considered to be a change in circumstances indicating that the carrying value of our intangible assets may not be recoverable include, but are not limited to, a decline in stock price and resulting market capitalization, a significant decrease in the market value of an asset, or a significant decrease in operating or cash flow projections. No impairments of goodwill or long-lived assets were recorded in
2017
.
During the third quarter of 2015, we performed an interim goodwill test and concluded that the carrying amounts of the Test and Inspection Services and Precision Measurement Systems business units’ goodwill exceeded the implied fair values of that goodwill. We recognized an aggregate non-cash goodwill impairment charge of $80,337 to write down the carrying values to the implied fair values, of which $69,908 represented the full carrying value of the goodwill related to the Test and Inspection Services business unit and the remaining $10,429 related to the Precision Measurement Systems business unit.
During the second and third quarters of 2016, we performed an interim goodwill test and concluded that the carrying amounts of the Rail Technologies, Protective Coatings, and Precision Measurement Systems business units’ goodwill exceeded the implied fair values of the respective goodwill. We recognized an aggregate non-cash goodwill impairment charges of $61,142 to write down the carrying values to the implied fair values, of which $16,560 represented the full carrying value of goodwill related to the 2013 Ball Winch acquisition and $11,873 represented the remaining carrying value related to the Precision Measurement Systems business unit. We also performed interim long-lived asset recoverability tests during the second and third quarters of 2016 and concluded that the long-lived assets related to the Test and Inspection Services and Precision Measurement Systems business units had carrying values in excess of the asset groups’ fair value. We recognized non-cash definite-lived intangible asset impairment charges of $59,786 to write down the carrying values to the implied fair values, of which $42,982 related to Test and Inspection Services and $16,804 related to Precision Measurement Systems. Finally, in 2016, we recognized $14,956 non-cash tangible long-lived impairment charges related to the carrying value of certain long-lived tangible assets exceeding their fair value, all of which related to Test and Inspection Services.
No assurances can be given that we will not be required to record future significant charges related to tangible or intangible asset impairments.
Our indebtedness could materially adversely affect our business, financial condition, and results of operations and prevent us from fulfilling our obligations.
Our indebtedness could materially adversely affect our business, financial condition, and results of operations. For example, it could:
•
require us to dedicate a substantial portion of our cash flows to payments of our indebtedness, which would reduce the availability of our cash flow to fund working capital, capital expenditures, expansion efforts, and other general corporate purposes;
•
limit our flexibility in planning for, or reacting to, changes in our business and the industry in which we operate;
•
place us at a competitive disadvantage compared to our competitors that have less debt; and
•
limit, among other things, our ability to borrow additional funds for working capital, capital expenditures, or general corporate purposes.
9
Our inability to comply with covenants in place or our inability to make the required principal and interest payments may cause an event of default, which could have a substantial adverse impact to our business, financial condition, and results of operations. There is no assurance that refinancings or asset dispositions could be effected on a timely basis or on satisfactory terms, if at all, particularly if credit market conditions deteriorate. Furthermore, there can be no assurance that refinancings or asset dispositions would be permitted by the terms of our credit agreements or debt instruments. Our existing credit agreements contain, and any future debt agreements we may enter into may contain, certain financial tests and other covenants that limit our ability to incur indebtedness, acquire other businesses, and may impose various other restrictions. Our ability to comply with financial tests may be adversely affected by changes in economic or business conditions beyond our control, and these covenants may limit our ability to take advantage of potential business opportunities as they arise. We cannot be certain that we will be able to comply with the financial tests and other covenants, or, if we fail to do so, that we will be able to obtain waivers or amended terms from our lenders. An uncured default with respect to one or more of the covenants could result in the amounts outstanding being declared immediately due and payable, which may also trigger an obligation to redeem our outstanding debt securities and repay all other outstanding indebtedness. Any such acceleration of our indebtedness would have a material adverse effect on our business, financial condition, and results of operations.
Prolonged low energy prices and other unfavorable changes in U.S., global, or regional economic and market conditions could adversely affect our business.
We could be adversely impacted by prolonged negative changes in economic conditions affecting either our suppliers or customers as well as the capital markets. Negative changes in government spending may result in delayed or permanent deferrals of existing or potential projects. No assurances can be given that we will be able to successfully mitigate various prolonged uncertainties including materials cost variability, delayed or reduced customer orders and payments, and access to available capital resources outside of operations.
In addition, volatile market conditions and low energy prices could continue for an extended period, which would negatively affect our business prospects. Historically, oil and natural gas prices have been volatile and are subject to fluctuations in response to changes in supply and demand, market uncertainty, and a variety of additional factors that are beyond our control. Sustained declines or significant and frequent fluctuations in the price of oil and natural gas may have a material adverse effect on our operations and financial condition.
Our ability to maintain or improve our profitability could be adversely impacted by cost pressures.
Our profitability is dependent upon the efficient use of our resources. Rising inflation, labor costs, labor disruptions, and other increases in costs in the geographic areas in which we operate could have a significant adverse impact on our profitability and results of operations.
Management projections, estimates, and judgments may not be indicative of our future performance.
Our management is required to use certain estimates in preparing our financial statements, including accounting estimates to determine reserves related to litigation, deferred tax assets, and the fair market value of certain assets and liabilities. Certain asset and liability valuations are subject to management’s judgment and actual results are influenced by factors outside our control.
We are required to maintain a valuation allowance for deferred tax assets and record a charge to income and equity if we determine, based on available evidence at the time the determination is made, that it is more likely than not that some portion or all of the deferred tax assets will not be realized. This evaluation process involves significant management judgment about assumptions that are subject to change from period to period. The use of different estimates can result in changes in the amounts of deferred tax items recognized, which can result in equity and earnings volatility because such changes are reported in current period earnings. See Part II, Item 8, Financial Statements and Supplementary Data, Note 14 Income Taxes, to the Consolidated Financial Statements included herein, for additional discussion of our deferred taxes.
Our business operates in highly competitive markets and a failure to react to changing market conditions could adversely impact our business.
We face strong competition in each of the markets in which we participate. A slow response to competitor pricing actions and new competitor entries into our product lines could negatively impact our overall pricing. Efforts to improve pricing could negatively impact our sales volume in all product categories. We may be required to invest more heavily to maintain and expand our product offerings. There can be no assurance that new product offerings will be widely accepted in the markets we serve. Significant negative developments in any of these areas could adversely affect our financial results and condition.
10
If we are unable to protect our intellectual property and prevent its improper use by third parties, our ability to compete may be harmed.
We own a number of patents and trademarks under the intellectual property laws of the United States, Canada, Europe, and other countries where product sales are possible. However, we have not perfected patent and trademark protection of our proprietary intellectual property for all products in all countries. The decision not to obtain patent and trademark protection in other countries may result in other companies copying and marketing products that are based upon our proprietary intellectual property. This could impede growth into new markets where we do not have such protections and result in a greater supply of similar products in such markets, which in turn could result in a loss of pricing power and reduced revenue.
Our success is in part dependent on the accuracy and proper utilization of our management information and communications systems.
We are currently working through an enterprise resource program (“ERP”) system transition. Certain divisions of our Company migrated into the new ERP system during 2016 while certain other divisions may be transitioned during 2018 and subsequent years. The system implementation is intended to enable us to better meet the information requirements of our users, increase our integration efficiencies, and identify additional synergies in the future. The implementation of our ERP system is complex because of the wide range of processes and systems to be integrated across our business. Project delays, business interruptions, or loss of expected benefits could have a material adverse effect on our business, financial condition, or results of operations. Any disruptions, delays, or deficiencies in the design, operation, or implementation of our various systems, or in the performance of our systems, particularly any disruptions, delays, or deficiencies that impact our operations, could adversely affect our ability to effectively run and manage our business, including our ability to receive, process, ship, and bill for orders in a timely manner or our ability to properly manage our inventory or accurately present our inventory availability or pricing.
We are subject to cybersecurity risks and may incur increasing costs in an effort to minimize those risks.
Our business employs systems and websites that allow for the storage and transmission of proprietary or confidential information regarding our customers, employees, job applicants, and other parties, including financial information, intellectual property, and personal identification information. Security breaches and other disruptions could compromise our information, expose us to liability, and harm our reputation and business. The steps we take to deter and mitigate these risks may not be successful. We may not have the resources or technical sophistication to anticipate or prevent current or rapidly evolving types of cyber-attacks. Data and security breaches can also occur as a result of non-technical issues, including an intentional or inadvertent breach by our employees or by persons with whom we have commercial relationships. Any compromise or breach of our security could result in a violation of applicable privacy and other laws, legal and financial exposure, negative impacts on our customers’ willingness to transact business with us, and a loss of confidence in our security measures, which could have an adverse effect on our results of operations and our reputation.
We are dependent upon key customers.
We could be adversely affected by changes in the business or financial condition of a customer or customers. A prolonged decrease in capital spending by our railroad customers could negatively impact our sales and profitability. As a result of the ongoing litigation and termination of the amended 2005 concrete tie supply agreement with Union Pacific Railroad (“UPRR”), our CXT Concrete Tie sales to, and new orders from, UPRR have ceased which adversely affected our results beginning in 2015.
No assurances can be given that a significant downturn in the business or financial condition of a current customer, or customers, or potential litigation with a current customer, would not also impact our results of operations and/or financial condition.
An adverse outcome in any pending or future litigation or pending or future warranty claims against the Company or its subsidiaries or our determination that a customer has a substantial product warranty claim could negatively impact our financial results and/or our financial condition.
We are party to various legal proceedings. In addition, from time to time our customers assert claims against us relating to the warranties which apply to products we sell. There is the potential that a result materially adverse to us or our subsidiaries in pending or future legal proceedings or pending or future product warranty claims could materially exceed any accruals we have established and adversely affect our financial results and/or financial condition. In addition, we could suffer a significant loss of business from a customer who is dissatisfied with the resolution of a warranty claim. For example, UPRR terminated our amended 2005 concrete tie supply agreement over allegedly defective ties and reduced new orders for other products which negatively affected our results beginning in 2015.
11
In January 2015, UPRR filed a lawsuit against the Company asserting that we were in material breach of our amended 2005 concrete tie supply agreement with UPRR due to claimed failures to provide warranty ties to replace alleged defective concrete ties. UPRR seeks various types of relief including incidental, consequential, and other damages in amounts to be determined at trial under various legal theories. See Part II, Item 8, Financial Statements and Supplementary Data, Note 19 Commitments and Contingent Liabilities, to the Consolidated Financial Statements included herein, for additional information regarding UPRR’s lawsuit.
We continue to work with UPRR in an attempt to reach a resolution on this matter. However, such discussions may not be successful, and the results of litigation and any settlement or judgment amounts resulting from this matter may not be within the range of our estimated accrual. Consequently, while we believe the claims in the UPRR lawsuit are without merit, and we intend to vigorously defend ourselves and have asserted a counterclaim for damages in the UPRR lawsuit, an adverse outcome could result in a substantial judgment against us that could have a material adverse effect on our financial condition, results of operations, liquidity, and capital resources. No assurances can be given that prior to any settlement or judgment, we will not recognize additional material charges because our warranty reserve accrual for UPRR is based upon our current estimate of the number of defective concrete ties that need to be replaced and facts could emerge which would cause us to materially increase this estimate.
A portion of our sales are derived from our international operations, which expose us to certain risks inherent in doing business on an international level.
Doing business outside the United States subjects the Company to various risks, including changing economic and political conditions, work stoppages, exchange controls, currency fluctuations, armed conflicts, and unexpected changes in United States and foreign laws relating to tariffs, trade restrictions, transportation regulations, foreign investments, and taxation. Increasing sales to foreign countries exposes the Company to increased risk of loss from foreign currency fluctuations and exchange controls as well as longer accounts receivable payment cycles. We have little control over most of these risks and may be unable to anticipate changes in international economic and political conditions and, therefore, unable to alter our business practices in time to avoid the adverse effect of any of these possible changes.
Changes in exchange rates for foreign currencies may reduce international demand for our products or increase our labor or supply costs in non-U.S. markets. Fluctuations in the relative values of the United States dollar, Canadian dollar, British pound, and Euro may result in volatile earnings to reflect exchange rate translation in our Canadian and European sales and operations. If the United States dollar strengthens in value as compared to the value of the Canadian dollar, British pound, or Euro, our reported earnings in dollars from sales in those currencies will be unfavorable. Conversely, a favorable result will be reported if the United States dollar weakens in value as compared to the value of the Canadian dollar, British pound, or Euro.
Economic conditions and regulatory changes caused by the United Kingdom’s pending exit from the European Union could adversely affect our business.
In June 2016, the United Kingdom (“U.K.”) held a referendum in which voters approved an exit from the European Union (“E.U.”), commonly referred to as “Brexit”. The U.K. government has initiated a process to withdraw from the E.U. and has begun negotiating the terms of its separation. Since the announcement of Brexit, there has been volatility in currency exchange rate fluctuations between the U.S. dollar relative to the U.K. pound. The announcement of Brexit and pending withdrawal of the U.K. from the E.U. may also create market volatility and could continue to contribute to instability in global financial and foreign exchange markets, political institutions, and regulatory agencies. The majority of our U.K. operations are heavily concentrated within the U.K. borders; however, this could adversely affect the future growth of our U.K. operations into other European locations. Our U.K. operations represented approximately 10% of our total revenue for the twelve-month periods ended
December 31, 2017
,
2016
, and
2015
.
Material modification to NAFTA and certain other international trade agreements could affect our business, financial condition, and results of operations.
The current Presidential administration has made comments suggesting it is not supportive of certain international trade agreements, including the North American Free Trade Agreement (“NAFTA”). At this time, it remains unclear what the current administration and Congress would or would not do with respect to these international trade agreements. While the Company is a net exporter out of the United States, potential material modifications to NAFTA, or certain other international trade agreements, may adversely impact our business, financial condition, and results of operations.
12
Violations of foreign governmental regulations, including the U.S. Foreign Corrupt Practices Act and similar worldwide anti-corruption laws, could result in fines, penalties, and criminal sanctions against the Company, its officers, or both and could adversely affect our business.
Our foreign operations are subject to governmental regulations in the countries in which we operate as well as U.S. laws. These include regulations relating to currency conversion, repatriation of earnings, taxation of our earnings and the earnings of our personnel, and the increasing requirement in some countries to make greater use of local employees and suppliers, including, in some jurisdictions, mandates that provide for greater local participation in the ownership and control of certain local business assets.
The U.S. Foreign Corrupt Practices Act and similar other worldwide anti-corruption laws, such as the U.K. Bribery Act, prohibit improper payments for the purpose of obtaining or retaining business. Although we have established an internal control structure, corporate policies, compliance, and training processes to reduce the risk of violation, we cannot ensure that these procedures protect us from violations of such policies by our employees or agents. Failure to comply with applicable laws or regulations could subject us to fines, penalties, and suspension or debarment from contracting. Events of non-compliance could harm our reputation, reduce our revenues and profits, and subject us to criminal and civil enforcement actions. Violations of such laws or allegations of violation could disrupt our business and result in material adverse results to our operating results or future profitability.
Certain divisions of our business depend on a small number of suppliers. The loss of any such supplier could have a material adverse effect on our business, financial condition, and result of operations.
In our Rail Products businesses, we rely on a limited number of suppliers for key products that we sell to our customers. In addition, our Piling business is predominantly dependent upon one supplier for sheet piling while our Protective Coatings business is predominately dependent on two suppliers of epoxy coating. A significant downturn in the business of one or more of these suppliers, a disruption in their manufacturing operations, an unwillingness to continue to sell to us, or a disruption in the availability of existing and new piling and rail products may adversely impact our financial results.
Fluctuations in the price, quality, and availability of the primary raw materials used in our business could have a material adverse effect on our operations and profitability.
Most of our businesses utilize steel as a significant product component. The steel industry is cyclical and prices and availability are subject to these cycles as well as to international market forces. We also use significant amounts of cement and aggregate in our CXT Concrete Ties and Precast Concrete Products businesses. No assurances can be given that our financial results would not be adversely affected if prices or availability of these materials were to change in a significantly unfavorable manner.
Labor disputes may have a material adverse effect on our operations and profitability.
Four of our manufacturing facilities are staffed by employees represented by labor unions. Approximately
146
employees employed at these facilities are currently working under three separate collective bargaining agreements. Disputes with regard to the terms of these agreements or our potential inability to renegotiate acceptable contracts with these unions could result in, among other things, strikes, work stoppages, slowdowns, or lockouts, which could cause a disruption of our operations and have a material adverse effect on our results of operations, financial condition, and liquidity.
Actions of activist shareholders could be disruptive and potentially costly and the possibility that activist shareholders may seek changes that conflict with our strategic direction could cause uncertainty about the strategic direction of our business.
In February 2016, the Company entered into an agreement with an activist investor, Legion Partners Asset Management, LLC and various of its affiliates (collectively, “Legion Partners”) that had filed a Schedule 13D with the SEC with respect to the Company. Pursuant to that agreement, the Company agreed to appoint a representative of Legion Partners to the Company’s Board of Directors and Legion Partners agreed to various standstill provisions and to vote for the Company’s director nominees at the Company’s 2016 and 2017 Annual Meetings of Shareholders. This agreement expired by its terms on February 13, 2018.
13
Although our agreement with Legion Partners expired by its terms in February 2017, activist investors may attempt to effect changes in the Company’s strategic direction and how the Company is governed, or to acquire control over the Company. Some investors seek to increase short-term shareholder value by advocating corporate actions such as financial restructuring, increased borrowing, special dividends, stock repurchases, or even sales of assets or the entire company. While the Company welcomes varying opinions from all shareholders, activist campaigns that contest or conflict with our strategic direction could have an adverse effect on the Company’s results of operations and financial condition as responding to proxy contests and other actions by activist shareholders can disrupt our operations, be costly and time-consuming, and divert the attention of the Company’s board and senior management from the pursuit of business strategies. In addition, perceived uncertainties as to our future direction as a result of changes to the composition of our Board may lead to the perception of a change in the direction of the business, instability or lack of continuity, which may be exploited by our competitors, may cause concern to our current or potential customers, may result in the loss of potential business opportunities and may make it more difficult to attract and retain qualified personnel and business partners. These types of actions could cause significant fluctuations in our stock price based on temporary or speculative market perceptions or other factors that do not necessarily reflect the underlying fundamentals and prospects of our business.
Our success is highly dependent on the continued service and availability of qualified personnel.
Much of our future success depends on the continued availability and service of key personnel, including our Chief Executive Officer, the executive team, and other highly skilled employees. Changes in demographics, training requirements, and the availability of qualified personnel could negatively affect our ability to compete and lead to a reduction in our profitability.
We may not foresee or be able to control certain events that could adversely affect our business.
Unexpected events including fires or explosions at our facilities, natural disasters, armed conflicts, unplanned outages, equipment failures, failure to meet product specifications, or a disruption in certain of our operations, may cause our operating costs to increase or otherwise impact our financial performance.
Shifting federal, state, local, and foreign regulatory policies impose risks to our operations.
We are subject to regulation by federal, state, local, and foreign regulatory agencies. We are required to comply with numerous laws and regulations and to obtain numerous authorizations, permits, approvals, and certificates from governmental agencies. Compliance with emerging regulatory initiatives, delays, discontinuations, or reversals of existing regulatory policies in the markets in which we operate could have an adverse effect on our business, results of operations, cash flows, and financial condition.
The Tax Cuts and Jobs Act (the “Act”) was enacted on December 22, 2017. The Act reduces the U.S. federal corporate tax rate from 35% to 21%, requires companies to pay a one-time transition tax on previously deferred earnings of certain foreign subsidiaries, and creates new taxes on certain foreign sourced earnings. Our
2017
financial results include a provisional tax expense of
$3,298
related to the one-time transition tax, partially offset by a provisional
$1,508
tax benefit related to the remeasurement of certain deferred tax assets and liabilities. We will continue to refine our provisional tax amounts during 2018,
as we gain a more thorough understanding of the tax law, as further guidance is issued, and as we evaluate our income tax accounting policies with regard to certain provisions of the Act.
A substantial portion of our operations are heavily dependent on governmental funding of infrastructure projects. Many of these projects have “Buy America” or “Buy American” provisions. Significant changes in the level of government funding of these projects could have a favorable or unfavorable impact on our operating results. Additionally, government actions concerning “Buy America” provisions, taxation, tariffs, the environment, or other matters could impact our operating results.
ITEM 1B.
UNRESOLVED STAFF COMMENTS
None.
14
ITEM 2.
PROPERTIES
The location and general description of the principal properties which are owned or leased by L.B. Foster Company, together with the segment of the Company’s business using such properties, are set forth in the following table:
|
Location
|
Function
|
Acres
|
Business Segment
|
Lease
Expiration |
||||
|
Bedford, PA
|
Bridge component fabricating plant
|
16
|
Construction
|
Owned
|
||||
|
Birmingham, AL
|
Protective coatings facility
|
32
|
Tubular and Energy
|
2022
|
||||
|
Burnaby, British Columbia, Canada
|
Friction management products plant
|
N/A
|
Rail
|
2021
|
||||
|
Channelview, TX
|
Threading, test, and inspection facility
|
73
|
Tubular and Energy
|
Owned
|
||||
|
Columbia City, IN
|
Rail processing facility and yard storage
|
22
|
Rail
|
Owned
|
||||
|
Hillsboro, TX
|
Precast concrete facility
|
9
|
Construction
|
Owned
|
||||
|
Kimball, NE
|
Threading, test, and inspection facility
|
145
|
Tubular and Energy
|
Owned
|
||||
|
Leming, TX
|
Threading, test, and inspection facility
|
63
|
Tubular and Energy
|
Owned
|
||||
|
Magnolia, TX
|
Threading facility and joint venture manufacturing facility
|
35
|
Tubular and Energy
|
Owned
|
||||
|
Morgantown, WV
|
Test and inspection facility
|
N/A
|
Tubular and Energy
|
2018
|
||||
|
Niles, OH
|
Rail fabrication, friction management products, and yard storage
|
35
|
Rail
|
Owned
|
||||
|
Petersburg, VA
|
Piling storage facility
|
35
|
Construction
|
Owned
|
||||
|
Pueblo, CO
|
Rail joint manufacturing facility
|
9
|
Rail
|
Owned
|
||||
|
Saint-Jean-sur-Richelieu, Quebec, Canada
|
Rail anchors and track spikes manufacturing plant
|
17
|
Rail
|
Owned
|
||||
|
Sheffield, United Kingdom
|
Track component and friction management products facility
|
N/A
|
Rail
|
2019
|
||||
|
Spokane, WA
|
CXT concrete tie plant
|
13
|
Rail
|
2018
|
||||
|
Spokane, WA
|
Precast concrete facility
|
5
|
Construction
|
2018
|
||||
|
Waverly, WV
|
Precast concrete facility
|
85
|
Construction
|
Owned
|
||||
|
Willis, TX
|
Protective coatings facility
|
16
|
Tubular and Energy
|
Owned
|
||||
|
Willis, TX
|
Measurement services facility
|
68
|
Tubular and Energy
|
Owned
|
||||
Included in the table above are certain facilities leased by the Company for which there is no acreage included in the lease. For these properties a “N/A” has been included in the “Acres” column.
Including the properties listed above, the Company has a total of
17
sales offices, including its headquarters in Pittsburgh, PA and
32
warehouses, plants, and yard facilities located throughout the United States, Canada, and Europe. The Company’s facilities are in good condition and suitable for the Company’s business as currently conducted and as currently planned to be conducted.
ITEM 3.
LEGAL PROCEEDINGS
Information regarding the Company’s legal proceedings and other commitments and contingencies is set forth in Part II, Item 8, Financial Statements and Supplementary Data, Note 19 Commitments and Contingent Liabilities, to the Consolidated Financial Statements included herein, which is incorporated by reference into this Item 3.
ITEM 4.
MINE SAFETY DISCLOSURES
This item is not applicable to the Company.
15
ITEM 5.
MARKET FOR REGISTRANT'S COMMON EQUITY, RELATED STOCKHOLDER MATTERS, AND ISSUER PURCHASES OF EQUITY SECURITIES
Stock Market Information
(Dollars in thousands, except share data unless otherwise noted)
The Company had
309
common shareholders of record on
February 21, 2018
. Common stock prices are quoted daily through the NASDAQ Global Select Market quotation service (Symbol: FSTR). The following table sets forth the range of high and low sales prices per share of our common stock for the periods indicated:
|
|
2017
|
2016
|
||||||||||||||||||||||
|
Quarter
|
High
|
Low
|
Dividends
|
High
|
Low
|
Dividends
|
||||||||||||||||||
|
First
|
$
|
15.86
|
|
$
|
11.80
|
|
$
|
—
|
|
$
|
18.53
|
|
$
|
8.80
|
|
$
|
0.04
|
|
||||||
|
Second
|
21.95
|
|
12.15
|
|
—
|
|
20.77
|
|
10.12
|
|
0.04
|
|
||||||||||||
|
Third
|
23.25
|
|
17.00
|
|
—
|
|
12.50
|
|
9.25
|
|
0.04
|
|
||||||||||||
|
Fourth
|
27.45
|
|
21.15
|
|
—
|
|
15.65
|
|
9.25
|
|
—
|
|
||||||||||||
Dividends
During the fourth quarter 2016, the Board of Directors decided to suspend the Company’s quarterly dividend.
The Company’s November 7, 2016 credit facility permits it to pay dividends and distributions and make redemptions with respect to its stock providing no event of default or potential default (as defined in the facility agreement) has occurred prior to or after giving effect to the dividend, distribution, or redemption. Dividends, distributions, and redemptions are capped at $1,700 per year when funds are drawn on the facility.
16
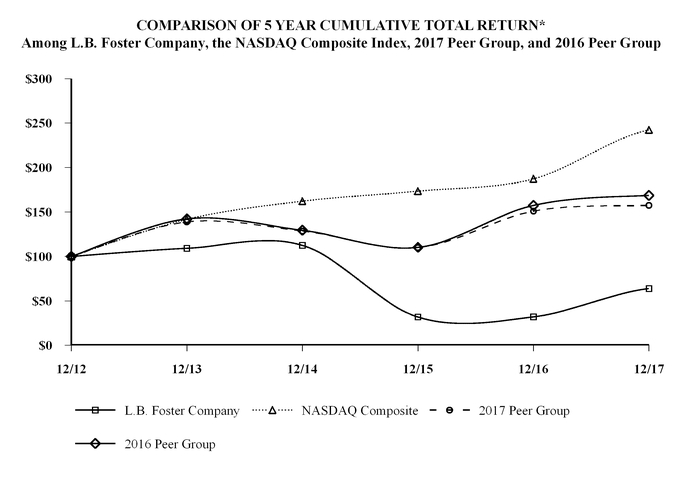
Performance Graph
(In whole dollars)
In
2017
, the Company changed its peer group to align it with the Company’s comparator group as used by the Company’s compensation committee to evaluate the Company’s compensation practices. The Company’s
2017
peer group (“2017 Peer Group”) consists of Alamo Group, Inc., American Railcar Industries, Inc., Ampco-Pittsburgh Corporation, CIRCOR International, Inc., Columbus McKinnon Corporation, Gibraltar Industries, Inc., Hawkins, Inc., Haynes International, Inc., Houston Wire & Cable Company, Insteel Industries Inc., Lindsay Corporation, Lydall Inc., Manitex International, Inc., NN Inc., Orion Marine Group, Inc., Quanex Building Products Corporation, Raven Industries Inc., Sterling Construction Co. Inc., and The Gorman-Rupp Company.
Prior to
2017
, the Company's peer group (“2016 Peer Group”) consisted of Alamo Group, Inc., AM Castle & Co., American Railcar Industries, Inc., CIRCOR International, Inc., Columbus McKinnon Corporation, Gibraltar Industries, Inc., Houston Wire & Cable Company, Insteel Industries Inc., Lindsay Corporation, Lydall Inc., MYR Group, Inc., NN Inc., Northwest Pipe Co., Olympic Steel Inc., Orion Marine Group, Inc., Quanex Building Products Corporation, Raven Industries Inc., and Sterling Construction Co. Inc.
The following tables compare total shareholder returns for the Company over the last five years to the NASDAQ Composite Index and the peer groups assuming a $100 investment made on
December 31, 2012
. Each of the four measures of cumulative total return assumes reinvestment of dividends. The stock performance shown on the graph below is not necessarily indicative of future price performance.
|
*
|
$100 invested on 12/31/2012 in stock or index, including reinvestment of dividends. Fiscal year ended December 31.
|
|
12/12
|
12/13
|
12/14
|
12/15
|
12/16
|
12/17
|
|||||||||||||
|
L.B. Foster Company
|
$
|
100.00
|
|
$
|
109.16
|
|
$
|
112.41
|
|
$
|
31.86
|
|
$
|
32.00
|
|
$
|
63.89
|
|
|
NASDAQ Composite
|
100.00
|
|
141.63
|
|
162.09
|
|
173.33
|
|
187.19
|
|
242.29
|
|
||||||
|
2017 Peer Group
|
100.00
|
|
138.84
|
|
128.55
|
|
109.99
|
|
150.91
|
|
157.39
|
|
||||||
|
2016 Peer Group
|
100.00
|
|
142.21
|
|
129.37
|
|
110.18
|
|
157.34
|
|
168.61
|
|
||||||
17
Securities Authorized for Issuance Under Equity Compensation Plans
The following table sets forth information at
December 31, 2017
with respect to compensation plans under which equity securities of the Company are authorized for issuance.
|
Plan Category
|
Number of securities to be issued upon exercise of outstanding options, warrants, and rights
(a)
|
Weighted-average exercise price of outstanding options, warrants, and rights
(b)
|
Number of securities remaining available for future issuance under equity compensation plans (excluding securities to be issued upon exercise of outstanding options, warrants, or rights)
(c)
|
||||||||
|
Equity compensation plans approved by shareholders
|
429,058
|
|
(1)
|
$
|
—
|
|
(2)
|
210,332
|
|
(3)
|
|
|
Equity compensation plans not approved by shareholders
|
—
|
|
—
|
|
—
|
|
|||||
|
Total
|
429,058
|
|
(1)
|
—
|
|
(2)
|
210,332
|
|
(3)
|
||
|
(1)
|
The number of performance share units included in this table reflects an assumed payout at maximum performance achievement. The performance share units were granted under the 2006 Omnibus Incentive Plan and were unvested and unearned at
December 31, 2017
.
|
|
(2)
|
At
December 31, 2017
, there were no outstanding awards with an exercise price per share. This column does not reflect outstanding performance share units.
|
|
(3)
|
Does not include the
429,058
performance share units included in column (a).
|
Under the 2006 Omnibus Incentive Plan, since May 24, 2006, non-employee directors have been automatically awarded shares of the Company’s common stock as determined by the Board of Directors at each annual shareholder meeting at which such non-employee director is elected or re-elected. During
2017
, pursuant to the 2006 Omnibus Incentive Plan, the Company issued approximately
28,000
fully-vested shares of the Company’s common stock for the annual non-employee director equity award. During
2017
, the Company issued approximately
11,000
shares to certain non-employee directors who elected the option to receive fully-vested shares of the Company’s common stock in lieu of director cash compensation. Through
December 31, 2017
, there were
223,920
fully vested shares issued under the 2006 Omnibus Incentive Plan to non-employee directors. During the quarter ended June 30, 2017, the Nomination and Governance Committee and Board of Directors jointly approved the Deferred Compensation Plan for Non-Employee Directors under the 2006 Omnibus Incentive Plan, which permits non-employee directors of the Company to defer receipt of earned cash and/or stock compensation for service on the Board. During
2017
, approximately
27,000
deferred share units were allotted to the accounts of non-employee directors pursuant to the Deferred Compensation Plan for Non-Employee Directors.
The Company grants eligible employees restricted stock and performance unit awards under the 2006 Incentive Omnibus Plan. The forfeitable restricted stock awards granted prior to March 2015 generally time-vest after a four-year period, and those granted after March 2015 generally time-vest ratably over a three-year period, unless indicated otherwise in the underlying restricted stock award agreement. Performance unit awards are offered annually under separate three-year long-term incentive programs. Performance units are subject to forfeiture and will be converted into common stock of the Company based upon the Company’s performance relative to performance measures and conversion multiples as defined in the underlying program.
With respect to awards made prior to December 31, 2016, the Company will withhold or employees may tender shares of restricted stock when issued to pay for withholding taxes. Since 2017, the Company will withhold shares of restricted stock for satisfaction of tax withholding obligations. During
2017
,
2016
, and
2015
, the Company withheld
7,277
,
20,186
, and
25,340
shares, respectively, for this purpose. The values of the shares withheld were
$103
,
$275
, and
$1,114
in
2017
,
2016
, and
2015
, respectively. Awards made since January 1,
2018
provide that the Company will withhold shares of restricted stock to satisfy tax withholding obligations.
18
Issuer Purchases of Equity Securities
The Company’s purchases of equity securities for the three-month period ended
December 31, 2017
were as follows:
|
Total number of shares purchased (1)
|
Average price paid per share
|
Total number of shares purchased as part of publicly announced plans or programs (2)
|
Approximate dollar value of shares that may yet be purchased under the plans or programs
|
|||||||||||
|
October 1, 2017 - October 31, 2017
|
—
|
|
$
|
—
|
|
—
|
|
$
|
29,933
|
|
||||
|
November 1, 2017 - November 30, 2017
|
—
|
|
—
|
|
—
|
|
29,933
|
|
||||||
|
December 1, 2017 - December 31, 2017
|
—
|
|
—
|
|
—
|
|
29,933
|
|
||||||
|
Total
|
—
|
|
$
|
—
|
|
—
|
|
$
|
29,933
|
|
||||
|
(1)
|
Reflects shares withheld by the Company to pay taxes upon vesting of restricted stock. These shares do not impact the remaining authorization to repurchase shares under approved plans or programs. No such shares were withheld during the three-month period ended
December 31, 2017
.
|
|
(2)
|
On December 9, 2015, the Board of Directors authorized the repurchase of up to $30,000 of the Company’s common shares until December 31, 2017. This authorization became effective January 1, 2016. The $30,000 repurchase authorization is restricted under the terms of the Second Amendment to the Second Amended and Restated Credit Agreement dated March 13, 2015, and as amended by the Second Amendment dated November 7, 2016 (“Second Amendment”). Dividends, distributions, and redemptions under the Second Amendment are capped at a maximum annual amount of $1,700 throughout the life of the repurchase authorization. For the three-month period ended
December 31, 2017
, there were no share repurchases as part of the authorized program. At
December 31, 2017
, approximately
$29,933
remained of our $30,000 share repurchase program that was announced December 9, 2015. This repurchase program expired December 31, 2017.
|
19
ITEM 6.
SELECTED FINANCIAL DATA
(Dollars in thousands, except per share data)
The following selected financial data has been derived from our audited financial statements. The financial data presented below should be read in conjunction with the information contained in “Management’s Discussion and Analysis of Financial Condition and Results of Operations” and the Consolidated Financial Statements of the Company and the Notes thereto included elsewhere in this Annual Report on Form 10-K.
|
|
Year Ended December 31,
|
|||||||||||||||||||
|
Income Statement Data
|
2017 (a)
|
2016 (b)
|
2015 (c)
|
2014 (d)
|
2013 (e)
|
|||||||||||||||
|
Net sales
|
$
|
536,377
|
|
$
|
483,514
|
|
$
|
624,523
|
|
$
|
607,192
|
|
$
|
597,963
|
|
|||||
|
Operating profit (loss)
(f)
|
$
|
15,739
|
|
$
|
(5,195
|
)
|
$
|
28,760
|
|
$
|
37,082
|
|
$
|
41,571
|
|
|||||
|
Net income (loss)
|
$
|
4,113
|
|
$
|
(141,660
|
)
|
$
|
(44,445
|
)
|
$
|
25,656
|
|
$
|
29,290
|
|
|||||
|
Basic earnings (loss) per common share
|
$
|
0.40
|
|
$
|
(13.79
|
)
|
$
|
(4.33
|
)
|
$
|
2.51
|
|
$
|
2.88
|
|
|||||
|
Diluted earnings (loss) per common share
|
$
|
0.39
|
|
$
|
(13.79
|
)
|
$
|
(4.33
|
)
|
$
|
2.48
|
|
$
|
2.85
|
|
|||||
|
Dividends paid per common share
|
$
|
—
|
|
$
|
0.12
|
|
$
|
0.16
|
|
$
|
0.13
|
|
$
|
0.12
|
|
|||||
|
(a)
|
2017
includes provisional tax amounts related to the enactment of the U.S. Tax Cuts and Jobs Act, including additional tax expense of
$3,298
related to the one-time transition tax and a
$1,508
tax benefit related to the remeasurement of certain deferred tax assets and liabilities. More information about the tax reform can be found in Part II, Item 8, Financial Statements and Supplementary Data, Note 14 Income Tax, to the Consolidated Financial Statements included herein.
|
|
(b)
|
2016
includes long-lived tangible and intangible, including goodwill, asset impairments of $135,884. More information about the impairments can be found in Part II, Item 8, Financial Statements and Supplementary Data, Note 4 Goodwill and Other Intangible Assets, and Note 7 Property, Plant, and Equipment, to the Consolidated Financial Statements included herein.
|
|
(c)
|
2015
includes the results of the acquisitions of TEW Plus, Ltd. (“Tew Plus”) (November 23), IOS Holdings, Inc (“IOS”) (March 13), and TEW Holdings, Ltd. (“Tew”) (January 13). The results also include an $80,337 impairment of goodwill related to the IOS and Chemtec reporting units. More information about the impairment can be found in Part II, Item 8, Financial Statements and Supplementary Data, Note 4 Goodwill and Other Intangible Assets, to the Consolidated Financial Statements included herein.
|
|
(d)
|
2014
includes CXT Concrete Tie UPRR warranty charges of $9,374 within the Rail Products and Services segment. The
2014
results also include the acquisitions of Carr Concrete (July 7), FWO (October 29), and Chemtec (December 30).
|
|
(e)
|
2013
includes the acquisition of Ball Winch, (November 7).
|
|
(f)
|
Operating profit (loss) represents the gross profit less selling and administrative expenses and amortization expense.
|
|
|
December 31,
|
|||||||||||||||||||
|
Balance Sheet Data
|
2017
|
2016
|
2015
|
2014
|
2013
|
|||||||||||||||
|
Total assets
|
$
|
396,556
|
|
$
|
393,023
|
|
$
|
566,660
|
|
$
|
491,717
|
|
$
|
413,193
|
|
|||||
|
Working capital
|
127,581
|
|
117,273
|
|
122,828
|
|
135,488
|
|
171,603
|
|
||||||||||
|
Long-term debt
|
129,310
|
|
149,179
|
|
167,419
|
|
25,752
|
|
25
|
|
||||||||||
|
Stockholders' equity
|
146,479
|
|
133,251
|
|
282,832
|
|
335,888
|
|
316,397
|
|
||||||||||
20
ITEM 7.
MANAGEMENT'S DISCUSSION AND ANALYSIS OF FINANCIAL CONDITION AND RESULTS OF OPERATIONS
(Dollars in thousands, except share data unless otherwise noted)
Executive Level Overview
2017
Developments and
2018
Outlook
During
2017
, we:
|
•
|
Increased net sales by
$52,863
, or
10.9%
, to
$536,377
;
|
|
•
|
Generated net income of
$4,113
, or
$0.39
per diluted share;
|
|
•
|
Incurred provisional tax expense of $1,790 related to the enactment of the U.S. Tax Cuts and Jobs Act;
|
|
•
|
Generated EBITDA (earnings before interest, taxes, depreciation, and amortization) of
$35,953
;
(a)
|
|
•
|
Effectively managed working capital levels, resulting in
$39,372
of net cash provided by operating activities;
|
|
•
|
Reduced borrowings by
$29,600
, including the payoff of our term loan;
|
|
•
|
Decreased selling and administrative expenses by
$5,455
, primarily from our successful 2016 workforce and operations restructuring;
|
|
•
|
Successfully completed a $1,800 building expansion at our Waverly, WV precast concrete facility allowing us to broaden our product capabilities;
|
|
•
|
Installed and maintained 285 trackside rail lubricator units as part of a Class 1 long-term service agreement; and
|
|
•
|
Increased new orders by
14.5%
resulting in a backlog of
$166,905
, which is a
13.2%
increase over the prior year end.
|
(a) The following table displays a reconciliation of this non-GAAP financial measure for the three-year periods ended
December 31, 2017
,
2016
, and
2015
. Adjusted EBITDA adjusts EBITDA for the
2016
and
2015
asset impairments. EBITDA and Adjusted EBITDA are financial metrics utilized by management to evaluate the Company’s performance on a comparable basis. Management believes that disclosure of these non-GAAP financial measures is useful to investors as an additional way to evaluate the Company’s performance.
|
Twelve Months Ended
December 31, |
||||||||||||
|
|
2017
|
2016
|
2015
|
|||||||||
|
Adjusted EBITDA Reconciliation
|
||||||||||||
|
Net income (loss)
|
$
|
4,113
|
|
$
|
(141,660
|
)
|
$
|
(44,445
|
)
|
|||
|
Interest expense, net
|
8,070
|
|
6,323
|
|
4,172
|
|
||||||
|
Income tax expense (benefit)
|
3,929
|
|
(5,509
|
)
|
(6,132
|
)
|
||||||
|
Depreciation
|
12,849
|
|
13,917
|
|
14,429
|
|
||||||
|
Amortization
|
6,992
|
|
9,575
|
|
12,245
|
|
||||||
|
Total EBITDA
|
35,953
|
|
(117,354
|
)
|
(19,731
|
)
|
||||||
|
Asset impairments
|
—
|
|
135,884
|
|
80,337
|
|
||||||
|
Adjusted EBITDA
|
$
|
35,953
|
|
$
|
18,530
|
|
$
|
60,606
|
|
|||
Throughout 2017, the Company saw strengthening results compared to our prior year, as many of the markets we serve continued their recovery, which ultimately led to several of our businesses outperforming against projections. During 2017 our Rail Products and Services segment was encouraged as the North American freight rail market began increasing spending related to the Company’s product and service offerings. As Class I rail carriers reported steady, and in some instances, lower capital spending compared to the prior year, we believe this spending has been directed toward the need for maintenance and other track infrastructure programs compared to rolling stock and locomotives, which drove our sales growth. The first half of 2017 had strengthening commodity markets which translated into increased commodity carloads for rail carriers compared to the prior year period. Rail carloads were up throughout 2017 primarily driven by intermodal activity. However, carloads do remain suppressed compared to historical levels due to the continuing energy industry shift away from coal to natural gas as well as declining rail shipments of crude oil and most other metals, ores, and agriculture products. Our Rail Distribution business has been particularly impacted as this division serves Class II railroads and the North American industrial rail market, which have experienced reduced project activity and pricing declines to remain competitive. Freight rail in North America also experienced moderate increases in coal carloads, however, coal shipments are not expected to return to peak levels in the near future. Spending in 2018 by the freight rail operators in North America is anticipated to increase from 2017 levels as the market is expected to experience continued growth, particularly within intermodal, as the trucking market tightens and operators look to further efficiencies within their infrastructures.
21
Freight rail operators are prioritizing spending against safety improvement, operating efficiency, and other cost reduction activities. The Company continues to target products and solutions to help improve safety and operating efficiency as well as introduce services that contribute to extending the useful life of certain rail equipment and lowering maintenance costs for operators. Freight rail operators are expected to benefit from the need for intermodal networks to efficiently ship goods.
Funding for transit rail projects in North America continued to improve through 2017. While our revenues from this market are always affected by swings in large projects from one year to the next, we continue to believe the transit market will grow over the long run, which was indicative by significant increases in new orders positioning us with a very strong backlog as we enter 2018. During 2017, we capitalized on opportunities with transit agencies who continue to expand to serve further geographic areas and passenger traffic. Management believes that the global transit market represents an attractive opportunity for future growth. Our recent investments in the U.K. continue to provide growth as passenger networks are extended, especially in the most congested areas. Substantial job wins continued throughout 2017 as investments in London and inter-city networks within the U.K. remain solid.
While certain key steel price indices have shown recent increases, pricing in the markets we serve has continued to lag. Management enacted multiple strategies in an effort to maximize profit margins throughout the prolonged downturn in the North American freight rail market. As we exit this downturn, we believe our current cost structure in place reflected positive returns in 2017 and positions us to meet our increased 2018 projections. Should business activity be weaker than projected, we are better positioned to handle these changes.
As we exited 2016, the Tubular and Energy Services segment began to see recovery from the struggling energy market it serves. Throughout 2017, we experienced increases in both our upstream and midstream order activity. We saw rig counts increase during the year, driving our growth in our upstream services. As a result, upstream sales have increased sequentially each quarter during the year, ending the year at almost double the prior year sales total. Although overall rig counts began to moderate towards the end of the year, the Company is encouraged by the impact of productivity that is driving well count per rig at a higher rate along with increased depths and lateral lengths of wells. The midstream market recovery, which tends to lag the upstream market, strengthened considerably throughout the year as orders in our Protective Coatings and Precision Measurement Systems businesses increased over 50% from the prior year.
It is our continued belief that there are widespread needs across the U.S. for pipeline infrastructure in the long term, and new demand will be driven by already developed wells, future export potential, and transition from coal to natural gas plants. With 2018 projections showing U.S. rig counts continuing to grow, production increases to over ten million barrels per day, and futures trading at prices not seen since 2015, the Company anticipates the Tubular and Energy Services segment’s solid performance to continue as we move into 2018.
Within our Construction Products segment, heavy civil construction projects as well as bridge spending experienced marginal decreases in 2017 as compared to the prior year levels. This decline was particularly felt in the second half of 2017. We entered 2018 with an improved backlog across all businesses within the segment, with the exception of Fabricated Bridge Products. Although our bridge division has not booked a mega project during 2017, it is not indicative of any weakness in our capabilities to secure grid decking business. Neither the dynamics of this market nor the number of structurally deficient, obsolete bridges have changed in a meaningful way.
While Piling sales increased compared to the prior year, primarily from our commoditized piling products, the overall profit was reduced. This was due to managements strategic initiative to aggressively pursue targeted opportunities at a reduced margin level, impacting the short-term results but is anticipated to develop favorable long-term market share in a highly competitive segment. We are encouraged by our strong backlog as we enter 2018 with several new winnable projects in front of us along with the current administration’s emphasis on infrastructure, a healthier overall economy, and a rising price environment.
The Precast Concrete Products business continued to show moderate growth during 2017. Along with the successful investment made at our West Virginia facility to improve capacity and efficiency, we have added revenue from reaching new markets and customers throughout the northeast U.S. as well as increased product offerings. We anticipate this market to grow at a slower pace, but we enter 2018 with increased backlog and improved order entry.
Management intends to stay focused on prudent working capital management and operating cash flow to continue to pay down our outstanding debt. With the prior year restructuring activities being fully realized during 2017, we believe that the Company’s expenses and operating leverage now provide the agility to succeed in the cyclical markets in which we participate. Our long-term objective is to continue the modernization of the entire Company with the ongoing integration of our ERP system from which we can grow and leverage best in class business processes.
22
UPRR Product Warranty Claim
On January 23, 2015, UPRR filed a Complaint and Demand for Jury Trial in the District Court for Douglas County, NE against the Company and its subsidiary, CXT, asserting, among other matters, that the Company breached its express warranty, breached an implied covenant of good faith and fair dealing, and anticipatorily repudiated its warranty obligations, and that UPRR’s exclusive and limited remedy provisions in the supply agreement have failed of their essential purpose which entitles UPRR to recover all incidental and consequential damages. The Complaint seeks to cancel all duties of UPRR under the contract, to adjudge the Company as having no remaining rights under the contracts, and to recover damages in an amount to be determined at trial for the value of unfulfilled warranty replacement ties and ties likely to become warranty eligible, for costs of cover for replacement ties, and for various incidental and consequential damages. The amended 2005 supply agreement provides that UPRR’s exclusive remedy is to receive a replacement tie that meets the contract specifications for each tie that failed to meet the contract specifications or otherwise contained a material defect provided that the Company receives written notice of such failure or defect within 15 years after that tie was produced. The amended 2005 supply agreement provides that the Company’s warranty does not apply to ties that (a) have been repaired or altered without the Company’s written consent in such a way as to affect the stability or reliability thereof, (b) have been subject to misuse, negligence, or accident, or (c) have been improperly maintained or used contrary to the specifications for which such ties were produced. The amended 2005 supply agreement also continues to provide that the Company’s warranty is in lieu of all other express or implied warranties and that neither party shall be subject to or liable for any incidental or consequential damages to the other party. The dispute is largely based on (1) claims submitted that the Company believes are for ties claimed for warranty replacement that are inaccurately rated under concrete tie rating guidelines and procedures agreed to in 2012 and incorporated by amendment to the 2005 supply agreement and are not the responsibility of the Company and claims that do not meet the criteria of a warranty replacement and (2) UPRR’s assertion, which the Company vigorously disputes, that UPRR in future years will be entitled to warranty replacement ties for virtually all of the Grand Island ties. Many thousands of Grand Island ties have been performing in track for over ten years. In addition, a significant amount of Grand Island ties were rated by both parties in the excellent category of the rating system.
By Third Amended Scheduling Order dated September 26, 2017, a June 29, 2018 deadline for completion of discovery has been established with trial to proceed at some future date on or after October 1, 2018. The parties continued to conduct discovery, with various disputes that required and will likely require court resolution. The Company intends to continue to engage in discussions in an effort to resolve the UPRR matter. However, we cannot predict that such discussions will be successful, or that the results of the litigation with UPRR, or any settlement or judgment amounts, will reasonably approximate our estimated accruals for loss contingencies. Future potential costs pertaining to UPRR’s claims and the outcome of the UPRR litigation could result in a material adverse effect on our results of operations, financial condition, and cash flows.
23
Year-to-date Results Comparison
The segment gross profit measures presented within Management's Discussion and Analysis of Financial Condition and Results of Operations (“MD&A”) constitute non-GAAP financial measures disclosed by management to provide investors and other users information to evaluate the performance of the Company’s segments on a more comparable basis to market trends and peers. These non-GAAP financial measures exclude significant cost allocations to the reportable segments:
•
Allows users to understand the operational performance of our reportable segments;
•
Provides greater comparability to other registrants with similar businesses and avoids possible non-comparability at the reportable segment pre-tax profit level resulting from our specific corporate cost allocations; and
•
Facilitates a clearer, market-based perspective on the strength or weakness of our reportable segments in their markets to better aid in investment decisions.
In addition, these non-GAAP financial measures have historically been key metrics utilized by segment managers to monitor selling prices and quantities as well as production and service costs to better evaluate key profitability drivers and trends that may develop due to industry and competitive conditions. The following table reconciles the non-GAAP financial measures to the profitability of the segments reporting in accordance with GAAP:
|
Twelve months ended December 31, 2017
|
Rail Products and
Services |
Construction
Products |
Tubular and Energy
Services |
Total
|
||||||||||||
|
Reportable Segment Profit
|
$
|
12,216
|
|
$
|
11,620
|
|
$
|
3,849
|
|
$
|
27,685
|
|
||||
|
Segment and Allocated Selling & Administrative
|
36,975
|
|
18,796
|
|
16,036
|
|
71,807
|
|
||||||||
|
Amortization Expense
|
3,698
|
|
151
|
|
3,143
|
|
6,992
|
|
||||||||
|
Asset Impairments
|
—
|
|
—
|
|
—
|
|
—
|
|
||||||||
|
Non-GAAP Segment Gross Profit
|
$
|
52,889
|
|
$
|
30,567
|
|
$
|
23,028
|
|
$
|
106,484
|
|
||||
|
Twelve months ended December 31, 2016
|
Rail Products and
Services |
Construction
Products |
Tubular and Energy
Services |
Total
|
||||||||||||
|
Reportable Segment (Loss) Profit
|
$
|
(26,228
|
)
|
$
|
8,189
|
|
$
|
(116,126
|
)
|
$
|
(134,165
|
)
|
||||
|
Segment and Allocated Selling & Administrative
|
40,696
|
|
18,739
|
|
17,978
|
|
77,413
|
|
||||||||
|
Amortization Expense
|
3,881
|
|
151
|
|
5,543
|
|
9,575
|
|
||||||||
|
Asset Impairments
|
32,725
|
|
—
|
|
103,159
|
|
135,884
|
|
||||||||
|
Non-GAAP Segment Gross Profit
|
$
|
51,074
|
|
$
|
27,079
|
|
$
|
10,554
|
|
$
|
88,707
|
|
||||
|
Twelve months ended December 31, 2015
|
Rail Products and
Services |
Construction
Products |
Tubular and Energy
Services |
Total
|
||||||||||||
|
Reportable Segment Profit (Loss)
|
$
|
27,037
|
|
$
|
12,958
|
|
$
|
(81,344
|
)
|
$
|
(41,349
|
)
|
||||
|
Segment and Allocated Selling & Administrative
|
44,204
|
|
20,969
|
|
15,520
|
|
80,693
|
|
||||||||
|
Amortization Expense
|
4,035
|
|
242
|
|
7,968
|
|
12,245
|
|
||||||||
|
Asset Impairments
|
—
|
|
—
|
|
80,337
|
|
80,337
|
|
||||||||
|
Non-GAAP Segment Gross Profit
|
$
|
75,276
|
|
$
|
34,169
|
|
$
|
22,481
|
|
$
|
131,926
|
|
||||
24
Results of Operations
|
|
Twelve Months Ended
December 31, |
Percent of Total Net Sales
Twelve Months Ended December 31, |
Percent
Increase/(Decrease) |
||||||||||||||||||||||||
|
|
2017
|
2016
|
2015
|
2017
|
2016
|
2015
|
2017 vs. 2016
|
2016 vs. 2015
|
|||||||||||||||||||
|
Net Sales:
|
|||||||||||||||||||||||||||
|
Rail Products and Services
|
$
|
256,127
|
|
$
|
239,127
|
|
$
|
328,982
|
|
47.8
|
%
|
49.5
|
%
|
52.7
|
%
|
7.1
|
%
|
(27.3
|
)%
|
||||||||
|
Construction Products
|
161,801
|
|
145,602
|
|
176,394
|
|
30.2
|
|
30.1
|
|
28.2
|
|
11.1
|
|
(17.5
|
)
|
|||||||||||
|
Tubular and Energy Services
|
118,449
|
|
98,785
|
|
119,147
|
|
22.0
|
|
20.4
|
|
19.1
|
|
19.9
|
|
(17.1
|
)
|
|||||||||||
|
Total net sales
|
$
|
536,377
|
|
$
|
483,514
|
|
$
|
624,523
|
|
100.0
|
%
|
100.0
|
%
|
100.0
|
%
|
10.9
|
%
|
(22.6
|
)%
|
||||||||
|
|
Twelve Months Ended
December 31, |
Non-GAAP / Reported
Gross Profit Percentage Twelve Months Ended December 31, |
Percent
Increase/(Decrease) |
||||||||||||||||||||||||
|
|
2017
|
2016
|
2015
|
2017
|
2016
|
2015
|
2017 vs. 2016
|
2016 vs. 2015
|
|||||||||||||||||||
|
Gross Profit:
|
|||||||||||||||||||||||||||
|
Non-GAAP Rail Products and Services
|
$
|
52,889
|
|
$
|
51,074
|
|
$
|
75,276
|
|
20.6
|
%
|
21.4
|
%
|
22.9
|
%
|
3.6
|
%
|
(32.2
|
)%
|
||||||||
|
Non-GAAP Construction Products
|
30,567
|
|
27,079
|
|
34,169
|
|
18.9
|
|
18.6
|
|
19.4
|
|
12.9
|
|
(20.7
|
)
|
|||||||||||
|
Non-GAAP Tubular and Energy Services
|
23,028
|
|
10,554
|
|
22,481
|
|
19.4
|
|
10.7
|
|
18.9
|
|
118.2
|
|
(53.1
|
)
|
|||||||||||
|
Non-GAAP Segment gross profit
|
106,484
|
|
88,707
|
|
131,926
|
|
|||||||||||||||||||||
|
LIFO (expense) income
|
(2,009
|
)
|
2,643
|
|
2,468
|
|
(0.4
|
)
|
0.5
|
|
0.4
|
|
(176.0
|
)
|
7.1
|
|
|||||||||||
|
Other
|
(1,223
|
)
|
(994
|
)
|
(741
|
)
|
(0.2
|
)
|
(0.2
|
)
|
(0.1
|
)
|
(23.0
|
)
|
(34.1
|
)
|
|||||||||||
|
Total gross profit
|
$
|
103,252
|
|
$
|
90,356
|
|
$
|
133,653
|
|
19.2
|
%
|
18.7
|
%
|
21.4
|
%
|
14.3
|
%
|
(32.4
|
)%
|
||||||||
|
|
Twelve Months Ended
December 31, |
Percent of Total Net Sales
Twelve Months Ended December 31, |
Percent
Increase/(Decrease) |
||||||||||||||||||||||||
|
|
2017
|
2016
|
2015
|
2017
|
2016
|
2015
|
2017 vs. 2016
|
2016 vs. 2015
|
|||||||||||||||||||
|
Expenses:
|
|||||||||||||||||||||||||||
|
Selling and administrative expenses
|
$
|
80,521
|
|
$
|
85,976
|
|
$
|
92,648
|
|
15.0
|
%
|
17.8
|
%
|
14.8
|
%
|
(6.3
|
)%
|
(7.2
|
)%
|
||||||||
|
Amortization expense
|
6,992
|
|
9,575
|
|
12,245
|
|
1.3
|
|
2.0
|
|
2.0
|
|
(27.0
|
)
|
(21.8
|
)
|
|||||||||||
|
Asset impairments
|
—
|
|
135,884
|
|
80,337
|
|
—
|
|
28.1
|
|
12.9
|
|
(100.0
|
)
|
69.1
|
|
|||||||||||
|
Interest expense
|
8,377
|
|
6,551
|
|
4,378
|
|
1.6
|
|
1.4
|
|
0.7
|
|
27.9
|
|
49.6
|
|
|||||||||||
|
Interest income
|
(307
|
)
|
(228
|
)
|
(206
|
)
|
(0.1
|
)
|
—
|
|
—
|
|
(34.6
|
)
|
(10.7
|
)
|
|||||||||||
|
Equity (income) loss of nonconsolidated investments
|
(6
|
)
|
1,290
|
|
413
|
|
—
|
|
0.3
|
|
0.1
|
|
(100.5
|
)
|
212.3
|
|
|||||||||||
|
Other income
|
(367
|
)
|
(1,523
|
)
|
(5,585
|
)
|
(0.1
|
)
|
(0.3
|
)
|
(0.9
|
)
|
75.9
|
|
72.7
|
|
|||||||||||
|
Total expenses
|
$
|
95,210
|
|
$
|
237,525
|
|
$
|
184,230
|
|
17.8
|
%
|
49.1
|
%
|
29.5
|
%
|
(59.9
|
)%
|
28.9
|
%
|
||||||||
|
Income (loss) before income taxes
|
$
|
8,042
|
|
$
|
(147,169
|
)
|
$
|
(50,577
|
)
|
1.5
|
%
|
(30.4
|
)%
|
(8.1
|
)%
|
105.5
|
%
|
(191.0
|
)%
|
||||||||
|
Income tax expense (benefit)
|
3,929
|
|
(5,509
|
)
|
(6,132
|
)
|
0.7
|
|
(1.1
|
)
|
(1.0
|
)
|
171.3
|
|
10.2
|
|
|||||||||||
|
Net income (loss)
|
$
|
4,113
|
|
$
|
(141,660
|
)
|
$
|
(44,445
|
)
|
0.8
|
%
|
(29.3
|
)%
|
(7.1
|
)%
|
102.9
|
%
|
(218.7
|
)%
|
||||||||
25
Fiscal
2017
Compared to Fiscal
2016
— Company Analysis
Net sales of
$536,377
for the year ended
December 31, 2017
increased by
$52,863
, or
10.9%
, compared to the prior year period. Each of the three segments reported overall year over year increases of
19.9%
,
11.1%
, and
7.1%
for Tubular and Energy Services, Construction Products, and Rail Products and Services, respectively.
Gross profit margin for
2017
was
19.2%
, or
50
basis points (“bps”) higher than the prior year. The current year margin was significantly impacted by the recovery in the oil and gas market but partially offset by pricing pressure within the rail market. Included in the
2017
gross profit was
$2,009
related to LIFO expense compared to
$2,643
of income in the prior year.
Selling and administrative expenses decreased by
$5,455
, or
6.3%
, over the prior year period. The decrease was primarily attributable to the prior year restructuring activity of $2,827 and, to a lesser extent, the reduction of legal costs related to the UPRR matter of $1,250 and reduced insurance reserves of $1,075.
The Company did not record asset impairments for the year ended
December 31, 2017
. Non-cash asset impairments of
$135,884
were recorded during the year ended December 31, 2016. During the second quarter of 2016, the Company identified various indicators that suggested that there was a more likely than not probability that the carrying values of certain assets and reporting units were less than their respective fair values in the prior year. The impairment indicators included a rapid deterioration in actual performance against forecasts, downward revisions in projected financial results, declines in the Company’s market capitalization, and reductions in new order activity.
Asset groups that had indicators of impairment were analyzed to determine if the carrying values were recoverable. Based upon the recoverability assessment, the Company determined that certain intangible assets and property, plant, and equipment within the Test and Inspection Services business unit and certain intangible assets within the Chemtec business unit were impaired. The impairment assessment was finalized during the three-month period ended September 30, 2016 resulting in a $59,786 definite-lived intangible asset impairment and a $14,956 property, plant, and equipment impairment that were recorded within the Tubular and Energy Services segment. The remaining asset groups tested for recoverability were substantially in excess of their respective carrying values.
The Company performed an interim goodwill impairment review as of June 1, 2016 as a result of the adverse effect on certain reporting units of reduced capital spending and cost reduction priorities that oil and gas developers and railroad customers have enacted as well as the indicators previously noted. The forecasts for the Chemtec, Protective Coatings, and Rail Technologies business units did not indicate a timely recovery to support the carrying values of the business units. Upon finalization of the interim impairment assessment during the three-month period ended September 30, 2016, the Company recognized a goodwill impairment of $61,142, which represented the full impairment of goodwill related to the Chemtec and Protective Coatings business units and approximately 68% of the Rail Technologies goodwill value. The estimated fair values of the remaining reporting units were substantially in excess of the carrying value of those reporting units.
Amortization expense for the year ended
December 31, 2017
was reduced by
$2,583
as a direct result of the prior year definite-lived intangible asset impairments.
Other income was reduced by
$1,156
compared to the prior year which was primarily due to foreign exchange losses of
$804
.
The Company’s effective income tax rate for
2017
was
48.9%
, compared to
3.7%
in the prior year period. The Company’s 2017 effective income tax rate was significantly affected by the recently enacted U.S. tax legislation, including a provisional tax expense of $3,298 related to the one-time transition tax on earnings of foreign subsidiaries, partially offset by a $1,508 provisional tax benefit related to the remeasurement of deferred tax assets and liabilities at the 21% federal corporate tax rate. In addition, the Company realized domestic tax benefits previously offset by a valuation allowance.
The Company's effective income tax rate in the prior year period included a valuation allowance of $29,719 against deferred tax assets, as well as deferred U.S. income taxes and foreign withholding taxes of $7,932 related to accumulated foreign earnings not permanently reinvested outside of the United States.
Net income for the year ended
December 31, 2017
was
$4,113
, or
$0.39
per diluted share, compared to the net loss for the
2016
period of
$141,660
, or
$13.79
per diluted share.
Fiscal
2016
Compared to Fiscal
2015
– Company Analysis
Net sales of $483,514 for the year ended December 31, 2016 decreased by $141,009 or 22.6% compared to the prior year period. All segments reported overall year over year declines of 27.3%, 17.5% and 17.1% for Rail Products and Services, Construction Products and Tubular and Energy Services, respectively.
Gross profit margin for 2016 was 18.7%, or 271 basis points lower than the prior year. The current year margin was significantly impacted by the prolonged weakness in the oil and gas market and reduced activity in the rail market. Included in the 2016 gross profit was $2,643 related to the LIFO income compared to $2,468 in the prior year.
Selling and administrative expenses decreased by $6,672, or 7.2%, over the prior year period. The decrease was primarily attributable to cost reduction initiatives related to personnel and travel costs of $2,982, incentive compensation reductions of $3,777, prior year acquisition and integration costs of $1,212 and other strategic spending reductions of $4,024,
26
which were partially offset by increased litigation related costs for the UPRR matter of $2,671, the fourth quarter employment claim settlement expense of $900, and other miscellaneous items including ERP costs totaling $1,799.
The Company recorded non-cash asset impairments of $135,884 during the year ended December 31, 2016. During the second quarter of 2016, the Company identified various indicators that suggested that there was a more likely than not probability that the carrying values of certain assets and reporting units were less than their respective fair values. The impairment indicators included a rapid deterioration in actual performance against forecasts, downward revisions in projected financial results, declines in the Company’s market capitalization, and reductions in new order activity.
Asset groups that had indicators of impairment were analyzed to determine if the carrying values were recoverable. Based upon the recoverability assessment, the Company determined that certain intangible assets and property, plant, and equipment within the Test and Inspection Services division and certain intangible assets within the Chemtec division were impaired. The impairment assessment was finalized during the three-month period ended September 30, 2016 resulting in a $59,786 definite-lived intangible asset impairment and a $14,956 property, plant, and equipment impairment that were recorded within the Tubular and Energy Services segment. The remaining asset groups tested for recoverability were substantially in excess of their respective carrying values.
The Company performed an interim goodwill impairment review as of June 1, 2016 as a result of the adverse effect on certain reporting units of reduced capital spending and cost reduction priorities that oil and gas developers and railroad customers have enacted as well as the indicators previously noted. The forecasts for the Chemtec, Protective Coatings, and Rail Technologies reporting units did not indicate a timely recovery to support the carrying values of the reporting units. Upon finalization of the interim impairment assessment during the three-month period ended September 30, 2016, the Company recognized a goodwill impairment of $61,142, which represented the full impairment of goodwill related to the Chemtec and Protective Coatings reporting units and approximately 68% of the Rail Technologies goodwill value. The estimated fair values of the remaining reporting units were substantially in excess of the carrying value of those reporting units.
Other income during the prior year was favorably impacted by the sale of assets at our Tucson, AZ facility resulting in a gain of $2,279, realized and unrealized foreign exchange gains totaling $1,616, and other less significant income items.
The Company’s effective income tax rate for 2016 was 3.7%, compared to 12.1% in the prior year period. The Company accrued deferred U.S. income taxes and foreign withholding taxes of $7,932 in the current year, related to accumulated foreign earnings that management no longer intends to permanently reinvest outside of the United States. The Company also recorded a valuation allowance of $29,719 against deferred tax assets in the current year.
Net loss for the year ended December 31, 2016 was $141,660, or $13.79 per diluted share, compared to the net loss for the 2015 period of $44,445, or $4.33 per diluted share.
Results of Operations — Segment Analysis
Rail Products and Services
|
Twelve Months Ended
December 31, |
Increase
|
Decrease
|
Percent
Increase |
Percent
Decrease |
||||||||||||||||||||||
|
|
2017
|
2016
|
2015
|
2017 vs. 2016
|
2016 vs. 2015
|
2017 vs. 2016
|
2016 vs. 2015
|
|||||||||||||||||||
|
Net Sales
|
$
|
256,127
|
|
$
|
239,127
|
|
$
|
328,982
|
|
$
|
17,000
|
|
$
|
(89,855
|
)
|
7.1
|
%
|
(27.3
|
)%
|
|||||||
|
Segment Profit (Loss)
|
$
|
12,216
|
|
$
|
(26,228
|
)
|
$
|
27,037
|
|
$
|
38,444
|
|
$
|
(53,265
|
)
|
146.6
|
%
|
(197.0
|
)%
|
|||||||
|
Segment Profit (Loss) Percentage
|
4.8
|
%
|
(11.0
|
)%
|
8.2
|
%
|
15.7
|
%
|
(19.2
|
)%
|
143.5
|
%
|
(233.5
|
)%
|
||||||||||||
Fiscal
2017
Compared to Fiscal
2016
Rail Products and Services segment sales increased
$17,000
, or
7.1%
, compared to the prior year period. For
2017
, our Rail Technologies business accounted for 4.1% of the segment increase. This business unit serves the global market with locations in North America and Europe, with each of our regions experiencing sales growth in the current year. Our Rail Products and CXT Concrete Ties business units accounted for 1.6% and 1.4%, respectively, of the segment increase. The Company was encouraged by the impact of North American carload traffic during
2017
, particularly intermodal traffic levels, as well as capitalizing on opportunities with the expansion of the global transit market.
The Rail Products and Services segment profit for
2017
was
$12,216
, and a segment profit margin of
4.8%
compared to segment loss of
$26,228
, and a margin of
(11.0)%
for
2016
. The increase was primarily attributable to the 2016 goodwill impairment of
$32,725
related to the Rail Technologies business unit. Additionally, profit was favorably impacted by a
$3,221
reduction in selling and administrative expenses in
2017
, resulting from the successful 2016 restructuring and a
2017
gain on patent sale of
$500
. Non-GAAP gross profit increased by
$1,815
, or
3.6%
, although the segment gross profit margin decreased by
80
bps principally attributable to declines in Rail Technologies and, to a lesser extent, Rail Products margins.
27
During
2017
, the Rail Products and Services segment increased new orders by
17.0%
compared to the prior year. Each of the three business units within the segment had increases in new orders compared to
2016
. The growth in new orders strengthened backlog by
9.7%
compared to the prior year, ending
2017
at
$68,850
.
Fiscal
2016
Compared to Fiscal
2015
Rail Products and Services segment sales decreased $89,855, or 27.3%, compared to the prior year period. For 2016, our Rail Distribution business accounted for approximately 47.9% of the decrease. This division serves Class II freight, rail and transit railroads and the North American industrial rail market, which experienced price and project declines. All rail divisions experienced reductions in sales over the prior year period attributable to continued weakness in the North American freight rail market in both commodity carloads as well as intermodal rail traffic. Additionally, due to the ongoing litigation with UPRR, our rail divisions experienced a decline in sales to UPRR of approximately $12,600.
The Rail Products and Services segment loss for 2016 was $26,244, and a margin of (11.0%) compared to segment profit of $27,037, and a margin of 8.2% for 2015. The reduction was primarily attributable to the $32,725 goodwill impairment related to the Rail Technologies reporting unit along with reductions in gross profit due to the lower sales volumes. The non-GAAP gross profit decreased by $24,202, or 32.2%, and the corresponding margin decreased by 150 basis points principally attributable to declines in Rail Technologies and CXT Concrete Tie margins, which were negatively impacted by reduced volumes and the related deleveraging of the businesses. Our Transit Products business also was negatively impacted by a $1,224 pretax warranty charge related to a transit products project.
During 2016, the Rail Products and Services segment had a reduction in new orders of 23.9% compared to the prior year. The Rail Distribution and CXT Concrete Tie businesses represented 31.4% of the current year decline and all other rail divisions experienced double digit declines relative to the prior year due to reductions in rail capital spending.
Construction Products
|
Twelve Months Ended
December 31, |
Increase
|
Decrease
|
Percent
Increase |
Percent
Decrease |
||||||||||||||||||||||
|
|
2017
|
2016
|
2015
|
2017 vs. 2016
|
2016 vs. 2015
|
2017 vs. 2016
|
2016 vs. 2015
|
|||||||||||||||||||
|
Net Sales
|
$
|
161,801
|
|
$
|
145,602
|
|
$
|
176,394
|
|
$
|
16,199
|
|
$
|
(30,792
|
)
|
11.1
|
%
|
(17.5
|
)%
|
|||||||
|
Segment Profit
|
$
|
11,620
|
|
$
|
8,189
|
|
$
|
12,958
|
|
$
|
3,431
|
|
$
|
(4,769
|
)
|
41.9
|
%
|
(36.8
|
)%
|
|||||||
|
Segment Profit Percentage
|
7.2
|
%
|
5.6
|
%
|
7.3
|
%
|
1.6
|
%
|
(1.7
|
)%
|
27.7
|
%
|
(23.4
|
)%
|
||||||||||||
Fiscal
2017
Compared to Fiscal
2016
Construction Products segment sales increased
$16,199
, or
11.1%
, compared to the prior year period, with increases in each of the three business units. The Fabricated Bridge sales increase was primarily driven by several large projects throughout the year, including the continuation of the Peace Bridge project. Piling sales were favorably impacted by strong demand within the sheet and pipe piling product lines. Lastly, Precast Concrete Products experienced increases in their buildings sales, which were primarily driven by orders from state agencies.
The Construction Products segment profit of
$11,620
increased by
$3,431
compared to the prior year to
7.2%
of net sales. While selling and administrative expenses remained consistent with the prior year, the segment's non-GAAP gross profit increased by
$3,488
, or
12.9%
. The non-GAAP gross profit increase was primarily due to sales volume but was also favorably impacted by improved manufacturing efficiencies.
For
2017
, the Construction Products segment had an
8.0%
decrease in new orders compared to the prior year period. The decrease primarily relates to the Fabricated Bridge business unit as the prior year included the $15,000 Peace Bridge order. This was partially offset by an increase within our Precast Concrete Products business unit. The segment's backlog at
December 31, 2017
was
$71,318
, a
0.9%
decrease as compared to the prior year.
Fiscal
2016
Compared to Fiscal
2015
Construction Products segment sales decreased $30,792, or 17.5%, compared to the prior year period. The Piling business unit represented $24,319 of the reduction and Fabricated Bridge sales represented $8,943, which were both attributable to fewer large project opportunities in the market as compared to the prior year period as well as increased competition leading to fewer project wins. Throughout the year, lower scrap input prices and very low factory utilization rates kept steel prices very competitive. As a result, the Company did not participate in some of the typical projects we serve with pipe pile and H-pile, resulting in lower sales volumes and pricing. Partially offsetting these declines were increased Precast Concrete Product sales.
The Construction Products segment profit of $8,189 declined by $4,769 compared to the prior year as a result of reduced gross profit attributable to lower sales volumes. The non-GAAP gross profit decreased by $7,090, or 20.7%, due to reductions in Piling products and Fabricated Bridge gross profit as a result of the decline in volumes.
28
For 2016, the Construction Products segment had a 10.1% increase in new orders compared to the prior year period. The increase relates to significant project wins within the Fabricated Bridge business, and to a lesser extent, Precast Concrete Products.
Tubular and Energy Services
|
Twelve Months Ended
December 31, |
Increase
|
Decrease
|
Percent
Increase |
Percent
Decrease |
||||||||||||||||||||||
|
|
2017
|
2016
|
2015
|
2017 vs. 2016
|
2016 vs. 2015
|
2017 vs. 2016
|
2016 vs. 2015
|
|||||||||||||||||||
|
Net Sales
|
$
|
118,449
|
|
$
|
98,785
|
|
$
|
119,147
|
|
$
|
19,664
|
|
$
|
(20,362
|
)
|
19.9
|
%
|
(17.1
|
)%
|
|||||||
|
Segment Profit (Loss)
|
$
|
3,849
|
|
$
|
(116,126
|
)
|
$
|
(81,344
|
)
|
$
|
119,975
|
|
$
|
(34,782
|
)
|
103.3
|
%
|
(42.8
|
)%
|
|||||||
|
Segment Profit (Loss) Percentage
|
3.2
|
%
|
(117.6
|
)%
|
(68.3
|
)%
|
120.8
|
%
|
(49.3
|
)%
|
102.8
|
%
|
(72.2
|
)%
|
||||||||||||
Fiscal
2017
Compared to Fiscal
2016
Tubular and Energy Services segment sales increased
$19,664
, or
19.9%
, compared to the prior year period. The increase was primarily related to our Test and Inspection Services and Protective Coatings business units. These increases were partially offset by a reduction within our Precision Measurement Systems business unit.
Tubular and Energy Services segment profit increased
103.3%
to
$3,849
in
2017
compared to a loss of
$116,126
in
2016
. The current year profit increase was primarily attributable to the prior year asset impairment of
$103,159
and the
$2,400
reduction in
2017
amortization expense due to the
2016
definite-lived intangible asset impairment. Also contributing to the increased profit was the reduction of selling and administrative expenses of
$1,942
, which was primarily related to the prior year restructuring activity. Non-GAAP gross profit increased by
$12,474
which was favorably impacted by improved margins within each division of the segment and most significantly in our Test and Inspection Services business unit. During
2017
, our Protective Coatings business unit incurred a
$839
warranty charge which negatively impacted the segment profit.
The Tubular and Energy Services segment had an increase in new orders of
53.4%
compared to the prior year period. New orders increased during
2017
as both the upstream and midstream energy markets showed recovery during the year and most significantly impacted our Test and Inspection Services and Protective Coatings business units. The increase in new orders lead to a
109.6%
increase in backlog, with a
December 31, 2017
balance of
$26,737
.
During 2017, the lease at our Birmingham, Alabama facility expired. The Company negotiated a lease renewal for this facility. The renewal is for a term of five years and is scheduled to expire July 31, 2022.
Fiscal
2016
Compared to Fiscal
2015
Tubular and Energy Services segment sales decreased $20,362, or 17.1%, compared to the prior year period. The decrease related primarily to $15,141 from Test and Inspection Services and $10,488 from Protective Coatings partially offset by an increase of $6,782 related to Precision Measurement Systems.
Tubular and Energy Services segment loss increased 42.8% to $116,126 in 2016 compared to a loss of $81,344 in 2015. The margin for this segment also decreased 492 basis points to (117.5%) compared to (68.3%) in the prior year period. The losses were largely attributable to impairments of $103,176 and $80,337 for 2016 and 2015, respectively. The non-GAAP gross profit declined by $11,927, or 53.1%, which was negatively impacted by our Test and Inspection Services and Protective Coatings businesses. Despite improved volumes during the 2016 fourth quarter, our Test and Inspection Services business was negatively impacted by the weakness in the upstream oil and gas market, where demand levels remained low, leading to heightened competition and reductions in service prices. Similarly, Protective Coatings sales declined significantly beginning in the third quarter 2016, which led to a temporary idling of the Birmingham facility. The facility has restarted operations in early October 2016. Non-GAAP gross profit was also negatively impacted by Precision Measurement Systems sales which produced lower margins due to competitive pressures as a result of the depressed midstream oil and gas market.
The Tubular and Energy Services segment had a reduction in new orders of 36.7% compared to the prior year period. Orders were down due to a reduction in midstream oil and gas new project lettings, with our Protective Coatings division reporting a 56.7% decline.
29
Liquidity and Capital Resources
Total debt at
December 31, 2017
and
2016
was
$129,966
and
$159,565
, respectively, and was primarily comprised of borrowings on the revolving credit facility and, in
2016
, the term loan.
Our need for liquidity relates primarily to working capital requirements for operating activities, debt service payments, capital expenditures, and JV capital obligations.
The change in cash and cash equivalents for the three-year periods ended December 31 are as follows:
|
2017
|
2016
|
2015
|
||||||||||
|
Net cash provided by operating activities
|
$
|
39,372
|
|
$
|
18,405
|
|
$
|
56,172
|
|
|||
|
Net cash used by investing activities
|
(4,687
|
)
|
(7,930
|
)
|
(205,575
|
)
|
||||||
|
Net cash (used) provided by financing activities
|
(29,703
|
)
|
(12,519
|
)
|
134,289
|
|
||||||
|
Effect of exchange rate changes on cash and cash equivalents
|
2,333
|
|
(905
|
)
|
(3,598
|
)
|
||||||
|
Net increase (decrease) in cash and cash equivalents
|
$
|
7,315
|
|
$
|
(2,949
|
)
|
$
|
(18,712
|
)
|
|||
Cash Flows from Operating Activities
During the year ended
December 31, 2017
, net cash provided by operating activities was
$39,372
compared to
$18,405
during the prior year period. For the twelve months ended
December 31, 2017
, income and adjustments to income from operating activities provided
$23,679
compared to
$24,261
in
2016
. Working capital and other assets and liabilities
provided
$15,693
in the current period compared to a use of
$5,856
during
2016
. During the
twelve months ended
December 31, 2017
, the Company received $9,946 and $1,827 from our
2016
and
2015
federal income tax refunds, respectively.
The Company’s calculation of days sales outstanding at
December 31, 2017
was
50
days compared to
53
days at
December 31, 2016
. We believe our receivables portfolio is strong.
During the
2016
period, net cash provided by operating activities provided
$18,405
, a decrease of
$37,767
, compared to the
2015
period. For the year ended
December 31, 2016
, income and adjustments to income from operating activities provided
$24,261
compared to
$46,971
in
2015
. Working capital and other assets and liabilities used
$5,856
in
2016
compared to providing
$9,201
in
2015
. The reduction in cash flows from operations was largely impacted by working capital movement.
Cash Flows from Investing Activities
For the year ended
December 31, 2017
, the Company had capital expenditures of
$6,149
, a
$1,515
reduction from
2016
. The current year expenditures were primarily related to the purchase of 285 trackside rail lubricator units as part of a multiple year service contract with a Class I railroad and, to a lesser extent, the building expansion at our Waverly, WV Precast Concrete Products facility. The Company received proceeds of
$1,462
from the sale of assets. These proceeds were primarily from the sale of our Protective Coatings field service division.
Capital expenditures for the year ended
December 31, 2016
were
$7,664
, a decrease of
$7,249
, compared to
2015
of
$14,913
. The
2016
expenditures related primarily to the Birmingham, AL inside diameter coating line upgrade and application development of the Company’s new enterprise resource planning system. Also, the Company received proceeds of
$969
related to the sale of assets and loaned
$1,235
to its LB Pipe JV. Expenditures for the year ended
December 31, 2015
related primarily to upgrades to the outside diameter coating line of the Birmingham, AL coating facility as well as general plant and yard improvements across each segment.
During
2015
, the Company acquired Tew Plus, Ltd. (“Tew Plus”), Tew Holdings, Ltd. (“Tew”) and IOS. The total purchase price of these acquisitions, net of cash acquired, was
$196,001
as of
December 31, 2015
. Investing activities during
2015
included capital expenditures of
$14,913
. The
2015
expenditures related primarily to the Birmingham, AL protective coatings facility upgrades, application development of a new enterprise resource planning system, and general plant and yard improvements across each segment. Other investing activities related to cash proceeds of
$5,339
from the sale of assets. The sale of the Tucson, AZ concrete tie facility contributed $2,750 of the total proceeds.
Cash Flows from Financing Activities
The Company reduced its outstanding debt by
$29,600
during the year ended
December 31, 2017
, including the payoff of the term loan. During the year ended
December 31, 2016
, the Company reduced outstanding debt by approximately
$9,184
, primarily from operational cash flows. The Company also paid
$1,417
in financing fees in
2016
related to our
2016
credit agreement amendments. During the
2015
period, the Company had an increase in outstanding debt of approximately $142,326, primarily related to drawings against the revolving credit facility to fund domestic acquisition activity.
The Company withholds shares from employees to pay their withholding taxes in connection with the vesting of restricted stock awards. For the
twelve months ended
December 31, 2017
, the Company withheld
7,277
shares having a value of approximately
$103
to satisfy tax obligations. The Company withheld
20,186
shares having a value of approximately
$275
for the twelve-month period ended
December 31, 2016
compared to withholding 25,340 shares having a value of
30
approximately $1,114 in the
2015
period. Cash outflows related to dividends were
$1,244
and
$1,656
for the periods ended
December 31, 2016
and
2015
, respectively.
Lastly, for the years ended
December 31, 2016
and
2015
, the Company purchased
5,000
and
80,512
shares of common stock for
$67
and
$1,587
, respectively, under our existing share repurchase authorization. There were no share repurchases during the
twelve months ended
December 31, 2016
.
Financial Condition
On November 7, 2016, the Company, its domestic subsidiaries, and certain of its Canadian subsidiaries entered into the Second Amendment (the “Second Amendment”) to the Second Amended and Restated Credit Agreement dated March 13, 2015 and as amended by the First Amendment dated June 29, 2016 (the “Amended and Restated Credit Agreement”), with PNC Bank, N.A., Bank of America, N.A., Wells Fargo Bank, N.A., Citizens Bank of Pennsylvania, and Branch Banking and Trust Company. This Second Amendment modified the Amended and Restated Credit Agreement which had a maximum revolving credit line of $275,000. The Second Amendment reduced the permitted revolving credit borrowings to $195,000 and provides for additional term loan borrowing of $30,000 (“Term Loan”). The Term Loan was subject to quarterly straight line amortization until fully paid off upon the final payment on January 1, 2020. Furthermore, certain matters, including excess cash flow, asset sales, and equity issuances, triggered mandatory prepayments to the Term Loan. Term Loan borrowings were not available to draw upon following repayment. During
2017
, the Company paid off the balance of the Term Loan. Capitalized terms used but not defined herein shall have the meanings ascribed to them in the Second Amendment or Amended and Restated Credit Agreement, as applicable.
The Second Amendment further provides for modifications to the financial covenants as defined in the Amended and Restated Credit Agreement. The Second Amendment calls for the elimination of the Maximum Leverage Ratio covenant through the quarter ending June 30, 2018. After that period, the Maximum Gross Leverage Ratio covenant will be reinstated to require a maximum ratio of 4.25 Consolidated Indebtedness to 1.00 Gross Leverage for the quarter ending September 30, 2018, and 3.75 to 1.00 for all periods thereafter until the maturity date of the credit facility. The Second Amendment also includes a Minimum Last Twelve Months EBITDA (as defined by the Amendment) covenant (“Minimum EBITDA”). For the quarter ended December 31, 2016 through the quarter ended June 30, 2017, the Minimum EBITDA had to be at least $18,500. For each quarter thereafter, through the quarter ending June 30, 2018, the Minimum EBITDA requirement increases by various increments. The incremental Minimum EBITDA requirement for the twelve month period ended
December 31, 2017
had to be at least
$25,000
. For the
twelve months ended
December 31, 2017
, the EBITDA calculation as defined by the Amended and Restated Credit Agreement was
$37,341
. At June 30, 2018, the Minimum EBITDA requirement will be $31,000. After the quarter ending June 30, 2018, the Minimum EBITDA covenant will be eliminated through the maturity of the credit agreement. The Second Amendment also includes a Minimum Fixed Charge Coverage Ratio covenant. The covenant represents the ratio of the Company’s fixed charges to the last twelve months of EBITDA, and is required to be a minimum of 1.00 to 1.00 through the quarter ended December 31, 2017 and 1.25 to 1.00 for each quarter thereafter through the maturity of the credit facility. The final financial covenant included in the Second Amendment is a Minimum Liquidity covenant which calls for a minimum of $25,000 in undrawn availability on the revolving credit loan at all times through the quarter ending June 30, 2018.
The Second Amendment includes several changes to certain non-financial covenants as defined in the Credit Agreement. Through the maturity date of the agreement, the Company has been prohibited from making any future acquisitions. The limitation on permitted annual distributions of dividends or redemptions of the Company’s stock has been decreased from $4,000 to $1,700. The aggregate limitation on loans to and investments in non-loan parties was decreased from $10,000 to $5,000. Furthermore, the limitation on asset sales has been decreased from $25,000 annually with a carryover of up to $15,000 from the prior year to $25,000 in the aggregate through the maturity date of the credit facility.
The Second Amendment provides for the elimination of the three lowest tiers of the pricing grid that had previously been defined in the First Amendment. Upon execution of the Second Amendment through the quarter ending March 31, 2018, the Company will be locked into the highest tier of the pricing grid which provides for pricing of the prime rate plus 225 basis points on base rate loans and the applicable LIBOR rate plus 325 basis points on euro rate loans. For each quarter after March 31, 2018 and through the maturity date of the credit facility, the Company’s position on the pricing grid will be governed by a Minimum Net Leverage ratio which is the ratio of Consolidated Indebtedness less cash on hand in excess of $15,000 to EBITDA. If, after March 31, 2018 the Minimum Net Leverage ratio positions the Company on the lowest tier of the pricing grid, pricing will be the prime rate plus 150 basis points on base rate loans or the applicable LIBOR rate plus 250 basis points on euro rate loans.
The Company generated
$39,372
from cash flows from operations during
2017
that was utilized to fund capital expenditures and make payments against our term loan and revolving credit facility. At
December 31, 2017
, we had
$37,678
in cash and cash equivalents and
$41,105
of availability under the Second Amendment to the Second Amended and Restated Credit Agreement while carrying
$129,966
in total debt. We believe this liquidity will provide adequate flexibility to operate the business in a prudent manner, continue to service our revolving debt facility, and be better leveraged to weather any future downturn in our markets.
31
Non-domestic cash balances of
$35,807
are held in various locations throughout the world. Management determined that the cash balances of our Canadian and United Kingdom subsidiaries exceeded our projected capital needs by
$30,200
, and does not intend to permanently reinvest such amounts outside of the United States. Accordingly, the Company has accrued the U.S. income tax and foreign withholding taxes associated with the repatriation of the excess cash.
At
December 31, 2017
, the Company was in compliance with the covenants in the Second Amendment.
To reduce the impact of interest rate changes on outstanding variable-rate debt, the Company entered into forward starting LIBOR-based interest rate swaps with notional values totaling $50,000. The swaps became effective on February 28, 2017 at which point they effectively convert a portion of the debt from variable to fixed-rate borrowings during the term of the swap contract. At
December 31, 2017
, the swap asset was
$222
compared to a liability of
$334
at
December 31, 2016
.
Tabular Disclosure of Contractual Obligations
A summary of the Company’s required payments under financial instruments and other commitments at
December 31, 2017
are presented in the following table:
|
Total
|
Less than
1 year |
1-3
years |
4-5
years |
More than
5 years |
||||||||||||||||
|
Contractual Cash Obligations
|
||||||||||||||||||||
|
Revolving credit facility (1)
|
$
|
128,470
|
|
$
|
—
|
|
$
|
128,470
|
|
$
|
—
|
|
$
|
—
|
|
|||||
|
Interest
|
12,461
|
|
5,912
|
|
6,549
|
|
—
|
|
—
|
|
||||||||||
|
Other debt
|
1,496
|
|
656
|
|
840
|
|
—
|
|
—
|
|
||||||||||
|
Pension plan contributions
|
253
|
|
253
|
|
—
|
|
—
|
|
—
|
|
||||||||||
|
Operating leases
|
17,811
|
|
4,483
|
|
5,616
|
|
2,946
|
|
4,766
|
|
||||||||||
|
U.S. transition tax (2)
|
2,617
|
|
209
|
|
419
|
|
419
|
|
1,570
|
|
||||||||||
|
Purchase obligations not reflected in the financial statements
|
31,320
|
|
31,320
|
|
—
|
|
—
|
|
—
|
|
||||||||||
|
Total contractual cash obligations
|
$
|
194,428
|
|
$
|
42,833
|
|
$
|
141,894
|
|
$
|
3,365
|
|
$
|
6,336
|
|
|||||
|
Other Financial Commitments
|
||||||||||||||||||||
|
Standby letters of credit
|
$
|
425
|
|
$
|
425
|
|
$
|
—
|
|
$
|
—
|
|
$
|
—
|
|
|||||
|
(1)
|
Repayments of outstanding loan balances are disclosed in Note 10 Long-Term Debt and Related Matters, to Consolidated Financial Statements included in Part II, Item 8, Financial Statements and Supplementary Data of this report.
|
|
(2)
|
Further detail on the U.S. Tax Cuts and Jobs Act transition tax is disclosed in Note 14 Income Taxes, to Consolidated Financial Statements included in Part II, Item 8, Financial Statements and Supplementary Data of this report.
|
Other long-term liabilities include items such as deferred income taxes which are not contractual obligations by nature. The Company cannot estimate the settlement years for these items and has excluded them from the above table.
Management believes its internal and external sources of funds are adequate to meet anticipated needs, including those disclosed above, for the foreseeable future.
Off-Balance Sheet Arrangements
The Company’s off-balance sheet arrangements include the operating leases, purchase obligations, and standby letters of credit disclosed within the contractual obligations table above in the “Liquidity and Capital Resources” section. These arrangements provide the Company with increased flexibility relative to the utilization and investment of cash resources.
Backlog
Although backlog is not necessarily indicative of future operating results, the following table provides the backlog by business segment:
|
|
Backlog
|
|||||||||||
|
|
December 31, 2017
|
December 31, 2016
|
December 31, 2015
|
|||||||||
|
Rail Products and Services
|
$
|
68,850
|
|
$
|
62,743
|
|
$
|
85,199
|
|
|||
|
Construction Products
|
71,318
|
|
71,954
|
|
45,371
|
|
||||||
|
Tubular and Energy Services
|
26,737
|
|
12,759
|
|
34,137
|
|
||||||
|
Total Backlog
|
$
|
166,905
|
|
$
|
147,456
|
|
$
|
164,707
|
|
|||
While a considerable portion of our business is backlog driven, certain businesses, including the Test and Inspection Services and the Rail Technologies business units, are not driven by backlog and therefore have insignificant levels of backlog throughout the year.
32
Critical Accounting Policies and Estimates
The accompanying consolidated financial statements have been prepared in conformity with accounting principles generally accepted in the United States. When more than one accounting principle, or the method of its application, is generally accepted, management selects the principle or method that is appropriate in the Company’s specific circumstance. Application of these accounting principles requires management to make estimates that affect the reported amount of assets, liabilities, revenues, and expenses, and the related disclosure of contingent assets and liabilities. The following critical accounting policies relate to the Company’s more significant judgments and estimates used in the preparation of its consolidated financial statements. There can be no assurance that actual results will not differ from those estimates. For a summary of our significant accounting policies, including those discussed below, see Part II, Item 8, Financial Statements and Supplementary Data, Note 1 Summary of Significant Accounting Polices to the Consolidated Financial Statements.
Revenue Recognition -
The Company’s revenues are comprised of product and service sales as well as products and services provided under long-term contracts. For product and service sales, the Company recognizes revenue when the following criteria have been satisfied: persuasive evidence of a sales arrangement exists; product delivery and transfer of title to the customer has occurred or services have been rendered; the price is fixed or determinable; and collectability is reasonably assured. Generally, product title passes to the customer upon shipment. In limited cases, title does not transfer and revenue is not recognized until the customer has received the products at its physical location. Revenue is recorded net of returns, allowances, customer discounts, and incentives. Sales taxes collected from customers and remitted to governmental authorities are accounted for on a net (excluded from revenues) basis. Shipping and handling costs are included in cost of goods sold.
Revenues for products under long-term contracts are recognized using the percentage-of-completion method. Sales and gross profit are recognized as work is performed based upon the proportion of actual costs incurred to estimated total project costs. Sales and gross profit are adjusted prospectively for revisions in estimated total project costs and contract values. For certain products, the percentage-of-completion is based upon actual labor costs as a percentage of estimated total labor costs. At the time a loss contract becomes known, the entire amount of the estimated loss is recognized in the Consolidated Statement of Operations.
Business Combinations, Goodwill, and Intangible Assets -
We account for acquired businesses using the acquisition method of accounting, which requires that the assets acquired and liabilities assumed be recorded at the date of acquisition at their respective estimated fair values. The cost to acquire a business is allocated to the underlying net assets of the acquired business based on estimates of their respective fair values. The purchase price allocation process requires management to make significant estimates and assumptions, especially at the acquisition date with respect to intangible assets. Although we believe the assumptions and estimates we have made are reasonable, they are based in part on historical experience and information obtained from the management of the acquired companies and are inherently uncertain. Examples of critical estimates in valuing certain of the intangible assets we have acquired or may acquire in the future include but are not limited to: future expected cash flows from customer relationships, the acquired company’s trade name and trademarks as well as assumptions about the period of time the acquired trade name and trademarks will continue to be used in the combined company’s product portfolio, future expected cash flows from developed technology, and discount rates. Unanticipated events and circumstances may occur which may affect the accuracy or validity of such assumptions, estimates, or actual results.
Intangible assets are amortized over the expected life of the asset. Any excess of the purchase price over the estimated fair values of the net assets acquired is recorded as goodwill. The judgments made in determining the estimated fair values assigned to each class of assets acquired and liabilities assumed, as well as asset lives, can materially impact our results of operations. Fair values and useful lives are determined based on, among other factors, the expected future period of benefit of the asset, the various characteristics of the asset, and projected cash flows. Because this process involves management making estimates with respect to future revenues and market conditions and because these estimates also form the basis for the determination of whether or not an impairment charge should be recorded, these estimates are considered to be critical accounting estimates.
Goodwill is required to be tested for impairment at least annually. The Company performs its annual impairment test as of October 1
st
or more frequently when indicators of impairment are present. The goodwill impairment test involves comparing the fair value of a reporting unit to its carrying value, including goodwill. If the carrying amount of the reporting unit exceeds its fair value, an impairment loss equal to the excess is recorded as a component of operations. The Company uses a combination of a discounted cash flow model (“DCF model”) and a market approach to determine the current fair values of the reporting units. A number of significant assumptions and estimates are involved in the application of the DCF model to forecast operating cash flows, including markets and market share, sales volume and pricing, costs to produce, and working capital changes. In times of adverse economic conditions in the global economy, the Company’s long-term cash flow projections are subject to a greater degree of uncertainty than usual. If we had established different reporting units or utilized different valuation methodologies or assumptions, the impairment test results could differ, and we could be required to record impairment charges.
33
The Company considers historical experience and available information at the time the fair values of its reporting units are estimated. However, actual amounts realized may differ from those used to evaluate the impairment of goodwill. If actual results are not consistent with our assumptions and judgments used in estimating future cash flows and asset fair values, the Company may be exposed to impairment losses that could be material to our results of operations.
There were no goodwill impairments recorded during the year ended
December 31, 2017
. The Company recorded goodwill impairment charges of $61,142 and $80,337 during 2016 and 2015, respectively, related to reporting units within the Tubular and Energy Services and Rail Products and Services segment.
At
December 31, 2017
, the Company had
$19,785
of goodwill on its Consolidated Balance Sheet. Of the total,
$14,638
related to the Rail Products and Services segment and
$5,147
related to the Construction Products segment. The Company recorded a $32,725 partial goodwill impairment related to the Rail Products and Services segment during the year ended December 31, 2016. Based on considerations of current year financial results, including consideration of macroeconomic conditions, such as performance of the Company's stock price, the segment's fair value was estimated to be in excess of its carrying value at
December 31, 2017
. However, the previously recorded partial impairment included assumptions for certain market recoveries throughout the years ended December 31, 2018 and beyond. If these recoveries do not fully develop, the Rail Products and Services segment may require an incremental goodwill impairment. Additional information concerning the impairments is set forth in Part II, Item 8, Financial Statements and Supplementary Data, Note 4 Goodwill and Other Intangible Assets, to the Consolidated Financial Statements included herein, which is incorporated by reference into this Item 7.
Intangible Assets, Long-Lived Assets, and Investments -
The Company is required to test for asset impairment whenever events or changes in circumstances indicate that the carrying value of an asset might not be recoverable. Once a triggering event has occurred, the impairment test employed is based on whether the intent is to hold the asset for continued use or to hold the asset for sale. The applicable guidance for assets held for use requires that, if the sum of the future expected cash flows associated with an asset, undiscounted and without interest charges, is less than the carrying value, an asset impairment must be recognized in the financial statements. The amount of the impairment is the difference between the fair value of the asset and the carrying value of the asset. For assets held for sale, to the extent the carrying value is greater than the asset’s fair value less costs to sell, an impairment loss is recognized for the difference. The accounting estimate related to asset impairments is highly susceptible to change from period to period because it requires management to make assumptions about the existence of impairment indicators and cash flows over future years. These assumptions impact the amount of an impairment, which would have an impact on the Consolidated Statements of Operations.
The fair value of the Company’s equity investments is dependent on the performance of the investee companies as well as volatility inherent in the external markets for these investments. In assessing potential impairment of these investments, we consider these factors as well as the forecasted financial performance of the investees. If these forecasts are not met and indicate an other-than-temporary decline in value, impairment charges may be required.
During
2017
, the Company recorded an other-than-temporary impairment of
$413
to its investment in L B Pipe and Coupling Products, LLC joint venture as the asset is held for sale at fair value. No other material impairments of intangible assets, long-lived assets, or investments were recored during the period ended
December 31, 2017
. The Company recorded definite-lived intangible asset impairments of $59,786 and property, plant and equipment impairment of $14,956 for the year ended December 31, 2016. The impairments related to the Tubular and Energy Services segment. There were no material impairments of intangible assets, long-lived assets, or investments for the years ended December 31, 2015.
Product Warranty -
The Company maintains a current warranty for the repair or replacement of defective products. For certain manufactured products, an accrual is made on a monthly basis as a percentage of cost of sales. For long-term construction projects, a product warranty accrual is established when the claim is known and quantifiable. The product warranty accrual is periodically adjusted based on the identification or resolution of known individual product warranty claims. The underlying assumptions used to calculate the product warranty accrual can change from period to period and are dependent upon estimates of the amount and cost of future product repairs or replacements.
At
December 31, 2017
and
2016
, the product warranty reserve was
$8,682
and
$10,154
, respectively. During the years ended
December 31, 2017
,
2016
, and
2015
, the Company recorded product warranty expense of
$3,564
,
$2,524
, and
$1,794
, respectively. For additional information regarding the Company’s product warranty, refer to Part II, Item 8, Financial Statements and Supplementary Data, Note 19 to the Consolidated Financial Statements, Commitments and Contingent Liabilities, included herein.
Contingencies and Litigation
- The preparation of consolidated financial statements requires us to make estimates and assumptions that affect the reported amounts of assets and liabilities and the disclosure of contingent assets and liabilities as of the date of the consolidated financial statements, and also affect the amounts of revenues and expenses reported for each period.
In the ordinary course of business, various legal and regulatory claims and proceedings are pending or threatened against the Company. When a probable, estimable exposure exists, the Company accrues an estimate of the probable costs for the resolution of these matters. These estimates are based upon an analysis of potential results, assuming a combination of litigation
34
and settlement strategies. During 2016, we recorded $900 in legal expense related to the anticipated settlement of an employment dispute. This settlement was finalized during 2017 for
$797
, resulting in an adjustment of $103. There were no such charges for the years ended December 31, 2015. Future results of operations could be materially affected by changes in our assumptions or the outcome of these proceedings.
The Company’s operations are subject to national, state, foreign, and/or local laws and regulations that impose limitations and prohibitions on the discharge and emission of, and establish standards for the use, disposal, and management of, regulated materials and waste. These regulations impose liability for the costs of investigation, remediation, and damages resulting from present and past spills, disposals, or other releases of hazardous substances or materials. Liabilities are recorded when remediation efforts are probable and the costs can be reasonably estimated. Estimates are not reduced by potential claims for recovery. Claims for recovery are recognized as agreements are reached with third parties or as amounts are received. Established reserves are periodically reviewed and adjusted to reflect current remediation progress, prospective estimates of required activity, and other factors that may be relevant, including changes in technology or regulations.
Refer to Part II, Item 8, Financial Statements and Supplementary Data, Note 19 Commitments and Contingent Liabilities, to the Consolidated Financial Statements for additional information regarding the Company’s commitments and contingent liabilities.
Income Taxes -
The recognition of deferred tax assets requires management to make judgments regarding the future realization of these assets. As prescribed by Financial Accounting Standard’s Board (“FASB”) Accounting Standards Codification (“ASC”) 740, “Income Taxes,” valuation allowances must be provided for those deferred tax assets for which it is more likely than not (a likelihood of more than 50%) that some portion or all of the deferred tax assets will not be realized. This guidance requires management to evaluate positive and negative evidence regarding the recoverability of deferred tax assets. The determination of whether the positive evidence outweighs the negative evidence and quantification of the valuation allowance requires management to make estimates and judgments of future financial results.
The Company evaluates all tax positions taken on its federal, state, and foreign tax filings to determine if the position is more likely than not to be sustained upon examination. For positions that meet the more likely than not to be sustained criteria, the largest amount of benefit to be realized upon ultimate settlement is determined on a cumulative probability basis. A previously recognized tax position is derecognized when it is subsequently determined that a tax position no longer meets the more likely than not threshold to be sustained. The evaluation of the sustainability of a tax position and the expected tax benefit is based on judgment, historical experience, and various other assumptions. Actual results could differ from those estimates upon subsequent resolution of identified matters.
The Company’s income tax rate is significantly affected by the tax rate on global operations. In addition to local country tax laws and regulations, this rate depends on the extent earnings are indefinitely reinvested outside the United States. Indefinite reinvestment is determined by management’s judgment about and intentions concerning the future operations of the Company. At
December 31, 2017
, management does not intend to repatriate accumulated foreign earnings of
$2,318
. Should we decide to repatriate these accumulated foreign earnings, the Company would have to accrue additional income and withholding taxes in the period in which it is determined that the earnings will no longer be indefinitely invested outside the United States.
Refer to Part II, Item 8, Financial Statements and Supplementary Data, Note 14 Income Taxes, included herein for additional information regarding the Company’s deferred tax assets. The Company’s ability to realize these tax benefits may affect the Company’s reported income tax expense and net income.
New Accounting Pronouncements -
See Part II, Item 8, Financial Statements and Supplementary Data, Note 1 Summary of Significant Accounting Policies, to the Consolidated Financial Statements, included herein for information regarding new accounting pronouncements.
35
ITEM 7A.
QUANTITATIVE AND QUALITATIVE DISCLOSURES ABOUT MARKET RISK
(Dollars in thousands)
Interest Rate Risk
In the ordinary course of business, the Company is exposed to interest rate risks that may adversely affect funding costs associated with its variable-rate debt. To reduce the impact of interest rate changes on a portion of this variable-rate debt, the Company entered into forward starting interest rate swap agreements, which effectively convert a portion of the debt from a variable to a fixed-rate borrowing during the term of the swap contracts. See Part II, Item 8, Financial Statements and Supplementary Data, Note 18 Fair Value Measurements, to the Consolidated Financial Statements included herein, for additional information.
For the year ended
December 31, 2017
, a 1% change in the interest rate for variable rate debt as of
December 31, 2017
would increase or decrease interest expense by approximately
$1,425
.
The Company does not purchase or hold any derivative financial instruments for trading purposes. At contract inception, the Company designates its derivative instruments as hedges. The Company recognizes all derivative instruments on the balance sheet at fair value. Fluctuations in the fair values of derivative instruments designated as cash flow hedges are recorded in accumulated other comprehensive income and reclassified into earnings within other income as the underlying hedged items affect earnings. To the extent that a change in a derivative does not perfectly offset the change in value of the interest rate being hedged, the ineffective portion is recognized in earnings immediately.
The Company has entered into three forward starting LIBOR-based interest rate swap agreements with notional values totaling $50,000. At
December 31, 2017
, the interest rate swap asset was
$222
compared to a liability of
$334
at
December 31, 2016
.
Foreign Currency Exchange Rate Risk
The Company is subject to exposures to changes in foreign currency exchange rates. The Company may manage its exposure to changes in foreign currency exchange rates on firm sale and purchase commitments by entering into foreign currency forward contracts. The Company’s risk management objective is to reduce its exposure to the effects of changes in exchange rates on these transactions over the duration of the transactions. The Company did not engage in foreign currency hedging transactions during the three-year period ended
December 31, 2017
.
36
ITEM 8.
FINANCIAL STATEMENTS AND SUPPLEMENTARY DATA
Report of Independent Registered Public Accounting Firm
To the Stockholders and the Board of Directors of L.B. Foster Company and Subsidiaries
Opinion on the Financial Statements
We have audited the accompanying consolidated balance sheets of L.B. Foster Company and Subsidiaries (the Company) as of December 31, 2017 and 2016, the related consolidated statements of operations, comprehensive income (loss), stockholders’ equity and cash flows for each of the three years in the period ended December 31, 2017, and the related notes and financial statement schedule listed in the Index at Item 15 (a) (collectively referred to as the “consolidated financial statements”). In our opinion, the consolidated financial statements present fairly, in all material respects, the financial position of the Company at December 31, 2017 and 2016, and the results of its operations and its cash flows for each of the three years in the period ended December 31, 2017, in conformity with U.S. generally accepted accounting principles.
We also have audited, in accordance with the standards of the Public Company Accounting Oversight Board (United States) (PCAOB), the Company's internal control over financial reporting as of December 31, 2017, based on criteria established in Internal Control-Integrated Framework issued by the Committee of Sponsoring Organizations of the Treadway Commission (2013 framework) and our report dated
February 28, 2018
expressed an unqualified opinion thereon.
Basis for Opinion
These financial statements are the responsibility of the Company's management. Our responsibility is to express an opinion on the Company’s financial statements based on our audits. We are a public accounting firm registered with the PCAOB and are required to be independent with respect to the Company in accordance with the U.S. federal securities laws and the applicable rules and regulations of the Securities and Exchange Commission and the PCAOB.
We conducted our audits in accordance with the standards of the PCAOB. Those standards require that we plan and perform the audit to obtain reasonable assurance about whether the financial statements are free of material misstatement, whether due to error or fraud. Our audits included performing procedures to assess the risks of material misstatement of the financial statements, whether due to error or fraud, and performing procedures that respond to those risks. Such procedures included examining, on a test basis, evidence regarding the amounts and disclosures in the financial statements. Our audits also included evaluating the accounting principles used and significant estimates made by management, as well as evaluating the overall presentation of the financial statements. We believe that our audits provide a reasonable basis for our opinion.
/s/ Ernst & Young LLP
We have served as the Company’s auditor since 1990
Pittsburgh, Pennsylvania
February 28, 2018
37
L.B. FOSTER COMPANY AND SUBSIDIARIES
DECEMBER 31,
(In thousands, except share data)
|
2017
|
2016
|
|||||||
|
ASSETS
|
||||||||
|
Current assets:
|
||||||||
|
Cash and cash equivalents
|
$
|
37,678
|
|
$
|
30,363
|
|
||
|
Accounts receivable - net
|
76,582
|
|
66,632
|
|
||||
|
Inventories - net
|
97,543
|
|
83,243
|
|
||||
|
Prepaid income tax
|
188
|
|
14,166
|
|
||||
|
Other current assets
|
9,120
|
|
5,200
|
|
||||
|
Total current assets
|
221,111
|
|
199,604
|
|
||||
|
Property, plant, and equipment - net
|
96,096
|
|
103,973
|
|
||||
|
Other assets:
|
||||||||
|
Goodwill
|
19,785
|
|
18,932
|
|
||||
|
Other intangibles - net
|
57,440
|
|
63,519
|
|
||||
|
Investments
|
162
|
|
4,031
|
|
||||
|
Other assets
|
1,962
|
|
2,964
|
|
||||
|
Total assets
|
$
|
396,556
|
|
$
|
393,023
|
|
||
|
LIABILITIES AND STOCKHOLDERS' EQUITY
|
||||||||
|
Current liabilities:
|
||||||||
|
Accounts payable
|
$
|
52,404
|
|
$
|
37,744
|
|
||
|
Deferred revenue
|
10,136
|
|
7,597
|
|
||||
|
Accrued payroll and employee benefits
|
11,888
|
|
7,497
|
|
||||
|
Accrued warranty
|
8,682
|
|
10,154
|
|
||||
|
Current maturities of long-term debt
|
656
|
|
10,386
|
|
||||
|
Other accrued liabilities
|
9,764
|
|
8,953
|
|
||||
|
Total current liabilities
|
93,530
|
|
82,331
|
|
||||
|
Long-term debt
|
129,310
|
|
149,179
|
|
||||
|
Deferred tax liabilities
|
9,744
|
|
11,371
|
|
||||
|
Other long-term liabilities
|
17,493
|
|
16,891
|
|
||||
|
Stockholders' equity:
|
||||||||
|
Common stock, par value $0.01, authorized 20,000,000 shares; shares issued at December 31, 2017 and December 31, 2016, 11,115,779; shares outstanding at December 31, 2017 and December 31, 2016, 10,340,576 and 10,312,625, respectively
|
111
|
|
111
|
|
||||
|
Paid-in capital
|
45,017
|
|
44,098
|
|
||||
|
Retained earnings
|
137,780
|
|
133,667
|
|
||||
|
Treasury stock — at cost, common stock, shares at December 31, 2017 and December 31, 2016, 775,203 and 803,154, respectively
|
(18,662
|
)
|
(19,336
|
)
|
||||
|
Accumulated other comprehensive loss
|
(17,767
|
)
|
(25,289
|
)
|
||||
|
Total stockholders' equity
|
146,479
|
|
133,251
|
|
||||
|
TOTAL LIABILITIES AND STOCKHOLDERS' EQUITY
|
$
|
396,556
|
|
$
|
393,023
|
|
||
The accompanying notes are an integral part of these Consolidated Financial Statements.
38
L.B. FOSTER COMPANY AND SUBSIDIARIES
THE THREE YEARS ENDED DECEMBER 31,
(In thousands, except share data)
|
2017
|
2016
|
2015
|
||||||||||
|
Sales of goods
|
$
|
431,818
|
|
$
|
415,375
|
|
$
|
537,214
|
|
|||
|
Sales of services
|
104,559
|
|
68,139
|
|
87,309
|
|
||||||
|
Total net sales
|
536,377
|
|
483,514
|
|
624,523
|
|
||||||
|
Cost of goods sold
|
346,985
|
|
331,437
|
|
420,169
|
|
||||||
|
Cost of services sold
|
86,140
|
|
61,721
|
|
70,701
|
|
||||||
|
Total cost of sales
|
433,125
|
|
393,158
|
|
490,870
|
|
||||||
|
Gross profit
|
103,252
|
|
90,356
|
|
133,653
|
|
||||||
|
Selling and administrative expenses
|
80,521
|
|
85,976
|
|
92,648
|
|
||||||
|
Amortization expense
|
6,992
|
|
9,575
|
|
12,245
|
|
||||||
|
Asset impairments
|
—
|
|
135,884
|
|
80,337
|
|
||||||
|
Interest expense
|
8,377
|
|
6,551
|
|
4,378
|
|
||||||
|
Interest income
|
(307
|
)
|
(228
|
)
|
(206
|
)
|
||||||
|
Equity (income) loss of nonconsolidated investments
|
(6
|
)
|
1,290
|
|
413
|
|
||||||
|
Other income
|
(367
|
)
|
(1,523
|
)
|
(5,585
|
)
|
||||||
|
95,210
|
|
237,525
|
|
184,230
|
|
|||||||
|
Income (loss) before income taxes
|
8,042
|
|
(147,169
|
)
|
(50,577
|
)
|
||||||
|
Income tax expense (benefit)
|
3,929
|
|
(5,509
|
)
|
(6,132
|
)
|
||||||
|
Net income (loss)
|
$
|
4,113
|
|
$
|
(141,660
|
)
|
$
|
(44,445
|
)
|
|||
|
Basic earnings (loss) per common share
|
$
|
0.40
|
|
$
|
(13.79
|
)
|
$
|
(4.33
|
)
|
|||
|
Diluted earnings (loss) per common share
|
$
|
0.39
|
|
$
|
(13.79
|
)
|
$
|
(4.33
|
)
|
|||
|
Dividends paid per common share
|
$
|
—
|
|
$
|
0.12
|
|
$
|
0.16
|
|
|||
The accompanying notes are an integral part of these Consolidated Financial Statements.
39
L.B. FOSTER COMPANY AND SUBSIDIARIES
CONSOLIDATED STATEMENTS OF COMPREHENSIVE INCOME (LOSS)
THE THREE YEARS ENDED DECEMBER 31,
(In thousands)
|
2017
|
2016
|
2015
|
||||||||||
|
Net income (loss)
|
$
|
4,113
|
|
$
|
(141,660
|
)
|
$
|
(44,445
|
)
|
|||
|
Other comprehensive income (loss), net of tax:
|
||||||||||||
|
Foreign currency translation adjustment
|
6,024
|
|
(5,896
|
)
|
(6,947
|
)
|
||||||
|
Unrealized gain (loss) on cash flow hedges, net of tax (benefit) of $0, ($54), and ($76)
|
426
|
|
(83
|
)
|
(121
|
)
|
||||||
|
Pension and post-retirement benefit plans benefit (expense), net of tax expense (benefit): $159, ($491), and $208
|
920
|
|
(1,671
|
)
|
631
|
|
||||||
|
Reclassification of pension liability adjustments to earnings, net of tax expense of $5, $135, and $160*
|
152
|
|
301
|
|
389
|
|
||||||
|
Other comprehensive income (loss)
|
7,522
|
|
(7,349
|
)
|
(6,048
|
)
|
||||||
|
Comprehensive income (loss)
|
$
|
11,635
|
|
$
|
(149,009
|
)
|
$
|
(50,493
|
)
|
|||
|
*
|
Reclassifications out of accumulated other comprehensive income for pension obligations are reflected in selling and administrative expense.
|
The accompanying notes are an integral part of these Consolidated Financial Statements.
40
L.B. FOSTER COMPANY AND SUBSIDIARIES
THE THREE YEARS ENDED DECEMBER 31,
(In thousands)
|
2017
|
2016
|
2015
|
||||||||||
|
CASH FLOWS FROM OPERATING ACTIVITIES:
|
||||||||||||
|
Net income (loss)
|
$
|
4,113
|
|
$
|
(141,660
|
)
|
$
|
(44,445
|
)
|
|||
|
Adjustments to reconcile net income (loss) to cash provided (used) by operating activities:
|
||||||||||||
|
Deferred income taxes
|
(1,983
|
)
|
3,375
|
|
(14,582
|
)
|
||||||
|
Depreciation
|
12,849
|
|
13,917
|
|
14,429
|
|
||||||
|
Amortization
|
6,992
|
|
9,575
|
|
12,245
|
|
||||||
|
Asset impairments
|
—
|
|
135,884
|
|
80,337
|
|
||||||
|
Equity (income) loss and remeasurement (gain)
|
(6
|
)
|
1,290
|
|
(167
|
)
|
||||||
|
Loss (gain) on sales and disposals of property, plant, and equipment
|
18
|
|
202
|
|
(2,064
|
)
|
||||||
|
Stock-based compensation
|
1,696
|
|
1,346
|
|
1,471
|
|
||||||
|
Income tax deficiency (benefit) from stock-based compensation
|
—
|
|
332
|
|
(253
|
)
|
||||||
|
Change in operating assets and liabilities:
|
||||||||||||
|
Accounts receivable
|
(9,217
|
)
|
11,959
|
|
31,223
|
|
||||||
|
Inventories
|
(12,648
|
)
|
10,479
|
|
4,331
|
|
||||||
|
Other current assets
|
350
|
|
1,380
|
|
3,248
|
|
||||||
|
Prepaid income tax
|
13,978
|
|
(13,035
|
)
|
1,134
|
|
||||||
|
Other noncurrent assets
|
959
|
|
59
|
|
(909
|
)
|
||||||
|
Dividends from L B Pipe & Coupling Products, LLC
|
—
|
|
—
|
|
90
|
|
||||||
|
Accounts payable
|
14,600
|
|
(16,005
|
)
|
(17,204
|
)
|
||||||
|
Deferred revenue
|
2,440
|
|
984
|
|
(2,279
|
)
|
||||||
|
Accrued payroll and employee benefits
|
4,260
|
|
(2,676
|
)
|
(5,136
|
)
|
||||||
|
Other current liabilities
|
(588
|
)
|
1,432
|
|
(4,189
|
)
|
||||||
|
Other liabilities
|
1,559
|
|
(433
|
)
|
(1,108
|
)
|
||||||
|
Net cash provided by operating activities
|
39,372
|
|
18,405
|
|
56,172
|
|
||||||
|
CASH FLOWS FROM INVESTING ACTIVITIES:
|
||||||||||||
|
Proceeds from the sale of property, plant, and equipment
|
1,462
|
|
969
|
|
5,339
|
|
||||||
|
Capital expenditures on property, plant, and equipment
|
(6,149
|
)
|
(7,664
|
)
|
(14,913
|
)
|
||||||
|
Acquisitions, net of cash acquired
|
—
|
|
—
|
|
(196,001
|
)
|
||||||
|
Loans and capital contributions to equity method investment
|
—
|
|
(1,235
|
)
|
—
|
|
||||||
|
Net cash used by investing activities
|
(4,687
|
)
|
(7,930
|
)
|
(205,575
|
)
|
||||||
|
CASH FLOWS FROM FINANCING ACTIVITIES:
|
||||||||||||
|
Repayments of debt
|
(182,718
|
)
|
(155,427
|
)
|
(161,068
|
)
|
||||||
|
Proceeds from debt
|
153,118
|
|
146,243
|
|
301,063
|
|
||||||
|
Proceeds from exercise of stock options and stock awards
|
—
|
|
—
|
|
68
|
|
||||||
|
Financing fees
|
—
|
|
(1,417
|
)
|
(1,670
|
)
|
||||||
|
Treasury stock acquisitions
|
(103
|
)
|
(342
|
)
|
(2,701
|
)
|
||||||
|
Cash dividends on common stock paid to shareholders
|
—
|
|
(1,244
|
)
|
(1,656
|
)
|
||||||
|
Income tax (deficiency) benefit from stock-based compensation
|
—
|
|
(332
|
)
|
253
|
|
||||||
|
Net cash (used) provided by financing activities
|
(29,703
|
)
|
(12,519
|
)
|
134,289
|
|
||||||
|
Effect of exchange rate changes on cash and cash equivalents
|
2,333
|
|
(905
|
)
|
(3,598
|
)
|
||||||
|
Net increase (decrease) in cash and cash equivalents
|
7,315
|
|
(2,949
|
)
|
(18,712
|
)
|
||||||
|
Cash and cash equivalents at beginning of period
|
30,363
|
|
33,312
|
|
52,024
|
|
||||||
|
Cash and cash equivalents at end of period
|
$
|
37,678
|
|
$
|
30,363
|
|
$
|
33,312
|
|
|||
|
Supplemental disclosure of cash flow information:
|
||||||||||||
|
Interest paid
|
$
|
7,589
|
|
$
|
4,855
|
|
$
|
3,674
|
|
|||
|
Income taxes (received) paid
|
$
|
(11,189
|
)
|
$
|
3,942
|
|
$
|
7,835
|
|
|||
|
Capital expenditures funded through financing agreements
|
$
|
—
|
|
$
|
—
|
|
$
|
288
|
|
|||
41
L.B. FOSTER COMPANY AND SUBSIDIARIES
CONSOLIDATED STATEMENTS OF STOCKHOLDERS EQUITY
FOR THE THREE YEARS ENDED
DECEMBER 31, 2017
|
|
Common
Stock |
Paid-in
Capital |
Retained
Earnings |
Treasury
Stock |
Accumulated
Other Comprehensive (Loss) Income |
Total
|
||||||||||||||||||
|
|
(In thousands, except share data)
|
|||||||||||||||||||||||
|
Balance, January 1, 2015
|
$
|
111
|
|
$
|
48,115
|
|
$
|
322,672
|
|
$
|
(23,118
|
)
|
$
|
(11,892
|
)
|
$
|
335,888
|
|
||||||
|
Net loss
|
—
|
|
—
|
|
(44,445
|
)
|
—
|
|
—
|
|
(44,445
|
)
|
||||||||||||
|
Other comprehensive loss, net of tax:
|
|
|
|
|
|
|
||||||||||||||||||
|
Pension liability adjustment
|
—
|
|
—
|
|
—
|
|
—
|
|
1,020
|
|
1,020
|
|
||||||||||||
|
Foreign currency translation adjustment
|
—
|
|
—
|
|
—
|
|
—
|
|
(6,947
|
)
|
(6,947
|
)
|
||||||||||||
|
Unrealized derivative loss on cash flow hedges
|
—
|
|
—
|
|
—
|
|
—
|
|
(121
|
)
|
(121
|
)
|
||||||||||||
|
Purchase of 80,512 common shares for treasury
|
—
|
|
—
|
|
—
|
|
(1,587
|
)
|
—
|
|
(1,587
|
)
|
||||||||||||
|
Issuance of 59,113 common shares, net of shares withheld for taxes
|
—
|
|
(3,158
|
)
|
—
|
|
2,114
|
|
—
|
|
(1,044
|
)
|
||||||||||||
|
Stock-based compensation and related excess tax benefit
|
—
|
|
1,724
|
|
—
|
|
—
|
|
—
|
|
1,724
|
|
||||||||||||
|
Cash dividends on common stock paid to shareholders
|
—
|
|
—
|
|
(1,656
|
)
|
—
|
|
—
|
|
(1,656
|
)
|
||||||||||||
|
Balance, December 31, 2015
|
111
|
|
46,681
|
|
276,571
|
|
(22,591
|
)
|
(17,940
|
)
|
282,832
|
|
||||||||||||
|
Net loss
|
—
|
|
—
|
|
(141,660
|
)
|
—
|
|
—
|
|
(141,660
|
)
|
||||||||||||
|
Other comprehensive loss, net of tax:
|
|
|
|
|
|
|
||||||||||||||||||
|
Pension liability adjustment
|
—
|
|
—
|
|
—
|
|
—
|
|
(1,370
|
)
|
(1,370
|
)
|
||||||||||||
|
Foreign currency translation adjustment
|
—
|
|
—
|
|
—
|
|
—
|
|
(5,896
|
)
|
(5,896
|
)
|
||||||||||||
|
Unrealized derivative loss on cash flow hedges
|
—
|
|
—
|
|
—
|
|
—
|
|
(83
|
)
|
(83
|
)
|
||||||||||||
|
Purchase of 5,000 common shares for treasury
|
—
|
|
—
|
|
—
|
|
(67
|
)
|
—
|
|
(67
|
)
|
||||||||||||
|
Issuance of 96,619 common shares, net of shares withheld for taxes
|
—
|
|
(3,597
|
)
|
—
|
|
3,322
|
|
—
|
|
(275
|
)
|
||||||||||||
|
Stock-based compensation and related excess tax benefit
|
—
|
|
1,014
|
|
—
|
|
—
|
|
—
|
|
1,014
|
|
||||||||||||
|
Cash dividends on common stock paid to shareholders
|
—
|
|
|
(1,244
|
)
|
—
|
|
—
|
|
(1,244
|
)
|
|||||||||||||
|
Balance, December 31, 2016
|
111
|
|
44,098
|
|
133,667
|
|
(19,336
|
)
|
(25,289
|
)
|
133,251
|
|
||||||||||||
|
Net income
|
—
|
|
—
|
|
4,113
|
|
—
|
|
—
|
|
4,113
|
|
||||||||||||
|
Other comprehensive income, net of tax:
|
|
|
|
|
|
|
||||||||||||||||||
|
Pension liability adjustment
|
—
|
|
—
|
|
—
|
|
—
|
|
1,072
|
|
1,072
|
|
||||||||||||
|
Foreign currency translation adjustment
|
—
|
|
—
|
|
—
|
|
—
|
|
6,024
|
|
6,024
|
|
||||||||||||
|
Unrealized derivative gain on cash flow hedges
|
—
|
|
—
|
|
—
|
|
—
|
|
426
|
|
426
|
|
||||||||||||
|
Issuance of 27,951 common shares, net of shares withheld for taxes
|
—
|
|
(777
|
)
|
—
|
|
674
|
|
—
|
|
(103
|
)
|
||||||||||||
|
Stock-based compensation
|
—
|
|
1,696
|
|
—
|
|
—
|
|
—
|
|
1,696
|
|
||||||||||||
|
Balance, December 31, 2017
|
$
|
111
|
|
$
|
45,017
|
|
$
|
137,780
|
|
$
|
(18,662
|
)
|
$
|
(17,767
|
)
|
$
|
146,479
|
|
||||||
The accompanying notes are an integral part of these Consolidated Financial Statements.
42
L.B. FOSTER COMPANY AND SUBSIDIARIES
NOTES TO CONSOLIDATED FINANCIAL STATEMENTS
(Dollars in thousands, except share data unless otherwise noted)
Note 1.
Summary of Significant Accounting Policies
Basis of financial statement presentation
The consolidated financial statements include the accounts of the Company and its wholly-owned subsidiaries, joint ventures, and partnerships in which a controlling interest is held. Inter-company transactions and accounts have been eliminated. The Company utilizes the equity method of accounting for companies where its ownership is less than or equal to
50%
and significant influence exists.
Cash and cash equivalents
The Company considers cash and other instruments with maturities of three months or less, when purchased, to be cash and cash equivalents. The Company invests available funds in a manner to maximize returns, preserve investment principal, and maintain liquidity while seeking the highest yield available.
Cash and cash equivalents held in non-domestic accounts were
$35,807
and
$29,400
at
December 31, 2017
and
2016
, respectively. Included in non-domestic cash equivalents are investments in bank term deposits of approximately
$17
and
$16
at
December 31, 2017
and
2016
, respectively. The carrying amounts approximated fair value because of the short maturity of the instruments.
Inventories
Certain inventories are valued at the lower of the last-in, first-out (“LIFO”) cost or market. Approximately
50%
in
2017
and
47%
in
2016
of the Company’s inventory is valued at average cost or net realizable value, whichever is lower. Slow-moving inventory is reviewed and adjusted regularly, based upon product knowledge, physical inventory observation, and the age of the inventory. Inventory contains product costs, including inbound freight, direct labor, overhead costs relating to the manufacturing and distribution of products, and absorption costs representing the excess of manufacturing or production costs over the amounts charged to cost of sales or services.
Property, plant, and equipment
Depreciation and amortization are provided on a straight-line basis over the estimated useful lives of
5
to
40
years for buildings and
2
to
10
years for machinery and equipment. Leasehold improvements are amortized over
5
to
13
years, which represent the lives of the respective leases or the lives of the improvements, whichever is shorter. Depreciation expense is recorded within “Cost of sales” and “Selling and administrative expenses" based upon the particular asset’s use. The Company reviews a long-lived asset for impairment whenever events or changes in circumstances indicate that the carrying amount of the asset may not be recoverable. The Company impaired
$14,956
of property, plant, and equipment related to the Test and Inspection Services business unit within the Tubular and Energy Services segment during the year ended
December 31, 2016
. There were
no
material property, plant, and equipment impairments recorded for the years ended
December 31, 2017
and
2015
.
Maintenance, repairs, and minor renewals are charged to operations as incurred. Major renewals and betterments that substantially extend the useful life of the property are capitalized at cost. Upon sale or other disposition of assets, the costs and related accumulated depreciation and amortization are removed from the accounts and the resulting gain or loss, if any, is reflected in other income or loss.
Allowance for doubtful accounts
The allowance for doubtful accounts is recorded to reflect the ultimate realization of the Company’s accounts receivable and includes assessment of the probability of collection and the credit-worthiness of certain customers. Reserves for uncollectible accounts are recorded as part of "Selling and administrative expenses" on the Consolidated Statements of Operations. The Company reviews its accounts receivable aging and calculates an allowance through application of historic reserve factors to overdue receivables. This calculation is supplemented by specific account reviews performed by the Company’s credit department. As necessary, the application of the Company’s allowance rates to specific customers is reviewed and adjusted to more accurately reflect the credit risk inherent within that customer relationship.
Assets held for sale
The Company classifies assets as held for sale when management approves and commits to a formal plan of sale with the expectation the sale will be completed within one year. The net assets of the business held for sale are then recorded at the lower of their current carrying value or the fair market value, less costs to sell.
43
Investments
Investments in companies in which the Company has the ability to exert significant influence, but not control, over operating and financial policies (generally
20%
to
50%
ownership) are accounted for using the equity method. Under the equity method, investments are initially recorded at cost and adjusted for dividends and undistributed earnings and losses. The equity method of accounting requires a company to recognize a loss in the value of an equity method investment that is other than a temporary decline.
Goodwill and other intangible assets
Goodwill is tested annually for impairment or more often if there are indicators of impairment. The goodwill impairment test involves comparing the fair value of a reporting unit to its carrying value, including goodwill. If the carrying amount of the reporting unit exceeds its fair value, an impairment loss equal to the excess is recorded as a component of operations. The Company performs its annual impairment tests as of October 1
st
.
No
goodwill impairment was recognized during
2017
. During
2016
and
2015
, the Company identified certain triggering events that indicated an interim impairment test was required. As a result of the Company’s assessment, the Company recorded goodwill impairment of
$61,142
and
$80,337
during
2016
and
2015
, respectively. The
2016
charges related to the full impairment of the Chemtec Energy Services (or “Precision Measurement Systems”) and Protective Coatings business units goodwill within the Tubular and Energy Services segment resulting from the Chemtec Energy Services acquisition in
2014
and the
2013
acquisition of Ball Winch, LLC and a partial impairment of the Rail Technologies business unit goodwill within the Rail Products and Services segments, respectively. The
2015
impairment charge related to the goodwill resulting from the acquisition of IOS (or “Test and Inspection Services”) and Chemtec Energy Services within the Tubular and Energy Services segment. The measurement of goodwill impairment is a Level 3 fair value measurement, since the primary assumptions, including estimates of future revenue growth, gross margin, and EBITDA margin, are not market observable and require management to make judgments regarding future outcomes. Additional information concerning the impairments is set forth in Note 4 Goodwill and Other Intangible Assets.
The Company has no indefinite-lived intangible assets. The Company reviews a long-lived intangible asset for impairment whenever events or changes in circumstances indicate that the carrying amount of the asset may not be recoverable. All intangible assets are amortized over their useful lives ranging from
4
to
25
years, with a total weighted average amortization period of approximately
15
years, at
December 31, 2017
. There were
no
definite-lived intangible asset impairments during the years ended
December 31, 2017
and
2015
. During the year ended
December 31, 2016
, the Company recorded a definite-lived intangible asset impairment of
$59,786
related to the Chemtec Energy Services and Test and Inspection Services business units within the Tubular and Energy Services segment. See Note 4 Goodwill and Other Intangible Assets for additional information regarding the Company’s intangible assets.
Environmental remediation and compliance
Environmental remediation costs are accrued when the liability is probable and costs are estimable. Environmental compliance costs, which principally include the disposal of waste generated by routine operations, are expensed as incurred. Capitalized environmental costs, when appropriate, are depreciated over their useful life. Reserves are not reduced by potential claims for recovery and are not discounted. Claims for recovery are recognized as agreements are reached with third parties or as amounts are received. Reserves are periodically reviewed throughout the year and adjusted to reflect current remediation progress, prospective estimates of required activity, and other factors that may be relevant, including changes in technology or regulations. See Note 19 Commitments and Contingent Liabilities, for additional information regarding the Company’s outstanding environmental and litigation reserves.
Earnings per share
Basic earnings per share is calculated by dividing net income by the weighted average of common shares outstanding during the year. Diluted earnings per share is calculated by using the weighted average of common shares outstanding adjusted to include the potentially dilutive effect of outstanding stock options and restricted stock utilizing the treasury stock method.
Revenue recognition
The Company’s revenues are comprised of product and service sales as well as products and services provided under long-term contracts. For product and service sales, the Company recognizes revenue when the following criteria have been satisfied: persuasive evidence of a sales arrangement exists; product delivery and transfer of title to the customer has occurred or services have been rendered; the price is fixed or determinable; and collectability is reasonably assured. Generally, product title passes to the customer upon shipment. In limited cases, title does not transfer and revenue is not recognized until the customer has received the products at its physical location. Revenue is recorded net of returns, allowances, customer discounts, and incentives. Sales taxes collected from customers and remitted to governmental authorities are accounted for on a net (excluded from revenues) basis. Shipping and handling costs are included in cost of goods sold.
44
Revenues for products and services under long-term contracts are recognized using the percentage-of-completion method. Sales and gross profit are recognized as work is performed based upon the proportion of actual costs incurred to estimated total project costs. Sales and gross profit are adjusted prospectively for revisions in estimated total project costs and contract values. For certain products and services, the percentage of completion is based upon actual labor costs as a percentage of estimated total labor costs. At the time a loss contract becomes known, the entire amount of the estimated loss is recognized in the Consolidated Statements of Operations. Costs in excess of billings are classified as work-in-process inventory. Projects with billings in excess of costs are recorded within deferred revenue.
Deferred revenue
Deferred revenue consists of customer billings or payments received for which the revenue recognition criteria have not yet been met as well as billings in excess of costs on percentage of completion projects. Advanced payments from customers typically relate to contracts with respect to which the Company has significantly fulfilled its obligations, but due to the Company’s continuing involvement with the project, revenue is precluded from being recognized until title, ownership, and risk of loss have passed to the customer.
Fair value of financial instruments
The Company’s financial instruments consist of cash equivalents, accounts receivable, accounts payable, interest rate swap agreements, and debt. The carrying amounts of the Company’s financial instruments at
December 31, 2017
and
2016
approximate fair value. See Note 18 Fair Value Measurements, for additional information.
Stock-based compensation
The Company applies the provisions of Financial Accounting Standards Board (“FASB”) Accounting Standards Codification (“ASC”) 718, “Compensation - Stock Compensation,” to account for the Company’s stock-based compensation. Under the guidance, stock-based compensation cost is measured at the grant date based on the calculated fair value of the award. The expense is recognized over the employees’ requisite service period, generally the vesting period of the award. See Note 15 Stock-based Compensation, for additional information.
Product warranty
The Company maintains a current warranty liability for the repair or replacement of defective products. For certain manufactured products, an accrual is made on a monthly basis as a percentage of cost of sales based upon historical experience. For long-lived construction products, a warranty is established when the claim is known and quantifiable. The product warranty accrual is periodically adjusted based on the identification or resolution of known individual product warranty claims or due to changes in the Company’s historical warranty experience. At
December 31, 2017
and
2016
, the product warranty reserve was
$8,682
and
$10,154
, respectively. See Note 19 Commitments and Contingencies for additional information regarding the product warranty.
Income taxes
Income taxes are accounted for under the asset and liability method. Deferred tax assets and liabilities are recognized for the future tax consequences attributable to differences between the financial statement carrying amounts of assets and liabilities and their respective tax bases. Deferred taxes are measured using enacted tax laws and rates expected to be in effect when such differences are recovered or settled. The effect of a change in tax rates on deferred taxes is recognized in income in the period that includes the enactment date of the change.
The Company makes judgments regarding the recognition of deferred tax assets and the future realization of these assets. As prescribed by FASB ASC 740, “Income Taxes” and applicable guidance, valuation allowances must be provided for those deferred tax assets for which it is more likely than not (a likelihood of more than
50%
) that some portion or all of the deferred tax assets will not be realized. The guidance requires the Company to evaluate positive and negative evidence regarding the recoverability of deferred tax assets. The determination of whether the positive evidence outweighs the negative evidence and quantification of the valuation allowance requires the Company to make estimates and judgments of future financial results.
The Company evaluates all tax positions taken on its federal, state, and foreign tax filings to determine if the position is more likely than not to be sustained upon examination. For positions that meet the more likely than not to be sustained criteria, the largest amount of benefit to be realized upon ultimate settlement is determined on a cumulative probability basis. A previously recognized tax position is derecognized when it is subsequently determined that a tax position no longer meets the more likely than not threshold to be sustained. The evaluation of the sustainability of a tax position and the expected tax benefit is based on judgment, historical experience, and various other assumptions. Actual results could differ from those estimates upon subsequent resolution of identified matters. The Company accrues interest and penalties related to unrecognized tax benefits in its provision for income taxes.
Foreign currency translation
The assets and liabilities of our foreign subsidiaries are measured using the local currency as the functional currency and are translated into U.S. dollars at exchange rates as of the balance sheet date. Income statement amounts are translated at the
45
weighted-average rates of exchange during the year. The translation adjustment is accumulated as a separate component of accumulated other comprehensive income (loss). Foreign currency transaction gains and losses are included in determining net income. Included in net income or loss for the years ended
December 31, 2017
and
2016
were foreign currency transaction losses of approximately
$804
and
$12
, respectively, and a gain of
$1,616
for the year ended
December 31, 2015
.
Research and development
The Company expenses research and development costs as costs are incurred. For the years ended
December 31, 2017
,
2016
, and
2015
, research and development expenses were
$2,241
,
$3,511
, and
$3,937
, respectively, and were principally related to the Company’s friction management and railroad monitoring system products within the Rail Products and Services segment.
Use of estimates
The preparation of financial statements in conformity with U.S. generally accepted accounting principles (“GAAP”) requires management to make estimates and assumptions that affect the amounts reported in the financial statements and accompanying notes. Actual results could differ from those estimates.
Recently issued accounting guidance
In May 2014, the FASB issued Accounting Standards Update (“ASU”) 2014-09, “Revenue from Contracts with Customers (Topic 606)” (“ASU 2014-09”), which supersedes the revenue recognition requirements in Accounting Standards Codification 605, “Revenue Recognition” (“ASC 605”). ASU 2014-09 is based on the principle that revenue is recognized to depict the transfer of goods or services to customers in an amount that reflects the consideration to which the entity expects to be entitled in exchange for those goods or services. It also requires additional disclosure about the nature, amount, timing, and uncertainty of revenue, cash flows arising from customer contracts, including significant judgments and changes in judgments, and assets recognized from costs incurred to obtain or fulfill a contract. ASU 2014-09 is effective for fiscal years beginning after December 15, 2017, including interim periods within that reporting period. The Company will adopt the provisions of ASU 2014-09 on January 1, 2018, using the modified retrospective approach. Revenue from the Company's product and service sales will continue to be recognized when products are shipped or services are rendered (i.e., point in time). Revenue from the Company's product and services provided under long-term agreements will continue to be recognized as the Company transfers control of the product or provides the service to its customers (i.e., over time), which approximates the previously used percentage-of-completion or completed contract methods of accounting. The adoption of ASU 2014-09 is not expected to have a material impact to the Company's financial position or results of operations; however, the Company will present the disclosures required by this new standard beginning with our 2018 interim financial reporting.
In February 2016, the FASB issued ASU 2016-02, “Leases (Topic 842)” (“ASU 2016-02”). The new accounting requirements include the accounting for, presentation of, and classification of leases. The guidance will result in most leases being capitalized as a right of use asset with a related liability on our balance sheets. The requirements of the new standard are effective for annual reporting periods beginning after December 15, 2018, and interim periods within those annual periods. The Company is in the process of analyzing the impact of ASU 2016-02 on our financial position. The Company has a significant number of operating leases, and, as a result, expects this guidance to have a material impact on its Condensed Consolidated Balance Sheet. The change will not affect the covenants of the Second Amendment to the Second Amended and Restated Credit Agreement dated March 13, 2015. The Company does not anticipate early adoption as it relates to ASU 2016-02.
In October 2016, the FASB issued ASU 2016-16, “Income Taxes – Intra-Entity Transfers of Assets Other Than Inventory (Topic 740),” (“ASU 2016-16”) which will require an entity to recognize the income tax consequences of an intra-entity transfer of an asset, other than inventory, when the transfer occurs. The ASU is effective on January 1, 2018. The Company continues to evaluate the impact this standard will have on the Company’s financial statements but believes there will not be a material change once adopted. The Company has not elected the early adoption of ASU 2016-16.
In March 2017, the FASB issued ASU 2017-07, “Compensation – Retirement Benefits (Topic 715)” (“ASU 2017-07”), which improves the presentation of net periodic pension cost and net periodic postretirement benefit cost. The guidance requires that the entity report the service cost component in the same line item or items as other compensation costs arising from services rendered by the pertinent employees during the period, and report the other components of net periodic pension cost and net periodic postretirement benefit cost in the income statement separately from the service cost component and outside a subtotal of income from operations. Of the components of net periodic benefit cost, only the service cost component will be eligible for asset capitalization. The new standard will be effective for annual periods beginning after December 15, 2018, including interim periods within those annual periods. The Company is evaluating its implementation approach and assessing the impact of ASU 2017-07 on the presentation of operations.
In February 2018, the FASB issued ASU 2018-02, “Income Statement – Reporting Comprehensive Income,” (“ASU 2018-02”) that will permit companies the option to reclassify stranded tax effects caused by the newly-enacted US Tax Cuts and Jobs Act from accumulated other comprehensive income to retained earnings. Consequently, the amendments eliminate the stranded tax effects resulting from the Tax Cuts and Jobs Act and will improve the usefulness of information reported to
46
financial statement users. However, because the amendments only relate to the reclassification of the income tax effects of the Tax Cuts and Jobs Act, the underlying guidance that requires that the effect of a change in tax laws or rates be included in income from continuing operations is not affected. Adoption of the ASU will be optional and companies will need to disclose if it elects not to adopt the ASU. The ASU will be effective for fiscal years beginning after December 15, 2018, and interim periods within those fiscal years. Early adoption will be permitted, including adoption in any interim period, for financial statements that have not yet been issued or made available for issuance. Entities will have the option to apply the amendments retrospectively or to record the reclassification as of the beginning of the period of adoption.
Recently adopted accounting guidance
In July 2015, the FASB issued ASU 2015-11, “Inventory (Topic 330)” (“ASU 2015-11”). The pronouncement was issued to simplify the measurement of inventory and changes the measurement from lower of cost or market to lower of cost or net realizable value. The standard defines net realizable value as the estimated selling prices in the ordinary course of business, less reasonably predictable costs of completion, disposal, and transportation. This standard requires prospective application and is effective for fiscal years beginning after December 15, 2016, and interim periods within those fiscal years. The adoption of this guidance by the Company did not have a material impact on its Consolidated Financial Statements.
In March 2016, the FASB issued ASU No. 2016-09, “Compensation—Stock Compensation (Topic 718)” (“ASU 2016-09”), which simplifies the accounting for stock-based compensation. Among other things, ASU 2016-09 provides for (i) the simplification of accounting presentation of excess tax benefits and tax deficiencies, (ii) an accounting policy election regarding forfeitures to use an estimate or account for when incurred, and (iii) simplification of cash flow presentation for excess tax benefits. The standard is effective for the annual reporting periods beginning after December 15, 2016, and the transition method required by ASU 2016-09 varies by amendment. The provisions of ASU 2016-09 related to the recognition of excess tax benefits in the income statement and classification in the statement of cash flows were adopted prospectively and prior periods were not retrospectively adjusted. ASU 2016-09 permits companies to make an accounting policy election to recognize forfeitures of stock-based awards as they occur or make an estimate by applying a forfeiture rate each quarter. The Company previously estimated forfeitures and will continue to apply this accounting policy.
In January 2017, the FASB issued ASU 2017-04, “Intangibles – Goodwill and Other (Topic 350),” (“ASU 2017-04”) which simplifies the subsequent measurement of goodwill by eliminating Step 2 from the goodwill impairment test. Under the new guidance, an entity will recognize an impairment charge for the amount by which the carrying value exceeds the fair value. This standard is effective for annual or any interim goodwill impairment tests in fiscal years beginning after December 15, 2019. Early adoption is permitted for interim or annual goodwill impairment tests performed on testing dates after January 1, 2017. The adoption of this guidance by the Company did not to have a material impact on its Consolidated Financial Statements or interim goodwill testing.
Note 2.
Business Segments
The Company is a leading manufacturer and distributor of products and services for transportation and energy infrastructure with locations in North America and Europe. The Company is organized and evaluated by product group, which is the basis for identifying reportable segments. Each segment represents a revenue-producing component of the Company for which separate financial information is produced internally that is subject to evaluation by the Company’s chief operating decision maker in deciding how to allocate resources. Each segment is evaluated based upon its segment profit contribution to the Company’s consolidated results.
The Company markets its products directly in all major industrial areas of the United States, Canada, and Europe, primarily through an internal sales force.
The Company’s Rail Products and Services segment provides a full line of new and used rail, trackwork, and accessories to railroads, mines, and other customers in the rail industry. The Rail Products and Services segment also designs and produces insulated rail joints, power rail, track fasteners, concrete railroad ties, coverboards, and special accessories for mass transit and other rail systems. In addition, the Rail Products and Services segment engineers, manufactures, and assembles friction management products and railway wayside data collection and management systems.
The Company’s Construction Products segment sells and rents steel sheet piling, H-bearing pile, and other piling products for foundation and earth retention requirements. The Construction Products segment also sells bridge decking, bridge railing, structural steel fabrications, expansion joints, bridge forms, and other products for highway construction and repair. Lastly, the Construction Products segment produces precast concrete buildings and a variety of specialty precast concrete products.
The Company’s Tubular and Energy Services segment provides pipe coatings for natural gas pipelines and utilities, upstream test and inspection services, and precision measurement systems for the oil and gas market, and produces threaded pipe products for the oil and gas markets as well as industrial water well and irrigation markets.
47
The following table illustrates net sales, profit (loss), assets, depreciation/amortization, and expenditures for long-lived assets of the Company by segment for the years ended or at
December 31, 2017
,
2016
, and
2015
. Segment profit is the earnings from operations before income taxes and includes internal cost of capital charges for net assets used in the segment at a rate of generally
1%
per month excluding recently acquired businesses. The internal cost of capital charges are eliminated during the consolidation process. The accounting policies of the reportable segments are the same as those described in the summary of significant accounting policies except that the Company accounts for inventory on a First-In, First-Out (“FIFO”) basis at the segment level compared to a Last-In, First-Out (“LIFO”) basis at the consolidated level.
|
|
2017
|
|||||||||||||||||||
|
|
Net Sales
|
Segment Profit
|
Segment Assets
|
Depreciation/Amortization
|
Expenditures for Long-Lived Assets
|
|||||||||||||||
|
Rail Products and Services
|
$
|
256,127
|
|
$
|
12,216
|
|
$
|
192,038
|
|
$
|
7,004
|
|
$
|
2,915
|
|
|||||
|
Construction Products
|
161,801
|
|
11,620
|
|
83,154
|
|
1,955
|
|
1,390
|
|
||||||||||
|
Tubular and Energy Services
|
118,449
|
|
3,849
|
|
100,706
|
|
9,410
|
|
1,282
|
|
||||||||||
|
Total
|
$
|
536,377
|
|
$
|
27,685
|
|
$
|
375,898
|
|
$
|
18,369
|
|
$
|
5,587
|
|
|||||
|
|
2016
|
|||||||||||||||||||
|
|
Net Sales
|
Segment (Loss) Profit*
|
Segment Assets*
|
Depreciation/Amortization
|
Expenditures for Long-Lived Assets
|
|||||||||||||||
|
Rail Products and Services
|
$
|
239,127
|
|
$
|
(26,228
|
)
|
$
|
174,049
|
|
$
|
7,276
|
|
$
|
856
|
|
|||||
|
Construction Products
|
145,602
|
|
8,189
|
|
81,074
|
|
2,256
|
|
687
|
|
||||||||||
|
Tubular and Energy Services
|
98,785
|
|
(116,126
|
)
|
100,006
|
|
12,644
|
|
3,810
|
|
||||||||||
|
Total
|
$
|
483,514
|
|
$
|
(134,165
|
)
|
$
|
355,129
|
|
$
|
22,176
|
|
$
|
5,353
|
|
|||||
|
|
2015
|
|||||||||||||||||||
|
|
Net Sales
|
Segment Profit (Loss)**
|
Segment Assets**
|
Depreciation/Amortization
|
Expenditures for Long-Lived Assets
|
|||||||||||||||
|
Rail Products and Services
|
$
|
328,982
|
|
$
|
27,037
|
|
$
|
241,222
|
|
$
|
8,098
|
|
$
|
4,273
|
|
|||||
|
Construction Products
|
176,394
|
|
12,958
|
|
86,335
|
|
2,720
|
|
1,260
|
|
||||||||||
|
Tubular and Energy Services
|
119,147
|
|
(81,344
|
)
|
216,715
|
|
14,857
|
|
4,303
|
|
||||||||||
|
Total
|
$
|
624,523
|
|
$
|
(41,349
|
)
|
$
|
544,272
|
|
$
|
25,675
|
|
$
|
9,836
|
|
|||||
|
*
|
Segment loss includes impairment of goodwill, definite-lived intangible assets, and property, plant, and equipment as further described in Note 4 Goodwill and Other Intangible Assets and Note 7 Property, Plant, and Equipment.
|
|
**
|
Segment loss includes impairment of goodwill as further described in Note 4 Goodwill and Other Intangible Assets.
|
During
2017
,
2016
, and
2015
,
no
single customer accounted for more than
10%
of the Company’s consolidated net sales. Sales between segments are immaterial.
48
Reconciliations of reportable segment net sales, profits (losses), assets, depreciation/amortization, and expenditures for long-lived assets to the Company’s consolidated totals are as follows for the years ended and as of December 31:
|
2017
|
2016
|
2015
|
||||||||||
|
Income (loss) from Operations:
|
||||||||||||
|
Profit (loss) for reportable segments
|
$
|
27,685
|
|
$
|
(134,165
|
)
|
$
|
(41,349
|
)
|
|||
|
Interest expense
|
(8,377
|
)
|
(6,551
|
)
|
(4,378
|
)
|
||||||
|
Interest income
|
307
|
|
228
|
|
206
|
|
||||||
|
Other income
|
367
|
|
1,523
|
|
5,585
|
|
||||||
|
LIFO (expense) income
|
(2,009
|
)
|
2,643
|
|
2,468
|
|
||||||
|
Equity in income (loss) of nonconsolidated investments
|
6
|
|
(1,290
|
)
|
(413
|
)
|
||||||
|
Corporate expense, cost of capital elimination, and other unallocated charges
|
(9,937
|
)
|
(9,557
|
)
|
(12,696
|
)
|
||||||
|
Income (loss) before income taxes
|
$
|
8,042
|
|
$
|
(147,169
|
)
|
$
|
(50,577
|
)
|
|||
|
Assets:
|
||||||||||||
|
Total for reportable segments
|
$
|
375,898
|
|
$
|
355,129
|
|
$
|
544,272
|
|
|||
|
Unallocated corporate assets
|
25,845
|
|
41,072
|
|
28,209
|
|
||||||
|
LIFO
|
(5,187
|
)
|
(3,178
|
)
|
(5,821
|
)
|
||||||
|
Total Assets
|
$
|
396,556
|
|
$
|
393,023
|
|
$
|
566,660
|
|
|||
|
Depreciation/Amortization:
|
||||||||||||
|
Total for reportable segments
|
$
|
18,369
|
|
$
|
22,176
|
|
$
|
25,675
|
|
|||
|
Other
|
1,472
|
|
1,316
|
|
999
|
|
||||||
|
Total
|
$
|
19,841
|
|
$
|
23,492
|
|
$
|
26,674
|
|
|||
|
Expenditures for Long-Lived Assets:
|
||||||||||||
|
Total for reportable segments
|
$
|
5,587
|
|
$
|
5,353
|
|
$
|
9,836
|
|
|||
|
Expenditures funded through financing agreements
|
—
|
|
—
|
|
288
|
|
||||||
|
Other expenditures
|
562
|
|
2,311
|
|
5,077
|
|
||||||
|
Total
|
$
|
6,149
|
|
$
|
7,664
|
|
$
|
15,201
|
|
|||
The following table summarizes the Company’s sales by major geographic region in which the Company has operations for the years ended December 31:
|
2017
|
2016
|
2015
|
||||||||||
|
United States
|
$
|
431,868
|
|
$
|
390,930
|
|
$
|
522,404
|
|
|||
|
Canada
|
38,859
|
|
30,644
|
|
40,545
|
|
||||||
|
United Kingdom
|
37,237
|
|
37,188
|
|
26,817
|
|
||||||
|
Other
|
28,413
|
|
24,752
|
|
34,757
|
|
||||||
|
$
|
536,377
|
|
$
|
483,514
|
|
$
|
624,523
|
|
||||
The following table summarizes the Company’s long-lived assets by geographic region at December 31:
|
2017
|
2016
|
2015
|
||||||||||
|
United States
|
$
|
89,439
|
|
$
|
96,650
|
|
$
|
118,053
|
|
|||
|
Canada
|
4,788
|
|
5,445
|
|
6,186
|
|
||||||
|
United Kingdom
|
1,850
|
|
1,842
|
|
2,449
|
|
||||||
|
Other
|
19
|
|
36
|
|
57
|
|
||||||
|
$
|
96,096
|
|
$
|
103,973
|
|
$
|
126,745
|
|
||||
49
The following table summarizes the Company’s sales by major product line:
|
2017
|
2016
|
2015
|
||||||||||
|
Rail Technologies
|
$
|
100,257
|
|
$
|
90,469
|
|
$
|
98,237
|
|
|||
|
Rail Distribution
|
90,696
|
|
83,236
|
|
126,277
|
|
||||||
|
Piling
|
73,158
|
|
70,535
|
|
94,853
|
|
||||||
|
Precast Concrete Products
|
55,877
|
|
54,514
|
|
52,044
|
|
||||||
|
Test and Inspection Services
|
39,198
|
|
20,765
|
|
35,906
|
|
||||||
|
Protective Coatings
|
38,096
|
|
23,043
|
|
33,532
|
|
||||||
|
Fabricated Bridge
|
32,766
|
|
20,553
|
|
29,496
|
|
||||||
|
Precision Measurement Systems
|
29,670
|
|
42,830
|
|
36,048
|
|
||||||
|
Other products
|
76,659
|
|
77,569
|
|
118,130
|
|
||||||
|
$
|
536,377
|
|
$
|
483,514
|
|
$
|
624,523
|
|
||||
Note 3.
Acquisitions
TEW Plus, Ltd
On
November 23, 2015
, the Company acquired the
75%
balance of the remaining shares of
TEW Plus, Ltd (“Tew Plus”)
for
$2,130
, net of cash acquired. Headquartered in Nottingham, UK, Tew Plus provides telecommunications and security systems to the railway and commercial markets. Their offerings include full installation services including: design, project management, survey, and commissioning along with future maintenance. The results of Tew Plus’ operations are included within the Rail Products and Services segment from the date of acquisition.
Inspection Oilfield Services
On
March 13, 2015
, the Company acquired
IOS Holdings, Inc. (“IOS” or ”Test and Inspection Services”)
for
$167,404
, net of cash acquired and a net working capital receivable adjustment of
$2,363
. The purchase agreement included an earn-out provision for the seller to generate an additional
$60,000
of proceeds upon achieving certain levels of EBITDA during the three-year period that ended on December 31, 2017. The Company did not accrue an estimated earn-out obligation based upon a probability weighted valuation model of the projected EBITDA results, which indicated that the minimum target would not be achieved. Approximately
$7,600
of the purchase price related to amounts held in escrow to satisfy potential indemnity claims made under the purchase agreement. Headquartered in Houston, TX, IOS is a leading independent provider of tubular management services with operations in every significant oil and gas producing region in the continental United States. The acquisition is included within our Tubular and Energy Services segment from the date of acquisition. See Note 4 Goodwill and Other Intangible Assets, with respect to an impairment of the goodwill related to this acquisition.
TEW Holdings, Ltd
On
January 13, 2015
, the Company acquired
TEW Holdings, Ltd (“Tew”)
for
$26,467
, net of cash acquired, working capital, and net debt adjustments totaling
$4,200
. The purchase price included approximately
$600
which was held in escrow to satisfy potential indemnity claims made under the purchase agreement. Headquartered in Nottingham, UK, Tew provides application engineering solutions primarily to the rail market and other major industries. The results of Tew’s operations are included within the Rail Products and Services segment from the date of acquisition.
Acquisition Summary
Each transaction was accounted for under the acquisition method of accounting under U.S. generally accepted accounting principles, which requires an acquiring entity to recognize, with limited exceptions, all of the assets acquired and liabilities assumed in a transaction at fair value as of the acquisition date. Goodwill primarily represents the value paid for each acquisition’s enhancement to the Company’s product and service offerings and capabilities, as well as a premium payment related to the ability to control the acquired assets.
No
acquisition-related costs were incurred during the years ended
December 31, 2017
and
2016
. The Company incurred
$760
of acquisition-related costs that are included in the results of operations within selling and administrative costs for the year ended
December 31, 2015
.
50
The following unaudited pro forma consolidated income statement presents the Company’s results as if the acquisitions of IOS and Tew had occurred on January 1,
2015
. The
2015
pro forma results include the impact of the current year impairment of goodwill as further described in Note 4:
|
Twelve months ended December 31,
|
||||
|
|
2015
|
|||
|
Net sales
|
$
|
640,596
|
|
|
|
Gross profit
|
138,123
|
|
||
|
Net loss
|
(44,399
|
)
|
||
|
Diluted loss per share
|
||||
|
As Reported
|
$
|
(4.33
|
)
|
|
|
Pro forma
|
$
|
(4.32
|
)
|
|
The following table summarizes the estimated fair values of the assets acquired and liabilities assumed at the dates of the acquisition:
|
Allocation of Purchase Price
|
November 23,
2015 - Tew Plus |
March 13,
2015 - IOS |
|
January 13,
2015 - Tew |
||||||||
|
Current assets
|
$
|
4,420
|
|
$
|
19,877
|
|
|
$
|
12,125
|
|
||
|
Other assets
|
—
|
|
708
|
|
|
—
|
|
|||||
|
Property, plant, and equipment
|
47
|
|
51,453
|
|
*
|
2,398
|
|
|||||
|
Goodwill
|
822
|
|
69,908
|
|
*
|
8,772
|
|
|||||
|
Other intangibles
|
1,074
|
|
50,354
|
|
*
|
14,048
|
|
|||||
|
Liabilities assumed
|
(3,597
|
)
|
(23,596
|
)
|
(6,465
|
)
|
||||||
|
Total
|
$
|
2,766
|
|
$
|
168,704
|
|
|
$
|
30,878
|
|
||
|
*
|
See Note 4 Goodwill and Other Intangible Assets, and Note 7 Property, Plant, and Equipment, with respect to an impairment of property, plant, and equipment, intangible assets, and goodwill related to this acquisition.
|
The following table summarizes the estimates of the fair values and amortizable lives of the identifiable intangible assets acquired:
|
Intangible Asset
|
November 23,
2015 - Tew Plus |
March 13,
2015 - IOS |
|
January 13,
2015 - Tew |
||||||||
|
Trade name
|
$
|
—
|
|
$
|
2,641
|
|
|
$
|
870
|
|
||
|
Customer relationships
|
817
|
|
41,171
|
|
|
10,035
|
|
|||||
|
Technology
|
203
|
|
4,364
|
|
|
2,480
|
|
|||||
|
Non-competition agreements
|
54
|
|
2,178
|
|
|
663
|
|
|||||
|
Total identified intangible assets
|
$
|
1,074
|
|
$
|
50,354
|
|
**
|
$
|
14,048
|
|
||
|
**
|
See Note 4 Goodwill and Other Intangible Assets, with respect to an impairment of intangible assets related to this acquisition.
|
51
Note 4.
Goodwill and Other Intangible Assets
The following table represents the goodwill balance by reportable segment:
|
Rail Products
and Services |
Construction
Products |
Tubular and
Energy Services |
Total
|
|||||||||||||
|
Balance at December 31, 2015:
|
$
|
48,188
|
|
$
|
5,147
|
|
$
|
28,417
|
|
$
|
81,752
|
|
||||
|
Foreign currency translation impact
|
(1,524
|
)
|
—
|
|
—
|
|
(1,524
|
)
|
||||||||
|
Disposition
|
(154
|
)
|
—
|
|
—
|
|
(154
|
)
|
||||||||
|
Impairment charges
|
(32,725
|
)
|
—
|
|
(28,417
|
)
|
(61,142
|
)
|
||||||||
|
Balance at December 31, 2016:
|
13,785
|
|
5,147
|
|
—
|
|
18,932
|
|
||||||||
|
Foreign currency translation impact
|
853
|
|
—
|
|
—
|
|
853
|
|
||||||||
|
Balance at December 31, 2017:
|
$
|
14,638
|
|
$
|
5,147
|
|
$
|
—
|
|
$
|
19,785
|
|
||||
The Company performs goodwill impairment tests annually during the fourth quarter, and also performs interim goodwill impairment tests if it is determined that it is more likely than not that the fair value of a reporting unit is less than the carrying amount. Qualitative factors are assessed to determine whether it is more likely than not that the fair value of a reporting unit is less than the carrying amount. No goodwill impairment was recorded in connection with these evaluations for the
twelve months ended December 31, 2017
. The Company continues to monitor the recoverability of the long-lived assets associated with certain reporting units of the Company and the long-term financial projections of the businesses. Sustained declines in the markets we serve may result in future long-lived asset impairment.
During the year ended
December 31, 2016
, various reporting units underperformed against their projections and revised their forecasts downward. The revised forecasts, which were primarily attributable to weakness in the rail and energy markets, indicated longer recovery horizons than we previously projected. In connection with the revisions to the longer term projections and a substantial decline in market capitalization, the Company concluded that these qualitative factors indicated that there was a more likely than not risk that the carrying value of goodwill exceeded its fair value.
As a result of the Company’s qualitative review, with the assistance of an independent valuation firm, the Company performed a quantitative interim test for impairment of goodwill as of June 1, 2016. The valuation included the use of both the income and market approaches. Greater weighting was applied to the income approach since the Company believes it is the most reliable indication of value as it captures forecasted revenues and earnings for the reporting units in the projection period that the market approach may not directly incorporate. In addition, a lack of comparable market transactions has limited the availability of information necessary for the market approach.
The results of the test indicated that the Rail Technologies (within the Rail Products and Services segment), Chemtec (or “Precision Measurement Systems”), and Protective Coatings (Chemtec and Protective Coatings are within the Tubular and Energy Services segment) business units’ respective fair values were less than their carrying values. All other reporting units that maintain goodwill substantially exceeded their carrying value and were not at risk of impairment. As a result of the continued weakness in the commodity cycles impacting the energy and rail markets, the near term projections of the Rail Technologies, Chemtec, and Protective Coatings business units had deteriorated and the expected future growth of these business units was determined to be insufficient to support the carrying values.
The Company determined the implied fair values of the Rail Technologies, Chemtec, and Protective Coatings business units by using level 3 unobservable inputs, which incorporated assumptions that we believe would be a reasonable market participant’s view in a hypothetical purchase, to develop the discounted cash flows of the respective reporting units. Significant level 3 inputs included estimates of future revenue growth, gross margin and earnings before interest, taxes, depreciation and amortization (“EBITDA”). The resulting fair values of each reporting unit were allocated to the assets and liabilities of the respective reporting unit as if each reporting unit had been acquired in a business combination as of the test date and the fair value was the purchase price paid to acquire each reporting unit. The results of the step 2 analysis indicated that the carrying amounts of the goodwill of Rail Technologies, Chemtec, and Protective Coatings exceeded the implied fair values of that goodwill. Accordingly, the Company recognized a non-cash goodwill impairment of
$61,142
, which represented the full impairment of goodwill within the Chemtec and Protective Coatings business units and approximately
68%
of Rail Technologies goodwill.
No
additional impairments were triggered as a result of the Company’s
2016
annual impairment test.
At
December 31, 2017
, approximately
$14,638
of the Company’s goodwill balance is allocated to the Rail Technologies business unit within the Rail Products and Services reportable segment.
In
2015
, the Company compared the implied fair values of the IOS (or “Test and Inspection Services”) and Chemtec goodwill amounts to the carrying amounts of that goodwill. The fair values of the IOS and Chemtec business units were allocated to all of the assets and liabilities of the respective reporting unit as if IOS and Chemtec had been acquired in business combinations as of the test date and the fair value was the purchase price paid to acquire each reporting unit. As a result of this
52
valuation, it was determined that the carrying amounts of IOS’s and Chemtec’s goodwill exceeded the implied fair values of that goodwill. The Company recognized a non-cash goodwill impairment charge of
$80,337
to write down the carrying values to the implied fair values, of which
$69,908
represented the full carrying value of goodwill related to the IOS acquisition and the remaining
$10,429
related to the Chemtec reporting unit. No additional impairments were triggered as a result of the Company’s
2015
annual impairment test.
At
December 31, 2017
, the Company had an aggregate goodwill impairment of
$141,479
, which was related to the 2016 and 2015 write downs.
The following table represents the gross definite-lived intangible assets balance by reportable segment at December 31:
|
2017
|
2016
|
|||||||
|
Rail Products and Services
|
$
|
57,654
|
|
$
|
56,476
|
|
||
|
Construction Products
|
1,348
|
|
1,348
|
|
||||
|
Tubular and Energy Services
|
29,179
|
|
29,179
|
|
||||
|
$
|
88,181
|
|
$
|
87,003
|
|
|||
During the year ended
December 31, 2017
, based on the Company's review of impairment indicators, there was no test performed on the recoverability of our definite-lived intangible assets. There were
no
definite-lived intangible asset impairments recorded during the years ended
December 31, 2017
or
2015
.
During the year ended
December 31, 2016
, the results of our testing indicated that the long-lived assets related to the IOS and Chemtec business units, within the Tubular and Energy Services segment, had carrying values in excess of the asset groups’ fair value. Based upon level 3 unobservable inputs, the Company incorporated assumptions that it believes would be a reasonable market participant’s view in a hypothetical purchase, to develop the discounted cash flows. Significant level 3 inputs included estimates of future revenue growth, gross margin and EBITDA. As a result of the analysis, the Company recorded a
$42,982
non-cash impairment of definite-lived intangible assets related to the IOS business unit and a
$16,804
non-cash impairment of definite-lived intangible assets related to the Chemtec business unit.
The components of the Company’s intangible assets are as follows at:
|
|
December 31, 2017
|
|||||||||||||
|
|
Weighted Average
Amortization Period In Years |
Gross
Carrying Value |
Accumulated
Amortization |
Net
Carrying Amount |
||||||||||
|
Non-compete agreements
|
5
|
$
|
4,238
|
|
$
|
(3,100
|
)
|
$
|
1,138
|
|
||||
|
Patents
|
10
|
389
|
|
(164
|
)
|
225
|
|
|||||||
|
Customer relationships
|
17
|
37,679
|
|
(9,171
|
)
|
28,508
|
|
|||||||
|
Trademarks and trade names
|
14
|
10,085
|
|
(4,091
|
)
|
5,994
|
|
|||||||
|
Technology
|
14
|
35,790
|
|
(14,215
|
)
|
21,575
|
|
|||||||
|
$
|
88,181
|
|
$
|
(30,741
|
)
|
$
|
57,440
|
|
||||||
|
|
December 31, 2016
|
|||||||||||||
|
|
Weighted Average
Amortization Period In Years |
Gross
Carrying Value |
Accumulated
Amortization |
Net
Carrying Amount |
||||||||||
|
Non-compete agreements
|
5
|
$
|
4,219
|
|
$
|
(2,217
|
)
|
$
|
2,002
|
|
||||
|
Patents
|
10
|
373
|
|
(143
|
)
|
230
|
|
|||||||
|
Customer relationships
|
18
|
36,843
|
|
(6,582
|
)
|
30,261
|
|
|||||||
|
Trademarks and trade names
|
14
|
10,018
|
|
(3,238
|
)
|
6,780
|
|
|||||||
|
Technology
|
14
|
35,550
|
|
(11,304
|
)
|
24,246
|
|
|||||||
|
$
|
87,003
|
|
$
|
(23,484
|
)
|
$
|
63,519
|
|
||||||
Intangible assets are amortized over their useful lives ranging from
4
to
25
years, with a total weighted average amortization period of approximately
15
years. Amortization expense for the years ended
December 31, 2017
,
2016
, and
2015
was
$6,992
,
$9,575
, and
$12,245
, respectively.
53
Estimated amortization expense for the years
2018
and thereafter is as follows:
|
|
Amortization
Expense |
|||
|
2018
|
$
|
7,036
|
|
|
|
2019
|
6,314
|
|
||
|
2020
|
5,991
|
|
||
|
2021
|
5,971
|
|
||
|
2022
|
5,904
|
|
||
|
2023 and thereafter
|
26,224
|
|
||
|
$
|
57,440
|
|
||
Note 5.
Accounts Receivable
Accounts receivable at
December 31, 2017
and
2016
are summarized as follows:
|
2017
|
2016
|
|||||||
|
Trade
|
$
|
74,514
|
|
$
|
64,707
|
|
||
|
Allowance for doubtful accounts
|
(2,151
|
)
|
(1,417
|
)
|
||||
|
72,363
|
|
63,290
|
|
|||||
|
Other
|
4,219
|
|
3,342
|
|
||||
|
$
|
76,582
|
|
$
|
66,632
|
|
|||
The Company’s customers are principally in the transportation and energy infrastructure sectors. At
December 31, 2017
and
2016
, trade receivables, net of allowance for doubtful accounts, from customers were as follows:
|
2017
|
2016
|
|||||||
|
Rail Products and Services
|
$
|
31,225
|
|
$
|
29,552
|
|
||
|
Construction Products
|
20,070
|
|
20,531
|
|
||||
|
Tubular and Energy Services
|
21,068
|
|
13,207
|
|
||||
|
$
|
72,363
|
|
$
|
63,290
|
|
|||
Credit is extended based upon an evaluation of the customer’s financial condition and, while collateral is not required, the Company periodically receives surety bonds that guarantee payment. Credit terms are consistent with industry standards and practices.
Note 6.
Inventory
Inventories at
December 31, 2017
and
2016
are summarized in the following table:
|
2017
|
2016
|
|||||||
|
Finished goods
|
$
|
55,846
|
|
$
|
46,673
|
|
||
|
Work-in-process
|
29,379
|
|
21,716
|
|
||||
|
Raw materials
|
17,505
|
|
18,032
|
|
||||
|
Total inventories at current costs
|
102,730
|
|
86,421
|
|
||||
|
Less: LIFO reserve
|
(5,187
|
)
|
(3,178
|
)
|
||||
|
$
|
97,543
|
|
$
|
83,243
|
|
|||
At
December 31, 2017
and
2016
, approximately
50%
and
53%
of the Company’s inventory was valued at the lower of LIFO cost or market. At
December 31, 2017
and
2016
, the LIFO carrying value of inventories for book purposes exceeded the LIFO value for tax purposes by approximately
$10,694
and
$8,925
, respectively. At
December 31, 2017
, liquidation of certain LIFO inventory layers carried at costs that were lower than the costs of current purchases resulted in a decrease in cost of goods sold of
$16
and at
December 31, 2016
and
2015
liquidation of certain LIFO inventory layers carried at costs that were higher than the costs of their current purchases resulted in an increase in cost of goods sold of
$1,304
and
$115
, respectively.
54
Note 7.
Property, Plant, and Equipment
Property, plant, and equipment at
December 31, 2017
and
2016
consist of the following:
|
2017
|
2016
|
|||||||
|
Land
|
$
|
14,869
|
|
$
|
14,826
|
|
||
|
Improvements to land and leaseholds
|
17,415
|
|
17,408
|
|
||||
|
Buildings
|
34,929
|
|
33,910
|
|
||||
|
Machinery and equipment, including equipment under capitalized leases
|
120,806
|
|
118,060
|
|
||||
|
Construction in progress
|
1,057
|
|
1,291
|
|
||||
|
189,076
|
|
185,495
|
|
|||||
|
Less: accumulated depreciation and amortization, including accumulated amortization of capitalized leases
|
92,980
|
|
81,522
|
|
||||
|
$
|
96,096
|
|
$
|
103,973
|
|
|||
There were
no
impairments of property, plant, and equipment recorded during the years ended
December 31, 2017
or
2015
.
During the year ended
December 31, 2016
, the Company performed recoverability tests on reporting units when it was more likely than not that the carrying value of the long-lived asset group would not be recoverable. The results of our testing indicated that the long-lived assets related to the IOS business, within the Tubular and Energy Services segment, had carrying values in excess of the asset groups’ fair value. Based upon level 3 unobservable inputs, the Company incorporated assumptions that it believes would be a reasonable market participant’s view in a hypothetical purchase, to develop the discounted cash flows. Significant level 3 inputs included estimates of future revenue growth, gross margin, and EBITDA. As a result of the analysis, the Company recorded a
$14,956
non-cash impairment of property, plant and equipment related to the IOS business.
Depreciation expense, including amortization of assets under capital leases, for the years ended
December 31, 2017
,
2016
, and
2015
amounted to
$12,849
,
$13,917
, and
$14,429
, respectively.
Note 8.
Investments
The Company is a member of a joint venture, L B Pipe and Coupling Products, LLC (“L B Pipe JV”), in which it maintains a
45%
ownership interest. L B Pipe JV manufactures, markets, and sells various machined components and precision coupling products for the energy, water well, and construction markets and is scheduled to terminate on June 30, 2019.
Under applicable guidance for variable interest entities in FASB ASC 810, “Consolidation,” the Company previously determined that L B Pipe JV was a variable interest entity. The Company concluded that it was not the primary beneficiary of the variable interest entity, as the Company did not have a controlling financial interest and did not have the power to direct the activities that most significantly impact the economic performance of L B Pipe JV.
During the year ended
December 31, 2017
, pursuant to the limited liability company agreement, the Company determined to sell its
45%
ownership to the other
45%
equity holder and no longer classified the L B Pipe JV as a variable interest entity. The Company concluded that it has met the criteria under applicable guidance for a long-lived asset to be held for sale, and has, accordingly, reclassified L B Pipe JV investment of
$3,875
as a current asset held for sale within "Other current assets" on the Consolidated Balance Sheet. During
2017
, the asset was remeasured to its fair market value. The difference between the fair market value,
$3,875
, and the Company's carrying amount,
$4,288
, resulted in a
$413
other-than-temporary impairment for the
twelve months ended December 31, 2017
. The Company performed recoverability tests over its nonconsolidated equity method investments and concluded that the fair values exceeded the carrying values and
no
impairment was recorded by the Company during the years ended
December 31, 2016
or
2015
.
During the years ended
December 31, 2017
and
2016
, each of the L B Pipe JV members received proportional distributions from L B Pipe JV. During
2016
, the Company and the other
45%
member each executed a revolving line of credit with L B Pipe JV with an available limit of
$1,350
. The Company and the other
45%
member each loaned
$1,235
to L B Pipe JV in an effort to maintain compliance with L B Pipe JV’s debt covenants with an unaffiliated bank. Pursuant to the sale agreement, the Company is to receive its outstanding loan balance, including applicable interest, upon its sale of L B Pipe JV.
The Company recorded equity in the income of L B Pipe JV of approximately
$386
and losses of
$1,345
and
$410
for the years ended
December 31, 2017
,
2016
, and
2015
, respectively.
55
At
December 31, 2017
and
2016
, the Company had a nonconsolidated equity method investment of
$3,875
, recorded as an asset held for sale in “Other current assets,” and
$3,902
, recorded in “Investments,” respectively, in L B Pipe JV and other investments totaling
$162
and
$129
at
December 31, 2017
and
2016
, respectively.
The Company is leasing
five
acres of land and
two
facilities to L B Pipe JV through June 30, 2019, with a
5.5
-year renewal period. The current monthly lease payments, including interest, approximate
$17
, with a balloon payment of approximately
$488
, which is required to be paid at the termination of the lease, allocated over the renewal period, or during the initial term of the lease. This lease qualifies as a direct financing lease under the applicable guidance in FASB ASC 840-30, “Leases.”
The following is a schedule of the direct financing minimum lease payments for the years
2017
and thereafter:
|
|
Minimum Lease Payments
|
|||
|
2018
|
$
|
150
|
|
|
|
2019
|
585
|
|
||
|
$
|
735
|
|
||
The Company’s exposure to loss results from its capital contributions, net of the Company’s share of L B Pipe JV’s income or loss, its revolving line of credit, and its net investment in the direct financing lease covering the facility used by L B Pipe JV for its operations. The carrying amounts with the maximum exposure to loss of the Company at
December 31, 2017
and
2016
, respectively, are as follows:
|
2017
|
2016
|
|||||||
|
LB Pipe JV equity method investment
|
$
|
3,875
|
|
$
|
3,902
|
|
||
|
Revolving line of credit
|
1,235
|
|
1,235
|
|
||||
|
Net investment in direct financing lease
|
735
|
|
871
|
|
||||
|
$
|
5,845
|
|
$
|
6,008
|
|
|||
Note 9.
Deferred Revenue
Deferred revenue of
$10,136
and
$7,597
at
December 31, 2017
and
2016
, respectively, consists of customer billings or payments received for which the revenue recognition criteria have not yet been met as well as billings in excess of costs on percentage of completion projects. Advanced payments from customers typically relate to contracts with respect to which the Company has significantly fulfilled its obligations, but due to the Company’s continuing involvement with the project, revenue is precluded from being recognized until title, ownership, and risk of loss have passed to the customer.
Note 10.
Long-term debt at
December 31, 2017
and
2016
consists of the following:
|
2017
|
2016
|
|||||||
|
Revolving credit facility with an interest rate of 4.78% at December 31, 2017 and 4.22% at December 31, 2016
|
$
|
128,470
|
|
$
|
127,073
|
|
||
|
Term loan payable in quarterly installments through January 1, 2020 with an interest rate of 3.92% at December 31, 2016
|
—
|
|
30,000
|
|
||||
|
Financing agreement payable in installments through July 1, 2017 with an interest rate of 3.00% at December 31, 2016
|
—
|
|
534
|
|
||||
|
Lease obligations payable in installments through 2020 with a weighted average interest rate of 3.21% at December 31, 2017 and 3.10% at December 31, 2016
|
1,496
|
|
1,958
|
|
||||
|
Total
|
129,966
|
|
159,565
|
|
||||
|
Less current maturities
|
656
|
|
10,386
|
|
||||
|
Long-term portion
|
$
|
129,310
|
|
$
|
149,179
|
|
||
56
The maturities of long-term debt are as follows:
|
|
December 31, 2017
|
|||
|
2018
|
$
|
656
|
|
|
|
2019
|
576
|
|
||
|
2020
|
128,734
|
|
||
|
2021
|
—
|
|
||
|
2022
|
—
|
|
||
|
2023 and thereafter
|
—
|
|
||
|
Total
|
$
|
129,966
|
|
|
Borrowings
United States
On November 7, 2016, the Company, its domestic subsidiaries, and certain of its Canadian subsidiaries entered into the Second Amendment (the “Second Amendment”) to the Second Amended and Restated Credit Agreement dated March 13, 2015 and as amended by the First Amendment dated June 29, 2016 (the “Amended and Restated Credit Agreement”), with PNC Bank, N.A., Bank of America, N.A., Wells Fargo Bank, N.A., Citizens Bank of Pennsylvania, and Branch Banking and Trust Company. This Second Amendment modifies the Amended and Restated Credit Agreement which had a maximum revolving credit line of
$275,000
. The Second Amendment reduces the permitted revolving credit borrowings to
$195,000
and provides for additional term loan borrowing of
$30,000
(“Term Loan”). The Term Loan was subject to quarterly straight line amortization until the scheduled maturity of
January 1, 2020
. Furthermore, certain matters, including excess cash flow, asset sales, and equity issuances, triggered mandatory prepayments to the Term Loan. Term Loan borrowings were not available to draw upon following repayment. During
2017
, the Company paid off the balance of the Term Loan. Capitalized terms used but not defined herein shall have the meanings ascribed to them in the Second Amendment or Amended and Restated Credit Agreement, as applicable.
The Second Amendment further provides for modifications to the financial covenants as defined in the Amended and Restated Credit Agreement. The Second Amendment calls for the elimination of the Maximum Leverage Ratio covenant through the quarter ending June 30, 2018. After that period, the Maximum Gross Leverage Ratio covenant will be reinstated to require a maximum ratio of
4.25
Consolidated Indebtedness to
1.00
Gross Leverage for the quarter ending September 30, 2018, and
3.75
to
1.00
for all periods thereafter until the maturity date of the credit facility of March 13, 2020. The Second Amendment also includes a Minimum Last Twelve Months EBITDA covenant (“Minimum EBITDA”). For the quarter ended
December 31, 2016
through the quarter ended June 30, 2017, the Minimum EBITDA had to be at least
$18,500
. For each quarter thereafter, through the quarter ending June 30, 2018, the Minimum EBITDA requirement will increase by various increments. The incremental Minimum EBITDA requirement for the period ended
December 31, 2017
was at least
$25,000
. At June 30, 2018, the Minimum EBITDA requirement will be
$31,000
. After the quarter ending June 30, 2018, the Minimum EBITDA covenant will be eliminated through the maturity of the credit agreement. The Second Amendment also includes a Minimum Fixed Charge Coverage Ratio covenant. The covenant represents the ratio of the Company’s fixed charges to the last twelve months of EBITDA, and is required to be a minimum of
1.00
to
1.00
through the quarter ended December 31, 2017 and
1.25
to
1.00
for each quarter thereafter through the maturity of the credit facility. The final financial covenant included in the Second Amendment is a Minimum Liquidity covenant which calls for a minimum of
$25,000
in undrawn availability on the revolving credit loan at all times through the quarter ending June 30, 2018.
The Second Amendment includes several changes to certain non-financial covenants as defined in the Credit Agreement. Through the maturity date of the agreement, the Company has been prohibited from making any future acquisitions. The limitation on permitted annual distributions of dividends or redemptions of the Company’s stock was decreased from
$4,000
to
$1,700
. The aggregate limitation on loans to and investments in non-loan parties was decreased from
$10,000
to
$5,000
. Furthermore, the limitation on asset sales was decreased from
$25,000
annually with a carryover of up to
$15,000
from the prior year to
$25,000
in the aggregate through the maturity date of the credit facility. At
December 31, 2017
, the Company was in compliance with the covenants in the Second Amendment.
The Second Amendment provides for the elimination of the three lowest tiers of the pricing grid that had previously been defined in the First Amendment. Upon execution of the Second Amendment through the quarter ending March 31, 2018, the Company will be locked into the highest tier of the pricing grid which provides for pricing of the prime rate plus
225
basis points on base rate loans and the applicable LIBOR rate plus
325
basis points on euro rate loans. For each quarter after March 31, 2018 and through the maturity date of the credit facility, the Company’s position on the pricing grid will be governed by a Minimum Net Leverage ratio which is the ratio of Consolidated Indebtedness less cash on hand in excess of
$15,000
to EBITDA. If, after March 31, 2018 the Minimum Net Leverage ratio positions the Company on the lowest tier of the pricing
57
grid, pricing will be the prime rate plus
150
basis points on base rate loans or the applicable LIBOR rate plus
250
basis points on euro rate loans.
At
December 31, 2017
and
2016
, the Company had outstanding letters of credit of approximately
$425
and had net available borrowing capacity of
$41,105
and
$67,502
, respectively. The maturity date of the facility is March 13, 2020.
United Kingdom
A subsidiary of the Company has a credit facility with NatWest Bank for its United Kingdom operations that includes an overdraft availability of
£1,500
pounds sterling (approximately
$2,027
at
December 31, 2017
). This credit facility supports the United Kingdom’s working capital requirements and is collateralized by substantially all of the assets of the subsidiary's operations. The interest rate on this facility is the financial institution’s base rate plus
2.50%
. Outstanding performance bonds reduce availability under this credit facility. There were
no
outstanding borrowings under this credit facility at
December 31, 2017
, however, there were
$533
in outstanding guarantees (as defined in the underlying agreement) at
December 31, 2017
. This credit facility was renewed and amended during the fourth quarter of
2017
with all underlying terms and conditions remaining unchanged as a result of the renewal. It is the Company’s intention to renew this credit facility with NatWest Bank during the annual review in
2018
.
The United Kingdom loan agreements contain certain financial covenants that require the subsidiary to maintain senior interest and cash flow coverage ratios. The subsidiary was in compliance with these financial covenants at
December 31, 2017
and
2016
. The subsidiary had available borrowing capacity of
$1,494
and
$1,650
at
December 31, 2017
and
2016
, respectively.
Note 11.
Stockholders’ Equity
The Company had authorized shares of
20,000,000
in common stock with
11,115,779
shares issued at
December 31, 2017
and
2016
. The common stock has a par value of
$0.01
per share and the Company paid dividends of
$0.04
per share for each of the first three quarters of
2016
and suspended dividend payments during the fourth quarter of
2016
, which continued throughout
2017
.
At
December 31, 2017
and
2016
, the Company had authorized shares of
5,000,000
in preferred stock.
No
preferred stock has been issued.
No
par value has been assigned to the preferred stock.
On December 4, 2013, the Company’s Board of Directors authorized the purchase of up to
$15,000
in shares of its common stock through a share repurchase program at prevailing market prices or privately negotiated transactions. The Company repurchased
80,512
shares, for an aggregate price of
$1,587
, during 2015 under the repurchase program. On December 9, 2015, the Board of Directors authorized the repurchase of up to
$30,000
of the Company’s common shares until
December 31, 2017
. This authorization became effective January 1, 2016 and replaced the prior authorization. The Second Amendment limits the amount of common shares that the Company can repurchase. The Company repurchased
5,000
shares, for an aggregate price of
$67
, during
2016
under the repurchase program. There were
no
repurchases under the program for the year ended
December 31, 2017
. Approximately
$29,933
remained of our
$30,000
share repurchase program that was announced December 9, 2015 and expired on December 31, 2017.
At
December 31, 2017
and
2016
, the Company withheld
7,277
and
20,186
shares for approximately
$103
and
$275
, respectively, from employees to pay their withholding taxes in connection with the exercise and/or vesting of stock options and restricted stock awards.
Cash dividends of
$0
,
$1,244
, and
$1,656
were declared and paid in
2017
,
2016
, and
2015
, respectively.
|
|
Common Stock
|
|||||
|
Treasury
|
Outstanding
|
|||||
|
Share Activity
|
(Number of Shares)
|
|||||
|
Balance at end of 2014
|
873,374
|
|
10,242,405
|
|
||
|
Issued for stock-based compensation plans
|
(59,113
|
)
|
59,113
|
|
||
|
Repurchased common stock
|
80,512
|
|
(80,512
|
)
|
||
|
Balance at end of 2015
|
894,773
|
|
10,221,006
|
|
||
|
Issued for stock-based compensation plans
|
(96,619
|
)
|
96,619
|
|
||
|
Repurchased common stock
|
5,000
|
|
(5,000
|
)
|
||
|
Balance at end of 2016
|
803,154
|
|
10,312,625
|
|
||
|
Issued for stock-based compensation plans
|
(27,951
|
)
|
27,951
|
|
||
|
Balance at end of 2017
|
775,203
|
|
10,340,576
|
|
||
58
Note 12.
Accumulated Other Comprehensive Loss
The components of accumulated other comprehensive loss, net of tax, for the years ended
December 31, 2017
and
2016
, are as follows:
|
2017
|
2016
|
|||||||
|
Pension and post-retirement benefit plan adjustments
|
$
|
(3,367
|
)
|
$
|
(4,439
|
)
|
||
|
Unrealized gain (loss) on interest rate swap contracts
|
222
|
|
(204
|
)
|
||||
|
Foreign currency translation adjustments
|
(14,622
|
)
|
(20,646
|
)
|
||||
|
$
|
(17,767
|
)
|
$
|
(25,289
|
)
|
|||
Foreign currency translation adjustments are generally not adjusted for income taxes as they relate to indefinite investments in non U.S. subsidiaries. See Note 14 Income Taxes for further information.
Note 13.
Earnings Per Common Share
(Share amounts in thousands)
The following table sets forth the computation of basic and diluted earnings per common share for the three years ended December 31:
|
2017
|
2016
|
2015
|
||||||||||
|
Numerator for basic and diluted earnings (loss) per common share:
|
||||||||||||
|
Net income (loss)
|
$
|
4,113
|
|
$
|
(141,660
|
)
|
$
|
(44,445
|
)
|
|||
|
Denominator:
|
||||||||||||
|
Weighted average shares outstanding
|
10,334
|
|
10,273
|
|
10,254
|
|
||||||
|
Denominator for basic earnings per common share
|
10,334
|
|
10,273
|
|
10,254
|
|
||||||
|
Effect of dilutive securities:
|
||||||||||||
|
Stock compensation plans
|
149
|
|
—
|
|
—
|
|
||||||
|
Dilutive potential common shares
|
149
|
|
—
|
|
—
|
|
||||||
|
Denominator for diluted earnings per common share - adjusted weighted average shares outstanding and assumed conversions
|
10,483
|
|
10,273
|
|
10,254
|
|
||||||
|
Basic earnings (loss) per common share
|
$
|
0.40
|
|
$
|
(13.79
|
)
|
$
|
(4.33
|
)
|
|||
|
Diluted earnings (loss) per common share
|
$
|
0.39
|
|
$
|
(13.79
|
)
|
$
|
(4.33
|
)
|
|||
|
Dividends paid per common share
|
$
|
—
|
|
$
|
0.12
|
|
$
|
0.16
|
|
|||
There were
143
and
130
anti-dilutive shares in
2016
and
2015
, respectively, that were excluded from the above calculation.
59
Note 14.
Income Taxes
Income (loss) before income taxes, as shown in the accompanying consolidated statements of operations, includes the following components:
|
2017
|
2016
|
2015
|
||||||||||
|
Domestic
|
$
|
2,072
|
|
$
|
(151,027
|
)
|
$
|
(55,061
|
)
|
|||
|
Foreign
|
5,970
|
|
3,858
|
|
4,484
|
|
||||||
|
Income (loss) from operations, before income taxes
|
$
|
8,042
|
|
$
|
(147,169
|
)
|
$
|
(50,577
|
)
|
|||
Significant components of the provision for income taxes are as follows:
|
2017
|
2016
|
2015
|
||||||||||
|
Current:
|
||||||||||||
|
Federal
|
$
|
2,630
|
|
$
|
(9,980
|
)
|
$
|
5,571
|
|
|||
|
State
|
822
|
|
(487
|
)
|
1,540
|
|
||||||
|
Foreign
|
2,460
|
|
1,583
|
|
1,339
|
|
||||||
|
Total current
|
5,912
|
|
(8,884
|
)
|
8,450
|
|
||||||
|
Deferred:
|
||||||||||||
|
Federal
|
(1,559
|
)
|
2,555
|
|
(12,016
|
)
|
||||||
|
State
|
17
|
|
706
|
|
(2,014
|
)
|
||||||
|
Foreign
|
(441
|
)
|
114
|
|
(552
|
)
|
||||||
|
Total deferred
|
(1,983
|
)
|
3,375
|
|
(14,582
|
)
|
||||||
|
Total income tax expense (benefit)
|
$
|
3,929
|
|
$
|
(5,509
|
)
|
$
|
(6,132
|
)
|
|||
The reconciliation of income tax computed at statutory rates to income tax expense (benefit) is as follows:
|
|
2017
|
2016
|
2015
|
||||||||||||||||||
|
|
Amount
|
Percent
|
Amount
|
Percent
|
Amount
|
Percent
|
|||||||||||||||
|
Statutory rate
|
$
|
2,815
|
|
35.0
|
%
|
$
|
(51,509
|
)
|
35.0
|
%
|
$
|
(17,702
|
)
|
35.0
|
%
|
||||||
|
Foreign tax rate differential
|
(717
|
)
|
(8.9
|
)
|
(485
|
)
|
0.3
|
|
(419
|
)
|
0.8
|
|
|||||||||
|
State income taxes, net of federal benefit
|
368
|
|
4.6
|
|
(2,893
|
)
|
2.0
|
|
(159
|
)
|
0.3
|
|
|||||||||
|
Non-deductible goodwill impairment
|
—
|
|
—
|
|
11,448
|
|
(7.8
|
)
|
12,737
|
|
(25.2
|
)
|
|||||||||
|
Non-deductible expenses
|
323
|
|
4.0
|
|
262
|
|
(0.2
|
)
|
452
|
|
(0.9
|
)
|
|||||||||
|
Domestic production activities deduction
|
(405
|
)
|
(5.0
|
)
|
700
|
|
(0.5
|
)
|
(507
|
)
|
1.0
|
|
|||||||||
|
U.S. Tax Cuts and Jobs Act: remeasurement of deferred taxes
|
10,260
|
|
127.6
|
|
—
|
|
—
|
|
—
|
|
—
|
|
|||||||||
|
U.S. Tax Cuts and Jobs Act: deferred foreign earnings
|
4,009
|
|
49.9
|
|
—
|
|
—
|
|
—
|
|
—
|
|
|||||||||
|
Tax on unremitted foreign earnings
|
(6,712
|
)
|
(83.5
|
)
|
7,932
|
|
(5.4
|
)
|
—
|
|
—
|
|
|||||||||
|
Change in valuation allowance
|
(6,023
|
)
|
(74.9
|
)
|
29,719
|
|
(20.2
|
)
|
—
|
|
—
|
|
|||||||||
|
Other
|
11
|
|
0.1
|
|
(683
|
)
|
0.5
|
|
(534
|
)
|
1.1
|
|
|||||||||
|
Total income tax expense (benefit) / Effective rate
|
$
|
3,929
|
|
48.9
|
%
|
$
|
(5,509
|
)
|
3.7
|
%
|
$
|
(6,132
|
)
|
12.1
|
%
|
||||||
60
Significant components of the Company’s deferred tax assets and liabilities at
December 31, 2017
and
2016
are as follows:
|
2017
|
2016
|
|||||||
|
Deferred tax assets:
|
||||||||
|
Goodwill and other intangibles
|
$
|
19,324
|
|
$
|
32,699
|
|
||
|
Pension and post-retirement liability
|
1,532
|
|
2,186
|
|
||||
|
Warranty reserve
|
2,060
|
|
3,633
|
|
||||
|
Deferred compensation
|
2,385
|
|
1,227
|
|
||||
|
Contingent liabilities
|
1,669
|
|
2,336
|
|
||||
|
Net operating loss / tax credit carryforwards
|
1,816
|
|
1,384
|
|
||||
|
Other
|
1,442
|
|
2,190
|
|
||||
|
Total deferred tax assets
|
30,228
|
|
45,655
|
|
||||
|
Less: valuation allowance
|
(23,696
|
)
|
(29,719
|
)
|
||||
|
Net deferred tax assets
|
6,532
|
|
15,936
|
|
||||
|
Deferred tax liabilities:
|
||||||||
|
Goodwill and other intangibles
|
(5,721
|
)
|
(6,087
|
)
|
||||
|
Depreciation
|
(7,079
|
)
|
(10,586
|
)
|
||||
|
Unremitted earnings of foreign subsidiaries
|
(1,220
|
)
|
(7,932
|
)
|
||||
|
Inventories
|
(1,743
|
)
|
(1,506
|
)
|
||||
|
Other
|
(513
|
)
|
(1,196
|
)
|
||||
|
Total deferred tax liabilities
|
(16,276
|
)
|
(27,307
|
)
|
||||
|
Net deferred tax liabilities
|
$
|
(9,744
|
)
|
$
|
(11,371
|
)
|
||
The Tax Cuts and Jobs Act (the “Act”) was enacted on December 22, 2017. The Act reduces the U.S. federal corporate tax rate from
35%
to
21%
, requires companies to pay a one-time transition tax on earnings of certain foreign subsidiaries that were previously tax deferred and creates new taxes on certain foreign sourced earnings. At December 31, 2017, we have not completed our accounting for the tax effects of enactment of the Act; however, in certain cases, as described below, we have made a reasonable estimate of the effects on our existing deferred tax balances and the one-time transition tax. The provisional tax benefit related to the remeasurement of certain deferred tax assets and liabilities was
$1,508
, and was included as a component of income tax expense from continuing operations. The provisional tax expense related to the one-time transition tax on mandatory deemed repatriation of foreign earnings, and related items, was
$3,298
based on cumulative foreign earnings of
$65,113
and was also included as a component of income tax expense from continuing operations. In all cases, we will continue to make and refine our calculations as additional analysis is completed. Our estimates may be adjusted in future periods throughout 2018 as we gain a more thorough understanding of the tax law, as further guidance is issued, and as we evaluate our income tax accounting policies with regard to certain provisions of the Act.
A provisional estimate could not be made for the global intangible low-taxed income ("GILTI") provisions of the Act, as the Company has not yet completed its assessment or elected an accounting policy to either recognize deferred taxes for basis differences expected to reverse as GILTI or to record GILTI as period costs if and when incurred. Additional information is necessary to prepare a more detailed analysis of the Company's deferred tax assets and liabilities and historical foreign earnings, as well as potential correlative adjustments.
Each quarter, management reviews operations and liquidity needs in each jurisdiction to assess the Company’s intent to reinvest foreign earnings outside of the United States. At
December 31, 2017
, management determined that cash balances of its Canadian and United Kingdom subsidiaries exceeded projected capital needs by
$30,200
. Management does not intend for such amounts to be permanently reinvested outside of the United States and has therefore accrued foreign withholding taxes of
$1,220
at
December 31, 2017
.
At
December 31, 2017
, the Company has not recorded deferred U.S. income taxes or foreign withholding taxes on remaining undistributed foreign earnings of
$2,318
. It is management's intent and practice to indefinitely reinvest such earnings outside of the United States. Determination of the amount of any unrecognized deferred income tax liability associated with these undistributed earnings is not practicable because of the complexities of the hypothetical calculation.
A valuation allowance is required to be established or maintained when, based on currently available information and other factors, it is more likely than not that all or a portion of a deferred tax asset will not be realized. The Company has
61
considered all available evidence, both positive and negative, in assessing the need for a valuation allowance in each jurisdiction.
The negative evidence considered in evaluating U.S. deferred tax assets included cumulative financial losses over the
three-year period ended December 31, 2017
and the inability to consistently achieve forecasted results. Positive evidence considered included the composition and reversal patterns of existing taxable and deductible temporary differences between financial reporting and tax, as well as the composition of financial losses. Cumulative financial losses over the
three-year period ended December 31, 2017
were a significant piece of objective negative evidence, and typically limit a Company’s ability to consider other subjective evidence. Based on our evaluation, a valuation allowance of
$23,696
was recorded at
December 31, 2017
to recognize only the amount of deferred tax assets more likely than not to be realized. The amount of deferred tax assets considered realizable, however, could be adjusted if objective negative evidence in the form of cumulative financial losses is no longer present, and additional weight is given to subjective evidence such as our projections for growth.
At
December 31, 2017
and
2016
, the tax benefit of net operating loss carryforwards available for state income tax purposes was
$1,708
and
$1,378
, respectively. The state net operating loss carryforwards will expire in various years through
2037
. We believe it is more likely than not that the tax benefit from state operating loss carryforwards will not be realized. In recognition of this risk, we have provided a valuation allowance of
$1,708
against deferred tax assets related to state operating loss carryforwards at
December 31, 2017
.
At
December 31, 2017
, the Company has net operating loss carryforwards in certain foreign jurisdictions of
$1,363
, which may be carried forward indefinitely. The foreign jurisdictions have incurred cumulative financial losses over the
three-year period ended December 31, 2017
and have projected future taxable losses. We believe it is more likely than not that the tax benefit from these loss carryforwards will not be realized. In recognition of this risk, we have provided a valuation allowance of
$481
, collectively, against deferred tax assets in foreign jurisdictions at
December 31, 2017
.
The determination to record or not record a valuation allowance involves management judgment, based on the consideration of positive and negative evidence available at the time of the assessment. Management will continue to assess the realization of its deferred tax assets based upon future evidence, and may record adjustments to valuation allowances against deferred tax assets in future periods, as appropriate, that could materially impact net income.
The following table provides a reconciliation of unrecognized tax benefits at
December 31, 2017
and
2016
:
|
2017
|
2016
|
|||||||
|
Unrecognized tax benefits at beginning of period:
|
$
|
619
|
|
$
|
582
|
|
||
|
Increases based on tax positions for prior periods
|
—
|
|
37
|
|
||||
|
Decreases based on tax positions for prior periods
|
(20
|
)
|
—
|
|
||||
|
Balance at end of period
|
$
|
599
|
|
$
|
619
|
|
||
The total amount of unrecognized tax benefits that, if recognized, would affect the effective tax rate is
$599
at
December 31, 2017
. The Company accrues interest and penalties related to unrecognized tax benefits in its provision for income taxes. At
December 31, 2017
and
2016
, the Company had accrued interest and penalties related to unrecognized tax benefits of
$500
and
$464
, respectively. At
December 31, 2017
, the Company does not expect any material increases or decreases to its unrecognized tax benefits within the next
12 months
. Ultimate realization of this decrease is dependent upon the occurrence of certain events, including the completion of audits by tax authorities and expiration of statutes of limitations.
The Company files income tax returns in the United States and in various state, local, and foreign jurisdictions. The Company is subject to federal income tax examinations for the
2014
period and thereafter. With respect to the state, local, and foreign filings, certain entities of the Company are subject to income tax examinations for the
2013
period and thereafter.
Note 15.
Stock-based Compensation
The Company applies the provisions of FASB ASC 718, “Compensation - Stock Compensation,” to account for the Company’s stock-based compensation. Stock-based compensation cost is measured at the grant date based on the calculated fair value of the award and is recognized over the employees’ requisite service period. The Company recorded stock-based compensation expense of
$1,696
,
$1,346
, and
$1,471
for the years ended
December 31, 2017
,
2016
, and
2015
, respectively, related to fully-vested stock awards, restricted stock awards, and performance unit awards. At
December 31, 2017
, unrecognized compensation expense for awards the Company expects to vest approximated
$3,687
. The Company will recognize this expense over the upcoming
3.3
year period through March 2021.
Shares issued as a result of vested stock-based compensation generally will be from previously issued shares that have been reacquired by the Company and held as Treasury stock or authorized but previously unissued common stock.
62
The Company realized reductions in excess tax benefits of
$0
and
$332
for the years ended
December 31, 2017
and
2016
, respectively, and excess tax benefits for the tax deduction from stock-based compensation of
$253
for the year ended
December 31, 2015
. This excess tax benefit or deficiency is included in "Cash flows from financing activities" in the Consolidated Statements of Cash Flows for the years ended
December 31, 2016
and
2015
. Applying the prospective approach in accordance with FASB ASU 2016-09, a charge of
$127
was recorded in "Income tax expense" in the Consolidated Statements of Operations, and is now included in "Cash flows from operating activities" for the
twelve months ended December 31, 2017
in the Consolidated Statements of Cash Flows.
At
December 31, 2017
, the Company had stock awards issued pursuant to the 2006 Omnibus Incentive Plan, as amended and restated in May 2016 (“Omnibus Plan”). The Omnibus Plan allows for the issuance of
1,270,000
shares of common stock through the granting of stock options or stock awards (including performance units convertible into stock) to key employees and directors at no less than 100% of fair market value on the date of the grant. The Omnibus Plan provides for the granting of “nonqualified options” with a duration of not more than ten years from the date of grant. The Omnibus Plan also provides that, unless otherwise set forth in the option agreement, stock options are exercisable in installments of up to 25% annually beginning one year from the date of grant.
No
stock options have been granted under the Omnibus Plan and, as such, there was
no
stock-based compensation expense related to stock options recorded in
2017
,
2016
, or
2015
.
Stock Option Awards
No
stock options were outstanding during the years ended
December 31, 2017
and
2016
. Certain information for the year ended
December 31, 2015
relative to employee stock options is summarized as follows:
|
2015
|
|||
|
Number of shares under the plans:
|
|||
|
Outstanding and exercisable at beginning of year
|
7,500
|
|
|
|
Granted
|
—
|
|
|
|
Canceled
|
—
|
|
|
|
Exercised
|
(7,500
|
)
|
|
|
Outstanding and exercisable at end of year
|
—
|
|
|
The weighted average exercise price per share of the stock options exercised in
2015
was
$9.08
. The total intrinsic value of stock options exercised during the years ended
December 31, 2015
was
$253
.
Fully-Vested Stock Awards
Non-employee directors are automatically awarded fully vested shares of the Company’s common stock on each date the non-employee directors are elected at the annual shareholders’ meeting to serve as directors. During the quarter ended June 30, 2017, the Nomination and Governance Committee and Board of Directors jointly approved the Deferred Compensation Plan for Non-Employee Directors under the 2006 Omnibus Incentive Plan, which permits non-employee directors of the Company to defer receipt of earned cash and/or stock compensation for service on the Board.
The non-employee directors were granted a total of
39,280
,
59,598
, and
14,000
fully-vested shares for the years ended
December 31, 2017
,
2016
, and
2015
, respectively. Compensation expense recorded by the Company related to fully-vested stock awards to non-employee directors was approximately
$704
,
$698
, and
$534
for the years ended
December 31, 2017
,
2016
, and
2015
, respectively. During
2017
,
26,860
deferred share units were allotted to the accounts of the non-employee directors pursuant to the Deferred Compensation Plan for Non-Employee Directors.
The weighted average fair value of all the fully-vested stock grants awarded was
$17.92
,
$11.72
, and
$38.15
per share for
2017
,
2016
, and
2015
, respectively.
Restricted Stock Awards and Performance Unit Awards
Under the 2006 Omnibus Plan, the Company grants eligible employees restricted stock and performance unit awards. The forfeitable restricted stock awards granted prior to March 2015 generally time-vest after a
four
-year period, and those granted subsequent to March 2015 generally time-vest ratably over a
three
-year period, unless indicated otherwise by the underlying restricted stock agreement. Performance unit awards are offered annually under separate
three
-year long-term incentive programs. Performance units are subject to forfeiture and will be converted into common stock of the Company based upon the Company’s performance relative to performance measures and conversion multiples as defined in the underlying program. If the Company’s estimate of the number of performance stock awards expected to vest changes in a subsequent accounting period, cumulative compensation expense could increase or decrease. The change will be recognized in the current period for the vested shares and would change future expense over the remaining vesting period.
63
The following table summarizes the restricted stock award, deferred stock, and performance unit award activity for the three-year periods ended
December 31, 2017
,
2016
, and
2015
:
|
Restricted
Stock |
Deferred
Stock |
Performance
Stock Units |
Weighted Average
Aggregate Grant Date Fair Value |
||||||||||
|
Outstanding at January 1, 2015
|
108,237
|
|
—
|
|
71,990
|
|
$
|
36.25
|
|
||||
|
Granted
|
29,656
|
|
—
|
|
41,114
|
|
44.93
|
|
|||||
|
Vested
|
(39,076
|
)
|
—
|
|
(23,877
|
)
|
32.35
|
|
|||||
|
Adjustment for incentive awards expected to vest
|
—
|
|
—
|
|
(53,228
|
)
|
43.26
|
|
|||||
|
Canceled and forfeited
|
(5,000
|
)
|
—
|
|
—
|
|
44.84
|
|
|||||
|
Outstanding at December 31, 2015
|
93,817
|
|
—
|
|
35,999
|
|
$
|
39.66
|
|
||||
|
Granted
|
48,283
|
|
—
|
|
129,844
|
|
12.50
|
|
|||||
|
Vested
|
(56,807
|
)
|
—
|
|
—
|
|
28.45
|
|
|||||
|
Adjustment for incentive awards not expected to vest
|
—
|
|
—
|
|
(93,103
|
)
|
24.79
|
|
|||||
|
Canceled and forfeited
|
(6,021
|
)
|
—
|
|
(9,050
|
)
|
18.82
|
|
|||||
|
Outstanding at December 31, 2016
|
79,272
|
|
—
|
|
63,690
|
|
$
|
21.66
|
|
||||
|
Granted
|
175,196
|
|
26,860
|
|
120,583
|
|
14.46
|
|
|||||
|
Vested
|
(22,808
|
)
|
—
|
|
—
|
|
28.88
|
|
|||||
|
Adjustment for incentive awards not expected to vest
|
—
|
|
—
|
|
46,130
|
|
19.00
|
|
|||||
|
Canceled and forfeited
|
(44,854
|
)
|
—
|
|
(49,062
|
)
|
15.40
|
|
|||||
|
Outstanding at December 31, 2017
|
186,806
|
|
26,860
|
|
181,341
|
|
$
|
16.53
|
|
||||
Performance units are subject to forfeiture and will be converted into common stock of the Company based upon the Company’s performance relative to performance measures and conversion multiples as defined in the underlying plan. The aggregate fair value in the above table is based upon achieving 100% of the performance targets as defined in the underlying plan.
Excluding the fully-vested stock awards granted to non-employee directors, the Company recorded stock-based compensation expense of
$1,499
,
$648
, and
$937
, respectively, for the periods ended
December 31, 2017
,
2016
, and
2015
related to restricted stock and performance unit awards. The following table presents the number of shares available for future grants:
|
2017
|
2016
|
2015
|
|||||||
|
Number of shares available for future grant:
|
|||||||||
|
Beginning of year
|
675,447
|
|
407,307
|
|
469,840
|
|
|||
|
End of year
|
639,390
|
|
675,447
|
|
407,307
|
|
|||
Note 16.
Retirement Plans
The Company has
three
retirement plans that cover its hourly and salaried employees in the United States:
one
defined benefit plan, which is frozen, and
two
defined contribution plans. On December 31, 2017, the Company consolidated its three United States defined benefit plans into one United States defined benefit plan and consolidated its prior four United States defined contribution plans into two United States defined contribution plans. Employees are eligible to participate in the appropriate plan based on employment classification. The Company’s contributions to the defined benefit and defined contribution plans are governed by the Employee Retirement Income Security Act of 1974 (“ERISA”) and the Company’s policy and investment guidelines of the applicable plan. The Company’s policy is to contribute at least the minimum in accordance with the funding standards of ERISA.
Rail Technologies maintains
two
defined contribution plans for its employees in Canada, as well as a post-retirement benefit plan. In the United Kingdom, Rail Technologies maintains
two
defined contribution plans and a defined benefit plan, which is frozen. These plans are discussed in further detail below.
64
United States Defined Benefit Plan
The following tables present a reconciliation of the changes in the benefit obligation, the fair market value of the assets, and the funded status of the plan, as of
December 31, 2017
and
2016
:
|
2017
|
2016
|
|||||||
|
Changes in benefit obligation:
|
||||||||
|
Benefit obligation at beginning of year
|
$
|
18,241
|
|
$
|
17,759
|
|
||
|
Service cost
|
—
|
|
36
|
|
||||
|
Interest cost
|
684
|
|
746
|
|
||||
|
Actuarial loss
|
775
|
|
534
|
|
||||
|
Benefits paid
|
(917
|
)
|
(834
|
)
|
||||
|
Benefit obligation at end of year
|
$
|
18,783
|
|
$
|
18,241
|
|
||
|
Change to plan assets:
|
||||||||
|
Fair value of assets at beginning of year
|
$
|
14,180
|
|
$
|
14,235
|
|
||
|
Actual gain on plan assets
|
1,629
|
|
779
|
|
||||
|
Benefits paid
|
(917
|
)
|
(834
|
)
|
||||
|
Fair value of assets at end of year
|
14,892
|
|
14,180
|
|
||||
|
Funded status at end of year
|
$
|
(3,891
|
)
|
$
|
(4,061
|
)
|
||
|
Amounts recognized in the consolidated balance sheet consist of:
|
||||||||
|
Other long-term liabilities
|
$
|
(3,891
|
)
|
$
|
(4,061
|
)
|
||
|
Amounts recognized in accumulated other comprehensive income consist of:
|
||||||||
|
Net loss
|
$
|
3,913
|
|
$
|
4,186
|
|
||
The actuarial loss included in accumulated other comprehensive loss that will be recognized in net periodic pension cost during
2018
is
$96
, before taxes.
Net periodic pension costs for the three years ended
December 31, 2017
are as follows:
|
2017
|
2016
|
2015
|
||||||||||
|
Components of net periodic benefit cost:
|
||||||||||||
|
Service cost
|
$
|
—
|
|
$
|
36
|
|
$
|
38
|
|
|||
|
Interest cost
|
684
|
|
746
|
|
742
|
|
||||||
|
Expected return on plan assets
|
(710
|
)
|
(717
|
)
|
(816
|
)
|
||||||
|
Amortization of prior service cost
|
—
|
|
—
|
|
3
|
|
||||||
|
Recognized net actuarial loss
|
130
|
|
276
|
|
275
|
|
||||||
|
Net periodic pension cost
|
$
|
104
|
|
$
|
341
|
|
$
|
242
|
|
|||
The weighted average assumptions in the following table represent the rates used to develop the actuarial present value of the projected benefit obligation for the year listed and also the net periodic benefit cost for the following year.
|
2017
|
2016
|
2015
|
|||||||
|
Discount rate
|
3.9
|
%
|
4.3
|
%
|
4.3
|
%
|
|||
|
Expected rate of return on plan assets
|
5.9
|
%
|
5.2
|
%
|
5.2
|
%
|
|||
The expected long-term rate of return is based on numerous factors including the target asset allocation for plan assets, historical rate of return, long-term inflation assumptions, and current and projected market conditions. The increase in the expected rate of return on plan assets reflects the expected increased corporate shareholder returns resulting from the Tax Cuts and Jobs Act of 2017.
65
Amounts applicable to the Company’s pension plan with accumulated benefit obligations in excess of plan assets are as follows at December 31:
|
2017
|
2016
|
|||||||
|
Projected benefit obligation
|
$
|
18,783
|
|
$
|
18,241
|
|
||
|
Accumulated benefit obligation
|
18,783
|
|
18,241
|
|
||||
|
Fair value of plan assets
|
14,892
|
|
14,180
|
|
||||
Plan assets consist primarily of various fixed income and equity investments. The Company’s primary investment objective is to provide long-term growth of capital while accepting a moderate level of risk. The investments are limited to cash and cash equivalents, bonds, preferred stocks, and common stocks. The investment target ranges and actual allocation of pension plan assets by major category at
December 31, 2017
and
2016
are as follows:
|
Target
|
2017
|
2016
|
||||||
|
Asset Category
|
||||||||
|
Cash and cash equivalents
|
0 - 10%
|
2
|
%
|
5
|
%
|
|||
|
Total fixed income funds
|
25 - 50
|
32
|
|
33
|
|
|||
|
Total mutual funds and equities
|
50 - 70
|
66
|
|
62
|
|
|||
|
Total
|
100
|
%
|
100
|
%
|
||||
In accordance with the fair value disclosure requirements of FASB ASC 820, “Fair Value Measurements and Disclosures,” the following assets were measured at fair value on a recurring basis at
December 31, 2017
and
2016
. Additional information regarding FASB ASC 820 and the fair value hierarchy can be found in Note 18 Fair Value Measurements.
|
2017
|
2016
|
|||||||
|
Asset Category
|
||||||||
|
Cash and cash equivalents
|
$
|
284
|
|
$
|
660
|
|
||
|
Fixed income funds
|
||||||||
|
Corporate bonds
|
4,755
|
|
4,767
|
|
||||
|
Total fixed income funds
|
4,755
|
|
4,767
|
|
||||
|
Equity funds and equities
|
||||||||
|
Mutual funds
|
712
|
|
8,753
|
|
||||
|
Exchange-Traded Funds (“ETF”)
|
9,141
|
|
—
|
|
||||
|
Total mutual funds and equities
|
9,853
|
|
8,753
|
|
||||
|
Total
|
$
|
14,892
|
|
$
|
14,180
|
|
||
Cash equivalents.
The Company uses quoted market prices to determine the fair value of these investments in interest-bearing cash accounts and they are classified in Level 1 of the fair value hierarchy. The carrying amounts approximate fair value because of the short maturity of the instruments.
Fixed income funds.
Investments within the fixed income funds category consist of fixed income corporate debt. The Company uses quoted market prices to determine the fair values of these fixed income funds. These instruments consist of exchange-traded government and corporate bonds and are classified in Level 1 of the fair value hierarchy.
Equity funds and equities.
The valuation of investments in registered investment companies is based on the underlying investments in securities. Securities traded on security exchanges are valued at the latest quoted sales price. Securities traded in the over-the-counter market and listed securities for which no sale was reported on that date are valued at the average of the last reported bid and ask quotations. These investments are classified in Level 1 of the fair value hierarchy.
The Company currently does not anticipate contributions to its United States defined benefit plan in
2018
.
66
The following benefit payments are expected to be paid:
|
|
Pension
|
|||
|
|
Benefits
|
|||
|
2018
|
$
|
927
|
|
|
|
2019
|
996
|
|
||
|
2020
|
1,003
|
|
||
|
2021
|
1,058
|
|
||
|
2022
|
1,071
|
|
||
|
Years 2023-2027
|
5,608
|
|
||
United Kingdom Defined Benefit Plan
The Portec Rail Products (UK) Limited Pension Plan covers certain current employees, former employees, and retirees. The plan has been frozen to new entrants since April 1, 1997 and also covers the former employees of a merged plan after January 2002. Benefits under the plan were based on years of service and eligible compensation during defined periods of service. Our funding policy for the plan is to make minimum annual contributions required by applicable regulations.
The funded status of the United Kingdom defined benefit plan at
December 31, 2017
and
2016
is as follows:
|
2017
|
2016
|
|||||||
|
Changes in benefit obligation:
|
||||||||
|
Benefit obligation at beginning of year
|
$
|
8,104
|
|
$
|
7,862
|
|
||
|
Interest cost
|
236
|
|
259
|
|
||||
|
Actuarial (gain) loss
|
(451
|
)
|
1,532
|
|
||||
|
Benefits paid
|
(322
|
)
|
(273
|
)
|
||||
|
Foreign currency exchange rate changes
|
768
|
|
(1,276
|
)
|
||||
|
Benefit obligation at end of year
|
$
|
8,335
|
|
$
|
8,104
|
|
||
|
Change to plan assets:
|
||||||||
|
Fair value of assets at beginning of year
|
$
|
5,826
|
|
$
|
6,661
|
|
||
|
Actual gain on plan assets
|
573
|
|
265
|
|
||||
|
Employer contribution
|
276
|
|
253
|
|
||||
|
Benefits paid
|
(322
|
)
|
(273
|
)
|
||||
|
Foreign currency exchange rate changes
|
551
|
|
(1,080
|
)
|
||||
|
Fair value of assets at end of year
|
6,904
|
|
5,826
|
|
||||
|
Funded status at end of year
|
$
|
(1,431
|
)
|
$
|
(2,278
|
)
|
||
|
Amounts recognized in the consolidated balance sheet consist of:
|
||||||||
|
Other long-term liabilities
|
$
|
(1,431
|
)
|
$
|
(2,278
|
)
|
||
|
Amounts recognized in accumulated other comprehensive income consist of:
|
||||||||
|
Net loss
|
$
|
1,161
|
|
$
|
2,015
|
|
||
|
Prior service cost
|
39
|
|
53
|
|
||||
|
$
|
1,200
|
|
$
|
2,068
|
|
|||
Net periodic pension costs for the three years ended December 31 are as follows:
|
2017
|
2016
|
2015
|
||||||||||
|
Components of net periodic benefit cost:
|
||||||||||||
|
Interest cost
|
$
|
236
|
|
$
|
259
|
|
$
|
295
|
|
|||
|
Expected return on plan assets
|
(280
|
)
|
(290
|
)
|
(324
|
)
|
||||||
|
Amortization of prior service cost
|
19
|
|
17
|
|
27
|
|
||||||
|
Recognized net actuarial loss
|
192
|
|
275
|
|
225
|
|
||||||
|
Net periodic pension cost
|
$
|
167
|
|
$
|
261
|
|
$
|
223
|
|
|||
67
The weighted average assumptions in the following table represent the rates used to develop the actuarial present value of the projected benefit obligation for the year listed and also the net periodic benefit cost for the following year.
|
2017
|
2016
|
2015
|
|||||||
|
Discount rate
|
2.5
|
%
|
2.7
|
%
|
4.0
|
%
|
|||
|
Expected rate of return on plan assets
|
4.1
|
%
|
4.4
|
%
|
5.2
|
%
|
|||
Amounts applicable to the Company’s pension plans with accumulated benefit obligations in excess of plan assets are as follows at December 31:
|
2017
|
2016
|
|||||||
|
Projected benefit obligation
|
$
|
8,335
|
|
$
|
8,104
|
|
||
|
Accumulated benefit obligation
|
8,335
|
|
8,104
|
|
||||
|
Fair value of plan assets
|
6,904
|
|
5,826
|
|
||||
The Company has estimated the long-term rate of return on plan assets based primarily on historical returns on plan assets, adjusted for changes in target portfolio allocations, and recent changes in long-term interest rates based on publicly available information.
Plan assets are invested by the trustees in accordance with a written statement of investment principles. This statement permits investment in equities, corporate bonds, United Kingdom government securities, commercial property, and cash, based on certain target allocation percentages. Asset allocation is primarily based on a strategy to provide steady growth without undue fluctuations. The target asset allocation percentages for
2017
are as follows:
|
|
|
Portec Rail
|
|
|
|
Plan
|
|
Equity securities
|
|
Up to 100%
|
|
Commercial property
|
|
Not to exceed 50%
|
|
U.K. Government securities
|
|
Not to exceed 50%
|
|
Cash
|
|
Up to 100%
|
Plan assets held within the United Kingdom defined benefit plan consist of cash and marketable securities that have been classified as Level 1 of the fair value hierarchy. All other plan assets have been classified as Level 2 of the fair value hierarchy.
The plan assets by category for the two years ended
December 31, 2017
and
2016
are as follows:
|
2017
|
2016
|
|||||||
|
Asset Category
|
||||||||
|
Cash and cash equivalents
|
$
|
695
|
|
$
|
707
|
|
||
|
Equity securities
|
2,707
|
|
2,617
|
|
||||
|
Bonds
|
2,276
|
|
1,347
|
|
||||
|
Other
|
1,226
|
|
1,155
|
|
||||
|
Total
|
$
|
6,904
|
|
$
|
5,826
|
|
||
United Kingdom regulations require trustees to adopt a prudent approach to funding required contributions to defined benefit pension plans. The Company anticipates making contributions of
$253
to the United Kingdom defined benefit plan during
2018
.
68
The following estimated future benefits payments are expected to be paid under the United Kingdom defined benefit plan:
|
|
Pension
|
|||
|
|
Benefits
|
|||
|
2018
|
$
|
259
|
|
|
|
2019
|
275
|
|
||
|
2020
|
291
|
|
||
|
2021
|
299
|
|
||
|
2022
|
317
|
|
||
|
Years 2023-2027
|
2,040
|
|
||
Other Post-Retirement Benefit Plan
Rail Technologies’ operation near Montreal, Quebec, Canada, maintains a post-retirement benefit plan, which provides retiree life insurance, health care benefits, and, for a closed group of employees, dental care. Retiring employees with a minimum of
10
years of service are eligible for the plan benefits. The plan is not funded. Cost of benefits earned by employees is charged to expense as services are rendered. The expense related to this plan was not material for
2017
or
2016
. Rail Technologies’ accrued benefit obligation was
$1,104
and
$909
as of
December 31, 2017
and
2016
, respectively. This obligation is recognized within other long-term liabilities. Benefit payments anticipated for
2018
are not material.
The weighted average assumptions in the following table represent the rates used to develop the actuarial present value of the projected benefit obligation for the year listed and also the net periodic benefit cost for the following year.
|
2017
|
2016
|
|||||
|
Discount rate
|
3.6
|
%
|
4.0
|
%
|
||
|
Weighted average health care trend rate
|
5.1
|
%
|
5.1
|
%
|
||
The weighted average health care rate trends downward to an ultimate rate of
4.4%
in
2035
.
Defined Contribution Plans
The Company sponsors
six
defined contribution plans for hourly and salaried employees across our domestic and international facilities. The following table summarizes the expense associated with the contributions made to these plans.
|
Twelve Months Ended December 31,
|
||||||||||||
|
|
2017
|
2016
|
2015
|
|||||||||
|
United States
|
$
|
2,641
|
|
$
|
1,813
|
|
$
|
2,434
|
|
|||
|
Canada
|
223
|
|
225
|
|
226
|
|
||||||
|
United Kingdom
|
450
|
|
376
|
|
494
|
|
||||||
|
$
|
3,314
|
|
$
|
2,414
|
|
$
|
3,154
|
|
||||
Note 17.
Rental and Lease Information
The Company has capital and operating leases for certain plant facilities, office facilities, and equipment. Rental expense for the years ended
December 31, 2017
,
2016
, and
2015
amounted to
$5,278
,
$4,864
, and
$4,611
, respectively. Generally, land and building leases include escalation clauses.
69
The following is a schedule, by year, of the future minimum payments under capital and operating leases, together with the present value of the net minimum payments at
December 31, 2017
:
|
Capital
|
Operating
|
|||||||
|
Year ending December 31,
|
Leases
|
Leases
|
||||||
|
2018
|
$
|
711
|
|
$
|
4,483
|
|
||
|
2019
|
598
|
|
3,149
|
|
||||
|
2020
|
265
|
|
2,467
|
|
||||
|
2021
|
—
|
|
1,769
|
|
||||
|
2022
|
—
|
|
1,177
|
|
||||
|
2023 and thereafter
|
—
|
|
4,766
|
|
||||
|
Total minimum lease payments
|
1,574
|
|
$
|
17,811
|
|
|||
|
Less: amount representing interest
|
78
|
|
||||||
|
Total present value of minimum payments with interest rates ranging from 2.95% to 4.25%
|
$
|
1,496
|
|
|||||
Assets recorded under capital leases are as follows for the years ended
December 31, 2017
and
2016
:
|
2017
|
2016
|
|||||||
|
Machinery and equipment at cost
|
$
|
3,164
|
|
$
|
3,152
|
|
||
|
Less: accumulated amortization
|
1,066
|
|
829
|
|
||||
|
Net capital lease assets
|
$
|
2,098
|
|
$
|
2,323
|
|
||
Note 18.
Fair Value Measurements
The Company determines the fair value of assets and liabilities based on the exchange price that would be received for an asset or paid to transfer a liability (an exit price) in the principal or most advantageous market for the asset or liability in an orderly transaction between market participants. The fair values are based on assumptions that market participants would use when pricing an asset or liability, including assumptions about risk and the risks inherent in valuation techniques and the inputs to valuations. The fair value hierarchy is based on whether the inputs to valuation techniques are observable or unobservable. Observable inputs reflect market data obtained from independent sources, while unobservable inputs reflect the Company’s own assumptions of what market participants would use. The fair value hierarchy includes three levels of inputs that may be used to measure fair value as described below.
Level 1:
Quoted market prices in active markets for identical assets or liabilities.
Level 2:
Observable market-based inputs or unobservable inputs that are corroborated by market data.
Level 3:
Unobservable inputs that are not corroborated by market data.
The classification of a financial asset or liability within the hierarchy is determined based on the lowest level input that is significant to the fair value measurement.
The Company has an established process for determining fair value for its financial assets and liabilities, principally cash and cash equivalents and interest rate swaps. Fair value is based on quoted market prices, where available. If quoted market prices are not available, fair value is based on assumptions that use as inputs market-based parameters. The following section describes the valuation methodologies used by the Company to measure different financial instruments at fair value, including an indication of the level in the fair value hierarchy in which each instrument is generally classified. Where appropriate, the description includes details of the key inputs to the valuations and any significant assumptions.
Cash equivalents.
Included within “Cash and cash equivalents” are investments in non-domestic term deposits. The carrying amounts approximate fair value because of the short maturity of the instruments.
LIBOR-Based interest rate swaps
.
To reduce the impact of interest rate changes on outstanding variable-rate debt, the Company entered into forward starting LIBOR-based interest rate swaps with notional values totaling
$50,000
. The swaps became effective in February 2017 at which point they effectively converted a portion of the debt from variable to fixed-rate borrowings during the term of the swap contract. The fair value of the interest rate swaps is based on market-observable forward interest rates and represents the estimated amount that the Company would pay to terminate the agreements. As such, the swap agreements have been classified as Level 2 within the fair value hierarchy.
70
The following assets of the Company were measured at fair value on a recurring basis subject to the disclosure requirements of FASB ASC 820, “Fair Value Measurement,” at
December 31, 2017
and
December 31, 2016
:
|
|
Fair Value Measurements at Reporting Date
Using |
Fair Value Measurements at Reporting Date
Using |
|||||||||||||||||||||||||||||||
|
|
December 31, 2017
|
Quoted
Prices in Active Markets for Identical Assets (Level 1) |
Significant
Other Observable Inputs (Level 2) |
Significant
Unobservable Inputs (Level 3) |
December 31, 2016
|
Quoted
Prices in Active Markets for Identical Assets (Level 1) |
Significant
Other Observable Inputs (Level 2) |
Significant
Unobservable Inputs (Level 3) |
|||||||||||||||||||||||||
|
Term deposits
|
$
|
17
|
|
$
|
17
|
|
$
|
—
|
|
$
|
—
|
|
$
|
16
|
|
$
|
16
|
|
$
|
—
|
|
$
|
—
|
|
|||||||||
|
Interest rate swaps
|
222
|
|
—
|
|
222
|
|
—
|
|
—
|
|
—
|
|
—
|
|
—
|
|
|||||||||||||||||
|
Total assets
|
$
|
239
|
|
$
|
17
|
|
$
|
222
|
|
$
|
—
|
|
$
|
16
|
|
$
|
16
|
|
$
|
—
|
|
$
|
—
|
|
|||||||||
|
Interest rate swaps
|
$
|
—
|
|
$
|
—
|
|
$
|
—
|
|
$
|
—
|
|
$
|
334
|
|
$
|
—
|
|
$
|
334
|
|
$
|
—
|
|
|||||||||
|
Total liabilities
|
$
|
—
|
|
$
|
—
|
|
$
|
—
|
|
$
|
—
|
|
$
|
334
|
|
$
|
—
|
|
$
|
334
|
|
$
|
—
|
|
|||||||||
The interest rate swaps are accounted for as fair value hedges and substantially offset the changes in fair value of the hedged portion of the underlying debt that are attributable to the changes in market risk. Therefore, the gains and losses related to changes in the fair value of the interest rate swaps are included in interest income or expense, in our Consolidated Statements of Operations. For the
twelve months ended December 31, 2017
, interest expense from interest rate swaps was
$378
.
In accordance with the provisions of FASB ASC 820, the Company measures certain nonfinancial assets and liabilities at fair value, that are recognized or disclosed on a nonrecurring basis. During the year ended
December 31, 2017
, a
$413
other-than-temporary impairment charge was recorded with respect to L B Pipe JV assets held for sale utilizing a Level 2 fair value measurement. The impairment was a result of the Company's carrying value being greater than the agreed-upon sales price, or fair market value. See Note 8 Investments contained herein for additional information.
Information regarding the fair value disclosures associated with the assets of the Company’s defined benefit plans can be found in Note 16 Retirement Plans.
Note 19.
Commitments and Contingent Liabilities
The Company is subject to product warranty claims that arise in the ordinary course of its business. For certain manufactured products, the Company maintains a product warranty accrual that is adjusted on a monthly basis as a percentage of cost of sales. This product warranty accrual is periodically adjusted based on the identification or resolution of known individual product warranty claims.
The following table sets forth the Company’s product warranty accrual:
|
|
Warranty Liability
|
||
|
Balance at December 31, 2016
|
$
|
10,154
|
|
|
Additions to warranty liability
|
3,564
|
|
|
|
Warranty liability utilized
|
(5,036
|
)
|
|
|
Balance at December 31, 2017
|
$
|
8,682
|
|
Included within the above table are concrete tie warranty reserves of approximately
$7,595
and
$7,574
, respectively, at
December 31, 2017
and
2016
. For the periods ended
December 31, 2017
,
2016
, and
2015
, the Company recorded approximately
$21
,
$204
, and
$972
, respectively, in pre-tax concrete tie warranty charges within “Cost of goods sold” in the Company’s Rail Products and Services segment primarily related to concrete ties manufactured at the Company’s former Grand Island, NE facility. For the year ended
December 31, 2017
, the Company recorded
$839
in pre-tax warranty charges within “Cost of services sold” in our Tubular and Energy Services segment related to a Protective Coatings claim. During the year ended
December 31, 2016
, the Company recorded approximately
$1,224
in pre-tax warranty charges within “Cost of goods sold” in the Company’s Rail Products and Services segment related to Transit Products project.
71
UPRR Warranty Claims
On July 12, 2011, UPRR notified (the “UPRR Notice”) the Company and its subsidiary, CXT Incorporated (“CXT”), of a warranty claim under CXT’s 2005 supply contract relating to the sale of pre-stressed concrete railroad ties to UPRR. UPRR asserted that a significant percentage of concrete ties manufactured in 2006 through 2011 at CXT’s Grand Island, NE facility failed to meet contract specifications, had workmanship defects and were cracking and failing prematurely. Of the
3.0 million
ties manufactured between 1998 and 2011 from the Grand Island, NE facility, approximately
1.6 million
ties were sold during the period UPRR had claimed nonconformance. The 2005 contract called for each concrete tie which failed to conform to the specifications or had a material defect in workmanship to be replaced with
1.5
new concrete ties, provided, that, within
five
years of the sale of a concrete tie, UPRR notified CXT of such failure to conform or such defect in workmanship. The UPRR Notice did not specify how many ties manufactured during this period were defective nor the exact nature of the alleged workmanship defect.
Following the UPRR Notice, the Company worked with material scientists and pre-stressed concrete experts to test a representative sample of Grand Island, NE concrete ties and assess warranty claims for certain concrete ties made in its Grand Island, NE facility between 1998 and 2011. The Company discontinued manufacturing operations in Grand Island, NE in early 2011.
2012
During 2012, the Company completed sufficient testing and analysis to further understand this matter. Based upon testing results and expert analysis, the Company believed it discovered conditions, which largely related to the 2006 to 2007 manufacturing period, that can shorten the life of the concrete ties produced during this period. During the fourth quarter of 2012 and first quarter of 2013, the Company reached agreement with UPRR on several matters including a tie rating process for the Company and UPRR to work together to identify, prioritize, and replace defective ties that meet the criteria for replacement. This process applies to the ties the Company shipped to UPRR from its Grand Island, NE facility from 1998 to 2011. During most of this period, the Company’s warranty policy for UPRR carried a
5
-year warranty with a
1.5
:1 replacement ratio for any defective ties. In order to accommodate UPRR and other customer concerns, the Company also reverted to a previously used warranty policy providing a
15
-year warranty with a
1
:1 replacement ratio. This change provided an additional 10 years of warranty protection. In the amended 2005 supply agreement, the Company and UPRR also extended the supply of Tucson ties by
5 years
and agreed on a cash payment of
$12,000
to UPRR as compensation for concrete ties already replaced by UPRR during the investigation period.
During 2012, as a result of the testing that the Company conducted on concrete ties manufactured at its former Grand Island, NE facility and the developments related to UPRR and other customer matters, the Company recorded pre-tax warranty charges of
$22,000
in “Cost of Goods Sold” within its Rail Products and Services segment based on the Company’s estimate of the number of defective concrete ties that will ultimately require replacement during the applicable warranty periods.
2013
Throughout 2013, at UPRR’s request and under the terms of the amended 2005 supply agreement, the Company provided warranty replacement concrete ties for use across certain UPRR subdivisions. The Company attempted to reconcile the quantity of warranty claims for ties replaced and obtain supporting detail for the ties removed. The Company believes that UPRR did not replace concrete ties in accordance with the amended agreement and has not furnished adequate documentation throughout the replacement process in these subdivisions to support its full warranty claim. Based on the information received by the Company to date, the Company believes that a significant number of ties which UPRR replaced in these subdivisions did not meet the criteria to be covered as warranty replacement ties under the amended 2005 supply agreement. The disagreement related to the 2013 warranty replacement activity includes approximately
170,000
ties where the Company provided detailed documentation supporting our position with reason codes that detail why these ties are not eligible for a warranty claim.
In late November 2013, the Company received notice from UPRR asserting a material breach of the amended 2005 supply agreement. UPRR’s notice asserted that the failure to honor its claims for warranty ties in these subdivisions was a material breach. Following receipt of this notice, the Company provided information to UPRR to refute UPRR’s claim of breach and included the reconciliation of warranty claims supported by substantial findings from the Company’s track observation team, all within the
90
-day cure period. The Company also proposed further discussions to reach agreement on reconciliation for 2013 replacement activities and future replacement activities and a recommended process that will ensure future replacement activities are done with appropriate documentation and per the terms of the amended 2005 supply agreement.
72
2014
During the first quarter of 2014, the Company further responded within the
90
-day cure period to UPRR’s claim and presented a reconciliation for the subdivisions at issue. This proposed reconciliation was based on empirical data and visual observation from Company employees that were present during the replacement process for a substantial majority of the concrete ties replaced. The Company spent considerable time documenting facts related to concrete tie condition and track condition to assess whether the ties replaced met the criteria to be eligible for replacement under the terms of the amended 2005 supply agreement.
During 2014, the Company increased its accrual by an additional
$8,766
based on revised estimates of ties to be replaced based upon scientific testing and other analysis, adjusted for ties already provided to UPRR. The Company continued to work with UPRR to identify, replace, and reconcile defective ties related to the warranty claim in accordance with the amended 2005 supply agreement. The Company and UPRR met during the third quarter of 2014 to evaluate each other’s position in an effort to work towards agreement on the unreconciled 2013 and 2014 replacement activity as well as the standards and practices to be implemented for future replacement activity and warranty tie replacement.
In November and December of 2014, the Company received additional notices from UPRR asserting that ties manufactured in 2000 were defective and again asserting material breaches of the amended 2005 supply agreement relating to warranty tie replacements as well as certain new ties provided to UPRR being out of specification.
At
December 31, 2014
, the Company and UPRR had not been able to reconcile the disagreement related to the 2013 and 2014 warranty replacement activity. The disagreement relating to the
2014
warranty replacement activity includes approximately
90,100
ties that the Company believes are not warranty-eligible.
2015
On January 23, 2015, UPRR filed a Complaint and Demand for Jury Trial in the District Court for Douglas County, NE against the Company and its subsidiary, CXT, asserting, among other matters, that the Company breached its express warranty, breached an implied covenant of good faith and fair dealing, and anticipatorily repudiated its warranty obligations, and that UPRR’s exclusive and limited remedy provisions in the supply agreement have failed of their essential purpose which entitles UPRR to recover all incidental and consequential damages. The Complaint seeks to cancel all duties of UPRR under the contract, to adjudge the Company as having no remaining rights under the contracts, and to recover damages in an amount to be determined at trial for the value of unfulfilled warranty replacement ties and ties likely to become warranty eligible, for costs of cover for replacement ties, and for various incidental and consequential damages. The amended 2005 supply agreement provides that UPRR’s exclusive remedy is to receive a replacement tie that meets the contract specifications for each tie that failed to meet the contract specifications or otherwise contained a material defect provided that the Company receives written notice of such failure or defect within
15
years after that tie was produced. The amended 2005 supply agreement provides that the Company’s warranty does not apply to ties that (a) have been repaired or altered without the Company’s written consent in such a way as to affect the stability or reliability thereof, (b) have been subject to misuse, negligence, or accident, or (c) have been improperly maintained or used contrary to the specifications for which such ties were produced. The amended 2005 supply agreement also continues to provide that the Company’s warranty is in lieu of all other express or implied warranties and that neither party shall be subject to or liable for any incidental or consequential damages to the other party. The dispute is largely based on (1) claims submitted that the Company believes are for ties claimed for warranty replacement that are inaccurately under concrete tie rating guidelines and procedures agreed to in 2012 and incorporated by amendment to the 2005 supply agreement rated and are not the responsibility of the Company and claims that do not meet the criteria of a warranty replacement and (2) UPRR’s assertion, which the Company vigorously disputes, that UPRR in future years will be entitled to warranty replacement ties for virtually all of the Grand Island ties. Many thousands of Grand Island ties have been performing in track for over
ten
years. In addition, a significant amount of Grand Island ties were rated by both parties in the excellent category of the rating system.
In June 2015, UPRR delivered an additional notice alleging deficiencies in certain ties produced in the Company’s Tucson and Spokane locations and other claimed material breaches which the Company contends are unfounded. The Company again responded to UPRR that it was not in material breach of the amended 2005 supply agreement relating to warranty tie replacements and that the ties in question complied with the specifications provided by UPRR.
On June 16 and 17, 2015, UPRR issued formal notice of the termination of the concrete tie supply agreement as well as the termination of the lease agreement at the Tucson, AZ production facility and rejection and revocation of its prior acceptance of certain ties manufactured at the Company’s Spokane, WA production facility. Since that time, UPRR has discontinued submitting purchase orders to the Company for shipment of warranty replacement ties.
On May 29, 2015, the Company and CXT filed an Answer, Affirmative Defenses and Counterclaims in response to the Complaint, denying liability to UPRR. As a result of UPRR’s subsequent June 16-17, 2015 actions and certain related conduct, the Company on October 5, 2015 amended the pending Answer, Affirmative Defenses and Counterclaims to add, among other things, assertions that UPRR’s conduct in question was wrongful and unjustified and constituted additional grounds for the affirmative defenses to UPRR’s claims and also for the Company’s counterclaims.
73
2016
By Scheduling Order dated June 29, 2016, an August 31, 2017 deadline for the completion of fact discovery was established with trial to proceed at some future date after October 30, 2017, and UPRR filed an amended notice of trial to commence on October 30, 2017.
2017
By Third Amended Scheduling Order dated September 26, 2017, a June 29, 2018 deadline for completion of discovery has been established with trial to proceed at some future date on or after October 1, 2018. During the
twelve months ended December 31, 2017
, the parties continued to conduct discovery, with various disputes that required and will likely require court resolution. The Company intends to continue to engage in discussions in an effort to resolve the UPRR matter. However, we cannot predict that such discussions will be successful, or that the results of the litigation with UPRR, or any settlement or judgment amounts, will reasonably approximate our estimated accruals for loss contingencies. Future potential costs pertaining to UPRR’s claims and the outcome of the UPRR litigation could result in a material adverse effect on our results of operations, financial condition, and cash flows.
As a result of the preliminary status of the litigation and the uncertainty of any potential judgment, an estimate of any additional loss, or a range of additional loss, associated with this litigation cannot be made based upon currently available information.
Other Legal Matters
In June and September 2017, the Company recorded a cumulative pre-tax warranty charge within “Cost of services sold” in its Tubular and Energy Services segment of
$839
from a claim alleging a pipe expansion issue caused by our Protective Coatings services. The claim was settled during the year ended
December 31, 2017
.
In December 2016, the Company recorded a pre-tax warranty charge within “Cost of goods sold” within its Rail Products and Services segment of approximately
$1,224
with respect to allegedly defective products provided in connection with a transit project.
In September 2015, the Company was notified of a collective action complaint by current and former Test and Inspection Services employees to recover unpaid overtime wages and other damages under the Fair Labor Standards Act. The parties commenced court-ordered mediation on October 17, 2016. In December 2016, the Company reached an agreement in principle to settle the claim for
$900
and no admission of liability, subject to negotiation of a settlement agreement and approval by the court, which is expected to occur in the first half of 2017. For the year ended December 31, 2016, the Company recorded within “Selling and administrative expenses” in the Company’s Tubular and Energy Services segment a pre-tax charge of approximately
$900
related to the anticipated settlement of this claim. For the year ended
December 31, 2017
, the final settlement of
$797
was approved. The approval resulted in a pre-tax income adjustment of
$103
within “Selling and administrative expenses” reported in the Company’s Tubular and Energy Services segment.
The Company is also subject to other legal proceedings and claims that arise in the ordinary course of its business. Legal actions are subject to inherent uncertainties, and future events could change management's assessment of the probability or estimated amount of potential losses from pending or threatened legal actions. Based on available information, it is the opinion of management that the ultimate resolution of pending or threatened legal actions, both individually and in the aggregate, will not result in losses having a material adverse effect on the Company's financial position or liquidity at
December 31, 2017
.
If management believes that, based on available information, it is at least reasonably possible that a material loss (or additional material loss in excess of any accrual) will be incurred in connection with any legal actions, the Company discloses an estimate of the possible loss or range of loss, either individually or in the aggregate, as appropriate, if such an estimate can be made, or discloses that an estimate cannot be made. Based on the Company's assessment at
December 31, 2017
, no such disclosures were considered necessary.
Environmental Matters
The Company is subject to national, state, foreign, and/or local laws and regulations relating to the protection of the environment. The Company is monitoring its potential environmental exposure related to current and former facilities. The Company’s efforts to comply with environmental regulations may have an adverse effect on its future earnings. On June 5, 2017, a General Notice Letter was received from the United States Environmental Protection Agency (“EPA”) indicating that the Company may be a potentially responsible party regarding the Portland Harbor Superfund Site cleanup along with numerous other companies. The Company is reviewing the basis for its identification by the EPA and the nature of the historic operations of an L.B. Foster predecessor on the site. In the opinion of management, compliance with the present environmental protection laws will not have a material adverse effect on the financial condition, results of operations, cash flows, competitive position, or capital expenditures of the Company.
74
The following table sets forth the Company’s undiscounted environmental obligation:
|
|
Environmental liability
|
||
|
Balance at December 31, 2016
|
$
|
6,270
|
|
|
Additions to environmental obligations
|
143
|
|
|
|
Environmental obligations utilized
|
(269
|
)
|
|
|
Balance at December 31, 2017
|
$
|
6,144
|
|
Note 20.
Other Income
The following table summarizes the Company’s other income for the three years ended
December 31, 2017
,
2016
, and
2015
.
|
2017
|
2016
|
2015
|
||||||||||
|
Gain on Protective Coatings Field Service asset sale (a)
|
$
|
(487
|
)
|
$
|
—
|
|
$
|
—
|
|
|||
|
Gain on Rail Segment patent sale (b)
|
(500
|
)
|
—
|
|
—
|
|
||||||
|
Gain on Tucson, AZ asset sale (c)
|
—
|
|
—
|
|
(2,279
|
)
|
||||||
|
Foreign currency losses (gains)
|
804
|
|
12
|
|
(1,616
|
)
|
||||||
|
Remeasurement gain on equity method investment (d)
|
—
|
|
—
|
|
(580
|
)
|
||||||
|
Legal settlement gain (e)
|
—
|
|
—
|
|
(460
|
)
|
||||||
|
Other
|
(184
|
)
|
(1,535
|
)
|
(650
|
)
|
||||||
|
$
|
(367
|
)
|
$
|
(1,523
|
)
|
$
|
(5,585
|
)
|
||||
|
a)
|
On August 7, 2017, the Company sold the assets of its Protective Coatings Field Services business for
$1,200
, resulting in a pre-tax gain on sale of
$487
within our Tubular and Energy Services segment.
|
|
b)
|
On August 8, 2017, the Company sold its rights in European transit rail patents. The gain on sale of
$500
was recorded within the Rail Products and Services segment.
|
|
c)
|
On December 23, 2015, the Company sold certain assets related to the former Tucson, AZ precast concrete tie facility for
$2,750
resulting in a pre-tax gain on sale of
$2,279
.
|
|
d)
|
On November 23, 2015, the Company acquired the remaining
75%
of shares of Tew Plus resulting in a gain of
$580
, which is recorded within other income as of December 31, 2015. The gain is included in equity loss (income) and remeasurement gain within the Consolidated Statements of Cash Flows.
|
|
e)
|
During the fourth quarter of 2015 the Company received
$460
from the Steel Antitrust Settlement Fund related to a claim regarding steel purchased by the Company between 2005 and 2007.
|
75
Note 21.
Quarterly Financial Information (Unaudited)
Quarterly financial information for the years ended
December 31, 2017
and
2016
is presented below:
|
|
2017
|
|||||||||||||||
|
First
Quarter |
Second
Quarter |
Third
Quarter |
Fourth
Quarter (1) |
|||||||||||||
|
Net sales
|
$
|
118,702
|
|
$
|
144,860
|
|
$
|
131,492
|
|
$
|
141,323
|
|
||||
|
Gross profit
|
$
|
21,252
|
|
$
|
27,736
|
|
$
|
26,365
|
|
$
|
27,899
|
|
||||
|
Net (loss) income
|
$
|
(2,422
|
)
|
$
|
3,024
|
|
$
|
3,222
|
|
$
|
289
|
|
||||
|
Basic (loss) earnings per common share
|
$
|
(0.23
|
)
|
$
|
0.29
|
|
$
|
0.31
|
|
$
|
0.03
|
|
||||
|
Diluted (loss) earnings per common share
|
$
|
(0.23
|
)
|
$
|
0.29
|
|
$
|
0.31
|
|
$
|
0.03
|
|
||||
|
Dividends paid per common share
|
$
|
—
|
|
$
|
—
|
|
$
|
—
|
|
$
|
—
|
|
||||
Differences between the sum of quarterly results and the annual amounts in the Consolidated Statements of Operations are due to rounding.
|
(1)
|
- Fourth quarter
2017
includes provisional tax amounts related to the enactment of the U.S. Tax Cuts and Jobs Act, including additional tax expense of
$3,298
related to the one-time transition tax and a
$1,508
tax benefit related to the remeasurement of certain deferred tax assets and liabilities.
|
|
|
2016
|
|||||||||||||||
|
First
Quarter |
Second
Quarter (1) |
Third
Quarter (2) |
Fourth
Quarter (3) |
|||||||||||||
|
Net sales
|
$
|
126,310
|
|
$
|
135,994
|
|
$
|
114,644
|
|
$
|
106,566
|
|
||||
|
Gross profit
|
$
|
23,960
|
|
$
|
27,813
|
|
$
|
19,803
|
|
$
|
18,779
|
|
||||
|
Net loss
|
$
|
(2,832
|
)
|
$
|
(91,996
|
)
|
$
|
(5,982
|
)
|
$
|
(40,851
|
)
|
||||
|
Basic loss per common share
|
$
|
(0.28
|
)
|
$
|
(8.96
|
)
|
$
|
(0.58
|
)
|
$
|
(3.97
|
)
|
||||
|
Diluted loss per common share
|
$
|
(0.28
|
)
|
$
|
(8.96
|
)
|
$
|
(0.58
|
)
|
$
|
(3.97
|
)
|
||||
|
Dividends paid per common share
|
$
|
0.04
|
|
$
|
0.04
|
|
$
|
0.04
|
|
$
|
—
|
|
||||
|
(1)
|
- Second quarter
2016
includes
$128,938
impairment of assets related to the Chemtec, Protective Coatings, IOS, and Rail Technologies product groups.
|
|
(2)
|
- Third quarter
2016
includes
$6,946
related to the finalization of the impairment analysis of the Chemtec and Rail Technologies product groups.
|
|
(3)
|
- Fourth quarter
2016
includes deferred U.S. income taxes and foreign withholding taxes of
$7,932
on unremitted foreign earnings and a valuation allowance of
$29,719
against deferred tax assets.
|
76
ITEM 9.
CHANGES IN AND DISAGREEMENTS WITH ACCOUNTANTS ON ACCOUNTING AND FINANCIAL DISCLOSURE
None.
ITEM 9A.
CONTROLS AND PROCEDURES
Evaluation of Disclosure Controls and Procedures
L.B. Foster Company carried out an evaluation, under the supervision and with the participation of the Company’s management, including the Chief Executive Officer and the Chief Financial Officer, of the effectiveness of the design and operation of the Company’s disclosure controls and procedures (as defined in Rule 13a–15(e) under the Securities Exchange Act of 1934, as amended (“the Exchange Act”)) as of the end of the period covered by this report. Based on that evaluation, the Chief Executive Officer and Chief Financial Officer concluded that the Company’s disclosure controls and procedures were effective at the end of the period covered by this report.
Managements’ Report on Internal Control Over Financial Reporting
The management of L.B. Foster Company is responsible for establishing and maintaining adequate internal control over financial reporting, as such term is defined in Exchange Act Rule 13a–15(f). L.B. Foster Company’s internal control system is designed to provide reasonable assurance to the Company’s management and Board of Directors regarding the reliability of financial reporting and the preparation of financial statements for external purposes in accordance with accounting principles generally accepted in the United States. All internal control systems, no matter how well designed, have inherent limitations. Accordingly, even effective controls can provide only reasonable assurance with respect to financial statement preparation and presentation. There were no significant changes in internal control over financial reporting (as defined in Rule 13a-15(f) under the Exchange Act) that occurred during the fourth quarter of
2017
that have materially affected, or are reasonably likely to materially affect, the Company’s internal control over financial reporting.
L.B. Foster Company’s management assessed the effectiveness of the Company’s internal control over financial reporting as of
December 31, 2017
. In making this assessment, management used criteria set forth by the Committee of Sponsoring Organizations of the Treadway Commission (“COSO”) in
Internal Control - Integrated Framework (2013 Framework)
. Based on this assessment, management concluded that the Company maintained effective internal control over financial reporting at
December 31, 2017
.
Ernst & Young LLP, the independent registered public accounting firm that also audited the Company’s consolidated financial statements, has issued an attestation report on the Company’s internal control over financial reporting. Ernst & Young’s attestation report on the Company’s internal control over financial reporting appears in Part II, Item 8 of this Annual Report on Form 10-K and is incorporated herein by reference.
77
Report of Independent Registered Public Accounting Firm
To the Stockholders and the Board of Directors of L.B. Foster Company and Subsidiaries
Opinion on Internal Control over Financial Reporting
We have audited L.B. Foster Company and Subsidiaries’ internal control over financial reporting as of December 31, 2017, based on criteria established in Internal Control - Integrated Framework issued by the Committee of Sponsoring Organizations of the Treadway Commission (2013 framework) (the COSO criteria). In our opinion, L.B. Foster Company and Subsidiaries (the Company) maintained, in all material respects, effective internal control over financial reporting as of December 31, 2017, based on the COSO criteria.
We also have audited, in accordance with the standards of the Public Company Accounting Oversight Board (United States) (PCAOB), the consolidated balance sheets of the Company as of December 31, 2017 and 2016, the related consolidated statements of operations, comprehensive income (loss), stockholders’ equity and cash flows for each of the three years in the period ended December 31, 2017, and the related notes and the financial statement schedule listed in the index at Item 15(a) and our report dated
February 28, 2018
expressed an unqualified opinion thereon.
Basis for Opinion
The Company’s management is responsible for maintaining effective internal control over financial reporting and for its assessment of the effectiveness of internal control over financial reporting included in the accompanying Managements’ Report on Internal Control over Financial Reporting. Our responsibility is to express an opinion on the Company’s internal control over financial reporting based on our audit. We are a public accounting firm registered with the PCAOB and are required to be independent with respect to the Company in accordance with the U.S. federal securities laws and the applicable rules and regulations of the Securities and Exchange Commission and the PCAOB.
We conducted our audit in accordance with the standards of the PCAOB. Those standards require that we plan and perform the audit to obtain reasonable assurance about whether effective internal control over financial reporting was maintained in all material respects.
Our audit included obtaining an understanding of internal control over financial reporting, assessing the risk that a material weakness exists, testing and evaluating the design and operating effectiveness of internal control based on the assessed risk, and performing such other procedures as we considered necessary in the circumstances. We believe that our audit provides a reasonable basis for our opinion.
Definition and Limitations of Internal Control over Financial Reporting
A company’s internal control over financial reporting is a process designed to provide reasonable assurance regarding the reliability of financial reporting and the preparation of financial statements for external purposes in accordance with generally accepted accounting principles. A company’s internal control over financial reporting includes those policies and procedures that (1) pertain to the maintenance of records that, in reasonable detail, accurately and fairly reflect the transactions and dispositions of the assets of the company; (2) provide reasonable assurance that transactions are recorded as necessary to permit preparation of financial statements in accordance with generally accepted accounting principles, and that receipts and expenditures of the company are being made only in accordance with authorizations of management and directors of the company; and (3) provide reasonable assurance regarding prevention or timely detection of unauthorized acquisition, use, or disposition of the company’s assets that could have a material effect on the financial statements.
Because of its inherent limitations, internal control over financial reporting may not prevent or detect misstatements. Also, projections of any evaluation of effectiveness to future periods are subject to the risk that controls may become inadequate because of changes in conditions, or that the degree of compliance with the policies or procedures may deteriorate.
/s/ Ernst & Young LLP
Pittsburgh, Pennsylvania
February 28, 2018
78
ITEM 9B.
OTHER INFORMATION
None.
ITEM 10.
DIRECTORS, EXECUTIVE OFFICERS, AND CORPORATE GOVERNANCE
The information required by this Item regarding the directors of the Company is incorporated herein by reference to the information included in the Company’s proxy statement for the
2018
annual meeting of stockholders (the “Proxy Statement”) under the caption “Election of Directors.”
The information required by this Item regarding the executive officers of the Company is set forth in Part I of this Annual Report on Form 10-K under the caption “Executive Officers of the Registrant” and is incorporated herein by reference.
The information required by this Item regarding compliance with Section 16(a) of the Exchange Act is incorporated herein by reference to the information included in the Proxy Statement under the caption “Section 16(a) Beneficial Reporting Compliance.”
The information required by this Item regarding our Code of Ethics is set forth in Part I of this Annual Report on Form 10-K under the caption “Code of Ethics” and is incorporated herein by reference.
The information required by this Item regarding our audit committee and the audit committee financial expert(s) is incorporated herein by reference to the information included in the Proxy Statement under the caption “Corporate Governance — Board Committees — Audit Committee.”
ITEM 11.
EXECUTIVE COMPENSATION
The information required by this Item regarding executive compensation is incorporated herein by reference to the information included in the Proxy Statement under the captions “Director Compensation—
2017
,” “Executive Compensation,” “Summary Compensation Table (
2017
,
2016
, and
2015
),” “Grants of Plan-Based Awards in
2017
,” “Outstanding Equity Awards At
2017
Fiscal Year-End,” “
2017
Options Exercises and Stock Vested Table,” “
2017
Nonqualified Deferred Compensation,” “Change-In-Control,” “Compensation Committee Interlocks and Insider Participation,” and “Compensation Committee Report.”
ITEM 12.
SECURITY OWNERSHIP OF CERTAIN BENEFICIAL OWNERS AND MANAGEMENT AND RELATED STOCKHOLDER MATTERS
The information required by this Item regarding the Company’s equity compensation plans is set forth in Part II, Item 5 of this Annual Report on Form 10-K under the caption “Securities Authorized for Issuance Under Equity Compensation Plans” and is incorporated herein by reference.
The information required by this Item regarding the beneficial ownership of the Company is incorporated herein by reference to the information included in the Proxy Statement under the caption “Stock Ownership.”
ITEM 13.
CERTAIN RELATIONSHIPS AND RELATED TRANSACTIONS, AND DIRECTOR INDEPENDENCE
The information required by this Item regarding transactions with related persons is incorporated herein by reference to the information included in the Proxy Statement under the caption “Corporate Governance — Transactions with Related Parties.”
The information required by this Item regarding director independence is incorporated herein by reference to information included in the Proxy Statement under the caption “Corporate Governance — The Board, Board Meetings, Independence and Tenure.”
ITEM 14.
PRINCIPAL ACCOUNTANT FEES AND SERVICES
The information required by this Item regarding principal accountant fees and services is incorporated herein by reference to information included in the Proxy Statement under the caption “Independent Registered Public Accountants’ Fees.”
79
ITEM 15.
EXHIBITS AND FINANCIAL STATEMENT SCHEDULES
The following documents are filed as a part of this Report:
(a)(1).
Financial Statements
The following Reports of Independent Registered Public Accounting Firm, consolidated financial statements, and accompanying notes are included in Item 8 of this Report:
Reports of Independent Registered Public Accounting Firm.
Consolidated Balance Sheets as of
December 31, 2017
and
2016
.
Consolidated Statements of Operations for the Years Ended
December 31, 2017
,
2016
, and
2015
.
Consolidated Statements of Comprehensive Income for the Years Ended
December 31, 2017
,
2016
, and
2015
.
Consolidated Statements of Cash Flows for the Years Ended
December 31, 2017
,
2016
, and
2015
.
Consolidated Statements of Stockholders’ Equity for the Years Ended
December 31, 2017
,
2016
, and
2015
.
Notes to Consolidated Financial Statements.
(a)(2).
Financial Statement Schedule
Schedules for the Years Ended
December 31, 2017
,
2016
, and
2015
:
II – Valuation and Qualifying Accounts.
The remaining schedules are omitted because of the absence of conditions upon which they are required.
(a)(3).
Exhibits
The Index to Exhibits immediately following Part IV, Item 16 Form 10-K Summary filed as part of this Annual Report on Form 10-K.
L. B. FOSTER COMPANY AND SUBSIDIARIES
SCHEDULE II VALUATION AND QUALIFYING ACCOUNTS
FOR THE YEARS ENDED
DECEMBER 31, 2017
,
2016
, AND
2015
|
Balance at Beginning of Year
|
Additions Charged to Costs and Expenses
|
Deductions (1)
|
Balance at End of Year
|
|||||||||||||
|
2017
|
||||||||||||||||
|
Deducted from assets to which they apply:
|
||||||||||||||||
|
Allowance for doubtful accounts
|
$
|
1,417
|
|
$
|
1,517
|
|
$
|
783
|
|
$
|
2,151
|
|
||||
|
Valuation allowance for deferred tax assets
|
$
|
29,719
|
|
$
|
—
|
|
$
|
6,023
|
|
$
|
23,696
|
|
||||
|
2016
|
||||||||||||||||
|
Deducted from assets to which they apply:
|
||||||||||||||||
|
Allowance for doubtful accounts
|
$
|
1,485
|
|
$
|
982
|
|
$
|
1,050
|
|
$
|
1,417
|
|
||||
|
Valuation allowance for deferred tax assets
|
$
|
—
|
|
$
|
29,719
|
|
$
|
—
|
|
$
|
29,719
|
|
||||
|
2015
|
||||||||||||||||
|
Deducted from assets to which they apply:
|
||||||||||||||||
|
Allowance for doubtful accounts
|
$
|
1,036
|
|
$
|
1,113
|
|
$
|
664
|
|
$
|
1,485
|
|
||||
|
(1)
|
Notes and accounts receivable written off as uncollectible.
|
ITEM 16.
FORM 10-K SUMMARY
We may voluntarily include a summary of information required by Annual Report on Form 10-K under this Item 16. We have elected not to include such summary information.
80
INDEX TO EXHIBITS
All exhibits are incorporated herein by reference:
|
Exhibit Number
|
Description
|
|
|
2.1
|
|
|
|
3.1
|
|
|
|
3.2
|
|
|
|
10.1
|
|
|
|
10.2
|
|
|
|
10.3
|
|
|
|
10.4 **
|
|
|
|
10.5 **
|
|
|
|
10.6 **
|
|
|
|
10.7 **
|
|
|
|
10.8 **
|
|
|
|
10.9 **
|
|
|
|
10.10 **
|
|
|
|
10.11 **
|
|
|
|
10.12 **
|
|
|
|
10.13 **
|
|
|
|
10.14 **
|
|
|
|
10.15 **
|
|
|
81
|
10.16 **
|
|
|
|
10.17 **
|
|
|
|
10.18 **
|
|
|
|
10.19 **
|
|
|
|
10.20 **
|
||
|
10.21 **
|
||
|
10.22 **
|
||
|
10.23 **
|
||
|
10.24 **
|
||
|
10.25
|
|
|
|
10.26
|
|
|
|
*21
|
|
|
|
*23
|
|
|
|
*31.1
|
|
|
|
*31.2
|
|
|
|
*32.0
|
|
|
|
*101.INS
|
|
XBRL Instance Document.
|
|
*101.SCH
|
|
XBRL Taxonomy Extension Schema Document.
|
|
*101.CAL
|
|
XBRL Taxonomy Extension Calculation Linkbase Document.
|
|
*101.DEF
|
|
XBRL Taxonomy Extension Definition Linkbase Document.
|
|
*101.LAB
|
|
XBRL Taxonomy Extension Label Linkbase Document.
|
|
*101.PRE
|
|
XBRL Taxonomy Extension Presentation Linkbase Document.
|
|
*
|
|
Exhibits are filed herewith.
|
|
**
|
|
Exhibit represents a management contract or compensatory plan, contract or arrangement required to be filed as Exhibits to this Annual Report on Form 10-K.
|
82
SIGNATURES
Pursuant to the requirements of Section 13 or 15(d) of the Securities Exchange Act of 1934, the Registrant has duly caused this report to be signed on its behalf by the undersigned, thereunto duly authorized.
|
L.B. FOSTER COMPANY
|
|||
|
|
(Registrant)
|
||
|
Date:
|
February 28, 2018
|
By:
|
/s/ Robert P. Bauer
|
|
|
(Robert P. Bauer,
|
||
|
|
President and Chief Executive Officer)
|
||
Pursuant to the requirements of the Securities Exchange Act of 1934, this report has been signed below by the following persons on behalf of the Registrant and in the capacities and on the dates indicated.
|
|
|
Name
|
|
Position
|
|
Date
|
|
By:
|
|
/s/ Lee B. Foster II
|
|
Chairman of the Board and Director
|
|
February 28, 2018
|
|
|
(Lee B. Foster II)
|
|
|
|||
|
By:
|
|
/s/ Robert P. Bauer
|
|
President, Chief Executive Officer,
|
|
February 28, 2018
|
|
|
(Robert P. Bauer)
|
|
and Director
|
|
||
|
By:
|
|
/s/ Dirk Jungé
|
|
Director
|
|
February 28, 2018
|
|
|
(Dirk Jungé)
|
|
|
|||
|
By:
|
|
/s/ Diane B. Owen
|
|
Director
|
|
February 28, 2018
|
|
|
(Diane B. Owen)
|
|
|
|||
|
By:
|
|
/s/ Robert S. Purgason
|
|
Director
|
|
February 28, 2018
|
|
|
(Robert S. Purgason)
|
|
|
|||
|
By:
|
|
/s/ William H. Rackoff
|
|
Director
|
|
February 28, 2018
|
|
|
(William H. Rackoff)
|
|
|
|||
|
By:
|
|
/s/ Suzanne B. Rowland
|
|
Director
|
|
February 28, 2018
|
|
|
(Suzanne B. Rowland)
|
|
|
|||
|
By:
|
|
/s/ Bradley S. Vizi
|
|
Director
|
|
February 28, 2018
|
|
|
(Bradley S. Vizi)
|
|
|
|||
|
By:
|
|
/s/ James P. Maloney
|
|
Senior Vice President,
|
|
February 28, 2018
|
|
|
(James P. Maloney)
|
|
Chief Financial Officer, and Treasurer
|
|
||
|
By:
|
|
/s/ Christopher T. Scanlon
|
|
Controller and Chief Accounting Officer
|
|
February 28, 2018
|
|
|
(Christopher T. Scanlon)
|
|
|
|||
83
TABLE OF CONTENTS
Part IItem 1. BusinessItem 1A. Risk FactorsItem 1B. Unresolved Staff CommentsItem 2. PropertiesItem 3. Legal ProceedingsItem 4. Mine Safety DisclosuresPart IIItem 5. Market For Registrant's Common Equity, Related Stockholder Matters, and Issuer Purchases Of Equity SecuritiesItem 6. Selected Financial DataItem 7. Management's Discussion and Analysis Of Financial Condition and Results Of OperationsItem 7A. Quantitative and Qualitative Disclosures About Market RiskItem 8. Financial Statements and Supplementary DataItem 9. Changes in and Disagreements with Accountants on Accounting and Financial DisclosureItem 9A. Controls and ProceduresItem 9B. Other InformationPart IIIItem 10. Directors, Executive Officers, and Corporate GovernanceItem 11. Executive CompensationItem 12. Security Ownership Of Certain Beneficial Owners and Management and Related Stockholder MattersItem 13. Certain Relationships and Related Transactions, and Director IndependenceItem 14. Principal Accountant Fees and ServicesPart IVItem 15. Exhibits and Financial Statement SchedulesItem 16. Form 10-k Summary