FORTINET, INC.
10-Ks and 10-Qs
|
|
|
|
|
|
|
|
|
|
|
|
|
|
|
|
|
|
|
|
|
|
|
|
|
|
|
|
|
|
|
|
|
|
|
|
|
|
|
|
|
|
|
|
|
|
|
|
|
|
|
|
|
|
|
|
UNITED STATES
SECURITIES AND EXCHANGE COMMISSION
Washington, D.C. 20549
FORM 10-K
(Mark One)
|
x
|
ANNUAL REPORT PURSUANT TO SECTION 13 OR 15(d) OF THE SECURITIES EXCHANGE ACT OF 1934
|
For the fiscal year ended
December 31, 2017
or
|
o
|
TRANSITION REPORT PURSUANT TO SECTION 13 OR 15(d) OF THE SECURITIES EXCHANGE ACT OF 1934
|
For the transition period from
to
Commission file number: 001-34511
______________________________________
FORTINET, INC.
(Exact name of registrant as specified in its charter)
______________________________________
|
Delaware
|
77-0560389
|
|
(State or other jurisdiction of
incorporation or organization)
|
(I.R.S. Employer
Identification No.)
|
|
899 Kifer Road
Sunnyvale, California
|
94086
|
|
(Address of principal executive offices)
|
(Zip Code)
|
(Registrant’s telephone number, including area code)
Securities registered pursuant to Section 12(b) of the Act:
|
Common Stock, $0.001 Par Value
|
|
The Nasdaq Stock Market LLC
|
|
(Title of each class)
|
|
(Name of exchange on which registered)
|
Securities registered pursuant to Section 12(g) of the Act: None
Indicate by check mark if the registrant is a well-known seasoned issuer, as defined in Rule 405 of the Securities Act. Yes
x
No
o
Indicate by check mark if the registrant is not required to file reports pursuant to Section 13 or Section 15(d) of the Act. Yes
o
No
x
Indicate by check mark whether the registrant (1) has filed all reports required to be filed by Section 13 or 15(d) of the Securities Exchange Act of 1934 (“Exchange Act”) during the preceding 12 months (or for such shorter period that the registrant was required to file such reports), and (2) has been subject to such filing requirements for the past 90 days. Yes
x
No
o
Indicate by check mark whether the registrant has submitted electronically and posted on its corporate Website, if any, every Interactive Data File required to be submitted and posted pursuant to Rule 405 of Regulation S-T (§232.405 of this chapter) during the preceding 12 months (or for such shorter period that the registrant was required to submit and post such files). Yes
x
No
o
Indicate by check mark if disclosure of delinquent filers pursuant to Item 405 of Regulation S-K (§229.405 of this chapter) is not contained herein, and will not be contained, to the best of the registrant’s knowledge, in definitive proxy or information statements incorporated by reference in Part III of this Form 10-K or any amendment to this Form 10-K.
x
Indicate by check mark whether the registrant is a large accelerated filer, an accelerated filer, a non-accelerated filer, a smaller reporting company, or an emerging growth company. See the definitions of “large accelerated filer,” “accelerated filer,” “smaller reporting company,” and “emerging growth company” in Rule 12b-2 of the Exchange Act.
|
Large accelerated filer
|
x
|
Accelerated filer
|
o
|
||
|
Non-accelerated filer
|
o
|
(Do not check if smaller reporting company)
|
Smaller reporting company
|
o
|
|
|
Emerging growth company
|
o
|
||||
If an emerging growth company, indicate by check mark if the registrant has elected not to use the extended transition period for complying with any new or revised financial accounting standards provided pursuant to Section 13(a) of the Exchange Act.
o
Indicate by check mark whether the registrant is a shell company (as defined in Rule 12b-2 of the Act). Yes
o
No
x
The aggregate market value of voting stock held by non-affiliates of the registrant, as of
June 30, 2017
, the last business day of the registrant’s most recently completed second quarter, was
$4,597,906,585
(based on the closing price for shares of the registrant’s common stock as reported by The Nasdaq Global Select Market on that date). Shares of common stock held by each executive officer, director, and holder of 5% or more of the registrant’s outstanding common stock have been excluded in that such persons may be deemed to be affiliates. This determination of affiliate status is not necessarily a conclusive determination for other purposes.
As of
February 16, 2018
, there were
168,024,163
shares of the registrant’s common stock outstanding.
DOCUMENTS INCORPORATED BY REFERENCE
Portions of the registrant’s definitive Proxy Statement relating to its
2018
Annual Meeting of Stockholders are incorporated by reference into Part III of this Annual Report on Form 10-K where indicated. Such Proxy Statement will be filed with the United States Securities and Exchange Commission within 120 days after the end of the fiscal year to which this report relates.
FORTINET, INC.
ANNUAL REPORT ON FORM 10-K
For the Year Ended
December 31, 2017
Table of Contents
|
|
|
Page
|
|
Part I
|
||
|
Item 1.
|
||
|
Item 1A.
|
||
|
Item 1B.
|
||
|
Item 2.
|
||
|
Item 3.
|
||
|
Item 4.
|
||
|
Part II
|
||
|
Item 5.
|
||
|
Item 6.
|
||
|
Item 7.
|
||
|
Item 7A.
|
||
|
Item 8.
|
||
|
Item 9.
|
||
|
Item 9A.
|
||
|
Item 9B.
|
||
|
Part III
|
||
|
Item 10.
|
||
|
Item 11.
|
||
|
Item 12.
|
||
|
Item 13.
|
||
|
Item 14.
|
||
|
Part IV
|
||
|
Item 15.
|
||
Overview
Fortinet is a global leader in broad, automated and integrated cybersecurity solutions. We provide high performance cybersecurity solutions to a wide variety of businesses, such as carriers, data centers, enterprises and distributed offices, including a majority of the Fortune 100 companies. Our cybersecurity solutions are designed to provide broad, automated and integrated protection against dynamic and sophisticated security threats, while simplifying the information technology (“IT”) and security infrastructure of our end-customers.
We have four current focus areas for our business.
|
•
|
Core Business (FortiGate)
—We derive a majority of product sales from our FortiGate appliances. Our FortiGate appliances include the FortiGate-20 to -100 series, designed for small businesses and enterprises with distributed offices (“low-end products”), the FortiGate-200 to -900 series for medium-sized businesses (“mid-range products”) and the FortiGate-1000 to -7000 series for large businesses and service providers (“high-end products”). In February 2018, we launched the new FortiGate 6000 series, which is built upon a new hardware process and architecture that delivers over 100 gigabytes of advanced threat protection and secure sockets layer (“SSL”) inspection to handle the volume of traffic driven by increased adoption of the cloud.
|
Our FortiOS operating system provides the foundation for all FortiGate security functions and offers end-customers the ability to manage security capabilities across their cloud assets and software-defined wireless area networks. Our network security platform also includes our FortiGuard security subscription services, which end-customers can subscribe to in order to obtain access to updates to application control, anti-virus, intrusion prevention, web filtering and anti-spam functionality. End-customers may also purchase FortiCare technical support services for our products and FortiCare professional services to assist in the design, implementation and maintenance of their networks. We complement our core FortiGate product line with other products and software that offer additional protection from security threats to other critical areas of the business.
|
•
|
Fortinet Security Fabric
—We developed the Fortinet Security Fabric to provide unified security across the entire digital attack surface, including network core, endpoints, applications, data centers, access and private and public cloud. The Fortinet Security Fabric is designed to enable traditionally disparate security devices to work together as an integrated and collaborative whole. It delivers integrated scalability, access control, awareness, security, traffic segmentation, centralized management, visibility and orchestration. The breadth of the Fortinet Security Fabric helps businesses and government agencies defend the expanding attack surface.
|
At the core of the Fortinet Security Fabric are our FortiGate hardware products and software, which include a broad set of security services, including firewall, virtual private network, anti-malware, anti-spam, application control, intrusion prevention, access control, web filtering, traffic and device segmentation and advanced threat protection (“ATP”). Through these security services, our FortiGuard Labs team provides updates using threat research and a global cloud network of data collection and intelligence resources to deliver subscription-based security services to FortiGate appliances and software products.
We continue to expand the adoption of the Fortinet Security Fabric to third-party solution providers. In 2017, we welcomed 18 new partners to our Fabric-Ready
partner program, including Intel, Amazon Web Services and Microsoft. Our Fabric-ready program consisted of 37 ecosystem partners as of February 3, 2018. Billings for non-FortiGate products and services increased in 2017.
|
•
|
Fortinet Cloud Security
—Our technology positions us to deliver security to the cloud and for the cloud. We help our customers secure their cloud implementations by offering integration, visibility and automation across multi-cloud and hybrid deployments. We have a variety of software products designed to extend traditional network security protection into the cloud as standalone solutions, or as part of our distributed Security Fabric architecture. Our FortiCASB extends the core capabilities of our security fabric architecture to provide businesses the same level of cybersecurity and threat intelligence in cloud environments as they do on their physical networks. The Fortinet cloud security is available across all major cloud providers, including Microsoft Azure, Amazon Web Services, Google Cloud, IBM Cloud and Oracle Cloud.
|
1
|
•
|
Internet of Things (“IoT”) and Operational Technology Security (“OT”)
—The emergence of the IoT has created an environment where data moves freely between devices across locations, network environments, remote offices, mobile workers and public cloud environments, making it difficult to consistently track and secure. We are continuing to extend broad security to these IoT and OT environments. Our products enable critical infrastructure and industrial organizations to deliver advanced segmentation, access control and malware protection needed to unify their security architecture and defend their OT networks regardless of the operating environment.
|
During our year ended
December 31, 2017
, we generated total revenue of
$1.49 billion
and net income of
$31.4 million
. See Part II, Item 8 of this Annual Report on Form 10-K for more information on our consolidated balance sheets as of December 31, 2017 and 2016 and our consolidated statements of operations, comprehensive income, stockholders’ equity and cash flows for each of the three years ended December 31, 2017, 2016 and 2015.
We were incorporated in Delaware in November 2000. Our principal executive office is located at 899 Kifer Road,
Sunnyvale, California 94086 and our telephone number at that location is (408) 235-7700.
Technology and Architecture
Our proprietary SPU hardware architecture, FortiOS operating system and associated security and networking functions combine to form the Fortinet Security Fabric. This approach to security ties together discrete security solutions into an integrated whole, which enables our products to perform security processing for networks with high throughput requirements across a broad threat landscape.
SPU
Our proprietary SPU consists of Application-Specific Integrated Circuits (“ASICs”) consisting of three main lines of processors: (i) the Content Processor (“SPU CP”), (ii) the Network Processor (“SPU NP”) and (iii) the System-on-a-Chip (“SPU SOC”). Our proprietary ASICs are designed to enhance the security processing capabilities implemented in software by accelerating computationally intensive tasks such as firewall policy enforcement, network address translation, IPS threat detection and encryption. This architecture provides the flexibility of implementing accelerated processing of new threat detection without requiring a new ASIC. The SPU CP is currently included in most of our entry-level and all of our mid-range and high-end FortiGate appliances. The SPU NP is currently included in some of our mid-range and high-end FortiGate appliances, delivering additional accelerated firewall and VPN performance. Entry-level FortiGate products often use the SPU SOC2 or SPU SOC3 to provide the necessary acceleration at this level. Mid-range FortiGate products use a central processing unit (“CPU”) and include the SPU NP and SPU CP hardware acceleration. The high-end FortiGate products use multiple CPUs, SPU CPs and SPU NPs.
FortiOS
Our proprietary FortiOS operating system provides the foundation for the operation of all FortiGate appliances, whether physical, virtual, private or public cloud or on-demand based, and is at the heart of our Security Fabric implementation. The core kernel functions to the security processing feature sets work together to provide a highly integrated solution. FortiOS provides (i) multiple layers of security, including a hardened kernel layer providing protection for the FortiGate system, (ii) a network security layer providing security for end-customers’ network infrastructures and (iii) application content protection providing security for end-customers’ workstations and applications. FortiOS directs the operations of processors and SPUs and provides system management functions such as command-line, graphical user interfaces, multiple network and security topology views.
Key high-level functions and capabilities of FortiOS include:
|
•
|
key enablement for the Fortinet Security Fabric architecture;
|
|
•
|
allowing for FortiGate appliances to be configured into different security environments such as our Internal Network Firewall, NGFW and DCFW;
|
|
•
|
configuration of the physical aspects of the appliance such as ports, onboard Wi-Fi and switching;
|
|
•
|
extending the Fortinet Security Fabric by directly managing FortiSwitch and FortiAP devices;
|
|
•
|
key network functions such as routing and deployment modes (network routing, transparent, sniffer, etc.);
|
|
•
|
implementation of security updates from our FortiGuard distribution network, delivering ATP, such as IPS, antivirus and application control;
|
|
•
|
access to cloud-based web and email filtering databases;
|
|
•
|
direct integration with both cloud and on premises FortiSandbox technology;
|
|
•
|
security policy objects and enforcement;
|
2
|
•
|
data leak prevention and document finger printing; and
|
|
•
|
real-time reporting and logging.
|
FortiOS also enables advanced, integrated routing and switching, allowing end-customers to deploy FortiGate devices within a wide variety of networks, as well as providing a direct replacement solution option for legacy switching and routing equipment. FortiOS implements a suite of commonly used standards-based routing protocols as well as network address translation technologies, allowing the FortiGate appliance to integrate and operate in a wide variety of network environments. Additional features include virtual domain capabilities, which can provide support for multiple customers on a single device or FortiOS instance. FortiOS also provides capabilities for logging of traffic for forensic analysis purposes that are particularly important for regulatory compliance initiatives like payment card industry data security standard. FortiOS is designed to help control network traffic in order to optimize performance by including functionality such as packet classification, queue disciplines, policy enforcement, congestion management, WAN optimization and caching. These features enable administrators to set the appropriate configurations and policies that meet their infrastructure needs. We make updates to FortiOS available through our FortiCare technical support services.
Products
Our core product offerings consist of our FortiGate product family, along with our non-FortiGate products, all of which may be purchased to complement commercial and enterprise deployments. Our FortiGate hardware and software licenses are sold with a set of broad security services. These security services are enabled by FortiGuard which provides extensive threat research and artificial intelligence capabilities from a global cloud network to deliver protection services to each FortiGate appliance. Our non-FortiGate products include the Fortinet Security Fabric (such as FortiSandbox, FortiSIEM and FortiManager), cloud security products (such as Fabric virtual machines and cloud services) and other products.
FortiGate
Our flagship FortiGate hardware appliances and software offer a broad set of security and networking functions, including firewall, intrusion prevention, anti-malware, VPN, application control, web filtering, anti-spam and WAN acceleration. All FortiGate models run on our FortiOS operating system. FortiGate platforms can be centrally managed through both embedded web-based and command line interfaces, as well as through FortiManager, which provides central management architecture for thousands of FortiGate hardware appliance and software licenses across a range of hypervisor platforms.
By combining multiple network security functions in our purpose-built security platform, the FortiGate appliances provide broad, high-quality protection capabilities and deployment flexibility while reducing the operational burden and costs associated with managing multiple point products. With over 30 models in the FortiGate product line, FortiGate is designed to address security requirements for small- to medium-sized businesses, large enterprises and government organizations worldwide.
Typically, all FortiGate hardware appliances include our SPUs to accelerate content and network security features implemented within FortiOS. The significant differences between each model are the performance and scalability targets each model is designed to meet, while the security features and associated services offered are common throughout all models. The FortiGate-20 through -100 series models are designed for perimeter protection for small- to medium-sized businesses and enterprises with distributed offices. The FortiGate-200 through -900 series models are designed for perimeter deployment in medium-sized to large enterprise networks. The FortiGate-1000 through -7000 series models deliver high performance and scalable network security functionality for perimeter, data center and core deployment in large enterprises.
We also incorporate additional technologies within FortiGate appliances that differentiate our solutions, including data leakage protection, traffic optimization, secure socket layer inspection, threat vulnerability management and wireless controller technology. In addition to these in-built features, we offer a full range of wireless access points and controllers, complementing FortiGate with the flexibility of wireless local area network access.
3
FortiSandbox
The FortiSandbox technology delivers proactive detection and mitigation with the capability to generate a directly actionable protection capability. Available in both hardware and cloud-based form, the FortiSandbox technology has a dual-layer sandbox complemented by FortiGuard’s anti-malware intelligence. FortiSandbox allows suspicious code to be subject to a set of multi-layer protection techniques culminating in execution within an operating system to allow detailed real-time behavioral analysis to be performed. When malicious code is identified in this way, a signature can be generated locally for distribution across the Fortinet Security Fabric. Additional insight on the nature of the threat is provided through an intuitive dashboard showing threat information, including system activity, exploit efforts, web traffic and any related subsequent downloads. In addition to integrating within FortiOS, the FortiSandbox can also deliver its detection and local threat intelligence to registered FortiMail, FortiWeb appliances and FortiClient enabled end points.
FortiSIEM
Our FortiSIEM family of products provides a cloud-ready security information and event management (“SIEM”) solution for enterprises and service providers. FortiSIEM unifies analytics that are traditionally monitored discretely, parses the information and then processes it in an event-based analytics engine for handling real-time searches, rules, dashboards and ad-hoc queries. This unification of diverse sources of data enables organizations to create comprehensive dashboards and reports to identify root causes of threats, and take the steps necessary to remediate and prevent them in the future. Our FortiSIEM products are available either through subscription or perpetual licenses.
FortiSwitch
Our FortiSwitch product family provides secure switching solutions. It can be deployed in traditional network switching designs with layer 2 and layer 3 access control features. FortiSwitch is part of Fortinet’s Security Fabric solution. FortiSwitch within Fortinet Security Fabric creates a scalable and secure access layer on which customers depend for connecting their end devices, such as computers and laptops, as well as an expanding field of IoT devices.
Fortinet Management and Analysis Products
Our FortiManager and FortiAnalyzer hardware and software products are typically sold in conjunction with most commercial and enterprise deployments.
FortiManager.
Our FortiManager family of products provides a central and scalable management solution for our FortiGate products, including software updates, configuration, policy settings and security updates. One FortiManager product is capable of managing thousands of FortiGate units. FortiManager facilitates the coordination of policy-based provisioning, device configuration and operating system revision management, as well as network security monitoring and device control.
FortiAnalyzer.
Our FortiAnalyzer family of products provides centralized network logging, analyzing and reporting solutions that securely aggregate content and log data from our FortiGate devices and other Fortinet products as well as third-party devices to enable network logging, analysis and reporting.
Services
FortiGuard Security Subscription Services
Security requirements are dynamic due to the constantly changing nature of threats. Our FortiGuard security subscription services are designed to allow us to quickly deliver new threat detection and prevention capabilities to end-customers worldwide as new threats evolve. Our FortiGuard Labs global threat research team identifies emerging threats, collects threat samples, and replicates, reviews, characterizes and collates attack data. Based on this research, we develop updates for virus signatures, attack definitions, scanning engines and other security solution components to distribute to end-customers. End-customers purchase FortiGuard security subscription services in advance, typically with terms of one or more years, to obtain access to regular updates for application control, antivirus, intrusion prevention, web filtering and anti-spam functions for our FortiGate products; antivirus, web filtering and VPN functions for our FortiClient software; antivirus and anti-spam functions for our FortiMail products; vulnerability management for our FortiGate, FortiAnalyzer and FortiMonitor products; database functions for our FortiDB appliance; web functions for our FortiWeb appliances; and ATP for our FortiSandbox on premise and cloud products. We provide FortiGuard security subscription services 24 hours a day, seven days a week.
4
FortiCare Technical Support Services
Our FortiCare services portfolio includes technical support and extended product warranty. For our standard technical support, our channel partners may provide first-level support to the end-customer. We also provide first-level support to our end-customers, as well as second- and third-level support as appropriate. We also provide knowledge management tools and customer self-help portals to help augment our support capabilities in an efficient and scalable manner. We deliver technical support to partners and end-customers 24 hours a day, seven days a week through regional technical support centers located worldwide. In addition to our appliance technical support services, we offer a range of advanced services, including premium support and professional services.
Professional Services
We offer professional services to end-customers including Technical Account Managers (“TAMs”), Resident Engineers (“REs”) and professional service consultants for implementations.
Dedicated support engineers are available to help identify and eliminate issues before problems arise. These TAMs and REs are seasoned professionals with broad and deep experience in the security and networking field. Each TAM and RE acts as a single point of contact and customer advocate within Fortinet, and is focused on building and maintaining a deep understanding of our customers’ businesses and security requirements.
Our professional services consultants help in the design of deployments of our products and work closely with end-customer engineers, managers and other project team members to implement our products according to design, utilizing network analysis tools, traffic simulation software and scripts.
Training Services
We offer training services to our end-customers and channel partners through our training department and authorized training partners. We have also implemented a training certification program, Network Security Expert, to help ensure an understanding of our products and services.
Customers
We typically sell our security solutions to channel partners, who in turn sell to end-customers of various sizes and, at times, we also sell directly to end-customers. Our end-customers include small and medium-sized businesses, large enterprises and government organizations across a wide range of industries, including telecommunications, technology, government, financial services, education, retail, manufacturing and healthcare. An end-customer deployment may involve one of our appliances or thousands, depending on our end-customer’s size and security requirements. We also offer access to our products via the cloud through certain cloud providers such as Amazon Web Services and Microsoft Azure. Many of our customers also purchase our FortiGuard security subscription services and FortiCare technical support services. For information regarding our geographic revenue based on billing address, see Note 14 to our consolidated financial statements in Part II, Item 8 of this Annual Report on Form 10-K.
One distributor, Exclusive Networks Group (“Exclusive”), which distributed our solutions to a large group of resellers and end-customers, accounted for
18%
,
20%
and
25%
of total revenue during 2015, 2016 and 2017, respectively. In July 2017, Exclusive acquired the U.S. division of Fine Tec Computers (“Fine Tec U.S.”). Fine Tec U.S.’s revenue has been combined with Exclusive’s from the date of acquisition. Since the acquisition of Fine Tec U.S., Exclusive’s business with us has increased and may continue to increase in the future.
Sales and Marketing
We primarily sell our products and services through a distribution model. We sell to distributors that sell to networking security and enterprise-focused resellers and service providers, who, in turn, sell to our end-customers. In certain cases, we sell directly to government-focused resellers, as well as to large service providers and financial institutions who have large purchasing power and unique customer deployment demands. We work with many technology distributors, including Exclusive, Ingram Micro Inc., Westcon and Tech Data.
5
We support our channel partners with a dedicated team of experienced channel account managers, sales professionals and sales engineers who provide business planning, joint marketing strategy, and pre-sales and operational sales support. Additionally, our sales teams help drive and support large enterprise and service provider sales through a direct touch model. Our sales professionals and engineers typically work closely with our channel partners and directly engage with large end-customers to address their unique security and deployment requirements. To support our broadly dispersed global channel and end-customer base, we have sales professionals in over 80 countries around the world.
Our marketing strategy is focused on building our brand and driving end-customer demand for our security solutions. We use a combination of internal marketing professionals and a network of regional and global channel partners. Our internal marketing organization is responsible for messaging, branding, demand generation, product marketing, channel marketing, event marketing, digital marketing, communications, analyst relations, public relations and sales enablement. We focus our resources on campaigns, programs and activities that can be leveraged by partners worldwide to extend our marketing reach, such as sales tools and collateral, product awards and technical certifications, media engagement, training, regional seminars and conferences, webinars and various other demand-generation activities.
In 2017, we continued to invest in sales and marketing, particularly in the enterprise market where enterprise customers tend to have a higher lifetime value. We intend to continue to make investments in our sales resources and infrastructure and marketing strategy, which are critical to support our growth.
Manufacturing and Suppliers
We outsource the manufacturing of our security appliance products to a variety of contract manufacturers and original design manufacturers. Our current manufacturing partners include Micro-Star International Co., Wistron Corporation, Flextronics International Ltd, Senao Networks, Inc., Adlink Technology, Inc. and a number of manufacturers located in Taiwan and other countries outside the United States. We submit purchase orders to our contract manufacturers that describe the type and quantities of our products to be manufactured, the delivery date and other delivery terms. Once our products are manufactured, they are sent to either our warehouse in California, or to our logistics partner in Taoyuan City, Taiwan, where accessory packaging and quality-control testing are performed. We believe that outsourcing our manufacturing and a substantial portion of our logistics enables us to focus resources on our core competencies. Our proprietary SPUs, which are the key to the performance of our appliances, are built by contract manufacturers including Faraday Technology Corporation (“Faraday”), Kawasaki Microelectronics America, Inc. and Renesas Electronics Corporation (“Renesas”). These contract manufacturers use foundries operated by either United Microelectronics Corporation (“UMC”) or Taiwan Semiconductor Manufacturing Company Limited (“TSMC”), or their own foundry, such as Renesas’ fab.
The components included in our products are sourced from various suppliers by us or more frequently by our contract manufacturers. Some of the components important to our business, including specific types of CPUs from Intel Corporation (“Intel”), network chips from Broadcom Corporation (“Broadcom”), Marvell Technology Group Ltd. (“Marvell”) and Intel, and solid-state drives (silicon-based storage devices) from Intel, ADATA Technology Co., Ltd. (“ADATA”), OCZ Technology Group, Inc. (“OCZ”), Samsung Electronics Co., Ltd. (“Samsung”), and Western Digital Technologies, Inc. (“Western Digital”), are available from a limited or sole source of supply.
We have no long-term contracts related to the manufacturing of our ASICs or other components that guarantee any capacity or pricing terms.
Research and Development
We focus our research and development efforts on developing new products and services, and adding new features to existing products and services. Our development strategy is to identify features, products and systems for both software and hardware that are, or are expected to be, important to our end-customers. Our success in designing, developing, manufacturing and selling new or enhanced products will depend on a variety of factors, including the identification of market demand for new products, product selection, timely implementation of product design and development, product performance, effective manufacturing and assembly processes and sales and marketing. Our research and development expense was
$210.6 million
,
$183.1 million
and
$158.1 million
in 2017, 2016 and 2015, respectively.
6
Intellectual Property
We rely primarily on patent, trademark, copyright and trade secrets laws, confidentiality procedures and contractual provisions to protect our technology. As of
December 31, 2017
, we had 467 issued U.S.- and foreign-issued patents and 291 pending U.S. and foreign patent applications. We also license software from third parties for inclusion in our products, including open source software and other software available on commercially reasonable terms.
Despite our efforts to protect our rights in our technology, unauthorized parties may attempt to copy aspects of our products or obtain and use information that we regard as proprietary. We generally enter into confidentiality agreements with our employees, consultants, vendors and customers, and generally limit access to and distribution of our proprietary information. However, we cannot provide assurance that the steps we take will prevent misappropriation of our technology. In addition, the laws of some foreign countries do not protect our proprietary rights to as great an extent as the laws of the United States, and many foreign countries do not enforce these laws as diligently as government agencies and private parties in the United States.
Our industry is characterized by the existence of a large number of patents and frequent claims and related litigation regarding patent and other intellectual property rights. Third parties have asserted, are currently asserting and may in the future assert patent, copyright, trademark or other intellectual property rights against us, our channel partners or our end-customers. Successful claims of infringement by a third party could prevent us from distributing certain products or performing certain services or require us to pay substantial damages (including treble damages if we are found to have willfully infringed patents or copyrights), royalties or other fees. Even if third parties may offer a license to their technology, the terms of any offered license may not be acceptable and the failure to obtain a license or the costs associated with any license could cause our business, operating results or financial condition to be materially and adversely affected. We typically indemnify our end-customers, distributors and certain resellers against claims that our products infringe the intellectual property of third parties.
Seasonality
For information regarding seasonality in our sales, see the section entitled “Management’s Discussion and Analysis of Financial Condition and Results of Operations—Quarterly Results of Operations—Seasonality, Cyclicality and Quarterly Revenue Trends” in Part II, Item 7 of this Annual Report on Form 10-K.
Competition
The markets for our products are extremely competitive and are characterized by rapid technological change. The principal competitive factors in our markets include the following:
•
product performance, features, effectiveness, interoperability and reliability;
•
our ability to add and integrate new networking and security features and technological expertise;
•
compliance with industry standards and certifications;
•
price of products and services and total cost of ownership;
•
brand recognition;
•
customer service and support;
•
sales and distribution capabilities;
•
size and financial stability of operations; and
•
breadth of product line.
Among others, our competitors include Check Point Software Technologies Ltd. (“Check Point”), Cisco Systems, Inc. (“Cisco”), F5 Networks, Inc. (“F5 Networks”), FireEye, Inc. (“FireEye”), Forcepoint LLC (“Forcepoint”), Imperva, Inc. (“Imperva”), Juniper Networks, Inc. (“Juniper”), McAfee, LLC. (“McAfee”), Palo Alto Networks, Inc. (“Palo Alto Networks”), Proofpoint, Inc. (“Proofpoint”), SonicWALL, Inc. (“SonicWALL”), Sophos Group Plc (“Sophos”), Symantec Corporation (“Symantec”) and Trend Micro Incorporated (“Trend Micro”).
We believe we compete favorably based on our products’ performance, reliability and breadth, our ability to add and integrate new networking and security features and our technological expertise. Several competitors are significantly larger, have greater financial, technical, marketing, distribution, customer support and other resources, are more established than we are and have significantly better brand recognition. Some of these larger competitors have substantially broader product offerings and leverage their relationships based on other products or incorporate functionality into existing products in a manner that discourages users from purchasing our products. Based in part on these competitive pressures, we may lower prices or attempt to add incremental features and functionality.
7
Conditions in our markets could change rapidly and significantly as a result of technological advancements or continuing market consolidation. The development and market acceptance of alternative technologies could decrease the demand for our products or render them obsolete. Our competitors may introduce products that are less costly, provide superior performance, market their products better, or achieve greater market acceptance than us. In addition, our larger competitors often have broader product lines and are in a better position to withstand any significant reduction in capital spending by end-customers in these markets, and will therefore not be as susceptible to downturns in a particular market. The above competitive pressures are likely to continue to impact our business. We may not be able to compete successfully in the future, and competition may harm our business.
Employees
As of
December 31, 2017
, our total headcount was
5,066
employees and contractors. None of our U.S. employees are represented by a labor union; however, our employees in certain European countries have the right to be represented by external labor organizations if they maintain up-to-date union membership. We have not experienced any work stoppages, and we consider our relations with our employees to be good.
Available Information
Our web site is located at www.fortinet.com, and our investor relations web site is located at http://investor.fortinet.com. The information posted on our website is not incorporated by reference into this Annual Report on Form 10-K. Our Annual Report on Form 10-K, Quarterly Reports on Form 10-Q, Current Reports on Form 8-K and amendments to reports filed or furnished pursuant to Sections 13(a) and 15(d) of the Securities Act, are available free of charge on our investor relations web site as soon as reasonably practicable after we electronically file such material with, or furnish it to, the SEC. You may also access all of our public filings through the SEC’s website at www.sec.gov. Further, a copy of this Annual Report on Form 10-K is located at the SEC’s Public Reference Room at 100 F Street, NE, Washington, D.C. 20549. Information on the operation of the Public Reference Room can be obtained by calling the SEC at 1-800-SEC-0330.
We webcast our earnings calls and certain events we participate in or host with members of the investment community on our investor relations web site. Additionally, we provide notifications of news or announcements regarding our financial performance, including SEC filings, investor events, press and earnings releases, as part of our investor relations web site. The contents of these web sites are not intended to be incorporated by reference into this report or in any other report or document we file.
8
Investing in our common stock involves a high degree of risk. Investors should carefully consider the following risks and all other information contained in this Annual Report on Form 10-K, including our consolidated financial statements and the related notes, before investing in our common stock. The risks and uncertainties described below are not the only ones we face. Additional risks and uncertainties that we are unaware of, or that we currently believe are not material, also may become important factors that affect us. If any of the following risks materialize, our business, financial condition and results of operations could be materially harmed. In that case, the trading price of our common stock could decline substantially, and investors may lose some or all of their investment.
Risks Related to Our Business
Our operating results are likely to vary significantly and be unpredictable.
Our operating results have historically varied from period to period, and we expect that they will continue to do so as a result of a number of factors, many of which are outside of our control or may be difficult to predict, including:
|
•
|
our ability to attract and retain new end-customers or sell additional products and subscriptions to our existing end-customers;
|
|
•
|
the level of demand for our products and services, which may render forecasts inaccurate;
|
|
•
|
the timing of channel partner and end-customer orders, and our reliance on a concentration of shipments at the end of each quarter;
|
|
•
|
the timing of shipments, which may depend on factors such as inventory levels, logistics, manufacturing or shipping delays, our ability to ship new products on schedule and our ability to accurately forecast inventory requirements;
|
|
•
|
inventory management;
|
|
•
|
the mix of products sold and the mix of revenue between products and services, as well as the degree to which products and services are bundled and sold together for a package price;
|
|
•
|
the purchasing practices and budgeting cycles of our channel partners and end-customers;
|
|
•
|
the effectiveness of our sales organization, generally or in a particular geographic region, the time it takes to hire sales personnel and the timing of hiring, and our ability to retain, sales personnel;
|
|
•
|
the seasonal buying patterns of our end-customers;
|
|
•
|
the timing and level of our investments in sales and marketing, and the impact of such investments on our operating expenses, operating margin and the productivity and effectiveness of execution of our sales and marketing teams;
|
|
•
|
the timing of revenue recognition for our sales;
|
|
•
|
the level of perceived threats to network security, which may fluctuate from period to period;
|
|
•
|
changes in the requirements, market needs or buying practices and patterns of our distributors, resellers or end-customers;
|
|
•
|
changes in the growth rate of the network security market;
|
|
•
|
the timing and success of new product and service introductions or enhancements by us or our competitors, or any other change in the competitive landscape of our industry, including consolidation among our competitors, partners or end-customers;
|
9
|
•
|
the deferral of orders from distributors, resellers or end-customers in anticipation of new products or product enhancements announced by us or our competitors;
|
|
•
|
increases or decreases in our billings, revenue and expenses caused by fluctuations in foreign currency exchange rates or a strengthening of the U.S. dollar, as a significant portion of our expenses is incurred and paid in currencies other than the U.S. dollar, and the impact such fluctuations may have on the actual prices that our partners and customers are willing to pay for our products and services;
|
|
•
|
compliance with existing laws and regulations that are applicable to our ability to conduct business with the public sector;
|
|
•
|
the impact of cloud-based platforms on the timing of our revenue recognition, billings and free cash flow;
|
|
•
|
decisions by potential end-customers to purchase network security solutions from newer technology providers, from larger, more established security vendors or from their primary network equipment vendors;
|
|
•
|
price competition and increased competitiveness in our market;
|
|
•
|
our ability to both increase revenues and manage and control operating expenses in order to improve our operating margins;
|
|
•
|
changes in customer renewal rates for our services;
|
|
•
|
changes in the payment terms of services contracts or the length of services contracts sold;
|
|
•
|
changes in our estimated annual effective tax rates;
|
|
•
|
changes in circumstances and challenges in business conditions, including decreased demand, which may negatively impact our channel partners’ ability to sell the current inventory they hold and negatively impact their future purchases of products from us;
|
|
•
|
increased demand for cloud-based services and the uncertainty associated with transitioning to providing such services;
|
|
•
|
increased expenses, unforeseen liabilities or write-downs and any impact on results of operations from any acquisition consummated;
|
|
•
|
our channel partners having insufficient financial resources to withstand changes and challenges in business conditions;
|
|
•
|
disruptions in our channel or termination of our relationship with important channel partners, including as a result of consolidation among distributors and resellers of security solutions;
|
|
•
|
insolvency, credit or other difficulties confronting our key suppliers and channel partners, which could affect their ability to purchase or pay for products and services and which could disrupt our supply or distribution chain;
|
|
•
|
policy changes and uncertainty with respect to immigration laws, trade policy, foreign imports and tax laws related to international commerce;
|
|
•
|
political, economic and social instability;
|
|
•
|
general economic conditions, both in domestic and foreign markets;
|
|
•
|
future accounting pronouncements or changes in our accounting policies, such as changes in the revenue recognition standards or accounting for leases, as well as the significant costs that may be incurred to adopt and comply with these new pronouncements;
|
10
|
•
|
possible impairments or acceleration of depreciation of our existing real estate due to our current real estate holdings and future development plans; and
|
|
•
|
legislative or regulatory changes, such as with respect to privacy, information and cybersecurity, exports, the environment and applicable accounting standards.
|
Any one of the factors above or the cumulative effect of some of the factors referred to above may result in significant fluctuations in our quarterly financial and other operating results. This variability and unpredictability could result in our failing to meet our internal operating plan or the expectations of securities analysts or investors for any period. If we fail to meet or exceed such expectations for these or any other reasons, the market price of our shares could fall substantially and we could face costly lawsuits, including securities class action suits. In addition, a significant percentage of our operating expenses are fixed in nature over the near term. Accordingly, in the event of revenue shortfalls, we are generally unable to mitigate the negative impact on margins in the short term.
Adverse economic conditions or reduced information technology spending may adversely impact our business.
Our business depends on the overall demand for information technology and on the economic health of our current and prospective customers. In addition, the purchase of our products is often discretionary and may involve a significant commitment of capital and other resources. Weak global economic conditions and spending environments, weak economic conditions in certain regions or a reduction in information technology spending regardless of macro-economic conditions could have adverse impacts on our business, financial condition and results of operations, including longer sales cycles, lower prices for our products and services, higher default rates among our channel partners, reduced unit sales and slower or declining growth.
Our billings, revenue, operating margin and free cash flow growth may slow or may not continue.
We may experience slowing growth, or a decrease, in billings, revenue, operating margin and free cash flow for a number of reasons, including a slowdown in demand for our products or services, a shift in demand from products to services, increased competition, a decrease in the growth of our overall market or softness in demand in certain geographies or industry verticals, such as the service provider industry, changes in our strategic opportunities and our failure for any reason to continue to capitalize on growth opportunities and due to other risks identified in the risk factors described in this periodic report. Our expenses as a percentage of total revenue may be higher than expected if our revenue is lower than expected and, if our investments in sales and marketing and other functional areas do not result in expected billings and revenue growth, we may experience margin declines and may not be able to sustain profitability in future periods if we fail to increase billings, revenue or deferred revenue, do not appropriately manage our cost structure and free cash flow or encounter unanticipated liabilities. Any failure by us to maintain profitability, maintain our margins and continue our billings, revenue and free cash flow growth could cause the price of our common stock to materially decline.
11
We rely significantly on revenue from FortiGuard security subscription and FortiCare technical support services, and revenue from these services may decline or fluctuate. Because we recognize revenue from these services over the term of the relevant service period, downturns or upturns in sales of FortiGuard security subscription and FortiCare technical support services are not immediately reflected in full in our operating results.
Our FortiGuard security subscription and FortiCare technical support services revenue has historically accounted for a significant percentage of our total revenue. Revenue from the sale of new, or from the renewal of existing, FortiGuard security subscription and FortiCare technical support service contracts may decline and fluctuate as a result of a number of factors, including fluctuations in purchases of FortiGate appliances, changes in the sales mix between products and services, end-customers’ level of satisfaction with our products and services, the prices of our products and services, the prices of products and services offered by our competitors, reductions in our customers’ spending levels and the timing of revenue recognition with respect to these arrangements. If our sales of new, or renewals of existing, FortiGuard security subscription and FortiCare technical support service contracts decline, our revenue and revenue growth may decline and our business could suffer. In addition, in the event significant customers require payment terms for FortiGuard security subscription and FortiCare technical support services in arrears or for shorter periods of time than annually, such as monthly or quarterly, this may negatively impact our billings and revenue. Furthermore, we recognize FortiGuard security subscription and FortiCare technical support services revenue monthly over the term of the relevant service period, which is typically from one to three years, to a lesser extent, five years. As a result, much of the FortiGuard security subscription and FortiCare technical support services revenue we report each quarter is the recognition of deferred revenue from FortiGuard security subscription and FortiCare technical support services contracts entered into during previous quarters or years. Consequently, a decline in new or renewed FortiGuard security subscription and FortiCare technical support services contracts in any one quarter will not be fully reflected in revenue in that quarter but will negatively affect our revenue in future quarters. Accordingly, the effect of significant downturns in sales of new, or renewals of existing, FortiGuard security subscription and FortiCare technical support services is not reflected in full in our statements of operations until future periods. Our FortiGuard security subscription and FortiCare technical support services revenue also makes it difficult for us to rapidly increase our revenue through additional service sales in any period, as revenue from new and renewal support services contracts must be recognized over the applicable service period.
We generate a majority of revenue from sales to distributors, resellers and end-customers outside of the United States, and we are therefore subject to a number of risks associated with international sales and operations.
We market and sell our products throughout the world and have established sales offices in many parts of the world. Our international sales have represented a majority of our total revenue in recent periods. Therefore, we are subject to risks associated with having worldwide operations. We are also subject to a number of risks typically associated with international sales and operations, including:
|
•
|
economic or political instability in foreign markets;
|
|
•
|
greater difficulty in enforcing contracts and accounts receivable collection, including longer collection periods;
|
|
•
|
longer sales processes for larger deals, particularly during the summer months;
|
|
•
|
changes in regulatory requirements;
|
|
•
|
difficulties and costs of staffing and managing foreign operations;
|
|
•
|
the uncertainty of protection for intellectual property rights in some countries;
|
|
•
|
costs of compliance with foreign policies, laws and regulations and the risks and costs of non-compliance with such policies, laws and regulations;
|
|
•
|
protectionist policies and penalties, and local laws, requirements, policies and perceptions that may adversely impact a U.S.-headquartered business’s sales in certain countries outside of the United States;
|
|
•
|
costs of complying with, and the risks and costs of non-compliance with, U.S. or other foreign laws and regulations for foreign operations, including the U.S. Foreign Corrupt Practices Act, the United Kingdom Bribery Act 2010, the General Data Protection Regulation (which will be implemented by the European Union in May 2018), import and export control laws, tariffs, trade barriers and economic sanctions;
|
12
|
•
|
other regulatory or contractual limitations on our ability to sell our products in certain foreign markets, and the risks and costs of non-compliance;
|
|
•
|
heightened risks of unfair or corrupt business practices in certain geographies and of improper or fraudulent sales or sales-related arrangements that could disrupt the sales team through terminations of employment or otherwise, and may adversely impact financial results as compared to those already reported or forecasted and result in restatements of financial statements and irregularities in financial statements;
|
|
•
|
our ability to effectively implement and maintain adequate internal controls to properly manage our international sales and operations;
|
|
•
|
the potential for political unrest, changes and uncertainty, and for terrorism, hostilities, war or natural disasters;
|
|
•
|
changes in foreign currency exchange rates;
|
|
•
|
management communication and integration problems resulting from cultural differences and geographic dispersion; and
|
|
•
|
changes in tax, employment and other laws.
|
Product and service sales and employee and contractor matters may be subject to foreign governmental regulations, which vary substantially from country to country. Further, we may be unable to keep up-to-date with changes in government requirements as they change over time. Failure to comply with these regulations could result in adverse effects to our business. In many foreign countries, it is common for others to engage in business practices that are prohibited by our internal policies and procedures or U.S. regulations applicable to us. Although we implemented policies and procedures designed to ensure compliance with these laws and policies, there can be no assurance that all of our employees, contractors, channel partners and agents will comply with these laws and policies. Violations of laws or key control policies by our employees, contractors, channel partners or agents could result in litigation, regulatory action, costs of investigation, delays in revenue recognition, delays in financial reporting, financial reporting misstatements, fines, penalties or the prohibition of the importation or exportation of our products and services, any of which could have a material adverse effect on our business and results of operations.
If we are not successful in continuing to execute our strategy to increase our sales to large and medium-sized end-customers, our results of operations may suffer.
An important part of our growth strategy is to increase sales of our products to large and medium-sized businesses, service providers and government organizations. While we have increased sales in recent periods to large and medium-sized businesses, our sales volume varies by quarter. Such sales are often for a longer contract term and may be at higher discount levels. We also have experienced uneven traction selling to certain government organizations and service providers, and there can be no assurance that we will be successful selling to these customers. Sales to these organizations involve risks that may not be present, or that are present to a lesser extent, with sales to smaller entities. These risks include:
|
•
|
increased competition from competitors that traditionally target large and medium-sized businesses, service providers and government organizations and that may already have purchase commitments from those end-customers;
|
|
•
|
increased purchasing power and leverage held by large end-customers in negotiating contractual arrangements;
|
|
•
|
unanticipated changes in the capital resources or purchasing behavior of large end-customers, including changes in the volume and frequency of their purchases and changes in the mix of products and services and related payment terms;
|
|
•
|
more stringent support requirements in our support service contracts, including stricter support response times, more complex requirements and increased penalties for any failure to meet support requirements;
|
|
•
|
longer sales cycles and the associated risk that substantial time and resources may be spent on a potential end-customer that elects not to purchase our products and services; and
|
13
|
•
|
longer ramp-up periods for enterprise sales personnel as compared to other sales personnel.
|
Large and medium-sized businesses, service providers and government organizations often undertake a significant evaluation process that results in a lengthy sales cycle, in some cases longer than 12 months. Although we have a channel sales model, our sales representatives typically engage in direct interaction with end-customers, along with our distributors and resellers, in connection with sales to large and medium-sized end-customers. We may spend substantial time, effort and money in our sales efforts without being successful in producing any sales. In addition, product purchases by large and medium-sized businesses, service providers and government organizations are frequently subject to budget constraints, multiple approvals and unplanned administrative, processing and other delays. Furthermore, service providers represent our largest industry vertical and consolidation or continued changes in buying behavior by larger customers within this industry could negatively impact our business. Large and medium-sized businesses, service providers and government organizations typically have longer implementation cycles, require greater product functionality and scalability, expect a broader range of services, including design services, demand that vendors take on a larger share of risks, require acceptance provisions that can lead to a delay in revenue recognition and expect greater payment flexibility from vendors. In addition, large and medium-sized businesses, service providers and government organizations may require that our products and services be sold differently from how we offer our products and services, which could negatively impact our operating results. Our large business and service provider customers may also become more deliberate in their purchases as they plan their next-generation network security architecture, leading them to take more time in making purchasing decisions or to purchase based only on their immediate needs. All these factors can add further risk to business conducted with these customers. In addition, if sales expected from a large and medium-sized end-customer for a particular quarter are not realized in that quarter or at all, our business, operating results and financial condition could be materially and adversely affected.
Managing inventory of our products and product components is complex. Insufficient inventory may result in lost sales opportunities or delayed revenue, while excess inventory may harm our gross margins.
Managing our inventory is complex. Our channel partners may increase orders during periods of product shortages, cancel orders or not place orders commensurate with our expectations if their inventory is too high, return products or take advantage of price protection (if any is available to the particular partner) or delay orders in anticipation of new products, and accurately forecasting inventory requirements and demand can be challenging. Our channel partners also may adjust their orders in response to the supply of our products and the products of our competitors that are available to them and in response to seasonal fluctuations in end-customer demand. Furthermore, if the time required to manufacture or ship certain products increases for any reason, inventory shortfalls could result. Management of our inventory is further complicated by the significant number of different products and models that we sell which may impact our billings, revenue and free cash flow. Mismanagement of our inventory, whether due to imprecise forecasting, employee errors or malfeasance, inaccurate information or otherwise, may adversely affect our results of operations.
Inventory management remains an area of focus as we balance the need to maintain inventory levels that are sufficient to ensure competitive lead times against the risk of inventory obsolescence because of rapidly changing technology and customer requirements, or excess inventory levels. If we ultimately determine that we have excess inventory, we may have to reduce our prices and write-down inventory, which in turn could result in lower gross margins. Alternatively, insufficient inventory levels may lead to shortages that result in delayed revenue or loss of sales opportunities altogether as potential end-customers turn to competitors’ products that are readily available. For example, we have in the past experienced inventory shortages and excesses due to the variance in demand for certain products from forecasted amounts. In addition, for those channel partners that have rights of return, inventory held by such channel partners affects our results of operations. Our inventory management systems and related supply chain visibility tools may be inadequate to enable us to effectively manage inventory. If we are unable to effectively manage our inventory and that of our channel partners, our results of operations could be adversely affected.
14
We are dependent on the continued services and performance of our senior management, the loss of any of whom could adversely affect our business, operating results and financial condition.
Our future performance depends on the continued services and continuing contributions of our senior management to execute on our business plan and to identify and pursue new opportunities and product innovations. The loss of services of members of senior management, particularly Ken Xie, our Co-Founder, Chief Executive Officer and Chairman or Michael Xie, our Co-Founder, President and Chief Technology Officer, or of any of our senior sales leaders or functional area leaders, could significantly delay or prevent the achievement of our development and strategic objectives. In February 2018, we underwent a transition in senior management as Drew Del Matto resigned as our Chief Financial Officer and Keith Jensen was appointed as our Interim Chief Financial Officer. The loss of the services or the distraction of our senior management for any reason could adversely affect our business, financial condition and results of operations.
If we are unable to hire, retain and motivate qualified personnel, our business will suffer.
Our future success depends, in part, on our ability to continue to attract and retain highly skilled personnel. The loss of the services of any of our key personnel, the inability to attract or retain qualified personnel, or delays in hiring required personnel, particularly in engineering, sales and marketing, may seriously harm our business, financial condition and results of operations. From time to time, we experience turnover in our management-level personnel. None of our key employees has an employment agreement for a specific term, and any of our employees may terminate their employment at any time. Our ability to continue to attract and retain highly skilled personnel will be critical to our future success. Competition for highly skilled personnel is frequently intense, especially for qualified employees in network security and especially in the locations where we have a substantial presence and need for highly skilled personnel, such as the San Francisco Bay Area and Vancouver, Canada. We may not be successful in attracting, assimilating or retaining qualified personnel to fulfill our current or future needs. Also, to the extent we hire personnel from competitors, we may be subject to allegations that they have been improperly solicited or divulged proprietary or other confidential information. Changes in immigration laws, including changes to the rules regarding H1-B visas, may also harm our ability to attract personnel from other countries.
If we do not increase the effectiveness of our sales organization, we may have difficulty adding new end-customers or increasing sales to our existing end-customers and our business may be adversely affected.
Although we have a channel sales model, members of our sales organization often engage in direct interaction with our prospective end-customers. Therefore, we continue to be substantially dependent on our sales organization to obtain new end-customers and sell additional products and services to our existing end-customers. There is significant competition for sales personnel with the skills and technical knowledge that we require. Our ability to grow our revenue depends, in large part, on our success in recruiting, training and retaining sufficient numbers of sales personnel to support our growth and on the effectiveness of those personnel. New hires require substantial training and may take significant time before they achieve full productivity. Our recent hires and planned hires may not become productive as quickly as we expect, and we may be unable to hire or retain sufficient numbers of qualified individuals in the markets where we do business or plan to do business. For example, we realigned our sales organization in early 2016 and it has taken more time than we expected to ramp up the productivity of our realigned sales organization. Furthermore, hiring sales personnel in new countries requires additional setup and upfront costs that we may not recover if the sales personnel fail to achieve full productivity. If our sales employees do not become fully productive on the timelines that we have projected, our revenue will not increase at anticipated levels and our ability to achieve long-term projections may be negatively impacted. If we are unable to hire and train sufficient numbers of effective sales personnel, or the sales personnel are not successful in obtaining new end-customers or increasing sales to our existing customer base, our business, operating results and prospects will be adversely affected.
15
The sales prices of our products and services may decrease, which may reduce our gross profits and operating margin, and which may adversely impact our financial results and the trading price of our common stock.
The sales prices for our products and services may decline for a variety of reasons, including competitive pricing pressures, discounts or promotional programs we offer, a change in our mix of products and services and anticipation of the introduction of new products and services. Competition continues to increase in the market segments in which we participate, and we expect competition to further increase in the future, thereby leading to increased pricing pressures. Larger competitors with more diverse product offerings may reduce the price of products and services that compete with ours in order to promote the sale of other products or services or may bundle them with other products or services. Additionally, although we price our products and services worldwide in U.S. dollars, currency fluctuations in certain countries and regions have in the past, and may in the future, negatively impact actual prices that partners and customers are willing to pay in those countries and regions. Furthermore, we anticipate that the sales prices and gross profits for our products or services will decrease over product life cycles. We cannot ensure that we will be successful in developing and introducing new offerings with enhanced functionality on a timely basis, or that our product and service offerings, if introduced, will enable us to maintain our prices, gross profits and operating margin at levels that will allow us to maintain profitability.
Reliance on a concentration of shipments at the end of the quarter could cause our billings and revenue to fall below expected levels.
As a result of customer-buying patterns and the efforts of our sales force and channel partners to meet or exceed quarterly quotas, we have historically received a substantial portion of each quarter’s sales orders and generated a substantial portion of each quarter’s billings and revenue during the last two weeks of the quarter. If expected orders at the end of any quarter are delayed for any reason, including the failure of anticipated purchase orders to materialize, our logistics partners’ inability to ship products prior to quarter-end to fulfill purchase orders received near the end of the quarter, our failure to accurately forecast our inventory requirements and to appropriately manage inventory to meet demand, our inability to release new products on schedule, any failure of our systems related to order review and processing, any delays in shipments due to trade compliance requirements, labor disputes or logistics changes at shipping ports or otherwise, our billings and revenue for that quarter could fall below our expectations or those of securities analysts and investors, resulting in a decline in our stock price.
Unless we continue to develop better market awareness of our company and our products, and to improve lead generation and sales enablement, our revenue may not continue to grow.
Increased market awareness of our capabilities and products and increased lead generation are essential to our continued growth and our success in all of our markets, particularly for the large businesses, service provider and government organization market. We have historically had relatively low spending on marketing activities. While we have increased our investments in sales and marketing, it is not clear that these investments will continue to result in increased revenue. If our investments in additional sales personnel or if our marketing programs are not successful in continuing to create market awareness of our company and products or increasing lead generation, or if we experience turnover and disruption in our sales and marketing teams, we will not be able to achieve sustained growth, and our business, financial condition and results of operations will be adversely affected.
We rely on third-party channel partners to generate substantially all of our revenue. If our partners fail to perform, our ability to sell our products and services will be limited, and if we fail to optimize our channel partner model going forward, our operating results will be harmed.
A significant portion of our sales is generated through a limited number of distributors, and substantially all of our revenue is generated through sales by our channel partners, including distributors and resellers. We depend on our channel partners to generate a significant portion of our sales opportunities and to manage our sales process. To the extent our channel partners are unsuccessful in selling our products, or we are unable to enter into arrangements with and retain a sufficient number of high-quality channel partners in each of the regions in which we sell products, or if we are unable to keep them motivated to sell our products, our ability to sell our products and operating results will be harmed. The termination of our relationship with any significant channel partner may adversely impact our sales and operating results.
16
We provide sales channel partners with specific programs to assist them in selling our products and incentivize them to sell our products, but there can be no assurance that these programs will be effective. In addition, our channel partners may be unsuccessful in marketing, selling and supporting our products and services and may purchase more inventory than they can sell. Our channel partners generally do not have minimum purchase requirements. Some of our channel partners may have insufficient financial resources to withstand changes and challenges in business conditions. In addition, if our channel partners’ financial condition or operations weaken it could negatively impact their ability to sell our product and services. Our channel partners may also market, sell and support products and services that are competitive with ours, and may devote more resources to the marketing, sales and support of such products. They may also have incentives to promote our competitors’ products to the detriment of our own, or they may cease selling our products altogether. We cannot ensure that we will retain these channel partners or that we will be able to secure additional or replacement partners or that existing channel partners will continue to perform. The loss of one or more of our significant channel partners or the failure to obtain and ship a number of large orders each quarter through them could harm our operating results.
In addition, we may be impacted by consolidation of our existing channel partners. In such instances, we may experience changes to our overall business and operational relationships due to dealing with a larger combined entity, and our ability to maintain such relationships on favorable contractual terms may be more limited. We may also become increasingly dependent on a more limited number of channel partners, as consolidation increases the relative proportion of our business for which each channel partner is responsible, which may magnify the risks described in the preceding paragraphs. In July 2017, Exclusive, which distributes our solutions to a large group of resellers and end-customers, acquired Fine Tec U.S. Since the acquisition of Fine Tec U.S., Exclusive’s business with us has increased and may continue to increase in the future. The two channel partners together accounted for 35% of our total net accounts receivable as of December 31, 2017 and
25%
of our total revenue during 2017. In the fourth quarter of 2017, the combined Exclusive/Fine Tec U.S. entity accounted for 30% of our total revenue. During 2015 and 2016, Exclusive accounted for
18%
and
20%
of our total revenue, respectively.
In addition, any new sales channel partner will require extensive training and may take several months or more to achieve productivity. Our channel partner sales structure could subject us to lawsuits, potential liability and reputational harm if, for example, any of our channel partners misrepresent the functionality of our products or services to end-customers or our channel partners violate laws or our corporate policies. We depend on our global channel partners to comply with applicable legal and regulatory requirements. To the extent that they fail to do so, that could have a material adverse effect on our business, operating results and financial condition. If we fail to optimize our channel partner model or fail to manage existing sales channels, our business will be seriously harmed.
Actual, possible or perceived defects or vulnerabilities in our products or services, the failure of our products or services to prevent a virus or security breach or the misuse of our products could harm our reputation and divert resources.
Because our products and services are complex, they have contained and may contain defects or errors that are not detected until after their commercial release and deployment by our customers. Defects or vulnerabilities may impede or block network traffic, cause our products or services to be vulnerable to electronic break-ins or cause them to fail to help secure networks. Different customers deploy and use our products in different ways, and certain deployments and usages may subject our products to adverse conditions that may negatively impact the effectiveness and useful lifetime of our products. Our networks and products, including cloud-based technology and subscriptions, could be targeted by attacks specifically designed to disrupt our business and harm our reputation. We cannot ensure that our products will prevent all security threats. Because the techniques used by computer hackers to access or sabotage networks change frequently and generally are not recognized until launched against a target, we may be unable to anticipate these techniques. In addition, defects or errors in our FortiGuard security subscription updates or our FortiGate appliances could result in a failure of our FortiGuard security subscription services to effectively update end-customers’ FortiGate appliances and cloud-based products and thereby leave customers vulnerable to attacks. Furthermore, our solutions may also fail to detect or prevent viruses, worms or similar threats due to a number of reasons such as the evolving nature of such threats and the continual emergence of new threats that we may fail to add to our FortiGuard databases in time to protect our end-customers’ networks. Our FortiGuard or FortiCare data centers and networks may also experience technical failures and downtime, and may fail to distribute appropriate updates, or fail to meet the increased requirements of our customer base. Any such technical failure, downtime or failures in general may temporarily or permanently expose our end-customers’ networks, leaving their networks unprotected against the latest security threats.
An actual, possible or perceived security breach or infection of the network of one of our end-customers, regardless of whether the breach is attributable to the failure of our products or services to prevent the security breach, could adversely affect the market’s perception of our security products and services and, in some instances, subject us to potential liability that is not contractually limited. We may not be able to correct any security flaws or vulnerabilities promptly, or at all. Our products may also be misused by end-customers or third parties who obtain access to our products. For example, our products could be used to censor private access to certain information on the internet. Such use of our products for censorship could result in negative
17
press coverage and negatively affect our reputation, even if we take reasonable measures to prevent any improper shipment of our products or if our products are provided by an unauthorized third party. Any actual, possible or perceived defects, errors or vulnerabilities in our products, or misuse of our products, could result in:
|
•
|
the expenditure of significant financial and product development resources in efforts to analyze, correct, eliminate or work around errors or defects or to address and eliminate vulnerabilities;
|
|
•
|
the loss of existing or potential end-customers or channel partners;
|
|
•
|
delayed or lost revenue;
|
|
•
|
delay or failure to attain market acceptance;
|
|
•
|
negative publicity and harm to our reputation; and
|
|
•
|
litigation, regulatory inquiries or investigations that may be costly and harm our reputation and, in some instances, subject us to potential liability that is not contractually limited.
|
Our business and operations have experienced growth, and if we do not appropriately manage any future growth, including through the expansion of our real estate holdings, or are unable to improve our systems and processes, our operating results will be negatively affected.
Our business has grown over the last several years. We rely heavily on information technology and accounting systems to help manage critical functions such as order processing, revenue recognition, financial forecasts, inventory and supply chain management and trade compliance reviews. Certain of these systems were developed by us for our internal use and, as such, may have a higher risk of failure or not receive the same level of support as systems purchased from and supported by external technology companies. In addition, we have been slow to adopt and implement certain automated functions, which could have a negative impact on our business. For example, a large part of our order processing relies on manual data entry
of customer purchase orders received through email and, to a lesser extent, through electronic data interchange
from our customers. Combined with the fact that we may receive a large amount of our orders in the last few weeks of any given quarter, an interruption in our email service or other systems could result in delayed order fulfillment and decreased billings and revenue for that quarter.
To manage any future growth effectively, we must continue to improve and expand our information technology and financial, operating and administrative systems and controls, and continue to manage headcount, capital and processes in an efficient manner. We may not be able to successfully implement requisite improvements to these systems, controls and processes, such as system capacity, access and change management controls, in a timely or efficient manner. Our failure to improve our systems and processes, or their failure to operate in the intended manner, whether as a result of the significant growth of our business or otherwise, may result in our inability to manage the growth of our business and to accurately forecast our revenue, expenses and earnings, or to prevent certain losses. Moreover, the failure of our systems and processes could undermine our ability to provide accurate, timely and reliable reports on our financial and operating results and could impact the effectiveness of our internal control over financial reporting. In addition, our systems and processes may not prevent or detect all errors, omissions or fraud. Our productivity and the quality of our products and services may also be adversely affected if we do not integrate and train our new employees quickly and effectively. Any future growth would add complexity to our organization and require effective coordination throughout our organization. Failure to manage any future growth effectively could result in increased costs and harm our results of operations.
We have expanded our office real estate holdings to meet our projected growing need for office space. We purchased office buildings in Ottawa and Burnaby, Canada in 2017, and we have purchased various small buildings adjacent to our Sunnyvale headquarters as we expand our headquarters in Sunnyvale, California. These plans will require significant capital expenditure over the next several years and involve certain risks, including impairment charges and acceleration of depreciation, changes in future business strategy that may decrease the need for expansion (such as a decrease in headcount) and, risks related to construction. Future changes in growth or fluctuations in cash flow may also negatively impact our ability to pay for these projects or free cash flow. Additionally, inaccuracies in our projected capital expenditures could negatively impact our business, operating results and financial condition.
18
We may experience difficulties maintaining and expanding our ERP and CRM systems.
The maintenance of our ERP and CRM systems has required, and will continue to require, the investment of significant financial and human resources. In addition, we may choose to upgrade or expand the functionality of our ERP and CRM systems, leading to additional costs. We may also discover deficiencies in our design or maintenance of the ERP or CRM systems that could adversely affect our ability to process orders, ship products, provide services and customer support, send invoices and track payments, fulfill contractual obligations, accurately maintain books and records, provide accurate, timely and reliable reports on our financial and operating results, or otherwise operate our business. Additionally, if the system does not operate as intended, the effectiveness of our internal control over financial reporting could be adversely affected or our ability to assess it adequately could be delayed. Further, we recently implemented new systems to comply with the new revenue recognition standard and may further expand the scope of our ERP and CRM systems. Our operating results may be adversely affected if these upgrades or expansions are delayed or if the systems do not function as intended or are not sufficient to meet our revenue recognition accounting requirements.
If our estimates or judgments relating to our critical accounting policies are based on assumptions that change or prove to be incorrect, our operating results could fall below expectations of securities analysts and investors, resulting in a decline in our stock price.
The preparation of financial statements in conformity with generally accepted accounting principles requires management to make estimates and assumptions that affect the amounts reported in the consolidated financial statements and accompanying notes. We base our estimates on historical experience and on various other assumptions that we believe to be reasonable under the circumstances, as provided in “Management’s Discussion and Analysis of Financial Condition and Results of Operations” in this Annual Report on Form 10-K, the results of which form the basis for making judgments about the carrying values of assets and liabilities that are not readily apparent from other sources. Additionally, in connection with adopting and implementing the new revenue accounting standard, management will make judgments and assumptions based on our interpretation of the new standard. The new revenue standard is principles based and interpretation of those principles may vary from company to company based on their unique circumstances. It is possible that interpretation, industry practice and guidance may evolve as we work toward implementing the new standard. Our operating results may be adversely affected if our assumptions change or if actual circumstances differ from those in our assumptions, which could cause our operating results to fall below the expectations of securities analysts and investors, resulting in a decline in our stock price. Significant assumptions and estimates used in preparing our consolidated financial statements include those related to revenue recognition and sales return reserves, stock-based compensation expense, valuation of inventory, investments, accounting for business combination, goodwill and other long-lived assets, restructuring, accounting for income taxes, and litigation and settlement costs.
We offer retroactive price protection to certain of our major distributors, and if we fail to balance their inventory with end-customer demand for our products, our allowance for price protection may be inadequate, which could adversely affect our results of operations.
We provide certain of our major distributors with price protection rights for inventories of our products held by them. If we reduce the list price of our products, certain distributors receive refunds or credits from us that reduce the price of such products held in their inventory based upon the new list price. Future credits for price protection will depend on the percentage of our price reductions for the products in inventory and our ability to manage the levels of our major distributors’ inventories. If future price protection adjustments are higher than expected, our future results of operations could be materially and adversely affected.
19
Because we depend on several third-party manufacturers to build our products, we are susceptible to manufacturing delays that could prevent us from shipping customer orders on time, if at all, and may result in the loss of sales and customers, and third-party manufacturing cost increases could result in lower gross margins and free cash flow.
We outsource the manufacturing of our security appliance products to contract manufacturing partners and original design manufacturing partners including Micro-Star International Co., Ltd., Wistron Corporation, Flex Ltd., Senao Networks, Inc., ADLINK Technology, Inc. and a number of manufacturers located in Taiwan and other countries outside the United States. Our reliance on our third-party manufacturers in Asia and elsewhere reduces our control over the manufacturing process, exposing us to risks, including reduced control over quality assurance and product costs, supply and timing. Any manufacturing disruption by our third-party manufacturers could impair our ability to fulfill orders. If we are unable to manage our relationships with these third-party manufacturers effectively, or if these third-party manufacturers experience delays, increased manufacturing lead-times, disruptions, capacity constraints or quality control problems in their manufacturing operations, or fail to meet our future requirements for timely delivery, our ability to ship products to our customers could be impaired and our business would be seriously harmed.
These manufacturers fulfill our supply requirements on the basis of individual purchase orders. We have no long-term contracts or arrangements with our third-party manufacturers that guarantee capacity, the continuation of particular payment terms or the extension of credit limits. Accordingly, they are not obligated to continue to fulfill our supply requirements, and the prices we are charged for manufacturing services could be increased on short notice. If we are required to change third-party manufacturers, our ability to meet our scheduled product deliveries to our customers would be adversely affected, which could cause the loss of sales and existing or potential customers, delayed revenue or an increase in our costs, which could adversely affect our gross margins. Our individual product lines are generally manufactured by only one manufacturing partner. Any production or shipping interruptions for any reason, such as a natural disaster, epidemic, capacity shortages, quality problems or strike or other labor disruption at one of our manufacturing partners or locations or at shipping ports or locations, would severely affect sales of our product lines manufactured by that manufacturing partner. Furthermore, manufacturing cost increases for any reason could result in lower gross margins.
Our proprietary SPU, which is the key to the performance of our appliances, is built by contract manufacturers including Faraday, MegaChips Corporation and Renesas. These contract manufacturers use foundries operated by UMC, TSMC or Renesas on a purchase-order basis, and these foundries do not guarantee their capacity and could reject orders or increase their pricing. Accordingly, the foundries are not obligated to continue to fulfill our supply requirements, and due to the long lead time that a new foundry would require, we could suffer temporary or long-term inventory shortages of our SPU as well as increased costs. In addition to our proprietary SPU, we also purchase off-the-shelf ASICs from vendors for which we have experienced, and may continue to experience, long lead times. Our suppliers may also prioritize orders by other companies that order higher volumes or more profitable products. If any of these manufacturers materially delays its supply of ASICs or specific product models to us, or requires us to find an alternate supplier and we are not able to do so on a timely and reasonable basis, or if these foundries materially increase their prices for fabrication of our ASICs, our business would be harmed.
In addition, our reliance on third-party manufacturers and foundries limits our control over environmental regulatory requirements such as the hazardous substance content of our products and therefore our ability to ensure compliance with the Restriction of Hazardous Substances Directive (the “EU RoHS”) adopted in the European Union (the “EU”) and other similar laws. It also exposes us to the risk that certain minerals and metals, known as “conflict minerals,” that are contained in our products have originated in the Democratic Republic of the Congo or an adjoining country. As a result of the passage of the Dodd-Frank Wall Street Reform and Consumer Protection Act of 2010 (“Dodd-Frank”), the SEC adopted disclosure requirements for public companies whose products contain conflict minerals that are necessary to the functionality or production of such products. Under these rules, we are required to obtain sourcing data from suppliers, perform supply chain due diligence, and file annually with the SEC a specialized disclosure report on Form SD covering the prior calendar year. Although the SEC has provided guidance with respect to a portion of the conflict minerals filing requirements that somewhat reduced the reporting required, we have incurred and expect to incur additional costs to comply with the rules, including costs related to efforts to determine the origin, source and chain of custody of the conflict minerals used in our products and the adoption of conflict minerals-related governance policies, processes and controls. Moreover, the implementation of these compliance measures could adversely affect the sourcing, availability and pricing of materials used in the manufacture of our products to the extent that there may be only a limited number of suppliers that are able to meet our sourcing requirements. There can be no assurance that we will be able to obtain such materials in sufficient quantities or at competitive prices. We may also encounter customers who require that all of the components of our products be certified as conflict-free. If we are not able to meet customer requirements, such customers may choose to not purchase our products, which could impact our sales and the value of portions of our inventory.
20
Because some of the key components in our products come from limited sources of supply, we are susceptible to supply shortages, long lead times for components, and supply changes, each of which could disrupt or delay our scheduled product deliveries to our customers, result in inventory shortage, cause loss of sales and customers or increase component costs resulting in lower gross margins and free cash flow.
We and our contract manufacturers currently purchase several key parts and components used in the manufacture of our products from limited sources of supply. We are therefore subject to the risk of shortages and long lead times in the supply of these components and the risk that component suppliers discontinue or modify components used in our products. We have in the past experienced, and are currently experiencing, shortages and long lead times for certain components. Certain of our limited source components for particular appliances and suppliers of those components include: specific types of CPUs from Intel, network chips from Broadcom, Marvell and Intel, and memory devices from Intel, ADATA, OCZ, Samsung and Western Digital. We also may face shortages in the supply of the capacitors and resistors that are used in the manufacturing of our products. The introduction by component suppliers of new versions of their products, particularly if not anticipated by us or our contract manufacturers, could require us to expend significant resources to incorporate these new components into our products. In addition, if these suppliers were to discontinue production of a necessary part or component, we would be required to expend significant resources and time in locating and integrating replacement parts or components from another vendor. Qualifying additional suppliers for limited source parts or components can be time-consuming and expensive.
Our manufacturing partners have experienced long lead times for the purchase of components incorporated into our products. Lead times for components may be adversely impacted by factors outside of our control, such as natural disasters and other factors. Our reliance on a limited number of suppliers involves several additional risks, including:
|
•
|
a potential inability to obtain an adequate supply of required parts or components when required;
|
|
•
|
financial or other difficulties faced by our suppliers;
|
|
•
|
infringement or misappropriation of our intellectual property;
|
|
•
|
price increases;
|
|
•
|
failure of a component to meet environmental or other regulatory requirements;
|
|
•
|
failure to meet delivery obligations in a timely fashion; and
|
|
•
|
failure in component quality.
|
The occurrence of any of these events would be disruptive to us and could seriously harm our business. Any interruption or delay in the supply of any of these parts or components, or the inability to obtain these parts or components from alternate sources at acceptable prices and within a reasonable amount of time, would harm our ability to meet our scheduled product deliveries to our distributors, resellers and end-customers. This could harm our relationships with our channel partners and end-customers and could cause delays in shipment of our products and adversely affect our results of operations. In addition, increased component costs could result in lower gross margins.
We are exposed to fluctuations in currency exchange rates, which could negatively affect our financial condition and results of operations.
A significant portion of our operating expenses are incurred outside the United States. These expenses are denominated in foreign currencies and are subject to fluctuations due to changes in foreign currency exchange rates, particularly changes in the Euro and Canadian dollar and, to a lesser extent, the British pound. Additionally, fluctuations in the exchange rate of the Canadian dollar may negatively impact our development plans in Burnaby, Canada. While we are not currently engaged in material hedging activities, we have been hedging currency exposures relating to certain balance sheet accounts through the use of forward exchange contracts. If we stop hedging against any of these risks or if our attempts to hedge against these currency exposures are not successful, our financial condition and results of operations could be adversely affected. Our sales contracts are primarily denominated in U.S. dollars and therefore, while substantially all of our revenue is not subject to foreign currency risk, it does not serve as a hedge to our foreign currency-denominated operating expenses. In addition, a strengthening of the U.S. dollar may increase the real cost of our products to our customers outside of the United States, which may also adversely affect our financial condition and results of operations.
21
Failure to comply with laws and regulations applicable to our business could subject us to fines and penalties and could also cause us to lose end-customers in the public sector or negatively impact our ability to contract with the public sector.
Our business is subject to regulation by various federal, state, local and foreign governmental agencies, including agencies responsible for monitoring and enforcing employment and labor laws, workplace safety, product safety, product labeling, environmental laws, consumer protection laws, anti-bribery laws, data privacy laws, import and export controls, federal securities laws and tax laws and regulations. In certain jurisdictions, these regulatory requirements may be more stringent than in the United States. Noncompliance with applicable regulations or requirements could subject us to investigations, sanctions, enforcement actions, disgorgement of profits, fines, damages and civil and criminal penalties or injunctions. If any governmental sanctions are imposed, or if we do not prevail in any possible civil or criminal litigation, our business, operating results and financial condition could be adversely affected. In addition, responding to any action will likely result in a significant diversion of management’s attention and resources and an increase in professional fees. Enforcement actions and sanctions could harm our business, operating results and financial condition.
For example, with respect to data privacy, in April 2016, the European Parliament approved the General Data Protection Regulation (the “GDPR”), which will come into effect in May 2018 and supersede current EU data protection regulations. The GDPR will impose stringent data handling requirements on companies that receive or process personal data of residents of the EU, and non-compliance with the GDPR could result in significant penalties, including data protection audits and heavy fines. Compliance with, and the other burdens imposed by, the GDPR may limit our ability to operate or expand our business in Europe and could adversely impact our operating results. Any noncompliance with the GDPR, whether perceived or actual, could also adversely impact our operating results.
Selling our solutions to the U.S. government, whether directly or through channel partners, also subjects us to certain regulatory and contractual requirements. Failure to comply with these requirements by either us or our channel partners could subject us to investigations, fines, other penalties and damages, which could have an adverse effect on our business, operating results, financial condition and prospects. As an example, the U.S. Department of Justice (the “DOJ”), on its own behalf or on behalf of the General Services Administration (the “GSA”), as well as individuals, has in the past pursued claims against, reached financial settlements with or otherwise obtained damages from companies that sell electronic equipment and from IT vendors under the False Claims Act and other statutes related to pricing, discount practices and compliance with laws related to sales to the federal government, such as the Trade Agreements Act. The DOJ continues to actively pursue such claims. Violations of certain regulatory and contractual requirements could also result in us being suspended or debarred from
future government contracting. Any of these outcomes could have an adverse effect on our revenue, operating results, financial condition and prospects. See Part I, Item 3 of this Annual Report on Form 10-K for more information on our legal proceedings.
These laws and regulations impose added costs on our business, and failure to comply with these or other applicable regulations and requirements, including non-compliance in the past, could lead to claims for damages from our channel partners, penalties, termination of contracts, loss of exclusive rights in our intellectual property and temporary suspension or permanent debarment from government contracting. Any such damages, penalties, disruptions or limitations in our ability to do business with the public sector could have an adverse effect on our business and operating results.
We are subject to governmental export and import controls that could subject us to liability or restrictions on sales, and could impair our ability to compete in international markets.
Because we incorporate encryption technology into our products, certain of our products are subject to U.S. export controls and may be exported outside the United States only with the required export license or through an export license exception, and may be prohibited altogether from export to certain countries. If we were to fail to comply with U.S. export laws, U.S. Customs regulations and import regulations, U.S. economic sanctions and other countries’ import and export laws, we could be subject to substantial civil and criminal penalties, including fines for the company and incarceration for responsible employees and managers, and the possible loss of export or import privileges. In addition, if our channel partners fail to obtain appropriate import, export or re-export licenses or permits (e.g. for stocking orders placed by our partners), we may also be adversely affected through reputational harm and penalties and we may not be able to provide support related to appliances shipped pursuant to such orders. Obtaining the necessary export license for a particular sale may be time-consuming and may result in the delay or loss of sales opportunities.
22
Furthermore, U.S. export control laws and economic sanctions prohibit the shipment of certain products to U.S. embargoed or sanctioned countries, governments and persons. Even though we take precautions to prevent our product from being shipped to U.S. sanctions targets, our products could be shipped to those targets by our channel partners, despite such precautions. Any such shipment could have negative consequences including government investigations and penalties and reputational harm. In addition, various countries regulate the import of certain encryption technology, including import permitting and licensing requirements, and have enacted laws that could limit our ability to distribute our products or could limit our customers’ ability to implement our products in those countries. Changes in our products or changes in export and import regulations may create delays in the introduction of our products in international markets, prevent our customers with international operations from deploying our products globally or, in some cases, prevent the export or import of our products to certain countries, governments or persons altogether. Any change in export or import regulations, economic sanctions or related legislation, shift in the enforcement or scope of existing regulations, or change in the countries, governments, persons or technologies targeted by such regulations, could result in decreased use of our products by, or in our decreased ability to export or sell our products to, existing or potential customers with international operations. Any decreased use of our products or limitation on our ability to export or sell our products would likely adversely affect our business, financial condition and results of operations.
Efforts to withdraw from or materially modify NAFTA or other international trade agreements, to change tax provisions related to global manufacturing and sales or to impose new tariffs, economic sanctions or related legislation, any of which could our adversely affect our financial condition and results of operations.
Our business benefits from free trade agreements, such as the North American Free Trade Agreement (“NAFTA”), and we also rely on various U.S. corporate tax provisions related to international commerce, as we develop, market and sell our products and services globally. Efforts to withdraw from or materially modify NAFTA or other international trade agreements, or to change corporate tax policy related to international commerce, could adversely affect our financial condition and results of operations as could the continuing uncertainty regarding whether such actions will be taken. Moreover, efforts to implement changes related to export or import regulations (including the imposition of new border taxes or tariffs on foreign imports), economic sanctions or related policies. Any modification in these areas, any shift in the enforcement or scope of existing regulations or any change in the countries, governments, persons or technologies targeted by such regulations, could result in decreased use of our products by, or in our decreased ability to export or sell our products to, existing or potential end-customers with international operations and could result in increased costs. Any decreased use of our products or limitation on our ability to export or sell our products would likely adversely affect our business, financial condition and results of operations.
If we fail to comply with environmental requirements, our business, financial condition, operating results and reputation could be adversely affected.
We are subject to various environmental laws and regulations, including laws governing the hazardous material content of our products, laws relating to our real property and future expansion plans and laws concerning the recycling of electrical and electronic equipment. The laws and regulations to which we are subject include the EU RoHS and the EU Waste Electrical and Electronic Equipment Directive (the “WEEE Directive”), as well as the implementing legislation of the EU member states. Similar laws and regulations have been passed or are pending in China, South Korea, Norway and Japan and may be enacted in other regions, including in the United States, and we are, or may in the future be, subject to these laws and regulations.
The EU RoHS and the similar laws of other jurisdictions ban the use of certain hazardous materials such as lead, mercury, cadmium and certain plastic additives in the manufacture of electrical equipment, including our products. We have incurred costs to comply with these laws, including research and development costs, costs associated with assuring the supply of compliant components and costs associated with writing off noncompliant inventory. We expect to continue to incur costs related to environmental laws and regulations in the future. With respect to the EU RoHS, we and our competitors rely on exemptions for lead and other substances in network infrastructure equipment. It is possible this exemption will be revoked in the future. Additionally, although we have filed for an extension, it is possible that this exemption may expire in the future without being extended. If this exemption is revoked or expires without extension, if there are other changes to these laws (or their interpretation) or if new similar laws are passed in other jurisdictions, we may be required to reengineer our products to use components compatible with these regulations. This reengineering and component substitution could result in additional costs to us or disrupt our operations or logistics.
23
The EU has also adopted the WEEE Directive, which requires electronic goods producers to be responsible for the collection, recycling and treatment of such products. Although currently our EU international channel partners are responsible for the requirements of this directive as the importer of record in most of the European countries in which we sell our products, changes in interpretation of the regulations may cause us to incur costs or have additional regulatory requirements in the future to meet in order to comply with this directive, or with any similar laws adopted in other jurisdictions.
Our failure to comply with these and future environmental rules and regulations could result in reduced sales of our products, increased costs, substantial product inventory write-offs, reputational damage, penalties and other sanctions.
A portion of our revenue is generated by sales to government organizations, which are subject to a number of challenges and risks.
Sales to U.S. and foreign federal, state and local governmental agency end-customers have accounted for a portion of our revenue in past periods, and we may in the future increase sales to government organizations. Sales to government organizations are subject to a number of risks. Selling to government organizations can be highly competitive, expensive and time consuming, often requiring significant upfront time and expense, with long sales cycles and without any assurance of winning a sale.
Government demand, sales and payment for our products and services may be negatively impacted by numerous factors and requirements unique to selling to government agencies, such as:
|
•
|
public sector budgetary cycles;
|
|
•
|
funding authorizations and requirements unique to government agencies, with funding or purchasing reductions or delays adversely affecting public sector demand for our products;
|
|
•
|
geopolitical matters; and
|
|
•
|
rules and regulations applicable to certain government sales, including GSA regulations.
|
The rules and regulations applicable to sales to government organizations may also negatively impact sales to other organizations. To date, we have had limited traction in sales to U.S. federal government agencies, and any future sales to government organizations is uncertain. Government organizations may have contractual or other legal rights to terminate contracts with our distributors and resellers for convenience or due to a default, and any such termination may adversely impact our future results of operations. For example, if the distributor receives a significant portion of its revenue from sales to such government organization, the financial health of the distributor could be substantially harmed, which could negatively affect our future sales to such distributor. Governments routinely investigate, review and audit government vendors’ administrative and other processes, and any unfavorable investigation, audit or other review could result in the government’s refusing to continue buying our products and services, a reduction of revenue or fines, or civil or criminal liability if the investigation, audit or other review uncovers improper, illegal or otherwise concerning activities. Any such penalties could adversely impact our results of operations in a material way. Finally, purchases by the U.S. government may require certain products to be manufactured in the United States and other high cost manufacturing locations, and we may not manufacture all products in locations that meet the requirements of the U.S. government.
24
False detection of vulnerabilities, viruses or security breaches or false identification of spam or spyware could adversely affect our business.
Our FortiGuard security subscription services may falsely detect, report and act on viruses or other threats that do not actually exist. This risk is heightened by the inclusion of a “heuristics” feature in our products, which attempts to identify viruses and other threats not based on any known signatures but based on characteristics or anomalies that may indicate that a particular item is a threat. When our end-customers enable the heuristics feature in our products, the risk of falsely identifying viruses and other threats significantly increases. These false positives, while typical in the industry, may impair the perceived reliability of our products and may therefore adversely impact market acceptance of our products. Also, our FortiGuard security subscription services may falsely identify emails or programs as unwanted spam or potentially unwanted programs, or alternatively fail to properly identify unwanted emails or programs, particularly as spam emails or spyware are often designed to circumvent anti-spam or spyware products. Parties whose emails or programs are blocked by our products may seek redress against us for labeling them as spammers or spyware, or for interfering with their business. In addition, false identification of emails or programs as unwanted spam or potentially unwanted programs may reduce the adoption of our products. If our system restricts important files or applications based on falsely identifying them as malware or some other item that should be restricted, this could adversely affect end-customers’ systems and cause material system failures. In addition, our threat researchers periodically identify vulnerabilities in various third-party products, and, if these identifications are perceived to be incorrect or are in fact incorrect, this could harm our business. Any such false identification or perceived false identification of important files, applications or vulnerabilities could result in negative publicity, loss of end-customers and sales, increased costs to remedy any problem and costly litigation.
If our internal network system or our website is compromised, public perception of our products and services will be harmed, we may become subject to liability, and our business, operating results and stock price may be adversely impacted.
Our success depends on the market’s confidence in our ability to provide effective network security protection. Despite our efforts and processes to prevent breaches of our internal network system and website, we are still vulnerable to computer viruses, break-ins, phishing attacks, attempts to overload our servers with denial-of-service and other cyber-attacks and similar disruptions from unauthorized access to our internal network system or our website. Our security measures may also be breached due to employee error, malfeasance or otherwise, and third parties may attempt to fraudulently induce our employees to transfer funds or disclose information in order to gain access to our network and confidential information. We cannot guarantee that the measures we have taken to protect our network and website will provide absolute security. Moreover, because we provide network security products, we may be a more attractive target for attacks by computer hackers. Although we have not yet experienced significant damages from unauthorized access by a third party of our internal network or website, an actual or perceived breach of network security occurs in our internal systems or website could adversely affect the market perception of our products and services and investor confidence in our company. Any breach of our network system or website could impair our ability to operate our business, including our ability to provide FortiGuard security subscription and FortiCare technical support services to our end-customers, lead to interruptions or system slowdowns, cause loss of critical data or lead to the unauthorized disclosure or use of confidential, proprietary or sensitive information. We could also be subject to liability and litigation and reputational harm and our channel partners and end-customers may be harmed, lose confidence in us and decrease or cease using our products and services. Any breach of our internal network system or our website could have an adverse effect on our business, operating results and stock price.
Our ability to sell our products is dependent on the quality of our technical support services, and our failure to offer high quality technical support services would have a material adverse effect on our sales and results of operations.
Once our products are deployed within our end-customers’ networks, our end-customers depend on our technical support services, as well as the support of our channel partners and other third parties, to resolve any issues relating to our products. If we, our channel partners or other third parties do not effectively assist our customers in deploying our products, succeed in helping our customers quickly resolve post-deployment issues and provide effective ongoing support, our ability to sell additional products and services to existing customers would be adversely affected and our reputation with potential customers could be damaged. Many large end-customers, and service provider or government organization end-customers, require higher levels of support than smaller end-customers because of their more complex deployments and more demanding environments and business models. If we, our channel partners or other third parties fail to meet the requirements of our larger end-customers, it may be more difficult to execute on our strategy to increase our penetration with large businesses, service providers and government organizations. As a result, our failure to maintain high quality support services would have a material adverse effect on our business, financial condition and results of operations.
25
We could be subject to changes in our tax rates, the adoption of new U.S. or international tax legislation or exposure to additional tax liabilities.
We are subject to taxes in the United States and numerous foreign jurisdictions, where a number of our subsidiaries are organized. Our provision for income taxes is subject to volatility and could be adversely affected by several factors, many of which are outside of our control, including:
|
•
|
earnings being lower than anticipated in countries that have lower tax rates or higher than anticipated in countries that have higher tax rates;
|
|
•
|
the mix of earnings in countries with differing statutory tax rates or withholding taxes;
|
|
•
|
changes in the valuation of our deferred tax assets and liabilities;
|
|
•
|
transfer pricing adjustments;
|
|
•
|
an increase in non-deductible expenses for tax purposes, including certain stock-based compensation expense, write-offs of acquired in-process research and development and impairment of goodwill;
|
|
•
|
tax costs related to intercompany realignments;
|
|
•
|
tax assessments resulting from income tax audits or any related tax interest or penalties that could significantly affect our provision for income taxes for the period in which the settlement takes place;
|
|
•
|
a change in our decision to indefinitely reinvest foreign earnings;
|
|
•
|
changes in accounting principles;
|
|
•
|
court decisions, tax rulings and interpretations of tax laws, and regulations by international, federal or local governmental authorities; or
|
|
•
|
changes in tax laws and regulations.
|
Significant judgment is required to determine the recognition and measurement attribute prescribed in the Financial Accounting Standards Board standard. In addition, the standard applies to all income tax positions, including the potential recovery of previously paid taxes, which, if settled unfavorably, could adversely impact our provision for income taxes or additional paid-in capital. Further, as a result of certain of our ongoing employment and capital investment actions and commitments, our income in certain foreign countries is subject to reduced tax rates. Our failure to meet these commitments could adversely impact our provision for income taxes.
In addition, we have open tax years that could be subject to the examination by the Internal Revenue Service (the “IRS”) and other tax authorities. Tax authorities in France are currently examining the inter-company relationship between Fortinet, Inc., Fortinet France and Fortinet Singapore. In April 2017, we received a notice from the French tax authorities that an audit was officially opened for tax years from 2007 to 2015. We regularly assess the likelihood of adverse outcomes resulting from such examinations to determine the adequacy of our provision for income taxes.
Although we believe that our estimates are reasonable, the ultimate tax outcome may differ from the amounts recorded in our consolidated financial statements and may materially affect our financial results in the period or periods for which such determination is made.
26
In December 2017, the U.S. federal government enacted the Tax Cuts and Jobs Act (the “2017 Tax Act”). The 2017 Tax Act significantly changed the existing U.S. corporate income tax laws by, among other things, lowering the corporate tax rate, implementing a territorial tax system and imposing a one-time deemed repatriation tax on cumulative undistributed foreign earnings, for which we have not previously recognized U.S. income taxes. Given the timing, scope and magnitude of the changes enacted by the 2017 Tax Act, along with ongoing implementation efforts, guidance and other developments from U.S. regulatory and standard-setting bodies, the completion of the accounting for certain tax items included in Note 12 to the consolidated financial statements that have been reported as provisional, or where no estimate of the impact was provided as a result of us not having the necessary information, may be subject to material change. Any significant changes to our future effective tax rate, including final resolution of provisional amounts relating to effects of the 2017 Tax Act, may result in a material adverse effect on our business, financial condition, results of operations or cash flows. For example, in the fourth quarter of 2017, we provisionally recorded a $47.9 million expense on the remeasurement of deferred tax assets due to the reduction of the federal corporate income tax rate, and a $15.2 million expense for the one-time transition tax on the deemed repatriation related to the 2017 Tax Act. We will continue to monitor and assess the impact of the 2017 Tax Act and the ongoing guidance and accounting interpretations issued in response to the 2017 Tax Act.
Although we currently do not have a valuation allowance, we may in the future be required to establish one. We will continue to assess the need for a valuation allowance on the deferred tax assets by evaluating both positive and negative evidence that may exist.
Forecasting our estimated annual effective tax rate is complex and subject to uncertainty, and there may be material differences between our forecasted and actual tax rates.
Forecasts of our income tax position and effective tax rate are complex, subject to uncertainty and periodic updates because our income tax position for each year combines the effects of a mix of profits earned and losses incurred by us in various tax jurisdictions with a broad range of income tax rates, as well as changes in the valuation of deferred tax assets and liabilities, the impact of various accounting rules and changes to these rules and tax laws, the results of examinations by various tax authorities, and the impact of any acquisition, business combination or other reorganization or financing transaction. To forecast our global tax rate, we estimate our pre-tax profits and losses by jurisdiction and forecast our tax expense by jurisdiction. If the mix of profits and losses, our ability to use tax credits or effective tax rates in a given jurisdiction differs from our estimate, our actual tax rate could be materially different than forecasted, which could have a material impact on our results of business, financial condition and results of operations. Additionally, our actual tax rate may be subject to further uncertainty due to potential changes in U.S. and foreign tax rules.
As a multinational corporation, we conduct our business in many countries and are subject to taxation in many jurisdictions. The taxation of our business is subject to the application of multiple and sometimes conflicting tax laws and regulations, as well as multinational tax conventions. Our effective tax rate is highly dependent upon the geographic distribution of our worldwide earnings or losses, the tax regulations and tax holidays in each geographic region, the availability of tax credits and carryforwards and the effectiveness of our tax planning strategies. The application of tax laws and regulations is subject to legal and factual interpretation, judgment and uncertainty. Tax laws themselves are subject to change as a result of changes in fiscal policy, changes in legislation and the evolution of regulations and court rulings. Consequently, taxing authorities may impose tax assessments or judgments against us that could materially impact our tax liability and/or our effective income tax rate.
The Organisation for Economic Co-operation and Development (the “OECD”) has been working on a Base Erosion and Profit Sharing Project, commonly known as BEPS. As part of this project, the OECD has issued and continues to issue guidelines and proposals that change various aspects of the existing framework under which our tax obligations are determined in many of the countries in which we do business. Due to our extensive international business activities, any changes in the taxation of such activities could increase our tax obligations in many countries and may increase our worldwide effective tax rate.
27
Our inability to acquire and integrate other businesses, products or technologies could seriously harm our competitive position.
In order to remain competitive, we may seek to acquire additional businesses, products, technologies or intellectual property, such as patents. For any possible future acquisition, we may not be successful in negotiating the terms of the acquisition, financing the acquisition, or effectively integrating the acquired business, product, technology or intellectual property and sales force into our existing business and operations. We may have difficulty incorporating acquired technologies, intellectual property or products with our existing product lines, integrating reporting systems and procedures, and maintaining uniform standards, controls, procedures and policies. For example, we may experience difficulties integrating an acquired company’s ERP or CRM systems, sales support and other processes and systems, with our current systems and processes. Our due diligence may fail to identify all of the problems, liabilities or other shortcomings or challenges of an acquired business, product or technology, including issues with intellectual property, product quality or product architecture, regulatory compliance practices, revenue recognition or other accounting practices or employee or customer issues, and we may not accurately forecast the financial impact of an acquisition. In addition, any acquisitions we are able to complete may be dilutive to revenue growth and earnings and may not result in any synergies or other benefits we had expected to achieve, which could result in impairment charges that could be substantial. We may have to pay cash, incur debt or issue equity securities to pay for any acquisition, each of which could affect our financial condition or the value of our capital stock and could result in dilution to our stockholders. Acquisitions during a quarter may result in increased operating expenses and adversely affect our results of operations for that period or future periods compared to the results that we have previously forecasted or achieved. Further, completing a potential acquisition and integrating acquired businesses, products, technologies or intellectual property could significantly divert management time and resources.
Our business is subject to the risks of warranty claims, product returns, product liability and product defects.
Our products are very complex and, despite testing prior to their release, have contained and may contain undetected defects or errors, especially when first introduced or when new versions are released. Product errors have affected the performance of our products and could delay the development or release of new products or new versions of products, adversely affect our reputation and our end-customers’ willingness to buy products from us and adversely affect market acceptance or perception of our products. Any such errors or delays in releasing new products or new versions of products or allegations of unsatisfactory performance could cause us to lose revenue or market share, increase our service costs, cause us to incur substantial costs in redesigning the products, cause us to lose significant end-customers, subject us to liability for damages and divert our resources from other tasks, any one of which could materially and adversely affect our business, results of operations and financial condition. Our products must successfully interoperate with products from other vendors. As a result, when problems occur in a network, it may be difficult to identify the sources of these problems. The occurrence of hardware and software errors, whether or not caused by our products, could delay or reduce market acceptance of our products and have an adverse effect on our business and financial performance, and any necessary revisions may cause us to incur significant expenses. The occurrence of any such problems could harm our business, financial condition and results of operations.
Although we generally have limitation of liability provisions in our standard terms and conditions of sale, they may not fully or effectively protect us from claims as a result of federal, state or local laws or ordinances or unfavorable judicial decisions in the United States or other countries, and in some circumstances we may be required to indemnify a customer in full, without a limitation on liability, for certain liabilities, including potential liabilities that are not contractually limited. The sale and support of our products also entail the risk of product liability claims. We maintain insurance to protect against certain claims associated with the use of our products, but our insurance coverage may not cover such claim at all or may not adequately cover any claim asserted against us, and in some instances may subject us to potential liability that is not contractually limited. In addition, even claims that ultimately are unsuccessful could result in our expenditure of funds in litigation and divert management’s time and other resources.
28
Our business is subject to the risks of earthquakes, fire, power outages, floods and other catastrophic events, and to interruption by manmade problems such as civil unrest, labor disruption and terrorism.
A significant natural disaster, such as an earthquake, fire, power outage, flood or other catastrophic event, could have a material adverse impact on our business, operating results and financial condition. Our corporate headquarters are located in the San Francisco Bay Area, a region known for seismic activity, and our research and development and data center in Burnaby, Canada, from which we deliver customers our FortiGuard security subscription updates, is subject to the risk of flooding and is also in a region known for seismic activity. In addition, natural disasters could affect our manufacturing vendors, suppliers or logistics providers’ ability to perform services, such as obtaining product components and manufacturing products, or assisting with shipments, on a timely basis, as well as our customers’ ability to order from us and our employees’ ability to perform their duties. In the event our or our service providers’ information technology systems or manufacturing or logistics abilities are hindered by any of the events discussed above, shipments could be delayed, resulting in our missing financial targets, such as revenue and shipment targets, for a particular quarter. In addition, regional instability, civil unrest, labor disruptions, acts of terrorism and other geo-political unrest could cause disruptions in our business or the business of our manufacturers, logistics providers, partners or end-customers, or of the economy as a whole. Given our typical concentration of sales at the end of each quarter, any disruption in the business of our manufacturers, logistics providers, partners or end-customers that impacts sales at the end of our quarter could have a significant adverse impact on our quarterly results. To the extent that any of the above results in security risks to our customers, delays or cancellations of customer orders or the delay of the manufacture, deployment or shipment of our products, our business, financial condition and results of operations would be adversely affected.
Risks Related to Our Industry
The network security market is rapidly evolving and the complex technology incorporated in our products makes them difficult to develop. If we do not accurately predict, prepare for and respond promptly to technological and market developments and changing end-customer needs, our competitive position and prospects will be harmed.
The network security market is expected to continue to evolve rapidly. Moreover, many of our end-customers operate in markets characterized by rapidly changing technologies and business plans, which require them to add numerous network access points and adapt increasingly complex networks, incorporating a variety of hardware, software applications, operating systems and networking protocols. In addition, computer hackers and others who try to attack networks employ increasingly sophisticated techniques to gain access to and attack systems and networks. The technology in our products is especially complex because it needs to effectively identify and respond to new and increasingly sophisticated methods of attack, while minimizing the impact on network performance. Additionally, some of our new products and enhancements may require us to develop new hardware architectures and ASICs that involve complex, expensive and time consuming research and development processes. For example, we enter into development agreements with third parties. If our contract development projects are not successfully completed, or are not completed in a timely fashion, our product development could be delayed and our business generally could suffer. Costs for contract development can be substantial and our profitability may be harmed if we are unable to recover these costs. Although the market expects rapid introduction of new products or product enhancements to respond to new threats, the development of these products is difficult and the timetable for commercial release and availability is uncertain and there can be long time periods between releases and availability of new products. We have in the past and may in the future experience unanticipated delays in the availability of new products and services and fail to meet previously announced timetables for such availability. If we do not quickly respond to the rapidly changing and rigorous needs of our end-customers by developing and releasing and making available on a timely basis new products and services or enhancements that can respond adequately to new security threats, our competitive position and business prospects will be harmed.
Moreover, business models based on software-as-a-service (“SaaS”) and infrastructure-as-a-service (“IaaS”), both of which are hosted or cloud-based services, have become increasingly in-demand by our end-customers and adopted by other providers, including our competitors. While we have introduced additional cloud-based products and services and will continue to do so, most of our platform is currently deployed on premise, and therefore, if customers demand that our platform be provided through a SaaS or IaaS business model, we would be required to make additional investments in our infrastructure and personnel to be able to more fully provide our platform through a SaaS or IaaS model in order to maintain the competitiveness of our platform. Such investments may involve expanding our data centers, servers and networks, and increasing our technical operations and engineering teams. These risks are compounded by the uncertainty concerning the future viability of SaaS and IaaS business models and the future demand for such models by customers. Additionally, if we are unable to meet the demand to provide our services through a SaaS or IaaS model, we may lose customers to competitors.
29
Our uniform resource locator (“URL”) database for our web filtering service may fail to keep pace with the rapid growth of URLs and may not categorize websites in accordance with our end-customers
’
expectations.
The success of our web filtering service depends on the breadth and accuracy of our URL database. Although our URL database currently catalogs millions of unique URLs, it contains only a portion of the URLs for all of the websites that are available on the internet. In addition, the total number of URLs and software applications is growing rapidly, and we expect this rapid growth to continue in the future. Accordingly, we must identify and categorize content for our security risk categories at an extremely rapid rate. Our database and technologies may not be able to keep pace with the growth in the number of websites, especially the growing amount of content utilizing foreign languages and the increasing sophistication of malicious code and the delivery mechanisms associated with spyware, phishing and other hazards associated with the internet. Further, the ongoing evolution of the internet and computing environments will require us to continually improve the functionality, features and reliability of our web filtering function. Any failure of our databases to keep pace with the rapid growth and technological change of the internet could impair the market acceptance of our products, which in turn could harm our business, financial condition and results of operations.
In addition, our web filtering service may not be successful in accurately categorizing internet and application content to meet our end-customers’ expectations. We rely upon a combination of automated filtering technology and human review to categorize websites and software applications in our proprietary databases. Our end-customers may not agree with our determinations that particular URLs should be included or not included in specific categories of our databases. In addition, it is possible that our filtering processes may place material that is objectionable or that presents a security risk in categories that are generally unrestricted by our customers’ internet and computer access policies, which could result in such material not being blocked from the network. Conversely, we may miscategorize websites such that access is denied to websites containing information that is important or valuable to our customers. Any miscategorization could result in customer dissatisfaction and harm our reputation. Any failure to effectively categorize and filter websites according to our end-customers’ and channel partners’ expectations could impair the growth of our business.
If our new products and product enhancements do not achieve sufficient market acceptance, our results of operations and competitive position will suffer.
We spend substantial amounts of time and money to research and develop new products and enhanced versions of our existing products in order to incorporate additional features, improved functionality or other enhancements in order to meet our customers’ rapidly evolving demands for network security in our highly competitive industry. When we develop a new product or an enhanced version of an existing product, we typically incur expenses and expend resources upfront to market, promote and sell the new offering. Therefore, when we develop and introduce new or enhanced products, they must achieve high levels of market acceptance in order to justify the amount of our investment in developing and bringing them to market.
Our new products or product enhancements could fail to attain sufficient market acceptance for many reasons, including:
|
•
|
delays in releasing our new products or enhancements to the market;
|
|
•
|
failure to accurately predict market demand in terms of product functionality and to supply products that meet this demand in a timely fashion;
|
|
•
|
failure of our sales force and partners to focus on selling new products;
|
|
•
|
inability to interoperate effectively with the networks or applications of our prospective end-customers;
|
|
•
|
inability to protect against new types of attacks or techniques used by hackers;
|
|
•
|
actual or perceived defects, vulnerabilities, errors or failures;
|
|
•
|
negative publicity about their performance or effectiveness;
|
|
•
|
introduction or anticipated introduction of competing products by our competitors;
|
|
•
|
poor business conditions for our end-customers, causing them to delay IT purchases;
|
|
•
|
changes to the regulatory requirements around security; and
|
30
|
•
|
reluctance of customers to purchase products incorporating open source software.
|
If our new products or enhancements do not achieve adequate acceptance in the market, our competitive position will be impaired, our revenue will be diminished and the effect on our operating results may be particularly acute because of the significant research, development, marketing, sales and other expenses we incurred in connection with the new product or enhancement.
Demand for our products may be limited by market perception that individual products from one vendor that provide multiple layers of security protection in one product are inferior to point solution network security solutions from multiple vendors.
Sales of many of our products depend on increased demand for incorporating broad security functionality into one appliance. If the market for these products fails to grow as we anticipate, our business will be seriously harmed. Target customers may view “all-in-one” network security solutions as inferior to security solutions from multiple vendors because of, among other things, their perception that such products of ours provide security functions from only a single vendor and do not allow users to choose “best-of-breed” defenses from among the wide range of dedicated security applications available. Target customers might also perceive that, by combining multiple security functions into a single platform, our solutions create a “single point of failure” in their networks, which means that an error, vulnerability or failure of our product may place the entire network at risk. In addition, the market perception that “all-in-one” solutions may be suitable only for small and medium-sized businesses because such solution lacks the performance capabilities and functionality of other solutions may harm our sales to large businesses, service provider and government organization end-customers. If the foregoing concerns and perceptions become prevalent, even if there is no factual basis for these concerns and perceptions, or if other issues arise with our market in general, demand for multi-security functionality products could be severely limited, which would limit our growth and harm our business, financial condition and results of operations. Further, a successful and publicized targeted attack against us, exposing a “single point of failure,” could significantly increase these concerns and perceptions and may harm our business and results of operations.
We face intense competition in our market and we may lack sufficient financial or other resources to maintain or improve our competitive position.
The market for network security products is intensely competitive and we expect competition to intensify in the future. Our competitors include companies such as Check Point, Cisco, F5 Networks, FireEye, Forcepoint, Imperva, Juniper, McAfee, Palo Alto Networks, Proofpoint, SonicWALL, Sophos, Symantec and Trend Micro.
Many of our existing and potential competitors enjoy substantial competitive advantages such as:
|
•
|
greater name recognition and longer operating histories;
|
|
•
|
larger sales and marketing budgets and resources;
|
|
•
|
broader distribution and established relationships with distribution partners and end-customers;
|
|
•
|
access to larger customer bases;
|
|
•
|
greater customer support resources;
|
|
•
|
greater resources to make acquisitions;
|
|
•
|
lower labor and development costs; and
|
|
•
|
substantially greater financial, technical and other resources.
|
31
In addition, some of our larger competitors have substantially broader product offerings, and leverage their relationships based on other products or incorporate functionality into existing products in a manner that discourages customers from purchasing our products. These larger competitors often have broader product lines and market focus, and are in a better position to withstand any significant reduction in capital spending by end-customers in these markets. Therefore, these competitors will not be as susceptible to downturns in a particular market. Also, many of our smaller competitors that specialize in providing protection from a single type of network security threat are often able to deliver these specialized network security products to the market more quickly than we can. Some of our smaller competitors are using third-party chips designed to accelerate performance. Conditions in our markets could change rapidly and significantly as a result of technological advancements or continuing market consolidation. Our competitors and potential competitors may also be able to develop products or services that are equal or superior to ours, achieve greater market acceptance of their products and services, and increase sales by utilizing different distribution channels than we do. Our current and potential competitors may also offer point solutions, fabric and/or cloud security services that compete with some of the features present in our platform. They may also establish cooperative relationships among themselves or with third parties that may further enhance their resources. In addition, current or potential competitors may be acquired by third parties with greater available resources, and new competitors may arise pursuant to acquisitions of network security companies or divisions. As a result of such acquisitions, competition in our market may continue to increase and our current or potential competitors might be able to adapt more quickly to new technologies and customer needs, devote greater resources to the promotion or sale of their products and services, initiate or withstand substantial price competition, take advantage of acquisition or other opportunities more readily, or develop and expand their product and service offerings more quickly than we do. In addition, our competitors may bundle products and services competitive with ours with other products and services. Customers may accept these bundled products and services rather than separately purchasing our products and services. Due to budget constraints or economic downturns, organizations may be more willing to incrementally add solutions to their existing network security infrastructure from competitors than to replace it with our solutions. These competitive pressures in our market or our failure to compete effectively may result in price reductions, fewer customer orders, reduced revenue and gross margins and loss of market share.
If functionality similar to that offered by our products is incorporated into existing network infrastructure products, organizations may decide against adding our appliances to their network, which would have an adverse effect on our business.
Large, well-established providers of networking equipment such as Cisco, F5 Networks and Juniper offer, and may continue to introduce, network security features that compete with our products, either in standalone security products or as additional features in their network infrastructure products. The inclusion of, or the announcement of an intent to include, functionality perceived to be similar to that offered by our security solutions in networking products that are already generally accepted as necessary components of network architecture may have an adverse effect on our ability to market and sell our products. Furthermore, even if the functionality offered by network infrastructure providers is more limited than our products, a significant number of customers may elect to accept such limited functionality in lieu of adding appliances from an additional vendor such as us. Many organizations have invested substantial personnel and financial resources to design and operate their networks and have established deep relationships with other providers of networking products, which may make them reluctant to add new components to their networks, particularly from other vendors such as us. In addition, an organization’s existing vendors or new vendors with a broad product offering may be able to offer concessions that we are not able to match because we currently offer only network security products and have fewer resources than many of our competitors. If organizations are reluctant to add additional network infrastructure from new vendors or otherwise decide to work with their existing vendors, our business, financial condition and results of operations will be adversely affected.
32
Risks Related to Intellectual Property
Our proprietary rights may be difficult to enforce, which could enable others to copy or use aspects of our products without compensating us.
We rely primarily on patent, trademark, copyright and trade secrets laws and confidentiality procedures and contractual provisions to protect our technology. Valid patents may not issue from our pending applications, and the claims eventually allowed on any patents may not be sufficiently broad to protect our technology or products. Any issued patents may be challenged, invalidated or circumvented, and any rights granted under these patents may not actually provide adequate defensive protection or competitive advantages to us. Patent applications in the United States are typically not published until at least 18 months after filing, or, in some cases, not at all, and publications of discoveries in industry-related literature lag behind actual discoveries. We cannot be certain that we were the first to make the inventions claimed in our pending patent applications or that we were the first to file for patent protection. Additionally, the process of obtaining patent protection is expensive and time-consuming, and we may not be able to prosecute all necessary or desirable patent applications at a reasonable cost or in a timely manner. In addition, recent changes to the patent laws in the United States may bring into question the validity of certain software patents and may make it more difficult and costly to prosecute patent applications. As a result, we may not be able to obtain adequate patent protection or effectively enforce our issued patents.
Despite our efforts to protect our proprietary rights, unauthorized parties may attempt to copy aspects of our products or obtain and use information that we regard as proprietary. We generally enter into confidentiality or license agreements with our employees, consultants, vendors and customers, and generally limit access to and distribution of our proprietary information. However, we cannot guarantee that the steps taken by us will prevent misappropriation of our technology. Policing unauthorized use of our technology or products is difficult. In addition, the laws of some foreign countries do not protect our proprietary rights to as great an extent as the laws of the United States, and many foreign countries do not enforce these laws as diligently as government agencies and private parties in the United States. From time to time, legal action by us may be necessary to enforce our patents and other intellectual property rights, to protect our trade secrets, to determine the validity and scope of the proprietary rights of others or to defend against claims of infringement or invalidity. Such litigation could result in substantial costs and diversion of resources and could negatively affect our business, operating results and financial condition. If we are unable to protect our proprietary rights (including aspects of our software and products protected other than by patent rights), we may find ourselves at a competitive disadvantage to others who need not incur the additional expense, time and effort required to create the innovative products that have enabled us to be successful to date.
Our products contain third-party open source software components, and failure to comply with the terms of the underlying open source software licenses could restrict our ability to sell our products.
Our products contain software modules licensed to us by third-party authors under “open source” licenses, including the GNU Public License, the GNU Lesser Public License, the BSD License, the Apache License, the MIT X License and the Mozilla Public License. From time to time, there have been claims against companies that distribute or use open source software in their products and services, asserting that open source software infringes the claimants’ intellectual property rights. We could be subject to suits by parties claiming infringement of intellectual property rights in what we believe to be licensed open source software. Use and distribution of open source software may entail greater risks than use of third-party commercial software, as open source licensors generally do not provide warranties or other contractual protections regarding infringement claims or the quality of the code. Some open source licenses contain requirements that we make available source code for modifications or derivative works we create based upon the type of open source software we use. If we combine our proprietary software with open source software in a certain manner, we could, under certain open source licenses, be required to release the source code of our proprietary software to the public. This would allow our competitors to create similar products with lower development effort and time and ultimately could result in a loss of product sales for us.
Although we monitor our use of open source software to avoid subjecting our products to conditions we do not intend, the terms of many open source licenses have not been interpreted by U.S. courts, and there is a risk that these licenses could be construed in a way that could impose unanticipated conditions or restrictions on our ability to commercialize our products. In this event, we could be required to seek licenses from third parties to continue offering our products, to make our proprietary code generally available in source code form, to re-engineer our products or to discontinue the sale of our products if re-engineering could not be accomplished on a timely basis, any of which requirements could adversely affect our business, operating results and financial condition.
33
Claims by others that we infringe their proprietary technology or other litigation matters could harm our business.
Patent and other intellectual property disputes are common in the network security industry. Third parties are currently asserting, have asserted and may in the future assert claims of infringement of intellectual property rights against us. They have also asserted such claims against our end-customers or channel partners whom we may indemnify against claims that our products infringe the intellectual property rights of third parties. As the number of products and competitors in our market increases and overlaps occur, infringement claims may increase. Any claim of infringement by a third party, even those without merit, could cause us to incur substantial costs defending against the claim and could distract our management from our business. In addition, litigation may involve patent holding companies, non-practicing entities or other adverse patent owners who have no relevant product revenue and against whom our own patents may therefore provide little or no deterrence or protection.
Although third parties may offer a license to their technology, the terms of any offered license may not be acceptable, and the failure to obtain a license or the costs associated with any license could cause our business, financial condition and results of operations to be materially and adversely affected. In addition, some licenses may be non-exclusive and, therefore, our competitors may have access to the same technology licensed to us.
Alternatively, we may be required to develop non-infringing technology, which could require significant time, effort and expense, and may ultimately not be successful. Furthermore, a successful claimant could secure a judgment or we may agree to a settlement that prevents us from distributing certain products or performing certain services or that requires us to pay substantial damages (including treble damages if we are found to have willfully infringed such claimant’s patents or copyrights), royalties or other fees. Any of these events could seriously harm our business, financial condition and results of operations.
From time to time we are subject to lawsuits claiming patent infringement. We are also subject to other litigation in addition to patent infringement claims, such as employment-related litigation and disputes, as well as general commercial litigation, and could become subject to other forms of litigation and disputes, including stockholder litigation. If we are unsuccessful in defending any such claims, our operating results and financial condition and results may be materially and adversely affected. For example, we may be required to pay substantial damages and could be prevented from selling certain of our products. Litigation, with or without merit, could negatively impact our business, reputation and sales in a material fashion.
We have several ongoing patent lawsuits, several non-practicing entity patent holding companies have sent us letters proposing that we license certain of their patents and organizations have sent letters demanding that we provide indemnification for patent claims. Given this and the proliferation of lawsuits in our industry and other similar industries by both non-practicing entities and operating entities, and recent non-practicing entity and operating entity patent litigation against other companies in the security space, we expect that we will be sued for patent infringement in the future, regardless of the merits of any such lawsuits. The cost to defend such lawsuits and any adverse result in such lawsuits could have a material adverse effect on our results of operations and financial condition.
We rely on the availability of third-party licenses.
Many of our products include software or other intellectual property licensed from third parties. It may be necessary in the future to renew licenses relating to various aspects of these products or to seek new licenses for existing or new products. There can be no assurance that the necessary licenses would be available on acceptable terms, if at all. The inability to obtain certain licenses or other rights or to obtain such licenses or rights on favorable terms, or the need to engage in litigation regarding these matters, could result in delays in product releases until equivalent technology can be identified, licensed or developed, if at all, and integrated into our products and may have a material adverse effect on our business, operating results, and financial condition. Moreover, the inclusion in our products of software or other intellectual property licensed from third parties on a nonexclusive basis could limit our ability to differentiate our products from those of our competitors.
We also rely on technologies licensed from third parties in order to operate functions of our business. If any of these third parties allege that we have not properly paid for such licenses or that we have improperly used the technologies under such licenses, we may need to pay additional fees or obtain new licenses, and such licenses may not be available on terms acceptable to us or at all. In either case, or if we were required to redesign our internal operations to function with new technologies, our business, results of operations and financial condition could be harmed.
34
Risks Related to Ownership of our Common Stock
As a public company, we are subject to compliance initiatives that will require substantial time from our management and result in significantly increased costs that may adversely affect our operating results and financial condition.
The Sarbanes-Oxley Act of 2002 (“Sarbanes-Oxley”), Dodd-Frank and other rules implemented by the SEC and The Nasdaq Stock Market impose various requirements on public companies, including requiring changes in corporate governance practices. These requirements, as well as proposed corporate governance laws and regulations under consideration, may further increase our compliance costs. If compliance with these various legal and regulatory requirements diverts our management’s attention from other business concerns, it could have a material adverse effect on our business, financial condition and results of operations. Sarbanes-Oxley requires, among other things, that we assess the effectiveness of our internal control over financial reporting annually, and of our disclosure controls and procedures quarterly. Although our most recent assessment, testing and evaluation resulted in our conclusion that, as of December 31, 2017, our internal controls over financial reporting were effective, we cannot predict the outcome of our testing in 2018 or future periods. We may incur additional expenses and commitment of management’s time in connection with further evaluations, both of which could materially increase our operating expenses and accordingly reduce our operating results.
Changes in financial accounting standards may cause adverse unexpected fluctuations and affect our reported results of operations.
A change in accounting standards or practices, and varying interpretations of existing or new accounting pronouncements, such as changes to standards related to revenue recognition, equity investment valuation (which became effective for us beginning on January 1, 2018) and accounting for leases (which will become effective for us on January 1, 2019), as well as the significant costs incurred that may be incurred to adopt and to comply with these new pronouncements, could have a significant effect on our reported financial results or the way we conduct our business. If we do not ensure that our systems and processes are aligned with the new standards, we could encounter difficulties generating quarterly and annual financial statements in a timely manner, which would have an adverse effect on our business, our ability to meet our reporting obligations and compliance with internal control requirements.
As a result of adopting and implementing the new revenue recognition standard, we will be required to change our accounting for commission expense. We will capitalize and amortize certain direct costs, such as commissions, over the expected period of benefit rather than expensing them as incurred. While the adoption of the new revenue recognition standard does not change the cash flows received from our contracts with customers, its adoption could have a material effect on our financial position or results of operations. Refer to Note 1 in the notes to our consolidated financial statements included in this Annual Report on Form 10-K for additional information on the new standard and its potential impact on us. The new revenue standard is principles based and interpretation of those principles may vary from company to company based on their unique circumstances. Management will make judgments and assumptions based on our interpretation of the new standard. It is possible that interpretation, industry practice and guidance may evolve as we work toward implementing the new revenue recognition standard. If our circumstances change or if actual circumstances differ from our assumptions, our operating result may be adversely affected and could fall below our publicly announced guidance or the expectations of securities analysts and investors, resulting in a decline in the market price of our common stock. Further, the new equity investment valuation standard, which requires most equity investments to be measured at fair value (with subsequent changes in fair value recognized in net income), may increase the volatility of our earnings.
If securities or industry analysts stop publishing research or publish inaccurate or unfavorable research about our business, our stock price and trading volume could decline.
The trading market for our common stock will depend in part on the research and reports that securities or industry analysts publish about us or our business. If we do not maintain adequate research coverage or if one or more of the analysts who cover us downgrades our stock or publishes inaccurate or unfavorable research about our business, our stock price could decline. If one or more of these analysts ceases coverage of our company or fails to publish reports on us regularly, demand for our stock could decrease, which could cause our stock price and trading volume to decline.
The trading price of our common stock may be volatile.
The market price of our common stock may be subject to wide fluctuations in response to, among other things, the risk factors described in this periodic report, news about us and our financial results, news about our competitors and their results, and other factors such as rumors or fluctuations in the valuation of companies perceived by investors to be comparable to us. For example, during 2017, the closing price of our common stock ranged from $30.12 to $45.09 per share.
35
Furthermore, the stock markets have experienced price and volume fluctuations that have affected and continue to affect the market prices of equity securities of many companies. These fluctuations often have been unrelated or disproportionate to the operating performance of those companies. These broad market and industry fluctuations, as well as general economic, political and market conditions, such as recessions, interest rate changes or international currency fluctuations, may negatively affect the market price of our common stock.
In the past, many companies that have experienced volatility in the market price of their stock have been subject to securities class action litigation. We may be the target of this type of litigation in the future. Securities litigation against us could result in substantial costs and divert our management’s attention from other business concerns, which could seriously harm our business.
Share repurchases under our share repurchase program could increase the volatility of the trading price of our common stock and could diminish our cash reserves.
In 2017, our board of directors approved the increase in the aggregate authorized repurchase amount under our share repurchase program by
$700.0 million
, bringing the total authorization to $1.0 billion. Share repurchases under our share repurchase program could affect the price of our common stock, increase stock price volatility and diminish our cash reserves. In addition, an announcement of the reduction, suspension or termination of our share repurchase program could result in a decrease in the trading price of our common stock.
Anti-takeover provisions contained in our certificate of incorporation and bylaws, as well as provisions of Delaware law, could impair a takeover attempt.
Our certificate of incorporation, bylaws and Delaware law contain provisions that could have the effect of rendering more difficult, delaying or preventing an acquisition deemed undesirable by our board of directors. Our corporate governance documents include provisions:
|
•
|
providing for a classified board of directors whose members serve staggered three-year terms;
|
|
•
|
authorizing “blank check” preferred stock, which could be issued by the board without stockholder approval and may contain voting, liquidation, dividend and other rights superior to our common stock;
|
|
•
|
limiting the liability of, and providing indemnification to, our directors and officers;
|
|
•
|
limiting the ability of our stockholders to call and bring business before special meetings;
|
|
•
|
requiring advance notice of stockholder proposals for business to be conducted at meetings of our stockholders and for nominations of candidates for election to our board of directors;
|
|
•
|
providing that certain litigation matters may only be brought against us in state or federal courts in the State of Delaware;
|
|
•
|
controlling the procedures for the conduct and scheduling of board and stockholder meetings; and
|
|
•
|
providing the board of directors with the express power to postpone previously scheduled annual meetings and to cancel previously scheduled special meetings.
|
These provisions, alone or together, could delay or prevent hostile takeovers and changes in control or changes in our management.
As a Delaware corporation, we are also subject to provisions of Delaware law, including Section 203 of the Delaware General Corporation law, which prevents some stockholders holding more than 15% of our outstanding common stock from engaging in certain business combinations without approval of the holders of a substantial majority of all of our outstanding common stock.
Any provision of our certificate of incorporation or bylaws or Delaware law that has the effect of delaying or deterring a change in control could limit the opportunity for our stockholders to receive a premium for their shares of our common stock, and could also affect the price that some investors are willing to pay for our common stock.
36
However, these anti-takeover provisions will not have the effect of preventing activist stockholders from seeking to increase short-term stockholder value through actions such as nominating board candidates and requesting that we pursue strategic combinations or other transactions. These actions could disrupt our operations, be costly and time-consuming and divert the attention of our management and employees. In addition, perceived uncertainties as to our future direction as a result of activist stockholder actions could result in the loss of potential business opportunities, as well as other negative business consequences. Actions of an activist stockholder may also cause fluctuations in our stock price based on speculative market perceptions or other factors that do not necessarily reflect our business. Further, we may incur significant expenses in retaining professionals to advise and assist us on activist stockholder matters, including legal, financial, communications advisors and solicitation experts, which may negatively impact our future financial results.
Not applicable.
Our corporate headquarters is located in Sunnyvale, California and comprises approximately 162,000 square feet of office and building space. Along with our corporate headquarters, as of December 31, 2017, we also owned approximately 200,000 square feet in Union City, California used as a distribution facility; approximately 135,000 square feet of buildings adjacent to our corporate headquarters intended to support growth in our business operations; approximately 340,000 square feet of office and building space in Burnaby and Ottawa, Canada used for operations, support and research and development work; and 40,000 square feet of office space in Sophia, France predominantly used as a sales and support office.
We maintain additional offices throughout the United States and various international locations, including Singapore, Japan, France, India, China, the United Kingdom, Mexico and Germany. We believe that our existing properties are sufficient and suitable to meet our current needs. We intend to expand our facilities or add new facilities as we add employees and enter new geographic markets, and we believe that suitable additional or alternative space will be available as needed to accommodate ongoing operations and any such growth. However, we expect to incur additional operating expenses and capital expenditures in connection with such new or expanded facilities.
For information regarding the geographical location of our property and equipment, see Note 14 to our consolidated financial statements in Part II, Item 8 of this Annual Report on Form 10-K.
We are subject to various claims, complaints and legal actions that arise from time to time in the normal course of business. We accrue for contingencies when we believe that a loss is probable and that we can reasonably estimate the amount of any such loss. There can be no assurance that existing or future legal proceedings arising in the ordinary course of business or otherwise will not have a material adverse effect on our business, consolidated financial position, results of operations or cash flows.
In October 2016, we received a letter from the United States Attorney's Office for the Northern District of California requesting information relating to our compliance with the Trade Agreements Act. We have been fully cooperating with this ongoing inquiry and have periodically met and spoken with the United States Attorney’s Office in connection with this matter.
Not applicable.
37
|
ITEM 5.
|
Market for Registrant’s Common Equity, Related Stockholder Matters and Issuer Purchases of Equity Securities
|
Our common stock is traded on The Nasdaq Global Select Market under the symbol “FTNT.” The following table sets forth, for the time periods indicated, the high and low closing sales price of our common stock, as reported on the Nasdaq Global Select Market.
|
2017
|
2016
|
||||||||||||||
|
|
High
|
Low
|
High
|
Low
|
|||||||||||
|
Fourth Quarter
|
$
|
45.09
|
|
$
|
36.35
|
|
$
|
36.94
|
|
$
|
28.61
|
|
|||
|
Third Quarter
|
$
|
41.10
|
|
$
|
35.84
|
|
$
|
37.17
|
|
$
|
31.57
|
|
|||
|
Second Quarter
|
$
|
40.97
|
|
$
|
37.20
|
|
$
|
34.78
|
|
$
|
28.79
|
|
|||
|
First Quarter
|
$
|
38.35
|
|
$
|
30.12
|
|
$
|
30.63
|
|
$
|
23.83
|
|
|||
Holders of Record
As of
February 16, 2018
, there were
57
holders of record of our common stock. A substantially greater number of holders of our common stock are “street name” or beneficial holders, whose shares are held by banks, brokers and other financial institutions.
Dividends
We have never declared or paid cash dividends on our capital stock. We do not anticipate paying any cash dividends in the foreseeable future. Any future determination to declare cash dividends will be made at the discretion of our board of directors and will depend on our financial condition, operating results, capital requirements, general business conditions and other factors that our board of directors may deem relevant.
Stock Performance Graph
This performance graph shall not be deemed “filed” for purposes of Section 18 of the Securities and Exchange Act of 1934
(
the “Exchange Act”), or incorporated by reference into any filing of Fortinet under the Securities Act of 1933, as amended (the “Securities Act
”
), or the Exchange Act, except as shall be expressly set forth by specific reference in such filing.
The following graph compares the cumulative five-year total return for our common stock, the NASDAQ Composite Index and the NASDAQ Computer Index. Such returns are based on historical results and are not intended to suggest future performance. Data for the NASDAQ Composite Index and the NASDAQ Computer Index assume reinvestment of dividends. We have never declared or paid cash dividends on our capital stock, nor do we anticipate paying any such cash dividends in the foreseeable future.
38
COMPARISON OF CUMULATIVE TOTAL RETURN*
Among Fortinet, Inc., The NASDAQ Composite Index and
The NASDAQ Computer Index
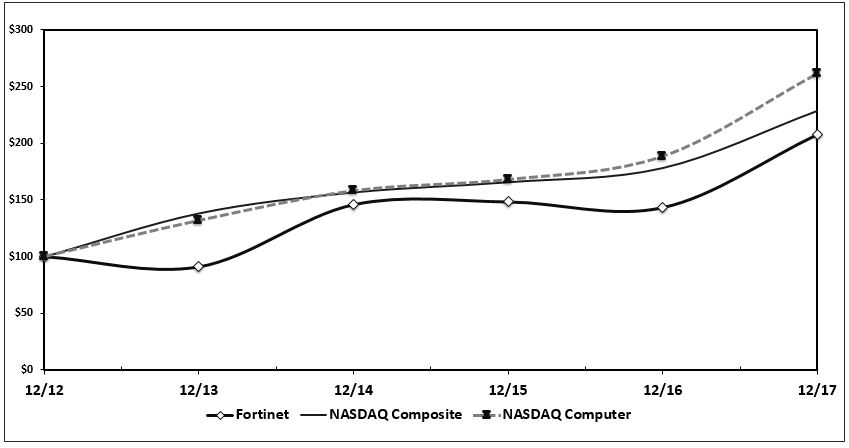
|
December 2012 *
|
December 2013
|
December 2014
|
December 2015
|
December 2016
|
December 2017
|
|||||||||||||||||||
|
Fortinet, Inc.
|
$
|
100
|
|
$
|
91
|
|
$
|
146
|
|
$
|
148
|
|
$
|
143
|
|
$
|
208
|
|
||||||
|
NASDAQ Composite
|
$
|
100
|
|
$
|
138
|
|
$
|
157
|
|
$
|
166
|
|
$
|
178
|
|
$
|
229
|
|
||||||
|
NASDAQ Computer
|
$
|
100
|
|
$
|
132
|
|
$
|
158
|
|
$
|
168
|
|
$
|
189
|
|
$
|
262
|
|
||||||
________________
* Assumes that $100 was invested on December 31, 2012 in stock or index, including reinvestment of dividends. Stockholder returns over the indicated period should not be considered indicative of future stockholder returns.
Sales of Unregistered Securities
None.
Purchases of Equity Securities by the Issuer and Affiliated Purchasers
Share Repurchase Program
In January 2016, our board of directors approved a Share Repurchase Program (the “Repurchase Program”), which authorized the repurchase of up to
$200.0 million
of our outstanding common stock through December 31, 2017. In 2016 and 2017, our board of directors approved the increases in the aggregate
authorized repurchase amount under the Repurchase Program by $100.0 million and $700.0 million, respectively, bringing the total amount authorized to $1.0 billion through January 31, 2019. Under the Repurchase Program, share repurchases may be made by us from time to time in privately negotiated transactions or in open market transactions. The Repurchase Program does not require us to purchase a minimum number of shares, and may be suspended, modified or discontinued at any time without prior notice.
39
The following table provides information with respect to the shares of common stock we repurchased during the three months ended
December 31, 2017
(in thousands, except share and per share amounts):
|
Period
|
Total Number of Shares Purchased
|
Average Price Paid per Share
|
Total Number of Shares Purchased as Part of Publicly Announced Plan or Program
|
Approximate Dollar Value of Shares that May Yet Be Purchased Under the Plans or Programs
|
||||||||||
|
October 1 - October 31, 2017
|
955,867
|
|
$
|
38.68
|
|
955,867
|
|
$
|
728,242
|
|
||||
|
November 1 - November 30, 2017
|
4,688,088
|
|
$
|
40.18
|
|
4,688,088
|
|
$
|
539,865
|
|
||||
|
December 1 - December 31, 2017
|
2,270,446
|
|
$
|
42.73
|
|
2,270,446
|
|
$
|
442,839
|
|
||||
The following selected consolidated financial data set forth below was derived from our historical audited consolidated financial statements and should be read in conjunction with the section titled “Management’s Discussion and Analysis of Financial Condition and Results of Operations” and “Financial Statements and Supplementary Data,” and other financial data included elsewhere in this Annual Report on Form 10-K. Our historical results of operations are not indicative of our future results of operations.
|
|
Year Ended December 31,
|
||||||||||||||||||
|
2017
|
2016
|
2015
|
2014
|
2013
|
|||||||||||||||
|
(in thousands, except per share amounts)
|
|||||||||||||||||||
|
Consolidated Statement of Operations Data:
|
|||||||||||||||||||
|
Total revenue
|
$
|
1,494,930
|
|
$
|
1,275,443
|
|
$
|
1,009,268
|
|
$
|
770,364
|
|
$
|
615,297
|
|
||||
|
Gross profit
|
$
|
1,109,646
|
|
$
|
937,606
|
|
$
|
722,491
|
|
$
|
539,355
|
|
$
|
434,654
|
|
||||
|
Operating income
|
$
|
109,804
|
|
$
|
42,944
|
|
$
|
14,877
|
|
$
|
59,324
|
|
$
|
72,090
|
|
||||
|
Net income
|
$
|
31,399
|
|
$
|
32,187
|
|
$
|
7,987
|
|
$
|
25,343
|
|
$
|
44,273
|
|
||||
|
Net income per share
:
|
|||||||||||||||||||
|
Basic
|
$
|
0.18
|
|
$
|
0.19
|
|
$
|
0.05
|
|
$
|
0.15
|
|
$
|
0.27
|
|
||||
|
Diluted
|
$
|
0.18
|
|
$
|
0.18
|
|
$
|
0.05
|
|
$
|
0.15
|
|
$
|
0.26
|
|
||||
|
Weighted-average shares outstanding:
|
|||||||||||||||||||
|
Basic
|
174,315
|
|
172,621
|
|
170,385
|
|
163,831
|
|
162,435
|
|
|||||||||
|
Diluted
|
178,079
|
|
176,338
|
|
176,141
|
|
169,289
|
|
168,183
|
|
|||||||||
|
|
As of December 31,
|
||||||||||||||||||
|
2017
|
2016
|
2015
|
2014
|
2013
|
|||||||||||||||
|
(in thousands)
|
|||||||||||||||||||
|
Consolidated Balance Sheet Data:
|
|||||||||||||||||||
|
Cash, cash equivalents and investments
|
$
|
1,349,299
|
|
$
|
1,310,508
|
|
$
|
1,164,310
|
|
$
|
991,744
|
|
$
|
843,045
|
|
||||
|
Total assets
|
$
|
2,257,916
|
|
$
|
2,139,941
|
|
$
|
1,790,510
|
|
$
|
1,424,774
|
|
$
|
1,168,464
|
|
||||
|
Total stockholders’ equity
|
$
|
589,377
|
|
$
|
837,681
|
|
$
|
755,377
|
|
$
|
675,966
|
|
$
|
585,760
|
|
||||
40
In addition to historical information, this Annual Report on Form 10-K contains forward-looking statements within the meaning of Section 27A of the Securities Act and Section 21E of the Exchange Act. These statements include, among other things, statements concerning our expectations regarding:
|
•
|
continued growth and market share gains;
|
|
•
|
variability in sales in certain product categories from year to year and between quarters;
|
|
•
|
expected impact of sales of certain products and services;
|
|
•
|
the impact of macro-economic and geopolitical factors on our international sales;
|
|
•
|
the proportion of our revenue that consists of our product and service revenue, and the mix of billings between products and services, and the duration of service contracts;
|
|
•
|
the impact of our product innovation strategy;
|
|
•
|
drivers of long-term growth and operating leverage, such as increased sales productivity, functionality and value in our standalone and bundled subscription service offerings;
|
|
•
|
growing our sales to businesses, service providers and government organizations, the impact of sales to these organizations on our long-term growth, expansion and operating results, and the effectiveness of our internal sales organization;
|
|
•
|
trends in revenue, costs of revenue and gross margin;
|
|
•
|
trends in our operating expenses, including sales and marketing expense, research and development expense, general and administrative expense, and expectations regarding these expenses as a percentage of total revenue;
|
|
•
|
continued investments in research and development;
|
|
•
|
managing our continued investments in sales and marketing, and the impact of those investments;
|
|
•
|
expectations regarding uncertain tax benefits and our effective tax rate;
|
|
•
|
the impact of the 2017 Tax Act;
|
|
•
|
expectations regarding spending related to real estate and other capital expenditures and to the impact on free cash flows;
|
|
•
|
competition in our markets;
|
|
•
|
our intentions regarding repatriation of cash, cash equivalents and investments held by our international subsidiaries and the sufficiency of our existing cash, cash equivalents and investments to meet our cash needs for at least the next 12 months;
|
|
•
|
other statements regarding our future operations, financial condition and prospects and business strategies; and
|
|
•
|
adoption and impact of new accounting standards, including those related to revenue recognition and accounting for leases.
|
41
These forward-looking statements are subject to certain risks and uncertainties that could cause our actual results to differ materially from those reflected in the forward-looking statements. Factors that could cause or contribute to such differences include, but are not limited to, those discussed in this Annual Report on Form 10-K and, in particular, the risks discussed under the heading “Risk Factors” in Part I, Item 1A of this Annual Report on Form 10-K and those discussed in other documents we file with the Securities and Exchange Commission (the “SEC”). We undertake no obligation to revise or publicly release the results of any revision to these forward-looking statements. Given these risks and uncertainties, readers are cautioned not to place undue reliance on such forward-looking statements.
Business Overview
Fortinet is a global leader in broad, automated and integrated cybersecurity solutions. We provide high performance cybersecurity solutions to a wide variety of businesses, such as enterprises, data centers and distributed offices, including majority of the Fortune 100 companies. Our cybersecurity solutions are designed to provide broad, automated and integrated protection against dynamic and sophisticated security threats, while simplifying the IT and security infrastructure of our end-customers.
We have four current focus areas for our business. First, we derive a majority of product sales from our FortiGate network security appliances. We continue to develop and improve our offerings, which provide opportunities for market share gains. Second, the Fortinet Security Fabric has been developed to provide unified security across the entire digital attack surface, including network core, endpoints, applications, data centers, access and private and public cloud, and is designed to enable traditionally disparate security devices to work together as an integrated and collaborative whole. As a result of the increased success in selling the Security Fabric, billings for non-FortiGate products and services grew significantly in 2017. Third, cloud security provides opportunity for growth and was one of the fastest growing parts of our business in 2017. We help customers secure their cloud implementations by offering integration, visibility and automation across multi-cloud and hybrid deployments. Our FortiCASB extends the core capabilities of our security fabric architecture to provide businesses the same level of cybersecurity and threat intelligence in cloud environments as they do on their physical networks. The Fortinet cloud security is available across all major cloud providers, including Microsoft Azure, Amazon Web Services, Google Cloud, IBM Cloud and Oracle Cloud. Fourth, the emergence of the IoT has created an environment where data move freely between devices across locations, network environments, remote offices, mobile workers and public cloud environments, making it difficult to consistently track and secure.
Financial Highlights
|
•
|
We recorded total revenue of
$1.49 billion
in
2017
, an increase of
17%
compared to
$1.28 billion
in
2016
. Product revenue was
$577.2 million
in 2017, an increase of
5%
compared to
$548.1 million
in
2016
. Service revenue was
$917.8 million
in
2017
, an increase of
26%
compared to
$727.3 million
in
2016
.
|
|
•
|
We generated operating income of
$109.8 million
in 2017, an increase of 156% compared to
$42.9 million
in 2016.
|
|
•
|
Cash, cash equivalents and investments were
$1.35 billion
as of
December 31, 2017
, an increase of
$38.8 million
, or
3%
, from
December 31, 2016
.
|
|
•
|
Deferred revenue was
$1.34 billion
as of
December 31, 2017
, an increase of
$301.0 million
, or
29%
, from
December 31, 2016
.
|
|
•
|
We generated cash flows from operating activities of
$594.4 million
in
2017
, an increase of
$248.7 million
, or
72%
, compared to
2016
.
|
|
•
|
In 2017, we repurchased
11.2 million
shares of common stock under the Repurchase Program for an aggregate purchase price of
$446.3 million
. In 2016, we repurchased 3.9 million shares of common stock for a total purchase price of $110.8 million.
|
Our revenue growth was driven by the strength in sales of our FortiGate and non-FortiGate products and the sale of new, and the renewal and upgrade of existing, FortiCare technical support and FortiGuard security subscription service contracts. Revenue grew in 2017 as the investment made in sales and marketing enabled us to continue to gain enterprise customers.
42
We continue to see a shift in our revenue mix from product revenues to higher-margin, recurring service revenues, reflecting our success in driving higher-priced subscription bundles and services. On a geographic basis, revenue continues to be diversified globally, which remains a key strength of our business.
The percentage of our FortiGate-related billings from high-end products increased from
38%
in 2016 to
39%
in 2017, and the percentage of our FortiGate-related billings from mid-range products increased from
28%
in 2016 to
30%
in 2017. The percentage of our FortiGate-related billings from entry-level products decreased to
31%
in 2017 from 34% in 2016. The sale of non-FortiGate products also grew significantly in 2017. We also saw more deals that included multiple Fortinet products in physical, virtual and cloud environments.
In
2017
, operating expenses as a percentage of revenue decreased by 3 percentage points compared to
2016
. The decrease was primarily driven by a reduction in sales and marketing expenses as a percentage of revenue. Headcount increased by 9% to 5,066 employees and contractors as of December 31, 2017, up from 4,665 as of December 31, 2016.
Business Model
Our sales strategy is based on a distribution model whereby we primarily sell our products, software licenses and services directly to distributors which sell to resellers and service providers, which, in turn, sell to our end-customers. In certain cases, we sell directly to large service providers and major systems integrators. We also offer our products across all major cloud providers, including Amazon Web Services, Microsoft Azure, Google Cloud, IBM Cloud and Oracle Cloud. While the revenue from such sales are still relatively insignificant, they have increased significantly in recent periods on a percentage basis.
Typically, FortiGuard security subscription and FortiCare technical support services are purchased along with our hardware products and software licenses, most frequently as part of a bundle offering that includes hardware and services functionality. We generally invoice at the time of our sale for the total price of the products and security and technical support services, and the invoice is payable within 30 to 90 days. We also invoice certain licenses and services on a monthly basis.
We generally recognize product revenue up front, and recognize revenue for the sale of new and the renewal of existing FortiGuard security subscription and FortiCare technical support services contracts ratably over the term of the service contract. We recognize revenue for certain software licenses up front as product revenue and, to a lesser extent, recognize other software licenses over the term of the agreement as services revenue. We recognize the security and support revenue over the service period, which is typically one to three years, to a lesser extent, five years. Sales of new and renewal services are a source of recurring revenue and increase our deferred revenue balance, which has contributed to our positive cash flow from operations. We recognize commissions on both product and service sales at the time of sale.
Our approach to network security is defined by our SPU hardware architecture. The SPU includes three lines of proprietary ASICs, content processor, network processor and the system on a chip. The ASICs are designed for highly efficient execution of computationally intensive tasks, including policy enforcement, threat detection and encryption. As such, ASIC-based solutions can run many security applications simultaneously without a significant reduction in performance.
Key Metrics
We monitor a number of key metrics, including the key financial metrics set forth below, in order to help us evaluate growth trends, establish budgets, measure the effectiveness of our sales and marketing efforts, and assess operational efficiencies. The following table summarizes revenue, deferred revenue, billings (non-GAAP), cash, cash equivalents and investments, net cash provided by operating activities, and free cash flow (non-GAAP). We discuss revenue below under “—Components of Operating Results,” and we discuss our cash, cash equivalents and investments, and net cash provided by operating activities below under “—Liquidity and Capital Resources.” Deferred revenue, billings (non-GAAP), and free cash flow (non-GAAP) are discussed immediately below the following table.
43
|
|
Year Ended or As of December 31,
|
||||||||||
|
2017
|
2016
|
2015
|
|||||||||
|
(in thousands)
|
|||||||||||
|
Revenue
|
$
|
1,494,930
|
|
$
|
1,275,443
|
|
$
|
1,009,268
|
|
||
|
Deferred revenue
|
$
|
1,336,314
|
|
$
|
1,035,349
|
|
$
|
791,303
|
|
||
|
Billings (non-GAAP)
|
$
|
1,795,895
|
|
$
|
1,515,089
|
|
$
|
1,232,014
|
|
||
|
Cash, cash equivalents and investments
|
$
|
1,349,299
|
|
$
|
1,310,508
|
|
$
|
1,164,310
|
|
||
|
Net cash provided by operating activities
|
$
|
594,405
|
|
$
|
345,708
|
|
$
|
282,547
|
|
||
|
Free cash flow (non-GAAP)
|
$
|
459,093
|
|
$
|
278,526
|
|
$
|
245,189
|
|
||
Deferred revenue.
Our deferred revenue consists of amounts that have been invoiced but that have not yet been recognized as revenue. The majority of our deferred revenue balance consists of the unrecognized portion of service revenue from FortiGuard security subscription and FortiCare technical support service contracts, which is recognized as revenue ratably over the contractual service period. We monitor our deferred revenue balance, growth and the mix of short-term and long-term deferred revenue because it represents a significant portion of revenue and free cash flow to be recognized in future periods. Deferred revenue was
$1.34 billion
as of
December 31, 2017
, an increase of
$301.0 million
, or
29%
, from
December 31, 2016
.
Billings (non-GAAP).
We define billings as revenue recognized in accordance with generally accepted accounting principles in the United States (“GAAP”) plus the change in deferred revenue from the beginning to the end of the period less any deferred revenue balances acquired from business combination(s) during the period. We consider billings to be a useful metric for management and investors because billings drive future revenue, which is an important indicator of the health and viability of our business. There are a number of limitations related to the use of billings instead of GAAP revenue. First, billings include amounts that have not yet been recognized as revenue and are impacted by the term of security and support agreements. Second, we may calculate billings in a manner that is different from peer companies that report similar financial measures. Management accounts for these limitations by providing specific information regarding GAAP revenue and evaluating billings together with GAAP revenue. Total billings were
$1.80 billion
for 2017, an increase of
19%
compared to
$1.52 billion
in 2016.
A reconciliation of billings to revenue, the most directly comparable financial measure calculated and presented in accordance with GAAP, is provided below:
|
|
Year Ended December 31,
|
||||||||||
|
2017
|
2016
|
2015
|
|||||||||
|
(in thousands)
|
|||||||||||
|
Billings:
|
|||||||||||
|
Revenue
|
$
|
1,494,930
|
|
$
|
1,275,443
|
|
$
|
1,009,268
|
|
||
|
Add change in deferred revenue
|
300,965
|
|
244,046
|
|
232,546
|
|
|||||
|
Less deferred revenue balance acquired in business combination
|
—
|
|
(4,400
|
)
|
(9,800
|
)
|
|||||
|
Total billings (non-GAAP)
|
$
|
1,795,895
|
|
$
|
1,515,089
|
|
$
|
1,232,014
|
|
||
Free cash flow (non-GAAP).
We define free cash flow as net cash provided by operating activities minus capital expenditures such as purchases of real estate and other property and equipment. We believe free cash flow to be a liquidity measure that provides useful information to management and investors about the amount of cash generated by the business that, after capital expenditures, can be used for strategic opportunities, including repurchasing outstanding common stock, investing in our business, making strategic acquisitions and strengthening the balance sheet. A limitation of using free cash flow rather than the GAAP measure of net cash provided by operating activities is that free cash flow does not represent the total increase or decrease in the cash, cash equivalents and investments balance for the period because it excludes cash provided by or used for other investing and financing activities. Management accounts for this limitation by providing information about our capital expenditures and other investing and financing activities on the face of the cash flow statement and under “—Liquidity and Capital Resources” and by presenting cash flows from investing and financing activities in our reconciliation of free cash flows. In addition, it is important to note that other companies, including companies in our industry, may not use free cash flow, may calculate free cash flow in a different manner than we do or may use other financial measures to evaluate their performance, all of which could reduce the usefulness of free cash flows as a comparative measure. A reconciliation of free cash flow to net cash provided by operating activities, the most directly comparable financial measure calculated and presented in accordance with GAAP, is provided below:
44
|
|
Year Ended December 31,
|
||||||||||
|
2017
|
2016
|
2015
|
|||||||||
|
(in thousands)
|
|||||||||||
|
Free Cash Flow:
|
|||||||||||
|
Net cash provided by operating activities
|
$
|
594,405
|
|
$
|
345,708
|
|
$
|
282,547
|
|
||
|
Less purchases of property and equipment
|
(135,312
|
)
|
(67,182
|
)
|
(37,358
|
)
|
|||||
|
Free cash flow (non-GAAP)
|
$
|
459,093
|
|
$
|
278,526
|
|
$
|
245,189
|
|
||
|
Net cash used in investing activities
|
$
|
(76,803
|
)
|
$
|
(74,123
|
)
|
$
|
(967
|
)
|
||
|
Net cash used in financing activities
|
$
|
(415,601
|
)
|
$
|
(105,859
|
)
|
$
|
(21,557
|
)
|
||
Components of Operating Results
Revenue
We generate the majority of our revenue from sales of our products and amortization of amounts included in deferred revenue related to previous sales of FortiGuard security subscription and FortiCare technical support services. We also recognize revenue from sales of software licenses, cloud business relationships and providing professional services. Revenue is recognized when persuasive evidence of an arrangement exists, delivery has occurred or services have been rendered, the sales price is fixed or determinable and collectability is reasonably assured.
Our total revenue is comprised of the following:
|
•
|
Product revenue
. Product revenue is primarily generated from sales of our appliances. The majority of our product revenue has been generated by our FortiGate line of appliances, and we do not expect this to change in the foreseeable future. Product revenue also includes revenue derived from sales of software. As a percentage of total revenue, we expect that our product revenue may vary from quarter-to-quarter based on certain factors, as discussed below under “—Quarterly Results of Operations,” and we expect the trend to continue in 2018.
|
|
•
|
Service revenue
. Service revenue is generated primarily from FortiGuard security subscription services related to application control, antivirus, intrusion prevention, web filtering, anti-spam, ATP and vulnerability management updates, and from FortiCare technical support services for software updates, maintenance releases and patches, internet access to technical content, telephone and internet access to technical support personnel and hardware support. We recognize revenue from FortiGuard security subscription and FortiCare technical support services over the contractual service period. Our typical contractual support and subscription term is one to three years and, to a lesser extent, five years. We also generate a small portion of our revenue from professional services and training services, for which we recognize revenue as the services are provided, and cloud-based services, for which we recognize revenue as the subscription service is delivered over the term, which is typically one year, or on a monthly usage basis. We continue to see a shift from product revenue to higher-margin, recurring service revenue, which reflects our ongoing success in driving sales of mid-range and high-end service bundles, as well as increases in certain software and other time based service models. Our service revenue growth rate depends significantly on the growth of our customer base, the expansion of our service bundle offerings, the expansion and introduction of new service offerings and the renewal of service contracts by our existing customers.
|
Our total cost of revenue is comprised of the following:
|
•
|
Cost of product revenue
. A substantial majority of the cost of product revenue consists of third-party contract manufacturers' costs, as well as other costs of materials used in production. Our cost of product revenue also includes supplies, shipping costs, personnel costs associated with logistics and quality control, facility-related costs, excess and obsolete inventory costs, warranty costs, and amortization and impairment of intangible assets, if applicable. Personnel costs include direct compensation and benefits.
|
|
•
|
Cost of service revenue
. Cost of service revenue is primarily comprised of salaries, benefits and bonuses, as well as stock-based compensation. Cost of service revenue also includes supplies and facility-related costs.
|
45
Gross margin
. Gross profit as a percentage of revenue, or gross margin, has been and will continue to be affected by a variety of factors, including the average sales price of our products, product costs, the mix of products sold and the mix of revenue between products, software licenses and services and any excess inventory write-offs. Service revenue and software licenses have had a positive effect on our total gross margin given the higher gross margins compared to product gross margins. During
2017
, service gross margin benefited from the shift to higher-margin service revenue. Product gross margin was negatively impacted as longer term deals and higher priced service bundles resulted in allocating a lower percentage of contract values to product and allocating a larger percentage of contact values to services. As a result, the service margin expansion was partially offset by a decline in product gross margin in 2017. We believe our overall gross margin will remain at a relatively comparable level in 2018.
Operating expenses
. Our operating expenses consist of research and development, sales and marketing, general and administrative expenses, and restructuring charges. Personnel costs are the most significant component of operating expenses and consist primarily of salaries, benefits, bonuses, stock-based compensation, and sales commissions, as applicable. We expect personnel costs to continue to increase in absolute dollars as we expand our workforce. We expect sales commission expense recognized at the time of sale to decrease as a percentage of revenue due to the adoption of ASU 2014-09—Revenue from Contracts with Customers.
|
•
|
Research and development
. Research and development expense consists primarily of personnel costs. Additional research and development expenses include ASIC and system prototypes and certification-related expenses, depreciation of capital equipment and facility-related expenses. The majority of our research and development is focused on both software development and the ongoing development of our hardware platform. We record all research and development expenses as incurred. Our research and development teams are primarily located in Canada and the United States.
|
|
•
|
Sales and marketing
. Sales and marketing expense is the largest component of our operating expenses and primarily consists of personnel costs. Additional sales and marketing expenses include promotional lead generation and other marketing expenses, travel, depreciation of capital equipment and facility-related expenses. We intend to hire additional personnel focused on sales and marketing and expand our sales and marketing efforts worldwide in order to capture additional market share in the high-return enterprise market, where customers tend to provide a higher lifetime value.
|
|
•
|
General and administrative
. General and administrative expense consists of personnel costs, as well as professional fees, depreciation of capital equipment and software, facility-related expenses, expenses associated with the ERP system implementation and business acquisition costs. General and administrative personnel include our executive, finance, human resources, information technology and legal organizations. Our professional fees principally consist of outside legal, auditing, accounting, tax, information technology and other consulting costs.
|
|
•
|
Restructuring charges
. Restructuring charges relate to alignment activities performed in connection with the Meru Networks, Inc. (“Meru”) and AccelOps, Inc. (“AccelOps”) acquisitions to reduce our cost structure and improve operational efficiencies, resulting in workforce reductions, contract terminations and other charges.
|
Interest income.
Interest income consists of income earned on our cash, cash equivalents and investments. We have historically invested our cash in corporate debt securities, money market funds, certificates of deposit, commercial paper, U.S. government and agency securities and municipal bonds.
Other income (expense)
—
net
. Other income (expense)—net consists primarily of foreign exchange gains and losses related to foreign currency exchange remeasurement.
Provision for income taxes.
We are subject to tax in the United States, as well as other tax jurisdictions or countries in which we conduct business. Earnings from our non-U.S. activities are subject to income taxes in the local country, which are generally lower than U.S. tax rates, and may be subject to U.S. income taxes. Our effective tax rate differs from the U.S. statutory rate primarily due to foreign income subject to different tax rates than in the U.S., research and development tax credits, withholding taxes, nondeductible stock-based compensation expense and the tax impact of the 2017 Tax Act.
46
In December, 2017, the U.S. federal government enacted the 2017 Tax Act. The 2017 Tax Act decreased the federal corporate income tax rate from 35% to 21% effective January 1, 2018 and created a territorial tax system with a one-time mandatory tax on foreign earnings of U.S. subsidiaries not previously subject to U.S. income tax. Under GAAP, changes in tax rates and tax law are accounted for in the period of enactment and deferred tax assets and liabilities are measured at the enacted tax rate. As such, we provisionally recorded a $47.9 million expense on the remeasurement of deferred assets due to the reduction of the federal corporate income tax rate, and a $15.2 million expense for the one-time transition tax on the deemed repatriation related to the 2017 Tax Act.
Our effective tax rate approximates the federal corporate income tax rates plus the impact of state taxes, excess tax benefits related to stock-based compensation expense, research and development tax credits, foreign withholding tax, nondeductible stock-based compensation expense, foreign income subject to lower tax rates than income earned in the United States, deferred tax assets remeasurement and a one-time transition tax.
Critical Accounting Policies and Estimates
Our discussion and analysis of our financial condition and results of operations are based upon our financial statements, which have been prepared in accordance with GAAP. These principles require us to make estimates and judgments that affect the reported amounts of assets, liabilities, revenue, cost of revenue and expenses, and related disclosures. We base our estimates on historical experience and on various other assumptions that we believe to be reasonable under the circumstances. To the extent that there are material differences between these estimates and our actual results, our future financial statements will be affected.
We believe that, of the significant accounting policies described in Note 1 to our consolidated financial statements included in Part II, Item 8 of this Annual Report on Form 10-K, the following accounting policies involve a greater degree of judgment and complexity. Accordingly, we believe these are the most critical to fully understand and evaluate our financial condition and results of operations.
Revenue Recognition
We derive the majority of our revenue from sales of our hardware, FortiGuard security subscription and FortiCare technical support services, and other services through our channel partners and a direct sales force.
Revenue is recognized when all of the following criteria have been met:
|
•
|
Persuasive evidence of an arrangement exists.
Binding contracts or purchase orders are generally used to determine the existence of an arrangement.
|
|
•
|
Delivery has occurred or services have been rendered.
Product delivery occurs when we fulfill an order and title and risk of loss has been transferred. Service revenue is deferred and recognized ratably over the contractual service period, which is typically from one to three years and, to a lesser extent,
five
years, and is generally recognized upon delivery or completion of service.
|
|
•
|
Sales price is fixed or determinable.
We assess whether the sales price is fixed or determinable based on the payment terms associated with the transaction and when the sales price is deemed final.
|
|
•
|
Collectability is reasonably assured
. We assess collectability based primarily on creditworthiness as determined by credit checks, analysis, and payment history.
|
We recognize product revenue for sales to distributors that have no general right of return and direct sales to end-customers upon shipment, based on general revenue recognition accounting guidance once all other revenue recognition criteria have been met. Certain distributors are granted stock rotation rights, limited rights of return and rebates for sales of our products. The arrangement fee for this group of distributors is not typically fixed or determinable when products are shipped and revenue is therefore deferred and recognized upon sell-through. For sales that include end-customer acceptance criteria, revenue is recognized upon acceptance. We recognize software license revenue upon electronic transfer of the license key to the customer. Historically, software license revenue has not been material.
47
Substantially all of our products have been sold in combination with services, which consist of security subscriptions and technical support services. Security services provide access to our antivirus, intrusion prevention, web filtering, and anti-spam functionality. Support services include rights to unspecified software upgrades, maintenance releases and patches, telephone and internet access to technical support personnel, and hardware support.
Service revenue consists of sales from our FortiGuard security subscription and FortiCare technical support services, professional and training services and other services that include SaaS and IaaS, both of which are hosted or cloud-based services. We recognize revenue from these arrangements as the subscription service is delivered over the term, which is typically one year, or on a monthly usage basis. To date, SaaS and IaaS revenues have not represented a significant percentage of our total revenue.
We reduce revenue for estimates of sales returns and allowances and
record reductions to revenue for rebates and estimated commitments related to price protection and other customer incentive programs. Additionally, in limited circumstances, we may permit end-customers, distributors and resellers to return our products, subject to varying limitations, for a refund within a reasonably short period from the date of purchase. We estimate and record reserves for sales incentives and sales returns based on historical experience.
Our sales arrangements typically contain multiple elements, such as hardware, security subscription, technical support services and other services. The majority of our hardware appliance products contain our operating system software that together function to deliver the essential functionality of the product. Our products and services generally qualify as separate units of accounting. We allocate revenue to each unit of accounting based on an estimated selling price using vendor-specific objective evidence (“VSOE”) of selling price, if it exists, or third-party evidence (“TPE”) of selling price. If neither VSOE nor TPE of selling price exists for a deliverable, we use our best estimate of selling price (“BESP”) for that deliverable. Revenue allocated to each element is then recognized when the basic revenue recognition criteria are met for each element. Revenue is reported net of sales taxes.
For our hardware appliances, we use BESP as our selling price estimate. For our support and other services, we generally use VSOE as our selling price estimate. We determine VSOE of fair value for elements of an arrangement based on the historical pricing and discounting practices for those services when sold separately. In establishing VSOE, we require that a substantial majority of the selling prices for a service fall within a reasonably narrow pricing range, generally evidenced by a substantial majority of such historical stand-alone transactions falling within a reasonably narrow range as a percentage of list price. When we are unable to establish a selling price using VSOE for our support and other services, we use BESP in our allocation of arrangement consideration. We determine BESP for a product or service by considering multiple historical factors including, but not limited to, cost of products, gross margin objectives, pricing practices, geographies, customer classes and distribution channels that fall within a reasonably narrow range as a percentage of list price.
For multiple-element arrangements where software deliverables are included, revenue is allocated to the non-software deliverables and to the software deliverables as a group using the relative estimated selling prices of each of the deliverables in the arrangement based on the estimated selling price hierarchy. The amount allocated to the software deliverables is then allocated to each software deliverable using the residual method when VSOE of fair value exists. If evidence of VSOE of fair value of one or more undelivered elements does not exist, all software allocated revenue is deferred and recognized when delivery of those elements occurs or when fair value can be established. When the undelivered element for which we do not have VSOE of fair value is support, revenue for the entire arrangement is recognized ratably over the support period. The same residual method and VSOE of fair value principles apply for our multiple element arrangements that contain only software elements.
48
ASU 2014-09
On January 1, 2018, we adopted Accounting Standards Update (“ASU”) 2014-09—Revenue from Contracts with Customers, which outlines a single, comprehensive model for entities to use in accounting for revenue arising from contracts with customers. The core principle of ASU 2014-09 is to recognize revenue when promised goods or services are transferred to customers in an amount that reflects the consideration that is expected to be received for those goods or services. ASU 2014-09 defines a five-step process to achieve this core principle and, accordingly, we expect more judgment and estimates may be required within the revenue recognition process than is required under the legacy GAAP, including identifying performance obligations in the contract, estimating the amount of variable consideration to include in the transaction price and allocating the transaction price to each separate performance obligation. ASU 2014-09 permits two methods of adoption: retrospectively to each prior reporting period presented (the full retrospective method), or retrospectively with the cumulative effect of initially applying the guidance recognized at the date of initial application (the modified retrospective method). We elected to adopt ASU 2014-09 using the modified retrospective method and will apply the standard to contracts that are not completed as of January 1, 2018, and will recognize the cumulative effect of initially applying the standard as an adjustment to the opening balance of accumulated deficit.
We have completed our analysis of open revenue contracts as of January 1, 2018. Based on our assessment, the impact on revenue in our consolidated financial statements is not material. The impact on revenue primarily relates to the acceleration of revenue from U.S.-based channel partners that was previously deferred until the product was sold through and certain changes related to revenue recognized on software license sales. We expect the pattern of revenue recognition from direct sales of our FortiGate and other appliances and FortiGuard security subscription and FortiCare technical support services to be substantially unchanged on an ongoing basis.
Commission Expense
We recognize commission expense on both product sales and service contracts at the time of sale. Under ASC 2014-09, as of January 1, 2018, we will continue to expense commissions related to appliance sales when incurred, but will capitalize and recognize certain commissions on service contracts over the period of benefit. As part of the transition to the new accounting standard, we expect to capitalize at least
$130.0
million of sales commissions that have been determined to be the remaining costs to obtain then existing service contracts. Capitalized sales commissions will be amortized on a straight-line basis over the period of benefit for new business or the contract term for renewals. See Note 1 to our consolidated financial statements in Part II, Item 8 of this Annual Report on Form 10-K for further discussion.
Stock-Based Compensation
Employee Stock Options.
We estimate the fair value of employee stock options awarded to our employees using the Black-Scholes-Merton (“Black-Scholes”) pricing model. For all employee stock options, we recognize expense over the requisite service period using the straight-line method. Our option pricing model requires the input of subjective assumptions, including the expected stock price volatility, expected term, risk-free interest rates and expected dividend yield of our common stock. The assumptions used in our option pricing model represent management’s best estimates. These estimates involve inherent uncertainties and the application of management’s judgment. A 10% change in any of these assumptions would not have a significant impact on our stock-based compensation expense.
Employee Stock Purchase Plan.
We estimate the fair value of the rights to acquire stock under our employee stock purchase plan (“ESPP”) using the Black-Scholes pricing model and we recognize expense over the requisite service period using the straight-line method. The pricing model requires the input of the fair value of our common stock and assumptions, including the expected term of the award, expected volatility of the price of our common stock, risk-free interest rates and expected dividend yield of our common stock. Our ESPP provides for consecutive six-month offering periods and we use our own historical volatility data in the valuation of ESPP shares. A 10% change in any of these assumptions would not have a significant impact on our stock-based compensation expense.
49
Valuation of Inventory
As of December 31, 2016, inventory was recorded at the lower of cost or market. On January 1, 2017, we adopted ASU 2015-11—Inventory: Simplifying the Measurement of Inventory. As such, as of December 31, 2017, inventory is recorded at the lower of cost or net realizable value. Adoption of ASU 2015-11 did not have an impact on our consolidated financial statements. Cost is computed using the first-in, first-out method. In assessing the ultimate recoverability of inventory, we make estimates regarding future customer demand, the timing of new product introductions, economic trends and market conditions. If the actual product demand is significantly lower than forecasted, we could be required to record additional inventory write-downs which would be charged to cost of product revenue. Any write-downs could have an adverse impact on our gross margins and profitability.
Business Combinations
We include the results of operations of the businesses that we acquire as of the respective dates of acquisition. We allocate the fair value of the purchase price of our business acquisitions to the tangible assets acquired, liabilities assumed, and intangible assets acquired, based on their estimated fair values. The excess of the purchase price over the fair values of these identifiable assets and liabilities is recorded as goodwill. We often continue to gather additional information throughout the measurement period, and if we make changes to the amounts recorded, such charges are recorded in the period in which they are identified.
Restructuring
Our restructuring expenses consist of severance and other one-time benefits, contract terminations and other expenses. Liabilities for costs associated with a restructuring activity are measured at fair value. One-time termination benefits are expensed at the date we notify the employee, unless the employee must provide future service, in which case the benefits are expensed ratably over the future service period. A liability for terminating a contract before the end of its term, which termination is usually done by giving written notice to the counterparty within the notification period specified by the contract or by otherwise negotiating a termination with the counterparty, is recognized at fair value on the notification date. A liability for costs that will continue to be incurred under a contract for its remaining term without economic benefit to the entity is recognized at the cease-use date. Other costs primarily consist of asset write-offs, which are expensed when incurred.
Accounting for Income Taxes
We record income taxes using the asset and liability method, which requires the recognition of deferred tax assets and liabilities for the expected future tax consequences of events that have been recognized in our financial statements or tax returns. In addition, deferred tax assets are recorded for the future benefit of utilizing net operating losses and research and development credit carryforwards. Deferred tax assets and liabilities are measured using the currently enacted tax rates that apply to taxable income in effect for the years in which those tax assets and liabilities are expected to be realized or settled. Valuation allowances are provided when necessary to reduce deferred tax assets to the amount expected to be realized.
We recognize tax benefits from an uncertain tax position only if it is more likely than not, based on the technical merits of the position that the tax position will be sustained on examination by the taxing authorities. The tax benefits recognized in the financial statements from such positions are then measured based on the largest benefit that has a greater than 50% likelihood of being realized upon ultimate settlement.
In December 2017, the U.S. federal government enacted the 2017 Tax Act. The 2017 Tax Act reduced the federal corporate income tax rate from 35% to 21% effective January 1, 2018 and created a territorial tax system with a one-time transition tax on foreign earnings of U.S. subsidiaries not previously subject to U.S. income tax. Under U.S. GAAP, changes in tax rates and tax law are accounted for in the period of enactment and deferred tax assets and liabilities are measured at the enacted tax rate. Due to the timing of the enactment and the complexity involved in applying the provisions of the 2017 Tax Act, we have recorded provisional estimates associated with the 2017 Tax Act. We consider both the recognition of the transition tax and the remeasurement of deferred income taxes incomplete. New guidance from regulators, interpretation of the law, and refinement of our estimates from ongoing analysis of data and tax positions may change the provisional amounts.
50
As part of the process of preparing our consolidated financial statements, we are required to estimate our taxes in each of the jurisdictions in which we operate. We estimate actual current tax exposure together with assessing temporary differences resulting from differing treatment of items, such as accruals and allowances not currently deductible for tax purposes. These differences result in deferred tax assets, which are included in our consolidated balance sheets. In general, deferred tax assets represent future tax benefits to be received when certain expenses previously recognized in our consolidated statements of operations become deductible expenses under applicable income tax laws, or loss or credit carryforwards are utilized.
In assessing the realizability of deferred tax assets, management considers whether it is more likely than not that some portion or all of the deferred tax assets will be realized. The ultimate realization of deferred tax assets is dependent upon the generation of future taxable income during the periods in which those temporary differences become deductible. We continue to assess the need for a valuation allowance on the deferred tax assets by evaluating both positive and negative evidence that may exist. Any adjustment to the valuation allowance on deferred tax assets would be recorded in the consolidated statements of operations for the period that the adjustment is determined to be required.
We make estimates and judgments about our future taxable income that are based on assumptions that are consistent with our plans and estimates. Should the actual amounts differ from our estimates, the amount of our tax expense and liabilities could be materially impacted.
Results of Operations
The following tables set forth our results of operations for the periods presented and as a percentage of our total revenue for those periods. The period-to-period comparison of financial results is not necessarily indicative of financial results to be achieved in future periods.
|
|
Year Ended December 31,
|
||||||||||
|
|
2017
|
2016
|
2015
|
||||||||
|
|
(in thousands)
|
||||||||||
|
Consolidated Statement of Operations Data:
|
|||||||||||
|
Revenue:
|
|||||||||||
|
Product
|
$
|
577,171
|
|
$
|
548,110
|
|
$
|
476,782
|
|
||
|
Service
|
917,759
|
|
727,333
|
|
532,486
|
|
|||||
|
Total revenue
|
1,494,930
|
|
1,275,443
|
|
1,009,268
|
|
|||||
|
Cost of revenue:
|
|||||||||||
|
Product
|
243,824
|
|
208,984
|
|
190,398
|
|
|||||
|
Service
|
141,460
|
|
128,853
|
|
96,379
|
|
|||||
|
Total cost of revenue
|
385,284
|
|
337,837
|
|
286,777
|
|
|||||
|
Gross profit:
|
|||||||||||
|
Product
|
333,347
|
|
339,126
|
|
286,384
|
|
|||||
|
Service
|
776,299
|
|
598,480
|
|
436,107
|
|
|||||
|
Total gross profit
|
1,109,646
|
|
937,606
|
|
722,491
|
|
|||||
|
Operating expenses:
|
|||||||||||
|
Research and development
|
210,614
|
|
183,084
|
|
158,129
|
|
|||||
|
Sales and marketing
|
701,026
|
|
626,501
|
|
470,371
|
|
|||||
|
General and administrative
|
87,862
|
|
81,080
|
|
71,514
|
|
|||||
|
Restructuring charges
|
340
|
|
3,997
|
|
7,600
|
|
|||||
|
Total operating expenses
|
999,842
|
|
894,662
|
|
707,614
|
|
|||||
|
Operating income
|
109,804
|
|
42,944
|
|
14,877
|
|
|||||
|
Interest income
|
13,482
|
|
7,303
|
|
5,295
|
|
|||||
|
Other income (expense)—net
|
708
|
|
(7,099
|
)
|
(3,167
|
)
|
|||||
|
Income before income taxes
|
123,994
|
|
43,148
|
|
17,005
|
|
|||||
|
Provision for income taxes
|
92,595
|
|
10,961
|
|
9,018
|
|
|||||
|
Net income
|
$
|
31,399
|
|
$
|
32,187
|
|
$
|
7,987
|
|
||
51
|
|
Year Ended December 31,
|
|||||||
|
2017
|
2016
|
2015
|
||||||
|
(as percentage of revenue)
|
||||||||
|
Revenue:
|
||||||||
|
Product
|
39
|
%
|
43
|
%
|
47
|
%
|
||
|
Service
|
61
|
|
57
|
|
53
|
|
||
|
Total revenue
|
100
|
|
100
|
|
100
|
|
||
|
Cost of revenue:
|
||||||||
|
Product
|
16
|
|
16
|
|
19
|
|
||
|
Service
|
9
|
|
10
|
|
10
|
|
||
|
Total cost of revenue
|
26
|
|
26
|
|
28
|
|
||
|
Gross margin:
|
||||||||
|
Product
|
58
|
|
62
|
|
60
|
|
||
|
Service
|
85
|
|
82
|
|
82
|
|
||
|
Total gross margin
|
74
|
|
74
|
|
72
|
|
||
|
Operating expenses:
|
||||||||
|
Research and development
|
14
|
|
14
|
|
16
|
|
||
|
Sales and marketing
|
47
|
|
49
|
|
47
|
|
||
|
General and administrative
|
6
|
|
6
|
|
7
|
|
||
|
Restructuring charges
|
—
|
|
0.3
|
|
1
|
|
||
|
Total operating expenses
|
67
|
|
70
|
|
70
|
|
||
|
Operating margin
|
7
|
|
3
|
|
1
|
|
||
|
Interest income
|
1
|
|
1
|
|
1
|
|
||
|
Other income (expense)—net
|
—
|
|
(1
|
)
|
—
|
|
||
|
Income before income taxes
|
8
|
|
3
|
|
2
|
|
||
|
Provision for income taxes
|
6
|
|
1
|
|
1
|
|
||
|
Net income
|
2
|
%
|
3
|
%
|
1
|
%
|
||
2017
and
2016
Revenue
|
|
Year Ended December 31,
|
|
|
|||||||||||||||||
|
2017
|
2016
|
|
|
|||||||||||||||||
|
Amount
|
% of
Revenue
|
Amount
|
% of
Revenue
|
Change
|
% Change
|
|||||||||||||||
|
(in thousands, except percentages)
|
||||||||||||||||||||
|
Revenue:
|
||||||||||||||||||||
|
Product
|
$
|
577,171
|
|
39
|
%
|
$
|
548,110
|
|
43
|
%
|
$
|
29,061
|
|
5
|
%
|
|||||
|
Service
|
917,759
|
|
61
|
|
727,333
|
|
57
|
|
190,426
|
|
26
|
|
||||||||
|
Total revenue
|
$
|
1,494,930
|
|
100
|
%
|
$
|
1,275,443
|
|
100
|
%
|
$
|
219,487
|
|
17
|
%
|
|||||
|
Revenue by geography:
|
||||||||||||||||||||
|
Americas
|
$
|
642,331
|
|
43
|
%
|
$
|
536,706
|
|
42
|
%
|
$
|
105,625
|
|
20
|
%
|
|||||
|
Europe, Middle East and Africa (“EMEA”)
|
554,569
|
|
37
|
|
477,393
|
|
37
|
|
77,176
|
|
16
|
|
||||||||
|
Asia Pacific (“APAC”)
|
298,030
|
|
20
|
|
261,344
|
|
21
|
|
36,686
|
|
14
|
|
||||||||
|
Total revenue
|
$
|
1,494,930
|
|
100
|
%
|
$
|
1,275,443
|
|
100
|
%
|
$
|
219,487
|
|
17
|
%
|
|||||
52
Total revenue increased by
$219.5 million
, or
17%
, in
2017
compared to
2016
. We continued to experience global diversification of revenue in 2017. Revenue from all our regions grew, with the Americas contributing the largest portion of our revenue growth both on an absolute dollar and on a percentage basis. Product revenue increased by
$29.1 million
, or
5%
, in 2017 compared to
2016
. The increase in product revenue was primarily driven by greater sales volume in our FortiGate product family across all product categories and in particular for our high-end and mid-range products for large enterprise customers. Sales of non-FortiGate products, such as the Fortinet Security Fabric and cloud products, also grew significantly. Service revenue increased by
$190.4 million
, or
26%
, in
2017
compared to
2016
. The increase in service revenue was primarily due to the recognition of revenue from our growing deferred revenue balance consisting of FortiGuard security subscription and FortiCare technical support contracts sold to a larger customer base, as well as the renewals of similar contracts sold in earlier periods. We continue to see a shift from product revenues to higher-margin, recurring service revenues, which reflect our ongoing success in driving sales of high-end and mid-range products and tend to include more security subscriptions and support services, as well as longer contract durations.
Cost of revenue and gross margin
|
|
Year Ended December 31,
|
|
|
|||||||||||
|
2017
|
2016
|
Change
|
% Change
|
|||||||||||
|
(in thousands, except percentages)
|
||||||||||||||
|
Cost of revenue:
|
||||||||||||||
|
Product
|
$
|
243,824
|
|
$
|
208,984
|
|
$
|
34,840
|
|
17
|
%
|
|||
|
Service
|
141,460
|
|
128,853
|
|
12,607
|
|
10
|
|
||||||
|
Total cost of revenue
|
$
|
385,284
|
|
$
|
337,837
|
|
$
|
47,447
|
|
14
|
%
|
|||
|
Gross margin (%):
|
||||||||||||||
|
Product
|
57.8
|
%
|
61.9
|
%
|
(4.1
|
)%
|
||||||||
|
Service
|
84.6
|
|
82.3
|
|
2.3
|
|
||||||||
|
Total gross margin
|
74.2
|
%
|
73.5
|
%
|
0.7
|
%
|
||||||||
Total gross margin increased by
0.7
percentage points in
2017
compared to
2016
, driven by higher margin on service revenue. Service gross margin increased by
2.3
percentage points during 2017 as compared to 2016. Product gross margin decreased by
4.1
percentage points in
2017
compared to
2016
. During
2017
, service gross margin benefited from the shift to higher-margin service revenue. Product gross margin was negatively impacted by longer term deals and higher priced service bundles, resulting in lower product revenue recognized in 2017 and higher deferred revenue for services that will be recognized in future periods, and as a result of product costs being recognized upon shipment. As a result, the service margin expansion was partially offset by a decline in product gross margin in 2017. Total cost of product revenue was comprised primarily of direct and indirect cost of products sold, inventory reserves and other charges. Cost of service revenue was comprised primarily of personnel costs.
Operating expenses
|
|
Year Ended December 31,
|
Change
|
% Change
|
|||||||||||||||||
|
2017
|
2016
|
|||||||||||||||||||
|
Amount
|
% of
Revenue
|
Amount
|
% of
Revenue
|
|||||||||||||||||
|
(in thousands, except percentages)
|
||||||||||||||||||||
|
Operating expenses:
|
||||||||||||||||||||
|
Research and development
|
$
|
210,614
|
|
14
|
%
|
$
|
183,084
|
|
14
|
%
|
$
|
27,530
|
|
15
|
%
|
|||||
|
Sales and marketing
|
701,026
|
|
47
|
|
626,501
|
|
49
|
|
74,525
|
|
12
|
|
||||||||
|
General and administrative
|
87,862
|
|
6
|
|
81,080
|
|
6
|
|
6,782
|
|
8
|
|
||||||||
|
Restructuring charges
|
340
|
|
—
|
|
3,997
|
|
0.3
|
|
(3,657
|
)
|
(91
|
)
|
||||||||
|
Total operating expenses
|
$
|
999,842
|
|
67
|
%
|
$
|
894,662
|
|
70
|
%
|
$
|
105,180
|
|
12
|
%
|
|||||
53
Research and development
Research and development expense increased by
$27.5 million
, or
15%
, in
2017
compared to
2016
, primarily due to an increase of $17.6 million in personnel costs as a result of increased headcount to support the development of new products and continued enhancements of our existing products. In addition, product development costs, such as third-party testing and prototypes, increased by $6.2 million and depreciation and other occupancy-related costs increased by $3.1 million. We intend to continue to invest in our research and development organization, and expect research and development expense to increase in absolute dollars in 2018.
Sales and marketing
Sales and marketing expense increased by
$74.5 million
, or
12%
, in
2017
compared to
2016
, primarily due to an increase of $55.1 million in personnel costs as we continued to increase our sales and marketing headcount in order to drive continued market share gains globally. Marketing-related expense increased by $11.9 million as we invested significantly in marketing programs to drive broader market awareness, build lead generation programs and accelerate pipeline. In addition, depreciation expense and other occupancy-related expense increased by $6.8 million. As a percentage of total revenue, sales and marketing expense decreased as revenue grew at a higher pace compared to personnel costs. We intend to continue to make investments in our sales resources and infrastructure and marketing strategy, which are critical to support growth, and expect sales and marketing expense to increase in absolute dollars in 2018.
General and administrative
General and administrative expense increased by
$6.8 million
, or
8%
, in
2017
compared to
2016
. Personnel costs increased by $8.5 million as we continued to increase headcount in order to support our expanding business. Professional fees increased by $10.6 million, primarily due to the implementation of a new revenue recognition system and a litigation settlement expense of $1.8 million. The increase in expense was partially offset by a decrease in third-party costs of $13.4 million related to the substantial completion of our ERP system implementation in 2016. We expect general and administrative expense to increase in absolute dollars in 2018.
Restructuring
Restructuring expenses of
$0.3 million
and
$4.0 million
in 2017 and 2016, respectively, primarily relate to our restructuring activities to improve operating efficiencies due to the acquisition of AccelOps and certain other activities. See Note 9 to the consolidated financial statements for additional details, including the types of expenses incurred and cash payments made.
Operating margin
We generated operating income of
$109.8 million
in 2017, an increase of $66.9 million, or 156%, compared to
$42.9 million
in 2016. The improvement in operating margin was primarily due to the improvement in gross margin, and the decline in sales and marketing expenses as a percentage of total revenue. As a percentage of total revenue, sales and marketing expenses decreased to 47% in 2017 from 49% in 2016.
Interest income and other income (expense)
—
net
|
|
Year Ended December 31,
|
|
|
|||||||||||
|
2017
|
2016
|
Change
|
% Change
|
|||||||||||
|
(in thousands, except percentages)
|
||||||||||||||
|
Interest income
|
$
|
13,482
|
|
$
|
7,303
|
|
$
|
6,179
|
|
85
|
%
|
|||
|
Other income (expense)—net
|
708
|
|
(7,099
|
)
|
7,807
|
|
(110
|
)
|
||||||
Interest income increased in 2017 as compared to 2016, primarily due to higher interest rates on invested balances of cash, cash equivalents and investments. Interest income varies depending on our average investment balances during the period, types and mix of investments, and market interest rates. The change in other income (expense)—net in 2017 as compared to 2016 was the result of a gain of approximately $1.0 million for foreign currency exchange gains in 2017 compared to a loss of $6.6 million in 2016, due primarily to changes in the value of Euro relative to the U.S. dollar.
54
Provision for income taxes
|
|
Year Ended December 31,
|
Change
|
% Change
|
|||||||||||
|
2017
|
2016
|
|||||||||||||
|
(in thousands, except percentages)
|
||||||||||||||
|
Provision for income taxes
|
$
|
92,595
|
|
$
|
10,961
|
|
$
|
81,634
|
|
745
|
%
|
|||
|
Effective tax rate (%)
|
75
|
%
|
25
|
%
|
50
|
%
|
—
|
|
||||||
Our effective tax rate was
75%
for
2017
, compared to an effective tax rate of
25%
for
2016
. The provision for income taxes for
2017
was comprised primarily of U.S. federal and state taxes, other foreign income taxes, foreign withholding taxes, an increase in tax reserves, remeasurement of deferred tax assets and a one-time transition tax.
In December 2017, the U.S. federal government enacted the 2017 Tax Act. The 2017 Tax Act reduced the federal corporate income tax rate from 35% to 21% effective January 1, 2018 and created a territorial tax system with a one-time mandatory tax on foreign earnings of U.S. subsidiaries not previously subject to U.S. income tax. Under GAAP, changes in tax rates and tax law are accounted for in the period of enactment and deferred tax assets and liabilities are measured at the enacted tax rate.
The SEC staff has issued Staff Accounting Bulletin No. 118 (
“
SAB 118”), which provides guidance on accounting for the tax effects of the 2017 Tax Act. SAB 118 provides a measurement period that should not extend beyond one year from the 2017 Tax Act enactment date for companies to complete the accounting under ASC 740. In accordance with SAB 118, a company must reflect the income tax effects of those aspects of the 2017 Tax Act for which the accounting under ASC 740 is complete. To the extent that a company’s accounting for certain income tax effects of the 2017 Tax Act is incomplete but it is able to determine a reasonable estimate, it must record a provisional estimate in the financial statements. If a company cannot determine a provisional estimate to be included in the financial statements, it should continue to apply ASC 740 on the basis of the provisions of the tax laws that were in effect immediately before the enactment of the 2017 Tax Act.
The increase in the effective tax rate in 2017 was primarily due to the deferred tax assets remeasurement and a one-time transition tax due to the 2017 Tax Act. Excluding the tax impact from the 2017 Tax Act, the 2017 effective tax rate would have been 24%, which was relatively consistent with 2016. In 2016, due to the early adoption of ASU 2016-09, approximately $10.8 million of excess tax benefits were recognized in the income tax provision. In 2017, $13.5 million of excess tax benefits was included in the income tax provision.
It is our policy to classify accrued interest and penalties related to unrecognized tax benefits in the provision for income taxes. As of December 31, 2017, we had accrued $13.5 million for estimated interest related to uncertain tax provisions compared to an accrual of $9.5 million as of December 31, 2016.
It is reasonably possible that our gross unrecognized tax benefits will decrease by up to $12.0 million in the next 12 months, primarily due to the lapse of the statute of limitations and audit settlement. These adjustments, if recognized, would positively impact our effective tax rate, and would be recognized as additional tax benefits.
55
2016
and
2015
Revenue
|
|
Year Ended December 31,
|
Change
|
% Change
|
|||||||||||||||||
|
2016
|
2015
|
|||||||||||||||||||
|
Amount
|
% of
Revenue
|
Amount
|
% of
Revenue
|
|||||||||||||||||
|
(in thousands, except percentages)
|
||||||||||||||||||||
|
Revenue:
|
||||||||||||||||||||
|
Product
|
$
|
548,110
|
|
43
|
%
|
$
|
476,782
|
|
47
|
%
|
$
|
71,328
|
|
15
|
%
|
|||||
|
Service
|
727,333
|
|
57
|
|
532,486
|
|
53
|
|
194,847
|
|
37
|
|
||||||||
|
Total revenue
|
$
|
1,275,443
|
|
100
|
%
|
$
|
1,009,268
|
|
100
|
%
|
$
|
266,175
|
|
26
|
%
|
|||||
|
Revenue by geography:
|
||||||||||||||||||||
|
Americas
|
$
|
536,706
|
|
42
|
%
|
$
|
435,282
|
|
43
|
%
|
$
|
101,424
|
|
23
|
%
|
|||||
|
EMEA
|
477,393
|
|
37
|
|
366,018
|
|
36
|
|
111,375
|
|
30
|
|
||||||||
|
APAC
|
261,344
|
|
21
|
|
207,968
|
|
21
|
|
53,376
|
|
26
|
|
||||||||
|
Total revenue
|
$
|
1,275,443
|
|
100
|
%
|
$
|
1,009,268
|
|
100
|
%
|
$
|
266,175
|
|
26
|
%
|
|||||
Total revenue increased by $266.2 million, or 26%, in 2016 compared to 2015. We continued to experience global diversification of revenue in 2016. Revenue from all our regions grew, with EMEA contributing the largest portion of our revenue growth both on an absolute dollar and on a percentage basis. Product revenue increased by $71.3 million, or 15%, in 2016 compared to 2015. The increase in product revenue was primarily driven by greater sales volume in our FortiGate product family across all product categories and in particular for our high-end and mid-range products for large enterprise customers. Sales of non-FortiGate products also grew significantly. Service revenue increased by $194.8 million, or 37%, in 2016 compared to 2015. The increase in service revenue was primarily due to the recognition of revenue from our growing deferred revenue balance consisting of FortiGuard security subscription and FortiCare technical support contracts sold to a larger customer base, as well as the renewals of similar contracts sold in earlier periods. We started to see a shift from product revenues to higher-margin, recurring service revenues, which reflected our ongoing success in driving sales of service bundles.
Cost of revenue and gross margin
|
|
Year Ended December 31,
|
Change
|
% Change
|
|||||||||||
|
2016
|
2015
|
|||||||||||||
|
(in thousands, except percentages)
|
||||||||||||||
|
Cost of revenue:
|
||||||||||||||
|
Product
|
$
|
208,984
|
|
$
|
190,398
|
|
$
|
18,586
|
|
10
|
%
|
|||
|
Service
|
128,853
|
|
96,379
|
|
32,474
|
|
34
|
|
||||||
|
Total cost of revenue
|
$
|
337,837
|
|
$
|
286,777
|
|
$
|
51,060
|
|
18
|
%
|
|||
|
Gross margin (%):
|
||||||||||||||
|
Product
|
61.9
|
%
|
60.1
|
%
|
1.8
|
%
|
||||||||
|
Service
|
82.3
|
|
81.9
|
|
0.4
|
|
||||||||
|
Total gross margin
|
73.5
|
%
|
71.6
|
%
|
1.9
|
%
|
||||||||
Total gross margin increased by 1.9 percentage points in 2016 compared to 2015, as both product and service gross margins increased. Product gross margin increased by 1.8 percentage points in 2016 compared to 2015. Product gross margin was positively impacted by higher sales of software products such as certain of our virtualized security solutions and by lower warranty related costs, and was partially offset by higher inventory reserves.
Service gross margin increased during 2016 as compared to 2015, as we scaled efficiencies resulting from an increased mix on higher-margin service revenue. Cost of service revenue was comprised primarily of personnel costs.
56
Operating expenses
|
|
Year Ended December 31,
|
Change
|
% Change
|
|||||||||||||||||
|
2016
|
2015
|
|||||||||||||||||||
|
Amount
|
% of
Revenue
|
Amount
|
% of
Revenue
|
|||||||||||||||||
|
(in thousands, except percentages)
|
||||||||||||||||||||
|
Operating expenses:
|
||||||||||||||||||||
|
Research and development
|
$
|
183,084
|
|
14
|
%
|
$
|
158,129
|
|
16
|
%
|
$
|
24,955
|
|
16
|
%
|
|||||
|
Sales and marketing
|
626,501
|
|
49
|
|
470,371
|
|
47
|
|
156,130
|
|
33
|
|
||||||||
|
General and administrative
|
81,080
|
|
6
|
|
71,514
|
|
7
|
|
9,566
|
|
13
|
|
||||||||
|
Restructuring charges
|
3,997
|
|
0.3
|
|
7,600
|
|
1
|
|
(3,603
|
)
|
(47
|
)
|
||||||||
|
Total operating expenses
|
$
|
894,662
|
|
70
|
%
|
$
|
707,614
|
|
70
|
%
|
$
|
187,048
|
|
26
|
%
|
|||||
Research and development
Research and development expense increased by $25.0 million, or 16%, in 2016 compared to 2015, primarily due to an increase of $19.0 million in personnel costs as a result of increased headcount to support the development of new products and continued enhancements of our existing products. Depreciation and other occupancy-related costs increased by $6.6 million.
Sales and marketing
Sales and marketing expense increased by $156.1 million, or 33%, in 2016 compared to 2015, primarily due to an increase of $122.3 million in personnel costs as we continued to increase our sales and marketing headcount in order to drive continued market share gains globally. In addition, depreciation expense and other occupancy-related expense increased by $14.0 million, and travel and entertainment expense increased by $8.1 million. Marketing-related expense increased by $7.6
million as we invested significantly in marketing programs, particularly in the large enterprise market, including costs related to trade shows and lead generation. As a percentage of total revenue, sales and marketing expense increased as we accelerated the investment in our sales force and marketing programs to drive future growth.
General and administrative
General and administrative expense increased by $9.6 million, or 13%, in 2016 compared to 2015. Personnel costs increased by $9.6 million as we continued to increase headcount in order to support our expanding business and ERP implementation. During 2016, we expensed $7.8 million of third-party costs relating to the implementation and maintenance of the ERP system implementation compared to $5.4 million in 2015. These increases were partially offset by lower professional fees of $6.7 million in 2016.
Restructuring
Restructuring expenses of $4.0 million in 2016 primarily relate to our restructuring activities to improve operating efficiencies due to the acquisition of AccelOps and certain other activities. Restructuring charges of $7.6 million during 2015 relate to restructuring activities in connection with the Meru acquisition. See Note 9 to the consolidated financial statements for additional details, including the types of expenses incurred and cash payments made.
Operating margin
We generated operating income of
$42.9 million
in 2016, an increase of $28.0 million, or 189%, compared to operating income of
$14.9 million
in 2015. The improvement in operating margin was primarily due to the improvement in gross margin, and the decline in general and administrative expenses as a percentage of total revenue. As a percentage of total revenue, general and administrative expenses decreased to 6% in 2016 from 7% in 2015.
57
Interest income and other income (expense)
—
net
|
|
Year Ended December 31,
|
Change
|
% Change
|
|||||||||||
|
2016
|
2015
|
|||||||||||||
|
(in thousands, except percentages)
|
||||||||||||||
|
Interest income
|
$
|
7,303
|
|
$
|
5,295
|
|
$
|
2,008
|
|
38
|
%
|
|||
|
Other income (expense)—net
|
(7,099
|
)
|
(3,167
|
)
|
(3,932
|
)
|
124
|
|
||||||
Interest income increased in 2016 as compared to 2015, primarily due to higher interest earned on invested balances of cash, cash equivalents and investments. Interest income varies depending on our average investment balances during the period, types and mix of investments, and market interest rates. The increase in other expense—net in 2016 as compared to 2015 was the result of higher foreign currency exchange losses.
Provision for income taxes
|
|
Year Ended December 31,
|
Change
|
% Change
|
|||||||||||
|
2016
|
2015
|
|||||||||||||
|
(in thousands, except percentages)
|
||||||||||||||
|
Provision for income taxes
|
$
|
10,961
|
|
$
|
9,018
|
|
$
|
1,943
|
|
22
|
%
|
|||
|
Effective tax rate (%)
|
25
|
%
|
53
|
%
|
(28
|
)%
|
—
|
|
||||||
Our effective tax rate was 25% for 2016, compared with an effective tax rate of 53% for 2015. The provision for income taxes for 2016 was comprised primarily of U.S. federal and state taxes, other foreign income taxes, foreign withholding taxes, an increase in tax reserves, as well as transfer pricing allocations that impact jurisdictional income taxed at various tax rates. The decrease in the effective tax rate in 2016 was primarily due to the recognition of excess tax benefits for income tax provision from the adoption of ASU 2016-09. In 2016, due to the early adoption of ASU 2016-09, approximately $10.8 million of excess tax benefits were recognized in the income tax provision. In 2015, there were no excess tax benefits included in the income tax provision.
It is our policy to classify accrued interest and penalties related to unrecognized tax benefits in the provision for income taxes. As of December 31, 2016, we had accrued $9.5 million for estimated interest related to uncertain tax provisions compared to an accrual of $5.5 million as of December 31, 2015.
Quarterly Results of Operations
The following table sets forth our unaudited quarterly statements of operations data for the last eight quarters. The information for each of these quarters has been prepared on the same basis as the audited annual financial statements included elsewhere in this Annual Report and, in the opinion of management, includes all adjustments, which includes only normal recurring adjustments, necessary for the fair presentation of the results of operations for these periods. This data should be read in conjunction with our audited consolidated financial statements and related notes included elsewhere in this annual report. These quarterly operating results are not necessarily indicative of our operating results for any future period.
58
|
|
Three Months Ended
|
||||||||||||||||||||||||||||||
|
|
Dec 31,
2017 |
Sept 30,
2017 |
Jun 30,
2017 |
Mar 31,
2017 |
Dec 31,
2016 |
Sept 30,
2016 |
Jun 30,
2016 |
Mar 31,
2016 |
|||||||||||||||||||||||
|
|
(in thousands, except per share amounts)
|
||||||||||||||||||||||||||||||
|
Consolidated Statements of Operations Data:
|
|||||||||||||||||||||||||||||||
|
Revenue:
|
|||||||||||||||||||||||||||||||
|
Product
|
$
|
162,118
|
|
$
|
137,095
|
|
$
|
142,705
|
|
$
|
135,253
|
|
$
|
158,925
|
|
$
|
127,972
|
|
$
|
136,641
|
|
$
|
124,572
|
|
|||||||
|
Service
|
254,550
|
|
237,122
|
|
220,764
|
|
205,323
|
|
203,905
|
|
188,674
|
|
174,750
|
|
160,004
|
|
|||||||||||||||
|
Total revenue
|
416,668
|
|
374,217
|
|
363,469
|
|
340,576
|
|
362,830
|
|
316,646
|
|
311,391
|
|
284,576
|
|
|||||||||||||||
|
Cost of revenue:
|
|||||||||||||||||||||||||||||||
|
Product
(1)(2)
|
69,634
|
|
58,106
|
|
60,787
|
|
55,297
|
|
56,616
|
|
50,267
|
|
52,788
|
|
49,313
|
|
|||||||||||||||
|
Service
(1)(2)
|
35,785
|
|
35,543
|
|
34,865
|
|
35,267
|
|
34,275
|
|
34,532
|
|
31,715
|
|
28,331
|
|
|||||||||||||||
|
Total cost of revenue
|
105,419
|
|
93,649
|
|
95,652
|
|
90,564
|
|
90,891
|
|
84,799
|
|
84,503
|
|
77,644
|
|
|||||||||||||||
|
Total gross profit
|
311,249
|
|
280,568
|
|
267,817
|
|
250,012
|
|
271,939
|
|
231,847
|
|
226,888
|
|
206,932
|
|
|||||||||||||||
|
Operating expenses:
|
|||||||||||||||||||||||||||||||
|
Research and development
(1)
|
54,774
|
|
53,486
|
|
51,159
|
|
51,195
|
|
45,589
|
|
47,239
|
|
45,502
|
|
44,754
|
|
|||||||||||||||
|
Sales and marketing
(1)(2)
|
191,928
|
|
172,361
|
|
166,337
|
|
170,400
|
|
162,873
|
|
154,831
|
|
162,694
|
|
146,103
|
|
|||||||||||||||
|
General and administrative
(1)
|
22,349
|
|
21,025
|
|
21,911
|
|
22,577
|
|
17,451
|
|
22,006
|
|
22,184
|
|
19,439
|
|
|||||||||||||||
|
Restructuring charges
|
—
|
|
—
|
|
(90
|
)
|
430
|
|
833
|
|
2,283
|
|
553
|
|
328
|
|
|||||||||||||||
|
Total operating expenses
|
269,051
|
|
246,872
|
|
239,317
|
|
244,602
|
|
226,746
|
|
226,359
|
|
230,933
|
|
210,624
|
|
|||||||||||||||
|
Operating income (loss)
|
42,198
|
|
33,696
|
|
28,500
|
|
5,410
|
|
45,193
|
|
5,488
|
|
(4,045
|
)
|
(3,692
|
)
|
|||||||||||||||
|
Interest income
|
4,061
|
|
3,866
|
|
3,163
|
|
2,392
|
|
1,964
|
|
1,888
|
|
1,705
|
|
1,746
|
|
|||||||||||||||
|
Other income (expense)—net
|
(1,181
|
)
|
344
|
|
1,243
|
|
302
|
|
(3,650
|
)
|
(787
|
)
|
(1,350
|
)
|
(1,312
|
)
|
|||||||||||||||
|
Income (loss) before income taxes
|
45,078
|
|
37,906
|
|
32,906
|
|
8,104
|
|
43,507
|
|
6,589
|
|
(3,690
|
)
|
(3,258
|
)
|
|||||||||||||||
|
Provision for (benefit from) income taxes
|
74,039
|
|
11,296
|
|
9,873
|
|
(2,613
|
)
|
18,341
|
|
298
|
|
(2,302
|
)
|
(5,376
|
)
|
|||||||||||||||
|
Net income (loss)
|
$
|
(28,961
|
)
|
$
|
26,610
|
|
$
|
23,033
|
|
$
|
10,717
|
|
$
|
25,166
|
|
$
|
6,291
|
|
$
|
(1,388
|
)
|
$
|
2,118
|
|
|||||||
|
Net income (loss) per share
:
|
|||||||||||||||||||||||||||||||
|
Basic
|
$
|
(0.17
|
)
|
$
|
0.15
|
|
$
|
0.13
|
|
$
|
0.06
|
|
$
|
0.15
|
|
$
|
0.04
|
|
$
|
(0.01
|
)
|
$
|
0.01
|
|
|||||||
|
Diluted
|
$
|
(0.17
|
)
|
$
|
0.15
|
|
$
|
0.13
|
|
$
|
0.06
|
|
$
|
0.14
|
|
$
|
0.04
|
|
$
|
(0.01
|
)
|
$
|
0.01
|
|
|||||||
_______________________________________________
|
(1)
|
Includes stock-based compensation as follows:
|
|
|
Three Months Ended
|
||||||||||||||||||||||||||||||
|
|
Dec 31,
2017 |
Sept 30,
2017 |
Jun 30,
2017 |
Mar 31,
2017 |
Dec 31,
2016 |
Sept 30,
2016 |
Jun 30,
2016 |
Mar 31,
2016 |
|||||||||||||||||||||||
|
|
(in thousands)
|
||||||||||||||||||||||||||||||
|
Cost of product revenue
|
$
|
341
|
|
$
|
314
|
|
$
|
383
|
|
$
|
342
|
|
$
|
313
|
|
$
|
309
|
|
$
|
298
|
|
$
|
280
|
|
|||||||
|
Cost of service revenue
|
2,349
|
|
2,371
|
|
2,473
|
|
2,310
|
|
2,276
|
|
2,238
|
|
2,123
|
|
2,134
|
|
|||||||||||||||
|
Research and development
|
8,067
|
|
7,976
|
|
8,253
|
|
7,898
|
|
7,871
|
|
7,648
|
|
7,458
|
|
7,143
|
|
|||||||||||||||
|
Sales and marketing
|
19,614
|
|
19,609
|
|
19,745
|
|
19,026
|
|
17,930
|
|
17,378
|
|
16,990
|
|
15,815
|
|
|||||||||||||||
|
General and administrative
|
4,083
|
|
4,037
|
|
4,237
|
|
3,755
|
|
3,691
|
|
3,520
|
|
3,478
|
|
3,530
|
|
|||||||||||||||
|
Total stock-based compensation expense
|
$
|
34,454
|
|
$
|
34,307
|
|
$
|
35,091
|
|
$
|
33,331
|
|
$
|
32,081
|
|
$
|
31,093
|
|
$
|
30,347
|
|
$
|
28,902
|
|
|||||||
|
(2)
|
Total amortization included in the product costs, service costs, and sales and marketing expense are as follows:
|
59
|
|
Three Months Ended
|
||||||||||||||||||||||||||||||
|
|
Dec 31,
2017 |
Sept 30,
2017 |
Jun 30,
2017 |
Mar 31,
2017 |
Dec 31,
2016 |
Sept 30,
2016 |
Jun 30,
2016 |
Mar 31,
2016 |
|||||||||||||||||||||||
|
|
(in thousands)
|
||||||||||||||||||||||||||||||
|
Amortization of intangible assets
|
$
|
2,037
|
|
$
|
2,037
|
|
$
|
2,207
|
|
$
|
2,292
|
|
$
|
3,022
|
|
$
|
2,839
|
|
$
|
2,269
|
|
$
|
1,178
|
|
|||||||
Seasonality, Cyclicality and Quarterly Revenue Trends
Our quarterly results reflect a pattern of increased customer buying at year-end, which has positively impacted billings and product revenue activity in the fourth quarter. In the first quarter, we generally experience lower sequential customer buying, which results in lower billings and product revenue. Although these seasonal factors are common in the technology sector, historical patterns should not be considered a reliable indicator of our future sales activity or performance. On a quarterly basis, we have usually generated the majority of our product revenue in the final month of each quarter and a significant amount in the last two weeks of each quarter. We believe this is due to customer buying patterns typical in this industry.
Consistent with the seasonality note above, our total quarterly revenue over the past eight quarters has generally increased sequentially in each quarter, except in the first quarters of 2017 and 2016. Product revenue, on average throughout the year, increased in
2017
as compared to the same quarters in
2016
, which we believe was due in part to the investments made in our sales and marketing organizations, to a robust security market and to continued product innovation. We continue to see a shift from product revenues to higher-margin, recurring service revenues, which reflect our ongoing success in driving sales of mid-range and high-end service bundles, richer service offerings and the average contract length.
Total gross margin has fluctuated on a quarterly basis primarily due to shifts in the mix of sales between products and services, and among products. Product gross margin varies based on the types of products sold and the average selling prices of our products. In 2017, product gross margin was impacted by the shift toward higher-margin subscription bundles and longer duration of service contracts. Service gross margin benefited from the shift to higher-margin service revenue.
60
Liquidity and Capital Resources
|
|
As of December 31,
|
||||||||||
|
|
2017
|
2016
|
2015
|
||||||||
|
|
(in thousands)
|
||||||||||
|
Cash and cash equivalents
|
$
|
811,004
|
|
$
|
709,003
|
|
$
|
543,277
|
|
||
|
Investments
|
538,295
|
|
601,505
|
|
621,033
|
|
|||||
|
Total cash, cash equivalents and investments
|
$
|
1,349,299
|
|
$
|
1,310,508
|
|
$
|
1,164,310
|
|
||
|
Working capital
|
$
|
689,597
|
|
$
|
709,276
|
|
$
|
591,873
|
|
||
|
|
Year Ended December 31,
|
||||||||||
|
|
2017
|
2016
|
2015
|
||||||||
|
|
(in thousands)
|
||||||||||
|
Cash provided by operating activities
|
$
|
594,405
|
|
$
|
345,708
|
|
$
|
282,547
|
|
||
|
Cash used in investing activities
|
(76,803
|
)
|
(74,123
|
)
|
(967
|
)
|
|||||
|
Cash used in financing activities
|
(415,601
|
)
|
(105,859
|
)
|
(21,557
|
)
|
|||||
|
Net increase in cash and cash equivalents
|
$
|
102,001
|
|
$
|
165,726
|
|
$
|
260,023
|
|
||
Liquidity and capital resources may be impacted by our operating activities, as well as by our stock repurchases, real estate and other capital expenditures, proceeds associated with stock option exercises and issuances of common stock under our ESPP, payment of taxes in connection with the net settlement of equity awards and business acquisitions. In recent years, we have received significant capital resources as a result of increases in our deferred revenue and the proceeds from exercise of stock options and purchases under our ESPP. Additional increases in deferred revenue may depend on a number of factors including our billing growth rate, service contract renewal rates and length of initial and renewals service contracts. We expect proceeds from the issuance of stock options in future years to be impacted by the increased mix of restricted stock units granted versus stock options and also to vary based on our share price. As of December 31, 2017,
$442.8 million
remained available for future share repurchase under the Repurchase Program.
We currently expect to spend $90.0 million to $120.0 million for 2018 in capital expenditures, primarily related to expansion of our offices to support worldwide growth.
As of
December 31, 2017
, our cash, cash equivalents and investments of
$1.35 billion
were invested primarily in corporate debt securities, money market fund, certificate of deposits, commercial paper and U.S. government and agency securities. It is our investment policy to invest excess cash in a manner that preserves capital, provides liquidity and maximizes return without significantly increasing risk.
As of
December 31, 2017
,
$848.0 million
of our cash and investments were held by our international subsidiaries. Under the 2017 Tax Act signed into law in December 2017, starting on January 1, 2018, we are no longer subject to federal income tax on earnings remitted from our foreign subsidiaries. We have analyzed our global working capital and cash requirements and the potential tax liabilities attributable to a repatriation, and have determined that we will be repatriating certain unremitted foreign earnings which was previously deemed indefinitely reinvested. For those investments from which we were able to make a reasonable estimate of the tax effects of such repatriation, we have recorded a provisional estimate for withholding and state taxes. We do not enter into investments for trading or speculative purposes. We believe that our existing cash and cash equivalents will be sufficient to meet our anticipated cash needs for at least the next 12 months. Our future capital requirements will depend on many factors, including our growth rate, the timing and amount of our planned share repurchases, the timing and extent of spending to support development efforts, the expansion of sales and marketing activities, the introduction of new and enhanced products and services offerings, the costs to ensure access to adequate manufacturing capacity, the continuing market acceptance of our products and our investments in real estate through purchases or long-term leases. Historically, we have required capital principally to fund our working capital needs, share repurchases, capital expenditures, and acquisition activities. In the event that additional financing is required from outside sources, we may not be able to raise it on terms acceptable to us or at all. If we are unable to raise additional capital when desired, our business, operating results and financial condition would be adversely affected.
61
Operating Activities
Cash generated by operating activities is our primary source of liquidity. It is primarily comprised of net income, as adjusted for non-cash items, and changes in operating assets and liabilities, including deferred revenue. Non-cash adjustments consist primarily of stock-based compensation, depreciation of property and equipment, amortization of intangible assets and amortization of investment premiums.
Our operating activities during 2017 provided
$594.4 million
in cash as a result of our continued growth of our business and our ability to successfully manage our working capital. Changes in operating assets and liabilities primarily resulted from an increase in sales of our FortiGuard security subscription and FortiCare technical support services to new and existing customers, as reflected by an increase in our deferred revenue, which was partially offset by an increase in accounts receivable. We continue to see a shift from product revenues to higher-margin, recurring service revenues and longer duration contracts. For example, our total revenue grew 17% in 2017 compared to 2016, while our total deferred revenue balance grew 29%.
Our operating activities during 2016 provided $345.7 million in cash as a result of our continued growth of our business and the ability to successfully manage our working capital. Changes in operating assets and liabilities primarily resulted from an increase in sales of our FortiGuard security subscription and FortiCare technical supports to new and existing customers, as reflected by an increase in our deferred revenue, which was partially offset by an increase in accounts receivable and payments for inventory purchases. We are also starting to see a shift from product revenues to higher-margin, recurring service revenues. For example, our total revenue grew 26% in 2016 compared to 2015, while our total deferred revenue balance grew 31%.
Our operating activities during 2015 provided $282.5 million in cash as a result of our continued growth in billings and the ability to successfully manage our working capital. Additionally, in 2015, we received $9.0 million related to a mutual three-year covenant-not-to-sue agreement. Changes in operating assets and liabilities primarily resulted from an increase in payments received from customers, partially offset by an increase in payments to vendors.
Investing Activities
The changes in cash flows from investing activities primarily relate to timing of purchases, maturities and sales of investments, purchases of property and equipment, and payments made in connection with business acquisitions. Historically, in making a lease versus purchase decision related to our larger facilities, we have considered various factors including financial metrics and the impact on our employees. In certain cases, we have elected to purchase the facility if we believe that purchasing rather than leasing is more in line with our long-term strategy. We expect to make similar decisions in the future.
During 2017, cash used for investing activities was primarily due to the
$135.3 million
we spent on capital expenditures, including our purchases of real estate properties in Canada and Sunnyvale, California for total cash of $107.2 million. The outflow of cash was partially offset by positive cash flow due to maturities, net of purchases, from our investments of
$58.5 million
.
During 2016, cash used for investing activities was primarily due to $67.2 million we spent on capital expenditures, including our purchases of a warehouse in Union City, California, for total cash of $18.5 million, and a $22.1 million payment for the acquisition of AccelOps. The outflow of cash was partially offset by positive cash flow due to maturities, net of purchases, from our investments of $15.1 million.
During 2015, cash used for investing activities was primarily due to $38.0 million used for the acquisition of Meru. In addition, we spent $37.4 million on capital expenditures, including our purchases of certain real properties in Sunnyvale, California and Sophia, France for total cash of $13.9 million. The outflow of cash was partially offset by positive cash flow due to maturities, net of purchases, from our investments of $74.4 million.
Financing Activities
The changes in cash flows from financing activities primarily relate to proceeds from the issuance of common stock under our equity incentive plan and the ESPP, taxes paid related to net share settlement of equity awards and repurchase and retirement of common stock.
62
During 2017, cash used for financing activities was
$415.6 million
, primarily due to
$446.3 million
used to repurchase our common stock. This was partially offset by
$30.7 million
of proceeds from the issuance of common stock, net of tax withholding.
During 2016, cash used for financing activities was $105.9 million, primarily due to $110.8 million used to repurchase our common stock. This was partially offset by $6.6 million of proceeds from the issuance of common stock, net of tax withholding.
During 2015, cash used for financing activities was $21.6 million, primarily due to $60.0 million used to repurchase our common stock. This was partially offset by $38.4 million of proceeds from the issuance of common stock, net of tax withholding.
Contractual Obligations and Commitments
The following summarizes our contractual obligations as of
December 31, 2017
:
|
|
Payments Due by Period
|
||||||||||||||||||
|
|
Total
|
Less than 1 year
|
1 - 3 years
|
3 - 5 years
|
More than 5 years
|
||||||||||||||
|
|
(in thousands)
|
||||||||||||||||||
|
Operating lease commitments
(1)
|
$
|
56,871
|
|
$
|
16,020
|
|
$
|
23,790
|
|
$
|
10,503
|
|
$
|
6,558
|
|
||||
|
Inventory purchase commitments
(2)
|
97,170
|
|
97,170
|
|
—
|
|
—
|
|
—
|
|
|||||||||
|
Total
|
$
|
154,041
|
|
$
|
113,190
|
|
$
|
23,790
|
|
$
|
10,503
|
|
$
|
6,558
|
|
||||
________________________
|
(1)
|
Consists of contractual obligations from non-cancelable office space under operating leases.
|
|
(2)
|
Consists of minimum purchase commitments with independent contract manufacturers.
|
In addition to commitments with contract manufacturers, we have open purchase orders and contractual obligations in the ordinary course of business for which we have not received goods or services. As of
December 31, 2017
, we had $6.8 million in other contractual commitments having a remaining term in excess of one year that may not be cancelable.
As of
December 31, 2017
, we had
$90.2 million
of long-term tax liabilities, including interest, related to uncertain tax positions. Because of the high degree of uncertainty regarding the settlement of these liabilities, we are unable to estimate the years in which future cash outflows may occur.
Off-Balance Sheet Arrangements
During
2017
,
2016
and
2015
, we did not have any relationships with unconsolidated organizations or financial partnerships, such as structured finance or special purpose entities that would have been established for the purpose of facilitating off-balance sheet arrangements or other contractually narrow or limited purposes.
Recent Accounting Pronouncement
See Note 1 of the notes to our consolidated financial statements in Part II, Item 8 of this Annual Report on Form 10-K for a full description of recently adopted accounting pronouncements.
Interest Rate Fluctuation Risk
The primary objectives of our investment activities are to preserve principal, provide liquidity and maximize income without significantly increasing risk. Some of the securities we invest in are subject to market risk. This means that a change in prevailing interest rates may cause the principal amount of the investment to fluctuate. To minimize this risk, we maintain our portfolio of cash, cash equivalents and investments in a variety of securities, including corporate debt securities, money market funds, commercial paper, municipal bonds, U.S. government and agency securities, certificates of deposit and term deposits. The risk associated with fluctuating interest rates is limited to our investment portfolio. A 10% decrease in interest rates in
2017
,
2016
and
2015
would have resulted in an insignificant decrease in our interest income in each of these periods.
63
Foreign Currency Exchange Risk
Our sales contracts are primarily denominated in U.S. dollars and therefore substantially all of our revenue is not subject to foreign currency translation risk. However, a substantial portion of our operating expenses incurred outside the United States are denominated in foreign currencies and are subject to fluctuations due to changes in foreign currency exchange rates, particularly changes in the Canadian dollar (“CAD”), the Euro (“EUR”) and the British pound (“GBP”). To help protect against significant fluctuations in value and the volatility of future cash flows caused by changes in currency exchange rates, we engage in foreign currency risk management activities to minimize the impact of balance sheet items denominated in CAD. We do not use these contracts for speculative or trading purposes. All of the derivative instruments are with high quality financial institutions and we monitor the credit worthiness of these parties. These contracts typically have a maturity of one month. We record changes in the fair value of forward exchange contracts related to balance sheet accounts as other expense in the consolidated statement of operations. We recognized an expense of
$1.0 million
in Other income (expense)—net, in
2017
due to foreign currency transaction gains.
Our use of forward exchange contracts is intended to reduce, but not eliminate, the impact of currency exchange rate movements, are relatively short-term in nature and are focused on the CAD, long-term material changes in the value of the U.S. dollar against other foreign currencies, such as the EUR and GBP, could adversely impact our operating expenses in the future. We assessed the risk of loss in fair values from the impact of hypothetical changes in foreign currency exchange rates. For foreign currency exchange rate risk, a 10% increase or decrease of foreign currency exchange rates against the U.S. dollar with all other variables held constant would have resulted in a $5.5 million change in the value of our foreign currency cash balances as of December 31, 2017.
Inflation Risk
Our monetary assets, consisting primarily of cash, cash equivalents and short-term investments, are not affected significantly by inflation because they are short-term. We believe the impact of inflation on replacement costs of equipment, furniture and leasehold improvements will not materially affect our operations. The rate of inflation, however, affects our cost of revenue and expenses, such as those for employee compensation, which may not be readily recoverable in the price of products and services offered by us.
64
|
ITEM 8.
|
Financial Statements and Supplementary Data
|
INDEX TO CONSOLIDATED FINANCIAL STATEMENTS
For the years ended December 31, 2017, 2016, and 2015
|
|
Page
|
The supplementary financial information required by this Item 8 is included in Part II, Item 7 of this Annual Report on Form 10-K under the caption “Management’s Discussion and Analysis of Financial Condition and Results of Operations—Quarterly Results of Operations.”
65
REPORT OF INDEPENDENT REGISTERED PUBLIC ACCOUNTING FIRM
To the Shareholders and Board of Directors of Fortinet, Inc.
Opinion on the Financial Statements
We have audited the accompanying consolidated balance sheets of Fortinet, Inc. and subsidiaries (the “Company”) as of December 31, 2017 and 2016, and the related consolidated statements of operations, comprehensive income, stockholders’ equity, and cash flows for each of the three years in the period ended December 31, 2017, and the related notes and the schedule listed in the Index at Item 15 (collectively referred to as the “financial statements”). In our opinion, such consolidated financial statements present fairly, in all material respects, the financial position of the Company as of December 31, 2017 and 2016, and the results of their operations and its cash flows for each of the three years in the period ended December 31, 2017, in conformity with accounting principles generally accepted in the United States of America.
We have also audited, in accordance with the standards of the Public Company Accounting Oversight Board (United States) (PCAOB), the Company’s internal control over financial reporting as of December 31, 2017, based on the criteria established in
Internal Control
—
Integrated Framework (2013)
issued by the Committee of Sponsoring Organizations of the Treadway Commission and our report dated
February 26, 2018
, expressed an unqualified opinion on the Company's internal control over financial reporting.
Basis for Opinion
These financial statements and financial statement schedule are the responsibility of the Company’s management. Our responsibility is to express an opinion on the financial statements and financial statement schedule based on our audits. We are a public accounting firm registered with the PCAOB and are required to be independent with respect to the Company in accordance with the U.S. federal securities laws and the applicable rules and regulations of the Securities and Exchange Commission and the PCAOB.
We conducted our audits in accordance with the standards of the PCAOB. Those standards require that we plan and perform the audit to obtain reasonable assurance about whether the financial statements are free of material misstatement, whether due to error or fraud. An audit included performing procedures to assess the risks of material misstatement of the financial statements, whether due to error or fraud, and performing procedures that respond to those risks. Such procedures included examining, on a test basis, evidence regarding the amounts and disclosures in the financial statements. Our audits also included evaluating the accounting principles used and significant estimates made by management, as well as evaluating the overall presentation of the financial statements. We believe that our audits provide a reasonable basis for our opinion.
/s/ DELOITTE & TOUCHE LLP
San Jose, California
February 26, 2018
We have served as the Company's auditor since 2002.
66
FORTINET, INC.
(in thousands, except per share amounts)
|
|
December 31,
2017 |
December 31,
2016 |
|||||
|
ASSETS
|
|||||||
|
CURRENT ASSETS:
|
|||||||
|
Cash and cash equivalents
|
$
|
811,004
|
|
$
|
709,003
|
|
|
|
Short-term investments
|
440,273
|
|
376,522
|
|
|||
|
Accounts receivable—Net of reserves for sales returns and doubtful accounts of $14,503 and $11,235 at December 31, 2017 and 2016, respectively
|
348,185
|
|
312,998
|
|
|||
|
Inventory
|
77,291
|
|
106,887
|
|
|||
|
Prepaid expenses and other current assets
|
40,067
|
|
33,306
|
|
|||
|
Total current assets
|
1,716,820
|
|
1,538,716
|
|
|||
|
LONG-TERM INVESTMENTS
|
98,022
|
|
224,983
|
|
|||
|
PROPERTY AND EQUIPMENT—NET
|
245,395
|
|
137,249
|
|
|||
|
DEFERRED TAX ASSETS
|
146,932
|
|
182,745
|
|
|||
|
OTHER INTANGIBLE ASSETS—NET
|
16,255
|
|
24,828
|
|
|||
|
GOODWILL
|
14,553
|
|
14,553
|
|
|||
|
OTHER ASSETS
|
19,939
|
|
16,867
|
|
|||
|
TOTAL ASSETS
|
$
|
2,257,916
|
|
$
|
2,139,941
|
|
|
|
LIABILITIES AND STOCKHOLDERS’ EQUITY
|
|||||||
|
CURRENT LIABILITIES:
|
|||||||
|
Accounts payable
|
$
|
70,009
|
|
$
|
56,732
|
|
|
|
Accrued liabilities
|
50,015
|
|
35,640
|
|
|||
|
Accrued payroll and compensation
|
91,944
|
|
78,138
|
|
|||
|
Income taxes payable
|
21,435
|
|
13,588
|
|
|||
|
Deferred revenue
|
793,820
|
|
645,342
|
|
|||
|
Total current liabilities
|
1,027,223
|
|
829,440
|
|
|||
|
DEFERRED REVENUE
|
542,494
|
|
390,007
|
|
|||
|
INCOME TAX LIABILITIES
|
90,213
|
|
68,551
|
|
|||
|
OTHER LIABILITIES
|
8,609
|
|
14,262
|
|
|||
|
Total liabilities
|
1,668,539
|
|
1,302,260
|
|
|||
|
COMMITMENTS AND CONTINGENCIES (Note 10)
|
|
|
|
|
|||
|
STOCKHOLDERS’ EQUITY:
|
|||||||
|
Common stock, $0.001 par value—300,000 shares authorized; 167,890 and 173,078 shares issued and outstanding at December 31, 2017 and 2016, respectively
|
168
|
|
173
|
|
|||
|
Additional paid-in capital
|
909,636
|
|
800,653
|
|
|||
|
Accumulated other comprehensive loss
|
(847
|
)
|
(765
|
)
|
|||
|
Retained earnings (deficit)
|
(319,580
|
)
|
37,620
|
|
|||
|
Total stockholders’ equity
|
589,377
|
|
837,681
|
|
|||
|
TOTAL LIABILITIES AND STOCKHOLDERS’ EQUITY
|
$
|
2,257,916
|
|
$
|
2,139,941
|
|
|
See notes to consolidated financial statements.
67
FORTINET, INC.
(in thousands, except per share amounts)
|
|
Year Ended December 31,
|
||||||||||
|
2017
|
2016
|
2015
|
|||||||||
|
REVENUE:
|
|||||||||||
|
Product
|
$
|
577,171
|
|
$
|
548,110
|
|
$
|
476,782
|
|
||
|
Service
|
917,759
|
|
727,333
|
|
532,486
|
|
|||||
|
Total revenue
|
1,494,930
|
|
1,275,443
|
|
1,009,268
|
|
|||||
|
COST OF REVENUE:
|
|||||||||||
|
Product
|
243,824
|
|
208,984
|
|
190,398
|
|
|||||
|
Service
|
141,460
|
|
128,853
|
|
96,379
|
|
|||||
|
Total cost of revenue
|
385,284
|
|
337,837
|
|
286,777
|
|
|||||
|
GROSS PROFIT:
|
|||||||||||
|
Product
|
333,347
|
|
339,126
|
|
286,384
|
|
|||||
|
Service
|
776,299
|
|
598,480
|
|
436,107
|
|
|||||
|
Total gross profit
|
1,109,646
|
|
937,606
|
|
722,491
|
|
|||||
|
OPERATING EXPENSES:
|
|||||||||||
|
Research and development
|
210,614
|
|
183,084
|
|
158,129
|
|
|||||
|
Sales and marketing
|
701,026
|
|
626,501
|
|
470,371
|
|
|||||
|
General and administrative
|
87,862
|
|
81,080
|
|
71,514
|
|
|||||
|
Restructuring charges
|
340
|
|
3,997
|
|
7,600
|
|
|||||
|
Total operating expenses
|
999,842
|
|
894,662
|
|
707,614
|
|
|||||
|
OPERATING INCOME
|
109,804
|
|
42,944
|
|
14,877
|
|
|||||
|
INTEREST INCOME
|
13,482
|
|
7,303
|
|
5,295
|
|
|||||
|
OTHER INCOME (EXPENSE)—NET
|
708
|
|
(7,099
|
)
|
(3,167
|
)
|
|||||
|
INCOME BEFORE INCOME TAXES
|
123,994
|
|
43,148
|
|
17,005
|
|
|||||
|
PROVISION FOR INCOME TAXES
|
92,595
|
|
10,961
|
|
9,018
|
|
|||||
|
NET INCOME
|
$
|
31,399
|
|
$
|
32,187
|
|
$
|
7,987
|
|
||
|
Net income per share (Note 8):
|
|
||||||||||
|
Basic
|
$
|
0.18
|
|
$
|
0.19
|
|
$
|
0.05
|
|
||
|
Diluted
|
$
|
0.18
|
|
$
|
0.18
|
|
$
|
0.05
|
|
||
|
Weighted-average shares outstanding:
|
|
||||||||||
|
Basic
|
174,315
|
|
172,621
|
|
170,385
|
|
|||||
|
Diluted
|
178,079
|
|
176,338
|
|
176,141
|
|
|||||
See notes to consolidated financial statements.
68
FORTINET, INC.
CONSOLIDATED STATEMENTS OF COMPREHENSIVE INCOME
(in thousands)
|
|
Year Ended December 31,
|
||||||||||
|
|
2017
|
2016
|
2015
|
||||||||
|
Net income
|
$
|
31,399
|
|
$
|
32,187
|
|
$
|
7,987
|
|
||
|
Other comprehensive income (loss):
|
|||||||||||
|
Change in unrealized gains (losses) on investments
|
(93
|
)
|
258
|
|
(897
|
)
|
|||||
|
Tax provision (benefit) related to change in unrealized gains (losses) on investments
|
(11
|
)
|
90
|
|
(313
|
)
|
|||||
|
Other comprehensive income (loss)
|
(82
|
)
|
168
|
|
(584
|
)
|
|||||
|
Comprehensive income
|
$
|
31,317
|
|
$
|
32,355
|
|
$
|
7,403
|
|
||
See notes to consolidated financial statements.
69
FORTINET, INC.
CONSOLIDATED STATEMENTS OF STOCKHOLDERS’ EQUITY
(in thousands)
|
|
Common Stock
|
Additional
Paid-In
Capital
|
Accumulated
Other
Comprehensive Loss
|
Retained Earnings (Deficit)
|
Total
Stockholders’
Equity
|
|||||||||||||||||
|
Shares
|
Amount
|
|||||||||||||||||||||
|
BALANCE—December 31, 2014
|
166,443
|
|
$
|
166
|
|
$
|
562,504
|
|
$
|
(349
|
)
|
$
|
113,645
|
|
$
|
675,966
|
|
|||||
|
Issuance of common stock in connection with equity incentive plans - net of tax withholding
|
6,715
|
|
7
|
|
39,011
|
|
—
|
|
—
|
|
39,018
|
|
||||||||||
|
Repurchase and retirement of common stock
|
(1,759
|
)
|
(2
|
)
|
(6,847
|
)
|
—
|
|
(53,151
|
)
|
(60,000
|
)
|
||||||||||
|
Stock-based compensation expense
|
—
|
|
—
|
|
95,088
|
|
—
|
|
—
|
|
95,088
|
|
||||||||||
|
Tax shortfalls, net of excess tax benefits, on stock-based compensation awards
|
—
|
|
—
|
|
(2,098
|
)
|
—
|
|
—
|
|
(2,098
|
)
|
||||||||||
|
Net unrealized loss on investments - net of taxes
|
—
|
|
—
|
|
—
|
|
(584
|
)
|
—
|
|
(584
|
)
|
||||||||||
|
Net income
|
—
|
|
—
|
|
—
|
|
—
|
|
7,987
|
|
7,987
|
|
||||||||||
|
BALANCE—December 31, 2015
|
171,399
|
|
171
|
|
687,658
|
|
(933
|
)
|
68,481
|
|
755,377
|
|
||||||||||
|
Issuance of common stock in connection with equity incentive plans - net of tax withholding
|
5,533
|
|
6
|
|
5,984
|
|
—
|
|
—
|
|
5,990
|
|
||||||||||
|
Repurchase and retirement of common stock
|
(3,854
|
)
|
(4
|
)
|
(16,214
|
)
|
—
|
|
(94,610
|
)
|
(110,828
|
)
|
||||||||||
|
Stock-based compensation expense
|
—
|
|
—
|
|
122,423
|
|
—
|
|
—
|
|
122,423
|
|
||||||||||
|
Cumulative-effect adjustment from adoption of ASU 2016-09
|
—
|
|
—
|
|
802
|
|
—
|
|
31,562
|
|
32,364
|
|
||||||||||
|
Net unrealized loss on investments - net of taxes
|
—
|
|
—
|
|
—
|
|
168
|
|
—
|
|
168
|
|
||||||||||
|
Net income
|
—
|
|
—
|
|
—
|
|
—
|
|
32,187
|
|
32,187
|
|
||||||||||
|
BALANCE—December 31, 2016
|
173,078
|
|
173
|
|
800,653
|
|
(765
|
)
|
37,620
|
|
837,681
|
|
||||||||||
|
Issuance of common stock in connection with equity incentive plans - net of tax withholding
|
6,016
|
|
6
|
|
29,523
|
|
—
|
|
—
|
|
29,529
|
|
||||||||||
|
Repurchase and retirement of common stock
|
(11,204
|
)
|
(11
|
)
|
(57,723
|
)
|
—
|
|
(388,599
|
)
|
(446,333
|
)
|
||||||||||
|
Stock-based compensation expense
|
—
|
|
—
|
|
137,183
|
|
—
|
|
—
|
|
137,183
|
|
||||||||||
|
Net unrealized gain on investments - net of tax
|
—
|
|
—
|
|
—
|
|
(82
|
)
|
—
|
|
(82
|
)
|
||||||||||
|
Net income
|
—
|
|
—
|
|
—
|
|
—
|
|
31,399
|
|
31,399
|
|
||||||||||
|
BALANCE—December 31, 2017
|
167,890
|
|
$
|
168
|
|
$
|
909,636
|
|
$
|
(847
|
)
|
$
|
(319,580
|
)
|
$
|
589,377
|
|
|||||
See notes to consolidated financial statements.
70
FORTINET, INC.
(in thousands)
|
|
Year Ended December 31,
|
||||||||||
|
|
2017
|
2016
|
2015
|
||||||||
|
CASH FLOWS FROM OPERATING ACTIVITIES:
|
|||||||||||
|
Net income
|
$
|
31,399
|
|
$
|
32,187
|
|
$
|
7,987
|
|
||
|
Adjustments to reconcile net income to net cash provided by operating activities:
|
|||||||||||
|
Depreciation and amortization
|
55,476
|
|
48,520
|
|
31,589
|
|
|||||
|
Amortization of investment premiums
|
2,542
|
|
4,780
|
|
7,457
|
|
|||||
|
Stock-based compensation
|
137,183
|
|
122,423
|
|
95,088
|
|
|||||
|
Other non-cash items—net
|
3,780
|
|
2,644
|
|
3,391
|
|
|||||
|
Changes in operating assets and liabilities, net of assets acquired and liabilities assumed in business acquisitions:
|
|||||||||||
|
Accounts receivable—net
|
(38,455
|
)
|
(57,875
|
)
|
(66,464
|
)
|
|||||
|
Inventory
|
9,423
|
|
(43,023
|
)
|
(19,088
|
)
|
|||||
|
Prepaid expenses and other current assets
|
(6,726
|
)
|
2,616
|
|
(2,630
|
)
|
|||||
|
Deferred tax assets
|
35,824
|
|
(27,822
|
)
|
(29,851
|
)
|
|||||
|
Other assets
|
(1,001
|
)
|
(2,352
|
)
|
667
|
|
|||||
|
Accounts payable
|
13,090
|
|
39
|
|
(2,517
|
)
|
|||||
|
Accrued liabilities
|
14,445
|
|
(3,210
|
)
|
883
|
|
|||||
|
Accrued payroll and compensation
|
12,567
|
|
15,696
|
|
11,301
|
|
|||||
|
Other liabilities
|
(5,489
|
)
|
(5,013
|
)
|
2,016
|
|
|||||
|
Deferred revenue
|
300,839
|
|
242,961
|
|
222,346
|
|
|||||
|
Income taxes payable
|
29,508
|
|
13,137
|
|
20,372
|
|
|||||
|
Net cash provided by operating activities
|
594,405
|
|
345,708
|
|
282,547
|
|
|||||
|
CASH FLOWS FROM INVESTING ACTIVITIES:
|
|||||||||||
|
Purchases of investments
|
(669,171
|
)
|
(473,608
|
)
|
(459,903
|
)
|
|||||
|
Sales of investments
|
300,317
|
|
28,311
|
|
47,900
|
|
|||||
|
Maturities of investments
|
427,363
|
|
460,443
|
|
486,419
|
|
|||||
|
Purchases of property and equipment
|
(135,312
|
)
|
(67,182
|
)
|
(37,358
|
)
|
|||||
|
Payments made in connection with business acquisitions, net of cash acquired
|
—
|
|
(22,087
|
)
|
(38,025
|
)
|
|||||
|
Net cash used in investing activities
|
(76,803
|
)
|
(74,123
|
)
|
(967
|
)
|
|||||
|
CASH FLOWS FROM FINANCING ACTIVITIES:
|
|||||||||||
|
Repurchase and retirement of common stock
|
(446,333
|
)
|
(110,828
|
)
|
(60,000
|
)
|
|||||
|
Proceeds from issuance of common stock
|
75,869
|
|
44,861
|
|
67,314
|
|
|||||
|
Taxes paid related to net share settlement of equity awards
|
(45,137
|
)
|
(38,266
|
)
|
(28,871
|
)
|
|||||
|
Payments of debt assumed in connection with business acquisition
|
—
|
|
(1,626
|
)
|
—
|
|
|||||
|
Net cash used in financing activities
|
(415,601
|
)
|
(105,859
|
)
|
(21,557
|
)
|
|||||
|
NET INCREASE IN CASH AND CASH EQUIVALENTS
|
102,001
|
|
165,726
|
|
260,023
|
|
|||||
|
CASH AND CASH EQUIVALENTS—Beginning of year
|
709,003
|
|
543,277
|
|
283,254
|
|
|||||
|
CASH AND CASH EQUIVALENTS—End of year
|
$
|
811,004
|
|
$
|
709,003
|
|
$
|
543,277
|
|
||
|
SUPPLEMENTAL DISCLOSURES OF CASH FLOW INFORMATION:
|
|||||||||||
|
Cash paid for income taxes—net
|
$
|
32,157
|
|
$
|
26,608
|
|
$
|
18,893
|
|
||
|
NON-CASH INVESTING AND FINANCING ACTIVITIES:
|
|||||||||||
|
Transfers of evaluation units from inventory to property and equipment
|
$
|
20,979
|
|
$
|
21,069
|
|
$
|
17,395
|
|
||
|
Liability for purchase of property and equipment and asset retirement obligations
|
$
|
8,111
|
|
$
|
8,157
|
|
$
|
9,870
|
|
||
|
Equity awards assumed in connection with business acquisition
|
$
|
—
|
|
$
|
—
|
|
$
|
471
|
|
||
See notes to consolidated financial statements.
71
FORTINET, INC.
NOTES TO CONSOLIDATED FINANCIAL STATEMENTS
|
1.
|
SUMMARY OF SIGNIFICANT ACCOUNTING POLICIES
|
Business
—Fortinet, Inc. (“Fortinet”) was incorporated in Delaware in November 2000 and is a global leader in broad, automated and integrated cybersecurity solutions. Fortinet provides high performance cybersecurity solutions to a wide variety of businesses, such as enterprises, data centers and distributed offices, including a majority of the Fortune 100 companies. Fortinet’s cybersecurity solutions are designed to provide broad, automated and integrated protection against dynamic and sophisticated security threats, while simplifying the information technology and security infrastructure of our end-customers.
Basis of Presentation and Preparation
—The consolidated financial statements of Fortinet and its wholly owned subsidiaries (collectively, the “Company,” “we,” “us” or “our”) have been prepared in accordance with generally accepted accounting principles in the United States (“GAAP”). All intercompany transactions and balances have been eliminated in consolidation.
Use of Estimates
—The preparation of consolidated financial statements in accordance with GAAP requires management to make estimates and assumptions that affect the amounts reported in the consolidated financial statements and accompanying notes. Such management estimates include, but are not limited to, the best estimate of selling price (“BESP”) for our products and services, stock-based compensation, inventory valuation, fair value of assets acquired and liabilities assumed in business combinations, measurement of liabilities for uncertain tax positions and deferred tax assets, assessment of recoverability of our goodwill and other long-lived assets, sales returns reserve, restructuring expenses and other loss contingencies. We base our estimates on historical experience and also on assumptions that we believe are reasonable. Actual results could differ from those estimates.
Concentration of Credit Risk
—Financial instruments that subject us to concentrations of credit risk consist primarily of cash, cash equivalents, short-term and long-term investments and accounts receivable. Our cash balances are maintained as deposits with various large financial institutions in the United States and around the world. Balances in the United States typically exceed the amount of insurance provided on such deposits. We maintain our cash equivalents and investments in money market funds, commercial paper and fixed income securities with major financial institutions that our management believes are financially sound.
Our accounts receivables are primarily derived from our channel partners in various geographic locations. We perform ongoing credit evaluations of our customers. We generally do not require collateral on accounts receivable and we maintain reserves for estimated potential credit losses. As of
December 31, 2017
, one distributor, Exclusive Networks Group (“Exclusive”), accounted for
35%
of total net accounts receivable. In July 2017, Exclusive acquired the U.S. division of Fine Tec Computers (“Fine Tec U.S.”). Fine Tec U.S.’s revenue and accounts receivable have been combined with Exclusive’s from the date of acquisition. As of December 31, 2016, two distributors, Exclusive and Fine Tec Computers, accounted for
26%
and
10%
of total net accounts receivable, respectively.
During 2015, 2016 and
2017
, Exclusive accounted for
18%
,
20%
and
25%
of total revenue, respectively.
Financial Instruments and Fair Value
—We apply fair value accounting for all financial assets and liabilities and non-financial assets and liabilities that are recognized or disclosed at fair value in the financial statements on a recurring basis. Due to their short-term nature, the carrying amounts reported in the consolidated financial statements approximate the fair value for cash and cash equivalents, accounts receivable, accounts payable, accrued liabilities, and accrued payroll and compensation.
Comprehensive Income
—Comprehensive income includes certain changes in equity from non-owner sources that are excluded from net income, specifically, unrealized gains and losses on available-for-sale investments and the related tax impact.
72
Foreign Currency and Transaction Gains and Losses
—The functional currency of our foreign subsidiaries is the U.S. dollar. Accordingly, monetary assets and liabilities denominated in foreign currencies have been remeasured into U.S. dollars using the exchange rates in effect at the balance sheet dates. Foreign currency denominated income and expenses have been remeasured using the exchange rates in effect during each period. Foreign currency remeasurement gains (losses) of
$1.0 million
,
$(6.6) million
and
$(3.2) million
are included in other income (expense)—net for
2017
,
2016
and
2015
, respectively.
Cash, Cash Equivalents and Available-for-Sale Investments
—We consider all highly liquid investments, purchased with original maturities of three months or less, to be cash equivalents. Cash and cash equivalents consist of balances with banks and highly liquid investments in money market funds, commercial paper, term deposits and corporate debt.
We classify our investments as available-for-sale at the time of purchase, since it is our intent that these investments are available for current operations. Investments with original maturities greater than
three months
that mature less than
one year
from the consolidated balance sheet date are classified as short-term investments. Investments with maturities greater than
one year
from the consolidated balance sheet date are classified as long-term investments.
Investments are considered to be impaired when a decline in fair value is judged to be other-than-temporary. We consult with our investment managers and consider available quantitative and qualitative evidence in evaluating potential impairment of our investments on a quarterly basis. If the cost of an individual investment exceeds its fair value, we evaluate, among other factors, general market conditions, the duration and extent to which the fair value is less than cost, and our intent and ability to hold the investment. Once a decline in fair value is determined to be other-than-temporary, an impairment charge is recorded and a new cost basis in the investment is established.
For debt securities in an unrealized loss position which is deemed to be other-than-temporary, the difference between the security’s then-current amortized cost basis and fair value is separated into (i) the amount of the impairment related to the credit loss (i.e., the credit loss component) and (ii) the amount of the impairment related to all other factors (i.e., the non-credit loss component). The credit loss component is recognized in earnings. The non-credit loss component is recognized in accumulated other comprehensive loss.
Inventory
—As of December 31, 2016, inventory is recorded at the lower of cost or market. On January 1, 2017, we adopted Accounting Standards Update (“ASU”) 2015-11—Inventory: Simplifying the Measurement of Inventory. As such, as of December 31, 2017, inventory is recorded at the lower of cost or net realizable value. Adoption of ASU 2015-11 did not have an impact on our consolidated financial statements. Cost is computed using the first-in, first-out method. In assessing the ultimate recoverability of inventory, we make estimates regarding future customer demand, the timing of new product introductions, economic trends and market conditions. If the actual product demand is significantly lower than forecasted, we could be required to record inventory write-downs which would be charged to cost of product revenue.
Property and Equipment
—Property and equipment are stated at cost less accumulated depreciation. Depreciation is computed using the straight-line method over the estimated useful lives of the assets as follows:
|
|
Estimated Useful Lives
|
|
Building and building improvements
|
2 to 30 years
|
|
Computer equipment and software
|
1 to 7 years
|
|
Evaluation units
|
1 year
|
|
Furniture and fixtures
|
3 to 5 years
|
|
Leasehold improvements
|
Shorter of useful life or lease term
|
Other Investments
—Investments in privately held companies where we own less than 20% of the voting stock and have no indicators of significant influence over operating and financial policies of those companies are included in other assets in the consolidated balance sheets and are accounted for under the cost method. For these non-quoted investments, we regularly review the assumptions underlying the operating performance and cash flow forecasts as well as current fundraising activities and valuations based on information provided by these privately held companies. If it is determined that an other-than-temporary decline exists in an equity security, we write down the investment to its fair value and record the related impairment as an investment loss in our consolidated statements of operations.
73
Consolidation of Variable Interest Entities
—We use a qualitative approach in assessing the consolidation requirement for variable interest entities (“VIEs”). This approach focuses on determining whether we have the power to direct the activities of the VIE that most significantly affect the VIE’s economic performance and whether we have the obligation to absorb losses, or the right to receive benefits, that could potentially be significant to the VIE. For all periods presented in the accompanying consolidated financial statements, we have determined that we are not the primary beneficiary of any VIEs.
Business Combinations
—We include the results of operations of the businesses that we acquire as of the respective dates of acquisition. We allocate the fair value of the purchase price of our business acquisitions to the tangible and intangible assets acquired and liabilities assumed, based on their estimated fair values. The excess of the purchase price over the fair values of these identifiable assets and liabilities is recorded as goodwill. We often continue to gather additional information throughout the measurement period, and if we make changes to the amounts recorded, such amounts are recorded in the period in which they are identified.
Impairment of Long-Lived Assets
—We evaluate events and changes in circumstances that could indicate carrying amounts of long-lived assets, including intangible assets, may not be recoverable. When such events or changes in circumstances occur, we assess the recoverability of long-lived assets by determining whether the carrying value of such assets will be recovered through undiscounted expected future cash flows. If the total of the future undiscounted cash flows is less than the carrying amount of those assets, we record an impairment charge in the period in which we make the determination. If such assets are considered to be impaired, the impairment to be recognized is measured by the amount by which the carrying amount of the assets exceeds the fair value of the assets.
Restructuring
— Our restructuring expenses consist of severance and other one-time benefits, contract terminations and other expenses. Liabilities for costs associated with a restructuring activity are measured at fair value. One-time termination benefits are expensed at the date we notify the employee, unless the employee must provide future service, in which case the benefits are expensed ratably over the future service period. A liability for terminating a contract before the end of its term, which is usually done by giving written notice to the counterparty within the notification period specified by the contract or by otherwise negotiating a termination with the counterparty, is recognized at fair value on the notification date. A liability for costs that will continue to be incurred under a contract for its remaining term without economic benefit to the entity is recognized at the cease-use date. Other costs primarily consist of asset write-offs, which are expensed when incurred.
Goodwill
—Goodwill represents the excess of purchase consideration over the estimated fair value of net assets of businesses acquired in a business combination. Goodwill acquired in a business combination is not amortized, but instead tested for impairment at least annually during the fourth quarter, or sooner when circumstances indicate an impairment may exist. We perform a qualitative assessment in the fourth quarter of each year, or more frequently if indicators of potential impairment exist, to determine if any events or circumstances exist, such as an adverse change in business climate or a decline in the overall industry that would indicate that it would more likely than not reduce the fair value of a reporting unit below its carrying amount, including goodwill. Then we perform a quantitative impairment test by comparing the fair value of a reporting unit with its carrying amount. Any excess in the carrying value of a reporting unit’s goodwill over its fair value is recognized as an impairment loss, limited to the total amount of goodwill allocated to that reporting unit.
We performed our annual goodwill impairment analysis and did not identify any impairment indicators as a result of the review. As of December 31, 2017, we had
one
reporting unit.
Other Intangible Assets
—Intangible assets with finite lives are carried at cost, less accumulated amortization. Amortization is computed using the
straight-line and accelerated method over the estimated economic lives of the assets, which range from
one
to
five
years.
Deferred Revenue
—Deferred revenue consists of amounts that have been invoiced but that have not yet been recognized as revenue. The majority of deferred revenue is comprised of security subscription and technical support services which are invoiced upfront and delivered over 12 months or longer.
74
Income Taxes
—We record income taxes using the asset and liability method, which requires the recognition of deferred tax assets and liabilities for the expected future tax consequences of events that have been recognized in our financial statements or tax returns. In addition, deferred tax assets are recorded for the future benefit of utilizing net operating losses and research and development credit carryforwards. Deferred tax assets and liabilities are measured using the currently enacted tax rates that apply to taxable income in effect for the years in which those tax assets and liabilities are expected to be realized or settled. Valuation allowances are provided when necessary to reduce deferred tax assets to the amount expected to be realized.
We recognize tax benefits from an uncertain tax position only if it is more likely than not, based on the technical merits of the position, that the tax position will be sustained on examination by the taxing authorities. The tax benefits recognized in the financial statements from such positions are then measured based on the largest benefit that has a greater than 50% likelihood of being realized upon ultimate settlement.
Stock-Based Compensation
—The fair value of restricted stock units (“RSUs”) is based on the closing market price of our common stock on the date of grant. We have elected to use the Black-Scholes-Merton (“Black-Scholes”) pricing model to determine the fair value of our employee stock options and our employee stock purchase plan (“ESPP”). Stock-based compensation expense is amortized on a straight-line basis over the service period.
Leases
—We rent certain facilities under operating lease agreements and recognize related rent expense on a straight-line basis over the term of the lease. Some of our lease agreements contain rent holidays, scheduled rent increases, lease incentives and renewal options. Rent holidays and scheduled rent increases are included in the determination of rent expense to be recorded over the lease term. Lease incentives are recognized as a reduction of rent expense on a straight-line basis over the term of the lease. Renewals are not assumed in the determination of the lease term unless they are deemed to be reasonably assured at the inception of the lease. We begin recognizing rent expense on the date that we obtain the legal right to use and control the leased space.
Advertising Expense
—Advertising costs are expensed when incurred and are included in operating expenses in the accompanying consolidated statements of operations. Our advertising expenses were not significant for any periods presented.
Research and Development Costs
—Research and development costs are expensed as incurred.
Commission Expense
—We recognize commission expense on both product sales and service contracts at the time of sale.
Software Development Costs
—The costs to develop software that is marketed have not been capitalized as we believe our current software development process is essentially completed concurrently with the establishment of technological feasibility. Such costs are expensed as incurred and included in research and development in our consolidated statements of operations.
The costs to obtain or develop software for internal use are capitalized based on qualifying criteria, which includes a determination of whether such costs are incurred during the application development stage. Such costs are amortized over the software’s estimated useful life.
Revenue Recognition
—We derive the majority of our revenue from sales of our hardware, FortiGuard security subscription and FortiCare technical support services, and other services through our channel partners and a direct sales force.
Revenue is recognized when all of the following criteria have been met:
|
•
|
Persuasive evidence of an arrangement exists.
Binding contracts or purchase orders are generally used to determine the existence of an arrangement.
|
|
•
|
Delivery has occurred or services have been rendered.
Product delivery occurs when we fulfill an order and title and risk of loss has been transferred. Service revenue is deferred and recognized ratably over the contractual service period, which is typically from
one
to
three
years and, to a lesser extent,
five
years, and is generally recognized upon delivery or completion of service.
|
75
|
•
|
Sales price is fixed or determinable.
We assess whether the sales price is fixed or determinable based on the payment terms associated with the transaction and when the sales price is deemed final.
|
|
•
|
Collectability is reasonably assured.
We assess collectability based primarily on creditworthiness as determined by credit checks, analysis, and payment history.
|
We recognize product revenue for sales to distributors that have no general right of return and direct sales to end-customers upon shipment, based on general revenue recognition accounting guidance once all other revenue recognition criteria have been met. Certain distributors are granted stock rotation rights, limited rights of return and rebates for sales of our products. The arrangement fee for this group of distributors is typically not fixed or determinable when products are shipped and revenue is therefore deferred and recognized upon sell-through. For sales that include end-customer acceptance criteria, revenue is recognized upon acceptance.
We recognize software license revenue upon electronic transfer of the license key to the customer. To date, software license revenues have not represented a significant percentage of our total revenue.
Substantially all of our products have been sold in combination with services, which consist of security subscriptions and technical support services. Security services provide access to our antivirus, intrusion prevention, web filtering and anti-spam functionality. Support services include rights to unspecified software upgrades, maintenance releases and patches, telephone and internet access to technical support personnel and hardware support. We recognize revenue from these services ratably over the contractual service period. Revenue related to subsequent renewals of these services are recognized over the term of the renewal agreement.
We reduce revenue for estimates of sales returns and allowances and record reductions to revenue for rebates and estimated commitments related to price protection and other customer incentive programs. Additionally, in limited circumstances, we may permit end-customers, distributors and resellers to return our products, subject to varying limitations, for a refund within a reasonably short period from the date of purchase. We estimate and record reserves for sales incentives and sales returns based on historical experience.
Service revenue consists of sales from our FortiGuard security subscription and FortiCare technical support services, professional and training services and other services that include SaaS and IaaS (both of which are hosted or cloud-based services). We recognize revenue from these arrangements as the subscription service is delivered over the term which is typically one year or on a monthly usage basis. To date, SaaS and IaaS revenues have not represented a significant percentage of our total revenue.
Our sales arrangements typically contain multiple elements, such as hardware, security subscription, technical support services and other services. The majority of our hardware appliance products contain our operating system software that together function to deliver the essential functionality of the product. Our products and services generally qualify as separate units of accounting. We allocate revenue to each unit of accounting based on an estimated selling price using VSOE of selling price, if it exists, or TPE of selling price. If neither VSOE nor TPE of selling price exists for a deliverable, we use our BESP for that deliverable. Revenue allocated to each element is then recognized when the basic revenue recognition criteria are met for each element. Revenue is reported net of sales taxes.
For our hardware products, we use BESP as our selling price. For our support, software licenses and other services, we generally use VSOE as our selling price estimate. We determine VSOE of fair value for elements of an arrangement based on the historical pricing and discounting practices for those services when sold separately. In establishing VSOE, we require that a substantial majority of the selling prices for a service fall within a reasonably narrow pricing range, generally evidenced by a substantial majority of such historical stand-alone transactions falling within a reasonably narrow range as a percentage of list price. When we are unable to establish a selling price using VSOE for our support and other services, we use BESP in our allocation of arrangement consideration. We determine BESP for a product or service by considering multiple historical factors including, but not limited to, cost of products, gross margin objectives, pricing practices, geographies, customer classes and distribution channels that fall within a reasonably narrow range as a percentage of list price.
76
For multiple-element arrangements where software deliverables are included, revenue is allocated to the non-software deliverables and to the software deliverables as a group using the relative estimated selling prices of each of the deliverables in the arrangement based on the estimated selling price hierarchy. The amount allocated to the software deliverables is then allocated to each software deliverable using the residual method when VSOE of fair value exists. If evidence of VSOE of fair value of one or more undelivered elements does not exist, all software allocated revenue is deferred and recognized when delivery of those elements occurs or when fair value can be established. When the undelivered element for which we do not have VSOE of fair value is support, revenue for the entire arrangement is recognized ratably over the support period. The same residual method and VSOE of fair value principles apply for our multiple element arrangements that contain only software elements.
Shipping and Handling
—Shipping and handling fees charged to our customers are recognized as product revenue in the period shipped and the related costs for providing these services are recorded as a cost of sale. Shipping and handling fees recognized as product revenue were not significant during 2017, 2016 and 2015.
Accounts Receivable
—Trade accounts receivable are recorded at the invoiced amount, net of sales returns reserve and allowances for doubtful accounts. The sales returns reserve is determined based on specific criteria including agreements to provide rebates and other factors known at the time, as well as estimates of the amount of goods shipped that will be returned. To determine the adequacy of the sales returns reserve, we analyze historical experience of actual rebates and returns as well as distributor inventory levels. The sales returns reserve was
$13.6 million
and
$10.3 million
as of December 31, 2017 and 2016, respectively. The allowance for doubtful accounts is determined based on our assessment of the collectability of customer accounts. The allowance for doubtful accounts was
$0.9 million
as of December 31, 2017 and 2016.
Warranties
—We generally provide a
1
-year warranty on hardware products and a
90
-day warranty on software. We also provide extended warranties under the terms of our support agreements. A provision for estimated future costs related to warranty activities in the first year after product sale is recorded as a component of cost of product revenues when the product revenue is recognized, based upon historical product failure rates and historical costs incurred in correcting product failures. Warranty costs related to extended warranties sold under support agreements are recognized as incurred. In the event we change our warranty reserve estimates, the resulting charge against future cost of sales or reversal of previously recorded charges may materially affect our gross margins and operating results. Accrued warranty was not significant as of December 31, 2017 and 2016.
Foreign Currency Derivatives
—Our sales contracts are primarily denominated in U.S. dollars and therefore substantially all of our revenue is not subject to foreign currency translation risk. However, a substantial portion of our operating expenses incurred outside the United States are denominated in foreign currencies and are subject to fluctuations due to changes in foreign currency exchange rates, particularly changes in the Canadian dollar (“CAD”), the Euro (“EUR”) and the British pound (“GBP”). To help protect against significant fluctuations in the value and the volatility of future cash flows caused by changes in currency exchange rates, we engage in foreign currency risk management activities to minimize the impact of balance sheet items denominated in CAD. We do not use these contracts for speculative or trading purposes. All of the derivative instruments are with high quality financial institutions and we monitor the creditworthiness of these parties. These contracts typically have a maturity of one month. Changes in the fair value of forward exchange contracts related to balance sheet accounts are insignificant and are included in Other income (expense)—net in the consolidated statement of operations.
Additionally, independent of our use of foreign currency risk management activities, fluctuations in foreign currency exchange rates may cause us to recognize transaction gains and losses in our consolidated statements of operations. Our hedging activities are intended to reduce, but not eliminate, the impact of currency exchange rate movements. As our hedging activities are relatively short-term in nature and are focused on the CAD, long-term material changes in the value of the U.S. dollar against other foreign currencies, such as the EUR and GBP, could adversely impact our operating expenses in the future.
77
There were no outstanding forward exchange contracts as of December 31, 2017. The notional amount of forward exchange contracts to hedge balance sheet accounts December 31, 2016 were (in thousands):
|
|
Buy/Sell
|
Notional
|
|||
|
Balance Sheet Contracts:
|
|||||
|
Currency—As of December 31, 2016
|
|||||
|
CAD
|
Sell
|
$
|
2,615
|
|
|
Recently Adopted Accounting Standards
Measurement of Inventory
In July 2015, the Financial Accounting Standards Board (the “FASB”) issued ASU 2015-11—Inventory: Simplifying the Measurement of Inventory, which requires entities to measure most inventory at the lower of cost and net realizable value, replacing the former methodology of measuring inventory at the lower of cost or market. We adopted ASU 2015-11 on a prospective basis beginning on January 1, 2017. The adoption of ASU 2015-11 did not have an impact on our consolidated financial statements.
Statement of Cash Flows - Restricted Cash
In August 2016, the FASB issued ASU 2016-18—Statement of Cash Flows: Restricted Cash, which addresses the presentation of restricted cash in the statement of cash flows. Under ASU 2016-18, restricted cash or restricted cash equivalents should be included with cash and cash equivalents when reconciling the beginning-of-period and end-of-period total amounts shown on the statement of cash flows. ASU 2016-18 is effective for us beginning on January 1, 2018 and will be applied on a retrospective basis. Early adoption is permitted. We elected to early adopt ASU 2016-18 on January 1, 2017. The adoption did not have a material impact on our consolidated financial statements.
Business Combinations – Definition of a Business
In January 2017, the FASB issued ASU 2017-01—Business Combinations: Clarifying the Definition of a Business, which clarifies the definition of a business to assist organizations with evaluating whether transactions should be accounted for as acquisitions (or disposals) of assets or businesses. The definition of a business affects many areas of accounting including acquisitions, disposals, goodwill and consolidation. We elected to early adopt ASU 2017-01 on a prospective basis beginning on January 1, 2017. The adoption of ASU 2017-01 did not have a material impact on our consolidated financial statements.
Goodwill Impairment
In January 2017, the FASB issued ASU 2017-04—Intangibles—Goodwill and Other: Simplifying the Test for Goodwill Impairment. ASU 2017-04 eliminates Step 2 from the goodwill impairment test, which measures a goodwill impairment loss by comparing the implied fair value of a reporting unit’s goodwill with the carrying amount of that goodwill. Under ASU 2017-04, an entity should perform its annual or interim goodwill impairment test by comparing the fair value of the reporting unit with its carrying amount, and should recognize an impairment loss for the amount by which the carrying amount exceeds the reporting unit’s fair value, with the loss not exceeding the total amount of goodwill allocated to that reporting unit. ASU 2017-04 will be effective for us beginning on January 1, 2020. Early adoption is permitted for interim or annual goodwill impairment tests performed after January 1, 2017. At adoption, ASU 2017-04 requires a prospective approach. We early adopted ASU 2017-04 on October 1, 2017, and the adoption did not impact our consolidated financial statements.
78
Recent Accounting Standards Not Yet Effective
Share-Based Payment Accounting
In May 2017, the FASB issued ASU 2017-09—Compensation—Stock Compensation: Scope of Modification Accounting to clarify when to account for a change to the terms or conditions of a share-based payment award as a modification. Under ASU 2017-09, modification accounting is required only if the fair value, the vesting conditions or the classification of the award (as equity or liability) changes as a result of the change in terms or conditions. ASU 2017-09 is effective prospectively for us beginning on January 1, 2018. We adopted ASU 2017-09 on January 1, 2018. The adoption is not expected to have a material impact on our consolidated financial statements.
Income Taxes – Intra-Entity Asset Transfers
In October 2016, the FASB issued ASU 2016-16—Income Taxes—Intra-Entity Transfer of Assets Other Than Inventory, which requires the recognition of the income tax consequences of an intra-entity transfer of an asset, other than inventory, when the transfer occurs. ASU 2016-16 is effective for us beginning on January 1, 2018. We adopted ASU 2016-16 on January 1, 2018. The adoption is not expected to have a material impact on our consolidated financial statements.
Leases
In February 2016, the FASB issued ASU 2016-02—Leases, which requires the recognition of right-of-use assets and lease liabilities on the consolidated balance sheet for substantially all leases. ASU 2016-02 includes a number of optional practical expedients that entities may elect to apply. ASU 2016-02 will also require significant additional disclosures about the amount, timing and uncertainty of cash flows from leases. ASU 2016-02 will be effective for us beginning on January 1, 2019, using a modified retrospective approach. Based on our current lease portfolio, we currently estimate that the value of leased assets and liabilities that may be recognized to be at least
$40.0 million
. We are continuing to evaluate the impact of ASU 2016-02 and our estimate is subject to change. We do not believe that ASU 2016-02 will have a material impact on our consolidated statements of operations. We expect to expand our disclosures in the notes to consolidated financial statements to include more details on our leases, significant judgments and lease-related amounts recognized in the consolidated financial statements.
Financial Instruments – Recognition and Measurement
In January 2016, the FASB issued ASU 2016-01—Financial Instruments—Overall: Recognition and Measurement of Financial Assets and Financial Liabilities, which requires most equity investments to be measured at fair value, with subsequent changes in fair value recognized in net income. A practicality exception will apply to those equity investments that do not have a readily determinable fair value. These investments may be measured at cost, adjusted for changes in observable prices minus impairment. ASU 2016-01 is effective for our cost-method investments beginning on January 1, 2018 on a prospective basis. We adopted ASU 2016-01 on January 1, 2018 and there was no material impact as of adoption date.
Revenue Recognition
In May 2014, the FASB issued ASU 2014-09—Revenue from Contracts with Customers, which outlines a single, comprehensive model for entities to use in accounting for revenue arising from contracts with customers. The core principle of ASU 2014-09 is to recognize revenue when promised goods or services are transferred to customers in an amount that reflects the consideration that is expected to be received for those goods or services. ASU 2014-09 defines a five-step process to achieve this core principle and, accordingly, we expect more judgment and estimates may be required within the revenue recognition process than is required under the legacy GAAP, including identifying performance obligations in the contract, estimating the amount of variable consideration to include in the transaction price and allocating the transaction price to each separate performance obligation. ASU 2014-09 is effective for us beginning on January 1, 2018. ASU 2014-09 permits two methods of adoption: retrospectively to each prior reporting period presented (the full retrospective method), or retrospectively with the cumulative effect of initially applying the guidance recognized at the date of initial application (the modified retrospective method). We elected to adopt ASU 2014-09 using the modified retrospective method and will apply the standard to contracts that are not completed as of January 1, 2018, and will recognize the cumulative effect of initially applying the standard as an adjustment to the opening balance of accumulated deficit.
79
We have completed our analysis of open revenue contracts as of January 1, 2018. Based on our assessment, the impact on revenue in our consolidated financial statements is not material. The impact on revenue primarily relates to the acceleration of revenue from U.S.-based channel partners, which were previously deferred until the product was sold through, and certain changes related to revenue recognized on software license sales. We expect the pattern of revenue recognition from direct sales of our FortiGate and other appliances and FortiGuard security subscription and FortiCare technical support services to be substantially unchanged on an ongoing basis. As of January 1, 2018, sales returns reserve will be presented as part of accrued liabilities as netting against accounts receivable is no longer allowed under ASU 2014-09.
Under the legacy GAAP, we expensed all sales commissions when incurred. As of January 1, 2018, we will continue to expense commissions related to appliance sales when incurred, but will capitalize and recognize certain commissions on service contracts over the period of benefit. As part of the transition to the new accounting standard, we expect to capitalize at least
$130.0
million of sales commissions as of January 1, 2018 that have been determined to be the remaining costs to obtain then-existing service contracts. Capitalized sales commissions will be amortized on a straight-line basis over the period of benefit for new business or the contract term for renewals.
In the preparation for the adoption of ASU 2014-09, we have implemented internal controls and all necessary system functionality to enable the preparation of financial information and related disclosures in accordance with this standard.
|
2.
|
FINANCIAL INSTRUMENTS AND FAIR VALUE
|
The following tables summarize our investments (in thousands):
|
|
December 31, 2017
|
||||||||||||||
|
|
Amortized
Cost
|
Unrealized
Gains
|
Unrealized
Losses
|
Fair
Value
|
|||||||||||
|
Corporate debt securities
|
$
|
391,000
|
|
$
|
3
|
|
$
|
(1,178
|
)
|
$
|
389,825
|
|
|||
|
Commercial paper
|
74,210
|
|
5
|
|
(8
|
)
|
74,207
|
|
|||||||
|
Certificates of deposit and term deposits
(1)
|
45,870
|
|
2
|
|
(17
|
)
|
45,855
|
|
|||||||
|
U.S. government and agency securities
|
28,487
|
|
—
|
|
(79
|
)
|
28,408
|
|
|||||||
|
Total available-for-sale securities
|
$
|
539,567
|
|
$
|
10
|
|
$
|
(1,282
|
)
|
$
|
538,295
|
|
|||
|
|
December 31, 2016
|
||||||||||||||
|
|
Amortized
Cost
|
Unrealized
Gains
|
Unrealized
Losses
|
Fair
Value
|
|||||||||||
|
Corporate debt securities
|
$
|
379,494
|
|
$
|
43
|
|
$
|
(925
|
)
|
$
|
378,612
|
|
|||
|
Commercial paper
|
95,110
|
|
23
|
|
(25
|
)
|
95,108
|
|
|||||||
|
U.S. government and agency securities
|
64,604
|
|
16
|
|
(79
|
)
|
64,541
|
|
|||||||
|
Municipal bonds
|
59,257
|
|
3
|
|
(235
|
)
|
59,025
|
|
|||||||
|
Certificates of deposit and term deposits
(1)
|
4,219
|
|
—
|
|
—
|
|
4,219
|
|
|||||||
|
Total available-for-sale securities
|
$
|
602,684
|
|
$
|
85
|
|
$
|
(1,264
|
)
|
$
|
601,505
|
|
|||
|
(1)
The majority of our certificates of deposit and term deposits are foreign deposits.
|
|||||||||||||||
80
The following tables show the gross unrealized losses and the related fair values of our investments that have been in a continuous unrealized loss position (in thousands):
|
December 31, 2017
|
|||||||||||||||||||||||
|
|
Less Than 12 Months
|
12 Months or Greater
|
Total
|
||||||||||||||||||||
|
|
Fair
Value
|
Unrealized
Losses
|
Fair
Value
|
Unrealized
Losses
|
Fair
Value
|
Unrealized
Losses
|
|||||||||||||||||
|
Corporate debt securities
|
$
|
317,412
|
|
$
|
(871
|
)
|
$
|
58,161
|
|
$
|
(308
|
)
|
$
|
375,573
|
|
$
|
(1,179
|
)
|
|||||
|
Certificates of deposit and term deposits
|
37,229
|
|
(16
|
)
|
—
|
|
—
|
|
37,229
|
|
(16
|
)
|
|||||||||||
|
Commercial paper
|
29,044
|
|
(8
|
)
|
—
|
|
—
|
|
29,044
|
|
(8
|
)
|
|||||||||||
|
U.S. government and agency securities
|
16,967
|
|
(21
|
)
|
11,441
|
|
(58
|
)
|
28,408
|
|
(79
|
)
|
|||||||||||
|
Total available-for-sale securities
|
$
|
400,652
|
|
$
|
(916
|
)
|
$
|
69,602
|
|
$
|
(366
|
)
|
$
|
470,254
|
|
$
|
(1,282
|
)
|
|||||
|
December 31, 2016
|
|||||||||||||||||||||||
|
|
Less Than 12 Months
|
12 Months or Greater
|
Total
|
||||||||||||||||||||
|
|
Fair
Value
|
Unrealized
Losses
|
Fair
Value
|
Unrealized
Losses
|
Fair
Value
|
Unrealized
Losses
|
|||||||||||||||||
|
Corporate debt securities
|
$
|
311,980
|
|
$
|
(910
|
)
|
$
|
13,541
|
|
$
|
(15
|
)
|
$
|
325,521
|
|
$
|
(925
|
)
|
|||||
|
Municipal bonds
|
52,200
|
|
(235
|
)
|
—
|
|
—
|
|
52,200
|
|
(235
|
)
|
|||||||||||
|
U.S. government and agency securities
|
33,430
|
|
(79
|
)
|
—
|
|
—
|
|
33,430
|
|
(79
|
)
|
|||||||||||
|
Commercial paper
|
17,394
|
|
(25
|
)
|
—
|
|
—
|
|
17,394
|
|
(25
|
)
|
|||||||||||
|
Total available-for-sale securities
|
$
|
415,004
|
|
$
|
(1,249
|
)
|
$
|
13,541
|
|
$
|
(15
|
)
|
$
|
428,545
|
|
$
|
(1,264
|
)
|
|||||
The contractual maturities of our investments were as follows (in thousands):
|
|
December 31,
2017 |
December 31,
2016 |
|||||
|
Due within one year
|
$
|
440,273
|
|
$
|
376,522
|
|
|
|
Due within one to three years
|
98,022
|
|
224,983
|
|
|||
|
Total
|
$
|
538,295
|
|
$
|
601,505
|
|
|
Available-for-sale securities are reported at fair value, with unrealized gains and losses and the related tax impact included as a separate component of stockholders’ equity and in comprehensive income. Realized losses on available-for-sale securities were
$0.8 million
in the periods presented and are included in Other income (expense)—net in our consolidated statements of operations. We use the specific identification method to determine the cost basis of investments sold.
The unrealized losses on our available-for-sale securities were caused by fluctuations in market value and interest rates as a result of the economic environment. As the decline in market value are attributable to changes in market conditions and not credit quality, and because we have concluded currently that we neither intend to sell nor is it more likely than not that we will be required to sell these investments prior to a recovery of par value, we do not consider these investments to be other-than temporarily impaired as of December 31, 2017.
Fair Value Accounting—We apply the following fair value hierarchy for disclosure of the inputs used to measure fair value. This hierarchy prioritizes the inputs into three broad levels as follows:
Level 1—Inputs are unadjusted quoted prices in active markets for identical assets or liabilities.
81
Level 2—Inputs are quoted prices for similar assets and liabilities in active markets or inputs that are observable for the assets or liabilities, either directly or indirectly through market corroboration, for substantially the full term of the financial instruments.
Level 3—Unobservable inputs based on our own assumptions used to measure assets and liabilities at fair value. The inputs require significant management judgment or estimation.
We measure the fair value of money market funds and certain U.S. government and agency securities using quoted prices in active markets for identical assets. The fair value of all other financial instruments was based on quoted prices for similar assets in active markets, or model driven valuations using significant inputs derived from or corroborated by observable market data.
We classify investments within Level 1 if quoted prices are available in active markets for identical securities.
We classify items within Level 2 if the investments are valued using model driven valuations using observable inputs such as quoted market prices, benchmark yields, reported trades, broker/dealer quotes or alternative pricing sources with reasonable levels of price transparency. Investments are held by custodians who obtain investment prices from a third-party pricing provider that incorporates standard inputs in various asset price models.
Fair Value of Financial Instruments
Assets Measured at Fair Value on a Recurring Basis
The following tables present the fair value of our financial assets measured at fair value on a recurring basis as of
December 31, 2017
and 2016 (in thousands):
|
|
December 31, 2017
|
December 31, 2016
|
|||||||||||||||||||||||||||||
|
|
Aggregate
Fair
Value
|
Quoted
Prices in
Active
Markets For
Identical
Assets
|
Significant
Other
Observable
Remaining
Inputs
|
Significant
Other
Unobservable
Remaining
Inputs
|
Aggregate
Fair
Value
|
Quoted
Prices in
Active
Markets For
Identical
Assets
|
Significant
Other
Observable
Remaining
Inputs
|
Significant
Other
Unobservable
Remaining
Inputs
|
|||||||||||||||||||||||
|
|
|
(Level 1)
|
(Level 2)
|
(Level 3)
|
|
(Level 1)
|
(Level 2)
|
(Level 3)
|
|||||||||||||||||||||||
|
Assets:
|
|||||||||||||||||||||||||||||||
|
Corporate debt securities
|
$
|
411,142
|
|
$
|
—
|
|
$
|
411,142
|
|
$
|
—
|
|
$
|
378,612
|
|
$
|
—
|
|
$
|
378,612
|
|
$
|
—
|
|
|||||||
|
Money market funds
|
195,592
|
|
195,592
|
|
—
|
|
—
|
|
38,649
|
|
38,649
|
|
—
|
|
—
|
|
|||||||||||||||
|
Certificates of deposit and term deposits
(1)
|
132,070
|
|
—
|
|
132,070
|
|
—
|
|
59,479
|
|
—
|
|
59,479
|
|
—
|
|
|||||||||||||||
|
Commercial paper
|
128,890
|
|
—
|
|
128,890
|
|
—
|
|
105,097
|
|
—
|
|
105,097
|
|
—
|
|
|||||||||||||||
|
U.S. government and agency securities
|
28,408
|
|
24,952
|
|
3,456
|
|
—
|
|
64,541
|
|
52,082
|
|
12,459
|
|
—
|
|
|||||||||||||||
|
Municipal bonds
|
—
|
|
—
|
|
—
|
|
—
|
|
59,025
|
|
—
|
|
59,025
|
|
—
|
|
|||||||||||||||
|
Total
|
$
|
896,102
|
|
$
|
220,544
|
|
$
|
675,558
|
|
$
|
—
|
|
$
|
705,403
|
|
$
|
90,731
|
|
$
|
614,672
|
|
$
|
—
|
|
|||||||
|
Reported as:
|
|||||||||||||||||||||||||||||||
|
Cash equivalents
|
$
|
357,807
|
|
$
|
103,898
|
|
|||||||||||||||||||||||||
|
Short-term investments
|
440,273
|
|
376,522
|
|
|||||||||||||||||||||||||||
|
Long-term investments
|
98,022
|
|
224,983
|
|
|||||||||||||||||||||||||||
|
Total
|
$
|
896,102
|
|
$
|
705,403
|
|
|||||||||||||||||||||||||
82
(1)
Subsequent to the issuance of our consolidated financial statements as of and for the year ended December 31, 2016, we determined that
$55.3 million
in 30-day term deposits, included within cash and cash equivalents in the consolidated balance sheet as of December 31, 2016, should have also been included as Level 2 investments in the fair value hierarchy table for financial assets and financial liabilities measured at fair value on a recurring basis. Accordingly, we have corrected the above table as of December
31, 2016, the effect of which is immaterial to the financial statements as a whole.
There were
no
transfers between Level 1 and Level 2 of the fair value hierarchy during the year ended
December 31, 2017
and
December 31, 2016
.
Assets Measured at Fair Value on a Nonrecurring Basis
We measure certain assets, including goodwill, other intangible assets—net and investments in privately held companies at fair value on a nonrecurring basis when there are identifiable events or changes in circumstances that may have a significant adverse impact on the fair value of these assets.
During the second quarter of 2015, we reassessed the fair value and the remaining useful life of the developed technologies and customer relationship acquired from the Coyote Point Systems (“Coyote”) business acquisition. Based on this reassessment, we determined a decrease in the projected cash flow and that the remaining net book value of the developed technologies and customer relationships were impaired. As a result, we recorded an impairment charge of
$1.6 million
associated with these assets. The impairment charge is included within cost of product revenue and sales and marketing in the consolidated statements of operations.
3. INVENTORY
Inventory consisted of the following (in thousands):
|
|
December 31,
2017 |
December 31,
2016 |
|||||
|
Raw materials
|
$
|
13,042
|
|
$
|
18,924
|
|
|
|
Finished goods
|
64,249
|
|
87,963
|
|
|||
|
Inventory
|
$
|
77,291
|
|
$
|
106,887
|
|
|
Inventory includes finished goods held by distributors where revenue is recognized on a sell-through basis of
$0.1 million
and
$1.0 million
as of December 31, 2017 and 2016, respectively. Inventory also includes materials at contract manufacturers of
$2.6 million
and
$6.1 million
as of December 31, 2017 and 2016, respectively.
4. PROPERTY AND EQUIPMENT—Net
Property and equipment—net consisted of the following (in thousands):
|
|
December 31,
2017 |
December 31,
2016 |
|||||
|
Building and building improvements
|
$
|
133,212
|
|
$
|
49,783
|
|
|
|
Computer equipment and software
|
79,911
|
|
65,323
|
|
|||
|
Land
|
65,583
|
|
35,079
|
|
|||
|
Leasehold improvements
|
20,777
|
|
18,699
|
|
|||
|
Evaluation units
|
20,087
|
|
20,173
|
|
|||
|
Furniture and fixtures
|
14,705
|
|
13,995
|
|
|||
|
Construction-in-progress
|
6,275
|
|
4,669
|
|
|||
|
Total property and equipment
|
340,550
|
|
207,721
|
|
|||
|
Less: accumulated depreciation
|
(95,155
|
)
|
(70,472
|
)
|
|||
|
Property and equipment—net
|
$
|
245,395
|
|
$
|
137,249
|
|
|
83
Depreciation expense was
$46.9 million
,
$39.2 million
and
$28.4 million
in
2017
,
2016
and
2015
, respectively.
In April 2017, we purchased certain real estate in Burnaby, Canada for
$84.8 million
. The purchase was accounted for under the asset acquisition method. The cost of the assets acquired was allocated to land and buildings based on their relative fair values. The amounts allocated to land and buildings were
$12.7 million
and
$72.1 million
, respectively.
5. INVESTMENTS IN PRIVATELY HELD COMPANIES
Our investments in the equity securities of privately held companies totaled
$12.1 million
and
$10.3 million
as of December 31, 2017 and 2016, respectively. These investments are accounted for as cost-basis investments, as we own less than 20% of the voting securities in each of these investments and do not have the ability to exercise significant influence over operating and financial policies of the respective entities. These investments are carried at historical cost and are recorded as other assets on our consolidated balance sheets and would be measured at fair value if indicators of impairment existed. As of December 31, 2017, no events have occurred that would adversely affect the carrying value of these investments.
As of December 31, 2017, we determined that we had a variable interest in these privately held companies. However, we determined that we were not the primary beneficiary as we did not have the power to direct their activities that most significantly affect their economic performance. The VIEs are not required to be consolidated in our consolidated financial statements.
6. BUSINESS COMBINATIONS
AccelOps, Inc.
On June 7, 2016, we completed our acquisition of AccelOps, Inc. (“AccelOps”), a provider of network security monitoring and analytics solutions, for total cash consideration of
$22.1 million
, net of cash received. This acquisition extended the Fortinet Security Fabric.
The acquisition of AccelOps was accounted as a business combination in accordance with ASC Topic 805 “Business Combinations” issued by the FASB, and we used our best estimates and assumptions to assign fair value to the tangible and intangible assets acquired and liabilities assumed at the acquisition date. The total purchase price was allocated to AccelOps’ identifiable tangible and intangible assets acquired and liabilities assumed based on their estimated fair values as of the acquisition date.
Total allocation of the purchase price was (in thousands):
|
Cash and cash equivalents
|
$
|
171
|
|
|
Accounts receivable
|
1,126
|
|
|
|
Prepaid expenses and other assets
|
430
|
|
|
|
Property and equipment
|
203
|
|
|
|
Deferred tax assets
|
3,435
|
|
|
|
Finite-lived intangible assets
|
14,900
|
|
|
|
Indefinite-lived intangible assets in process research and development
|
1,600
|
|
|
|
Goodwill
|
9,861
|
|
|
|
Total assets acquired
|
31,726
|
|
|
|
Deferred revenue
|
4,400
|
|
|
|
Accounts payable and accrued liabilities
|
3,348
|
|
|
|
Other liabilities
|
1,694
|
|
|
|
Total liabilities assumed
|
9,442
|
|
|
|
Total purchase price allocation
|
$
|
22,284
|
|
84
Finite-lived intangible assets consist of developed technology, customer relationships and other intangible assets. AccelOps’ technology provides a software solution to manage security, performance and compliance from a single platform. The acquired developed technologies include software patents, know-how, process and designs. The value of customer relationships is attributable to the generation of a consistent income source and the avoidance of costs associated with creating new customer relationships.
The estimated useful life and fair values of the acquired finite-lived intangible assets were as follows (in thousands, except for estimated useful life):
|
Estimated Useful Life (in years)
|
Fair Values
|
||||
|
Developed technologies
|
4
|
$
|
12,400
|
|
|
|
Customer relationships
|
3
|
2,300
|
|
||
|
Other
|
2
|
200
|
|
||
|
Total
|
$
|
14,900
|
|
||
The developed technologies and other are amortized on a straight-line basis. The amortization expense of developed technologies and other intangibles are recorded in cost of revenue. The amortization expense of customer relationships is amortized on an accelerated basis and is recorded in sales and marketing expenses.
Indefinite-lived intangible assets consist of in-process research and development, which will begin to be amortized upon completion of development.
The goodwill of
$9.9 million
represents the amount of the purchase price in excess of the fair value of the net tangible liabilities assumed and intangible assets acquired, including AccelOps’ assembled workforce. The goodwill recorded as part of the AccelOps acquisition is not deductible for U.S. federal income tax purposes.
Meru Networks, Inc.
On July 8, 2015, we completed our acquisition of Meru Networks, Inc. (“Meru”), a provider of wi-fi networking products and services. In connection with the acquisition, we paid
$41.8 million
, comprised of cash consideration of
$40.9 million
, withholding tax liability of
$0.4 million
and the estimated fair value associated with RSUs of Meru of
$0.5 million
that were converted for
53,401
shares of our common stock.
We accounted for this transaction as a business combination in accordance with ASC Topic 805. We expensed acquisition-related costs of
$1.7 million
in general and administrative expenses. The total purchase price was allocated to Meru’s identifiable tangible and intangible assets acquired and liabilities assumed based on their estimated fair values as of the acquisition date.
85
Total allocation of the purchase price was as follows (in thousands):
|
Cash and cash equivalents
|
$
|
3,268
|
|
|
Accounts receivable
|
8,191
|
|
|
|
Inventory
|
11,610
|
|
|
|
Prepaid expenses and other assets
|
2,409
|
|
|
|
Property and equipment
|
920
|
|
|
|
Deferred tax assets
|
18,585
|
|
|
|
Finite-lived intangible assets
|
19,600
|
|
|
|
Goodwill
|
1,868
|
|
|
|
Total assets acquired
|
66,451
|
|
|
|
Deferred revenue
|
9,800
|
|
|
|
Accounts payable and accrued liabilities
|
14,887
|
|
|
|
Total liabilities assumed
|
24,687
|
|
|
|
Total purchase price allocation
|
$
|
41,764
|
|
The goodwill of
$1.9 million
represents the premium we paid over the fair value of the net tangible liabilities assumed and identified intangible assets acquired, due primarily to Meru’s assembled workforce. The goodwill recorded as part of the Meru acquisition is not deductible for U.S. federal income tax purposes.
Intangible assets consist primarily of customer relationships and developed technologies. Customer relationships represent Meru’s installed base and the ability to sell existing, in-process and future versions of our products and services to its existing customers. Developed technologies represent the virtualized wireless local area network solutions offering centralized coordination and control of various access points on the network. This includes patented and unpatented technology, know-how, processes, designs and computer software. The estimated useful life and fair values of the acquired identifiable intangible assets were as follows (in thousands, except for estimated useful life):
|
Estimated Useful Life (in years)
|
Fair Values
|
||||
|
Customer relationships
|
5
|
$
|
12,200
|
|
|
|
Developed technologies
|
4
|
7,200
|
|
||
|
Trade name
|
0.5
|
200
|
|
||
|
Total
|
$
|
19,600
|
|
||
Customer relationships and trade name are amortized and the amortization expense is recorded in sales and marketing expenses in the consolidated statement of operations. Developed technologies are amortized and the amortization expense is recorded in cost of product revenue in the consolidated statement of operations.
7. GOODWILL AND OTHER INTANGIBLE ASSETS—Net
Goodwill
As of
December 31, 2017
, we had goodwill of
$14.6 million
. There were
no
impairments to goodwill during 2017 or during prior periods.
86
Other Intangible Assets—net
The following tables present other intangible assets—net as of
December 31, 2017
and 2016 (in thousands, except years):
|
December 31, 2017
|
|||||||||||||
|
|
Weighted-Average Useful Life (in Years)
|
Gross
|
Accumulated Amortization
|
Net
|
|||||||||
|
Other intangible assets—net:
|
|||||||||||||
|
Finite-lived intangible assets:
|
|||||||||||||
|
Developed technologies and other
|
3.8
|
$
|
23,984
|
|
$
|
13,750
|
|
$
|
10,234
|
|
|||
|
Customer relationships
|
4.7
|
14,500
|
|
10,079
|
|
4,421
|
|
||||||
|
38,484
|
|
23,829
|
|
14,655
|
|
||||||||
|
Indefinite-lived intangible assets:
|
|||||||||||||
|
In-process research and development
|
1,600
|
|
—
|
|
1,600
|
|
|||||||
|
Total other intangible assets—net
|
$
|
40,084
|
|
$
|
23,829
|
|
$
|
16,255
|
|
||||
|
December 31, 2016
|
|||||||||||||
|
|
Weighted-Average Useful Life (in Years)
|
Gross
|
Accumulated Amortization
|
Net
|
|||||||||
|
Other intangible assets—net:
|
|||||||||||||
|
Finite-lived intangible assets:
|
|||||||||||||
|
Developed technologies and other
|
3.8
|
$
|
23,984
|
|
$
|
8,750
|
|
$
|
15,234
|
|
|||
|
Customer relationships
|
4.7
|
14,500
|
|
6,506
|
|
7,994
|
|
||||||
|
38,484
|
|
15,256
|
|
23,228
|
|
||||||||
|
Indefinite-lived intangible assets:
|
|||||||||||||
|
In-process research and development
|
1,600
|
|
—
|
|
1,600
|
|
|||||||
|
Total other intangible assets—net
|
$
|
40,084
|
|
$
|
15,256
|
|
$
|
24,828
|
|
||||
The in-process research and development intangible asset of
$1.6 million
is expected to be completed in the first quarter of 2018. Upon completion, the cost will be transferred to developed technology and will be amortized over the remaining estimated useful life of the asset. Amortization expense was
$8.6 million
,
$9.3 million
, and
$3.2 million
in
2017
,
2016
and
2015
, respectively. The following table summarizes estimated future amortization expense of finite-lived intangible assets—net (in thousands):
|
|
Amount
|
||
|
Years:
|
|||
|
2018
|
$
|
6,885
|
|
|
2019
|
5,407
|
|
|
|
2020
|
2,363
|
|
|
|
Total
|
$
|
14,655
|
|
87
8. NET INCOME PER SHARE
Basic net income per share is computed by dividing net income by the weighted-average number of shares of common stock outstanding during the period. Diluted net income per share is computed by dividing net income by the weighted-average number of shares of common stock outstanding during the period, plus the dilutive effects of RSUs, stock options and the ESPP. Dilutive shares of common stock are determined by applying the treasury stock method.
A reconciliation of the numerator and denominator used in the calculation of basic and diluted net income per share is as follows (in thousands, except per share amounts):
|
|
Year Ended December 31,
|
||||||||||
|
|
2017
|
2016
|
2015
|
||||||||
|
Numerator:
|
|||||||||||
|
Net income
|
$
|
31,399
|
|
$
|
32,187
|
|
$
|
7,987
|
|
||
|
Denominator:
|
|||||||||||
|
Basic shares:
|
|||||||||||
|
Weighted-average common stock outstanding-basic
|
174,315
|
|
172,621
|
|
170,385
|
|
|||||
|
Diluted shares:
|
|||||||||||
|
Weighted-average common stock outstanding-basic
|
174,315
|
|
172,621
|
|
170,385
|
|
|||||
|
Effect of potentially dilutive securities:
|
|||||||||||
|
RSUs
|
2,287
|
|
1,891
|
|
2,260
|
|
|||||
|
Stock options
|
1,426
|
|
1,757
|
|
3,427
|
|
|||||
|
ESPP
|
51
|
|
69
|
|
69
|
|
|||||
|
Weighted-average shares used to compute diluted net income per share
|
178,079
|
|
176,338
|
|
176,141
|
|
|||||
|
Net income per share:
|
|||||||||||
|
Basic
|
$
|
0.18
|
|
$
|
0.19
|
|
$
|
0.05
|
|
||
|
Diluted
|
$
|
0.18
|
|
$
|
0.18
|
|
$
|
0.05
|
|
||
The following weighted-average shares of common stock were excluded from the computation of diluted net income per share for the periods presented, as their effect would have been antidilutive (in thousands):
|
|
Year Ended December 31,
|
|||||||
|
|
2017
|
2016
|
2015
|
|||||
|
RSUs
|
1,418
|
|
3,319
|
|
1,393
|
|
||
|
Stock options
|
1,031
|
|
1,024
|
|
382
|
|
||
|
ESPP
|
156
|
|
159
|
|
94
|
|
||
|
2,605
|
|
4,502
|
|
1,869
|
|
|||
88
9. RESTRUCTURING CHARGES
In 2016 and 2015, we implemented plans to restructure and further improve efficiencies in our operations due primarily to acquisitions of Meru and AccelOps. Restructuring charges related to these plans consisted primarily of employee severance and other one-time benefits paid in cash and are included in operating expense in the consolidated statements of operations. The restructuring reserve was included in accrued liabilities on the consolidated balance sheet as of December 31, 2017 and 2016. The restructuring activities were completed by the end of the third quarter of 2017.
Activities related to the restructuring actions are summarized as follows (in thousands):
|
|
Employee Severance and Other Benefits
|
Contract Terminations and Other Charges
|
Total
|
||||||||
|
Costs incurred
|
$
|
7,109
|
|
$
|
491
|
|
$
|
7,600
|
|
||
|
Less cash payments
|
(3,104
|
)
|
(71
|
)
|
(3,175
|
)
|
|||||
|
Less non-cash items
|
(316
|
)
|
(191
|
)
|
(507
|
)
|
|||||
|
Balance as of December 31, 2015
|
3,689
|
|
229
|
|
3,918
|
|
|||||
|
Costs incurred
|
3,246
|
|
751
|
|
3,997
|
|
|||||
|
Less cash payments
|
(5,933
|
)
|
(664
|
)
|
(6,597
|
)
|
|||||
|
Less non-cash items
|
(89
|
)
|
(78
|
)
|
(167
|
)
|
|||||
|
Balance as of December 31, 2016
|
913
|
|
238
|
|
1,151
|
|
|||||
|
Costs incurred
|
294
|
|
46
|
|
340
|
|
|||||
|
Less cash payments
|
(1,207
|
)
|
(284
|
)
|
(1,491
|
)
|
|||||
|
Less non-cash items
|
—
|
|
—
|
|
—
|
|
|||||
|
Balance as of December 31, 2017
|
$
|
—
|
|
$
|
—
|
|
$
|
—
|
|
||
89
10. COMMITMENTS AND CONTINGENCIES
The following table summarizes our future principal contractual obligations as of
December 31, 2017
(in thousands):
|
|
Total
|
2018
|
2019
|
2020
|
2021
|
2022
|
Thereafter
|
||||||||||||||||||||
|
Operating lease commitments
|
$
|
56,871
|
|
$
|
16,020
|
|
$
|
13,193
|
|
$
|
10,597
|
|
$
|
6,346
|
|
$
|
4,157
|
|
$
|
6,558
|
|
||||||
|
Inventory purchase commitments
|
97,170
|
|
97,170
|
|
—
|
|
—
|
|
—
|
|
—
|
|
—
|
|
|||||||||||||
|
Total
|
$
|
154,041
|
|
$
|
113,190
|
|
$
|
13,193
|
|
|
$
|
10,597
|
|
|
$
|
6,346
|
|
|
$
|
4,157
|
|
|
$
|
6,558
|
|
||
Operating Leases
—We lease certain facilities under various non-cancelable operating leases, which expire through 2026. Certain leases require us to pay variable costs such as taxes, maintenance, and insurance. The terms of certain operating leases also provide for renewal options and escalation clauses. Rent expense was
$16.7 million
,
$18.9 million
and
$13.8 million
for
2017
,
2016
and
2015
, respectively. Rent expense is recognized using the straight-line method over the term of the lease.
Inventory Purchase Commitments
—Our independent contract manufacturers procure components and build our products based on our forecasts. These forecasts are based on estimates of future demand for our products, which are in turn based on historical trends and an analysis from our sales and marketing organizations, adjusted for overall market conditions. In order to reduce manufacturing lead times and plan for adequate component supply, we may issue purchase orders to some of our independent contract manufacturers which may not be cancelable. As of
December 31, 2017
, we had
$97.2 million
of open purchase orders with our independent contract manufacturers that may not be cancelable.
Other Contractual Commitments and Open Purchase Orders
—In addition to commitments with contract manufacturers, we have open purchase orders and contractual obligations in the ordinary course of business for which we have not received goods or services. As of
December 31, 2017
, we had
$6.8 million
in other contractual commitments having a remaining term in excess of one year that may not be cancelable.
Litigation
—We are involved in disputes, litigation, and other legal actions. For lawsuits where we are the defendant, we are in the process of defending these litigation matters, and while there can be no assurances and the outcome of these matters is currently not determinable, we currently believe that there are no existing claims or proceedings that are likely to have a material adverse effect on our financial position. There are many uncertainties associated with any litigation and these actions or other third-party claims against us may cause us to incur costly litigation fees, including contingent legal fees with related parties, costs and substantial settlement charges, and possibly subject us to damages and other penalties. In addition, the resolution of any intellectual property litigation may require us to make royalty payments, which could adversely affect our gross margins in future periods. If any of those events were to occur, our business, financial condition, results of operations, and cash flows could be adversely affected. The actual liability in any such matters may be materially different from our estimates, if any, which could result in the need to adjust the liability and record additional expenses. As required under ASC 450, Contingencies, issued by the FASB, we accrue for contingencies when we believe that a loss is probable and that we can reasonably estimate the amount of any such loss.
In October 2016, we received a letter from the United States Attorney’s Office for the Northern District of California requesting information relating to our compliance with the Trade Agreements Act. We have been fully cooperating with this ongoing inquiry and have periodically met and spoken with the United States Attorney’s Office in connection with this matter.
In December 2015, we received
$9.0 million
from a third-party for a release of claims. In addition, we agreed to a
three
-year covenant-not-to-sue. Of the
$9.0 million
consideration received,
$2.0 million
was used to offset contingent legal fees incurred in connection with the litigation and the remaining
$7.0 million
was deferred, with the short-term portion recorded as accrued liabilities and the long-term portion recorded as other liabilities in the consolidated balance sheet. The deferral is recognized ratably through 2018 as an offset to general and administrative expenses in the consolidated statement of operations.
90
Indemnification
—Under the indemnification provisions of our standard sales contracts, we agree to defend our customers against third-party claims asserting various allegations such as product defects and infringement of certain intellectual property rights, which may include patents, copyrights, trademarks or trade secrets, and to pay judgments entered on such claims. In some contracts, our exposure under these indemnification provisions is limited by the terms of the contracts to certain defined limits, such as the total amount paid by our customer under the agreement. However, certain agreements include covenants, penalties and indemnification provisions including and beyond indemnification for third-party claims of intellectual property infringement, that could potentially expose us to losses in excess of the amount received under the agreement, and in some instances to potential liability that is not contractually limited. To date, there have been
no
material awards under such indemnification provisions.
11. STOCKHOLDERS’ EQUITY
Stock-Based Compensation Plans
Our stock-based compensation plans include the 2000 Stock Plan (the “2000 Plan”), the 2008 Stock Plan (the “2008 Plan”), the 2009 Equity Incentive Plan (the “2009 Plan”) and the ESPP, as well as an equity plan assumed through the Meru acquisition. Under these plans, we have granted (or, in the case of the acquired plan, we have assumed) stock options and RSUs.
Stock Plans
—Our board of directors adopted the 2000 Plan in 2000 and the 2008 Plan in 2008. The plans include both incentive and non-statutory stock options, which allowed us to grant options to purchase common stock to employees, directors, and contractors. During 2017, 2016 and 2015, we issued
no
stock options under these plans. As of December 31, 2015,
no
shares remain available for grant under these plans.
2009
Equity Incentive
Plan
—In 2009, our board of directors approved the 2009 Plan, which includes awards of stock options, stock appreciation rights, restricted stock, RSUs and performance stock units. The maximum aggregate number of shares that may be issued under the 2009 Plan is
9.0 million
shares, plus any shares subject to stock options or similar awards granted under the 2008 Plan and the 2000 Plan that expire or otherwise terminate without having been exercised in full and shares issued pursuant to awards granted under the 2008 Plan and the 2000 Plan that are forfeited to or repurchased by us, with the maximum number of shares to be added to the 2009 Plan pursuant to such terminations, forfeitures and repurchases not to exceed
21.0 million
shares. The shares may be authorized but unissued or reacquired, common stock. The number of shares available for issuance under the 2009 Plan is increased on the first day of each year beginning with 2011, in an amount equal to the lesser of (i)
14.0 million
shares (as adjusted in connection with the stock split effected in June 2011), (ii)
5%
of the outstanding shares on the last day of the immediately preceding year or (iii) such number of shares determined by our board of directors. Under the 2009 Plan, we may grant awards to employees, directors and other service providers. In the case of an incentive stock option granted to an employee who, at the time of the grant, owns stock representing more than
10%
of the voting power of all classes of stock, the exercise price shall be no less than
110%
of the fair market value per share on the date of grant and expire
five
years from the date of grant, and options granted to any other employee, the per share exercise price shall be no less than
100%
of the closing stock price on the date of grant. In the case of a non-statutory stock option and options granted to other service providers, the per share exercise price shall be no less than
100%
of the fair market value per share on the date of grant. Options granted to individuals owning less than
10%
of the total combined voting power of all classes of stock generally have a contractual term of
seven
years and options generally vest over
four
years.
2011 Employee Stock Purchase Plan
—In June 2011, our stockholders approved the ESPP. The ESPP permits eligible employees to purchase common stock through regular, systematic payroll deductions, up to a maximum of
15%
of employees’ compensation for each purchase period at purchase prices equal to
85%
of the lesser of the fair market value of our common stock at the first trading date of the applicable offering period or the purchase date, subject to purchase limits of
4,000
shares for each purchase period or
$25,000
worth of stock for each calendar year.
Meru 2010 Equity Incentive Plan
—In connection with the Meru acquisition, we assumed and exchanged Meru’s outstanding RSUs with an estimated fair value of
$2.0 million
. Of the total estimated fair value,
$0.5 million
relating to earned equity awards was allocated to the purchase price and the remainder relating to future services is being recognized over the remaining service period. No new equity awards can be granted under the assumed plan. As of December 31, 2017, RSUs representing
584
shares of common stock were outstanding under the awards assumed through the acquisition of Meru.
91
As of December 31, 2017, there were a total of
49,869,569
shares of common stock available for grant under our stock-based compensation plans.
Restricted Stock Units
The following table summarizes the activity and related information for RSUs for the periods presented below (in thousands, except per share amounts):
|
|
Restricted Stock Units Outstanding
|
|||||
|
|
Number of Shares
|
Weighted-Average Grant Date Fair Value per Share
|
||||
|
Balance—December 31, 2014
|
6,291
|
|
$
|
22.93
|
|
|
|
Granted
|
6,303
|
|
39.04
|
|
||
|
Forfeited
|
(1,029
|
)
|
31.78
|
|
||
|
Vested
|
(2,308
|
)
|
22.74
|
|
||
|
Balance—December 31, 2015
|
9,257
|
|
32.97
|
|
||
|
Granted
|
5,551
|
|
27.96
|
|
||
|
Forfeited
|
(1,673
|
)
|
32.03
|
|
||
|
Vested
|
(3,626
|
)
|
30.45
|
|
||
|
Balance—December 31, 2016
|
9,509
|
|
31.01
|
|
||
|
Granted
|
4,200
|
|
37.60
|
|
||
|
Forfeited
|
(1,254
|
)
|
34.12
|
|
||
|
Vested
|
(3,939
|
)
|
29.42
|
|
||
|
Balance—December 31, 2017
|
8,516
|
|
$
|
34.79
|
|
|
As of
December 31, 2017
, total compensation expense related to unvested RSUs granted to employees and non-employees under the 2009 Plan, but not yet recognized, was
$249.2 million
. This expense is expected to be amortized on a straight-line basis over a weighted-average vesting period of
2.57
years.
RSUs settle into shares of common stock upon vesting. Upon the vesting of the RSUs, we net-settle the RSUs and withhold a portion of the shares to satisfy minimum statutory employee withholding taxes. Total payment for the employees’ tax obligations to the taxing authorities is reflected as a financing activity within the consolidated statements of cash flows.
The following summarizes the number and value of the shares withheld for employee taxes (in thousands):
|
Year Ended December 31,
|
|||||||||||
|
2017
|
2016
|
2015
|
|||||||||
|
Shares withheld for taxes
|
1,234
|
|
1,203
|
|
761
|
|
|||||
|
Amount withheld for taxes
|
$
|
45,137
|
|
$
|
38,266
|
|
$
|
28,871
|
|
||
Employee Stock Options
In determining the fair value of our employee stock options, we use the Black-Scholes option pricing model, which employs the following assumptions.
Expected Term
—The expected term represents the period that our stock-based awards are expected to be outstanding. We believe that we have sufficient historical experience for determining the expected term of the stock option award, and therefore, we calculated our expected term based on historical experience instead of using the simplified method.
92
Expected Volatility
—The expected volatility of our common stock is based on our weighted-average implied and historical volatility.
Fair Value of Common Stock
—The fair value of our common stock is the closing sales price of the common stock effective on the date of grant.
Risk-Free Interest Rate
—We base the risk-free interest rate on the implied yield available on U.S. Treasury zero-coupon issues with an equivalent remaining term.
Expected Dividend
—The expected dividend weighted-average assumption is
zero
.
The following table summarizes the weighted-average assumptions relating to our employee stock options:
|
|
Year Ended December 31,
|
|||||||
|
|
2017
|
2016
|
2015
|
|||||
|
Expected term in years
|
4.4
|
|
4.3
|
|
4.3
|
|
||
|
Volatility
|
36
|
%
|
42
|
%
|
39
|
%
|
||
|
Risk-free interest rate
|
1.9
|
%
|
1.1
|
%
|
1.6
|
%
|
||
|
Dividend rate
|
—
|
%
|
—
|
%
|
—
|
%
|
||
The following table summarizes the stock option activity and related information for the periods presented below (in thousands, except exercise prices and contractual life):
|
|
Options Outstanding
|
|||||||||||
|
|
Number
of Shares
|
Weighted-
Average
Exercise
Price
|
Weighted-
Average
Remaining
Contractual
Life (Years)
|
Aggregate
Intrinsic
Value
|
||||||||
|
Balance—December 31, 2014
|
10,702
|
|
$
|
14.98
|
|
|||||||
|
Granted
|
819
|
|
39.50
|
|
||||||||
|
Forfeited
|
(150
|
)
|
28.67
|
|
||||||||
|
Exercised
|
(4,403
|
)
|
11.10
|
|
||||||||
|
Balance—December 31, 2015
|
6,968
|
|
20.03
|
|
||||||||
|
Granted
|
1,468
|
|
25.65
|
|
||||||||
|
Forfeited
|
(268
|
)
|
34.82
|
|
||||||||
|
Exercised
|
(1,981
|
)
|
10.45
|
|
||||||||
|
Balance—December 31, 2016
|
6,187
|
|
23.79
|
|
|
|
||||||
|
Granted
|
555
|
|
37.34
|
|
||||||||
|
Forfeited
|
(209
|
)
|
31.75
|
|
||||||||
|
Exercised
|
(2,209
|
)
|
19.19
|
|
||||||||
|
Balance—December 31, 2017
|
4,324
|
|
$
|
27.50
|
|
|||||||
|
Options vested and expected to vest—December 31, 2017
|
4,324
|
|
$
|
27.50
|
|
3.18
|
$
|
70,853
|
|
|||
|
Options exercisable—December 31, 2017
|
2,908
|
|
$
|
25.46
|
|
2.07
|
$
|
53,569
|
|
|||
The aggregate intrinsic value represents the pre-tax difference between the exercise price of stock options and the quoted market price of our common stock on
December 31, 2017
, for all in-the-money stock options. As of
December 31, 2017
, total compensation expense related to unvested stock options granted to employees but not yet recognized was
$13.5 million
. This expense is expected to be amortized on a straight-line basis over a weighted-average period of
2.4
years.
93
Additional information related to our stock options is summarized below (in thousands, except per share amounts):
|
Year Ended December 31,
|
|||||||||||
|
2017
|
2016
|
2015
|
|||||||||
|
Weighted-average fair value per share granted
|
$
|
12.15
|
|
$
|
9.14
|
|
$
|
13.20
|
|
||
|
Intrinsic value of options exercised
|
42,666
|
|
40,306
|
|
113,786
|
|
|||||
|
Fair value of options vested
|
8,102
|
|
5,444
|
|
10,943
|
|
|||||
The following table summarizes information about outstanding and exercisable stock options as of
December 31, 2017
, as follows (in thousands, except exercise prices and contractual life):
|
|
Options Outstanding
|
Options Exercisable
|
||||||||||||||
|
Range of Exercise Prices
|
Number
Outstanding
|
Weighted-
Average
Remaining
Contractual
Life (Years)
|
Weighted-
Average
Exercise
Price
|
Number
Exercisable
|
Weighted-
Average
Exercise
Price
|
|||||||||||
|
$19.94–19.94
|
29
|
|
2.85
|
$
|
19.94
|
|
29
|
|
$
|
19.94
|
|
|||||
|
20.13–24.92
|
2,164
|
|
2.79
|
22.43
|
|
1,596
|
|
21.94
|
|
|||||||
|
26.49–26.70
|
912
|
|
1.18
|
26.70
|
|
906
|
|
26.70
|
|
|||||||
|
31.39–33.31
|
461
|
|
4.80
|
32.71
|
|
239
|
|
32.79
|
|
|||||||
|
36.70–48.83
|
758
|
|
5.72
|
40.13
|
|
138
|
|
46.56
|
|
|||||||
|
4,324
|
|
2,908
|
|
|||||||||||||
Employee Stock Purchase Plan
In determining the fair value of the ESPP, we use the Black-Scholes option pricing model that employs the following weighted-average assumptions:
|
Year Ended December 31,
|
||||||||
|
2017
|
2016
|
2015
|
||||||
|
Expected term in years
|
0.5
|
|
0.5
|
|
0.5
|
|
||
|
Volatility
|
29
|
%
|
39
|
%
|
30
|
%
|
||
|
Risk-free interest rate
|
0.9
|
%
|
0.4
|
%
|
0.2
|
%
|
||
|
Dividend rate
|
—
|
%
|
—
|
%
|
—
|
%
|
||
Additional information related to the ESPP is provided below (in thousands, except per share amounts):
|
Year Ended December 31,
|
|||||||||||
|
2017
|
2016
|
2015
|
|||||||||
|
Weighted-average fair value per share granted
|
$
|
8.73
|
|
$
|
7.68
|
|
$
|
9.56
|
|
||
|
Shares issued under the ESPP
|
1,135
|
|
1,151
|
|
764
|
|
|||||
|
Weighted-average price per share issued
|
$
|
29.52
|
|
$
|
21.01
|
|
$
|
24.30
|
|
||
94
Shares Reserved for Future Issuances
The following table presents the common stock reserved for future issuance (in thousands):
|
December 31,
2017 |
||
|
Outstanding stock options and RSUs
|
12,840
|
|
|
Reserved for future equity award grants
|
46,939
|
|
|
Reserved for future ESPP issuances
|
2,931
|
|
|
Total common stock reserved for future issuances
|
62,710
|
|
Stock-based Compensation Expense
Stock-based compensation expense is included in costs and expenses as follows (in thousands):
|
|
Year Ended December 31,
|
||||||||||
|
|
2017
|
2016
|
2015
|
||||||||
|
Cost of product revenue
|
$
|
1,380
|
|
$
|
1,200
|
|
$
|
973
|
|
||
|
Cost of service revenue
|
9,503
|
|
8,771
|
|
7,121
|
|
|||||
|
Research and development
|
32,194
|
|
30,120
|
|
24,555
|
|
|||||
|
Sales and marketing
|
77,994
|
|
68,113
|
|
49,436
|
|
|||||
|
General and administrative
|
16,112
|
|
14,219
|
|
13,003
|
|
|||||
|
Total stock-based compensation expense
|
$
|
137,183
|
|
$
|
122,423
|
|
$
|
95,088
|
|
||
The following table summarizes stock-based compensation expense by award type (in thousands):
|
|
Year Ended December 31,
|
||||||||||
|
|
2017
|
2016
|
2015
|
||||||||
|
RSUs
|
$
|
119,764
|
|
$
|
107,124
|
|
$
|
77,262
|
|
||
|
Stock options
|
7,341
|
|
6,596
|
|
11,425
|
|
|||||
|
ESPP
|
10,078
|
|
8,703
|
|
6,401
|
|
|||||
|
Total stock-based compensation expense
|
$
|
137,183
|
|
$
|
122,423
|
|
$
|
95,088
|
|
||
Total income tax benefit associated with stock-based compensation that is recognized in the consolidated statements of operations is as follows (in thousands):
|
Year Ended December 31,
|
|||||||||||
|
2017
|
2016
|
2015
|
|||||||||
|
Income tax benefit associated with stock-based compensation
|
$
|
30,943
|
|
$
|
29,190
|
|
$
|
25,189
|
|
||
Share Repurchase Program
In January 2016, our board of directors approved the Share Repurchase Program (the “Repurchase Program”), which authorized the repurchase of up to
$200.0 million
of our outstanding common stock through December 31, 2017. In 2016 and 2017, our board of directors approved the increases in the aggregate authorized repurchase amount under the Repurchase Program by
$100.0 million
and
$700.0 million
, respectively, to a total of
$1.0 billion
. Under the Repurchase Program, share repurchases may be made by us from time to time in privately negotiated transactions or in open market transactions. The Repurchase Program does not require us to purchase a minimum number of shares, and may be suspended, modified or discontinued at any time without prior notice. In 2017, we repurchased
11.2 million
shares of common stock under the Repurchase Program in open market transactions for an aggregate purchase price of
$446.3 million
. As of December 31, 2017,
$442.8 million
remained available for future share repurchases under the Repurchase Program.
95
12. INCOME TAXES
Income before income taxes consisted of the following (in thousands):
|
Year Ended December 31,
|
|||||||||||
|
|
2017
|
2016
|
2015
|
||||||||
|
Domestic
|
$
|
(40,709
|
)
|
$
|
(49,707
|
)
|
$
|
(37,437
|
)
|
||
|
Foreign
|
164,703
|
|
92,855
|
|
54,442
|
|
|||||
|
Total income before income taxes
|
$
|
123,994
|
|
$
|
43,148
|
|
$
|
17,005
|
|
||
The provision for income taxes consisted of the following (in thousands):
|
Year Ended December 31,
|
|||||||||||
|
|
2017
|
2016
|
2015
|
||||||||
|
Current:
|
|||||||||||
|
Federal
|
$
|
34,739
|
|
$
|
7,904
|
|
$
|
9,864
|
|
||
|
State
|
816
|
|
803
|
|
(136
|
)
|
|||||
|
Foreign
|
27,688
|
|
17,829
|
|
13,683
|
|
|||||
|
Total current
|
$
|
63,243
|
|
$
|
26,536
|
|
$
|
23,411
|
|
||
|
Deferred:
|
|||||||||||
|
Federal
|
$
|
39,103
|
|
$
|
(10,037
|
)
|
$
|
(9,383
|
)
|
||
|
State
|
(9,333
|
)
|
(4,861
|
)
|
(2,988
|
)
|
|||||
|
Foreign
|
(418
|
)
|
(677
|
)
|
(2,022
|
)
|
|||||
|
Total deferred
|
29,352
|
|
(15,575
|
)
|
(14,393
|
)
|
|||||
|
Provision for income taxes
|
$
|
92,595
|
|
$
|
10,961
|
|
$
|
9,018
|
|
||
The provision for income taxes differs from the amount computed by applying the statutory federal income tax rate as follows (in thousands):
|
Year Ended December 31,
|
|||||||||||
|
|
2017
|
2016
|
2015
|
||||||||
|
Tax at federal statutory tax rate
|
$
|
43,398
|
|
$
|
15,096
|
|
$
|
5,951
|
|
||
|
Foreign income taxed at different rates
|
(19,536
|
)
|
(13,681
|
)
|
(11,225
|
)
|
|||||
|
Foreign withholding taxes
|
17,445
|
|
14,998
|
|
10,962
|
|
|||||
|
Stock-based compensation expense
|
9,502
|
|
10,010
|
|
6,369
|
|
|||||
|
Foreign tax credit
|
(12,795
|
)
|
(34,992
|
)
|
(6,901
|
)
|
|||||
|
State taxes—net of federal benefit
|
(3,505
|
)
|
(4,252
|
)
|
(2,454
|
)
|
|||||
|
Research and development credit
|
(4,009
|
)
|
(2,713
|
)
|
(3,529
|
)
|
|||||
|
Dividend distribution
|
—
|
|
27,295
|
|
9,647
|
|
|||||
|
Impact of the 2017 Tax Act:
|
|||||||||||
|
Deferred tax asset remeasurement due to reduction in the federal corporate income tax rate
|
47,878
|
|
—
|
|
—
|
|
|||||
|
One-time transition tax
|
15,222
|
|
—
|
|
—
|
|
|||||
|
Other
|
(1,005
|
)
|
(800
|
)
|
198
|
|
|||||
|
Total provision for income taxes
|
$
|
92,595
|
|
$
|
10,961
|
|
$
|
9,018
|
|
||
96
Significant permanent differences arise from the portion of stock-based compensation expense that is not expected to generate a tax deduction, such as stock-based compensation expense on stock option grants to certain foreign employees, offset by the actual tax benefits in the current periods from disqualifying dispositions of shares held by our U.S. employees. For stock options exercised by our U.S. employees, we receive an income tax benefit calculated as the difference between the fair market value of the stock issued at the time of the exercise and the option price, tax effected. In 2017, the excess tax benefits of
$13.5 million
were recognized in income tax provision due to the adoption of ASU 2016-09. In 2016, the excess tax benefits of
$10.8 million
were recognized in income tax provision. For 2015, income tax payable was reduced by excess tax benefits from the exercise or vesting of stock-based awards of
$1.3 million
.
In December 2017, the U.S. federal government enacted the Tax Cuts and Jobs Act (the “2017 Tax Act”). The 2017 Tax Act reduced the U.S. federal corporate income tax rate from 35% to 21% effective January 1, 2018 and created a territorial tax system with a one-time mandatory tax on foreign earnings of U.S. subsidiaries not previously subject to U.S. income tax. Under GAAP, changes in tax rates and tax law are accounted for in the period of enactment and deferred tax assets and liabilities are measured at the enacted tax rate.
The Securities and Exchange Commission (“SEC”) staff issued Staff Accounting Bulletin No. 118 (“SAB 118”), which provides guidance on accounting for the tax effects of the 2017 Tax Act. SAB 118 provides a measurement period that should not extend beyond one year from the 2017 Tax Act enactment date for companies to complete the accounting under ASC 740. In accordance with SAB 118, a company must reflect the income tax effects of those aspects of the 2017 Tax Act for which the accounting under ASC 740 is complete. To the extent that a company’s accounting for certain income tax effects of the 2017 Tax Act is incomplete but it is able to determine a reasonable estimate, it must record a provisional estimate in the financial statements. If a company cannot determine a provisional estimate to be included in the financial statements, it should continue to apply ASC 740 on the basis of the provisions of the tax laws that were in effect immediately before the enactment of the 2017 Tax Act.
Consistent with the guidance issued by the SEC, which provides for a measurement period of one year from the enactment date to finalize the accounting for effects of the 2017 Tax Act, we provisionally recorded a
$47.9 million
expense on the remeasurement of deferred tax assets due to the reduction of federal corporate income tax rate, and a
$15.2 million
expense for the one-time transition tax on deemed repatriation. We are able to make a reasonable estimate of the transition tax. However, we are continuing to gather additional information to more precisely compute the amount of the transition tax.
The 2017 Tax Act creates a new requirement that global intangible low-taxed income (“GILTI”) earned by controlled foreign corporations (“CFCs”) must be included currently in the gross income of the CFCs’ U.S. shareholder. Because of the complexity of the new GILTI tax rules, we are continuing to evaluate this provision of the 2017 Tax Act and the application of ASC 740. Under GAAP, we are allowed to make an accounting policy choice of either (1) treating taxes due on future U.S. inclusions in taxable income related to GILTI as a current-period expense when incurred (the “period cost method”) or (2) factoring such amounts into a company’s measurement of its deferred taxes (the “deferred method”). Our selection of an accounting policy with respect to the new GILTI tax rules will depend, in part, on analyzing our global income to determine whether we expect to have future U.S. inclusions in taxable income related to GILTI and, if so, what the impact is expected to be. We have not yet made any adjustments related to potential GILTI tax in our financial statements and have not made a policy decision regarding whether to record deferred taxes on GILTI.
During 2016, we repatriated
$55.0 million
of foreign earnings and profits. A decision was made to bring this cash back to the United States as it carried a foreign tax credit of
$22.3 million
. Our 2015 income tax provision reflected a
$1.2 million
tax benefit due to a recent U.S. Tax Court opinion involving an independent third party filed on July 27, 2015. Based on the findings of the U.S. Tax Court, we recognized the tax benefit for excluding the share-based compensation from intercompany charges in prior periods. During 2015, we completed a corporate reorganization to convert our Canadian company to a branch of our U.S. company resulting on a
$27.6 million
deemed dividend distribution. The tax impact of the Canadian deemed dividend distribution of
$9.6 million
was partially offset by an additional tax benefit of
$6.4 million
due to the deferred tax benefit of the Canadian stock based compensation expense.
97
The tax effects of temporary differences that give rise to significant portions of the deferred tax assets as of the years ended are presented below (in thousands):
|
|
December 31,
2017 |
December 31,
2016 |
|||||
|
Deferred tax assets:
|
|||||||
|
General business credit carryforward
|
$
|
49,854
|
|
$
|
62,705
|
|
|
|
Deferred revenue
|
37,432
|
|
41,877
|
|
|||
|
Nondeductible reserves and accruals
|
22,966
|
|
27,029
|
|
|||
|
Net operating loss carryforward
|
15,670
|
|
24,348
|
|
|||
|
Stock-based compensation expense
|
12,265
|
|
20,943
|
|
|||
|
Depreciation and amortization
|
8,753
|
|
5,776
|
|
|||
|
Other
|
(8
|
)
|
67
|
|
|||
|
Total deferred tax assets
|
$
|
146,932
|
|
$
|
182,745
|
|
|
In assessing the realizability of deferred tax assets, we considered whether it is more likely than not that some portion or all of our deferred tax assets will be realized. This realization is dependent upon the generation of future taxable income during the periods in which those temporary differences become deductible. We concluded that it is more likely than not that we would be able to realize the benefits of our deferred tax assets in the future.
As of
December 31, 2017
, we had
$42.4 million
in federal net operating loss carryforwards to offset future income, which is limited by Section 382 of the Internal Revenue Code (“Section 382”) due to the acquisition of Meru and AccelOps. With the acquisition of Meru, we had
$22.6 million
in federal net operating loss carryforwards which is limited by Section 382 available from year 2020. With the acquisition of AccelOps, we had
$19.9 million
in federal net operating loss carryforwards which is limited by Section 382 available from year 2016. We had
$25.6 million
federal tax credits to offset future federal taxes. As of
December 31, 2017
, we had
$36.7 million
in California net operating loss carryforwards. With the acquisition of Meru and AccelOps, we also had
$22.1 million
and
$14.6 million
in California net operating loss carryforwards, respectively, which is subject to Section 382 limitation. We had state tax credit carryforwards of
$21.7 million
available to offset our future state taxes. The state credits carry forward indefinitely.
We have analyzed our global working capital and cash requirements and the potential tax liabilities attributable to a repatriation, and have determined that we will be repatriating certain unremitted foreign earnings which was previously deemed indefinitely reinvested. For those investments from which we were able to make a reasonable estimate of the tax effects of such repatriation, we have recorded a provisional estimate for withholding and state taxes. For those investments from which we were not able to make a reasonable estimate, we have not recorded any deferred taxes. We will record the tax effects of any change in our prior assertion with respect to these investments, and disclose any unrecognized deferred tax liability for temporary differences related to our foreign investments, if practicable, in the period that we are first able to make a reasonable estimate, no later than December 2018.
We operate under a tax incentive agreement in Singapore, which is effective through December 31, 2021, and may be extended if certain additional requirements are satisfied. The tax incentive agreement is conditional upon our meeting certain employment and investment thresholds.
As of
December 31, 2017
, we had
$72.5 million
of unrecognized tax benefits, of which, if recognized,
$70.8 million
would favorably affect our effective tax rate. Our policy is to include accrued interest and penalties related to uncertain tax benefits in income tax expense. As of
December 31, 2017
, 2016 and 2015, accrued interest and penalties were
$13.5 million
,
$9.5 million
and
$5.5 million
, respectively.
98
The aggregate changes in the balance of unrecognized tax benefits are as follows (in thousands):
|
|
Year Ended December 31,
|
||||||||||
|
|
2017
|
2016
|
2015
|
||||||||
|
Unrecognized tax benefits, beginning of year
|
$
|
65,534
|
|
$
|
59,672
|
|
$
|
44,151
|
|
||
|
Gross increases for tax positions related to the current year
|
13,166
|
|
4,837
|
|
17,478
|
|
|||||
|
Gross decreases for tax positions related to the current year
|
(10,747
|
)
|
—
|
|
—
|
|
|||||
|
Gross increases for tax positions related to the prior year
|
7,049
|
|
1,762
|
|
8,319
|
|
|||||
|
Gross decreases for tax positions related to prior year
|
(874
|
)
|
(737
|
)
|
(9,207
|
)
|
|||||
|
Gross decreases for tax positions related to expiration of statute of limitations
|
(1,584
|
)
|
—
|
|
(1,069
|
)
|
|||||
|
Unrecognized tax benefits, end of year
|
$
|
72,544
|
|
$
|
65,534
|
|
$
|
59,672
|
|
||
As of
December 31, 2017
, 2016 and 2015,
$90.2 million
,
$68.6 million
and
$60.6 million
, respectively, of the amounts reflected above were recorded as Income tax liabilities—non-current in our consolidated balance sheet.
It is reasonably possible that our gross unrecognized tax benefits will decrease by up to
$12.0 million
in the next 12 months, primarily due to the lapse of the statute of limitations and audit settlement. These adjustments, if recognized, would positively impact our effective tax rate, and would be recognized as additional tax benefits.
We file income tax returns in the U.S. federal jurisdiction and in various U.S. state and foreign jurisdictions. Generally, we are no longer subject to U.S. state and non-U.S. income tax examinations by tax authorities for tax years prior to 2009. We are no longer subject to examination by U.S federal income tax authorities for tax years prior to 2012. We have closed the Internal Revenue Service audit for tax years 2012, 2013 and 2014 at the field level. This audit included a refund claim for
$6.5 million
, which was approved in the audit process. This refund claim was sent to the Joint Committee in Washington for the final review on January 18, 2018, and was approved on January 31, 2018 and will result in a benefit to the tax provision in 2018 by approximately
$3.0 million
. In addition, the tax authorities in France are examining the intercompany relationship between Fortinet, Inc., Fortinet France and Fortinet Singapore. In May 2017, we received a notice from the French tax authorities that an audit was officially opened for tax years from 2007 to 2015.
13. DEFINED CONTRIBUTION PLANS
Our tax-deferred savings plan under our 401(k) Plan, permits participating employees to defer a portion of their pre-tax earnings. In Canada, we have a Group Registered Retirement Savings Plan Program (the “RRSP”), which permits participants to make tax deductible contributions. Our board of directors approved
50%
matching contributions on employee contributions up to
4%
of each employee’s eligible earnings. Our matching contributions to our 401(k) Plan and the RRSP for
2017
,
2016
and 2015 were
$4.7 million
,
$4.4 million
and
$3.5 million
, respectively.
14. SEGMENT INFORMATION
Operating segments are defined as components of an enterprise about which separate financial information is available that is evaluated regularly by the chief operating decision maker in deciding how to allocate resources and in assessing performance. Our chief operating decision maker is our chief executive officer. Our chief executive officer reviews financial information presented on a consolidated basis, accompanied by information about revenue by geographic region for purposes of allocating resources and evaluating financial performance. We have
one
business activity, and there are
no
segment managers who are held accountable for operations, operating results and plans for levels or components below the consolidated unit level. Accordingly, we have determined that we have
one
operating segment, and therefore,
one
reportable segment.
99
Revenue by geographic region is based on the billing address of the customer. The following tables set forth revenue and property and equipment—net by geographic region (in thousands):
|
|
Year Ended December 31,
|
||||||||||
|
Revenue
|
2017
|
2016
|
2015
|
||||||||
|
Americas:
|
|||||||||||
|
United States
|
$
|
496,967
|
|
$
|
426,406
|
|
$
|
347,905
|
|
||
|
Latin America (“LATAM”)
|
92,081
|
|
66,026
|
|
54,124
|
|
|||||
|
Canada
(1)
|
53,283
|
|
44,274
|
|
33,253
|
|
|||||
|
Total Americas
|
642,331
|
|
536,706
|
|
435,282
|
|
|||||
|
Europe, Middle East and Africa (“EMEA”)
|
554,569
|
|
477,393
|
|
366,018
|
|
|||||
|
Asia Pacific (“APAC”)
|
298,030
|
|
261,344
|
|
207,968
|
|
|||||
|
Total revenue
|
$
|
1,494,930
|
|
$
|
1,275,443
|
|
$
|
1,009,268
|
|
||
(1)
Certain amounts in the prior periods in Canada were reclassified to the United States to conform with the 2017 presentation as a result of a change in the bill-to address of a customer.
|
Property and Equipment
—
net
|
December 31,
2017 |
December 31,
2016 |
|||||
|
Americas:
|
|||||||
|
United States
|
$
|
115,606
|
|
$
|
96,414
|
|
|
|
Canada
|
103,787
|
|
12,881
|
|
|||
|
LATAM
|
342
|
|
607
|
|
|||
|
Total Americas
|
219,735
|
|
109,902
|
|
|||
|
EMEA:
|
|||||||
|
France
|
11,846
|
|
13,241
|
|
|||
|
Other EMEA
|
5,836
|
|
6,391
|
|
|||
|
Total EMEA
|
17,682
|
|
19,632
|
|
|||
|
APAC
|
7,978
|
|
7,715
|
|
|||
|
Total property and equipment—net
|
$
|
245,395
|
|
$
|
137,249
|
|
|
15. ACCUMULATED OTHER COMPREHENSIVE LOSS
The following table summarizes the changes in accumulated balances of other comprehensive loss for
2017
and
2016
(in thousands):
|
December 31, 2017
|
|||||||||||
|
Unrealized Losses on Investments
|
Tax provision related to unrealized gains or losses on investments
|
Total
|
|||||||||
|
Beginning balance
|
$
|
(1,179
|
)
|
$
|
414
|
|
$
|
(765
|
)
|
||
|
Other comprehensive loss before reclassifications
|
(938
|
)
|
248
|
|
(690
|
)
|
|||||
|
Amounts reclassified from accumulated other comprehensive loss
|
845
|
|
(237
|
)
|
608
|
|
|||||
|
Net current-period other comprehensive loss
|
(93
|
)
|
11
|
|
(82
|
)
|
|||||
|
Ending balance
|
$
|
(1,272
|
)
|
$
|
425
|
|
$
|
(847
|
)
|
||
100
|
December 31, 2016
|
|||||||||||
|
Unrealized Losses on Investments
|
Tax provision related to unrealized gains or losses on investments
|
Total
|
|||||||||
|
Beginning balance
|
$
|
(1,437
|
)
|
$
|
504
|
|
$
|
(933
|
)
|
||
|
Other comprehensive income before reclassifications
|
255
|
|
(89
|
)
|
166
|
|
|||||
|
Amounts reclassified from accumulated other comprehensive loss
|
3
|
|
(1
|
)
|
2
|
|
|||||
|
Net current-period other comprehensive income
|
258
|
|
(90
|
)
|
168
|
|
|||||
|
Ending balance
|
$
|
(1,179
|
)
|
$
|
414
|
|
$
|
(765
|
)
|
||
Amounts reclassified from accumulated other comprehensive loss for unrealized losses on investments and tax provision related to unrealized gains or losses on investments are recorded in Other income (expense)—net and in Provision for income taxes, respectively.
16. RELATED PARTY TRANSACTIONS
The son of one member of our board of directors is a partner of an outside law firm that we utilize for certain complex litigation matters. Expenses for legal services provided by the law firm related to matters that arose subsequent to the member joining our board of directors were
$1.1 million
,
$0.4 million
and
$7.2 million
in 2017, 2016 and 2015, respectively. Of such amounts,
$2.5 million
was incurred under contingent fee arrangements in 2015. There were no expenses incurred under contingent fee arrangements in 2017 and 2016. Amounts due and payable to the law firm were
$0.2 million
and
$0.1 million
as of December 31, 2017 and December 31, 2016, respectively.
101
None.
Evaluation of Disclosure Controls and Procedures
Our management, with the participation of our chief executive officer and chief financial officer, evaluated the effectiveness of our disclosure controls and procedures (as defined in Rule 13a-15(e) or 15d-15(e) under the Securities Exchange Act of 1934 (the “Exchange Act”) as of the end of the period covered by this Annual Report on Form 10-K. In designing and evaluating the disclosure controls and procedures, management recognized that any controls and procedures, no matter how well designed and operated, can provide only reasonable assurance of achieving the desired control objectives. In addition, the design of disclosure controls and procedures must reflect the fact that there are resource constraints and that management is required to apply its judgment in evaluating the benefits of possible controls and procedures relative to their costs.
Based on that evaluation, our chief executive officer and chief financial officer concluded that our disclosure controls and procedures were effective as of
December 31, 2017
to provide reasonable assurance that information we are required to disclose in reports that we file or submit under the Exchange Act is recorded, processed, summarized and reported within the time periods specified in SEC rules and forms, and that such information is accumulated and communicated to our management, including our chief executive officer and chief financial officer, as appropriate, to allow timely decisions regarding required disclosure.
Management
’
s Report on Internal Control Over Financial Reporting
Our management is responsible for establishing and maintaining adequate internal control over financial reporting, as defined in Rule 13a-15(f) and 15d-15(f) under the Exchange Act. Management conducted an evaluation of the effectiveness of our internal control over financial reporting based on the framework in
Internal Control—Integrated Framework (2013)
set forth by the Committee of Sponsoring Organizations of the Treadway Commission.
Based on this evaluation, management concluded that our internal control over financial reporting was effective as of
December 31, 2017
. Management reviewed the results of its assessment with our Audit Committee. The effectiveness of our internal control over financial reporting as of
December 31, 2017
has been audited by Deloitte & Touche LLP, an independent registered public accounting firm, as stated in its report, which appears in this Item under the heading “Report of Independent Registered Public Accounting Firm.”
Changes in Internal Control over Financial Reporting
There were no changes in our internal control over financial reporting (as defined in Rules 13a-15(f) or 15d-15(f) under the Exchange Act) during the fourth quarter of
2017
that have materially affected, or are reasonably likely to materially affect, our internal control over financial reporting.
102
REPORT OF INDEPENDENT REGISTERED PUBLIC ACCOUNTING FIRM
To the Shareholders and Board of Directors of Fortinet, Inc.
Opinion on Internal Control over Financial Reporting
We have audited the internal control over financial reporting of Fortinet, Inc. and subsidiaries (the “Company”) as of December 31, 2017, based on criteria established in
Internal Control
—
Integrated Framework (2013)
issued by the Committee of Sponsoring Organizations of the Treadway Commission (COSO). In our opinion, the Company maintained, in all material respects, effective internal control over financial reporting as of December 31, 2017, based on the criteria established in
Internal Control — Integrated Framework (2013)
issued by the COSO.
We have also audited, in accordance with the standards of the Public Company Accounting Oversight Board (United States) (PCAOB), the consolidated financial statements and financial statement schedule as of and for the year ended December 31, 2017, of the Company and our report dated
February 26, 2018
, expressed an unqualified opinion on those financial statements and financial statement schedule.
Basis for Opinion
The Company’s management is responsible for maintaining effective internal control over financial reporting and for its assessment of the effectiveness of internal control over financial reporting, included in the accompanying Management’s Report on Internal Control over Financial Reporting. Our responsibility is to express an opinion on the Company’s internal control over financial reporting based on our audit. We are a public accounting firm registered with the PCAOB and are required to be independent with respect to the Company in accordance with the U.S. federal securities laws and the applicable rules and regulations of the Securities and Exchange Commission and the PCAOB.
We conducted our audit in accordance with the standards of the PCAOB. Those standards require that we plan and perform the audit to obtain reasonable assurance about whether effective internal control over financial reporting was maintained in all material respects. Our audit included obtaining an understanding of internal control over financial reporting, assessing the risk that a material weakness exists, testing and evaluating the design and operating effectiveness of internal control based on the assessed risk, and performing such other procedures as we considered necessary in the circumstances. We believe that our audit provides a reasonable basis for our opinion.
A company’s internal control over financial reporting is a process designed by, or under the supervision of, the company’s principal executive and principal financial officers, or persons performing similar functions, and effected by the company’s board of directors, management, and other personnel to provide reasonable assurance regarding the reliability of financial reporting and the preparation of financial statements for external purposes in accordance with generally accepted accounting principles. A company’s internal control over financial reporting includes those policies and procedures that (1) pertain to the maintenance of records that, in reasonable detail, accurately and fairly reflect the transactions and dispositions of the assets of the company; (2) provide reasonable assurance that transactions are recorded as necessary to permit preparation of financial statements in accordance with generally accepted accounting principles, and that receipts and expenditures of the company are being made only in accordance with authorizations of management and directors of the company; and (3) provide reasonable assurance regarding prevention or timely detection of unauthorized acquisition, use, or disposition of the company's assets that could have a material effect on the financial statements.
Because of the inherent limitations of internal control over financial reporting, including the possibility of collusion or improper management override of controls, material misstatements due to error or fraud may not be prevented or detected on a timely basis. Also, projections of any evaluation of the effectiveness of the internal control over financial reporting to future periods are subject to the risk that the controls may become inadequate because of changes in conditions, or that the degree of compliance with the policies or procedures may deteriorate.
/s/
DELOITTE & TOUCHE LLP
San Jose, California
February 26, 2018
103
None.
Information responsive to this item is incorporated herein by reference to our definitive proxy statement with respect to our
2018
Annual Meeting of Stockholders to be filed with the SEC within 120 days after the end of the fiscal year covered by this Annual Report on Form 10-K.
As part of our system of corporate governance, our board of directors has adopted a code of business conduct and ethics. The code applies to all of our employees, officers (including our principal executive officer, principal financial officer, principal accounting officer or controller, or persons performing similar functions), agents and representatives, including our independent directors and consultants, who are not our employees, with regard to their Fortinet-related activities. Our code of business conduct and ethics is available on our website at www.fortinet.com under “Corporate—Investor Relations—Corporate Governance.” We will post on this section of our website any amendment to our code of business conduct and ethics, as well as any waivers of our code of business conduct and ethics, that are required to be disclosed by the rules of the SEC or the Nasdaq Stock Market.
Information responsive to this item is incorporated herein by reference to our definitive proxy statement with respect to our
2018
Annual Meeting of Stockholders to be filed with the SEC within 120 days after the end of the fiscal year covered by this Annual Report on Form 10-K.
Information responsive to this item is incorporated herein by reference to our definitive proxy statement with respect to our
2018
Annual Meeting of Stockholders to be filed with the SEC within 120 days after the end of the fiscal year covered by this Annual Report on Form 10-K.
Information responsive to this item is incorporated herein by reference to our definitive proxy statement with respect to our
2018
Annual Meeting of Stockholders to be filed with the SEC within 120 days after the end of the fiscal year covered by this Annual Report on Form 10-K.
Information responsive to this item is incorporated herein by reference to our definitive proxy statement with respect to our
2018
Annual Meeting of Stockholders to be filed with the SEC within 120 days after the end of the fiscal year covered by this Annual Report on Form 10-K.
104
(a) The following documents are filed as part of this Annual Report on Form 10-K:
|
1.
|
Financial Statements:
The information concerning Fortinet’s financial statements and the Report of Independent Registered Public Accounting Firm required by this Item 15(a)(1) is incorporated by reference herein to the section of this Annual Report on Form 10-K in Part II, Item 8, titled “Financial Statements and Supplementary Data.”
|
|
2.
|
Financial Statement Schedule:
The following financial statement schedule of Fortinet, Inc., for the fiscal years ended December 31, 2017, 2016 and 2015, is filed as part of this Annual Report on Form 10-K and should be read in conjunction with our consolidated financial statements.
|
105
SCHEDULE II—VALUATION AND QUALIFYING ACCOUNTS
|
|
Year Ended December 31,
|
||||||||||
|
|
2017
|
2016
|
2015
|
||||||||
|
|
(in thousands)
|
||||||||||
|
Sales Returns Reserve and Allowance for Doubtful Accounts:
|
|||||||||||
|
Beginning balance
|
$
|
11,235
|
|
$
|
6,228
|
|
$
|
6,204
|
|
||
|
Charged to costs and expenses, net of deductions
|
3,268
|
|
5,007
|
|
24
|
|
|||||
|
Ending balance
|
$
|
14,503
|
|
$
|
11,235
|
|
$
|
6,228
|
|
||
Schedules not listed above have been omitted because they are not applicable or are not required or the information required to be set forth therein is included in the consolidated financial statements or notes thereto.
|
3.
|
Exhibits
: See Item 15(b) below. We have filed, or incorporated into this Annual Report on Form 10-K by reference, the exhibits listed on the accompanying Exhibit Index immediately preceding the signature page of this Annual Report on Form 10-K.
|
(b) Exhibits:
The exhibit list in the Exhibit Index immediately preceding the signature page of this Annual Report on Form 10-K is incorporated herein by reference as the list of exhibits required by this Item 15(b).
(c) Financial Statement Schedules: See Item 15(a) above.
106
EXHIBIT INDEX
|
Exhibit
Number
|
Description
|
Incorporated by reference herein
|
||||||
|
Form
|
Date
|
Exhibit
Number
|
||||||
|
Amended and Restated Certificate of Incorporation
|
Registration Statement on Form S-l (File No. 333-161190)
|
August 10, 2009
|
3.2
|
|||||
|
Bylaws
|
Current Report on Form 8-K (File No. 001-34511)
|
April 21, 2014
|
3.1
|
|||||
|
Specimen common stock certificate of the Company
|
Registration Statement on Form S-l, as amended (File No. 333-161190)
|
November 2, 2009
|
4.1
|
|||||
|
10.1
†
|
Forms of Indemnification Agreement between the Company and its directors and officers
|
Registration Statement on Form S-l (File No. 333-161190)
|
August 10, 2009
|
10.1
|
||||
|
10.2
†
|
2000 Stock Plan and forms of agreement thereunder
|
Registration Statement on Form S-l (File No. 333-161190)
|
August 10, 2009
|
10.2
|
||||
|
10.3
†
|
2008 Stock Plan and forms of agreement thereunder
|
Registration Statement on Form S-l (File No. 333-161190)
|
August 10, 2009
|
10.3
|
||||
|
10.4
†
|
2009 Equity Incentive Plan and forms of restricted stock unit award and restricted stock agreement thereunder
|
Registration Statement on Form S-l (File No. 333-161190)
|
August 10, 2009
|
10.4
|
||||
|
10.5
†
|
Forms of stock option agreement under 2009 Equity Incentive Plan
|
Annual Report on Form 10-K (File No. 001-34511)
|
February 28, 2012
|
10.5
|
||||
|
10.6
†
|
Form of performance stock unit award agreement under 2009 Equity Incentive Plan
|
Quarterly Report on Form 10-Q (File No. 001-34511)
|
August 6, 2013
|
99.1
|
||||
|
10.7
†
|
Forms of restricted stock unit award and performance stock unit award agreement under 2009 Equity Incentive Plan (Additional Forms)
|
Annual Report on Form 10-K (File No. 001-34511)
|
March 2, 2015
|
10.7
|
||||
|
10.8
†
|
Fortinet, Inc. 2011 Employee Stock Purchase Plan
|
Current Report on Form 8-K (File No. 001-34511)
|
June 27, 2011
|
10.1
|
||||
|
10.9
†
|
Meru Networks, Inc. 2010 Equity Incentive Plan
|
Registration Statement on Form S-8 (File No. 333-205958)
|
July 30, 2015
|
99.1
|
||||
|
10.10
†
|
Meru Networks, Inc. 2013 New Employee Stock Inducement Plan
|
Registration Statement on Form S-8 (File No. 333-205958)
|
July 30, 2015
|
99.2
|
||||
|
10.11
†
|
Forms of Fortinet, Inc. Restricted Stock Unit Assumption Agreement
|
Registration Statement on Form S-8 (File No. 333-205958)
|
July 30, 2015
|
99.3
|
||||
|
10.12
†
|
Fortinet, Inc. Bonus Plan
|
Current Report on Form 8-K (File No. 001-34511)
|
January 26, 2010
|
10.1
|
||||
|
10.13
†
|
Fortinet, Inc. Cash and Equity Incentive Plan
|
Quarterly Report on Form 10-Q (File No. 001-34511)
|
November 5, 2013
|
10.1
|
||||
|
10.14
†
|
Form of Change of Control Agreement between the Company and its directors
|
Quarterly Report on Form 10-Q (File No. 001-34511)
|
August 4, 2015
|
10.1
|
||||
|
10.15
†
|
Amended and Restated Change of Control Agreement, dated as of February 4, 2016, between the Company and Ken Xie
|
Annual Report on Form 10-K (File No. 001-34511)
|
February 26, 2016
|
10.15
|
||||
|
10.16
†
|
Amended and Restated Change of Control Agreement, dated as of February 4, 2016, between the Company and Michael Xie
|
Annual Report on Form 10-K (File No. 001-34511)
|
February 26, 2016
|
10.16
|
||||
|
10.17
†
|
Amended and Restated Change of Control Agreement, dated as of February 4, 2016, between the Company and John Whittle
|
Annual Report on Form 10-K (File No. 001-34511)
|
February 26, 2016
|
10.17
|
||||
|
10.18
†
|
Amended and Restated Change of Control Agreement, dated as of February 4, 2016, between the Company and Andrew Del Matto
|
Annual Report on Form 10-K (File No. 001-34511)
|
February 26, 2016
|
10.18
|
||||
107
|
10.19
†
|
Offer Letter, dated as of August 31, 2007, by and between the Company and John Whittle
|
Registration Statement on Form S-l, as amended (File No. 333-161190)
|
August 10, 2009
|
10.10
|
||||
|
10.20
†
|
Offer Letter, dated as of December 17, 2013, by and between the Company and Andrew Del Matto
|
Current Report on Form 8-K (File No. 001-34511)
|
December 20, 2013
|
99.1
|
||||
|
10.21
†
|
Letter regarding stock grants, dated as of December 17, 2013, between the Company and Andrew Del Matto
|
Current Report on Form 8-K (File No. 001-34511)
|
December 20, 2013
|
99.2
|
||||
|
10.22
†
*
|
Offer Letter, dated as of April 3, 2014, by and between the Company and Keith Jensen
|
|||||||
|
10.23
†
*
|
Change of Control Severance Agreement, dated as of February 4, 2016, between the Company and Keith Jensen
|
|||||||
|
21.1
*
|
List of subsidiaries
|
|||||||
|
23.1
*
|
Consent of Independent Registered Public Accounting Firm
|
|||||||
|
24.1
*
|
Power of Attorney (incorporated by reference to the signature page of this Annual Report on Form 10-K)
|
|||||||
|
31.1
*
|
Certification of Chief Executive Officer pursuant to Exchange Act Rules 13a-14(a) and 15d-14(a), as adopted pursuant to Section 302 of the Sarbanes-Oxley Act of 2002
|
|
|
31.2
*
|
Certification of Chief Financial Officer pursuant to Exchange Act Rules 13a-14(a) and 15d-14(a), as adopted pursuant to Section 302 of the Sarbanes-Oxley Act of 2002
|
|
|
32.1
*
|
Certifications of Chief Executive Officer and Chief Financial Officer pursuant to 18 U.S.C. Section 1350, as adopted pursuant to Section 906 of the Sarbanes-Oxley Act of 2002
|
|
|
101.SCH*
|
XBRL Taxonomy Extension Schema Document
|
|
|
101.CAL*
|
XBRL Taxonomy Extension Calculation Linkbase Document
|
|
|
101.PRE*
|
XBRL Taxonomy Extension Presentation Linkbase Document
|
|
|
101.DEF*
|
XBRL Taxonomy Extension Definition Linkbase Document
|
|
|
101.LAB*
|
XBRL Taxonomy Extension Label Linkbase Document
|
|
|
101.INS*
|
XBRL Instance Document
|
|
________________________________
†
Indicates management compensatory plan, contract or arrangement.
*
Filed herewith.
108
SIGNATURES
Pursuant to the requirements of Section 13 or 15(d) of the Securities Exchange Act of 1934, the registrant has duly caused this report to be signed on its behalf by the undersigned, thereunto duly authorized, on
February 26, 2018
.
|
FORTINET, INC.
|
||
|
By:
|
/s/ Ken Xie
|
|
|
Ken Xie, Chief Executive Officer and Chairman
|
||
|
(Duly Authorized Officer and Principal Executive Officer)
|
||
|
FORTINET, INC.
|
||
|
By:
|
/s/ Keith Jensen
|
|
|
Keith Jensen, Interim Chief Financial Officer
|
||
|
(Duly Authorized Officer and Principal Financial Officer and Principal Accounting Officer)
|
||
109
POWER OF ATTORNEY
KNOW ALL PERSONS BY THESE PRESENTS, that each person whose signature appears below constitutes and appoints Ken Xie and Keith Jensen, jointly and severally, his or her attorney-in-fact, with the power of substitution, for him or her in any and all capacities, to sign any amendments to this Annual Report on Form 10-K and to file the same, with exhibits thereto and other documents in connection therewith, with the Securities and Exchange Commission, hereby ratifying and confirming all that each of said attorneys-in-fact, or his substitute or substitutes, may do or cause to be done by virtue hereof.
Pursuant to the requirements of the Securities Exchange Act of 1934, this report has been signed below by the following persons on behalf of the registrant and in the capacities and on the dates indicated.
|
Signature
|
|
Title
|
|
Date
|
|
/s/ Ken Xie
|
|
Chief Executive Officer and Chairman
|
|
February 26, 2018
|
|
Ken Xie
|
|
(Principal Executive Officer)
|
|
|
|
/s/ Keith Jensen
|
|
Interim Chief Financial Officer
|
|
February 26, 2018
|
|
Keith Jensen
|
|
(Principal Financial Officer and Principal Accounting Officer)
|
|
|
|
/s/ Michael Xie
|
|
President, Chief Technology Officer and Director
|
|
February 26, 2018
|
|
Michael Xie
|
|
|
||
|
/s/ Peter D. Cohen
|
Director
|
February 26, 2018
|
||
|
Peter D. Cohen
|
||||
|
/s/ Ming Hsieh
|
|
Director
|
|
February 26, 2018
|
|
Ming Hsieh
|
|
|
||
|
/s/ Gary Locke
|
|
Director
|
|
February 26, 2018
|
|
Gary Locke
|
|
|
||
|
/s/ William H. Neukom
|
|
Director
|
|
February 26, 2018
|
|
William H. Neukom
|
|
|
||
|
/s/ Christopher B. Paisley
|
|
Director
|
|
February 26, 2018
|
|
Christopher B. Paisley
|
|
|
||
|
/s/ Judith Sim
|
Director
|
February 26, 2018
|
||
|
Judith Sim
|
||||
110
TABLE OF CONTENTS
Part IItem 1. BusinessItem 1A. Risk FactorsItem 1B. Unresolved Staff CommentsItem 2. PropertiesItem 3. Legal ProceedingsItem 4. Mine Safety DisclosurePart IIItem 5. Market For Registrant S Common Equity, Related Stockholder Matters and Issuer Purchases Of Equity SecuritiesItem 6. Selected Financial DataItem 7. Management S Discussion and Analysis Of Financial Condition and Results Of OperationsItem 7A. Quantitative and Qualitative Disclosures About Market RiskItem 8. Financial Statements and Supplementary DataItem 9. Changes in and Disagreements with Accountants on Accounting and Financial DisclosureItem 9A. Controls and ProceduresItem 9B. Other InformationPart IIIItem 10. Directors, Executive Officers and Corporate GovernanceItem 11. Executive CompensationItem 12. Security Ownership Of Certain Beneficial Owners and Management and Related Stockholder MattersItem 13. Certain Relationships and Related Transactions, and Director IndependenceItem 14. Principal Accounting Fees and ServicesPart IVItem 15. Exhibits, Financial Statement Schedules