FULTON FINANCIAL CORP
10-Ks and 10-Qs
|
|
|
|
|
|
|
|
|
|
|
|
|
|
|
|
|
|
|
|
|
|
|
|
|
|
|
|
|
|
|
|
|
|
|
|
|
|
|
|
|
|
|
|
|
|
|
|
|
|
|
|
|
|
|
|
|
|
|
UNITED STATES
SECURITIES AND EXCHANGE COMMISSION
Washington, DC 20549
_______________________________________________________
FORM 10-K
|
x
|
ANNUAL REPORT PURSUANT TO SECTION 13 OR 15(d) OF THE SECURITIES EXCHANGE ACT OF 1934
|
|
For the fiscal year ended December 31, 2016,
|
|
or
|
¨
|
TRANSITION REPORT PURSUANT TO SECTION 13 OR 15(d) OF THE SECURITIES EXCHANGE ACT OF 1934
|
Commission File Number: 0-10587
_______________________________________________________
FULTON FINANCIAL CORPORATION
(Exact name of registrant as specified in its charter)
|
Pennsylvania
|
|
23-2195389
|
|
(State or other jurisdiction of
incorporation or organization)
|
|
(I.R.S. Employer
Identification No.)
|
|
One Penn Square, P. O. Box 4887, Lancaster, Pennsylvania
|
|
17604
|
|
(Address of principal executive offices)
|
|
(Zip Code)
|
(717) 291-2411
(Registrant’s telephone number, including area code)
Securities registered pursuant to Section 12(b) of the Act:
|
Title of each class
|
|
Name of exchange on which registered
|
|
Common Stock, $2.50 par value
|
|
The NASDAQ Stock Market, LLC
|
|
Securities registered pursuant to Section 12(g) of the Act:
|
|
None
|
Indicate by checkmark whether the registrant is a well-known seasoned issuer, as defined in Rule 405 of the Securities Act. Yes
x
No
¨
Indicate by checkmark whether the registrant is not required to file reports pursuant to Section 13 or Section 15(d) of the Act. Yes
¨
No
x
Indicate by checkmark whether the registrant (1) has filed all reports required to be filed by Section 13 or 15(d) of the Securities Exchange Act of 1934 during the preceding 12 months (or for such shorter period that the registrant was required to file such reports), and (2) has been subject to such filing requirements for the past 90 days. Yes
x
No
¨
Indicate by checkmark whether the registrant has submitted electronically and posted on its corporate Web site, if any, every Interactive Data File required to be submitted and posted pursuant to Rule 405 of Regulation S-T (§232.405 of this chapter) during the preceding 12 months (or for such shorter period that the registrant was required to submit and post such files). Yes
x
No
¨
Indicate by checkmark if disclosure of delinquent filers pursuant to Item 405 of Regulation S-K (§ 229.405) is not contained herein, and will not be contained, to the best of registrant’s knowledge, in definitive proxy or information statements incorporated by reference in Part III of this Form 10-K or any amendment to this Form 10-K.
¨
Indicate by checkmark whether the registrant is a large accelerated filer, an accelerated filer, a non-accelerated filer, or a smaller reporting company. See the definitions of "large accelerated filer," and "smaller reporting company" in Rule 12b-2 of the Exchange Act. (Check One):
|
Large accelerated filer
|
x
|
|
Accelerated filer
|
¨
|
|
Non-accelerated filer
|
¨
|
|
Smaller reporting company
|
¨
|
Indicate by checkmark whether the registrant is a shell company (as defined in Rule 12b-2 of the Act). Yes
¨
No
x
The aggregate market value of the voting Common Stock held by non-affiliates of the registrant, based on the average bid and asked prices on June 30, 2016, the last business day of the registrant’s most recently completed second fiscal quarter, was approximately $2.3 billion. The number of shares of the registrant’s Common Stock outstanding on February 17, 2017 was 174,097,000.
Portions of the Definitive Proxy Statement of the Registrant for the Annual Meeting of Shareholders to be held on May 15, 2017 are incorporated by reference in Part III.
1
TABLE OF CONTENTS
|
Description
|
|
Page
|
|
PART I
|
||
|
Item 1.
|
||
|
Item 1A.
|
||
|
Item 1B.
|
||
|
Item 2.
|
||
|
Item 3.
|
||
|
Item 4.
|
||
|
PART II
|
||
|
Item 5.
|
||
|
Item 6.
|
||
|
Item 7.
|
||
|
Item 7A.
|
||
|
Item 8.
|
||
|
Item 9.
|
||
|
Item 9A.
|
||
|
Item 9B.
|
||
|
PART III
|
||
|
Item 10.
|
||
|
Item 11.
|
||
|
Item 12.
|
||
|
Item 13.
|
||
|
Item 14.
|
||
|
PART IV
|
||
|
Item 15.
|
||
|
Item 16.
|
||
2
General
Fulton Financial Corporation (the "Corporation") was incorporated under the laws of Pennsylvania on February 8, 1982 and became a bank holding company through the acquisition of all of the outstanding stock of Fulton Bank N.A. ("Fulton Bank") on June 30, 1982. In 2000, the Corporation became a financial holding company as defined in the Gramm-Leach-Bliley Act ("GLB Act"), which gave the Corporation the ability to expand its financial services activities under its holding company structure (See "Competition" and "Supervision and Regulation" below). The Corporation directly owns 100% of the common stock of six community banks and eight non-bank entities. As of
December 31, 2016
, the Corporation had approximately 3,500 full-time equivalent employees.
The common stock of the Corporation is listed for quotation on the Global Select Market of The NASDAQ Stock Market under the symbol FULT. The Corporation’s Internet address is
www.fult.com
. Electronic copies of the Corporation’s
2016
Annual Report on Form 10-K are available free of charge by visiting "Investor Relations" at
www.fult.com
. Electronic copies of quarterly reports on Form 10-Q and current reports on Form 8-K are also available at this Internet address. These reports, as well as any amendments thereto, are posted on the Corporation's website as soon as reasonably practicable after they are electronically filed with the Securities and Exchange Commission ("SEC").
Bank and Financial Services Subsidiaries
The Corporation’s six subsidiary banks are located primarily in suburban or semi-rural geographic markets throughout a five-state region (Pennsylvania, Delaware, Maryland, New Jersey and Virginia). Each of these banking subsidiaries delivers financial services in a highly personalized, community-oriented style that emphasizes relationship banking. Where appropriate, operations are centralized through common platforms and back-office functions. The Corporation has announced that it is developing plans to seek regulatory approval to begin the process of consolidating its six subsidiary banks in connection with a transition to a business model that will be less oriented on geographic boundaries and will instead focus more on alignment with the customer segments the Corporation serves. The Corporation also believes that consolidating its subsidiary banks will enhance its ability to manage risk more efficiently and effectively through a centralized risk management and compliance function. This multi-year process is expected to eventually result in the Corporation conducting its core banking business through a single subsidiary bank. Consolidation of the bank subsidiaries will result in a single subsidiary bank with greater than $10 billion in assets, subjecting it to more stringent regulation applicable to institutions that exceed that threshold. See Item 1A. "Risk Factors - Legal, Compliance and Reputational Risks - The Corporation’s largest subsidiary, Fulton Bank, is expected to have had total assets of $10 billion or more for four consecutive quarters as of March 31, 2017, which will subject it to additional regulation and increased supervision." The timing of the commencement of this process will depend significantly on the Corporation and its banking subsidiaries making necessary progress in enhancing a largely centralized compliance program designed to comply with the requirements of the Bank Secrecy Act, the USA Patriot Act of 2001 and related anti-money laundering regulations, and establishing, to the satisfaction of the Corporation’s banking regulatory agencies, that those enhancements are sustainable to achieve compliance with the regulatory enforcement orders issued to the Corporation and its subsidiary banks by their respective banking regulatory agencies relating to identified deficiencies in that compliance program. See Item 1A. "Risk Factors - Legal, Compliance and Reputational Risks - The Corporation and its bank subsidiaries are subject to regulatory enforcement orders requiring improvement in compliance functions and remedial actions."
The Corporation’s subsidiary banks are located in areas that are home to a wide range of manufacturing, distribution, health care and other service companies. The Corporation and its banks are not dependent upon one or a few customers or any one industry, and the loss of any single customer or a few customers would not have a material adverse impact on any of the subsidiary banks. However, a large portion of the Corporation’s loan portfolio is comprised of commercial loans, commercial mortgage loans and construction loans. See Item 1A. "Risk Factors - Economic and Credit Risks - Economic downturns and the composition of the Corporation’s loan portfolio subject the Corporation to credit risk."
Each of the subsidiary banks offers a full range of consumer and commercial banking products and services in its local market area. Personal banking services include various checking account and savings deposit products, certificates of deposit and individual retirement accounts. The subsidiary banks offer a variety of consumer lending products to creditworthy customers in their market areas. Secured consumer loan products include home equity loans and lines of credit, which are underwritten based on loan-to-value limits specified in the Corporation's lending policy. The subsidiary banks also offer a variety of fixed, variable and adjustable rate products, including construction loans and jumbo loans. Residential mortgages are offered through Fulton Mortgage Company,
3
which operates as a division of each subsidiary bank. Consumer loan products also include automobile loans, automobile and equipment leases, personal lines of credit and checking account overdraft protection.
Commercial banking services are provided to small and medium sized businesses (generally with sales of less than $150 million) in the subsidiary banks’ market areas. The Corporation's policies limit the maximum total lending commitment to a single borrower to $50.0 million as of
December 31, 2016
, which is below the Corporation’s regulatory lending limit. In addition, the Corporation has established lower total lending limits based on the Corporation's internal risk rating of the borrower and for certain types of lending commitments. Commercial lending products include commercial, financial, agricultural and real estate loans. Variable, adjustable and fixed rate loans are provided, with variable and adjustable rate loans generally tied to an index, such as the Prime Rate or the London Interbank Offered Rate ("LIBOR"), as well as interest rate swaps. The commercial lending policy of the Corporation's subsidiary banks encourages relationship banking and provides strict guidelines related to customer creditworthiness and collateral requirements for secured loans. In addition, equipment leasing, letters of credit, cash management services and traditional deposit products are offered to commercial customers.
Investment management, trust, brokerage, insurance and investment advisory services are offered to consumer and commercial banking customers in the market areas serviced by the Corporation's subsidiary banks by Fulton Financial Advisors (a division of the Corporation's subsidiary, Fulton Bank).
The Corporation’s subsidiary banks deliver their products and services through traditional branch banking, with a network of full service branch offices. Electronic delivery channels include a network of automated teller machines, telephone banking, mobile banking and online banking. The variety of available delivery channels allows customers to access their account information and perform certain transactions, such as depositing checks, transferring funds and paying bills, at virtually any time of the day.
The following table provides certain information for the Corporation’s banking subsidiaries as of
December 31, 2016
:
|
Subsidiary
|
Main Office
Location |
Total
Assets |
Total
Deposits |
Branches (1)
|
|||||||||
|
|
|
(dollars in millions)
|
|
||||||||||
|
Fulton Bank, N.A.
|
Lancaster, PA
|
$
|
10,700
|
|
$
|
8,310
|
|
112
|
|
||||
|
Fulton Bank of New Jersey
|
Mt. Laurel, NJ
|
3,814
|
|
3,246
|
|
65
|
|
||||||
|
The Columbia Bank
|
Columbia, MD
|
2,287
|
|
1,790
|
|
31
|
|
||||||
|
Lafayette Ambassador Bank
|
Bethlehem, PA
|
1,526
|
|
1,266
|
|
21
|
|
||||||
|
FNB Bank, N.A.
|
Danville, PA
|
350
|
|
286
|
|
7
|
|
||||||
|
Swineford National Bank
|
Middleburg, PA
|
319
|
|
276
|
|
7
|
|
||||||
|
243
|
|
||||||||||||
|
(1)
|
Remote service facilities (mainly stand-alone automated teller machines) are excluded. See additional information in Item 2. "Properties."
|
Non-Bank Subsidiaries
The Corporation owns 100% of the common stock of five non-bank subsidiaries, which are consolidated for financial reporting purposes: (i) Fulton Financial Realty Company, which holds title to or leases certain properties where Corporation branch offices and other facilities are located; (ii) Central Pennsylvania Financial Corp., which owns limited partnership interests in partnerships invested primarily in low- and moderate-income housing projects; (iii) FFC Management, Inc., which owns certain investment securities and other passive investments; (iv) FFC Penn Square, Inc., which owns trust preferred securities ("TruPS") issued by a subsidiary of Fulton Bank; and (v) Fulton Insurance Services Group, Inc., which engages in the sale of various life insurance products.
The Corporation also owns 100% of the common stock of three non-bank subsidiaries which are not consolidated for financial reporting purposes. The following table provides information for these non-bank subsidiaries, whose sole assets consist of junior subordinated deferrable interest debentures issued by the Corporation, as of
December 31, 2016
:
|
Subsidiary
|
State of Incorporation
|
Total Assets
|
|||
|
(in thousands)
|
|||||
|
Columbia Bancorp Statutory Trust
|
Delaware
|
$
|
6,186
|
|
|
|
Columbia Bancorp Statutory Trust II
|
Delaware
|
4,124
|
|
||
|
Columbia Bancorp Statutory Trust III
|
Delaware
|
6,186
|
|
||
4
Competition
The banking and financial services industries are highly competitive. Within its geographic region, the Corporation’s subsidiaries face direct competition from other commercial banks, varying in size from local community banks to larger regional and national
banks, credit unions and non-bank entities. As a result of the wide availability of electronic delivery channels, the subsidiary banks also face competition from financial institutions that do not have a physical presence in the Corporation’s geographic markets.
The industry is also highly competitive due, in part, to the GLB Act. As a result of the GLB Act,various types of entities aggressively compete for customers that were traditionally served only by the banking industry. Under the GLB Act, banks, insurance companies and securities firms may affiliate under a financial holding company structure, allowing their expansion into non-banking financial services activities that had previously been restricted. These activities include a full range of banking, securities and insurance activities, including securities and insurance underwriting, issuing and selling annuities and merchant banking activities. While the Corporation does not currently engage in many of these activities, further entry into these businesses may enhance the ability of the Corporation to compete in the future.
5
Market Share
Deposit market share information is compiled as of
June 30
of each year by the Federal Deposit Insurance Corporation ("FDIC"). The Corporation’s banks maintain branch offices in
52
counties across five states. In
14
of these counties, the Corporation ranked in the top five in deposit market share (based on deposits as of
June 30, 2016
). The following table summarizes information about the counties in which the Corporation has branch offices and its market position in each county:
|
|
|
|
|
No. of Financial
Institutions |
Deposit Market Share
(June 30, 2016) |
||||||||||||||
|
County
|
State
|
Population
(2016 Est.) |
Banking Subsidiary
|
Banks/
Thrifts |
Credit
Unions |
Rank
|
%
|
||||||||||||
|
Lancaster
|
PA
|
541,000
|
|
Fulton Bank, N.A.
|
20
|
|
13
|
|
1
|
|
26.7
|
%
|
|||||||
|
Berks
|
PA
|
416,000
|
|
Fulton Bank, N.A.
|
18
|
|
12
|
|
8
|
|
3.6
|
%
|
|||||||
|
Bucks
|
PA
|
628,000
|
|
Fulton Bank, N.A.
|
36
|
|
14
|
|
15
|
|
1.9
|
%
|
|||||||
|
Centre
|
PA
|
163,000
|
|
Fulton Bank, N.A.
|
16
|
|
4
|
|
10
|
|
3.2
|
%
|
|||||||
|
Chester
|
PA
|
521,000
|
|
Fulton Bank, N.A.
|
31
|
|
8
|
|
13
|
|
3.0
|
%
|
|||||||
|
Columbia
|
PA
|
66,000
|
|
FNB Bank, N.A.
|
6
|
|
3
|
|
5
|
|
3.9
|
%
|
|||||||
|
Cumberland
|
PA
|
250,000
|
|
Fulton Bank, N.A.
|
17
|
|
6
|
|
12
|
|
2.1
|
%
|
|||||||
|
Dauphin
|
PA
|
274,000
|
|
Fulton Bank, N.A.
|
16
|
|
10
|
|
7
|
|
4.3
|
%
|
|||||||
|
Delaware
|
PA
|
566,000
|
|
Fulton Bank, N.A.
|
31
|
|
15
|
|
28
|
|
0.3
|
%
|
|||||||
|
Lebanon
|
PA
|
138,000
|
|
Fulton Bank, N.A.
|
12
|
|
6
|
|
1
|
|
31.4
|
%
|
|||||||
|
Lehigh
|
PA
|
364,000
|
|
Lafayette Ambassador Bank
|
20
|
|
12
|
|
7
|
|
4.4
|
%
|
|||||||
|
Lycoming
|
PA
|
116,000
|
|
FNB Bank, N.A.
|
11
|
|
10
|
|
14
|
|
0.8
|
%
|
|||||||
|
Montgomery
|
PA
|
824,000
|
|
Fulton Bank, N.A.
|
39
|
|
32
|
|
24
|
|
0.4
|
%
|
|||||||
|
Montour
|
PA
|
19,000
|
|
FNB Bank, N.A.
|
5
|
|
3
|
|
2
|
|
23.5
|
%
|
|||||||
|
Northampton
|
PA
|
302,000
|
|
Lafayette Ambassador Bank
|
16
|
|
12
|
|
4
|
|
12.6
|
%
|
|||||||
|
Northumberland
|
PA
|
93,000
|
|
FNB Bank, N.A.
|
18
|
|
4
|
|
9
|
|
3.7
|
%
|
|||||||
|
Swineford National Bank
|
14
|
|
2.0
|
%
|
|||||||||||||||
|
Schuylkill
|
PA
|
143,000
|
|
Fulton Bank, N.A.
|
13
|
|
2
|
|
9
|
|
4.1
|
%
|
|||||||
|
Snyder
|
PA
|
41,000
|
|
Swineford National Bank
|
8
|
|
1
|
|
2
|
|
26.0
|
%
|
|||||||
|
Union
|
PA
|
45,000
|
|
Swineford National Bank
|
10
|
|
3
|
|
5
|
|
6.8
|
%
|
|||||||
|
York
|
PA
|
445,000
|
|
Fulton Bank, N.A.
|
15
|
|
13
|
|
3
|
|
11.3
|
%
|
|||||||
|
New Castle
|
DE
|
562,000
|
|
Fulton Bank, N.A.
|
20
|
|
19
|
|
12
|
|
0.2
|
%
|
|||||||
|
Sussex
|
DE
|
222,000
|
|
Fulton Bank, N.A.
|
16
|
|
5
|
|
3
|
|
8.8
|
%
|
|||||||
|
Anne Arundel
|
MD
|
571,000
|
|
The Columbia Bank
|
28
|
|
11
|
|
20
|
|
0.4
|
%
|
|||||||
|
Baltimore
|
MD
|
837,000
|
|
The Columbia Bank
|
33
|
|
17
|
|
23
|
|
0.7
|
%
|
|||||||
|
Baltimore City
|
MD
|
621,000
|
|
The Columbia Bank
|
27
|
|
14
|
|
14
|
|
0.3
|
%
|
|||||||
|
Cecil
|
MD
|
103,000
|
|
The Columbia Bank
|
7
|
|
4
|
|
3
|
|
13.4
|
%
|
|||||||
|
Frederick
|
MD
|
248,000
|
|
The Columbia Bank
|
17
|
|
5
|
|
15
|
|
0.9
|
%
|
|||||||
|
Howard
|
MD
|
320,000
|
|
The Columbia Bank
|
19
|
|
6
|
|
4
|
|
8.5
|
%
|
|||||||
|
Montgomery
|
MD
|
1,057,000
|
|
The Columbia Bank
|
32
|
|
26
|
|
35
|
|
0.2
|
%
|
|||||||
|
Prince George's
|
MD
|
922,000
|
|
The Columbia Bank
|
19
|
|
25
|
|
21
|
|
0.6
|
%
|
|||||||
|
Washington
|
MD
|
150,000
|
|
The Columbia Bank
|
12
|
|
4
|
|
2
|
|
20.1
|
%
|
|||||||
|
Atlantic
|
NJ
|
273,000
|
|
Fulton Bank of New Jersey
|
16
|
|
7
|
|
12
|
|
1.3
|
%
|
|||||||
|
Burlington
|
NJ
|
450,000
|
|
Fulton Bank of New Jersey
|
20
|
|
12
|
|
15
|
|
1.0
|
%
|
|||||||
|
Camden
|
NJ
|
510,000
|
|
Fulton Bank of New Jersey
|
20
|
|
11
|
|
11
|
|
2.4
|
%
|
|||||||
|
Cumberland
|
NJ
|
155,000
|
|
Fulton Bank of New Jersey
|
12
|
|
5
|
|
11
|
|
2.0
|
%
|
|||||||
|
Gloucester
|
NJ
|
292,000
|
|
Fulton Bank of New Jersey
|
23
|
|
5
|
|
2
|
|
14.1
|
%
|
|||||||
6
|
|
|
|
|
No. of Financial
Institutions |
Deposit Market Share
(June 30, 2016) |
||||||||||||||
|
County
|
State
|
Population
(2016 Est.) |
Banking Subsidiary
|
Banks/
Thrifts |
Credit
Unions |
Rank
|
%
|
||||||||||||
|
Hunterdon
|
NJ
|
125,000
|
|
Fulton Bank of New Jersey
|
17
|
|
7
|
|
9
|
|
2.6
|
%
|
|||||||
|
Mercer
|
NJ
|
372,000
|
|
Fulton Bank of New Jersey
|
27
|
|
20
|
|
19
|
|
0.9
|
%
|
|||||||
|
Middlesex
|
NJ
|
849,000
|
|
Fulton Bank of New Jersey
|
46
|
|
27
|
|
27
|
|
0.3
|
%
|
|||||||
|
Monmouth
|
NJ
|
628,000
|
|
Fulton Bank of New Jersey
|
27
|
|
12
|
|
25
|
|
0.6
|
%
|
|||||||
|
Morris
|
NJ
|
501,000
|
|
Fulton Bank of New Jersey
|
34
|
|
18
|
|
14
|
|
1.4
|
%
|
|||||||
|
Ocean
|
NJ
|
593,000
|
|
Fulton Bank of New Jersey
|
21
|
|
8
|
|
17
|
|
0.9
|
%
|
|||||||
|
Salem
|
NJ
|
64,000
|
|
Fulton Bank of New Jersey
|
7
|
|
4
|
|
1
|
|
25.2
|
%
|
|||||||
|
Somerset
|
NJ
|
336,000
|
|
Fulton Bank of New Jersey
|
28
|
|
12
|
|
10
|
|
2.4
|
%
|
|||||||
|
Warren
|
NJ
|
107,000
|
|
Fulton Bank of New Jersey
|
13
|
|
3
|
|
6
|
|
7.9
|
%
|
|||||||
|
Chesapeake City
|
VA
|
240,000
|
|
Fulton Bank, N.A.
|
12
|
|
7
|
|
10
|
|
1.5
|
%
|
|||||||
|
Fairfax
|
VA
|
1,149,000
|
|
Fulton Bank, N.A.
|
38
|
|
29
|
|
43
|
|
—
|
%
|
|||||||
|
Henrico
|
VA
|
328,000
|
|
Fulton Bank, N.A.
|
25
|
|
16
|
|
20
|
|
0.6
|
%
|
|||||||
|
Manassas
|
VA
|
43,000
|
|
Fulton Bank, N.A.
|
13
|
|
4
|
|
11
|
|
1.8
|
%
|
|||||||
|
Newport News
|
VA
|
184,000
|
|
Fulton Bank, N.A.
|
12
|
|
7
|
|
14
|
|
0.6
|
%
|
|||||||
|
Richmond City
|
VA
|
224,000
|
|
Fulton Bank, N.A.
|
18
|
|
11
|
|
16
|
|
0.2
|
%
|
|||||||
|
Virginia Beach
|
VA
|
457,000
|
|
Fulton Bank, N.A.
|
15
|
|
12
|
|
10
|
|
1.5
|
%
|
|||||||
Supervision and Regulation
The Corporation and its subsidiaries operate in an industry that is subject to laws and regulations that are enforced by a number of federal and state agencies. Changes in these laws and regulations, including interpretation and enforcement activities, could impact the cost of operating in the financial services industry, limit or expand permissible activities or affect competition among banks and other financial institutions.
The Corporation is a registered financial holding company under the Bank Holding Company Act ("BHCA") and is regulated, supervised and examined by the Federal Reserve Bank. The Corporation's subsidiary banks are depository institutions whose deposits are insured by the FDIC. The following table summarizes the charter types and primary regulators for each of the Corporation’s subsidiary banks:
|
Subsidiary
|
Charter
|
|
Primary Regulator(s)
|
|
Fulton Bank, N.A.
|
National
|
|
OCC
|
|
Fulton Bank of New Jersey
|
NJ
|
|
NJ/FDIC
|
|
The Columbia Bank
|
MD
|
|
MD/FDIC
|
|
Lafayette Ambassador Bank
|
PA
|
|
PA/Federal Reserve
|
|
FNB Bank, N.A.
|
National
|
|
OCC
|
|
Swineford National Bank
|
National
|
|
OCC
|
OCC - Office of the Comptroller of the Currency
Federal statutes that apply to the Corporation and its subsidiaries include the GLB Act, the BHCA, the Dodd-Frank Wall Street Reform and Consumer Protection Act ("Dodd-Frank Act"), the Federal Reserve Act, the National Bank Act and the Federal Deposit Insurance Act, among others. In general, these statutes, regulations promulgated thereunder, and related interpretations establish the eligible business activities of the Corporation, certain acquisition and merger restrictions, limitations on intercompany transactions, such as loans and dividends, and capital adequacy requirements, among other things.
BHCA
- The Corporation is subject to regulation and examination by the Federal Reserve Bank, and is required to file periodic reports and to provide additional information that the Federal Reserve may require. The BHCA regulates activities of bank holding companies, including requirements and limitations relating to capital, transactions with officers, directors and affiliates, securities issuances, dividend payments, extensions of credit, among others. The BHCA permits the Federal Reserve, in certain circumstances,
7
to issue cease and desist orders and other enforcement actions against bank holding companies (and their non-banking affiliates) to correct or curtail unsafe or unsound banking practices. In addition, the Federal Reserve must approve certain proposed changes in organizational structure or other business activities before they occur. The BHCA imposes certain restrictions upon the Corporation regarding the acquisition of substantially all of the assets of, or direct or indirect ownership or control of, any bank for which it is not already the majority owner.
Dodd-Frank Act
- The Dodd-Frank Act was enacted in July 2010 and resulted in significant financial regulatory reform. The Dodd-Frank Act also changed the responsibilities of the current federal banking regulators. Among other things, the Dodd-Frank Act created the Financial Stability Oversight Council, with oversight authority for monitoring and regulating systemic risk, and the Consumer Financial Protection Bureau ("CFPB"), which has broad regulatory and enforcement powers over consumer financial products and services. Effective July 21, 2011, the CFPB became responsible for administering and enforcing numerous federal consumer financial laws enumerated in the Dodd-Frank Act. The Dodd-Frank Act also provided that, for banks with total assets of more than $10 billion, the CFPB would have exclusive or primary authority to examine those banks for, and enforce compliance with, the federal consumer financial laws. As of
December 31, 2016
, the Corporation's largest subsidiary bank, Fulton Bank, had
$10.7 billion
in assets and had assets of $10 billion or more as of the end of each of the previous two quarters. If Fulton Bank has assets of $10 billion or more as of March 31, 2017, it and the Corporation's other subsidiary banks will become subject to the supervision, examination and enforcement jurisdiction of the CFPB with respect to the federal consumer financial laws, among other things. Although currently not subject to CFPB examination, Fulton Bank and the Corporation's other subsidiary banks remain subject to the review and supervision of other applicable regulatory authorities, and such authorities may enforce compliance with regulations issued by the CFPB.
Stress testing
- In October 2012, the Board of Governors of the Federal Reserve System ("FRB") issued final rules regarding company-run stress testing. In accordance with these rules, the Corporation is required to conduct an annual stress test in the manner specified, and using assumptions for baseline, adverse and severely adverse scenarios announced by the FRB. The stress test is designed to assess the potential impact of the various scenarios on the Corporation's earnings, capital levels and capital ratios over a nine-quarter time horizon. The Corporation's board of directors and its senior management are required to consider the results of the stress test in the normal course of business, including as part of the Corporation's capital planning process and the evaluation of the adequacy of its capital. Public disclosure of summary stress test results under the severely adverse scenario began in June 2015 for stress tests that commenced in the fall of 2014. The Corporation believes that both the quality and magnitude of its capital base are sufficient to support its current operations given its risk profile. The results of the annual stress testing process did not lead the Corporation to raise additional capital or alter the mix of its capital components. Pursuant to final rules published in October 2014 and December 2015, the FRB modified the start date of the stress test cycles so that, beginning in 2016, stress tests must be conducted using financial data as of December 31 of the prior year, the results of the stress test must be reported to the FRB on or before July 31 and a summary of the results of the stress test must be publicly disclosed between October 15 and October 31. The Corporation timely submitted its stress test report to the FRB before its required date of July 31, 2016, and a summary of the results was publicly disclosed on October 18, 2016, as required by the final rules.
Under similar rules adopted by the OCC, the primary regulator of Fulton Bank, national banks with total consolidated assets of more than $10 billion are also required to conduct annual stress tests. A national bank becomes subject to the annual stress testing requirement when the institution's total consolidates assets, calculated as the average of the institution's total consolidated assets, as reported on the institution's quarterly Call Reports, for the most recent four consecutive quarters exceeds $10 billion. As of June 30, 2016, Fulton Bank crossed the $10 billion in assets threshold and has maintained that level of assets through the quarter ended December 31, 2016. Provided that Fulton Bank reports total consolidated assets of $8.3 billion or more on its Call Report for the quarter ending March 31, 2017, it will be required to conduct annual stress tests in accordance with the OCC rules and as a result, to submit its first stress test report to the OCC on or before July 31, 2018.
Consumer Lending Laws
- Bank regulatory agencies are increasingly focusing attention on consumer protection laws and regulations. To promote fairness and transparency for mortgages, credit cards, and other consumer financial products and services, the Dodd-Frank Act established the CFPB. This agency is responsible for interpreting and enforcing federal consumer financial laws, as defined by the Dodd-Frank Act, that, among other things, govern the provision of deposit accounts along with mortgage origination and servicing. Some federal consumer financial laws enforced by the CFPB include the Equal Credit Opportunity Act, Truth in Lending Act ("TILA"), the Truth in Savings Act, the Home Mortgage Disclosure Act, Real Estate Settlement Procedures Act ("RESPA"), the Equal Credit Opportunity Act, the Fair Debt Collection Practices Act, and the Fair Credit Reporting Act. The CFPB is also authorized to prevent any institution under its authority from engaging in an unfair, deceptive, or abusive act or practice in connection with consumer financial products and services. As a residential mortgage lender, the Corporation and its bank subsidiaries are subject to multiple federal consumer protection statutes and regulations, including, but not limited to, TILA, the Home Mortgage Disclosure Act, the Equal Credit Opportunity Act, RESPA, the Fair Credit Reporting Act, the Fair Debt Collection Act and the Flood Disaster Protection Act. Failure to comply with these and similar statutes and regulations can result
8
in the Corporation and its bank subsidiaries becoming subject to formal or informal enforcement actions, the imposition of civil money penalties and consumer litigation.
Ability-to-pay rules and qualified mortgages
- As required by the Dodd-Frank Act, the CFPB issued a series of final rules in January 2013 amending Regulation Z, implementing TILA, which requires mortgage lenders to make a reasonable and good faith determination, based on verified and documented information, that a consumer applying for a residential mortgage loan has a reasonable ability to repay the loan according to its terms. These final rules prohibit creditors, such as the Corporation's bank subsidiaries, from extending residential mortgage loans without regard for the consumer's ability to repay and add restrictions and requirements to residential mortgage origination and servicing practices. In addition, these rules restrict the imposition of prepayment penalties and compensation practices relating to residential mortgage loan origination. Mortgage lenders are required to determine consumers’ ability to repay in one of two ways. The first alternative requires the mortgage lender to consider eight underwriting factors when making the credit decision. Alternatively, the mortgage lender can originate "qualified mortgages," which are entitled to a presumption that the creditor making the loan satisfied the ability-to-repay requirements. In general, a qualified mortgage is a residential mortgage loan that does not have certain high risk features, such as negative amortization, interest-only payments, balloon payments, or a term exceeding 30 years. In addition, to be a qualified mortgage, the points and fees paid by a consumer cannot exceed 3% of the total loan amount and the borrower’s total debt-to-income ratio must be no higher than 43% (subject to certain limited exceptions for loans eligible for purchase, guarantee or insurance by a government sponsored enterprise or a federal agency).
Integrated disclosures under the Real Estate Settlement Procedures Act and the Truth in Lending Act
- As required by the Dodd-Frank Act, the CFPB issued final rules in December 2013 revising and integrating previously separate disclosures required under RESPA and TILA in connection with certain closed-end consumer mortgage loans. These final rules became effective August 1, 2015 and require lenders to provide a new Loan Estimate, combining content from the former Good Faith Estimate required under RESPA and the initial disclosures required under TILA, not later than the third business day after submission of a loan application, and a new Closing Disclosure, combining content of the former HUD-1 Settlement Statement required under RESPA and the final disclosures required under TILA, at least three days prior to the loan closing.
Consumer Financial Protection Enforcement
- The CFPB has exclusive examination and primary enforcement authority with respect to compliance with federal consumer financial protection laws and regulations by institutions under its supervision and is authorized, individually or jointly with the federal bank regulatory agencies (the "Agencies"), to conduct investigations to determine whether any person is, or has, engaged in conduct that violates such laws or regulations. The CFPB may bring an administrative enforcement proceeding or civil action in federal district court. In addition, in accordance with a memorandum of understanding entered into between the CFPB and the Department of Justice ("DOJ"), the two agencies have agreed to coordinate efforts related to enforcing the fair lending laws, which includes information sharing and conducting joint investigations. As an independent bureau funded by the FRB, the CFPB may impose requirements that are more severe than those of the other bank regulatory agencies. As an insured depository institution with total assets of more than $10 billion, Fulton Bank and the Corporation's other subsidiary banks will become subject to the CFPB’s supervisory and enforcement authorities if it maintains that level of assets through March 31, 2017. The Dodd-Frank Act also permits states to adopt stricter consumer protection laws and state attorneys general to enforce consumer protection rules issued by the CFPB. As a result of these aspects of the Dodd-Frank Act, going forward, the Corporation's subsidiary banks would operate in a stringent consumer compliance environment and may incur additional costs related to consumer protection compliance, including but not limited to potential costs associated with CFPB examinations, regulatory and enforcement actions and consumer-oriented litigation, which is likely to increase as a result of the consumer protection provisions of the Dodd-Frank Act. The CFPB, other financial regulatory agencies, including the OCC, as well as the Department of Justice have recently pursued a number of enforcement actions against depository institutions with respect to compliance with fair lending laws.
Volcker Rule
- As mandated by the Dodd-Frank Act, in December 2013, the OCC, FRB, FDIC, SEC and Commodity Futures Trading Commission issued final rulings (the "Final Rules") implementing certain prohibitions and restrictions on the ability of a banking entity and non-bank financial company supervised by the FRB to engage in proprietary trading and have certain ownership interests in, or relationships with, a "covered fund" (the so-called "Volcker Rule"). The Final Rules generally treat as a covered fund any entity that would be an investment company under the Investment Company Act of 1940 (the "1940 Act") but for the application of the exemptions from SEC registration set forth in Section 3(c)(1) (fewer than 100 beneficial owners) or Section 3(c)(7) (qualified purchasers) of the 1940 Act. The Final Rules also require regulated entities to establish an internal compliance program that is consistent with the extent to which it engages in proprietary trading and covered fund activities covered by the Volcker Rule. Although the Final Rules provide some tiering of compliance and reporting obligations based on size, the fundamental prohibitions of the Volcker Rule apply to banking entities of any size, including the Corporation. In December 2014, the FRB extended, until July 21, 2016, the date by which banking entities must conform their covered fund activities and investments to the requirements of the Final Rules, and in July 2016, the FRB granted an additional one-year extension of the conformance period to July 21, 2017. The Corporation does not engage in proprietary trading or in any other activities prohibited by the Final Rules.
9
Based on the Corporation's evaluation of its investments, none fell within the definition of a "covered fund" and none needed to be disposed of during 2016 or by July 31, 2017. The Corporation does not currently expect that the Final Rules will have a material effect on its business, financial condition or results of operations.
Capital Requirements
- There are a number of restrictions on financial and bank holding companies and FDIC-insured depository subsidiaries that are designed to minimize potential loss to depositors and the FDIC insurance funds. Also, a bank holding company is required to serve as a source of financial strength to its depository institution subsidiaries and to commit resources to support such institutions in circumstances where it might not do so absent such policy. Under the BHCA, the FRB has the authority to require a bank holding company to terminate any activity or to relinquish control of a non-bank subsidiary upon the FRB’s determination that such activity or control constitutes a serious risk to the financial soundness and stability of a depository institution subsidiary of the bank holding company.
The Basel Committee on Banking Supervision ("Basel") is a committee of central banks and bank regulators from major industrialized countries that develops broad policy guidelines for use by each country’s regulators with the purpose of ensuring that financial institutions have adequate capital given the risk levels of assets and off-balance sheet financial instruments. In December 2010, Basel released frameworks for strengthening international capital and liquidity regulations, referred to as Basel III.
In July 2013, the FRB approved final rules (the "U.S. Basel III Capital Rules") establishing a new comprehensive capital framework for U.S. banking organizations and implementing the Basel's December 2010 framework for strengthening international capital standards. The U.S. Basel III Capital Rules substantially revise the risk-based capital requirements applicable to bank holding companies and depository institutions.
The minimum regulatory capital requirements established by the U.S. Basel III Capital Rules became effective for the Corporation on January 1, 2015, and will be fully phased in on January 1, 2019.
The U.S. Basel III Capital Rules require the Corporation and its bank subsidiaries to:
|
•
|
Meet a minimum Common Equity Tier 1 capital ratio of 4.50% of risk-weighted assets and a minimum Tier 1 capital ratio of 6.00% of risk-weighted assets;
|
|
•
|
Continue to require a minimum Total capital ratio of 8.00% of risk-weighted assets and a minimum Tier 1 leverage capital ratio of 4.00% of average assets; and
|
|
•
|
Comply with a revised definition of capital to improve the ability of regulatory capital instruments to absorb losses. Certain non-qualifying capital instruments, including cumulative preferred stock and TruPS, are being phased out as a component of Tier 1 capital for institutions of the Corporation's size.
|
The U.S. Basel III Capital Rules use a standardized approach for risk weightings that expand the risk-weightings for assets and off balance sheet exposures from the previous 0%, 20%, 50% and 100% categories to a much larger and more risk-sensitive number of categories, depending on the nature of the assets and off-balance sheet exposures and resulting in higher risk weights for a variety of asset categories.
When fully phased in on January 1, 2019, the Corporation and its bank subsidiaries will also be required to maintain a "capital conservation buffer" of 2.50% above the minimum risk-based capital requirements. The required minimum capital conservation buffer began to be phased in incrementally, starting at 0.625%, on January 1, 2016, increasing to 1.25% on January 1, 2017, and will continue to increase, to 1.875% on January 1, 2018 and 2.50% on January 1, 2019. The rules provide that the failure to maintain the "capital conservation buffer" will result in restrictions on capital distributions and discretionary cash bonus payments to executive officers. As a result, under the U.S. Basel III Capital Rules, if any of the Corporation's bank subsidiaries fails to maintain the required minimum capital conservation buffer, the Corporation will be subject to limits, and possibly prohibitions, on its ability to obtain capital distributions from such subsidiaries. If the Corporation does not receive sufficient cash dividends from its bank subsidiaries, it may not have sufficient funds to pay dividends on its capital stock, service its debt obligations or repurchase its common stock. In addition, the restrictions on payments of discretionary cash bonuses to executive officers may make it more difficult for the Corporation to retain key personnel.
As of
December 31, 2016
, the Corporation met the fully-phased in minimum capital requirements, including the new capital conservation buffer, as prescribed in the U.S. Basel III Capital Rules.
The Basel III liquidity framework also includes new liquidity requirements that require financial institutions to maintain increased levels of liquid assets or alter their strategies for liquidity management. The Basel III liquidity framework requires banks and bank holding companies to measure their liquidity against specific ratios.
10
In September 2014, the FRB approved final rules (the "U.S. Liquidity Coverage Ratio Rule") implementing portions of the Basel III liquidity framework for large, internationally active banking organizations, generally those having $250 billion or more in total assets, and similar, but less stringent rules, applicable to bank holding companies with consolidated assets of $50 billion or more. The U.S. Liquidity Coverage Ratio Rule requires banking organizations to maintain a Liquidity Coverage Ratio ("LCR") that is designed to ensure that sufficient high quality liquid resources are available for a one month period in case of a stress scenario. Impacted financial institutions are required to have been compliant with the U.S. Liquidity Coverage Ratio Rule by January 1, 2017. The Corporation’s total assets and the scope of its operations do not currently meet the thresholds set forth in the U.S. Liquidity Coverage Ratio Rule, as a result of which the Corporation is not currently required to maintain a minimum LCR.
The Basel III liquidity framework also introduced a second ratio, referred to as the Net Stable Funding Ratio ("NSFR"), which is designed to promote funding resiliency over longer-term time horizons by creating additional incentives for banks to fund their activities with more stable sources of funding on an ongoing structural basis. This new liquidity standard is subject to further rulemaking. To date, U.S. banking regulators have not proposed any additional liquidity rules. Because of the Corporation's size, neither the U.S. Liquidity Coverage Ratio Rule nor any additional proposed rules under the Basel III liquidity framework are applicable to it.
Prompt Corrective Regulatory Action
- The Federal Deposit Insurance Corporation Improvement Act ("FDICIA") established a system of prompt corrective action to resolve the problems of undercapitalized institutions. Under this system, the federal bank regulators are required to take certain, and authorized to take other, supervisory actions against undercapitalized institutions, based upon five categories of capitalization which FDICIA created: "well capitalized," "adequately capitalized," "undercapitalized," "significantly undercapitalized," and "critically undercapitalized," the severity of which depends upon the institution’s degree of capitalization. Generally, a capital restoration plan must be filed with the institution’s primary federal regulator within 45 days of the date an institution receives notice that it is "undercapitalized," "significantly undercapitalized" or "critically undercapitalized," and the plan must be guaranteed by any parent holding company. In addition, various mandatory supervisory actions become immediately applicable to the institution, including restrictions on growth of assets and other forms of expansion. Prior to January 1, 2015, an insured depository institution was treated as well capitalized if its total risk-based capital ratio was 10.00% or greater, its Tier 1 risk-based capital ratio was 6.00% or greater and its Tier 1 leverage capital ratio was 5.00% or greater, and it was not subject to any order or directive by its primary federal regulator to meet a specific capital level. Effective January 1, 2015, an insured depository institution was treated as well capitalized if its total risk-based capital ratio is 10.00% or greater, its Tier 1 risk-based capital ratio is 8.00% or greater, its Common Equity Tier 1 risk-based capital ratio is 6.50% or greater and its Tier 1 leverage capital ratio is 5.00% or greater, and it is not subject to any order or directive to meet a specific capital level. As of
December 31, 2016
, each of the Corporation’s bank subsidiaries’ capital ratios was above the minimum levels required to be considered "well capitalized" by its primary federal regulator.
Loans and Dividends from Subsidiary Banks
- There are various restrictions on the extent to which the Corporation's bank subsidiaries can make loans or extensions of credit to, or enter into certain transactions with, its affiliates, which would include the Corporation and its non-banking subsidiaries. In general, these restrictions require that such loans be secured by designated amounts of specified collateral and are limited, as to any one of the Corporation or its non-bank subsidiaries, to 10% of the lending bank’s regulatory capital (20% in the aggregate to all such entities). The Dodd-Frank Act expanded these restrictions, effective in July 2012, to cover securities lending, repurchase agreement and derivatives activities that the Corporation’s bank subsidiaries may have with an affiliate.
For safety and soundness reasons, banking regulations also limit the amount of cash that can be transferred from subsidiary banks to the parent company in the form of dividends. Dividend limitations vary, depending on the subsidiary bank’s charter and whether or not it is a member of the Federal Reserve System. Generally, subsidiaries are prohibited from paying dividends when doing so would cause them to fall below the regulatory minimum capital levels. Additionally, limits may exist on paying dividends in excess of net income for specified periods. See "Note 11 - Regulatory Matters," in the Notes to Consolidated Financial Statements in Item 8. "Financial Statements and Supplementary Data" for additional information regarding regulatory capital and dividend and loan limitations.
Federal Deposit Insurance
- Substantially all of the deposits of the Corporation’s subsidiary banks are insured up to the applicable limits by the Deposit Insurance Fund ("DIF") of the FDIC, generally up to $250,000 per insured depositor.
The subsidiary banks pay deposit insurance premiums based on assessment rates established by the FDIC. The FDIC has established a risk-based assessment system under which institutions are classified and pay premiums according to their perceived risk to the DIF. An institution’s base assessment rate is generally subject to following adjustments: (1) a decrease for the institution’s long-term unsecured debt, including most senior and subordinated debt, (2) an increase for brokered deposits above a threshold amount and (3) an increase for unsecured debt held that is issued by another insured depository institution.
11
On April 1, 2011, as required by the Dodd-Frank Act, the deposit insurance assessment base changed from total domestic deposits to average total assets, minus average tangible equity. In addition, the FDIC also created a two scorecard system, one for large depository institutions that have $10 billion or more in assets and another for highly complex institutions that have $50 billion or more in assets. As of
December 31, 2016
, the Corporation’s largest subsidiary bank, Fulton Bank, had assets of
$10.7 billion
and had assets of $10 billion or more as of the end of each of the previous two quarters. If Fulton Bank has assets of $10 billion or more as of March 31, 2017, it will become subject to a modified methodology for calculating FDIC insurance assessments and potentially higher assessment rates as a result of institutions with $10 billion or more in assets being required to bear the cost of raising the FDIC reserve ratio to 1.35% as required by the Dodd-Frank Act.
The FDIC annually establishes for the DIF a designated reserve ratio, or DRR, of estimated insured deposits. The FDIC has announced that the DRR for 2017 will remain at 2.00%, which is the same ratio that has been in effect since January 1, 2011. The FDIC is authorized to change deposit insurance assessment rates as necessary to maintain the DRR, without further notice-and-comment rulemaking, provided that: (1) no such adjustment can be greater than three basis points from one quarter to the next, (2) adjustments cannot result in rates more than three basis points above or below the base rates and (3) rates cannot be negative.
The Dodd-Frank Act increased the minimum DIF reserve ratio to 1.35% of insured deposits, which must be reached by September 30, 2020, and provides that, in setting the assessment rates necessary to meet the new requirement, the FDIC shall offset the effect of this provision on insured depository institutions with total consolidated assets of less than $10 billion, so that more of the cost of raising the reserve ratio will be borne by the institutions with more than $10 billion in assets. In October 2010, the FDIC adopted a restoration plan to ensure that the DIF reserve ratio reaches 1.35% by September 30, 2020.
On October 22, 2015, the FDIC issued a proposal to increase the reserve ratio for the DIF to the minimum level of 1.35% as required by the Reform Act. The FDIC adopted the final rule on March 15, 2016, which imposes on insured depository institutions with $10 billion or more in total consolidated assets (such as Fulton Bank) a quarterly surcharge equal to an annual rate of 4.5 basis points applied to the deposit insurance assessment base, after making certain adjustments. The rule became effective on July 1, 2016.
Pursuant to the Dodd-Frank Act, the FDIC has backup enforcement authority over a depository institution holding company, such as the Corporation, if the conduct or threatened conduct of such holding company poses a risk to the DIF, although such authority may not be used if the holding company is generally in sound condition and does not pose a foreseeable and material risk to the DIF.
USA Patriot Act
- Anti-terrorism legislation enacted under the USA Patriot Act of 2001 ("Patriot Act") expanded the scope of anti-money laundering laws and regulations and imposed significant new compliance obligations for financial institutions, including the Corporation’s subsidiary banks. The Patriot Act gives the federal government powers to address terrorist threats through enhanced domestic security measures, expanded surveillance powers, increased information sharing and broadened anti-money laundering requirements. By way of amendments to the Bank Secrecy Act ("BSA"), Title III of the Patriot Act takes measures intended to encourage information sharing among bank regulatory agencies and law enforcement bodies. Further, these regulations impose affirmative obligations on a wide range of financial institutions to maintain appropriate policies, procedures and controls to detect, prevent and report money laundering and terrorist financing.
Among other requirements, the Patriot Act and the related regulations impose the following requirements with respect to financial institutions:
|
•
|
Establishment of anti-money laundering programs;
|
|
•
|
Establishment of a program specifying procedures for obtaining identifying information from customers seeking to open new accounts, including verifying the identity of customers within a reasonable period of time;
|
|
•
|
Establishment of enhanced due diligence policies, procedures and controls designed to detect and report money laundering; and
|
|
•
|
Prohibition on correspondent accounts for foreign shell banks and compliance with recordkeeping obligations with respect to correspondent accounts of foreign banks.
|
Failure to comply with the Patriot Act’s requirements could have serious legal, financial, regulatory and reputational consequences. In addition, bank regulators will consider a holding company’s effectiveness in combating money laundering when ruling on BHCA and Bank Merger Act applications. In May 2016, the regulations implementing the BSA were amended to explicitly include risk-based procedures for conducting ongoing customer due diligence, to include understanding the nature and purpose of customer relationships for the purpose of developing a customer risk profile. In addition, banks must identify and verify the identity of the beneficial owners of all legal entity customers (other than those that are excluded) at the time a new account is opened (other than accounts that are exempted). The Corporation and its banking subsidiaries must comply with these amendments and new requirements by May 11, 2018. The Corporation has adopted policies, procedures and controls to address compliance with the
12
Patriot Act and will continue to revise and update its policies, procedures and controls to reflect required changes (including the May 2016 amendments).
The Corporation and its banking subsidiaries are currently subject to regulatory enforcement orders (the "Consent Orders") issued by bank regulatory agencies relating to identified deficiencies in a largely centralized compliance program (the "BSA/AML Compliance Program") designed to comply with the BSA, the Patriot Act and related anti-money laundering regulations (the "BSA/AML Requirements"). The Consent Orders require, among other things, that the Corporation and its banking subsidiaries review, assess and take actions to strengthen and enhance the BSA/AML Compliance Program, and, in some cases, conduct retrospective reviews of past account activity and transactions, as well as certain reports filed in accordance with the BSA/AML Requirements, to determine whether suspicious activity and certain transactions in currency were properly identified and reported in accordance with the BSA/AML Requirements. See Item 1A. "Risk Factors-Legal, Compliance and Reputational Risks-The Corporation and its bank subsidiaries are subject to regulatory enforcement orders requiring improvement in compliance functions and remedial actions;" "Note-17 Commitments and Contingencies - Legal Proceedings," in the Notes to Consolidated Financial Statements in Item 8. "Financial Statements and Supplementary Data."
Commercial Real Estate Guidance
- In December 2015, the Agencies released a statement entitled "Statement on Prudent Risk Management for Commercial Real Estate Lending" (the "CRE Statement"). In the CRE Statement, the Agencies express concerns with institutions which ease commercial real estate underwriting standards, direct financial institutions to maintain underwriting discipline and exercise risk management practices to identify, measure and monitor lending risks, and indicate that they will continue to pay special attention to commercial real estate lending activities and concentrations going forward. The Agencies previously issued guidance in December 2006, entitled "Interagency Guidance on Concentrations in Commercial Real Estate Lending, Sound Risk Management Practices," which states that an institution is potentially exposed to significant commercial real estate concentration risk, and should employ enhanced risk management practices, where (1) total commercial real estate loans represents 300% or more of its total capital and (2) the outstanding balance of such institution's commercial real estate loan portfolio has increased by 50% or more during the prior 36 months.
Community Reinvestment
- Under the Community Reinvestment Act ("CRA"), each of the Corporation’s subsidiary banks has a continuing and affirmative obligation, consistent with its safe and sound operation, to ascertain and meet the credit needs of its entire community, including low and moderate income areas. The CRA does not establish specific lending requirements or programs for financial institutions, nor does it limit an institution's discretion to develop the types of products and services that it believes are best suited to its particular community. The CRA requires an institution’s primary federal regulator, in connection with its examination of the institution, to assess the institution's record of meeting the credit needs of its community and to take such record into account in its evaluation of certain applications by such institution. The assessment focuses on three tests: (1) a lending test, to evaluate the institution’s record of making loans, including community development loans, in its designated assessment areas; (2) an investment test, to evaluate the institution’s record of investing in community development projects, affordable housing, and programs benefiting low- or moderate-income individuals and areas and small businesses; and (3) a service test, to evaluate the institution’s delivery of banking services throughout its CRA assessment area, including low- and moderate-income areas. The CRA also requires all institutions to make public disclosure of their CRA ratings. As of
December 31, 2016
, all of the Corporation’s subsidiary banks are rated at least as "satisfactory." Regulations require that the Corporation’s subsidiary banks publicly disclose certain agreements that are in fulfillment of CRA. None of the Corporation’s subsidiary banks are party to any such agreements at this time.
Standards for Safety and Soundness
- Pursuant to the requirements of FDICIA, as amended by the Riegle Community Development and Regulatory Improvement Act of 1994, the federal bank regulatory agencies adopted guidelines establishing general standards relating to internal controls, information systems, internal audit systems, loan documentation, credit underwriting, interest rate risk exposure, asset growth, asset quality, earnings, compensation, fees and benefits. In general, the guidelines require, among other things, appropriate systems and practices to identify and manage the risks and exposures specified in the guidelines. An institution must submit a compliance plan to its regulator if it is notified that it is not satisfying any such safety and soundness standards. If the institution fails to submit an acceptable compliance plan or fails in any material respect to implement an accepted compliance plan, the regulator must issue an order directing corrective actions and may issue an order directing other actions of the types to which a significantly undercapitalized institution is subject under the "prompt corrective action" provisions of FDICIA. If the institution fails to comply with such an order, the regulator may seek to enforce such order in judicial proceedings and to impose civil money penalties.
The guidelines prohibit excessive compensation as an unsafe and unsound practice and describe compensation as excessive when the amounts paid are unreasonable or disproportionate to the services performed by an executive officer, employee, director or principal shareholder. In July 2010, the federal banking agencies issued Guidance on Sound Incentive Compensation Policies ("Guidance") that applies to all banking organizations supervised by the agencies (thereby including both the Corporation and its banking subsidiaries). Pursuant to the Guidance, to be consistent with safety and soundness principles, a banking organization’s
13
incentive compensation arrangements should: (1) provide employees with incentives that appropriately balance risk and reward; (2) be compatible with effective controls and risk management; and (3) be supported by strong corporate governance, including active and effective oversight by the banking organization’s board of directors. Monitoring methods and processes used by a banking organization should be commensurate with the size and complexity of the organization and its use of incentive compensation.
Section 956 of the Dodd-Frank Act requires the federal banking agencies and the SEC to establish joint regulations or guidelines prohibiting incentive-based payment arrangements at specified regulated entities that encourage inappropriate risk-taking by providing an executive officer, employee, director or principal shareholder with excessive compensation, fees, or benefits or that could lead to material financial loss to the entity. The federal banking agencies issued such proposed rules in April 2011 and issued a revised proposed rule in June 2016, implementing the requirements and prohibitions set forth in Section 956. The revised proposed rule would apply to all banks, among other institutions, with at least $1 billion in average total consolidated assets, for which it would go beyond the existing Guidance to (i) prohibit certain types and features of incentive-based compensation arrangements for senior executive officers, (ii) require incentive-based compensation arrangements to adhere to certain basic principles to avoid a presumption of encouraging inappropriate risk, (iii) require appropriate board or committee oversight, (iv) establish minimum record keeping and (v) mandate disclosures to the appropriate federal banking agency.
Privacy Protection and Cybersecurity
- The Corporation’s bank subsidiaries are subject to regulations implementing the privacy protection provisions of the GLB Act. These regulations require each of the Corporation’s bank subsidiaries to disclose its privacy policy, including identifying with whom it shares "nonpublic personal information," to customers at the time of establishing the customer relationship and annually thereafter. The regulations also require each bank to provide its customers with initial and annual notices that accurately reflect its privacy policies and practices. In addition, to the extent its sharing of such information is not covered by an exception, each bank is required to provide its customers with the ability to "opt-out" of having the bank share their nonpublic personal information with unaffiliated third parties.
The Corporation’s bank subsidiaries are subject to regulatory guidelines establishing standards for safeguarding customer information. These regulations implement certain provisions of the GLB Act. The guidelines describe the federal bank regulatory agencies’ expectations for the creation, implementation and maintenance of an information security program, which would include administrative, technical and physical safeguards appropriate to the size and complexity of the institution and the nature and scope of its activities. The standards set forth in the guidelines are intended to ensure the security and confidentiality of customer records and information, protect against any anticipated threats or hazards to the security or integrity of such records and protect against unauthorized access to or use of such records or information that could result in substantial harm or inconvenience to any customer. These guidelines, along with related regulatory materials, increasingly focus on risk management and processes related to information technology and the use of third parties in the provision of financial services. In October 2016, the federal banking agencies issued an advance notice of proposed rulemaking on enhanced cybersecurity risk-management and resilience standards that would apply to large and interconnected banking organizations and to services provided by third parties to these firms. These enhanced standards would apply only to depository institutions and depository institution holding companies with total consolidated assets of $50 billion or more.
Federal Reserve System
- FRB regulations require depository institutions to maintain cash reserves against their transaction accounts (primarily NOW and demand deposit accounts). A reserve of 3% is to be maintained against aggregate transaction accounts between $15.2 million and $110.2 million (subject to adjustment by the FRB) plus a reserve of 10% (subject to adjustment by the FRB between 8% and 14%) against that portion of total transaction accounts in excess of $110.2 million. The first $15.2 million of otherwise reservable balances (subject to adjustment by the FRB) is exempt from the reserve requirements. Each of the Corporation’s bank subsidiaries is in compliance with the foregoing requirements.
Required reserves must be maintained in the form of either vault cash, an account at a Federal Reserve Bank or a pass-through account as defined by the FRB. Pursuant to the Emergency Economic Stabilization Act of 2008, the Federal Reserve Banks pay interest on depository institutions’ required and excess reserve balances. The interest rate paid on required reserve balances is currently the average target federal funds rate over the reserve maintenance period. The rate on excess balances will be set equal to the lowest target federal funds rate in effect during the reserve maintenance period.
Federal Securities Laws
- The Corporation is subject to the periodic reporting, proxy solicitation, tender offer, insider trading, corporate governance and other requirements under the Securities Exchange Act of 1934. Among other things, the federal securities laws require management to issue a report on the effectiveness of its internal controls over financial reporting. In addition, the Corporation’s independent registered public accountants are required to issue an opinion on the effectiveness of the Corporation’s internal control over financial reporting. These reports can be found in Part II, Item 8, "Financial Statements and Supplementary Data." Certifications of the Chief Executive Officer and the Chief Financial Officer as required by Sarbanes-Oxley and the resulting SEC rules can be found in the "Signatures" and "Exhibits" sections.
14
Executive Officers
As of
December 31, 2016
, the executive officers of the Corporation are as follows:
|
Name
|
Age
|
Office Held and Term of Office
|
||
|
E. Philip Wenger
|
59
|
Director of the Corporation since 2009. Mr. Wenger was appointed Chairman of the Board, President and Chief Executive Officer of the Corporation in January 2013. He previously served as President and Chief Operating Officer of the Corporation from 2008 to 2012, a Director of Fulton Bank, N.A. from 2003 to 2009, Chairman of Fulton Bank, N.A. from 2006 to 2009 and has been employed by the Corporation in a number of positions since 1979.
|
||
|
Philmer H. Rohrbaugh
|
64
|
Senior Executive Vice President, Chief Operating Officer and Chief Financial Officer of the Corporation effective December 6, 2016. He joined the Corporation in November 2012 as Senior Executive Vice President and Chief Risk Officer and became Senior Executive Vice President and Chief Operating Officer effective June 1, 2016. Mr. Rohrbaugh was a managing partner of KPMG, LLP's Chicago office from 2009 to 2012; Vice Chairman Industries and part of the U.S. Management Committee of KPMG from 2006 to 2009; he joined KPMG in 2002. He has more than 35 years of experience in public accounting with substantial audit experience serving public and private companies, including financial institutions, and advising companies on accounting, financial reporting matters, equity and debt offerings, and merger and acquisition transactions. Mr. Rohrbaugh currently serves as a director of a public manufacturing company and a national department store chain.
|
||
|
Beth Ann Chivinski
|
56
|
Senior Executive Vice President and Chief Risk Officer of the Corporation effective June1, 2016. Ms. Chivinski has worked in various positions with the Corporation since June of 1994. Most recently she served as the Corporation’s Senior Executive Vice President and Chief Audit Executive since April 1, 2013. Prior to that, she served as the Corporation’s Executive Vice President, Controller and Chief Accounting Officer from June 2004 to March 31, 2013. Ms. Chivinski is a Certified Public Accountant.
|
||
|
Meg R. Mueller
|
52
|
Senior Executive Vice President and Chief Credit Officer of the Corporation since July 2013. Executive Vice President and Chief Credit Officer since 2010. Ms. Mueller has been employed by the Corporation in a number of positions since 1996.
|
||
|
Curtis J. Myers
|
48
|
Senior Executive Vice President of the Corporation; and President and Chief Operating Officer of Fulton Bank, N.A. since July 2013. President and Chief Operating Officer of Fulton Bank, N.A. and Executive Vice President of the Corporation since August 2011. President and Chief Operating Officer of Fulton Bank, N.A. since February 2009. Mr. Myers has been employed by Fulton Bank, N.A. in a number of positions since 1990.
|
||
|
Craig A. Roda
|
60
|
Senior Executive Vice President of Community Banking of the Corporation since July 2011; and Chairman and Chief Executive Officer of Fulton Bank, N.A., since February 2009. Chief Executive Officer and President of Fulton Bank, N.A. from 2006 to 2009. Mr. Roda has been employed by the Corporation in a number of positions since 1979.
|
||
|
Angela M. Sargent
|
49
|
Senior Executive Vice President and Chief Information Officer of the Corporation since July 2013. Executive Vice President and Chief Information Officer since 2002. Ms. Sargent has been employed by the Corporation in a number of positions since 1992.
|
||
15
An investment in the Corporation's securities involves certain risks, including, among others, the risks described below. In addition to the other information contained in this report, you should carefully consider the following risk factors.
ECONOMIC AND CREDIT RISKS.
Difficult conditions in the economy and the capital markets may materially adversely affect the Corporation's business and results of operations.
The Corporation's results of operations and financial condition are affected by conditions in the capital markets and the economy generally. The Corporation's financial performance is highly dependent upon the business environment in the markets where the Corporation operates and in the U.S. as a whole. Unfavorable or uncertain economic and market conditions can be caused by declines in economic growth, business activity or investor or business confidence, limitations on the availability, or increases in the cost, of credit and capital, changes in the rate of inflation, changes in interest rates, high unemployment, natural disasters, acts of war or terrorism, global economic conditions and geopolitical factors, or a combination of these or other factors.
Specifically, the business environment impacts the ability of borrowers to pay interest on, and repay principal of, outstanding loans and the value of collateral securing those loans, as well as demand for loans and other products and services the Corporation offers. If the quality of the Corporation’s loan portfolio declines, the Corporation may have to increase its provision for credit losses, which would negatively impact its results of operations, and could result in charge-offs of a higher percentage of its loans. Unlike large, national institutions, the Corporation is not able to spread the risks of unfavorable local economic conditions across a large number of diversified economies and geographic locations. If the communities in which the Corporation operates do not grow, or if prevailing economic conditions locally or nationally are unfavorable, its business could be adversely affected. In addition, increased market competition in a lower demand environment could adversely affect the profit potential of the Corporation.
The Corporation is subject to certain risks in connection with the establishment and level of its allowance for credit losses.
The allowance for credit losses consists of the allowance for loan losses and the reserve for unfunded lending commitments. While the Corporation believes that its allowance for credit losses as of December 31, 2016 is sufficient to cover incurred losses in the loan portfolio on that date, the Corporation may need to increase its provision for credit losses due to changes in the risk characteristics of the loan portfolio, thereby negatively impacting its results of operations.
The allowance for loan losses represents management’s estimate of losses inherent in the loan portfolio as of the balance sheet date and is recorded as a reduction to loans. Management’s estimate of losses inherent in the loan portfolio is dependent on the proper application of its methodology for determining its allowance needs. The most critical judgments underpinning that methodology include: the ability to identify potential problem loans in a timely manner; proper collateral valuation of loans evaluated for impairment; proper measurement of allowance needs for pools of loans measured for impairment; and an overall assessment of the risk profile of the loan portfolio.
The Corporation determines the appropriate level of the allowance for credit losses based on many quantitative and qualitative factors, including, but not limited to: the size and composition of the loan portfolio; changes in risk ratings; changes in collateral values; delinquency levels; historical losses; and economic conditions. In addition, as the Corporation’s loan portfolio grows, it will generally be necessary to increase the allowance for credit losses through additional provisions, which will impact the Corporation’s operating results.
If the Corporation’s assumptions and judgments regarding such matters prove to be inaccurate, its allowance for credit losses might not be sufficient, and additional provisions for credit losses might need to be made. Depending on the amount of such provisions for credit losses, the adverse impact on the Corporation’s earnings could be material.
Furthermore, banking regulators may require the Corporation to make additional provisions for credit losses or otherwise recognize further loan charge-offs or impairments following their periodic reviews of the Corporation’s loan portfolio, underwriting procedures and allowance for credit losses. Any increase in the Corporation’s allowance for credit losses or loan charge-offs as required by such regulatory agencies could have a material adverse effect on the Corporation’s financial condition and results of operations. See Item 7. "Management’s Discussion and Analysis of Financial Condition and Results of Operations-Financial Condition-Provision and Allowance for Credit Losses."
16
Economic downturns and the composition of the Corporation’s loan portfolio subject the Corporation to credit risk.
National, regional and local economic conditions can impact the Corporation’s loan portfolio. For example, an increase in unemployment, a decrease in real estate values or changes in interest rates, as well as other factors, such as a substantial decline in the stock market, could weaken the economies of the communities the Corporation serves. Weakness in the market areas served by the Corporation may depress the Corporation’s earnings and consequently its financial condition because:
|
•
|
Borrowers may not be able to pay interest on, and repay their principal of, outstanding loans;
|
|
•
|
the value of the collateral securing the Corporation's loans to borrowers may decline; and
|
|
•
|
demand for loans, as well as and other products and services the Corporation offers, may decline.
|
Approximately
$10.9 billion
, or
74.5%
, of the Corporation’s loan portfolio was in commercial loans, commercial mortgage loans, and construction loans at December 31, 2016. Commercial loans, commercial mortgage loans and construction loans generally involve a greater degree of credit risk than residential mortgage loans and consumer loans because they typically have larger balances and are likely to be more sensitive to broader economic factors and conditions. Because payments on these loans often depend on the successful operation and management of businesses and properties, repayment of such loans may be affected by factors outside the borrower’s control, such as adverse conditions in the real estate markets, adverse economic conditions or changes in government regulation. In recent years, commercial real estate markets have been experiencing substantial growth, and increased competitive pressures have contributed significantly to historically low capitalization rates and rising property values. Commercial real estate prices, according to many U.S. commercial real estate indices, are currently above the 2007 peak levels that contributed to the financial crisis. Accordingly, the federal bank regulatory agencies have expressed concerns about weaknesses in the current commercial real estate market. The Corporation’s failure to adequately implement enhanced risk management policies, procedures and controls could adversely affect its ability to increase this portfolio going forward and could result in an increased rate of delinquencies in, and increased losses, from this portfolio. Furthermore, intense competition among lenders, coupled with moderate levels of recent economic growth, can increase pressure on the Corporation to relax its credit standards and/or underwriting criteria in order to achieve the Corporation’s loan growth targets. A relaxation of credit standards or underwriting criteria could result in greater challenges in the repayment or collection of loans should economic conditions, or individual borrower performance, deteriorate to a degree that could impact loan performance. Additionally, competitive pressures could drive the Corporation to consider loans and customer relationships that are outside of the Corporation’s established risk appetite or target customer base. See Item 7. "Management’s Discussion and Analysis of Financial Condition and Results of Operations-Financial Condition-Loans."
MARKET RISKS.
The Corporation is subject to interest rate risk.
The Corporation cannot predict or control changes in interest rates. The Corporation is affected by fiscal and monetary policies of the federal government, including those of the FRB, which regulates the national money supply and engages in other lending and investment activities in order to manage recessionary and inflationary pressures, many of which affect interest rates charged on loans and paid on deposits.
Net interest income is the difference between interest earned on interest-earning assets and interest paid on interest-bearing liabilities. Net interest income is the most significant component of the Corporation's net income, accounting for approximately
74%
of total revenues in 2016. In recent years, the narrowing of interest rate spreads, the difference between interest rates earned on loans and investments and interest rates paid on deposits and borrowings, has adversely affected the Corporation's net interest income.
Low market interest rates have pressured the net interest margin in recent years. Interest-earning assets, such as loans and investments, have been originated, acquired or repriced at lower rates, reducing the average rate earned on those assets. While the average rate paid on interest-bearing liabilities, such as deposits and borrowings, has also declined, the decline has not always occurred at the same pace as the decline in the average rate earned on interest-earning assets, resulting in a narrowing of the net interest margin.
Competition sometimes pressures the Corporation to lower rates charged on loans more than the decline in market rates would otherwise indicate. Competition may also pressure the Corporation to pay higher rates on deposits than market rates would otherwise indicate. Thus, although loan demand has improved in recent years, intense competition among lenders has contributed to downward pressure on loan yields, also narrowing the net interest margin. Further, due to historically low market interest rates, rates paid on deposits have tended to reach a natural floor below which it is difficult to further reduce such rates. See Item 7. "Management’s Discussion and Analysis of Financial Condition and Results of Operations-Net Interest Income."
17
Changes in interest rates may also affect the average life of loans and certain investment securities, most notably mortgage-backed securities. Decreases in interest rates can result in increased prepayments of loans and certain investment securities, as borrowers or issuers refinance to reduce their borrowing costs. Under those circumstances, the Corporation would be subject to reinvestment risk to the extent that it is not able to reinvest the cash received from such prepayments at rates that are comparable to the rates on the loans and investment securities which are prepaid. Conversely, increases in interest rates may extend the average life of fixed rate assets, which could restrict the Corporation’s ability to reinvest in higher yielding alternatives, and may result in customers withdrawing certificates of deposit early so long as the early withdrawal penalty is less than the interest they could receive as a result of the higher interest rates.
Changes in interest rates also affect the fair value of interest-earning investment securities. Generally, the value of interest-earning investment securities moves inversely with changes in interest rates. At December 31, 2016, the fair value of the Corporation’s portfolio of interest-earning investment securities was
$2.5 billion
. Net unrealized losses on these securities was
$47.3 million
at December 31, 2016. Whether a decline in fair value below the amortized cost of an investment security constitutes other-than-temporary impairment depends on a number of factors, including whether the Corporation has the intent and ability to retain the investment security for a period of time sufficient to allow for any anticipated recovery in fair value.
Changes in interest rates can affect demand for the Corporation’s products and services.
Movements in interest rates can cause demand for some of the Corporation’s products and services to be cyclical. As a result, the Corporation may need to periodically increase or decrease the size of certain of its businesses, including its personnel, to more appropriately match increases and decreases in demand and volume. The need to change the scale of these businesses is challenging, and there is often a lag between changes in the businesses and the Corporation’s reaction to these changes. For example, demand for residential mortgage loans has historically tended to increase during periods when interest rates were declining and to decrease during periods when interest rates were rising.
Price fluctuations in securities markets, as well as other market events, such as a disruption in credit and other markets and the abnormal functioning of markets for securities, could have an impact on the Corporation's results of operations.
The market value of the Corporation's securities investments, which include mortgage-backed securities, state and municipal securities, auction rate securities, corporate debt securities and equity investments, as well as the revenues the Corporation earns from its trust and investment management services business, are particularly sensitive to price fluctuations and market events. Declines in the values of the Corporation’s securities holdings, combined with adverse changes in the expected cash flows from these investments, could result in other-than-temporary impairment charges.
As of December 31, 2016, the Corporation’s securities investments included
$97.3 million
of investments in student loan auction rate certificates ("ARCs"). Following the failures of periodic auctions for these ARCs, which began in 2008 and have continued since that time, there has not been an active market for these securities. Other than sporadic redemptions and tender offers made by the issuers of these ARCs, these securities are illiquid. Secondary market transactions involving ARCs typically represent forced liquidations or distressed sales and do not provide an accurate basis for determining their fair value. The Corporation does not have the intent to sell the ARCs it holds and does not believe it will more likely than not be required to sell any of the ARCs it holds prior to a recovery of their fair value to amortized cost, which may be at maturity. However, if the Corporation chose to liquidate these securities prior to their maturity, it would likely have to do so at "distressed" sale prices and would likely do so at a loss.
A portion of the Corporation's securities portfolio includes holdings of equity investments, including stocks of publicly traded financial institutions. The portfolio of publicly traded financial institutions includes shares of a single financial institution which, as of December 31, 2016, had a fair value of
$11.9 million
. The Corporation's holdings of this financial institution’s securities constituted approximately
50.5%
of the fair value of the Corporation's aggregate holdings of publicly traded financial institutions’ securities as of that date.
The Corporation's investment management and trust services revenue, which is partially based on the value of the underlying investment portfolios, can also be impacted by fluctuations in the securities markets. If the values of those investment portfolios decrease, whether due to factors influencing U.S. or international securities markets, in general, or otherwise, the Corporation's revenue could be negatively impacted. In addition, the Corporation's ability to sell its brokerage services is dependent, in part, upon consumers' level of confidence in securities markets. See Item 7A. "Quantitative and Qualitative Disclosures About Market Risk."
18
LIQUIDITY RISK.
Changes in interest rates or disruption in liquidity markets may adversely affect the Corporation’s sources of funding
.
The Corporation must maintain sufficient sources of liquidity to meet the demands of its depositors and borrowers, support its operations and meet regulatory expectations. The Corporation’s liquidity management policies and practices emphasize core deposits and repayments and maturities of loans and investments as its primary sources of liquidity. These primary sources of liquidity can be supplemented by FHLB advances, borrowings from the Federal Reserve Bank, proceeds from the sales of loans and use of liquidity resources of the holding company, including capital markets funding. Lower-cost, core deposits may be adversely affected by changes in interest rates, and secondary sources of liquidity can be more costly to the Corporation than funding provided by deposit account balances having similar maturities. In addition, adverse changes in the Corporation’s results of operations or financial condition, downgrades in the Corporation’s credit ratings, regulatory actions involving the Corporation, or changes in regulatory, industry or market conditions could lead to increases in the cost of these secondary sources of liquidity, the inability to refinance or replace these secondary funding sources as they mature, or the withdrawal of unused borrowing capacity under these secondary funding sources.
While the Corporation attempts to manage its liquidity through various techniques, the assumptions and estimates used do not always accurately forecast the impact of changes in customer behavior. For example, the Corporation may face limitations on its ability to fund loan growth if customers move funds out of the Corporation’s bank subsidiaries’ deposit accounts in response to increases in interest rates. In the years following the 2008 financial crisis, even as the general level of market interest rates remained low by historical standards, depositors frequently avoided higher-yielding and higher-risk alternative investments, in favor of the safety and liquidity of non-maturing deposit accounts. These circumstances contributed to significant growth in non-maturing deposit account balances at the Corporation, and at depository financial institutions generally. Should interest rates rise, customers may become more sensitive to interest rates when making deposit decisions and considering alternative opportunities. This increased sensitivity to interest rates could cause customers to move funds into higher-yielding deposit accounts offered by the Corporation’s bank subsidiaries, require the Corporation’s bank subsidiaries to offer higher interest rates on deposit accounts to retain customer deposits or cause customers to move funds into alternative investments or deposits of other banks or non-bank providers. Technology and other factors have also made it more convenient for customers to transfer low-cost deposits into higher-cost deposits or into alternative investments or deposits of other banks or non-bank providers. Movement of customer deposits into higher-yielding deposit accounts offered by the Corporation’s bank subsidiaries, the need to offer higher interest rates on deposit accounts to retain customer deposits or the movement of customer deposits into alternative investments or deposits of other banks or non-bank providers could increase the Corporation’s funding costs, reduce its net interest margin and/or create liquidity challenges.
Market conditions have been negatively impacted by disruptions in the liquidity markets in the past, and such disruptions or an adverse change in the Corporation's results of operations or financial condition could, in the future, have a negative impact on secondary sources of liquidity. If the Corporation is not able to continue to rely primarily on customer deposits to meet its liquidity and funding needs, continue to access secondary, non-deposit funding sources on favorable terms or otherwise fails to manage its liquidity effectively, the Corporation’s ability to continue to grow may be constrained and the Corporation’s liquidity, operating margins, results of operations and financial condition may be materially adversely affected. See Item 7A. "Quantitative and Qualitative Disclosures About Market Risk-Interest Rate Risk, Asset/Liability Management and Liquidity."
Liquidity planning at both the bank and holding company levels has become an area of increased regulatory emphasis.
Due to regulatory constraints on the Corporation’s ability to rely on short-term borrowings, any significant movements of deposits away from traditional depository accounts which negatively impacts the Corporation’s loan-to-deposit ratio could restrict its ability to achieve growth in loans or require the Corporation to pay higher interest rates on deposit products in order to retain deposits to fund loans.
Liquidity must also be managed at the holding company level. Banking regulators carefully scrutinize liquidity at the holding company level, in addition to consolidated and bank liquidity levels. For safety and soundness reasons, banking regulations limit the amount of cash that can be transferred from bank subsidiaries to the parent company in the form of loans and dividends. Generally, these limitations are based on the bank subsidiaries' regulatory capital levels and their net income. These factors have affected some institutions' ability to pay dividends and have required some institutions to establish borrowing facilities at the holding company level.
LEGAL, COMPLIANCE AND REPUTATIONAL RISKS.
The Corporation and its bank subsidiaries are subject to extensive regulation and supervision and may be adversely affected by changes in laws and regulations or any failure to comply with laws and regulations.
19
Virtually every aspect of the Corporation's and its bank subsidiaries’ operations is subject to extensive regulation and supervision by federal and state regulatory agencies. Under this regulatory framework, regulatory agencies have broad authority in carrying out their supervisory, examination and enforcement responsibilities to address compliance with applicable laws and regulations, including laws and regulations relating to capital adequacy, asset quality, liquidity and risk management, as well as laws and regulations governing consumer protection, fair lending, privacy, information security and anti-money laundering and anti-terrorism laws, among other aspects of the Corporation’s business.
Federal and state legislatures and regulatory agencies continually review banking and other laws, regulations and policies for possible changes. Changes in federal or state laws, regulations or governmental policies, including income tax laws, affecting the Corporation and its business, and the effects of such changes, are difficult to predict and may produce unintended consequences. New laws, regulations or changes in the regulatory environment could limit the types of financial services and products the Corporation may offer, alter demand for existing products and services, increase the ability of non-banks to offer competing financial services and products, increase compliance burdens, or otherwise adversely affect the Corporation’s business, results of operations or financial condition.
The Corporation has six bank subsidiaries, and the Corporation and its subsidiaries are subject to regulation by a relatively large number of federal and state regulatory agencies. This corporate structure presents challenges, specifically, the need for compliance with different, and potentially inconsistent, regulatory requirements and expectations. The time, expense and internal and external resources associated with regulatory compliance continue to increase, and balancing the need to address regulatory changes and effectively manage overall non-interest expenses has become more challenging than it has been in the past. As a result, the Corporation’s
compliance obligations increase the Corporation's expense, require increasing amounts of management's attention and can be a disadvantage from a competitive standpoint with respect to non-regulated competitors and larger bank competitors with more extensive resources.
The Corporation has announced that it is developing plans to seek regulatory approval to begin the process of consolidating its six bank subsidiaries. This multi-year consolidation process is expected to eventually result in the Corporation conducting its core banking business through a single bank subsidiary, which would reduce the number of government agencies that regulate the Corporation’s banking operations. The timing of the commencement of this consolidation process will depend significantly on the Corporation and its bank subsidiaries making necessary progress in enhancing a largely centralized compliance program designed to comply with the requirements of the BSA, the Patriot Act and related anti-money laundering regulations (collectively, the "BSA/AML Requirements"). The Corporation will also need to establish, to the satisfaction of the Corporation’s banking regulatory agencies, that those enhancements are sustainable to achieve compliance with the regulatory enforcement orders issued to the Corporation and its bank subsidiaries by their respective banking regulatory agencies relating to identified deficiencies in that compliance program. There is no assurance that the regulatory approvals required for such consolidation can be obtained or that such consolidation would significantly reduce the time, expense and internal and external resources associated with regulatory compliance.
Compliance with banking statutes and regulations is important to the Corporation’s ability to engage in new activities and to consummate certain transactions. Banking regulators are scrutinizing banks through longer and more intensive bank examinations. Federal and state banking agencies possess broad powers to take supervisory actions, as they deem appropriate. These supervisory actions may result in higher capital requirements, higher deposit insurance premiums and limitations on the Corporation’s operations and expansion activities that could have a material adverse effect on its business and profitability. As noted below and as examples of such limitations, the regulatory enforcement orders to which the Corporation and each of its bank subsidiaries are subject impose certain restrictions on the expansion activities of the Corporation and such bank subsidiaries.
In addition, in September 2016, the CFPB and the OCC entered into a consent order with a large national bank alleging widespread improper sales practices, which prompted the federal bank regulatory agencies to conduct a horizontal review of sales practices throughout the banking industry. The elevated attention likely will result in continued additional regulatory scrutiny and regulation of incentive arrangements, which could adversely impact the delivery of services and increase compliance costs.
Failure to comply with these regulatory requirements, including inadvertent or unintentional violations, may result in the assessment of fines and penalties, or the commencement of further informal or formal regulatory enforcement actions against the Corporation or its bank subsidiaries. Other negative consequences can also result from such failures, including regulatory restrictions on the Corporation's activities, including restrictions on the Corporation’s ability to grow through acquisition, reputational damage, restrictions on the ability of institutional investment managers to invest in the Corporation's securities, and increases in the Corporation's costs of doing business. The occurrence of one or more of these events may have a material adverse effect on the Corporation's business, financial condition and/or results of operations.
20
The Corporation and its bank subsidiaries are subject to regulatory enforcement orders requiring improvement in compliance functions and remedial actions.
In recent years, a combination of financial reform legislation and heightened scrutiny by banking regulators have significantly increased expectations regarding what constitutes an effective risk and compliance management infrastructure. To keep pace with these expectations, the Corporation has invested considerable resources in initiatives designed to strengthen its risk management framework and regulatory compliance programs, including those designed to comply with the BSA/AML Requirements.
Nonetheless, as mentioned above, the Corporation and each of its bank subsidiaries are subject to regulatory enforcement orders issued during 2014 and 2015 by their respective Federal and state bank regulatory agencies relating to identified deficiencies in the Corporation’s centralized BSA and anti-money laundering compliance program (the “BSA/AML Compliance Program”), which was designed to comply with the BSA/AML Requirements.
The regulatory enforcement orders, which are in the form of consent orders or orders to cease and desist issued upon consent (the “Consent Orders”), generally require, among other things, that the Corporation and its bank subsidiaries undertake a number of required actions to strengthen and enhance the BSA/AML Compliance Program, and, in some cases, conduct retrospective reviews of past account activity and transactions, as well as certain reports filed in accordance with the BSA/AML Requirements, to determine whether suspicious activity and certain transactions in currency were properly identified and reported in accordance with the BSA/AML Requirements.
In addition to requiring strengthening and enhancement of the BSA/AML Compliance Program, while the Consent Orders remain in effect, the Corporation is subject to certain restrictions on expansion activities, such as growth through acquisition or branching to supplement organic growth of the Corporation and its bank subsidiaries. Further, any failure to comply with the requirements of any of the Consent Orders involving the Corporation or its bank subsidiaries could result in further enforcement actions, the imposition of material restrictions on the activities of the Corporation or its bank subsidiaries, or the assessment of fines or penalties.
Additional expenses and investments have been incurred as the Corporation expanded its hiring of personnel and use of outside professionals, such as consulting and legal services, and capital investments in operating systems to strengthen and support the BSA/AML Compliance Program, as well as the Corporation’s broader compliance and risk management infrastructures. The expense and capital investment associated with all of these efforts, including in connection with the Consent Orders, have had an adverse effect on the Corporation’s results of operations in recent periods and could have a material adverse effect on the Corporation’s results of operations in one or more future periods.
Finally, due to the existence of the Consent Orders, some counterparties may not be permitted to, due to their internal policies, or may choose not to do business with the Corporation or its bank subsidiaries. Should counterparties upon which the Corporation or its bank subsidiaries rely for the conduct of their business become unwilling to do business with the Corporation or its bank subsidiaries, the Corporation’s results of operations and/or financial condition could be materially adversely effected.
While the Corporation believes that it has made significant progress in improving its BSA/AML Compliance Program, there is no assurance as to how long the Consent Orders will remain in effect.
The Corporation's largest subsidiary, Fulton Bank, is expected to have had total assets of $10 billion or more for four consecutive quarters as of March 31, 2017, which will subject it to additional regulation and increased supervision.
The Dodd-Frank Act imposes additional regulatory requirements on institutions with $10 billion or more in assets. The Corporation's largest bank subsidiary, Fulton Bank, had
$10.7 billion
in assets as of December 31, 2016, and had assets of $10 billion or more as of the end of each of the previous two quarters. If Fulton Bank has assets of $10 billion or more as of March 31, 2017, it will become subject to the following:
|
•
|
Supervion, examination and enforcement jurisdiction by the CFPB with respect to consumer financial protection laws;
|
|
•
|
Additional stress testing requirements;
|
|
•
|
A modified methodology for calculating FDIC insurance assessments and potentially higher assessment rates as a result of institutions with $10 billion or more in assets being required to bear the cost of raising the FDIC reserve ratio to 1.35% as required by the Dodd-Frank Act;
|
|
•
|
Heightened compliance standards under the Volcker Rule; and
|
|
•
|
Enhanced bank regulatory supervision as a larger financial institution.
|
21
In addition, the Corporation’s other bank subsidiaries will also become subject to the supervision, examination and enforcement jurisdiction by the CFPB with respect to consumer financial protection laws. See Item 1. "Business-Supervision and Regulation."
Financial reform legislation continues to have a significant impact on the Corporation's business and results of operations; however, until more implementing regulations are adopted, the extent to which the legislation will impact the Corporation is uncertain.
The Dodd-Frank Act was enacted in 2010. The scope of the Dodd-Frank Act impacted many aspects of the financial services industry, and the Act required the development and adoption of many regulations, a number of which have not yet been adopted or fully implemented. The delay in the implementation of many of the regulations mandated by the Dodd-Frank Act on the timelines contemplated by such legislation has resulted in a lack of clear regulatory guidance to banks with respect to certain matters. The resulting uncertainty can cause banks to take a cautious approach to certain business initiatives and planning. Additional uncertainty regarding the effect of the Dodd-Frank Act exists due to court decisions and the potential for additional legislative changes to the Dodd-Frank Act.
The Corporation has been impacted, and will likely continue to be in the future, by the so-called Durbin Amendment to the Dodd-Frank Act, which reduced debit card interchange revenue of banks, and revised FDIC deposit insurance assessments. The Corporation has also been impacted by the Dodd-Frank Act in the areas of corporate governance, capital requirements, risk management, stress testing and regulation under consumer protection laws.
The Dodd-Frank Act established the CFPB. Among other things, the CFPB was given rulemaking authority over most providers of consumer financial services in the U.S., examination and enforcement authority over the consumer operations of large banks, as well as interpretive authority with respect to numerous existing consumer financial services regulations. The CFPB began exercising these oversight authorities over the largest banks during 2011. As an independent bureau funded by the FRB, the CFPB may impose requirements more severe than the previous bank regulatory agencies. The CFPB has also been directed to write rules identifying practices or acts that are unfair, deceptive or abusive in connection with any transaction with a consumer for a consumer financial product or service, or the offering of a consumer financial product or service. The CFPB has initiated enforcement actions against a variety of bank and non-bank market participants with respect to a number of consumer financial products and services that has resulted in those participants expending significant time, money and resources to adjust to the initiatives being pursued by the CFPB. These enforcement actions may serve as precedent for how the CFPB interprets and enforces consumer protection laws, including practices or acts that are deemed to be unfair, deceptive or abusive, with respect to all supervised institutions, which may result in the imposition of higher standards of compliance with such laws. The concept of what may be considered to be an “abusive” practice is relatively new under the law.
Pursuant to the Dodd-Frank Act, the CFPB issued a series of final rules in January 2013 related to mortgage loan origination and mortgage loan servicing. These final rules prohibit creditors, such as the Corporation's bank subsidiaries, from extending residential mortgage loans without regard for the consumer's ability to repay, provide certain safe harbor protections for the origination of loans that meet the requirements for a "qualified mortgage" and add restrictions and requirements to residential mortgage origination and servicing practices. In addition, these rules restrict the imposition of prepayment penalties and compensation practices relating to residential mortgage loan origination. These rules may subject the Corporation’s bank subsidiaries to increased potential liability related to their residential loan origination activities, as well as increase costs. See Item 1. "Business-Supervision and Regulation."
In May 2016, the CFPB issued a proposed rule that would prohibit banks from using a pre-dispute arbitration agreement to block consumer class actions in court and would require banks to insert language into their arbitration agreements reflecting this limitation. The proposed rule would also require banks that use pre-dispute arbitration agreements to submit certain records relating to arbitral proceedings to the CFPB. The proposed rule would generally apply to contracts entered into more than 180 days after the effective date of any final rule. If adopted as proposed, this rule could result in increased litigation and defense costs as plaintiff’s class action firms would feel encouraged to seek clients as class representatives for alleged consumer harm that otherwise would have been the subject to the existing arbitration clauses in consumer contracts. This proposed rule, if adopted, and other CFPB regulations likely will continue to increase the Corporation’s compliance expenses.
Fulton Bank and the Corporation’s other bank subsidiaries are expected to become (as of March 31, 2017) subject to supervision and examination by the CFPB for compliance with the CFPB’s regulations and policies. The costs and limitations related to this additional regulatory regimen have yet to be fully determined, however they could result in material adverse effects on the Corporation’s profitability.
22
The financial services industry, as well as the broader economy, may be subject to new legislation, regulation, and government policy.
At this time, it is difficult to predict the legislative and regulatory changes that will result from the combination of a new President of the United States and, for the first year since 2010, both Houses of Congress and the White House have majority memberships from the same political party. In recent years, however, both the new President and senior members of the House of Representatives have advocated for significant reduction of financial services regulation, to include amendments to the Dodd-Frank Act and structural changes to the CFPB, and consideration of significant changes to the federal income tax code. In addition, the new Administration and Congress may cause broader economic changes due to changes in governing ideology and governing style. New appointments to the Board of Governors of the Federal Reserve could affect monetary policy and interest rates, and changes in fiscal policy could affect broader patterns of trade and economic growth. Future legislation, regulation, and government policy could affect the banking industry as a whole, including the Corporation’s business and results of operations, in ways that are difficult to predict. In addition, the Corporation’s results of operations could also be adversely affected by changes in the way in which existing statutes and regulations are interpreted or applied by courts and government agencies.
Negative publicity could damage the Corporation’s reputation and business.
Reputation risk, or the risk to the Corporation's earnings and capital from negative public opinion, is inherent in the Corporation's business. Negative public opinion could result from the Corporation's actual or alleged conduct in any number of activities, including lending practices, corporate governance, regulatory, compliance, mergers and acquisitions, and disclosure, sharing or inadequate protection of customer information, and from actions taken by government agencies and community organizations in response to that conduct. Because the Corporation conducts the majority of its businesses under the "Fulton" brand, negative public opinion about one line of business could affect the Corporation's other lines of businesses.
From time to time the Corporation and its subsidiaries may be the subject of litigation and governmental or administrative proceedings. Adverse outcomes of any such litigation or proceedings may have a material adverse impact on the Corporation’s business and results of operations as well as its reputation.
Many aspects of the Corporation’s business involve substantial risk of legal liability. From time to time, the Corporation and its subsidiaries have been named or threatened to be named as defendants in various lawsuits arising from its business activities (and in some cases from the activities of companies that were acquired). In addition, the Corporation and its bank subsidiaries are regularly the subject of governmental investigations and other forms of regulatory inquiry. For example, the Corporation is cooperating with the U.S. Department of Justice in an investigation regarding potential violations of the fair lending laws by Fulton Bank, Fulton Bank of New Jersey, The Columbia Bank and Lafayette Ambassador Bank due to potential lending discrimination on the basis of race and national origin. Like other large financial institutions, the Corporation is also subject to risk from potential employee misconduct, including non-compliance with policies and improper use or disclosure of confidential information. These matters could result in adverse judgments, settlements, fines, penalties, injunctions or other relief. Substantial legal liability or significant regulatory actions against us could materially adversely affect our business, financial condition or results of operations and/or cause significant reputational harm to our business. The Corporation establishes reserves for legal claims when payments associated with the claims become probable and the costs can be reasonably estimated. However, the Corporation may still incur legal costs for a matter, even if a reserve has not been established.
Currently, the Corporation and its bank subsidiaries are the subject of regulatory proceedings in the form of the Consent Orders. The Corporation can provide no assurance as to the outcome or resolution of legal or administrative actions, and such actions may result in judgments against us for significant damages or the imposition of regulatory restrictions on our operations. Resolution of these types of matters can be prolonged and costly, and the ultimate results or judgments are uncertain due to the inherent uncertainty in the outcomes of litigation and other proceedings.
The Corporation is subject to a variety of risks in connection with origination and sale of loans.
The Corporation originates residential mortgage loans and other loans, such as loans guaranteed, in part, by the U.S. Small Business Administration, all or portions of which are later sold in the secondary market to government sponsored enterprises or agencies, such as the Federal National Mortgage Association (Fannie Mae), and other non-government sponsored investors. In connection with such sales, the Corporation makes certain representations and warranties with respect to matters such as the underwriting, origination, documentation or other characteristics of the loans sold. The Corporation may be required to repurchase a loan, or to reimburse the purchaser of a loan for any related losses, if it is determined that the loan sold was in violation of representations or warranties made at the time of the sale, and, in some cases, if there is evidence of borrower fraud, in the event of early payment default by the borrower on the loan, or for other reasons. The Corporation maintains reserves for potential losses on certain loans sold, however, it is possible that losses incurred in connection with loan repurchases and reimbursement payments may be in
23
excess of any applicable reserves, and the Corporation may be required to increase reserves and may sustain additional losses associated with such loan repurchases and reimbursement payments in the future. Increases to the reserves and losses incurred in connection with actual loan repurchases and reimbursement payments in excess of the amount of any applicable reserves could have a material adverse effect on the Corporation’s financial condition or results of operations.
STRATEGIC AND EXTERNAL RISKS.
The Corporation is in the process of transforming its business model and this transformation may not be successful.
The Corporation historically has followed a "super-community" banking strategy under which the Corporation has operated its bank subsidiaries autonomously to maximize the advantages of the community banking model in serving the needs of its customers. Reliance on this model has posed challenges to the Corporation's efforts to manage risk efficiently and effectively through a centralized risk management and compliance function. As a result of these challenges and a desire to refine its business strategy, the Corporation is in the process of transitioning to a business model that is primarily focused on alignment of services with the customer segments the Corporation serves and less oriented to geographic boundaries.
The transformation of the Corporation’s business model, which is being implemented over a period of several years, may have some or all of the following unintended effects:
|
•
|
The efficiencies sought may not be achieved;
|
|
•
|
Some customers may not receive the change in business model in a positive manner, and relationships with these customers may be jeopardized;
|
|
•
|
The changes in organizational structure and the evolution of the Corporation’s culture that will be required to support the transition to the new business model may lead to dissatisfaction among employees which could make it more difficult for the Corporation to retain key employees;
|
|
•
|
The transition to the new business model may create operational and other challenges that are disruptive to the Corporation’s business; and
|
|
•
|
Expenses will be incurred in the implementation of the new business model, and the implementation process may distract the Corporation from achieving other fundamental business objectives.
|
The Corporation may not be able to achieve its growth plans.
The Corporation’s business plan includes the pursuit of profitable growth. Under current economic, competitive and regulatory conditions, profitable growth may be difficult to achieve due to one or more of the following factors:
|
•
|
In the current, prolonged low interest rate environment, the Corporation’s net interest margin has been compressed, and it is possible that a net interest margin that is lower than historical levels could continue for some time. As a result, income growth will likely need to come from growth in the volume of earning assets, particularly loans, and an increase in non-interest income. However, customer demand and competition could make such income growth difficult to achieve;
|
|
•
|
Operating expenses, particularly in the compliance and risk management areas, have been elevated, and such expenses may increase in the near future, as a result of Fulton Bank surpassing the $10 billion in assets threshold; and
|
|
•
|
Growth through acquisition or branching to supplement organic growth is unlikely to occur while the Consent Orders referenced above are in place, due to an inability to obtain the required regulatory approvals.
|
The competition the Corporation faces is significant and may reduce the Corporation's customer base and negatively impact the Corporation's results of operations.
There is significant competition among commercial banks in the market areas served by the Corporation. In addition, the Corporation also competes with other providers of financial services, such as savings and loan associations, credit unions, consumer finance companies, securities firms, insurance companies, commercial finance and leasing companies, the mutual funds industry, full service brokerage firms and discount brokerage firms, some of which are subject to less extensive regulation than the Corporation is with respect to the products and services they provide and have different cost structures. Some of the Corporation's competitors have greater resources, higher lending limits, lower cost of funds and may offer other services not offered by the Corporation. The Corporation also experiences competition from a variety of institutions outside its market areas. Some of these institutions conduct business primarily over the Internet and, as a result, may be able to realize certain cost savings and offer products and services at more favorable rates and with greater convenience to the customer. The financial services industry could become even more competitive as a result of legislative, regulatory and technological changes and continued consolidation. In addition, technology
24
has lowered barriers to entry and made it possible for non-banks to offer products and services traditionally provided by banks, such as transferring funds and paying bills.
Competition may adversely affect the rates the Corporation pays on deposits and charges on loans, and could result in the loss of fee income, as well as the loss of customer deposits and the income generated from those deposits, thereby potentially adversely affecting the Corporation's profitability and its ability to continue to grow. The Corporation's profitability and continued growth depends upon its continued ability to successfully compete in the market areas it serves. See Item 1. “Business-Competition."
If the goodwill that the Corporation has recorded in connection with its acquisitions becomes impaired, it could have a negative impact on the Corporation's results of operations.
In the past, the Corporation supplemented its internal growth with strategic acquisitions of banks, branches and other financial services companies. If the purchase price of an acquired company exceeds the fair value of the company's net assets, the excess is carried on the acquirer's balance sheet as goodwill. As of December 31, 2016, the Corporation had
$530.6 million
of goodwill recorded on its balance sheet. The Corporation is required to evaluate goodwill for impairment at least annually. Write-downs of the amount of any impairment, if necessary, are to be charged to earnings in the period in which the impairment occurs. There can be no assurance that future evaluations of goodwill will not result in impairment charges.
Changes in accounting policies, standards, and interpretations could materially affect how we report our financial condition and results of operations.
The preparation of the Corporation’s financial statements in accordance with U.S. generally accepted accounting principles requires management to make estimates and assumptions that affect the reported amounts of assets and liabilities as of the date of the financial statements, as well as revenues and expenses during the period. A summary of the accounting policies that the Corporation considers to be most important to the presentation of its financial condition and results of operations, because they require management’s most difficult judgments as a result of the need to make estimates about the effects of matters that are inherently uncertain, including those related to the allowance for credit losses, goodwill, income taxes, and fair value measurements, is set forth in Item 7. "Management’s Discussion and Analysis of Financial Condition and Results of Operations-Critical Accounting Policies" and within "Note 1-Summary of Significant Accounting Policies," in the Notes to Consolidated Financial Statements in Item 8. "Financial Statements and Supplementary Data."
A variety of factors could affect the ultimate values of assets, liabilities, income and expenses recognized and reported in the Corporation’s financial statements and these ultimate values may differ materially from those determined based on management’s estimates and assumptions. In addition, the Financial Accounting Standards Board ("FASB"), regulatory agencies, and other bodies that establish accounting standards from time to time change the financial accounting and reporting standards governing the preparation of the Corporation’s financial statements. Further, those bodies that establish and interpret the accounting standards (such as the FASB, the Securities and Exchange Commission, and banking regulators) may change prior interpretations or positions regarding how these standards should be applied. These changes can be difficult to predict and can materially affect how the Corporation records and reports its financial condition and results of operations. For example, during 2016, the FASB issued a new accounting standard, Accounting Standards Update 2016-13, that will require the recognition of credit losses on loans and other financial assets based on an entity’s current estimate of expected losses over the lifetime of each loan or other financial asset, referred to as the current expected credit loss ("CECL") model, as opposed to current accounting standards, which require recognition of losses on loans and other financial assets only when those losses are "probable." The Corporation’s adoption of this accounting standard, which is required for interim and annual reporting periods beginning after December 15, 2019, could materially affect the Corporation’s allowance for credit losses methodology, financial condition, capital levels and results of operations, including expenses the Corporation may incur in implementing this accounting standard.See "Note 1 - Summary of Significant Accounting Policies - Recently Issued Accounting Standards" in the Notes to Consolidated Financial Statements in Item 8. "Financial Statements and Supplementary Data."
OPERATIONAL RISKS.
The Corporation is exposed to many types of operational and other risks and the Corporation's framework for managing risks may not be effective in mitigating risk.
The Corporation is exposed to many types of operational risk, including the risk of human error or fraud by employees and other third parties, intentional and inadvertent misrepresentation by loan applicants, unsatisfactory performance by employees and vendors, clerical and record-keeping errors, computer and telecommunications systems malfunctions or failures and reliance on data that may be faulty or incomplete. In an environment characterized by continual, rapid technological change, as discussed below, when the Corporation introduces new products and services, or makes changes to its information technology systems and
25
processes, these operational risks are increased. Any of these operational risks could result in the Corporation's diminished ability to operate one or more of its businesses, financial loss, potential liability to customers, inability to secure insurance, reputational damage and regulatory intervention, which could materially adversely affect the Corporation.
The Corporation’s risk management framework is subject to inherent limitations, and risks may exist, or develop in the future, that the Corporation has not anticipated or identified. If the Corporation's risk management framework proves to be ineffective, the Corporation could suffer unexpected losses and could be materially adversely affected. As noted above, the Corporation’s historical decentralized banking strategy further challenges the Corporation's efforts to manage risk efficiently and effectively through a centralized risk management and compliance function.
The Corporation’s operational risks include risks associated with third-party vendors and other financial institutions.
The Corporation relies upon certain third-party vendors to provide products and services necessary to maintain its day-to-day operations, including, notably, responsibility for the core processing system that services all of the Corporation’s bank subsidiaries. Accordingly, the Corporation’s operations are exposed to the risk that these vendors might not perform in accordance with applicable contractual arrangements or service level agreements. The failure of an external vendor to perform in accordance with applicable contractual arrangements or service level agreements could be disruptive to the Corporation’s operations, which could have a material adverse effect on the Corporation’s financial condition and/or results of operations. Further, third-party vendor risk management has become a point of regulatory emphasis recently. A failure of the Corporation to follow applicable regulatory guidance in this area could expose the Corporation to regulatory sanctions.
The commercial soundness of many financial institutions may be closely interrelated as a result of credit, trading, execution of transactions or other relationships between the institutions. As a result, concerns about, or a default or threatened default by, one institution could lead to significant market-wide liquidity and credit problems, losses or defaults by other institutions. This risk is sometimes referred to as "systemic risk" and may adversely affect financial intermediaries, such as clearing agencies, clearing houses, banks, securities firms and exchanges, with which the Corporation interacts on a daily basis, and therefore could adversely affect the Corporation.
Any of these operational or other risks could result in the Corporation's diminished ability to operate one or more of its businesses, financial loss, potential liability to customers, inability to secure insurance, reputational damage and regulatory intervention, which could materially adversely affect the Corporation.
The Corporation’s internal controls may be ineffective.
One critical component of the Corporation’s risk management framework is its system of internal controls. Management regularly reviews and updates the Corporation’s internal controls, disclosure controls and procedures, and corporate governance policies and procedures. Any system of controls, however well designed and operated, is based in part on certain assumptions and can provide reasonable, but not absolute, assurances that the objectives of the controls are met. Any failure or circumvention of the Corporation’s controls and procedures or failure to comply with regulations related to controls and procedures could have a material adverse effect on the Corporation’s business, results of operations, financial condition and reputation. See Item 9A. "Controls and Procedures."
Loss of, or failure to adequately safeguard, confidential or proprietary information may adversely affect the Corporation's operations, net income or reputation.
The Corporation’s business is highly dependent on information systems and technology and the ability to collect, process, transmit and store significant amounts of confidential information regarding customers, employees and others on a daily basis. While the Corporation performs some of the functions required to operate its business directly, it also outsources significant business functions, such as processing customer transactions, maintenance of customer-facing websites, including its online banking function, and developing software for new products and services, among others. These relationships require the Corporation to allow third parties to access, store, process and transmit customer information. As a result, the Corporation may be subject to cyber security risks directly, as well as indirectly through the vendors to whom it outsources business functions. The increased use of smartphones, tablets and other mobile devices, as well as cloud computing, may also heighten these and other operational risks. Cyber threats could result in unauthorized access, loss or destruction of customer data, unavailability, degradation or denial of service, introduction of computer viruses and other adverse events, causing the Corporation to incur additional costs (such as repairing systems or adding new personnel or protection technologies). Cyber threats may also subject the Company to regulatory investigations, litigation or enforcement or require the payment of regulatory fines or penalties, all or any of which could adversely affect the Corporation’s business, financial condition or results of operations and damage its reputation.
26
The Corporation attempts to reduce its exposure to its vendors’ cyber incidents by performing initial vendor due diligence that is updated periodically for critical vendors, negotiating service level standards with vendors, negotiating for indemnification from vendors for confidentiality and data breaches, and limiting third-party access to the least privileged level necessary to perform outsourced functions, among other things. The Corporation also uses monitoring and preventive controls to detect and respond to cyber threats to its own systems before they become significant. However, there can be no assurance that the measures employed by the Corporation to combat direct or indirect cyber threats will be effective. In addition, because the methods of cyber attacks change frequently or, in some cases, are not recognized until launched, the Corporation may be unable to implement effective preventive control measures or proactively address these methods. The Corporation’s or a vendor’s failure to promptly identify and counter a cyber attack may result in increased costs and consequences of a successful cyber attack. Although the Corporation maintains insurance coverage that may, subject to policy terms and conditions, cover certain aspects of cyber risks, such insurance coverage may be inapplicable or otherwise insufficient to cover any or all losses.
Account data compromise events at large retailers, health insurers and others in recent years have resulted in heightened legislative and regulatory focus on privacy, data protection and information security. New or revised laws and regulations may significantly impact the Corporation’s current and planned privacy, data protection and information security-related practices, the collection, use, sharing, retention and safeguarding of consumer and employee information, and current or planned business activities. Compliance with current or future privacy, data protection and information security laws to which the Corporation is subject could result in higher compliance and technology costs and could restrict the Corporation’s ability to provide certain products and services, which could materially and adversely affect the Corporation’s profitability. The Corporation’s failure to comply with privacy, data protection and information security laws could result in potentially significant regulatory and governmental investigations and/or actions, litigation, fines, sanctions and damage to the Corporation’s reputation and its brand.
The Corporation continually encounters technological change.
The financial services industry is continually undergoing rapid technological change with frequent introductions of new technology-driven products and services. The effective use of technology increases efficiency and enables financial institutions to better serve customers and to reduce costs. The Corporation’s future success depends, in part, upon its ability to address the needs of its customers by using technology to provide products and services that will satisfy customer demands, as well as to create additional efficiencies in the Corporation’s operations. The costs of new technology, including personnel, can be high, in both absolute and relative terms. Many of the Corporation’s financial institution competitors have substantially greater resources to invest in technological improvements. In addition, new payment services developed and offered by non-bank competitors pose an increasing threat to the traditional payment services offered by financial institutions. The Corporation may not be able to effectively implement new technology-driven products and services, be successful in marketing these products and services to its customers, or effectively deploy new technologies to improve the efficiency of its operations. Failure to successfully keep pace with technological change affecting the financial services industry could have a material adverse impact on the Corporation’s business, financial condition and results of operations.
There can be no assurance, given the past pace of change and innovation, that the Corporation’s technology, either purchased or developed internally, will meet or continue to meet the needs of the Corporation and the needs of its customers.
In addition, advances in technology, as well as changing customer preferences favoring access to the Corporation’s products and services through digital channels, could decrease the value of the Corporation’s branch network and other assets. If customers increasingly choose to access the Corporation’s products and services through digital channels, the Corporation may find it necessary to consolidate, close or sell branch locations or restructure its branch network. These actions could lead to losses on assets, expenses to reconfigure branches and the loss of customers in affected markets. As a result, the Corporation’s business, financial condition or results of operations may be adversely affected.
The Corporation may not be able to attract and retain skilled people.
The Corporation’s success depends, in large part, on its ability to attract and retain skilled people. Competition for talented personnel in most activities engaged in by the Corporation can be intense, and the Corporation may not be able to hire sufficiently skilled people or to retain them. The unexpected loss of services of one or more of the Corporation’s key personnel could have a material adverse impact on the Corporation’s business because of their skills, knowledge of the Corporation’s markets, years of industry experience and the difficulty of promptly finding qualified replacement personnel.
As an example, and as noted above, the Corporation is engaged in an effort to enhance its compliance and risk management functions. Because many of the Corporation’s peers are engaged in similar efforts, the competition for personnel with skills in these areas can be significant and, to the extent that the Corporation is able to attract qualified personnel, the expense associated with hiring and retaining such personnel may be substantial.
27
RISKS RELATED TO AN INVESTMENT IN THE CORPORATION’S SECURITIES.
The Corporation's future growth may require the Corporation to raise additional capital in the future, but that capital may not be available when it is needed or may be available only at an excessive cost.
The Corporation is required by regulatory agencies to maintain adequate levels of capital to support its operations. The Corporation anticipates that current capital levels will satisfy regulatory requirements for the foreseeable future. The Corporation, however, may at some point choose to raise additional capital to support future growth. The Corporation's ability to raise additional capital will depend, in part, on conditions in the capital markets at that time, which are outside of the Corporation's control. Accordingly, the Corporation may be unable to raise additional capital, if and when needed, on terms acceptable to the Corporation, or at all. If the Corporation cannot raise additional capital when needed, its ability to expand operations through internal growth and acquisitions could be materially impacted. In the event of a material decrease in the Corporation's stock price, future issuances of equity securities could result in dilution of existing shareholder interests.
Capital planning has taken on more importance due to regulatory requirements and the Basel III capital standards.
Consistent with current regulatory guidance, the Corporation conducts an annual stress test using internal financial data and different economic scenarios provided by the FRB, and reports the results of the stress test to the FRB. The Corporation's board of directors and its senior management are required to consider the results of the annual stress test in the normal course of business, including as part of its capital planning process and the evaluation of the adequacy of its capital. The results of future stress testing processes may lead the Corporation to retain additional capital or alter the mix of its capital components. In addition, the implementation of certain regulations with regard to regulatory capital could disproportionately affect the Corporation's regulatory capital position relative to that of its competitors, including those who may not be subject to the same regulatory requirements.
In 2013, the federal banking regulatory agencies implemented the U.S. Basel III Capital Rules, including: (i) minimum Common Equity Tier 1 capital ratio of 4.50% of risk-weighted assets, (ii) increased minimum Tier 1 capital ratio (from 4.00% to 6.00% of risk-weighted assets), (iii) retention of the minimum Total capital ratio of 8.00% of risk-weighted assets and the minimum Tier 1 leverage capital ratio at 4.00% of average assets and (iv) a "capital conservation buffer" of 2.50% above the minimum risk-based capital requirements which must be maintained to avoid restrictions on capital distributions and certain discretionary bonus payments. As a result of the implementation of the new capital standards, certain non-qualifying capital instruments, including cumulative preferred stock and TruPS, are excluded as a component of Tier 1 capital for institutions of the Corporation’s size and are included in Tier 2 capital instead.
The fully phased-in capital standards under the U.S. Basel III Capital Rules require banks to maintain more capital than the minimum levels required under former regulatory capital standards. The new minimum regulatory capital requirements began to apply to the Corporation on January 1, 2015. The required minimum capital conservation buffer began to be phased in incrementally on January 1, 2016 and will be fully phased in on January 1, 2019. The failure to meet the established capital requirements could result in the federal banking regulators placing limitations or conditions on the activities of the Corporation or its bank subsidiaries or restricting the commencement of new activities, and such failure could subject the Corporation or its bank subsidiaries to a variety of enforcement remedies, including limiting the ability of the Corporation or its bank subsidiaries to pay dividends, issuing a directive to increase capital and terminating FDIC deposit insurance. In addition, the failure to comply with the capital conservation buffer will result in restrictions on capital distributions and discretionary cash bonus payments to executive officers. As of December 31, 2016, the Corporation's current capital levels met the fully phased-in minimum capital requirements, including capital conservation buffers, as set forth in the U.S. Basel III Capital Rules. See Item 1. "Business-Supervision and Regulation-Capital Requirements."
The Corporation is a holding company and relies on dividends and other payments from its subsidiaries for substantially all of its revenue and its ability to make dividend payments, distributions and other payments.
The Corporation is a separate and distinct legal entity from its bank and nonbank subsidiaries, and depends on the payment of dividends and other payments and distributions from its subsidiaries, principally its bank subsidiaries, for substantially all of its revenues. As a result, the Corporation's ability to make dividend payments on its common stock depends primarily on certain federal and state regulatory considerations and the receipt of dividends and other distributions from its subsidiaries. There are various regulatory and prudential supervisory restrictions, which may change from time to time, that impact the ability of the Corporation’s bank subsidiaries to pay dividends or make other payments to it. There can be no assurance that the Corporation’s bank subsidiaries will be able to pay dividends at past levels, or at all, in the future. If the Corporation does not receive sufficient cash dividends or is unable to borrow from its bank subsidiaries, then the Corporation may not have sufficient funds to pay dividends
28
to its shareholders, repurchase its common stock or service its debt obligations. See Item 1. "Business-Supervision and Regulation-Loans and Dividends from Subsidiary Banks."
In addition, as noted above, liquidity and capital planning at both the bank and holding company levels has become an area of increased regulatory emphasis. In recent years, the Corporation has pursued a strategy of capital management under which it has sought to deploy its capital, through stock repurchases, increased regular dividends and special dividends, in a manner that is beneficial to the Corporation’s shareholders. This capital management strategy is subject to regulatory supervision.
A downgrade in the credit ratings of the Corporation or its bank subsidiaries could have a material adverse impact on the Corporation.
Fitch, Inc., Moody's Investors Service, Inc. and DBRS, Inc. continuously evaluate the Corporation and its subsidiaries, and their ratings of the Corporation and its subsidiary's long-term and short-term debt are based on a number of factors, including financial strength, as well as factors not entirely within the Corporation’s and its subsidiaries' control, such as conditions affecting the financial services industry generally. In light of these reviews and the continued focus on the financial services industry generally, the Corporation and its subsidiaries may not be able to maintain their current respective ratings. Ratings downgrades by any of these credit rating agencies could have a significant and immediate impact on the Corporation's funding and liquidity through cash obligations, reduced funding capacity and collateral triggers. A reduction in the Corporation's or its subsidiaries' credit ratings could also increase the Corporation's borrowing costs and limit its access to the capital markets.
Downgrades in the credit or financial strength ratings assigned to the counterparties with whom the Corporation transacts could create the perception that the Corporation's financial condition will be adversely impacted as a result of potential future defaults by such counterparties. Additionally, the Corporation could be adversely affected by a general, negative perception of financial institutions caused by the downgrade of other financial institutions. Accordingly, ratings downgrades for other financial institutions could affect the market price of the Corporation's stock and could limit access to or increase its cost of capital.
Anti-takeover provisions could negatively impact the Corporation's shareholders.
Provisions of banking laws, Pennsylvania corporate law and of the Corporation's Amended and Restated Articles of Incorporation and Bylaws could make it more difficult for a third party to acquire control of the Corporation or have the effect of discouraging a third party from attempting to acquire control of the Corporation. To the extent that these provisions discourage such a transaction, holders of the Corporation's common stock may not have an opportunity to dispose of part or all of their stock at a higher price than that prevailing in the market. These provisions may also adversely affect the market price of the Corporation’s stock. In addition, some of these provisions make it more difficult to remove, and thereby may serve to entrench, the Corporation's incumbent directors and officers, even if their removal would be regarded by some shareholders as desirable.
Certain provisions of Pennsylvania corporate law applicable to the Corporation and the Corporation's Amended and Restated Articles of Incorporation and Bylaws include provisions which may be considered to be "anti-takeover" in nature because they may have the effect of discouraging or making more difficult the acquisition of control of the Corporation by means of a hostile tender offer, exchange offer, proxy contest or similar transaction. These provisions are intended to protect the Corporation's shareholders by providing a measure of assurance that the Corporation's shareholders will be treated fairly in the event of an unsolicited takeover bid and by preventing a successful takeover bidder from exercising its voting control to the detriment of the other shareholders. Certain provisions in the Corporation's Amended and Restated Articles of Incorporation and Bylaws, taken as a whole, may also discourage a hostile tender offer, exchange offer, proxy solicitation or similar transaction relating to the Corporation's common stock.
The ability of a third party to acquire the Corporation is also limited under applicable banking regulations. The BHCA requires any "bank holding company" (as defined in that Act) to obtain the approval of the FRB prior to acquiring more than 5% of the Corporation’s outstanding common stock. Any person other than a bank holding company is required to obtain prior approval of the FRB to acquire 10% or more of the Corporation’s outstanding common stock under the Change in Bank Control Act of 1978 and, under certain circumstances, such approvals are required at an even lower ownership percentage. Any holder of 25% or more of the Corporation’s outstanding common stock, other than an individual, is subject to regulation as a bank holding company under the BHCA. In addition, the delays associated with obtaining necessary regulatory approvals for acquisitions of interests in bank holding companies also tend to make more difficult certain methods of effecting acquisitions. While these provisions do not prohibit an acquisition, they would likely act as deterrents to an unsolicited takeover attempt.
None.
29
The following table summarizes the Corporation’s full-service branch properties, by subsidiary bank, as of
December 31, 2016
. Remote service facilities (mainly stand-alone automated teller machines) are excluded.
|
Subsidiary Bank
|
Owned
|
Leased
|
Total Branches
|
||||||
|
Fulton Bank, N.A.
|
45
|
|
67
|
|
112
|
|
|||
|
Fulton Bank of New Jersey
|
36
|
|
29
|
|
65
|
|
|||
|
The Columbia Bank
|
8
|
|
23
|
|
31
|
|
|||
|
Lafayette Ambassador Bank
|
4
|
|
17
|
|
21
|
|
|||
|
FNB Bank, N.A.
|
5
|
|
2
|
|
7
|
|
|||
|
Swineford National Bank
|
5
|
|
2
|
|
7
|
|
|||
|
Total
|
103
|
|
140
|
|
243
|
|
|||
The following table summarizes the Corporation’s other significant administrative properties. Banking subsidiaries also maintain administrative offices at their respective main banking branches, which are included within the preceding table.
|
Entity
|
|
Property
|
|
Location
|
|
Owned/Leased
|
|
Fulton Bank, N.A./Fulton Financial Corporation
|
|
Corporate Headquarters
|
|
Lancaster, PA
|
|
(1)
|
|
Fulton Financial Corporation
|
|
Operations Center
|
|
East Petersburg, PA
|
|
Owned
|
|
Fulton Bank, N.A.
|
|
Operations Center
|
|
Mantua, NJ
|
|
Owned
|
|
(1)
|
Includes approximately 100,000 square feet which is owned by an independent third party who financed the construction through a loan from Fulton Bank, N.A. The Corporation is leasing this space from the third party in an arrangement accounted for as a capital lease. The lease term expires in 2027. The Corporation owns the remainder of the Corporate Headquarters location. This property also includes a Fulton Bank, N.A. branch, which is included in the preceding table.
|
The information presented in the "Legal Proceedings" section of "Note 17 - Commitment and Contingencies" in the Notes to Consolidated Financial Statements is incorporated herein by reference.
Not applicable.
30
Common Stock
As of
December 31, 2016
, the Corporation had
174.0 million
shares of $2.50 par value common stock outstanding held by
approximately 33,000 holders of record. The closing price per share of the Corporation’s common stock on February 17, 2017 was $19.10. The common stock of the Corporation is traded on the Global Select Market of The NASDAQ Stock Market under the symbol FULT.
The following table presents the quarterly high and low prices of the Corporation’s stock and per share cash dividends declared for each of the quarterly periods in
2016
and
2015
:
|
|
Price Range
|
Per
Share Dividend |
||||||||||
|
|
High
|
Low
|
||||||||||
|
2016
|
||||||||||||
|
First Quarter
|
$
|
13.74
|
|
$
|
11.48
|
|
$
|
0.09
|
|
|||
|
Second Quarter
|
14.35
|
|
12.66
|
|
0.10
|
|
||||||
|
Third Quarter
|
14.86
|
|
12.91
|
|
0.10
|
|
||||||
|
Fourth Quarter
|
19.45
|
|
14.04
|
|
0.12
|
|
||||||
|
2015
|
||||||||||||
|
First Quarter
|
$
|
12.68
|
|
$
|
11.00
|
|
$
|
0.09
|
|
|||
|
Second Quarter
|
13.52
|
|
11.85
|
|
0.09
|
|
||||||
|
Third Quarter
|
13.66
|
|
11.60
|
|
0.09
|
|
||||||
|
Fourth Quarter
|
14.59
|
|
11.61
|
|
0.11
|
|
||||||
Restrictions on the Payments of Dividends
The Corporation is a separate and distinct legal entity from its banking and nonbanking subsidiaries, and depends on the payment of dividends from its subsidiaries, principally its banking subsidiaries, for substantially all of its revenues. As a result, the Corporation's ability to make dividend payments on its common stock depends primarily on certain federal and state regulatory considerations and the receipt of dividends and other distributions from its subsidiaries. There are various regulatory and prudential supervisory restrictions, which may change from time to time, that impact the ability of its banking subsidiaries to pay dividends or make other payments to it. For additional information regarding the regulatory restrictions applicable to the Corporation and its subsidiaries, see "Supervision and Regulation," in Item 1. "Business;" Item 1A. "Risk Factors - The Corporation is a holding company and relies on dividends and other payments from its subsidiaries for substantially all of its revenue and its ability to make dividend payments, distributions and other payments," under "Risks Related to an Investment in the Corporation’s Securities;" and "Note 11 - Regulatory Matters," in the Notes to Consolidated Financial Statements in Item 8. "Financial Statements and Supplementary Data."
Securities Authorized for Issuance under Equity Compensation Plans
The following table provides information about options outstanding under the Corporation’s Amended and Restated Equity and Cash Incentive Compensation Plan and the number of securities remaining available for future issuance under the Corporation's Amended and Restated Equity and Cash Incentive Compensation Plan, the 2011 Directors' Equity Participation Plan and the Employee Stock Purchase Plan as of
December 31, 2016
:
|
Plan Category
|
Number of securities to be
issued upon exercise of outstanding options, warrants and rights (1) |
Weighted-average exercise price of outstanding options, warrants and rights (2)
|
Number of securities
remaining available for future issuance under equity compensation plans (excluding securities reflected in first column) (3) |
|||||||
|
Equity compensation plans approved by security holders
|
2,837,963
|
|
$
|
10.98
|
|
13,767,305
|
|
|||
|
Equity compensation plans not approved by security holders
|
—
|
|
—
|
|
—
|
|
||||
|
Total
|
2,837,963
|
|
$
|
10.98
|
|
13,767,305
|
|
|||
(1) The number of securities to be issued upon exercise of outstanding options, warrants and rights includes
1,046,296
performance-based restricted stock units ("PSUs"), which is the target number of PSUs that are payable under the Amended and Restated Equity and Cash Incentive Compensation Plan ("Employee
31
Equity Plan"), though no shares will be issued until achievement of applicable performance goals, and includes
461,484
time-vested restricted stock units ("RSUs") granted under the Employee Equity Plan
(2) The weighted-average exercise price of outstanding options, warrants and rights does not take into account outstanding PSUs and RSUs granted under the Employee Equity Plan.
(3) Consists of
11,427,029
shares that may be awarded under the Employee Equity and Cash Incentive Compensation Plan,
370,552
shares that may be awarded under the 2011 Directors' Equity Participation Plan and
1,969,724
of shares that may be purchased under the Employee Stock Purchase Plan. Excludes accrued purchase rights under the Employee Stock Purchase Plan as of
December 31, 2016
as the number of shares to be purchased is indeterminable until the time shares are issued.
Performance Graph
The following graph shows cumulative total shareholder return (i.e., price change, plus reinvestment of dividends) on the common stock of Fulton Financial Corporation during the five-year period ended
December 31, 2016
, compared with (1) the NASDAQ Bank Index and (2) the Standard and Poor's 500 index ("S&P 500"). The graph is not indicative of future price performance.
The graph below is furnished under this Part II, Item 5 of this Form 10-K and shall not be deemed to be "soliciting material" or to be "filed" with the SEC or subject to Regulation 14A or 14C, or to the liabilities of Section 18 of the Securities Exchange Act of 1934, as amended.
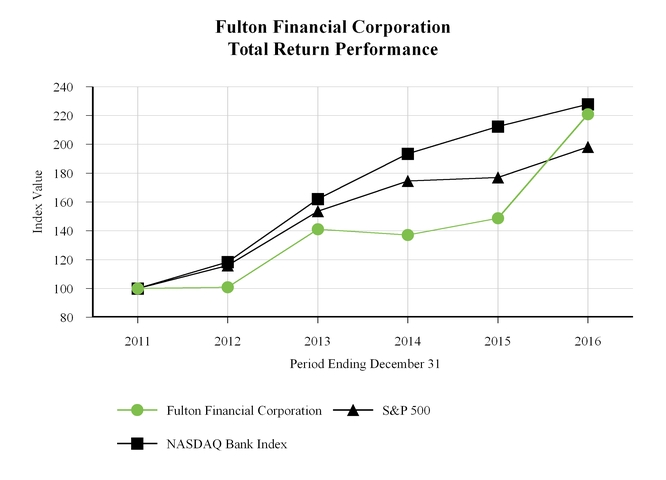
|
|
Year Ending December 31
|
|||||||||||||||||||||||
|
Index
|
2011
|
2012
|
2013
|
2014
|
2015
|
2016
|
||||||||||||||||||
|
Fulton Financial Corporation
|
$
|
100.00
|
|
$
|
100.93
|
|
$
|
141.13
|
|
$
|
137.10
|
|
$
|
148.68
|
|
$
|
220.81
|
|
||||||
|
S&P 500
|
$
|
100.00
|
|
$
|
116.00
|
|
$
|
153.57
|
|
$
|
174.60
|
|
$
|
177.01
|
|
$
|
198.18
|
|
||||||
|
NASDAQ Bank Index
|
$
|
100.00
|
|
$
|
118.35
|
|
$
|
162.04
|
|
$
|
193.48
|
|
$
|
212.35
|
|
$
|
227.80
|
|
||||||
32
5-YEAR CONSOLIDATED SUMMARY OF FINANCIAL RESULTS
(dollars in thousands, except per-share data)
|
2016
|
2015
|
2014
|
2013
|
2012
|
|||||||||||||||
|
SUMMARY OF INCOME
|
|||||||||||||||||||
|
Interest income
|
$
|
603,100
|
|
$
|
583,789
|
|
$
|
596,078
|
|
$
|
609,689
|
|
$
|
647,496
|
|
||||
|
Interest expense
|
82,328
|
|
83,795
|
|
81,211
|
|
82,495
|
|
103,168
|
|
|||||||||
|
Net interest income
|
520,772
|
|
499,994
|
|
514,867
|
|
527,194
|
|
544,328
|
|
|||||||||
|
Provision for credit losses
|
13,182
|
|
2,250
|
|
12,500
|
|
40,500
|
|
94,000
|
|
|||||||||
|
Investment securities gains, net
|
2,550
|
|
9,066
|
|
2,041
|
|
8,004
|
|
3,026
|
|
|||||||||
|
Non-interest income, excluding investment securities gains
|
187,628
|
|
172,773
|
|
165,338
|
|
179,660
|
|
213,386
|
|
|||||||||
|
Loss on redemption of trust preferred securities
|
—
|
|
5,626
|
|
—
|
|
—
|
|
—
|
|
|||||||||
|
Non-interest expense, excluding loss on redemption of trust preferred securities
|
489,519
|
|
474,534
|
|
459,246
|
|
461,433
|
|
449,294
|
|
|||||||||
|
Income before income taxes
|
208,249
|
|
199,423
|
|
210,500
|
|
212,925
|
|
217,446
|
|
|||||||||
|
Income taxes
|
46,624
|
|
49,921
|
|
52,606
|
|
51,085
|
|
57,601
|
|
|||||||||
|
Net income
|
$
|
161,625
|
|
$
|
149,502
|
|
$
|
157,894
|
|
$
|
161,840
|
|
$
|
159,845
|
|
||||
|
PER COMMON SHARE
|
|||||||||||||||||||
|
Net income (basic)
|
$
|
0.93
|
|
$
|
0.85
|
|
$
|
0.85
|
|
$
|
0.84
|
|
$
|
0.80
|
|
||||
|
Net income (diluted)
|
0.93
|
|
0.85
|
|
0.84
|
|
0.83
|
|
0.80
|
|
|||||||||
|
Cash dividends
|
0.41
|
|
0.38
|
|
0.34
|
|
0.32
|
|
0.30
|
|
|||||||||
|
RATIOS
|
|||||||||||||||||||
|
Return on average assets
|
0.88
|
%
|
0.86
|
%
|
0.93
|
%
|
0.96
|
%
|
0.98
|
%
|
|||||||||
|
Return on average equity
|
7.69
|
|
7.38
|
|
7.62
|
|
7.88
|
|
7.79
|
|
|||||||||
|
Return on average tangible equity
(1)
|
10.30
|
|
10.01
|
|
10.31
|
|
10.76
|
|
10.73
|
|
|||||||||
|
Net interest margin
|
3.18
|
|
3.21
|
|
3.39
|
|
3.50
|
|
3.76
|
|
|||||||||
|
Efficiency ratio
(1)
|
67.16
|
|
68.61
|
|
65.65
|
|
63.39
|
|
57.61
|
|
|||||||||
|
Dividend payout ratio
|
44.09
|
|
44.71
|
|
40.48
|
|
38.55
|
|
37.50
|
|
|||||||||
|
PERIOD-END BALANCES
|
|||||||||||||||||||
|
Total assets
|
$
|
18,944,247
|
|
$
|
17,914,718
|
|
$
|
17,124,767
|
|
$
|
16,934,634
|
|
$
|
16,533,097
|
|
||||
|
Investment securities
|
2,559,227
|
|
2,484,773
|
|
2,323,371
|
|
2,568,434
|
|
2,721,082
|
|
|||||||||
|
Loans, net of unearned income
|
14,699,272
|
|
13,838,602
|
|
13,111,716
|
|
12,782,220
|
|
12,146,971
|
|
|||||||||
|
Deposits
|
15,012,864
|
|
14,132,317
|
|
13,367,506
|
|
12,491,186
|
|
12,484,163
|
|
|||||||||
|
Short-term borrowings
|
541,317
|
|
497,663
|
|
329,719
|
|
1,258,629
|
|
868,399
|
|
|||||||||
|
FHLB advances and long-term debt
|
929,403
|
|
949,542
|
|
1,139,413
|
|
883,584
|
|
894,253
|
|
|||||||||
|
Shareholders’ equity
|
2,121,115
|
|
2,041,894
|
|
1,996,665
|
|
2,063,187
|
|
2,081,656
|
|
|||||||||
|
AVERAGE BALANCES
|
|||||||||||||||||||
|
Total assets
|
$
|
18,371,173
|
|
$
|
17,406,843
|
|
$
|
16,959,507
|
|
$
|
16,811,337
|
|
$
|
16,257,776
|
|
||||
|
Investment securities
|
2,469,564
|
|
2,347,810
|
|
2,485,292
|
|
2,715,546
|
|
2,724,257
|
|
|||||||||
|
Loans, net of unearned income
|
14,128,064
|
|
13,330,973
|
|
12,885,180
|
|
12,578,524
|
|
11,968,567
|
|
|||||||||
|
Deposits
|
14,585,545
|
|
13,747,113
|
|
12,867,663
|
|
12,473,184
|
|
12,392,580
|
|
|||||||||
|
Short-term borrowings
|
395,727
|
|
323,772
|
|
832,839
|
|
1,196,323
|
|
690,883
|
|
|||||||||
|
FHLB advances and long-term debt
|
959,142
|
|
1,023,972
|
|
965,601
|
|
889,461
|
|
933,727
|
|
|||||||||
|
Shareholders’ equity
|
2,100,634
|
|
2,026,883
|
|
2,071,640
|
|
2,053,821
|
|
2,050,994
|
|
|||||||||
|
(1)
|
Ratio represents a financial measure derived by methods other than Generally Accepted Accounting Principles ("GAAP"). See reconciliation of this non-GAAP financial measure to the most directly comparable GAAP measure under the following heading, "Supplemental Reporting of Non-GAAP Based Financial Measures" below.
|
33
Supplemental Reporting of Non-GAAP Based Financial Measures
This Annual Report on Form 10-K contains supplemental financial information, as detailed below, which has been derived by methods other than Generally Accepted Accounting Principles ("GAAP"). The Corporation has presented these non-GAAP financial measures because it believes that these measures provide useful and comparative information to assess trends in the Corporation's results of operations. Presentation of these non-GAAP financial measures is consistent with how the Corporation evaluates its performance internally, and these non-GAAP financial measures are frequently used by securities analysts, investors and other interested parties in the evaluation of companies in the Corporation's industry. Management believes that these non-GAAP financial measures, in addition to GAAP measures, are also useful to investors to evaluate the Corporation's results. Investors should recognize that the Corporation's presentation of these non-GAAP financial measures might not be comparable to similarly-titled measures of other companies. These non-GAAP financial measures should not be considered a substitute for GAAP basis measures, and the Corporation strongly encourages a review of its consolidated financial statements in their entirety. Following are reconciliations of these non-GAAP financial measures to the most directly comparable GAAP measure as of and for the year ended December 31:
|
2016
|
2015
|
2014
|
2013
|
2012
|
|||||||||||||||
|
(in thousands, except per share data and percentages)
|
|||||||||||||||||||
|
Return on average tangible equity
|
|||||||||||||||||||
|
Net income
|
$
|
161,625
|
|
$
|
149,502
|
|
$
|
157,894
|
|
$
|
161,840
|
|
$
|
159,845
|
|
||||
|
Plus: Intangible amortization, net of tax
|
—
|
|
161
|
|
818
|
|
1,584
|
|
1,970
|
|
|||||||||
|
Numerator
|
$
|
161,625
|
|
$
|
149,663
|
|
$
|
158,712
|
|
$
|
163,424
|
|
$
|
161,815
|
|
||||
|
Average common shareholders' equity
|
$
|
2,100,634
|
|
$
|
2,026,883
|
|
$
|
2,071,640
|
|
$
|
2,053,821
|
|
$
|
2,050,994
|
|
||||
|
Less: Average goodwill and intangible assets
|
(531,556
|
)
|
(531,618
|
)
|
(532,425
|
)
|
(534,431
|
)
|
(542,600
|
)
|
|||||||||
|
Average tangible shareholders' equity (denominator)
|
$
|
1,569,078
|
|
$
|
1,495,265
|
|
$
|
1,539,215
|
|
$
|
1,519,390
|
|
$
|
1,508,394
|
|
||||
|
Return on average tangible equity
|
10.30
|
%
|
10.01
|
%
|
10.31
|
%
|
10.76
|
%
|
10.73
|
%
|
|||||||||
|
Efficiency ratio
|
|||||||||||||||||||
|
Non-interest expense, excluding loss on redemption of trust preferred securities
|
$
|
489,519
|
|
$
|
480,160
|
|
$
|
459,246
|
|
$
|
461,433
|
|
$
|
449,294
|
|
||||
|
Less: Intangible amortization
|
—
|
|
(247
|
)
|
(1,259
|
)
|
(2,438
|
)
|
(3,031
|
)
|
|||||||||
|
Less: Loss on redemption of trust preferred securities
|
—
|
|
(5,626
|
)
|
—
|
|
—
|
|
—
|
|
|||||||||
|
Numerator
|
$
|
489,519
|
|
$
|
474,287
|
|
$
|
457,987
|
|
$
|
458,995
|
|
$
|
446,263
|
|
||||
|
Net interest income (fully taxable equivalent) (1)
|
$
|
541,271
|
|
$
|
518,464
|
|
$
|
532,322
|
|
$
|
544,474
|
|
$
|
561,190
|
|
||||
|
Plus: Total Non-interest income
|
190,178
|
|
181,839
|
|
167,379
|
|
187,664
|
|
216,412
|
|
|||||||||
|
Less: Investment securities gains, net
|
(2,550
|
)
|
(9,066
|
)
|
(2,041
|
)
|
(8,004
|
)
|
(3,026
|
)
|
|||||||||
|
Denominator
|
$
|
728,899
|
|
$
|
691,237
|
|
$
|
697,660
|
|
$
|
724,134
|
|
$
|
774,576
|
|
||||
|
Efficiency ratio
|
67.16
|
%
|
68.61
|
%
|
65.65
|
%
|
63.39
|
%
|
57.61
|
%
|
|||||||||
|
Non-performing assets to tangible equity and allowance for credit losses
|
|||||||||||||||||||
|
Non-performing assets (numerator)
|
$
|
144,453
|
|
$
|
155,913
|
|
$
|
150,504
|
|
$
|
169,329
|
|
$
|
237,199
|
|
||||
|
Tangible equity
|
$
|
1,589,559
|
|
$
|
1,510,338
|
|
$
|
1,464,862
|
|
$
|
1,530,111
|
|
$
|
1,546,093
|
|
||||
|
Plus: Allowance for credit losses
|
171,325
|
|
171,412
|
|
185,931
|
|
204,917
|
|
225,439
|
|
|||||||||
|
Tangible equity and allowance for credit losses (denominator)
|
$
|
1,760,884
|
|
$
|
1,681,750
|
|
$
|
1,650,793
|
|
$
|
1,735,028
|
|
$
|
1,771,532
|
|
||||
|
Non-performing assets to tangible common shareholders' equity and allowance for credit losses
|
8.20
|
%
|
9.27
|
%
|
9.12
|
%
|
9.76
|
%
|
13.39
|
%
|
|||||||||
(1) Presented on a fully taxable equivalent basis, using a 35% Federal tax rate and statutory interest expense disallowances.
34
This Management’s Discussion and Analysis of Financial Condition and Results of Operations ("Management’s Discussion") relates to Fulton Financial Corporation (the "Corporation"), a financial holding company registered under the Bank Holding Company Act and incorporated under the laws of the Commonwealth of Pennsylvania in 1982, and its wholly owned subsidiaries. Management’s Discussion should be read in conjunction with the consolidated financial statements and other financial information presented in this report.
FORWARD-LOOKING STATEMENTS
The Corporation has made, and may continue to make, certain forward-looking statements with respect to its financial condition and results of operations. Do not unduly rely on forward-looking statements. Forward-looking statements can be identified by the use of words such as "may," "should," "will," "could," "estimates," "predicts," "potential," "continue," "anticipates," "believes," "plans," "expects," "future," "intends" and similar expressions which are intended to identify forward-looking statements.
These forward-looking statements are not guarantees of future performance and are subject to risks and uncertainties, some of which are beyond the Corporation's control and ability to predict, that could cause actual results to differ materially from those expressed in the forward-looking statements. The Corporation undertakes no obligation, other than as required by law, to update or revise any forward-looking statements, whether as a result of new information, future events or otherwise. Many factors could affect future financial results including, without limitation:
|
•
|
the impact of adverse conditions in the economy and capital markets on the performance of the Corporation’s loan portfolio and demand for the Corporation’s products and services;
|
|
•
|
increases in non-performing assets, which may require the Corporation to increase the allowance for credit losses, charge off loans and incur elevated collection and carrying costs related to such non-performing assets;
|
|
•
|
investment securities gains and losses, including other-than-temporary declines in the value of securities which may result in charges to earnings;
|
|
•
|
the effects of market interest rates, and the relative balances of interest rate-sensitive assets to interest rate-sensitive liabilities, on net interest margin and net interest income;
|
|
•
|
the effects of changes in interest rates on demand for the Corporation’s products and services;
|
|
•
|
the effects of changes in interest rates or disruptions in liquidity markets on the Corporation’s sources of funding;
|
|
•
|
the Corporation’s ability to manage liquidity, both at the holding company level and at its bank subsidiaries;
|
|
•
|
the impact of increased regulatory scrutiny of the banking industry;
|
|
•
|
the effects of the increasing amounts of time and expense associated with regulatory compliance and risk management;
|
|
•
|
the potential for negative consequences from regulatory violations and investigations, including potential supervisory actions and the assessment of fines and penalties;
|
|
•
|
the additional time, expense and investment required to comply with, and the restrictions on potential growth and investment activities resulting from, the existing enforcement orders applicable to the Corporation and its bank subsidiaries by federal and state bank regulatory agencies requiring improvement in compliance functions and other remedial actions, or any future enforcement orders;
|
|
•
|
the Corporation’s ability to manage the uncertainty associated with the delay in implementing many of the regulations mandated by the Dodd-Frank Act;
|
|
•
|
the effects of, and uncertainty surrounding, potential changes in legislation, regulation and government policy as a result of the recent change in federal administration;
|
|
•
|
the effects of negative publicity on the Corporation’s reputation;
|
|
•
|
the effects of adverse outcomes in litigation and governmental or administrative proceedings;
|
|
•
|
the potential to incur losses in connection with repurchase and indemnification payments related to sold loans;
|
|
•
|
the Corporation’s ability to successfully transform its business model;
|
|
•
|
the Corporation’s ability to achieve its growth plans;
|
|
•
|
the effects of competition on deposit rates and growth, loan rates and growth and net interest margin;
|
|
•
|
the Corporation’s ability to manage the level of non-interest expenses, including salaries and employee benefits expenses, operating risk losses and goodwill impairment;
|
|
•
|
the effects of changes in accounting policies, standards, and interpretations on the Corporation's financial condition and results of operations;
|
|
•
|
the impact of operational risks, including the risk of human error, inadequate or failed internal processes and systems, computer and telecommunications systems failures, faulty or incomplete data and an inadequate risk management framework;
|
35
|
•
|
the impact of failures of third parties upon which the Corporation relies to perform in accordance with contractual arrangements;
|
|
•
|
the failure or circumvention of the Corporation’s system of internal controls;
|
|
•
|
the loss of, or failure to safeguard, confidential or proprietary information;
|
|
•
|
the Corporation’s failure to identify and to address cyber-security risks;
|
|
•
|
the Corporation’s ability to keep pace with technological changes;
|
|
•
|
the Corporation’s ability to attract and retain talented personnel;
|
|
•
|
capital and liquidity strategies, including the Corporation’s ability to comply with applicable capital and liquidity requirements, and the Corporation’s ability to generate capital internally or raise capital on favorable terms;
|
|
•
|
the Corporation’s reliance on its subsidiaries for substantially all of its revenues and its ability to pay dividends or other distributions; and
|
|
•
|
the effects of any downgrade in the Corporation’s credit ratings on its borrowing costs or access to capital markets.
|
OVERVIEW
The Corporation is a financial holding company comprised of six wholly owned banking subsidiaries which provide a full range of retail and commercial financial services in Pennsylvania, Delaware, Maryland, New Jersey and Virginia. The Corporation generates the majority of its revenue through net interest income, or the difference between interest earned on loans and investments and interest paid on deposits and borrowings. Growth in net interest income is dependent upon balance sheet growth and/or maintaining or increasing the net interest margin, which is net interest income (fully taxable-equivalent, or "FTE") as a percentage of average interest-earning assets. The Corporation also generates revenue through fees earned on the various services and products offered to its customers and through gains on sales of assets, such as loans, investments and properties. Offsetting these revenue sources are provisions for credit losses on loans, non-interest expenses and income taxes.
The following table presents a summary of the Corporation’s earnings and selected performance ratios:
|
2016
|
2015
|
||||||
|
Net income (in thousands)
|
$
|
161,625
|
|
$
|
149,502
|
|
|
|
Diluted net income per share
|
$
|
0.93
|
|
$
|
0.85
|
|
|
|
Return on average assets
|
0.88
|
%
|
0.86
|
%
|
|||
|
Return on average equity
|
7.69
|
%
|
7.38
|
%
|
|||
|
Return on average tangible equity
(1)
|
10.30
|
%
|
10.01
|
%
|
|||
|
Net interest margin
(2)
|
3.18
|
%
|
3.21
|
%
|
|||
|
Efficiency ratio
(1)
|
67.16
|
%
|
68.61
|
%
|
|||
|
Non-performing assets to total assets
|
0.76
|
%
|
0.87
|
%
|
|||
|
Annualized net charge-offs to average loans
|
0.09
|
%
|
0.13
|
%
|
|||
|
(1)
|
Ratio represents a financial measure derived by methods other than Generally Accepted Accounting Principles ("GAAP"). See reconciliation of this non-GAAP financial measure to the most directly comparable GAAP measure under the heading, "Supplemental Reporting of Non-GAAP Based Financial Measures," in Item 6. Selected Financial Data.
|
|
(2)
|
Presented on an FTE basis, using a 35% Federal tax rate and statutory interest expense disallowances. See also the "Net Interest Income" section of Management’s Discussion.
|
Following is a summary of the financial highlights for the year ended
December 31, 2016
.
|
•
|
Net Income Per Share Growth
- Diluted net income per share increased
$0.08
, or
9.4%
, to
$0.93
per diluted share, compared to
$0.85
in
2015
. This increase was due to an increase in net income of
$12.1 million
, or
8.1%
, and a
2.4 million
, or
1.3%
, decrease in weighted average diluted shares outstanding in comparison to
2015
. The increase in net income was driven by a
$20.8 million
, or
4.2%
, increase in net interest income and a $14.9 million, or 8.6%, increase in non-interest income, excluding investment securities gains, partially offset by a
$10.9 million
increase in the provision for credit losses, a
$9.4 million
, or
1.9%
, increase in non-interest expense and a
$6.5 million
, or
71.9%
, decrease in investment securities gains.
|
|
•
|
Net Interest Income Growth
- The
$20.8 million
increase in net interest income resulted from the impact of growth in interest-earning assets, partially offset by the impact of a lower net interest margin.
|
36
|
◦
|
Net Interest Margin
- For the year ended
December 31, 2016
, the net interest margin decreased
3
basis points, or
0.9%
, in comparison to
2015
, driven by a
7
basis point decrease in yields on interest-earning assets, partially offset by a
4
basis point decrease in the cost of interest-bearing liabilities.
|
|
◦
|
Loan Growth
- Average loans increased
$797.1 million
, or
6.0%
, in comparison to
2015
, with notable increases in commercial mortgages, commercial - industrial, financial and agricultural, and construction loans. The Corporation's loan growth occurred throughout most of its markets.
|
|
◦
|
Deposit Growth
- Average deposits increased
$838.4 million
, or
6.1%
, in comparison to
2015
. The increase was the result of growth in demand and savings accounts, partially offset by a decrease in time deposits. Average deposit growth outpaced loan growth, which enhanced the Corporation's funding position. At
December 31, 2016
, the loan-to-deposit ratio was
97.9%
, which was relatively flat compared to
December 31, 2015
.
|
|
•
|
Asset Quality
- Overall asset quality continued to improve in
2016
, with decreases in net charge-offs, non-performing loans and overall delinquency levels. The
$10.9 million
increase in the provision for credit losses to
$13.2 million
for the year ended
December 31, 2016
was primarily driven by growth in the loan portfolio.
|
|
•
|
Non-Interest Income
- Non-interest income, excluding securities gains, increased
$14.9 million
, or
8.6%
, in comparison to
2015
, primarily driven by a
$7.5 million
, or
17.0%
, increase in other service charges and fees.
|
|
•
|
Non-Interest Expense
- Non-interest expense increased
$9.4 million
, or
1.9%
, in comparison to
2015
, driven largely by a
$22.5 million
, or
8.6%
, increase in salaries and employee benefits and a
$2.3 million
, or
6.6%
increase in software and data processing expense. These increases were partially offset by decreases in other expense categories, as discussed in the "Non-Interest Expense" section.
|
|
•
|
Income Taxes
- Income tax expense for 2016 reflected an effective tax rate ("ETR") of 22.4%, as compared to 25.0% for 2015. The decrease in the ETR resulted from increases in tax credit investments and related net tax credits earned and tax-exempt income.
|
CRITICAL ACCOUNTING POLICIES
The following is a summary of those accounting policies that the Corporation considers to be most important to the presentation of its financial condition and results of operations, as they require management’s most difficult judgments as a result of the need to make estimates about the effects of matters that are inherently uncertain. See additional information regarding these critical accounting policies in "Note 1 - Summary of Significant Accounting Policies," in the Notes to the Consolidated Financial Statements in Item 8. "Financial Statements and Supplementary Data."
Allowance for Credit Losses
- The allowance for credit losses consists of the allowance for loan losses and the reserve for unfunded lending commitments. The allowance for loan losses represents management’s estimate of incurred losses in the loan portfolio as of the balance sheet date and is recorded as a reduction to loans. The reserve for unfunded lending commitments represents management’s estimate of losses inherent in its unfunded loan commitments and is recorded in other liabilities on the consolidated balance sheet.
The Corporation’s allowance for loan losses includes: 1) specific allowances allocated to loans evaluated for impairment under the Financial Accounting Standards Board's Accounting Standards Codification ("FASB ASC") Section 310-10-35; and 2) allowances calculated for pools of loans evaluated for impairment under FASB ASC Subtopic 450-20.
Management's estimate of incurred losses in the loan portfolio is based on a methodology that includes the following critical judgments:
|
•
|
Identification of potential problem loans in a timely manner.
For commercial loans, commercial mortgages and construction loans to commercial borrowers, an internal risk rating process is used. The Corporation believes that internal risk ratings are the most relevant credit quality indicator for these types of loans. The migration of loans through the various internal risk rating categories is a significant component of the allowance for credit loss methodology for these loans, which bases the probability of default on this migration. Assigning risk ratings involves judgment. The Corporation's loan review officers provide an independent assessment of risk rating accuracy. Ratings may be changed based on the ongoing monitoring procedures performed by loan officers or credit administration staff, or if specific loan review assessments identify a deterioration or an improvement in the loan.
|
37
The Corporation does not assign internal risk ratings for residential mortgages, home equity loans, consumer loans, lease receivables, and construction loans to individuals secured by residential real estate, as these portfolios consist of a larger number of loans with smaller balances. Instead, these portfolios are evaluated for risk through the monitoring of delinquency status.
|
•
|
Proper collateral valuation of impaired loans evaluated for impairment under FASB ASC Section 310-10-35.
Substantially all of the Corporation’s impaired loans to borrowers with total outstanding loan balances greater than or equal to $1.0 million are measured based on the estimated fair value of each loan’s collateral. Collateral could be in the form of real estate, in the case of impaired commercial mortgages and construction loans, or business assets, such as accounts receivable or inventory, in the case of commercial loans. Commercial loans may also be secured by real property.
|
For loans secured by real estate, estimated fair values are determined primarily through appraisals performed by state certified third-party appraisers, discounted to arrive at expected net sale proceeds. For collateral-dependent loans, estimated real estate fair values are also net of estimated selling costs. When a real estate secured loan becomes impaired, a decision is made regarding whether an updated appraisal of the real estate is necessary. This decision is based on various considerations, including: the age of the most recent appraisal; the loan-to-value ratio based on the original appraisal; the condition of the property; the Corporation’s experience and knowledge of the real estate market; the purpose of the loan; market factors; payment status; the strength of any guarantors; and the existence and age of other indications of value such as broker price opinions, among others. The Corporation generally obtains updated state certified third-party appraisals for impaired loans secured predominately by real estate every
12
months.
When updated certified appraisals are not obtained for loans evaluated for impairment under FASB ASC Section 310-10-35 that are secured by real estate, fair values are estimated based on the original appraisal values, as long as the original appraisal indicated a strong loan-to-value position and, in the opinion of the Corporation's internal credit administration staff, there has not been a significant deterioration in the collateral value since the original appraisal was performed. Original appraisals are typically used only when the estimated collateral value, as adjusted appropriately for the age of the appraisal, results in a current loan-to-value ratio that is lower than the Corporation's loan-to-value requirements for new loans, generally less than
70%
.
|
•
|
Proper measurement of allowance needs for pools of loans measured for impairment under FASB ASC Subtopic 450-20.
For loan loss allocation purposes, loans are segmented into pools with similar characteristics. These pools are established by general loan type, or "portfolio segments," as presented in the table under the heading, "Loans, net of unearned income," within "Note 4 -Loans and Allowance for Credit Losses," in the Notes to Consolidated Financial Statements. Certain portfolio segments are further disaggregated and evaluated collectively for impairment based on "class segments," which are largely based on the type of collateral underlying each loan. For commercial loans, class segments include loans secured by collateral and unsecured loans. Construction loan class segments include loans secured by commercial real estate, loans to commercial borrowers secured by residential real estate and loans to individuals secured by residential real estate. Consumer loan class segments are based on collateral types and include direct consumer installment loans and indirect automobile loans.
|
Commercial loans, commercial mortgages and construction loans to commercial borrowers are further segmented into separate pools based on internally assigned risk ratings. Residential mortgages, home equity loans, consumer loans, and lease receivables are further segmented into separate pools based on delinquency status.
A loss rate is calculated for each pool through a migration analysis based on historical losses as loans migrate through the various risk rating or delinquency categories. Estimated loss rates are based on a probability of default and a loss given default. The loss rate is adjusted to consider qualitative factors, such as economic conditions and trends.
|
•
|
Overall assessment of the risk profile of the loan portfolio.
The allocation of the allowance for credit losses is reviewed to evaluate its appropriateness in relation to the overall risk profile of the loan portfolio. The Corporation considers risk factors such as: local and national economic conditions; trends in delinquencies and non-accrual loans; the diversity of borrower industry types; and the composition of the portfolio by loan type. An unallocated allowance is maintained for factors and conditions that exist at the balance sheet date, but are not specifically identifiable, and to recognize the inherent imprecision in estimating and measuring loss exposure.
|
For additional details related to the allowance for credit losses, see "Note 4 - Loans and Allowance for Credit Losses," in the Notes to Consolidated Financial Statements in Item 8. "Financial Statements and Supplementary Data."
Goodwill
- Goodwill recorded in connection with acquisitions is not amortized to expense, but is tested at least annually for impairment. A quantitative annual impairment test is not required if, based on a qualitative analysis, the Corporation determines that the existence of events and circumstances indicate that it is more likely than not that goodwill is not impaired. The Corporation
38
completes its annual goodwill impairment test as of October 31st of each year. The Corporation tests for impairment by first allocating its goodwill and other assets and liabilities, as necessary, to defined reporting units. A fair value is then determined for each reporting unit. If the fair values of the reporting units exceed their book values, no write-down of the recorded goodwill through an impairment charge to non-interest expense is necessary. If the fair values are less than the book values, an additional valuation procedure is necessary to assess the proper carrying value of the goodwill.
Reporting unit valuation is inherently subjective, with a number of factors based on assumptions and management judgments. Among these are future growth rates for the reporting units, selection of comparable market transactions, discount rates and earnings capitalization rates. Changes in assumptions and results due to economic conditions, industry factors and reporting unit performance and cash flow projections could result in different assessments of the fair values of reporting units and could result in impairment charges.
For additional details related to the annual goodwill impairment test, see "Note 6 - Goodwill and Intangible Assets," in the Notes to Consolidated Financial Statements in Item 8. "Financial Statements and Supplementary Data."
Income Taxes
– The provision for income taxes is based upon income before income taxes, adjusted for the effect of certain tax-exempt income, non-deductible expenses and credits. In addition, certain items of income and expense are reported in different periods for financial reporting and tax return purposes. The tax effects of these temporary differences are recognized currently in the deferred income tax provision or benefit. Deferred tax assets or liabilities are computed based on the difference between the financial statement and income tax bases of assets and liabilities using the applicable enacted marginal tax rate.
The Corporation must also evaluate the likelihood that deferred tax assets will be recovered through future taxable income. If any such assets are more likely than not to not be recovered, a valuation allowance must be recognized. The assessment of the carrying value of deferred tax assets is based on certain assumptions, changes in which could have a material impact on the Corporation’s consolidated financial statements.
On a periodic basis, the Corporation evaluates its income tax positions based on tax laws, regulations and financial reporting considerations, and records adjustments as appropriate. Recognition and measurement of tax positions is based upon management’s evaluations of current taxing authorities’ examinations of the Corporation’s tax returns, recent positions taken by the taxing authorities on similar transactions and the overall tax environment.
For additional details see "Note 12 - Income Taxes," in the Notes to Consolidated Financial Statements in Item 8. "Financial Statements and Supplementary Data."
Fair Value Measurements
– FASB ASC Topic 820 establishes a fair value hierarchy for the inputs to valuation techniques used to measure assets and liabilities at fair value based on the following three categories (from highest to lowest priority):
|
•
|
Level 1 – Inputs that represent quoted prices for identical instruments in active markets.
|
|
•
|
Level 2 – Inputs that represent quoted prices for similar instruments in active markets, or quoted prices for identical instruments in non-active markets. Also includes valuation techniques whose inputs are derived principally from observable market data other than quoted prices, such as interest rates or other market-corroborated means.
|
|
•
|
Level 3 – Inputs that are largely unobservable, as little or no market data exists for the instrument being valued.
|
The Corporation has categorized all assets and liabilities measured at fair value both on a recurring and nonrecurring basis into the above three levels.
The determination of fair value for assets categorized as Level 3 items involves a great deal of subjectivity due to the use of unobservable inputs. In addition, determining when a market is no longer active and placing little or no reliance on distressed market prices requires the use of management’s judgment. The Corporation's Level 3 assets include available for sale debt securities in the form of pooled trust preferred securities, certain single-issuer trust preferred securities issued by financial institutions and auction rate securities. The Corporation also categorizes impaired loans, net of allowance allocations, other real estate owned ("OREO") and mortgage servicing rights as Level 3 assets measured at fair value on a non-recurring basis.
The Corporation engages third-party valuation experts to assist in valuing interest rate swap derivatives and most available-for-sale investment securities, both measured at fair value on a recurring basis, and mortgage servicing rights, which are measured at fair value on a non-recurring basis. The pricing data and market quotes the Corporation obtains from outside sources are reviewed internally for reasonableness.
For additional details see "Note 18 - Fair Value Measurements," in the Notes to Consolidated Financial Statements in Item 8. "Financial Statements and Supplementary Data" for the disclosures required by FASB ASC Topic 820.
39
New Accounting Standards
For a description of new accounting standards issued, but not yet adopted by the Corporation, see "New Accounting Standards," in "Note 1 - Summary of Significant Accounting Policies" in the Notes to Consolidated Financial Statements in Item 8. "Financial Statements and Supplementary Data."
40
RESULTS OF OPERATIONS
Net Interest Income
Net interest income is the most significant component of the Corporation’s net income. The Corporation manages the risk associated with changes in interest rates through the techniques described within Item 7A, "Quantitative and Qualitative Disclosures About Market Risk."
The following table provides a comparative average balance sheet and net interest income analysis for
2016
compared to
2015
and
2014
. Interest income and yields are presented on an FTE basis, using a 35% federal tax rate and statutory interest expense disallowances. The discussion following this table is based on these tax-equivalent amounts.
|
2016
|
2015
|
2014
|
||||||||||||||||||||||||||||||
|
|
Average
Balance |
Interest (1)
|
Yield/
Rate |
Average
Balance |
Interest (1)
|
Yield/
Rate |
Average
Balance |
Interest (1)
|
Yield/
Rate |
|||||||||||||||||||||||
|
(dollars in thousands)
|
||||||||||||||||||||||||||||||||
|
ASSETS
|
||||||||||||||||||||||||||||||||
|
Interest-earning assets:
|
||||||||||||||||||||||||||||||||
|
Loans, net of unearned income
(2)
|
$
|
14,128,064
|
|
$
|
558,472
|
|
3.95
|
%
|
$
|
13,330,973
|
|
$
|
537,979
|
|
4.04
|
%
|
$
|
12,885,180
|
|
$
|
542,540
|
|
4.21
|
%
|
||||||||
|
Taxable investment securities
(3)
|
2,128,497
|
|
44,975
|
|
2.11
|
|
2,093,829
|
|
45,279
|
|
2.16
|
|
2,189,510
|
|
50,651
|
|
2.31
|
|
||||||||||||||
|
Tax-exempt investment securities
(3)
|
327,098
|
|
14,865
|
|
4.54
|
|
230,633
|
|
12,120
|
|
5.26
|
|
261,825
|
|
13,810
|
|
5.27
|
|
||||||||||||||
|
Equity securities
(3)
|
13,969
|
|
780
|
|
5.58
|
|
23,348
|
|
1,295
|
|
5.54
|
|
33,957
|
|
1,728
|
|
5.09
|
|
||||||||||||||
|
Total investment securities
|
2,469,564
|
|
60,620
|
|
2.45
|
|
2,347,810
|
|
58,694
|
|
2.50
|
|
2,485,292
|
|
66,189
|
|
2.66
|
|
||||||||||||||
|
Loans held for sale
|
19,697
|
|
728
|
|
3.70
|
|
19,937
|
|
801
|
|
4.02
|
|
17,524
|
|
786
|
|
4.49
|
|
||||||||||||||
|
Other interest-earning assets
|
407,471
|
|
3,779
|
|
0.93
|
|
447,354
|
|
4,785
|
|
1.07
|
|
314,345
|
|
4,018
|
|
1.28
|
|
||||||||||||||
|
Total interest-earning assets
|
17,024,796
|
|
623,599
|
|
3.66
|
|
16,146,074
|
|
602,259
|
|
3.73
|
|
15,702,341
|
|
613,533
|
|
3.91
|
|
||||||||||||||
|
Noninterest-earning assets:
|
||||||||||||||||||||||||||||||||
|
Cash and due from banks
|
104,772
|
|
105,359
|
|
177,664
|
|
||||||||||||||||||||||||||
|
Premises and equipment
|
227,047
|
|
226,436
|
|
224,903
|
|
||||||||||||||||||||||||||
|
Other assets
(3)
|
1,179,437
|
|
1,103,427
|
|
1,049,765
|
|
||||||||||||||||||||||||||
|
Less: Allowance for loan losses
|
(164,879
|
)
|
(174,453
|
)
|
(195,166
|
)
|
||||||||||||||||||||||||||
|
Total Assets
|
$
|
18,371,173
|
|
$
|
17,406,843
|
|
$
|
16,959,507
|
|
|||||||||||||||||||||||
|
LIABILITIES AND EQUITY
|
||||||||||||||||||||||||||||||||
|
Interest-bearing liabilities:
|
||||||||||||||||||||||||||||||||
|
Demand deposits
|
$
|
3,552,886
|
|
$
|
6,654
|
|
0.19
|
%
|
$
|
3,255,192
|
|
$
|
4,299
|
|
0.13
|
%
|
$
|
3,013,879
|
|
$
|
3,793
|
|
0.13
|
%
|
||||||||
|
Savings deposits
|
4,054,970
|
|
7,981
|
|
0.20
|
|
3,677,079
|
|
5,435
|
|
0.15
|
|
3,431,957
|
|
4,298
|
|
0.13
|
|
||||||||||||||
|
Time deposits
|
2,825,722
|
|
30,058
|
|
1.06
|
|
2,988,648
|
|
30,748
|
|
1.03
|
|
2,992,920
|
|
27,019
|
|
0.90
|
|
||||||||||||||
|
Total interest-bearing deposits
|
10,433,578
|
|
44,693
|
|
0.43
|
|
9,920,919
|
|
40,482
|
|
0.41
|
|
9,438,756
|
|
35,110
|
|
0.37
|
|
||||||||||||||
|
Short-term borrowings
|
395,727
|
|
855
|
|
0.21
|
|
323,772
|
|
372
|
|
0.11
|
|
832,839
|
|
1,608
|
|
0.19
|
|
||||||||||||||
|
Long-term debt
|
959,142
|
|
36,780
|
|
3.83
|
|
1,023,972
|
|
42,941
|
|
4.19
|
|
965,601
|
|
44,493
|
|
4.61
|
|
||||||||||||||
|
Total interest-bearing liabilities
|
11,788,447
|
|
82,328
|
|
0.70
|
|
11,268,663
|
|
83,795
|
|
0.74
|
|
11,237,196
|
|
81,211
|
|
0.72
|
|
||||||||||||||
|
Noninterest-bearing liabilities:
|
||||||||||||||||||||||||||||||||
|
Demand deposits
|
4,151,967
|
|
3,826,194
|
|
3,428,907
|
|
||||||||||||||||||||||||||
|
Other
|
330,125
|
|
285,103
|
|
221,764
|
|
||||||||||||||||||||||||||
|
Total Liabilities
|
16,270,539
|
|
15,379,960
|
|
14,887,867
|
|
||||||||||||||||||||||||||
|
Shareholders’ equity
|
2,100,634
|
|
2,026,883
|
|
2,071,640
|
|
||||||||||||||||||||||||||
|
Total Liabilities and Shareholders' Equity
|
$
|
18,371,173
|
|
$
|
17,406,843
|
|
$
|
16,959,507
|
|
|||||||||||||||||||||||
|
Net interest income/net interest margin (FTE)
|
541,271
|
|
3.18
|
%
|
518,464
|
|
3.21
|
%
|
532,322
|
|
3.39
|
%
|
||||||||||||||||||||
|
Tax equivalent adjustment
|
(20,499
|
)
|
(18,470
|
)
|
(17,455
|
)
|
||||||||||||||||||||||||||
|
Net interest income
|
$
|
520,772
|
|
$
|
499,994
|
|
$
|
514,867
|
|
|||||||||||||||||||||||
(1)
Includes dividends earned on equity securities.
(2)
Includes non-performing loans.
(3)
Includes amortized historical cost for available for sale securities; the related unrealized holding gains (losses) are included in other assets.
41
The following table summarizes the changes in FTE interest income and expense resulting from changes in average balances (volumes) and changes in rates:
|
|
2016 vs. 2015 Increase (decrease) due to change in
|
2015 vs. 2014 Increase (decrease) due to change in
|
|||||||||||||||||||||
|
|
Volume
|
Rate
|
Net
|
Volume
|
Rate
|
Net
|
|||||||||||||||||
|
|
|
|
(in thousands)
|
|
|
||||||||||||||||||
|
Interest income on:
|
|||||||||||||||||||||||
|
Loans and leases
|
$
|
31,676
|
|
$
|
(11,183
|
)
|
$
|
20,493
|
|
$
|
18,147
|
|
$
|
(22,708
|
)
|
$
|
(4,561
|
)
|
|||||
|
Taxable investment securities
|
743
|
|
(1,047
|
)
|
(304
|
)
|
(2,134
|
)
|
(3,238
|
)
|
(5,372
|
)
|
|||||||||||
|
Tax-exempt investment securities
|
4,551
|
|
(1,806
|
)
|
2,745
|
|
(646
|
)
|
(1,044
|
)
|
(1,690
|
)
|
|||||||||||
|
Equity securities
|
(524
|
)
|
10
|
|
(514
|
)
|
(577
|
)
|
143
|
|
(434
|
)
|
|||||||||||
|
Loans held for sale
|
(10
|
)
|
(63
|
)
|
(73
|
)
|
102
|
|
(87
|
)
|
15
|
|
|||||||||||
|
Other interest-earning assets
|
(404
|
)
|
(603
|
)
|
(1,007
|
)
|
1,500
|
|
(732
|
)
|
768
|
|
|||||||||||
|
Total interest income
|
$
|
36,032
|
|
$
|
(14,692
|
)
|
$
|
21,340
|
|
$
|
16,392
|
|
$
|
(27,666
|
)
|
$
|
(11,274
|
)
|
|||||
|
Interest expense on:
|
|||||||||||||||||||||||
|
Demand deposits
|
$
|
423
|
|
$
|
1,932
|
|
$
|
2,355
|
|
$
|
359
|
|
$
|
147
|
|
$
|
506
|
|
|||||
|
Savings deposits
|
603
|
|
1,943
|
|
2,546
|
|
302
|
|
835
|
|
1,137
|
|
|||||||||||
|
Time deposits
|
(1,711
|
)
|
1,021
|
|
(690
|
)
|
(39
|
)
|
3,768
|
|
3,729
|
|
|||||||||||
|
Short-term borrowings
|
106
|
|
377
|
|
483
|
|
(725
|
)
|
(511
|
)
|
(1,236
|
)
|
|||||||||||
|
Long-term debt
|
(2,620
|
)
|
(3,541
|
)
|
(6,161
|
)
|
2,607
|
|
(4,159
|
)
|
(1,552
|
)
|
|||||||||||
|
Total interest expense
|
$
|
(3,199
|
)
|
$
|
1,732
|
|
$
|
(1,467
|
)
|
$
|
2,504
|
|
$
|
80
|
|
$
|
2,584
|
|
|||||
|
Note:
|
Changes which are partially attributable to both volume and rate are allocated to the volume and rate components presented above based on the percentage of the direct changes that are attributable to each component.
|
Comparison of
2016
to
2015
FTE net interest income increased
$22.8 million
, or
4.4%
, to
$541.3 million
in
2016
. Net interest margin decreased
3
basis points, or
0.9%
, to
3.18%
in
2016
from
3.21%
in
2015
.
As summarized above, FTE interest income increased
$36.0 million
as the result of an
$878.7 million
, or
5.4%
, increase in average interest-earning assets. This increase was partially offset by a
$14.7 million
decrease resulting from a
7
basis point decline in average yields on interest earning assets.
Average loans and average FTE yields, by type, are summarized in the following table:
|
|
2016
|
2015
|
Increase (Decrease) in Balance
|
|||||||||||||||||
|
|
Balance
|
Yield
|
Balance
|
Yield
|
$
|
%
|
||||||||||||||
|
|
(dollars in thousands)
|
|||||||||||||||||||
|
Real estate - commercial mortgage
|
$
|
5,636,696
|
|
3.98
|
%
|
$
|
5,246,054
|
|
4.13
|
%
|
$
|
390,642
|
|
7.4
|
%
|
|||||
|
Commercial - industrial, financial and agricultural
|
4,080,854
|
|
3.78
|
|
3,882,998
|
|
3.80
|
|
197,856
|
|
5.1
|
|
||||||||
|
Real estate - home equity
|
1,651,112
|
|
4.08
|
|
1,700,851
|
|
4.10
|
|
(49,739
|
)
|
(2.9
|
)
|
||||||||
|
Real estate - residential mortgage
|
1,464,744
|
|
3.77
|
|
1,371,321
|
|
3.81
|
|
93,423
|
|
6.8
|
|
||||||||
|
Real estate - construction
|
824,182
|
|
3.79
|
|
726,914
|
|
3.88
|
|
97,268
|
|
13.4
|
|
||||||||
|
Consumer
|
276,792
|
|
5.36
|
|
265,688
|
|
5.57
|
|
11,104
|
|
4.2
|
|
||||||||
|
Leasing and other
|
193,684
|
|
5.83
|
|
137,147
|
|
6.76
|
|
56,537
|
|
41.2
|
|
||||||||
|
Total
|
$
|
14,128,064
|
|
3.95
|
%
|
$
|
13,330,973
|
|
4.04
|
%
|
$
|
797,091
|
|
6.0
|
%
|
|||||
Average loans increased
$797.1 million
, or
6.0%
, which contributed
$31.7 million
to the increase in FTE interest income. This increase was partially offset by an
$11.2 million
decrease in FTE interest income as a result of a
9
basis point, or
2.2%
, decline in the average yield on the loan portfolio. The increase in average loans was driven largely by growth in the commercial mortgage, commercial loan, construction, residential mortgage and leasing portfolios. The commercial mortgage growth was realized in all
42
geographic markets, but largely in Pennsylvania. The decrease in average yields on loans was attributable to repayments of higher-yielding loans, refinancing activity at lower rates, and new loan production at rates lower than the overall portfolio yield.
Average investment securities increased
$121.8 million
, or
5.2%
, in comparison to
2015
.
The average yield on investment securities decreased
5
basis points, or
2.0%
, to
2.45%
in
2016
from
2.50%
in
2015
. Other interest earning assets decreased
$39.9 million
, or
8.9%
.
Interest expense decreased
$1.5 million
, or
1.8%
, to
$82.3 million
in
2016
from
$83.8 million
in
2015
, despite an increase in total average interest-bearing liabilities of
$519.8 million
, or
4.6%
, compared to 2015. The impact of the increase in average balances of interest-bearing liabilities was more than offset by a
4
basis point decrease in the average cost of these interest-bearing liabilities. This decrease resulted from a shift in funding mix that was more concentrated in lower-cost deposits and short-term borrowings, as well as the impact of long-term debt refinancing activities.
Average deposits and interest rates, by type, are summarized in the following table:
|
|
2016
|
2015
|
Increase (Decrease) in Balance
|
|||||||||||||||||
|
|
Balance
|
Rate
|
Balance
|
Rate
|
$
|
%
|
||||||||||||||
|
|
(dollars in thousands)
|
|||||||||||||||||||
|
Noninterest-bearing demand
|
$
|
4,151,967
|
|
—
|
%
|
$
|
3,826,194
|
|
—
|
%
|
$
|
325,773
|
|
8.5
|
%
|
|||||
|
Interest-bearing demand
|
3,552,886
|
|
0.19
|
|
3,255,192
|
|
0.13
|
|
297,694
|
|
9.1
|
|
||||||||
|
Savings and money market accounts
|
4,054,970
|
|
0.20
|
|
3,677,079
|
|
0.15
|
|
377,891
|
|
10.3
|
|
||||||||
|
Total demand and savings
|
11,759,823
|
|
0.12
|
|
10,758,465
|
|
0.09
|
|
1,001,358
|
|
9.3
|
|
||||||||
|
Time deposits
|
2,825,722
|
|
1.06
|
|
2,988,648
|
|
1.03
|
|
(162,926
|
)
|
(5.5
|
)
|
||||||||
|
Total deposits
|
$
|
14,585,545
|
|
0.31
|
%
|
$
|
13,747,113
|
|
0.29
|
%
|
$
|
838,432
|
|
6.1
|
%
|
|||||
The
$1.0 billion
, or
9.3%
, increase in average total demand and savings account balances was primarily due to a $500.8 million, or 10.1%, increase in personal account balances, a $342.1 million, or 8.7%, increase in business account balances, and a $159.4 million, or 8.6%, increase in state and municipal account balances.
The average cost of interest-bearing deposits increased
2
basis points, or
4.9%
, to
0.43%
in
2016
from
0.41%
in
2015
, primarily due to an increase in the rates on all interest-bearing deposits.
Average borrowings and interest rates, by type, are summarized in the following table:
|
|
2016
|
2015
|
Increase (Decrease) in Balance
|
|||||||||||||||||
|
|
Balance
|
Rate
|
Balance
|
Rate
|
$
|
%
|
||||||||||||||
|
|
(dollars in thousands)
|
|||||||||||||||||||
|
Short-term borrowings:
|
||||||||||||||||||||
|
Customer repurchase agreements
|
$
|
184,978
|
|
0.11
|
%
|
$
|
161,093
|
|
0.10
|
%
|
$
|
23,885
|
|
14.8
|
%
|
|||||
|
Customer short-term promissory notes
|
72,224
|
|
0.03
|
|
81,530
|
|
0.02
|
|
(9,306
|
)
|
(11.4
|
)
|
||||||||
|
Total short-term customer funding
|
257,202
|
|
0.09
|
|
242,623
|
|
0.07
|
|
14,579
|
|
6.0
|
|
||||||||
|
Federal funds purchased
|
127,604
|
|
0.45
|
|
65,779
|
|
0.21
|
|
61,825
|
|
94.0
|
|
||||||||
|
Short-term FHLB advances
(1)
|
10,921
|
|
0.43
|
|
15,370
|
|
0.33
|
|
(4,449
|
)
|
(28.9
|
)
|
||||||||
|
Total short-term borrowings
|
395,727
|
|
0.21
|
|
323,772
|
|
0.11
|
|
71,955
|
|
22.2
|
|
||||||||
|
Long-term debt:
|
||||||||||||||||||||
|
FHLB Advances
|
597,211
|
|
3.12
|
|
622,978
|
|
3.43
|
|
(25,767
|
)
|
(4.1
|
)
|
||||||||
|
Other long-term debt
|
361,931
|
|
5.01
|
|
400,994
|
|
5.38
|
|
(39,063
|
)
|
(9.7
|
)
|
||||||||
|
Total long-term debt
|
959,142
|
|
3.83
|
|
1,023,972
|
|
4.19
|
|
(64,830
|
)
|
(6.3
|
)
|
||||||||
|
Total
|
$
|
1,354,869
|
|
2.78
|
%
|
$
|
1,347,744
|
|
3.21
|
%
|
$
|
7,125
|
|
0.5
|
%
|
|||||
(1) Represents FHLB advances with an original maturity term of less than one year.
43
Total average short-term borrowings increased
$72.0 million
, or
22.2%
, primarily due to an increase in Federal funds purchased. Total long-term debt decreased
$64.8 million
as the result of maturing FHLB advances and the maturity of $100.0 million of subordinated debt in April 2015.
The cost of average short-term borrowings increased 10 basis points, to 0.21% in 2016, largely due to the Federal Reserve System (FRB) increasing the Federal funds interest rate by 25 basis points in December 2015. The cost of average long-term debt decreased 36 basis points, to 3.83% in 2016, as the result of certain refinancing activities for FHLB advances and other long-term debt.
In June 2015, the Corporation issued $150 million of subordinated debt at an effective rate of 4.69%. The proceeds of this issuance were used to redeem $150 million of trust preferred securities, with an effective rate of 6.52%, in July 2015.
In the third quarter of 2015, the Corporation executed two transactions to restructure its long-term FHLB advances. First, $200 million of FHLB advances, with a weighted average rate of 4.45% and maturing in the first quarter of 2017, were refinanced with new advances maturing from September 2019 to December 2020, at a weighted average rate of 2.95%. This transaction reduced interest expense on a quarterly basis by approximately $750,000, beginning in the fourth quarter of 2015.
Second, forward agreements were executed to refinance an additional $200 million of FHLB advances which matured in December 2016. These forward agreements have maturity dates from March 2021 to December 2021 and will reduce the weighted average rate on these advances from 4.03% to 2.40% and decrease interest expense on a quarterly basis by approximately $800,000 beginning in the first quarter of 2017.
Comparison of
2015
to
2014
FTE net interest income decreased $13.9 million, or 2.6%, to $518.5 million in 2015. The net interest margin decreased 18 basis points, or 5.3%, to 3.21% in 2014 from 3.39% in 2014.
FTE interest income decreased $11.3 million, or 1.8%, as average yields on interest-earning assets decreased 18 basis points. This decrease in yields resulted in a $27.7 million decrease in FTE interest income, partially offset by a $16.4 million increase in FTE interest income as a result of a $443.7 million, or 2.8%, increase in average interest-earning assets.
Average loans and average FTE yields, by type, are summarized in the following table:
|
|
2015
|
2014
|
Increase (Decrease) in Balance
|
|||||||||||||||||
|
|
Balance
|
Yield
|
Balance
|
Yield
|
$
|
%
|
||||||||||||||
|
|
(dollars in thousands)
|
|||||||||||||||||||
|
Real estate - commercial mortgage
|
$
|
5,246,054
|
|
4.13
|
%
|
$
|
5,117,433
|
|
4.38
|
%
|
$
|
128,621
|
|
2.5
|
%
|
|||||
|
Commercial - industrial, financial and agricultural
|
3,882,998
|
|
3.80
|
%
|
3,659,059
|
|
3.94
|
|
223,939
|
|
6.1
|
|
||||||||
|
Real estate - home equity
|
1,700,851
|
|
4.10
|
%
|
1,738,449
|
|
4.17
|
|
(37,598
|
)
|
(2.2
|
)
|
||||||||
|
Real estate - residential mortgage
|
1,371,321
|
|
3.81
|
%
|
1,355,876
|
|
3.95
|
|
15,445
|
|
1.1
|
|
||||||||
|
Real estate - construction
|
726,914
|
|
3.88
|
%
|
631,968
|
|
4.04
|
|
94,946
|
|
15.0
|
|
||||||||
|
Consumer
|
265,688
|
|
5.57
|
%
|
277,853
|
|
5.11
|
|
(12,165
|
)
|
(4.4
|
)
|
||||||||
|
Leasing and other
|
137,147
|
|
6.76
|
%
|
104,542
|
|
8.40
|
|
32,605
|
|
31.2
|
|
||||||||
|
Total
|
$
|
13,330,973
|
|
4.04
|
%
|
$
|
12,885,180
|
|
4.21
|
%
|
$
|
445,793
|
|
3.5
|
%
|
|||||
Overall loan growth in 2015 resulted from an increase in business activity in the Corporation's markets. This growth was realized mainly in commercial loans and commercial mortgages, which realized a combined increase of $352.6 million, or 4.0%.
The average yield on loans during 2015 of 4.04% represented a 17 basis point, or 4.0%, decrease in comparison to 2014. The decrease in average yields on loans was attributable to yields on new loans being lower than the overall portfolio yield.
Average investment securities decreased $137.5 million, or 5.5%, in comparison to 2014, as portfolio cash flows were not fully reinvested. The average yield on investment securities decreased 16 basis points, or 6.0%, to 2.50% in 2015 from 2.66% in 2014. Other interest-earning assets increased $133.0 million, or 42.3%. During the fourth quarter of 2014, the Corporation changed providers for check clearing services to the Federal Reserve Bank of Philadelphia, resulting in the transfer of clearing account balances from noninterest earning assets to low-yielding interest-bearing Federal Reserve Bank accounts, which contributed to the 21 basis points, or 16.4%, decrease in the average yield on other interest-earning assets.
44
Interest expense increased $2.6 million, or 3.2%, to $83.8 million in 2015 from $81.2 million in 2014, mainly due to a change in funding mix from lower-cost short-term Federal funds purchased and short-term FHLB advances to higher-cost deposits and long-term FHLB advances. As a result of these funding changes, the total cost of interest-bearing liabilities increased 2 basis points. Total interest-bearing liabilities increased $31.5 million, or 0.3%. Additional funding to support the increase in interest-earning assets was provided by a $397.3 million, or 11.6%, increase in noninterest-bearing demand deposits.
Average deposits and interest rates, by type, are summarized in the following table:
|
|
2015
|
2014
|
Increase (Decrease) in Balance
|
|||||||||||||||||
|
|
Balance
|
Rate
|
Balance
|
Rate
|
$
|
%
|
||||||||||||||
|
|
(dollars in thousands)
|
|||||||||||||||||||
|
Noninterest-bearing demand
|
$
|
3,826,194
|
|
—
|
%
|
$
|
3,428,907
|
|
—
|
%
|
$
|
397,287
|
|
11.6
|
%
|
|||||
|
Interest-bearing demand
|
3,255,192
|
|
0.13
|
|
3,013,879
|
|
0.13
|
|
241,313
|
|
8.0
|
|
||||||||
|
Savings
|
3,677,079
|
|
0.15
|
|
3,431,957
|
|
0.13
|
|
245,122
|
|
7.1
|
|
||||||||
|
Total demand and savings
|
10,758,465
|
|
0.09
|
|
9,874,743
|
|
0.08
|
|
883,722
|
|
8.9
|
|
||||||||
|
Time deposits
|
2,988,648
|
|
1.03
|
|
2,992,920
|
|
0.90
|
|
(4,272
|
)
|
(0.1
|
)
|
||||||||
|
Total deposits
|
$
|
13,747,113
|
|
0.29
|
%
|
$
|
12,867,663
|
|
0.27
|
%
|
$
|
879,450
|
|
6.8
|
%
|
|||||
The $883.7 million, or 8.9%, increase in average total demand and savings account balances was primarily due to a $410.6 million, or 11.7%, increase in business account balances, a $315.5 million, or 6.8%, increase in personal account balances, and a $157.6 million, or 9.3%, increase in state and municipal account balances.
The average cost of interest-bearing deposits increased 4 basis points, or 10.8%, to 0.41% in 2015 from 0.37% in 2014, primarily due to an increase in the rate on time deposits, which contributed $3.8 million to the increase in interest expense.
Average borrowings and interest rates, by type, are summarized in the following table:
|
|
2015
|
2014
|
Increase (Decrease) in Balance
|
|||||||||||||||||
|
|
Balance
|
Rate
|
Balance
|
Rate
|
$
|
%
|
||||||||||||||
|
|
(dollars in thousands)
|
|||||||||||||||||||
|
Short-term borrowings:
|
||||||||||||||||||||
|
Customer repurchase agreements
|
$
|
161,093
|
|
0.10
|
%
|
$
|
197,432
|
|
0.10
|
%
|
$
|
(36,339
|
)
|
(18.4
|
)%
|
|||||
|
Customer short-term promissory notes
|
81,530
|
|
0.02
|
|
88,670
|
|
0.06
|
|
(7,140
|
)
|
(8.1
|
)
|
||||||||
|
Total short-term customer funding
|
242,623
|
|
0.07
|
|
286,102
|
|
0.08
|
|
(43,479
|
)
|
(15.2
|
)
|
||||||||
|
Federal funds purchased
|
65,779
|
|
0.21
|
|
285,169
|
|
0.20
|
|
(219,390
|
)
|
(76.9
|
)
|
||||||||
|
Short-term FHLB advances (1)
|
15,370
|
|
0.33
|
|
261,568
|
|
0.29
|
|
(246,198
|
)
|
(94.1
|
)
|
||||||||
|
Total short-term borrowings
|
323,772
|
|
0.11
|
|
832,839
|
|
0.19
|
|
(509,067
|
)
|
(61.1
|
)
|
||||||||
|
Long-term debt:
|
||||||||||||||||||||
|
FHLB Advances
|
622,978
|
|
3.43
|
|
583,893
|
|
3.79
|
|
39,085
|
|
6.7
|
|
||||||||
|
Other long-term debt
|
400,994
|
|
5.38
|
|
381,708
|
|
5.86
|
|
19,286
|
|
5.1
|
|
||||||||
|
Total long-term debt
|
1,023,972
|
|
4.19
|
|
965,601
|
|
4.61
|
|
58,371
|
|
6.0
|
|
||||||||
|
Total
|
$
|
1,347,744
|
|
3.21
|
%
|
$
|
1,798,440
|
|
2.56
|
%
|
$
|
(450,696
|
)
|
(25.1
|
)%
|
|||||
(1) Represents FHLB advances with an original maturity term of less than one year.
Total short-term borrowings decreased $509.1 million, or 61.1%, due to an improvement in the Corporation's funding position as increases in average deposits and decreases in average investments outpaced the growth in average interest-earning assets. The $58.4 million increase in long-term debt was primarily due to additional long-term FHLB advances. The average cost of total borrowings increased 65 basis points, or 25.4%, to 3.21% in 2015 from 2.56% in 2014, primarily due to the change in funding mix. While total borrowings decreased $450.7 million, or 25.1%, the percentage of lower-cost short-term borrowings decreased from 46.3% of the total in 2014 to 24.0% in 2015. This change in the funding mix resulted from the improvement in the Corporation's overall liquidity position and the shift from short-term borrowings to deposits. See the discussion of long-term debt refinancing activities in the "Comparison of 2016 to 2015" section.
45
Provision for Credit Losses
The provision for credit losses was
$13.2 million
in
2016
, an increase of
$10.9 million
in comparison to
2015
. The provision for credit losses for
2015
was
$2.3 million
, a decrease of $10.3 million in comparison to
2014
.
The provision for credit losses is recognized as an expense in the consolidated statements of income and is the amount necessary to adjust the allowance for credit losses to its appropriate balance, as determined through the Corporation's allowance methodology. The Corporation determines the appropriate level of the allowance for credit losses based on many quantitative and qualitative factors, including, but not limited to: the size and composition of the loan portfolio, changes in risk ratings, changes in collateral values, delinquency levels, historical losses and economic conditions. See further discussion of the Corporation's allowance methodology under the heading "Critical Accounting Policies" above. For details related to the Corporation's allowance and provision for credit losses, see "Provision and Allowance for Credit Losses," under "Financial Condition" below.
Non-Interest Income and Expense
Comparison of
2016
to
2015
Non-Interest Income
The following table presents the components of non-interest income for
2016
and
2015
:
|
|
|
|
Increase (Decrease)
|
|||||||||||
|
|
2016
|
2015
|
$
|
%
|
||||||||||
|
|
(dollars in thousands)
|
|||||||||||||
|
Service charges on deposit accounts:
|
||||||||||||||
|
Overdraft fees
|
$
|
22,175
|
|
$
|
21,500
|
|
$
|
675
|
|
3.1
|
%
|
|||
|
Cash management fees
|
14,183
|
|
13,342
|
|
841
|
|
6.3
|
|
||||||
|
Other
|
14,988
|
|
15,255
|
|
(267
|
)
|
(1.8
|
)
|
||||||
|
Total service charges on deposit accounts
|
51,346
|
|
50,097
|
|
1,249
|
|
2.5
|
|
||||||
|
Other service charges and fees:
|
||||||||||||||
|
Merchant fees
|
16,136
|
|
15,037
|
|
1,099
|
|
7.3
|
|
||||||
|
Commercial loan interest rate swap fees
|
11,560
|
|
5,518
|
|
6,042
|
|
109.5
|
|
||||||
|
Debit card income
|
11,236
|
|
10,748
|
|
488
|
|
4.5
|
|
||||||
|
Letter of credit fees
|
4,504
|
|
4,809
|
|
(305
|
)
|
(6.3
|
)
|
||||||
|
Foreign currency processing income
|
1,555
|
|
1,436
|
|
119
|
|
8.3
|
|
||||||
|
Other
|
6,482
|
|
6,444
|
|
38
|
|
0.6
|
|
||||||
|
Total other service charges and fees
|
51,473
|
|
43,992
|
|
7,481
|
|
17.0
|
|
||||||
|
Investment management and trust services
|
45,270
|
|
44,056
|
|
1,214
|
|
2.8
|
|
||||||
|
Mortgage banking income:
|
||||||||||||||
|
Gain on sales of mortgage loans
|
15,685
|
|
13,264
|
|
2,421
|
|
18.3
|
|
||||||
|
Mortgage servicing income
|
3,730
|
|
4,944
|
|
(1,214
|
)
|
(24.6
|
)
|
||||||
|
Total mortgage banking income
|
19,415
|
|
18,208
|
|
1,207
|
|
6.6
|
|
||||||
|
Other non-interest income:
|
||||||||||||||
|
Credit card income
|
10,252
|
|
9,638
|
|
614
|
|
6.4
|
|
||||||
|
SBA loan sale gains
|
2,273
|
|
458
|
|
1,815
|
|
N/M
|
|
||||||
|
Other income
|
7,599
|
|
6,324
|
|
1,275
|
|
20.2
|
|
||||||
|
Total other income
|
20,124
|
|
16,420
|
|
3,704
|
|
22.6
|
|
||||||
|
Total, excluding investment securities gains
|
187,628
|
|
172,773
|
|
14,855
|
|
8.6
|
|
||||||
|
Investment securities gains
|
2,550
|
|
9,066
|
|
(6,516
|
)
|
(71.9
|
)
|
||||||
|
Total
|
$
|
190,178
|
|
$
|
181,839
|
|
$
|
8,339
|
|
4.6
|
%
|
|||
N/M - Not meaningful
The $675,000, or 3.1%, increase in overdraft fee income during the year ended December 31, 2016, in comparison to the same period in 2015, consisted of a $461,000 increase in fees assessed on personal accounts and a $214,000 increase in fees assessed
46
on commercial accounts, due to higher volumes. Cash management fees increased $841,000, or 6.3%, compared to 2015 due to higher transaction volumes and fee increases implemented in 2016.
The
$1.1 million
, or
7.3
%, increase in merchant fee income, the
$488,000
, or
4.5
%, increase in debit card income and the
$614,000
, or
6.4
%, increase in credit card income were all due to increases in the volumes of transactions in comparison to
2015
.
The
$6.0 million
increase in commercial loan interest rate swap fees was due to growth in commercial loans and the attractiveness of interest rate swaps in the current rate environment, whereby borrowers executed swaps to lock in fixed rates, while the Corporation continues to earn a floating rate. See "Note 10 - Derivative Financial Instruments," in the Notes to Consolidated Financial Statements in Item 8. "Financial Statements and Supplementary Data" for additional details.
The $1.2 million, or 2.8%, increase in investment management and trust services income reflected a $1.6 million, or 6.4%, increase
in trust commissions and money market income, partially offset by a $355,000, or 1.8%, decrease in brokerage fees. The increase in trust commission income was driven by a 9.3% in increase assets under management, as well as improvements in market values of existing assets.
Gains on sales of mortgage loans increased
$2.4 million
, or
18.3
%, due to a 23.7% increase in pricing spreads compared to the prior year, partially offset by a $43.3 million, or 4.4%, decrease in new loan volumes. Mortgage servicing income decreased
$1.2 million
, or
24.6
%, mainly due to a $1.3 million net valuation allowance recognized in 2016. See "Note 7 - Mortgage Servicing Rights," in the Notes to Consolidated Financial Statements in Item 8. "Financial Statements and Supplementary Data" for additional details regarding the impairment charge.
Gains on sales of SBA loans increased
$1.8 million
compared to 2015. Other income increased
$1.3 million
, or
20.2
%, due mainly to an increase in the cash surrender value of insurance contracts on directors and employees.
Gains on sales of investment securities decreased
$6.5 million
compared to 2015. See "Note 3 - Investment Securities," in the Notes to Consolidated Financial Statements in Item 8. "Financial Statements and Supplementary Data" for additional details.
Non-Interest Expense
The following table presents the components of non-interest expense for 2016 and 2015:
|
|
|
|
Increase (Decrease)
|
|||||||||||
|
|
2016
|
2015
|
$
|
%
|
||||||||||
|
|
(dollars in thousands)
|
|||||||||||||
|
Salaries and employee benefits
|
$
|
283,353
|
|
$
|
260,832
|
|
$
|
22,521
|
|
8.6
|
%
|
|||
|
Net occupancy expense
|
47,611
|
|
47,777
|
|
(166
|
)
|
(0.3
|
)
|
||||||
|
Other outside services
|
23,883
|
|
27,785
|
|
(3,902
|
)
|
(14.0
|
)
|
||||||
|
Data processing
|
20,016
|
|
19,894
|
|
122
|
|
0.6
|
|
||||||
|
Software
|
16,903
|
|
14,746
|
|
2,157
|
|
14.6
|
|
||||||
|
Equipment expense
|
12,788
|
|
14,514
|
|
(1,726
|
)
|
(11.9
|
)
|
||||||
|
Professional fees
|
11,004
|
|
11,244
|
|
(240
|
)
|
(2.1
|
)
|
||||||
|
Supplies and postage
|
10,292
|
|
10,202
|
|
90
|
|
0.9
|
|
||||||
|
FDIC insurance
|
9,767
|
|
11,470
|
|
(1,703
|
)
|
(14.8
|
)
|
||||||
|
Marketing
|
7,044
|
|
7,324
|
|
(280
|
)
|
(3.8
|
)
|
||||||
|
Telecommunications
|
5,702
|
|
6,350
|
|
(648
|
)
|
(10.2
|
)
|
||||||
|
Operating risk loss
|
2,815
|
|
3,624
|
|
(809
|
)
|
(22.3
|
)
|
||||||
|
OREO and repossession expense
|
1,926
|
|
3,630
|
|
(1,704
|
)
|
(46.9
|
)
|
||||||
|
Loss on redemption of trust preferred securities
|
—
|
|
5,626
|
|
(5,626
|
)
|
N/M
|
|
||||||
|
Intangible amortization
|
—
|
|
247
|
|
(247
|
)
|
(100.0
|
)
|
||||||
|
Other
|
36,415
|
|
34,895
|
|
1,520
|
|
4.4
|
|
||||||
|
Total
|
$
|
489,519
|
|
$
|
480,160
|
|
$
|
9,359
|
|
1.9
|
%
|
|||
|
N/M - Not meaningful
|
||||||||||||||
The
$22.5 million
, or
8.6
%, increase in salaries and employee benefits during the year ended December 31, 2016 was primarily driven by an $18.8 million, or 8.6%, increase in salaries, resulting from higher average salaries per full-time equivalent employee, normal merit increases and an increase in incentive compensation. The average number of full-time equivalent employees increased
47
to 3,490 for the year ended December 31, 2016, compared to 3,460 for the year ended December 31, 2015. Benefits expenses increased $3.7 million, or 8.9%, due to an increase in health care expense, employer contributions to the Corporation's 401(k) retirement plan, defined benefit plan expense, employee education and other employee benefits.
The
$3.9 million
, or
14.0
%, decrease in other outside services in comparison to 2015 was due to lower expenses associated with the Corporation's BSA/AML compliance program remediation efforts, and lower costs for information technology and human resources initiatives.
The $2.2 million, or 14.6%, increase in software resulted from investments in technology, which are reflected in higher amortization, as well as increases in maintenance costs.
Equipment expense decreased
$1.7 million
, or
11.9
%, primarily due to lower depreciation expense, as certain assets became fully depreciated. FDIC insurance expense decreased
$1.7 million
, or
14.8
%, due to a reduction in the assessment rate beginning in the the third quarter of 2016. Other real estate owned and repossession expense decreased
$1.7 million
, or
46.9
%, when compared to 2015, due to lower holding costs and an increase in net gains on sales. This expense category can experience volatility from period to period based on the timing of foreclosures and sales of properties and payments of expenses.
In July 2015, the Corporation redeemed $150.0 million of TruPS. In connection with this redemption, a loss of $5.6 million was
recognized as a component of non-interest expense with no comparable expense in 2016.
Other non-interest expense increased $1.5 million mainly as a result of $1.8 million of property write downs related to a branch closure and the reconfiguration of a building as part of a long-term facilities plan.
48
Comparison of
2015
to
2014
Non-Interest Income
The following table presents the components of non-interest income:
|
|
|
|
Increase (Decrease)
|
|||||||||||
|
|
2015
|
2014
|
$
|
%
|
||||||||||
|
|
(dollars in thousands)
|
|||||||||||||
|
Service charges on deposit accounts:
|
||||||||||||||
|
Overdraft fees
|
$
|
21,500
|
|
$
|
22,145
|
|
$
|
(645
|
)
|
(2.9
|
)%
|
|||
|
Cash management fees
|
13,342
|
|
12,709
|
|
633
|
|
5.0
|
|
||||||
|
Other
|
15,255
|
|
14,439
|
|
816
|
|
5.7
|
|
||||||
|
Total service charges on deposit accounts
|
50,097
|
|
49,293
|
|
804
|
|
1.6
|
|
||||||
|
Other service charges and fees:
|
||||||||||||||
|
Merchant fees
|
15,037
|
|
13,826
|
|
1,211
|
|
8.8
|
|
||||||
|
Debit card income
|
10,748
|
|
9,948
|
|
800
|
|
8.0
|
|
||||||
|
Commercial loan interest rate swap fees
|
5,518
|
|
3,615
|
|
1,903
|
|
52.6
|
|
||||||
|
Letter of credit fees
|
4,809
|
|
4,563
|
|
246
|
|
5.4
|
|
||||||
|
Foreign currency processing income
|
1,436
|
|
1,248
|
|
188
|
|
15.1
|
|
||||||
|
Other
|
6,444
|
|
6,696
|
|
(252
|
)
|
(3.8
|
)
|
||||||
|
Total other service charges and fees
|
43,992
|
|
39,896
|
|
4,096
|
|
10.3
|
|
||||||
|
Investment management and trust services
|
44,056
|
|
44,605
|
|
(549
|
)
|
(1.2
|
)
|
||||||
|
Mortgage banking income:
|
||||||||||||||
|
Gain on sales of mortgage loans
|
13,264
|
|
10,063
|
|
3,201
|
|
31.8
|
|
||||||
|
Mortgage servicing income
|
4,944
|
|
7,044
|
|
(2,100
|
)
|
(29.8
|
)
|
||||||
|
Total mortgage banking income
|
18,208
|
|
17,107
|
|
1,101
|
|
6.4
|
|
||||||
|
Other non-interest income:
|
||||||||||||||
|
Credit card income
|
9,638
|
|
9,177
|
|
461
|
|
5.0
|
|
||||||
|
Other income
|
6,782
|
|
5,260
|
|
1,522
|
|
28.9
|
|
||||||
|
Total other income
|
16,420
|
|
14,437
|
|
1,983
|
|
13.7
|
|
||||||
|
Total, excluding investment securities gains
|
172,773
|
|
165,338
|
|
7,435
|
|
4.5
|
|
||||||
|
Investment securities gains
|
9,066
|
|
2,041
|
|
7,025
|
|
344.2
|
|
||||||
|
Total
|
$
|
181,839
|
|
$
|
167,379
|
|
$
|
14,460
|
|
8.6
|
%
|
|||
The $549,000, or 1.2%, decrease in investment management and trust services income was due to a $449,000, or 2.3%, decrease in brokerage revenue and a $131,000, or 0.5%, decrease in trust commissions. These decreases resulted from a downturn in market conditions which decreased the values of existing assets under management in trust, wealth management, and brokerage managed accounts.
Total service charges on deposit accounts increased $804,000, or 1.6%. Improvements were seen in other service charges on deposits ($816,000, or 5.7%, increase) due to growth in balances, and cash management fees ($633,000, or 5.0%, increase) due to changes in fee structures. These increases were partially offset by a $645,000, or 2.9%, decrease in overdraft fees due to lower volumes resulting from changes in customer behavior.
The $1.2 million, or 8.8%, increase in merchant fee income, the $800,000, or 8.0%, increase in debit card income and the $461,000, or 5.0%, increase in credit card income were largely driven by higher transaction volumes. Commercial interest rate swap fees increased $1.9 million, or 52.6%, due to higher commercial loan origination volumes.
Gains on sales of mortgage loans increased $3.2 million, or 31.8%, due to a $136.4 million, or 16.1%, increase in new loan commitments and a 13.5% increase in pricing spreads compared to 2014. The increase in new loan commitments was largely in refinancing volumes, which were $479.2 million, or 48.7%, of total new loan commitments in 2015 compared to $277.5 million, or 32.7%, in 2014. Mortgage servicing income decreased $2.1 million, or 29.8%, due to an increase in amortization of mortgage servicing rights ("MSRs"), as prepayments increased when compared to 2014.
49
The $1.5 million, or 28.9%, increase in other income was due to higher gains on sales of fixed assets, primarily former branch properties, in 2015.
Investment securities gains of $9.1 million in 2015 were a result of $6.5 million of net realized gains on the sales of financial institution stocks and $2.6 million of net realized gains on the sales of debt securities. Investment securities gains of $2.0 million for 2014 were the net result of $1.7 million of net realized gains on the sales of debt securities and $335,000 of net realized gains on the sales of financial institution stocks.
Non-Interest Expense
The following table presents the components of non-interest expense:
|
|
|
Increase (Decrease)
|
||||||||||||
|
|
2015
|
2014
|
$
|
%
|
||||||||||
|
|
(dollars in thousands)
|
|||||||||||||
|
Salaries and employee benefits
|
$
|
260,832
|
|
$
|
251,021
|
|
$
|
9,811
|
|
3.9
|
%
|
|||
|
Net occupancy expense
|
47,777
|
|
48,130
|
|
(353
|
)
|
(0.7
|
)
|
||||||
|
Other outside services
|
27,785
|
|
28,404
|
|
(619
|
)
|
(2.2
|
)
|
||||||
|
Data processing
|
19,894
|
|
17,162
|
|
2,732
|
|
15.9
|
|
||||||
|
Software
|
14,746
|
|
12,758
|
|
1,988
|
|
15.6
|
|
||||||
|
Equipment expense
|
14,514
|
|
13,567
|
|
947
|
|
7.0
|
|
||||||
|
FDIC insurance
|
11,470
|
|
10,958
|
|
512
|
|
4.7
|
|
||||||
|
Professional fees
|
11,244
|
|
12,097
|
|
(853
|
)
|
(7.1
|
)
|
||||||
|
Supplies and postage
|
10,202
|
|
9,795
|
|
407
|
|
4.2
|
|
||||||
|
Marketing
|
7,324
|
|
8,133
|
|
(809
|
)
|
(9.9
|
)
|
||||||
|
Telecommunications
|
6,350
|
|
6,870
|
|
(520
|
)
|
(7.6
|
)
|
||||||
|
Loss on redemption of trust preferred securities
|
5,626
|
|
—
|
|
5,626
|
|
N/M
|
|
||||||
|
OREO and repossession expense
|
3,630
|
|
3,270
|
|
360
|
|
11.0
|
|
||||||
|
Operating risk loss
|
3,624
|
|
4,271
|
|
(647
|
)
|
(15.1
|
)
|
||||||
|
Intangible amortization
|
247
|
|
1,259
|
|
(1,012
|
)
|
(80.4
|
)
|
||||||
|
Other
|
34,895
|
|
31,551
|
|
3,344
|
|
10.6
|
|
||||||
|
Total
|
$
|
480,160
|
|
$
|
459,246
|
|
$
|
20,914
|
|
4.6
|
%
|
|||
Salaries and employee benefits increased $9.8 million, or 3.9%, with salaries increasing $8.4 million, or 4.0%, and employee benefits increasing $1.4 million, or 3.6%. The increase in salaries was primarily due to higher average salaries per full-time equivalent employee, an increase in incentive compensation, and higher temporary employee expenses, partially offset by a decrease in the average number of full-time equivalent employees to 3,460 in 2015, compared to 3,530 in 2014. The increase in employee benefits was primarily due to an increase in defined benefit plan expense in 2015, while 2014 included a $1.5 million gain realized on a post-retirement plan amendment.
The $4.7 million, or 15.8%, combined increase in data processing and software resulted from higher transaction volumes, contractual increases in third-party service provider costs, and the implementation of additional systems.
Other outside services expenses remained elevated in 2015, decreasing a modest $619,000, or 2.2%, from 2014. The $947,000, or 7.0%, increase in equipment expense was primarily due to an increase in depreciation expense on new office furniture and equipment. FDIC insurance expense increased $512,000, or 4.7%, as a result of balance sheet growth. Professional fees, consisting of legal and audit fees, decreased $853,000, or 7.1%, due to a combination of lower loan workout legal costs and lower corporate legal fees. Marketing expense decreased $809,000, or 9.9%, as fewer promotional campaigns were executed in 2015.
The $360,000, or 11.0%, decrease in other real estate owned and repossession expense was primarily due to lower repossession expense in 2015. This expense category can experience volatility from period to period based on the timing of foreclosures and sales of properties and payments of expenses, such as real estate taxes.
The $647,000, or 15.1%, decrease in operating risk loss was due to a $1.3 million decrease in check card fraud losses, partially offset by an $817,000 increase in losses associated with previously sold residential mortgages. See "Note 17 - Commitments and Contingencies," in the Notes to Consolidated Financial Statements in Item 8. "Financial Statements and Supplementary Data" for additional details related to repurchases of previously sold residential mortgages.
50
Intangible amortization decreased $1.0 million, as core deposit intangible assets recognized from previous acquisitions were largely amortized and net book values were approaching $0.
In July 2015, the Corporation redeemed $150.0 million of TruPS. In connection with this redemption, a loss of $5.6 million, consisting of the remaining unamortized issuance and hedge costs, was recognized as a component of non-interest expense.
Income Taxes
Income tax expense for
2016
was
$46.6 million
, a decrease of
$3.3 million
, or
6.6%
, from
2015
, primarily as a result of an increase in tax credit investments and tax-exempt income, partially offset by the
4.4%
increase in income before income taxes. Income tax expense for
2015
decreased $2.7 million, or 5.1%, from
2014
. The Corporation’s effective tax rate (income taxes as a percentage of income before income taxes) was
22.4%
in
2016
and
25.0%
in both
2015
and
2014
.
The Corporation’s effective tax rates are lower than the 35% federal statutory rate due mainly to investments in tax-free state and municipal securities and federal tax credits earned from investments in certain community development projects that generate tax credits under various Federal programs ("Tax Credit Investments"), partially offset by the impact of state income taxes. Net credits associated with Tax Credit Investments were
$14.6 million
in
2016
and $10.4 million in both
2015
and
2014
.
For additional information regarding income taxes, see "Note 12 - Income Taxes," in the Notes to Consolidated Financial Statements in Item 8. "Financial Statements and Supplementary Data."
51
FINANCIAL CONDITION
The table below presents condensed consolidated ending balance sheets.
|
|
December 31
|
Increase (decrease)
|
||||||||||||
|
|
2016
|
2015
|
$
|
%
|
||||||||||
|
|
(dollars in thousands)
|
|||||||||||||
|
Assets
|
||||||||||||||
|
Cash and due from banks
|
$
|
118,763
|
|
$
|
101,120
|
|
$
|
17,643
|
|
17.4
|
%
|
|||
|
Other interest-earning assets
|
291,252
|
|
292,516
|
|
(1,264
|
)
|
(0.4
|
)
|
||||||
|
Loans held for sale
|
28,697
|
|
16,886
|
|
11,811
|
|
69.9
|
|
||||||
|
Investment securities
|
2,559,227
|
|
2,484,773
|
|
74,454
|
|
3.0
|
|
||||||
|
Loans, net of allowance
|
14,530,593
|
|
13,669,548
|
|
861,045
|
|
6.3
|
|
||||||
|
Premises and equipment
|
217,806
|
|
225,535
|
|
(7,729
|
)
|
(3.4
|
)
|
||||||
|
Goodwill and intangible assets
|
531,556
|
|
531,556
|
|
—
|
|
—
|
|
||||||
|
Other assets
|
666,353
|
|
592,784
|
|
73,569
|
|
12.4
|
|
||||||
|
Total Assets
|
$
|
18,944,247
|
|
$
|
17,914,718
|
|
$
|
1,029,529
|
|
5.7
|
%
|
|||
|
Liabilities and Shareholders’ Equity
|
||||||||||||||
|
Deposits
|
$
|
15,012,864
|
|
$
|
14,132,317
|
|
$
|
880,547
|
|
6.2
|
%
|
|||
|
Short-term borrowings
|
541,317
|
|
497,663
|
|
43,654
|
|
8.8
|
|
||||||
|
Long-term debt
|
929,403
|
|
949,542
|
|
(20,139
|
)
|
(2.1
|
)
|
||||||
|
Other liabilities
|
339,548
|
|
293,302
|
|
46,246
|
|
15.8
|
|
||||||
|
Total Liabilities
|
16,823,132
|
|
15,872,824
|
|
950,308
|
|
6.0
|
|
||||||
|
Total Shareholders’ Equity
|
2,121,115
|
|
2,041,894
|
|
79,221
|
|
3.9
|
|
||||||
|
Total Liabilities and Shareholders’ Equity
|
$
|
18,944,247
|
|
$
|
17,914,718
|
|
$
|
1,029,529
|
|
5.7
|
%
|
|||
Investment Securities
The following table presents the carrying amount of investment securities, which were all classified as available for sale, as of December 31:
|
|
2016
|
2015
|
2014
|
||||||||
|
|
(in thousands)
|
||||||||||
|
U.S. Government securities
|
$
|
—
|
|
$
|
—
|
|
$
|
200
|
|
||
|
U.S. Government sponsored agency securities
|
134
|
|
25,136
|
|
214
|
|
|||||
|
State and municipal
|
391,641
|
|
262,765
|
|
245,215
|
|
|||||
|
Corporate debt securities
|
109,409
|
|
96,955
|
|
98,034
|
|
|||||
|
Collateralized mortgage obligations
|
593,860
|
|
821,509
|
|
902,313
|
|
|||||
|
Mortgage-backed securities
|
1,342,401
|
|
1,158,835
|
|
928,831
|
|
|||||
|
Auction rate securities
|
97,256
|
|
98,059
|
|
100,941
|
|
|||||
|
Total debt securities
|
2,534,701
|
|
2,463,259
|
|
2,275,748
|
|
|||||
|
Equity securities
|
24,526
|
|
21,514
|
|
47,623
|
|
|||||
|
Total
|
$
|
2,559,227
|
|
$
|
2,484,773
|
|
$
|
2,323,371
|
|
||
Total investment securities increased
$74.5 million
, or
3.0%
, to
$2.6 billion
at
December 31, 2016
, mainly in mortgage-backed securities and state and municipal securities, partially offset by a decrease in collateralized mortgage obligations.
Collateralized mortgage obligations decreased $227.6 million, or 27.7%, as the Corporation reduced its holdings in lower coupon investments due to volatility in market pricing. The $3.0 million, or 14.0%, increase in equity securities reflects an increase in unrealized gains on financial institutions stocks. The net pre-tax unrealized loss on available for sale investment securities was
$35.0 million
as of
December 31, 2016
, compared to a $9.3 million net pre-tax unrealized loss as of
December 31, 2015
. The change was due to an increase in market interest rates, which resulted in lower fair values for debt securities, including collateralized mortgage obligations and mortgage-backed securities.
52
Loans
The following table presents loans outstanding, by type, as of the dates shown, and the changes in balances for the most recent year:
|
|
December 31
|
2016 vs. 2015 Increase (Decrease)
|
||||||||||||||||||||||||
|
|
2016
|
2015
|
2014
|
2013
|
2012
|
$
|
%
|
|||||||||||||||||||
|
|
(dollars in thousands)
|
|||||||||||||||||||||||||
|
Real estate – commercial mortgage
|
$
|
6,018,582
|
|
$
|
5,462,330
|
|
$
|
5,197,155
|
|
$
|
5,101,922
|
|
$
|
4,664,426
|
|
$
|
556,252
|
|
10.2
|
%
|
||||||
|
Commercial – industrial, financial and agricultural
|
4,087,486
|
|
4,088,962
|
|
3,725,567
|
|
3,628,420
|
|
3,612,065
|
|
(1,476
|
)
|
—
|
|
||||||||||||
|
Real estate – home equity
|
1,625,115
|
|
1,684,439
|
|
1,736,688
|
|
1,764,197
|
|
1,632,390
|
|
(59,324
|
)
|
(3.5
|
)
|
||||||||||||
|
Real estate – residential mortgage
|
1,601,994
|
|
1,376,160
|
|
1,377,068
|
|
1,337,380
|
|
1,257,432
|
|
225,834
|
|
16.4
|
|
||||||||||||
|
Real estate – construction
|
843,649
|
|
799,988
|
|
690,601
|
|
573,672
|
|
584,118
|
|
43,661
|
|
5.5
|
|
||||||||||||
|
Consumer
|
291,470
|
|
268,588
|
|
265,431
|
|
283,124
|
|
309,864
|
|
22,882
|
|
8.5
|
|
||||||||||||
|
Leasing, other and overdrafts
|
250,366
|
|
173,651
|
|
131,583
|
|
103,301
|
|
93,914
|
|
76,715
|
|
44.2
|
|
||||||||||||
|
Gross loans
|
14,718,662
|
|
13,854,118
|
|
13,124,093
|
|
12,792,016
|
|
12,154,209
|
|
864,544
|
|
6.2
|
|
||||||||||||
|
Unearned income
|
(19,390
|
)
|
(15,516
|
)
|
(12,377
|
)
|
(9,796
|
)
|
(7,238
|
)
|
(3,874
|
)
|
25.0
|
|
||||||||||||
|
Loans, net of unearned income
|
$
|
14,699,272
|
|
$
|
13,838,602
|
|
$
|
13,111,716
|
|
$
|
12,782,220
|
|
$
|
12,146,971
|
|
$
|
860,670
|
|
6.2
|
%
|
||||||
The Corporation does not have a concentration of credit risk with any single borrower, industry or geographic location within its footprint. Approximately
$6.9 billion
, or
46.7%
, of the loan portfolio was in commercial mortgage and construction loans as of
December 31, 2016
. As of
December 31, 2016
, the Corporation's policies limit the maximum total lending commitment to an individual borrower to $50.0 million. In addition, the Corporation has established lower total lending limits for certain types of lending commitments, and lower total lending limits based on the Corporation's internal risk rating of an individual borrower at the time the lending commitment is approved. As of
December 31, 2016
, the Corporation had 122 relationships with total borrowing commitments between $20.0 million and $50.0 million.
Commercial mortgage loans increased
$556.3 million
, or
10.2%
, in comparison to
December 31, 2015
across all markets, but primarily in Pennsylvania.
Residential mortgages increased
$225.8 million
, or
16.4%
, across all markets, except Delaware. The increase in residential mortgages resulted from a strategic decision to originate and retain certain jumbo mortgage loans and loans that enhance the Corporation's compliance with Community Reinvestment Act requirements.
53
The following table summarizes the industry concentrations within the commercial loan portfolio as of December 31:
|
2016
|
2015
|
||||
|
Services
|
21.8
|
%
|
22.6
|
%
|
|
|
Retail
|
15.1
|
|
8.3
|
|
|
|
Health care
|
10.5
|
|
10.6
|
|
|
|
Manufacturing
|
9.2
|
|
11.3
|
|
|
|
Construction
(1)
|
9.0
|
|
9.7
|
|
|
|
Wholesale
|
7.0
|
|
8.0
|
|
|
|
Real estate
(2)
|
6.7
|
|
7.3
|
|
|
|
Agriculture
|
5.0
|
|
5.1
|
|
|
|
Arts and entertainment
|
2.6
|
|
2.8
|
|
|
|
Transportation
|
2.3
|
|
2.7
|
|
|
|
Financial services
|
2.1
|
|
1.7
|
|
|
|
Other
|
8.7
|
|
9.9
|
|
|
|
Total
|
100.0
|
%
|
100.0
|
%
|
|
|
(1)
|
Includes commercial loans to borrowers engaged in the construction industry.
|
|
(2)
|
Includes commercial loans to borrowers engaged in the business of: renting, leasing or managing real estate for others; selling and/or buying real estate for others; and appraising real estate.
|
Commercial loans and commercial mortgage loans also include shared national credits, which are participations in loans or loan commitments of at least $20 million that are shared by three or more banks. The Corporation only participates in shared national credits to borrowers located in its geographic markets. Below is a summary of the Corporation's outstanding purchased shared national credits as of December 31:
|
2016
|
2015
|
||||||
|
(in thousands)
|
|||||||
|
Commercial - industrial, financial and agricultural
|
$
|
155,353
|
|
$
|
152,830
|
|
|
|
Real estate - commercial mortgage
|
81,573
|
|
96,219
|
|
|||
|
Total
|
$
|
236,926
|
|
$
|
249,049
|
|
|
Total shared national credits decreased
$12.1 million
, or
4.9%
, in comparison to
2015
. As of
December 31, 2016
, none of the shared national credits were past due.
Construction loans include loans to commercial borrowers secured by residential real estate, loans to commercial borrowers secured by commercial real estate and other construction loans, which represent loans to individuals secured by residential real estate.
The following table presents outstanding construction loans and delinquency rates, by class segment, as of December 31:
|
2016
|
2015
|
||||||||||||||||||
|
$
|
Delinquency Rate
|
% of Total
|
$
|
Delinquency Rate
|
% of Total
|
||||||||||||||
|
(dollars in thousands)
|
|||||||||||||||||||
|
Commercial
|
$
|
644,490
|
|
0.2
|
%
|
76.4
|
%
|
$
|
559,991
|
|
0.2
|
%
|
70.0
|
%
|
|||||
|
Commercial - residential
|
142,189
|
|
6.0
|
|
16.9
|
|
179,303
|
|
7.3
|
|
22.4
|
|
|||||||
|
Other
|
56,970
|
|
1.9
|
|
6.7
|
|
60,694
|
|
1.1
|
|
7.6
|
|
|||||||
|
Total Real estate - construction
|
$
|
843,649
|
|
1.3
|
%
|
100.0
|
%
|
$
|
799,988
|
|
1.8
|
%
|
100.0
|
%
|
|||||
Construction loans increased
$43.7 million
, or
5.5%
, as a result of growth in commercial construction loans, partially offset by a decrease in residential construction loans. Geographically, the increase occurred in the Maryland ($30.7 million, or 49.1%), Pennsylvania ($15.3 million, or 3.2%) and Delaware ($9.7 million, or 22%) markets, partially offset by decreases in the New Jersey ($7.7 million, or 4.9%) and Virginia ($4.3 million, or 7.2%) markets.
54
Provision and Allowance for Credit Losses
The Corporation accounts for the credit risk associated with lending activities through the allowance for credit losses and the provision for credit losses.
A summary of the Corporation’s loan loss experience follows:
|
2016
|
2015
|
2014
|
2013
|
2012
|
|||||||||||||||
|
|
(dollars in thousands)
|
||||||||||||||||||
|
Loans, net of unearned income outstanding at end of year
|
$
|
14,699,272
|
|
$
|
13,838,602
|
|
$
|
13,111,716
|
|
$
|
12,782,220
|
|
$
|
12,146,971
|
|
||||
|
Daily average balance of loans, net of unearned income
|
$
|
14,128,064
|
|
$
|
13,330,973
|
|
$
|
12,885,180
|
|
$
|
12,578,524
|
|
$
|
11,968,567
|
|
||||
|
Balance of allowance for credit losses at beginning of year
|
$
|
171,412
|
|
$
|
185,931
|
|
$
|
204,917
|
|
$
|
225,439
|
|
$
|
258,177
|
|
||||
|
Loans charged off:
|
|||||||||||||||||||
|
Commercial – industrial, financial and agricultural
|
15,276
|
|
15,639
|
|
24,516
|
|
30,383
|
|
41,868
|
|
|||||||||
|
Real estate - home equity and consumer
|
7,712
|
|
5,831
|
|
7,811
|
|
10,070
|
|
13,470
|
|
|||||||||
|
Real estate – commercial mortgage
|
3,580
|
|
4,218
|
|
6,004
|
|
20,829
|
|
51,988
|
|
|||||||||
|
Real estate – residential mortgage
|
2,326
|
|
3,612
|
|
2,918
|
|
9,705
|
|
4,509
|
|
|||||||||
|
Real estate – construction
|
1,218
|
|
201
|
|
1,209
|
|
6,572
|
|
26,250
|
|
|||||||||
|
Leasing, other and overdrafts
|
3,815
|
|
2,656
|
|
2,135
|
|
2,653
|
|
2,281
|
|
|||||||||
|
Total loans charged off
|
33,927
|
|
32,157
|
|
44,593
|
|
80,212
|
|
140,366
|
|
|||||||||
|
Recoveries of loans previously charged off:
|
|||||||||||||||||||
|
Commercial – industrial, financial and agricultural
|
8,981
|
|
5,264
|
|
4,256
|
|
9,281
|
|
4,282
|
|
|||||||||
|
Real estate - home equity and consumer
|
2,466
|
|
2,492
|
|
2,347
|
|
2,378
|
|
1,811
|
|
|||||||||
|
Real estate – commercial mortgage
|
3,373
|
|
2,801
|
|
1,960
|
|
3,494
|
|
3,371
|
|
|||||||||
|
Real estate – residential mortgage
|
1,072
|
|
1,322
|
|
451
|
|
548
|
|
459
|
|
|||||||||
|
Real estate – construction
|
3,924
|
|
2,824
|
|
3,177
|
|
2,682
|
|
2,814
|
|
|||||||||
|
Leasing, other and overdrafts
|
842
|
|
685
|
|
916
|
|
807
|
|
891
|
|
|||||||||
|
Total recoveries
|
20,658
|
|
15,388
|
|
13,107
|
|
19,190
|
|
13,628
|
|
|||||||||
|
Net loans charged off
|
13,269
|
|
16,769
|
|
31,486
|
|
61,022
|
|
126,738
|
|
|||||||||
|
Provision for credit losses
|
13,182
|
|
2,250
|
|
12,500
|
|
40,500
|
|
94,000
|
|
|||||||||
|
Balance at end of year
|
$
|
171,325
|
|
$
|
171,412
|
|
$
|
185,931
|
|
$
|
204,917
|
|
$
|
225,439
|
|
||||
|
Components of Allowance for Credit Losses:
|
|||||||||||||||||||
|
Allowance for loan losses
|
$
|
168,679
|
|
$
|
169,054
|
|
$
|
184,144
|
|
$
|
202,780
|
|
$
|
223,903
|
|
||||
|
Reserve for unfunded lending commitments
(1)
|
2,646
|
|
2,358
|
|
1,787
|
|
2,137
|
|
1,536
|
|
|||||||||
|
Allowance for credit losses
|
$
|
171,325
|
|
$
|
171,412
|
|
$
|
185,931
|
|
$
|
204,917
|
|
$
|
225,439
|
|
||||
|
Selected Asset Quality Ratios:
|
|||||||||||||||||||
|
Net charge-offs to average loans
|
0.09
|
%
|
0.13
|
%
|
0.24
|
%
|
0.49
|
%
|
1.06
|
%
|
|||||||||
|
Allowance for loan losses to loans outstanding
|
1.15
|
%
|
1.22
|
%
|
1.40
|
%
|
1.59
|
%
|
1.84
|
%
|
|||||||||
|
Allowance for credit losses to loans outstanding
|
1.17
|
%
|
1.24
|
%
|
1.42
|
%
|
1.60
|
%
|
1.86
|
%
|
|||||||||
|
Non-performing assets
(2)
to total assets
|
0.76
|
%
|
0.87
|
%
|
0.88
|
%
|
1.00
|
%
|
1.43
|
%
|
|||||||||
|
Non-performing assets
(2)
to total loans and OREO
|
0.98
|
%
|
1.13
|
%
|
1.15
|
%
|
1.32
|
%
|
1.95
|
%
|
|||||||||
|
Non-accrual loans to total loans
|
0.82
|
%
|
0.94
|
%
|
0.92
|
%
|
1.05
|
%
|
1.52
|
%
|
|||||||||
|
Allowance for credit losses to non-performing loans
|
130.15
|
%
|
118.37
|
%
|
134.26
|
%
|
132.82
|
%
|
106.82
|
%
|
|||||||||
|
Non-performing assets
(2)
to tangible equity and allowance for credit losses
(3)
|
8.20
|
%
|
9.27
|
%
|
9.12
|
%
|
9.76
|
%
|
13.39
|
%
|
|||||||||
(1)
Reserve for unfunded lending commitments recorded within other liabilities on the consolidated balance sheets.
(2)
Includes accruing loans past due 90 days or more.
|
(3)
|
Ratio represents a financial measure derived by methods other than Generally Accepted Accounting Principles ("GAAP"). See reconciliation of this non-GAAP financial measure to the most directly comparable GAAP measure under the heading, "Supplemental Reporting of Non-GAAP Based Financial Measures," in Item 6. "Selected Financial Data."
|
The provision for credit losses increased
$10.9 million
in comparison to
2015
due mainly to loan growth, as overall credit metrics were stable to improving. Net charge-offs decreased
$3.5 million
, or
20.9%
, to
$13.3 million
in
2016
from
$16.8 million
in
2015
. This decrease was primarily due to a
$4.1 million
, or
39.3%
, decrease in commercial loan net charge-offs, a
$1.2 million
, or
85.4%
, decrease in commercial mortgage net charge-offs, and a
$1.0 million
, or
45.2%
decrease in residential mortgage net charge-offs, partially offset by increases in net charge-offs in consumer and home equity loans of
$1.9 million
, or
57.1%
and a
$1.0 million
,
55
or
50.8%
, increase in leasing and other loans net charge-offs. The
$13.3 million
of net charge-offs were primarily in the Pennsylvania ($9.5 million, or 71.7% of the total), and New Jersey ($4.0 million, or 30.0%) markets, partially offset by net recoveries in the Virginia and Delaware markets.
The following table presents non-performing assets as of December 31:
|
|
2016
|
2015
|
2014
|
2013
|
2012
|
||||||||||||||
|
|
(in thousands)
|
||||||||||||||||||
|
Non-accrual loans
(1) (2) (3)
|
$
|
120,133
|
|
$
|
129,523
|
|
$
|
121,080
|
|
$
|
133,753
|
|
$
|
184,832
|
|
||||
|
Loans 90 days or more past due and still accruing
(2)
|
11,505
|
|
15,291
|
|
17,402
|
|
20,524
|
|
26,221
|
|
|||||||||
|
Total non-performing loans
|
131,638
|
|
144,814
|
|
138,482
|
|
154,277
|
|
211,053
|
|
|||||||||
|
OREO
|
12,815
|
|
11,099
|
|
12,022
|
|
15,052
|
|
26,146
|
|
|||||||||
|
Total non-performing assets
|
$
|
144,453
|
|
$
|
155,913
|
|
$
|
150,504
|
|
$
|
169,329
|
|
$
|
237,199
|
|
||||
|
(1)
|
In
2016
, the total interest income that would have been recorded if non-accrual loans had been current in accordance with their original terms was approximately $6.1 million. The amount of interest income on non-accrual loans that was recognized in
2016
was approximately $2.3 million.
|
|
(2)
|
Accrual of interest is generally discontinued when a loan becomes 90 days past due. When interest accruals are discontinued, unpaid interest previously credited to income is reversed. Non-accrual loans may be restored to accrual status when all delinquent principal and interest has been paid currently for six consecutive months or the loan is considered secured and in the process of collection. Certain loans, primarily adequately collateralized residential mortgage loans, may continue to accrue interest after reaching 90 days past due.
|
|
(3)
|
Excluded from non-performing assets as of
December 31, 2016
were
$59.6 million
of loans modified under trouble debt restructurings ("TDRs"). These loans were reviewed for impairment under FASB ASC Section 310-10-35, but continue to accrue interest and are, therefore, not included in non-accrual loans.
|
The following table presents TDRs as of December 31:
|
2016
|
2015
|
2014
|
2013
|
2012
|
|||||||||||||||
|
(in thousands)
|
|||||||||||||||||||
|
Real estate – residential mortgage
|
$
|
27,617
|
|
$
|
28,511
|
|
$
|
31,308
|
|
$
|
28,815
|
|
$
|
32,993
|
|
||||
|
Real estate – commercial mortgage
|
15,957
|
|
17,563
|
|
18,822
|
|
19,758
|
|
34,672
|
|
|||||||||
|
Real estate – construction
|
726
|
|
3,942
|
|
9,241
|
|
10,117
|
|
10,564
|
|
|||||||||
|
Commercial – industrial, financial and agricultural
|
6,627
|
|
5,953
|
|
5,237
|
|
8,045
|
|
5,745
|
|
|||||||||
|
Real estate - home equity
|
8,594
|
|
4,556
|
|
2,975
|
|
1,365
|
|
1,518
|
|
|||||||||
|
Consumer
|
39
|
|
33
|
|
38
|
|
11
|
|
16
|
|
|||||||||
|
Total accruing TDRs
|
59,560
|
|
60,558
|
|
67,621
|
|
68,111
|
|
85,508
|
|
|||||||||
|
Non-accrual TDRs
(1)
|
27,850
|
|
31,035
|
|
24,616
|
|
30,209
|
|
31,245
|
|
|||||||||
|
Total TDRs
|
$
|
87,410
|
|
$
|
91,593
|
|
$
|
92,237
|
|
$
|
98,320
|
|
$
|
116,753
|
|
||||
|
(1)
|
Included within non-accrual loans in the preceding table.
|
Total TDRs modified during
2016
and still outstanding as of
December 31, 2016
were
$12.4 million
. Of these loans,
$6.0 million
, or
48.4%
, had a payment default during
2016
, which the Corporation defines as a single missed scheduled payment, subsequent to modification. TDRs modified during
2015
and still outstanding as of
December 31, 2015
totaled
$14.4 million
. Of these loans,
$5.1 million
, or
35.5%
, had a payment default subsequent to modification during
2015
.
56
The following table presents the changes in non-accrual loans for the years ended December 31:
|
Commercial -
Industrial, Financial and Agricultural |
Real Estate -
Commercial Mortgage |
Real Estate -
Construction |
Real Estate -
Residential Mortgage |
Real Estate -
Home Equity |
Consumer
|
Leasing
|
Total
|
||||||||||||||||||||||||
|
(in thousands)
|
|||||||||||||||||||||||||||||||
|
Balance of non-accrual loans at December 31, 2014
|
$
|
29,769
|
|
$
|
44,437
|
|
$
|
16,348
|
|
$
|
20,043
|
|
$
|
10,483
|
|
$
|
—
|
|
$
|
—
|
|
$
|
121,080
|
|
|||||||
|
Additions
|
51,066
|
|
24,310
|
|
5,150
|
|
13,845
|
|
8,839
|
|
2,229
|
|
2,835
|
|
108,274
|
|
|||||||||||||||
|
Payments
|
(20,575
|
)
|
(19,786
|
)
|
(9,253
|
)
|
(3,810
|
)
|
(1,945
|
)
|
—
|
|
(1
|
)
|
(55,370
|
)
|
|||||||||||||||
|
Charge-offs
(1)
|
(15,639
|
)
|
(4,218
|
)
|
(201
|
)
|
(3,612
|
)
|
(3,604
|
)
|
(2,227
|
)
|
(1,409
|
)
|
(30,910
|
)
|
|||||||||||||||
|
Transfers to OREO
|
(2,381
|
)
|
(1,668
|
)
|
—
|
|
(4,112
|
)
|
(2,039
|
)
|
—
|
|
—
|
|
(10,200
|
)
|
|||||||||||||||
|
Transfers to accrual status
|
(41
|
)
|
(2,344
|
)
|
—
|
|
(440
|
)
|
(524
|
)
|
(2
|
)
|
—
|
|
(3,351
|
)
|
|||||||||||||||
|
Balance of non-accrual loans at December 31, 2015
|
42,199
|
|
40,731
|
|
12,044
|
|
21,914
|
|
11,210
|
|
—
|
|
1,425
|
|
129,523
|
|
|||||||||||||||
|
Additions
|
32,831
|
|
25,151
|
|
6,921
|
|
5,611
|
|
8,983
|
|
2,803
|
|
808
|
|
83,108
|
|
|||||||||||||||
|
Payments
|
(14,328
|
)
|
(14,682
|
)
|
(6,257
|
)
|
(3,532
|
)
|
(2,512
|
)
|
(1
|
)
|
(24
|
)
|
(41,336
|
)
|
|||||||||||||||
|
Charge-offs
(1)
|
(15,276
|
)
|
(3,580
|
)
|
(1,218
|
)
|
(2,326
|
)
|
(4,912
|
)
|
(2,800
|
)
|
(2,209
|
)
|
(32,321
|
)
|
|||||||||||||||
|
Transfers to OREO
|
(552
|
)
|
(2,992
|
)
|
(1,684
|
)
|
(2,925
|
)
|
(1,199
|
)
|
—
|
|
—
|
|
(9,352
|
)
|
|||||||||||||||
|
Transfers to accrual status
|
(2,525
|
)
|
(5,692
|
)
|
—
|
|
(311
|
)
|
(959
|
)
|
(2
|
)
|
—
|
|
(9,489
|
)
|
|||||||||||||||
|
Balance of non-accrual loans at December 31, 2016
|
$
|
42,349
|
|
$
|
38,936
|
|
$
|
9,806
|
|
$
|
18,431
|
|
$
|
10,611
|
|
$
|
—
|
|
$
|
—
|
|
$
|
120,133
|
|
|||||||
(1) Excludes charge-offs of loans on accrual status.
Non-accrual loans decreased
$9.4 million
, or
7.2%
, in
2016
due mainly to a decrease in non-accrual loan additions from
$108.3 million
in
2015
to
$83.1 million
in
2016
. The non-accrual loan additions occurred across most loan types, and was not driven by one specific account or event. Non-accrual loan balances continued to be reduced through payments, return to accrual status and charge-offs.
The following table presents non-performing loans, by type, as of the dates shown and the changes in non-performing loans for the most recent year:
|
|
December 31
|
2016 vs. 2015 Decrease
|
||||||||||||||||||||||||
|
|
2016
|
2015
|
2014
|
2013
|
2012
|
$
|
%
|
|||||||||||||||||||
|
|
(dollars in thousands)
|
|||||||||||||||||||||||||
|
Commercial – industrial, financial and agricultural
|
$
|
43,460
|
|
$
|
44,071
|
|
$
|
30,388
|
|
$
|
38,021
|
|
$
|
66,954
|
|
$
|
(611
|
)
|
(1.4
|
)%
|
||||||
|
Real estate – commercial mortgage
|
39,319
|
|
41,170
|
|
45,237
|
|
44,068
|
|
57,120
|
|
(1,851
|
)
|
(4.5
|
)
|
||||||||||||
|
Real estate – residential mortgage
|
23,655
|
|
28,484
|
|
28,995
|
|
31,347
|
|
34,436
|
|
(4,829
|
)
|
(17.0
|
)
|
||||||||||||
|
Real estate – home equity
|
13,154
|
|
14,683
|
|
14,740
|
|
16,983
|
|
17,204
|
|
(1,529
|
)
|
(10.4
|
)
|
||||||||||||
|
Real estate – construction
|
9,842
|
|
12,460
|
|
16,399
|
|
21,267
|
|
32,005
|
|
(2,618
|
)
|
(21.0
|
)
|
||||||||||||
|
Consumer
|
1,891
|
|
2,440
|
|
2,590
|
|
2,543
|
|
3,315
|
|
(549
|
)
|
(22.5
|
)
|
||||||||||||
|
Leasing
|
317
|
|
1,506
|
|
133
|
|
48
|
|
19
|
|
(1,189
|
)
|
(79.0
|
)
|
||||||||||||
|
Total non-performing loans
|
$
|
131,638
|
|
$
|
144,814
|
|
$
|
138,482
|
|
$
|
154,277
|
|
$
|
211,053
|
|
$
|
(13,176
|
)
|
(9.1
|
)%
|
||||||
Non-performing residential mortgage loans decreased
$4.8 million
, or
17.0%
, in comparison to
December 31, 2015
. Geographically, the decrease occurred mainly in the Pennsylvania ($1.8 million, or 16.8%), New Jersey ($1.5 million, or 18.0%) and Maryland ($1.3 million, or 38.7%) markets.
Non-performing construction loans decreased
$2.6 million
, or
21.0%
, in comparison to
December 31, 2015
. Geographically, the decrease occurred mainly in the Pennsylvania ($4.6 million, or 50.6%), New Jersey ($1.4 million, or 79.0%) and Maryland ($543,000, or 42.7%) markets, partially offset by an increase in the Delaware ($3.9 million) market.
57
The following table summarizes OREO, by property type, as of December 31:
|
2016
|
2015
|
||||||
|
|
(in thousands)
|
||||||
|
Residential properties
|
$
|
7,655
|
|
$
|
7,303
|
|
|
|
Commercial properties
|
2,651
|
|
2,167
|
|
|||
|
Undeveloped land
|
2,509
|
|
1,629
|
|
|||
|
Total OREO
|
$
|
12,815
|
|
$
|
11,099
|
|
|
As noted under the heading "Critical Accounting Policies" within Management's Discussion, the Corporation's ability to identify potential problem loans in a timely manner is key to maintaining an adequate allowance for credit losses. For commercial loans, commercial mortgages and construction loans to commercial borrowers, an internal risk rating process is used to monitor credit quality. For a complete description of the Corporation's risk ratings, refer to the "Allowance for Credit Losses" section within "Note 1 - Summary of Significant Accounting Policies," in the Notes to Consolidated Financial Statements. The evaluation of credit risk for residential mortgages, home equity loans, construction loans to individuals, consumer loans and lease receivables is based on aggregate payment history, through the monitoring of delinquency levels and trends.
Total internally risk rated loans were
$10.9 billion
and
$10.3 billion
as of
December 31, 2016
and
2015
, respectively. The following table presents internal risk ratings of special mention or lower for commercial loans, commercial mortgages and construction loans to commercial borrowers, by class segment, as of December 31:
|
Special Mention
|
2016 vs. 2015 Increase (Decrease)
|
Substandard or Lower
|
2016 vs. 2015 Increase (Decrease)
|
Total Criticized Loans
|
|||||||||||||||||||||||||||||||||
|
2016
|
2015
|
$
|
%
|
2016
|
2015
|
$
|
%
|
2016
|
2015
|
||||||||||||||||||||||||||||
|
(dollars in thousands)
|
|||||||||||||||||||||||||||||||||||||
|
Real estate - commercial mortgage
|
$
|
132,484
|
|
$
|
102,625
|
|
$
|
29,859
|
|
29.1
|
%
|
$
|
122,976
|
|
$
|
155,442
|
|
$
|
(32,466
|
)
|
(20.9
|
)%
|
$
|
255,460
|
|
$
|
258,067
|
|
|||||||||
|
Commercial - secured
|
128,873
|
|
92,711
|
|
36,162
|
|
39.0
|
|
118,527
|
|
136,710
|
|
(18,183
|
)
|
(13.3
|
)
|
247,400
|
|
229,421
|
|
|||||||||||||||||
|
Commercial -unsecured
|
4,481
|
|
2,761
|
|
1,720
|
|
62.3
|
|
3,531
|
|
3,346
|
|
185
|
|
5.5
|
|
8,012
|
|
6,107
|
|
|||||||||||||||||
|
Total commercial - industrial, financial and agricultural
|
133,354
|
|
95,472
|
|
37,882
|
|
39.7
|
|
122,058
|
|
140,056
|
|
(17,998
|
)
|
(12.9
|
)
|
255,412
|
|
235,528
|
|
|||||||||||||||||
|
Construction - commercial residential
|
15,447
|
|
17,154
|
|
(1,707
|
)
|
(10.0
|
)
|
13,172
|
|
21,812
|
|
(8,640
|
)
|
(39.6
|
)
|
28,619
|
|
38,966
|
|
|||||||||||||||||
|
Construction - commercial
|
3,412
|
|
3,684
|
|
(272
|
)
|
(7.4
|
)
|
5,115
|
|
3,597
|
|
1,518
|
|
42.2
|
|
8,527
|
|
7,281
|
|
|||||||||||||||||
|
Total real estate - construction (excluding construction - other)
|
18,859
|
|
20,838
|
|
(1,979
|
)
|
(9.5
|
)
|
18,287
|
|
25,409
|
|
(7,122
|
)
|
(28.0
|
)
|
37,146
|
|
46,247
|
|
|||||||||||||||||
|
Total
|
$
|
284,697
|
|
$
|
218,935
|
|
$
|
65,762
|
|
30.0
|
%
|
$
|
263,321
|
|
$
|
320,907
|
|
$
|
(57,586
|
)
|
(17.9
|
)%
|
$
|
548,018
|
|
$
|
539,842
|
|
|||||||||
|
% of total risk rated loans
|
2.6
|
%
|
2.1
|
%
|
2.4
|
%
|
3.1
|
%
|
5.0
|
%
|
5.2
|
%
|
|||||||||||||||||||||||||
As of
December 31, 2016
, total loans with risk ratings of special mention and substandard or lower were
$8.2 million
, or
1.5%
, higher than
2015
. However, these loans decreased as a percentage of total risk rated loans to
5.0%
from
5.2%
.
58
The following table presents a summary of delinquency status and rates, as a percentage of total loans, for loans that do not have internal risk ratings, by class segment, as of December 31:
|
Delinquent (1)
|
Non-performing (2)
|
Total Past Due
|
|||||||||||||||||||||||||||||||||||||||
|
2016
|
2015
|
2016
|
2015
|
2016
|
2015
|
||||||||||||||||||||||||||||||||||||
|
$
|
%
|
$
|
%
|
$
|
%
|
$
|
%
|
$
|
%
|
$
|
%
|
||||||||||||||||||||||||||||||
|
(dollars in thousands)
|
|||||||||||||||||||||||||||||||||||||||||
|
Real estate - home equity
|
$
|
9,274
|
|
0.57
|
%
|
$
|
8,983
|
|
0.53
|
%
|
$
|
13,154
|
|
0.81
|
%
|
$
|
14,683
|
|
0.87
|
%
|
$
|
22,428
|
|
1.38
|
%
|
$
|
23,666
|
|
1.40
|
%
|
|||||||||||
|
Real estate - residential mortgage
|
20,344
|
|
1.27
|
|
18,305
|
|
1.33
|
|
23,655
|
|
1.48
|
|
28,484
|
|
2.07
|
|
43,999
|
|
2.75
|
|
46,789
|
|
3.40
|
|
|||||||||||||||||
|
Real estate - construction - other
|
—
|
|
—
|
|
88
|
|
0.14
|
|
1,096
|
|
1.92
|
|
609
|
|
1.01
|
|
1,096
|
|
1.92
|
|
697
|
|
1.15
|
|
|||||||||||||||||
|
Consumer - direct
|
1,752
|
|
1.81
|
|
2,254
|
|
2.28
|
|
1,563
|
|
1.61
|
|
2,203
|
|
2.23
|
|
3,315
|
|
3.42
|
|
4,457
|
|
4.51
|
|
|||||||||||||||||
|
Consumer - indirect
|
3,599
|
|
1.85
|
|
2,809
|
|
1.65
|
|
328
|
|
0.17
|
|
237
|
|
0.14
|
|
3,927
|
|
2.02
|
|
3,046
|
|
1.79
|
|
|||||||||||||||||
|
Total Consumer
|
5,351
|
|
1.83
|
|
5,063
|
|
1.89
|
|
1,891
|
|
0.65
|
|
2,440
|
|
0.90
|
|
7,242
|
|
2.48
|
|
7,503
|
|
2.79
|
|
|||||||||||||||||
|
Leasing, other and Overdrafts
|
1,068
|
|
0.46
|
|
759
|
|
0.48
|
|
317
|
|
0.14
|
|
1,506
|
|
0.95
|
|
1,385
|
|
0.60
|
|
2,265
|
|
1.43
|
|
|||||||||||||||||
|
Total
|
$
|
36,037
|
|
0.95
|
%
|
$
|
33,198
|
|
0.94
|
%
|
$
|
40,113
|
|
1.05
|
%
|
$
|
47,722
|
|
1.34
|
%
|
$
|
76,150
|
|
2.00
|
%
|
$
|
80,920
|
|
2.28
|
%
|
|||||||||||
(1)
Includes all accruing loans
30
days to
89
days past due.
(2)
Includes all accruing loans
90
days or more past due and all non-accrual loans.
The following table summarizes the allocation of the allowance for loan losses
:
|
|
2016
|
2015
|
2014
|
2013
|
2012
|
|||||||||||||||||||||||||||||
|
|
Allowance
|
% of
Loans In Each Category |
Allowance
|
% of
Loans In Each Category |
Allowance
|
% of
Loans In Each Category |
Allowance
|
% of
Loans In Each Category |
Allowance
|
% of
Loans In Each Category |
||||||||||||||||||||||||
|
(dollars in thousands)
|
||||||||||||||||||||||||||||||||||
|
Real estate - commercial mortgage
|
$
|
46,842
|
|
40.9
|
%
|
$
|
47,866
|
|
39.5
|
%
|
$
|
53,493
|
|
39.6
|
%
|
$
|
55,659
|
|
39.9
|
%
|
$
|
62,928
|
|
38.4
|
%
|
|||||||||
|
Commercial - industrial, financial and agricultural
|
54,353
|
|
27.8
|
|
57,098
|
|
29.5
|
|
51,378
|
|
28.4
|
|
50,330
|
|
28.4
|
|
60,205
|
|
29.7
|
|
||||||||||||||
|
Real estate - residential mortgage
|
22,929
|
|
10.9
|
|
21,375
|
|
9.9
|
|
29,072
|
|
10.5
|
|
33,082
|
|
10.5
|
|
34,536
|
|
10.4
|
|
||||||||||||||
|
Consumer, home equity, leasing & other
|
33,567
|
|
14.7
|
|
27,458
|
|
15.3
|
|
33,085
|
|
16.2
|
|
34,852
|
|
16.7
|
|
27,895
|
|
16.7
|
|
||||||||||||||
|
Real estate - construction
|
6,455
|
|
5.7
|
|
6,529
|
|
5.8
|
|
9,756
|
|
5.3
|
|
12,649
|
|
4.5
|
|
17,287
|
|
4.8
|
|
||||||||||||||
|
Unallocated
|
4,533
|
|
N/A
|
|
8,728
|
|
N/A
|
|
7,360
|
|
N/A
|
|
16,208
|
|
N/A
|
|
21,052
|
|
N/A
|
|
||||||||||||||
|
$
|
168,679
|
|
100.0
|
%
|
$
|
169,054
|
|
100.0
|
%
|
$
|
184,144
|
|
100.0
|
%
|
$
|
202,780
|
|
100.0
|
%
|
$
|
223,903
|
|
100.0
|
%
|
||||||||||
N/A – Not applicable
Management believes that the
$168.7 million
allowance for loan losses as of
December 31, 2016
is sufficient to cover incurred losses in the loan portfolio. See additional disclosures in "Note 1 - Summary of Significant Accounting Policies," and "Note 4 - Loans and Allowance for Credit Losses," in the Notes to Consolidated Financial Statements in Item 8. "Financial Statements and Supplementary Data;" and "Critical Accounting Policies" above.
Other Assets
Other assets increased
$73.6 million
, or
12.4%
, to
$666.4 million
as of
December 31, 2016
. The increase resulted primarily from a $42.3 million increase in Tax Credit Investments, an $8.4 million increase in the fair value of commercial loan interest rate swaps and a $5.6 million increase in life insurance assets.
59
Deposits and Borrowings
The following table summarizes the increase in ending deposits, by type:
|
|
|
|
Increase (Decrease)
|
|||||||||||
|
|
2016
|
2015
|
$
|
%
|
||||||||||
|
|
(dollars in thousands)
|
|||||||||||||
|
Noninterest-bearing demand
|
$
|
4,376,137
|
|
$
|
3,948,114
|
|
$
|
428,023
|
|
10.8
|
%
|
|||
|
Interest-bearing demand
|
3,703,712
|
|
3,451,207
|
|
252,505
|
|
7.3
|
|
||||||
|
Savings and money market accounts
|
4,179,773
|
|
3,868,046
|
|
311,727
|
|
8.1
|
|
||||||
|
Total demand, savings and money market accounts
|
12,259,622
|
|
11,267,367
|
|
992,255
|
|
8.8
|
|
||||||
|
Time deposits
|
2,753,242
|
|
2,864,950
|
|
(111,708
|
)
|
(3.9
|
)
|
||||||
|
Total deposits
|
$
|
15,012,864
|
|
$
|
14,132,317
|
|
$
|
880,547
|
|
6.2
|
%
|
|||
Noninterest-bearing demand deposits increased
$428.0 million
, or
10.8%
, primarily due to a $311.8 million, or 10.4%, increase in business account balances, a $59.5 million, or 64.8%, increase in state and municipal account balances and a $52.3 million, or 6.4%, increase in personal account balances. Interest-bearing demand accounts increased
$252.5 million
, or
7.3%
, due to a $140.1 million, or 12.0%, increase in state and municipal account balances, an $80.8 million, or 4.1%, increase in personal account balances, and a $31.6 million, or 10.8%, increase in business account balances. The
$311.7 million
, or
8.1%
, increase in savings and money market account balances was primarily due to a $309.1 million, or 12.4%, increase in personal account balances.
The following table summarizes the changes in ending borrowings, by type:
|
|
|
|
Increase (Decrease)
|
|||||||||||
|
|
2016
|
2015
|
$
|
%
|
||||||||||
|
|
(dollars in thousands)
|
|||||||||||||
|
Short-term borrowings:
|
||||||||||||||
|
Customer repurchase agreements
|
$
|
195,734
|
|
$
|
111,496
|
|
$
|
84,238
|
|
75.6
|
%
|
|||
|
Customer short-term promissory notes
|
67,013
|
|
78,932
|
|
(11,919
|
)
|
(15.1
|
)
|
||||||
|
Total short-term customer funding
|
262,747
|
|
190,428
|
|
72,319
|
|
38.0
|
|
||||||
|
Federal funds purchased
|
278,570
|
|
197,235
|
|
81,335
|
|
41.2
|
|
||||||
|
Short-term FHLB Advances
(1)
|
—
|
|
110,000
|
|
(110,000
|
)
|
(100.0
|
)
|
||||||
|
Total short-term borrowings
|
541,317
|
|
497,663
|
|
43,654
|
|
8.8
|
|
||||||
|
Long-term debt:
|
||||||||||||||
|
FHLB Advances
|
567,240
|
|
587,756
|
|
(20,516
|
)
|
(3.5
|
)
|
||||||
|
Other long-term debt
|
362,163
|
|
361,786
|
|
377
|
|
0.1
|
|
||||||
|
Total long-term debt
|
929,403
|
|
949,542
|
|
(20,139
|
)
|
(2.1
|
)
|
||||||
|
Total borrowings
|
$
|
1,470,720
|
|
$
|
1,447,205
|
|
$
|
23,515
|
|
1.6
|
%
|
|||
(1) Represents FHLB advances with an original maturity term of less than one year.
The
$43.7 million
increase in total short-term borrowings resulted from the
$84.2 million
, or
75.6%
, increase in customer repurchase agreements and the
$81.3 million
, or
41.2%
, increase in Federal Funds purchased, partially offset by the maturity of short-term FHLB advances. The
$20.5 million
decrease in FHLB advances was due to maturing advances that were not refinanced.
Other Liabilities
Other liabilities increased $
46.2 million
, or
15.8
%, to
$339.5 million
as of
December 31, 2016
. The increase resulted primarily from a $30.9 million increase in commitments to fund Tax Credit Investments and an $8.4 million increase in the fair value of commercial loan interest rate swaps.
60
Shareholders’ Equity
Total shareholders’ equity increased
$79.2 million
, or
3.9%
, to
$2.1 billion
, or
11.2%
, of total assets, as of
December 31, 2016
. The increase was due primarily to
$161.6 million
of net income and
$17.1 million
of common stock issued, partially offset by
$18.5 million
of common stock repurchases, a
$16.4 million
net decrease accumulated other comprehensive loss, mainly available for sale securities, and
$71.1 million
of dividends on common shares outstanding.
In November 2016, the Corporation's board of directors approved an extension, through December 31, 2017, to a share repurchase program pursuant to which the Corporation is authorized to repurchase up to $50.0 million of its outstanding shares of common stock, or approximately 2.3% of its outstanding shares. During 2016, approximately
1.5 million
shares were repurchased through this program for a total cost of
$18.5 million
, or
$12.48
per share. Up to an additional $31.5 million of the Corporation's common stock may be repurchased under this program through December 31, 2017.
The Corporation and its subsidiary banks are subject to regulatory capital requirements administered by various banking regulators. Failure to meet minimum capital requirements can trigger certain actions by regulators that could have a material effect on the Corporation’s financial statements. The regulations require that banks and bank holding companies maintain minimum amounts and ratios of total, Tier I and Common Equity Tier I capital (as defined in the regulations) to risk-weighted assets (as defined), and Tier I capital to average assets (as defined).
The following table summarizes the Corporation’s capital ratios in comparison to regulatory requirements at December 31:
|
2016
|
2015
|
Regulatory
Minimum for Capital Adequacy |
Fully Phased-in, with Capital Conservation Buffers
|
||||
|
Total capital (to risk-weighted assets)
|
13.2%
|
13.2%
|
8.0%
|
10.5%
|
|||
|
Tier I capital (to risk-weighted assets)
|
10.4%
|
10.2%
|
6.0%
|
8.5%
|
|||
|
Common equity tier I (to risk-weighted assets)
|
10.4%
|
10.2%
|
4.5%
|
7.0%
|
|||
|
Tier I capital (to average assets)
|
9.0%
|
9.0%
|
4.0%
|
4.0%
|
|||
In July 2013, the FRB approved final rules (the "U.S. Basel III Capital Rules") establishing a new comprehensive capital framework for U.S. banking organizations and implementing the Basel Committee on Banking Supervision's December 2010 framework for strengthening international capital standards. The U.S. Basel III Capital Rules substantially revise the risk-based capital requirements applicable to bank holding companies and depository institutions.
The minimum regulatory capital requirements established by the U.S. Basel III Capital Rules became effective for the Corporation on January 1, 2015, and will be fully phased in on January 1, 2019.
The U.S. Basel III Capital Rules require the Corporation and its bank subsidiaries to:
|
•
|
Meet a minimum Common Equity Tier 1 capital ratio of 4.50% of risk-weighted assets and a Tier 1 capital ratio of 6.00% of risk-weighted assets;
|
|
•
|
Continue to require a minimum Total capital ratio of 8.00% of risk-weighted assets and a Tier 1 leverage capital ratio of 4.00% of average assets; and
|
|
•
|
Comply with a revised definition of capital to improve the ability of regulatory capital instruments to absorb losses as a result of which certain non-qualifying capital instruments, including cumulative preferred stock and TruPS, will be excluded as a component of Tier 1 capital for institutions of the Corporation's size.
|
When fully phased in on January 1, 2019, the Corporation and its bank subsidiaries will also be required to maintain a "capital conservation buffer" of 2.50% above the minimum risk-based capital requirements, which must be maintained to avoid restrictions on capital distributions and certain discretionary bonus payments.
The U.S. Basel III Capital Rules use a standardized approach for risk weightings that expand the risk-weightings for assets and off balance sheet exposures from the current 0%, 20%, 50% and 100% categories to a much larger and more risk-sensitive number of categories, depending on the nature of the assets and off-balance sheet exposures, resulting in higher risk weights for a variety of asset categories.
61
As of
December 31, 2016
, the Corporation and each of its bank subsidiaries met the minimum requirements of the U.S. Basel III Capital Rules, and each of the Corporation’s bank subsidiaries’ capital ratios exceeded the amounts required to be considered "well capitalized" as defined in the regulations. As of
December 31, 2016
, the Corporation's capital levels also met the fully-phased in minimum capital requirements, including the capital conservation buffers, as prescribed in the U.S. Basel III Capital Rules. See "Note 11 - Regulatory Matters," in the Notes to Consolidated Financial Statements in Item 8. "Financial Statements and Supplementary Data."
Contractual Obligations and Off-Balance Sheet Arrangements
The Corporation has various financial obligations that require future cash payments. These obligations include payments for liabilities recorded on the Corporation’s consolidated balance sheets as well as contractual obligations for purchased services or for operating leases.
The following table summarizes the Corporation's significant contractual obligations to third parties, by type, that were fixed and determinable as of
December 31, 2016
:
|
|
Payments Due In
|
||||||||||||||||||
|
|
One Year
or Less |
One to
Three Years |
Three to
Five Years |
Over Five
Years |
Total
|
||||||||||||||
|
|
(in thousands)
|
||||||||||||||||||
|
Deposits with no stated maturity
(1)
|
$
|
12,259,622
|
|
$
|
—
|
|
$
|
—
|
|
$
|
—
|
|
$
|
12,259,622
|
|
||||
|
Time deposits
(2)
|
1,333,954
|
|
1,041,626
|
|
288,407
|
|
89,255
|
|
2,753,242
|
|
|||||||||
|
Short-term borrowings
(3)
|
541,317
|
|
—
|
|
—
|
|
—
|
|
541,317
|
|
|||||||||
|
Long-term debt
(3)
|
114,415
|
|
202,731
|
|
341,814
|
|
270,443
|
|
929,403
|
|
|||||||||
|
Operating leases
(4)
|
16,330
|
|
26,492
|
|
20,436
|
|
44,395
|
|
107,653
|
|
|||||||||
|
Purchase obligations
(5)
|
22,799
|
|
32,282
|
|
23,051
|
|
—
|
|
78,132
|
|
|||||||||
|
Uncertain tax positions
(6)
|
2,438
|
|
—
|
|
—
|
|
—
|
|
2,438
|
|
|||||||||
|
(1)
|
Includes demand deposits and savings accounts, which can be withdrawn by customers at any time.
|
|
(2)
|
See additional information regarding time deposits in "Note 8 - Deposits," in the Notes to Consolidated Financial Statements in Item 8. "Financial Statements and Supplementary Data."
|
|
(3)
|
See additional information regarding borrowings in "Note 9 - Short-Term Borrowings and Long-Term Debt," in the Notes to Consolidated Financial Statements in Item 8. "Financial Statements and Supplementary Data."
|
|
(4)
|
See additional information regarding operating leases in "Note 16 - Leases," in the Notes to Consolidated Financial Statements in Item 8. "Financial Statements and Supplementary Data."
|
|
(5)
|
Includes information technology, telecommunication and data processing outsourcing contracts.
|
|
(6)
|
Includes accrued interest. See additional information related to uncertain tax positions in "Note 12 - Income Taxes," in the Notes to Consolidated Financial Statements in Item 8. "Financial Statements and Supplementary Data."
|
In addition to the contractual obligations listed in the preceding table, the Corporation is a party to financial instruments with off-balance sheet risk in the normal course of business to meet the financing needs of its customers. These financial instruments include commitments to extend credit and standby and commercial letters of credit, which involve, to varying degrees, elements of credit and interest rate risk that are not recognized on the consolidated balance sheets. Commitments to extend credit are agreements to lend to a customer as long as there is no violation of any condition established in the contract. Standby letters of credit are conditional commitments issued to guarantee the financial or performance obligation of a customer to a third party. Commercial letters of credit are conditional commitments issued to facilitate foreign or domestic trade transactions for customers. Commitments and standby and commercial letters of credit do not necessarily represent future cash needs, as they may expire without being drawn.
62
The following table presents the Corporation’s commitments to extend credit and letters of credit as of
December 31, 2016
(in thousands):
|
Commercial and other
|
$
|
3,673,815
|
|
|
Home equity
|
1,368,465
|
|
|
|
Commercial mortgage and construction
|
1,033,287
|
|
|
|
Total commitments to extend credit
|
$
|
6,075,567
|
|
|
Standby letters of credit
|
$
|
356,359
|
|
|
Commercial letters of credit
|
38,901
|
|
|
|
Total letters of credit
|
$
|
395,260
|
|
63
Market risk is the exposure to economic loss that arises from changes in the values of certain financial instruments. The types of market risk exposures generally faced by financial institutions include interest rate risk, equity market price risk, debt security market price risk, foreign currency price risk and commodity price risk. Due to the nature of its operations, foreign currency price risk and commodity price risk are not significant to the Corporation.
Interest Rate Risk, Asset/Liability Management and Liquidity
Interest rate risk creates exposure in two primary areas. First, changes in rates have an impact on the Corporation’s liquidity position and could affect its ability to meet obligations and continue to grow. Second, movements in interest rates can create fluctuations in the Corporation’s net interest income and changes in the economic value of its equity.
The Corporation employs various management techniques to minimize its exposure to interest rate risk. An Asset/Liability Management Committee ("ALCO") is responsible for reviewing the interest rate sensitivity and liquidity positions of the Corporation, approving asset and liability management policies, and overseeing the formulation and implementation of strategies regarding balance sheet positions.
The Corporation uses two complementary methods to measure and manage interest rate risk. They are simulation of net interest income and estimates of economic value of equity. Using these measurements in tandem provides a reasonably comprehensive summary of the magnitude of the Corporation's interest rate risk, level of risk as time evolves, and exposure to changes in interest rates.
Simulation of net interest income is performed for the next 12-month period. A variety of interest rate scenarios are used to measure the effects of sudden and gradual movements upward and downward in the yield curve. These results are compared to the results obtained in a flat or unchanged interest rate scenario. Simulation of net interest income is used primarily to measure the Corporation’s short-term earnings exposure to rate movements. The Corporation’s policy limits the potential exposure of net interest income, in a non-parallel instantaneous shock, to 10% of the base case net interest income for a 100 basis point shock in interest rates, 15% for a 200 basis point shock and 20% for a 300 basis point shock. A "shock" is an immediate upward or downward movement of interest rates. The shocks do not take into account changes in customer behavior that could result in changes to mix and/or volumes in the balance sheet, nor do they take into account the potential effects of competition on the pricing of deposits and loans over the forward 12-month period.
Contractual maturities and repricing opportunities of loans are incorporated in the simulation model as are prepayment assumptions, maturity data and call options within the investment portfolio. Assumptions based on past experience are incorporated into the model for non-maturity deposit accounts. The assumptions used are inherently uncertain and, as a result, the model cannot precisely measure future net interest income or precisely predict the impact of fluctuations in market interest rates on net interest income. Actual results will differ from the model's simulated results due to timing, amount and frequency of interest rate changes as well as changes in market conditions and the application and timing of various management strategies.
The following table summarizes the expected impact of abrupt interest rate changes on net interest income (due to the current level of interest rates, the 200 and 300 basis point downward shock scenarios are not shown) as of
December 31, 2016
:
|
Rate Shock (1)
|
Annual change
in net interest income
|
% Change in net interest income
|
|
|
+300 bp
|
+ $87.4 million
|
+ 15.3%
|
|
|
+200 bp
|
+ $59.6 million
|
+ 10.4%
|
|
|
+100 bp
|
+ $28.3 million
|
+ 4.9%
|
|
|
–100 bp
|
– $33.2 million
|
– 5.8%
|
|
|
(1)
|
These results include the effect of implicit and explicit interest rate floors that limit further reduction in interest rates.
|
Economic value of equity estimates the discounted present value of asset and liability cash flows. Discount rates are based upon market prices for like assets and liabilities. Abrupt changes or "shocks" in interest rates, both upward and downward, are used to determine the comparative effect of such interest rate movements relative to the unchanged environment. This measurement tool is used primarily to evaluate the longer-term repricing risks and options in the Corporation’s balance sheet. The Corporation's policy limits the economic value of equity that may be at risk, in a non-parallel instantaneous shock, to 10% of the base case economic value of equity for a 100 basis point shock in interest rates, 20% for a 200 basis point shock and 30% for a 300 basis
64
point shock. As of December 31, 2016, the Corporation was within economic value of equity policy limits for every 100 basis point shock.
Interest Rate Swaps
The Corporation enters into interest rate swaps with certain qualifying commercial loan customers to meet their interest rate risk management needs. The Corporation simultaneously enters into interest rate swaps with dealer counterparties, with identical notional amounts and terms. The net result of these interest rate swaps is that the customer pays a fixed rate of interest and the Corporation receives a floating rate. These interest rate swaps are derivative financial instruments that are recorded at their fair value in other assets and liabilities on the consolidated balance sheets. Changes in fair value during the period are recorded in other non-interest expense on the consolidated statements of income.
Liquidity
The Corporation must maintain a sufficient level of liquid assets to meet the cash needs of its customers, who, as depositors, may want to withdraw funds or who, as borrowers, need credit availability. Liquidity is provided on a continuous basis through scheduled and unscheduled principal and interest payments on investments and outstanding loans and through the availability of deposits and borrowings. The Corporation also maintains secondary sources that provide liquidity on a secured and unsecured basis to meet short-term and long-term needs.
The Corporation maintains liquidity sources in the form of demand and savings deposits, time deposits, repurchase agreements and short-term promissory notes. The Corporation can access additional liquidity from these sources, if necessary, by increasing the rates of interest paid on those accounts and borrowings. The positive impact to liquidity resulting from paying higher interest rates could have a detrimental impact on the net interest margin and net interest income if rates on interest-earning assets do not increase in proportion. Borrowing availability with the FHLB and the Federal Reserve Bank, along with Federal funds lines at various correspondent banks, provides the Corporation with additional liquidity.
Each of the Corporation’s subsidiary banks is a member of the FHLB and has access to FHLB overnight and term credit facilities.
As of
December 31, 2016
, the Corporation had
$567.2 million
of short- and long-term advances outstanding from the FHLB with an additional borrowing capacity of approximately $3.1 billion under these facilities. Advances from the FHLB are secured by qualifying commercial real estate and residential mortgage loans, investments and other assets.
As of
December 31, 2016
, the Corporation had aggregate availability under Federal funds lines of
$1.1 billion
with $278.6 million borrowed against that amount. A combination of commercial real estate loans, commercial loans and securities are pledged to the Federal Reserve Bank of Philadelphia to provide access to Federal Reserve Bank Discount Window borrowings. As of
December 31, 2016
, the Corporation had $1.2 billion of collateralized borrowing availability at the Discount Window, and no outstanding borrowings.
Liquidity must also be managed at the Corporation parent company level. For safety and soundness reasons, banking regulations limit the amount of cash that can be transferred from subsidiary banks to the parent company in the form of loans and dividends. Generally, these limitations are based on the subsidiary banks’ regulatory capital levels and their net income. See "Note 11 - Regulatory Matters - Dividend and Loan Limitations" in the Notes to Consolidated Financial Statements in Item 8. "Financial Statements and Supplementary Data" for additional information concerning limitations on the dividends that may be paid to the Corporation, and loans that may be granted to the Corporation and its affiliates, by the Corporation's subsidiary banks. Management continues to monitor the liquidity and capital needs of the parent company and will implement appropriate strategies, as necessary, to remain adequately capitalized and to meet its cash needs.
The Corporation’s sources and uses of funds were discussed in general terms in the "Net Interest Income" section of Management’s Discussion and Analysis. The consolidated statements of cash flows provide additional information. The Corporation’s operating
activities during 2016 generated
$185.4 million
of cash, mainly due to net income. Cash used in investing activities was
$1.0 billion
, due to net increases in loans and investment securities. Net cash provided by financing activities was
$832.6 million
due mainly to increases in deposits.
65
The following table presents the expected maturities of available for sale investment securities, at estimated fair value, as of December 31, 2016 and the weighted average yields of such securities (calculated based on historical cost):
|
|
Maturing
|
||||||||||||||||||||||||||
|
|
Within One Year
|
After One But
Within Five Years |
After Five But
Within Ten Years |
After Ten Years
|
|||||||||||||||||||||||
|
|
Amount
|
Yield
|
Amount
|
Yield
|
Amount
|
Yield
|
Amount
|
Yield
|
|||||||||||||||||||
|
|
(dollars in thousands)
|
||||||||||||||||||||||||||
|
U.S. Government sponsored agency securities
|
$
|
3
|
|
1.43
|
%
|
$
|
12
|
|
1.56
|
%
|
$
|
119
|
|
3.30
|
%
|
$
|
—
|
|
—
|
%
|
|||||||
|
State and municipal
(1)
|
30,122
|
|
3.26
|
|
14,638
|
|
5.36
|
|
68,997
|
|
4.96
|
|
277,884
|
|
4.67
|
|
|||||||||||
|
ARCs
(2)
|
—
|
|
—
|
|
—
|
|
—
|
|
—
|
|
—
|
|
97,256
|
|
2.09
|
|
|||||||||||
|
Corporate debt securities
|
24,902
|
|
4.66
|
|
14,692
|
|
3.76
|
|
27,817
|
|
4.87
|
|
41,998
|
|
2.88
|
|
|||||||||||
|
Total
|
$
|
55,027
|
|
3.89
|
%
|
$
|
29,342
|
|
4.57
|
%
|
$
|
96,933
|
|
4.93
|
%
|
$
|
417,138
|
|
3.87
|
%
|
|||||||
|
Collateralized mortgage obligations
(3)
|
$
|
593,860
|
|
1.73
|
%
|
||||||||||||||||||||||
|
Mortgage-backed securities
(3)
|
$
|
1,342,401
|
|
2.16
|
%
|
||||||||||||||||||||||
|
(1)
|
Weighted average yields on tax-exempt securities have been computed on a fully taxable-equivalent basis assuming a federal tax rate of 35% and statutory interest expense disallowances.
|
|
(2)
|
Maturities of ARCs are based on contractual maturities.
|
|
(3)
|
Maturities for mortgage-backed securities and collateralized mortgage obligations are dependent upon the interest rate environment and prepayments on the underlying loans. For the purpose of this table, all balances and weighted average rates are shown in one period. As of December 31, 2016, the weighted average remaining lives of collateralized mortgage obligations and mortgage-backed securities were four and five years, respectively.
|
The Corporation’s investment portfolio consists mainly of mortgage-backed securities and collateralized mortgage obligations which have stated maturities that may differ from actual maturities due to borrowers’ ability to prepay obligations. Cash flows from such investments are dependent upon the performance of the underlying mortgage loans and are generally influenced by the level of interest rates. As rates increase, cash flows generally decrease as prepayments on the underlying mortgage loans decrease. As rates decrease, cash flows generally increase as prepayments increase.
The following table presents the approximate contractual maturity of fixed rate loans and loan types subject to changes in interest rates as of December 31, 2016:
|
One Year
or Less |
One
Through Five Years |
More Than
Five Years |
Total
|
||||||||||||
|
|
(in thousands)
|
||||||||||||||
|
Commercial, financial and agricultural:
|
|||||||||||||||
|
Adjustable and floating rate
|
$
|
1,034,885
|
|
$
|
1,840,388
|
|
$
|
422,255
|
|
$
|
3,297,528
|
|
|||
|
Fixed rate
|
196,434
|
|
288,226
|
|
305,298
|
|
789,958
|
|
|||||||
|
Total
|
$
|
1,231,319
|
|
$
|
2,128,614
|
|
$
|
727,553
|
|
$
|
4,087,486
|
|
|||
|
Real estate – mortgage (1):
|
|||||||||||||||
|
Adjustable and floating rate
|
$
|
1,315,042
|
|
$
|
3,556,723
|
|
$
|
2,384,856
|
|
$
|
7,256,621
|
|
|||
|
Fixed rate
|
498,748
|
|
1,024,986
|
|
465,336
|
|
1,989,070
|
|
|||||||
|
Total
|
$
|
1,813,790
|
|
$
|
4,581,709
|
|
$
|
2,850,192
|
|
$
|
9,245,691
|
|
|||
|
Real estate – construction:
|
|||||||||||||||
|
Adjustable and floating rate
|
$
|
178,197
|
|
$
|
287,264
|
|
$
|
286,964
|
|
$
|
752,425
|
|
|||
|
Fixed rate
|
62,445
|
|
12,130
|
|
16,649
|
|
91,224
|
|
|||||||
|
Total
|
$
|
240,642
|
|
$
|
299,394
|
|
$
|
303,613
|
|
$
|
843,649
|
|
|||
(1) Includes commercial mortgages, residential mortgages and home equity loan.
66
Contractual maturities of time deposits as of
December 31, 2016
were as follows (in thousands):
|
Year
|
|
||
|
2017
|
$
|
1,333,954
|
|
|
2018
|
376,599
|
|
|
|
2019
|
665,027
|
|
|
|
2020
|
182,473
|
|
|
|
2021
|
105,934
|
|
|
|
Thereafter
|
89,255
|
|
|
|
$
|
2,753,242
|
|
|
Contractual maturities of time deposits of $100,000 or more outstanding, included in the table above, as of December 31, 2016 were as follows (in thousands):
|
Three months or less
|
$
|
170,315
|
|
|
Over three through six months
|
167,736
|
|
|
|
Over six through twelve months
|
229,538
|
|
|
|
Over twelve months
|
611,907
|
|
|
|
Total
|
$
|
1,179,496
|
|
Equity Market Price Risk
Equity market price risk is the risk that changes in the values of equity investments could have a material impact on the financial position or results of operations of the Corporation. As of December 31, 2016, the Corporation’s equity investments consisted of
$23.5 million
of common stocks of publicly traded financial institutions and
$1.0 million
of other equity investments.
The equity investments most susceptible to market price risk are the financial institutions stocks, which had a cost basis of
$11.5 million
and a fair value of
$23.5 million
as of December 31, 2016, including an investment in a single financial institution with a cost basis of
$5.8 million
and a fair value of
$11.9 million
. The fair value of this investment accounted for
50.5%
of the fair value of the common stocks of publicly traded financial institutions. No other investment within the financial institutions stock portfolio exceeded
10%
of the portfolio's fair value. In total, net unrealized gains in this portfolio were approximately $12.3 million as of December 31, 2016. Management continuously monitors the fair value of its equity investments and evaluates current market conditions and operating results of the issuers. Periodic sale and purchase decisions are made based on this monitoring process. None of the Corporation’s equity securities are classified as trading.
In addition to its equity portfolio, investment management and trust services income may be impacted by fluctuations in the equity markets. A portion of this revenue is based on the value of the underlying investment portfolios, many of which include equity investments. If the values of those investment portfolios decrease, whether due to factors influencing U.S. or international securities markets in general or otherwise, the Corporation’s revenue would be negatively impacted. Total assets under management were $6.2 billion at December 31, 2016. In addition, the Corporation’s ability to sell its brokerage services in the future will be dependent, in part, upon consumers’ level of confidence in financial markets.
Debt Security Market Price Risk
Debt security market price risk is the risk that changes in the values of debt securities, unrelated to interest rate changes, could have a material impact on the financial position or results of operations of the Corporation. The Corporation’s debt security investments consist primarily of U.S. government sponsored agency issued mortgage-backed securities and collateralized mortgage obligations, state and municipal securities, U.S. government debt securities, auction rate securities and corporate debt securities. All of the Corporation's investments in mortgage-backed securities and collateralized mortgage obligations have principal payments that are guaranteed by U.S. government sponsored agencies.
State and Municipal Securities
As of December 31, 2016, the Corporation owned state and municipal securities issued by various states and municipalities with a total fair value of $391.6 million. Ongoing uncertainty with respect to the financial strength of state and municipal bond insurers places much greater emphasis on the underlying strength of issuers. Continued pressure on local tax revenues of issuers due to adverse economic conditions could have an adverse impact on the underlying credit quality of issuers. The Corporation evaluates existing and potential holdings primarily based on the underlying creditworthiness of the issuing state or municipality and then,
67
to a lesser extent, on any credit enhancement. State and municipal securities can be supported by the general obligation of the issuing state or municipality, allowing the securities to be repaid by any means available to the issuing state or municipality. As of December 31, 2016, approximately 98% of state and municipal securities were supported by the general obligation of corresponding states or municipalities. Approximately 59% of these securities were school district issuances, which are also supported by the states of the issuing municipalities.
Auction Rate Securities
As of December 31, 2016, the Corporation’s investments in student loan auction rate securities, also known as auction rate certificates ("ARCs"), had a cost basis of
$107.2 million
and a fair value of
$97.3 million
.
As of December 31, 2016, the fair values of the ARCs currently in the portfolio were derived using significant unobservable inputs based on an expected cash flows model which produced fair values which were materially different from those that would be expected from settlement of these investments in the current market. The expected cash flows model produced fair values which assumed a return to market liquidity sometime within the next five years. The Corporation believes that the trusts underlying the ARCs will self-liquidate as student loans are repaid.
The credit quality of the underlying debt associated with the ARCs is also a factor in the determination of their estimated fair value. As of
December 31, 2016
, all of the ARCs were rated above investment grade, with approximately
$5.5 million
, or
6%
, "AAA" rated and
$91.8 million
, or
94%
, "AA" rated. All of the loans underlying the ARCs have principal payments which are guaranteed by the federal government. At
December 31, 2016
, all of the Corporation's ARCs were current and making scheduled interest payments.
Corporate Debt Securities
The Corporation holds corporate debt securities in the form of single-issuer trust preferred securities and subordinated debt issued by financial institutions. As of December 31, 2016, these securities had an amortized cost of
$112.0 million
and an estimated fair value of
$109.4 million
.
See "Note 3 - Investment Securities," in the Notes to Consolidated Financial Statements in Item 8. "Financial Statements and Supplementary Data" for further discussion related to the Corporation’s other-than-temporary impairment evaluations for debt securities, and see "Note 18 - Fair Value Measurements," in the Notes to Consolidated Financial Statements in Item 8. "Financial Statements and Supplementary Data" for further discussion related to the fair values of debt securities.
68
|
|
||||
|
(dollars in thousands, except per-share data)
|
||||
|
|
December 31,
|
||||||
|
|
2016
|
2015
|
|||||
|
Assets
|
|||||||
|
Cash and due from banks
|
$
|
118,763
|
|
$
|
101,120
|
|
|
|
Interest-bearing deposits with other banks
|
233,763
|
|
230,300
|
|
|||
|
Federal Reserve Bank and Federal Home Loan Bank stock
|
57,489
|
|
62,216
|
|
|||
|
Loans held for sale
|
28,697
|
|
16,886
|
|
|||
|
Available for sale investment securities
|
2,559,227
|
|
2,484,773
|
|
|||
|
Loans, net of unearned income
|
14,699,272
|
|
13,838,602
|
|
|||
|
Allowance for loan losses
|
(168,679
|
)
|
(169,054
|
)
|
|||
|
Net Loans
|
14,530,593
|
|
13,669,548
|
|
|||
|
Premises and equipment
|
217,806
|
|
225,535
|
|
|||
|
Accrued interest receivable
|
46,294
|
|
42,767
|
|
|||
|
Goodwill and intangible assets
|
531,556
|
|
531,556
|
|
|||
|
Other assets
|
620,059
|
|
550,017
|
|
|||
|
Total Assets
|
$
|
18,944,247
|
|
$
|
17,914,718
|
|
|
|
Liabilities
|
|||||||
|
Deposits:
|
|||||||
|
Noninterest-bearing
|
$
|
4,376,137
|
|
$
|
3,948,114
|
|
|
|
Interest-bearing
|
10,636,727
|
|
10,184,203
|
|
|||
|
Total Deposits
|
15,012,864
|
|
14,132,317
|
|
|||
|
Short-term borrowings:
|
|||||||
|
Federal funds purchased
|
278,570
|
|
197,235
|
|
|||
|
Other short-term borrowings
|
262,747
|
|
300,428
|
|
|||
|
Total Short-Term Borrowings
|
541,317
|
|
497,663
|
|
|||
|
Accrued interest payable
|
9,632
|
|
10,724
|
|
|||
|
Other liabilities
|
329,916
|
|
282,578
|
|
|||
|
Federal Home Loan Bank advances and long-term debt
|
929,403
|
|
949,542
|
|
|||
|
Total Liabilities
|
16,823,132
|
|
15,872,824
|
|
|||
|
Shareholders’ Equity
|
|||||||
|
Common stock, $2.50 par value, 600 million shares authorized, 219.9 million shares issued in 2016 and 218.9 million shares issued in 2015
|
549,707
|
|
547,141
|
|
|||
|
Additional paid-in capital
|
1,467,602
|
|
1,450,690
|
|
|||
|
Retained earnings
|
732,099
|
|
641,588
|
|
|||
|
Accumulated other comprehensive loss
|
(38,449
|
)
|
(22,017
|
)
|
|||
|
Treasury stock, 45.8 million shares in 2016 and 44.7 million shares in 2015
|
(589,844
|
)
|
(575,508
|
)
|
|||
|
Total Shareholders’ Equity
|
2,121,115
|
|
2,041,894
|
|
|||
|
Total Liabilities and Shareholders’ Equity
|
$
|
18,944,247
|
|
$
|
17,914,718
|
|
|
|
See Notes to Consolidated Financial Statements
|
|||||||
69
|
|
||||
|
(dollars in thousands, except per-share data)
|
||||
|
2016
|
2015
|
2014
|
|||||||||
|
Interest Income
|
|||||||||||
|
Loans, including fees
|
$
|
543,385
|
|
$
|
524,060
|
|
$
|
530,308
|
|
||
|
Investment securities:
|
|||||||||||
|
Taxable
|
44,975
|
|
45,279
|
|
50,651
|
|
|||||
|
Tax-exempt
|
9,662
|
|
7,879
|
|
8,977
|
|
|||||
|
Dividends
|
571
|
|
985
|
|
1,338
|
|
|||||
|
Loans held for sale
|
728
|
|
801
|
|
786
|
|
|||||
|
Other interest income
|
3,779
|
|
4,785
|
|
4,018
|
|
|||||
|
Total Interest Income
|
603,100
|
|
583,789
|
|
596,078
|
|
|||||
|
Interest Expense
|
|||||||||||
|
Deposits
|
44,693
|
|
40,482
|
|
35,110
|
|
|||||
|
Short-term borrowings
|
855
|
|
372
|
|
1,608
|
|
|||||
|
Long-term debt
|
36,780
|
|
42,941
|
|
44,493
|
|
|||||
|
Total Interest Expense
|
82,328
|
|
83,795
|
|
81,211
|
|
|||||
|
Net Interest Income
|
520,772
|
|
499,994
|
|
514,867
|
|
|||||
|
Provision for credit losses
|
13,182
|
|
2,250
|
|
12,500
|
|
|||||
|
Net Interest Income After Provision for Credit Losses
|
507,590
|
|
497,744
|
|
502,367
|
|
|||||
|
Non-Interest Income
|
|||||||||||
|
Service charges on deposit accounts
|
51,346
|
|
50,097
|
|
49,293
|
|
|||||
|
Other service charges and fees
|
51,473
|
|
43,992
|
|
39,896
|
|
|||||
|
Investment management and trust services
|
45,270
|
|
44,056
|
|
44,605
|
|
|||||
|
Mortgage banking income
|
19,415
|
|
18,208
|
|
17,107
|
|
|||||
|
Other
|
20,124
|
|
16,420
|
|
14,437
|
|
|||||
|
Investment securities gains (losses):
|
|||||||||||
|
Net gains on sales of investment securities
|
2,550
|
|
9,066
|
|
2,071
|
|
|||||
|
Net other-than-temporary impairment losses
|
—
|
|
—
|
|
(30
|
)
|
|||||
|
Investment securities gains, net
|
2,550
|
|
9,066
|
|
2,041
|
|
|||||
|
Total Non-Interest Income
|
190,178
|
|
181,839
|
|
167,379
|
|
|||||
|
Non-Interest Expense
|
|||||||||||
|
Salaries and employee benefits
|
283,353
|
|
260,832
|
|
251,021
|
|
|||||
|
Net occupancy expense
|
47,611
|
|
47,777
|
|
48,130
|
|
|||||
|
Other outside services
|
23,883
|
|
27,785
|
|
28,404
|
|
|||||
|
Data processing
|
20,016
|
|
19,894
|
|
17,162
|
|
|||||
|
Software
|
16,903
|
|
14,746
|
|
12,758
|
|
|||||
|
Equipment expense
|
12,788
|
|
14,514
|
|
13,567
|
|
|||||
|
Professional fees
|
11,004
|
|
11,244
|
|
12,097
|
|
|||||
|
Supplies and postage
|
10,292
|
|
10,202
|
|
9,795
|
|
|||||
|
FDIC insurance expense
|
9,767
|
|
11,470
|
|
10,958
|
|
|||||
|
Marketing
|
7,044
|
|
7,324
|
|
8,133
|
|
|||||
|
Telecommunications
|
5,702
|
|
6,350
|
|
6,870
|
|
|||||
|
Operating risk loss
|
2,815
|
|
3,624
|
|
4,271
|
|
|||||
|
Other real estate owned and repossession expense
|
1,926
|
|
3,630
|
|
3,270
|
|
|||||
|
Loss on redemption of trust preferred securities
|
—
|
|
5,626
|
|
—
|
|
|||||
|
Intangible amortization
|
—
|
|
247
|
|
1,259
|
|
|||||
|
Other
|
36,415
|
|
34,895
|
|
31,551
|
|
|||||
|
Total Non-Interest Expense
|
489,519
|
|
480,160
|
|
459,246
|
|
|||||
|
Income Before Income Taxes
|
208,249
|
|
199,423
|
|
210,500
|
|
|||||
|
Income taxes
|
46,624
|
|
49,921
|
|
52,606
|
|
|||||
|
Net Income
|
$
|
161,625
|
|
$
|
149,502
|
|
$
|
157,894
|
|
||
|
Per Share:
|
|||||||||||
|
Net Income (Basic)
|
$
|
0.93
|
|
$
|
0.85
|
|
$
|
0.85
|
|
||
|
Net Income (Diluted)
|
0.93
|
|
0.85
|
|
0.84
|
|
|||||
|
Cash Dividends
|
0.41
|
|
0.38
|
|
0.34
|
|
|||||
|
See Notes to Consolidated Financial Statements
|
|||||||||||
70
|
CONSOLIDATED STATEMENTS OF COMPREHENSIVE INCOME
|
||||
|
(in thousands)
|
||||
|
2016
|
2015
|
2014
|
||||||||||
|
Net Income
|
$
|
161,625
|
|
$
|
149,502
|
|
$
|
157,894
|
|
|||
|
Other Comprehensive (Loss) Income, net of tax:
|
||||||||||||
|
Unrealized (losses) gains on available for sale investment securities:
|
||||||||||||
|
Unrealized (loss) gain on securities
|
(14,891
|
)
|
(7,717
|
)
|
33,734
|
|
||||||
|
Reclassification adjustment for securities gains included in net income
|
(1,657
|
)
|
(5,892
|
)
|
(1,327
|
)
|
||||||
|
Non-credit related unrealized (loss) gain on other-than-temporarily impaired debt securities
|
(185
|
)
|
239
|
|
780
|
|
||||||
|
Net unrealized (losses) gains on available for sale investment securities
|
(16,733
|
)
|
(13,370
|
)
|
33,187
|
|
||||||
|
Unrealized gains on derivative financial instruments:
|
||||||||||||
|
Amortization of unrealized loss on derivative financial instruments
|
16
|
|
75
|
|
136
|
|
||||||
|
Reclassification adjustment for loss on derivative financial instruments included in net income
|
—
|
|
2,456
|
|
—
|
|
||||||
|
Net unrealized gains on derivative financial instruments
|
16
|
|
2,531
|
|
136
|
|
||||||
|
Defined benefit pension plan and postretirement benefits:
|
||||||||||||
|
Unrecognized pension and postretirement (cost) income
|
(931
|
)
|
4,680
|
|
(13,168
|
)
|
||||||
|
Amortization of net unrecognized pension and postretirement income
|
1,216
|
|
1,864
|
|
408
|
|
||||||
|
Reclassification adjustment for post-retirement plan curtailment gain included in net income
|
—
|
|
—
|
|
(944
|
)
|
||||||
|
Net unrealized gains (losses) on pension and postretirement plans
|
285
|
|
6,544
|
|
(13,704
|
)
|
||||||
|
Other Comprehensive (Loss) Income
|
(16,432
|
)
|
(4,295
|
)
|
19,619
|
|
||||||
|
Total Comprehensive Income
|
$
|
145,193
|
|
$
|
145,207
|
|
$
|
177,513
|
|
|||
|
See Notes to Consolidated Financial Statements
|
||||||||||||
71
|
CONSOLIDATED STATEMENTS OF SHAREHOLDERS’ EQUITY
|
||||
|
(in thousands, except per share data)
|
||||
|
|
Common Stock
|
Additional
Paid-in Capital |
Accumulated
Other Comprehensive Income (Loss) |
|
|
|||||||||||||||||||||
|
|
Shares
Outstanding |
Amount
|
Retained
Earnings |
Treasury
Stock |
Total
|
|||||||||||||||||||||
|
|
||||||||||||||||||||||||||
|
Balance at December 31, 2013
|
192,652
|
|
$
|
544,568
|
|
$
|
1,432,974
|
|
$
|
463,843
|
|
$
|
(37,341
|
)
|
$
|
(340,857
|
)
|
$
|
2,063,187
|
|
||||||
|
Net income
|
157,894
|
|
157,894
|
|
||||||||||||||||||||||
|
Other comprehensive income
|
19,619
|
|
19,619
|
|
||||||||||||||||||||||
|
Stock issued, including related tax benefits
|
781
|
|
987
|
|
1,684
|
|
5,611
|
|
8,282
|
|
||||||||||||||||
|
Stock-based compensation awards
|
5,865
|
|
5,865
|
|
||||||||||||||||||||||
|
Acquisition of treasury stock
|
(14,509
|
)
|
(175,255
|
)
|
(175,255
|
)
|
||||||||||||||||||||
|
Deferred accelerated stock repurchase
|
(20,000
|
)
|
(20,000
|
)
|
||||||||||||||||||||||
|
Common stock cash dividends - $0.34 per share
|
(62,927
|
)
|
(62,927
|
)
|
||||||||||||||||||||||
|
Balance at December 31, 2014
|
178,924
|
|
$
|
545,555
|
|
$
|
1,420,523
|
|
$
|
558,810
|
|
$
|
(17,722
|
)
|
$
|
(510,501
|
)
|
$
|
1,996,665
|
|
||||||
|
Net income
|
149,502
|
|
149,502
|
|
||||||||||||||||||||||
|
Other comprehensive loss
|
(4,295
|
)
|
(4,295
|
)
|
||||||||||||||||||||||
|
Stock issued, including related tax benefits
|
1,018
|
|
1,586
|
|
4,229
|
|
4,993
|
|
10,808
|
|
||||||||||||||||
|
Stock-based compensation awards
|
5,938
|
|
5,938
|
|
||||||||||||||||||||||
|
Acquisition of treasury stock
|
(3,976
|
)
|
|
|
(50,000
|
)
|
(50,000
|
)
|
||||||||||||||||||
|
Settlement of accelerated stock repurchase agreement
|
(1,790
|
)
|
20,000
|
|
(20,000
|
)
|
—
|
|
||||||||||||||||||
|
Common stock cash dividends - $0.38 per share
|
(66,724
|
)
|
(66,724
|
)
|
||||||||||||||||||||||
|
Balance at December 31, 2015
|
174,176
|
|
$
|
547,141
|
|
$
|
1,450,690
|
|
$
|
641,588
|
|
$
|
(22,017
|
)
|
$
|
(575,508
|
)
|
$
|
2,041,894
|
|
||||||
|
Net income
|
161,625
|
|
161,625
|
|
||||||||||||||||||||||
|
Other comprehensive loss
|
(16,432
|
)
|
(16,432
|
)
|
||||||||||||||||||||||
|
Stock issued, including related tax benefits
|
1,350
|
|
2,566
|
|
10,356
|
|
4,209
|
|
17,131
|
|
||||||||||||||||
|
Stock-based compensation awards
|
6,556
|
|
6,556
|
|
||||||||||||||||||||||
|
Acquisition of treasury stock
|
(1,486
|
)
|
(18,545
|
)
|
(18,545
|
)
|
||||||||||||||||||||
|
Common stock cash dividends - $0.41 per share
|
(71,114
|
)
|
(71,114
|
)
|
||||||||||||||||||||||
|
Balance at December 31, 2016
|
174,040
|
|
$
|
549,707
|
|
$
|
1,467,602
|
|
$
|
732,099
|
|
$
|
(38,449
|
)
|
$
|
(589,844
|
)
|
$
|
2,121,115
|
|
||||||
|
See Notes to Consolidated Financial Statements
|
||||||||||||||||||||||||||
72
|
|
||||
|
(in thousands)
|
||||
|
|
2016
|
2015
|
2014
|
||||||||
|
CASH FLOWS FROM OPERATING ACTIVITIES:
|
|||||||||||
|
Net Income
|
$
|
161,625
|
|
$
|
149,502
|
|
$
|
157,894
|
|
||
|
Adjustments to reconcile net income to net cash provided by operating activities:
|
|||||||||||
|
Provision for credit losses
|
13,182
|
|
2,250
|
|
12,500
|
|
|||||
|
Depreciation and amortization of premises and equipment
|
27,403
|
|
27,605
|
|
24,555
|
|
|||||
|
Net amortization of investment security premiums
|
10,430
|
|
7,330
|
|
5,120
|
|
|||||
|
Deferred income tax expense
|
11,054
|
|
13,424
|
|
18,523
|
|
|||||
|
Investment securities gains, net
|
(2,550
|
)
|
(9,066
|
)
|
(2,041
|
)
|
|||||
|
Gains on sales of mortgage loans
|
(15,685
|
)
|
(13,264
|
)
|
(10,063
|
)
|
|||||
|
Proceeds from sales of mortgage loans held for sale
|
709,316
|
|
757,850
|
|
654,654
|
|
|||||
|
Originations of mortgage loans held for sale
|
(705,442
|
)
|
(743,950
|
)
|
(640,762
|
)
|
|||||
|
Amortization of intangible assets
|
—
|
|
247
|
|
1,259
|
|
|||||
|
Amortization of issuance costs and discount of long-term debt
|
617
|
|
582
|
|
337
|
|
|||||
|
Stock-based compensation
|
6,556
|
|
5,938
|
|
5,865
|
|
|||||
|
Excess tax benefits from stock-based compensation
|
(964
|
)
|
(201
|
)
|
(81
|
)
|
|||||
|
(Increase) decrease in accrued interest receivable
|
(3,527
|
)
|
(949
|
)
|
2,219
|
|
|||||
|
Loss on redemption of trust preferred securities
|
—
|
|
5,626
|
|
—
|
|
|||||
|
Increase in other assets
|
(29,940
|
)
|
(22,987
|
)
|
(23,619
|
)
|
|||||
|
(Decrease) increase in accrued interest payable
|
(1,092
|
)
|
(7,321
|
)
|
2,827
|
|
|||||
|
Increase in other liabilities
|
4,427
|
|
4,928
|
|
1,522
|
|
|||||
|
Total adjustments
|
23,785
|
|
28,042
|
|
52,815
|
|
|||||
|
Net cash provided by operating activities
|
185,410
|
|
177,544
|
|
210,709
|
|
|||||
|
CASH FLOWS FROM INVESTING ACTIVITIES:
|
|||||||||||
|
Proceeds from sales of securities available for sale
|
115,844
|
|
66,480
|
|
32,227
|
|
|||||
|
Proceeds from maturities and paydowns of securities available for sale
|
558,854
|
|
439,533
|
|
417,559
|
|
|||||
|
Purchase of securities available for sale
|
(782,765
|
)
|
(683,839
|
)
|
(164,769
|
)
|
|||||
|
Decrease (increase) in short-term investments
|
1,264
|
|
130,567
|
|
(174,922
|
)
|
|||||
|
Net increase in loans
|
(873,939
|
)
|
(743,655
|
)
|
(360,982
|
)
|
|||||
|
Net purchases of premises and equipment
|
(19,674
|
)
|
(27,113
|
)
|
(24,561
|
)
|
|||||
|
Net cash used in investing activities
|
(1,000,416
|
)
|
(818,027
|
)
|
(275,448
|
)
|
|||||
|
CASH FLOWS FROM FINANCING ACTIVITIES:
|
|||||||||||
|
Net increase in demand and savings deposits
|
992,253
|
|
971,312
|
|
722,791
|
|
|||||
|
Net (decrease) increase in time deposits
|
(111,706
|
)
|
(206,501
|
)
|
153,529
|
|
|||||
|
Increase (decrease) in short-term borrowings
|
43,654
|
|
167,944
|
|
(928,910
|
)
|
|||||
|
Additions to long-term debt
|
215,884
|
|
347,778
|
|
262,113
|
|
|||||
|
Repayments of long-term debt
|
(236,640
|
)
|
(540,079
|
)
|
(6,621
|
)
|
|||||
|
Net proceeds from issuance of common stock
|
16,167
|
|
10,607
|
|
8,201
|
|
|||||
|
Excess tax benefits from stock-based compensation
|
964
|
|
201
|
|
81
|
|
|||||
|
Dividends paid
|
(69,382
|
)
|
(65,361
|
)
|
(64,028
|
)
|
|||||
|
Acquisition of treasury stock
|
(18,545
|
)
|
(50,000
|
)
|
(175,255
|
)
|
|||||
|
Deferred accelerated stock repurchase payment
|
—
|
|
—
|
|
(20,000
|
)
|
|||||
|
Net cash provided by (used in) financing activities
|
832,649
|
|
635,901
|
|
(48,099
|
)
|
|||||
|
Net Increase (decrease) in Cash and Due From Banks
|
17,643
|
|
(4,582
|
)
|
(112,838
|
)
|
|||||
|
Cash and Due From Banks at Beginning of Year
|
101,120
|
|
105,702
|
|
218,540
|
|
|||||
|
Cash and Due From Banks at End of Year
|
$
|
118,763
|
|
$
|
101,120
|
|
$
|
105,702
|
|
||
|
Supplemental Disclosures of Cash Flow Information
|
|||||||||||
|
Cash paid during period for:
|
|||||||||||
|
Interest
|
$
|
83,420
|
|
$
|
91,116
|
|
$
|
78,384
|
|
||
|
Income taxes
|
16,193
|
|
13,378
|
|
16,778
|
|
|||||
|
See Notes to Consolidated Financial Statements
|
|||||||||||
73
NOTES TO CONSOLIDATED FINANCIAL STATEMENTS
|
|
||||
Business:
Fulton Financial Corporation ("Parent Company") is a multi-bank financial holding company which provides a full range of banking and financial services to businesses and consumers through its
six
wholly owned banking subsidiaries: Fulton Bank, N.A., Fulton Bank of New Jersey, The Columbia Bank, Lafayette Ambassador Bank, FNB Bank, N.A. and Swineford National Bank. In addition, the Parent Company owns the following non-bank subsidiaries: Fulton Financial Realty Company, Central Pennsylvania Financial Corp., FFC Management, Inc., FFC Penn Square, Inc. and Fulton Insurance Services Group, Inc. Collectively, the Parent Company and its subsidiaries are referred to as the Corporation.
The Corporation’s primary sources of revenue are interest income on loans and investment securities and fee income on its products and services. Its expenses consist of interest expense on deposits and borrowed funds, provision for credit losses, other operating expenses and income taxes. The Corporation’s primary competition is other financial services providers operating in its region. Competitors also include financial services providers located outside the Corporation’s geographic market as a result of the growth in electronic delivery systems. The Corporation is subject to the regulations of certain federal and state agencies and undergoes periodic examinations by such regulatory authorities.
The Corporation offers, through its banking subsidiaries, a full range of retail and commercial banking services in Pennsylvania, Delaware, Maryland, New Jersey and Virginia. Industry diversity is the key to the economic well-being of these markets, and the Corporation is not dependent upon any single customer or industry.
Basis of Financial Statement Presentation:
The consolidated financial statements have been prepared in conformity with accounting principles generally accepted in the United States ("U.S. GAAP") and include the accounts of the Parent Company and all wholly owned subsidiaries. All significant intercompany accounts and transactions have been eliminated. The preparation of financial statements in accordance with U.S. GAAP requires management to make estimates and assumptions that affect the reported amounts of assets and liabilities, the disclosed amount of contingent assets and liabilities as of the date of the financial statements and the reported amounts of revenues and expenses during the period. Actual results could differ from those estimates. The Corporation evaluates subsequent events through the date of the filing of this report with the Securities and Exchange Commission ("SEC").
Federal Reserve Bank and Federal Home Loan Bank Stock:
Certain of the Corporation's wholly owned banking subsidiaries are members of the Federal Reserve Bank and Federal Home Loan Bank and are required by federal law to hold stock in these institutions according to predetermined formulas. These restricted investments are carried at cost on the consolidated balance sheets and are periodically evaluated for impairment. Each of the Corporation’s subsidiary banks is a member of the Federal Home Loan Bank for the region encompassing the headquarters of the subsidiary bank. Memberships are maintained with the Atlanta, New York and Pittsburgh regional Federal Home Loan Banks (collectively referred to as the "FHLB").
Investments:
Debt securities are classified as held to maturity at the time of purchase when the Corporation has both the intent and ability to hold these investments until they mature. Such debt securities are carried at cost, adjusted for amortization of premiums and accretion of discounts using the effective yield method. The Corporation does not engage in trading activities, however, since the investment portfolio serves as a source of liquidity, all debt securities and marketable equity securities are classified as available for sale. Securities available for sale are carried at estimated fair value with the related unrealized holding gains and losses reported in shareholders’ equity as a component of other comprehensive income, net of tax. Realized securities gains and losses are computed using the specific identification method and are recorded on a trade date basis.
Securities are evaluated periodically to determine whether declines in value are other-than-temporary. For its investments in equity securities, most notably its investments in stocks of financial institutions, the Corporation evaluates the near-term prospects of the issuers in relation to the severity and duration of the impairment. Equity securities with fair values less than cost are considered to be other-than-temporarily impaired if the Corporation does not have the ability and intent to hold the investments for a reasonable period of time that would be sufficient for a recovery of fair value.
Impaired debt securities are determined to be other-than-temporarily impaired if the Corporation concludes at the balance sheet date that it has the intent to sell, or believes it will more likely than not be required to sell, an impaired debt security before a recovery of its amortized cost basis. Credit losses on other-than-temporarily impaired debt securities are recorded through earnings, regardless of the intent or the requirement to sell. Credit loss is measured as the difference between the present value of an impaired debt security’s expected cash flows and its amortized cost. Non-credit related other-than-temporary impairment charges are recorded
74
as decreases to accumulated other comprehensive income as long as the Corporation has no intent or expected requirement to sell the impaired debt security before a recovery of its amortized cost basis.
Fair Value Option:
The Corporation has elected to measure mortgage loans held for sale at fair value. Derivative financial instruments related to mortgage banking activities are also recorded at fair value, as detailed under the heading "Derivative Financial Instruments," below. The Corporation determines fair value for its mortgage loans held for sale based on the price that secondary market investors would pay for loans with similar characteristics, including interest rate and term, as of the date fair value is measured. Changes in fair values during the period are recorded as components of mortgage banking income on the consolidated statements of income. Interest income earned on mortgage loans held for sale is classified in interest income on the consolidated statements of income.
Loans and Revenue Recognition
: Loan and lease financing receivables are stated at their principal amount outstanding, except for mortgage loans held for sale, which are carried at fair value. Interest income on loans is accrued as earned. Unearned income on lease financing receivables is recognized on a basis which approximates the effective yield method.
In general, a loan is placed on non-accrual status once it becomes
90
days delinquent as to principal or interest. In certain cases a loan may be placed on non-accrual status prior to being
90
days delinquent if there is an indication that the borrower is having difficulty making payments, or the Corporation believes it is probable that all amounts will not be collected according to the contractual terms of the loan agreement. When interest accruals are discontinued, unpaid interest previously credited to income is reversed. Non-accrual loans may be restored to accrual status when all delinquent principal and interest has been paid currently for six consecutive months or the loan is considered secured and in the process of collection. The Corporation generally applies payments received on non-accruing loans to principal until such time as the principal is paid off, after which time any payments received are recognized as interest income. If the Corporation believes that all amounts outstanding on a non-accrual loan will ultimately be collected, payments received subsequent to its classification as a non-accrual loan are allocated between interest income and principal.
A loan that is
90
days delinquent may continue to accrue interest if the loan is both adequately secured and is in the process of collection. Past due status is determined based on contractual due dates for loan payments. An adequately secured loan is one that has collateral with a supported fair value that is sufficient to discharge the debt, and/or has an enforceable guarantee from a financially responsible party. A loan is considered to be in the process of collection if collection is proceeding through legal action or through other activities that are reasonably expected to result in repayment of the debt or restoration to current status in the near future.
Loans and lease financing receivables deemed to be a loss are written off through a charge against the allowance for loan losses. Closed-end consumer loans are generally charged off when they become
120
days past due (
180
days for open-end consumer loans) if they are not adequately secured by real estate. All other loans are evaluated for possible charge-off when it is probable that the balance will not be collected, based on the ability of the borrower to pay and the value of the underlying collateral. Principal recoveries of loans previously charged off are recorded as increases to the allowance for loan losses.
Loan Origination Fees and Costs:
Loan origination fees and the related direct origination costs are deferred and amortized over the life of the loan as an adjustment to interest income generally using the effective yield method. For mortgage loans sold, net loan origination fees and costs are included in the gain or loss on sale of the related loan.
Allowance for Credit Losses:
The allowance for credit losses consists of the allowance for loan losses and the reserve for unfunded lending commitments. The allowance for loan losses represents management’s estimate of incurred losses in the loan portfolio as of the balance sheet date and is recorded as a reduction to loans. The reserve for unfunded lending commitments represents management’s estimate of incurred losses in its unfunded loan commitments and is recorded in other liabilities on the consolidated balance sheets. The allowance for credit losses is increased by charges to expense, through the provision for credit losses, and decreased by charge-offs, net of recoveries. Management believes that the allowance for loan losses and the reserve for unfunded lending commitments are adequate as of the balance sheet date; however, future changes to the allowance or reserve may be necessary based on changes in any of the factors discussed in the following paragraphs.
Maintaining an adequate allowance for credit losses is dependent upon various factors, including the ability to identify potential problem loans in a timely manner. For commercial loans, commercial mortgages and construction loans to commercial borrowers, an internal risk rating process is used. The Corporation believes that internal risk ratings are the most relevant credit quality
75
indicator for these types of loans. The migration of loans through the various internal risk rating categories is a significant component of the allowance for credit loss methodology for these loans, which bases the probability of default on this migration. Assigning risk ratings involves judgment. The Corporation's loan review officers provide a separate assessment of risk rating accuracy. Risk ratings may be changed based on the ongoing monitoring procedures performed by loan officers or credit administration staff, or if specific loan review assessments identify a deterioration or an improvement in the loan.
The following is a summary of the Corporation's internal risk rating categories:
|
•
|
Pass
: These loans do not currently pose undue credit risk and can range from the highest to average quality, depending on the degree of potential risk.
|
|
•
|
Special Mention
: These loans have an undue and unwarranted credit risk, but not to the point of justifying a classification of substandard. Loans in this category are currently acceptable, but are nevertheless potentially weak.
|
|
•
|
Substandard or Lower
: These loans are inadequately protected by current sound worth and paying capacity of the borrower. There exists a well-defined weakness or weaknesses that jeopardize the normal repayment of the debt.
|
The Corporation does not assign internal risk ratings for smaller balance, homogeneous loans, such as: home equity, residential mortgage, consumer, lease receivables and construction loans to individuals secured by residential real estate. For these loans, the most relevant credit quality indicator is delinquency status. The migration of loans through the various delinquency status categories is a significant component of the allowance for credit loss methodology for these loans, which bases the probability of default on this migration.
The Corporation’s allowance for loan losses includes: 1) specific allowances allocated to loans evaluated for impairment under the Financial Accounting Standards Board's Accounting Standards Codification ("FASB ASC") Section 310-10-35; and 2) allowances calculated for pools of loans measured for impairment under FASB ASC Subtopic 450-20.
A loan is considered to be impaired if it is probable that all amounts will not be collected according to the contractual terms of the loan agreement. Impaired loans consist of all loans on non-accrual status and accruing TDRs. An allowance for loan losses is established for an impaired loan if its carrying value exceeds its estimated fair value. Impaired loans to borrowers with total outstanding commitments greater than or equal to
$1.0 million
are evaluated individually for impairment. Impaired loans to borrowers with total outstanding commitments less than
$1.0 million
are pooled and measured for impairment collectively.
All loans evaluated for impairment under FASB ASC Section 310-10-35 are measured for losses on a quarterly basis. As of
December 31, 2016
and
2015
, substantially
all
of the Corporation’s impaired loans to borrowers with total outstanding loan balances greater than or equal to
$1.0 million
were measured based on the estimated fair value of each loan’s collateral. Collateral could be in the form of real estate, in the case of impaired commercial mortgages and construction loans, or business assets, such as accounts receivable or inventory, in the case of commercial and industrial loans. Commercial and industrial loans may also be secured by real property.
For loans secured by real estate, estimated fair values are determined primarily through appraisals performed by state certified third-party appraisers, discounted to arrive at expected net sale proceeds. For collateral dependent loans, estimated real estate fair values are also net of estimated selling costs. When a real estate secured loan becomes impaired, a decision is made regarding whether an updated appraisal of the real estate is necessary. This decision is based on various considerations, including: the age of the most recent appraisal; the loan-to-value ratio based on the original appraisal; the condition of the property; the Corporation’s experience and knowledge of the real estate market; the purpose of the loan; market factors; payment status; the strength of any guarantors; and the existence and age of other indications of value such as broker price opinions, among others. The Corporation generally obtains updated state certified third-party appraisals for impaired loans secured predominantly by real estate every
12
months.
As of
December 31, 2016
and
2015
, approximately
62%
and
69%
, respectively, of impaired loans with principal balances greater than or equal to
$1.0 million
, whose primary collateral is real estate, were measured at estimated fair value using state certified third-party appraisals that had been updated within the preceding
12
months.
When updated appraisals are not obtained for loans evaluated for impairment under FASB ASC Section 310-10-35 that are secured by real estate, fair values are estimated based on the original appraisal values, as long as the original appraisal indicated an acceptable loan-to-value position and, in the opinion of the Corporation's internal credit administration staff, there has not been a significant deterioration in the collateral value since the original appraisal was performed. Original appraisals are typically used only when the estimated collateral value, as adjusted appropriately for the age of the appraisal, results in a current loan-to-value ratio that is lower than the Corporation's loan-to-value requirements for new loans, generally less than
70%
.
76
For impaired loans with principal balances greater than or equal to
$1.0 million
secured by non-real estate collateral, such as accounts receivable or inventory, estimated fair values are determined based on borrower financial statements, inventory listings, accounts receivable agings or borrowing base certificates. Indications of value from these sources are generally discounted based on the age of the financial information or the quality of the assets. Liquidation or collection discounts are applied to these assets based upon existing loan evaluation policies.
All loans not evaluated for impairment under FASB ASC Section 310-10-35 are evaluated for impairment under FASB ASC Subtopic 450-20, using a pooled loss evaluation approach. In general, these loans include residential mortgages, home equity loans, consumer loans, and lease receivables. Accruing commercial loans, commercial mortgages and construction loans are also evaluated for impairment under FASB ASC Subtopic 450-20.
The Corporation segments its loan portfolio by general loan type, or "portfolio segments," as presented in the table under the heading, "Loans, net of unearned income," within Note 4, "Loans and Allowance for Credit Losses." Certain portfolio segments are further disaggregated and evaluated collectively for impairment based on "class segments," which are largely based on the type of collateral underlying each loan. For commercial loans, class segments include loans secured by collateral and unsecured loans. Construction loan class segments include loans secured by commercial real estate, loans to commercial borrowers secured by residential real estate and loans to individuals secured by residential real estate. Consumer loan class segments are based on collateral types and include direct consumer installment loans and indirect automobile loans.
The Corporation calculates allowance allocation needs for loans measured under FASB ASC Subtopic 450-20 through the following procedures:
|
•
|
The loans are segmented into pools with similar characteristics, as noted above. Commercial loans, commercial mortgages and construction loans to commercial borrowers are further segmented into separate pools based on internally assigned risk ratings. Residential mortgages, home equity loans, consumer loans, and lease receivables are further segmented into separate pools based on delinquency status.
|
|
•
|
A loss rate is calculated for each pool through a migration analysis of historical losses as loans migrate through the various risk rating or delinquency categories. Estimated loss rates are based on a probability of default and a loss rate forecast.
|
|
•
|
The loss rate is adjusted to consider qualitative factors, such as economic conditions and trends.
|
|
•
|
The resulting adjusted loss rate is applied to the balance of the loans in the pool to arrive at the allowance allocation for the pool.
|
The allocation of the allowance for credit losses is reviewed to evaluate its appropriateness in relation to the overall risk profile of the loan portfolio. The Corporation considers risk factors such as: local and national economic conditions; trends in delinquencies and non-accrual loans; the diversity of borrower industry types; and the composition of the portfolio by loan type. An unallocated allowance is maintained for factors and conditions that exist at the balance sheet date, but are not specifically identifiable, and to recognize the inherent imprecision in estimating and measuring loss exposure.
Premises and Equipment:
Premises and equipment are stated at cost, less accumulated depreciation and amortization. The provision for depreciation and amortization is generally computed using the straight-line method over the estimated useful lives of the related assets, which are a maximum of
50
years for buildings and improvements,
8 years
for furniture and
5 years
for equipment. Leasehold improvements are amortized over the shorter of the useful life or the non-cancelable lease term.
Other Real Estate Owned ("OREO"):
Assets acquired in settlement of mortgage loan indebtedness are recorded as OREO and are included in other assets on the consolidated balance sheets, initially at the lower of the estimated fair value of the asset, less estimated selling costs, or the carrying amount of the loan. Costs to maintain the assets and subsequent gains and losses on sales are included in OREO and repossession expense on the consolidated statements of income.
Mortgage Servicing Rights ("MSRs"):
The estimated fair value of MSRs related to residential mortgage loans sold and serviced by the Corporation is recorded as an asset upon the sale of such loans. MSRs are amortized as a reduction to servicing income over the estimated lives of the underlying loans.
MSRs are stratified and evaluated for impairment by comparing each stratum's carrying amount to its estimated fair value. Fair values are determined through a discounted cash flows valuation completed by a third-party valuation expert. Significant inputs to the valuation include expected net servicing income, the discount rate and the expected lives of the underlying loans. Expected life is based on the contractual terms of the loans, as adjusted for prepayment projections. To the extent the amortized cost of the MSRs exceeds their estimated fair value, a valuation allowance is established through a charge against servicing income, included
77
as a component of mortgage banking income on the consolidated statements of income. If subsequent valuations indicate that impairment no longer exists, the valuation allowance is reduced through an increase to servicing income.
Derivative Financial Instruments:
The Corporation manages its exposure to certain interest rate and foreign currency risks through the use of derivatives. None of the Corporation's outstanding derivative contracts are designated as hedges and none are entered into for speculative purposes. Derivative instruments are carried at fair value, with changes in fair values recognized in earnings as components of non-interest income or non-interest expense on the consolidated statements of income.
Derivative contracts create counterparty credit risk with both the Corporation's customers and with institutional derivative counterparties. The Corporation manages counterparty credit risk through its credit approval processes, monitoring procedures and obtaining adequate collateral, when the Corporation determines it is appropriate to do so and in accordance with counterparty contracts.
Mortgage Banking Derivatives
In connection with its mortgage banking activities, the Corporation enters into commitments to originate certain fixed-rate residential mortgage loans for customers, also referred to as interest rate locks. In addition, the Corporation enters into forward commitments for the future sales or purchases of mortgage-backed securities to or from third-party counterparties to hedge the effect of changes in interest rates on the values of both the interest rate locks and mortgage loans held for sale. Forward sales commitments may also be in the form of commitments to sell individual mortgage loans at a fixed price at a future date. The amount necessary to settle each interest rate lock is based on the price that secondary market investors would pay for loans with similar characteristics, including interest rate and term, as of the date fair value is measured. Gross derivative assets and liabilities are recorded in other assets and other liabilities, respectively, on the consolidated balance sheets, with changes in fair values during the period recorded in mortgage banking income on the consolidated statements of income.
Interest Rate Swaps
The Corporation enters into interest rate swaps with certain qualifying commercial loan customers to meet their interest rate risk management needs. The Corporation simultaneously enters into interest rate swaps with dealer counterparties, with identical notional amounts and terms. The net result of these interest rate swaps is that the customer pays a fixed rate of interest and the Corporation receives a floating rate. These interest rate swaps are derivative financial instruments and the gross fair values are recorded in other assets and other liabilities on the consolidated balance sheets, with changes in fair value during the period recorded in other non-interest expense on the consolidated statements of income.
Foreign Exchange Contracts
The Corporation enters into foreign exchange contracts to accommodate the needs of its customers. Foreign exchange contracts are commitments to buy or sell foreign currency on a future date at a contractual price. The Corporation offsets its foreign exchange contract exposure with customers by entering into contracts with third-party correspondent financial institutions to mitigate its exposure to fluctuations in foreign currency exchange rates. The Corporation also holds certain amounts of foreign currency with international correspondent banks. The Corporation's policy limits the total net foreign currency open positions, which includes all outstanding contracts and foreign account balances, to
$500,000
. Gross fair values are recorded in other assets and other liabilities on the consolidated balance sheets, with changes in fair values during the period recorded in other service charges and fees on the consolidated statements of income.
Balance Sheet Offsetting:
Although certain financial assets and liabilities may be eligible for offset on the consolidated balance sheets as they are subject to master netting arrangements or similar agreements, the Corporation elects to not offset such qualifying assets and liabilities.
The Corporation is a party to interest rate swap transactions with financial institution counterparties and customers. Under these agreements, the Corporation has the right to net-settle multiple contracts with the same counterparty in the event of default on, or termination of, any one contract. Cash collateral is posted by the party with a net liability position in accordance with contract thresholds and can be used to settle the fair value of the interest rate swap agreements in the event of default.
The Corporation is also a party to foreign currency exchange contracts with financial institution counterparties, under which the Corporation has the right to net-settle multiple contracts with the same counterparty in the event of default on, or termination of, any one contract. As with interest rate swap contracts, cash collateral is posted by the party with a net liability position in accordance with contract thresholds and can be used to settle the fair value of the foreign currency exchange contracts in the event of default. For additional details, see "Note 10 - Derivative Financial Instruments."
78
The Corporation also enters into agreements with customers in which it sells securities subject to an obligation to repurchase the same or similar securities, referred to as repurchase agreements. Under these agreements, the Corporation may transfer legal control over the assets but still maintain effective control through agreements that both entitle and obligate the Corporation to repurchase the assets. Therefore, repurchase agreements are reported as secured borrowings, classified in short-term borrowings on the consolidated balance sheets, while the securities underlying the repurchase agreements remain classified with investment securities on the consolidated balance sheets. The Corporation has no intention of setting off these amounts, therefore, these repurchase agreements are not eligible for offset.
Income Taxes:
The Corporation accounts for income taxes in accordance with FASB ASC Topic 740, "Income Taxes" ("ASC Topic 740"). Under ASC Topic 740, deferred tax assets and liabilities are determined based on the differences between the financial statement carrying amounts and the tax bases of existing assets and liabilities and are measured at the prevailing enacted tax rates that will be in effect when these differences are settled or realized. ASC Topic 740 also requires that deferred tax assets be reduced by a valuation allowance if it is more likely than not that some portion or all of the deferred tax assets will not be realized.
The realizability of the net deferred tax assets is evaluated quarterly by assessing the valuation allowance and by adjusting the amount of the allowance, if necessary. The Corporation considers all available positive and negative evidence including projected future taxable income and available tax planning strategies that could be implemented to realize the net deferred tax assets. The evaluation of both positive and negative evidence is a requirement pursuant to ASC Topic 740 in determining whether it is more-likely-than-not the net deferred tax assets will be realized. In the event the Corporation determines that the deferred income tax assets would be realized in the future in excess of their net recorded amount, an adjustment to the valuation allowance would be recorded, which would reduce the provision for income taxes.
ASC Topic 740 also creates a single model to address uncertainty in tax positions, and clarifies the accounting for uncertainty in income taxes recognized in an enterprise's financial statements by prescribing the minimum recognition threshold a tax position is required to meet before being recognized in an enterprise's financial statements. It also provides guidance on derecognition, measurement, classification, interest and penalties, accounting in interim periods, disclosure and transition. The liability for unrecognized tax benefits is included in other liabilities within the consolidated balance sheets at
December 31, 2016
and
2015
.
Stock-Based Compensation:
The Corporation grants equity awards to employees, consisting of stock options, restricted stock, restricted stock units ("RSUs") and performance-based restricted stock units ("PSUs") under its Amended and Restated Equity and Cash Incentive Compensation Plan ("Employee Equity Plan"). In addition, employees may purchase stock under the Corporation’s Employee Stock Purchase Plan ("ESPP").
The Corporation also grants stock equity awards to non-employee members of its board of directors under the 2011 Directors’ Equity Participation Plan ("Directors’ Plan"). Under the Directors’ Plan, the Corporation can grant equity awards to non-employee holding company and subsidiary bank directors in the form of stock options, restricted stock or common stock.
Stock option fair values are estimated through the use of the Black-Scholes valuation methodology as of the date of grant. Stock options carry terms of up to
ten
years. The fair value of restricted stock, RSUs and a majority of PSUs are based on the trading price of the Corporation's stock on the date of grant. The fair value of certain PSUs are estimated through the use of the Monte Carlo valuation methodology as of the date of grant.
Equity awards issued under the Employee Equity Plan are generally granted annually and become fully vested over or after a
three
-year vesting period. The vesting period for non-performance-based awards represents the period during which employees are required to provide service in exchange for such awards. Equity awards under the Directors' Plan generally vest immediately upon grant. Certain events, as defined in the Employee Equity Plan and the Directors' Plan, result in the acceleration of the vesting of equity awards. Restricted stock, RSUs and PSUs earn dividends during the vesting period, which are forfeitable if the awards do not vest.
The fair value of stock options, restricted stock and RSUs granted to employees is recognized as compensation expense over the vesting period for such awards. Compensation expense for PSUs is also recognized over the vesting period, however, compensation expense for PSUs may vary based on the expectations for actual performance relative to defined performance measures.
Net Income Per Share:
Basic net income per common share is calculated as net income divided by the weighted average number of shares outstanding.
Diluted net income per share is calculated as net income divided by the weighted average number of shares outstanding plus the incremental number of shares added as a result of converting common stock equivalents, calculated using the treasury stock
79
method. The Corporation’s common stock equivalents consist of outstanding stock options, restricted stock, RSUs and PSUs. PSUs are required to be included in weighted average diluted shares outstanding if performance measures, as defined in each PSU award agreement, are met as of the end of the period.
A reconciliation of weighted average common shares outstanding used to calculate basic and diluted net income per share follows:
|
2016
|
2015
|
2014
|
||||||
|
|
(in thousands)
|
|||||||
|
Weighted average common shares outstanding (basic)
|
173,325
|
|
175,721
|
|
186,219
|
|
||
|
Impact of common stock equivalents
|
1,093
|
|
1,053
|
|
962
|
|
||
|
Weighted average common shares outstanding (diluted)
|
174,418
|
|
176,774
|
|
187,181
|
|
||
In
2016
,
2015
and
2014
,
534,000
,
1.7 million
and
2.8 million
stock options, respectively, were excluded from the diluted earnings per share computation as their effect would have been anti-dilutive.
Disclosures about Segments of an Enterprise and Related Information
: The Corporation does not have any operating segments which require disclosure of additional information. While the Corporation owns
six
separate banks, each engages in similar activities, provides similar products and services, and operates in the same general geographic area. The Corporation’s non-banking activities are immaterial and, therefore, separate information has not been disclosed.
Financial Guarantees
: Financial guarantees, which consist primarily of standby and commercial letters of credit, are accounted for by recognizing a liability equal to the fair value of the guarantees and crediting the liability to income over the term of the guarantee. Fair value is estimated based on the fees currently charged to enter into similar agreements with similar terms.
Business Combinations and Intangible Assets
: The Corporation accounts for its acquisitions using the purchase accounting method. Purchase accounting requires that all assets acquired and liabilities assumed, including certain intangible assets that must be recognized, be recorded at their estimated fair values as of the acquisition date. Any purchase price exceeding the fair value of net assets acquired is recorded as goodwill.
Goodwill is not amortized to expense, but is tested for impairment at least annually. A quantitative annual impairment test is not required if, based on a qualitative analysis, the Corporation determines that the existence of events and circumstances indicate that it is more likely than not that goodwill is not impaired. Write-downs of the balance, if necessary as a result of the impairment test, are charged to expense in the period in which goodwill is determined to be impaired. The Corporation performs its annual test of goodwill impairment as of
October 31st
of each year. If certain events occur which indicate goodwill might be impaired between annual tests, goodwill must be tested when such events occur. Based on the results of its annual impairment tests, the Corporation concluded that there was no impairment in
2016
,
2015
or
2014
. See "Note 6 - Goodwill and Intangible Assets," for additional details.
Intangible assets are amortized over their estimated lives. Some intangible assets have indefinite lives and are, therefore, not amortized. All intangible assets must be evaluated for impairment if certain events occur. Any impairment write-downs are recognized as non-interest expense on the consolidated statements of income.
Variable Interest Entities ("VIEs")
: FASB ASC Topic 810 provides guidance on when to consolidate certain VIEs in the financial statements of the Corporation. VIEs are entities in which equity investors do not have a controlling financial interest or do not have sufficient equity at risk for the entity to finance activities without additional financial support from other parties. VIEs are assessed for consolidation under ASC Topic 810 when the Corporation holds variable interests in these entities. The Corporation consolidates VIEs when it is deemed to be the primary beneficiary. The primary beneficiary of a VIE is determined to be the party that has the power to make decisions that most significantly affect the economic performance of the VIE and has the obligation to absorb losses or the right to receive benefits that in either case could potentially be significant to the VIE.
The Parent Company owns all of the common stock of
three
subsidiary trusts, which have issued securities (Trust Preferred Securities) in conjunction with the Parent Company issuing junior subordinated deferrable interest debentures to the trusts. The terms of the junior subordinated deferrable interest debentures are the same as the terms of the Trust Preferred Securities ("TruPS"). The Parent Company’s obligations under the debentures constitute a full and unconditional guarantee by the Parent Company of the obligations of the trusts. The provisions of ASC Topic 810 related to subsidiary trusts, as interpreted by the SEC, disallow consolidation of subsidiary trusts in the financial statements of the Corporation. As a result, TruPS are not included on the Corporation’s consolidated balance sheets. The junior subordinated debentures issued by the Parent Company to the subsidiary
80
trusts, which have the same total balance and rate as the combined equity securities and TruPS issued by the subsidiary trusts, remain in long-term debt. See "Note 9 - Short-Term Borrowings and Long-Term Debt," for additional information.
The Corporation makes investments in certain community development projects that generate tax credits under various Federal programs, including affordable housing projects, New Markets Tax Credit projects and historic rehabilitation projects (collectively, "Tax Credit Investments"). These investments are made throughout the Corporation's market area as a means of supporting the communities it serves. The Corporation typically acts as a limited partner or member of a limited liability company in its affordable housing investments and does not exert control over the operating or financial policies of the partnership or limited liability company. In the case of its New Markets Tax Credit investments, the Corporation has 100% ownership in the investment fund, although it does not exert control over the operating or financial policies of the partnership. Tax credits earned are subject to recapture by taxing authorities based upon compliance requirements to be met at the project level. As of
December 31, 2016
and
2015
, the Corporation’s Tax Credit Investments, included in other assets on the consolidated balance sheets and representing total committed equity investments, totaled
$186.4 million
and
$175.0 million
, respectively. As of
December 31, 2016
, the Corporation had future funding commitments, included in other liabilities on the consolidated balance sheets, of approximately
$40.6 million
.
Effective January 1, 2015, the Corporation accounts for its investments in Tax Credit Investments using the proportional amortization method. The proportional amortization method allows an entity to amortize the initial cost of its investment in proportion to the amount of tax credits and other tax benefits received and recognize the net investment performance in the income statement as a component of income taxes. Prior to the adoption of the proportional amortization method, the Corporation amortized its investments under the effective yield method over the life of the tax credits generated as a result of the investment. The net income tax benefit associated with these investments, which consists of the amortization of the initial cost of the investments, net of tax benefits, and the income tax credits earned on the investments, recorded in the provision for income taxes on the consolidated statements of income, was
$14.6 million
in
2016
, and
$10.4 million
in both
2015
and
2014
.
Under the proportional amortization method, an investment must be tested for impairment when events or changes in circumstances indicate that it is more likely than not that the carrying amount of the investment will not be realized. An impairment loss is measured as the amount by which the carrying amount of the investment exceeds its fair value. There were
no
impairment losses recognized for the Corporation’s tax credit investments in
2016
,
2015
or
2014
. Because of its 100% ownership, the Corporation's New Markets Tax Credit investments were consolidated based on FASB ASC Topic 810 as of
December 31, 2016
and
2015
. Investments in affordable housing projects were not consolidated based on management's assessment of the provisions of FASB ASC Topic 810.
Fair Value Measurements:
FASB ASC Topic 820 establishes a fair value hierarchy for the inputs to valuation techniques used to measure assets and liabilities at fair value using the following three categories (from highest to lowest priority):
|
•
|
Level 1 – Inputs that represent quoted prices for identical instruments in active markets.
|
|
•
|
Level 2 – Inputs that represent quoted prices for similar instruments in active markets, or quoted prices for identical instruments in non-active markets. Also includes valuation techniques whose inputs are derived principally from observable market data other than quoted prices, such as interest rates or other market-corroborated means.
|
|
•
|
Level 3 – Inputs that are largely unobservable, as little or no market data exists for the instrument being valued.
|
The Corporation has categorized all assets and liabilities required to be measured at fair value on both a recurring and nonrecurring basis into the above three levels. See "Note 18 - Fair Value Measurements," for additional details.
Recently Adopted Accounting Standards:
In August 2014, the FASB issued ASC Update 2014-15, "Presentation of Financial Statements - Going Concern." ASC Update 2014-15 provides guidance regarding management's responsibility to evaluate whether there is substantial doubt about an entity's ability to continue as a going concern and to provide related disclosures. The standards update describes how an entity's management should assess whether there are conditions and events, considered in the aggregate, that raise substantial doubt about an entity's ability to continue as a going concern within one year after the date that the financial statements are issued. For public business entities, ASC Update 2014-15 was effective for annual reporting periods ending after December 15, 2016, with earlier adoption permitted. For the Corporation, this standards update was effective with this 2016 annual report on Form 10-K. The adoption of ASC Update 2014-15 did not have an impact on the Corporation’s consolidated financial statements.
In November 2014, the FASB issued ASC Update 2014-16, "Derivatives and Hedging: Determining Whether the Host Contract in a Hybrid Financial Instrument Issued in the Form of a Share is More Akin to Debt or to Equity." ASC Update 2014-16 was issued to reduce existing diversity in the accounting for hybrid financial instruments issued in the form of a share, such as redeemable convertible preferred stock. ASC Update 2014-16 applies to all entities that are issuers of, or investors in, hybrid financial
81
instruments that are issued in the form of a share, and was effective for public business entities’ annual reporting periods beginning after December 15, 2015 and interim periods within those annual periods, with earlier adoption permitted. For the Corporation, this standards update was effective with its March 31, 2016 quarterly report on Form 10-Q. The adoption of ASC Update 2014-16 did not have an impact on the Corporation’s consolidated financial statements.
In January 2015, the FASB issued ASC Update 2015-01, "Income Statement - Extraordinary and Unusual Items." ASC Update 2015-01 was issued to eliminate the concept of extraordinary items from U.S. GAAP. net of tax, after income from continuing operations. ASC Update 2015-01 amends existing extraordinary items disclosure guidance. Under the amended guidance, reporting entities will no longer separately disclose extraordinary items, net of tax, after income from continuing operations in the income statement.
ASC Update 2015-01 was effective for annual reporting periods beginning after December 15, 2015, with earlier adoption permitted provided that the guidance is applied from the beginning of the fiscal year of adoption.
The Corporation adopted this standards update effective with its March 31, 2016 quarterly report on Form 10-Q and the adoption of ASC Update 2015-01 did not have an impact on its consolidated financial statements.
In February 2015, the FASB issued ASC Update 2015-02, "Consolidation: Amendments to the Consolidation Analysis." ASC Update 2015-02 changes the way reporting enterprises evaluate whether: (a) they should consolidate limited partnerships and similar entities, (b) fees paid to a decision maker or service provider are variable interests in a VIE, and (c) variable interests in a VIE held by related parties of the reporting enterprise
require the reporting enterprise to consolidate the VIE.
ASC Update 2015-02 was effective for public business entities' annual and interim reporting periods beginning after December 15, 2015, with earlier adoption permitted.
The Corporation adopted this standards update effective with its March 31, 2016 quarterly report on Form 10-Q, and the adoption of ASC Update 2015-02 did not have an impact on its consolidated financial statements.
In April 2015, the FASB issued ASC Update 2015-03, "Interest - Imputation of Interest" and updated ASC Update 2015-03 with the issuance of ASC Update 2015-15, "Presentation and Subsequent Measurement of Debt Issuance Costs Associated with Line-of-Credit Arrangements," in August of 2015. ASC Update 2015-03 simplifies the presentation of debt issuances costs. Debt issuance costs related to a recognized debt liability will be presented on the balance sheet as a direct deduction to the debt liability, similar to the presentation of debt discounts. Under prior U.S. GAAP, debt issuance costs were reported on the balance sheet as assets. The costs will continue to be amortized to interest expense using the effective interest method. ASC Update 2015-03 was effective for public business entities' annual and interim reporting periods beginning after December 15, 2015, with earlier adoption permitted.
The Corporation adopted this standards update effective with its March 31, 2016 quarterly report on Form 10-Q and the adoption of ASC Update 2015-03 did not have a material impact on its consolidated financial statements.
In April 2015, the FASB issued ASC Update 2015-05, "Customer's Accounting for Fees Paid in a Cloud Computing Arrangement." ASC Update 2015-05 provides explicit guidance to determine when a customer's fees paid in a cloud computing arrangement is for the acquisition of software licenses, services, or both. ASC Update 2015-05 was effective for public business entities' annual and interim reporting periods beginning after December 15, 2015, with earlier adoption permitted.
The Corporation adopted this standards update effective with its March 31, 2016 quarterly report on Form 10-Q and the adoption of ASC Update 2015-05 did not have a material impact on its consolidated financial statements.
Recently Issued Accounting Standards:
In May 2014, the Financial Accounting Standards Board ("FASB") issued ASC Update 2014-09, "Revenue from Contracts with Customers." This standards update establishes a single comprehensive model for entities to use in accounting for revenue arising from contracts with customers and supersedes most current revenue recognition guidance, including industry-specific guidance. The core principle prescribed by this standards update is that an entity recognizes revenue to depict the transfer of promised goods or services to customers in an amount that reflects the consideration to which the entity expects to be entitled in exchange for those goods or services. The standard applies to all contracts with customers, except those that are within the scope of other topics in the FASB ASC. The standard also requires significantly expanded disclosures about revenue recognition. During 2016, the FASB issued amendments to this standard (ASC Updates 2016-08, 2016-10, 2016-11 and 2016-12). These amendments provide further clarification to the standard. For public business entities, ASC Update 2014-09 is effective for interim and annual reporting periods beginning after December 15, 2017. Early application is not permitted. For the Corporation, this standards update is effective with its March 31, 2018 quarterly report on Form 10-Q. The Corporation is currently evaluating the impact of the adoption of ASC update 2014-09 on its consolidated financial statements.
In January 2016, the FASB issued ASC Update 2016-01, "Financial Instruments - Overall: Recognition and Measurement of Financial Assets and Financial Liabilities." ASC Update 2016-01 provides guidance regarding the income statement impact of equity investments held by an entity and the recognition of changes in fair value of financial liabilities when the fair value option is elected. ASC Update 2016-01 is effective for public business entities' annual and interim reporting periods beginning after December 15, 2017, with earlier adoption permitted.
The Corporation intends to adopt this standards update effective with its March 31, 2018 quarterly report on Form 10-Q and does not expect the adoption of ASC Update 2016-01 to have a material impact on its consolidated financial statements.
82
In February 2016, the FASB issued ASC Update 2016-02, "Leases." This standards update states that a lessee should recognize the assets and liabilities that arise from all leases with a term greater than 12 months. The core principle requires the lessee to recognize a liability to make lease payments and a "right-of-use" asset. The accounting applied by the lessor is relatively unchanged. The standards update also requires expanded qualitative and quantitative disclosures. For public business entities, ASC Update 2016-02 is effective for interim and annual reporting periods beginning after December 15, 2018. ASC Update 2016-02 mandates a modified retrospective transition for all entities. Early application is permitted. For the Corporation, this standards update is effective with its March 31, 2019 quarterly report on Form 10-Q. The Corporation is currently evaluating the impact of the adoption of ASC Update 2016-02 on its consolidated financial statements. The Corporation currently operates a number of branches that are leased, with the leases accounted for as operating leases that are not recognized on the balance sheet. Under ASC update 2016-02, right-of-use assets and lease liabilities will need to be recognized on the consolidated balance sheet for these branches. This is expected to be the most significant impact of the adoption of this standards update.
In March 2016, the FASB issued ASC Update 2016-09, "Stock Compensation: Improvements to Employee Share-Based Payment Accounting." The purpose of this standards update is to simplify several aspects of the accounting for share-based payment transactions, including the income tax consequences, classification of awards as either equity or liability, and classification on the statement of cash flows. ASC Update 2016-09 is effective for interim and annual reporting periods beginning after December 15, 2016. Early application is permitted. For the Corporation, this standards update is effective with its March 31, 2017 quarterly report on Form 10-Q. The Corporation does not expect the adoption of ASC Update 2016-09 to have a material impact on its consolidated financial statements.
In June 2016, the FASB issued ASC Update 2016-13, "Financial Instruments - Credit Losses." The new impairment model prescribed by this standards update is a single impairment model for all financial assets (i.e., loans and investments). The recognition of credit losses would be based on an entity’s current estimate of expected losses (referred to as the Current Expected Credit Loss model, or "CECL"), as opposed to recognition of losses only when they are probable (current practice). ASC Update 2016-13 is effective for interim and annual reporting periods beginning after December 15, 2019. Early adoption is permitted. The Corporation intends to adopt this standards update effective with its March 31, 2020 quarterly report on Form 10-Q. The Corporation is currently evaluating the impact of the adoption of ASC Update 2016-13 on its consolidated financial statements.
In August 2016, the FASB issued ASC Update 2016-15, "Statement of Cash Flows - Classification of Certain Cash Receipts and Cash Payments." This standards update provides guidance regarding the presentation of certain cash receipts and cash payments in the statement of cash flows, addressing eight specific cash flow classification issues, in order to reduce existing diversity in practice. ASC Update 2016-15 is effective for interim and annual reporting periods beginning after December 15, 2017. Early adoption is permitted. The Corporation intends to adopt this standards update effective with its March 31, 2018 quarterly report on Form 10-Q and does not expect the adoption of ASC Update 2016-15 to have a material impact on its consolidated financial statements.
In November 2016, the FASB issued ASC Update 2016-18, "Statement of Cash Flows - Restricted Cash." This standards update provides guidance regarding the presentation of restricted cash in the statement of cash flows. The update
requires companies to include amounts generally described as restricted cash and restricted cash equivalents, along with cash and cash equivalents, when reconciling the beginning-of-period and end-of-period total amounts shown on the statement of cash flows. It also requires an entity to disclose the nature of the restrictions on cash and cash equivalents. ASC Update 2016-18 is effective for interim and annual reporting periods beginning after December 15, 2017. Early adoption is permitted. The Corporation intends to adopt this standards update effective with its March 31, 2018 quarterly report on Form 10-Q and does not expect the adoption of ASC Update 2016-18 to have a material impact on its consolidated financial statements.
In January 2017, the FASB issued ASC Update 2017-04, "Intangibles - Goodwill and Other." This standards update eliminates Step 2 of the goodwill impairment test which measures the impairment amount. Identifying and measuring impairment will take place in a single quantitative step. In addition, no separate qualitative assessment for reporting units with zero or negative carrying amount is required. Entities must disclose the existence of these reporting units and the amount of goodwill allocated to them. This update should be applied on a prospective basis and an entity is required to disclose the nature of and reason for the change in accounting principle upon transition. ASC Update 2017-04 is effective for annual or interim goodwill impairment tests in reporting periods beginning after December 15, 2019. Early adoption is permitted. The Corporation intends to adopt this standards update effective with its 2020 goodwill impairment test and does not expect the adoption of ASC Update 2017-04 to have a material impact on its consolidated financial statements.
Reclassifications:
Certain amounts in the
2015
and
2014
consolidated financial statements and notes have been reclassified to conform to the
2016
presentation.
83
|
|
||||
The Corporation’s subsidiary banks are required to maintain reserves, in the form of cash and balances with the Federal Reserve Bank, against their deposit liabilities. The amounts of such reserves as of
December 31, 2016
and
2015
were
$113.3 million
and
$91.1 million
, respectively.
|
|
||||
The following tables present the amortized cost and estimated fair values of investment securities, which were all classified as available for sale, as of
December 31
:
|
Amortized
Cost |
Gross
Unrealized Gains |
Gross
Unrealized Losses |
Estimated
Fair Value |
||||||||||||
|
|
(in thousands)
|
||||||||||||||
|
2016
|
|||||||||||||||
|
U.S. Government sponsored agency securities
|
$
|
132
|
|
$
|
2
|
|
$
|
—
|
|
$
|
134
|
|
|||
|
State and municipal securities
|
405,274
|
|
2,043
|
|
(15,676
|
)
|
391,641
|
|
|||||||
|
Corporate debt securities
|
112,016
|
|
1,978
|
|
(4,585
|
)
|
109,409
|
|
|||||||
|
Collateralized mortgage obligations
|
604,095
|
|
1,943
|
|
(12,178
|
)
|
593,860
|
|
|||||||
|
Mortgage-backed securities
|
1,353,292
|
|
6,546
|
|
(17,437
|
)
|
1,342,401
|
|
|||||||
|
Auction rate securities
|
107,215
|
|
—
|
|
(9,959
|
)
|
97,256
|
|
|||||||
|
Total debt securities
|
2,582,024
|
|
12,512
|
|
(59,835
|
)
|
2,534,701
|
|
|||||||
|
Equity securities
|
12,231
|
|
12,295
|
|
—
|
|
24,526
|
|
|||||||
|
Total
|
$
|
2,594,255
|
|
$
|
24,807
|
|
$
|
(59,835
|
)
|
$
|
2,559,227
|
|
|||
|
2015
|
|||||||||||||||
|
U.S. Government sponsored agency securities
|
$
|
25,154
|
|
$
|
35
|
|
$
|
(53
|
)
|
$
|
25,136
|
|
|||
|
State and municipal securities
|
256,746
|
|
6,019
|
|
—
|
|
262,765
|
|
|||||||
|
Corporate debt securities
|
100,336
|
|
2,695
|
|
(6,076
|
)
|
96,955
|
|
|||||||
|
Collateralized mortgage obligations
|
835,439
|
|
3,042
|
|
(16,972
|
)
|
821,509
|
|
|||||||
|
Mortgage-backed securities
|
1,154,935
|
|
10,104
|
|
(6,204
|
)
|
1,158,835
|
|
|||||||
|
Auction rate securities
|
106,772
|
|
—
|
|
(8,713
|
)
|
98,059
|
|
|||||||
|
Total debt securities
|
2,479,382
|
|
21,895
|
|
(38,018
|
)
|
2,463,259
|
|
|||||||
|
Equity securities
|
14,677
|
|
6,845
|
|
(8
|
)
|
21,514
|
|
|||||||
|
Total
|
$
|
2,494,059
|
|
$
|
28,740
|
|
$
|
(38,026
|
)
|
$
|
2,484,773
|
|
|||
Securities carried at
$1.8 billion
and
$1.7 billion
as of
December 31, 2016
and
2015
, respectively, were pledged as collateral to secure public and trust deposits and customer repurchase agreements.
Equity securities include common stocks of financial institutions (estimated fair value of
$23.5 million
and
$20.6 million
at
December 31, 2016
and
2015
, respectively) and other equity investments (estimated fair value of
$1.0 million
and
$914,000
at
December 31, 2016
and
2015
, respectively). As of
December 31, 2016
, the financial institutions stock portfolio had a cost basis of
$11.5 million
and an estimated fair value of
$23.5 million
, including an investment in a single financial institution with a cost basis of
$5.8 million
and an estimated fair value of
$11.9 million
. This investment accounted for
50.5%
of the estimated fair value of the Corporation's investments in the common stocks of publicly traded financial institutions. No other investment in the financial institutions stock portfolio exceeded
10%
of the portfolio's estimated fair value.
84
The amortized cost and estimated fair values of debt securities as of
December 31, 2016
, by contractual maturity, are shown in the following table. Actual maturities may differ from contractual maturities because borrowers may have the right to call or prepay obligations with or without call or prepayment penalties.
|
|
Amortized
Cost |
Estimated
Fair Value |
|||||
|
(in thousands)
|
|||||||
|
|
|||||||
|
Due in one year or less
|
$
|
54,727
|
|
$
|
55,027
|
|
|
|
Due from one year to five years
|
28,720
|
|
29,342
|
|
|||
|
Due from five years to ten years
|
95,658
|
|
96,933
|
|
|||
|
Due after ten years
|
445,532
|
|
417,138
|
|
|||
|
624,637
|
|
598,440
|
|
||||
|
Collateralized mortgage obligations
(1)
|
604,095
|
|
593,860
|
|
|||
|
Mortgage-backed securities
(1)
|
1,353,292
|
|
1,342,401
|
|
|||
|
Total debt securities
|
$
|
2,582,024
|
|
$
|
2,534,701
|
|
|
|
(1)
|
Maturities for mortgage-backed securities and collateralized mortgage obligations are dependent upon the interest rate environment and prepayments on the underlying loans.
|
The following table presents information related to gross gains and losses on the sales of equity and debt securities, and losses recognized for other-than-temporary impairment of investments:
|
Gross
Realized Gains |
Gross
Realized Losses |
Other-
than- temporary Impairment Losses |
Net
Gains |
||||||||||||
|
|
(in thousands)
|
||||||||||||||
|
2016:
|
|||||||||||||||
|
Equity securities
|
$
|
2,005
|
|
$
|
(10
|
)
|
$
|
—
|
|
$
|
1,995
|
|
|||
|
Debt securities
|
581
|
|
(26
|
)
|
—
|
|
555
|
|
|||||||
|
Total
|
$
|
2,586
|
|
$
|
(36
|
)
|
$
|
—
|
|
$
|
2,550
|
|
|||
|
2015:
|
|||||||||||||||
|
Equity securities
|
$
|
6,496
|
|
$
|
(1
|
)
|
$
|
—
|
|
$
|
6,495
|
|
|||
|
Debt securities
|
2,571
|
|
—
|
|
—
|
|
2,571
|
|
|||||||
|
Total
|
$
|
9,067
|
|
$
|
(1
|
)
|
$
|
—
|
|
$
|
9,066
|
|
|||
|
2014:
|
|||||||||||||||
|
Equity securities
|
$
|
335
|
|
$
|
—
|
|
$
|
(12
|
)
|
$
|
323
|
|
|||
|
Debt securities
|
2,058
|
|
(322
|
)
|
(18
|
)
|
1,718
|
|
|||||||
|
Total
|
$
|
2,393
|
|
$
|
(322
|
)
|
$
|
(30
|
)
|
$
|
2,041
|
|
|||
There were
no
other-than-temporary impairment charges in 2016 or 2015. In 2014, there were
$30,000
of other-than-temporary impairment charges, consisting of
$12,000
of impairment charges on equity securities and
$18,000
of charges on pooled trust preferred securities.
85
The following table presents a summary of the cumulative credit related other-than-temporary impairment charges, recognized as components of earnings, for debt securities held by the Corporation at
December 31
:
|
2016
|
2015
|
2014
|
|||||||||
|
|
(in thousands)
|
||||||||||
|
Balance of cumulative credit losses on debt securities, beginning of year
|
$
|
(11,510
|
)
|
$
|
(16,242
|
)
|
$
|
(20,691
|
)
|
||
|
Additions for credit losses recorded which were not previously recognized as components of earnings
|
—
|
|
—
|
|
(18
|
)
|
|||||
|
Reductions for securities sold during the period
|
—
|
|
4,730
|
|
4,460
|
|
|||||
|
Reductions for increases in cash flows expected to be collected that are recognized over the remaining life of the security
|
—
|
|
2
|
|
7
|
|
|||||
|
Balance of cumulative credit losses on debt securities, end of year
|
$
|
(11,510
|
)
|
$
|
(11,510
|
)
|
$
|
(16,242
|
)
|
||
Other-than-temporary impairment charges related to investments in common stocks of financial institutions were due to the severity and duration of the declines in fair values of certain financial institution stocks, in conjunction with management’s assessment of the near-term prospects of each specific financial institution. The credit related other-than-temporary impairment charges for debt securities were determined based on expected cash flows models.
The following table presents the gross unrealized losses and estimated fair values of investments, aggregated by investment category and length of time that individual securities have been in a continuous unrealized loss position, as of
December 31, 2016
. There were no gross unrealized losses on equity securities as of
December 31, 2016
.
|
|
Less Than 12 months
|
12 Months or Longer
|
Total
|
||||||||||||||||||||
|
|
Estimated
Fair Value |
Unrealized
Losses |
Estimated
Fair Value |
Unrealized
Losses |
Estimated
Fair Value |
Unrealized
Losses |
|||||||||||||||||
|
|
(in thousands)
|
||||||||||||||||||||||
|
State and municipal securities
|
$
|
247,509
|
|
$
|
(15,676
|
)
|
$
|
—
|
|
$
|
—
|
|
$
|
247,509
|
|
$
|
(15,676
|
)
|
|||||
|
Corporate debt securities
|
11,922
|
|
(110
|
)
|
34,629
|
|
(4,475
|
)
|
46,551
|
|
(4,585
|
)
|
|||||||||||
|
Collateralized mortgage obligations
|
166,905
|
|
(3,899
|
)
|
258,237
|
|
(8,279
|
)
|
425,142
|
|
(12,178
|
)
|
|||||||||||
|
Mortgage-backed securities
|
1,137,510
|
|
(17,437
|
)
|
—
|
|
—
|
|
1,137,510
|
|
(17,437
|
)
|
|||||||||||
|
Auction rate securities
|
—
|
|
—
|
|
97,256
|
|
(9,959
|
)
|
97,256
|
|
(9,959
|
)
|
|||||||||||
|
Total debt securities
|
1,563,846
|
|
(37,122
|
)
|
390,122
|
|
(22,713
|
)
|
1,953,968
|
|
(59,835
|
)
|
|||||||||||
For comparative purposes, the following table presents gross unrealized losses and the estimated fair value of investments, aggregated by investment category and length of time that individual securities have been in a continuous unrealized loss position, at December 31, 2015.
|
|
Less Than 12 months
|
12 Months or Longer
|
Total
|
||||||||||||||||||||
|
|
Estimated
Fair Value |
Unrealized
Losses |
Estimated
Fair Value |
Unrealized
Losses |
Estimated
Fair Value |
Unrealized
Losses |
|||||||||||||||||
|
|
(in thousands)
|
||||||||||||||||||||||
|
U.S. Government sponsored agency securities
|
$
|
9,957
|
|
$
|
(53
|
)
|
$
|
—
|
|
$
|
—
|
|
$
|
9,957
|
|
$
|
(53
|
)
|
|||||
|
Corporate debt securities
|
12,892
|
|
(97
|
)
|
33,036
|
|
(5,979
|
)
|
45,928
|
|
(6,076
|
)
|
|||||||||||
|
Collateralized mortgage obligations
|
166,007
|
|
(1,467
|
)
|
467,778
|
|
(15,505
|
)
|
633,785
|
|
(16,972
|
)
|
|||||||||||
|
Mortgage-backed securities
|
611,920
|
|
(4,783
|
)
|
63,818
|
|
(1,421
|
)
|
675,738
|
|
(6,204
|
)
|
|||||||||||
|
Auction rate securities
|
—
|
|
—
|
|
98,059
|
|
(8,713
|
)
|
98,059
|
|
(8,713
|
)
|
|||||||||||
|
Total debt securities
|
800,776
|
|
(6,400
|
)
|
662,691
|
|
(31,618
|
)
|
1,463,467
|
|
(38,018
|
)
|
|||||||||||
|
Equity securities
|
—
|
|
—
|
|
14
|
|
(8
|
)
|
14
|
|
(8
|
)
|
|||||||||||
|
Total
|
$
|
800,776
|
|
$
|
(6,400
|
)
|
$
|
662,705
|
|
$
|
(31,626
|
)
|
$
|
1,463,481
|
|
$
|
(38,026
|
)
|
|||||
86
The Corporation’s collateralized mortgage obligations and mortgage-backed securities have contractual terms that generally do not permit the issuer to settle the securities at a price less than the amortized cost of the investment. Because the decline in fair value of these securities is attributable to changes in interest rates and not credit quality, and because the Corporation does not have the intent to sell and does not believe it will more likely than not be required to sell any of these securities prior to a recovery of their fair value to amortized cost, the Corporation did not consider these investments to be other-than-temporarily impaired as of
December 31, 2016
.
As of
December 31, 2016
, all student loan auction rate certificates ("ARCs") were current and making scheduled interest payments and were rated above investment grade, with approximately
$5.5 million
, or
6%
, "AAA" rated and
$91.8 million
, or
94%
, "AA" rated. All of the loans underlying the ARCs have principal payments which are guaranteed by the federal government. Based on management’s evaluations, ARCs with a fair value of
$97.3 million
were not subject to any other-than-temporary impairment charges as of
December 31, 2016
. The Corporation does not have the intent to sell and does not believe it will more likely than not be required to sell these securities prior to a recovery of their fair value to amortized cost, which may be at maturity.
The majority of the Corporation’s available for sale corporate debt securities are issued by financial institutions. The following table presents the amortized cost and estimated fair values of corporate debt securities as of
December 31
:
|
|
2016
|
2015
|
|||||||||||||
|
|
Amortized
Cost |
Estimated
Fair Value |
Amortized
Cost |
Estimated
Fair Value |
|||||||||||
|
|
(in thousands)
|
||||||||||||||
|
Single-issuer trust preferred securities
|
$
|
43,746
|
|
$
|
39,829
|
|
$
|
44,648
|
|
$
|
39,106
|
|
|||
|
Subordinated debt
|
46,231
|
|
46,723
|
|
39,610
|
|
40,779
|
|
|||||||
|
Senior debt
|
18,037
|
|
18,433
|
|
12,043
|
|
12,329
|
|
|||||||
|
Pooled trust preferred securities
|
—
|
|
422
|
|
—
|
|
706
|
|
|||||||
|
Corporate debt securities issued by financial institutions
|
108,014
|
|
105,407
|
|
96,301
|
|
92,920
|
|
|||||||
|
Other corporate debt securities
|
4,002
|
|
4,002
|
|
4,035
|
|
4,035
|
|
|||||||
|
Available for sale corporate debt securities
|
$
|
112,016
|
|
$
|
109,409
|
|
$
|
100,336
|
|
$
|
96,955
|
|
|||
Single-issuer trust preferred securities had an unrealized loss of
$3.9 million
as of
December 31, 2016
.
Six
of the
19
single-issuer trust preferred securities held were rated below investment grade by at least
one
ratings agency, with an amortized cost of
$11.5 million
and an estimated fair value of
$10.0 million
as of
December 31, 2016
. All of the single-issuer trust preferred securities rated below investment grade were rated "BB" or "Ba."
Two
single-issuer trust preferred securities with an amortized cost of
$3.7 million
and an estimated fair value of
$2.5 million
as of
December 31, 2016
were not rated by any ratings agency.
Based on management's evaluations, corporate debt securities with a fair value of
$109.4 million
were not subject to any additional other-than-temporary impairment charges as of
December 31, 2016
. The Corporation does not have the intent to sell and does not believe it will more likely than not be required to sell any of these securities prior to a recovery of their fair value to amortized cost, which may be at maturity.
87
|
|
||||
Loans, net of unearned income
Loans, net of unearned income are summarized as follows as of
December 31
:
|
2016
|
2015
|
||||||
|
|
(in thousands)
|
||||||
|
Real estate – commercial mortgage
|
$
|
6,018,582
|
|
$
|
5,462,330
|
|
|
|
Commercial – industrial, financial and agricultural
|
4,087,486
|
|
4,088,962
|
|
|||
|
Real estate – home equity
|
1,625,115
|
|
1,684,439
|
|
|||
|
Real estate – residential mortgage
|
1,601,994
|
|
1,376,160
|
|
|||
|
Real estate – construction
|
843,649
|
|
799,988
|
|
|||
|
Consumer
|
291,470
|
|
268,588
|
|
|||
|
Leasing and other
|
246,704
|
|
170,914
|
|
|||
|
Overdrafts
|
3,662
|
|
2,737
|
|
|||
|
Loans, gross of unearned income
|
14,718,662
|
|
13,854,118
|
|
|||
|
Unearned income
|
(19,390
|
)
|
(15,516
|
)
|
|||
|
Loans, net of unearned income
|
$
|
14,699,272
|
|
$
|
13,838,602
|
|
|
The Corporation has extended credit to the officers and directors of the Corporation and to their associates. These related-party loans are made on substantially the same terms, including interest rates and collateral, as those prevailing at the time for comparable transactions with unrelated persons and do not involve more than the normal risk of collection. The aggregate dollar amount of these loans, including unadvanced commitments, was
$154.4 million
and
$191.6 million
as of
December 31, 2016
and
2015
,
respectively. During
2016
, additions totaled
$26.6 million
and repayments totaled
$63.8 million
in related-party loans.
The total portfolio of mortgage loans serviced by the Corporation for unrelated third parties was
$4.7 billion
and
$4.8 billion
as of
December 31, 2016
and
2015
, respectively.
Allowance for Credit Losses
The following table presents the components of the allowance for credit losses as of
December 31
:
|
2016
|
2015
|
2014
|
|||||||||
|
|
(in thousands)
|
||||||||||
|
Allowance for loan losses
|
$
|
168,679
|
|
$
|
169,054
|
|
$
|
184,144
|
|
||
|
Reserve for unfunded lending commitments
|
2,646
|
|
2,358
|
|
1,787
|
|
|||||
|
Allowance for credit losses
|
$
|
171,325
|
|
$
|
171,412
|
|
$
|
185,931
|
|
||
The following table presents the activity in the allowance for credit losses for the years ended
December 31
:
|
2016
|
2015
|
2014
|
|||||||||
|
|
(in thousands)
|
||||||||||
|
Balance at beginning of year
|
$
|
171,412
|
|
$
|
185,931
|
|
$
|
204,917
|
|
||
|
Loans charged off
|
(33,927
|
)
|
(32,157
|
)
|
(44,593
|
)
|
|||||
|
Recoveries of loans previously charged off
|
20,658
|
|
15,388
|
|
13,107
|
|
|||||
|
Net loans charged off
|
(13,269
|
)
|
(16,769
|
)
|
(31,486
|
)
|
|||||
|
Provision for credit losses
|
13,182
|
|
2,250
|
|
12,500
|
|
|||||
|
Balance at end of year
|
$
|
171,325
|
|
$
|
171,412
|
|
$
|
185,931
|
|
||
88
The following table presents the activity in the allowance for loan losses by portfolio segment for the years ended
December 31
and loans, net of unearned income, and their related allowance for loan losses, by portfolio segment, as of December 31:
|
Real Estate -
Commercial Mortgage |
Commercial -
Industrial, Financial and Agricultural |
Real Estate -
Home Equity |
Real Estate -
Residential Mortgage |
Real Estate -
Construction |
Consumer
|
Leasing
and other and Overdrafts |
Unallocated
|
Total
|
|||||||||||||||||||||||||||
|
|
(in thousands)
|
||||||||||||||||||||||||||||||||||
|
Balance at December 31, 2014
|
$
|
53,493
|
|
$
|
51,378
|
|
$
|
28,271
|
|
$
|
29,072
|
|
$
|
9,756
|
|
$
|
3,015
|
|
$
|
1,799
|
|
$
|
7,360
|
|
$
|
184,144
|
|
||||||||
|
Loans charged off
|
(4,218
|
)
|
(15,639
|
)
|
(3,604
|
)
|
(3,612
|
)
|
(201
|
)
|
(2,227
|
)
|
(2,656
|
)
|
—
|
|
(32,157
|
)
|
|||||||||||||||||
|
Recoveries of loans previously charged off
|
2,801
|
|
5,264
|
|
1,362
|
|
1,322
|
|
2,824
|
|
1,130
|
|
685
|
|
—
|
|
15,388
|
|
|||||||||||||||||
|
Net loans charged off
|
(1,417
|
)
|
(10,375
|
)
|
(2,242
|
)
|
(2,290
|
)
|
2,623
|
|
(1,097
|
)
|
(1,971
|
)
|
—
|
|
(16,769
|
)
|
|||||||||||||||||
|
Provision for loan losses
(1)
|
(4,210
|
)
|
16,095
|
|
(3,624
|
)
|
(5,407
|
)
|
(5,850
|
)
|
667
|
|
2,640
|
|
1,368
|
|
1,679
|
|
|||||||||||||||||
|
Balance at December 31, 2015
|
47,866
|
|
57,098
|
|
22,405
|
|
21,375
|
|
6,529
|
|
2,585
|
|
2,468
|
|
8,728
|
|
169,054
|
|
|||||||||||||||||
|
Loans charged off
|
(3,580
|
)
|
(15,276
|
)
|
(4,912
|
)
|
(2,326
|
)
|
(1,218
|
)
|
(2,800
|
)
|
(3,815
|
)
|
—
|
|
(33,927
|
)
|
|||||||||||||||||
|
Recoveries of loans previously charged off
|
3,373
|
|
8,981
|
|
1,171
|
|
1,072
|
|
3,924
|
|
1,295
|
|
842
|
|
—
|
|
20,658
|
|
|||||||||||||||||
|
Net loans charged off
|
(207
|
)
|
(6,295
|
)
|
(3,741
|
)
|
(1,254
|
)
|
2,706
|
|
(1,505
|
)
|
(2,973
|
)
|
—
|
|
(13,269
|
)
|
|||||||||||||||||
|
Provision for loan losses
(1)
|
(817
|
)
|
3,550
|
|
8,137
|
|
2,808
|
|
(2,780
|
)
|
2,494
|
|
3,697
|
|
(4,195
|
)
|
12,894
|
|
|||||||||||||||||
|
Balance at December 31, 2016
|
$
|
46,842
|
|
$
|
54,353
|
|
$
|
26,801
|
|
$
|
22,929
|
|
$
|
6,455
|
|
$
|
3,574
|
|
$
|
3,192
|
|
$
|
4,533
|
|
$
|
168,679
|
|
||||||||
|
Allowance for loan losses at December 31, 2016
|
|||||||||||||||||||||||||||||||||||
|
Measured for impairment under FASB ASC Subtopic 450-20
|
$
|
36,680
|
|
$
|
40,700
|
|
$
|
17,290
|
|
$
|
11,032
|
|
$
|
4,587
|
|
$
|
3,548
|
|
$
|
3,192
|
|
$
|
4,533
|
|
$
|
121,562
|
|
||||||||
|
Evaluated for impairment under FASB ASC Section 310-10-35
|
10,162
|
|
13,653
|
|
9,511
|
|
11,897
|
|
1,868
|
|
26
|
|
—
|
|
N/A
|
|
47,117
|
|
|||||||||||||||||
|
$
|
46,842
|
|
$
|
54,353
|
|
$
|
26,801
|
|
$
|
22,929
|
|
$
|
6,455
|
|
$
|
3,574
|
|
$
|
3,192
|
|
$
|
4,533
|
|
$
|
168,679
|
|
|||||||||
|
Loans, net of unearned income at December 31, 2016
|
|||||||||||||||||||||||||||||||||||
|
Measured for impairment under FASB ASC Subtopic 450-20
|
$
|
5,963,689
|
|
$
|
4,038,511
|
|
$
|
1,605,910
|
|
$
|
1,555,946
|
|
$
|
833,117
|
|
$
|
291,430
|
|
$
|
230,976
|
|
N/A
|
|
$
|
14,519,579
|
|
|||||||||
|
Evaluated for impairment under FASB ASC Section 310-10-35
|
54,893
|
|
48,975
|
|
19,205
|
|
46,048
|
|
10,532
|
|
40
|
|
—
|
|
N/A
|
|
179,693
|
|
|||||||||||||||||
|
$
|
6,018,582
|
|
$
|
4,087,486
|
|
$
|
1,625,115
|
|
$
|
1,601,994
|
|
$
|
843,649
|
|
$
|
291,470
|
|
$
|
230,976
|
|
N/A
|
|
$
|
14,699,272
|
|
||||||||||
|
Allowance for loan losses at December 31, 2015
|
|||||||||||||||||||||||||||||||||||
|
Measured for impairment under FASB ASC Subtopic 450-20
|
$
|
35,395
|
|
$
|
42,515
|
|
$
|
14,412
|
|
$
|
7,953
|
|
$
|
4,134
|
|
$
|
2,563
|
|
$
|
1,764
|
|
$
|
8,728
|
|
$
|
117,464
|
|
||||||||
|
Evaluated for impairment under FASB ASC Section 310-10-35
|
12,471
|
|
14,583
|
|
7,993
|
|
13,422
|
|
2,395
|
|
22
|
|
704
|
|
N/A
|
|
51,590
|
|
|||||||||||||||||
|
$
|
47,866
|
|
$
|
57,098
|
|
$
|
22,405
|
|
$
|
21,375
|
|
$
|
6,529
|
|
$
|
2,585
|
|
$
|
2,468
|
|
$
|
8,728
|
|
$
|
169,054
|
|
|||||||||
|
Loans, net of unearned income at December 31, 2015
|
|||||||||||||||||||||||||||||||||||
|
Measured for impairment under FASB ASC Subtopic 450-20
|
$
|
5,404,036
|
|
$
|
4,040,810
|
|
$
|
1,668,673
|
|
$
|
1,325,735
|
|
$
|
784,002
|
|
$
|
268,555
|
|
$
|
156,710
|
|
N/A
|
|
$
|
13,648,521
|
|
|||||||||
|
Evaluated for impairment under FASB ASC Section 310-10-35
|
58,294
|
|
48,152
|
|
15,766
|
|
50,425
|
|
15,986
|
|
33
|
|
1,425
|
|
N/A
|
|
190,081
|
|
|||||||||||||||||
|
$
|
5,462,330
|
|
$
|
4,088,962
|
|
$
|
1,684,439
|
|
$
|
1,376,160
|
|
$
|
799,988
|
|
$
|
268,588
|
|
$
|
158,135
|
|
N/A
|
|
$
|
13,838,602
|
|
||||||||||
|
(1)
|
For the year ended
December 31, 2016
, the provision for loan losses excluded a
$288,000
increase in the reserve for unfunded lending commitments. The total provision for credit losses, comprised of allocations for both funded and unfunded loans, was
$13.2 million
for the year ended
December 31, 2016
. For the year ended
December 31, 2015
, the provision for loan losses excluded a
$571,000
increase in the reserve for unfunded lending commitments. The total provision for credit losses was
$2.3 million
for the year ended
December 31, 2015
.
|
N/A – Not applicable.
89
Impaired Loans
The following table presents total impaired loans by class segment as of
December 31
:
|
|
2016
|
2015
|
|||||||||||||||||||||
|
|
Unpaid
Principal Balance |
Recorded
Investment |
Related
Allowance |
Unpaid
Principal Balance |
Recorded
Investment |
Related
Allowance |
|||||||||||||||||
|
(in thousands)
|
|||||||||||||||||||||||
|
With no related allowance recorded:
|
|||||||||||||||||||||||
|
Real estate - commercial mortgage
|
$
|
28,757
|
|
$
|
25,447
|
|
$
|
—
|
|
$
|
27,872
|
|
$
|
22,596
|
|
$
|
—
|
|
|||||
|
Commercial - secured
|
29,296
|
|
25,526
|
|
—
|
|
18,012
|
|
13,702
|
|
—
|
|
|||||||||||
|
Real estate - residential mortgage
|
4,689
|
|
4,689
|
|
—
|
|
4,790
|
|
4,790
|
|
—
|
|
|||||||||||
|
Construction - commercial residential
|
6,271
|
|
4,795
|
|
—
|
|
9,916
|
|
8,865
|
|
—
|
|
|||||||||||
|
69,013
|
|
60,457
|
|
60,590
|
|
49,953
|
|
||||||||||||||||
|
With a related allowance recorded:
|
|||||||||||||||||||||||
|
Real estate - commercial mortgage
|
37,132
|
|
29,446
|
|
10,162
|
|
45,189
|
|
35,698
|
|
12,471
|
|
|||||||||||
|
Commercial - secured
|
27,767
|
|
22,626
|
|
13,198
|
|
39,659
|
|
33,629
|
|
14,085
|
|
|||||||||||
|
Commercial - unsecured
|
1,122
|
|
823
|
|
455
|
|
971
|
|
821
|
|
498
|
|
|||||||||||
|
Real estate - home equity
|
23,971
|
|
19,205
|
|
9,511
|
|
20,347
|
|
15,766
|
|
7,993
|
|
|||||||||||
|
Real estate - residential mortgage
|
48,885
|
|
41,359
|
|
11,897
|
|
55,242
|
|
45,635
|
|
13,422
|
|
|||||||||||
|
Construction - commercial residential
|
10,103
|
|
4,206
|
|
1,300
|
|
9,949
|
|
6,290
|
|
2,110
|
|
|||||||||||
|
Construction - commercial
|
681
|
|
435
|
|
145
|
|
820
|
|
638
|
|
217
|
|
|||||||||||
|
Construction - other
|
1,096
|
|
1,096
|
|
423
|
|
331
|
|
193
|
|
68
|
|
|||||||||||
|
Consumer - indirect
|
19
|
|
19
|
|
12
|
|
14
|
|
14
|
|
8
|
|
|||||||||||
|
Consumer - direct
|
21
|
|
21
|
|
14
|
|
19
|
|
19
|
|
14
|
|
|||||||||||
|
Leasing and other and overdrafts
|
—
|
|
—
|
|
—
|
|
1,658
|
|
1,425
|
|
704
|
|
|||||||||||
|
150,797
|
|
119,236
|
|
47,117
|
|
174,199
|
|
140,128
|
|
51,590
|
|
||||||||||||
|
Total
|
$
|
219,810
|
|
$
|
179,693
|
|
$
|
47,117
|
|
$
|
234,789
|
|
$
|
190,081
|
|
$
|
51,590
|
|
|||||
As of
December 31, 2016
and
2015
, there were
$60.5 million
and
$50.0 million
, respectively, of impaired loans that did not have a related allowance for loan loss. The estimated fair values of the collateral securing these loans exceeded their carrying amount, or the loans have been charged down to realizable collateral values. Accordingly, no specific valuation allowance was considered to be necessary.
90
The following table presents average impaired loans, by class segment, for the years ended
December 31
:
|
2016
|
2015
|
2014
|
|||||||||||||||||||||
|
Average
Recorded Investment |
Interest Income
Recognized (1) |
Average
Recorded Investment |
Interest Income
Recognized (1) |
Average
Recorded Investment |
Interest Income
Recognized (1) |
||||||||||||||||||
|
(in thousands)
|
|||||||||||||||||||||||
|
With no related allowance recorded:
|
|||||||||||||||||||||||
|
Real estate - commercial mortgage
|
$
|
24,232
|
|
$
|
294
|
|
$
|
25,345
|
|
$
|
315
|
|
$
|
23,467
|
|
$
|
320
|
|
|||||
|
Commercial - secured
|
19,825
|
|
104
|
|
15,654
|
|
97
|
|
18,928
|
|
119
|
|
|||||||||||
|
Commercial - unsecured
|
—
|
|
—
|
|
17
|
|
—
|
|
—
|
|
—
|
|
|||||||||||
|
Real estate - home equity
|
—
|
|
—
|
|
—
|
|
—
|
|
180
|
|
1
|
|
|||||||||||
|
Real estate - residential mortgage
|
5,598
|
|
126
|
|
5,389
|
|
124
|
|
1,532
|
|
31
|
|
|||||||||||
|
Construction - commercial residential
|
6,285
|
|
48
|
|
11,685
|
|
148
|
|
15,421
|
|
227
|
|
|||||||||||
|
Construction - commercial
|
—
|
|
—
|
|
915
|
|
—
|
|
1,907
|
|
—
|
|
|||||||||||
|
55,940
|
|
572
|
|
59,005
|
|
684
|
|
61,435
|
|
698
|
|
||||||||||||
|
With a related allowance recorded:
|
|||||||||||||||||||||||
|
Real estate - commercial mortgage
|
31,737
|
|
384
|
|
39,232
|
|
475
|
|
38,240
|
|
524
|
|
|||||||||||
|
Commercial - secured
|
25,857
|
|
130
|
|
25,660
|
|
150
|
|
20,991
|
|
129
|
|
|||||||||||
|
Commercial - unsecured
|
887
|
|
4
|
|
1,749
|
|
6
|
|
895
|
|
3
|
|
|||||||||||
|
Real estate - home equity
|
17,912
|
|
285
|
|
13,887
|
|
144
|
|
13,976
|
|
108
|
|
|||||||||||
|
Real estate - residential mortgage
|
42,191
|
|
908
|
|
46,252
|
|
1,041
|
|
50,281
|
|
1,178
|
|
|||||||||||
|
Construction - commercial residential
|
5,295
|
|
41
|
|
6,455
|
|
79
|
|
8,723
|
|
136
|
|
|||||||||||
|
Construction - commercial
|
524
|
|
—
|
|
931
|
|
—
|
|
1,900
|
|
—
|
|
|||||||||||
|
Construction - other
|
682
|
|
—
|
|
263
|
|
—
|
|
387
|
|
—
|
|
|||||||||||
|
Consumer - indirect
|
15
|
|
1
|
|
16
|
|
1
|
|
7
|
|
—
|
|
|||||||||||
|
Consumer - direct
|
18
|
|
1
|
|
17
|
|
1
|
|
16
|
|
1
|
|
|||||||||||
|
Leasing, other and overdrafts
|
854
|
|
—
|
|
285
|
|
—
|
|
—
|
|
—
|
|
|||||||||||
|
125,972
|
|
1,754
|
|
134,747
|
|
1,897
|
|
135,416
|
|
2,079
|
|
||||||||||||
|
Total
|
$
|
181,912
|
|
$
|
2,326
|
|
$
|
193,752
|
|
$
|
2,581
|
|
$
|
196,851
|
|
$
|
2,777
|
|
|||||
|
(1)
|
All impaired loans, excluding accruing TDRs, were non-accrual loans. Interest income recognized for the years ended
December 31, 2016
,
2015
and
2014
represents amounts earned on accruing TDRs.
|
91
Credit Quality Indicators and Non-performing Assets
The following table presents internal credit risk ratings as of
December 31
:
|
|
Pass
|
Special Mention
|
Substandard or Lower
|
Total
|
|||||||||||||||||||||||||||
|
|
2016
|
2015
|
2016
|
2015
|
2016
|
2015
|
2016
|
2015
|
|||||||||||||||||||||||
|
|
(dollars in thousands)
|
||||||||||||||||||||||||||||||
|
Real estate - commercial mortgage
|
$
|
5,763,122
|
|
$
|
5,204,263
|
|
$
|
132,484
|
|
$
|
102,625
|
|
$
|
122,976
|
|
$
|
155,442
|
|
$
|
6,018,582
|
|
$
|
5,462,330
|
|
|||||||
|
Commercial - secured
|
3,686,152
|
|
3,696,692
|
|
128,873
|
|
92,711
|
|
118,527
|
|
136,710
|
|
3,933,552
|
|
3,926,113
|
|
|||||||||||||||
|
Commercial -unsecured
|
145,922
|
|
156,742
|
|
4,481
|
|
2,761
|
|
3,531
|
|
3,346
|
|
153,934
|
|
162,849
|
|
|||||||||||||||
|
Total commercial - industrial, financial and agricultural
|
3,832,074
|
|
3,853,434
|
|
133,354
|
|
95,472
|
|
122,058
|
|
140,056
|
|
4,087,486
|
|
4,088,962
|
|
|||||||||||||||
|
Construction - commercial residential
|
113,570
|
|
140,337
|
|
15,447
|
|
17,154
|
|
13,172
|
|
21,812
|
|
142,189
|
|
179,303
|
|
|||||||||||||||
|
Construction - commercial
|
635,963
|
|
552,710
|
|
3,412
|
|
3,684
|
|
5,115
|
|
3,597
|
|
644,490
|
|
559,991
|
|
|||||||||||||||
|
Total real estate - construction (excluding construction - other)
|
749,533
|
|
693,047
|
|
18,859
|
|
20,838
|
|
18,287
|
|
25,409
|
|
786,679
|
|
739,294
|
|
|||||||||||||||
|
Total
|
$
|
10,344,729
|
|
$
|
9,750,744
|
|
$
|
284,697
|
|
$
|
218,935
|
|
$
|
263,321
|
|
$
|
320,907
|
|
$
|
10,892,747
|
|
$
|
10,290,586
|
|
|||||||
|
% of Total
|
95.0
|
%
|
94.8
|
%
|
2.6
|
%
|
2.1
|
%
|
2.4
|
%
|
3.1
|
%
|
100.0
|
%
|
100.0
|
%
|
|||||||||||||||
The following table presents delinquency and non-performing status for loans that do not have internal credit risk ratings, by class segment, as of
December 31
:
|
Performing
|
Delinquent (1)
|
Non-performing (2)
|
Total
|
||||||||||||||||||||||||||||
|
2016
|
2015
|
2016
|
2015
|
2016
|
2015
|
2016
|
2015
|
||||||||||||||||||||||||
|
(dollars in thousands)
|
|||||||||||||||||||||||||||||||
|
Real estate - home equity
|
$
|
1,602,687
|
|
$
|
1,660,773
|
|
$
|
9,274
|
|
$
|
8,983
|
|
$
|
13,154
|
|
$
|
14,683
|
|
$
|
1,625,115
|
|
$
|
1,684,439
|
|
|||||||
|
Real estate - residential mortgage
|
1,557,995
|
|
1,329,371
|
|
20,344
|
|
18,305
|
|
23,655
|
|
28,484
|
|
1,601,994
|
|
1,376,160
|
|
|||||||||||||||
|
Real estate - construction - other
|
55,874
|
|
59,997
|
|
—
|
|
88
|
|
1,096
|
|
609
|
|
56,970
|
|
60,694
|
|
|||||||||||||||
|
Consumer - direct
|
93,572
|
|
94,262
|
|
1,752
|
|
2,254
|
|
1,563
|
|
2,203
|
|
96,887
|
|
98,719
|
|
|||||||||||||||
|
Consumer - indirect
|
190,656
|
|
166,823
|
|
3,599
|
|
2,809
|
|
328
|
|
237
|
|
194,583
|
|
169,869
|
|
|||||||||||||||
|
Total consumer
|
284,228
|
|
261,085
|
|
5,351
|
|
5,063
|
|
1,891
|
|
2,440
|
|
291,470
|
|
268,588
|
|
|||||||||||||||
|
Leasing, other and overdrafts
|
229,591
|
|
155,870
|
|
1,068
|
|
759
|
|
317
|
|
1,506
|
|
230,976
|
|
158,135
|
|
|||||||||||||||
|
Total
|
$
|
3,730,375
|
|
$
|
3,467,096
|
|
$
|
36,037
|
|
$
|
33,198
|
|
$
|
40,113
|
|
$
|
47,722
|
|
$
|
3,806,525
|
|
$
|
3,548,016
|
|
|||||||
|
% of Total
|
98.0
|
%
|
97.7
|
%
|
0.9
|
%
|
1.0
|
%
|
1.1
|
%
|
1.3
|
%
|
100.0
|
%
|
100.0
|
%
|
|||||||||||||||
(1)
Includes all accruing loans
30
days to
89
days past due.
(2)
Includes all accruing loans
90
days or more past due and all non-accrual loans.
The following table presents total non-performing assets as of
December 31
:
|
2016
|
2015
|
||||||
|
|
(in thousands)
|
||||||
|
Non-accrual loans
|
$
|
120,133
|
|
$
|
129,523
|
|
|
|
Loans 90 days or more past due and still accruing
|
11,505
|
|
15,291
|
|
|||
|
Total non-performing loans
|
131,638
|
|
144,814
|
|
|||
|
Other real estate owned
|
12,815
|
|
11,099
|
|
|||
|
Total non-performing assets
|
$
|
144,453
|
|
$
|
155,913
|
|
|
92
The following table presents past due status and non-accrual loans, by portfolio segment and class segment, as of
December 31
:
|
|
2016
|
||||||||||||||||||||||||||||||
|
|
30-59
Days Past Due |
60-89
Days Past Due |
≥ 90 Days
Past Due and Accruing |
Non-
accrual |
Total ≥ 90
Days |
Total Past
Due |
Current
|
Total
|
|||||||||||||||||||||||
|
|
(in thousands)
|
||||||||||||||||||||||||||||||
|
Real estate - commercial mortgage
|
$
|
6,254
|
|
$
|
1,622
|
|
$
|
383
|
|
$
|
38,936
|
|
$
|
39,319
|
|
$
|
47,195
|
|
$
|
5,971,387
|
|
$
|
6,018,582
|
|
|||||||
|
Commercial - secured
|
6,660
|
|
2,616
|
|
959
|
|
41,589
|
|
42,548
|
|
51,824
|
|
3,881,728
|
|
3,933,552
|
|
|||||||||||||||
|
Commercial - unsecured
|
898
|
|
35
|
|
152
|
|
760
|
|
912
|
|
1,845
|
|
152,089
|
|
153,934
|
|
|||||||||||||||
|
Total Commercial - industrial, financial and agricultural
|
7,558
|
|
2,651
|
|
1,111
|
|
42,349
|
|
43,460
|
|
53,669
|
|
4,033,817
|
|
4,087,486
|
|
|||||||||||||||
|
Real estate - home equity
|
6,596
|
|
2,678
|
|
2,543
|
|
10,611
|
|
13,154
|
|
22,428
|
|
1,602,687
|
|
1,625,115
|
|
|||||||||||||||
|
Real estate - residential mortgage
|
15,600
|
|
4,744
|
|
5,224
|
|
18,431
|
|
23,655
|
|
43,999
|
|
1,557,995
|
|
1,601,994
|
|
|||||||||||||||
|
Construction - commercial
|
743
|
|
—
|
|
—
|
|
435
|
|
435
|
|
1,178
|
|
643,312
|
|
644,490
|
|
|||||||||||||||
|
Construction - commercial residential
|
233
|
|
51
|
|
36
|
|
8,275
|
|
8,311
|
|
8,595
|
|
133,594
|
|
142,189
|
|
|||||||||||||||
|
Construction - other
|
—
|
|
—
|
|
—
|
|
1,096
|
|
1,096
|
|
1,096
|
|
55,874
|
|
56,970
|
|
|||||||||||||||
|
Total Real estate - construction
|
976
|
|
51
|
|
36
|
|
9,806
|
|
9,842
|
|
10,869
|
|
832,780
|
|
843,649
|
|
|||||||||||||||
|
Consumer - direct
|
1,211
|
|
541
|
|
1,563
|
|
—
|
|
1,563
|
|
3,315
|
|
93,572
|
|
96,887
|
|
|||||||||||||||
|
Consumer - indirect
|
3,200
|
|
399
|
|
328
|
|
—
|
|
328
|
|
3,927
|
|
190,656
|
|
194,583
|
|
|||||||||||||||
|
Total Consumer
|
4,411
|
|
940
|
|
1,891
|
|
—
|
|
1,891
|
|
7,242
|
|
284,228
|
|
291,470
|
|
|||||||||||||||
|
Leasing, other and overdrafts
|
543
|
|
525
|
|
317
|
|
—
|
|
317
|
|
1,385
|
|
229,591
|
|
230,976
|
|
|||||||||||||||
|
$
|
41,938
|
|
$
|
13,211
|
|
$
|
11,505
|
|
$
|
120,133
|
|
$
|
131,638
|
|
$
|
186,787
|
|
$
|
14,512,485
|
|
$
|
14,699,272
|
|
||||||||
|
|
2015
|
||||||||||||||||||||||||||||||
|
30-59
Days Past Due |
60-89
Days Past Due |
≥ 90 Days
Past Due and Accruing |
Non-
accrual |
Total ≥ 90
Days |
Total Past
Due |
Current
|
Total
|
||||||||||||||||||||||||
|
(in thousands)
|
|||||||||||||||||||||||||||||||
|
Real estate - commercial mortgage
|
$
|
6,469
|
|
$
|
1,312
|
|
$
|
439
|
|
$
|
40,731
|
|
$
|
41,170
|
|
$
|
48,951
|
|
$
|
5,413,379
|
|
$
|
5,462,330
|
|
|||||||
|
Commercial - secured
|
5,654
|
|
2,615
|
|
1,853
|
|
41,498
|
|
43,351
|
|
51,620
|
|
3,874,493
|
|
3,926,113
|
|
|||||||||||||||
|
Commercial - unsecured
|
510
|
|
83
|
|
19
|
|
701
|
|
720
|
|
1,313
|
|
161,536
|
|
162,849
|
|
|||||||||||||||
|
Total Commercial - industrial, financial and agricultural
|
6,164
|
|
2,698
|
|
1,872
|
|
42,199
|
|
44,071
|
|
52,933
|
|
4,036,029
|
|
4,088,962
|
|
|||||||||||||||
|
Real estate - home equity
|
6,438
|
|
2,545
|
|
3,473
|
|
11,210
|
|
14,683
|
|
23,666
|
|
1,660,773
|
|
1,684,439
|
|
|||||||||||||||
|
Real estate - residential mortgage
|
15,141
|
|
3,164
|
|
6,570
|
|
21,914
|
|
28,484
|
|
46,789
|
|
1,329,371
|
|
1,376,160
|
|
|||||||||||||||
|
Construction - commercial
|
50
|
|
176
|
|
—
|
|
638
|
|
638
|
|
864
|
|
559,127
|
|
559,991
|
|
|||||||||||||||
|
Construction - commercial residential
|
1,366
|
|
494
|
|
—
|
|
11,213
|
|
11,213
|
|
13,073
|
|
166,230
|
|
179,303
|
|
|||||||||||||||
|
Construction - other
|
88
|
|
—
|
|
416
|
|
193
|
|
609
|
|
697
|
|
59,997
|
|
60,694
|
|
|||||||||||||||
|
Total Real estate - construction
|
1,504
|
|
670
|
|
416
|
|
12,044
|
|
12,460
|
|
14,634
|
|
785,354
|
|
799,988
|
|
|||||||||||||||
|
Consumer - direct
|
1,687
|
|
567
|
|
2,203
|
|
—
|
|
2,203
|
|
4,457
|
|
94,262
|
|
98,719
|
|
|||||||||||||||
|
Consumer - indirect
|
2,308
|
|
501
|
|
237
|
|
—
|
|
237
|
|
3,046
|
|
166,823
|
|
169,869
|
|
|||||||||||||||
|
Total Consumer
|
3,995
|
|
1,068
|
|
2,440
|
|
—
|
|
2,440
|
|
7,503
|
|
261,085
|
|
268,588
|
|
|||||||||||||||
|
Leasing, other and overdrafts
|
483
|
|
276
|
|
81
|
|
1,425
|
|
1,506
|
|
2,265
|
|
155,870
|
|
158,135
|
|
|||||||||||||||
|
$
|
40,194
|
|
$
|
11,733
|
|
$
|
15,291
|
|
$
|
129,523
|
|
$
|
144,814
|
|
$
|
196,741
|
|
$
|
13,641,861
|
|
$
|
13,838,602
|
|
||||||||
93
The following table presents TDRs as of
December 31
:
|
2016
|
2015
|
||||||
|
|
(in thousands)
|
||||||
|
Real-estate - residential mortgage
|
$
|
27,617
|
|
$
|
28,511
|
|
|
|
Real-estate - commercial mortgage
|
15,957
|
|
17,563
|
|
|||
|
Construction - commercial residential
|
726
|
|
3,942
|
|
|||
|
Commercial - secured
|
6,564
|
|
5,833
|
|
|||
|
Real estate - home equity
|
8,594
|
|
4,556
|
|
|||
|
Commercial - unsecured
|
63
|
|
120
|
|
|||
|
Consumer - direct
|
20
|
|
19
|
|
|||
|
Consumer - indirect
|
19
|
|
14
|
|
|||
|
Total accruing TDRs
|
59,560
|
|
60,558
|
|
|||
|
Non-accrual TDRs
(1)
|
27,850
|
|
31,035
|
|
|||
|
Total TDRs
|
$
|
87,410
|
|
$
|
91,593
|
|
|
(1)
Included within non-accrual loans in the preceding table.
As of
December 31, 2016
and
2015
, there were $
3.6 million
and $
5.3 million
, respectively, of commitments to lend additional funds to borrowers whose loans were modified under TDRs.
94
The following table presents TDRs by class segment and type of concession for loans that were modified during the years ended December 31, 2016, 2015 and 2014:
|
2016
|
2015
|
2014
|
|||||||||||||||||||
|
Number of Loans
|
Post-Modification Recorded Investment
|
Number of Loans
|
Post-Modification Recorded Investment
|
Number of Loans
|
Post-Modification Recorded Investment
|
||||||||||||||||
|
(dollars in thousands)
|
|||||||||||||||||||||
|
Commercial – secured:
|
|||||||||||||||||||||
|
Extend maturity with rate concession
|
—
|
|
$
|
—
|
|
2
|
|
$
|
127
|
|
3
|
|
$
|
315
|
|
||||||
|
Extend maturity without rate concession
|
10
|
|
3,801
|
|
9
|
|
3,785
|
|
8
|
|
1,640
|
|
|||||||||
|
Commercial – unsecured:
|
|||||||||||||||||||||
|
Extend maturity without rate concession
|
2
|
|
103
|
|
1
|
|
38
|
|
—
|
|
—
|
|
|||||||||
|
Real estate - commercial mortgage:
|
|||||||||||||||||||||
|
Extend maturity with rate concession
|
—
|
|
—
|
|
5
|
|
2,014
|
|
1
|
|
60
|
|
|||||||||
|
Extend maturity without rate concession
|
—
|
|
—
|
|
4
|
|
639
|
|
7
|
|
6,781
|
|
|||||||||
|
Real estate - home equity:
|
|||||||||||||||||||||
|
Extend maturity with rate concession
|
—
|
|
—
|
|
2
|
|
36
|
|
—
|
|
—
|
|
|||||||||
|
Extend maturity without rate concession
|
89
|
|
4,484
|
|
3
|
|
203
|
|
—
|
|
—
|
|
|||||||||
|
Bankruptcy
|
47
|
|
2,671
|
|
52
|
|
2,501
|
|
30
|
|
1,551
|
|
|||||||||
|
Real estate – residential mortgage:
|
|||||||||||||||||||||
|
Extend maturity with rate concession
|
—
|
|
—
|
|
4
|
|
750
|
|
2
|
|
390
|
|
|||||||||
|
Extend maturity without rate concession
|
2
|
|
315
|
|
3
|
|
262
|
|
2
|
|
210
|
|
|||||||||
|
Bankruptcy
|
6
|
|
981
|
|
7
|
|
2,508
|
|
19
|
|
1,807
|
|
|||||||||
|
Construction - commercial residential:
|
|||||||||||||||||||||
|
Extend maturity without rate concession
|
—
|
|
—
|
|
1
|
|
1,535
|
|
3
|
|
3,616
|
|
|||||||||
|
Consumer - direct:
|
|||||||||||||||||||||
|
Bankruptcy
|
1
|
|
2
|
|
2
|
|
6
|
|
7
|
|
7
|
|
|||||||||
|
Consumer - indirect:
|
|||||||||||||||||||||
|
Bankruptcy
|
1
|
|
21
|
|
1
|
|
12
|
|
4
|
|
20
|
|
|||||||||
|
Total
|
158
|
|
$
|
12,378
|
|
96
|
|
$
|
14,416
|
|
86
|
|
$
|
16,397
|
|
||||||
The following table presents TDRs, by class segment, as of
December 31, 2016
,
2015
and 2014 that were modified during the years ended
December 31, 2016
,
2015
and 2014 and had a post-modification payment default during their respective year of modification. The Corporation defines a payment default as a single missed scheduled payment:
|
2016
|
2015
|
2014
|
||||||||||||||||||
|
Number of Loans
|
Recorded Investment
|
Number of Loans
|
Recorded Investment
|
Number of Loans
|
Recorded Investment
|
|||||||||||||||
|
(dollars in thousands)
|
||||||||||||||||||||
|
Construction - commercial residential
|
—
|
|
$
|
—
|
|
—
|
|
$
|
—
|
|
2
|
|
$
|
1,803
|
|
|||||
|
Real estate - commercial mortgage
|
1
|
|
118
|
|
4
|
|
359
|
|
2
|
|
1,660
|
|
||||||||
|
Real estate - residential mortgage
|
8
|
|
1,500
|
|
4
|
|
445
|
|
11
|
|
1,430
|
|
||||||||
|
Commercial - secured
|
6
|
|
2,497
|
|
8
|
|
3,549
|
|
4
|
|
1,208
|
|
||||||||
|
Commercial - unsecured
|
1
|
|
26
|
|
—
|
|
—
|
|
—
|
|
—
|
|
||||||||
|
Real estate - home equity
|
28
|
|
1,836
|
|
13
|
|
763
|
|
11
|
|
961
|
|
||||||||
|
Consumer - indirect
|
1
|
|
19
|
|
—
|
|
—
|
|
—
|
|
—
|
|
||||||||
|
Consumer - direct
|
—
|
|
—
|
|
—
|
|
—
|
|
1
|
|
1
|
|
||||||||
|
Total
|
45
|
|
$
|
5,996
|
|
29
|
|
$
|
5,116
|
|
31
|
|
$
|
7,063
|
|
|||||
95
|
|
||||
The following is a summary of premises and equipment as of
December 31
:
|
2016
|
2015
|
||||||
|
|
(in thousands)
|
||||||
|
Land
|
$
|
36,097
|
|
$
|
37,380
|
|
|
|
Buildings and improvements
|
293,836
|
|
297,018
|
|
|||
|
Furniture and equipment
|
137,282
|
|
136,029
|
|
|||
|
Construction in progress
|
21,096
|
|
16,585
|
|
|||
|
488,311
|
|
487,012
|
|
||||
|
Less: Accumulated depreciation and amortization
|
(270,505
|
)
|
(261,477
|
)
|
|||
|
$
|
217,806
|
|
$
|
225,535
|
|
||
|
|
||||
The following table summarizes the changes in goodwill:
|
2016
|
2015
|
||||||
|
|
(in thousands)
|
||||||
|
Goodwill
|
$
|
530,593
|
|
$
|
530,593
|
|
|
|
Non-amortizing intangible assets
|
963
|
|
963
|
|
|||
|
Balance at end of year
|
$
|
531,556
|
|
$
|
531,556
|
|
|
All of the Corporation’s reporting units passed the
2016
goodwill impairment test, resulting in
no
goodwill impairment charges in
2016
. All reporting units, with total allocated goodwill of
$530.6 million
, had fair values that exceeded net book values by approximately
62%
in the aggregate.
The estimated fair values of the Corporation’s reporting units are subject to uncertainty, including future changes in fair values of banks in general and future operating results of reporting units, which could differ significantly from the assumptions used in the valuation of reporting units.
Non-amortizing intangible assets consist of trade name intangible assets.
96
|
|
||||
The following table summarizes the changes in MSRs, which are included in other assets on the consolidated balance sheets:
|
2016
|
2015
|
||||||
|
|
(in thousands)
|
||||||
|
Amortized cost:
|
|||||||
|
Balance at beginning of year
|
$
|
40,944
|
|
$
|
42,148
|
|
|
|
Originations of mortgage servicing rights
|
5,485
|
|
6,166
|
|
|||
|
Amortization expense
|
(7,607
|
)
|
(7,370
|
)
|
|||
|
Balance at end of year
|
$
|
38,822
|
|
$
|
40,944
|
|
|
|
Valuation allowance:
|
|||||||
|
Balance at beginning of year
|
$
|
—
|
|
$
|
—
|
|
|
|
Net additions to the valuation allowance
|
(1,291
|
)
|
—
|
|
|||
|
Balance at end of year
|
$
|
(1,291
|
)
|
$
|
—
|
|
|
|
Net MSRs at end of year
|
$
|
37,531
|
|
$
|
40,944
|
|
|
MSRs represent the economic value of existing contractual rights to service mortgage loans that have been sold. Accordingly, actual and expected prepayments of the underlying mortgage loans can impact the value of MSRs. The Corporation accounts for MSRs at the lower of amortized cost or fair value.
The fair value of MSRs is estimated by discounting the estimated cash flows from servicing income, net of expense, over the expected life of the underlying loans at a discount rate commensurate with the risk associated with these assets. Expected life is based on the contractual terms of the loans, as adjusted for estimated prepayments. Based on a fair value analysis, the Corporation determined that net additions of
$1.3 million
to the valuation allowance were appropriate during
2016
.
No
valuation allowance was determined to be necessary as of
December 31, 2015
.
The estimated fair value of MSRs was
$38.2 million
and
$45.3 million
as of
December 31, 2016
and 2015, respectively.
Total MSR amortization expense, recognized as a reduction to mortgage banking income in the consolidated statements of income, was
$7.6 million
and
$7.4 million
in 2016 and 2015, respectively. Estimated MSR amortization expense for the next
five
years, based on balances as of
December 31, 2016
and the estimated remaining lives of the underlying loans, follows (in thousands):
|
Year
|
|
||
|
2017
|
$
|
6,538
|
|
|
2018
|
6,087
|
|
|
|
2019
|
5,590
|
|
|
|
2020
|
5,043
|
|
|
|
2021
|
4,443
|
|
|
|
|
||||
Deposits consisted of the following as of
December 31
:
|
2016
|
2015
|
||||||
|
|
(in thousands)
|
||||||
|
Noninterest-bearing demand
|
$
|
4,376,137
|
|
$
|
3,948,114
|
|
|
|
Interest-bearing demand
|
3,703,712
|
|
3,451,207
|
|
|||
|
Savings and money market accounts
|
4,179,773
|
|
3,868,046
|
|
|||
|
Time deposits
|
2,753,242
|
|
2,864,950
|
|
|||
|
Total Deposits
|
$
|
15,012,864
|
|
$
|
14,132,317
|
|
|
97
Included in time deposits were certificates of deposit equal to or greater than
$100,000
of
$1.2 billion
as of both
December 31, 2016
and
2015
. Time deposits of $250,000 or more were
$374.4 million
and
$359.9 million
as of
December 31, 2016
and
2015
, respectively. The scheduled maturities of time deposits as of
December 31, 2016
were as follows (in thousands):
|
Year
|
|
||
|
2017
|
$
|
1,333,954
|
|
|
2018
|
376,599
|
|
|
|
2019
|
665,027
|
|
|
|
2020
|
182,473
|
|
|
|
2021
|
105,934
|
|
|
|
Thereafter
|
89,255
|
|
|
|
$
|
2,753,242
|
|
|
|
|
||||
Short-term borrowings as of
December 31, 2016
,
2015
and
2014
and the related maximum amounts outstanding at the end of any month in each of the
three
years then ended are presented below. The securities underlying the repurchase agreements remain in available for sale investment securities.
|
|
December 31,
|
Maximum Outstanding
|
|||||||||||||||||||||
|
|
2016
|
2015
|
2014
|
2016
|
2015
|
2014
|
|||||||||||||||||
|
|
(in thousands)
|
||||||||||||||||||||||
|
Federal funds purchased
|
$
|
278,570
|
|
$
|
197,235
|
|
$
|
6,219
|
|
$
|
449,184
|
|
$
|
266,338
|
|
$
|
577,581
|
|
|||||
|
Short-term FHLB advances
(1)
|
—
|
|
110,000
|
|
70,000
|
|
—
|
|
200,000
|
|
600,000
|
|
|||||||||||
|
Customer repurchase agreements
|
195,734
|
|
111,496
|
|
158,394
|
|
221,989
|
|
212,509
|
|
244,729
|
|
|||||||||||
|
Customer short-term promissory notes
|
67,013
|
|
78,932
|
|
95,106
|
|
77,887
|
|
93,176
|
|
95,106
|
|
|||||||||||
|
$
|
541,317
|
|
$
|
497,663
|
|
$
|
329,719
|
|
|||||||||||||||
(1) Represents FHLB advances with an original maturity term of less than one year.
As of
December 31, 2016
, the Corporation had aggregate availability under Federal funds lines of
$1.1 billion
, with
$278.6 million
borrowed against that amount. A combination of commercial real estate loans, commercial loans and securities were pledged to the Federal Reserve Bank of Philadelphia to provide access to Federal Reserve Bank Discount Window borrowings. As of
December 31, 2016
and
2015
, the Corporation had
$1.2 billion
of collateralized borrowing availability at the Discount Window, and no outstanding borrowings.
The following table presents information related to customer repurchase agreements:
|
2016
|
2015
|
2014
|
|||||||||
|
|
(dollars in thousands)
|
||||||||||
|
Amount outstanding as of December 31
|
$
|
195,734
|
|
$
|
111,496
|
|
$
|
158,394
|
|
||
|
Weighted average interest rate as of December 31
|
0.10
|
%
|
0.15
|
%
|
0.13
|
%
|
|||||
|
Average amount outstanding during the year
|
$
|
184,978
|
|
$
|
161,093
|
|
$
|
197,432
|
|
||
|
Weighted average interest rate during the year
|
0.11
|
%
|
0.10
|
%
|
0.10
|
%
|
|||||
FHLB advances with an original maturity of one year or more and long-term debt included the following as of December 31:
|
2016
|
2015
|
||||||
|
|
(in thousands)
|
||||||
|
FHLB advances
|
$
|
567,240
|
|
$
|
587,756
|
|
|
|
Subordinated debt
|
350,000
|
|
350,000
|
|
|||
|
Junior subordinated deferrable interest debentures
|
16,496
|
|
16,496
|
|
|||
|
Unamortized discounts and issuance costs
|
(4,333
|
)
|
(4,710
|
)
|
|||
|
$
|
929,403
|
|
$
|
949,542
|
|
||
98
Excluded from the preceding table is the Parent Company’s revolving line of credit with its subsidiary banks. As of
December 31, 2016
and
2015
, there were no amounts outstanding under this line of credit. This line of credit, with a total commitment of
$75.0 million
, is secured by equity securities and insurance investments and bears interest at London Interbank Offered Rate ("LIBOR") for maturities of one month plus
2.00%
. The amount that the Corporation is permitted to borrow under this commitment at any given time is subject to a formula based on a percentage of the value of the collateral pledged. Although balances drawn on the line of credit and related interest income and expense are eliminated in the consolidated financial statements, this borrowing arrangement is senior to the subordinated debt and the junior subordinated deferrable interest debentures.
FHLB advances mature through March 2027 and carry a weighted average interest rate of
2.50%
. As of
December 31, 2016
, the Corporation had an additional borrowing capacity of approximately
$3.1 billion
with the FHLB. Advances from the FHLB are secured by FHLB stock, qualifying residential mortgages, investments and other assets.
The following table summarizes the scheduled maturities of FHLB advances with an original maturity of one year or more and long-term debt as of
December 31, 2016
(in thousands):
|
Year
|
|
||
|
2017
|
$
|
114,415
|
|
|
2018
|
—
|
|
|
|
2019
|
202,731
|
|
|
|
2020
|
142,370
|
|
|
|
2021
|
199,444
|
|
|
|
Thereafter
|
270,443
|
|
|
|
$
|
929,403
|
|
|
In
June 2015
, the Corporation issued
$150.0 million
of
ten
-year subordinated notes, which mature on
November 15, 2024
and carry a fixed rate of
4.50%
and an effective rate of approximately
4.69%
as a result of discounts and issuance costs. Interest is paid semi-annually in
May
and
November
. In
November 2014
, the Corporation issued
$100.0 million
of
ten
-year subordinated notes, which mature on
November 15, 2024
and carry a fixed rate of
4.50%
and an effective rate of approximately
4.87%
as a result of discounts and issuance costs. Interest is paid semi-annually in
May
and
November
. In
May 2007
, the Corporation issued
$100.0 million
of
ten
-year subordinated notes, which mature on
May 1, 2017
and carry a fixed rate of
5.75%
and an effective rate of approximately
5.96%
as a result of discounts and issuance costs. Interest is paid semi-annually in
May
and
November
.
During the third quarter of 2015,
$150.0 million
of TruPS, with a scheduled maturity of February 1, 2036 and an effective rate of approximately
6.52%
, were redeemed. As a result of this transaction, the Corporation recorded a
$5.6 million
loss on redemption, included as a component of non-interest expense. The loss on redemption consisted of
$1.8 million
of unamortized issuance costs and
$2.5 million
, net of a
$1.3 million
tax effect, of unamortized losses on a cash flow hedge recorded in accumulated other comprehensive income.
As of December 31, 2016, the Parent Company owned all of the common stock of
three
subsidiary trusts, which have issued TruPS in conjunction with the Parent Company issuing junior subordinated deferrable interest debentures to the trusts. The TruPS are redeemable on specified dates, or earlier if certain events arise.
The following table provides details of the debentures as of
December 31, 2016
(dollars in thousands):
|
Debentures Issued to
|
Fixed/
Variable |
Interest
Rate |
Amount
|
Maturity
|
Callable
|
Call Price
|
||||||||
|
Columbia Bancorp Statutory Trust
|
Variable
|
3.49
|
%
|
$
|
6,186
|
|
06/30/34
|
03/31/17
|
100.0
|
|||||
|
Columbia Bancorp Statutory Trust II
|
Variable
|
2.85
|
%
|
4,124
|
|
03/15/35
|
03/31/17
|
100.0
|
||||||
|
Columbia Bancorp Statutory Trust III
|
Variable
|
2.73
|
%
|
6,186
|
|
06/15/35
|
03/31/17
|
100.0
|
||||||
|
$
|
16,496
|
|
||||||||||||
99
|
|
||||
The following table presents the notional amounts and fair values of derivative financial instruments as of
December 31
:
|
|
2016
|
2015
|
|||||||||||||
|
|
Notional
Amount |
Asset
(Liability) Fair Value |
Notional
Amount |
Asset
(Liability) Fair Value |
|||||||||||
|
|
(in thousands)
|
||||||||||||||
|
Interest Rate Locks with Customers
|
|||||||||||||||
|
Positive fair values
|
$
|
87,119
|
|
$
|
863
|
|
$
|
87,781
|
|
$
|
1,291
|
|
|||
|
Negative fair values
|
18,239
|
|
(227
|
)
|
267
|
|
(16
|
)
|
|||||||
|
Net interest rate locks with customers
|
636
|
|
1,275
|
|
|||||||||||
|
Forward Commitments
|
|||||||||||||||
|
Positive fair values
|
70,031
|
|
2,223
|
|
69,045
|
|
205
|
|
|||||||
|
Negative fair values
|
19,964
|
|
(112
|
)
|
16,193
|
|
(24
|
)
|
|||||||
|
Net forward commitments
|
2,111
|
|
181
|
|
|||||||||||
|
Interest Rate Swaps with Customers
|
|||||||||||||||
|
Positive fair values
|
876,744
|
|
24,397
|
|
846,490
|
|
32,915
|
|
|||||||
|
Negative fair values
|
583,060
|
|
(16,998
|
)
|
8,757
|
|
(55
|
)
|
|||||||
|
Net interest rate swaps with customers
|
7,399
|
|
32,860
|
|
|||||||||||
|
Interest Rate Swaps with Dealer Counterparties
|
|||||||||||||||
|
Positive fair values
|
583,060
|
|
16,998
|
|
8,757
|
|
55
|
|
|||||||
|
Negative fair values
|
876,744
|
|
(24,397
|
)
|
846,490
|
|
(32,915
|
)
|
|||||||
|
Net interest rate swaps with dealer counterparties
|
(7,399
|
)
|
(32,860
|
)
|
|||||||||||
|
Foreign Exchange Contracts with Customers
|
|||||||||||||||
|
Positive fair values
|
11,674
|
|
504
|
|
4,897
|
|
114
|
|
|||||||
|
Negative fair values
|
4,659
|
|
(221
|
)
|
8,050
|
|
(184
|
)
|
|||||||
|
Net foreign exchange contracts with customers
|
283
|
|
(70
|
)
|
|||||||||||
|
Foreign Exchange Contracts with Correspondent Banks
|
|||||||||||||||
|
Positive fair values
|
7,040
|
|
241
|
|
9,728
|
|
428
|
|
|||||||
|
Negative fair values
|
12,869
|
|
(447
|
)
|
6,899
|
|
(147
|
)
|
|||||||
|
Net foreign exchange contracts with correspondent banks
|
(206
|
)
|
281
|
|
|||||||||||
|
Net derivative fair value asset
|
$
|
2,824
|
|
$
|
1,667
|
|
|||||||||
The following table presents the fair value gains and losses on derivative financial instruments for the years ended December 31:
|
|
2016
|
2015
|
2014
|
Statement of Income Classification
|
|||||||||
|
(in thousands)
|
|
||||||||||||
|
Interest rate locks with customers
|
$
|
(639
|
)
|
$
|
(110
|
)
|
$
|
577
|
|
Mortgage banking income
|
|||
|
Forward commitments
|
1,930
|
|
1,345
|
|
(2,422
|
)
|
Mortgage banking income
|
||||||
|
Interest rate swaps with customers
|
(25,461
|
)
|
13,342
|
|
20,406
|
|
Other non-interest expense
|
||||||
|
Interest rate swaps with counterparties
|
25,461
|
|
(13,342
|
)
|
(20,406
|
)
|
Other non-interest expense
|
||||||
|
Foreign exchange contracts with customers
|
353
|
|
(439
|
)
|
688
|
|
Other service charges and fees
|
||||||
|
Foreign exchange contracts with correspondent banks
|
(487
|
)
|
711
|
|
(880
|
)
|
Other service charges and fees
|
||||||
|
Net fair value gains (losses) on derivative financial instruments
|
$
|
1,157
|
|
$
|
1,507
|
|
$
|
(2,037
|
)
|
||||
100
The Corporation has elected to record mortgage loans held for sale at fair value. The following table presents a summary of mortgage loans held for sale and the impact of the fair value election on the consolidated financial statements as of and for the years ended
December 31, 2016
and
2015
:
|
Cost (1)
|
Fair Value
|
Balance Sheet
Classification |
Fair Value Loss
|
Statement of Income Classification
|
|||||||||||
|
|
(in thousands)
|
||||||||||||||
|
December 31, 2016:
|
|||||||||||||||
|
Mortgage loans held for sale
|
$
|
28,708
|
|
$
|
28,697
|
|
Loans held for sale
|
$
|
(313
|
)
|
Mortgage banking income
|
||||
|
December 31, 2015:
|
|||||||||||||||
|
Mortgage loans held for sale
|
16,584
|
|
16,886
|
|
Loans held for sale
|
(140
|
)
|
Mortgage banking income
|
|||||||
|
(1)
|
Cost basis of mortgage loans held for sale represents the unpaid principal balance.
|
The fair values of interest rate swap agreements and foreign exchange contracts the Corporation enters into with customers and dealer counterparties may be eligible for offset on the consolidated balance sheets as they are subject to master netting arrangements or similar agreements. The Corporation elects to not offset assets and liabilities subject to such arrangements on the consolidated financial statements. The following table presents the financial instruments that are eligible for offset, and the effects of offsetting, on the consolidated balance sheets as of December 31:
|
Gross Amounts
|
Gross Amounts Not Offset
|
||||||||||||||
|
Recognized
|
on the Consolidated
|
||||||||||||||
|
on the
|
Balance Sheets
|
||||||||||||||
|
Consolidated
|
Financial
|
Cash
|
Net
|
||||||||||||
|
Balance Sheets
|
Instruments (1)
|
Collateral (2)
|
Amount
|
||||||||||||
|
(in thousands)
|
|||||||||||||||
|
2016
|
|||||||||||||||
|
Interest rate swap derivative assets
|
$
|
41,395
|
|
$
|
(15,117
|
)
|
$
|
—
|
|
$
|
26,278
|
|
|||
|
Foreign exchange derivative assets with correspondent banks
|
241
|
|
(241
|
)
|
—
|
|
—
|
|
|||||||
|
Total
|
$
|
41,636
|
|
$
|
(15,358
|
)
|
$
|
—
|
|
$
|
26,278
|
|
|||
|
Interest rate swap derivative liabilities
|
$
|
41,395
|
|
$
|
(15,117
|
)
|
$
|
(4,010
|
)
|
$
|
22,268
|
|
|||
|
Foreign exchange derivative liabilities with correspondent banks
|
447
|
|
(241
|
)
|
(206
|
)
|
—
|
|
|||||||
|
Total
|
$
|
41,842
|
|
$
|
(15,358
|
)
|
$
|
(4,216
|
)
|
$
|
22,268
|
|
|||
|
2015
|
|||||||||||||||
|
Interest rate swap derivative assets
|
$
|
32,970
|
|
$
|
(55
|
)
|
$
|
—
|
|
$
|
32,915
|
|
|||
|
Foreign exchange derivative assets with correspondent banks
|
428
|
|
(147
|
)
|
—
|
|
281
|
|
|||||||
|
Total
|
$
|
33,398
|
|
$
|
(202
|
)
|
$
|
—
|
|
$
|
33,196
|
|
|||
|
Interest rate swap derivative liabilities
|
$
|
32,970
|
|
$
|
(55
|
)
|
$
|
(31,130
|
)
|
$
|
1,785
|
|
|||
|
Foreign exchange derivative liabilities with correspondent banks
|
147
|
|
(147
|
)
|
—
|
|
—
|
|
|||||||
|
Total
|
$
|
33,117
|
|
$
|
(202
|
)
|
$
|
(31,130
|
)
|
$
|
1,785
|
|
|||
|
(1)
|
For interest rate swap assets, amounts represent any derivative liability fair values that could be offset in the event of counterparty or customer default. For interest rate swap liabilities, amounts represent any derivative asset fair values that could be offset in the event of counterparty or customer default.
|
|
(2)
|
Amounts represent cash collateral posted on interest rate swap transactions and foreign exchange contracts with financial institution counterparties. Interest rate swaps with customers are collateralized by the underlying loans to those borrowers. Cash and securities collateral amounts are included in the table only to the extent of the net derivative fair values.
|
|
|
||||
Regulatory Capital Requirements
The Corporation’s subsidiary banks are subject to regulatory capital requirements administered by banking regulators. Failure to meet minimum capital requirements can trigger certain mandatory – and possibly additional discretionary – actions by regulators that, if undertaken, could have a direct material effect on the Corporation’s financial statements. Under capital adequacy guidelines and the regulatory framework for prompt corrective action, the subsidiary banks must meet specific capital guidelines that involve quantitative measures of the subsidiary banks’ assets, liabilities, and certain off-balance sheet items as calculated under regulatory
101
accounting practices. The subsidiary banks’ capital amounts and classification are also subject to qualitative judgments by the regulators about components, risk weightings, and other factors.
U.S. Basel III Capital Rules
In July 2013, the Federal Reserve Board approved final rules (the "U.S. Basel III Capital Rules") establishing a new comprehensive capital framework for U.S. banking organizations and implementing the Basel Committee on Banking Supervision's December 2010 framework for strengthening international capital standards. The U.S. Basel III Capital Rules substantially revise the risk-based capital requirements applicable to bank holding companies and depository institutions.
The minimum regulatory capital requirements established by the U.S. Basel III Capital Rules became effective for the Corporation on January 1, 2015, and become fully phased in on January 1, 2019.
When fully phased in, the U.S. Basel III Capital Rules will require the Corporation and its bank subsidiaries to:
|
•
|
Meet a minimum Common Equity Tier 1 capital ratio of 4.50% of risk-weighted assets and a minimum Tier 1 capital of 6.00% of risk-weighted assets;
|
|
•
|
Continue to require a minimum Total capital ratio of 8.00% of risk-weighted assets and a minimum Tier 1 leverage capital ratio of 4.00% of average assets;
|
|
•
|
Maintain a "capital conservation buffer" of 2.50% above the minimum risk-based capital requirements, which must be maintained to avoid restrictions on capital distributions and certain discretionary bonus payments; and
|
|
•
|
Comply with a revised definition of capital to improve the ability of regulatory capital instruments to absorb losses. Certain non-qualifying capital instruments, including cumulative preferred stock and TruPS, will be excluded as a component of Tier 1 capital for institutions of the Corporation's size.
|
The U.S. Basel III Capital Rules use a standardized approach for risk weightings that expand the risk-weightings for assets and off-balance sheet exposures from the previous 0%, 20%, 50% and 100% categories to a much larger and more risk-sensitive number of categories, depending on the nature of the assets and off-balance sheet exposures, resulting in higher risk weights for a variety of asset categories.
When fully phased in on January 1, 2019, the Corporation and its bank subsidiaries will also be required to maintain a "capital conservation buffer" of 2.50% above the minimum risk-based capital requirements. The required minimum capital conservation buffer began to be phased in incrementally, starting at 0.625%, on January 1, 2016, and increasing to 1.25% on January 1, 2017, and will continue to increase to 1.875% on January 1, 2018 and 2.50% on January 1, 2019. The rules provide that the failure to maintain the "capital conservation buffer" will result in restrictions on capital distributions and discretionary cash bonus payments to executive officers. As a result, under the U.S. Basel III Capital Rules, if any of the Corporation's bank subsidiaries fails to maintain the required minimum capital conservation buffer, the Corporation will be subject to limits, and possibly prohibitions, on its ability to obtain capital distributions from such subsidiaries. If the Corporation does not receive sufficient cash dividends from its bank subsidiaries, it may not have sufficient funds to pay dividends on its capital stock, service its debt obligations or repurchase its common stock. In addition, the restrictions on payments of discretionary cash bonuses to executive officers may make it more difficult for the Corporation to retain key personnel.
As of
December 31, 2016
, the Corporation believes its current capital levels would meet the fully phased-in minimum capital
requirements, including the new capital conservation buffers, as prescribed in the U.S. Basel III Capital Rules.
As of
December 31, 2016
and
2015
, each of the Corporation’s subsidiary banks was well capitalized under the regulatory framework for prompt corrective action based on their capital ratio calculations. To be categorized as well capitalized, these banks must maintain minimum total risk-based, Tier I risk-based, Common Equity Tier I risk-based and Tier I leverage ratios as set forth in the following table. There are no conditions or events since
December 31, 2016
that management believes have changed the institutions’ categories.
102
The following table presents the Total risk-based, Tier I risk-based, Common Equity Tier I risk-based and Tier I leverage requirements for the Corporation and its
four
significant subsidiaries with total assets in excess of
$1 billion
, as of
December 31, 2016
, under the U.S. Basel III Capital Rules:
|
2016
|
||||||||||||||||||||
|
Actual
|
For Capital
Adequacy Purposes |
Well Capitalized
|
||||||||||||||||||
|
|
Amount
|
Ratio
|
Amount
|
Ratio
|
Amount
|
Ratio
|
||||||||||||||
|
|
(dollars in thousands)
|
|||||||||||||||||||
|
Total Capital (to Risk-Weighted Assets):
|
||||||||||||||||||||
|
Corporation
|
$
|
2,074,526
|
|
13.2
|
%
|
$
|
1,255,292
|
|
8.0
|
%
|
N/A
|
|
N/A
|
|
||||||
|
Fulton Bank, N.A.
|
1,142,326
|
|
12.2
|
|
747,359
|
|
8.0
|
|
$
|
934,199
|
|
10.0
|
%
|
|||||||
|
Fulton Bank of New Jersey
|
385,807
|
|
13.1
|
|
234,782
|
|
8.0
|
|
293,427
|
|
10.0
|
|
||||||||
|
The Columbia Bank
|
203,890
|
|
12.2
|
|
133,836
|
|
8.0
|
|
167,294
|
|
10.0
|
|
||||||||
|
Lafayette Ambassador Bank
|
175,254
|
|
14.6
|
|
96,100
|
|
8.0
|
|
120,125
|
|
10.0
|
|
||||||||
|
Tier I Capital (to Risk-Weighted Assets):
|
||||||||||||||||||||
|
Corporation
|
$
|
1,637,150
|
|
10.4
|
%
|
$
|
941,469
|
|
6.0
|
%
|
N/A
|
|
N/A
|
|
||||||
|
Fulton Bank, N.A
|
1,050,175
|
|
11.2
|
|
560,519
|
|
6.0
|
|
$
|
747,359
|
|
8.0
|
%
|
|||||||
|
Fulton Bank of New Jersey
|
348,992
|
|
11.9
|
|
176,086
|
|
6.0
|
|
234,782
|
|
8.0
|
|
||||||||
|
The Columbia Bank
|
185,983
|
|
11.1
|
|
100,377
|
|
6.0
|
|
133,836
|
|
8.0
|
|
||||||||
|
Lafayette Ambassador Bank
|
166,186
|
|
13.8
|
|
72,075
|
|
6.0
|
|
96,100
|
|
8.0
|
|
||||||||
|
Common Equity Tier I Capital (to Risk-weighted Assets):
|
||||||||||||||||||||
|
Corporation
|
$
|
1,637,150
|
|
10.4
|
%
|
$
|
706,102
|
|
4.5
|
%
|
N/A
|
N/A
|
||||||||
|
Fulton Bank, N.A
|
1,006,175
|
|
10.8
|
|
420,389
|
|
4.5
|
|
$
|
607,229
|
|
6.5
|
%
|
|||||||
|
Fulton Bank of New Jersey
|
348,992
|
|
11.9
|
|
132,065
|
|
4.5
|
|
190,760
|
|
6.5
|
|
||||||||
|
The Columbia Bank
|
185,983
|
|
11.1
|
|
72,282
|
|
4.5
|
|
108,741
|
|
6.5
|
|
||||||||
|
Lafayette Ambassador Bank
|
166,186
|
|
13.8
|
|
54,056
|
|
4.5
|
|
78,081
|
|
6.5
|
|
||||||||
|
Tier I Capital (to Average Assets):
|
||||||||||||||||||||
|
Corporation
|
$
|
1,637,150
|
|
9.0
|
%
|
$
|
727,745
|
|
4.0
|
%
|
N/A
|
|
N/A
|
|
||||||
|
Fulton Bank, N.A
|
1,050,175
|
|
10.1
|
|
415,981
|
|
4.0
|
|
$
|
519,977
|
|
5.0
|
%
|
|||||||
|
Fulton Bank of New Jersey
|
348,992
|
|
9.4
|
|
148,472
|
|
4.0
|
|
185,590
|
|
5.0
|
|
||||||||
|
The Columbia Bank
|
185,983
|
|
8.6
|
|
86,310
|
|
4.0
|
|
107,888
|
|
5.0
|
|
||||||||
|
Lafayette Ambassador Bank
|
166,186
|
|
10.9
|
|
61,129
|
|
4.0
|
|
76,412
|
|
5.0
|
|
||||||||
N/A – Not applicable as "well capitalized" applies to banks only.
103
The following table presents the Total risk-based, Tier I risk-based and Tier I leverage requirements as of
December 31, 2015
, under U.S. Basel III Capital Rules:
|
2015
|
||||||||||||||||||||
|
Actual
|
For Capital
Adequacy Purposes |
Well Capitalized
|
||||||||||||||||||
|
Amount
|
Ratio
|
Amount
|
Ratio
|
Amount
|
Ratio
|
|||||||||||||||
|
(dollars in thousands)
|
||||||||||||||||||||
|
Total Capital (to Risk-Weighted Assets):
|
||||||||||||||||||||
|
Corporation
|
$
|
1,997,926
|
|
13.2
|
%
|
$
|
1,214,868
|
|
8.0
|
%
|
N/A
|
|
N/A
|
|
||||||
|
Fulton Bank, N.A.
|
1,088,709
|
|
12.2
|
|
714,734
|
|
8.0
|
|
$
|
893,418
|
|
10.0
|
%
|
|||||||
|
Fulton Bank of New Jersey
|
373,465
|
|
12.6
|
|
236,691
|
|
8.0
|
|
295,864
|
|
10.0
|
|
||||||||
|
The Columbia Bank
|
211,355
|
|
13.7
|
|
123,260
|
|
8.0
|
|
154,075
|
|
10.0
|
|
||||||||
|
Lafayette Ambassador Bank
|
172,345
|
|
14.1
|
|
97,792
|
|
8.0
|
|
122,240
|
|
10.0
|
|
||||||||
|
Tier I Capital (to Risk-Weighted Assets):
|
||||||||||||||||||||
|
Corporation
|
$
|
1,544,495
|
|
10.2
|
%
|
$
|
911,151
|
|
6.0
|
%
|
N/A
|
|
N/A
|
|
||||||
|
Fulton Bank, N.A
|
1,000,603
|
|
11.2
|
|
536,051
|
|
6.0
|
|
$
|
714,734
|
|
8.0
|
%
|
|||||||
|
Fulton Bank of New Jersey
|
336,319
|
|
11.4
|
|
177,518
|
|
6.0
|
|
236,691
|
|
8.0
|
|
||||||||
|
The Columbia Bank
|
192,090
|
|
12.5
|
|
92,445
|
|
6.0
|
|
123,260
|
|
8.0
|
|
||||||||
|
Lafayette Ambassador Bank
|
162,092
|
|
13.3
|
|
73,344
|
|
6.0
|
|
97,792
|
|
8.0
|
|
||||||||
|
Common Equity Tier I Capital (to Risk-weighted Assets):
|
||||||||||||||||||||
|
Corporation
|
$
|
1,541,214
|
|
10.2
|
%
|
$
|
683,363
|
|
4.5
|
%
|
N/A
|
|
N/A
|
|
||||||
|
Fulton Bank, N.A
|
956,603
|
|
10.7
|
|
402,038
|
|
4.5
|
|
$
|
580,721
|
|
6.5
|
%
|
|||||||
|
Fulton Bank of New Jersey
|
336,319
|
|
11.4
|
|
133,139
|
|
4.5
|
|
192,311
|
|
6.5
|
|
||||||||
|
The Columbia Bank
|
192,090
|
|
12.5
|
|
69,334
|
|
4.5
|
|
100,149
|
|
6.5
|
|
||||||||
|
Lafayette Ambassador Bank
|
162,092
|
|
13.3
|
|
55,008
|
|
4.5
|
|
79,456
|
|
6.5
|
|
||||||||
|
Tier I Capital (to Average Assets):
|
||||||||||||||||||||
|
Corporation
|
$
|
1,544,495
|
|
9.0
|
%
|
$
|
688,500
|
|
4.0
|
%
|
N/A
|
|
N/A
|
|
||||||
|
Fulton Bank, N.A
|
1,000,603
|
|
10.2
|
|
391,783
|
|
4.0
|
|
$
|
489,729
|
|
5.0
|
%
|
|||||||
|
Fulton Bank of New Jersey
|
336,319
|
|
9.5
|
|
141,257
|
|
4.0
|
|
176,572
|
|
5.0
|
|
||||||||
|
The Columbia Bank
|
192,090
|
|
9.7
|
|
79,618
|
|
4.0
|
|
99,523
|
|
5.0
|
|
||||||||
|
Lafayette Ambassador Bank
|
162,092
|
|
11.0
|
|
59,152
|
|
4.0
|
|
73,940
|
|
5.0
|
|
||||||||
N/A – Not applicable as "well capitalized" applies to banks only.
Dividend and Loan Limitations
The dividends that may be paid by subsidiary banks to the Parent Company are subject to certain legal and regulatory limitations. Dividend limitations vary, depending on the subsidiary bank’s charter and primary regulator and whether or not it is a member of the Federal Reserve System. Generally, subsidiaries are prohibited from paying dividends when doing so would cause them to fall below the regulatory minimum capital levels. Additionally, limits may exist on paying dividends in excess of net income for specified periods. The total amount available for payment of dividends by subsidiary banks was approximately
$233 million
as of
December 31, 2016
, based on the subsidiary banks maintaining enough capital to be considered well capitalized under the U.S. Basel III Capital Rules.
Under current Federal Reserve regulations, the subsidiary banks are limited in the amount they may loan to their affiliates, including the Parent Company. Loans to a single affiliate may not exceed
10%
, and the aggregate of loans to all affiliates may not exceed
20%
of each bank subsidiary’s regulatory capital.
104
|
|
||||
The components of the provision for income taxes are as follows:
|
2016
|
2015
|
2014
|
|||||||||
|
|
(in thousands)
|
||||||||||
|
Current tax expense:
|
|
|
|
||||||||
|
Federal
|
$
|
33,872
|
|
$
|
34,455
|
|
$
|
32,957
|
|
||
|
State
|
1,698
|
|
2,042
|
|
1,126
|
|
|||||
|
|
35,570
|
|
36,497
|
|
34,083
|
|
|||||
|
Deferred tax expense:
|
|
|
|
|
|
|
|||||
|
Federal
|
7,968
|
|
12,752
|
|
18,523
|
|
|||||
|
State
|
3,086
|
|
672
|
|
—
|
|
|||||
|
|
11,054
|
|
13,424
|
|
18,523
|
|
|||||
|
Income tax expense
|
$
|
46,624
|
|
$
|
49,921
|
|
$
|
52,606
|
|
||
The differences between the effective income tax rate and the federal statutory income tax rate are as follows:
|
2016
|
2015
|
2014
|
||||||
|
Statutory tax rate
|
35.0
|
%
|
35.0
|
%
|
35.0
|
%
|
||
|
Tax credit investments
|
(7.0
|
)
|
(5.2
|
)
|
(4.9
|
)
|
||
|
Tax-exempt income
|
(6.5
|
)
|
(6.0
|
)
|
(5.4
|
)
|
||
|
State income taxes, net of federal benefit
|
1.2
|
|
1.9
|
|
1.2
|
|
||
|
Bank owned life insurance
|
(0.6
|
)
|
(0.6
|
)
|
(0.5
|
)
|
||
|
Change in valuation allowance
|
0.3
|
|
(0.9
|
)
|
(0.8
|
)
|
||
|
Executive compensation
|
0.1
|
|
0.1
|
|
0.1
|
|
||
|
Other, net
|
(0.1
|
)
|
0.7
|
|
(0.3
|
)
|
||
|
Effective income tax rate
|
22.4
|
%
|
25.0
|
%
|
24.4
|
%
|
||
105
The net deferred tax asset recorded by the Corporation is included in other assets and consists of the following tax effects of temporary differences as of
December 31
:
|
2016
|
2015
|
||||||
|
|
(in thousands)
|
||||||
|
Deferred tax assets:
|
|||||||
|
Allowance for credit losses
|
$
|
62,726
|
|
$
|
62,846
|
|
|
|
Postretirement and defined benefit plans
|
12,659
|
|
13,070
|
|
|||
|
Unrealized holding losses on securities available for sale
|
12,260
|
|
3,250
|
|
|||
|
Deferred compensation
|
12,017
|
|
11,839
|
|
|||
|
State loss carryforwards
|
9,820
|
|
11,170
|
|
|||
|
Other accrued expenses
|
9,520
|
|
7,142
|
|
|||
|
Other-than-temporary impairment of investments
|
5,187
|
|
5,501
|
|
|||
|
Other
|
8,500
|
|
10,165
|
|
|||
|
Total gross deferred tax assets
|
132,689
|
|
124,983
|
|
|||
|
Deferred tax liabilities:
|
|||||||
|
Direct leasing
|
27,663
|
|
20,309
|
|
|||
|
Mortgage servicing rights
|
13,369
|
|
14,582
|
|
|||
|
Acquisition premiums/discounts
|
9,167
|
|
8,897
|
|
|||
|
Premises and equipment
|
5,625
|
|
5,955
|
|
|||
|
Intangible assets
|
1,810
|
|
1,614
|
|
|||
|
Other
|
12,530
|
|
9,593
|
|
|||
|
Total gross deferred tax liabilities
|
70,164
|
|
60,950
|
|
|||
|
Net deferred tax asset, before valuation allowance
|
62,525
|
|
64,033
|
|
|||
|
Valuation allowance
|
(8,950
|
)
|
(8,359
|
)
|
|||
|
Net deferred tax asset
|
$
|
53,575
|
|
$
|
55,674
|
|
|
In assessing the realizability of deferred tax assets, management considers whether it is more likely than not that some or all of the deferred tax assets will not be realized. The ultimate realization of deferred tax assets is dependent upon the generation of future taxable income and/or capital gain income during periods in which those temporary differences become deductible. Management considers the scheduled reversal of deferred tax liabilities, projected future taxable income and tax planning strategies, such as those that may be implemented to generate capital gains, in making this assessment.
The valuation allowance relates to state deferred tax assets and net operating loss carryforwards for which realizability is uncertain.
As of
December 31, 2016
and
2015
, the Corporation had state net operating loss carryforwards of approximately
$391 million
and
$424 million
, respectively, which are available to offset future state taxable income, and expire at various dates through
2036
.
The Corporation has
$5.0 million
of deferred tax assets resulting from unrealized other-than-temporary impairment losses on investment securities, which would be characterized as capital losses for tax purposes. If realized, the income tax benefits of these potential capital losses can only be recognized for tax purposes to the extent of capital gains generated during carryback and carryforward periods. Other deferred tax assets include
$2.5 million
related to realized capital losses on sales of investment securities that have not been deducted on tax returns as there were no capital gains available for offset in the current or carryback periods. These losses will begin to expire in
2018
. If sufficient capital gains are not realized during this period, some or all of this deferred tax asset may need to be written off through a charge to income tax expense. The Corporation currently believes that it has the ability to generate sufficient offsetting capital gains in future periods through the execution of certain tax planning strategies, which may include the sale and leaseback of some or all of its branch and office properties. As such, no valuation allowance for the deferred tax assets related to the realized or unrealized capital losses is considered to be necessary as of
December 31, 2016
.
Based on the level of historical taxable income and projections for future taxable income over the periods in which the deferred tax assets are deductible, management believes it is more likely than not that the Corporation will realize the benefits of its deferred tax assets, net of the valuation allowance, as of
December 31, 2016
.
106
Uncertain Tax Positions
The following summarizes the changes in unrecognized tax benefits for the years ended
December 31
:
|
2016
|
2015
|
2014
|
|||||||||
|
(in thousands)
|
|||||||||||
|
Balance at beginning of year
|
$
|
2,373
|
|
$
|
1,944
|
|
$
|
1,651
|
|
||
|
Prior period tax positions
|
—
|
|
—
|
|
188
|
|
|||||
|
Current period tax positions
|
456
|
|
492
|
|
269
|
|
|||||
|
Lapse of statute of limitations
|
(391
|
)
|
(63
|
)
|
(164
|
)
|
|||||
|
Balance at end of year
|
$
|
2,438
|
|
$
|
2,373
|
|
$
|
1,944
|
|
||
As of
December 31, 2016
, if recognized, all of the Corporation’s unrecognized tax benefits
would impact the effective tax rate.
Not included in the table above is
$845,000
of federal income tax benefit on unrecognized state tax benefits which, if recognized, would also impact the effective tax rate. Interest accrued related to unrecognized tax benefits is recorded as a component of income tax expense.
Penalties, if incurred, would also be recognized in income tax expense. The Corporation recognized approximately
$43,000
and
$46,000
in
2016
and
2015
, respectively, for interest and penalties in income tax expense related to unrecognized tax positions. As of
December 31, 2016
and
2015
, total accrued interest and penalties related to unrecognized tax positions were approximately
$574,000
and
$531,000
, respectively.
The Corporation and its subsidiaries file income tax returns in the federal and various state jurisdictions. In most cases, unrecognized tax benefits are related to tax years that remain subject to examination by the relevant taxing authorities. With few exceptions, the Corporation is no longer subject to federal, state and local examinations by tax authorities for years before
2013
.
|
|
||||
The following summarizes the Corporation’s expense under its retirement plans for the years ended
December 31
:
|
2016
|
2015
|
2014
|
|||||||||
|
|
(in thousands)
|
||||||||||
|
401(k) Retirement Plan
|
$
|
7,418
|
|
$
|
6,423
|
|
$
|
8,643
|
|
||
|
Pension Plan
|
4,310
|
|
4,102
|
|
1,514
|
|
|||||
|
$
|
11,728
|
|
$
|
10,525
|
|
$
|
10,157
|
|
|||
The 401(k) Retirement Plan is a defined contribution plan under which eligible employees may defer a portion of their pre-tax covered compensation on an annual basis, with employer matches of up to
5%
of employee compensation. Employee and employer contributions under these features are
100%
vested. Prior to January 1, 2015, this plan also included a profit sharing component whereby additional employer contributions not to exceed
5%
of each eligible employee’s covered compensation, were provided for certain employees.
Contributions to the Defined Benefit Pension Plan ("Pension Plan") are actuarially determined and funded annually, if necessary. The Corporation recognizes the funded status of its Pension Plan on the consolidated balance sheets and recognizes the changes in that funded status through other comprehensive income. The Pension Plan has been curtailed, with no additional benefits accruing to participants.
107
Pension Plan
The net periodic pension cost for the Pension Plan, as determined by consulting actuaries, consisted of the following components for the years ended
December 31
:
|
2016
|
2015
|
2014
|
|||||||||
|
|
(in thousands)
|
||||||||||
|
Service cost
(1)
|
$
|
688
|
|
$
|
579
|
|
$
|
367
|
|
||
|
Interest cost
|
3,520
|
|
3,405
|
|
3,413
|
|
|||||
|
Expected return on assets
|
(2,318
|
)
|
(3,009
|
)
|
(3,240
|
)
|
|||||
|
Net amortization and deferral
|
2,420
|
|
3,127
|
|
974
|
|
|||||
|
Net periodic pension cost
|
$
|
4,310
|
|
$
|
4,102
|
|
$
|
1,514
|
|
||
|
(1)
|
The Pension Plan was curtailed effective January 1, 2008. Pension plan service cost for all years presented was related to administrative costs associated with the plan and not due to the accrual of additional participant benefits.
|
The following table summarizes the changes in the projected benefit obligation and fair value of plan assets for the plan years ended
December 31
:
|
2016
|
2015
|
||||||
|
|
(in thousands)
|
||||||
|
Projected benefit obligation at beginning of year
|
$
|
84,736
|
|
$
|
93,079
|
|
|
|
Service cost
|
688
|
|
579
|
|
|||
|
Interest cost
|
3,520
|
|
3,405
|
|
|||
|
Benefit payments
|
(5,172
|
)
|
(3,904
|
)
|
|||
|
Change in assumptions
|
1,635
|
|
(7,722
|
)
|
|||
|
Experience gain
|
(44
|
)
|
(701
|
)
|
|||
|
Projected benefit obligation at end of year
|
$
|
85,363
|
|
$
|
84,736
|
|
|
|
Fair value of plan assets at beginning of year
|
$
|
46,971
|
|
$
|
51,730
|
|
|
|
Employer contributions
(1)
|
5,169
|
|
—
|
|
|||
|
Actual return on plan assets
|
1,716
|
|
(855
|
)
|
|||
|
Benefit payments
|
(5,172
|
)
|
(3,904
|
)
|
|||
|
Fair value of plan assets at end of year
|
$
|
48,684
|
|
$
|
46,971
|
|
|
(1) The Corporation funds at least the minimum amount required by the funding requirements of federal law and regulations. The corporation contributed
$5.2 million
to the Pension Plan during
2016
. There were
no
contributions to the Pension Plan in
2015
.
The following table presents the funded status of the Pension Plan, included in other liabilities on the consolidated balance sheets, as of
December 31
:
|
2016
|
2015
|
||||||
|
|
(in thousands)
|
||||||
|
Projected benefit obligation
|
$
|
(85,363
|
)
|
$
|
(84,736
|
)
|
|
|
Fair value of plan assets
|
48,684
|
|
46,971
|
|
|||
|
Funded status
|
$
|
(36,679
|
)
|
$
|
(37,765
|
)
|
|
108
The following table summarizes the changes in the unrecognized net loss included as a component of accumulated other comprehensive loss:
|
|
Unrecognized Net Loss
|
||||||
|
|
Gross of tax
|
Net of tax
|
|||||
|
|
(in thousands)
|
||||||
|
Balance as of December 31, 2014
|
$
|
38,082
|
|
$
|
24,754
|
|
|
|
Recognized as a component of 2015 periodic pension cost
|
(3,127
|
)
|
(2,033
|
)
|
|||
|
Unrecognized gains arising in 2015
|
(4,559
|
)
|
(2,963
|
)
|
|||
|
Balance as of December 31, 2015
|
30,396
|
|
19,758
|
|
|||
|
Recognized as a component of 2016 periodic pension cost
|
(2,420
|
)
|
(1,573
|
)
|
|||
|
Unrecognized losses arising in 2016
|
2,193
|
|
1,425
|
|
|||
|
Balance as of December 31, 2016
|
$
|
30,169
|
|
$
|
19,610
|
|
|
The total amount of unrecognized net loss that will be amortized as a component of net periodic pension cost in
2017
is expected to be
$2.7 million
.
The following rates were used to calculate net periodic pension cost and the present value of benefit obligations as of
December 31
:
|
2016
|
2015
|
2014
|
||||||
|
Discount rate-projected benefit obligation
|
4.00
|
%
|
4.25
|
%
|
3.75
|
%
|
||
|
Expected long-term rate of return on plan assets
|
5.00
|
%
|
6.00
|
%
|
6.00
|
%
|
||
As of
December 31, 2016
and
2015
, the discount rate used was determined using the Citigroup Average Life discount rate table, as adjusted based on the Pension Plan's expected benefit payments and rounded to the nearest
0.25%
.
The
5.00%
long-term rate of return on plan assets used to calculate the net periodic pension cost was based on historical returns, adjusted for expectations of long-term asset returns based on the
December 31, 2016
weighted average asset allocations. The expected long-term return is considered to be appropriate based on the asset mix and the historical returns realized.
The following table presents a summary of the fair values of the Pension Plan’s assets as of
December 31
:
|
|
2016
|
2015
|
|||||||||||
|
|
Estimated
Fair Value |
% of Total
Assets |
Estimated
Fair Value |
% of Total
Assets |
|||||||||
|
|
(dollars in thousands)
|
||||||||||||
|
Equity mutual funds
|
$
|
12,689
|
|
|
$
|
8,269
|
|
|
|||||
|
Equity common trust funds
|
7,936
|
|
|
6,350
|
|
|
|||||||
|
Equity securities
|
20,625
|
|
42.4
|
%
|
14,619
|
|
31.1
|
%
|
|||||
|
Cash and money market funds
|
7,149
|
|
|
8,196
|
|
|
|||||||
|
Fixed income mutual funds
|
10,540
|
|
|
9,578
|
|
|
|||||||
|
Corporate debt securities
|
3,252
|
|
|
3,749
|
|
|
|||||||
|
U.S. Government agency securities
|
496
|
|
|
|
2,881
|
|
|
|
|||||
|
Fixed income securities and cash
|
21,437
|
|
44.0
|
%
|
24,404
|
|
52.0
|
%
|
|||||
|
Other alternative investment funds
|
6,622
|
|
13.6
|
%
|
7,948
|
|
16.9
|
%
|
|||||
|
|
$
|
48,684
|
|
100.0
|
%
|
$
|
46,971
|
|
100.0
|
%
|
|||
Investment allocation decisions are made by a retirement plan committee. The goal of the investment allocation strategy is to match certain benefit obligations with maturities of fixed income securities. Pension Plan assets are invested with a balanced objective, with target asset allocations of approximately
50%
in equities,
40%
in fixed income securities and cash and
10%
in alternative investments. Alternative investments may include managed futures, commodities, real estate investment trusts, master limited partnerships, and long-short strategies with traditional stocks and bonds. All alternative investments are in the form of mutual funds, not individual contracts, to enable daily liquidity.
109
The fair values for all assets held by the Pension Plan, excluding equity common trust funds, are based on quoted prices for identical instruments and would be categorized as Level 1 assets under FASB ASC Topic 810. Equity common trust funds would be categorized as Level 2 assets under FASB ASC Topic 810.
Estimated future benefit payments are as follows (in thousands):
|
Year
|
|
||
|
2017
|
$
|
3,409
|
|
|
2018
|
3,742
|
|
|
|
2019
|
3,831
|
|
|
|
2020
|
4,213
|
|
|
|
2021
|
4,410
|
|
|
|
2022 – 2026
|
24,219
|
|
|
|
$
|
43,824
|
|
|
Postretirement Benefits
The Corporation provides medical benefits and life insurance benefits under a postretirement benefits plan ("Postretirement Plan") to certain retired full-time employees who were employees of the Corporation prior to
January 1, 1998
. Prior to February 1, 2014, certain full-time employees became eligible for these discretionary benefits if they reached retirement age while working for the Corporation. The Corporation recognizes the funded status of the postretirement plan on the consolidated balance sheets and recognizes the changes in that funded status through other comprehensive income.
In 2015, the Corporation amended the postretirement plan to eliminate a death benefit provision and to fix the cost of health insurance premiums paid for by each participant. This amendment resulted in a
$2.5 million
decrease in the postretirement benefit obligation that will be amortized to income over the estimated average remaining life of plan participants, or approximately 14 years.
In 2014, the Corporation amended the Postretirement Plan, making all active full-time employees ineligible for benefits under this plan. As a result of this amendment, the Corporation recorded a
$1.5 million
curtailment gain as a reduction to salaries and employee benefits expense in 2014. The curtailment gain resulted from the recognition of the remaining pre-curtailment prior service cost as of December 31, 2013. In addition, this amendment resulted in a
$3.4 million
decrease in the accumulated postretirement benefit obligation and a corresponding increase in unrecognized prior service cost credits.
The components of the net (benefit) expense for postretirement benefits other than pensions are as follows:
|
2016
|
2015
|
2014
|
|||||||||
|
|
(in thousands)
|
||||||||||
|
Service cost
|
$
|
—
|
|
$
|
—
|
|
$
|
15
|
|
||
|
Interest cost
|
85
|
|
206
|
|
206
|
|
|||||
|
Net amortization and deferral
|
(551
|
)
|
(258
|
)
|
(347
|
)
|
|||||
|
Net postretirement benefit cost
|
$
|
(466
|
)
|
$
|
(52
|
)
|
$
|
(126
|
)
|
||
110
The following table summarizes the changes in the accumulated postretirement benefit obligation and fair value of plan assets for the years ended
December 31
:
|
2016
|
2015
|
||||||
|
|
(in thousands)
|
||||||
|
Accumulated postretirement benefit obligation at beginning of year
|
$
|
2,875
|
|
$
|
5,552
|
|
|
|
Interest cost
|
85
|
|
206
|
|
|||
|
Benefit payments
|
(282
|
)
|
(251
|
)
|
|||
|
Experience gain
|
(732
|
)
|
189
|
|
|||
|
Change in assumptions
|
(20
|
)
|
(2,821
|
)
|
|||
|
Accumulated postretirement benefit obligation at end of year
|
$
|
1,926
|
|
$
|
2,875
|
|
|
|
Fair value of plan assets at beginning of year
|
$
|
15
|
|
$
|
8
|
|
|
|
Employer contributions
|
270
|
|
258
|
|
|||
|
Benefit payments
|
(282
|
)
|
(251
|
)
|
|||
|
Fair value of plan assets at end of year
|
$
|
3
|
|
$
|
15
|
|
|
The following table presents the funded status of the Postretirement Plan, included in other liabilities on the consolidated balance sheets as of
December 31
:
|
2016
|
2015
|
||||||
|
|
(in thousands)
|
||||||
|
Accumulated postretirement benefit obligation
|
$
|
(1,926
|
)
|
$
|
(2,875
|
)
|
|
|
Fair value of plan assets
|
3
|
|
15
|
|
|||
|
Funded status
|
$
|
(1,923
|
)
|
$
|
(2,860
|
)
|
|
The following table summarizes the changes in items recognized as a component of accumulated other comprehensive loss:
|
|
Gross of tax
|
|
|||||||||||||
|
|
Unrecognized
Prior Service Cost |
Unrecognized
Net Loss (Gain) |
Total
|
Net of tax
|
|||||||||||
|
|
(in thousands)
|
||||||||||||||
|
Balance as of December 31, 2014
|
$
|
(3,123
|
)
|
$
|
(336
|
)
|
$
|
(3,459
|
)
|
$
|
(2,249
|
)
|
|||
|
Recognized as a component of 2015 postretirement benefit cost
|
258
|
|
—
|
|
258
|
|
168
|
|
|||||||
|
Unrecognized gains arising in 2015
|
(2,469
|
)
|
(172
|
)
|
(2,641
|
)
|
(1,717
|
)
|
|||||||
|
Balance as of December 31, 2015
|
(5,334
|
)
|
(508
|
)
|
(5,842
|
)
|
(3,798
|
)
|
|||||||
|
Recognized as a component of 2016 postretirement benefit cost
|
465
|
|
86
|
|
551
|
|
358
|
|
|||||||
|
Unrecognized gains arising in 2016
|
—
|
|
(761
|
)
|
(761
|
)
|
(495
|
)
|
|||||||
|
Balance as of December 31, 2016
|
$
|
(4,869
|
)
|
$
|
(1,183
|
)
|
$
|
(6,052
|
)
|
$
|
(3,935
|
)
|
|||
The following rates were used to calculate net periodic postretirement benefit cost and the present value of benefit obligations as of
December 31
:
|
2016
|
2015
|
2014
|
||||||
|
Discount rate-projected benefit obligation
|
4.25
|
%
|
4.25
|
%
|
3.75
|
%
|
||
|
Expected long-term rate of return on plan assets
|
3.00
|
%
|
3.00
|
%
|
3.00
|
%
|
||
As of
December 31, 2016
and
2015
, the discount rate used to calculate the accumulated postretirement benefit obligation was determined using the Citigroup Average Life discount rate table, as adjusted based on the Postretirement Plan's expected benefit payments and rounded to the nearest
0.25%
.
111
Estimated future benefit payments under the Postretirement Plan are as follows (in thousands):
|
Year
|
|
||
|
2017
|
$
|
237
|
|
|
2018
|
222
|
|
|
|
2019
|
207
|
|
|
|
2020
|
193
|
|
|
|
2021
|
178
|
|
|
|
2022 – 2026
|
695
|
|
|
|
$
|
1,732
|
|
|
112
|
|
||||
Accumulated Other Comprehensive Income (Loss)
The following table presents the components of other comprehensive income (loss) for the years ended
December 31
:
|
Before-Tax Amount
|
Tax Effect
|
Net of Tax Amount
|
|||||||||
|
(in thousands)
|
|||||||||||
|
2016:
|
|||||||||||
|
Unrealized loss on securities
|
$
|
(22,907
|
)
|
$
|
8,016
|
|
$
|
(14,891
|
)
|
||
|
Reclassification adjustment for securities gains included in net income
(1)
|
(2,550
|
)
|
893
|
|
(1,657
|
)
|
|||||
|
Non-credit related unrealized loss on other-than-temporarily impaired debt securities
|
(285
|
)
|
100
|
|
(185
|
)
|
|||||
|
Amortization of unrealized loss on derivative financial instruments
(2)
|
25
|
|
(9
|
)
|
16
|
|
|||||
|
Unrecognized pension and postretirement cost
|
(1,432
|
)
|
501
|
|
(931
|
)
|
|||||
|
Amortization of net unrecognized pension and postretirement items
(3)
|
1,869
|
|
(653
|
)
|
1,216
|
|
|||||
|
Total Other Comprehensive Loss
|
$
|
(25,280
|
)
|
$
|
8,848
|
|
$
|
(16,432
|
)
|
||
|
2015:
|
|||||||||||
|
Unrealized loss on securities
|
$
|
(11,872
|
)
|
$
|
4,155
|
|
$
|
(7,717
|
)
|
||
|
Reclassification adjustment for securities gains included in net income
(1)
|
(9,066
|
)
|
3,174
|
|
(5,892
|
)
|
|||||
|
Reclassification adjustment for loss on derivative financial instruments included in net income
(2)
|
3,778
|
|
(1,322
|
)
|
2,456
|
|
|||||
|
Non-credit related unrealized gains on other-than-temporarily impaired debt securities
|
368
|
|
(129
|
)
|
239
|
|
|||||
|
Amortization of unrealized loss on derivative financial instruments
(2)
|
115
|
|
(40
|
)
|
75
|
|
|||||
|
Unrecognized pension and postretirement cost
|
7,200
|
|
(2,520
|
)
|
4,680
|
|
|||||
|
Amortization of net unrecognized pension and postretirement items
(3)
|
2,869
|
|
(1,005
|
)
|
1,864
|
|
|||||
|
Total Other Comprehensive Loss
|
$
|
(6,608
|
)
|
$
|
2,313
|
|
$
|
(4,295
|
)
|
||
|
2014:
|
|||||||||||
|
Unrealized gain on securities
|
$
|
51,901
|
|
$
|
(18,167
|
)
|
$
|
33,734
|
|
||
|
Reclassification adjustment for securities gains included in net income
(1)
|
(2,041
|
)
|
714
|
|
(1,327
|
)
|
|||||
|
Non-credit related unrealized gains on other-than-temporarily impaired debt securities
|
1,200
|
|
(420
|
)
|
780
|
|
|||||
|
Amortization of unrealized loss on derivative financial instruments
(2)
|
209
|
|
(73
|
)
|
136
|
|
|||||
|
Reclass adjustment for postretirement plan gain included in net income
(3)
|
(1,452
|
)
|
508
|
|
(944
|
)
|
|||||
|
Unrecognized pension and postretirement income
|
(20,258
|
)
|
7,090
|
|
(13,168
|
)
|
|||||
|
Amortization of net unrecognized pension and postretirement items
(3)
|
627
|
|
(219
|
)
|
408
|
|
|||||
|
Total Other Comprehensive Income
|
$
|
30,186
|
|
$
|
(10,567
|
)
|
$
|
19,619
|
|
||
|
(1)
|
Amounts reclassified out of accumulated other comprehensive loss. Before-tax amounts included in "Investment securities gains, net" on the consolidated statements of income. See "Note 3 - Investment Securities," for additional details.
|
|
(2)
|
Amounts reclassified out of accumulated other comprehensive loss. Before-tax amounts included in "Interest Expense" on the consolidated statements of income.
|
|
(3)
|
Amounts reclassified out of accumulated other comprehensive loss. Before-tax amounts included in "Salaries and employee benefits" on the consolidated statements of income. See "Note 13 - Employee Benefit Plans," for additional details.
|
113
The following table presents changes in each component of accumulated other comprehensive income (loss), net of tax, for the years ended
December 31
:
|
Unrealized Gain (Losses) on Investment Securities Not Other-Than-Temporarily Impaired
|
Unrealized Non-Credit Gains (Losses) on Other-Than-Temporarily Impaired Debt Securities
|
Unrealized Effective Portions of Losses on Forward-Starting Interest Rate Swaps
|
Unrecognized Pension and Postretirement Plan Income (Cost)
|
Total
|
|||||||||||||||
|
(in thousands)
|
|||||||||||||||||||
|
Balance as of December 31, 2013
|
$
|
(27,510
|
)
|
$
|
1,652
|
|
$
|
(2,682
|
)
|
$
|
(8,801
|
)
|
$
|
(37,341
|
)
|
||||
|
Other comprehensive income (loss) before reclassifications
|
33,734
|
|
780
|
|
—
|
|
(14,112
|
)
|
20,402
|
|
|||||||||
|
Amounts reclassified from accumulated other comprehensive income (loss)
|
(244
|
)
|
(1,083
|
)
|
136
|
|
408
|
|
(783
|
)
|
|||||||||
|
Balance as of December 31, 2014
|
5,980
|
|
1,349
|
|
(2,546
|
)
|
(22,505
|
)
|
(17,722
|
)
|
|||||||||
|
Other comprehensive income (loss) before reclassifications
|
(7,717
|
)
|
239
|
|
—
|
|
4,680
|
|
(2,798
|
)
|
|||||||||
|
Amounts reclassified from accumulated other comprehensive income (loss)
|
(4,762
|
)
|
(1,130
|
)
|
75
|
|
1,864
|
|
(3,953
|
)
|
|||||||||
|
Reclassification adjustment for loss on derivative financial instruments
|
—
|
|
—
|
|
2,456
|
|
—
|
|
2,456
|
|
|||||||||
|
Balance as of December 31, 2015
|
(6,499
|
)
|
458
|
|
(15
|
)
|
(15,961
|
)
|
(22,017
|
)
|
|||||||||
|
Other comprehensive income (loss) before reclassifications
|
(14,891
|
)
|
(185
|
)
|
—
|
|
(931
|
)
|
(16,007
|
)
|
|||||||||
|
Amounts reclassified from accumulated other comprehensive income (loss)
|
(1,657
|
)
|
—
|
|
15
|
|
1,217
|
|
(425
|
)
|
|||||||||
|
Balance as of December 31, 2016
|
$
|
(23,047
|
)
|
$
|
273
|
|
$
|
—
|
|
$
|
(15,675
|
)
|
$
|
(38,449
|
)
|
||||
Common Stock Repurchase Plans
In
November 2016
, the Corporation's board of directors approved an extension to a share repurchase program pursuant to which the Corporation is authorized to repurchase up to
$50.0 million
of its outstanding shares of common stock, or approximately
2.3%
of its outstanding shares, through December 31, 2017
. Repurchased shares will be added to treasury stock, at cost. As permitted by securities laws and other legal requirements, and subject to market conditions and other factors, purchases may be made from time to time in open market or privately negotiated transactions, including, without limitation, through accelerated share repurchase transactions. The share repurchase program may be discontinued at any time. During 2016,
1.5 million
shares were repurchased under this program for a total cost of
$18.5 million
, or
$12.48
per share. As of December 31, 2016, up to an additional
$31.5 million
of the Corporation's common stock may be repurchased under this program through December 31, 2017.
In
April 2015
, the Corporation announced that its board of directors had approved a share repurchase program pursuant to which the Corporation was authorized to repurchase up to
$50.0 million
of its outstanding shares of common stock, or approximately
2.3%
of its outstanding shares, through
December 31, 2015
. During
2015, the Corporation repurchased approximately
4.0 million
shares under this program for a total cost of
$50.0 million
, or
$12.57
per share, completing this program.
In 2014, the Corporation repurchased outstanding shares of its common stock under various repurchase programs approved by its board of directors. A total of
8.0 million
shares were repurchased for
$95.2 million
, or an average cost of
$11.91
per share.
In addition to the repurchases discussed above, in
November 2014
, the Corporation entered into an accelerated share repurchase agreement ("ASR") with a third party to repurchase
$100 million
of shares of its common stock. Under the terms of the ASR, the Corporation paid
$100 million
to the third party in
November 2014
and received an initial delivery of
6.5 million
shares, representing
80%
of the shares expected to be delivered under the ASR, based on the closing price for the Corporation’s shares on
November 13, 2014
. In April 2015, the third party delivered an additional
1.8 million
shares of common stock pursuant to the terms of the ASR, thereby completing the
$100.0 million
ASR. The Corporation repurchased a total of
8.3 million
shares of common stock under the ASR at an average price of
$12.05
per share.
114
|
|
||||
The following table presents compensation expense and related tax benefits for all equity awards recognized in the consolidated statements of income:
|
2016
|
2015
|
2014
|
|||||||||
|
|
(in thousands)
|
||||||||||
|
Compensation expense
|
$
|
6,556
|
|
$
|
5,938
|
|
$
|
5,865
|
|
||
|
Tax benefit
|
(2,679
|
)
|
(2,011
|
)
|
(1,608
|
)
|
|||||
|
Stock-based compensation, net of tax
|
$
|
3,877
|
|
$
|
3,927
|
|
$
|
4,257
|
|
||
The tax benefits as a percentage of compensation expense, as shown in the preceding table, were
40.9%
,
33.9%
and
27.4%
in
2016
,
2015
and
2014
, respectively. These percentages differ from the Corporation’s
35%
statutory federal tax rate. Tax benefits are only recognized over the vesting period for awards that ordinarily will generate a tax deduction when exercised, in the case of non-qualified stock options, or upon vesting, in the case of restricted stock, RSUs and PSUs. Tax benefits less than the
35%
statutory federal tax rate resulted from incentive stock options, for which a tax benefit is not recognized during the vesting period. Tax benefits in excess of the
35%
statutory federal tax rate resulted from incentive stock option exercises that triggered a tax deduction when they were exercised.
The following table presents compensation expense and related tax benefits for restricted stock awards, RSUs and PSUs recognized in the consolidated statements of income, and included as a component of total stock-based compensation in the preceding table:
|
2016
|
2015
|
2014
|
|||||||||
|
|
(in thousands)
|
||||||||||
|
Compensation expense
|
$
|
6,165
|
|
$
|
4,646
|
|
$
|
4,345
|
|
||
|
Tax benefit
|
(2,158
|
)
|
(1,626
|
)
|
(1,510
|
)
|
|||||
|
Restricted stock compensation, net of tax
|
$
|
4,007
|
|
$
|
3,020
|
|
$
|
2,835
|
|
||
The following table provides information about stock option activity for the year ended
December 31, 2016
:
|
Stock
Options |
Weighted
Average Exercise Price |
Weighted
Average Remaining Contractual Term |
Aggregate
Intrinsic Value (in millions) |
|||||||||
|
Outstanding as of December 31, 2015
|
2,980,087
|
|
$
|
12.31
|
|
|||||||
|
Exercised
|
(920,924
|
)
|
11.70
|
|
||||||||
|
Forfeited
|
(263,685
|
)
|
14.33
|
|
||||||||
|
Expired
|
(465,295
|
)
|
16.19
|
|
||||||||
|
Outstanding as of December 31, 2016
|
1,330,183
|
|
$
|
10.98
|
|
4.7 years
|
$
|
10.4
|
|
|||
|
Exercisable as of December 31, 2016
|
1,247,736
|
|
$
|
10.87
|
|
4.5 years
|
$
|
9.9
|
|
|||
The following table provides information about nonvested stock options, restricted stock, RSUs and PSUs granted under the Employee Equity Plan and Directors' Plan for the year ended
December 31, 2016
:
|
|
Nonvested Stock Options
|
Restricted Stock/RSUs/PSUs
|
|||||||||||
|
|
Options
|
Weighted
Average Grant Date Fair Value |
Shares
|
Weighted
Average Grant Date Fair Value |
|||||||||
|
Nonvested as of December 31, 2015
|
349,852
|
|
$
|
2.82
|
|
1,388,389
|
|
$
|
12.16
|
|
|||
|
Granted
|
—
|
|
—
|
|
447,130
|
|
13.86
|
|
|||||
|
Vested
|
(247,727
|
)
|
2.71
|
|
(292,583
|
)
|
11.73
|
|
|||||
|
Forfeited
|
(19,678
|
)
|
2.84
|
|
(17,221
|
)
|
12.20
|
|
|||||
|
Nonvested as of December 31, 2016
|
82,447
|
|
$
|
3.14
|
|
1,525,715
|
|
$
|
12.74
|
|
|||
115
As of
December 31, 2016
, there was
$8.4 million
of total unrecognized compensation cost related to nonvested stock options, restricted stock, RSUs and PSUs that will be recognized as compensation expense over a weighted average period of
two
years. As of
December 31, 2016
, the Employee Equity Plan had
11.4 million
shares reserved for future grants through
2023
, and the Directors’ Plan had
371,000
shares reserved for future grants through
2021
.
The following table presents information about stock options exercised:
|
2016
|
2015
|
2014
|
|||||||||
|
|
(dollars in thousands)
|
||||||||||
|
Number of options exercised
|
920,924
|
|
490,151
|
|
215,047
|
|
|||||
|
Total intrinsic value of options exercised
|
$
|
4,619
|
|
$
|
1,442
|
|
$
|
568
|
|
||
|
Cash received from options exercised
|
$
|
10,240
|
|
$
|
4,936
|
|
$
|
2,068
|
|
||
|
Tax deduction realized from options exercised
|
$
|
4,328
|
|
$
|
1,389
|
|
$
|
530
|
|
||
Upon exercise, the Corporation issues shares from its authorized, but unissued, common stock to satisfy the options.
The fair value of stock option awards under the Employee Equity Plan was estimated on the grant date using the Black-Scholes valuation methodology, which is dependent upon certain assumptions, as summarized in the table below. No options were granted in
2016
and
2015
under the Employee Equity Plan.
|
2014
|
|||
|
Risk-free interest rate
|
2.44
|
%
|
|
|
Volatility of Corporation’s stock
|
28.05
|
%
|
|
|
Expected dividend yield
|
2.36
|
%
|
|
|
Expected life of options
|
7 Years
|
|
|
The expected life of the options was estimated based on historical activity. Volatility of the Corporation’s stock was based on historical volatility for the period commensurate with the expected life of the options. The risk-free interest rate is the zero-coupon U.S. Treasury rate commensurate with the expected life of the options on the date of the grant.
Based on the assumptions above, the Corporation calculated an estimated fair value per option of
$3.14
for options granted in
2014
. The Corporation granted
288,626
options in
2014
, including
50,000
non-qualified stock options.
The fair value of certain PSUs with market-based performance conditions granted in
2016
under the Employee Equity Plan was estimated on the grant date using the Monte Carlo valuation methodology performed by a third-party valuation expert. This valuation is dependent upon certain assumptions, as summarized in the following table:
|
2016
|
|
2015
|
|
2014
|
|
|||
|
Risk-free interest rate
|
0.92
|
%
|
0.86
|
%
|
0.91
|
%
|
||
|
Volatility of Corporation’s stock
|
20.75
|
%
|
20.08
|
%
|
29.63
|
%
|
||
|
Expected life of PSUs
|
3 Years
|
|
3 Years
|
|
3 Years
|
|
||
The expected life of the PSUs with fair values measured using the Monte Carlo valuation methodology was based on the defined performance period of
three years
. Volatility of the Corporation’s stock was based on historical volatility for the period commensurate with the expected life of the PSUs. The risk-free interest rate is the zero-coupon U.S. Treasury rate commensurate with the expected life of the PSUs on the date of the grant. Based on the assumptions above, the Corporation calculated an estimated fair value per PSU granted in
2016
of
$11.23
.
Under the ESPP, eligible employees can purchase stock of the Corporation at
85%
of the fair market value of the stock on the date of purchase. The ESPP is considered to be a compensatory plan and, as such, compensation expense is recognized for the
15%
discount on shares purchased. The following table summarizes activity under the ESPP:
|
2016
|
2015
|
2014
|
|||||||||
|
ESPP shares purchased
|
109,665
|
|
121,890
|
|
132,640
|
|
|||||
|
Average purchase price per share (85% of market value)
|
$
|
12.37
|
|
$
|
10.86
|
|
$
|
10.31
|
|
||
|
Compensation expense recognized (in thousands)
|
$
|
240
|
|
$
|
234
|
|
$
|
241
|
|
||
116
|
|
||||
Certain branch offices and equipment are leased under agreements that expire at varying dates through
2036
. Most leases contain renewal provisions at the Corporation’s option. Total rental expense was approximately
$18.4 million
in
2016
,
$18.1 million
in
2015
and
$18.1 million
in
2014
.
Future minimum payments as of
December 31, 2016
under non-cancelable operating leases with initial terms exceeding
one
year are as follows (in thousands):
|
Year
|
|
||
|
2017
|
$
|
16,330
|
|
|
2018
|
14,206
|
|
|
|
2019
|
12,286
|
|
|
|
2020
|
11,040
|
|
|
|
2021
|
9,396
|
|
|
|
Thereafter
|
44,395
|
|
|
|
$
|
107,653
|
|
|
|
|
||||
Commitments
The Corporation is a party to financial instruments with off-balance sheet risk in the normal course of business to meet the financing needs of its customers.
Commitments to extend credit are agreements to lend to a customer as long as there is no violation of any condition established in the contract. Commitments generally have fixed expiration dates or other termination clauses and may require payment of a fee. Since a portion of the commitments is expected to expire without being drawn upon, the total commitment amounts do not necessarily represent future cash requirements. The Corporation evaluates each customer’s creditworthiness on a case-by-case basis. The amount of collateral, if any, obtained upon extension of credit is based on management’s credit evaluation of the customer. Collateral held varies but may include accounts receivable, inventory, property, equipment and income producing commercial properties. The Corporation records a reserve for unfunded commitments, included in other liabilities on the consolidated balance sheets, which represents management’s estimate of losses inherent in these commitments. See "Note 4 - Loans and Allowance for Credit Losses," for additional information.
Standby letters of credit are conditional commitments issued to guarantee the financial or performance obligation of a customer to a third party. Commercial letters of credit are conditional commitments issued to facilitate foreign and domestic trade transactions for customers. The credit risk involved in issuing letters of credit is similar to that involved in extending loan facilities. These obligations are underwritten consistently with commercial lending standards. The maximum exposure to loss for standby and commercial letters of credit is equal to the contractual (or notional) amount of the instruments.
The following table presents commitments to extend credit and letters of credit:
|
2016
|
2015
|
||||||
|
|
(in thousands)
|
||||||
|
Commercial and other
|
$
|
3,673,815
|
|
$
|
3,518,960
|
|
|
|
Home equity
|
1,368,465
|
|
1,300,062
|
|
|||
|
Commercial mortgage and construction
|
1,033,287
|
|
965,116
|
|
|||
|
Total commitments to extend credit
|
$
|
6,075,567
|
|
$
|
5,784,138
|
|
|
|
Standby letters of credit
|
$
|
356,359
|
|
$
|
374,729
|
|
|
|
Commercial letters of credit
|
38,901
|
|
39,529
|
|
|||
|
Total letters of credit
|
$
|
395,260
|
|
$
|
414,258
|
|
|
117
Residential Lending
Residential mortgages are originated and sold by the Corporation and consist primarily of conforming, prime loans sold to government sponsored agencies such as the Federal National Mortgage Association (Fannie Mae) and the Federal Home Loan Mortgage Corporation (Freddie Mac). The Corporation also sells certain residential mortgages to non-government sponsored agency investors.
The Corporation provides customary representations and warranties to government sponsored agencies and investors that specify, among other things, that the loans have been underwritten to the standards established by the government sponsored agency or investor. The Corporation may be required to repurchase a loan or reimburse the government sponsored agency or investor for a credit loss incurred on a loan, if it is determined that the representations and warranties have not been met. Such repurchases or reimbursements generally result from an underwriting or documentation deficiency. As of
December 31, 2016
and
2015
, total outstanding repurchase requests totaled approximately
$543,000
.
From
2000
to
2011
, the Corporation sold loans to the Federal Home Loan Bank of Pittsburgh under its Mortgage Partnership Finance Program ("MPF Program"). No loans were sold under this program since 2011. The Corporation provided a "credit enhancement" for residential mortgage loans sold under the MPF Program whereby it would assume credit losses in excess of a defined "First Loss Account," or "FLA" balance, up to specified amounts. The FLA is funded by the Federal Home Loan Bank of Pittsburgh based on a percentage of the outstanding principal balance of loans sold. As of
December 31, 2016
, the unpaid principal balance of loans sold under the MPF Program was approximately
$104 million
. As of
December 31, 2016
and
2015
, the reserves for estimated credit losses related to loans sold under the MPF Program were
$1.7 million
and
$1.8 million
, respectively. Required reserves are calculated based on delinquency status and estimated loss rates established through the Corporation's existing allowance for credit loss methodology for residential mortgage loans.
As of
December 31, 2016
and
2015
, the reserve for losses on residential mortgage loans sold was
$2.5 million
and
$2.6 million
, respectively, including both reserves for credit losses under the MPF Program and reserves for representation and warranty exposures. Management believes that the reserves recorded as of
December 31, 2016
are adequate. However, declines in collateral values, the identification of additional loans to be repurchased, or a deterioration in the credit quality of loans sold under the MPF Program could necessitate additional reserves, established through charges to earnings, in the future.
Legal Proceedings
The Corporation and its subsidiaries are involved in various legal proceedings in the ordinary course of business of the Corporation. The Corporation periodically evaluates the possible impact of pending litigation matters based on, among other factors, the advice of counsel, available insurance coverage and recorded liabilities and reserves for probable legal liabilities and costs. In addition, from time to time, the Corporation is the subject of investigations or other forms of regulatory or governmental inquiry covering a range of possible issues and, in some cases, these may be part of similar reviews of the specified activities of other industry participants. These inquiries could lead to administrative, civil or criminal proceedings, and could possibly result in fines, penalties, restitution or the need to alter the Corporation’s business practices, and cause the Corporation to incur additional costs. The Corporation’s practice is to cooperate fully with regulatory and governmental investigations.
As of the date of this report, the Corporation believes that any liabilities, individually or in the aggregate, which may result from the final outcomes of pending proceedings will not have a material adverse effect on the financial condition of the Corporation. However, legal proceedings are often unpredictable, and it is possible that the ultimate resolution of any such matters, if unfavorable, may be material to the Corporation’s results of operations for any particular period, depending, in part, upon the size of the loss or liability imposed and the operating results for the applicable period.
BSA/AML Enforcement Orders
The Corporation and each of its bank subsidiaries are subject to regulatory enforcement orders issued during 2014 and 2015 by their respective federal and state bank regulatory agencies relating to identified deficiencies in the Corporation’s centralized Bank Secrecy Act and anti-money laundering compliance program (the "BSA/AML Compliance Program"), which was designed to comply with the requirements of the Bank Secrecy Act, the USA Patriot Act of 2001 and related anti-money laundering regulations (collectively, the "BSA/AML Requirements"). The regulatory enforcement orders, which are in the form of consent orders or orders to cease and desist issued upon consent ("Consent Orders"), generally require, among other things, that the Corporation and its bank subsidiaries undertake a number of required actions to strengthen and enhance the BSA/AML Compliance Program, and, in some cases, conduct retrospective reviews of past account activity and transactions, as well as certain reports filed in accordance with the BSA/AML Requirements, to determine whether suspicious activity and certain transactions in currency were properly identified and reported in accordance with the BSA/AML Requirements. In addition to requiring strengthening and
118
enhancement of the BSA/AML Compliance Program, while the Consent Orders remain in effect, the Corporation is subject to certain restrictions on expansion activities of the Corporation and its bank subsidiaries. Further, any failure to comply with the requirements of any of the Consent Orders involving the Corporation or its bank subsidiaries could result in further enforcement actions, the imposition of material restrictions on the activities of the Corporation or its bank subsidiaries, or the assessment of fines or penalties.
Fair Lending Investigation
During the second quarter of 2015, Fulton Bank, N.A., the Corporation’s largest bank subsidiary, received a letter from the U.S. Department of Justice (the "Department") indicating that the Department had initiated an investigation regarding potential violations of fair lending laws (specifically, the Equal Credit Opportunity Act and the Fair Housing Act) by Fulton Bank, N.A. in certain geographies. Fulton Bank, N.A. has been and is cooperating with the Department and responding to the Department’s requests for information. During the third quarter of 2016, the Department informed the Corporation, Fulton Bank, N.A., and three of the Corporation’s other bank subsidiaries, Fulton Bank of New Jersey, The Columbia Bank and Lafayette Ambassador Bank, that the Department was expanding its investigation of potential lending discrimination on the basis of race and national origin to encompass additional geographies that were not included in the initial letter from the Department. In addition to requesting information concerning the lending activities of these bank subsidiaries, the Department also requested information concerning the Corporation and the residential mortgage lending activities conducted under the Fulton Mortgage Company brand, the trade name used by all of the Corporation’s bank subsidiaries for residential mortgage lending. The investigation relates to lending activities during the period January 1, 2009 to the present. The Corporation and the identified bank subsidiaries are cooperating with the Department and responding to the Department’s requests for information. The Corporation and its bank subsidiaries are not able at this time to determine the terms on which this investigation will be resolved or the timing of such resolution, or to reliably estimate the amounts of any settlement, fines or other penalties or the cost of any other remedial actions, if enforcement action is taken. In addition, should the investigation result in an enforcement action against the Corporation or its bank subsidiaries, or a settlement with the Department, the ability of the Corporation and its bank subsidiaries to engage in certain expansion or other activities may be restricted.
Agostino, et al. Litigation
Fulton Bank, N.A. (the "Bank"), the Corporation’s largest bank subsidiary, and
two
unrelated, third-party defendants, Ameriprise Financial Services, Inc. (“Ameriprise”) and Riverview Bank (“Riverview”), have been named as defendants in a lawsuit brought on behalf of a group of
67
plaintiffs filed on March 31, 2016, in the Court of Common Pleas for Dauphin County, Pennsylvania (Agostino, et al. v. Ameriprise Financial Services, Inc., et al., No. 2016-CV-2048-CV). The plaintiffs in this action, who are individuals, trustees of certain irrevocable trusts, or the executors of the estates of deceased individuals, were clients of Jeffrey M. Mottern, a now-deceased attorney, who is alleged to have operated a fraud scheme over a period of years through the sale of fictitious high-yield investments or by otherwise misappropriating funds entrusted to Mr. Mottern. Mr. Mottern is alleged to have used the proceeds of these activities to engage in speculative securities trading through defendant Ameriprise, which caused significant losses, and for Mr. Mottern’s personal expenses. The allegations against the Bank relate to a commercial checking account at the Bank maintained by Mr. Mottern in connection with Mr. Mottern’s law practice. The lawsuit alleges that the Bank is liable to the plaintiffs for failing to properly monitor Mr. Mottern’s checking account and detect Mr. Mottern’s fraudulent activity, and specifically alleges that the Bank aided and abetted Mr. Mottern’s: (1) fraud; (2) breach of fiduciary duty; (3) violations of the Pennsylvania Unfair Trade Practices and Consumer Protection Law; and (4) conversion. Similar claims have been asserted against Ameriprise and Riverview, which allegedly maintained a personal brokerage account and a trust account for client or other third-party funds, respectively, for Mr. Mottern. The lawsuit seeks damages from the defendants, including the Bank, alleged to be in excess of
$11.3 million
, treble damages and attorneys’ fees with respect to alleged violations of the Pennsylvania Unfair Trade Practices and Consumer Protection Law, punitive damages, plus interest and costs. On April 29, 2016, the Bank filed a Notice of Removal to remove this lawsuit to the United States District Court for the Middle District of Pennsylvania. On May 31, 2016, the plaintiffs filed a motion to remand the lawsuit to the Court of Common Pleas for Dauphin County, Pennsylvania. On October 24, 2016, the District Court granted the plaintiffs' motion and the lawsuit was remanded back to the Court of Common Pleas for Dauphin County. All defendants subsequently filed preliminary objections to the Complaint, including objections that, if granted, would result in dismissal of the case.
119
|
|
||||
All assets and liabilities measured at fair value on both a recurring and nonrecurring basis have been categorized based on the method of their fair value determination.
The following tables summarizes the Corporation’s assets and liabilities measured at fair value on a recurring basis and reported on the consolidated balance sheets as of December 31:
|
|
2016
|
||||||||||||||
|
|
Level 1
|
Level 2
|
Level 3
|
Total
|
|||||||||||
|
|
(in thousands)
|
||||||||||||||
|
Mortgage loans held for sale
|
$
|
—
|
|
$
|
28,697
|
|
$
|
—
|
|
$
|
28,697
|
|
|||
|
Available for sale investment securities:
|
|
|
|
|
|||||||||||
|
Equity securities
|
24,526
|
|
—
|
|
—
|
|
24,526
|
|
|||||||
|
U.S. Government sponsored agency securities
|
—
|
|
134
|
|
—
|
|
134
|
|
|||||||
|
State and municipal securities
|
—
|
|
391,641
|
|
—
|
|
391,641
|
|
|||||||
|
Corporate debt securities
|
—
|
|
106,537
|
|
2,872
|
|
109,409
|
|
|||||||
|
Collateralized mortgage obligations
|
—
|
|
593,860
|
|
—
|
|
593,860
|
|
|||||||
|
Mortgage-backed securities
|
—
|
|
1,342,401
|
|
—
|
|
1,342,401
|
|
|||||||
|
Auction rate securities
|
—
|
|
—
|
|
97,256
|
|
97,256
|
|
|||||||
|
Total available for sale investment securities
|
24,526
|
|
2,434,573
|
|
100,128
|
|
2,559,227
|
|
|||||||
|
Other assets
|
17,111
|
|
44,481
|
|
—
|
|
61,592
|
|
|||||||
|
Total assets
|
$
|
41,637
|
|
$
|
2,507,751
|
|
$
|
100,128
|
|
$
|
2,649,516
|
|
|||
|
Other liabilities
|
$
|
17,032
|
|
$
|
41,734
|
|
$
|
—
|
|
$
|
58,766
|
|
|||
|
|
2015
|
||||||||||||||
|
|
Level 1
|
Level 2
|
Level 3
|
Total
|
|||||||||||
|
|
(in thousands)
|
||||||||||||||
|
Mortgage loans held for sale
|
$
|
—
|
|
$
|
16,886
|
|
$
|
—
|
|
$
|
16,886
|
|
|||
|
Available for sale investment securities:
|
|
|
|
|
|||||||||||
|
Equity securities
|
21,514
|
|
—
|
|
—
|
|
21,514
|
|
|||||||
|
U.S. Government sponsored agency securities
|
—
|
|
25,136
|
|
—
|
|
25,136
|
|
|||||||
|
State and municipal securities
|
—
|
|
262,765
|
|
—
|
|
262,765
|
|
|||||||
|
Corporate debt securities
|
—
|
|
93,619
|
|
3,336
|
|
96,955
|
|
|||||||
|
Collateralized mortgage obligations
|
—
|
|
821,509
|
|
—
|
|
821,509
|
|
|||||||
|
Mortgage-backed securities
|
—
|
|
1,158,835
|
|
—
|
|
1,158,835
|
|
|||||||
|
Auction rate securities
|
—
|
|
—
|
|
98,059
|
|
98,059
|
|
|||||||
|
Total available for sale investment securities
|
21,514
|
|
2,361,864
|
|
101,395
|
|
2,484,773
|
|
|||||||
|
Other assets
|
16,129
|
|
34,465
|
|
—
|
|
50,594
|
|
|||||||
|
Total assets
|
$
|
37,643
|
|
$
|
2,413,215
|
|
$
|
101,395
|
|
$
|
2,552,253
|
|
|||
|
Other liabilities
|
$
|
15,914
|
|
$
|
33,010
|
|
$
|
—
|
|
$
|
48,924
|
|
|||
The valuation techniques used to measure fair value for the items in the table above are as follows:
|
•
|
Mortgage loans held for sale
– This category consists of mortgage loans held for sale that the Corporation has elected to measure at fair value. Fair values as of
December 31, 2016
and
2015
were measured as the price that secondary market investors were offering for loans with similar characteristics. See "Note 1 - Summary of Significant Accounting Policies" for details related to the Corporation’s election to measure assets and liabilities at fair value.
|
|
•
|
Available for sale investment securities
– Included within this asset category are both equity and debt securities. Level 2 available for sale debt securities are valued by a third-party pricing service commonly used in the banking industry. The pricing service uses pricing models that vary based on asset class and incorporate available market information,
|
120
including quoted prices of investment securities with similar characteristics. Because many fixed income securities do not trade on a daily basis, pricing models use available information, as applicable, through processes such as benchmark yield curves, benchmarking of like securities, sector groupings, and matrix pricing.
Standard market inputs include: benchmark yields, reported trades, broker/dealer quotes, issuer spreads, two-sided markets, benchmark securities, bids, offers and reference data, including market research publications. For certain security types, additional inputs may be used, or some of the standard market inputs may not be applicable.
Management tests the values provided by the pricing service by obtaining securities prices from an alternative third-party source and comparing the results. This test is done for approximately
80%
of the securities valued by the pricing service. Generally, differences by security in excess of
5%
are researched to reconcile the difference.
|
•
|
Equity securities
– Equity securities consist of stocks of financial institutions (
$23.5 million
at
December 31, 2016
and
$20.6 million
at
December 31, 2015
) and other equity investments (
$1.0 million
at
December 31, 2016
and
$914,000
at
December 31, 2015
). These Level 1 investments are measured at fair value based on quoted prices for identical securities in active markets.
|
|
•
|
U.S. Government securities/U.S. Government sponsored agency securities/State and municipal securities/Collateralized mortgage obligations/Mortgage-backed securities
– These debt securities are classified as Level 2 investments. Fair values are determined by a third-party pricing service, as detailed above.
|
|
•
|
Corporate debt securities
– This category consists of subordinated and senior debt issued by financial institutions (
$65.2 million
at
December 31, 2016
and
$53.1 million
at
December 31, 2015
), single-issuer trust preferred securities issued by financial institutions (
$39.8 million
at
December 31, 2016
and
$39.1 million
at
December 31, 2015
), pooled trust preferred securities issued by financial institutions (
$422,000
at
December 31, 2016
and
$706,000
at
December 31, 2015
) and other corporate debt issued by non-financial institutions (
$4.0 million
at
December 31, 2016
and
2015
).
|
Level 2 investments include subordinated debt, other corporate debt issued by non-financial institutions and
$37.3 million
and
$36.5 million
of single-issuer trust preferred securities held at
December 31, 2016
and
2015
, respectively. The fair values for these corporate debt securities are determined by a third-party pricing service, as detailed above.
Level 3 investments include the Corporation's investments in pooled trust preferred securities (
$422,000
at
December 31, 2016
and
$706,000
at
December 31, 2015
) and certain single-issuer trust preferred securities (
$2.5 million
at
December 31, 2016
and
$2.6 million
at
December 31, 2015
). The fair values of these securities were determined based on quotes provided by third-party brokers who determined fair values based predominantly on internal valuation models which were not indicative prices or binding offers. The Corporation’s third-party pricing service cannot derive fair values for these securities primarily due to inactive markets for similar investments. Level 3 values are tested by management primarily through trend analysis, by comparing current values to those reported at the end of the preceding calendar quarter, and determining if they are reasonable based on price and spread movements for this asset class.
|
•
|
Auction rate securities
– Due to their illiquidity, ARCs are classified as Level 3 investments and are valued through the use of an expected cash flows model prepared by a third-party valuation expert. The assumptions used in preparing the expected cash flows model include estimates for coupon rates, time to maturity and market rates of return. The most significant unobservable input to the expected cash flows model is an assumed return to market liquidity sometime within the next
five
years. If the assumed return to market liquidity was lengthened beyond the next
five
years, this would result in a decrease in the fair value of these ARCs. The Corporation believes that the trusts underlying the ARCs will self-liquidate as student loans are repaid. Level 3 values are tested by management through the performance of a trend analysis of the market price and discount rate. Changes in the price and discount rates are compared to changes in market data, including bond ratings, parity ratios, balances and delinquency levels.
|
|
•
|
Other assets
– Included within this category are the following:
|
|
•
|
Level 1 assets, consisting of mutual funds that are held in trust for employee deferred compensation plans (
$16.4 million
at
December 31, 2016
and
$15.6 million
at
December 31, 2015
) and the fair value of foreign currency exchange contracts (
$745,000
at
December 31, 2016
and
$542,000
at
December 31, 2015
). The mutual funds and foreign exchange prices used to measure these items at fair value are based on quoted prices for identical instruments in active markets.
|
121
|
•
|
Level 2 assets, representing the fair value of mortgage banking derivatives in the form of interest rate locks and forward commitments with secondary market investors (
$3.1 million
at
December 31, 2016
and
$1.5 million
at
December 31, 2015
) and the fair value of interest rate swaps (
$41.4 million
at
December 31, 2016
and
$33.0 million
at
December 31, 2015
). The fair values of the interest rate locks, forward commitments and interest rate swaps represent the amounts that would be required to settle the derivative financial instruments at the balance sheet date. See "Note 10 - Derivative Financial Instruments," for additional information.
|
|
•
|
Other liabilities
– Included within this category are the following:
|
|
•
|
Level 1 employee deferred compensation liabilities which represent amounts due to employees under deferred compensation plans (
$16.4 million
at
December 31, 2016
and
$15.6 million
at
December 31, 2015
) and the fair value of foreign currency exchange contracts (
$668,000
at
December 31, 2016
and
$331,000
at
December 31, 2015
). The fair values of these liabilities are determined in the same manner as the related assets, as described under the heading "Other assets," above.
|
|
•
|
Level 2 liabilities, representing the fair value of mortgage banking derivatives in the form of interest rate locks and forward commitments with secondary market investors (
$339,000
at
December 31, 2016
and
$40,000
at
December 31, 2015
) and the fair value of interest rate swaps (
$41.4 million
at
December 31, 2016
and
$33.0 million
at
December 31, 2015
). The fair values of these liabilities are determined in the same manner as the related assets, which are described under the heading "Other assets" above.
|
The following table presents the changes in available for sale investment securities measured at fair value on a recurring basis using unobservable inputs (Level 3) for the years ended
December 31
:
|
|
Pooled Trust
Preferred Securities |
Single-issuer
Trust Preferred Securities |
ARCs
|
||||||||
|
|
(in thousands)
|
||||||||||
|
Balance as of December 31, 2014
|
$
|
4,088
|
|
$
|
3,820
|
|
$
|
100,941
|
|
||
|
Unrealized adjustments to fair value
(1)
|
366
|
|
(230
|
)
|
(903
|
)
|
|||||
|
Sales
|
(3,633
|
)
|
—
|
|
—
|
|
|||||
|
Settlements - calls
|
(117
|
)
|
(970
|
)
|
(2,446
|
)
|
|||||
|
Discount accretion
(2)
|
2
|
|
10
|
|
467
|
|
|||||
|
Balance as of December 31, 2015
|
706
|
|
2,630
|
|
98,059
|
|
|||||
|
Unrealized adjustments to fair value
(1)
|
(286
|
)
|
(190
|
)
|
(1,246
|
)
|
|||||
|
Discount accretion
(2)
|
2
|
|
10
|
|
443
|
|
|||||
|
Balance as of December 31, 2016
|
$
|
422
|
|
$
|
2,450
|
|
$
|
97,256
|
|
||
|
(1)
|
Pooled trust preferred securities, single-issuer trust preferred securities and ARCs are classified as available for sale investment securities; as such, the
|
unrealized adjustment to fair value was recorded as an unrealized holding gain (loss) and included as a component of available for sale investment securities on the consolidated balance sheets.
|
(2)
|
Included as a component of net interest income on the consolidated statements of income.
|
122
Certain financial assets are not measured at fair value on an ongoing basis but are subject to fair value measurement in certain circumstances, such as upon their acquisition or when there is evidence of impairment. The following table presents the Corporation's financial assets measured at fair value on a nonrecurring basis and reported on the consolidated balance sheets at
December 31
:
|
|
2016
|
||||||||||||||
|
|
Level 1
|
Level 2
|
Level 3
|
Total
|
|||||||||||
|
|
(in thousands)
|
||||||||||||||
|
Net loans
|
$
|
—
|
|
$
|
—
|
|
$
|
132,576
|
|
$
|
132,576
|
|
|||
|
Other financial assets
|
—
|
|
—
|
|
50,347
|
|
50,347
|
|
|||||||
|
Total assets
|
$
|
—
|
|
$
|
—
|
|
$
|
182,923
|
|
$
|
182,923
|
|
|||
|
|
2015
|
||||||||||||||
|
|
Level 1
|
Level 2
|
Level 3
|
Total
|
|||||||||||
|
|
(in thousands)
|
||||||||||||||
|
Net loans
|
$
|
—
|
|
$
|
—
|
|
$
|
138,491
|
|
$
|
138,491
|
|
|||
|
Other financial assets
|
—
|
|
—
|
|
52,043
|
|
52,043
|
|
|||||||
|
Total assets
|
$
|
—
|
|
$
|
—
|
|
$
|
190,534
|
|
$
|
190,534
|
|
|||
The valuation techniques used to measure fair value for the items in the table above are as follows:
|
•
|
Net loans
– This category consists of loans that were evaluated for impairment under FASB ASC Section 310-10-35 and have been classified as Level 3 assets. The amount shown is the balance of impaired loans, net of the related allowance for loan losses. See "Note 4 - Loans and Allowance for Credit Losses," for additional details.
|
|
•
|
Other financial assets
– This category includes OREO (
$12.8 million
at
December 31, 2016
and
$11.1 million
at
December 31, 2015
) and MSRs (
$37.5 million
at
December 31, 2016
and
$40.9 million
at
December 31, 2015
), both classified as Level 3 assets.
|
Fair values for OREO were based on estimated selling prices less estimated selling costs for similar assets in active markets.
MSRs are initially recorded at fair value upon the sale of residential mortgage loans to secondary market investors. MSRs are amortized as a reduction to servicing income over the estimated lives of the underlying loans. MSRs are stratified and evaluated for impairment by comparing each stratum's carrying amount to its estimated fair value. Fair values are determined at the end of each quarter through a discounted cash flows valuation, prepared by a third-party valuation expert. Significant inputs to the valuation include expected net servicing income, the discount rate and the expected life of the underlying loans. Expected life is based on the contractual terms of the loans, as adjusted for prepayment projections. The weighted average annual constant prepayment rate and the weighted average discount rate used in the
December 31, 2016
valuation were
12.6%
and
10.1%
, respectively. Management tests the reasonableness of the significant inputs to the third-party valuation in comparison to market data.
123
As required by FASB ASC Section 825-10-50, the following table details the book values and the estimated fair values of the Corporation’s financial instruments as of
December 31, 2016
and
2015
. A general description of the methods and assumptions used to estimate such fair values is also provided.
|
|
2016
|
2015
|
|||||||||||||
|
Book Value
|
Estimated
Fair Value |
Book Value
|
Estimated
Fair Value |
||||||||||||
|
(in thousands)
|
|||||||||||||||
|
FINANCIAL ASSETS
|
|||||||||||||||
|
Cash and due from banks
|
$
|
118,763
|
|
$
|
118,763
|
|
$
|
101,120
|
|
$
|
101,120
|
|
|||
|
Interest-bearing deposits with other banks
|
233,763
|
|
233,763
|
|
230,300
|
|
230,300
|
|
|||||||
|
Federal Reserve Bank and FHLB stock
|
57,489
|
|
57,489
|
|
62,216
|
|
62,216
|
|
|||||||
|
Loans held for sale (1)
|
28,697
|
|
28,697
|
|
16,886
|
|
16,886
|
|
|||||||
|
Securities available for sale (1)
|
2,559,227
|
|
2,559,227
|
|
2,484,773
|
|
2,484,773
|
|
|||||||
|
Net Loans (1)
|
14,530,593
|
|
14,387,454
|
|
13,669,548
|
|
13,540,903
|
|
|||||||
|
Accrued interest receivable
|
46,294
|
|
46,294
|
|
42,767
|
|
42,767
|
|
|||||||
|
Other financial assets (1)
|
206,132
|
|
206,132
|
|
166,920
|
|
166,920
|
|
|||||||
|
FINANCIAL LIABILITIES
|
|
|
|
|
|||||||||||
|
Demand and savings deposits
|
$
|
12,259,622
|
|
$
|
12,259,622
|
|
$
|
11,267,367
|
|
$
|
11,267,367
|
|
|||
|
Time deposits
|
2,753,242
|
|
2,769,757
|
|
2,864,950
|
|
2,862,868
|
|
|||||||
|
Short-term borrowings
|
541,317
|
|
541,317
|
|
497,663
|
|
497,663
|
|
|||||||
|
Accrued interest payable
|
9,632
|
|
9,632
|
|
10,724
|
|
10,724
|
|
|||||||
|
Other financial liabilities (1)
|
216,080
|
|
216,080
|
|
190,927
|
|
190,927
|
|
|||||||
|
FHLB advances and long-term debt
|
929,403
|
|
928,167
|
|
949,542
|
|
959,315
|
|
|||||||
|
(1)
|
These financial instruments, or certain financial instruments within these categories, are measured at fair value on the Corporation’s consolidated balance sheets. Descriptions of the fair value determinations for these financial instruments are disclosed above.
|
Fair values of financial instruments are significantly affected by the assumptions used, principally the timing of future cash flows and discount rates. Because assumptions are inherently subjective in nature, the estimated fair values cannot be substantiated by comparison to independent market quotes and, in many cases, the estimated fair values could not necessarily be realized in an immediate sale or settlement of the instrument. The aggregate fair value amounts presented do not necessarily represent management’s estimate of the underlying value of the Corporation.
For short-term financial instruments, defined as those with remaining maturities of
90
days or less, and excluding those recorded at fair value on the Corporation’s consolidated balance sheets, book value was considered to be a reasonable estimate of fair value.
The following instruments are predominantly short-term:
|
Assets
|
|
Liabilities
|
|
Cash and due from banks
|
|
Demand and savings deposits
|
|
Interest-bearing deposits with other banks
|
|
Short-term borrowings
|
|
Accrued interest receivable
|
|
Accrued interest payable
|
Federal Reserve Bank and FHLB stock represent restricted investments and are carried at cost on the consolidated balance sheets.
Fair values for loans and time deposits were estimated by discounting future cash flows using the current rates at which similar loans would be made to borrowers and similar deposits would be issued to customers for the same remaining maturities. Fair values estimated in this manner do not fully incorporate an exit price approach to fair value, as defined in FASB ASC Topic 820.
The fair values of FHLB advances and long-term debt were estimated by discounting the remaining contractual cash flows using a rate at which the Corporation could issue debt with similar remaining maturities as of the balance sheet date. These borrowings would be categorized within Level 2 liabilities under FASB ASC Topic 820.
124
|
|
||||
CONDENSED BALANCE SHEETS
(in thousands)
|
|
December 31
|
|
December 31
|
|||||||||||||
|
|
2016
|
2015
|
|
2016
|
2015
|
|||||||||||
|
ASSETS
|
LIABILITIES AND EQUITY
|
|||||||||||||||
|
Cash
|
$
|
8,568
|
|
$
|
—
|
|
Long-term debt
|
$
|
362,005
|
|
$
|
361,504
|
|
|||
|
Other assets
|
5,648
|
|
4,337
|
|
Payable to non-bank subsidiaries
|
183,152
|
|
188,087
|
|
|||||||
|
Receivable from subsidiaries
|
46,715
|
|
29,249
|
|
Other liabilities
|
77,538
|
|
77,263
|
|
|||||||
|
|
Total Liabilities
|
622,695
|
|
626,854
|
|
|||||||||||
|
Investments in:
|
||||||||||||||||
|
Bank subsidiaries
|
2,265,264
|
|
2,226,975
|
|
||||||||||||
|
Non-bank subsidiaries
|
417,615
|
|
408,187
|
|
Shareholders’ equity
|
2,121,115
|
|
2,041,894
|
|
|||||||
|
Total Assets
|
$
|
2,743,810
|
|
$
|
2,668,748
|
|
Total Liabilities and Shareholders’ Equity
|
$
|
2,743,810
|
|
$
|
2,668,748
|
|
|||
CONDENSED STATEMENTS OF INCOME
|
2016
|
2015
|
2014
|
|||||||||
|
|
(in thousands)
|
||||||||||
|
Income:
|
|||||||||||
|
Dividends from subsidiaries
|
$
|
115,000
|
|
$
|
114,000
|
|
$
|
139,150
|
|
||
|
Other (1)
|
148,577
|
|
141,241
|
|
120,543
|
|
|||||
|
263,577
|
|
255,241
|
|
259,693
|
|
||||||
|
Expenses
|
177,835
|
|
176,457
|
|
152,243
|
|
|||||
|
Income before income taxes and equity in undistributed net income of subsidiaries
|
85,742
|
|
78,784
|
|
107,450
|
|
|||||
|
Income tax benefit
|
(10,543
|
)
|
(11,834
|
)
|
(10,549
|
)
|
|||||
|
96,285
|
|
90,618
|
|
117,999
|
|
||||||
|
Equity in undistributed net income (loss) of:
|
|||||||||||
|
Bank subsidiaries
|
58,477
|
|
60,806
|
|
33,134
|
|
|||||
|
Non-bank subsidiaries
|
6,863
|
|
(1,922
|
)
|
6,761
|
|
|||||
|
Net Income
|
$
|
161,625
|
|
$
|
149,502
|
|
$
|
157,894
|
|
||
(1) Consists primarily of management fees received from subsidiary banks.
125
CONDENSED STATEMENTS OF CASH FLOWS
|
2016
|
2015
|
2014
|
|||||||||
|
|
(in thousands)
|
||||||||||
|
Cash Flows From Operating Activities:
|
|||||||||||
|
Net Income
|
$
|
161,625
|
|
$
|
149,502
|
|
$
|
157,894
|
|
||
|
Adjustments to reconcile net income to net cash provided by operating activities:
|
|||||||||||
|
Stock-based compensation
|
6,556
|
|
5,938
|
|
5,865
|
|
|||||
|
Excess tax benefits from stock-based compensation
|
(964
|
)
|
(201
|
)
|
(81
|
)
|
|||||
|
(Increase) decrease in other assets
|
(16,585
|
)
|
2,806
|
|
(7,120
|
)
|
|||||
|
Equity in undistributed net income of subsidiaries
|
(65,340
|
)
|
(58,884
|
)
|
(39,895
|
)
|
|||||
|
Loss on redemption of trust preferred securities
|
—
|
|
5,626
|
|
—
|
|
|||||
|
(Decrease) increase in other liabilities and payable to non-bank subsidiaries
|
(5,928
|
)
|
106,490
|
|
37,354
|
|
|||||
|
Total adjustments
|
(82,261
|
)
|
61,775
|
|
(3,877
|
)
|
|||||
|
Net cash provided by operating activities
|
79,364
|
|
211,277
|
|
154,017
|
|
|||||
|
Cash Flows From Investing Activities
|
—
|
|
—
|
|
—
|
|
|||||
|
Cash Flows From Financing Activities:
|
|||||||||||
|
Repayments of long-term debt
|
—
|
|
(254,640
|
)
|
—
|
|
|||||
|
Additions to long-term debt
|
—
|
|
147,779
|
|
97,113
|
|
|||||
|
Net proceeds from issuance of common stock
|
16,167
|
|
10,607
|
|
8,201
|
|
|||||
|
Excess tax benefits from stock-based compensation
|
964
|
|
201
|
|
81
|
|
|||||
|
Dividends paid
|
(69,382
|
)
|
(65,361
|
)
|
(64,028
|
)
|
|||||
|
Acquisition of treasury stock
|
(18,545
|
)
|
(50,000
|
)
|
(175,255
|
)
|
|||||
|
Deferred accelerated stock repurchase payment
|
—
|
|
—
|
|
(20,000
|
)
|
|||||
|
Net cash used in financing activities
|
(70,796
|
)
|
(211,414
|
)
|
(153,888
|
)
|
|||||
|
Net Increase (Decrease) in Cash and Cash Equivalents
|
8,568
|
|
(137
|
)
|
129
|
|
|||||
|
Cash and Cash Equivalents at Beginning of Year
|
—
|
|
137
|
|
8
|
|
|||||
|
Cash and Cash Equivalents at End of Year
|
$
|
8,568
|
|
$
|
—
|
|
$
|
137
|
|
||
126
Management Report on Internal Control Over Financial Reporting
The management of Fulton Financial Corporation is responsible for establishing and maintaining adequate internal control over financial reporting. Fulton Financial Corporation’s internal control system is designed to provide reasonable assurance regarding the reliability of financial reporting and the preparation of financial statements for external purposes in accordance with U.S. generally accepted accounting principles.
Because of its inherent limitations, internal control over financial reporting may not prevent or detect misstatements. Also, projections of any evaluation of effectiveness to future periods are subject to the risk that controls may become inadequate because of changes in conditions, or that the degree of compliance with the policies or procedures may deteriorate.
Management assessed the effectiveness of the Company’s internal control over financial reporting as of
December 31, 2016
, using the criteria set forth by the Committee of Sponsoring Organizations of the Treadway Commission (COSO) in Internal Control – Integrated Framework (2013). Based on this assessment, management concluded that, as of
December 31, 2016
, the company’s internal control over financial reporting is effective based on those criteria.
|
/s/ E. P
HILIP
W
ENGER
|
|
E. Philip Wenger
Chairman, Chief Executive Officer and President
|
|
/s/ P
HILMER
H. R
OHRBAUGH
|
|
Philmer H. Rohrbaugh
Senior Executive Vice President,
Chief Operating Officer and Chief Financial Officer
|
127
Report of Independent Registered Public Accounting Firm
The Board of Directors and Stockholders
Fulton Financial Corporation:
We have audited the accompanying consolidated balance sheets of Fulton Financial Corporation (the Company) and subsidiaries as of December 31, 2016 and 2015, and the related consolidated statements of income, comprehensive income, shareholders’ equity, and cash flows for each of the years in the three-year period ended December 31, 2016. We also have audited the Company’s internal control over financial reporting as of December 31, 2016, based on criteria established in
Internal Control - Integrated Framework (2013)
issued by the Committee of Sponsoring Organizations of the Treadway Commission (COSO). The Company’s management is responsible for these consolidated financial statements, for maintaining effective internal control over financial reporting, and for its assessment of the effectiveness of internal control over financial reporting, included in the accompanying
Management Report on Internal Control Over Financial Reporting
. Our responsibility is to express an opinion on these consolidated financial statements and an opinion on the Company’s internal control over financial reporting based on our audits.
We conducted our audits in accordance with the standards of the Public Company Accounting Oversight Board (United States). Those standards require that we plan and perform the audits to obtain reasonable assurance about whether the financial statements are free of material misstatement and whether effective internal control over financial reporting was maintained in all material respects. Our audits of the consolidated financial statements included examining, on a test basis, evidence supporting the amounts and disclosures in the financial statements, assessing the accounting principles used and significant estimates made by management, and evaluating the overall financial statement presentation. Our audit of internal control over financial reporting included obtaining an understanding of internal control over financial reporting, assessing the risk that a material weakness exists, and testing and evaluating the design and operating effectiveness of internal control based on the assessed risk. Our audits also included performing such other procedures as we considered necessary in the circumstances. We believe that our audits provide a reasonable basis for our opinions.
A company’s internal control over financial reporting is a process designed to provide reasonable assurance regarding the reliability of financial reporting and the preparation of financial statements for external purposes in accordance with generally accepted accounting principles. A company’s internal control over financial reporting includes those policies and procedures that (1) pertain to the maintenance of records that, in reasonable detail, accurately and fairly reflect the transactions and dispositions of the assets of the company; (2) provide reasonable assurance that transactions are recorded as necessary to permit preparation of financial statements in accordance with generally accepted accounting principles, and that receipts and expenditures of the company are being made only in accordance with authorizations of management and directors of the company; and (3) provide reasonable assurance regarding prevention or timely detection of unauthorized acquisition, use, or disposition of the company’s assets that could have a material effect on the financial statements.
Because of its inherent limitations, internal control over financial reporting may not prevent or detect misstatements. Also, projections of any evaluation of effectiveness to future periods are subject to the risk that controls may become inadequate because of changes in conditions, or that the degree of compliance with the policies or procedures may deteriorate.
In our opinion, the consolidated financial statements referred to above present fairly, in all material respects, the financial position of Fulton Financial Corporation and subsidiaries as of December 31, 2016 and 2015, and the results of its operations and its cash flows for each of the years in the three-year period ended December 31, 2016, in conformity with U.S. generally accepted accounting principles. Also in our opinion, Fulton Financial Corporation and subsidiaries maintained, in all material respects, effective internal control over financial reporting as of December 31, 2016, based on criteria established in
Internal Control - Integrated Framework (2013)
issued by COSO.
|
/s/ KPMG LLP
|
|
Philadelphia, Pennsylvania
|
|
February 27, 2017
|
128
QUARTERLY CONSOLIDATED RESULTS OF OPERATIONS (UNAUDITED)
(in thousands, except per-share data)
|
Three Months Ended
|
|||||||||||||||
|
|
March 31
|
June 30
|
September 30
|
December 31
|
|||||||||||
|
2016
|
|||||||||||||||
|
Interest income
|
$
|
149,311
|
|
$
|
149,309
|
|
$
|
151,468
|
|
$
|
153,012
|
|
|||
|
Interest expense
|
20,257
|
|
20,393
|
|
20,903
|
|
20,775
|
|
|||||||
|
Net interest income
|
129,054
|
|
128,916
|
|
130,565
|
|
132,237
|
|
|||||||
|
Provision for credit losses
|
1,530
|
|
2,511
|
|
4,141
|
|
5,000
|
|
|||||||
|
Non-interest income
|
43,137
|
|
46,137
|
|
48,149
|
|
52,755
|
|
|||||||
|
Non-interest expenses
|
120,413
|
|
121,637
|
|
119,848
|
|
127,621
|
|
|||||||
|
Income before income taxes
|
50,248
|
|
50,905
|
|
54,725
|
|
52,371
|
|
|||||||
|
Income tax expense
|
11,991
|
|
11,155
|
|
13,257
|
|
10,221
|
|
|||||||
|
Net income
|
$
|
38,257
|
|
$
|
39,750
|
|
$
|
41,468
|
|
$
|
42,150
|
|
|||
|
Per share data:
|
|||||||||||||||
|
Net income (basic)
|
$
|
0.22
|
|
$
|
0.23
|
|
$
|
0.24
|
|
$
|
0.24
|
|
|||
|
Net income (diluted)
|
0.22
|
|
0.23
|
|
0.24
|
|
0.24
|
|
|||||||
|
Cash dividends
|
0.09
|
|
0.10
|
|
0.10
|
|
0.12
|
|
|||||||
|
2015
|
|||||||||||||||
|
Interest income
|
$
|
145,772
|
|
$
|
144,229
|
|
$
|
146,228
|
|
$
|
147,560
|
|
|||
|
Interest expense
|
22,191
|
|
21,309
|
|
20,534
|
|
19,761
|
|
|||||||
|
Net interest income
|
123,581
|
|
122,920
|
|
125,694
|
|
127,799
|
|
|||||||
|
Provision for credit losses
|
(3,700
|
)
|
2,200
|
|
1,000
|
|
2,750
|
|
|||||||
|
Non-interest income
|
44,737
|
|
46,489
|
|
44,774
|
|
45,839
|
|
|||||||
|
Non-interest expenses
|
118,478
|
|
118,354
|
|
124,889
|
|
118,439
|
|
|||||||
|
Income before income taxes
|
53,540
|
|
48,855
|
|
44,579
|
|
52,449
|
|
|||||||
|
Income tax expense
|
13,504
|
|
12,175
|
|
10,328
|
|
13,914
|
|
|||||||
|
Net income
|
$
|
40,036
|
|
$
|
36,680
|
|
$
|
34,251
|
|
$
|
38,535
|
|
|||
|
Per share data:
|
|||||||||||||||
|
Net income (basic)
|
$
|
0.22
|
|
$
|
0.21
|
|
$
|
0.20
|
|
$
|
0.22
|
|
|||
|
Net income (diluted)
|
0.22
|
|
0.21
|
|
0.20
|
|
0.22
|
|
|||||||
|
Cash dividends
|
0.09
|
|
0.09
|
|
0.09
|
|
0.11
|
|
|||||||
129
Not applicable.
Disclosure Controls and Procedures
The Corporation carried out an evaluation, under the supervision and with the participation of the Corporation’s management, including the Corporation’s Chief Executive Officer and Chief Financial Officer, of the effectiveness of its disclosure controls and procedures, as defined in Exchange Act Rules 13a-15(e) and 15d-15(e). Based upon the evaluation, the Corporation’s Chief Executive Officer and Chief Financial Officer concluded that, as of
December 31, 2016
, the Corporation’s disclosure controls and procedures are effective. Disclosure controls and procedures are controls and procedures that are designed to ensure that information required to be disclosed in the Corporation’s reports filed or submitted under the Exchange Act is recorded, processed, summarized and reported within the time periods specified in the Securities and Exchange Commission’s rules and forms.
The "Management Report on Internal Control over Financial Reporting" and the "Report of Independent Registered Public Accounting Firm" may be found in Item 8, "Financial Statements and Supplementary Data" of this document.
Changes in Internal Controls
There was no change in the Corporation’s "internal control over financial reporting" (as such term is defined in Rule 13a-15(f) under the Exchange Act) that occurred during the last fiscal quarter that has materially affected, or is reasonably likely to materially affect, the Corporation’s internal control over financial reporting.
Not applicable.
130
Incorporated by reference herein is the information appearing under the headings "Information about Nominees, Directors and Independence Standards," "Related Person Transactions," "Section 16(a) Beneficial Ownership Reporting Compliance," "Code of Conduct," "Procedure for Shareholder Nominations," and "Other Board Committees" within the Corporation’s
2017
Proxy Statement. The information concerning executive officers required by this Item is provided under the caption "Executive Officers" within Item 1, Part I, "Business" in this Annual Report.
The Corporation has adopted a code of ethics (Code of Conduct) that applies to all directors, officers and employees, including the Chief Executive Officer, the Chief Financial Officer and the Corporate Controller. A copy of the Code of Conduct may be obtained free of charge by writing to the Corporate Secretary at Fulton Financial Corporation, P.O. Box 4887, Lancaster, Pennsylvania 17604-4887, and is also available via the internet at www.fult.com.
Incorporated by reference herein is the information appearing under the headings "Information Concerning Compensation" and "Human Resources Committee Interlocks and Insider Participation" within the Corporation’s
2017
Proxy Statement.
Incorporated by reference herein is the information appearing under the heading "Security Ownership of Directors, Nominees, Management and Certain Beneficial Owners" within the Corporation’s
2017
Proxy Statement, and information appearing under the heading "Securities Authorized for Issuance under Equity Compensation Plans" within Item 5, "Market for Registrant’s Common Equity, Related Shareholder Matters and Issuer Purchases of Equity Securities" in this Annual Report.
Incorporated by reference herein is the information appearing under the headings "Related Person Transactions" and "Information about Nominees, Directors and Independence Standards" within the Corporation’s
2017
Proxy Statement, and the information appearing in "Note 4 - Loans and Allowance for Credit Losses," of the Notes to Consolidated Financial Statements in Item 8, "Financial Statements and Supplementary Data" in this Annual Report.
Incorporated by reference herein is the information appearing under the heading "Relationship With Independent Public Accountants" within the Corporation’s
2017
Proxy Statement.
131
(a) The following documents are filed as part of this report:
|
1.
|
Financial Statements — The following consolidated financial statements of Fulton Financial Corporation and subsidiaries are incorporated herein by reference in response to Item 8 above:
|
|
|
(i)
|
Consolidated Balance Sheets - December 31, 2016 and 2015.
|
|
|
(ii)
|
Consolidated Statements of Income - Years ended December 31, 2016, 2015 and 2014.
|
|
|
(iii)
|
Consolidated Statements of Comprehensive Income - Years ended December 31, 2016, 2015 and 2014.
|
|
|
(iii)
|
Consolidated Statements of Shareholders’ Equity - Years ended December 31, 2016, 2015 and 2014.
|
|
|
(iv)
|
Consolidated Statements of Cash Flows - Years ended December 31, 2016, 2015 and 2014.
|
|
|
(v)
|
Notes to Consolidated Financial Statements.
|
|
|
(vi)
|
Report of Independent Registered Public Accounting Firm.
|
|
|
2.
|
Financial Statement Schedules — All financial statement schedules for which provision is made in the applicable accounting regulations of the Securities and Exchange Commission are not required under the related instructions or are inapplicable and have therefore been omitted.
|
|
|
3.
|
Exhibits - The information required by this Section (a)(3) of Item 15 is set forth on the Exhibit Index that follows the Signatures page of this Form 10-K.
|
|
Not applicable.
132
SIGNATURES
Pursuant to the requirements of Section 13 or 15(d) of the Securities Exchange Act of 1934, the Registrant has duly caused this Report to be signed on its behalf by the undersigned, thereunto duly authorized.
|
FULTON FINANCIAL CORPORATION
|
|||
|
(Registrant)
|
|||
|
Dated:
|
February 27, 2017
|
By:
|
/
S
/ E. P
HILIP
W
ENGER
|
|
E. Philip Wenger, Chairman, Chief Executive Officer and President
|
|||
Pursuant to the requirements of the Securities Exchange Act of 1934, this Report has been executed below by the following persons on behalf of the Registrant and in the capacities and on the dates indicated.
|
Signature
|
|
Capacity
|
|
Date
|
|
/S/
L
ISA
C
RUTCHFIELD
|
|
Director
|
|
February 27, 2017
|
|
Lisa Crutchfield
|
||||
|
/S/
M
ICHAEL
J
.
D
E
P
ORTER
|
|
Executive Vice President and Controller
(Principal Accounting Officer)
|
|
February 27, 2017
|
|
Michael J. DePorter
|
||||
|
/S/
D
ENISE
L
.
D
EVINE
|
|
Director
|
|
February 27, 2017
|
|
Denise L. Devine
|
||||
|
/S/
P
ATRICK
J
.
F
REER
|
|
Director
|
|
February 27, 2017
|
|
Patrick J. Freer
|
||||
|
/S/
G
EORGE
W
.
H
ODGES
|
|
Director
|
|
February 27, 2017
|
|
George W. Hodges
|
||||
|
/S/
A
LBERT
M
ORRISON, III
|
|
Director
|
|
February 27, 2017
|
|
Albert Morrison, III
|
||||
|
/S/
J
AMES
R
.
M
OXLEY, III
|
|
Director
|
|
February 27, 2017
|
|
James R. Moxley, III
|
||||
|
/S/
P
HILMER
H
.
R
OHRBAUGH
|
Senior Executive Vice President,
|
February 27, 2017
|
||
|
Philmer H. Rohrbaugh
|
Chief Operating Officer and
|
|||
|
Chief Financial Officer
|
||||
|
(Principal Financial Officer)
|
||||
133
|
Signature
|
|
Capacity
|
|
Date
|
|
/S/
R
.
S
COTT
S
MITH, JR.
|
|
Director
|
|
February 27, 2017
|
|
R. Scott Smith, Jr.
|
||||
|
/S/
S
COTT
A
.
S
NYDER
|
|
Director
|
February 27, 2017
|
|
|
Scott A. Snyder
|
||||
|
/S/
R
ONALD
H
.
S
PAIR
|
|
Director
|
February 27, 2017
|
|
|
Ronald H. Spair
|
||||
|
/S/
M
ARK
F
.
S
TRAUSS
|
|
Director
|
|
February 27, 2017
|
|
Mark F. Strauss
|
||||
|
/S/
E
RNEST
J
.
W
ATERS
|
|
Director
|
|
February 27, 2017
|
|
Ernest J. Waters
|
||||
|
/S/
E
.
P
HILIP
W
ENGER
|
|
Chairman, Chief Executive Officer and President (Principal Executive Officer)
|
|
February 27, 2017
|
|
E. Philip Wenger
|
||||
134
EXHIBIT INDEX
Exhibits Required Pursuant to Item 601 of Regulation S-K
|
3.1
|
|
Articles of Incorporation, as amended and restated, of Fulton Financial Corporation as amended – Incorporated by reference to Exhibit 3.1 of the Fulton Financial Corporation Current Report Form 8-K dated June 24, 2011.
|
|
|
3.2
|
|
Bylaws of Fulton Financial Corporation as amended – Incorporated by reference to Exhibit 3.1 of the Fulton Financial Corporation Current Report on Form 8-K dated September 16, 2014.
|
|
|
4.1
|
|
First Supplemental Indenture entered into on May 1, 2007 between Fulton Financial Corporation and Wilmington Trust Company as trustee, relating to the issuance by Fulton Financial Corporation of $100 million aggregate principal amount of 5.75% subordinated notes due May 1, 2017 – Incorporated by reference to Exhibit 4.1 of the Fulton Financial Corporation Current Report on Form 8-K dated May 1, 2007.
|
|
|
4.2
|
|
An Indenture entered into on November 17, 2014 between Fulton Financial Corporation and Wilmington Trust, National Association as trustee, relating to the issuance by Fulton Financial Corporation of $250 million aggregate principal amount of 4.50% subordinated notes due November 15, 2024 – Incorporated by reference to Exhibit 4.1 of the Fulton Financial Corporation Current Report on Form 8-K dated November 12, 2014.
|
|
|
10.1
|
|
Amended Employment Agreement between Fulton Financial Corporation and E. Philip Wenger dated November 12, 2008 – Incorporated by reference to Exhibit 10.5 of the Fulton Financial Corporation Current Report on Form 8-K dated November 14, 2008.
|
|
|
10.2
|
|
Employment Agreement between Fulton Financial Corporation and Craig A. Roda dated August 1, 2011 – Incorporated by reference to Exhibit 10.1 of the Fulton Financial Corporation Current Report on Form 8-K dated August 5, 2011.
|
|
|
10.3
|
|
Employment Agreement between Fulton Financial Corporation and Philmer H. Rohrbaugh dated November 1, 2012 – Incorporated by reference to Exhibit 10.1 of the Fulton Financial Corporation Current Report on Form 8-K dated October 22, 2012.
|
|
|
10.4
|
|
Employment Agreement between Fulton Financial Corporation and Meg R. Mueller dated July 1, 2013 – Incorporated by reference to Exhibit 10.1 of the Fulton Financial Corporation Current Report on Form 8-K dated June 21, 2013.
|
|
|
10.5
|
|
Employment Agreement between Fulton Financial Corporation and Curtis J. Myers dated July 1, 2013 – Incorporated by reference to Exhibit 10.2 of the Fulton Financial Corporation Current Report on Form 8-K dated June 21, 2013.
|
|
|
10.6
|
|
Employment Agreement between Fulton Financial Corporation and Angela M. Sargent dated July 1, 2013 – Incorporated by reference to Exhibit 10.1 of the Fulton Financial Corporation Current Report on Form 8-K dated June 21, 2013.
|
|
|
10.7
|
|
Employment Agreement between Fulton Financial Corporation and Patrick S. Barrett dated November 4, 2013 – Incorporated by reference to Exhibit 10.1 of the Fulton Financial Corporation Current Report on Form 8-K dated October 24, 2013.
|
|
|
10.8
|
|
Employment Agreement between Fulton Financial Corporation and Beth Ann L. Chivinski dated April 1, 2014 - Incorporated by reference to Exhibit 10.1 of the Fulton Financial Corporation Current Report on Form 8-K dated May 3, 2016.
|
|
|
10.9
|
|
Form of Death Benefit Only Agreement to Senior Management – Incorporated by reference to Exhibit 10.9 of the Fulton Financial Corporation Annual Report on Form 10K for the fiscal year ended December 31, 2006.
|
|
|
10.10
|
|
Fulton Financial Corporation Amended and Restated Equity and Cash Incentive Compensation Plan – Incorporated by reference to Exhibit 10.1 of the Fulton Financial Corporation Current Report on Form 8-K dated May 3, 2013.
|
|
|
10.11
|
|
Amendment No. 1 to Fulton Financial Corporation Amended and Restated Equity and Cash Incentive Compensation Plan - Incorporated by reference to Exhibit 10.1 of the Fulton Financial Corporation Quarterly Report on Form 10-Q for the quarterly period ended June 30, 2016.
|
|
|
10.12
|
|
Form of Option Award and Form of Restricted Stock Award under the Fulton Financial Corporation Amended and Restated Equity and Cash Incentive Compensation Plan between Fulton Financial Corporation and Officers of the Corporation – Incorporated by reference to Exhibits 10.1 and 10.2, respectively, of the Fulton Financial Corporation Current Report on Form 8-K dated June 19, 2013.
|
|
135
|
10.13
|
|
Amended and Restated Fulton Financial Corporation Employee Stock Purchase Plan – Incorporated by reference to Exhibit A to Fulton Financial Corporation’s definitive proxy statement, dated March 26, 2014.
|
|
|
10.14
|
|
Fulton Financial Corporation Deferred Compensation Plan, as amended and restated effective December 1, 2015 – Incorporated by reference to Exhibit 10.12 of the Fulton Financial Corporation Annual Report on Form 10-K for the fiscal year ended December 31, 2016.
|
|
|
10.15
|
|
Agreement between Fulton Financial Corporation and Fiserv Solutions, Inc. dated July 11, 2016 - Incorporated by reference to Exhibit 10.1 of the Fulton Financial Corporation Quarterly Report on Form 10-Q for the quarterly period ended September 30, 2016. Portions of this exhibit have been redacted and are subject to a confidential treatment request filed with the Securities and Exchange Commission pursuant to Rule 24b-2 under the Securities Exchange Act of 1934, as amended. The redacted material was filed separately with the Securities and Exchange Commission.
|
|
|
10.16
|
|
Fulton Financial Corporation 2011 Directors' Equity Participation Plan – Incorporated by reference to Exhibit A to Fulton Financial Corporation’s definitive proxy statement, dated March 24, 2011.
|
|
|
10.17
|
|
Form of Restricted Stock Award Agreement between Fulton Financial Corporation and Directors of the Corporation as of July 1, 2011 – Incorporated by reference to Exhibit 10.1 of the Fulton Financial Corporation Quarterly Report on Form 10-Q for quarterly period ended June 30, 2011.
|
|
|
10.18
|
|
Forms of Time-Vested Restricted Stock Unit Award Agreement and Performance Share Restricted Stock Unit Award Agreement between Fulton Financial Corporation and Certain Employees of the Corporation as of March 18, 2014 – Incorporated by reference to Exhibits 10.1 and 10.2, respectively, of the Fulton Financial Corporation Current Report on Form 8-K dated March 24, 2014.
|
|
|
10.19
|
|
Form of Master Confirmation between Fulton Financial Corporation and Goldman, Sachs & Co. - Incorporated by reference to Exhibit 10.1 of the Fulton Financial Corporation Current Report on Form 8-K dated November 12, 2014.
|
|
|
12
|
|
Computation of Consolidated Ratios of Earnings to Fixed Charges - filed herewith.
|
|
|
21
|
|
Subsidiaries of the Registrant.
|
|
|
23
|
|
Consent of Independent Registered Public Accounting Firm.
|
|
|
31.1
|
|
Certification of Chief Executive Officer pursuant to Section 302 of the Sarbanes-Oxley Act of 2002.
|
|
|
31.2
|
|
Certification of Chief Financial Officer pursuant to Section 302 of the Sarbanes-Oxley Act of 2002.
|
|
|
32.1
|
|
Certification of Chief Executive Officer pursuant to Section 906 of the Sarbanes-Oxley Act of 2002.
|
|
|
32.2
|
|
Certification of Chief Financial Officer pursuant to Section 906 of the Sarbanes-Oxley Act of 2002.
|
|
|
101
|
|
Interactive data file containing the following financial statements formatted in XBRL (Extensible Business Reporting Language): (i) the Consolidated Balance Sheets at December 31, 2016 and December 31, 2015; (ii) the Consolidated Statements of Income for the years ended December 31, 2016, 2015 and 2014; (iii) the Consolidated Statements of Comprehensive Income for the years ended December 31, 2016, 2015 and 2014;(iv) the Consolidated Statements of Shareholders’ Equity for the years ended December 31, 2016, 2015 and 2014; (v) the Consolidated Statements of Cash Flows for the years ended December 31, 2016, 2015 and 2014; and, (iv) the Notes to Consolidated Financial Statements – filed herewith.
|
|
136
TABLE OF CONTENTS
Part IItem 1. BusinessItem 1A. Risk FactorsItem 1B. Unresolved Staff CommentsItem 2. PropertiesItem 3. Legal ProceedingsItem 4. Mine Safety DisclosuresPart IIItem 5. Market For Registrant S Common Equity, Related Stockholder Matters and Issuer Purchases Of Equity SecuritiesItem 6. Selected Financial DataItem 7. Management S Discussion and Analysis Of Financial Condition and Results Of OperationsItem 7A. Quantitative and Qualitative Disclosures About Market RiskItem 8. Financial Statements and Supplementary DataNote 1 Summary Of Significant Accounting PoliciesNote 2 Restrictions on Cash and Due From BanksNote 3 Investment SecuritiesNote 4 Loans and Allowance For Credit LossesNote 5 Premises and EquipmentNote 6 Goodwill and Intangible AssetsNote 7 Mortgage Servicing RightsNote 8 DepositsNote 9 Short-term Borrowings and Long-term DebtNote 10 Derivative Financial InstrumentsNote 11 Regulatory MattersNote 12 Income TaxesNote 13 Employee Benefit PlansNote 14 Shareholders EquityNote 15 Stock-based Compensation PlansNote 16 LeasesNote 17 Commitments and ContingenciesNote 18 Fair Value MeasurementsNote 19 Condensed Financial Information - Parent Company OnlyItem 9. Changes in and Disagreements with Accountants on Accounting and Financial DisclosureItem 9A. Controls and ProceduresItem 9B. Other InformationPart IIIItem 10. Directors, Executive Officers and Corporate GovernanceItem 11. Executive CompensationItem 12. Security Ownership Of Certain Beneficial Owners and Management and Related Stockholder MattersItem 13. Certain Relationships and Related Transactions, and Director IndependenceItem 14. Principal Accounting Fees and ServicesPart IVItem 15. Exhibits and Financial Statement SchedulesItem 16. Form 10-k Summary