|
|
|
|
|
|
|
|
|
|
|
|
|
|
|
|
|
|
|
|
|
|
|
|
|
|
|
|
|
|
|
|
|
|
|
|
|
|
|
|
|
|
|
|
|
|
|
|
|
|
|
|
|
|
|
|
Table of Contents
UNITED STATES
SECURITIES AND EXCHANGE COMMISSION
Washington, D.C. 20549
FORM 10-K
| x | ANNUAL REPORT PURSUANT TO SECTION 13 OR 15 (d) OF THE SECURITIES EXCHANGE ACT OF 1934 |
For the fiscal year ended December 31, 2011
or
| ¨ | TRANSITION REPORT PURSUANT TO SECTION 13 OR 15 (d) OF THE SECURITIES EXCHANGE ACT OF 1934 |
For the transition period from to
Commission file number 000-18911
GLACIER BANCORP, INC.
(Exact name of registrant as specified in its charter)
| MONTANA | 81-0519541 | |
|
(State or other jurisdiction of incorporation or organization) |
(IRS Employer Identification No.) |
|
| 49 Commons Loop, Kalispell, Montana | 59901 | |
| (Address of principal executive offices) | (Zip Code) | |
(406) 756-4200
(Registrant’s telephone number, including area code)
Securities registered pursuant to Section 12(b) of the Act:
| Common Stock, $0.01 par value per share | NASDAQ Global Select Market | |
| (Title of each class) | (Name of each exchange on which registered) |
Securities registered pursuant to Section 12(g) of the Act: NONE
Indicate by check mark if the registrant is a well-known seasoned issuer, as defined in Rule 405 of the Securities Act. x Yes ¨ No
Indicate by check mark if the registrant is not required to file reports pursuant to Section 13 or Section 15(d) of the Act. ¨ Yes x No
Indicate by check mark whether the registrant (1) has filed all reports required to be filed by Section 13 or 15(d) of the Securities Exchange Act of 1934 during the preceding 12 months (or for such shorter period that the registrant was required to file such reports), and (2) has been subject to such filing requirements for the past 90 days. x Yes ¨ No
Indicate by check mark whether the registrant has submitted electronically and posted on its corporate Website, if any, every Interactive Data File required to be submitted and posted pursuant to Rule 405 of Regulation S-T during the preceding 12 months. x Yes ¨ No
Indicate by check mark if disclosure of delinquent filers pursuant to item 405 of regulation S-K is not contained herein, and will not be contained, to the best of registrant’s knowledge, in definitive proxy or information statements incorporated by reference in Part III of this Form 10-K or any amendment to this Form 10-K. x
Indicate by check mark whether the Registrant is a large accelerated filer, an accelerated filer, a non-accelerated filer, or a smaller reporting company.
| Large accelerated filer | x | Accelerated filer | ¨ | |||
| Non-accelerated filer | ¨ | Smaller reporting company | ¨ | |||
Indicate by check mark whether the registrant is a shell company (as defined in Rule 12b-2 of the Exchange Act). ¨ Yes x No
The aggregate market value of the voting common equity held by non-affiliates of the Registrant at June 30, 2011 (the last business day of the most recent second quarter), was $941,037,169 (based on the average bid and ask price as quoted on the NASDAQ Global Select Market at the close of business on that date).
As of February 14, 2012, there were issued and outstanding 71,915,073 shares of the Registrant’s common stock. No preferred shares are issued or outstanding.
Document Incorporated by Reference
Portions of the 2012 Annual Meeting Proxy Statement dated March 28, 2012 are incorporated by reference into Part III of this Form 10-K.
Table of Contents
GLACIER BANCORP, INC.
FORM 10-K ANNUAL REPORT
For the Year ended December 31, 2011
| Page | ||||||
| PART I | ||||||
|
Item 1 |
3 | |||||
|
Item 1A |
15 | |||||
|
Item 1B |
20 | |||||
|
Item 2 |
20 | |||||
|
Item 3 |
21 | |||||
| PART II | ||||||
|
Item 5 |
21 | |||||
|
Item 6 |
23 | |||||
|
Item 7 |
Management’s Discussion and Analysis of Financial Condition and Results of Operations |
26 | ||||
|
Item 7A |
63 | |||||
|
Item 8 |
65 | |||||
|
Item 9 |
Changes in and Disagreements with Accountants in Accounting and Financial Disclosures |
117 | ||||
|
Item 9A |
117 | |||||
|
Item 9B |
117 | |||||
|
Item 10 |
118 | |||||
|
Item 11 |
118 | |||||
|
Item 12 |
Security Ownership of Certain Beneficial Owners and Management and Related Stockholder Matters |
118 | ||||
|
Item 13 |
Certain Relationships and Related Transactions, and Director Independence |
118 | ||||
|
Item 14 |
118 | |||||
|
Item 15 |
119 | |||||
Table of Contents
| Item 1. | Business |
GENERAL DEVELOPMENT OF BUSINESS
Glacier Bancorp, Inc. (the “Company”), headquartered in Kalispell, Montana, is a Montana corporation incorporated in 2004 as a successor corporation to the Delaware corporation originally incorporated in 1990. The Company is a regional multi-bank holding company providing commercial banking services from 106 locations in Montana, Idaho, Wyoming, Colorado, Utah and Washington. The Company offers a wide range of banking products and services, including transaction and savings deposits, real estate, commercial, agriculture, and consumer loans, mortgage origination services, and retail brokerage services. The Company serves individuals, small to medium-sized businesses, community organizations and public entities. For information regarding the Company’s lending, investment and funding activities, see “Item 7. Management’s Discussion and Analysis of Financial Condition and Results of Operations.”
Subsidiaries
The Company includes the parent holding company (“Parent”) and the following wholly-owned nineteen subsidiaries which consist of eleven bank subsidiaries (collectively referred to hereafter as the “Banks”) and eight other subsidiaries.
| Bank Subsidiaries | ||
|
Montana Glacier Bank (“Glacier”) founded in 1955 First Security Bank of Missoula (“First Security”) founded in 1973 Western Security Bank (“Western”) founded in 2001 Big Sky Western Bank (“Big Sky”) founded in 1990 Valley Bank of Helena (“Valley”) founded in 1978 First Bank of Montana (“First Bank-MT”) founded in 1924
Colorado Bank of the San Juans (“San Juans”) founded in 1998 |
Idaho Mountain West Bank (“Mountain West”) founded in 1993 Citizens Community Bank (“Citizens”) founded in 1996
Wyoming 1 st Bank (“1 st Bank”) founded in 1989 First Bank of Wyoming (“First Bank-WY”) founded in 1912 |
|
|
Other Subsidiaries GBCI Other Real Estate (“GORE”) Glacier Capital Trust II (“Glacier Trust II”) Glacier Capital Trust III (“Glacier Trust III”) Glacier Capital Trust IV (“Glacier Trust IV”) Citizens (ID) Statutory Trust I (“Citizens Trust I”) Bank of the San Juans Bancorporation Trust I (“San Juans Trust I”) First Company Statutory Trust 2001 (“First Co Trust 01”) First Company Statutory Trust 2003 (“First Co Trust 03”) |
||
The Company formed GORE to isolate certain bank foreclosed properties for legal protection and administrative purposes. The foreclosed properties were sold to GORE at fair market value in 2011 and 2010 by bank subsidiaries and properties remaining are currently held for sale.
The Company formed or acquired Glacier Trust II, Glacier Trust III, Glacier Trust IV, Citizens Trust I, San Juans Trust I, First Co Trust 01, and First Co Trust 03 as financing subsidiaries. The trusts were formed for the purpose of issuing trust preferred securities and the subsidiaries are not consolidated into the Company’s financial statements. The preferred securities entitle the shareholder to receive cumulative cash distributions from payments on subordinated debentures of the Company. For additional information regarding the subordinated debentures, see Note 10 to the Consolidated Financial Statements in “Item 8. Financial Statements and Supplementary Data.”
3
Table of Contents
The Company provides full service brokerage services (selling products such as stocks, bonds, mutual funds, limited partnerships, annuities and other insurance products) through Raymond James Financial Services, a non-affiliated company, at Glacier and Big Sky. The Company shares in the commissions generated, without devoting significant employee time to this portion of the business.
In January 2012, the Company announced that it plans to combine its eleven bank subsidiaries into a single commercial bank. The bank subsidiaries will operate as separate divisions of Glacier under the same names, management teams and divisions as before the consolidation. As part of the consolidation, the Company will file with the appropriate federal and state bank regulators an application to merge the bank subsidiaries. The resulting bank Board of Directors and executive officers will be the Board of Directors and senior management team of the Parent. The consolidation is expected to be completed early in the second quarter of 2012, following regulatory approvals.
Acquisitions
The Company’s strategy has been to profitably grow its business through internal growth and selective acquisitions. The Company continues to look for profitable expansion opportunities in existing markets and new markets in the Rocky Mountain states. During the last five years, the Company has completed the following acquisitions: On October 2, 2009, First Company and its subsidiary, First Bank of Wyoming, formerly First National Bank & Trust, was acquired by the Company. On December 1, 2008, Bank of the San Juans Bancorporation and its subsidiary, Bank of the San Juans in Durango, Colorado, was acquired by the Company. On April 30, 2007, North Side State Bank (“North Side”) in Rock Springs, Wyoming was acquired and became a part of 1 st Bank.
Bank Locations at December 31, 2011
The following is a list of the Parent and bank subsidiaries’ main office locations as of December 31, 2011. See “Item 2. Properties.”
| Glacier Bancorp, Inc. | 49 | Commons Loop, Kalispell, MT 59901 | (406) 756-4200 | |||
| Glacier | 202 | Main Street, Kalispell, MT 59901 | (406) 756-4200 | |||
| Mountain West | 125 | Ironwood Drive, Coeur d’Alene, Idaho 83814 | (208) 765-0284 | |||
| First Security | 1704 | Dearborn, Missoula, MT 59801 | (406) 728-3115 | |||
| Western | 2812 | 1 st Avenue North, Billings, MT 59101 | (406) 371-8258 | |||
| 1 st Bank | 1001 | Main Street, Evanston, WY 82930 | (307) 789-3864 | |||
| Valley | 3030 | North Montana Avenue, Helena, MT 59601 | (406) 495-2400 | |||
| Big Sky | 4150 | Valley Commons, Bozeman, MT 59718 | (406) 587-2922 | |||
| First Bank-WY | 245 | East First Street, Powell, WY 82435 | (307) 754-2201 | |||
| Citizens | 280 | South Arthur, Pocatello, ID 83204 | (208) 232-5373 | |||
| First Bank–MT | 224 | West Main, Lewistown, MT 59457 | (406) 538-7471 | |||
| San Juans | 144 | East Eighth Street, Durango, CO 81301 | (970) 247-1818 |
4
Table of Contents
Financial Information about Segments
The following schedules provide selected financial data for the Company’s operating segments:
| Glacier | Mountain West | First Security | ||||||||||||||||||||||||||||||||||
|
(Dollars in thousands) |
2011 | 2010 | 2009 | 2011 | 2010 | 2009 | 2011 | 2010 | 2009 | |||||||||||||||||||||||||||
|
Condensed Income Statements |
||||||||||||||||||||||||||||||||||||
|
Net interest income |
49,220 | 50,260 | 57,139 | 42,603 | 47,786 | 53,302 | 38,224 | 35,676 | 35,788 | |||||||||||||||||||||||||||
|
Non-interest income |
15,571 | 15,272 | 15,387 | 22,608 | 26,148 | 27,882 | 7,384 | 7,799 | 8,103 | |||||||||||||||||||||||||||
|
|
|
|
|
|
|
|
|
|
|
|
|
|
|
|
|
|
|
|||||||||||||||||||
|
Total revenues |
64,791 | 65,532 | 72,526 | 65,211 | 73,934 | 81,184 | 45,608 | 43,475 | 43,891 | |||||||||||||||||||||||||||
|
Provision for loan losses |
(16,800 | ) | (20,050 | ) | (32,000 | ) | (30,100 | ) | (45,000 | ) | (50,500 | ) | (9,950 | ) | (8,100 | ) | (10,450 | ) | ||||||||||||||||||
|
Core deposit intangibles amortization |
(119 | ) | (192 | ) | (330 | ) | (66 | ) | (172 | ) | (184 | ) | (261 | ) | (425 | ) | (468 | ) | ||||||||||||||||||
|
Goodwill impairment charge |
— | — | — | (23,159 | ) | — | — | — | — | — | ||||||||||||||||||||||||||
|
Other non-interest expense |
(30,537 | ) | (29,113 | ) | (27,325 | ) | (52,769 | ) | (51,203 | ) | (51,525 | ) | (20,548 | ) | (21,842 | ) | (18,897 | ) | ||||||||||||||||||
|
|
|
|
|
|
|
|
|
|
|
|
|
|
|
|
|
|
|
|||||||||||||||||||
|
Income (loss) before income taxes |
17,335 | 16,177 | 12,871 | (40,883 | ) | (22,441 | ) | (21,025 | ) | 14,849 | 13,108 | 14,076 | ||||||||||||||||||||||||
|
Income tax (expense) benefit |
(3,386 | ) | (2,989 | ) | (2,803 | ) | 16,087 | 10,262 | 9,764 | (2,936 | ) | (2,798 | ) | (3,372 | ) | |||||||||||||||||||||
|
|
|
|
|
|
|
|
|
|
|
|
|
|
|
|
|
|
|
|||||||||||||||||||
|
Net income (loss) |
13,949 | 13,188 | 10,068 | (24,796 | ) | (12,179 | ) | (11,261 | ) | 11,913 | 10,310 | 10,704 | ||||||||||||||||||||||||
|
|
|
|
|
|
|
|
|
|
|
|
|
|
|
|
|
|
|
|||||||||||||||||||
|
Average Balance Sheet Data |
||||||||||||||||||||||||||||||||||||
|
Total assets |
1,359,602 | 1,331,845 | 1,249,755 | 1,139,673 | 1,198,523 | 1,219,435 | 1,065,487 | 934,513 | 916,115 | |||||||||||||||||||||||||||
|
Total loans and loans held for sale |
808,415 | 889,644 | 967,239 | 739,092 | 906,484 | 976,132 | 571,802 | 574,734 | 580,401 | |||||||||||||||||||||||||||
|
Total deposits |
745,608 | 724,076 | 605,928 | 795,677 | 804,161 | 709,834 | 714,286 | 673,633 | 567,649 | |||||||||||||||||||||||||||
|
Stockholders’ equity |
181,483 | 162,116 | 137,188 | 175,355 | 175,059 | 135,932 | 130,402 | 127,915 | 122,153 | |||||||||||||||||||||||||||
|
End of Year Balance Sheet Data |
||||||||||||||||||||||||||||||||||||
|
Total assets |
1,376,715 | 1,374,067 | 1,325,039 | 1,130,766 | 1,164,903 | 1,172,331 | 1,102,203 | 1,004,835 | 890,672 | |||||||||||||||||||||||||||
|
Total loans, net of ALLL |
749,032 | 822,476 | 895,489 | 636,601 | 752,964 | 892,804 | 544,838 | 548,258 | 547,050 | |||||||||||||||||||||||||||
|
Total deposits |
807,505 | 740,391 | 726,403 | 806,039 | 770,058 | 793,006 | 732,672 | 713,098 | 588,858 | |||||||||||||||||||||||||||
|
Stockholders’ equity |
190,359 | 172,224 | 139,799 | 159,219 | 178,765 | 146,720 | 136,835 | 122,807 | 120,044 | |||||||||||||||||||||||||||
|
Ratios and Other |
||||||||||||||||||||||||||||||||||||
|
Return on average assets |
1.03 | % | 0.99 | % | 0.81 | % | -2.18 | % | -1.02 | % | -0.92 | % | 1.12 | % | 1.10 | % | 1.17 | % | ||||||||||||||||||
|
Return on average equity |
7.69 | % | 8.13 | % | 7.34 | % | -14.14 | % | -6.96 | % | -8.28 | % | 9.14 | % | 8.06 | % | 8.76 | % | ||||||||||||||||||
|
Tier I risk-based capital ratio |
18.67 | % | 16.61 | % | 12.33 | % | 19.13 | % | 18.81 | % | 13.39 | % | 15.91 | % | 15.35 | % | 14.91 | % | ||||||||||||||||||
|
Total risk-based capital ratio |
19.95 | % | 17.89 | % | 13.61 | % | 20.42 | % | 20.09 | % | 14.67 | % | 17.18 | % | 16.62 | % | 16.18 | % | ||||||||||||||||||
|
Leverage capital ratio |
13.00 | % | 11.98 | % | 10.09 | % | 12.81 | % | 13.29 | % | 10.98 | % | 10.49 | % | 10.82 | % | 11.32 | % | ||||||||||||||||||
|
Full time equivalent employees |
262 | 266 | 274 | 361 | 377 | 376 | 185 | 187 | 178 | |||||||||||||||||||||||||||
|
Locations |
17 | 16 | 17 | 28 | 28 | 29 | 13 | 13 | 13 | |||||||||||||||||||||||||||
| Western | 1st Bank | Valley | ||||||||||||||||||||||||||||||||||
|
(Dollars in thousands) |
2011 | 2010 | 2009 | 2011 | 2010 | 2009 | 2011 | 2010 | 2009 | |||||||||||||||||||||||||||
|
Condensed Income Statements |
||||||||||||||||||||||||||||||||||||
|
Net interest income |
21,236 | 20,519 | 21,233 | 22,251 | 22,796 | 24,057 | 14,303 | 13,611 | 14,051 | |||||||||||||||||||||||||||
|
Non-interest income |
8,949 | 9,857 | 8,631 | 4,900 | 4,934 | 4,628 | 5,130 | 6,913 | 5,717 | |||||||||||||||||||||||||||
|
|
|
|
|
|
|
|
|
|
|
|
|
|
|
|
|
|
|
|||||||||||||||||||
|
Total revenues |
30,185 | 30,376 | 29,864 | 27,151 | 27,730 | 28,685 | 19,433 | 20,524 | 19,768 | |||||||||||||||||||||||||||
|
Provision for loan losses |
(550 | ) | (950 | ) | (3,200 | ) | (1,950 | ) | (2,150 | ) | (10,800 | ) | — | (500 | ) | (1,200 | ) | |||||||||||||||||||
|
Core deposit intangibles amortization |
(332 | ) | (519 | ) | (571 | ) | (530 | ) | (591 | ) | (652 | ) | (9 | ) | (42 | ) | (42 | ) | ||||||||||||||||||
|
Goodwill impairment charge |
— | — | — | (17,000 | ) | — | — | — | — | — | ||||||||||||||||||||||||||
|
Other non-interest expense |
(17,113 | ) | (17,257 | ) | (16,342 | ) | (16,009 | ) | (17,197 | ) | (14,943 | ) | (9,562 | ) | (9,252 | ) | (9,229 | ) | ||||||||||||||||||
|
|
|
|
|
|
|
|
|
|
|
|
|
|
|
|
|
|
|
|||||||||||||||||||
|
Income (loss) before income taxes |
12,190 | 11,650 | 9,751 | (8,338 | ) | 7,792 | 2,290 | 9,862 | 10,730 | 9,297 | ||||||||||||||||||||||||||
|
Income tax (expense) benefit |
(2,622 | ) | (3,112 | ) | (2,813 | ) | (1,928 | ) | (2,080 | ) | (309 | ) | (2,778 | ) | (3,272 | ) | (2,740 | ) | ||||||||||||||||||
|
|
|
|
|
|
|
|
|
|
|
|
|
|
|
|
|
|
|
|||||||||||||||||||
|
Net income (loss) |
9,568 | 8,538 | 6,938 | (10,266 | ) | 5,712 | 1,981 | 7,084 | 7,458 | 6,557 | ||||||||||||||||||||||||||
|
|
|
|
|
|
|
|
|
|
|
|
|
|
|
|
|
|
|
|||||||||||||||||||
|
Average Balance Sheet Data |
||||||||||||||||||||||||||||||||||||
|
Total assets |
777,489 | 662,391 | 604,020 | 760,357 | 653,143 | 606,649 | 417,688 | 351,608 | 312,273 | |||||||||||||||||||||||||||
|
Total loans and loans held for sale |
278,927 | 315,663 | 344,456 | 254,914 | 280,954 | 312,372 | 188,441 | 189,443 | 195,007 | |||||||||||||||||||||||||||
|
Total deposits |
569,799 | 527,135 | 410,490 | 506,231 | 448,003 | 414,059 | 286,075 | 257,660 | 196,506 | |||||||||||||||||||||||||||
|
Stockholders’ equity |
90,768 | 88,276 | 87,837 | 105,196 | 106,426 | 97,859 | 34,164 | 32,240 | 34,246 | |||||||||||||||||||||||||||
|
End of Year Balance Sheet Data |
||||||||||||||||||||||||||||||||||||
|
Total assets |
808,512 | 766,367 | 624,077 | 785,730 | 717,120 | 650,072 | 462,300 | 394,220 | 351,228 | |||||||||||||||||||||||||||
|
Total loans, net of ALLL |
248,167 | 288,005 | 304,291 | 232,708 | 254,047 | 283,138 | 185,261 | 174,354 | 178,745 | |||||||||||||||||||||||||||
|
Total deposits |
550,725 | 577,147 | 504,619 | 535,670 | 468,966 | 421,271 | 304,418 | 276,567 | 211,935 | |||||||||||||||||||||||||||
|
Stockholders’ equity |
92,490 | 86,606 | 85,259 | 94,027 | 107,234 | 101,789 | 34,780 | 31,784 | 30,585 | |||||||||||||||||||||||||||
|
Ratios and Other |
||||||||||||||||||||||||||||||||||||
|
Return on average assets |
1.23 | % | 1.29 | % | 1.15 | % | -1.35 | % | 0.87 | % | 0.33 | % | 1.70 | % | 2.12 | % | 2.10 | % | ||||||||||||||||||
|
Return on average equity |
10.54 | % | 9.67 | % | 7.90 | % | -9.76 | % | 5.37 | % | 2.02 | % | 20.74 | % | 23.13 | % | 19.15 | % | ||||||||||||||||||
|
Tier I risk-based capital ratio |
15.82 | % | 15.30 | % | 14.67 | % | 18.22 | % | 17.60 | % | 14.99 | % | 12.76 | % | 13.82 | % | 13.11 | % | ||||||||||||||||||
|
Total risk-based capital ratio |
17.07 | % | 16.56 | % | 15.93 | % | 19.48 | % | 18.87 | % | 16.26 | % | 14.01 | % | 15.08 | % | 14.37 | % | ||||||||||||||||||
|
Leverage capital ratio |
8.28 | % | 9.21 | % | 10.19 | % | 8.49 | % | 9.42 | % | 9.74 | % | 6.94 | % | 8.05 | % | 8.57 | % | ||||||||||||||||||
|
Full time equivalent employees |
155 | 163 | 161 | 139 | 144 | 141 | 89 | 85 | 85 | |||||||||||||||||||||||||||
|
Locations |
8 | 8 | 8 | 12 | 12 | 12 | 6 | 6 | 6 | |||||||||||||||||||||||||||
5
Table of Contents
| Big Sky | First Bank-WY | Citizens | ||||||||||||||||||||||||||||||||||
|
(Dollars in thousands) |
2011 | 2010 | 2009 | 2011 | 2010 | 2009 1 | 2011 | 2010 | 2009 | |||||||||||||||||||||||||||
|
Condensed Income Statements |
||||||||||||||||||||||||||||||||||||
|
Net interest income |
13,803 | 14,168 | 15,700 | 10,643 | 10,315 | 3,964 | 11,368 | 10,591 | 10,437 | |||||||||||||||||||||||||||
|
Non-interest income |
3,619 | 3,427 | 3,564 | 2,684 | 3,072 | 4,187 | 3,641 | 5,003 | 4,235 | |||||||||||||||||||||||||||
|
|
|
|
|
|
|
|
|
|
|
|
|
|
|
|
|
|
|
|||||||||||||||||||
|
Total revenues |
17,422 | 17,595 | 19,264 | 13,327 | 13,387 | 8,151 | 15,009 | 15,594 | 14,672 | |||||||||||||||||||||||||||
|
Provision for loan losses |
(2,350 | ) | (3,475 | ) | (9,200 | ) | (700 | ) | (1,453 | ) | (1,683 | ) | (1,300 | ) | (2,000 | ) | (2,800 | ) | ||||||||||||||||||
|
Core deposit intangibles amortization |
(5 | ) | (23 | ) | (23 | ) | (577 | ) | (577 | ) | (144 | ) | (75 | ) | (93 | ) | (111 | ) | ||||||||||||||||||
|
Goodwill impairment charge |
— | — | — | — | — | — | — | — | — | |||||||||||||||||||||||||||
|
Other non-interest expense |
(9,887 | ) | (10,411 | ) | (8,441 | ) | (7,929 | ) | (8,752 | ) | (2,011 | ) | (8,174 | ) | (8,631 | ) | (7,992 | ) | ||||||||||||||||||
|
|
|
|
|
|
|
|
|
|
|
|
|
|
|
|
|
|
|
|||||||||||||||||||
|
Income (loss) before income taxes |
5,180 | 3,686 | 1,600 | 4,121 | 2,605 | 4,313 | 5,460 | 4,870 | 3,769 | |||||||||||||||||||||||||||
|
Income tax (expense) benefit |
(1,457 | ) | (945 | ) | (121 | ) | (770 | ) | (498 | ) | (230 | ) | (1,716 | ) | (1,700 | ) | (1,332 | ) | ||||||||||||||||||
|
|
|
|
|
|
|
|
|
|
|
|
|
|
|
|
|
|
|
|||||||||||||||||||
|
Net income (loss) |
3,723 | 2,741 | 1,479 | 3,351 | 2,107 | 4,083 | 3,744 | 3,170 | 2,437 | |||||||||||||||||||||||||||
|
|
|
|
|
|
|
|
|
|
|
|
|
|
|
|
|
|
|
|||||||||||||||||||
|
Average Balance Sheet Data |
||||||||||||||||||||||||||||||||||||
|
Total assets |
368,377 | 366,749 | 340,827 | 368,274 | 305,977 | 72,641 | 327,185 | 263,466 | 234,382 | |||||||||||||||||||||||||||
|
Total loans and loans held for sale |
238,955 | 262,342 | 287,338 | 136,738 | 150,029 | 39,416 | 161,892 | 168,498 | 168,675 | |||||||||||||||||||||||||||
|
Total deposits |
210,420 | 209,786 | 178,465 | 281,881 | 245,583 | 60,832 | 226,802 | 192,357 | 146,780 | |||||||||||||||||||||||||||
|
Stockholders’ equity |
67,074 | 61,063 | 45,683 | 42,217 | 38,371 | 7,870 | 36,334 | 33,627 | 30,814 | |||||||||||||||||||||||||||
|
End of Year Balance Sheet Data |
||||||||||||||||||||||||||||||||||||
|
Total assets |
385,434 | 362,416 | 368,571 | 390,917 | 351,624 | 295,953 | 362,420 | 289,507 | 241,807 | |||||||||||||||||||||||||||
|
Total loans, net of ALLL |
218,148 | 236,373 | 258,817 | 128,238 | 139,300 | 150,155 | 149,818 | 154,914 | 151,731 | |||||||||||||||||||||||||||
|
Total deposits |
221,541 | 199,599 | 184,278 | 288,482 | 258,454 | 247,256 | 238,314 | 207,473 | 159,763 | |||||||||||||||||||||||||||
|
Stockholders’ equity |
67,652 | 64,656 | 51,614 | 43,774 | 40,322 | 31,364 | 38,058 | 34,215 | 31,969 | |||||||||||||||||||||||||||
|
Ratios and Other |
||||||||||||||||||||||||||||||||||||
|
Return on average assets |
1.01 | % | 0.75 | % | 0.43 | % | 0.91 | % | 0.69 | % | 5.62 | % | 1.14 | % | 1.20 | % | 1.04 | % | ||||||||||||||||||
|
Return on average equity |
5.55 | % | 4.49 | % | 3.24 | % | 7.94 | % | 5.49 | % | 51.88 | % | 10.30 | % | 9.43 | % | 7.91 | % | ||||||||||||||||||
|
Tier I risk-based capital ratio |
24.15 | % | 21.95 | % | 16.06 | % | 18.90 | % | 18.74 | % | 15.98 | % | 12.58 | % | 11.85 | % | 11.32 | % | ||||||||||||||||||
|
Total risk-based capital ratio |
25.43 | % | 23.23 | % | 17.34 | % | 19.95 | % | 19.98 | % | 16.89 | % | 13.85 | % | 13.12 | % | 12.59 | % | ||||||||||||||||||
|
Leverage capital ratio |
17.33 | % | 17.43 | % | 13.67 | % | 10.40 | % | 11.77 | % | 10.38 | % | 7.65 | % | 8.86 | % | 9.62 | % | ||||||||||||||||||
|
Full time equivalent employees |
89 | 85 | 83 | 78 | 80 | 75 | 71 | 71 | 70 | |||||||||||||||||||||||||||
|
Locations |
5 | 5 | 5 | 4 | 4 | 3 | 6 | 6 | 6 | |||||||||||||||||||||||||||
| First Bank-MT | San Juans | GORE | ||||||||||||||||||||||||||||||||||
|
(Dollars in thousands) |
2011 | 2010 | 2009 | 2011 | 2010 | 2009 | 2011 | 2010 | 2009 | |||||||||||||||||||||||||||
|
Condensed Income Statements |
||||||||||||||||||||||||||||||||||||
|
Net interest income |
7,994 | 7,457 | 7,900 | 8,070 | 7,562 | 8,021 | — | — | — | |||||||||||||||||||||||||||
|
Non-interest income |
946 | 1,144 | 929 | 1,687 | 1,727 | 1,329 | 915 | 258 | — | |||||||||||||||||||||||||||
|
|
|
|
|
|
|
|
|
|
|
|
|
|
|
|
|
|
|
|||||||||||||||||||
|
Total revenues |
8,940 | 8,601 | 8,829 | 9,757 | 9,289 | 9,350 | 915 | 258 | — | |||||||||||||||||||||||||||
|
Provision for loan losses |
— | (265 | ) | (985 | ) | (800 | ) | (750 | ) | (1,800 | ) | — | — | — | ||||||||||||||||||||||
|
Core deposit intangibles amortization |
(266 | ) | (312 | ) | (358 | ) | (233 | ) | (234 | ) | (233 | ) | — | — | — | |||||||||||||||||||||
|
Goodwill impairment charge |
— | — | — | — | — | — | — | — | — | |||||||||||||||||||||||||||
|
Other non-interest expense |
(3,276 | ) | (3,163 | ) | (3,189 | ) | (7,158 | ) | (5,419 | ) | (5,435 | ) | (5,380 | ) | (2,315 | ) | — | |||||||||||||||||||
|
|
|
|
|
|
|
|
|
|
|
|
|
|
|
|
|
|
|
|||||||||||||||||||
|
Income (loss) before income taxes |
5,398 | 4,861 | 4,297 | 1,566 | 2,886 | 1,882 | (4,465 | ) | (2,057 | ) | — | |||||||||||||||||||||||||
|
Income tax (expense) benefit |
(1,508 | ) | (1,590 | ) | (1,426 | ) | (374 | ) | (1,045 | ) | (551 | ) | 1,737 | 806 | — | |||||||||||||||||||||
|
|
|
|
|
|
|
|
|
|
|
|
|
|
|
|
|
|
|
|||||||||||||||||||
|
Net income (loss) |
3,890 | 3,271 | 2,871 | 1,192 | 1,841 | 1,331 | (2,728 | ) | (1,251 | ) | — | |||||||||||||||||||||||||
|
|
|
|
|
|
|
|
|
|
|
|
|
|
|
|
|
|
|
|||||||||||||||||||
|
Average Balance Sheet Data |
||||||||||||||||||||||||||||||||||||
|
Total assets |
249,842 | 209,189 | 179,885 | 225,013 | 198,415 | 175,107 | 17,320 | 12,561 | — | |||||||||||||||||||||||||||
|
Total loans and loans held for sale |
113,397 | 114,310 | 119,840 | 138,286 | 146,911 | 149,665 | — | — | — | |||||||||||||||||||||||||||
|
Total deposits |
176,319 | 153,132 | 121,770 | 180,845 | 162,745 | 140,528 | — | — | — | |||||||||||||||||||||||||||
|
Stockholders’ equity |
34,753 | 33,742 | 30,955 | 26,418 | 25,887 | 23,396 | 18,567 | 12,683 | — | |||||||||||||||||||||||||||
|
End of Year Balance Sheet Data |
||||||||||||||||||||||||||||||||||||
|
Total assets |
265,621 | 239,667 | 217,379 | 243,723 | 230,345 | 184,528 | 7,195 | 20,610 | — | |||||||||||||||||||||||||||
|
Total loans, net of ALLL |
109,495 | 106,290 | 114,113 | 131,327 | 139,014 | 144,655 | — | — | — | |||||||||||||||||||||||||||
|
Total deposits |
186,361 | 165,816 | 143,552 | 195,067 | 184,217 | 148,474 | — | — | — | |||||||||||||||||||||||||||
|
Stockholders’ equity |
35,449 | 33,151 | 32,627 | 27,294 | 25,595 | 25,410 | 9,581 | 21,199 | — | |||||||||||||||||||||||||||
|
Ratios and Other |
||||||||||||||||||||||||||||||||||||
|
Return on average assets |
1.56 | % | 1.56 | % | 1.60 | % | 0.53 | % | 0.93 | % | 0.76 | % | ||||||||||||||||||||||||
|
Return on average equity |
11.19 | % | 9.69 | % | 9.27 | % | 4.51 | % | 7.11 | % | 5.69 | % | ||||||||||||||||||||||||
|
Tier I risk-based capital ratio |
13.79 | % | 13.93 | % | 12.73 | % | 12.36 | % | 11.76 | % | 11.11 | % | ||||||||||||||||||||||||
|
Total risk-based capital ratio |
15.05 | % | 15.19 | % | 13.99 | % | 13.63 | % | 13.03 | % | 12.37 | % | ||||||||||||||||||||||||
|
Leverage capital ratio |
8.33 | % | 9.18 | % | 9.19 | % | 8.48 | % | 8.83 | % | 10.33 | % | ||||||||||||||||||||||||
|
Full time equivalent employees |
39 | 39 | 40 | 44 | 46 | 41 | ||||||||||||||||||||||||||||||
|
Locations |
3 | 3 | 3 | 3 | 3 | 3 | ||||||||||||||||||||||||||||||
6
Table of Contents
| Parent | Eliminations and Other | Total Consolidated | ||||||||||||||||||||||||||||||||||
|
(Dollars in thousands) |
2011 | 2010 | 2009 | 2011 | 2010 | 2009 | 2011 | 2010 | 2009 | |||||||||||||||||||||||||||
|
Condensed Income Statements |
||||||||||||||||||||||||||||||||||||
|
Net interest income |
(4,102 | ) | (5,973 | ) | (6,265 | ) | 2 | — | — | 235,615 | 234,768 | 245,327 | ||||||||||||||||||||||||
|
Non-interest income |
35,082 | 61,924 | 52,466 | (34,917 | ) | (59,932 | ) | (50,584 | ) | 78,199 | 87,546 | 86,474 | ||||||||||||||||||||||||
|
|
|
|
|
|
|
|
|
|
|
|
|
|
|
|
|
|
|
|||||||||||||||||||
|
Total revenues |
30,980 | 55,951 | 46,201 | (34,915 | ) | (59,932 | ) | (50,584 | ) | 313,814 | 322,314 | 331,801 | ||||||||||||||||||||||||
|
Provision for loan losses |
— | — | — | — | — | — | (64,500 | ) | (84,693 | ) | (124,618 | ) | ||||||||||||||||||||||||
|
Core deposit intangibles amortization |
— | — | — | — | — | — | (2,473 | ) | (3,180 | ) | (3,116 | ) | ||||||||||||||||||||||||
|
Goodwill impairment charge |
— | — | — | — | — | — | (40,159 | ) | — | — | ||||||||||||||||||||||||||
|
Other non-interest expense |
(16,065 | ) | (14,613 | ) | (13,769 | ) | 14,915 | 14,400 | 13,396 | (189,492 | ) | (184,768 | ) | (165,702 | ) | |||||||||||||||||||||
|
|
|
|
|
|
|
|
|
|
|
|
|
|
|
|
|
|
|
|||||||||||||||||||
|
Income (loss) before income taxes |
14,915 | 41,338 | 32,432 | (20,000 | ) | (45,532 | ) | (37,188 | ) | 17,190 | 49,673 | 38,365 | ||||||||||||||||||||||||
|
Income tax (expense) benefit |
2,176 | 1,374 | 1,942 | (244 | ) | 244 | — | 281 | (7,343 | ) | (3,991 | ) | ||||||||||||||||||||||||
|
|
|
|
|
|
|
|
|
|
|
|
|
|
|
|
|
|
|
|||||||||||||||||||
|
Net income (loss) |
17,091 | 42,712 | 34,374 | (20,244 | ) | (45,288 | ) | (37,188 | ) | 17,471 | 42,330 | 34,374 | ||||||||||||||||||||||||
|
|
|
|
|
|
|
|
|
|
|
|
|
|
|
|
|
|
|
|||||||||||||||||||
|
Average Balance Sheet Data |
||||||||||||||||||||||||||||||||||||
|
Total assets |
995,355 | 949,597 | 824,527 | (1,148,846 | ) | (1,130,937 | ) | (1,043,687 | ) | 6,922,816 | 6,307,040 | 5,691,929 | ||||||||||||||||||||||||
|
Total loans and loans held for sale |
— | — | — | (5,068 | ) | — | — | 3,625,791 | 3,999,012 | 4,140,541 | ||||||||||||||||||||||||||
|
Total deposits |
— | — | — | (24,372 | ) | (39,887 | ) | (59,234 | ) | 4,669,571 | 4,358,384 | 3,493,607 | ||||||||||||||||||||||||
|
Stockholders’ equity |
857,625 | 817,496 | 691,922 | (942,731 | ) | (897,405 | ) | (753,933 | ) | 857,625 | 817,496 | 691,922 | ||||||||||||||||||||||||
|
End of Year Balance Sheet Data |
||||||||||||||||||||||||||||||||||||
|
Total assets |
990,634 | 978,875 | 832,916 | (1,124,264 | ) | (1,135,269 | ) | (962,778 | ) | 7,187,906 | 6,759,287 | 6,191,795 | ||||||||||||||||||||||||
|
Total loans, net of ALLL |
— | — | — | (5,014 | ) | (3,813 | ) | — | 3,328,619 | 3,612,182 | 3,920,988 | |||||||||||||||||||||||||
|
Total deposits |
— | — | — | (45,581 | ) | (39,884 | ) | (29,263 | ) | 4,821,213 | 4,521,902 | 4,100,152 | ||||||||||||||||||||||||
|
Stockholders’ equity |
850,227 | 838,583 | 685,890 | (929,518 | ) | (918,937 | ) | (797,180 | ) | 850,227 | 838,204 | 685,890 | ||||||||||||||||||||||||
|
Ratios and Other |
||||||||||||||||||||||||||||||||||||
|
Return on average assets |
0.25 | % | 0.67 | % | 0.60 | % | ||||||||||||||||||||||||||||||
|
Return on average equity |
2.04 | % | 5.18 | % | 4.97 | % | ||||||||||||||||||||||||||||||
|
Tier I risk-based capital ratio |
18.99 | % | 18.24 | % | 14.02 | % | ||||||||||||||||||||||||||||||
|
Total risk-based capital ratio |
20.27 | % | 19.51 | % | 15.29 | % | ||||||||||||||||||||||||||||||
|
Leverage capital ratio |
11.81 | % | 12.71 | % | 11.20 | % | ||||||||||||||||||||||||||||||
|
Full time equivalent employees |
141 | 131 | 119 | 1,653 | 1,674 | 1,643 | ||||||||||||||||||||||||||||||
|
Locations |
1 | 1 | 1 | 106 | 105 | 106 | ||||||||||||||||||||||||||||||
| 1 |
The average balance sheet data is based on daily averages for the entire year, with First Bank-WY having been acquired October 2, 2009. |
WEB SITE ACCESS
Copies of the Company’s Annual Report on Form 10-K, Quarterly Reports on Form 10-Q, Current Reports on Form 8-K and amendments to those reports filed or furnished pursuant to Section 13(a) or 15(d) of the Securities Exchange Act of 1934 are available free of charge through the Company’s website (www.glacierbancorp.com) as soon as reasonably practicable after the Company has filed the material with, or furnished it to, the Securities and Exchange Commission (“SEC”). Copies can also be obtained by accessing the SEC’s website (www.sec.gov).
MARKET AREA
The Company has 106 locations, of which 9 are loan or administration offices, in 35 counties within 6 states including Montana, Idaho, Wyoming, Colorado, Utah, and Washington. The Company has 53 locations in Montana, 29 locations in Idaho, 14 locations in Wyoming, 3 locations in Colorado, 4 locations in Utah and 3 locations in Washington.
The market area’s economic base primarily focuses on tourism, energy, construction, mining, manufacturing, service industry, and health care. The tourism industry is highly influenced by two national parks, several ski resorts, significant lakes, and rural scenic areas.
COMPETITION
Based on the Federal Deposit Insurance Corporation (“FDIC”) summary of deposits survey as of June 30, 2011, the Company has approximately 26 percent of the total FDIC insured deposits in the 13 counties that it services in Montana. In Idaho, the Company has approximately 7 percent of the deposits in the 9 counties that it services. In Wyoming, the Company has 26 percent of the deposits in the 6 counties it services. In Colorado, the Company has 12 percent of the deposits in the 2 counties it serves. In Utah, the Company has 13 percent of the deposits in the 3 counties it services.
7
Table of Contents
There are a large number of depository institutions including thrifts, commercial banks, and credit unions in the markets in which the Company has offices. The Banks, like other depository institutions, operate in a rapidly changing environment. Non-depository financial service institutions, primarily in the securities and insurance industries, have become competitors for retail savings and investment funds. In addition to offering competitive interest rates, the principal methods used by the Banks to attract deposits include the offering of a variety of services including on-line banking and convenient office locations and business hours. The primary factors in competing for loans are interest rates and rate adjustment provisions, loan maturities, loan fees, and the quality of service to borrowers and brokers.
EMPLOYEES
As of December 31, 2011, the Company employed 1,653 persons, 1,507 of whom were employed full time, none of whom were represented by a collective bargaining group. The Company provides its employees with a comprehensive benefit program, including medical and dental insurance, life and accident insurance, long-term disability coverage, sick leave, 401(k) and profit sharing plan, and a stock-based compensation plan. The Company considers its employee relations to be excellent. See Note 16 in the Consolidated Financial Statements in “Item 8. Financial Statements and Supplementary Data” for detailed information regarding employee benefit plans and eligibility requirements.
SUPERVISION AND REGULATION
Introduction
The following discussion provides an overview of certain elements of the extensive regulatory framework applicable to the Company and the Banks. This regulatory framework is primarily designed for the protection of depositors, the federal Deposit Insurance Fund and the banking system as a whole, rather than specifically for the protection of shareholders. Due to the breadth and growth of this regulatory framework, the costs of compliance continue to increase in order to monitor and satisfy these requirements.
To the extent that this section describes statutory and regulatory provisions, it is qualified by reference to those provisions. These statutes and regulations, as well as related policies, are subject to change by Congress, state legislatures and federal and state regulators. Changes in statutes, regulations or regulatory policies applicable to the Company, including the interpretation or implementation thereof, could have a material effect on the Company’s business or operations. In light of the recent financial crisis, numerous changes to the statutes, regulations or regulatory policies applicable to the Company and Banks have been made or proposed. The full extent to which these changes will impact the Company and the Banks is not yet known. However, continued efforts to monitor and comply with new regulatory requirements add to the complexity and cost of the Company’s business.
The Company recently announced plans to consolidate into Glacier its bank subsidiaries which operate throughout the states of Montana, Colorado, Idaho, Utah, Washington and Wyoming. The transaction is currently expected to close early in the second quarter of 2012. After this transaction is consummated, Glacier will be the sole bank subsidiary of the Company and will be subject to regulation and supervision by the Montana Department of Administration’s Banking and Financial Institutions Division and the FDIC. With respect to divisions of Glacier outside of Montana, they will be subject to applicable state laws.
Bank Holding Company Regulation
General . The Company is a bank holding company as defined in the Bank Holding Company Act of 1956, as amended (“BHCA”), due to its ownership of the bank subsidiaries. Glacier, First Security, Western, Valley, Big Sky, and First Bank-MT are Montana state-chartered banks; Mountain West and Citizens are Idaho state-chartered banks; 1st Bank and First Bank-WY are Wyoming state-chartered banks; and San Juans is a Colorado state-chartered bank. Customer deposits of the Banks are insured by the FDIC.
As a bank holding company, the Company is subject to regulation, supervision and examination by the Federal Reserve. In general, the BHCA limits the business of bank holding companies to owning or controlling banks and engaging in other activities closely related to banking. The Company must also file reports with and provide additional information to the Federal Reserve. Under the Financial Services Modernization Act of 1999, a bank holding company may apply to the Federal Reserve to become a financial holding company, and thereby engage (directly or through a subsidiary) in certain expanded activities deemed financial in nature, such as securities and insurance underwriting.
Holding Company Bank Ownership . The BHCA requires every bank holding company to obtain the prior approval of the Federal Reserve before 1) acquiring, directly or indirectly, ownership or control of any voting shares of another bank or bank holding company if, after such acquisition, it would own or control more than 5 percent of such shares; 2) acquiring all or substantially all of the assets of another bank or bank holding company; or 3) merging or consolidating with another bank holding company.
8
Table of Contents
Holding Company Control of Nonbanks . With some exceptions, the BHCA also prohibits a bank holding company from acquiring or retaining direct or indirect ownership or control of more than 5 percent of the voting shares of any company that is not a bank or bank holding company, or from engaging directly or indirectly in activities other than those of banking, managing or controlling banks or providing services for its subsidiaries. The principal exceptions to these prohibitions involve certain non-bank activities that, by federal statute, agency regulation or order, have been identified as activities closely related to the business of banking or of managing or controlling banks.
Transactions with Affiliates . Bank subsidiaries of a bank holding company are subject to restrictions imposed by the Federal Reserve Act on extensions of credit to the holding company or its subsidiaries, on investments in securities, and on the use of securities as collateral for loans to any borrower. These regulations and restrictions may limit the Company’s ability to obtain funds from the bank subsidiaries for its cash needs, including funds for payment of dividends, interest and operational expenses.
Tying Arrangements . The Company is prohibited from engaging in certain tie-in arrangements in connection with any extension of credit, sale or lease of property or furnishing of services. For example, with certain exceptions, neither the Company nor the Banks may condition an extension of credit to a customer on either 1) a requirement that the customer obtain additional services provided by the Company or the Banks or 2) an agreement by the customer to refrain from obtaining other services from a competitor.
Support of Bank Subsidiaries . Under Federal Reserve policy and the Dodd-Frank Wall Street Reform and Consumer Protection Act (“Dodd-Frank Act”), the Company is expected to act as a source of financial and managerial strength to its Banks. This means that the Company is required to commit, as necessary, resources to support the Banks. Any capital loans a bank holding company makes to its bank subsidiaries are subordinate to deposits and to certain other indebtedness of the bank subsidiaries.
State Law Restrictions . As a Montana corporation, the Company is subject to certain limitations and restrictions under applicable Montana corporate law. For example, state law restrictions in Montana include limitations and restrictions relating to indemnification of directors, distributions to shareholders, transactions involving directors, officers or interested shareholders, maintenance of books, records and minutes, and observance of certain corporate formalities.
The Bank Subsidiaries
Glacier, First Security, Western, Valley, Big Sky, and First Bank-MT are subject to regulation and supervision by the Montana Department of Administration’s Banking and Financial Institutions Division and the FDIC.
Mountain West and Citizens are subject to regulation and supervision by the Idaho Department of Finance and by the FDIC. In addition, Mountain West’s Utah and Washington branches are subject to regulation by the Utah Department of Financial Institutions and the Washington Department of Financial Institutions, respectively.
1st Bank and First Bank-WY are subject to regulation and supervision by the Wyoming Division of Banking and by the FDIC. In addition, 1st Bank’s Utah branches are subject to regulation by the Utah Department of Financial Institutions.
San Juans is subject to regulation by the Colorado Department of Regulatory Agencies-Division of Banking and by the FDIC.
The federal laws that apply to the Banks regulate, among other things, the scope of their business, their investments, their reserves against deposits, the timing of the availability of deposited funds, and the nature, amount of, and collateral for loans. Federal laws also regulate community reinvestment and insider credit transactions and impose safety and soundness standards.
Consumer Protection. The Banks are subject to a variety of federal and state consumer protection laws and regulations that govern their relationship with consumers including laws and regulations that impose certain disclosure requirements and regulate the manner in which they take deposits, make and collect loans, and provide other services. Failure to comply with these laws and regulations may subject the Banks to various penalties, including but not limited to, enforcement actions, injunctions, fines, civil liability, criminal penalties, punitive damages, and the loss of certain contractual rights.
Community Reinvestment . The Community Reinvestment Act of 1977 requires that, in connection with examinations of financial institutions within their jurisdiction, federal bank regulators must evaluate the record of financial institutions in meeting the credit needs of their local communities, including low and moderate-income neighborhoods, consistent with the safe and sound operation of those banks. A bank’s community reinvestment record is also considered by the applicable banking agencies in evaluating mergers, acquisitions, and applications to open a branch or facility.
9
Table of Contents
Insider Credit Transactions . Banks are also subject to certain restrictions on extensions of credit to executive officers, directors, principal shareholders, and their related interests. Extensions of credit 1) must be made on substantially the same terms, including interest rates and collateral, and follow credit underwriting procedures that are at least as stringent, as those prevailing at the time for comparable transactions with persons not related to the lending bank; and 2) must not involve more than the normal risk of repayment or present other unfavorable features. Banks are also subject to certain lending limits and restrictions on overdrafts to insiders. A violation of these restrictions may result in the assessment of substantial civil monetary penalties, regulatory enforcement actions, and other regulatory sanctions.
Regulation of Management . Federal law 1) sets forth circumstances under which officers or directors of a bank may be removed by the institution’s federal supervisory agency; 2) places restraints on lending by a bank to its executive officers, directors, principal shareholders, and their related interests; and 3) generally prohibits management personnel of a bank from serving as directors or in other management positions of another financial institution whose assets exceed a specified amount or which has an office within a specified geographic area.
Safety and Soundness Standards . Certain non-capital safety and soundness standards are also imposed upon the Banks. These standards cover, among other things, internal controls, information systems and internal audit systems, loan documentation, credit underwriting, interest rate exposure, asset growth, compensation, fees and benefits, such other operational and managerial standards as the agency determines to be appropriate, and standards for asset quality, earnings and stock valuation. An institution that fails to meet these standards may be subject to regulatory sanctions.
Interstate Banking and Branching
The Riegle-Neal Interstate Banking and Branching Efficiency Act of 1994 (the “Interstate Act”) together with the Dodd-Frank Act relaxed prior interstate branching restrictions under federal law by permitting, subject to regulatory approval, state and federally chartered commercial banks to establish branches in states where the laws permit banks chartered in such states to establish branches. The Interstate Act requires regulators to consult with community organizations before permitting an interstate institution to close a branch in a low-income area. Federal bank regulations prohibit banks from using their interstate branches primarily for deposit production and federal bank regulatory agencies have implemented a loan-to-deposit ratio screen to ensure compliance with this prohibition.
Dividends
A principal source of the Company’s cash is from dividends received from the Banks, which are subject to government regulation and limitation. Regulatory authorities may prohibit banks and bank holding companies from paying dividends in a manner that would constitute an unsafe or unsound banking practice. In addition, a bank may not pay cash dividends if that payment could reduce the amount of its capital below that necessary to meet minimum applicable regulatory capital requirements. State law limits a bank’s ability to pay dividends that are greater than a certain amount without approval of the applicable agency. Additionally, current guidance from the Federal Reserve provides, among other things, that dividends per share on the Company’s common stock generally should not exceed earnings per share, measured over the previous four fiscal quarters.
Capital Adequacy
Regulatory Capital Guidelines . Federal bank regulatory agencies use capital adequacy guidelines in the examination and regulation of bank holding companies and banks. The guidelines are “risk-based,” meaning that they are designed to make capital requirements more sensitive to differences in risk profiles among banks and bank holding companies.
Tier I and Tier II Capital . Under the guidelines, an institution’s capital is divided into two broad categories, Tier I capital and Tier II capital. Tier I capital generally consists of common shareholders’ equity, (including surplus and undivided profits), qualifying non-cumulative perpetual preferred stock, and qualified minority interests in the equity accounts of consolidated subsidiaries. Tier II capital generally consists of the allowance for loan and lease losses, hybrid capital instruments, and qualifying subordinated debt. The sum of Tier I capital and Tier II capital represents an institution’s total capital. The guidelines require that at least 50 percent of an institution’s total capital consist of Tier I capital.
Risk-based Capital Ratios . The adequacy of an institution’s capital is gauged primarily with reference to the institution’s risk-weighted assets. The guidelines assign risk weightings to an institution’s assets in an effort to quantify the relative risk of each asset and to determine the minimum capital required to support that risk. An institution’s risk-weighted assets are then compared with its Tier I capital and total capital to arrive at a Tier I risk-based capital ratio and a total risk-based capital ratio, respectively. The guidelines provide that an institution must have a minimum Tier I risk-based capital ratio of 4 percent and a minimum total risk-based capital ratio of 8 percent.
10
Table of Contents
Leverage Ratio . The guidelines also employ a leverage ratio, which is Tier I capital as a percentage of average total assets, less intangibles. The principal objective of the leverage ratio is to constrain the maximum degree to which banks may leverage its equity capital base. The minimum leverage ratio is 4 percent.
Prompt Corrective Action . Under the guidelines, an institution is assigned to one of five capital categories depending on its total risk-based capital ratio, Tier I risk-based capital ratio, and leverage ratio, together with certain subjective factors. The categories range from “well capitalized” to “critically undercapitalized.” Institutions that are “undercapitalized” or lower are subject to certain mandatory supervisory corrective actions. At each successively lower capital category, an insured bank is subject to increased restrictions on its operations. During these challenging economic times, the federal banking regulators have actively enforced these provisions.
Regulatory Oversight and Examination
The Federal Reserve conducts periodic inspections of bank holding companies, which are performed both onsite and offsite. The supervisory objectives of the inspection program are to ascertain whether the financial strength of a bank holding company is maintained on an ongoing basis and to determine the effects or consequences of transactions between a bank holding company or its non-banking subsidiaries and its bank subsidiaries. For bank holding companies under $10 billion in assets, the inspection type and frequency varies depending on asset size, complexity of the organization, and the bank holding company’s rating at its last inspection.
Banks are subject to periodic examinations by their primary regulators. Bank examinations have evolved from reliance on transaction testing in assessing a bank’s condition to a risk-focused approach. These examinations are extensive and cover the entire breadth of operations of a bank. Generally, safety and soundness examinations occur on an 18-month cycle for banks under $500 million in total assets that are well capitalized and without regulatory issues, and 12-months otherwise. Examinations alternate between the federal and state bank regulatory agency or may occur on a combined schedule. The frequency of consumer compliance and CRA examinations is linked to the size of the institution and its compliance and CRA ratings at its most recent examinations. However, the examination authority of the Federal Reserve and the FDIC allows them to examine supervised banks as frequently as deemed necessary based on the condition of the bank or as a result of certain triggering events.
Corporate Governance and Accounting
Sarbanes-Oxley Act of 2002 . The Sarbanes-Oxley Act of 2002 (the “Act”) addresses, among other things, corporate governance, auditing and accounting, enhanced and timely disclosure of corporate information, and penalties for non-compliance. Generally, the Act 1) requires chief executive officers and chief financial officers to certify to the accuracy of periodic reports filed with the SEC; 2) imposes specific and enhanced corporate disclosure requirements; 3) accelerates the time frame for reporting of insider transactions and periodic disclosures by public companies; 4) requires companies to adopt and disclose information about corporate governance practices, including whether or not they have adopted a code of ethics for senior financial officers and whether the audit committee includes at least one “audit committee financial expert;” and 5) requires the SEC, based on certain enumerated factors, to regularly and systematically review corporate filings.
As a publicly reporting company, the Company is subject to the requirements of the Act and related rules and regulations issued by the SEC and NASDAQ. After enactment, the Company updated its policies and procedures to comply with the Act’s requirements and has found that such compliance, including compliance with Section 404 of the Act relating to the Company’s internal control over financial reporting, has resulted in significant additional expense for the Company. The Company anticipates that it will continue to incur such additional expense in its ongoing compliance.
Anti-Terrorism
USA Patriot Act of 2001 . The Uniting and Strengthening America by Providing Appropriate Tools Required to Intercept and Obstruct Terrorism Act of 2001, intended to combat terrorism, was renewed with certain amendments in 2006 (the “Patriot Act”). The Patriot Act, in relevant part, 1) prohibits banks from providing correspondent accounts directly to foreign shell banks; 2) imposes due diligence requirements on banks opening or holding accounts for foreign financial institutions or wealthy foreign individuals; 3) requires financial institutions to establish an anti-money-laundering compliance program; and 4) eliminates civil liability for persons who file suspicious activity reports.
11
Table of Contents
Financial Services Modernization
Gramm-Leach-Bliley Act of 1999 . The Gramm-Leach-Bliley Financial Services Modernization Act of 1999 (the “GLB Act”) brought about significant changes to the laws affecting banks and bank holding companies. Generally, the GLB Act 1) repeals historical restrictions on preventing banks from affiliating with securities firms; 2) provides a uniform framework for the activities of banks, savings institutions and their holding companies; 3) broadens the activities that may be conducted by national banks and banking subsidiaries of bank holding companies; 4) provides an enhanced framework for protecting the privacy of consumer information and requires notification to consumers of bank privacy policies; and 5) addresses a variety of other legal and regulatory issues affecting both day-to-day operations and long-term activities of financial institutions. Bank holding companies that qualify and elect to become financial holding companies can engage in a wider variety of financial activities than permitted under previous law, particularly with respect to insurance and securities underwriting activities.
The Emergency Economic Stabilization Act of 2008
Emergency Economic Stabilization Act of 2008 . In response to market turmoil and financial crises affecting the overall banking system and financial markets in the United States, the Emergency Economic Stabilization Act of 2008 (the “EESA”) was enacted on October 3, 2008. EESA provides the United States Treasury Department (the “Treasury”) with broad authority to implement certain actions intended to help restore stability and liquidity to the U.S. financial markets.
Troubled Asset Relief Program . Under the EESA, the Treasury has authority, among other things, to purchase up to $700 billion in mortgage loans, mortgage-related securities and certain other financial instruments, including debt and equity securities issued by financial institutions pursuant to the Troubled Asset Relief Program (“TARP”). The purpose of TARP is to restore confidence and stability to the U.S. banking system and to encourage financial institutions to increase lending to customers and to each other. Pursuant to the EESA, the Treasury was initially authorized to use $350 billion for TARP. Of this amount, the Treasury allocated $250 billion to the TARP Capital Purchase Program (“CPP”), which funds were used to purchase preferred stock from qualifying financial institutions. After receiving preliminary approval from Treasury to participate in the program, the Company elected not to participate in light of its capital position and due to its ability to raise capital successfully in private equity markets.
Temporary Liquidity Guarantee Program . Another program established pursuant to the EESA is the Temporary Liquidity Guarantee Program (“TLGP”), which 1) removed the limit on FDIC deposit insurance coverage for non-interest bearing transaction accounts through December 31, 2009, and 2) provided FDIC backing for certain types of senior unsecured debt issued from October 14, 2008 through June 30, 2009. The end-date for issuing senior unsecured debt was later extended to October 31, 2009 and the FDIC also extended the Transaction Account Guarantee portion of the TLGP through December 31, 2010. In November 2010, the FDIC issued a final rule to implement provisions of the Dodd-Frank Act that provides for temporary unlimited coverage for non-interest-bearing transaction accounts. The separate coverage for non-interest-bearing transaction accounts became effective on December 31, 2010 and terminates on December 31, 2012.
Deposit Insurance
The bank subsidiaries’ deposits are insured under the Federal Deposit Insurance Act, up to the maximum applicable limits and are subject to deposit insurance assessments designed to tie what banks pay for deposit insurance more closely to the risks they pose. The Banks have prepaid their quarterly deposit insurance assessments for 2012 pursuant to applicable FDIC regulations. In February 2011, the FDIC approved new rules to, among other things, change the assessment base from one based on domestic deposits (as it has been since 1935) to one based on assets (average consolidated total assets minus average tangible equity). Since the new assessment base is larger than the base used under prior regulations, the rules also lower assessment rates, so that the total amount of revenue collected by the FDIC from the industry is not significantly altered. The rules also revise the deposit insurance assessment system for large financial institutions, defined as institutions with at least $10 billion in assets. The rules revise the assessment rate schedule, effective April 1, 2011, and adopt additional rate schedules that will go into effect when the Deposit Insurance Fund reserve ratio reaches various milestones. The Dodd-Frank Act requires the FDIC to increase the reserve ratio of the Deposit Insurance Fund from 1.15 percent to 1.35 percent of insured deposits by 2020 and eliminates the requirement that the FDIC pay dividends to insured depository institutions when the reserve ratio exceeds certain thresholds.
12
Table of Contents
Insurance of Deposit Accounts. The EESA included a provision for a temporary increase from $100,000 to $250,000 per depositor in deposit insurance effective October 3, 2008 through December 31, 2010. On May 20, 2009, the temporary increase was extended through December 31, 2013. The Dodd-Frank Act permanently raises the current standard maximum deposit insurance amount to $250,000. The FDIC insurance coverage limit applies per depositor, per insured depository institution for each account ownership category. EESA also temporarily raised the limit on federal deposit insurance coverage to an unlimited amount for non-interest or low-interest bearing demand deposits. Pursuant to the Dodd-Frank Act, unlimited coverage for non-interest transaction accounts will continue until December 31, 2012.
Recent Legislation
Dodd-Frank Wall Street Reform and Consumer Protection Act. As a result of the recent financial crises, on July 21, 2010 the Dodd-Frank Act was signed into law. The Dodd-Frank Act is expected to have a broad impact on the financial services industry, including significant regulatory and compliance changes and changes to corporate governance matters affecting public companies. Not all of the regulations implementing these changes have been promulgated. As a result, the Company cannot determine the full impact on its business and operations at this time. However, the Dodd-Frank Act is expected to have a significant impact on the Company’s business operations as its provisions take effect. Some of the provisions of the Dodd-Frank Act that may impact the Company’s business are summarized below.
Holding Company Capital Requirements. Under the Dodd-Frank Act, trust preferred securities will generally be excluded from the Tier 1 capital of a Bank holding company between $500 million and $15 billion in assets unless such securities were issued prior to May 19, 2010.
Corporate Governance. The Dodd-Frank Act requires publicly traded companies to provide their shareholders with 1) a non-binding shareholder vote on executive compensation; 2) a non-binding shareholder vote on the frequency of such vote; 3) disclosure of “golden parachute” arrangements in connection with specified change in control transactions; and 4) a non-binding shareholder vote on golden parachute arrangements in connection with these change in control transactions. Except with respect to “smaller reporting companies” and participants in the CPP, the new rules applied to proxy statements relating to annual meetings of shareholders held after January 20, 2011. “Smaller reporting companies,” those with a public float of less than $75 million, are required to include the non-binding shareholder votes on executive compensation and the frequency thereof in proxy statements relating to annual meetings occurring on or after January 21, 2013.
Prohibition Against Charter Conversions of Troubled Institutions. The Dodd-Frank Act generally prohibits a depository institution from converting from a state to federal charter, or vice versa, while it is the subject to an enforcement action unless the depository institution seeks prior approval from its regulator and complies with specified procedures to ensure compliance with the enforcement action.
Debit Card Interchange Fees. The Dodd-Frank Act requires the amount of any interchange fee charged by a debit card issuer with respect to a debit card transaction to be reasonable and proportional to the cost incurred by the issuer. While the restrictions on interchange fees do not apply to banks that, together with their affiliates, have assets of less than $10 billion, the rule could affect the competitiveness of debit cards issued by smaller banks.
Bureau of Consumer Financial Protection. The Dodd-Frank Act creates a new, independent federal agency called the Bureau of Consumer Financial Protection (“CFPB”) within the Federal Reserve Board. The CFPB has broad rulemaking, supervision and enforcement authority for a wide range of consumer protection laws applicable to banks and thrifts with greater than $10 billion in assets. Smaller institutions are subject to certain rules promulgated by the CFPB but will continue to be examined and supervised by their federal banking regulators for compliance purposes.
Repeal of Demand Deposit Interest Prohibition. The Dodd-Frank Act repeals the federal prohibitions on the payment of interest on demand deposits, thereby permitting depository institutions to pay interest on business transaction and other accounts.
13
Table of Contents
Overdrafts. On November 17, 2009, the Board of Governors of the Federal Reserve System promulgated the Electronic Fund Transfer rule with an effective date of January 19, 2010 and a mandatory compliance date of July 1, 2010. The rule, which applies to all FDIC-regulated institutions, prohibits financial institutions from assessing an overdraft fee for paying automated teller machine (“ATM”) and one-time point-of-sale debit card transactions, unless the customer affirmatively opts in to the overdraft service for those types of transactions. The opt-in provision establishes requirements for clear disclosure of fees and terms of overdraft services for ATM and one-time debit card transactions. Since a percentage of the Company’s service charges on deposits are in the form of overdraft fees on point-of-sale transactions, this could have an adverse impact on the Company’s non-interest income.
Proposed Legislation
General. Proposed legislation is introduced in almost every legislative session. Such legislation could dramatically affect the regulation of the banking industry. The Company cannot predict if any such legislation will be adopted or if it is adopted how it would affect the business of the Company or the Banks. Past history has demonstrated that new legislation or changes to existing laws or regulations usually results in a greater compliance burden and, therefore, generally increases the cost of doing business.
Possible Changes to Capital Requirements Resulting from Basel III. Basel III updates and revises significantly the current international bank capital accords (so-called “Basel I” and “Basel II”). Basel III is intended to be implemented by participating countries for large, internationally active banks. However, standards consistent with Basel III will be formally implemented in the United States through a series of regulations, some of which may apply to other banks. Among other things, Basel III creates “Tier 1 common equity,” a new measure of regulatory capital closer to pure tangible common equity than the present Tier 1 definition. Basel III also increases minimum capital ratios. For the new concept of Tier 1 common equity, the minimum ratio is 4.5 percent of risk-weighted assets. For Tier 1 and total capital the Basel III minimums are 6 percent and 8 percent respectively. Capital buffers comprising common equity equal to 2.5 percent of risk-weighted assets are added to each of these minimums to enable banks to absorb losses during a stressed period while remaining above their regulatory minimum ratios. The Company cannot predict the extent to which Basel III will be adopted or, if adopted, how it will apply to the Company or the Banks.
Effects of Government Monetary Policy
The Company’s earnings and growth are affected not only by general economic conditions, but also by the fiscal and monetary policies of the federal government, particularly the Federal Reserve. The Federal Reserve implements national monetary policy for such purposes as curbing inflation and combating recession, but its open market operations in U.S. government securities, control of the discount rate applicable to borrowings from the Federal Reserve, and establishment of reserve requirements against certain deposits, influence the growth of bank loans, investments and deposits, and also affect interest rates charged on loans or paid on deposits. The nature and impact of future changes in monetary policies and their impact on the Company or the Banks cannot be predicted with certainty.
14
Table of Contents
| Item 1A. | Risk Factors |
The Company and its eleven independent wholly-owned community bank subsidiaries are exposed to certain risks. The following is a discussion of the most significant risks and uncertainties that may affect the Company’s business, financial condition and future results.
The continued challenging economic environment could have a material adverse effect on the Company’s future results of operations or market price of stock.
The national economy, and the financial services sector in particular, are still facing significant challenges. Substantially all of the Company’s loans are to businesses and individuals in Montana, Idaho, Wyoming, Utah, Colorado and Washington, markets facing many of the same challenges as the national economy, including elevated unemployment and declines in commercial and residential real estate. Although some economic indicators are improving both nationally and in the Company’s markets, unemployment remains high and there remains substantial uncertainty regarding when and how strongly a sustained economic recovery will occur, and whether there will be another recession. These economic conditions can cause borrowers to be unable to pay their loans. The inability of borrowers to repay loans can erode earnings by reducing net interest income and by requiring the Company to add to its allowance for loan and lease losses. While the Company cannot accurately predict how long these conditions may exist, the challenging economy could continue to present risks for some time for the industry and Company. A further deterioration in economic conditions in the nation as a whole or in the Company’s markets could result in the following consequences, any of which could have an adverse impact, which may be material, on the Company’s business, financial condition, results of operations and prospects, and could also cause the market price of the Company’s stock to decline:
| • |
loan delinquencies may increase further; |
| • |
problem assets and foreclosures may increase further; |
| • |
collateral for loans made may decline further in value, in turn reducing customers’ borrowing power, reducing the value of assets and collateral associated with existing loans and increasing the potential severity of loss in the event of loan defaults; |
| • |
demand for banking products and services may decline; and |
| • |
low cost or non-interest bearing deposits may decrease. |
The allowance for loan and lease losses may not be adequate to cover actual loan losses, which could adversely affect earnings.
The Company maintains an allowance for loan and lease losses (“ALLL” or “allowance”) in an amount that it believes is adequate to provide for losses in the loan portfolio. While the Company strives to carefully manage and monitor credit quality and to identify loans that may become non-performing, at any time there are loans included in the portfolio that will result in losses, but that have not been identified as non-performing or potential problem loans. With respect to real estate loans and property taken in satisfaction of such loans (“other real estate owned” or “OREO”), the Company can be required to recognize significant declines in the value of the underlying real estate collateral or OREO quite suddenly as values are updated through appraisals and evaluations performed in the normal course of monitoring the credit quality of the loans. There are many factors that can cause the value of real estate to decline, including declines in the general real estate market, changes in methodology applied by appraisers, and/or using a different appraiser than was used for the prior appraisal or evaluation. The Company’s ability to recover on real estate loans by selling or disposing of the underlying real estate collateral is adversely impacted by declining values, which increases the likelihood the Company will suffer losses on defaulted loans beyond the amounts provided for in the ALLL. This, in turn, could require material increases in the Company’s provision for loan losses and ALLL. By closely monitoring credit quality, the Company attempts to identify deteriorating loans before they become non-performing assets and adjust the ALLL accordingly. However, because future events are uncertain, and if difficult economic conditions continue or worsen, there may be loans that deteriorate to a non-performing status in an accelerated time frame. As a result, future additions to the ALLL may be necessary. Because the loan portfolio contains a number of loans with relatively large balances, the deterioration of one or a few of these loans may cause a significant increase in non-performing loans, requiring an increase to the ALLL. Additionally, future significant additions to the ALLL may be required based on changes in the mix of loans comprising the portfolio, changes in the financial condition of borrowers, which may result from changes in economic conditions, or changes in the assumptions used in determining the ALLL. Additionally, federal banking regulators, as an integral part of their supervisory function, periodically review the Company’s loan portfolio and the adequacy of the ALLL. These regulatory agencies may require the Company to recognize further loan loss provisions or charge-offs based upon their judgments, which may be different from the Company’s judgments. Any increase in the ALLL would have an adverse effect, which could be material, on the Company’s financial condition and results of operations.
15
Table of Contents
The Company has a high concentration of loans secured by real estate, so any further deterioration in the real estate markets could require material increases in the ALLL and adversely affect the Company’s financial condition and results of operations.
The Company has a high degree of concentration in loans secured by real estate. A sluggish recovery, or a continuation of the downturn in the economic conditions or real estate values of the Company’s market areas, could adversely impact borrowers’ ability to repay loans secured by real estate and the value of real estate collateral, thereby increasing the credit risk associated with the loan portfolio. The Company’s ability to recover on these loans by selling or disposing of the underlying real estate collateral is adversely impacted by declining real estate values, which increases the likelihood that the Company will suffer losses on defaulted loans secured by real estate beyond the amounts provided for in the ALLL. This, in turn, could require material increases in the ALLL which would adversely affect the Company’s financial condition and results of operations, perhaps materially.
There can be no assurance the Company will be able to continue paying dividends on the common stock at recent levels.
The ability to pay dividends on the Company’s common stock depends on a variety of factors. The Company paid dividends of $0.13 per share in each quarter of 2009, 2010 and 2011. The Company may not be able to continue paying quarterly dividends commensurate with recent levels. In that regard, the Federal Reserve now is requiring the Company to provide prior written notice and related information for staff review before declaring or paying dividends. In addition, current guidance from the Federal Reserve provides, among other things, that dividends per share generally should not exceed earnings per share. As a result, future dividends will generally depend on the sufficiency of earnings. Furthermore, the Company’s ability to pay dividends depends on the amount of dividends paid to the Company by its subsidiaries, which is also subject to government regulation, oversight and review. In addition, the ability of some of the bank subsidiaries to pay dividends to the Company is subject to prior regulatory approval.
The Company may not be able to continue to grow organically or through acquisitions.
Historically, the Company has expanded through a combination of organic growth and acquisitions. If market and regulatory conditions remain challenging, the Company may be unable to grow organically or successfully complete potential future acquisitions. In particular, while the Company intends to focus any near-term acquisition efforts on FDIC-assisted transactions within its existing market areas, there can be no assurance that such opportunities will become available on terms that are acceptable to the Company. Furthermore, there can be no assurance that the Company can successfully complete such transactions, since they are subject to a formal bid process and regulatory review and approval.
The FDIC has increased insurance premiums to rebuild and maintain the federal Deposit Insurance Fund and there may be additional future premium increases and special assessments.
In 2009, the FDIC imposed a special deposit insurance assessment of five basis points on all insured institutions, and also required insured institutions to prepay estimated quarterly risk-based assessments for periods through 2012.
The Dodd-Frank Act established 1.35 percent as the minimum Deposit Insurance Fund reserve ratio. The FDIC has determined that the fund reserve ratio should be 2.0 percent and has adopted a plan under which it will meet the statutory minimum fund reserve ratio of 1.35 percent by the statutory deadline of September 30, 2020. The Dodd-Frank Act requires the FDIC to offset the effect on institutions with assets less than $10 billion of the increase in the statutory minimum fund reserve ratio to 1.35 percent from the former statutory minimum of 1.15 percent. The FDIC has not announced how it will implement this offset or how larger institutions will be affected by it.
Despite the FDIC’s actions to restore the Deposit Insurance Fund, the fund will suffer additional losses in the future due to failures of insured institutions. There could be additional significant deposit insurance premium increases, special assessments or prepayments in order to restore the insurance fund’s reserve ratio. Any significant premium increases or special assessments could have a material adverse effect on the Company’s financial condition and results of operations.
The Company’s loan portfolio mix increases the exposure to credit risks tied to deteriorating conditions.
The loan portfolio contains a high percentage of commercial, commercial real estate, real estate acquisition and development loans in relation to the total loans and total assets. These types of loans have historically been viewed as having more risk of default than residential real estate loans or certain other types of loans or investments. In fact, the FDIC has issued pronouncements alerting banks of its concern about banks with a heavy concentration of commercial real estate loans. These types of loans also typically are larger than residential real estate loans and other commercial loans. Because the Company’s loan portfolio contains a significant number of commercial and commercial real estate loans with relatively large balances, the deterioration of one or more of these loans may cause a significant increase in non-performing loans. An increase in non-performing loans could result in a loss of earnings from these loans, an increase in the provision for loan losses, or an increase in loan charge-offs, which could have a material adverse impact on results of operations and financial condition.
16
Table of Contents
Non-performing assets have increased and could continue to increase, which could adversely affect the Company’s results of operations and financial condition.
Non-performing assets (which include OREO) adversely affect the Company’s net income and financial condition in various ways. The Company does not record interest income on non-accrual loans or OREO, thereby adversely affecting its income. When the Company takes collateral in foreclosures and similar proceedings, it is required to mark the related asset to the then fair value of the collateral, less estimated cost to sell, which may result in a charge-off of the value of the asset and lead the Company to increase the provision for loan losses. An increase in the level of non-performing assets also increases the Company’s risk profile and may impact the capital levels its regulators believe are appropriate in light of such risks. Continued decreases in the value of these assets, or the underlying collateral, or in these borrowers’ performance or financial condition, whether or not due to economic and market conditions beyond the Company’s control, could adversely affect the Company’s business, results of operations and financial condition, perhaps materially. In addition to the carrying costs to maintain OREO, the resolution of non-performing assets increases the Company’s loan administration costs generally, and requires significant commitments of time from management and the Company’s directors, which reduces the time they have to focus on profitably growing the Company’s business. The Company may experience further increases in non-performing assets in the future.
A decline in the fair value of the Company’s investment portfolio could adversely affect earnings.
The fair value of the Company’s investment securities could decline as a result of factors including changes in market interest rates, credit quality and credit ratings, lack of market liquidity and other economic conditions. An investment security is impaired if the fair value of the security is less than the carrying value. When a security is impaired, the Company determines whether the impairment is temporary or other-than-temporary. If an impairment is determined to be other-than temporary, an impairment loss is recognized by reducing the amortized cost only for the credit loss associated with the other-than-temporary loss with a corresponding charge to earnings for a like amount. Any such impairment charge would have an adverse effect, which could be material, on the Company’s results of operations and financial condition.
With relatively soft loan demand and increased market liquidity, the investment securities portfolio has grown significantly and represented 44 percent of total assets at December 31, 2011. While the Company believes that the term of such investments has been kept relatively short, the Company is subject to interest rate risk exposure if rates were to increase sharply. Further, the change in the mix of the Company’s assets to more investment securities presents a different type of asset quality risk than the loan portfolio. While the Company believes a relatively conservative approach has been applied to the investment portfolio, there is always potential loss exposure under changing economic conditions. The Company’s investment securities portfolio has increased and now constitutes a much larger portion of assets with any attendant risks of such investments.
Recent and/or future U.S. credit downgrades or changes in outlook by major credit rating agencies may have an adverse effect on financial markets, including financial institutions and the financial industry.
On August 5, 2011, Standard and Poor’s downgraded the United States long-term debt rating from its AAA rating to AA+. On August 8, 2011, Standard and Poor’s downgraded from AAA to AA+ the credit ratings of certain long-term debt instruments issued by Fannie Mae and Freddie Mac and other U.S. government agencies linked to long-term United States debt. It is difficult to predict the effect of these actions, or any future downgrades or changes in outlook by Standard & Poor’s or either of the other two major credit rating agencies. However, these events could impact the trading market for U.S. government securities, including U.S. agency securities, and the securities markets more broadly, and consequently could impact the value and liquidity of financial assets, including assets in the Company’s investment portfolio. These actions could also create broader financial turmoil and uncertainty, which may negatively affect the global banking system and limit the availability of funding, including borrowing under securities sold under agreements to repurchase (“repurchase agreements”), at reasonable terms. In turn, this could have a material adverse effect on the Company’s liquidity, financial condition and results of operations.
17
Table of Contents
Fluctuating interest rates can adversely affect profitability.
The Company’s profitability is dependent to a large extent upon net interest income, which is the difference (or “spread”) between the interest earned on loans, securities and other interest-earning assets and interest paid on deposits, borrowings, and other interest-bearing liabilities. Because of the differences in maturities and repricing characteristics of interest-earning assets and interest-bearing liabilities, changes in interest rates do not produce equivalent changes in interest income earned on interest-earning assets and interest paid on interest-bearing liabilities. Accordingly, fluctuations in interest rates could adversely affect the Company’s interest rate spread, and, in turn, profitability. The Company seeks to manage its interest rate risk within well established guidelines. Generally, the Company seeks an asset and liability structure that insulates net interest income from large deviations attributable to changes in market rates. However, the Company’s structures and practices to manage interest rate risk may not be effective in a highly volatile rate environment.
Interest rate swaps expose the Company to certain risks, and may not be effective in mitigating exposure to changes in interest rates.
Commencing in the fourth quarter of 2011, the Company entered into interest rate swap agreements in order to manage a portion of the risk to interest rate volatility. The Company anticipates that additional interest rate swaps may be entered into in the future. These swap agreements involve other risks, such as the risk that counterparties may fail to honor their obligations under these arrangements, leaving the Company vulnerable to interest rate movements. There can be no assurance that these arrangements will be effective in reducing the Company’s exposure to changes in interest rates.
If goodwill recorded in connection with acquisitions becomes additionally impaired, it could have an adverse impact on earnings and capital.
Accounting standards require the Company account for acquisitions using the acquisition method of accounting. Under acquisition accounting, if the purchase price of an acquired company exceeds the fair value of its net assets, the excess is carried on the acquirer’s balance sheet as goodwill. In accordance with accounting principles generally accepted in the United States of America, goodwill is not amortized but rather is evaluated for impairment on an annual basis or more frequently if events or circumstances indicate that a potential impairment exists. The Company has incurred an impairment of goodwill of $40.2 million ($32.6 million after-tax) during the third quarter of 2011. The Company continues to maintain $106 million in goodwill on its balance sheet and there can be no assurance that future evaluations of goodwill will not result in findings of additional impairment and write-downs, which could be material. While a non-cash item, additional impairment of goodwill could have a material adverse effect on the Company’s business, financial condition and results of operations. Furthermore, additional impairment of goodwill could subject the Company to regulatory limitations, including the ability to pay dividends on its common stock.
Growth through future acquisitions could, in some circumstances, adversely affect profitability or other performance measures.
The Company has in recent years acquired other financial institutions. The Company may in the future engage in selected acquisitions of additional financial institutions, including transactions that may receive assistance from the FDIC, although the Company may not be able to successfully complete any such transactions. There are risks associated with any such acquisitions that could adversely affect profitability and other performance measures. These risks include, among other things, incorrectly assessing the asset quality of a financial institution being acquired, encountering greater than anticipated cost of integrating acquired businesses into the Company’s operations, and being unable to profitably deploy funds acquired in an acquisition. The Company may not be able to continue to grow through acquisitions, and if it does, there is a risk of negative impacts of such acquisitions on the Company’s operating results and financial condition.
The Company anticipates that it might issue capital stock in connection with future acquisitions. Acquisitions and related issuances of stock may have a dilutive effect on earnings per share and the percentage ownership of current shareholders.
A tightening of the credit markets may make it difficult to obtain adequate funding for loan growth, which could adversely affect earnings.
A tightening of the credit markets and the inability to obtain or retain adequate funds for continued loan growth at an acceptable cost may negatively affect the Company’s asset growth and liquidity position and, therefore, earnings capability. In addition to core deposit growth, maturity of investment securities and loan payments, the Company also relies on alternative funding sources through correspondent banking, and borrowing lines with the Federal Reserve Bank and the FHLB to fund loans. In the event the current economic downturn continues, particularly in the housing market, these resources could be negatively affected, both as to price and availability, which would limit and or raise the cost of the funds available to the Company.
18
Table of Contents
The Company may pursue additional capital in the future, which could dilute the holders of the Company’s outstanding common stock and may adversely affect the market price of common stock.
In the current economic environment, the Company believes it is prudent to consider alternatives for raising capital when opportunities to raise capital at attractive prices present themselves, in order to further strengthen the Company’s capital and better position itself to take advantage of opportunities that may arise in the future. Such alternatives may include issuance and sale of common or preferred stock or borrowings by the Company, with proceeds contributed to the bank subsidiaries. Any such capital raising alternatives could dilute the holders of the Company’s outstanding common stock, and may adversely affect the market price of the Company’s common stock and performance measures such as earnings per share.
Business would be harmed if the Company lost the services of any of the senior management team.
The Company believes its success to date has been substantially dependent on its Chief Executive Officer and other members of the executive management team, and on the Presidents of its bank subsidiaries. The loss of any of these persons could have an adverse effect on the Company’s business and future growth prospects.
Competition in the Company’s market areas may limit future success.
Commercial banking is a highly competitive business. The Company competes with other commercial banks, thrifts, credit unions, finance, insurance and other non-depository companies operating in its market areas. The Company is subject to substantial competition for loans and deposits from other financial institutions. Some of its competitors are not subject to the same degree of regulation and restriction as the Company. Some of the Company’s competitors have greater financial resources than the Company. If the Company is unable to effectively compete in its market areas, the Company’s business, results of operations and prospects could be adversely affected.
The Company operates in a highly regulated environment and changes or increases in, or supervisory enforcement of, banking or other laws and regulations or governmental fiscal or monetary policies could adversely affect the Company.
The Company is subject to extensive regulation, supervision and examination by federal and state banking authorities. In addition, as a publicly-traded company, the Company is subject to regulation by the SEC. Any change in applicable regulations or federal, state or local legislation or in policies or interpretations or regulatory approaches to compliance and enforcement, income tax laws and accounting principles could have a substantial impact on the Company and its operations. Changes in laws and regulations may also increase expenses by imposing additional fees or taxes or restrictions on operations. Additional legislation and regulations that could significantly affect powers, authority and operations may be enacted or adopted in the future, which could have a material adverse effect on the Company’s financial condition and results of operations. Failure to appropriately comply with any such laws, regulations or principles could result in sanctions by regulatory agencies or damage to the Company’s reputation, all of which could adversely affect the Company’s business, financial condition or results of operations.
In that regard, sweeping financial regulatory reform legislation was enacted in July 2010. Among other provisions, the new legislation 1) creates a new Bureau of Consumer Financial Protection with broad powers to regulate consumer financial products such as credit cards and mortgages; 2) creates a Financial Stability Oversight Council comprised of the heads of other regulatory agencies; 3) will lead to new capital requirements from federal banking regulatory agencies; 4) places new limits on electronic debt card interchange fees; and 5) requires the SEC and national stock exchanges to adopt significant new corporate governance and executive compensation reforms. The new legislation and regulations are expected to increase the overall costs of regulatory compliance.
Further, regulators have significant discretion and authority to prevent or remedy unsafe or unsound practices or violations of laws or regulations by financial institutions and bank holding companies in the performance of their supervisory and enforcement duties. Recently, these powers have been utilized more frequently due to the challenging national, regional and local economic conditions. The exercise of regulatory authority may have a negative impact on the Company’s financial condition and results of operations. Additionally, the Company’s business is affected significantly by the fiscal and monetary policies of the U.S. federal government and its agencies, including the Federal Reserve Board.
The Company cannot accurately predict the full effects of recent legislation or the various other governmental, regulatory, monetary and fiscal initiatives which have been and may be enacted on the financial markets, on the Company and on its bank subsidiaries. The terms and costs of these activities, or the failure of these actions to help stabilize the financial markets, asset prices, market liquidity and a continuation or worsening of current financial market and economic conditions could materially and adversely affect the Company’s business, financial condition, results of operations, and the trading price of the Company’s common stock.
19
Table of Contents
The Company has various anti-takeover measures that could impede a takeover.
The Company’s articles of incorporation include certain provisions that could make more difficult the acquisition of the Company by means of a tender offer, a proxy contest, merger or otherwise. These provisions include a requirement that any “Business Combination” (as defined in the articles of incorporation) be approved by at least 80 percent of the voting power of the then-outstanding shares, unless it is either approved by the Board of Directors or certain price and procedural requirements are satisfied. In addition, the authorization of preferred stock, which is intended primarily as a financing tool and not as a defensive measure against takeovers, may potentially be used by management to make more difficult uninvited attempts to acquire control of the Company. These provisions may have the effect of lengthening the time required for a person to acquire control of the Company through a tender offer, proxy contest or otherwise, and may deter any potentially unfriendly offers or other efforts to obtain control of the Company. This could deprive the Company’s shareholders of opportunities to realize a premium for their Glacier Bancorp, Inc. common stock, even in circumstances where such action is favored by a majority of the Company’s shareholders.
| Item 1B. | Unresolved Staff Comments |
None
| Item 2. | Properties |
At December 31, 2011, the Company owned 84 of its 106 offices. The remaining 22 offices were leased and include 5 offices in Montana, 12 offices in Idaho, 2 offices in Wyoming, 1 office in Colorado, 1 office in Utah, and 1 office in Washington. Including its headquarters, the aggregate book value of Company-owned offices is $119 million. The following schedule provides property information for the Company as of December 31, 2011.
|
(Dollars in thousands) |
Properties
Leased |
Properties
Owned |
Net Book
Value |
|||||||||
|
Glacier |
2 | 15 | $ | 22,879 | ||||||||
|
Mountain West |
14 | 14 | 19,136 | |||||||||
|
First Security |
2 | 11 | 13,098 | |||||||||
|
Western |
1 | 7 | 14,439 | |||||||||
|
1st Bank |
1 | 11 | 10,313 | |||||||||
|
Valley |
— | 6 | 7,749 | |||||||||
|
Big Sky |
— | 5 | 9,848 | |||||||||
|
First Bank-WY |
1 | 3 | 6,360 | |||||||||
|
Citizens |
— | 6 | 6,262 | |||||||||
|
First Bank-MT |
— | 3 | 750 | |||||||||
|
San Juans |
1 | 2 | 2,949 | |||||||||
|
Parent |
— | 1 | 4,776 | |||||||||
|
|
|
|
|
|
|
|||||||
| 22 | 84 | $ | 118,559 | |||||||||
|
|
|
|
|
|
|
|||||||
The Company believes that all of its facilities are well maintained, generally adequate and suitable for the current operations of its business, as well as fully utilized. In the normal course of business, new locations and facility upgrades occur as needed.
For additional information regarding the Company’s premises and equipment and lease obligations, see Notes 5 and 21 to the Consolidated Financial Statements in “Item 8. Financial Statements and Supplementary Data.”
20
Table of Contents
| Item 3. | Legal Proceedings |
The Company and its subsidiaries are parties to various claims, legal actions and complaints in the ordinary course of their businesses. In the Company’s opinion, all such matters are adequately covered by insurance, are without merit or are of such kind, or involve such amounts, that unfavorable disposition would not have a material adverse effect on the consolidated financial position or results of operations of the Company.
| Item 5. | Market for Registrant’s Common Equity, Related Stockholder Matters and Issuer Purchases of Equity Securities |
The Company’s stock trades on the NASDAQ Global Select Market under the symbol: GBCI. The primary market makers during the year are listed below:
| Barclays Capital Inc./Le | Credit Suisse Securities USA | D.A. Davidson & Co., Inc. | ||
| Deutsche Banc Alex Brown | Instinet, LLC | Knight Capital Americas, L.P. | ||
| Latour Trading LLC | Merrill Lynch, Pierce, Fenner | Morgan Stanley & Co. LLC | ||
| Octeg, LLC | Penson Financial Services | RBC Capital Markets Corp. | ||
| Tradebot Systems, Inc. | UBS Securities LLC | Wedbush Securities Inc. |
The market range of high and low closing prices for the Company’s common stock for the periods indicated are shown below. As of December 31, 2011, there were approximately 1,473 shareholders of record for the Company’s common stock.
| 2011 | 2010 | |||||||||||||||
|
Quarter |
High | Low | High | Low | ||||||||||||
|
First |
$ | 15.94 | $ | 14.09 | $ | 15.94 | $ | 13.75 | ||||||||
|
Second |
15.29 | 12.97 | 18.88 | 14.67 | ||||||||||||
|
Third |
13.75 | 9.23 | 16.73 | 13.75 | ||||||||||||
|
Fourth |
12.51 | 9.09 | 15.76 | 13.00 | ||||||||||||
The Company paid cash dividends on its common stock of $0.52 per share for the years ended December 31, 2011 and 2010. Future cash dividends will depend on a variety of factors, including net income, capital, asset quality, general economic conditions and regulatory considerations.
On March 22, 2010, the Company completed the common stock offering of 10,291,465 shares generating net proceeds, after underwriter discounts and offering expenses, of $145.5 million.
Unregistered Securities
There have been no securities of the Company sold within the last three years which were not registered under the Securities Act.
Issuer Stock Purchases
The Company made no stock repurchases during 2011.
Equity Compensation Plan Information
The Company currently maintains the 2005 Employee Stock Incentive Plan which was approved by the shareholders and provides for the issuance of stock-based compensation to officers, other employees and directors. Although the 1994 Director Stock Option Plan and the 1995 Employee Stock Option Plan expired in March 2009 and April 2005, respectively, there are issued options outstanding under both plans that have not been exercised as of December 31, 2011.
21
Table of Contents
The following table sets forth information regarding outstanding options and shares reserved for future issuance under the following plans as of December 31, 2011:
|
Plan Category |
Number of Shares to be
Issued Upon Exercise of Outstanding Options, Warrants and Rights (a) |
Weighted-Average
Exercise Price of Outstanding Options, Warrants and Rights (b) |
Number of Shares Remaining
Available for Future Issuance Under Equity Compensation Plans (Excluding Shares Reflected in Column (a)) (c) |
|||||||||
|
Equity compensation plans approved by the shareholders |
1,446,860 | $ | 19.52 | 3,722,053 | ||||||||
Stock Performance Graph
The following graphs compare the yearly cumulative total return of the Company’s common stock over both a five-year and ten-year measurement period with the yearly cumulative total return on the stocks included in 1) the Russell 2000 Index, and 2) the SNL Bank Index comprised of banks or bank holding companies with total assets between $5 billion and $10 billion. Each of the cumulative total returns are computed assuming the reinvestment of dividends at the frequency with which dividends were paid during the applicable years.
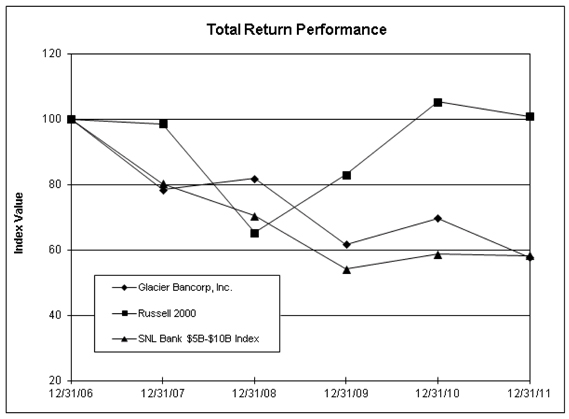
22
Table of Contents
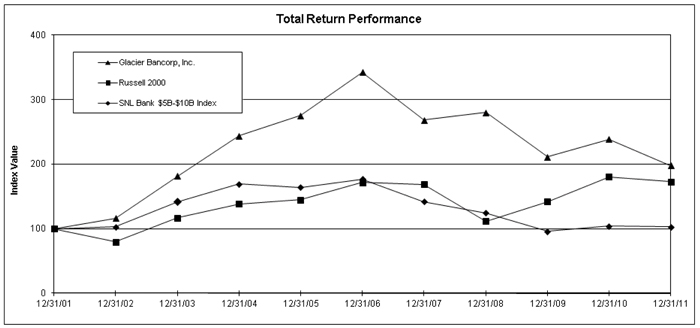
| Item 6. | Selected Financial Data |
The following financial data of the Company are derived from the Company’s historical audited financial statements and related notes. The information set forth below should be read in conjunction with Management’s Discussion and Analysis of Financial Condition and Results of Operations and the Consolidated Financial Statements and related notes contained elsewhere in this report.
|
Compounded Annual
Growth Rate |
||||||||||||||||||||||||||||
| December 31, |
1-Year
2011/2010 |
5-Year
2011/2007 |
||||||||||||||||||||||||||
|
(Dollars in thousands, except per share data) |
2011 | 2010 | 2009 | 2008 | 2007 | |||||||||||||||||||||||
|
Summary of financial condition |
||||||||||||||||||||||||||||
|
Total assets |
$ | 7,187,906 | 6,759,287 | 6,191,795 | 5,553,970 | 4,817,330 | 6.3 | % | 10.0 | % | ||||||||||||||||||
|
Investment securities, available-for-sale |
3,126,743 | 2,461,119 | 1,506,394 | 990,092 | 700,324 | 27.0 | % | 30.5 | % | |||||||||||||||||||
|
Loans receivable, net |
3,328,619 | 3,612,182 | 3,920,988 | 3,998,478 | 3,516,999 | (7.9 | %) | 1.2 | % | |||||||||||||||||||
|
Allowance for loan and lease losses |
(137,516 | ) | (137,107 | ) | (142,927 | ) | (76,739 | ) | (54,413 | ) | 0.3 | % | 22.8 | % | ||||||||||||||
|
Goodwill and intangibles |
114,384 | 157,016 | 160,196 | 159,765 | 154,264 | (27.2 | %) | (4.6 | %) | |||||||||||||||||||
|
Deposits |
4,821,213 | 4,521,902 | 4,100,152 | 3,262,475 | 3,184,478 | 6.6 | % | 8.5 | % | |||||||||||||||||||
|
Federal Home Loan Bank advances |
1,069,046 | 965,141 | 790,367 | 338,456 | 538,949 | 10.8 | % | 28.3 | % | |||||||||||||||||||
|
Securities sold under agreements to repurchase and other borrowed funds |
268,638 | 269,408 | 451,251 | 1,110,731 | 401,621 | (0.3 | %) | (4.5 | %) | |||||||||||||||||||
|
Stockholders’ equity |
850,227 | 838,204 | 685,890 | 676,940 | 528,576 | 1.4 | % | 13.3 | % | |||||||||||||||||||
|
Equity per share 1 |
11.82 | 11.66 | 11.13 | 11.04 | 9.85 | 1.4 | % | 6.3 | % | |||||||||||||||||||
|
Equity as a percentage of total assets |
11.83 | % | 12.40 | % | 11.08 | % | 12.19 | % | 10.97 | % | (4.6 | %) | 3.0 | % | ||||||||||||||
23
Table of Contents
|
Compounded Annual
Growth Rate |
||||||||||||||||||||||||||||
| Years ended December 31, | 1-Year | 5-Year | ||||||||||||||||||||||||||
|
(Dollars in thousands, except per share data) |
2011 | 2010 | 2009 | 2008 | 2007 | 2011/2010 | 2011/2007 | |||||||||||||||||||||
|
Summary of operations |
||||||||||||||||||||||||||||
|
Interest income |
$ | 280,109 | 288,402 | 302,494 | 302,985 | 304,760 | (2.9 | %) | 2.0 | % | ||||||||||||||||||
|
Interest expense |
44,494 | 53,634 | 57,167 | 90,372 | 121,291 | (17.0 | %) | (14.1 | %) | |||||||||||||||||||
|
|
|
|
|
|
|
|
|
|
|
|||||||||||||||||||
|
Net interest income |
235,615 | 234,768 | 245,327 | 212,613 | 183,469 | 0.4 | % | 8.3 | % | |||||||||||||||||||
|
Provision for loan losses |
64,500 | 84,693 | 124,618 | 28,480 | 6,680 | (23.8 | %) | 65.5 | % | |||||||||||||||||||
|
Non-interest income |
78,199 | 87,546 | 86,474 | 61,034 | 64,818 | (10.7 | %) | 8.6 | % | |||||||||||||||||||
|
Non-interest expense 2 |
191,965 | 187,948 | 168,818 | 145,909 | 137,917 | 2.1 | % | 11.3 | % | |||||||||||||||||||
|
|
|
|
|
|
|
|
|
|
|
|||||||||||||||||||
|
Income before income taxes 2 |
57,349 | 49,673 | 38,365 | 99,258 | 103,690 | 15.5 | % | (9.1 | %) | |||||||||||||||||||
|
Income tax (benefit) expense 2 |
7,265 | 7,343 | 3,991 | 33,601 | 35,087 | (1.1 | %) | (25.3 | %) | |||||||||||||||||||
|
|
|
|
|
|
|
|
|
|
|
|||||||||||||||||||
|
Net income 2 |
50,084 | 42,330 | 34,374 | 65,657 | 68,603 | 18.3 | % | (3.9 | %) | |||||||||||||||||||
|
|
|
|
|
|
|
|
|
|
|
|||||||||||||||||||
|
Basic earnings per share 1, 2 |
0.70 | 0.61 | 0.56 | 1.20 | 1.29 | 14.8 | % | (10.7 | %) | |||||||||||||||||||
|
Diluted earnings per share 1, 2 |
0.70 | 0.61 | 0.56 | 1.19 | 1.28 | 14.8 | % | (10.4 | %) | |||||||||||||||||||
|
Dividends declared per share 1 |
0.52 | 0.52 | 0.52 | 0.52 | 0.50 | 0.0 | % | 2.9 | % | |||||||||||||||||||
| At or for the Years ended December 31, | ||||||||||||||||||||
|
(Dollars in thousands) |
2011 | 2010 | 2009 | 2008 | 2007 | |||||||||||||||
|
Ratios |
||||||||||||||||||||
|
Return on average assets 2 |
0.72 | % | 0.67 | % | 0.60 | % | 1.31 | % | 1.49 | % | ||||||||||
|
Return on average equity 2 |
5.78 | % | 5.18 | % | 4.97 | % | 11.63 | % | 13.82 | % | ||||||||||
|
Dividend payout ratio 2 |
74.29 | % | 85.25 | % | 92.86 | % | 43.33 | % | 38.76 | % | ||||||||||
|
Average equity to average asset ratio |
12.39 | % | 12.96 | % | 12.16 | % | 11.23 | % | 10.78 | % | ||||||||||
|
Net interest margin on average earning assets (tax equivalent) |
3.89 | % | 4.21 | % | 4.82 | % | 4.70 | % | 4.50 | % | ||||||||||
|
Efficiency ratio 3 |
49.76 | % | 49.88 | % | 46.44 | % | 49.68 | % | 53.24 | % | ||||||||||
|
Allowance for loan and lease losses as a percent of loans |
3.97 | % | 3.66 | % | 3.52 | % | 1.88 | % | 1.52 | % | ||||||||||
|
Allowance for loan and lease losses as a percent of nonperforming loans |
102 | % | 70 | % | 70 | % | 105 | % | 484 | % | ||||||||||
|
Other data |
||||||||||||||||||||
|
Loans originated and acquired |
$ | 1,650,418 | 1,935,311 | 2,430,967 | 2,456,749 | 2,576,260 | ||||||||||||||
|
Number of full time equivalent employees |
1,653 | 1,674 | 1,643 | 1,571 | 1,480 | |||||||||||||||
|
Number of locations |
106 | 105 | 106 | 101 | 97 | |||||||||||||||
| 1 |
Revised for stock splits and dividends. |
| 2 |
Excludes goodwill impairment charge of $32.6 million ($40.2 million pre-tax). For additional information on the goodwill impairment charge see the Non-GAAP Financial Measures section below. |
| 3 |
Non-interest expense before other real estate owned expenses, core deposit intangibles amortization, goodwill impairment charges, and non-recurring expense items as a percentage of fully taxable equivalent net interest income and non-interest income, excluding gains or losses on sale of investments, other real estate owned income, and non-recurring income items. |
24
Table of Contents
Non-GAAP Financial Measures
In addition to the results presented in accordance with accounting principles generally accepted in the United States of America (“GAAP”), this Form 10-K contains certain non-GAAP financial measures. The Company believes that providing these non-GAAP financial measures provides investors with information useful in understanding the Company’s financial performance, performance trends, and financial position. While the Company uses these non-GAAP measures in its analysis of the Company’s performance, this information should not be considered an alternative to measurements required by GAAP.
| December 31, 2011 | ||||||||||||
|
Goodwill Impairment Charge, |
||||||||||||
|
(Dollars in thousands, except per share data) |
GAAP | Net of Tax | Non-GAAP | |||||||||
|
Non-interest expense |
$ | 232,124 | (40,159 | ) | 191,965 | |||||||
|
Income before income taxes |
$ | 17,190 | 40,159 | 57,349 | ||||||||
|
Income tax (benefit) expense |
$ | (281 | ) | 7,546 | 7,265 | |||||||
|
Net income |
$ | 17,471 | 32,613 | 50,084 | ||||||||
|
Basic earnings per share |
$ | 0.24 | 0.46 | 0.70 | ||||||||
|
Diluted earnings per share |
$ | 0.24 | 0.46 | 0.70 | ||||||||
|
Return on average assets |
0.25 | % | 0.47 | % | 0.72 | % | ||||||
|
Return on average equity |
2.04 | % | 3.74 | % | 5.78 | % | ||||||
|
Dividend payout ratio |
216.67 | % | -142.38 | % | 74.29 | % | ||||||
The reconciling item between the GAAP and non-GAAP financial measures was the third quarter of 2011 goodwill impairment charge (net of tax) of $32.6 million.
| • |
The goodwill impairment charge was $40.2 million with a tax benefit of $7.6 million which resulted in a goodwill impairment charge (net of tax) of $32.6 million. The tax benefit applied only to the $19.4 million of goodwill associated with taxable acquisitions and was determined based on the Company’s marginal income tax rate of 38.9 percent. |
| • |
The basic and diluted earnings per share reconciling items were determined based on the goodwill impairment charge (net of tax) divided by the weighted average diluted shares of 71,915,073. |
| • |
The goodwill impairment charge (net of tax) was included in determining earnings for both the GAAP return on average assets and GAAP return on average equity. The average assets used in the GAAP and non-GAAP return on average assets ratios were $6.923 billion and $6.931 billion for the year ended December 31, 2011, respectively. The average equity used in the GAAP and non-GAAP return on average equity ratios were $858 million and $866 million for the year ended December 31, 2011, respectively. |
| • |
The dividend payout ratio is calculated by dividing dividends declared per share by basic earnings per share. The non-GAAP dividend payout ratio uses the non-GAAP basic earnings per share for calculating the ratio. |
25
Table of Contents
| Item 7. | Management’s Discussion and Analysis of Financial Condition and Results of Operations |
The following discussion is intended to provide a more comprehensive review of the Company’s operating results and financial condition than can be obtained from reading the Consolidated Financial Statements alone. The discussion should be read in conjunction with the Consolidated Financial Statements and the notes thereto included in “Item 8. Financial Statements and Supplementary Data.”
FORWARD-LOOKING STATEMENTS
This Annual Report on Form 10-K may contain forward-looking statements within the meaning of the Private Securities Litigation Reform Act of 1995. These forward-looking statements include, but are not limited to, statements about management’s plans, objectives, expectations and intentions that are not historical facts, and other statements identified by words such as “expects,” “anticipates,” “intends,” “plans,” “believes,” “should,” “projects,” “seeks,” “estimates” or words of similar meaning. These forward-looking statements are based on current beliefs and expectations of management and are inherently subject to significant business, economic and competitive uncertainties and contingencies, many of which are beyond the Company’s control. In addition, these forward-looking statements are subject to assumptions with respect to future business strategies and decisions that are subject to change. The following factors, among others, could cause actual results to differ materially from the anticipated results or other expectations in the forward-looking statements, including those set forth in this Annual Report on Form 10-K, or the documents incorporated by reference:
| • |
the risks associated with lending and potential adverse changes of the credit quality of loans in the Company’s portfolio, including as a result of declines in the housing and real estate markets in its geographic areas; |
| • |
increased loan delinquency rates; |
| • |
the risks presented by a continued economic downturn, which could adversely affect credit quality, loan collateral values, other real estate owned values, investment values, liquidity and capital levels, dividends and loan originations; |
| • |
changes in market interest rates, which could adversely affect the Company’s net interest income and profitability; |
| • |
legislative or regulatory changes that adversely affect the Company’s business, ability to complete pending or prospective future acquisitions, limit certain sources of revenue, or increase cost of operations; |
| • |
costs or difficulties related to the integration of acquisitions; |
| • |
the goodwill we have recorded in connection with acquisitions could become impaired, which may have an adverse impact on our earnings and capital; |
| • |
reduced demand for banking products and services; |
| • |
the risks presented by public stock market volatility, which could adversely affect the market price of our common stock and our ability to raise additional capital in the future; |
| • |
competition from other financial services companies in our markets; |
| • |
loss of services from the senior management team; and |
| • |
the Company’s success in managing risks involved in the foregoing. |
Additional factors that could cause actual results to differ materially from those expressed in the forward-looking statements are discussed in Risk Factors in Item 1A. Please take into account that forward-looking statements speak only as of the date of this Annual Report on Form 10-K (or documents incorporated by reference, if applicable). The Company does not undertake any obligation to publicly correct or update any forward-looking statement if it later becomes aware that actual results are likely to differ materially from those expressed in such forward-looking statement.
26
Table of Contents
MANAGEMENT’S DISCUSSION AND ANALYSIS
OF FINANCIAL CONDITION AND RESULTS OF OPERATIONS
YEAR ENDED DECEMBER 31, 2011 COMPARED TO DECEMBER 31, 2010
Highlights and Overview
Net income for 2011 was $17.5 million, a decrease of $24.9 million from the prior year, and diluted earnings per share for 2011 was $0.24, a decrease of $0.37 per share from the prior year. The decrease in net income during 2011 compared to 2010 resulted from a goodwill impairment charge of $32.6 million ($40.2 million pre-tax) during 2011. For additional information regarding the goodwill impairment charge, see the section captioned “Critical Accounting Polices” included in “Item 7. Management’s Discussion and Analysis of Financial Condition and Results of Operations.” Excluding the goodwill impairment charge, operating income for 2011 was $50.1 million, an increase of $7.8 million, or 18 percent, over the prior year. Diluted operating earnings per share was $0.70, an increase of 15 percent from the $0.61 earned in 2010.
The foremost reason for the increase in operating income was a reduction in the provision for loan losses of $20.2 million. During the year, there was increased pressure on the net interest margin as a percentage of earning assets, on a tax-equivalent basis, which was attributable to a lower yield and volume of loans coupled with an increase in lower yielding investment securities. The net interest margin decreased 32 basis points from 4.21 percent in 2010 to 3.89 percent in 2011. However, the Company worked diligently to maintain net interest income through the purchase of investment securities and the decrease in interest rates on deposits. Net interest income increased $847 thousand, or less than 1 percent, from the prior year.
The Company’s loan portfolio decreased from the prior year as a result of continued slowing loan demand, net charged-off loans, and repossession of foreclosed assets. The loan portfolio decreased by $283 million, or 8 percent, from the prior year end. During the year, there was improvement in the credit quality of the loan portfolio from the historically high levels in 2010. Non-performing assets were $213 million at year end, a decrease of $57.1 million, or 21 percent, from the prior year end and primarily the result of a decrease in the non-performing loans which decreased 31 percent from the prior year end.
Consistent with the prior year, the Company purchased investment securities throughout the year to offset the decrease in the loan portfolio. Investment securities, interest bearing deposits and federal funds sold, increased $721 million, or 30 percent, from the prior year end.
Non-interest bearing deposits increased $155 million, or 18 percent, during the year and interest bearing deposits increased by $144 million, or 4 percent, during the year. As a result of the increase in deposits, the Company required less borrowings to fund the investment growth and only increased FHLB advances by $104 million during the year. Tangible stockholders’ equity increased $54.7 million, or $0.76 per share, during the year and the Company and each of the bank subsidiaries have remained above the well capitalized levels required by regulators.
Looking forward, the Company’s future performance will depend on many factors including economic conditions in the markets the Company serves, interest rate changes, increasing competition for deposits and loans, loan quality, and regulatory burden. The Company’s goal of its asset and liability management practices is to maintain or increase the level of net interest income within an acceptable level of interest rate risk.
27
Table of Contents
Financial Condition Analysis
Assets
The following table summarizes the asset balances as of the dates indicated, and the amount and percentage changes from December 31, 2010:
| December 31, | December 31, | |||||||||||||||
|
(Dollars in thousands) |
2011 | 2010 | $ Change | % Change | ||||||||||||
|
Cash on hand and in banks |
$ | 104,674 | 71,465 | 33,209 | 46 | % | ||||||||||
|
Investment securities and interest bearing cash deposits |
3,150,101 | 2,429,473 | 720,628 | 30 | % | |||||||||||
|
Loans receivable |
||||||||||||||||
|
Residential real estate |
516,807 | 632,877 | (116,070 | ) | -18 | % | ||||||||||
|
Commercial |
2,295,927 | 2,451,091 | (155,164 | ) | -6 | % | ||||||||||
|
Consumer and other |
653,401 | 665,321 | (11,920 | ) | -2 | % | ||||||||||
|
|
|
|
|
|
|
|
|
|||||||||
|
Loans receivable |
3,466,135 | 3,749,289 | (283,154 | ) | -8 | % | ||||||||||
|
Allowance for loan and lease losses |
(137,516 | ) | (137,107 | ) | (409 | ) | 0 | % | ||||||||
|
|
|
|
|
|
|
|
|
|||||||||
|
Loans receivable, net |
3,328,619 | 3,612,182 | (283,563 | ) | -8 | % | ||||||||||
|
|
|
|
|
|
|
|
|
|||||||||
|
Other assets |
604,512 | 646,167 | (41,655 | ) | -6 | % | ||||||||||
|
|
|
|
|
|
|
|
|
|||||||||
|
Total assets |
$ | 7,187,906 | 6,759,287 | 428,619 | 6 | % | ||||||||||
|
|
|
|
|
|
|
|
|
|||||||||
Investment securities and interest bearing deposits, increased $721 million, or 30 percent, from December 31, 2010. During the year, the Company purchased investment securities to primarily offset the lack of loan growth and to maintain interest income. The investment securities purchased during the current year were predominately U.S. Agency Collateralized Mortgage Obligations (“CMO”) with short weighted-average-lives and tax-exempt state and local government obligations. Investment securities represent 44 percent of total assets at December 31, 2011 versus 36 percent at December 31, 2010.
At December 31, 2011, the loan portfolio was $3.466 billion, a decrease of $283 million, or 8 percent, from total loans of $3.749 billion at December 31, 2010. Excluding net charge-offs of $64.1 million and loans transferred to OREO of $79.3 million, loans decreased $140 million, or 4 percent, from December 31, 2010. During the year, the largest decrease in dollars was in commercial loans which decreased $155 million, or 6 percent, from December 31, 2010. The largest percentage decrease was in real estate loans which decreased $116 million, or 18 percent, from December 31, 2010. The Company continues to reduce its exposure to land, lot and other construction loans which totaled $381 million as of December 31, 2011 and have decreased $168 million, or 31 percent, since the prior year end. The continued downturn in the economy and resulting lack of loan demand were the primary reasons for the decrease in the loan portfolio.
As a result of the third quarter 2011 goodwill impairment charge (net of tax) of $32.6 million, other assets decreased $41.7 million from December 31, 2010.
28
Table of Contents
Liabilities
The following table summarizes the liability balances as of the dates indicated, and the amount and percentage changes from December 31, 2010:
| December 31, | December 31, | |||||||||||||||
|
(Dollars in thousands) |
2011 | 2010 | $ Change | % Change | ||||||||||||
|
Non-interest bearing deposits |
$ | 1,010,899 | 855,829 | 155,070 | 18 | % | ||||||||||
|
Interest bearing deposits |
3,810,314 | 3,666,073 | 144,241 | 4 | % | |||||||||||
|
Repurchase agreements |
258,643 | 249,403 | 9,240 | 4 | % | |||||||||||
|
FHLB advances |
1,069,046 | 965,141 | 103,905 | 11 | % | |||||||||||
|
Other borrowed funds |
9,995 | 20,005 | (10,010 | ) | -50 | % | ||||||||||
|
Subordinated debentures |
125,275 | 125,132 | 143 | 0 | % | |||||||||||
|
Other liabilities |
53,507 | 39,500 | 14,007 | 35 | % | |||||||||||
|
|
|
|
|
|
|
|
|
|||||||||
|
Total liabilities |
$ | 6,337,679 | 5,921,083 | 416,596 | 7 | % | ||||||||||
|
|
|
|
|
|
|
|
|
|||||||||
At December 31, 2011, non-interest bearing deposits of $1.011 billion increased $155 million, or 18 percent, since December 31, 2010. The increase in non-interest bearing deposits during the year was driven by the continued growth in the number of personal and business customers, as well as existing customers retaining cash deposits for liquidity purposes due to the uncertainty in the current economic environment. Interest bearing deposits of $3.810 billion at December 31, 2011 included $170 million of reciprocal deposits (e.g., Certificate of Deposit Account Registry System deposits). Interest bearing deposits increased $144 million, or 4 percent, from the prior year end and included an increase of $31.1 million in wholesale deposits, including reciprocal deposits. These deposit increases have been beneficial to the Company in funding the investment securities portfolio growth at low costs over the prior twelve months.
To fund growth in the investment securities portfolio, the Company’s level of borrowings has increased as needed to supplement deposit growth. FHLB advances increased $104 million since December 31, 2010.
Stockholders’ Equity
The following table summarizes the stockholders’ equity balances as of the dates indicated, and the amount and percentage changes from December 31, 2010:
| December 31, | December 31, | |||||||||||||||
|
Dollars in thousands, except per share data) |
2011 | 2010 | $ Change | % Change | ||||||||||||
|
Common equity |
$ | 816,740 | 837,676 | (20,936 | ) | -2 | % | |||||||||
|
Accumulated other comprehensive income |
33,487 | 528 | 32,959 | 6242 | % | |||||||||||
|
|
|
|
|
|
|
|
|
|||||||||
|
Total stockholders’ equity |
850,227 | 838,204 | 12,023 | 1 | % | |||||||||||
|
Goodwill and core deposit intangible, net |
(114,384 | ) | (157,016 | ) | 42,632 | -27 | % | |||||||||
|
|
|
|
|
|
|
|
|
|||||||||
|
Tangible stockholders’ equity |
$ | 735,843 | 681,188 | 54,655 | 8 | % | ||||||||||
|
|
|
|
|
|
|
|
|
|||||||||
|
Stockholders’ equity to total assets |
11.83 | % | 12.40 | % | -0.57 | % | -5 | % | ||||||||
|
Tangible stockholders’ equity to total tangible assets |
10.40 | % | 10.32 | % | 0.08 | % | 1 | % | ||||||||
|
Book value per common share |
$ | 11.82 | 11.66 | 0.16 | 1 | % | ||||||||||
|
Tangible book value per common share |
$ | 10.23 | 9.47 | 0.76 | 8 | % | ||||||||||
|
Market price per share at end of period |
$ | 12.03 | 15.11 | (3.08 | ) | -20 | % | |||||||||
Total stockholders’ equity and book value per share increased $12.0 million and $0.16 per share from the prior year end. The increase came primarily from accumulated other comprehensive income representing net unrealized gains or losses (net of tax) on the investment securities portfolio which was largely offset by the third quarter 2011 goodwill impairment charge (net of tax) of $32.6 million. Tangible stockholders’ equity increased $54.7 million, or $0.76 per share since December 31, 2010 resulting in tangible stockholders’ equity to tangible assets of 10.40 percent and tangible book value per share of $10.23 as of December 31, 2011.
29
Table of Contents
Results of Operations
Performance Summary
Net income was $17.5 million or $0.24 per share for the year ended December 31, 2011. Excluding the goodwill impairment charge, net operating income for 2011 was $50.1 million versus $42.3 million for the prior year. Diluted operating income per share for 2011 was $0.70 per share, an increase of 15 percent from the prior year earnings per share of $0.61. Net operating income is considered a non-GAAP financial measure and additional information regarding this measurement and reconciliation is provided in “Item 6. Selected Financial Data.”
Income Summary
The following table summarizes income for the periods indicated, including the amount and percentage changes from December 31, 2010:
| Years ended December 31, | ||||||||||||||||
|
(Dollars in thousands) |
2011 | 2010 | $ Change | % Change | ||||||||||||
|
Net interest income |
||||||||||||||||
|
Interest income |
$ | 280,109 | $ | 288,402 | $ | (8,293 | ) | -3 | % | |||||||
|
Interest expense |
44,494 | 53,634 | (9,140 | ) | -17 | % | ||||||||||
|
|
|
|
|
|
|
|||||||||||
|
Total net interest income |
235,615 | 234,768 | 847 | 0 | % | |||||||||||
|
Non-interest income |
||||||||||||||||
|
Service charges, loan fees, and other fees |
48,113 | 47,946 | 167 | 0 | % | |||||||||||
|
Gain on sale of loans |
21,132 | 27,233 | (6,101 | ) | -22 | % | ||||||||||
|
Gain on sale of investments |
346 | 4,822 | (4,476 | ) | -93 | % | ||||||||||
|
Other income |
8,608 | 7,545 | 1,063 | 14 | % | |||||||||||
|
|
|
|
|
|
|
|||||||||||
|
Total non-interest income |
78,199 | 87,546 | (9,347 | ) | -11 | % | ||||||||||
|
|
|
|
|
|
|
|||||||||||
| $ | 313,814 | $ | 322,314 | $ | (8,500 | ) | -3 | % | ||||||||
|
|
|
|
|
|
|
|||||||||||
|
Net interest margin (tax-equivalent) |
3.89 | % | 4.21 | % | ||||||||||||
|
|
|
|
|
|||||||||||||
Net Interest Income
Net interest income for 2011 remained stable compared to 2010. During 2011, interest income decreased $8.3 million, or 3 percent, while interest expense decreased $9.1 million, or 17 percent from 2010. The decrease in interest income from the prior year resulted from the increase in premium amortization coupled with the reduction in loan balances, the combination of which put further pressure on earning asset yields. Interest income also continues to reflect the Company’s purchase of a significant amount of investment securities over the course of several quarters at lower yields than the loans they replaced. Interest income included $35.8 million in premium amortization (net of discount accretion) on CMOs which was an increase of $18.1 million from the prior year. This increase was the result of both the increased purchases of CMOs combined with the continued refinance activity. The decrease in interest expense in 2011 was primarily attributable to the rate decreases on interest bearing deposits. The funding cost for 2011 was 87 basis points compared to 116 basis points for 2010.
The net interest margin decreased 32 basis points from 4.21 percent for 2010 to 3.89 for 2011. The reduction was attributable to a lower yield and volume of loans coupled with an increase in lower yielding investment securities and higher CMO premium amortization. The premium amortization in 2011 accounted for a 56 basis point reduction in the net interest margin compared to a 30 basis point reduction in the net interest margin for the same period last year.
Non-interest Income
Non-interest income of $78.2 million for 2011 decreased $9.3 million, or 11 percent, over non-interest income of $87.5 million for 2010. Gain on sale of loans for 2011 decreased $6.1 million, or 22 percent, from 2010 due to a significant reduction in refinance activity. Excluding the prior year $2.0 million gain on the sale of merchant card servicing portfolio, other income for 2011 increased $3.1 million, or 56 percent, over 2010 of which $1.7 million was from debit card income and $1.3 million was from the combination of operating income from OREO and gain on sale of OREO.
30
Table of Contents
Non-interest Expense
The following table summarizes non-interest expense for the periods indicated, including the amount and percentage changes from December 31, 2010:
| Years ended December 31, | ||||||||||||||||
|
(Dollars in thousands) |
2011 | 2010 | $ Change | % Change | ||||||||||||
|
Compensation, employee benefits and related expense |
$ | 85,691 | $ | 87,728 | $ | (2,037 | ) | -2 | % | |||||||
|
Occupancy and equipment expense |
23,599 | 24,261 | (662 | ) | -3 | % | ||||||||||
|
Advertising and promotions |
6,469 | 6,831 | (362 | ) | -5 | % | ||||||||||
|
Outsourced data processing expense |
3,153 | 3,057 | 96 | 3 | % | |||||||||||
|
Other real estate owned expense |
27,255 | 22,193 | 5,062 | 23 | % | |||||||||||
|
Federal Deposit Insurance Corporation premiums |
8,169 | 9,121 | (952 | ) | -10 | % | ||||||||||
|
Core deposit intangibles amortization |
2,473 | 3,180 | (707 | ) | -22 | % | ||||||||||
|
Other expense |
35,156 | 31,577 | 3,579 | 11 | % | |||||||||||
|
|
|
|
|
|
|
|||||||||||
|
Total non-interest expense before goodwill impairment charge |
191,965 | 187,948 | 4,017 | 2 | % | |||||||||||
|
Goodwill impairment charge |
40,159 | — | 40,159 | n/m | ||||||||||||
|
|
|
|
|
|
|
|||||||||||
|
Total non-interest expense |
$ | 232,124 | $ | 187,948 | $ | 44,176 | 24 | % | ||||||||
|
|
|
|
|
|
|
|||||||||||
Excluding the goodwill impairment charge, non-interest expense for 2011 increased by $4.0 million, or 2 percent, from 2010. Compensation and employee benefits for 2011 decreased $2.0 million, or 2 percent, and was the result of the reduction in full time equivalent employees. Occupancy and equipment expense decreased $662 thousand, or 3 percent, from the prior year. OREO expense of $27.3 million increased $5.1 million, or 23 percent, from the prior year. The OREO expense for 2011 included $5.8 million of operating expenses, $16.3 million of fair value write-downs, and $5.2 million of loss on sale of OREO. FDIC premium expense decreased $952 thousand, or 10 percent, from the prior year as a result of a change in the FDIC assessment calculation. Other expense increased $3.6 million, or 11 percent, from the prior year and was primarily driven by increases in debit card expenses and expenses associated with New Markets Tax Credits investments.
Efficiency Ratio
The Company calculates the efficiency ratio as non-interest expense before other real estate owned expenses, core deposit intangibles amortization, goodwill impairment charges, and non-recurring expense items as a percentage of fully taxable equivalent net interest income and non-interest income, excluding gains or losses on sale of investments, other real estate owned income, and non-recurring income items. The efficiency ratio was 50 percent for both 2011 and 2010. There was a notable decrease in gain on sale of loans for 2011 compared to 2010 as refinance activity slowed during 2011. The decrease in gain on sale of loans was offset by increases in investment security income.
Provision for Loan Losses
|
(Dollars in thousands) |
Provision
for Loan Losses |
Net
Charge-Offs |
ALLL
as a Percent of Loans |
Accruing
Loans 30-89 Days Past Due as a Percent of Loans |
Non-Performing
Assets to Total Subsidiary Assets |
|||||||||||||||
|
Q4 2011 |
$ | 8,675 | 9,252 | 3.97 | % | 1.42 | % | 2.92 | % | |||||||||||
|
Q3 2011 |
17,175 | 18,877 | 3.92 | % | 0.60 | % | 3.49 | % | ||||||||||||
|
Q2 2011 |
19,150 | 20,184 | 3.88 | % | 1.14 | % | 3.68 | % | ||||||||||||
|
Q1 2011 |
19,500 | 15,778 | 3.86 | % | 1.44 | % | 3.78 | % | ||||||||||||
|
Q4 2010 |
27,375 | 24,525 | 3.66 | % | 1.21 | % | 3.91 | % | ||||||||||||
|
Q3 2010 |
19,162 | 26,570 | 3.47 | % | 1.06 | % | 4.03 | % | ||||||||||||
|
Q2 2010 |
17,246 | 19,181 | 3.58 | % | 0.92 | % | 4.01 | % | ||||||||||||
|
Q1 2010 |
20,910 | 20,237 | 3.58 | % | 1.53 | % | 4.19 | % | ||||||||||||
31
Table of Contents
The Company provisioned slightly more than the amount of net charged-off loans during 2011. The provision for loan losses was $64.5 million for 2011, a decrease of $20.2 million, or 24 percent, from the prior year. Net charged-off loans during 2011 was $64.1 million, a decrease of $26.4 million from 2010. The largest category of net charge-offs was in land, lot and other construction loans which had net charge-offs of $31.3 million, or 49 percent of total net charged-off loans.
MANAGEMENT’S DISCUSSION AND ANALYSIS
OF THE RESULTS OF OPERATIONS
YEAR ENDED DECEMBER 31, 2010 COMPARED TO DECEMBER 31, 2009
Income Summary
The following table summarizes income for the periods indicated, including the amount and percentage changes from December 31, 2009:
| Years ended December 31, | ||||||||||||||||
|
(Dollars in thousands) |
2010 | 2009 | $ Change | % Change | ||||||||||||
|
Net interest income |
||||||||||||||||
|
Interest income |
$ | 288,402 | $ | 302,494 | $ | (14,092 | ) | -5 | % | |||||||
|
Interest expense |
53,634 | 57,167 | (3,533 | ) | -6 | % | ||||||||||
|
|
|
|
|
|
|
|||||||||||
|
Total net interest income |
234,768 | 245,327 | (10,559 | ) | -4 | % | ||||||||||
|
Non-interest income |
||||||||||||||||
|
Service charges, loan fees, and other fees |
47,946 | 45,871 | 2,075 | 5 | % | |||||||||||
|
Gain on sale of loans |
27,233 | 26,923 | 310 | 1 | % | |||||||||||
|
Gain on sale of investments |
4,822 | 5,995 | (1,173 | ) | -20 | % | ||||||||||
|
Other income |
7,545 | 7,685 | (140 | ) | -2 | % | ||||||||||
|
|
|
|
|
|
|
|||||||||||
|
Total non-interest income |
87,546 | 86,474 | 1,072 | 1 | % | |||||||||||
|
|
|
|
|
|
|
|||||||||||
| $ | 322,314 | $ | 331,801 | $ | (9,487 | ) | -3 | % | ||||||||
|
|
|
|
|
|
|
|||||||||||
|
Net interest margin (tax-equivalent) |
4.21 | % | 4.82 | % | ||||||||||||
|
|
|
|
|
|||||||||||||
Net Interest Income
Net interest income for 2010 decreased $10.6 million, or 4 percent, over 2009. Total interest income decreased $14 million, or 5 percent, while total interest expense decreased $3.5 million, or 6 percent. The net interest margin as a percentage of earning assets, on a tax-equivalent basis, decreased 61 basis points from 4.82 percent for 2009 to 4.21 percent for 2010, such decrease including a 6 basis points reduction from the reversal of interest on non-accrual loans. The decrease in lower yield and lower volume of loans coupled with an increase in lower yielding investment securities put pressure on both interest income and the net interest margin.
Non-interest Income
Non-interest income increased $1.0 million in 2010 over the same period in 2009. Fee income for 2010 increased $2.1 million, or 5 percent, compared to 2009 primarily from an increase in debit card income. Gain on sale of loans remained at historical highs of $27.2 million for 2010, which was an increase of $310 thousand, or 1 percent, over 2009. Included in 2010 other income was $2.0 million in one-time gains on merchant card servicing portfolios and included in 2009 other income was $3.5 million in a one-time bargain purchase gain from the acquisition of First Bank-WY. Excluding one-time gains, other income increased $1.3 million over the same period in 2009.
32
Table of Contents
Non-interest Expense
The following table summarizes non-interest expense for the periods indicated, including the amount and percentage changes from December 31, 2009:
| Years ended December 31, | ||||||||||||||||
|
(Dollars in thousands) |
2010 | 2009 | $ Change | % Change | ||||||||||||
|
Compensation, employee benefits and related expense |
$ | 87,728 | $ | 84,965 | $ | 2,763 | 3 | % | ||||||||
|
Occupancy and equipment expense |
24,261 | 23,471 | 790 | 3 | % | |||||||||||
|
Advertising and promotions |
6,831 | 6,477 | 354 | 5 | % | |||||||||||
|
Outsourced data processing expense |
3,057 | 3,031 | 26 | 1 | % | |||||||||||
|
Other real estate owned expense |
22,193 | 9,092 | 13,101 | 144 | % | |||||||||||
|
Federal Deposit Insurance Corporation premiums |
9,121 | 8,639 | 482 | 6 | % | |||||||||||
|
Core deposit intangibles amortization |
3,180 | 3,116 | 64 | 2 | % | |||||||||||
|
Other expense |
31,577 | 30,027 | 1,550 | 5 | % | |||||||||||
|
|
|
|
|
|
|
|||||||||||
|
Total non-interest expense |
$ | 187,948 | $ | 168,818 | $ | 19,130 | 11 | % | ||||||||
|
|
|
|
|
|
|
|||||||||||
Non-interest expense for 2010 increased by $19.1 million, or 11 percent, from 2009. Compensation and employee benefits increased $2.8 million, or 3 percent, from 2009 which relates to the increase in full-time equivalent employees including the addition of First Bank-WY employees in October 2009. Occupancy and equipment expense increased $790 thousand, or 3 percent, from 2009. Advertising and promotion expense increased by $354 thousand, or 5 percent, from 2009. The primary category that saw much higher expense was OREO which increased $13.1 million, or 144 percent, from 2009. OREO expenses of $22.2 million for 2010 included $5.1 million of operating expenses, $10.4 million of fair value write-downs, and $6.7 million of loss on sale of OREO. FDIC premiums increased $482 thousand, or 6 percent, from 2009 which included a second quarter 2010 special assessment of $2.5 million.
Provision for Loan Losses
The provision for loan losses was $84.7 million for 2010, a decrease of $39.9 million, or 32 percent, from the same period in 2009. Net charged-off loans during the year ended December 31, 2010 was $90.5 million, an increase of $32.1 million from the same period in 2009.
ADDITIONAL MANAGEMENT’S DISCUSSION AND ANALYSIS
Lending Activity and Practices
The Banks focus their lending activity primarily on the following types of loans: 1) first-mortgage, conventional loans secured by residential properties, particularly single-family, 2) commercial lending that concentrates on targeted businesses, and 3) installment lending for consumer purposes (e.g., auto, home equity, etc.). Note 4 to the Consolidated Financial Statements in “Item 8. Financial Statements and Supplementary Data” provides more information about the loan portfolio.
33
Table of Contents
The following table summarizes the Company’s loan portfolio as of the dates indicated:
| December 31, 2011 | December 31, 2010 | December 31, 2009 | December 31, 2008 | December 31, 2007 | ||||||||||||||||||||||||||||||||||||
|
(Dollars in thousands) |
Amount | Percent | Amount | Percent | Amount | Percent | Amount | Percent | Amount | Percent | ||||||||||||||||||||||||||||||
|
Residential real estate loans |
$ | 516,807 | 15.53 | % | $ | 632,877 | 17.52 | % | $ | 743,147 | 18.95 | % | $ | 783,399 | 19.59 | % | $ | 685,731 | 19.50 | % | ||||||||||||||||||||
|
Commercial loans |
||||||||||||||||||||||||||||||||||||||||
|
Real estate |
1,672,059 | 50.23 | % | 1,796,503 | 49.73 | % | 1,894,690 | 48.33 | % | 1,930,849 | 48.29 | % | 1,611,178 | 45.81 | % | |||||||||||||||||||||||||
|
Other commercial |
623,868 | 18.74 | % | 654,588 | 18.12 | % | 724,579 | 18.48 | % | 644,980 | 16.13 | % | 636,125 | 18.09 | % | |||||||||||||||||||||||||
|
|
|
|
|
|
|
|
|
|
|
|
|
|
|
|
|
|
|
|
|
|||||||||||||||||||||
|
Total |
2,295,927 | 68.97 | % | 2,451,091 | 67.85 | % | 2,619,269 | 66.81 | % | 2,575,829 | 64.42 | % | 2,247,303 | 63.90 | % | |||||||||||||||||||||||||
|
Consumer and other loans |
||||||||||||||||||||||||||||||||||||||||
|
Home equity |
440,569 | 13.24 | % | 483,137 | 13.38 | % | 501,866 | 12.80 | % | 507,839 | 12.70 | % | 432,002 | 12.28 | % | |||||||||||||||||||||||||
|
Other consumer |
212,832 | 6.39 | % | 182,184 | 5.04 | % | 199,633 | 5.09 | % | 208,150 | 5.21 | % | 206,376 | 5.87 | % | |||||||||||||||||||||||||
|
|
|
|
|
|
|
|
|
|
|
|
|
|
|
|
|
|
|
|
|
|||||||||||||||||||||
|
Total |
653,401 | 19.63 | % | 665,321 | 18.42 | % | 701,499 | 17.89 | % | 715,989 | 17.91 | % | 638,378 | 18.15 | % | |||||||||||||||||||||||||
|
|
|
|
|
|
|
|
|
|
|
|
|
|
|
|
|
|
|
|
|
|||||||||||||||||||||
|
Loans receivable |
3,466,135 | 104.13 | % | 3,749,289 | 103.79 | % | 4,063,915 | 103.65 | % | 4,075,217 | 101.92 | % | 3,571,412 | 101.55 | % | |||||||||||||||||||||||||
|
Allowance for loan and lease losses |
(137,516 | ) | -4.13 | % | (137,107 | ) | -3.79 | % | (142,927 | ) | -3.65 | % | (76,739 | ) | -1.92 | % | (54,413 | ) | -1.55 | % | ||||||||||||||||||||
|
|
|
|
|
|
|
|
|
|
|
|
|
|
|
|
|
|
|
|
|
|||||||||||||||||||||
|
Loans receivable, net |
$ | 3,328,619 | 100.00 | % | $ | 3,612,182 | 100.00 | % | $ | 3,920,988 | 100.00 | % | $ | 3,998,478 | 100.00 | % | $ | 3,516,999 | 100.00 | % | ||||||||||||||||||||
|
|
|
|
|
|
|
|
|
|
|
|
|
|
|
|
|
|
|
|
|
|||||||||||||||||||||
The stated maturities or first repricing term (if applicable) for the loan portfolio at December 31, 2011 was as follows:
|
(Dollars in thousands) |
Residential
Real Estate |
Commercial |
Consumer
and Other |
Totals | ||||||||||||
|
Variable rate maturing or repricing in |
||||||||||||||||
|
One year or less |
$ | 189,798 | 779,936 | 271,402 | 1,241,136 | |||||||||||
|
One to five years |
119,202 | 763,623 | 28,873 | 911,698 | ||||||||||||
|
Thereafter |
9,027 | 118,311 | 4,860 | 132,198 | ||||||||||||
|
Fixed rate maturing in |
||||||||||||||||
|
One year or less |
104,202 | 236,993 | 124,005 | 465,200 | ||||||||||||
|
One to five years |
80,371 | 280,331 | 204,284 | 564,986 | ||||||||||||
|
Thereafter |
14,207 | 116,733 | 19,977 | 150,917 | ||||||||||||
|
|
|
|
|
|
|
|
|
|||||||||
|
Totals |
$ | 516,807 | 2,295,927 | 653,401 | 3,466,135 | |||||||||||
|
|
|
|
|
|
|
|
|
|||||||||
34
Table of Contents
The following tables summarize selected information by regulatory classification of the Company’s loan portfolio:
| Loans Receivable by Bank | ||||||||||||||||
|
(Dollars in thousands) |
Balance
12/31/11 |
Balance
12/31/10 |
$ Change | % Change | ||||||||||||
|
Glacier |
$ | 797,530 | 866,097 | (68,567 | ) | -8 | % | |||||||||
|
Mountain West |
707,442 | 821,135 | (113,693 | ) | -14 | % | ||||||||||
|
First Security |
575,254 | 571,925 | 3,329 | 1 | % | |||||||||||
|
Western |
272,681 | 305,977 | (33,296 | ) | -11 | % | ||||||||||
|
1st Bank |
243,216 | 266,505 | (23,289 | ) | -9 | % | ||||||||||
|
Valley |
195,395 | 183,003 | 12,392 | 7 | % | |||||||||||
|
Big Sky |
229,640 | 249,593 | (19,953 | ) | -8 | % | ||||||||||
|
First Bank-WY |
130,766 | 143,224 | (12,458 | ) | -9 | % | ||||||||||
|
Citizens |
166,777 | 168,972 | (2,195 | ) | -1 | % | ||||||||||
|
First Bank-MT |
112,390 | 109,310 | 3,080 | 3 | % | |||||||||||
|
San Juans |
135,516 | 143,574 | (8,058 | ) | -6 | % | ||||||||||
|
Eliminations and other |
(5,015 | ) | (3,813 | ) | (1,202 | ) | 32 | % | ||||||||
|
Loans held for sale |
(95,457 | ) | (76,213 | ) | (19,244 | ) | 25 | % | ||||||||
|
|
|
|
|
|
|
|||||||||||
|
Total |
$ | 3,466,135 | 3,749,289 | (283,154 | ) | -8 | % | |||||||||
|
|
|
|
|
|
|
|||||||||||
| Land, Lot and Other Construction Loans by Bank | ||||||||||||||||
|
(Dollars in thousands) |
Balance
12/31/11 |
Balance
12/31/10 |
$ Change | % Change | ||||||||||||
|
Glacier |
$ | 101,429 | 148,319 | (46,890 | ) | -32 | % | |||||||||
|
Mountain West |
91,275 | 147,991 | (56,716 | ) | -38 | % | ||||||||||
|
First Security |
46,899 | 72,409 | (25,510 | ) | -35 | % | ||||||||||
|
Western |
20,216 | 29,535 | (9,319 | ) | -32 | % | ||||||||||
|
1st Bank |
20,422 | 29,714 | (9,292 | ) | -31 | % | ||||||||||
|
Valley |
13,755 | 12,816 | 939 | 7 | % | |||||||||||
|
Big Sky |
43,548 | 53,648 | (10,100 | ) | -19 | % | ||||||||||
|
First Bank-WY |
6,924 | 12,341 | (5,417 | ) | -44 | % | ||||||||||
|
Citizens |
7,905 | 12,187 | (4,282 | ) | -35 | % | ||||||||||
|
First Bank-MT |
731 | 830 | (99 | ) | -12 | % | ||||||||||
|
San Juans |
24,114 | 30,187 | (6,073 | ) | -20 | % | ||||||||||
|
Other |
4,280 | — | 4,280 | n/m | ||||||||||||
|
|
|
|
|
|
|
|||||||||||
|
Total |
$ | 381,498 | 549,977 | (168,479 | ) | -31 | % | |||||||||
|
|
|
|
|
|
|
|||||||||||
35
Table of Contents
| Land, Lot and Other Construction Loans by Bank, by Type at 12/31/11 | ||||||||||||||||||||||||
|
(Dollars in thousands) |
Land
Development |
Consumer
Land or Lot |
Unimproved
Land |
Developed
Lots for Operative Builders |
Commercial
Developed Lot |
Other
Construction |
||||||||||||||||||
|
Glacier |
$ | 37,516 | 23,026 | 25,581 | 6,978 | 4,889 | 3,439 | |||||||||||||||||
|
Mountain West |
12,771 | 49,785 | 5,076 | 12,485 | 3,283 | 7,875 | ||||||||||||||||||
|
First Security |
19,915 | 5,961 | 15,013 | 3,447 | 698 | 1,865 | ||||||||||||||||||
|
Western |
9,710 | 4,241 | 3,157 | 534 | 1,649 | 925 | ||||||||||||||||||
|
1st Bank |
5,060 | 7,063 | 2,655 | 199 | 1,273 | 4,172 | ||||||||||||||||||
|
Valley |
1,984 | 4,495 | 1,383 | — | 3,582 | 2,311 | ||||||||||||||||||
|
Big Sky |
12,275 | 13,671 | 7,960 | 955 | 2,748 | 5,939 | ||||||||||||||||||
|
First Bank-WY |
1,758 | 3,336 | 784 | 582 | 80 | 384 | ||||||||||||||||||
|
Citizens |
1,977 | 1,005 | 1,910 | — | 621 | 2,392 | ||||||||||||||||||
|
First Bank-MT |
— | 56 | 618 | — | 57 | — | ||||||||||||||||||
|
San Juans |
915 | 12,757 | 1,937 | — | 7,741 | 764 | ||||||||||||||||||
|
Other |
— | — | — | — | — | 4,280 | ||||||||||||||||||
|
|
|
|
|
|
|
|
|
|
|
|
|
|||||||||||||
|
Total |
$ | 103,881 | 125,396 | 66,074 | 25,180 | 26,621 | 34,346 | |||||||||||||||||
|
|
|
|
|
|
|
|
|
|
|
|
|
|||||||||||||
| Residential Construction Loans by Bank, by Type |
Custom and
Owner |
Pre-Sold | ||||||||||||||||||||||
|
(Dollars in thousands) |
Balance
12/31/11 |
Balance
12/31/10 |
$ Change | % Change |
Occupied
12/31/11 |
and Spec
12/31/11 |
||||||||||||||||||
|
Glacier |
$ | 31,239 | 34,526 | (3,287 | ) | -10 | % | $ | 8,385 | 22,854 | ||||||||||||||
|
Mountain West |
13,519 | 21,375 | (7,856 | ) | -37 | % | 6,858 | 6,661 | ||||||||||||||||
|
First Security |
9,065 | 10,123 | (1,058 | ) | -10 | % | 4,009 | 5,056 | ||||||||||||||||
|
Western |
819 | 1,350 | (531 | ) | -39 | % | 302 | 517 | ||||||||||||||||
|
1st Bank |
3,295 | 6,611 | (3,316 | ) | -50 | % | 1,628 | 1,667 | ||||||||||||||||
|
Valley |
3,696 | 4,950 | (1,254 | ) | -25 | % | 3,361 | 335 | ||||||||||||||||
|
Big Sky |
10,494 | 11,004 | (510 | ) | -5 | % | 971 | 9,523 | ||||||||||||||||
|
First Bank-WY |
2,827 | 1,958 | 869 | 44 | % | 2,827 | — | |||||||||||||||||
|
Citizens |
7,010 | 9,441 | (2,431 | ) | -26 | % | 3,280 | 3,730 | ||||||||||||||||
|
First Bank-MT |
199 | 502 | (303 | ) | -60 | % | 156 | 43 | ||||||||||||||||
|
San Juans |
12,070 | 7,018 | 5,052 | 72 | % | 3,645 | 8,425 | |||||||||||||||||
|
|
|
|
|
|
|
|
|
|
|
|||||||||||||||
|
Total |
$ | 94,233 | 108,858 | (14,625 | ) | -13 | % | $ | 35,422 | 58,811 | ||||||||||||||
|
|
|
|
|
|
|
|
|
|
|
|||||||||||||||
| Single Family Residential Loans by Bank, by Type | 1st | Junior | ||||||||||||||||||||||
|
(Dollars in thousands) |
Balance
12/31/11 |
Balance
12/31/10 |
$ Change | % Change |
Lien
12/31/11 |
Lien
12/31/11 |
||||||||||||||||||
|
Glacier |
$ | 174,928 | 187,683 | (12,755 | ) | -7 | % | $ | 155,354 | 19,574 | ||||||||||||||
|
Mountain West |
263,499 | 282,429 | (18,930 | ) | -7 | % | 227,763 | 35,736 | ||||||||||||||||
|
First Security |
93,776 | 92,011 | 1,765 | 2 | % | 79,543 | 14,233 | |||||||||||||||||
|
Western |
42,124 | 42,070 | 54 | 0 | % | 40,216 | 1,908 | |||||||||||||||||
|
1st Bank |
53,385 | 59,337 | (5,952 | ) | -10 | % | 48,953 | 4,432 | ||||||||||||||||
|
Valley |
57,068 | 60,085 | (3,017 | ) | -5 | % | 47,820 | 9,248 | ||||||||||||||||
|
Big Sky |
31,275 | 32,496 | (1,221 | ) | -4 | % | 28,253 | 3,022 | ||||||||||||||||
|
First Bank-WY |
12,195 | 13,948 | (1,753 | ) | -13 | % | 8,592 | 3,603 | ||||||||||||||||
|
Citizens |
23,722 | 19,885 | 3,837 | 19 | % | 22,487 | 1,235 | |||||||||||||||||
|
First Bank-MT |
7,737 | 8,618 | (881 | ) | -10 | % | 6,892 | 845 | ||||||||||||||||
|
San Juans |
24,254 | 29,124 | (4,870 | ) | -17 | % | 22,582 | 1,672 | ||||||||||||||||
|
|
|
|
|
|
|
|
|
|
|
|||||||||||||||
|
Total |
$ | 783,963 | 827,686 | (43,723 | ) | -5 | % | $ | 688,455 | 95,508 | ||||||||||||||
|
|
|
|
|
|
|
|
|
|
|
|||||||||||||||
36
Table of Contents
| Commercial Real Estate Loans by Bank, by Type |
Owner
Occupied 12/31/11 |
Non-Owner
Occupied 12/31/11 |
||||||||||||||||||||||
|
(Dollars in thousands) |
Balance
12/31/11 |
Balance
12/31/10 |
$ Change | % Change | ||||||||||||||||||||
|
Glacier |
$ | 225,548 | 224,215 | 1,333 | 1 | % | $ | 113,421 | 112,127 | |||||||||||||||
|
Mountain West |
193,495 | 206,732 | (13,237 | ) | -6 | % | 120,162 | 73,333 | ||||||||||||||||
|
First Security |
259,396 | 227,662 | 31,734 | 14 | % | 176,866 | 82,530 | |||||||||||||||||
|
Western |
99,900 | 103,443 | (3,543 | ) | -3 | % | 59,752 | 40,148 | ||||||||||||||||
|
1st Bank |
57,445 | 58,353 | (908 | ) | -2 | % | 42,347 | 15,098 | ||||||||||||||||
|
Valley |
58,392 | 50,325 | 8,067 | 16 | % | 36,127 | 22,265 | |||||||||||||||||
|
Big Sky |
84,048 | 88,135 | (4,087 | ) | -5 | % | 55,399 | 28,649 | ||||||||||||||||
|
First Bank-WY |
23,986 | 27,609 | (3,623 | ) | -13 | % | 18,360 | 5,626 | ||||||||||||||||
|
Citizens |
60,754 | 61,737 | (983 | ) | -2 | % | 36,716 | 24,038 | ||||||||||||||||
|
First Bank-MT |
19,891 | 17,492 | 2,399 | 14 | % | 9,440 | 10,451 | |||||||||||||||||
|
San Juans |
50,297 | 50,066 | 231 | 0 | % | 28,541 | 21,756 | |||||||||||||||||
|
|
|
|
|
|
|
|
|
|
|
|||||||||||||||
|
Total |
$ | 1,133,152 | 1,115,769 | 17,383 | 2 | % | $ | 697,131 | 436,021 | |||||||||||||||
|
|
|
|
|
|
|
|
|
|
|
|||||||||||||||
| Consumer Loans by Bank, by Type |
Home Equity
Line of Credit 12/31/11 |
Other
Consumer 12/31/11 |
||||||||||||||||||||||
|
(Dollars in thousands) |
Balance
12/31/11 |
Balance
12/31/10 |
$ Change | % Change | ||||||||||||||||||||
|
Glacier |
$ | 134,725 | 150,082 | (15,357 | ) | -10 | % | $ | 120,794 | 13,931 | ||||||||||||||
|
Mountain West |
63,902 | 70,304 | (6,402 | ) | -9 | % | 56,515 | 7,387 | ||||||||||||||||
|
First Security |
66,549 | 71,677 | (5,128 | ) | -7 | % | 42,946 | 23,603 | ||||||||||||||||
|
Western |
37,657 | 43,081 | (5,424 | ) | -13 | % | 26,695 | 10,962 | ||||||||||||||||
|
1st Bank |
35,567 | 40,021 | (4,454 | ) | -11 | % | 14,006 | 21,561 | ||||||||||||||||
|
Valley |
24,634 | 23,745 | 889 | 4 | % | 14,663 | 9,971 | |||||||||||||||||
|
Big Sky |
26,229 | 27,733 | (1,504 | ) | -5 | % | 22,515 | 3,714 | ||||||||||||||||
|
First Bank-WY |
22,504 | 24,217 | (1,713 | ) | -7 | % | 13,372 | 9,132 | ||||||||||||||||
|
Citizens |
27,273 | 29,040 | (1,767 | ) | -6 | % | 22,973 | 4,300 | ||||||||||||||||
|
First Bank-MT |
7,093 | 8,005 | (912 | ) | -11 | % | 3,402 | 3,691 | ||||||||||||||||
|
San Juans |
13,331 | 14,848 | (1,517 | ) | -10 | % | 12,348 | 983 | ||||||||||||||||
|
|
|
|
|
|
|
|
|
|
|
|||||||||||||||
|
Total |
$ | 459,464 | 502,753 | (43,289 | ) | -9 | % | $ | 350,229 | 109,235 | ||||||||||||||
|
|
|
|
|
|
|
|
|
|
|
|||||||||||||||
n/m - not measurable
Residential Real Estate Lending
The Company’s lending activities consist of the origination of both construction and permanent loans on residential real estate. The Company actively solicits residential real estate loan applications from real estate brokers, contractors, existing customers, customer referrals, and on-line applications. The Company’s lending policies generally limit the maximum loan-to-value ratio on residential mortgage loans to 80 percent of the lesser of the appraised value or purchase price or above 80 percent of the loan if insured by a private mortgage insurance company. The Company also provides interim construction financing for single-family dwellings. These loans are supported by a term take-out commitment. The Company has not participated in any of the U.S. Departments of the Treasury and Housing and Urban Developments’ loan modification and refinancing programs.
Consumer Land or Lot Loans
The Company originates land and lot acquisition loans to borrowers who intend to construct their primary residence on the respective land or lot. These loans are generally for a term of three to five years and are secured by the developed land or lot with the loan to value limited to the lesser of 75 percent of cost or appraised value.
37
Table of Contents
Unimproved Land and Land Development Loans
Although unimproved land and land development loans have not recently been originated, where real estate market conditions warrant, the Company may originate such loans on properties intended for residential and commercial use. These loans are generally made for a term of 18 months to two years and secured by the developed property with a loan-to-value not to exceed the lesser of 75 percent of cost or 65 percent of the appraised discounted bulk sale value upon completion of the improvements. The projects under development are inspected on a regular basis and advances are made on a percentage of completion basis. The loans are made to borrowers with real estate development experience and appropriate financial strength. Generally, it is required that a certain percentage of the development be pre-sold or that construction and term take-out commitments are in place prior to funding the loan. Loans made on unimproved land are generally made for a term of five to ten years with a loan-to-value not to exceed the lesser of 50 percent of cost or appraised value.
Residential Builder Guidance Lines
The Company provides Builder Guidance Lines that are comprised of pre-sold and spec-home construction and lot acquisition loans. The spec-home construction and lot acquisition loans are limited to a specific number and maximum amount. Generally the individual loans will not exceed a one year maturity. The homes under construction are inspected on a regular basis and advances made on a percentage of completion basis.
Commercial Real Estate Loans
Loans are made to purchase, construct and finance commercial real estate properties. These loans are generally made to borrowers who own and will occupy the property and generally have a loan-to-value up to the lesser of 75 percent of cost or appraised value and require a minimum 1.2 times debt service coverage margin. Loans to finance investment or income properties are made, but require additional equity and generally have a loan-to-value up to the lesser of 70 percent of cost or appraised value and require a higher debt service coverage margin commensurate with the specific property and projected income.
Consumer Lending
The majority of consumer loans are secured by real estate, automobiles, or other assets. The Banks intend to continue making such loans because of their short-term nature, generally between three months and five years. Moreover, interest rates on consumer loans are generally higher than on residential mortgage loans. The Banks also originate second mortgage and home equity loans, especially to existing customers in instances where the first and second mortgage loans are less than 80 percent of the current appraised value of the property.
Credit Risk Management
The Company’s credit risk management includes stringent credit policies, concentration limits, individual loan approval limits and committee approval of larger loan requests. Management practices also include regular internal and external credit examinations and an independent stress testing of the commercial real estate portfolio, including construction loans. On a quarterly basis, both the Banks and Parent management review loans experiencing deterioration of credit quality. A review of loans by concentration limits is performed on a quarterly basis. Federal and state regulatory safety and soundness examinations are conducted annually at Glacier, Mountain West, First Security, Western and 1 st Bank and every eighteen months for all other bank subsidiaries.
The Company’s loan policy and credit administration practices establish standards and limits for all extensions of credit that are secured by interests in or liens on real estate, or made for the purpose of financing the construction of real property or other improvements. Ongoing monitoring and review of the loan portfolio is based on current information, including: the borrowers’ and guarantors’ creditworthiness, value of the real estate and other collateral, the project’s performance against projections, and monthly inspections by employees or external parties until the real estate project is complete.
Loan Approval Limits
Individual loan approval limits have been established for each lender based on the loan types and experience of the individual. Each bank subsidiary has an Officer Loan Committee consisting of senior lenders and members of senior management. The bank subsidiaries’ Officer Loan Committees have loan approval authority between $500,000 and $1,000,000. The bank subsidiaries’ Board of Directors’ have loan approval authority up to $2,000,000. Loans exceeding these limits and up to $10,000,000 are subject to approval by the Company’s Executive Loan Committee consisting of the Banks’ senior loan officers and the Company’s Credit Administrator. Loans greater than $10,000,000 are subject to approval by the Company’s Board of Directors. Under banking laws, loans to one borrower and related entities are limited to a prescribed percentage of the unimpaired capital and surplus of each bank subsidiary.
38
Table of Contents
Interest Reserves
Interest reserves are used to periodically advance loan funds to pay interest charges on the outstanding balance of the related loan. As with any extension of credit, the decision to establish a loan-funded interest reserve upon origination of construction loans, including residential construction and land, lot and other construction loans, is based on prudent underwriting, including the feasibility of the project, expected cash flow, creditworthiness of the borrower and guarantors, and the protection provided by the real estate and other underlying collateral. Interest reserves provide an effective means for addressing the cash flow characteristics of construction loans. In response to the downturn in the housing market and potential impact upon construction lending, the Company discourages the creation or continued use of interest reserves.
Interest reserves are advanced provided the related construction loan is performing as expected. Loans with interest reserves may be extended, renewed or restructured only when the related loan continues to perform as expected and meets the prudent underwriting standards identified above. Such renewals, extension or restructuring are not permitted in order to keep the related loan current.
In monitoring the performance and credit quality of a construction loan, the Company assesses the adequacy of any remaining interest reserve, and whether the use of an interest reserve remains appropriate in the presence of emerging weakness and associated risks in the construction loan.
The ongoing accrual and recognition of uncollected interest as income continues only when facts and circumstances continue to reasonably support the contractual payment of principal or interest. Loans are typically designated as non-accrual when the collection of the contractual principal or interest is unlikely and has remained unpaid for ninety days or more. For such loans, the accrual of interest and its capitalization into the loan balance will be discontinued.
The Company had $75.7 million and $141 million in loans with interest reserves with remaining reserves of $568 thousand and $879 thousand as of December 31, 2011 and 2010, respectively. During 2011, the Company extended, renewed, or restructured 31 loans with interest reserves, such loans having an aggregate outstanding principal balance of $37.3 million as of December 31, 2011. However, such actions were based on prudent underwriting standards and not to keep the loans current. As of December 31, 2011, the Company had 18 construction loans totaling $14.1 million with interest reserves that are currently non-performing or which are potential problem loans.
Loan Purchases and Sales
Fixed rate, long-term mortgage loans are generally sold in the secondary market. The Company is active in the secondary market, primarily through the origination of conventional, FHA and VA residential mortgages. The sale of loans in the secondary mortgage market reduces the Company’s risk of holding long-term, fixed rate loans during periods of rising rates. In connection with conventional loan sales, the Company typically sells the majority of mortgage loans originated with servicing released. The Company has also been very active in generating commercial SBA loans, and other commercial loans, with a portion of those loans sold to investors. The Company has not originated any type of subprime mortgages, either for the loan portfolio or for sale to investors. In addition, the Company has not purchased securities that were collateralized with subprime mortgages. The Company has not purchased loans outside the Company or originated loans outside the Company’s geographic market area.
Loan Origination and Other Fees
In addition to interest earned on loans, the Company receives fees for originating loans. Loan fees generally are a percentage of the principal amount of the loan and are charged to the borrower, and are normally deducted from the proceeds of the loan. Loan origination fees are generally 1.0 percent to 1.5 percent on residential mortgages and .5 percent to 1.5 percent on commercial loans. Consumer loans require a fixed fee amount as well as a minimum interest amount. The Company also receives other fees and charges relating to existing loans, which include charges and fees collected in connection with loan modifications.
Appraisal and Evaluation Process
The Company’s Loan Policy and credit administration practices adopt and implement the applicable requirements of the Interagency Appraisal and Evaluation Guidelines (and the Interagency Guidelines for Real Estate Lending Policies in Appendix A to Part 365 of Title 12, CFR) (collectively, the “Guidelines”) and the Uniform Standards of Professional Appraisal Practice (“USPAP”) as established and amended by the Appraisal Standards Board. The Company’s Loan Policy establishes criteria for obtaining appraisals or evaluations, including transactions that are otherwise exempt from the appraisal requirements set forth within the Guidelines.
39
Table of Contents
Each of the Company’s eleven bank subsidiaries monitor conditions, including supply and demand factors, in the real estate markets served so they can react quickly to changing market conditions to mitigate potential losses from specific credit exposures within the loan portfolio. Evidence of the following real estate market conditions and trends is obtained from lending personnel and third party sources:
| • |
demographic indicators, including employment and population trends; |
| • |
foreclosures, vacancy, construction and absorption rates; |
| • |
property sales prices, rental rates, and lease terms; |
| • |
current tax assessments; |
| • |
economic indicators, including trends within the lending areas; and |
| • |
valuation trends, including discount and capitalization rates. |
Third party information sources include federal, state, and local governments and agencies thereof, private sector economic data vendors, real estate brokers, licensed agents, sales, rental and foreclosure data tracking services.
The time between ordering an appraisal or evaluation and receipt from third party vendors is typically two to three weeks for residential property and four to six weeks for non-residential property. For real estate properties that are of highly specialized or limited use, significantly complex or large, additional time beyond the typical times may be required for new appraisals or evaluations.
As part of the Company’s credit administration and portfolio monitoring practices, the Company’s regular internal and external credit examinations review a significant number of individual loan files. Appraisals and evaluations are reviewed to determine whether the timeliness, methods, assumptions, and findings are reasonable and in compliance with the Company’s Loan Policy and credit administration practices, the Guidelines and USPAP standards. Such reviews include the adequacy of the steps taken by the Company to ensure that the individuals who perform appraisals and evaluations are appropriately qualified and are not subject to conflicts of interest. If there are any deficiencies noted in the reviews, they are reported to the Banks’ Board of Directors and prompt corrective action is taken.
Non-performing Assets
The following table summarizes information regarding non-performing assets at the dates indicated:
| December 31, | ||||||||||||||||||||
|
(Dollars in thousands) |
2011 | 2010 | 2009 | 2008 | 2007 | |||||||||||||||
|
Other real estate owned |
$ | 78,354 | 73,485 | 57,320 | 11,539 | 2,043 | ||||||||||||||
|
Accruing loans 90 days or more past due |
||||||||||||||||||||
|
Residential real estate |
59 | 506 | 1,965 | 4,103 | 840 | |||||||||||||||
|
Commercial |
1,168 | 3,051 | 1,311 | 2,897 | 1,216 | |||||||||||||||
|
Consumer and other |
186 | 974 | 2,261 | 1,613 | 629 | |||||||||||||||
|
|
|
|
|
|
|
|
|
|
|
|||||||||||
|
Total |
1,413 | 4,531 | 5,537 | 8,613 | 2,685 | |||||||||||||||
|
Non-accrual loans |
||||||||||||||||||||
|
Residential real estate |
11,882 | 23,095 | 20,093 | 3,575 | 934 | |||||||||||||||
|
Commercial |
109,640 | 161,136 | 168,328 | 58,454 | 7,192 | |||||||||||||||
|
Consumer and other |
12,167 | 8,274 | 9,860 | 2,272 | 434 | |||||||||||||||
|
|
|
|
|
|
|
|
|
|
|
|||||||||||
|
Total |
133,689 | 192,505 | 198,281 | 64,301 | 8,560 | |||||||||||||||
|
|
|
|
|
|
|
|
|
|
|
|||||||||||
|
Total non-performing assets 1 |
$ | 213,456 | 270,521 | 261,138 | 84,453 | 13,288 | ||||||||||||||
|
|
|
|
|
|
|
|
|
|
|
|||||||||||
|
Non-performing assets as a percentage of subsidiary assets |
2.92 | % | 3.91 | % | 4.13 | % | 1.46 | % | 0.27 | % | ||||||||||
|
Allowance for loan and lease losses as a percentage of non-performing loans |
102 | % | 70 | % | 70 | % | 105 | % | 484 | % | ||||||||||
|
Accruing loans 30-89 days past due |
$ | 49,086 | 45,497 | 87,491 | 54,787 | 45,490 | ||||||||||||||
|
Troubled debt restructurings not included in non-performing assets |
$ | 98,859 | 26,475 | 13,829 | n/m | n/m | ||||||||||||||
|
Interest income 2 |
$ | 7,441 | 10,987 | 11,730 | 4,434 | 683 | ||||||||||||||
| 1 |
As of December 31, 2011, non-performing assets have not been reduced by U.S. government guarantees of $2.7 million. |
| 2 |
Amounts represent estimated interest income that would have been recognized on loans accounted for on a non-accrual basis as of the end of each period had such loans performed pursuant to contractual terms. |
n/m - not measurable
40
Table of Contents
The following tables summarize selected information identified by regulatory classification on the Company’s loan portfolio.
| Non-Performing Assets, | Non- | Accruing | Other | |||||||||||||||||
| by Loan Type | Accruing | Loans 90 Days | Real Estate | |||||||||||||||||
| Balance | Balance | Loans | or More Past Due | Owned | ||||||||||||||||
|
(Dollars in thousands) |
12/31/11 | 12/31/10 | 12/31/11 | 12/31/11 | 12/31/11 | |||||||||||||||
|
Custom and owner occupied construction |
$ | 1,531 | 2,575 | 783 | — | 748 | ||||||||||||||
|
Pre-sold and spec construction |
5,506 | 16,071 | 1,098 | — | 4,408 | |||||||||||||||
|
Land development |
56,152 | 83,989 | 31,184 | — | 24,968 | |||||||||||||||
|
Consumer land or lots |
8,878 | 12,543 | 3,942 | 27 | 4,909 | |||||||||||||||
|
Unimproved land |
35,771 | 44,116 | 19,194 | 713 | 15,864 | |||||||||||||||
|
Developed lots for operative builders |
9,001 | 7,429 | 7,084 | — | 1,917 | |||||||||||||||
|
Commercial lots |
2,032 | 3,110 | 297 | — | 1,735 | |||||||||||||||
|
Other construction |
5,133 | 3,837 | 4,305 | — | 828 | |||||||||||||||
|
Commercial real estate |
28,828 | 36,978 | 19,181 | — | 9,647 | |||||||||||||||
|
Commercial and industrial |
12,855 | 13,127 | 12,213 | 342 | 300 | |||||||||||||||
|
Agriculture loans |
7,010 | 5,253 | 6,391 | — | 619 | |||||||||||||||
|
1-4 family |
33,589 | 34,791 | 21,602 | 292 | 11,695 | |||||||||||||||
|
Home equity lines of credit |
6,361 | 4,805 | 5,749 | 37 | 575 | |||||||||||||||
|
Consumer |
360 | 446 | 217 | 2 | 141 | |||||||||||||||
|
Other |
449 | 1,451 | 449 | — | — | |||||||||||||||
|
|
|
|
|
|
|
|
|
|
|
|||||||||||
|
Total |
$ | 213,456 | 270,521 | 133,689 | 1,413 | 78,354 | ||||||||||||||
|
|
|
|
|
|
|
|
|
|
|
|||||||||||
| Accruing 30 - 89 Days Delinquent | Non-Accrual & | |||||||||||||||||||
| Loans and Non-Performing | Accruing | Accruing Loans | Other | |||||||||||||||||
| Assets, by Bank | 30-89 Days | 90 Days or | Real Estate | |||||||||||||||||
| Balance | Balance | Past Due | More Past Due | Owned | ||||||||||||||||
|
(Dollars in thousands) |
12/31/11 | 12/31/10 | 12/31/11 | 12/31/11 | 12/31/11 | |||||||||||||||
|
Glacier |
$ | 69,324 | 75,869 | 10,176 | 49,042 | 10,106 | ||||||||||||||
|
Mountain West |
60,593 | 83,872 | 16,402 | 25,117 | 19,074 | |||||||||||||||
|
First Security |
59,713 | 59,770 | 13,648 | 28,339 | 17,726 | |||||||||||||||
|
Western |
7,651 | 11,237 | 1,937 | 448 | 5,266 | |||||||||||||||
|
1st Bank |
18,158 | 16,686 | 3,693 | 9,302 | 5,163 | |||||||||||||||
|
Valley |
2,444 | 1,900 | 863 | 728 | 853 | |||||||||||||||
|
Big Sky |
19,795 | 21,739 | 410 | 11,549 | 7,836 | |||||||||||||||
|
First Bank-WY |
8,965 | 9,901 | 321 | 6,910 | 1,734 | |||||||||||||||
|
Citizens |
5,992 | 8,000 | 1,175 | 3,126 | 1,691 | |||||||||||||||
|
First Bank-MT |
397 | 553 | 119 | 278 | — | |||||||||||||||
|
San Juans |
3,180 | 6,549 | 342 | 263 | 2,575 | |||||||||||||||
|
GORE |
6,330 | 19,942 | — | — | 6,330 | |||||||||||||||
|
|
|
|
|
|
|
|
|
|
|
|||||||||||
|
Total |
$ | 262,542 | 316,018 | 49,086 | 135,102 | 78,354 | ||||||||||||||
|
|
|
|
|
|
|
|
|
|
|
|||||||||||
41
Table of Contents
There was a sizeable decrease in non-performing assets during the year due to a decrease in non-performing loans of $61.9 million, or 31 percent. Although there was a $4.9 million, or 7 percent, increase in OREO from the prior year end, there was a significant amount of additions to and sales of OREO as the Company continued to work through the foreclosed properties. The momentum of reducing non-performing assets continued throughout the year with each bank subsidiary actively managing the disposition of non-performing assets. The Company’s early stage delinquencies (accruing loans 30-89 days past due) of $49.1 million at December 31, 2011, remained stable from the prior year end early stage delinquencies of $45.5 million.
The largest category of non-performing assets was land, lot and other construction which was $117 million, or 55 percent, of non-performing assets at December 31, 2011. Included in this category was $56.2 million of land development assets and $35.8 million in unimproved land at December 31, 2011. Although land, lot and other construction assets have historically put pressure on the Company’s credit quality, the Company has diligently reduced this category of non-performing assets by $38.1 million, or 25 percent, since the prior year end. Other notable categories of non-performing assets at December 31, 2011 were commercial real estate of $28.9 million and 1-4 family of $33.6 million, both categories of which have decreased since the prior year end.
Most of the Company’s non-performing assets are secured by real estate, and based on the most current information available to management, including updated appraisals or evaluations, the Company believes the value of the underlying real estate collateral is adequate to minimize significant charge-offs or loss to the Company. Each bank subsidiary evaluates the level of its non-performing assets, the values of the underlying real estate and other collateral, and related trends in net charge-offs in determining the adequacy of the ALLL. Through pro-active credit administration, the Banks work closely with borrowers to seek favorable resolution to the extent possible, thereby attempting to minimize net charge-offs or losses to the Company. Throughout the year, the Company has maintained an adequate allowance for loan and lease losses while working to reduce non-performing assets. The improvement in the credit quality ratios during the year are a product of this effort.
For non-performing construction loans involving residential structures, the percentage of completion exceeds 95 percent at December 31, 2011. For construction loans involving commercial structures, the percentage of completion ranges from projects not started to projects completed at December 31, 2011. During the construction loan term, all construction loan collateral properties are inspected at least monthly, or more frequently as needed, until completion. Draws on construction loans are predicated upon the results of the inspection and advanced based upon a percentage of completion basis versus original budget percentages. When construction loans become non-performing and the associated project is not complete, the Company on a case-by-case basis makes the decision to advance additional funds or to initiate collection/foreclosure proceedings. Such decision includes obtaining “as-is” and “at completion” appraisals for consideration of potential increases or decreases in the collateral’s value. The Company also considers the increased costs of monitoring progress to completion, and the related collection/holding period costs should collateral ownership be transferred to the Company. With very limited exception, the Company does not disburse additional funds on non-performing loans. Instead, the Company has proceeded to collection and foreclosure actions in order to reduce the Company’s exposure to loss on such loans.
As identified below, the following four bank subsidiaries had non-accrual construction loans that aggregated 5 percent or more of the Company’s $67.9 million of non-accrual construction loans at December 31, 2011. Also identified below are the principal areas of the bank subsidiaries’ operations in which the collateral properties of such non-accrual construction loans are located:
|
Glacier |
34 percent | Western Montana | ||||
|
First Security |
26 percent | Western Montana | ||||
|
Mountain West |
25 percent | Northern Idaho and Boise and Sun Valley, Idaho | ||||
|
Big Sky |
10 percent | Western Montana |
Residential non-accrual construction loans are 3 percent of the total construction loans on non-accrual status as of year end 2011, compared to 11 percent as of year end 2010. Unimproved land and land development loans collectively account for the bulk of the non-accrual commercial construction loans at the four bank subsidiaries. With locations and operations in the contiguous northern Rocky Mountain states of Idaho and Montana, the geography and economies of each of the four bank subsidiaries are predominantly tied to real estate development given the sprawling abundance of timbered valleys and mountainous terrain with significant lakes, streams and watershed areas. Consistent with the general economic downturn, the market for upscale primary, secondary and other housing as well as the associated construction and building industries have stalled after years of significant growth. As the housing market (rental and owner-occupied) and related industries continue to recover from the downturn, the Company continues to reduce its exposure to loss in the construction loan and other segments of the total loan portfolio.
For additional information on accounting policies relating to non-performing assets and impaired loans, see Note 1 to the Consolidated Financial Statements in “Item 8. Financial Statements and Supplementary Data.”
42
Table of Contents
Impaired Loans
Loans are designated impaired when, based upon current information and events, it is probable that the Company will be unable to collect the scheduled payments of principal or interest when due according to the contractual terms of the loan agreement and therefore, the Company has serious doubts as to the ability of such borrowers to fulfill the contractual obligation. When the ultimate collectability of the total principal of an impaired loan is in doubt and designated as non-accrual, all payments are applied to principal under the cost recovery method. When the ultimate collectability of the total principal on an impaired loan is not in doubt, contractual interest is generally credited to interest income when received under the cash basis method. Impaired loans were $259 million and $225 million as of December 31, 2011 and 2010, respectively. The ALLL includes valuation allowances of $18.8 million and $16.9 million specific to impaired loans as of December 31, 2011 and 2010, respectively. Of the total impaired loans at December 31, 2011, there were 41 commercial real estate and other commercial loans that accounted for $121 million, or 47 percent, of the impaired loans. The 41 loans were collateralized by 147 percent of the loan value, the majority of which had appraisals (new or updated) in 2011, such appraisals reviewed at least quarterly taking into account current market conditions. Of the total impaired loans at December 31, 2011, there were 269 loans aggregating to $165 million, or 64 percent, whereby the borrowers had more than one impaired loan. The amount of impaired loans that have had partial charge-offs during the year for which the Company continues to have concern about the collectability of the remaining loan balance was $34.9 million. Of these loans, there were charge-offs of $18.1 million during 2011.
For collateral-dependent loans and real estate loans for which foreclosure or a deed-in-lieu of foreclosure is probable, impairment is measured by the fair value of the collateral, less estimated cost to sell. The fair value of the collateral is determined primarily based upon appraisal or evaluation (new or updated) of the underlying property value. The Company reviews appraisals or evaluations, giving consideration to the highest and best use of the collateral, with values reduced by discounts to consider lack of marketability and estimated cost to sell. Appraisals or evaluations (new or updated) are reviewed at least quarterly and more frequently based on current market conditions, including deterioration in a borrower’s financial condition and when property values may be subject to significant volatility. After review and acceptance of the collateral appraisal or evaluation (new or updated), adjustments to an impaired loan’s value may occur.
In deciding whether to obtain a new or updated appraisal or evaluation, the Company considers the impact of the following factors and environmental events:
| • |
passage of time; |
| • |
improvements to, or lack of maintenance of, the collateral property; |
| • |
stressed and volatile economic conditions, including market values; |
| • |
changes in the performance, risk profile, size and complexity of the credit exposure; |
| • |
limited or specific use collateral property; |
| • |
high loan-to-value credit exposures; |
| • |
changes in the adequacy of the collateral protections, including loan covenants and financially responsible guarantors; |
| • |
competing properties in the market area; |
| • |
changes in zoning and environmental contamination; |
| • |
the nature of subsequent transactions (e.g., modification, restructuring, refinancing); and |
| • |
the availability of alternative financing sources. |
The Company also takes into account 1) the Company’s experience with whether the appraised values of impaired collateral-dependent loans are actually realized, and 2) the timing of cash flows expected to be received from the underlying collateral to the extent such timing is significantly different than anticipated in the most recent appraisal.
The Company generally obtains new or updated appraisals or evaluations annually for collateral underlying impaired loans. For collateral-dependent loans for which the appraisal of the underlying collateral is more than twelve months old, the Company updates collateral valuations through procedures that include obtaining current inspections of the collateral property, broker price opinions, comprehensive market analyses and current data for conditions and assumptions (e.g., discounts, comparable sales and trends) underlying the appraisals’ valuation techniques. The Company’s impairment/valuation procedures take into account new and updated appraisals on similar properties in the same area in order to capture current market valuation changes, unfavorable and favorable.
43
Table of Contents
Restructured Loans
A restructured loan is considered a troubled debt restructuring (“TDR”) if the creditor, for economic or legal reasons related to the debtor’s financial difficulties, grants a concession to the debtor that it would not otherwise consider. The Company had TDR loans of $165 million as of December 31, 2011. The Company’s TDR loans are considered impaired loans of which $65.6 million are designated as non-accrual. As a result of adopting the Financial Accounting Standards Board’s (“FASB”) amendment relating to TDRs during the third quarter of 2011, the Company reassessed all restructurings that occurred during the first six months of 2011 for potential identification as TDRs and identified $74.6 million in newly identified TDRs. Of these newly identified TDRs, $53.3 million were not previously identified as impaired loans; such loans had a specific valuation allowance of $3.2 million as of September 30, 2011.
Each restructured debt is separately negotiated with the borrower and includes terms and conditions that reflect the borrower’s prospective ability to service the debt as modified. The Company discourages the multiple loan strategy when restructuring loans regardless of whether or not the notes are TDR loans. The Company does not have any commercial TDR loans as of December 31, 2011 that have repayment dates extended at or near the original maturity date for which the Company has not classified as impaired. The Company has TDR loans of $24.9 million that are in non-accrual status or that have had partial charge-offs during the year, the borrowers of which continue to have $38.7 million in other loans that are on accrual status.
Other Real Estate Owned
The loan book value prior to the acquisition and transfer of the loan into OREO during 2011 was $96.5 million of which $20.3 million was residential real estate, $67.4 million was commercial real estate, and $8.8 million was consumer loans. The loan collateral acquired in foreclosure during 2011 was $79.3 million of which $15.6 million was residential real estate, $58.3 million was commercial real estate, and $5.4 million was consumer loans. The following table sets forth the changes in OREO for the years ended December 31, 2011 and 2010:
| Years ended December 31, | ||||||||
|
(Dollars in thousands) |
2011 | 2010 | ||||||
|
Balance at beginning of period |
$ | 73,485 | 57,320 | |||||
|
Additions |
79,295 | 72,572 | ||||||
|
Capital improvements |
669 | 273 | ||||||
|
Write-downs |
(16,246 | ) | (10,429 | ) | ||||
|
Sales |
(58,849 | ) | (46,251 | ) | ||||
|
|
|
|
|
|||||
|
Balance at end of period |
$ | 78,354 | 73,485 | |||||
|
|
|
|
|
|||||
There was an increase in write-downs in 2011 compared to 2010, which was attributable to an increase in volume of OREO during 2011. Write-downs as a percentage of the beginning balance and additions to OREO was 10.6 percent for 2011 compared to 8.0 percent for 2010. The Company believes that the write-downs in 2011 are not indicative of a trend in that several of such properties have characteristics unique to the property, including special or limited use, and locations of such properties. The Company determined that the write-downs were not indicative of a trend continuing beyond 2011 which would likely affect the future operating results in light of the remaining holdings of real property and each particular bank subsidiary’s experience in its particular markets. However, there can be no assurance that future significant write-downs will not occur.
Although the Company utilized auctions during 2010 as an alternative strategy for disposing of certain properties, the Company only utilized this strategy on a limited basis during 2011. The Company does not intend to use auctions for disposition of OREO in the future unless it is determined to be beneficial to the Company for certain properties. Costs of the auctions, including property-specific marketing costs and service fees paid to the third-party auction firms, are aggregated with other directly-related selling costs in determining the loss realized from disposition of the OREO. In addition to auctions, the Company utilizes real estate companies (local and national franchises) as well as showcasing select properties through the websites of the bank subsidiaries. Strategies for disposition of other real estate and other assets owned by each subsidiary are developed specific to each property.
44
Table of Contents
Allowance for Loan and Lease Losses
Determining the adequacy of the ALLL involves a high degree of judgment and is inevitably imprecise as the risk of loss is difficult to quantify. The ALLL methodology is designed to reasonably estimate the probable loan and lease losses within each bank subsidiary’s loan portfolios. Accordingly, the ALLL is maintained within a range of estimated losses. The determination of the ALLL, including the provision for loan losses and net charge-offs, is a critical accounting estimate that involves management’s judgments about all known relevant internal and external environmental factors that affect loan losses, including the credit risk inherent in the loan portfolios, economic conditions nationally and in the local markets in which the community bank subsidiaries operate, changes in collateral values, delinquencies, non-performing assets and net charge-offs.
Although the Company and Banks continue to actively monitor economic trends, soft economic conditions combined with potential declines in the values of real estate that collateralize most of the Company’s loan portfolios may adversely affect the credit risk and potential for loss to the Company.
The ALLL evaluation is well documented and approved by each bank subsidiary’s Board of Directors and reviewed by the Parent’s Board of Directors. In addition, the policy and procedures for determining the balance of the ALLL are reviewed annually by each bank subsidiary’s Board of Directors, the Parent’s Board of Directors, the internal audit department, independent credit reviewers and state and federal bank regulatory agencies.
At the end of each quarter, each of the community bank subsidiaries analyzes its loan portfolio and maintain an ALLL at a level that is appropriate and determined in accordance with accounting principles generally accepted in the United States of America. The allowance consists of a specific valuation allowance component and a general valuation allowance component. The specific valuation allowance component relates to loans that are determined to be impaired. A specific valuation allowance is established when the fair value of a collateral-dependent loan or the present value of the loan’s expected future cash flows (discounted at the loan’s effective interest rate) is lower than the carrying value of the impaired loan. The general valuation allowance component relates to probable credit losses inherent in the balance of the loan portfolio based on prior loss experience, adjusted for changes in trends and conditions of qualitative or environmental factors.
Management of each bank subsidiary exercises significant judgment when evaluating the effect of applicable qualitative or environmental factors on each bank subsidiary’s historical loss experience for loans not identified as impaired. Quantification of the impact upon each bank subsidiary’s ALLL is inherently subjective as data for any factor may not be directly applicable, consistently relevant, or reasonably available for management to determine the precise impact of a factor on the collectability of the Bank’s unimpaired loan portfolio as of each evaluation date. Bank management documents its conclusions and rationale for changes that occur in each applicable factor’s weight (i.e., measurement) and ensures that such changes are directionally consistent based on the underlying current trends and conditions for the factor.
The Company is committed to a conservative management of the credit risk within the loan portfolios, including the early recognition of problem loans. The Company’s credit risk management includes stringent credit policies, individual loan approval limits, limits on concentrations of credit, and committee approval of larger loan requests. Management practices also include regular internal and external credit examinations, identification and review of individual loans and leases experiencing deterioration of credit quality, procedures for the collection of non-performing assets, quarterly monitoring of the loan portfolios, semi-annual review of loans by industry, and periodic stress testing of the loans secured by real estate.
The Company’s model of eleven independent wholly-owned community banks, each with its own loan committee, chief credit officer and Board of Directors, provides substantial local oversight to the lending and credit management function. The Company’s decentralized business model affords multiple reviews of larger loans before credit is extended, a significant benefit in mitigating and managing the Company’s credit risk. The geographic dispersion of the market areas in which the Company and the community bank subsidiaries operate further mitigates the risk of credit loss. While this process is intended to limit credit exposure, there can be no assurance that further problem credits will not arise and additional loan losses incurred, particularly in periods of rapid economic downturns.
The primary responsibility for credit risk assessment and identification of problem loans rests with the loan officer of the account. This continuous process, utilizing each of the Banks’ internal credit risk rating process, is necessary to support management’s evaluation of the ALLL adequacy. An independent loan review function verifying credit risk ratings evaluates the loan officer and management’s evaluation of the loan portfolio credit quality. The loan review function also assesses the evaluation process and provides an independent analysis of the adequacy of the ALLL.
45
Table of Contents
The Company considers the ALLL balance of $138 million adequate to cover inherent losses in the loan portfolios as of December 31, 2011. However, no assurance can be given that the Company will not, in any particular period, sustain losses that are significant relative to the ALLL amount, or that subsequent evaluations of the loan portfolios applying management’s judgment about then current factors, including economic and regulatory developments, will not require significant changes in the ALLL. Under such circumstances, this could result in enhanced provisions for loan losses. See additional risk factors in “Item 1A. Risk Factors.”
The following table summarizes the allocation of the ALLL as of the dates indicated:
| December 31, 2011 | December 31, 2010 | December 31, 2009 | December 31, 2008 | December 31, 2007 | ||||||||||||||||||||||||||||||||||||
|
(Dollars in thousands) |
Allowance
for Loan and Lease Losses |
Percent
of Loans in Category |
Allowance
for Loan and Lease Losses |
Percent
of Loans in Category |
Allowance
for Loan and Lease Losses |
Percent
of Loans in Category |
Allowance
for Loan and Lease Losses |
Percent
of Loans in Category |
Allowance
for Loan and Lease Losses |
Percent
of Loans in Category |
||||||||||||||||||||||||||||||
|
Residential real estate |
$ | 17,227 | 14.9 | % | 20,957 | 16.9 | % | 13,496 | 18.3 | % | 7,233 | 19.2 | % | 4,755 | 19.2 | % | ||||||||||||||||||||||||
|
Commercial real estate |
76,920 | 48.3 | % | 76,147 | 47.9 | % | 66,791 | 46.6 | % | 35,305 | 47.4 | % | 23,010 | 45.1 | % | |||||||||||||||||||||||||
|
Other commercial |
20,833 | 18.0 | % | 19,932 | 17.4 | % | 39,558 | 17.8 | % | 21,590 | 15.8 | % | 17,453 | 17.8 | % | |||||||||||||||||||||||||
|
Home equity |
13,616 | 12.7 | % | 13,334 | 12.9 | % | 13,419 | 12.4 | % | 6,975 | 12.5 | % | 4,680 | 12.1 | % | |||||||||||||||||||||||||
|
Other consumer |
8,920 | 6.1 | % | 6,737 | 4.9 | % | 9,663 | 4.9 | % | 5,636 | 5.1 | % | 4,515 | 5.8 | % | |||||||||||||||||||||||||
|
|
|
|
|
|
|
|
|
|
|
|
|
|
|
|
|
|
|
|
|
|||||||||||||||||||||
|
Totals |
$ | 137,516 | 100.0 | % | 137,107 | 100.0 | % | 142,927 | 100.0 | % | 76,739 | 100.0 | % | 54,413 | 100.0 | % | ||||||||||||||||||||||||
|
|
|
|
|
|
|
|
|
|
|
|
|
|
|
|
|
|
|
|
|
|||||||||||||||||||||
The following table summarizes the ALLL experience for the periods indicated:
| Years ended December 31, | ||||||||||||||||||||
|
(Dollars in thousands) |
2011 | 2010 | 2009 | 2008 | 2007 | |||||||||||||||
|
Balance at beginning of period |
$ | 137,107 | 142,927 | 76,739 | 54,413 | 49,259 | ||||||||||||||
|
Provision for loan losses |
64,500 | 84,693 | 124,618 | 28,480 | 6,680 | |||||||||||||||
|
Charge-offs |
||||||||||||||||||||
|
Residential real estate |
(5,671 | ) | (16,575 | ) | (18,854 | ) | (3,233 | ) | (306 | ) | ||||||||||
|
Commercial loans |
(52,428 | ) | (69,595 | ) | (35,077 | ) | (4,957 | ) | (2,367 | ) | ||||||||||
|
Consumer and other loans |
(11,267 | ) | (7,780 | ) | (6,965 | ) | (1,649 | ) | (714 | ) | ||||||||||
|
|
|
|
|
|
|
|
|
|
|
|||||||||||
|
Total charge-offs |
(69,366 | ) | (93,950 | ) | (60,896 | ) | (9,839 | ) | (3,387 | ) | ||||||||||
|
|
|
|
|
|
|
|
|
|
|
|||||||||||
|
Recoveries |
||||||||||||||||||||
|
Residential real estate |
486 | 749 | 423 | 23 | 208 | |||||||||||||||
|
Commercial loans |
3,830 | 2,203 | 1,636 | 716 | 656 | |||||||||||||||
|
Consumer and other loans |
959 | 485 | 407 | 321 | 358 | |||||||||||||||
|
|
|
|
|
|
|
|
|
|
|
|||||||||||
|
Total recoveries |
5,275 | 3,437 | 2,466 | 1,060 | 1,222 | |||||||||||||||
|
|
|
|
|
|
|
|
|
|
|
|||||||||||
|
Charge-offs, net of recoveries |
(64,091 | ) | (90,513 | ) | (58,430 | ) | (8,779 | ) | (2,165 | ) | ||||||||||
|
Acquisitions 1 |
— | — | — | 2,625 | 639 | |||||||||||||||
|
|
|
|
|
|
|
|
|
|
|
|||||||||||
|
Balance at end of period |
$ | 137,516 | 137,107 | 142,927 | 76,739 | 54,413 | ||||||||||||||
|
|
|
|
|
|
|
|
|
|
|
|||||||||||
|
Allowance for loan and lease losses as a percentage of total loans |
3.97 | % | 3.66 | % | 3.52 | % | 1.88 | % | 1.52 | % | ||||||||||
|
Ratio of net charge-offs to average loans outstanding during the period |
1.77 | % | 2.26 | % | 1.41 | % | 0.23 | % | 0.06 | % | ||||||||||
| 1 |
Acquisition of San Juans in 2008 and North Side State Bank in 2007. |
46
Table of Contents
The following tables summarize the ALLL experience at the dates indicated, including identification by regulatory classification:
|
Allowance for Loan
and Lease Losses |
Provision
for Year |
Provision
for Year
|
ALLL
as a Percent |
|||||||||||||||||
|
(Dollars in thousands) |
Balance
12/31/11 |
Balance
12/31/10 |
Ended
12/31/11 |
Over Net
Charge-Offs |
of Loans
12/31/11 |
|||||||||||||||
|
Glacier |
$ | 35,336 | 34,701 | 16,800 | 1.0 | 4.51 | % | |||||||||||||
|
Mountain West |
36,167 | 35,064 | 30,100 | 1.0 | 5.38 | % | ||||||||||||||
|
First Security |
22,457 | 19,046 | 9,950 | 1.5 | 3.96 | % | ||||||||||||||
|
Western |
7,320 | 7,606 | 550 | 0.7 | 2.87 | % | ||||||||||||||
|
1st Bank |
8,572 | 10,467 | 1,950 | 0.5 | 3.55 | % | ||||||||||||||
|
Valley |
4,216 | 4,651 | — | — | 2.23 | % | ||||||||||||||
|
Big Sky |
8,860 | 9,963 | 2,350 | 0.7 | 3.90 | % | ||||||||||||||
|
First Bank-WY |
2,180 | 2,527 | 700 | 0.7 | 1.67 | % | ||||||||||||||
|
Citizens |
5,325 | 5,502 | 1,300 | 0.9 | 3.43 | % | ||||||||||||||
|
First Bank-MT |
2,894 | 3,020 | — | — | 2.58 | % | ||||||||||||||
|
San Juans |
4,189 | 4,560 | 800 | 0.7 | 3.09 | % | ||||||||||||||
|
|
|
|
|
|
|
|||||||||||||||
|
Total |
$ | 137,516 | 137,107 | 64,500 | 1.0 | 3.97 | % | |||||||||||||
|
|
|
|
|
|
|
|||||||||||||||
|
Net
Charge-Offs,
for Year Ended, By Bank |
||||||||||||||||
|
(Dollars in thousands) |
Balance
12/31/11 |
Balance
12/31/10 |
Charge-Offs
12/31/11 |
Recoveries
12/31/11 |
||||||||||||
|
Glacier |
$ | 16,165 | 24,327 | 17,579 | 1,414 | |||||||||||
|
Mountain West |
28,997 | 47,487 | 31,535 | 2,538 | ||||||||||||
|
First Security |
6,539 | 7,296 | 6,971 | 432 | ||||||||||||
|
Western |
836 | 2,106 | 1,010 | 174 | ||||||||||||
|
1st Bank |
3,845 | 2,578 | 4,287 | 442 | ||||||||||||
|
Valley |
435 | 216 | 460 | 25 | ||||||||||||
|
Big Sky |
3,453 | 4,048 | 3,581 | 128 | ||||||||||||
|
First Bank-WY |
1,047 | 605 | 1,067 | 20 | ||||||||||||
|
Citizens |
1,477 | 1,363 | 1,562 | 85 | ||||||||||||
|
First Bank-MT |
126 | 149 | 141 | 15 | ||||||||||||
|
San Juans |
1,171 | 338 | 1,173 | 2 | ||||||||||||
|
|
|
|
|
|
|
|
|
|||||||||
|
Total |
$ | 64,091 | 90,513 | 69,366 | 5,275 | |||||||||||
|
|
|
|
|
|
|
|
|
|||||||||
|
Net
Charge-Offs,
for Year Ended, By Loan Type |
||||||||||||||||
|
(Dollars in thousands) |
Balance
12/31/11 |
Balance
12/31/10 |
Charge-Offs
12/31/11 |
Recoveries
12/31/11 |
||||||||||||
|
Residential construction |
$ | 4,275 | 7,147 | 5,168 | 893 | |||||||||||
|
Land, lot and other construction |
31,306 | 51,580 | 33,162 | 1,856 | ||||||||||||
|
Commercial real estate |
7,676 | 10,181 | 8,278 | 602 | ||||||||||||
|
Commercial and industrial |
7,871 | 5,612 | 8,424 | 553 | ||||||||||||
|
Agriculture loans |
134 | — | 136 | 2 | ||||||||||||
|
1-4 family |
8,694 | 9,897 | 9,260 | 566 | ||||||||||||
|
Home equity lines of credit |
3,261 | 4,496 | 3,698 | 437 | ||||||||||||
|
Consumer |
615 | 951 | 914 | 299 | ||||||||||||
|
Other |
259 | 649 | 326 | 67 | ||||||||||||
|
|
|
|
|
|
|
|
|
|||||||||
|
Total |
$ | 64,091 | 90,513 | 69,366 | 5,275 | |||||||||||
|
|
|
|
|
|
|
|
|
|||||||||
47
Table of Contents
The allowance determined by each of the eleven community bank subsidiaries is combined together into a single allowance for the Company. Each of the Bank’s ALLL is considered adequate to absorb losses from any class of its loan portfolio. For the years ended December 31, 2011 and 2010, the Company believes the allowance is commensurate with the risk in the Company’s loan portfolio and is directionally consistent with the change in the quality of the Company’s loan portfolio as determined at each bank subsidiary. At December 31, 2011, the ALLL was $138 million and remained stable compared to the prior year end. The allowance was 3.97 percent of total loans outstanding at December 31, 2011, compared to 3.66 percent at December 31, 2010. The allowance was 102 percent of non-performing loans at December 31, 2011, an increase from 70 percent from the prior year end.
As of December 31, 2011 and 2010, the Company’s allowance consisted of the following components:
| December 31, | ||||||||
|
(Dollars in thousands) |
2011 | 2010 | ||||||
|
Specific valuation allowance |
$ | 18,828 | 16,871 | |||||
|
General valuation allowance |
118,688 | 120,236 | ||||||
|
|
|
|
|
|||||
|
Total ALLL |
$ | 137,516 | 137,107 | |||||
|
|
|
|
|
|||||
During 2011, the overall total of the ALLL increased by $409 thousand, the net result of a $1.9 million increase in the specific valuation allowance and a $1.5 million decrease in the general valuation allowance. The decrease in the general valuation since prior year end was due to a decrease in total loans of $283 million and an increase in TDR loans that were previously included in the general valuation allowance and were individually reviewed for impairment as of December 31, 2011. In addition, there was an increase in the bank subsidiaries’ overall historical loss experience adjusted for environmental factors during the year ended December 31, 2011, albeit total loans collectively evaluated for impairment decreased by $317 million during such period.
Presented below are select aggregated statistics that were also considered when determining the adequacy of the Company’s ALLL at December 31, 2011:
Positive Trends
| • |
The provision for loan losses in 2011 was $64.5 million, a decrease of $20.2 million from 2010. |
| • |
Non-accrual construction loans (i.e., residential construction and land, lot and other construction) were $67.9 million, or 51 percent, of the $134 million of non-accrual loans at year end 2011, a decrease of $49.8 million from the prior year end. Non-accrual construction loans at year end 2010 accounted for 61 percent of the $193 million of non-accrual loans. |
| • |
The $31.4 million total of non-accrual loans in the commercial real estate and commercial and industrial at year end 2011 decreased by $6.1 million from year end 2010. |
| • |
The $34.4 million total of non-accrual loans in the agriculture, 1-4 family, home equity lines of credit, consumer, and other loans at year end 2011 decreased by $2.9 million from year end 2010. |
| • |
Non-performing loans as a percent of total loans decreased to 3.90 percent at year end 2011 as compared to 5.26 percent at year end 2010. |
| • |
The allowance as a percent of non-performing loans was 102 percent at December 31, 2010, compared to 89 percent at December 31, 2010. |
| • |
Charge-offs, net of recoveries, in 2011 were $64.1 million, a decrease of $26.4 million from 2010. |
| • |
Net charge-offs of construction loans were $35.6 million, or 56 percent, of the $64.1 million of net charge-offs in 2011 compared to net charge-offs of construction loans of $58.7 million, or 65 percent, of the $90.5 million of net charge-offs in 2010. |
Negative Trends
| • |
Impaired loans as a percent of total loans increased to 7.46 percent at year end 2011 as compared to 6.00 percent at year end 2010. |
| • |
Early stage delinquencies (accruing loans 30-89 days past due) increased to $49.1 million at year end 2011 from $45.5 million at the prior year end. |
When applied to each bank subsidiary’s historical loss experience, the environmental factors result in the provision for loan losses being recorded in the period in which the loss has probably occurred. When the loss is confirmed at a later date, a charge-off is recorded. During 2011, the provision for loan losses exceeded loan charge-offs, net of recoveries, by $409 thousand. During 2010, loan charge-offs, net of recoveries, exceeded the provision for loan losses by $5.8 million.
48
Table of Contents
The eleven bank subsidiaries provide commercial services to individuals, small to medium size businesses, community organizations and public entities from 106 locations, including 97 branches, across Montana, Idaho, Wyoming, Colorado, Utah, and Washington. The Rocky Mountain areas in which the bank subsidiaries operate have diverse economies and markets that are tied to commodities (crops, livestock, minerals, oil and natural gas), tourism, real estate and land development and an assortment of industries, both manufacturing and service-related. Thus, the changes in the global, national, and local economies are not uniform across each of the bank subsidiaries.
Though stabilizing, the soft economic conditions during much of 2010 continued during 2011, including declining sales of existing real property (e.g., single family residential, multi-family, commercial buildings and land), an increase in existing inventory of real property, increase in real property delinquencies and foreclosures, and corresponding decrease in absorption rates, and lower values of real property that collateralize most of the Company’s loan portfolios, among other factors. While the national unemployment rate increased steadily from 7.4 percent at the start of 2009 to 10.0 percent at year end 2009, dropping to 9.4 percent at year end 2010 and 8.5 percent at year end 2011, the unemployment rates for most states in which the community bank subsidiaries conduct operations were lower throughout this time period compared to the national unemployment rate. Agricultural price declines in livestock and grain in 2009 have recovered significantly and remain strong. While prices for oil have held strong, prices for natural gas currently remain weak (due to excess supply) especially when compared to the exceptionally high price levels of natural gas during 2008. Although the cost of living (as reflected in Consumer Price Index measures) has slowly increased in during 2011, the overall decline in the cost of living during 2010 and 2009 helped buffer the general softening of the economy nationally, regionally and locally, and the impact of lower real property values. The tourism industry and related lodging continues to be a source of strength for those banks whose market areas have national parks and similar recreational areas in the market areas served. Such changes affected the bank subsidiaries in distinctly different ways as each bank has its own geographic area and local economic influences over both a short-term and long-term horizon.
In evaluating the need for a specific or general valuation allowance for impaired and unimpaired loans, respectively, within the Company’s construction loan portfolio, including residential construction and land, lot and other construction loans, the credit risk related to such loans was considered in the ongoing monitoring of such loans, including assessments based on current information, including new or updated appraisals or evaluations of the underlying collateral, expected cash flows and the timing thereof, as well as the estimated cost to sell when such costs are expected to reduce the cash flows available to repay or otherwise satisfy the construction loan. Construction loans are 14 percent of the Company’s total loan portfolio and account for 51 percent of the Company’s non-accrual loans at December 31, 2011. Collateral securing construction loans includes residential buildings (e.g., single/multi-family and condominiums), commercial buildings, and associated land (multi-acre parcels and individual lots, with and without shorelines). Outstanding balances are centered in Western Montana and Northern Idaho, as well as Boise and Sun Valley, Idaho. None of the individual bank subsidiaries have a concentration of construction loans exceeding 5 percent of the Company’s total loan portfolio.
For additional information regarding the ALLL, its relation to the provision for loan losses and risk related to asset quality, see Note 4 to the Consolidated Financial Statements in “Item 8. Financial Statements and Supplementary Data.”
Investment Activity
It has generally been the Company’s policy to maintain a liquid portfolio above policy limits. The Company’s investment securities are generally classified as available-for-sale and are carried at estimated fair value with unrealized gains or losses, net of tax, reflected as an adjustment to stockholders’ equity. The Company’s investment portfolio is primarily comprised of residential mortgage-backed securities and state and local government securities which are largely exempt from federal income tax. The Company uses the federal statutory rate of 35 percent in calculating its tax-equivalent yield. The residential mortgage-backed securities are typically short-term and provide the Company with on-going liquidity as scheduled and pre-paid principal payments are made on the securities. The Company assesses individual securities in its investment securities portfolio for other-than-temporary impairment at least on a quarterly basis, and more frequently when economic or market conditions warrant.
For additional investment activity information, see Note 3 to the Consolidated Financial Statements in “Item 8. Financial Statements and Supplementary Data.”
Other-Than-Temporary Impairment on Securities Analysis
Non-marketable equity securities owned at December 31, 2011 primarily consisted of stock issued by the FHLB of Seattle and Topeka, such shares measured at cost in recognition of the transferability restrictions imposed by the issuers. Other non-marketable equity securities include Federal Agriculture Mortgage Corporation and Bankers’ Bank of the West Bancorporation, Inc.
With respect to FHLB stock, the Company evaluates such stock for other-than-temporary impairment. Such evaluation takes into consideration 1) FHLB deficiency, if any, in meeting applicable regulatory capital targets, including risk-based capital requirements, 2) the significance of any decline in net assets of the FHLB as compared to the capital stock amount for the FHLB and the time period for any such decline, 3) commitments by the FHLB to make payments required by law or regulation and the level of such payments in relation to the operating performance of the FHLB, 4) the impact of legislative and regulatory changes on the FHLB, and 5) the liquidity position of the FHLB.
49
Table of Contents
Based on the analysis of its impaired non-marketable equity securities as of December 31, 2011, the Company determined that none of such securities had other-than-temporary impairment.
In evaluating debt securities for other-than-temporary impairment losses, management assesses whether the Company intends to sell the security or if it is more-likely-than-not that the Company will be required to sell the debt security. In so doing, management considers contractual constraints, liquidity, capital, asset / liability management and securities portfolio objectives.
The Company believes that macroeconomic conditions occurring during 2011 and 2010 have unfavorably impacted the fair value of certain debt securities in its investment portfolio. On August 5, 2011, Standard and Poor’s downgraded the United States long-term debt rating from its AAA rating to AA+. On August 8, 2011, Standard and Poor’s downgraded from AAA to AA+ the credit ratings of certain long-term debt instruments issued by Fannie Mae and Freddie Mac and other U.S. government agencies linked to long-term United States debt. For debt securities with limited or inactive markets, the impact of these macroeconomic conditions upon fair value estimates includes higher risk-adjusted discount rates and downgrades in credit ratings provided by nationally recognized credit rating agencies, (e.g., Moody’s, S&P, Fitch, and DBRS).
The following table separates investments with an unrealized loss position at December 31, 2011 into two categories: investments purchased prior to 2011 and those purchased during 2011. Of those investments purchased prior to 2011, the fair value and unrealized loss at December 31, 2010 is also presented.
| December 31, 2011 | December 31, 2010 | |||||||||||||||||||||||
|
(Dollars in thousands) |
Fair Value |
Unrealized
Loss |
Unrealized
Loss as a Percent of Fair Value |
Fair Value |
Unrealized
(Loss) Gain |
Unrealized
Loss as a Percent of Fair Value |
||||||||||||||||||
|
Temporarily impaired securities purchased prior to 2011 |
||||||||||||||||||||||||
|
State and local governments |
$ | 11,716 | (489 | ) | -4.17 | % | 11,244 | (968 | ) | -8.61 | % | |||||||||||||
|
Collateralized debt obligations |
5,366 | (282 | ) | -5.26 | % | 6,595 | (4,583 | ) | -69.49 | % | ||||||||||||||
|
Residential mortgage-backed securities |
250,124 | (2,151 | ) | -0.86 | % | 498,622 | 424 | 0.09 | % | |||||||||||||||
|
|
|
|
|
|
|
|
|
|||||||||||||||||
|
Total |
$ | 267,206 | (2,922 | ) | -1.09 | % | 516,461 | (5,127 | ) | -0.99 | % | |||||||||||||
|
|
|
|
|
|
|
|
|
|||||||||||||||||
|
Temporarily impaired securities purchased during 2011 |
||||||||||||||||||||||||
|
State and local governments |
$ | 24,666 | (89 | ) | -0.36 | % | ||||||||||||||||||
|
Corporate bonds |
31,782 | (1,264 | ) | -3.98 | % | |||||||||||||||||||
|
Residential mortgage-backed securities |
701,492 | (5,032 | ) | -0.72 | % | |||||||||||||||||||
|
|
|
|
|
|||||||||||||||||||||
|
Total |
$ | 757,940 | (6,385 | ) | -0.84 | % | ||||||||||||||||||
|
|
|
|
|
|||||||||||||||||||||
|
Temporarily impaired securities |
||||||||||||||||||||||||
|
State and local governments |
$ | 36,382 | (578 | ) | -1.59 | % | ||||||||||||||||||
|
Corporate bonds |
31,782 | (1,264 | ) | -3.98 | % | |||||||||||||||||||
|
Collateralized debt obligations |
5,366 | (282 | ) | -5.26 | % | |||||||||||||||||||
|
Residential mortgage-backed securities |
951,616 | (7,183 | ) | -0.75 | % | |||||||||||||||||||
|
|
|
|
|
|||||||||||||||||||||
|
Total |
$ | 1,025,146 | (9,307 | ) | -0.91 | % | ||||||||||||||||||
|
|
|
|
|
|||||||||||||||||||||
50
Table of Contents
With respect to severity, the following table provides the number of securities and amount of unrealized loss in the various ranges of unrealized loss as a percent of book value.
|
(Dollars in thousands) |
Unrealized
Loss |
Number of
Debt Securities |
||||||
|
Greater than 20.0% |
$ | — | — | |||||
|
15.1% to 20.0% |
(400 | ) | 1 | |||||
|
10.1% to 15.0% |
(661 | ) | 3 | |||||
|
5.1% to 10.0% |
(1,103 | ) | 13 | |||||
|
0.1% to 5.0% |
(7,143 | ) | 435 | |||||
|
|
|
|
|
|||||
|
Total |
$ | (9,307 | ) | 452 | ||||
|
|
|
|
|
|||||
With respect to the duration of the impaired debt securities, the Company identified 23 which have been continuously impaired for the twelve months ending December 31, 2011. The valuation history of such securities in the prior year(s) was also reviewed to determine the number of months in prior year(s) in which the identified securities was in an unrealized loss position. Of the 23 securities, 11 are state and local governments securities with an unrealized loss of $488 thousand, the most notable of which had an unrealized loss of $201 thousand.
Of the 23 securities, 6 are identical collateralized debt obligation (“CDO”) securities with an aggregate unrealized loss of $282 thousand, the most notable of which had an unrealized loss of $71 thousand. With respect to the CDO securities, each is in the form of a pooled trust preferred structure of which the Company owns a portion of the Senior Notes tranche. All of the assets underlying the pooled trust preferred structure are capital securities issued by trust subsidiaries of holding companies of banks and thrifts. Since December 31, 2009, the Senior Notes have been rated “A3” by Moody’s. The Senior Notes have also been rated as of January 4, 2012 by Fitch as “BBB,” such rating effective September 21, 2010. Prior to such downgrade, Fitch had rated the Senior Notes as “A.” The Trustee may treat a trust subsidiary as in default either because of an actual default or due to elective deferral of interest payments on their respective obligations. The following tables indicate the number of trust subsidiaries treated by the Trustee as in default and the percentage of those to the total number of trust subsidiaries for 2011 and 2010.
| Quarters ended 2011 | ||||||||||||||||
| March 31 | June 30 | September 30 | December 31 | |||||||||||||
|
Total number of trust subsidiaries |
26 | 26 | 26 | 23 | ||||||||||||
|
Number of trust subsidiaries in default |
9 | 9 | 10 | 9 | ||||||||||||
|
Percentage of trust subsidiaries in default |
35 | % | 35 | % | 38 | % | 39 | % | ||||||||
| Quarters ended 2010 | ||||||||||||||||
| March 31 | June 30 | September 30 | December 31 | |||||||||||||
|
Total number of trust subsidiaries |
26 | 26 | 26 | 26 | ||||||||||||
|
Number of trust subsidiaries in default |
6 | 8 | 8 | 9 | ||||||||||||
|
Percentage of trust subsidiaries in default |
23 | % | 31 | % | 31 | % | 35 | % | ||||||||
51
Table of Contents
In accordance with the prospectus for the CDO structure, the priority of payments favors holders of the Senior Notes over holders of the Mezzanine Notes and Income Notes. Though the maturity of the CDO structure is June 15, 2031, 62.4 percent of the outstanding principle of the Senior Notes has been prepaid through December 15, 2011. More specifically, at any time the Senior Notes are outstanding, if either the Senior Principle or Senior Interest Coverage Tests (the “Senior Coverage Tests”) are not satisfied as of a calculation date, then funds that would have otherwise been used to make payments on the Mezzanine Notes or Income Notes shall instead be applied as principle prepayments on the Senior Notes. Both the Senior Principle Coverage Test and the Senior Interest Test exceeded their threshold levels. During the first three quarters of 2011 and the preceding five quarters, the Senior Principle Coverage Test was below its threshold level, while the Senior Interest Coverage Test exceeded its threshold level. The Senior Coverage Tests exceeded the threshold levels for each of the first three quarters of 2009. In its assessment of the Senior Notes for potential other-than-temporary impairment, the Company evaluated the underlying issuers and engaged a third party vendor to stress test the performance of the underlying capital securities and related obligors. Such stress testing has been performed at the end of each quarter of 2011, 2010 and 2009. In each instance of stress testing, the results reflect no credit loss for the Senior Notes. In evaluating such results, the Company reviewed with the third party vendor the stress test assumptions and concurred with the analyses in concluding that the impairment at December 31, 2011 and at the end of each of the prior quarters of 2011, 2010 and 2009 was temporary, and not other-than-temporary.
Of the 23 securities temporarily impaired continuously for the twelve months ended December 31, 2011, 6 are non-guaranteed private label whole loan mortgages with an aggregate unrealized loss of $333 thousand, the most notable of which had an unrealized loss of $308 thousand. Of the 6 non-guaranteed private label whole loan mortgages, 5 are collateralized by 30-year fixed rate residential mortgages considered to be “Prime” and 1 is collateralized by 30-year fixed rate residential mortgages considered to be “ALT – A.” Moreover, none of the underlying mortgage collateral is considered “subprime.”
The Company engages a third-party to perform detailed analysis for other-than-temporary impairment of such securities. Such analysis takes into consideration original and current data for the tranche and CMO structure, the non-guaranteed classification of each CMO tranche, current and deal inception credit ratings, credit support (protection) afforded the tranche through the subordination of other tranches in the CMO structure, the nature of the collateral (e.g., Prime or Alt-A) underlying each CMO tranche, and realized cash flows since purchase.
Based on the analysis of its impaired debt securities as of December 31, 2011, the Company determined that none of such securities had other-than-temporary impairment.
Sources of Funds
Deposits obtained through the Banks have traditionally been the principal source of funds for use in lending and other business purposes. The Banks have a number of different deposit programs designed to attract both short-term and long-term deposits from the general public by providing a wide selection of accounts and rates. These programs include non-interest bearing demand accounts, interest bearing checking, regular statement savings, money market deposit accounts, and fixed rate certificates of deposit with maturities ranging from three months to five years, negotiated-rate jumbo certificates, and individual retirement accounts. In addition, the Banks obtain wholesale deposits through various programs including reciprocal deposit programs (e,g, Certificate of Deposit Account Registry System (“CDARS”)).
The Banks also obtain funds from repayment of loans and investment securities, repurchase agreements, advances from the FHLB, other borrowings, and sale of loans and investment securities. Loan repayments are a relatively stable source of funds, while interest bearing deposit inflows and outflows are significantly influenced by general interest rate levels and market conditions. Borrowings and advances may be used on a short-term basis to compensate for reductions in normal sources of funds such as deposit inflows at less than projected levels. Borrowings also may be used on a long-term basis to support expanded activities and to match maturities of longer-term assets.
52
Table of Contents
Deposits
Deposits are obtained primarily from individual and business residents of the Banks’ market area. The Banks issue negotiated-rate certificate of deposits accounts and have paid a limited amount of fees to brokers to obtain deposits. The following table illustrates the amounts outstanding at December 31, 2011 for deposits of $100,000 and greater, according to the time remaining to maturity. Included in certificates of deposit are brokered certificates of deposit and deposits issued through the CDARS of $372 million. Included in Demand Deposits are brokered deposits of $227 million.
| Certificates | Demand | |||||||||||
|
(Dollars in thousands) |
of Deposit | Deposits | Totals | |||||||||
|
Within three months |
$ | 424,350 | 1,986,757 | 2,411,107 | ||||||||
|
Three months to six months |
144,620 | — | 144,620 | |||||||||
|
Seven months to twelve months |
201,719 | — | 201,719 | |||||||||
|
Over twelve months |
162,494 | — | 162,494 | |||||||||
|
|
|
|
|
|
|
|||||||
|
Totals |
$ | 933,183 | 1,986,757 | 2,919,940 | ||||||||
|
|
|
|
|
|
|
|||||||
For additional deposit information, see Note 7 to the Consolidated Financial Statements in “Item 8. Financial Statements and Supplementary Data.”
Repurchase Agreements, FHLB Advances and Other Borrowings
The Banks have borrowed money through repurchase agreements. This process involves the “selling” of one or more of the securities in the Banks’ investment portfolio and by entering into an agreement to “repurchase” that same security at an agreed upon later date, typically overnight. A rate of interest is paid for the subject period of time. Through policies adopted by each of the Banks’ Board of Directors, the Banks enter into repurchase agreements with local municipalities, and certain customers, and have adopted procedures designed to ensure proper transfer of title and safekeeping of the underlying securities. In addition to retail repurchase agreements, the Company has entered into wholesale repurchase agreements as additional funding sources which the Company utilizes from time to time.
All bank subsidiaries, except San Juans, are members of the FHLB of Seattle. San Juans is a member of the FHLB of Topeka. FHLB of Seattle and Topeka are two of twelve banks that comprise the FHLB System. As members of the FHLB, the Banks may borrow from such entities on the security of FHLB stock, which the Banks are required to own as a member. The borrowings are collateralized by eligible categories of loans and investment securities (principally, securities which are obligations of, or guaranteed by, the United States and its agencies), provided certain standards related to credit-worthiness have been met. Advances are made pursuant to several different credit programs, each of which has its own interest rate and range of maturities. Depending on the program, limitations on the amount of advances are based either on a fixed percentage of an institution’s total assets or on the FHLB’s assessment of the institution’s credit-worthiness. FHLB advances have been used from time to time to meet seasonal and other withdrawals of deposits and to expand lending by matching a portion of the estimated amortization and prepayments of retained fixed rate mortgages.
During 2009 and 2010, the Banks periodically borrowed funds through the Term Auction Facility (“TAF”) program of the FRB. The TAF program required pledging of certain loans or investment securities of the Banks. The TAF program ceased operations in April 2010.
For additional information concerning the Company’s borrowings and repurchase agreements, see Notes 8 and 9 to the Consolidated Financial Statements in “Item 8. Financial Statements and Supplementary Data.”
Short-term borrowings
A critical component of the Company’s liquidity and capital resources is access to short-term borrowings to fund its operations. Short-term borrowings are accompanied by increased risks managed by asset liability committees (“ALCO”) such as rate increases or unfavorable change in terms which would make it more costly to obtain future short-term borrowings. The Company’s short-term borrowing sources include FHLB advances, discount window borrowings, federal funds purchased, wholesale deposits, and retail and wholesale repurchase agreements. FHLB advances and certain other short-term borrowings may be extended as long-term borrowings to decrease certain risks such as liquidity or interest rate risk; however, the reduction in risks are weighed against the increased cost of funds.
53
Table of Contents
The following table provides information relating to short-term borrowings which consists of borrowings that mature within one year of period end:
| At or for the Years ended December 31, | ||||||||||||
|
(Dollars in thousands) |
2011 | 2010 | 2009 | |||||||||
|
Repurchase agreements |
||||||||||||
|
Amount outstanding at end of period |
$ | 258,643 | 249,403 | 212,506 | ||||||||
|
Weighted interest rate on outstanding amount |
0.42 | % | 0.63 | % | 0.94 | % | ||||||
|
Maximum outstanding at any month-end |
$ | 338,352 | 252,083 | 234,914 | ||||||||
|
Average balance |
$ | 267,058 | 227,202 | 204,503 | ||||||||
|
Weighted average interest rate |
0.51 | % | 0.71 | % | 0.98 | % | ||||||
|
FHLB advances |
||||||||||||
|
Amount outstanding at end of period |
$ | 792,000 | 761,064 | 586,057 | ||||||||
|
Weighted interest rate on outstanding amount |
0.68 | % | 0.33 | % | 0.25 | % | ||||||
|
Maximum outstanding at any month-end |
$ | 877,017 | 773,076 | 586,057 | ||||||||
|
Average balance |
$ | 721,226 | 488,044 | 289,141 | ||||||||
|
Weighted average interest rate |
0.76 | % | 0.39 | % | 0.33 | % | ||||||
|
FRB discount window |
||||||||||||
|
Amount outstanding at end of period |
$ | — | — | 225,000 | ||||||||
|
Weighted interest rate on outstanding amount |
N/A | 0.00 | % | 0.25 | % | |||||||
|
Maximum outstanding at any month-end |
$ | — | 235,000 | 1,005,000 | ||||||||
|
Average balance |
$ | — | 35,630 | 658,262 | ||||||||
|
Weighted average interest rate |
N/A | 0.25 | % | 0.26 | % | |||||||
Subordinated Debentures
In addition to funds obtained in the ordinary course of business, the Company formed or acquired financing subsidiaries for the purpose of issuing trust preferred securities that entitle the shareholder to receive cumulative cash distributions from payments thereon. The subordinated debentures outstanding as of December 31, 2011 were $125,275,000, including fair value adjustments from prior acquisitions. For additional information regarding the subordinated debentures, see Note 10 to the Consolidated Financial Statements “Item 8. Financial Statements and Supplementary Data.”
Contractual Obligations and Off-Balance Sheet Arrangements
In the normal course of business, there are various outstanding commitments to extend credit, such as letters of credit and un-advanced loan commitments, which are not reflected in the accompanying condensed consolidated financial statements. Management does not anticipate any material losses as a result of these transactions. The Company has outstanding debt maturities, the largest aggregate amount of which were FHLB advances. For the schedules of outstanding commitments and future minimum lease payments see Note 21 to the Consolidated Financial Statements in “Item 8. Financial Statements and Supplementary Data.”
The following table represents the Company’s contractual obligations as of December 31, 2011:
| Payments Due by Period | ||||||||||||||||||||||||||||||||
|
(Dollars in thousands) |
Total |
Indeterminate
Maturity 1 |
2012 | 2013 | 2014 | 2015 | 2016 | Thereafter | ||||||||||||||||||||||||
|
Deposits |
$ | 4,821,213 | 3,359,477 | 1,147,799 | 175,543 | 70,701 | 36,225 | 31,403 | 65 | |||||||||||||||||||||||
|
Repurchase agreements |
258,643 | — | 258,643 | — | — | — | — | — | ||||||||||||||||||||||||
|
FHLB advances |
1,069,046 | — | 792,000 | — | — | 75,000 | 45,000 | 157,046 | ||||||||||||||||||||||||
|
Other borrowed funds |
8,123 | — | 188 | — | — | — | 4 | 7,931 | ||||||||||||||||||||||||
|
Subordinated debentures |
125,275 | — | — | — | — | — | — | 125,275 | ||||||||||||||||||||||||
|
Capital lease obligations |
2,643 | — | 235 | 238 | 829 | 195 | 197 | 949 | ||||||||||||||||||||||||
|
Operating lease obligations |
13,778 | — | 2,235 | 1,860 | 1,708 | 1,533 | 1,318 | 5,124 | ||||||||||||||||||||||||
|
|
|
|
|
|
|
|
|
|
|
|
|
|
|
|
|
|||||||||||||||||
| $ | 6,298,721 | 3,359,477 | 2,201,100 | 177,641 | 73,238 | 112,953 | 77,922 | 296,390 | ||||||||||||||||||||||||
|
|
|
|
|
|
|
|
|
|
|
|
|
|
|
|
|
|||||||||||||||||
| 1 |
Represents non-interest bearing deposits and NOW, savings, and money market accounts. |
54
Table of Contents
Liquidity Risk
Liquidity risk is the possibility that the Company will not be able to fund present and future obligations as they come due because of an inability to liquidate assets or obtain adequate funding at a reasonable cost. The objective of liquidity management is to maintain cash flows adequate to meet current and future needs for credit demand, deposit withdrawals, maturing liabilities and corporate operating expenses. Effective liquidity management entails three elements:
| 1. | Assessing on an ongoing basis, the current and expected future needs for funds, and ensuring that sufficient funds or access to funds exist to meet those needs at the appropriate time. |
| 2. | Providing for an adequate cushion of liquidity to meet unanticipated cash flow needs that may arise from potential adverse circumstances ranging from high probability/low severity events to low probability/high severity. |
| 3. | Balancing the benefits between providing for adequate liquidity to mitigate potential adverse events and the cost of that liquidity. |
The following table identifies certain liquidity sources and capacity available to the Company at December 31, 2011:
| December 31, | ||||
|
(Dollars in thousands) |
2011 | |||
|
FHLB advances |
||||
|
Borrowing capacity |
$ | 1,102,899 | ||
|
Amount utilized |
(1,069,046 | ) | ||
|
|
|
|||
|
Amount available |
$ | 33,853 | ||
|
|
|
|||
|
FRB discount window |
||||
|
Borrowing capacity |
$ | 244,886 | ||
|
Amount utilized |
— | |||
|
|
|
|||
|
Amount available |
$ | 244,886 | ||
|
|
|
|||
|
Unsecured lines of credit available |
$ | 183,860 | ||
|
|
|
|||
|
Unencumbered securities |
||||
|
U.S. government and federal agency |
$ | 208 | ||
|
U.S. government sponsored enterprises |
3,487 | |||
|
State and local governments |
941,226 | |||
|
Corporate bonds |
62,237 | |||
|
Collateralized debt obligations |
5,366 | |||
|
Residential mortgage-backed securities |
960,388 | |||
|
|
|
|||
|
Total unencumbered securities |
$ | 1,972,912 | ||
|
|
|
|||
The Company and each of the bank subsidiaries have a wide range of versatility in managing the liquidity and asset/liability mix across each of the bank subsidiaries as well as the Company as a whole. ALCO committees are maintained at the Parent and bank subsidiary levels with the ALCO committees meeting regularly to assess liquidity risk, among other matters. The Company monitors liquidity and contingency funding alternatives through management reports of liquid assets (e.g., investment securities), both unencumbered and pledged, as well as borrowing capacity, both secured and unsecured.
Capital Resources
Maintaining capital strength continues to be a long-term objective. Abundant capital is necessary to sustain growth, provide protection against unanticipated declines in asset values, and to safeguard the funds of depositors. Capital also is a source of funds for loan demand and enables the Company to effectively manage its assets and liabilities. Taking these considerations into account, the Company may, as it has done in the past, decide to utilize a portion of its strong capital position to repurchase shares of its outstanding common stock, from time to time, depending on market price and other relevant considerations.
The Federal Reserve Board has adopted capital adequacy guidelines that are used to assess the adequacy of capital in supervising a bank holding company. Each bank subsidiary was considered well capitalized by their respective regulator as of December 31, 2011 and 2010. There are no conditions or events since December 31, 2011 that management believes have changed the Company’s or bank subsidiaries’ risk-based capital category.
55
Table of Contents
The following table illustrates the Federal Reserve Board’s capital adequacy guidelines and the Company’s compliance with those guidelines as of December 31, 2011.
| Tier 1 (Core) | Total | Leverage | ||||||||||
|
(Dollars in thousands) |
Capital | Capital | Capital | |||||||||
|
Total stockholders’ equity |
$ | 850,227 | 850,227 | 850,227 | ||||||||
|
Less: |
||||||||||||
|
Goodwill and intangibles |
(112,780 | ) | (112,780 | ) | (112,780 | ) | ||||||
|
Net unrealized gain on AFS debt securities |
(33,487 | ) | (33,487 | ) | (33,487 | ) | ||||||
|
Other adjustments |
(56 | ) | (56 | ) | (56 | ) | ||||||
|
Plus: |
||||||||||||
|
Allowance for loan and lease losses |
— | 55,550 | — | |||||||||
|
Subordinated debentures |
124,500 | 124,500 | 124,500 | |||||||||
|
Other adjustments |
— | — | — | |||||||||
|
|
|
|
|
|
|
|||||||
|
Regulatory capital |
$ | 828,404 | 883,954 | 828,404 | ||||||||
|
|
|
|
|
|
|
|||||||
|
Risk-weighted assets |
$ | 4,361,871 | 4,361,871 | |||||||||
|
|
|
|
|
|||||||||
|
Total adjusted average assets |
$ | 7,015,052 | ||||||||||
|
|
|
|||||||||||
|
Capital as % of risk weighted assets |
18.99 | % | 20.27 | % | 11.81 | % | ||||||
|
|
|
|||||||||||
|
Regulatory “well capitalized” requirement |
6.00 | % | 10.00 | % | ||||||||
|
|
|
|
|
|||||||||
|
Excess over “well capitalized” requirement |
12.99 | % | 10.27 | % | ||||||||
|
|
|
|
|
|||||||||
Dividend payments were $0.52 per share for 2011 and 2010. The payment of dividends is subject to government regulation in that regulatory authorities may prohibit banks and bank holding companies from paying dividends that would constitute an unsafe or unsound banking practice. Additionally, current guidance from the Federal Reserve provides, among other things, that dividends per share on the Company’s common stock generally should not exceed earnings per share measured over the previous four fiscal quarters.
In addition to the primary and safeguard liquidity sources available, the Company has the capacity to issue 117,187,500 shares of common stock of which 71,915,073 has been issued as of December 31, 2011. The Company’s capacity to issue additional shares has been demonstrated with the most recent stock issuances in 2010 and 2008, although no assurances can be made that future stock issuances would be as successful. The Company also has the capacity to issue 1,000,000 shares of preferred shares of which none are currently issued. For additional information, see Note 12 to the Consolidated Financial Statements in “Item 8. Financial Statements and Supplementary Data.”
Federal and State Income Taxes
The Company files a consolidated federal income tax return, using the accrual method of accounting. All required tax returns have been timely filed. Financial institutions are subject to the provisions of the Internal Revenue Code of 1986, as amended, in the same general manner as other corporations.
Under Montana, Idaho, Colorado and Utah law, financial institutions are subject to a corporation tax, which incorporates or is substantially similar to applicable provisions of the Internal Revenue Code. The corporation tax is imposed on federal taxable income, subject to certain adjustments. State taxes are incurred at the rate of 6.75 percent in Montana, 7.6 percent in Idaho, 5 percent in Utah and 4.63 percent in Colorado. Wyoming and Washington do not impose a corporate income tax.
56
Table of Contents
The Company has equity investments in Certified Development Entities which have received allocations of New Markets Tax Credits (“NMTC”). Administered by the Community Development Financial Institutions Fund of the U.S. Department of the Treasury, the NMTC program is aimed at stimulating economic and community development and job creation in low-income communities. The federal income tax credits received are claimed over a seven-year credit allowance period. The Company also has equity investments in Low-Income Housing Tax Credits which are indirect federal subsidies used to finance the development of affordable rental housing for low-income households. The federal income tax credits received are claimed over a ten-year credit allowance period. The Company has investments in Qualified Zone Academy and Qualified School Construction bonds whereby the Company receives quarterly federal income tax credits in lieu of taxable interest income until the bonds mature. The federal income tax credits on these bonds are subject to federal and state income tax.
Following is a list of expected federal income tax credits to be received in the years indicated.
|
(Dollars in thousands) |
New
Market Tax Credits |
Low-Income
Housing Tax Credits |
Investment
Securities Tax Credits |
Total | ||||||||||||
|
2012 |
2,681 | 1,270 | 943 | 4,894 | ||||||||||||
|
2013 |
2,775 | 1,270 | 926 | 4,971 | ||||||||||||
|
2014 |
2,850 | 1,270 | 904 | 5,024 | ||||||||||||
|
2015 |
2,850 | 1,174 | 880 | 4,904 | ||||||||||||
|
2016 |
1,014 | 1,172 | 855 | 3,041 | ||||||||||||
|
Thereafter |
450 | 4,207 | 4,432 | 9,089 | ||||||||||||
|
|
|
|
|
|
|
|
|
|||||||||
| $ | 12,620 | 10,363 | 8,940 | 31,923 | ||||||||||||
|
|
|
|
|
|
|
|
|
|||||||||
Income tax (benefit) expense for the years ended December 31, 2011 and 2010 was $(281) thousand and $7.3 million, respectively. The Company’s effective tax rate for the years ended December 31, 2011 and 2010 was -1.6 percent and 14.8 percent, respectively. The primary reason for the current year negative effective tax rate is the low pre-tax income of $17.2 million which was mainly a result of the $40.2 million goodwill impairment charge. In addition to the current year goodwill impairment charge, the significant reasons for the low effective rates are the amount of tax-exempt investment income and federal tax credits. The tax-exempt income was $31.4 million and $23.4 million for the years ended December 31, 2011 and 2010, respectively. The federal tax credit benefits were $3.6 million and $3.4 million for the years ended December 31, 2011 and 2010, respectively. The Company continues its investments in select municipal securities and various VIEs whereby the Company receives federal tax credits.
See Note 14 to the Consolidated Financial Statements in “Item 8. Financial Statements and Supplementary Data” for additional information.
57
Table of Contents
Average Balance Sheet
The following three-year schedule provides 1) the total dollar amount of interest and dividend income of the Company for earning assets and the average yield; 2) the total dollar amount of interest expense on interest bearing liabilities and the average rate; 3) net interest and dividend income and interest rate spread; and 4) net interest margin and net interest margin tax-equivalent; and 5) return on average assets and return on average equity.
| Year ended December 31, 2011 | Year ended December 31, 2010 | Year ended December 31, 2009 | ||||||||||||||||||||||||||||||||||
|
(Dollars in thousands) |
Average
Balance |
Interest &
Dividends |
Average
Yield/ Rate |
Average
Balance |
Interest &
Dividends |
Average
Yield/ Rate |
Average
Balance |
Interest &
Dividends |
Average
Yield/ Rate |
|||||||||||||||||||||||||||
|
Assets |
||||||||||||||||||||||||||||||||||||
|
Residential real estate loans |
$ | 581,644 | $ | 33,060 | 5.68 | % | $ | 772,074 | $ | 45,401 | 5.88 | % | $ | 829,348 | $ | 54,498 | 6.57 | % | ||||||||||||||||||
|
Commercial loans |
2,364,115 | 130,249 | 5.51 | % | 2,542,186 | 143,861 | 5.66 | % | 2,608,961 | 151,580 | 5.81 | % | ||||||||||||||||||||||||
|
Consumer and other loans |
680,032 | 40,538 | 5.96 | % | 684,752 | 42,130 | 6.15 | % | 702,232 | 44,844 | 6.39 | % | ||||||||||||||||||||||||
|
|
|
|
|
|
|
|
|
|
|
|
|
|||||||||||||||||||||||||
|
Total loans 1 |
3,625,791 | 203,847 | 5.62 | % | 3,999,012 | 231,392 | 5.79 | % | 4,140,541 | 250,922 | 6.06 | % | ||||||||||||||||||||||||
|
Tax-exempt investment securities 2 |
705,548 | 31,420 | 4.45 | % | 479,640 | 23,351 | 4.87 | % | 445,063 | 22,196 | 4.99 | % | ||||||||||||||||||||||||
|
Taxable investment securities 3 |
2,115,779 | 44,842 | 2.12 | % | 1,378,468 | 33,659 | 2.44 | % | 707,062 | 29,376 | 4.15 | % | ||||||||||||||||||||||||
|
|
|
|
|
|
|
|
|
|
|
|
|
|||||||||||||||||||||||||
|
Total earning assets |
6,447,118 | 280,109 | 4.34 | % | 5,857,120 | 288,402 | 4.92 | % | 5,292,666 | 302,494 | 5.72 | % | ||||||||||||||||||||||||
|
|
|
|
|
|
|
|
|
|
|
|
|
|||||||||||||||||||||||||
|
Goodwill and intangibles |
145,623 | 158,636 | 158,896 | |||||||||||||||||||||||||||||||||
|
Non-earning assets |
330,075 | 291,284 | 240,367 | |||||||||||||||||||||||||||||||||
|
|
|
|
|
|
|
|||||||||||||||||||||||||||||||
|
Total assets |
$ | 6,922,816 | $ | 6,307,040 | $ | 5,691,929 | ||||||||||||||||||||||||||||||
|
|
|
|
|
|
|
|||||||||||||||||||||||||||||||
|
Liabilities |
||||||||||||||||||||||||||||||||||||
|
NOW accounts |
$ | 775,383 | $ | 1,906 | 0.25 | % | $ | 718,175 | $ | 2,545 | 0.35 | % | $ | 572,260 | $ | 2,275 | 0.40 | % | ||||||||||||||||||
|
Savings accounts |
387,921 | 511 | 0.13 | % | 345,297 | 725 | 0.21 | % | 303,794 | 947 | 0.31 | % | ||||||||||||||||||||||||
|
Money market deposit accounts |
875,127 | 3,667 | 0.42 | % | 848,495 | 6,975 | 0.82 | % | 768,939 | 8,436 | 1.10 | % | ||||||||||||||||||||||||
|
Certificate accounts |
1,085,293 | 16,332 | 1.50 | % | 1,082,428 | 21,016 | 1.94 | % | 960,403 | 24,719 | 2.57 | % | ||||||||||||||||||||||||
|
Wholesale deposits 4 |
622,808 | 2,853 | 0.46 | % | 533,476 | 4,337 | 0.81 | % | 133,083 | 2,052 | 1.54 | % | ||||||||||||||||||||||||
|
FHLB advances |
942,651 | 12,687 | 1.35 | % | 691,969 | 9,523 | 1.38 | % | 473,038 | 7,952 | 1.68 | % | ||||||||||||||||||||||||
|
Repurchase agreements, federal funds purchased and other borrowed funds |
418,626 | 6,538 | 1.56 | % | 407,516 | 8,513 | 2.09 | % | 995,006 | 10,786 | 1.08 | % | ||||||||||||||||||||||||
|
|
|
|
|
|
|
|
|
|
|
|
|
|||||||||||||||||||||||||
|
Total interest bearing liabilities |
5,107,809 | 44,494 | 0.87 | % | 4,627,356 | 53,634 | 1.16 | % | 4,206,523 | 57,167 | 1.36 | % | ||||||||||||||||||||||||
|
|
|
|
|
|
|
|||||||||||||||||||||||||||||||
|
Non-interest bearing deposits |
923,039 | 830,513 | 755,128 | |||||||||||||||||||||||||||||||||
|
Other liabilities |
34,343 | 31,675 | 38,356 | |||||||||||||||||||||||||||||||||
|
|
|
|
|
|
|
|||||||||||||||||||||||||||||||
|
Total liabilities |
6,065,191 | 5,489,544 | 5,000,007 | |||||||||||||||||||||||||||||||||
|
|
|
|
|
|
|
|||||||||||||||||||||||||||||||
|
Stockholders’ Equity |
||||||||||||||||||||||||||||||||||||
|
Common stock |
719 | 697 | 615 | |||||||||||||||||||||||||||||||||
|
Paid-in capital |
643,140 | 611,577 | 495,340 | |||||||||||||||||||||||||||||||||
|
Retained earnings |
195,301 | 196,785 | 193,973 | |||||||||||||||||||||||||||||||||
|
Accumulated other comprehensive income |
18,465 | 8,437 | 1,994 | |||||||||||||||||||||||||||||||||
|
|
|
|
|
|
|
|||||||||||||||||||||||||||||||
|
Total stockholders’ equity |
857,625 | 817,496 | 691,922 | |||||||||||||||||||||||||||||||||
|
|
|
|
|
|
|
|||||||||||||||||||||||||||||||
|
Total liabilities and stockholders’ equity |
$ | 6,922,816 | $ | 6,307,040 | $ | 5,691,929 | ||||||||||||||||||||||||||||||
|
|
|
|
|
|
|
|||||||||||||||||||||||||||||||
|
Net interest income |
$ | 235,615 | $ | 234,768 | $ | 245,327 | ||||||||||||||||||||||||||||||
|
|
|
|
|
|
|
|||||||||||||||||||||||||||||||
|
Net interest spread |
3.47 | % | 3.76 | % | 4.36 | % | ||||||||||||||||||||||||||||||
|
Net interest margin |
3.65 | % | 4.01 | % | 4.64 | % | ||||||||||||||||||||||||||||||
|
Net interest margin (tax-equivalent) |
3.89 | % | 4.21 | % | 4.82 | % | ||||||||||||||||||||||||||||||
| 1 |
Total loans are gross of the allowance for loan and lease losses, net of unearned income and include loans held for sale. Non-accrual loans were included in the average volume for the entire period. |
| 2 |
Excludes tax effect of $13,911,000, $10,338,000 and $9,827,000 on tax-exempt investment security income for the years ended December 31, 2011, 2010 and 2009 respectively. |
| 3 |
Excludes tax effect of $1,568,000, $1,503,000, and $0 on investment security tax credits for the years ended December 31, 2011, 2010 and 2009 respectively. |
| 4 |
Wholesale deposits include brokered deposits classified as NOW, money market deposit and certificate accounts, including reciprocal deposits. |
58
Table of Contents
Rate/Volume Analysis
Net interest income can be evaluated from the perspective of relative dollars of change in each period. Interest income and interest expense, which are the components of net interest income, are shown in the following table on the basis of the amount of any increases (or decreases) attributable to changes in the dollar levels of the Company’s interest earning assets and interest bearing liabilities (“Volume”) and the yields earned and rates paid on such assets and liabilities (“Rate”). The change in interest income and interest expense attributable to changes in both volume and rates has been allocated proportionately to the change due to volume and the change due to rate.
|
Years ended December 31,
2011 vs. 2010 Increase (Decrease) Due to: |
Years ended December 31,
2010 vs. 2009 Increase (Decrease) Due to: |
|||||||||||||||||||||||
|
(Dollars in thousands) |
Volume | Rate | Net | Volume | Rate | Net | ||||||||||||||||||
|
Interest income |
||||||||||||||||||||||||
|
Residential real estate loans |
$ | (11,198 | ) | $ | (1,143 | ) | $ | (12,341 | ) | $ | (3,764 | ) | $ | (5,333 | ) | $ | (9,097 | ) | ||||||
|
Commercial loans |
(10,077 | ) | (3,535 | ) | (13,612 | ) | (3,880 | ) | (3,839 | ) | (7,719 | ) | ||||||||||||
|
Consumer and other loans |
(290 | ) | (1,302 | ) | (1,592 | ) | (1,116 | ) | (1,598 | ) | (2,714 | ) | ||||||||||||
|
Investment securities |
29,553 | (10,301 | ) | 19,252 | 31,601 | (26,163 | ) | 5,438 | ||||||||||||||||
|
|
|
|
|
|
|
|
|
|
|
|
|
|||||||||||||
|
Total interest income |
7,988 | (16,281 | ) | (8,293 | ) | 22,841 | (36,933 | ) | (14,092 | ) | ||||||||||||||
|
Interest expense |
||||||||||||||||||||||||
|
NOW accounts |
203 | (842 | ) | (639 | ) | 580 | (310 | ) | 270 | |||||||||||||||
|
Savings accounts |
89 | (303 | ) | (214 | ) | 129 | (351 | ) | (222 | ) | ||||||||||||||
|
Money market deposit accounts |
219 | (3,527 | ) | (3,308 | ) | 873 | (2,333 | ) | (1,460 | ) | ||||||||||||||
|
Certificate accounts |
56 | (4,740 | ) | (4,684 | ) | 3,141 | (6,844 | ) | (3,703 | ) | ||||||||||||||
|
Wholesale deposits |
726 | (2,210 | ) | (1,484 | ) | 6,173 | (3,889 | ) | 2,284 | |||||||||||||||
|
FHLB advances |
3,450 | (286 | ) | 3,164 | 3,680 | (2,109 | ) | 1,571 | ||||||||||||||||
|
Repurchase agreements and other borrowed funds |
232 | (2,207 | ) | (1,975 | ) | (6,368 | ) | 4,095 | (2,273 | ) | ||||||||||||||
|
|
|
|
|
|
|
|
|
|
|
|
|
|||||||||||||
|
Total interest expense |
4,975 | (14,115 | ) | (9,140 | ) | 8,208 | (11,741 | ) | (3,533 | ) | ||||||||||||||
|
|
|
|
|
|
|
|
|
|
|
|
|
|||||||||||||
|
Net interest income |
$ | 3,013 | $ | (2,166 | ) | $ | 847 | $ | 14,633 | $ | (25,192 | ) | $ | (10,559 | ) | |||||||||
|
|
|
|
|
|
|
|
|
|
|
|
|
|||||||||||||
Net interest income decreased $10.6 million in 2010 over 2009. The decrease in net interest income was primarily due to lower yield and lower volume of loans which was partially offset by an increased volume of investment securities and net decrease in interest expense. Net interest income increased $847 thousand in 2011 over 2010. During 2011, the Company continued to purchase investment securities and reduce deposit rates to offset the lower volume of loans and maintain net interest income.
Effect of inflation and changing prices
Generally accepted accounting principles often require the measurement of financial position and operating results in terms of historical dollars, without consideration for change in relative purchasing power over time due to inflation. Virtually all assets of the Company and each bank subsidiary are monetary in nature; therefore, interest rates generally have a more significant impact on a company’s performance than does the effect of inflation.
Critical Accounting Policies
The preparation of consolidated financial statements in conformity with accounting principles generally accepted in the United States of America often requires management to use significant judgments as well as subjective and/or complex measurements in making estimates and assumptions that affect the reported amounts of assets, liabilities, income and expenses. The Company considers its accounting policies for the ALLL, goodwill, fair value measurements and determination of whether an investment security is temporarily or other-than-temporarily impaired to be critical accounting policies.
59
Table of Contents
Allowance for Loan and Lease Losses
For information regarding the ALLL, its relation to the provision for loan losses and risk related to asset quality, see the section captioned “Allowance for Loan and Lease Losses” included in “Item 7. Management’s Discussion and Analysis of Financial Condition and Results of Operations” and Notes 1 and 4 to the Consolidated Financial Statements in “Item 8. Financial Statements and Supplementary Data.”
Goodwill
The Company performed its annual goodwill impairment test during the third quarter of 2011. There were high levels of volatility and dislocation in bank stock prices nationwide during the third quarter of 2011, such that the Company’s stock was trading at prices that were below the Company’s book value per share for August and September. In addition, soft economic conditions continued in certain market areas of the Company. Due to such factors, as well as the Company’s internal evaluation process, the Company engaged an independent valuation firm to determine the implied fair value of Mountain West and 1st Bank. These two bank subsidiaries were selected because of Mountain West’s losses and decline in credit quality and 1st Bank’s significant amount of goodwill relative to its total assets. As part of step one of the goodwill impairment test, the independent valuation firm estimated the fair value of each of these bank subsidiaries using the quoted market prices of other publicly traded depository banks and thrifts, discounted cash flows and inputs from comparable acquisition transactions. Based on the estimated fair value, it was determined the valuation firm should proceed to step two of the goodwill impairment test whereby the firm valued the assets and liabilities of these banks and concluded that the implied fair value of goodwill was less than the current carrying value of goodwill for each of these two banks. As a result of the valuation, the Company recognized goodwill impairment charges of $23.2 million ($15.6 million after-tax) and $17.0 million at Mountain West and 1st Bank, respectively.
For the remaining eight bank subsidiaries each with goodwill, the Company determined an independent valuation was not necessary based on the Company’s analysis of each of the separate bank subsidiaries’ goodwill carrying value, earnings, capital and credit quality metrics as of September 30, 2011. For each of these bank subsidiaries, the Company performed the first step in evaluating goodwill for possible impairment utilizing data provided by the independent valuation firm. The Company determined an estimated fair value based on such data and applying premiums and discounts that took into account each of the individual bank subsidiaries’ earnings, capital and credit quality metrics as of September 30, 2011. In addition, the Company determined the Company’s estimated fair value and compared such value to the Company’s market capitalization at September 30, 2011 to calculate an implied control premium for the Company. The implied control premium was determined to be reasonable based upon estimated control premiums provided by an independent third party. Based on the results of these tests, the Company concluded it did not need to proceed to step two of the goodwill impairment testing process for any of the eight bank subsidiaries with goodwill. Based on such analysis, there was no goodwill impairment as of September 30, 2011 at any of the remaining eight bank subsidiaries each with goodwill. Since there were no events or circumstances that occurred during the fourth quarter of 2011 that would more-likely-than not reduce the fair value of a reporting unit below its carrying value, the Company did not perform interim testing at December 31, 2011. In addition, the Company’s stock price increased 28 percent from September 30, 2011 to $12.03 at December 31, 2011 which was above book value per share.
Significant judgment was applied in assessing goodwill for impairment and the Company believes the assumptions utilized were reasonable and appropriate. In addition, the Company continues to maintain $106 million in goodwill on its balance sheet and future adverse changes in the economic environment, operating results of the reporting units, or other factors could result in future goodwill impairment.
For additional information on goodwill, see Notes 1 and 6 to the Consolidated Financial Statements in “Item 8. Financial Statements and Supplementary Data.”
60
Table of Contents
Fair Value Measurements
Fair value is defined as the price that would be received to sell an asset or paid to transfer a liability in an orderly transaction between market participants at the measurement date. There is a fair value hierarchy which requires an entity to maximize the use of observable inputs and minimize the use of unobservable inputs when measuring fair value. The three levels of inputs that may be used to measure fair value are as follows:
|
Level 1 |
Quoted prices in active markets for identical assets or liabilities | |
|
Level 2 |
Observable inputs other than Level 1 prices, such as quoted prices for similar assets or liabilities; quoted prices in markets that are not active; or other inputs that are observable or can be corroborated by observable market data for substantially the full term of the assets or liabilities | |
|
Level 3 |
Unobservable inputs that are supported by little or no market activity and that are significant to the fair value of the assets or liabilities | |
On a recurring basis, the Company measures investment securities and interest rate swap agreements at fair value. The fair value of such investment securities is estimated by obtaining quoted market prices for identical assets, where available. If such prices are not available, fair value is based on independent asset pricing services and models, the inputs of which are market-based or independently sourced market parameters, including, but not limited to, yield curves, interest rates, volatilities, prepayments, defaults, cumulative loss projections, and cash flows. For those securities where greater reliance on unobservable inputs occurs, such securities are classified as Level 3 within the hierarchy.
In performing due diligence reviews of the independent asset pricing services and models for investment securities, the Company reviewed the vendors’ inputs for fair value estimates and the recommended assignments of levels within the fair value hierarchy. The Company’s review included the extent to which markets for investment securities were determined to have limited or no activity, or were judged to be active markets. The Company reviewed the extent to which observable and unobservable inputs were used as well as the appropriateness of the underlying assumptions about risk that a market participant would use in active markets, with adjustments for limited or inactive markets. In considering the inputs to the fair value estimates, the Company placed less reliance on quotes that were judged to not reflect orderly transactions, or were non-binding indications. The Company made independent inquires of other knowledgeable parties in testing the reliability of the inputs, including consideration for illiquidity, credit risk, and cash flow estimates. In assessing credit risk, the Company reviewed payment performance, collateral adequacy, credit rating histories, and issuers’ financial statements with follow-up discussion with issuers. For those markets determined to be inactive, the valuation techniques used were models for which management verified that discount rates were appropriately adjusted to reflect illiquidity and credit risk. The Company independently obtained cash flow estimates that were stressed at levels that exceeded those used by independent third party pricing vendors. Based on the Company’s due diligence review, investment securities are placed in the appropriate hierarchy levels.
The fair value of interest rate swap derivative agreements are obtained from an independent party and based upon the estimated amounts to settle the contracts considering current interest rates and are calculated using discounted cash flows. The inputs used to determine fair value include the 3 month Libor forward curve to estimate variable rate cash inflows and the spot Libor curve to estimate the discount rate. The estimated variable rate cash inflows are compared to the fixed rate outflows and such difference is discounted to a present value to estimate the fair value of the interest rate swaps. In performing due diligence of the estimated fair value, the Company obtained and compares the pricing from a secondary independent party. These inputs are classified within Level 2 of the fair value hierarchy.
On a non-recurring basis, the Company measures OREO, collateral-dependent impaired loans, net of ALLL, and goodwill at fair value. OREO is carried at the lower of fair value at acquisition date or current estimated fair value, less estimated cost to sell. Estimated fair value of OREO is based on appraisals or evaluations. OREO is classified within Level 3 of the fair value hierarchy.
Collateral-dependent impaired loans, net of ALLL, are loans for which it is probable that the Company will not collect all principal and interest due according to contractual terms and are considered impaired. The estimated fair value of collateral-dependent impaired loans is based on the appraised fair value of the collateral, less estimated cost to sell. Collateral-dependent impaired loans are classified within Level 3 of the fair value hierarchy. The Company reviews appraisals for OREO and collateral-dependent loans, giving consideration to the highest and best use of the collateral. The Company considers the appraisal or evaluation as the starting point for determining fair value and the Company also considers other factors and events in the environment that may affect the fair value. The appraised values are reduced by discounts to consider lack of marketability and estimated cost to sell.
61
Table of Contents
Goodwill is evaluated for impairment at the bank subsidiary level at least annually. As a result of a goodwill impairment assessment performed by an independent valuation firm for two of the Company’s bank subsidiaries, Mountain West and 1st Bank, a goodwill impairment charge was recorded during the third quarter of 2011. The key inputs used to determine the implied fair value of such bank subsidiaries and the corresponding amount of the impairment charge included quoted market prices of other publically traded depository banks and thrifts, discounted cash flows and inputs from comparable transactions. Based on the estimated fair value of the two banks, the firm valued the assets and liabilities of these banks and concluded there was goodwill impairment. Key inputs used in valuing the assets included estimated current interest rates for loans, loan discount rates, loan prepayment speeds and credit risk factors for loans. Key inputs used in valuing the liabilities included estimated current interest rates for borrowings, current interest rates for deposits and core deposit operating expenses, income and decay rates. For the remaining bank subsidiaries, the Company utilized the data provided by the independent valuation firm and estimated a fair value based on such data and applied premiums and discounts that took into account the individual bank subsidiaires’ earnings capital and credit quality metrics. These inputs are classified within Level 3 of the fair value hierarchy.
For additional information on fair value measurements, see Note 20 to the Consolidated Financial Statements in “Item 8. Financial Statements and Supplementary Data.”
Other-Than-Temporary Impairment on Securities
The Company assesses individual securities in its investment securities portfolio for impairment at least on a quarterly basis, and more frequently when economic or market conditions warrant. An investment is impaired if the fair value of the security is less than its carrying value at the financial statement date. If impairment is determined to be other-than-temporary, an impairment loss is recognized by reducing the amortized cost for the credit loss portion of the impairment with a corresponding charge to earnings for a like amount.
For fair value estimates provided by third party vendors, management also considered the models and methodology for appropriate consideration of both observable and unobservable inputs, including appropriately adjusted discount rates and credit spreads for securities with limited or inactive markets, and whether the quoted prices reflect orderly transactions. For certain securities, the Company obtained independent estimates of inputs, including cash flows, in supplement to third party vendor provided information. The Company also reviewed financial statements of select issuers, with follow up discussions with issuers’ management for clarification and verification of information relevant to the Company’s impairment analysis.
In evaluating impaired securities for other-than-temporary impairment losses, management considers 1) the severity and duration of the impairment, 2) the credit ratings of the security, 3) the overall deal structure, including the Company’s position within the structure, the overall and near term financial performance of the issuer and underlying collateral, delinquencies, defaults, loss severities, recoveries, prepayments, cumulative loss projections, discounted cash flows and fair value estimates.
For additional information regarding the accounting policy and analysis of other-than-temporary impairment on securities, see the section captioned “Investment Activity” included in “Item 7. Management’s Discussion and Analysis of Financial Condition and Results of Operations and Note 1 to the Consolidated Financial Statements in “Item 8. Financial Statements and Supplementary Data.”
Impact of Recently Issued Accounting Standards
New authoritative accounting guidance that has either been issued or is effective during 2011 and may possibly have a material impact on the Company includes amendments to: FASB Accounting Standards Codification TM (“ASC”) Topic 220, Comprehensive Income , FASB ASC Topic 310, Receivables , FASB ASC Topic 350, Intangibles – Goodwill and Other , FASB ASC Topic 805, Business Combinations and FASB ASC Topic 820, Fair Value Measurements and Disclosures . For additional information on the topics and the impact on the Company see Note 1 to the Consolidated Financial Statements in “Item 8. Financial Statements and Supplementary Data.”
62
Table of Contents
| Item 7A. | Quantitative and Qualitative Disclosures about Market Risk |
The disclosures set forth in this item are qualified by the section captioned “Forward-Looking Statements” included in “Item 7. Management’s Discussion and Analysis of Financial Condition and Results of Operations.”
Market Risk
Market risk is the risk of loss in a financial instrument arising from adverse changes in market rates/prices such as interest rates, foreign currency exchange rates, commodity prices, and equity prices. The Company’s primary market risk exposure is interest rate risk. The ongoing monitoring and management of this risk is an important component of the Company’s asset/liability management process which is governed by policies established by its Board of Directors that are reviewed and approved annually. The Board of Directors delegates responsibility for carrying out the asset/liability management policies to each bank subsidiary and Parent ALCO. In this capacity, ALCO develops guidelines and strategies impacting the Company’s asset/liability management related activities based upon estimated market risk sensitivity, policy limits and overall market interest rate levels and trends.
Interest Rate Risk
The objective of interest rate risk management is to contain the risks associated with interest rate fluctuations. The process involves identification and management of the sensitivity of net interest income to changing interest rates. Managing interest rate risk is not an exact science. The interval between repricing of interest rates of assets and liabilities changes from day to day as the assets and liabilities change. For some assets and liabilities, contractual maturity and the actual cash flows experienced are not the same. A good example is residential mortgages that have long-term contractual maturities but may be repaid well in advance of the maturity when current prevailing interest rates become lower than the contractual rate. Interest bearing deposits without a stated maturity could be withdrawn upon demand. However, the Banks’ experience indicates that these funding pools have a much longer duration and are not as sensitive to interest rate changes as other financial instruments. Prime based loans generally have rate changes when the FRB changes short-term interest rates. However, depending on the magnitude of the rate change and the relationship of the current rates to rate floors and rate ceilings that may be in place on the loans, the loan rate may not change.
For asset and liability management purposes, the Company has entered into forecasted interest rate swap agreements to hedge various interest rate exposures. At December 31, 2011, the Company had interest rate swap agreements to receive from the counterparty at 3 month LIBOR and to pay interest to the counterparty at a fixed rate of 3.378 percent on a notional amount of $160 million. The effective date of the transaction was October 21, 2011 and the maturity date is October 21, 2021, with cash flows being exchanged for the last seven years of the transaction.
GAP analysis
The GAP table below estimates the repricing and maturities of the contractual characteristics of the assets and liabilities, based upon the Company’s assessment of the repricing characteristics of the various instruments. Interest bearing checking and regular savings are included in the categories that reflect the interest rate sensitivity of the individual programs and if the deposits are not clearly rate sensitive, the deposits are included in the more than 5 years category. Money market balances are included in the less than 6 months category. Residential mortgage-backed securities are categorized based on the anticipated payments. The following table gives a description of our GAP position for various time periods. As of December 31, 2011, the Company had a negative GAP position at six months and a negative GAP position at twelve months. The cumulative GAP as a percentage of total assets for six months is a negative 13.54 percent which compares to a negative 17.77 percent at December 31, 2010 and a negative 14.05 percent at December 31, 2009.
63
Table of Contents
| Projected Maturity or Repricing | ||||||||||||||||||||
|
(Dollars in thousands) |
0-6
Months |
6-12
Months |
1 - 5
Years |
More than
5 Years |
Total | |||||||||||||||
|
Assets |
||||||||||||||||||||
|
Interest bearing deposits and federal funds sold |
$ | 22,497 | — | 104 | 757 | 23,358 | ||||||||||||||
|
Investment securities |
38,979 | 20,569 | 374,396 | 729,677 | 1,163,621 | |||||||||||||||
|
Residential mortgage-backed securities |
821,642 | 523,567 | 596,579 | 21,334 | 1,963,122 | |||||||||||||||
|
FHLB stock |
— | — | 49,088 | — | 49,088 | |||||||||||||||
|
Variable rate loans |
987,249 | 253,887 | 911,698 | 132,198 | 2,285,032 | |||||||||||||||
|
Fixed rate loans |
283,677 | 181,523 | 564,986 | 150,917 | 1,181,103 | |||||||||||||||
|
|
|
|
|
|
|
|
|
|
|
|||||||||||
|
Total interest bearing assets |
$ | 2,154,044 | 979,546 | 2,496,851 | 1,034,883 | 6,665,324 | ||||||||||||||
|
|
|
|
|
|
|
|
|
|
|
|||||||||||
|
Liabilities |
||||||||||||||||||||
|
Interest bearing deposits |
2,045,835 | 393,794 | 325,427 | 1,045,258 | 3,810,314 | |||||||||||||||
|
FHLB advances |
752,000 | 40,000 | 120,000 | 157,046 | 1,069,046 | |||||||||||||||
|
Repurchase agreements and other borrowed funds |
258,855 | 212 | 1,462 | 8,880 | 269,409 | |||||||||||||||
|
Subordinated debentures |
— | — | — | 125,275 | 125,275 | |||||||||||||||
|
|
|
|
|
|
|
|
|
|
|
|||||||||||
|
Total interest bearing liabilities |
$ | 3,056,690 | 434,006 | 446,889 | 1,336,459 | 5,274,044 | ||||||||||||||
|
|
|
|
|
|
|
|
|
|
|
|||||||||||
|
Repricing GAP |
$ | (902,646 | ) | 545,540 | 2,049,962 | (301,576 | ) | 1,391,280 | ||||||||||||
|
Cumulative repricing GAP |
$ | (902,646 | ) | (357,106 | ) | 1,692,856 | 1,391,280 | |||||||||||||
|
Cumulative GAP as a % of interest bearing assets |
-13.54 | % | -5.36 | % | 25.40 | % | 20.87 | % | ||||||||||||
Net interest income simulation
The traditional one-dimensional view of GAP is not sufficient to show a bank’s ability to withstand interest rate changes. Because of limitations in GAP modeling the ALCO of the Company uses a detailed and dynamic simulation model to quantify the estimated exposure of net interest income (“NII”) to sustained interest rate changes. While ALCO routinely monitors simulated NII sensitivity over rolling two-year and five-year horizons, it also utilizes additional tools to monitor potential longer-term interest rate risk. The simulation model captures the impact of changing interest rates on the interest income received and interest expense paid on all assets and liabilities reflected on the Company’s statement of financial condition. This sensitivity analysis is compared to ALCO policy limits which specify a maximum tolerance level for NII exposure over a one year and two year horizon, assuming no balance sheet growth. The ALCO policy rate scenarios include upward and downward shift in interest rates for a 200 basis point (“bp”), 400bp, and 300bp scenario. The 200bp and 400bp rate scenarios include parallel and pro rata shifts in interest rates over a 12-month period and 24 month period, respectively. The 300bp rate scenario is a shock scenario with instantaneous and parallel changes in interest rates. Given the historically low rate environment, a downward shift in interest rates of only 100bp is modeled. Since the model assumes that interest rates will not be negative, the 100bp scenario represents a flattening of market yield curves. Other non-parallel rate movement scenarios are also modeled to determine the potential impact on net interest income. The following is indicative of the Company’s overall NII sensitivity analysis as of December 31, 2011 and 2010 as compared to the policy limits approved by the Company’s and Banks’ Board of Directors. The Bank’s interest sensitivity remained within policy limits at December 31, 2011.
| Year 1 | Year 2 | |||||||||||||||
|
Rate Scenarios |
Policy
Limits |
Estimated
Sensitivity |
Policy
Limits |
Estimated
Sensitivity |
||||||||||||
|
-100 bp |
N/A | -0.3 | % | N/A | -4.3 | % | ||||||||||
|
+200 bp |
-10.0 | % | -4.5 | % | -15.0 | % | -5.9 | % | ||||||||
|
+400 bp |
-10.0 | % | -4.6 | % | -25.0 | % | -12.3 | % | ||||||||
|
+300 bp |
-20.0 | % | -12.2 | % | -20.0 | % | -4.6 | % | ||||||||
64
Table of Contents
The preceding sensitivity analysis does not represent a forecast and should not be relied upon as being indicative of expected operating results. These hypothetical estimates are based upon numerous assumptions including: the nature and timing of interest rate levels including yield curve shape, prepayments on loans and securities, deposit decay rates, pricing decisions on loans and deposits, reinvestment/replacement of assets and liability cash flows, and others. While assumptions are developed based upon current economic and local market conditions, the Company cannot make any assurances as to the predictive nature of these assumptions including how customer preferences or competitor influences might change. Also, as market conditions vary from those assumed in the sensitivity analysis, actual results will also differ due to prepayment/refinancing levels likely deviating from those assumed, the varying impact of interest rate change caps or floors on adjustable rate assets, the potential effect of changing debt service levels on customers with adjustable rate loans, depositor early withdrawals and product preference changes, and other internal and external variables. Furthermore, the sensitivity analysis does not reflect actions that ALCO might take in responding to or anticipating changes in interest rates.
Economic value of equity
In addition to the GAP and NII analyses, the Company calculates the economic value of equity (“EVE”) which focuses on longer term interest rate risk. The EVE process models the cash flow of financial instruments to maturity and then discounts those cashflows based on prevailing interest rates in order to develop a baseline EVE. The interest rates used in the model are then shocked for an immediate increase and decrease in interest rates. The results for the shocked model are compared to the baseline results to determine the percentage change in EVE under the various scenarios. The resulting percentage change in the EVE is an indication of the longer term re-pricing risk and option risks embedded in the balance sheet. The measure is not designed to estimate the Company’s capital levels, such as tangible, regulatory, or market capitalization. The following reflects the Company’s EVE maximum sensitivity policy limits and EVE analysis as of December 31, 2011:
|
Rate Shocks |
Policy
Limits |
Post
Shock Ratio |
||||||
|
-100 bp |
15 | % | -5.1 | % | ||||
|
+100 bp |
15 | % | -1.6 | % | ||||
|
+200 bp |
25 | % | -5.9 | % | ||||
|
+300 bp |
35 | % | -12.1 | % | ||||
| Item 8. | Financial Statements and Supplementary Data |
65
Table of Contents
Report of Independent Registered Public Accounting Firm
Audit Committee, Board of Directors and Stockholders
Glacier Bancorp, Inc.
Kalispell, Montana
We have audited the accompanying consolidated statements of financial condition of Glacier Bancorp, Inc. as of December 31, 2011 and 2010, and the related consolidated statements of operations, stockholders’ equity and comprehensive income and cash flows for each of the years in the three-year period ended December 31, 2011. The Company’s management is responsible for these financial statements. Our responsibility is to express an opinion on these financial statements based on our audits.
We conducted our audits in accordance with the standards of the Public Company Accounting Oversight Board (United States). Those standards require that we plan and perform the audits to obtain reasonable assurance about whether the financial statements are free of material misstatement. Our audits included examining, on a test basis, evidence supporting the amounts and disclosures in the financial statements, assessing the accounting principles used and significant estimates made by management and evaluating the overall financial statement presentation. We believe that our audits provide a reasonable basis for our opinion.
In our opinion, the consolidated financial statements referred to above present fairly, in all material respects, the financial position of Glacier Bancorp, Inc. as of December 31, 2011 and 2010, and the results of its operations and its cash flows for each of the years in the three-year period ended December 31, 2011, in conformity with accounting principles generally accepted in the Unites States of America.
We also have audited, in accordance with the standards of the Public Company Accounting Oversight Board (United States), Glacier Bancorp, Inc.’s internal control over financial reporting as of December 31, 2011, based on criteria established in Internal Control-Integrated Framework issued by the Committee of Sponsoring Organizations of the Treadway Commission (COSO) and our report dated February 28, 2012, expressed an unqualified opinion on the effectiveness of the Company’s internal control over financial reporting.
/s/ BKD, LLP
Denver, Colorado
February 28, 2012
66
Table of Contents
Report of Independent Registered Public Accounting Firm
Audit Committee, Board of Directors and Stockholders
Glacier Bancorp, Inc.
Kalispell, Montana
We have audited Glacier Bancorp, Inc.’s internal control over financial reporting as of December 31, 2011, based on criteria established in Internal Control – Integrated Framework issued by the Committee of Sponsoring Organizations of the Treadway Commission (COSO). The Company’s management is responsible for maintaining effective internal control over financial reporting and for its assessment of the effectiveness of internal control over financial reporting, included in the accompanying Report of Management. Our responsibility is to express an opinion on the Company’s internal control over financial reporting based on our audit.
We conducted our audit in accordance with the standards of the Public Company Accounting Oversight Board (United States). Those standards require that we plan and perform the audit to obtain reasonable assurance about whether effective internal control over financial reporting was maintained in all material respects. Our audit included obtaining an understanding of internal control over financial reporting, assessing the risk that a material weakness exists and testing and evaluating the design and operating effectiveness of internal control based on the assessed risk. Our audit also included performing such other procedures as we considered necessary in the circumstances. We believe that our audit provides a reasonable basis for our opinion.
A company’s internal control over financial reporting is a process designed to provide reasonable assurance regarding the reliability of financial reporting and the preparation of reliable financial statements in accordance with accounting principles generally accepted in the United States of America. Because management’s assessment and our audit were conducted to meet the reporting requirements of Section 112 of the Federal Deposit Insurance Corporation Improvement Act (FDICIA), our examination of Glacier Bancorp, Inc.’s internal control over financial reporting included controls over the preparation of financial statements in accordance with accounting principles generally accepted in the United States of America and with the instructions to the Consolidated Financial Statements for Bank Holding Companies (Form FR Y-9C). A company’s internal control over financial reporting includes those policies and procedures that (1) pertain to the maintenance of records that, in reasonable detail, accurately and fairly reflect the transactions and dispositions of the assets of the company; (2) provide reasonable assurance that transactions are recorded as necessary to permit preparation of financial statements in accordance with accounting principles generally accepted in the United States of America, and that receipts and expenditures of the company are being made only in accordance with authorizations of management and directors of the company; and (3) provide reasonable assurance regarding prevention, or timely detection and correction of unauthorized acquisition, use, or disposition of the company’s assets that could have a material effect on the financial statements.
67
Table of Contents
Because of its inherent limitations, internal control over financial reporting may not prevent or detect misstatements. Also, projections of any evaluation of effectiveness to future periods are subject to the risk that controls may become inadequate because of changes in conditions or that the degree of compliance with the policies or procedures may deteriorate.
In our opinion, Glacier Bancorp, Inc. maintained, in all material respects, effective internal control over financial reporting as of December 31, 2011, based on criteria established in Internal Control – Integrated Framework issued by the Committee of Sponsoring Organizations of the Treadway Commission (COSO).
We have also audited, in accordance with the standards of the Public Company Accounting Oversight Board (United States), the consolidated financial statements of Glacier Bancorp, Inc. and our report dated February 28, 2012, expressed an unqualified opinion thereon.
/s/ BKD, LLP
Denver, Colorado
February 28, 2012
68
Table of Contents
Glacier Bancorp, Inc.
| December 31, | ||||||||
|
(Dollars in thousands, except per share data) |
2011 | 2010 | ||||||
|
Assets |
||||||||
|
Cash on hand and in banks |
$ | 104,674 | 71,465 | |||||
|
Interest bearing cash deposits |
23,358 | 33,626 | ||||||
|
|
|
|
|
|||||
|
Cash and cash equivalents |
128,032 | 105,091 | ||||||
|
Investment securities, available-for-sale |
3,126,743 | 2,395,847 | ||||||
|
Loans held for sale |
95,457 | 76,213 | ||||||
|
Loans receivable |
3,466,135 | 3,749,289 | ||||||
|
Allowance for loan and lease losses |
(137,516 | ) | (137,107 | ) | ||||
|
|
|
|
|
|||||
|
Loans receivable, net |
3,328,619 | 3,612,182 | ||||||
|
Premises and equipment, net |
158,872 | 152,492 | ||||||
|
Other real estate owned |
78,354 | 73,485 | ||||||
|
Accrued interest receivable |
34,961 | 30,246 | ||||||
|
Deferred tax asset |
31,081 | 40,284 | ||||||
|
Core deposit intangible, net |
8,284 | 10,757 | ||||||
|
Goodwill |
106,100 | 146,259 | ||||||
|
Non-marketable equity securities |
49,694 | 65,040 | ||||||
|
Other assets |
41,709 | 51,391 | ||||||
|
|
|
|
|
|||||
|
Total assets |
$ | 7,187,906 | 6,759,287 | |||||
|
|
|
|
|
|||||
|
Liabilities |
||||||||
|
Non-interest bearing deposits |
$ | 1,010,899 | 855,829 | |||||
|
Interest bearing deposits |
3,810,314 | 3,666,073 | ||||||
|
Securities sold under agreements to repurchase |
258,643 | 249,403 | ||||||
|
Federal Home Loan Bank advances |
1,069,046 | 965,141 | ||||||
|
Other borrowed funds |
9,995 | 20,005 | ||||||
|
Subordinated debentures |
125,275 | 125,132 | ||||||
|
Accrued interest payable |
5,825 | 7,245 | ||||||
|
Other liabilities |
47,682 | 32,255 | ||||||
|
|
|
|
|
|||||
|
Total liabilities |
6,337,679 | 5,921,083 | ||||||
|
|
|
|
|
|||||
|
Stockholders’ Equity |
||||||||
|
Preferred shares, $0.01 par value per share, 1,000,000 shares authorized, none issued or outstanding |
— | — | ||||||
|
Common stock, $0.01 par value per share, 117,187,500 shares authorized |
719 | 719 | ||||||
|
Paid-in capital |
642,882 | 643,894 | ||||||
|
Retained earnings - substantially restricted |
173,139 | 193,063 | ||||||
|
Accumulated other comprehensive income |
33,487 | 528 | ||||||
|
|
|
|
|
|||||
|
Total stockholders’ equity |
850,227 | 838,204 | ||||||
|
|
|
|
|
|||||
|
Total liabilities and stockholders’ equity |
$ | 7,187,906 | 6,759,287 | |||||
|
|
|
|
|
|||||
|
Number of common stock shares issued and outstanding |
71,915,073 | 71,915,073 | ||||||
See accompanying notes to consolidated financial statements.
69
Table of Contents
Glacier Bancorp, Inc.
| Years ended December 31, | ||||||||||||
|
(Dollars in thousands, except per share data) |
2011 | 2010 | 2009 | |||||||||
|
Interest Income |
||||||||||||
|
Residential real estate loans |
$ | 33,060 | 45,401 | 54,498 | ||||||||
|
Commercial loans |
130,249 | 143,861 | 151,580 | |||||||||
|
Consumer and other loans |
40,538 | 42,130 | 44,844 | |||||||||
|
Investment securities |
76,262 | 57,010 | 51,572 | |||||||||
|
|
|
|
|
|
|
|||||||
|
Total interest income |
280,109 | 288,402 | 302,494 | |||||||||
|
|
|
|
|
|
|
|||||||
|
Interest Expense |
||||||||||||
|
Deposits |
25,269 | 35,598 | 38,429 | |||||||||
|
Securities sold under agreements to repurchase |
1,353 | 1,607 | 2,007 | |||||||||
|
Federal Home Loan Bank advances |
12,687 | 9,523 | 7,952 | |||||||||
|
Federal funds purchased and other borrowed funds |
224 | 284 | 1,961 | |||||||||
|
Subordinated debentures |
4,961 | 6,622 | 6,818 | |||||||||
|
|
|
|
|
|
|
|||||||
|
Total interest expense |
44,494 | 53,634 | 57,167 | |||||||||
|
|
|
|
|
|
|
|||||||
|
Net Interest Income |
235,615 | 234,768 | 245,327 | |||||||||
|
Provision for loan losses |
64,500 | 84,693 | 124,618 | |||||||||
|
|
|
|
|
|
|
|||||||
|
Net interest income after provision for loan losses |
171,115 | 150,075 | 120,709 | |||||||||
|
|
|
|
|
|
|
|||||||
|
Non-Interest Income |
||||||||||||
|
Service charges and other fees |
44,194 | 43,040 | 40,465 | |||||||||
|
Miscellaneous loan fees and charges |
3,919 | 4,906 | 5,406 | |||||||||
|
Gain on sale of loans |
21,132 | 27,233 | 26,923 | |||||||||
|
Gain on sale of investments |
346 | 4,822 | 5,995 | |||||||||
|
Other income |
8,608 | 7,545 | 7,685 | |||||||||
|
|
|
|
|
|
|
|||||||
|
Total non-interest income |
78,199 | 87,546 | 86,474 | |||||||||
|
|
|
|
|
|
|
|||||||
|
Non-Interest Expense |
||||||||||||
|
Compensation, employee benefits and related expense |
85,691 | 87,728 | 84,965 | |||||||||
|
Occupancy and equipment expense |
23,599 | 24,261 | 23,471 | |||||||||
|
Advertising and promotions |
6,469 | 6,831 | 6,477 | |||||||||
|
Outsourced data processing expense |
3,153 | 3,057 | 3,031 | |||||||||
|
Other real estate owned expense |
27,255 | 22,193 | 9,092 | |||||||||
|
Federal Deposit Insurance Corporation premiums |
8,169 | 9,121 | 8,639 | |||||||||
|
Core deposit intangibles amortization |
2,473 | 3,180 | 3,116 | |||||||||
|
Goodwill impairment charge |
40,159 | — | — | |||||||||
|
Other expense |
35,156 | 31,577 | 30,027 | |||||||||
|
|
|
|
|
|
|
|||||||
|
Total non-interest expense |
232,124 | 187,948 | 168,818 | |||||||||
|
|
|
|
|
|
|
|||||||
|
Income Before Income Taxes |
17,190 | 49,673 | 38,365 | |||||||||
|
Federal and state income tax (benefit) expense |
(281 | ) | 7,343 | 3,991 | ||||||||
|
|
|
|
|
|
|
|||||||
|
Net Income |
$ | 17,471 | 42,330 | 34,374 | ||||||||
|
|
|
|
|
|
|
|||||||
|
Basic earnings per share |
$ | 0.24 | 0.61 | 0.56 | ||||||||
|
Diluted earnings per share |
$ | 0.24 | 0.61 | 0.56 | ||||||||
|
Dividends declared per share |
$ | 0.52 | 0.52 | 0.52 | ||||||||
|
Average outstanding shares - basic |
71,915,073 | 69,657,980 | 61,529,944 | |||||||||
|
Average outstanding shares - diluted |
71,915,073 | 69,660,345 | 61,531,640 | |||||||||
See accompanying notes to consolidated financial statements.
70
Table of Contents
Glacier Bancorp, Inc.
Consolidated Statements of Stockholders’ Equity
and Comprehensive Income
Years ended December 31, 2011, 2010 and 2009
| Common Stock | Paid-in |
Retained
Earnings Substantially |
Accumulated
Other Comprehensive |
Total
Stockholders’ |
||||||||||||||||||||
|
(Dollars in thousands, except per share data) |
Shares | Amount | Capital | Restricted | (Loss) Income | Equity | ||||||||||||||||||
|
Balance at December 31, 2008 |
61,331,273 | $ | 613 | 491,794 | 185,776 | (1,243 | ) | 676,940 | ||||||||||||||||
|
Comprehensive income: |
||||||||||||||||||||||||
|
Net income |
— | — | — | 34,374 | — | 34,374 | ||||||||||||||||||
|
Unrealized gain on securities, net of reclassification adjustment and taxes |
— | — | — | — | 895 | 895 | ||||||||||||||||||
|
|
|
|||||||||||||||||||||||
|
Total comprehensive income |
35,269 | |||||||||||||||||||||||
|
|
|
|||||||||||||||||||||||
|
Cash dividends declared ($0.52 per share) |
— | — | — | (32,021 | ) | — | (32,021 | ) | ||||||||||||||||
|
Stock options exercised |
188,535 | 2 | 2,552 | — | — | 2,554 | ||||||||||||||||||
|
Stock issued in connection with acquisition |
99,995 | 1 | 1,419 | — | — | 1,420 | ||||||||||||||||||
|
Stock based compensation and related taxes |
— | — | 1,728 | — | — | 1,728 | ||||||||||||||||||
|
|
|
|
|
|
|
|
|
|
|
|
|
|||||||||||||
|
Balance at December 31, 2009 |
61,619,803 | $ | 616 | 497,493 | 188,129 | (348 | ) | 685,890 | ||||||||||||||||
|
Comprehensive income: |
||||||||||||||||||||||||
|
Net income |
— | — | — | 42,330 | — | 42,330 | ||||||||||||||||||
|
Unrealized gain on securities, net of reclassification adjustment and taxes |
— | — | — | — | 876 | 876 | ||||||||||||||||||
|
|
|
|||||||||||||||||||||||
|
Total comprehensive income |
43,206 | |||||||||||||||||||||||
|
|
|
|||||||||||||||||||||||
|
Cash dividends declared ($0.52 per share) |
— | — | — | (37,396 | ) | — | (37,396 | ) | ||||||||||||||||
|
Stock options exercised |
3,805 | — | 58 | — | — | 58 | ||||||||||||||||||
|
Public offering of stock issued |
10,291,465 | 103 | 145,493 | — | — | 145,596 | ||||||||||||||||||
|
Stock based compensation and related taxes |
— | — | 850 | — | — | 850 | ||||||||||||||||||
|
|
|
|
|
|
|
|
|
|
|
|
|
|||||||||||||
|
Balance at December 31, 2010 |
71,915,073 | $ | 719 | 643,894 | 193,063 | 528 | 838,204 | |||||||||||||||||
|
Comprehensive income: |
||||||||||||||||||||||||
|
Net income |
— | — | — | 17,471 | — | 17,471 | ||||||||||||||||||
|
Unrealized gain on securities, net of reclassification adjustment and taxes |
— | — | — | — | 38,400 | 38,400 | ||||||||||||||||||
|
Change in fair value of derivatives used for cash flow hedges, net of taxes |
— | — | — | — | (5,441 | ) | (5,441 | ) | ||||||||||||||||
|
|
|
|||||||||||||||||||||||
|
Total comprehensive income |
50,430 | |||||||||||||||||||||||
|
|
|
|||||||||||||||||||||||
|
Cash dividends declared ($0.52 per share) |
— | — | — | (37,395 | ) | — | (37,395 | ) | ||||||||||||||||
|
Stock based compensation and related taxes |
— | — | (1,012 | ) | — | — | (1,012 | ) | ||||||||||||||||
|
|
|
|
|
|
|
|
|
|
|
|
|
|||||||||||||
|
Balance at December 31, 2011 |
71,915,073 | $ | 719 | 642,882 | 173,139 | 33,487 | 850,227 | |||||||||||||||||
|
|
|
|
|
|
|
|
|
|
|
|
|
|||||||||||||
See accompanying notes to consolidated financial statements.
71
Table of Contents
Glacier Bancorp, Inc.
| Years ended December 31 | ||||||||||||
|
(Dollars in thousands) |
2011 | 2010 | 2009 | |||||||||
|
Operating Activities |
||||||||||||
|
Net income |
$ | 17,471 | 42,330 | 34,374 | ||||||||
|
Adjustments to reconcile net income to netcash provided by operating activities: |
||||||||||||
|
Provision for loan losses |
64,500 | 84,693 | 124,618 | |||||||||
|
Net amortization of investment securities premiums and discounts |
38,035 | 17,782 | (73 | ) | ||||||||
|
Federal Home Loan Bank stock dividends |
(17 | ) | (23 | ) | (16 | ) | ||||||
|
Mortgage loans held for sale originated or acquired |
(824,089 | ) | (1,086,089 | ) | (1,239,862 | ) | ||||||
|
Proceeds from sales of mortgage loans held for sale |
842,337 | 1,129,592 | 1,255,432 | |||||||||
|
Gain on sale of loans |
(21,132 | ) | (27,233 | ) | (26,923 | ) | ||||||
|
Gain on sale of investments |
(346 | ) | (4,822 | ) | (5,995 | ) | ||||||
|
Bargain purchase gain |
— | — | (3,482 | ) | ||||||||
|
Stock compensation expense, net of tax benefits |
45 | 932 | 1,863 | |||||||||
|
Excess deficiencies (benefits) related to the exercise of stock options |
— | 4 | (75 | ) | ||||||||
|
Depreciation of premises and equipment |
10,443 | 10,808 | 10,450 | |||||||||
|
Loss on sale of other real estate owned and write down |
19,727 | 15,937 | 5,676 | |||||||||
|
Amortization of core deposit intangibles |
2,473 | 3,180 | 3,116 | |||||||||
|
Goodwill impairment charge |
40,159 | — | — | |||||||||
|
Deferred tax (benefit) expense |
(13,308 | ) | 138 | (29,755 | ) | |||||||
|
Net (increase) decrease in accrued interest receivable |
(4,715 | ) | (517 | ) | 1,312 | |||||||
|
Net decrease (increase) in other assets |
12,464 | 6,878 | (29,895 | ) | ||||||||
|
Net decrease in accrued interest payable |
(1,420 | ) | (683 | ) | (2,241 | ) | ||||||
|
Net increase (decrease) in other liabilities |
4,216 | 1,036 | (1,787 | ) | ||||||||
|
|
|
|
|
|
|
|||||||
|
Net cash provided by operating activities |
186,843 | 193,943 | 96,737 | |||||||||
|
|
|
|
|
|
|
|||||||
|
Investing Activities |
||||||||||||
|
Proceeds from sales, maturities and prepayments of investment securities, available-for-sale |
1,024,508 | 700,182 | 310,809 | |||||||||
|
Purchases of investment securities, available-for-sale |
(1,730,244 | ) | (1,664,341 | ) | (768,045 | ) | ||||||
|
Principal collected on loans |
958,401 | 984,827 | 1,240,739 | |||||||||
|
Loans originated or acquired |
(826,329 | ) | (849,222 | ) | (1,191,105 | ) | ||||||
|
Net addition of premises and equipment and other real estate owned |
(17,492 | ) | (22,652 | ) | (11,859 | ) | ||||||
|
Proceeds from sale of other real estate owned |
46,703 | 30,529 | 14,763 | |||||||||
|
Net decrease (increase) of non-marketable equity securities |
15,357 | (1,829 | ) | (701 | ) | |||||||
|
Net cash received for acquisition of bank |
— | — | 41,716 | |||||||||
|
|
|
|
|
|
|
|||||||
|
Net cash used in investment activities |
(529,096 | ) | (822,506 | ) | (363,683 | ) | ||||||
|
|
|
|
|
|
|
|||||||
|
Financing Activities |
||||||||||||
|
Net increase in deposits |
299,311 | 421,750 | 601,062 | |||||||||
|
Net increase in securities sold under agreements to repurchase |
9,240 | 36,897 | 8,251 | |||||||||
|
Net increase in Federal Home Loan Bank advances |
103,905 | 174,774 | 451,910 | |||||||||
|
Net decrease in Federal Reserve Bank discount window |
— | (225,000 | ) | (689,000 | ) | |||||||
|
Net (decrease) increase in federal funds purchased and other borrowed funds |
(9,867 | ) | 6,404 | (565 | ) | |||||||
|
Cash dividends paid |
(37,395 | ) | (37,396 | ) | (32,021 | ) | ||||||
|
Excess (deficiencies) benefits related to the exercise of stock options |
— | (4 | ) | 75 | ||||||||
|
Proceeds from exercise of stock options and other stock issued |
— | 145,654 | 2,554 | |||||||||
|
|
|
|
|
|
|
|||||||
|
Net cash provided by financing activities |
365,194 | 523,079 | 342,266 | |||||||||
|
|
|
|
|
|
|
|||||||
|
Net increase (decrease) in cash and cash equivalents |
22,941 | (105,484 | ) | 75,320 | ||||||||
|
Cash and cash equivalents at beginning of period |
105,091 | 210,575 | 135,255 | |||||||||
|
|
|
|
|
|
|
|||||||
|
Cash and cash equivalents at end of period |
$ | 128,032 | 105,091 | 210,575 | ||||||||
|
|
|
|
|
|
|
|||||||
|
Supplemental Disclosure of Cash Flow Information |
||||||||||||
|
Cash paid during the period for interest |
$ | 45,913 | 54,318 | 59,408 | ||||||||
|
Cash paid during the period for income taxes |
7,925 | 9,371 | 36,778 | |||||||||
|
Sale and refinancing of other real estate owned |
8,665 | 10,215 | 8,150 | |||||||||
|
Other real estate acquired in settlement of loans |
79,295 | 72,572 | 71,967 | |||||||||
The following schedule summarizes the Company’s acquisition in 2009:
| First Bank-WY | ||||
|
Date acquired |
Oct. 2, 2009 | |||
|
Fair value of assets acquired |
$ | 272,280 | ||
|
Cash paid for the capital stock |
621 | |||
|
Capital stock issued |
9,995 | |||
|
Liabilities assumed |
266,758 | |||
See accompanying notes to consolidated financial statements.
72
Table of Contents
Notes to Consolidated Financial Statements
| 1) | Nature of Operations and Summary of Significant Accounting Policies |
General
Glacier Bancorp, Inc. (the “Company”) is a Montana corporation headquartered in Kalispell, Montana. The Company is a regional multi-bank holding company that provides a full range of banking services to individual and corporate customers in Montana, Idaho, Wyoming, Colorado, Utah and Washington through its bank subsidiaries. The bank subsidiaries are subject to competition from other financial service providers. The bank subsidiaries are also subject to the regulations of certain government agencies and undergo periodic examinations by those regulatory authorities.
The preparation of financial statements in conformity with accounting principles generally accepted in the United States of America requires management to make estimates and assumptions that affect the reported amounts of assets and liabilities and disclosure of contingent assets and liabilities at the date of the financial statements and the reported amounts of income and expenses during the reporting period. Actual results could differ from those estimates.
Material estimates that are particularly susceptible to significant change include: 1) the determination of the allowance for loan and lease losses (“ALLL” or “allowance”), 2) the valuations related to investments and real estate acquired in connection with foreclosures or in satisfaction of loans, and 3) the evaluation of goodwill impairment. In connection with the determination of the ALLL and other real estate valuation estimates, management obtains independent appraisals (new or updated) for significant items. Estimates relating to investments are obtained from independent third parties. Estimates relating to the evaluation of goodwill for impairment are determined based on independent party valuations and internal calculations using significant independent party inputs.
Principles of Consolidation
As of December 31, 2011, the Company was the parent holding company (“Parent”) for eleven independent wholly-owned community bank subsidiaries: Glacier Bank (“Glacier”), First Security Bank of Missoula (“First Security”), Western Security Bank (“Western”), Valley Bank of Helena (“Valley”), Big Sky Western Bank (“Big Sky”), and First Bank of Montana (“First Bank-MT”), all located in Montana; Mountain West Bank (“Mountain West”) and Citizens Community Bank (“Citizens”) located in Idaho; 1st Bank (“1st Bank”) and First Bank of Wyoming, formerly First National Bank & Trust, (“First Bank-WY”) located in Wyoming; and Bank of the San Juans (“San Juans”) located in Colorado. Effective June 30, 2011, First Bank-WY changed from a national bank charter to a Wyoming bank charter. All significant inter-company transactions have been eliminated in consolidation.
The Company owns a wholly-owned subsidiary, GBCI Other Real Estate (“GORE”), to isolate certain bank foreclosed properties for legal protection and administrative purposes. The foreclosed properties were sold to GORE at fair market value in 2011 and 2010 by bank subsidiaries and properties remaining are currently held for sale.
The Company owns seven trust subsidiaries, Glacier Capital Trust II (“Glacier Trust II”), Glacier Capital Trust III (“Glacier Trust III”), Glacier Capital Trust IV (“Glacier Trust IV”), Citizens (ID) Statutory Trust I (“Citizens Trust I”), Bank of the San Juans Bancorporation Trust I (“San Juans Trust I”), First Company Statutory Trust 2001 (“First Co Trust 01”) and First Company Statutory Trust 2003 (“First Co Trust 03”) for the purpose of issuing trust preferred securities. The trust subsidiaries are not consolidated into the Company’s financial statements.
73
Table of Contents
| 1) | Nature of Operations and Summary of Significant Accounting Policies…continued |
The following organizational chart illustrates the Company’s various relationships as of December 31, 2011:
|
Glacier Bancorp. Inc. (Parent Holding Company)
|
||||||||||||||||||||||||||||||||||
|
Glacier Bank (MT Community Bank)
|
Mountain West Bank (ID Community Bank)
|
First Security Bank of Missoula (MT Community Bank) |
Western Security Bank (MT Community Bank)
|
|||||||||||||||||||||||||||||||
|
1st Bank (WY Community Bank)
|
Valley Bank of Helena (MT Community Bank) |
Big Sky Western Bank (MT Community Bank) |
First Bank of Wyoming (WY Community Bank)
|
|||||||||||||||||||||||||||||||
|
Citizens Community Bank (ID Community Bank)
|
First Bank of Montana (MT Community Bank)
|
Bank of the San Juans (CO Community Bank) |
GBCI Other Real Estate
|
|||||||||||||||||||||||||||||||
|
Glacier Capital Trust II
|
Glacier Capital Trust III
|
Glacier Capital Trust IV |
Citizens (ID) Statutory Trust I
|
|||||||||||||||||||||||||||||||
|
Bank of the San Juans Bancorporation Trust I
|
First Company Statutory Trust 2001
|
First Company Statutory Trust 2003
|
||||||||||||||||||||||||||||||||
Variable Interest Entities
A variable interest entity (“VIE”) exists when either 1) the entity’s total equity investment at risk is not sufficient to permit the entity to finance its activities without additional subordinated financial support from other parties, or 2) the entity has equity investors that cannot make significant decisions about the entity’s operations or that do not absorb their proportionate share of the expected losses or receive the expected returns of the entity. In addition, a VIE must be consolidated by the Company if it is deemed to be the primary beneficiary of the VIE, which is the party involved with the VIE that has the power to direct the VIE’s significant activities and will absorb a majority of the expected losses, receive a majority of the expected residual returns, or both. The VIEs are regularly monitored to determine if any reconsideration events have occurred that could cause the primary beneficiary status to change.
The Company has equity investments in Certified Development Entities (“CDE”) which have received allocations of New Markets Tax Credits (“NMTC”). The Company also has equity investments in Low-Income Housing Tax Credit (“LIHTC”) partnerships. The CDEs and the LIHTC partnerships are VIEs. The underlying activities of the VIEs are community development projects designed primarily to promote community welfare, such as economic rehabilitation and development of low-income areas by providing housing, services, or jobs for residents. The maximum exposure to loss in the VIEs is the amount of equity invested and credit extended by the Company. However, the Company has credit protection in the form of indemnification agreements, guarantees, and collateral arrangements. The primary activities of the VIEs are recognized in commercial loans interest income, other non-interest income and other borrowed funds interest expense on the Company’s statements of operations. Such related cash flows are recognized in loans originated, principal collected on loans and change in other borrowed funds. The Company has evaluated the variable interests held by the Company in each CDE (NMTC) and LIHTC partnership investment and determined that the Company continues to be the primary beneficiary of such VIEs. As the primary beneficiary, the VIEs’ assets, liabilities, and results of operations are included in the Company’s consolidated financial statements.
74
Table of Contents
| 1) | Nature of Operations and Summary of Significant Accounting Policies…continued |
The following table summarizes the carrying amounts of the VIEs’ assets and liabilities included in the Company’s consolidated financial statements at December 31, 2011 and 2010:
| December 31, | ||||||||||||||||
| 2011 | 2010 | |||||||||||||||
|
(Dollars in thousands) |
CDE (NMTC) | LIHTC | CDE (NMTC) | LIHTC | ||||||||||||
|
Assets |
||||||||||||||||
|
Loans receivable |
$ | 32,748 | — | 29,239 | — | |||||||||||
|
Premises and equipment, net |
— | 15,996 | — | 9,637 | ||||||||||||
|
Accrued interest receivable |
116 | — | 112 | — | ||||||||||||
|
Other assets |
1,439 | 31 | 1,369 | 102 | ||||||||||||
|
|
|
|
|
|
|
|
|
|||||||||
|
Total assets |
$ | 34,303 | 16,027 | 30,720 | 9,739 | |||||||||||
|
|
|
|
|
|
|
|
|
|||||||||
|
Liabilities |
||||||||||||||||
|
Other borrowed funds |
$ | 4,629 | 3,306 | 4,629 | 1,617 | |||||||||||
|
Accrued interest payable |
4 | 9 | 2 | 9 | ||||||||||||
|
Other liabilities |
186 | 363 | 81 | 289 | ||||||||||||
|
|
|
|
|
|
|
|
|
|||||||||
|
Total liabilities |
$ | 4,819 | 3,678 | 4,712 | 1,915 | |||||||||||
|
|
|
|
|
|
|
|
|
|||||||||
Amounts presented in the table above are adjusted for intercompany eliminations. All assets presented can be used only to settle obligations of the consolidated VIEs and all liabilities presented consist of liabilities for which creditors and other beneficial interest holders therein have no recourse to the general credit of the Company.
Cash and Cash Equivalents
Cash and cash equivalents include cash on hand, cash held as demand deposits at various banks and regulatory agencies, interest bearing deposits, federal funds sold and liquid investments with original maturities of three months or less.
Pursuant to legislation enacted in 2010, the Federal Deposit Insurance Corporation (“FDIC”) fully insures all noninterest-bearing transaction accounts beginning December 31, 2010 through December 31, 2012, at all FDIC-insured institutions.
Investment Securities
Debt securities for which the Company has the positive intent and ability to hold to maturity are classified as held-to-maturity and are carried at amortized cost. Debt and equity securities held primarily for the purpose of selling in the near term are classified as trading securities and are reported at fair market value, with unrealized gains and losses included in income. Debt and equity securities not classified as held-to-maturity or trading are classified as available-for-sale and are reported at fair value with unrealized gains and losses, net of income taxes, as a separate component of stockholders’ equity. As of December 31, 2011 and 2010, the Company has only available-for-sale securities. Premiums and discounts on investment securities are amortized or accreted into income using a method that approximates the level-yield interest method. For additional information relating to investment securities, see Note 3.
Temporary versus Other-Than-Temporary Impairment
The Company assesses individual securities in its investment securities portfolio for impairment at least on a quarterly basis, and more frequently when economic or market conditions warrant. An investment is impaired if the fair value of the security is less than its carrying value at the financial statement date. If impairment is determined to be other-than-temporary, an impairment loss is recognized by reducing the amortized cost for the credit loss portion of the impairment with a corresponding charge to earnings for a like amount.
75
Table of Contents
| 1) | Nature of Operations and Summary of Significant Accounting Policies…continued |
For fair value estimates provided by third party vendors, management also considered the models and methodology for appropriate consideration of both observable and unobservable inputs, including appropriately adjusted discount rates and credit spreads for securities with limited or inactive markets, and whether the quoted prices reflect orderly transactions. For certain securities, the Company obtained independent estimates of inputs, including cash flows, in supplement to third party vendor provided information. The Company also reviewed financial statements of select issuers, with follow up discussions with issuers’ management for clarification and verification of information relevant to the Company’s impairment analysis.
In evaluating impaired securities for other-than-temporary impairment losses, management considers 1) the severity and duration of the impairment, 2) the credit ratings of the security, 3) the overall deal structure, including the Company’s position within the structure, the overall and near term financial performance of the issuer and underlying collateral, delinquencies, defaults, loss severities, recoveries, prepayments, cumulative loss projections, discounted cash flows and fair value estimates.
In evaluating debt securities for other-than-temporary impairment losses, management assesses whether the Company intends to sell the security or if it is more-likely-than-not that the Company will be required to sell the debt security. In so doing, management considers contractual constraints, liquidity, capital, asset / liability management and securities portfolio objectives. If impairment is determined to be other-than-temporary and the Company does not intend to sell a debt security, and it is more-likely-than-not the Company will not be required to sell the security before recovery of its cost basis, it recognizes the credit component of an other-than-temporary impairment of a debt security in earnings and the remaining portion (noncredit portion) in other comprehensive income, net of tax. For held-to-maturity debt securities, the amount of an other-than-temporary impairment recorded in other comprehensive income for the noncredit portion of a previous other-than-temporary impairment is amortized prospectively over the remaining life of the security on the basis of the timing of future estimated cash flows of the security.
If impairment is determined to be other-than-temporary and the Company intends to sell a debt security or it is more-likely-than-not the Company will be required to sell the security before recovery of its cost basis, it recognizes the entire amount of the other-than-temporary impairment in earnings.
For debt securities with other-than-temporary impairment, the previous amortized cost basis less the other-than-temporary impairment recognized in earnings shall be the new amortized cost basis of the security. In subsequent periods, the Company accretes into interest income the difference between the new amortized cost basis and cash flows expected to be collected prospectively over the life of the debt security.
Loans Held for Sale
Loans originated and intended for sale in the secondary market are carried at the lower of cost or estimated fair value in the aggregate. Net unrealized losses are recognized by charges to non-interest income. A sale is recognized when the Company surrenders control of the loan and consideration, other than beneficial interests in the loan, is received in exchange. A gain is recognized in non-interest income to the extent the sales price exceeds the carrying value of the sold loan.
Loans Receivable
Loans that are intended to be held-to-maturity are reported at the unpaid principal balance less net charge-offs and adjusted for deferred fees and costs on originated loans and unamortized premiums or discounts on acquired loans. Interest income is reported using the interest method and includes discount accretion and premium amortization on acquired loans and net loan fees on originated loans which are amortized over the expected life of the loans using a method that approximates the level-yield interest method. The Company’s loan segments include residential real estate, commercial, and consumer loans. The Company’s loan classes, a further disaggregation of segments, include residential real estate loans (residential real estate segment), commercial real estate and other commercial loans (commercial segment), and home equity and other consumer loans (consumer segment).
76
Table of Contents
| 1) | Nature of Operations and Summary of Significant Accounting Policies…continued |
Loans that are thirty days or more past due based on payments received and applied to the loan are considered delinquent. Loans are designated non-accrual and the accrual of interest is discontinued when the collection of the contractual principal or interest is unlikely. A loan is typically placed on non-accrual when principal or interest is due and has remained unpaid for ninety days or more. When a loan is placed on non-accrual status, interest previously accrued but not collected is reversed against current period interest income. Subsequent payments are applied to the outstanding principal balance if doubt remains as to the ultimate collectability of the loan. Interest accruals are not resumed on partially charged-off impaired loans. For other loans on non-accrual, interest accruals are resumed on such loans only when they are brought fully current with respect to interest and principal and when, in the judgment of management, the loans are estimated to be fully collectible as to both principal and interest.
The Company recognizes that while borrowers may experience deterioration in their financial condition, many continue to be creditworthy customers who have the willingness and capacity for debt repayment. In determining whether non-restructured or unimpaired loans issued to a single or related party group of borrowers should continue to accrue interest when the borrower has other loans that are impaired or troubled debt restructurings (“TDR”), the Company on a quarterly or more frequent basis performs an updated and comprehensive assessment of the willingness and capacity of the borrowers to timely and ultimately repay their total debt obligations, including contingent obligations. Such analysis takes into account current financial information about the borrowers and financially responsible guarantors, if any, including for example:
| • |
analysis of global, i.e., aggregate debt service for total debt obligations; |
| • |
assessment of the value and security protection of collateral pledged using current market conditions and alternative market assumptions across a variety of potential future situations; and |
| • |
loan structures and related covenants. |
The Company considers impaired loans to be the primary credit quality indicator for monitoring the credit quality of the loan portfolio. Loans are designated impaired when, based upon current information and events, it is probable that the Company will be unable to collect the scheduled payments of principal or interest when due according to the contractual terms of the loan agreement and therefore, the Company has serious doubts as to the ability of such borrowers to fulfill the contractual obligation. Impaired loans include non-performing loans (i.e., non-accrual loans and accruing loans 90 days or more past due) and accruing loans under ninety days past due where it is probable payments will not be received according to the loan agreement (e.g., TDR). The Company measures impairment on a loan-by-loan basis in the same manner for each class within the loan portfolio. An insignificant delay or shortfall in the amounts of payments would not cause a loan or lease to be considered impaired. The Company determines the significance of payment delays and shortfalls on a case-by-case basis, taking into consideration all of the facts and circumstances surrounding the loan and the borrower, including the length and reasons for the delay, the borrower’s prior payment record, and the amount of the shortfall in relation to the principal and interest due.
A restructured loan is considered a TDR if the creditor, for economic or legal reasons related to the debtor’s financial difficulties, grants a concession to the debtor that it would not otherwise consider. A TDR loan is considered an impaired loan and a specific valuation allowance is established when the fair value of the collateral-dependent loan or present value of the loan’s expected future cash flows (discounted at the loan’s effective interest rate based on the original contractual rate) is lower than the carrying value of the impaired loan. The Company made the following types of loan modifications, some of which were considered a TDR:
| • |
Reduction of the stated interest rate for the remaining term of the debt; |
| • |
Extension of the maturity date(s) at a stated rate of interest lower than the current market rate for newly originated debt having similar risk characteristics; and |
| • |
Reduction of the face amount of the debt as stated in the debt agreements. |
For additional information relating to loans, see Note 4.
77
Table of Contents
| 1) | Nature of Operations and Summary of Significant Accounting Policies…continued |
Allowance for Loan and Lease Losses
Based upon management’s analysis of the Company’s loan portfolio, the balance of the ALLL is an estimate of probable credit losses known and inherent within each bank subsidiary’s loan portfolio as of the date of the consolidated financial statements. The ALLL is analyzed at the loan class level and is maintained within a range of estimated losses. Determining the adequacy of the ALLL involves a high degree of judgment and is inevitably imprecise as the risk of loss is difficult to quantify. The determination of the ALLL and the related provision for loan losses is a critical accounting estimate that involves management’s judgments about all known relevant internal and external environmental factors that affect loan losses. The balance of the ALLL is highly dependent upon management’s evaluations of borrowers’ current and prospective performance, appraisals and other variables affecting the quality of the loan portfolio. Individually significant loans and major lending areas are reviewed periodically to determine potential problems at an early date. Changes in management’s estimates and assumptions are reasonably possible and may have a material impact upon the Company’s consolidated financial statements, results of operations or capital.
The ALLL consists of a specific valuation allowance component and a general valuation allowance component. The specific component relates to loans that are determined to be impaired and individually evaluated for impairment. The Company measures impairment on a loan-by-loan basis based on the present value of expected future cash flows discounted at the loan’s effective interest rate, except when it is determined that repayment of the loan is expected to be provided solely by the underlying collateral. For impairment based on expected future cash flows, the Company considers all information available as of a measurement date, including past events, current conditions, potential prepayments, and estimated cost to sell when such costs are expected to reduce the cash flows available to repay or otherwise satisfy the loan. For alternative ranges of cash flows, the likelihood of the possible outcomes is considered in determining the best estimate of expected future cash flows. The effective interest rate for a loan restructured in a TDR is based on the original contractual rate. For collateral-dependent loans and real estate loans for which foreclosure or a deed-in-lieu of foreclosure is probable, impairment is measured by the fair value of the collateral, less estimated cost to sell. The fair value of the collateral is determined primarily based upon appraisal or evaluation of the underlying real property value.
The general valuation allowance component relates to probable credit losses inherent in the balance of the loan portfolio based on historical loss experience, adjusted for changes in trends and conditions of qualitative or environmental factors. The historical loss experience is based on the previous twelve quarters loss experience by loan class adjusted for risk characteristics in the existing loan portfolio. The same trends and conditions are evaluated for each class within the loan portfolio; however, the risk characteristics are weighted separately at the individual class level based on each of the bank subsidiaries’ judgment and experience.
The changes in trends and conditions of certain items include the following:
| • |
Changes in lending policies and procedures, including changes in underwriting standards and collection, charge-off, and recovery practices not considered elsewhere in estimating credit losses; |
| • |
Changes in international, national, regional, and local economic and business conditions and developments that affect the collectability of the portfolio, including the condition of various market segments; |
| • |
Changes in the nature and volume of the portfolio and in the terms of loans; |
| • |
Changes in experience, ability, and depth of lending management and other relevant staff; |
| • |
Changes in the volume and severity of past due and nonaccrual loans; |
| • |
Changes in the quality of the Company’s loan review system; |
| • |
Changes in the value of underlying collateral for collateral-dependent loans; |
| • |
The existence and effect of any concentrations of credit, and changes in the level of such concentrations; |
| • |
The effect of other external factors such as competition and legal and regulatory requirements on the level of estimated credit losses in the Company’s existing portfolio. |
The ALLL is increased by provisions for loan losses which are charged to expense. The portions of loan balances determined by management to be uncollectible are charged-off as a reduction of the ALLL. Recoveries of amounts previously charged-off are credited as an increase to the ALLL. The Company’s charge-off policy is consistent with bank regulatory standards. Consumer loans generally are charged off when the loan becomes over 120 days delinquent. Real estate acquired as a result of foreclosure or by deed-in-lieu of foreclosure is classified as real estate owned until such time as it is sold.
78
Table of Contents
| 1) | Nature of Operations and Summary of Significant Accounting Policies…continued |
Premises and Equipment
Premises and equipment are accounted for at cost less depreciation. Depreciation is computed on a straight-line method over the estimated useful lives or the term of the related lease. The estimated useful life for office buildings is 15 - 40 years and the estimated useful life for furniture, fixtures, and equipment is 3 - 10 years. Interest is capitalized for any significant building projects. For additional information relating to premises and equipment, see Note 5.
Other Real Estate Owned
Property acquired by foreclosure or deed-in-lieu of foreclosure is carried at the lower of fair value at acquisition date or current estimated fair value, less estimated selling cost. Fair value is determined as the amount that could be reasonably expected in a current sale between a willing buyer and a willing seller in an orderly transaction between market participants at the measurement date. Subsequent to the initial acquisition, if the fair value of the asset, less estimated selling cost, is less than the cost of the property, a loss is recognized in other expense and the asset carrying value is reduced. Gain or loss on disposition of other real estate owned is recorded in non-interest income or non-interest expense, respectively. In determining the fair value of the properties on the date of transfer and any subsequent estimated losses of net realizable value, the fair value of other real estate acquired by foreclosure or deed-in-lieu of foreclosure is determined primarily based upon appraisal or evaluation of the underlying property value.
Long-lived Assets
Long-lived assets are reviewed for impairment whenever events or changes in circumstances indicate that the carrying amount of an asset may not be recoverable. An asset is deemed impaired if the sum of the expected future cash flows is less than the carrying amount of the asset. If impaired, an impairment loss is recognized in other expense to reduce the carrying value of the asset to fair value. At December 31, 2011 and 2010, no long-lived assets were considered impaired.
Business Combinations and Intangible Assets
Acquisition accounting requires the total purchase price to be allocated to the estimated fair values of assets acquired and liabilities assumed, including certain intangible assets. Goodwill is recorded if the purchase price exceeds the net fair value of assets acquired and a bargain purchase gain is recorded in other income if the net fair value of assets acquired exceeds the purchase price.
Adjustment of the allocated purchase price may be related to fair value estimates for which all information has not been obtained of the acquired entity known or discovered during the allocation period, the period of time required to identify and measure the fair values of the assets and liabilities acquired in the business combination. The allocation period is generally limited to one year following consummation of a business combination.
Core deposit intangible represents the intangible value of depositor relationships resulting from deposit liabilities assumed in acquisitions and is amortized using an accelerated method based on an estimated runoff of the related deposits, not exceeding 10 years. The useful life of the core deposit intangible is reevaluated on an annual basis, with any changes in estimated useful life accounted for prospectively over the revised remaining life. For additional information relating to core deposit intangibles, see Note 6.
The Company tests goodwill and other intangible assets for impairment at the reporting unit level (i.e., bank subsidiaries) annually during the third quarter. In addition, goodwill and other intangible assets of a subsidiary are tested for impairment between annual tests if an event occurs or circumstances change that would more-likely-than not reduce the fair value of a reporting units below its carrying amount. Examples of events and circumstances that could trigger the need for interim impairment testing include:
| • |
A significant change in legal factors or in the business climate; |
| • |
An adverse action or assessment by a regulator; |
| • |
Unanticipated competition; |
| • |
A loss of key personnel; |
| • |
A more-likely-than-not expectation that a reporting unit or a significant portion of a reporting unit will be sold or otherwise disposed of; and |
| • |
The testing for recoverability of a significant asset group within a reporting unit. |
79
Table of Contents
| 1) | Nature of Operations and Summary of Significant Accounting Policies…continued |
The goodwill impairment test is a two-step process which requires the Company to make assumptions and judgments regarding fair value. In the first step for evaluating for possible impairment, the Company compares the estimated fair value of its reporting units to the carrying value, which includes goodwill. If the estimated fair value is less than the carrying value, the second step is completed to compute the impairment amount, if any, by determining the “implied fair value” of goodwill. This determination requires the allocation of the estimated fair value of the reporting units to the assets and liabilities of the reporting units. Any remaining unallocated fair value represents the “implied fair value” of goodwill, which is compared to the corresponding carrying value of goodwill to compute impairment, if any. A recent Financial Accounting Standards Board (“FASB”) amendment provides the Company the option, prior to the two-step process, to first assess qualitative factors to determine whether the existence of events or circumstances leads to a determination that it is more-likely-than-not that he fair value of the a reporting unit is less than its carrying value. The Company chose not to early adopt this amendment during 2011. For additional information relating to goodwill, see Note 6.
Non-Marketable Equity Securities
The Company holds stock in the Federal Home Loan Bank (“FHLB”). FHLB stock is restricted because such stock may only be sold to the FHLB at its par value. Due to restrictive terms, and the lack of a readily determinable market value, FHLB stock is carried at cost. The investments in FHLB stock are required investments related to the Company’s borrowings from FHLB. FHLB obtains its funding primarily through issuance of consolidated obligations of the FHLB system. The U.S. government does not guarantee these obligations, and each of the 12 FHLBs are jointly and severally liable for repayment of each other’s debt.
The Company also held stock in the Federal Reserve Bank (“FRB”) as of December 31, 2010; however, during the second quarter of 2011, the nine bank subsidiaries with FRB stock redeemed their membership stock as a result of converting all bank subsidiaries to the FDIC as the primary regulator.
Derivatives and Hedging Activities
For asset and liability management purposes, the Company has entered into interest rate swap agreements to hedge against changes in forecasted cash flows due to interest rate exposures. The interest rate swaps are recognized as assets or liabilities on the Company’s statement of financial condition and measured at fair value. Fair value estimates are obtained from third parties and are based on pricing models. The Company does not enter into interest rate swap agreements for trading or speculative purposes.
Interest rate swaps are contracts in which a series of interest payments are exchanged over a prescribed period. The notional amount upon which the interest payments are based is not exchanged. The swap agreements are derivative instruments and convert a portion of the Company’s forecasted variable rate debt to a fixed rate (i.e., cash flow hedge). The effective portion of the gain or loss on the cash flow hedging instruments is initially reported as a component of other comprehensive income and subsequently reclassified into earnings in the same period during which the transaction affects earnings. The ineffective portion of the gain or loss on derivative instruments, if any, is recognized in earnings. The Company currently has cash flow hedges of which no portion is ineffective.
Interest rate derivative financial instruments receive hedge accounting treatment only if they are designated as a hedge and are expected to be, and are, effective in substantially reducing interest rate risk arising from the assets and liabilities identified as exposing the Company to risk. Derivative financial instruments that do not meet specified hedging criteria are recorded at fair value with changes in fair value recorded in income. The Company’s interest rate swaps are considered highly effective and currently meet the hedging accounting criteria.
Cash flows resulting from the interest rate derivative financial instruments that are accounted for as hedges of assets and liabilities are classified in the Company’s cash flow statement in the same category as the cash flows of the items being hedged. For additional information relating to interest rate swap agreements, see Note 11.
80
Table of Contents
| 1) | Nature of Operations and Summary of Significant Accounting Policies…continued |
Comprehensive Income
Comprehensive income consists of net income and other comprehensive income. Other comprehensive income includes unrealized gains (losses), net of tax expense (benefit), on available-for-sale securities and unrealized gains (losses), net of tax expense (benefit), on cash flow hedges.
Advertising and Promotion
Advertising and promotion costs are recognized in the period incurred.
Stock-based Compensation
Compensation cost related to share-based payment transactions is recognized in the financial statements over the requisite service period, which is the vesting period. Compensation cost is measured using the fair value of an award on the grant date by using a Black Scholes option-pricing model. For additional information relating to stock-based compensation, see Note 17.
Income Taxes
The Company’s income tax expense consists of the following components: current and deferred. Current income tax expense reflects taxes to be paid or refunded for the current period by applying the provisions of enacted tax law to earnings or losses. Deferred income tax expense results from changes in deferred assets and liabilities between periods.
Deferred tax assets and liabilities are recognized for estimated future tax consequences attributable to differences between the financial statement carrying amounts of assets and liabilities and their respective tax bases. The effect on deferred tax assets and liabilities of a change in income tax rates is recognized in income in the period that includes the enactment date.
Deferred tax assets are reduced by a valuation allowance, if based on the weight of available evidence, it is more-likely-than-not that some portion or all of the deferred tax assets will not be realized. The term more-likely-than-not means a likelihood of more than fifty percent. The recognition threshold considers the facts, circumstances, and information available at the reporting date and is subject to the Company’s judgment. In assessing the need for a valuation allowance, the Company considers both positive and negative evidence. For additional information relating to income taxes, see Note 14.
Earnings Per Share
Basic earnings per share is computed by dividing net income by the weighted average number of shares of common stock outstanding during the period presented. Diluted earnings per share is computed by including the net increase in shares as if dilutive outstanding stock options were exercised, using the treasury stock method. For additional information relating earnings per share, see Note 15.
Leases
The Company leases certain land, premises and equipment from third parties under operating and capital leases. The lease payments for operating lease agreements are recognized on a straight-line basis. The present value of the future minimum rental payments for capital leases is recognized as an asset when the lease is formed. Lease improvements incurred at the inception of the lease are recorded as an asset and depreciated over the initial term of the lease and lease improvements incurred subsequently are depreciated over the remaining term of the lease. For additional information relating to leases, see Note 21.
Transfers between Fair Value Hierarchy Levels
Transfers in and out of Level 1 (quoted market prices), Level 2 (other significant observable inputs) and Level 3 (significant unobservable inputs) are recognized on the actual transfer date.
Reclassifications
Certain reclassifications have been made to the 2010 and 2009 financial statements to conform to the 2011 presentation.
81
Table of Contents
| 1) | Nature of Operations and Summary of Significant Accounting Policies…continued |
Impact of Recent Authoritative Accounting Guidance
The Accounting Standards Codification TM (“ASC”) is the FASB’s officially recognized source of authoritative accounting principles generally accepted in the United States of America (“GAAP”) applicable to all public and non-public non-governmental entities. Rules and interpretive releases of the Securities and Exchange Commission (“SEC”) under the authority of the federal securities laws are also sources of authoritative GAAP for the Company as an SEC registrant. All other accounting literature is considered non-authoritative.
In September 2011, FASB amended FASB ASC Topic 350, Intangibles - Goodwill and Other. The amendment provides an entity the option to first assess qualitative factors to determine whether the existence of events or circumstances leads to a determination that it is more-likely-than-not that the fair value of a reporting unit is less than its carrying amount. If the entity concludes it is more-likely-than-not that the fair value of a reporting unit is less than its carrying amount, then performing the two-step impairment test is unnecessary. The amendment is effective prospectively during interim and annual periods beginning after December 15, 2011 and early adoption is permitted. The Company is currently evaluating the impact of the adoption of this amendment, but does not expect it to have a material effect on the Company’s financial position or results of operations.
In June 2011, FASB amended FASB ASC Topic 220, Comprehensive Income . The amendment provides an entity the option to present the total of comprehensive income, the components of net income, and the components of other comprehensive income either in a single continuous statement or in two separate but consecutive statements. Accounting Standards Update (“ASU”) No. 2011-12, Comprehensive Income (Topic 220) defers the specific requirement of the amendment to present items that are reclassified from accumulated other comprehensive income to net income separately with their respective components of net income and other comprehensive income. The amendments are effective retrospectively during interim and annual periods beginning after December 15, 2011. The Company is currently evaluating the impact of the adoption of the amendments, but does not expect them to have a material effect on the Company’s financial position or results of operations.
In May 2011, FASB amended FASB ASC Topic 820, Fair Value Measurement . The amendment achieves common fair value measurement and disclosure requirements in U.S. GAAP and International Financial Reporting Standards. The amendment changes the wording used to describe many of the requirements in U.S. GAAP for measuring fair value and for disclosing information about fair value measurements. The amendment is effective prospectively during interim and annual periods beginning after December 15, 2011. The Company is currently evaluating the impact of the adoption of this amendment, but does not expect it to have a material effect on the Company’s financial position or results of operations.
In April 2011, FASB amended FASB ASC Topic 310, Receivables . The amendment provides additional guidance or clarification regarding a creditor’s determination of whether a restructuring is a troubled debt restructuring. In evaluating whether a restructuring constitutes a troubled debt restructuring, a creditor must separately conclude that both of the following exist: 1) the restructuring constitutes a concession, and 2) the debtor is experiencing financial difficulties. The amendment provides further guidance as to when the creditor has granted a concession and the debtor is experiencing financial difficulties. The amendment is effective for the first interim or annual period beginning on or after June 15, 2011, and should be applied retrospectively to the beginning of the annual period of adoption. As a result of applying the amendment, an entity may identify receivables that are newly considered impaired. For purposes of measuring impairment of those receivables, an entity should apply the amendment prospectively for the first interim or annual period beginning on or after June 15, 2011. An entity should disclose the information relating to troubled debt restructurings which was deferred in January 2011 by ASU No. 2011-01, Receivables (Topic 310) for interim and annual periods beginning on or after June 15, 2011. The Company has evaluated the impact of the adoption of the amendments and determined there was not a material effect on the Company’s financial position or results of operations.
82
Table of Contents
| 1) | Nature of Operations and Summary of Significant Accounting Policies…continued |
In December 2010, FASB amended FASB ASC Topic 805, Business Combinations . The amendment specifies that if a public entity presents comparative financial statements, the entity should disclose revenue and earnings of the combined entity as though the business combination(s) that occurred during the current year had occurred as of the beginning of the comparable prior annual reporting period only. The amendment also expands the supplemental pro forma disclosures to include a description of the nature and amount of material, nonrecurring pro forma adjustments directly attributable to the business combination included in the reported pro forma revenue and earnings. The amendment is effective prospectively for business combinations for which the acquisition date is on or after the beginning of the first annual reporting period beginning on or after December 15, 2010. The Company has evaluated the impact of the adoption of this amendment and determined there was not a material effect on the Company’s financial position or results of operations.
In December 2010, FASB amended FASB ASC Topic 350, Intangibles – Goodwill and Other . The amendment affects all entities that have recognized goodwill and have one or more reporting units whose carrying amount for purposes of performing Step 1 of the goodwill impairment test is zero or negative. The amendment modifies Step 1 so that for those reporting units, an entity is required to perform Step 2 of the goodwill impairment test if it is more-likely-than-not that a goodwill impairment exists. In determining whether it is more-likely-than-not that a goodwill impairment exists, an entity should consider whether there are any adverse qualitative factors indicating that an impairment may exist. The amendment is effective for fiscal years, and interim periods within those years, beginning after December 15, 2010. The Company has evaluated the impact of the adoption of this amendment and determined there was not a material effect on the Company’s financial position or results of operations.
In July 2010, FASB amended FASB ASC Subtopic 310-30, Disclosures about the Credit Quality of Financing . As a result of the amendment in this Update, the Company will provide additional information to assist financial users in assessing the Company’s credit risk exposures and evaluating the adequacy of the Company’s allowance for loan and lease losses. For public entities, the disclosures as of the end of a reporting period are effective for interim and annual reporting periods ending on or after December 15, 2010. The disclosures about activity that occurs during a reporting period are effective for interim and annual reporting periods beginning on or after December 15, 2010. In January 2011, the effective date of the disclosures about troubled debt restructurings were temporarily delayed to allow FASB time to determine what constitutes a troubled debt restructuring. The Company has evaluated the impact of the adoption of this amendment and determined there was not a material effect on the Company’s financial position or results of operations.
In January 2010, FASB amended FASB ASC Topic 820, Fair Value Measurements and Disclosures , that provides for more robust disclosures about 1) the different classes of assets and liabilities measured at fair value, 2) the valuation techniques and inputs used, 3) the activity in Level 3 fair value measurements, and 4) the transfers between Levels 1, 2, and 3 fair value measurements. The new disclosures are effective for interim and annual reporting periods beginning after December 15, 2009, except for the disclosures about the activity in Level 3 fair value measurements. Those disclosures are effective for fiscal years beginning after December 15, 2010. The Company has evaluated the impact of the adoption of this amendment and determined there was not a material effect on the Company’s financial position or results of operations.
| 2) | Cash on Hand and in Banks |
At December 31, 2011 and 2010, cash and cash equivalents primarily consisted of cash on hand and cash items in process. The bank subsidiaries are required to maintain an average reserve balance with either the Federal Reserve Bank or in the form of cash on hand. The required reserve balance at December 31, 2011 was $10,022,000.
83
Table of Contents
| 3) | Investment Securities, Available-for-Sale |
A comparison of the amortized cost and estimated fair value of the Company’s investment securities designated as available-for-sale is presented below.
| December 31, 2011 | ||||||||||||||||||||
| Weighted | Amortized | Gross Unrealized | Fair | |||||||||||||||||
|
(Dollars in thousands) |
Yield | Cost | Gains | Losses | Value | |||||||||||||||
|
U.S. government and federal agency |
||||||||||||||||||||
|
Maturing after one year through five years |
1.62 | % | $ | 204 | 4 | — | 208 | |||||||||||||
|
U.S. government sponsored enterprises |
||||||||||||||||||||
|
Maturing within one year |
1.58 | % | 3,979 | 17 | — | 3,996 | ||||||||||||||
|
Maturing after one year through five years |
2.36 | % | 26,399 | 682 | — | 27,081 | ||||||||||||||
|
Maturing after five years through ten years |
1.90 | % | 78 | — | — | 78 | ||||||||||||||
|
|
|
|
|
|
|
|
|
|
|
|||||||||||
| 2.26 | % | 30,456 | 699 | — | 31,155 | |||||||||||||||
|
|
|
|
|
|
|
|
|
|
|
|||||||||||
|
State and local governments |
||||||||||||||||||||
|
Maturing within one year |
1.31 | % | 4,786 | 3 | (2 | ) | 4,787 | |||||||||||||
|
Maturing after one year through five years |
2.22 | % | 89,752 | 2,660 | (22 | ) | 92,390 | |||||||||||||
|
Maturing after five years through ten years |
2.59 | % | 63,143 | 2,094 | (19 | ) | 65,218 | |||||||||||||
|
Maturing after ten years |
4.84 | % | 845,657 | 57,138 | (535 | ) | 902,260 | |||||||||||||
|
|
|
|
|
|
|
|
|
|
|
|||||||||||
| 4.44 | % | 1,003,338 | 61,895 | (578 | ) | 1,064,655 | ||||||||||||||
|
|
|
|
|
|
|
|
|
|
|
|||||||||||
|
Corporate bonds |
||||||||||||||||||||
|
Maturing after one year through five years |
2.55 | % | 60,810 | 261 | (1,264 | ) | 59,807 | |||||||||||||
|
Maturing after five years through ten years |
2.38 | % | 2,409 | 21 | — | 2,430 | ||||||||||||||
|
|
|
|
|
|
|
|
|
|
|
|||||||||||
| 2.54 | % | 63,219 | 282 | (1,264 | ) | 62,237 | ||||||||||||||
|
|
|
|
|
|
|
|
|
|
|
|||||||||||
|
Collateralized debt obligations |
||||||||||||||||||||
|
Maturing after ten years |
8.03 | % | 5,648 | — | (282 | ) | 5,366 | |||||||||||||
|
Residential mortgage-backed securities |
1.70 | % | 1,960,167 | 10,138 | (7,183 | ) | 1,963,122 | |||||||||||||
|
|
|
|
|
|
|
|
|
|
|
|||||||||||
|
Total investment securities |
2.64 | % | $ | 3,063,032 | 73,018 | (9,307 | ) | 3,126,743 | ||||||||||||
|
|
|
|
|
|
|
|
|
|
|
|||||||||||
84
Table of Contents
| 3) | Investment Securities, Available-for-Sale…continued |
| December 31, 2010 | ||||||||||||||||||||
| Weighted | Amortized | Gross Unrealized | Fair | |||||||||||||||||
|
(Dollars in thousands) |
Yield | Cost | Gains | Losses | Value | |||||||||||||||
|
U.S. government and federal agency |
||||||||||||||||||||
|
Maturing after one year through five years |
1.62 | % | $ | 207 | 4 | — | 211 | |||||||||||||
|
U.S. government sponsored enterprises |
||||||||||||||||||||
|
Maturing after one year through five years |
2.38 | % | 40,715 | 715 | — | 41,430 | ||||||||||||||
|
Maturing after five years through ten years |
1.94 | % | 84 | — | — | 84 | ||||||||||||||
|
Maturing after ten years |
0.73 | % | 4 | — | — | 4 | ||||||||||||||
|
|
|
|
|
|
|
|
|
|
|
|||||||||||
| 2.38 | % | 40,803 | 715 | — | 41,518 | |||||||||||||||
|
|
|
|
|
|
|
|
|
|
|
|||||||||||
|
State and local governments |
||||||||||||||||||||
|
Maturing within one year |
4.06 | % | 1,091 | 20 | (5 | ) | 1,106 | |||||||||||||
|
Maturing after one year through five years |
3.70 | % | 8,341 | 214 | (10 | ) | 8,545 | |||||||||||||
|
Maturing after five years through ten years |
3.73 | % | 18,675 | 379 | (56 | ) | 18,998 | |||||||||||||
|
Maturing after ten years |
4.91 | % | 639,364 | 5,281 | (15,873 | ) | 628,772 | |||||||||||||
|
|
|
|
|
|
|
|
|
|
|
|||||||||||
| 4.86 | % | 667,471 | 5,894 | (15,944 | ) | 657,421 | ||||||||||||||
|
|
|
|
|
|
|
|
|
|
|
|||||||||||
|
Collateralized debt obligations |
||||||||||||||||||||
|
Maturing after ten years |
8.03 | % | 11,178 | — | (4,583 | ) | 6,595 | |||||||||||||
|
Residential mortgage-backed securities |
2.23 | % | 1,675,319 | 17,569 | (2,786 | ) | 1,690,102 | |||||||||||||
|
|
|
|
|
|
|
|
|
|
|
|||||||||||
|
Total investment securities |
3.00 | % | $ | 2,394,978 | 24,182 | (23,313 | ) | 2,395,847 | ||||||||||||
|
|
|
|
|
|
|
|
|
|
|
|||||||||||
The amortized cost of securities at December 31, 2009 was as follows:
| December 31, | ||||
|
(Dollars in thousands) |
2009 | |||
|
U.S. government and federal agency |
$ | 210 | ||
|
U.S. government sponsored enterprises |
177 | |||
|
State and local governments |
472,656 | |||
|
Collateralized debt obligations |
14,688 | |||
|
Residential mortgage-backed securities |
956,033 | |||
|
|
|
|||
| $ | 1,443,764 | |||
|
|
|
|||
Included in the residential mortgage-backed securities was $49,252,000 and $68,051,000 as of December 31, 2011 and 2010, respectively, of non-guaranteed private label whole loan mortgage-backed securities of which none of the underlying collateral is considered “subprime.”
Maturities of securities do not reflect repricing opportunities present in adjustable rate securities, nor do they reflect expected shorter maturities based upon early prepayment of principal. Weighted yields are based on the level-yield method taking into account premium amortization and discount accretion. Weighted yields on tax-exempt investment securities exclude the tax benefit.
85
Table of Contents
| 3) | Investment Securities, Available-for-Sale…continued |
Interest income from investment securities consists of the following:
| Years ended December 31, | ||||||||||||
|
(Dollars in thousands) |
2011 | 2010 | 2009 | |||||||||
|
Taxable interest |
$ | 44,842 | 33,659 | 29,376 | ||||||||
|
Tax-exempt interest |
31,420 | 23,351 | 22,196 | |||||||||
|
|
|
|
|
|
|
|||||||
|
Total interest income |
$ | 76,262 | 57,010 | 51,572 | ||||||||
|
|
|
|
|
|
|
|||||||
The cost of each investment sold is determined by specific identification. Gain or loss on sale of investments consists of the following:
| Years ended December 31, | ||||||||||||
|
(Dollars in thousands) |
2011 | 2010 | 2009 | |||||||||
|
Gross proceeds |
$ | 18,916 | 142,925 | 85,224 | ||||||||
|
Less amortized cost |
(18,570 | ) | (138,103 | ) | (79,229 | ) | ||||||
|
|
|
|
|
|
|
|||||||
|
Net gain (loss) on sale of investments |
$ | 346 | 4,822 | 5,995 | ||||||||
|
|
|
|
|
|
|
|||||||
|
Gross gain on sale of investments |
$ | 1,048 | 7,779 | 7,113 | ||||||||
|
Gross loss on sale of investments |
(702 | ) | (2,957 | ) | (1,118 | ) | ||||||
|
|
|
|
|
|
|
|||||||
|
Net gain (loss) on sale of investments |
$ | 346 | 4,822 | 5,995 | ||||||||
|
|
|
|
|
|
|
|||||||
At December 31, 2011 and 2010, the Company had investment securities with fair values of $1,120,047,000 and $879,330,000, respectively, pledged as collateral for FHLB advances, FRB discount window borrowings, securities sold under agreements to repurchase, U.S. Treasury Tax and Loan borrowings, interest rate swap agreements and deposits of several local government units.
Investments with an unrealized loss position are summarized as follows:
| December 31, 2011 | ||||||||||||||||||||||||
| Less than 12 months | 12 Months or More | Total | ||||||||||||||||||||||
| Fair | Unrealized | Fair | Unrealized | Fair | Unrealized | |||||||||||||||||||
|
(Dollars in thousands) |
Value | Loss | Value | Loss | Value | Loss | ||||||||||||||||||
|
State and local governments |
$ | 26,434 | (90 | ) | 9,948 | (488 | ) | 36,382 | (578 | ) | ||||||||||||||
|
Corporate bonds |
31,782 | (1,264 | ) | — | — | 31,782 | (1,264 | ) | ||||||||||||||||
|
Collateralized debt obligations |
— | — | 5,366 | (282 | ) | 5,366 | (282 | ) | ||||||||||||||||
|
Residential mortgage-backed securities |
943,372 | (6,850 | ) | 8,244 | (333 | ) | 951,616 | (7,183 | ) | |||||||||||||||
|
|
|
|
|
|
|
|
|
|
|
|
|
|||||||||||||
|
Total temporarily impaired securities |
$ | 1,001,588 | (8,204 | ) | 23,558 | (1,103 | ) | 1,025,146 | (9,307 | ) | ||||||||||||||
|
|
|
|
|
|
|
|
|
|
|
|
|
|||||||||||||
86
Table of Contents
| 3) | Investment Securities, Available-for-Sale…continued |
| December 31, 2010 | ||||||||||||||||||||||||
| Less than 12 months | 12 Months or More | Total | ||||||||||||||||||||||
| Fair | Unrealized | Fair | Unrealized | Fair | Unrealized | |||||||||||||||||||
|
(Dollars in thousands) |
Value | Loss | Value | Loss | Value | Loss | ||||||||||||||||||
|
State and local governments |
$ | 365,164 | (14,680 | ) | 13,122 | (1,264 | ) | 378,286 | (15,944 | ) | ||||||||||||||
|
Collateralized debt obligations |
— | — | 6,595 | (4,583 | ) | 6,595 | (4,583 | ) | ||||||||||||||||
|
Residential mortgage-backed securities |
364,925 | (1,585 | ) | 19,304 | (1,201 | ) | 384,229 | (2,786 | ) | |||||||||||||||
|
|
|
|
|
|
|
|
|
|
|
|
|
|||||||||||||
|
Total temporarily impaired securities |
$ | 730,089 | (16,265 | ) | 39,021 | (7,048 | ) | 769,110 | (23,313 | ) | ||||||||||||||
|
|
|
|
|
|
|
|
|
|
|
|
|
|||||||||||||
With respect to its impaired securities at December 31, 2011, management determined that it does not intend to sell and that there is no expected requirement to sell any of its impaired securities. Based on an analysis of its impaired securities as of December 31, 2011 and 2010, the Company determined that none of such securities had other-than-temporary impairment.
| 4) | Loans Receivable, Net |
The following schedules disclose the recorded investment in loans and the ALLL on a portfolio class basis:
| Year ended December 31, 2011 | ||||||||||||||||||||||||
| Residential | Commercial | Other | Home | Other | ||||||||||||||||||||
|
(Dollars in thousands) |
Total | Real Estate | Real Estate | Commercial | Equity | Consumer | ||||||||||||||||||
|
Allowance for loan and lease losses |
||||||||||||||||||||||||
|
Balance at beginning of period |
$ | 137,107 | 20,957 | 76,147 | 19,932 | 13,334 | 6,737 | |||||||||||||||||
|
Provision for loan losses |
64,500 | 1,455 | 39,563 | 10,709 | 4,450 | 8,323 | ||||||||||||||||||
|
Charge-offs |
(69,366 | ) | (5,671 | ) | (42,042 | ) | (10,386 | ) | (4,644 | ) | (6,623 | ) | ||||||||||||
|
Recoveries |
5,275 | 486 | 3,252 | 578 | 476 | 483 | ||||||||||||||||||
|
|
|
|
|
|
|
|
|
|
|
|
|
|||||||||||||
|
Balance at end of period |
$ | 137,516 | 17,227 | 76,920 | 20,833 | 13,616 | 8,920 | |||||||||||||||||
|
|
|
|
|
|
|
|
|
|
|
|
|
|||||||||||||
| December 31, 2011 | ||||||||||||||||||||||||
| Residential | Commercial | Other | Home | Other | ||||||||||||||||||||
|
(Dollars in thousands) |
Total | Real Estate | Real Estate | Commercial | Equity | Consumer | ||||||||||||||||||
|
Allowance for loan and lease losses |
||||||||||||||||||||||||
|
Individually evaluated for impairment |
$ | 18,828 | 2,659 | 9,756 | 4,233 | 584 | 1,596 | |||||||||||||||||
|
Collectively evaluated for impairment |
118,688 | 14,568 | 67,164 | 16,600 | 13,032 | 7,324 | ||||||||||||||||||
|
|
|
|
|
|
|
|
|
|
|
|
|
|||||||||||||
|
Total allowance for loan and lease losses |
$ | 137,516 | 17,227 | 76,920 | 20,833 | 13,616 | 8,920 | |||||||||||||||||
|
|
|
|
|
|
|
|
|
|
|
|
|
|||||||||||||
|
Loans receivable |
||||||||||||||||||||||||
|
Individually evaluated for impairment |
$ | 258,659 | 24,453 | 162,959 | 49,962 | 14,750 | 6,535 | |||||||||||||||||
|
Collectively evaluated for impairment |
3,207,476 | 492,354 | 1,509,100 | 573,906 | 425,819 | 206,297 | ||||||||||||||||||
|
|
|
|
|
|
|
|
|
|
|
|
|
|||||||||||||
|
Total loans receivable |
$ | 3,466,135 | 516,807 | 1,672,059 | 623,868 | 440,569 | 212,832 | |||||||||||||||||
|
|
|
|
|
|
|
|
|
|
|
|
|
|||||||||||||
87
Table of Contents
| 4) | Loans Receivable, Net…continued |
| December 31, 2010 | ||||||||||||||||||||||||
| Residential | Commercial | Other | Home | Other | ||||||||||||||||||||
|
(Dollars in thousands) |
Total | Real Estate | Real Estate | Commercial | Equity | Consumer | ||||||||||||||||||
|
Allowance for loan and lease losses |
||||||||||||||||||||||||
|
Individually evaluated for impairment |
$ | 16,871 | 2,793 | 10,184 | 2,649 | 504 | 741 | |||||||||||||||||
|
Collectively evaluated for impairment |
120,236 | 18,164 | 65,963 | 17,283 | 12,830 | 5,996 | ||||||||||||||||||
|
|
|
|
|
|
|
|
|
|
|
|
|
|||||||||||||
|
Total allowance for loan and lease losses |
$ | 137,107 | 20,957 | 76,147 | 19,932 | 13,334 | 6,737 | |||||||||||||||||
|
|
|
|
|
|
|
|
|
|
|
|
|
|||||||||||||
|
Loans receivable |
||||||||||||||||||||||||
|
Individually evaluated for impairment |
$ | 225,052 | 29,480 | 165,784 | 21,358 | 6,138 | 2,292 | |||||||||||||||||
|
Collectively evaluated for impairment |
3,524,237 | 603,397 | 1,630,719 | 633,230 | 476,999 | 179,892 | ||||||||||||||||||
|
|
|
|
|
|
|
|
|
|
|
|
|
|||||||||||||
|
Total loans receivable |
$ | 3,749,289 | 632,877 | 1,796,503 | 654,588 | 483,137 | 182,184 | |||||||||||||||||
|
|
|
|
|
|
|
|
|
|
|
|
|
|||||||||||||
Substantially all of the Company’s loan receivables are with customers within the Company’s market areas. Although the Company has a diversified loan portfolio, a substantial portion of its customers’ ability to honor their obligations is dependent upon the economic performance in the Company’s market areas. The bank subsidiaries are subject to regulatory limits for the amount of loans to any individual borrower and all bank subsidiaries are in compliance as of December 31, 2011 and 2010. No borrower had outstanding loans or commitments exceeding 10 percent of the Company’s consolidated stockholders’ equity as of December 31, 2011.
Net deferred fees, costs, premiums, and discounts of $3,123,000 and $6,001,000 are included in the loans receivable balance at December 31, 2011 and 2010, respectively. At December 31, 2011, the Company had $2,285,032,000 in variable rate loans and $1,181,103,000 in fixed rate loans. The weighted average interest rate on loans was 5.62 percent and 5.79 percent at December 31, 2011 and 2010, respectively. At December 31, 2011, 2010 and 2009, loans sold and serviced for others were $160,465,000, $173,446,000, and $176,231,000, respectively. At December 31, 2011, the Company had loans of $1,788,872,000 pledged as collateral for FHLB advances, FRB and U.S. Treasury Tax and Loan borrowings. There were no significant purchases or sales of loans held-to-maturity during 2011 or 2010.
The following is a summary of activity in the ALLL for the years ended December 31, 2011, 2010 and 2009:
| Years ended December 31, | ||||||||||||
|
(Dollars in thousands) |
2011 | 2010 | 2009 | |||||||||
|
Balance at beginning of period |
$ | 137,107 | 142,927 | 76,739 | ||||||||
|
Provision for loan losses |
64,500 | 84,693 | 124,618 | |||||||||
|
Charge-offs |
(69,366 | ) | (93,950 | ) | (60,896 | ) | ||||||
|
Recoveries |
5,275 | 3,437 | 2,466 | |||||||||
|
|
|
|
|
|
|
|||||||
|
Balance at end of period |
$ | 137,516 | 137,107 | 142,927 | ||||||||
|
|
|
|
|
|
|
|||||||
88
Table of Contents
| 4) | Loans Receivable, Net…continued |
The following schedules disclose the impaired loans by portfolio class of loans:
| At or for the Year ended December 31, 2011 | ||||||||||||||||||||||||
| Residential | Commercial | Other | Home | Other | ||||||||||||||||||||
|
(Dollars in thousands) |
Total | Real Estate | Real Estate | Commercial | Equity | Consumer | ||||||||||||||||||
|
Loans with a specific valuation allowance |
||||||||||||||||||||||||
|
Recorded balance |
$ | 77,717 | 11,111 | 39,971 | 22,087 | 1,219 | 3,329 | |||||||||||||||||
|
Unpaid principal balance |
85,514 | 11,177 | 47,569 | 22,196 | 1,238 | 3,334 | ||||||||||||||||||
|
Valuation allowance |
18,828 | 2,659 | 9,756 | 4,233 | 584 | 1,596 | ||||||||||||||||||
|
Average impaired loans |
66,871 | 10,330 | 38,805 | 13,395 | 1,284 | 3,057 | ||||||||||||||||||
|
Loans without a specific valuation allowance |
||||||||||||||||||||||||
|
Recorded balance |
$ | 180,942 | 13,342 | 122,988 | 27,875 | 13,531 | 3,206 | |||||||||||||||||
|
Unpaid principal balance |
208,828 | 14,741 | 139,962 | 35,174 | 15,097 | 3,854 | ||||||||||||||||||
|
Average impaired loans |
168,983 | 14,730 | 123,231 | 19,963 | 8,975 | 2,084 | ||||||||||||||||||
|
Totals |
||||||||||||||||||||||||
|
Recorded balance |
$ | 258,659 | 24,453 | 162,959 | 49,962 | 14,750 | 6,535 | |||||||||||||||||
|
Unpaid principal balance |
294,342 | 25,918 | 187,531 | 57,370 | 16,335 | 7,188 | ||||||||||||||||||
|
Valuation allowance |
18,828 | 2,659 | 9,756 | 4,233 | 584 | 1,596 | ||||||||||||||||||
|
Average impaired loans |
235,854 | 25,060 | 162,036 | 33,358 | 10,259 | 5,141 | ||||||||||||||||||
| At or for the Year ended December 31, 2010 | ||||||||||||||||||||||||
| Residential | Commercial | Other | Home | Other | ||||||||||||||||||||
|
(Dollars in thousands) |
Total | Real Estate | Real Estate | Commercial | Equity | Consumer | ||||||||||||||||||
|
Loans with a specific valuation allowance |
||||||||||||||||||||||||
|
Recorded balance |
$ | 65,170 | 12,473 | 44,338 | 5,898 | 732 | 1,729 | |||||||||||||||||
|
Unpaid principal balance |
73,195 | 12,970 | 50,614 | 6,934 | 945 | 1,732 | ||||||||||||||||||
|
Valuation allowance |
16,871 | 2,793 | 10,184 | 2,649 | 504 | 741 | ||||||||||||||||||
|
Average impaired loans |
71,192 | 10,599 | 51,627 | 5,773 | 1,514 | 1,679 | ||||||||||||||||||
|
Loans without a specific valuation allowance |
||||||||||||||||||||||||
|
Recorded balance |
$ | 159,882 | 17,007 | 121,446 | 15,460 | 5,406 | 563 | |||||||||||||||||
|
Unpaid principal balance |
186,280 | 20,399 | 142,141 | 16,909 | 6,204 | 627 | ||||||||||||||||||
|
Average impaired loans |
152,364 | 18,402 | 109,136 | 17,412 | 5,696 | 1,718 | ||||||||||||||||||
|
Totals |
||||||||||||||||||||||||
|
Recorded balance |
$ | 225,052 | 29,480 | 165,784 | 21,358 | 6,138 | 2,292 | |||||||||||||||||
|
Unpaid principal balance |
259,475 | 33,369 | 192,755 | 23,843 | 7,149 | 2,359 | ||||||||||||||||||
|
Valuation allowance |
16,871 | 2,793 | 10,184 | 2,649 | 504 | 741 | ||||||||||||||||||
|
Average impaired loans |
223,556 | 29,001 | 160,763 | 23,185 | 7,210 | 3,397 | ||||||||||||||||||
89
Table of Contents
| 4) | Loans Receivable, Net…continued |
Interest income recognized on impaired loans for the periods ended December 31, 2011, 2010 and 2009 was not significant.
The following is a loan portfolio aging analysis on a portfolio class basis:
| December 31, 2011 | ||||||||||||||||||||||||
|
(Dollars in thousands) |
Total |
Residential
Real Estate |
Commercial
Real Estate |
Other
Commercial |
Home
Equity |
Other
Consumer |
||||||||||||||||||
|
Accruing loans 30-59 days past due |
$ | 31,386 | 9,038 | 12,683 | 3,279 | 4,092 | 2,294 | |||||||||||||||||
|
Accruing loans 60-89 days past due |
17,700 | 2,678 | 11,660 | 1,034 | 1,276 | 1,052 | ||||||||||||||||||
|
Accruing loans 90 days or more past due |
1,413 | 59 | 108 | 1,060 | 156 | 30 | ||||||||||||||||||
|
Non-accrual loans |
133,689 | 11,881 | 87,956 | 21,685 | 10,272 | 1,895 | ||||||||||||||||||
|
|
|
|
|
|
|
|
|
|
|
|
|
|||||||||||||
|
Total past due and non-accrual loans |
184,188 | 23,656 | 112,407 | 27,058 | 15,796 | 5,271 | ||||||||||||||||||
|
Current loans receivable |
3,281,947 | 493,151 | 1,559,652 | 596,810 | 424,773 | 207,561 | ||||||||||||||||||
|
|
|
|
|
|
|
|
|
|
|
|
|
|||||||||||||
|
Total loans receivable |
$ | 3,466,135 | 516,807 | 1,672,059 | 623,868 | 440,569 | 212,832 | |||||||||||||||||
|
|
|
|
|
|
|
|
|
|
|
|
|
|||||||||||||
| December 31, 2010 | ||||||||||||||||||||||||
|
(Dollars in thousands) |
Total |
Residential
Real Estate |
Commercial
Real Estate |
Other
Commercial |
Home
Equity |
Other
Consumer |
||||||||||||||||||
|
Accruing loans 30-59 days past due |
$ | 36,545 | 13,450 | 11,399 | 6,262 | 3,031 | 2,403 | |||||||||||||||||
|
Accruing loans 60-89 days past due |
8,952 | 1,494 | 4,424 | 1,053 | 1,642 | 339 | ||||||||||||||||||
|
Accruing loans 90 days or more past due |
4,531 | 506 | 731 | 2,320 | 910 | 64 | ||||||||||||||||||
|
Non-accrual loans |
192,505 | 23,095 | 142,334 | 18,802 | 5,431 | 2,843 | ||||||||||||||||||
|
|
|
|
|
|
|
|
|
|
|
|
|
|||||||||||||
|
Total past due and non-accrual loans |
242,533 | 38,545 | 158,888 | 28,437 | 11,014 | 5,649 | ||||||||||||||||||
|
Current loans receivable |
3,506,756 | 594,332 | 1,637,615 | 626,151 | 472,123 | 176,535 | ||||||||||||||||||
|
|
|
|
|
|
|
|
|
|
|
|
|
|||||||||||||
|
Total loans receivable |
$ | 3,749,289 | 632,877 | 1,796,503 | 654,588 | 483,137 | 182,184 | |||||||||||||||||
|
|
|
|
|
|
|
|
|
|
|
|
|
|||||||||||||
Interest income that would have been recorded on non-accrual loans if such loans had been current for the entire period would have been approximately $7,441,000, $10,987,000, and $11,730,000 for the years ended December 31, 2011, 2010, and 2009, respectively.
The following is a summary of the TDRs that occurred during the period presented and the TDRs that occurred within the previous twelve months that subsequently defaulted during the periods presented on a portfolio class basis:
| Year ended December 31, 2011 | ||||||||||||||||||||||||
|
(Dollars in thousands) |
Total |
Residential
Real Estate |
Commercial
Real Estate |
Other
Commercial |
Home
Equity |
Other
Consumer |
||||||||||||||||||
|
Troubled debt restructurings |
||||||||||||||||||||||||
|
Number of loans |
338 | 20 | 120 | 149 | 22 | 27 | ||||||||||||||||||
|
Pre-modification outstanding balance |
$ | 158,295 | 13,500 | 109,593 | 20,446 | 9,198 | 5,558 | |||||||||||||||||
|
Post-modification outstanding balance |
$ | 155,827 | 13,452 | 107,778 | 20,434 | 9,200 | 4,963 | |||||||||||||||||
|
Troubled debt restructurings that subsequently defaulted |
||||||||||||||||||||||||
|
Number of loans |
66 | 4 | 29 | 22 | 7 | 4 | ||||||||||||||||||
|
Recorded balance |
$ | 41,236 | 2,291 | 32,615 | 2,718 | 3,202 | 410 | |||||||||||||||||
90
Table of Contents
| 4) | Loans Receivable, Net…continued |
The majority of TDRs occurring in most loan classes was a result of extensions of the maturity date and in total accounted for approximately 58 percent of the TDRs. For commercial real estate, the class with the largest amount of TDRs, approximately 56 percent were extensions of the maturity date and 31 percent were a combination of extensions of the maturity date, reductions in the interest rate or reductions in the loan balance.
In addition to the TDRs that occurred during the periods provided in the preceding tables, the Company had TDRs with pre-modification loan balances of $96,528,000 for the year ended December 31, 2011 for which other real estate owned was received in full or partial satisfaction of the loans. The majority of such TDRs were in commercial real estate.
As a result of adopting the FASB amendment relating to TDRs during the third quarter of 2011, the Company reassessed all loan restructurings that occurred during the first six months of 2011 for potential identification as TDRs. With respect to loan restructurings occurring in the first six months of 2011, the Company newly identified $74,557,000 as TDRs all of which were considered impaired as of September 30, 2011. Of these newly identified TDRs, $53,319,000 were not previously identified as impaired loans; such loans had a valuation allowance of $3,221,000 as of September 30, 2011. The remaining $21,238,000 of newly identified TDRs were previously considered to be impaired and the Company continues to allocate a specific valuation allowance.
There were $3,158,000 of additional outstanding commitments on TDRs outstanding at December 31, 2011. The amount of charge-offs on TDRs during 2011 was $8,792,000.
The Company has entered into transactions with its executive officers, directors, significant shareholders, and their affiliates. The aggregate amount of loans outstanding to such related parties at December 31, 2011 and 2010 was $89,089,000 and $89,250,000, respectively. During 2011, new loans to such related parties were $18,582,000 and repayments were $18,743,000. In management’s opinion, such loans were made in the ordinary course of business and were made on substantially the same terms as those prevailing at the time for comparable transaction with other persons.
| 5) | Premises and Equipment, Net |
Premises and equipment, net of accumulated depreciation, consist of the following at:
| December 31, | ||||||||
|
(Dollars in thousands) |
2011 | 2010 | ||||||
|
Land |
$ | 25,022 | 24,933 | |||||
|
Office buildings and construction in progress |
145,999 | 134,486 | ||||||
|
Furniture, fixtures and equipment |
62,002 | 60,496 | ||||||
|
Leasehold improvements |
7,766 | 8,836 | ||||||
|
Accumulated depreciation |
(81,917 | ) | (76,259 | ) | ||||
|
|
|
|
|
|||||
|
Net premises and equipment |
$ | 158,872 | 152,492 | |||||
|
|
|
|
|
|||||
Depreciation expense for the years ended December 31, 2011, 2010, and 2009 was $10,443,000, $10,808,000, and $10,450,000, respectively. Interest expense capitalized for various construction projects for the years ended December 31, 2011, 2010 and 2009 was $35,000, $65,000 and $33,000, respectively.
91
Table of Contents
| 6) | Other Intangible Assets and Goodwill |
The following table sets forth information regarding the Company’s core deposit intangibles:
|
At or for the
Years ended December 31, |
||||||||||||
|
(Dollars in thousands) |
2011 | 2010 | 2009 | |||||||||
|
Gross carrying value |
$ | 31,847 | 31,847 | 31,847 | ||||||||
|
Accumulated amortization |
(23,563 | ) | (21,090 | ) | (17,910 | ) | ||||||
|
|
|
|
|
|
|
|||||||
|
Net carrying value |
$ | 8,284 | 10,757 | 13,937 | ||||||||
|
|
|
|
|
|
|
|||||||
|
Aggregate amortization expense |
$ | 2,473 | 3,180 | 3,116 | ||||||||
|
Weighted-average amortization period |
||||||||||||
|
(Period in years) |
9.1 | |||||||||||
|
Estimated amortization expense |
||||||||||||
|
For the year ended December 31, 2012 |
$ | 2,111 | ||||||||||
|
For the year ended December 31, 2013 |
1,860 | |||||||||||
|
For the year ended December 31, 2014 |
1,611 | |||||||||||
|
For the year ended December 31, 2015 |
1,368 | |||||||||||
|
For the year ended December 31, 2016 |
1,037 | |||||||||||
The changes in the carrying amount of goodwill and accumulated impairment charge are as follows:
|
At or for
the
Years ended December 31, |
||||||||
|
(Dollars in thousands) |
2011 | 2010 | ||||||
|
Net carrying value at beginning of period |
$ | 146,259 | 146,259 | |||||
|
Impairment charge |
(40,159 | ) | — | |||||
|
|
|
|
|
|||||
|
Net carrying value at end of period |
106,100 | 146,259 | ||||||
|
|
|
|
|
|||||
|
Gross carrying value |
146,259 | 146,259 | ||||||
|
Accumulated impairment charge |
(40,159 | ) | — | |||||
|
|
|
|
|
|||||
|
Net carrying value |
$ | 106,100 | 146,259 | |||||
|
|
|
|
|
|||||
The Company performed its annual goodwill impairment test during the third quarter of 2011. Due to high levels of volatility and dislocation in bank stock prices nationwide during the third quarter 2011, as well as the Company’s internal evaluation process, the Company engaged an independent third party valuation firm to determine the implied fair value of Mountain West and 1st Bank. These two bank subsidiaries were selected because of Mountain West’s losses and decline in credit quality and 1st Bank’s significant amount of goodwill relative to its total assets. The implied fair value of these bank subsidiaries was estimated using the quoted market prices of other comparable banks, discounted cash flows and inputs from comparable transactions. As a result of the evaluation, the Company determined the goodwill of $23,159,000 ($15,613,000 after-tax) at Mountain West was fully impaired and the goodwill of $41,718,000 at 1st Bank was partially impaired by $17,000,000. The remaining goodwill of $81,382,000 at the other bank subsidiaries was determined not to be impaired at September 30, 2011. Since there were no events or circumstances that occurred during the fourth quarter of 2011 that would more-likely-than not reduce the fair value of a reporting unit below its carrying value, the Company did not perform interim testing at December 31, 2011.
92
Table of Contents
| 7) | Deposits |
Deposits consist of the following at:
| December 31, | ||||||||||||||||
|
(Dollars in thousands) |
2011 | 2010 | ||||||||||||||
|
Non-interest bearing deposits |
$ | 1,010,899 | 21.0 | % | 855,829 | 18.9 | % | |||||||||
|
|
|
|
|
|
|
|
|
|||||||||
|
NOW accounts |
843,129 | 17.5 | % | 771,961 | 17.1 | % | ||||||||||
|
Savings accounts |
404,671 | 8.4 | % | 361,124 | 8.0 | % | ||||||||||
|
Money market deposit accounts |
873,562 | 18.1 | % | 876,948 | 19.4 | % | ||||||||||
|
Certificate accounts |
1,080,917 | 22.4 | % | 1,079,138 | 23.9 | % | ||||||||||
|
Wholesale deposits 1 |
608,035 | 12.6 | % | 576,902 | 12.7 | % | ||||||||||
|
|
|
|
|
|
|
|
|
|||||||||
|
Total interest bearing deposits |
3,810,314 | 79.0 | % | 3,666,073 | 81.1 | % | ||||||||||
|
|
|
|
|
|
|
|
|
|||||||||
|
Total deposits |
$ | 4,821,213 | 100.0 | % | 4,521,902 | 100.0 | % | |||||||||
|
|
|
|
|
|
|
|
|
|||||||||
|
Deposits with a balance of $100,000 and greater |
||||||||||||||||
|
Demand deposits |
$ | 1,986,757 | 1,812,587 | |||||||||||||
|
Certificate accounts |
933,183 | 911,854 | ||||||||||||||
|
|
|
|
|
|||||||||||||
|
Total balances of $100,000 and greater |
$ | 2,919,940 | 2,724,441 | |||||||||||||
|
|
|
|
|
|||||||||||||
| 1 |
Wholesale deposits include brokered deposits classified as NOW, money market deposit and certificate accounts, including reciprocal deposits. |
The scheduled maturities of certificates of deposit are as follows and include $380,820,000 and $397,531,000 of wholesale deposits as of December 31, 2011 and 2010, respectively.
| December 31, | ||||||||
|
(Dollars in thousands) |
2011 | 2010 | ||||||
|
Maturing within one year |
$ | 1,147,799 | 1,180,365 | |||||
|
Maturing after one year through two years |
175,544 | 170,836 | ||||||
|
Maturing after two years through three years |
70,701 | 74,408 | ||||||
|
Maturing after three years through four years |
36,225 | 17,787 | ||||||
|
Maturing after four years through five years |
31,403 | 33,068 | ||||||
|
Thereafter |
65 | 205 | ||||||
|
|
|
|
|
|||||
|
Total |
$ | 1,461,737 | 1,476,669 | |||||
|
|
|
|
|
|||||
Interest expense on deposits is summarized as follows:
| Years ended December 31, | ||||||||||||
|
(Dollars in thousands) |
2011 | 2010 | 2009 | |||||||||
|
NOW accounts |
$ | 1,906 | 2,545 | 2,275 | ||||||||
|
Savings accounts |
511 | 725 | 947 | |||||||||
|
Money market deposit accounts |
3,667 | 6,975 | 8,436 | |||||||||
|
Certificate accounts |
16,332 | 21,016 | 24,719 | |||||||||
|
Wholesale deposits |
2,853 | 4,337 | 2,052 | |||||||||
|
|
|
|
|
|
|
|||||||
|
Total interest expense on deposits |
$ | 25,269 | 35,598 | 38,429 | ||||||||
|
|
|
|
|
|
|
|||||||
93
Table of Contents
| 7) | Deposits…continued |
The Company reclassified $2,205,000 and $4,298,000 of overdraft demand deposits to loans as of December 31, 2011 and 2010, respectively. The Company has entered into deposit transactions with its executive officers, directors, significant shareholders, and their affiliates. The aggregate amount of deposits with such related parties at December 31, 2011, and 2010 was $71,504,000 and $53,388,000, respectively.
Debit card expense for the years ended December 31, 2011, 2010, and 2009 was $4,073,000, $3,003,000, and $1,585,000, respectively, and was included in other expense in the Company’s statements of operations.
| 8) | Securities Sold Under Agreements to Repurchase |
Securities sold under agreements to repurchase (“repurchase agreements”) consist of the following:
| December 31, 2011 | ||||||||||||||||
|
(Dollars in thousands) |
Repurchase
Amount |
Weighted
Average Fixed Rate |
Amortized
Cost of Underlying Assets |
Fair
Value of Underlying Assets |
||||||||||||
|
Overnight |
$ | 257,802 | 0.42 | % | $ | 260,124 | 265,592 | |||||||||
|
Maturing within 30 days |
841 | 1.00 | % | 1,855 | 1,916 | |||||||||||
|
|
|
|
|
|
|
|||||||||||
| $ | 258,643 | 0.42 | % | $ | 261,979 | 267,508 | ||||||||||
|
|
|
|
|
|
|
|||||||||||
| December 31, 2010 | ||||||||||||||||
|
(Dollars in thousands) |
Repurchase
Amount |
Weighted
Average Fixed Rate |
Amortized
Cost of Underlying Assets |
Fair
Value of Underlying Assets |
||||||||||||
|
Overnight |
$ | 247,749 | 0.62 | % | $ | 247,712 | 255,271 | |||||||||
|
Maturing within 30 days |
418 | 2.00 | % | 870 | 902 | |||||||||||
|
Maturing after 90 days |
1,236 | 1.75 | % | 2,570 | 2,665 | |||||||||||
|
|
|
|
|
|
|
|||||||||||
| $ | 249,403 | 0.63 | % | $ | 251,152 | 258,838 | ||||||||||
|
|
|
|
|
|
|
|||||||||||
The securities, consisting of U.S. government sponsored enterprises issued or guaranteed residential mortgage-backed securities, subject to agreements to repurchase were for the same securities originally sold, and were held in a custody account by a third parties.
94
Table of Contents
| 9) | Borrowings |
Each advance from the FHLB bears a fixed rate of interest and consist of the following:
| December 31, | ||||||||||||||||
| 2011 | 2010 | |||||||||||||||
|
(Dollars in thousands) |
Amount |
Weighted
Rate |
Amount |
Weighted
Rate |
||||||||||||
|
Maturing within one year |
$ | 792,000 | 0.68 | % | 761,064 | 0.32 | % | |||||||||
|
Maturing one year through two years |
— | 0.00 | % | 82,000 | 4.19 | % | ||||||||||
|
Maturing two years through three years |
— | 0.00 | % | — | 0.00 | % | ||||||||||
|
Maturing three years through four years |
75,000 | 3.48 | % | — | 0.00 | % | ||||||||||
|
Maturing four years through five years |
45,000 | 2.99 | % | 75,000 | 3.48 | % | ||||||||||
|
Thereafter |
157,046 | 3.07 | % | 47,077 | 3.09 | % | ||||||||||
|
|
|
|
|
|||||||||||||
|
Total |
$ | 1,069,046 | 1.32 | % | 965,141 | 1.03 | % | |||||||||
|
|
|
|
|
|||||||||||||
In addition to specifically pledged loans and investment securities, FHLB advances are collateralized by FHLB stock owned by the Company and a blanket assignment of the unpledged qualifying loans and investments.
With respect to $357,000,000 of FHLB advances at December 31, 2011, the FHLB holds put options that will be exercised on the quarterly measurement date, after the initial lockout (i.e., nonputable) period, when 3-month LIBOR is 8 percent or greater. The FHLB put options as of December 31, 2011 are summarized as follows:
|
(Dollars in thousands) |
Amount |
Interest
Rate |
Earliest
Put |
|||||||
|
Maturing during years ending December 31, |
||||||||||
|
2012 |
$ | 82,000 | 3.49% - 4.83% | 2012 | ||||||
|
2015 |
75,000 | 3.16% - 3.64% | 2012 | |||||||
|
2016 |
45,000 | 2.93% - 3.05% | 2012 | |||||||
|
2018 |
20,000 | 2.73% - 2.85% | 2012 | |||||||
|
2021 |
135,000 | 2.88% - 3.43% | 2012 | |||||||
|
|
|
|||||||||
| $ | 357,000 | |||||||||
|
|
|
|||||||||
The Company’s remaining borrowings consisted of U.S. Treasury Tax and Loan borrowings, capital lease obligations, liens on other real estate owned, deferred gains from sales of small business administration loans, and other debt obligations through consolidation of certain VIEs. At December 31, 2011, the Company had $183,860,000 in unsecured lines of credit with various correspondent entities which are typically renewed on an annual basis.
95
Table of Contents
| 10) | Subordinated Debentures |
Trust preferred securities were issued by the Company’s seven trust subsidiaries, the common stock of which is wholly-owned by the Company, in conjunction with the Company issuing subordinated debentures to the trust subsidiaries. The terms of the subordinated debentures are the same as the terms of the trust preferred securities. The Company guaranteed the payment of distributions and payments for redemption or liquidation of the trust preferred securities to the extent of funds held by the trust subsidiaries. The obligations of the Company under the subordinated debentures together with the guarantee and other back-up obligations, in the aggregate, constitute a full and unconditional guarantee by the Company of the obligations of all trusts under the trust preferred securities.
The trust preferred securities are subject to mandatory redemption upon repayment of the subordinated debentures at their stated maturity date or the earlier redemption in an amount equal to their liquidation amount plus accumulated and unpaid distributions to the date of redemption. Interest distributions are payable quarterly. The Company may defer the payment of interest at any time from time to time for a period not exceeding 20 consecutive quarters provided that the deferral period does not extend past the stated maturity. During any such deferral period, distributions on the trust preferred securities will also be deferred and the Company’s ability to pay dividends on its common shares will be restricted.
Subject to prior approval by the FRB, the trust preferred securities may be redeemed at par prior to maturity at the Company’s option on or after the redemption date. The trust preferred securities may also be redeemed at any time in whole (but not in part) for the Trusts in the event of unfavorable changes in laws or regulations that result in 1) subsidiary trusts becoming subject to federal income tax on income received on the subordinated debentures, 2) interest payable by the Company on the subordinated debentures becoming non-deductible for federal tax purposes, 3) the requirement for the trusts to register under the Investment Company Act of 1940, as amended, or 4) loss of the ability to treat the trust preferred securities as “Tier 1 Capital” under the FRB capital adequacy guidelines.
The terms of the subordinated debentures, arranged by maturity date, are reflected in the table below. The amounts include fair value adjustments from acquisitions.
|
(Dollars in thousands) |
Balance |
Rate at
December 31, 2011 |
Fixed/
Variable |
Variable Rate
Structure 1 |
Maturity
Date |
Redemption
Date |
||||||||||||||||||
|
First Co Trust 01 |
$ | 2,892 | 3.728 | % | Variable | 3 mo LIBOR plus 3.30 | % | 07/31/31 | 07/31/06 | |||||||||||||||
|
First Co Trust 03 |
2,137 | 3.824 | % | Variable | 3 mo LIBOR plus 3.25 | % | 03/26/33 | 03/26/08 | ||||||||||||||||
|
Glacier Trust II |
46,393 | 3.153 | % | Variable | 3 mo LIBOR plus 2.75 | % | 04/07/34 | 04/07/09 | ||||||||||||||||
|
Citizens Trust I |
5,155 | 3.209 | % | Variable | 3 mo LIBOR plus 2.65 | % | 06/17/34 | 06/17/09 | ||||||||||||||||
|
Glacier Trust III |
36,083 | 1.693 | % | Variable | 3 mo LIBOR plus 1.29 | % | 04/07/36 | 04/07/11 | ||||||||||||||||
|
Glacier Trust IV |
30,928 | 2.116 | % | Variable | 3 mo LIBOR plus 1.57 | % | 09/15/36 | 09/15/11 | ||||||||||||||||
|
San Juans Trust I |
1,687 | 6.681 | % | Fixed | 3 mo LIBOR plus 1.82 | % | 03/01/37 | 03/01/12 | ||||||||||||||||
|
|
|
|||||||||||||||||||||||
| $ | 125,275 | |||||||||||||||||||||||
|
|
|
|||||||||||||||||||||||
| 1 |
For fixed rate debentures, this will be the rate structure upon conversion to variable rate at redemption date. |
96
Table of Contents
| 11) | Derivatives and Hedging Activities |
The Company is exposed to certain risk relating to its ongoing business operations. The primary risk managed by using derivative instruments is interest rate risk. Interest rate swaps are entered into to manage interest rate risk associated with the Company’s forecasted variable rate borrowings. The Company recognizes interest rate swaps as either assets or liabilities at fair value in the statement of financial condition.
The interest rate swaps on variable rate borrowings were designated as cash flow hedges and were over-the-counter contracts. The contracts were entered into by the Company with counterparties and the specific agreement of terms were negotiated, including the forecasted notional amount, the interest rate, and the maturity.
The Company is exposed to credit-related losses in the event of nonperformance by the counterparties to the agreements. The Company controls the credit risk through monitoring procedures and does not expect the counterparties to fail on their obligations. The Company only conducts business with primary dealers as counterparties and believes that the credit risk inherent in these contracts was not significant.
At December 31, 2011, the Company has interest rate swap agreements on a forecasted notional amount of $160,000,000. The effective date of the transaction was October 21, 2011 with the maturity date of October 21, 2021. For the first three years no cash flows will be exchanged and for the following seven years the Company will pay a fixed interest rate of 3.378 percent and the counterparty will pay the Company 3 month LIBOR. The hedging strategy converts the LIBOR based variable interest rate on forecasted borrowings to a fixed interest rate, thereby protecting the Company from floating interest rate variability.
The following table summarizes the Company’s interest rate derivative financial instruments as of December 31, 2011:
|
(Dollars in thousands) |
Balance Sheet
Location |
Notional
Amount |
Fair
Value |
|||||||||
|
Interest rate swap |
Other liabilities | $ | 160,000 | $ | 8,906 | |||||||
Pursuant to the interest rate swap agreements, the Company pledged collateral to the counterparties in the form of investment securities totaling $15,703,000 at December 31, 2011. There was no collateral pledged from the counterparties to the Company as of December 31, 2011. There is the possibility that the Company may need to pledge additional collateral in the future.
97
Table of Contents
| 12) | Regulatory Capital |
The FRB has adopted capital adequacy guidelines pursuant to which it assesses the adequacy of capital in supervising a bank holding company. The following table illustrates the FRB’s adequacy guidelines and the Company’s and bank subsidiaries’ compliance with those guidelines as of December 31, 2011.
| Actual |
Minimum Capital
Requirement |
Well Capitalized
Requirement |
||||||||||||||||||||||
| Amount | Ratio | Amount | Ratio | Amount | Ratio | |||||||||||||||||||
|
Tier 1 capital (to risk weighted assets) |
||||||||||||||||||||||||
|
Consolidated |
828,404 | 18.99 | % | 174,475 | 4.00 | % | 261,712 | 6.00 | % | |||||||||||||||
|
Glacier |
175,066 | 18.67 | % | 37,517 | 4.00 | % | 56,275 | 6.00 | % | |||||||||||||||
|
Mountain West |
139,809 | 19.13 | % | 29,237 | 4.00 | % | 43,855 | 6.00 | % | |||||||||||||||
|
First Security |
112,198 | 15.91 | % | 28,207 | 4.00 | % | 42,310 | 6.00 | % | |||||||||||||||
|
Western |
64,520 | 15.82 | % | 16,316 | 4.00 | % | 24,474 | 6.00 | % | |||||||||||||||
|
1st Bank |
64,267 | 18.22 | % | 14,113 | 4.00 | % | 21,169 | 6.00 | % | |||||||||||||||
|
Valley |
31,059 | 12.76 | % | 9,738 | 4.00 | % | 14,607 | 6.00 | % | |||||||||||||||
|
Big Sky |
65,218 | 24.15 | % | 10,801 | 4.00 | % | 16,201 | 6.00 | % | |||||||||||||||
|
First Bank-WY |
39,670 | 18.90 | % | 8,395 | 4.00 | % | 12,592 | 6.00 | % | |||||||||||||||
|
Citizens |
26,358 | 12.58 | % | 8,382 | 4.00 | % | 12,572 | 6.00 | % | |||||||||||||||
|
First Bank-MT |
20,854 | 13.79 | % | 6,050 | 4.00 | % | 9,075 | 6.00 | % | |||||||||||||||
|
San Juans |
19,161 | 12.36 | % | 6,201 | 4.00 | % | 9,302 | 6.00 | % | |||||||||||||||
|
Total capital (to risk weighted assets) |
||||||||||||||||||||||||
|
Consolidated |
883,954 | 20.27 | % | 348,950 | 8.00 | % | 436,187 | 10.00 | % | |||||||||||||||
|
Glacier |
187,082 | 19.95 | % | 75,033 | 8.00 | % | 93,792 | 10.00 | % | |||||||||||||||
|
Mountain West |
149,280 | 20.42 | % | 58,474 | 8.00 | % | 73,092 | 10.00 | % | |||||||||||||||
|
First Security |
121,181 | 17.18 | % | 56,414 | 8.00 | % | 70,517 | 10.00 | % | |||||||||||||||
|
Western |
69,646 | 17.07 | % | 32,632 | 8.00 | % | 40,790 | 10.00 | % | |||||||||||||||
|
1st Bank |
68,729 | 19.48 | % | 28,225 | 8.00 | % | 35,282 | 10.00 | % | |||||||||||||||
|
Valley |
34,117 | 14.01 | % | 19,476 | 8.00 | % | 24,345 | 10.00 | % | |||||||||||||||
|
Big Sky |
68,661 | 25.43 | % | 21,601 | 8.00 | % | 27,002 | 10.00 | % | |||||||||||||||
|
First Bank-WY |
41,860 | 19.95 | % | 16,789 | 8.00 | % | 20,987 | 10.00 | % | |||||||||||||||
|
Citizens |
29,011 | 13.85 | % | 16,763 | 8.00 | % | 20,954 | 10.00 | % | |||||||||||||||
|
First Bank-MT |
22,757 | 15.05 | % | 12,100 | 8.00 | % | 15,124 | 10.00 | % | |||||||||||||||
|
San Juans |
21,127 | 13.63 | % | 12,402 | 8.00 | % | 15,503 | 10.00 | % | |||||||||||||||
|
Leverage capital (to average assets) |
||||||||||||||||||||||||
|
Consolidated |
828,404 | 11.81 | % | 280,602 | 4.00 | % | N/A | N/A | ||||||||||||||||
|
Glacier |
175,066 | 13.00 | % | 53,846 | 4.00 | % | 67,308 | 5.00 | % | |||||||||||||||
|
Mountain West |
139,809 | 12.81 | % | 43,660 | 4.00 | % | 54,575 | 5.00 | % | |||||||||||||||
|
First Security |
112,198 | 10.49 | % | 42,793 | 4.00 | % | 53,492 | 5.00 | % | |||||||||||||||
|
Western |
64,520 | 8.28 | % | 31,159 | 4.00 | % | 38,949 | 5.00 | % | |||||||||||||||
|
1st Bank |
64,267 | 8.49 | % | 30,279 | 4.00 | % | 37,849 | 5.00 | % | |||||||||||||||
|
Valley |
31,059 | 6.94 | % | 17,906 | 4.00 | % | 22,382 | 5.00 | % | |||||||||||||||
|
Big Sky |
65,218 | 17.33 | % | 15,057 | 4.00 | % | 18,821 | 5.00 | % | |||||||||||||||
|
First Bank-WY |
39,670 | 10.40 | % | 15,264 | 4.00 | % | 19,080 | 5.00 | % | |||||||||||||||
|
Citizens |
26,358 | 7.65 | % | 13,783 | 4.00 | % | 17,228 | 5.00 | % | |||||||||||||||
|
First Bank-MT |
20,854 | 8.33 | % | 10,008 | 4.00 | % | 12,510 | 5.00 | % | |||||||||||||||
|
San Juans |
19,161 | 8.48 | % | 9,042 | 4.00 | % | 11,303 | 5.00 | % | |||||||||||||||
98
Table of Contents
| 12) | Regulatory Capital…continued |
The following table illustrates the FRB’s adequacy guidelines and the Company’s and bank subsidiaries’ compliance with those guidelines as of December 31, 2010:
| Actual |
Minimum capital
requirement |
Well capitalized
requirement |
||||||||||||||||||||||
| Amount | Ratio | Amount | Ratio | Amount | Ratio | |||||||||||||||||||
|
Tier 1 capital (to risk weighted assets) |
||||||||||||||||||||||||
|
Consolidated |
811,618 | 18.24 | % | 177,973 | 4.00 | % | 266,959 | 6.00 | % | |||||||||||||||
|
Glacier |
162,190 | 16.61 | % | 39,060 | 4.00 | % | 58,590 | 6.00 | % | |||||||||||||||
|
Mountain West |
154,575 | 18.81 | % | 32,879 | 4.00 | % | 49,318 | 6.00 | % | |||||||||||||||
|
First Security |
104,291 | 15.35 | % | 27,174 | 4.00 | % | 40,761 | 6.00 | % | |||||||||||||||
|
Western |
63,735 | 15.30 | % | 16,658 | 4.00 | % | 24,987 | 6.00 | % | |||||||||||||||
|
1st Bank |
61,497 | 17.60 | % | 13,976 | 4.00 | % | 20,964 | 6.00 | % | |||||||||||||||
|
Valley |
30,048 | 13.82 | % | 8,695 | 4.00 | % | 13,042 | 6.00 | % | |||||||||||||||
|
Big Sky |
62,570 | 21.95 | % | 11,402 | 4.00 | % | 17,103 | 6.00 | % | |||||||||||||||
|
First Bank-WY |
38,476 | 18.74 | % | 8,212 | 4.00 | % | 12,318 | 6.00 | % | |||||||||||||||
|
Citizens |
24,235 | 11.85 | % | 8,179 | 4.00 | % | 12,268 | 6.00 | % | |||||||||||||||
|
First Bank-MT |
19,497 | 13.93 | % | 5,599 | 4.00 | % | 8,399 | 6.00 | % | |||||||||||||||
|
San Juans |
18,681 | 11.76 | % | 6,356 | 4.00 | % | 9,533 | 6.00 | % | |||||||||||||||
|
Total capital (to risk weighted assets) |
||||||||||||||||||||||||
|
Consolidated |
868,245 | 19.51 | % | 355,946 | 8.00 | % | 444,932 | 10.00 | % | |||||||||||||||
|
Glacier |
174,674 | 17.89 | % | 78,119 | 8.00 | % | 97,649 | 10.00 | % | |||||||||||||||
|
Mountain West |
165,156 | 20.09 | % | 65,757 | 8.00 | % | 82,197 | 10.00 | % | |||||||||||||||
|
First Security |
112,913 | 16.62 | % | 54,348 | 8.00 | % | 67,935 | 10.00 | % | |||||||||||||||
|
Western |
68,971 | 16.56 | % | 33,317 | 8.00 | % | 41,646 | 10.00 | % | |||||||||||||||
|
1st Bank |
65,940 | 18.87 | % | 27,952 | 8.00 | % | 34,940 | 10.00 | % | |||||||||||||||
|
Valley |
32,789 | 15.08 | % | 17,389 | 8.00 | % | 21,737 | 10.00 | % | |||||||||||||||
|
Big Sky |
66,212 | 23.23 | % | 22,804 | 8.00 | % | 28,505 | 10.00 | % | |||||||||||||||
|
First Bank-WY |
41,015 | 19.98 | % | 16,424 | 8.00 | % | 20,530 | 10.00 | % | |||||||||||||||
|
Citizens |
26,827 | 13.12 | % | 16,357 | 8.00 | % | 20,447 | 10.00 | % | |||||||||||||||
|
First Bank-MT |
21,263 | 15.19 | % | 11,198 | 8.00 | % | 13,998 | 10.00 | % | |||||||||||||||
|
San Juans |
20,699 | 13.03 | % | 12,711 | 8.00 | % | 15,889 | 10.00 | % | |||||||||||||||
|
Leverage capital (to average assets) |
||||||||||||||||||||||||
|
Consolidated |
811,618 | 12.71 | % | 255,456 | 4.00 | % | N/A | N/A | ||||||||||||||||
|
Glacier |
162,190 | 11.98 | % | 54,149 | 4.00 | % | 67,686 | 5.00 | % | |||||||||||||||
|
Mountain West |
154,575 | 13.29 | % | 46,511 | 4.00 | % | 58,139 | 5.00 | % | |||||||||||||||
|
First Security |
104,291 | 10.82 | % | 38,538 | 4.00 | % | 48,173 | 5.00 | % | |||||||||||||||
|
Western |
63,735 | 9.21 | % | 27,678 | 4.00 | % | 34,598 | 5.00 | % | |||||||||||||||
|
1st Bank |
61,497 | 9.42 | % | 26,101 | 4.00 | % | 32,626 | 5.00 | % | |||||||||||||||
|
Valley |
30,048 | 8.05 | % | 14,939 | 4.00 | % | 18,673 | 5.00 | % | |||||||||||||||
|
Big Sky |
62,570 | 17.43 | % | 14,357 | 4.00 | % | 17,946 | 5.00 | % | |||||||||||||||
|
First Bank-WY |
38,476 | 11.77 | % | 13,077 | 4.00 | % | 16,347 | 5.00 | % | |||||||||||||||
|
Citizens |
24,235 | 8.86 | % | 10,940 | 4.00 | % | 13,675 | 5.00 | % | |||||||||||||||
|
First Bank-MT |
19,497 | 9.18 | % | 8,492 | 4.00 | % | 10,615 | 5.00 | % | |||||||||||||||
|
San Juans |
18,681 | 8.83 | % | 8,466 | 4.00 | % | 10,582 | 5.00 | % | |||||||||||||||
99
Table of Contents
| 12) | Regulatory Capital…continued |
The Federal Deposit Insurance Corporation Improvement Act generally restricts a depository institution from making any capital distribution (including payment of a dividend) or paying any management fee to its bank holding company if the institution would thereafter be capitalized at less than 8 percent total capital (to risk weighted assets), 4 percent tier 1 capital (to risk weighted assets), or a 4 percent tier 1 capital (to average assets).
At December 31, 2011 and 2010, each of the bank subsidiaries’ capital measures exceed the well capitalized threshold, which requires total capital (to risk weighted assets) of at least 10 percent, tier 1 capital (to risk weighted assets) of at least 6 percent, and a leverage capital (to average assets) of at least 5 percent. Failure to meet minimum capital requirements can initiate certain mandatory and possible additional discretionary actions by regulators that, if undertaken, could have a direct material effect on the Company’s and bank subsidiaries’ financial condition. There are no conditions or events since year end that management believes have changed the Company’s or subsidiaries’ risk-based capital category. In addition to the minimum regulatory capital requirements, certain bank subsidiaries have additional regulatory capital requirements of which they are in compliance as of December 31, 2011.
Current guidance from the Federal Reserve provides, among other things, that dividends per share on the Company’s common stock generally should not exceed earnings per share, measured over the previous four fiscal quarters. The bank subsidiaries are subject to certain restrictions on the amount of dividends that they may declare without prior regulatory approval. At December 31, 2011, $77,105,000 of retained earnings at the bank subsidiary level is available to the Parent without regulatory approval.
| 13) | Comprehensive Income |
The components of comprehensive income and related tax effects are as follows:
| Years ended December 31, | ||||||||||||
|
(Dollars in thousands) |
2011 | 2010 | 2009 | |||||||||
|
Net income |
$ | 17,471 | 42,330 | 34,374 | ||||||||
|
Unrealized holding gains on available-for-sale securities |
63,190 | 6,263 | 7,474 | |||||||||
|
Reclassification adjustment for gains included in net income |
(346 | ) | (4,822 | ) | (5,995 | ) | ||||||
|
|
|
|
|
|
|
|||||||
|
Net unrealized gains on securities |
62,844 | 1,441 | 1,479 | |||||||||
|
Tax effect |
(24,444 | ) | (565 | ) | (584 | ) | ||||||
|
|
|
|
|
|
|
|||||||
|
Net of tax amount |
38,400 | 876 | 895 | |||||||||
|
|
|
|
|
|
|
|||||||
|
Change in fair value of derivatives used for cash flow hedges |
(8,906 | ) | — | — | ||||||||
|
Tax effect |
3,465 | — | — | |||||||||
|
|
|
|
|
|
|
|||||||
|
Net of tax amount |
(5,441 | ) | — | — | ||||||||
|
|
|
|
|
|
|
|||||||
|
Total comprehensive income |
$ | 50,430 | 43,206 | 35,269 | ||||||||
|
|
|
|
|
|
|
|||||||
100
Table of Contents
| 14) | Federal and State Income Taxes |
The following is a summary of consolidated income tax expense:
| Years ended December 31, | ||||||||||||
|
(Dollars in thousands) |
2011 | 2010 | 2009 | |||||||||
|
Current |
||||||||||||
|
Federal |
$ | 8,836 | 3,724 | 26,557 | ||||||||
|
State |
4,191 | 3,481 | 7,189 | |||||||||
|
|
|
|
|
|
|
|||||||
|
Total current tax expense |
13,027 | 7,205 | 33,746 | |||||||||
|
|
|
|
|
|
|
|||||||
|
Deferred |
||||||||||||
|
Federal |
(11,256 | ) | 115 | (24,656 | ) | |||||||
|
State |
(2,052 | ) | 23 | (5,099 | ) | |||||||
|
|
|
|
|
|
|
|||||||
|
Total deferred tax (benefit) expense |
(13,308 | ) | 138 | (29,755 | ) | |||||||
|
|
|
|
|
|
|
|||||||
|
Total income tax (benefit) expense |
$ | (281 | ) | 7,343 | 3,991 | |||||||
|
|
|
|
|
|
|
|||||||
Combined federal and state income tax expense differs from that computed at the federal statutory corporate tax rate as follows:
| Years ended December 31, | ||||||||||||
| 2011 | 2010 | 2009 | ||||||||||
|
Federal statutory rate |
35.0 | % | 35.0 | % | 35.0 | % | ||||||
|
State taxes, net of federal income tax benefit |
8.1 | % | 4.6 | % | 3.8 | % | ||||||
|
Tax-exempt interest income |
-65.5 | % | -17.3 | % | -21.0 | % | ||||||
|
Tax credits |
-22.1 | % | -7.3 | % | -3.3 | % | ||||||
|
Bargain purchase gain |
0.0 | % | 0.0 | % | -3.2 | % | ||||||
|
Goodwill impairment charge |
42.3 | % | 0.0 | % | 0.0 | % | ||||||
|
Other, net |
0.6 | % | -0.2 | % | -0.9 | % | ||||||
|
|
|
|
|
|
|
|||||||
| -1.6 | % | 14.8 | % | 10.4 | % | |||||||
|
|
|
|
|
|
|
|||||||
101
Table of Contents
| 14) | Federal and State Income Taxes…continued |
The tax effect of temporary differences which give rise to a significant portion of deferred tax assets and deferred tax liabilities are as follows:
| December 31, | ||||||||
|
(Dollars in thousands) |
2011 | 2010 | ||||||
|
Deferred tax assets |
||||||||
|
Allowance for loan and lease losses |
$ | 53,555 | 53,795 | |||||
|
Other real estate owned |
7,852 | 3,540 | ||||||
|
Interest rate swap agreements |
3,464 | — | ||||||
|
Deferred compensation |
2,964 | 2,953 | ||||||
|
Impairment of equity securities (FHLMC & FNMA) |
2,954 | 2,976 | ||||||
|
Non-accrual interest |
2,894 | 4,528 | ||||||
|
Stock based compensation |
2,714 | 3,888 | ||||||
|
Employee benefits |
2,610 | 2,345 | ||||||
|
Federal income tax credits |
2,400 | — | ||||||
|
Other |
— | 261 | ||||||
|
|
|
|
|
|||||
|
Total gross deferred tax assets |
81,407 | 74,286 | ||||||
|
|
|
|
|
|||||
|
Deferred tax liabilities |
||||||||
|
Available-for-sale securities |
(24,784 | ) | (341 | ) | ||||
|
FHLB stock dividends |
(10,165 | ) | (10,236 | ) | ||||
|
Depreciation of premises and equipment |
(6,169 | ) | (6,687 | ) | ||||
|
Deferred loan costs |
(4,954 | ) | (4,761 | ) | ||||
|
Intangibles |
(1,566 | ) | (8,952 | ) | ||||
|
Other |
(2,688 | ) | (3,025 | ) | ||||
|
|
|
|
|
|||||
|
Total gross deferred tax liabilities |
(50,326 | ) | (34,002 | ) | ||||
|
|
|
|
|
|||||
|
Net deferred tax asset |
$ | 31,081 | 40,284 | |||||
|
|
|
|
|
|||||
The Company’s federal income tax credit carryforwards will expire in 2031.
The Company and its bank subsidiaries join together in the filing of consolidated income tax returns in the following jurisdictions: federal, Montana, Idaho, Colorado and Utah. Although 1st Bank and First Bank-WY have operations in Wyoming and Mountain West has operations in Washington, neither Wyoming nor Washington imposes a corporate-level income tax. All required income tax returns have been timely filed. The following schedule summarizes the years that remain subject to examination as of December 31, 2011:
|
Years ended December 31, |
||
|
Federal |
2008, 2009 and 2010 | |
|
Montana |
2008, 2009 and 2010 | |
|
Idaho |
2008, 2009 and 2010 | |
|
Colorado |
2007, 2008, 2009 and 2010 | |
|
Utah |
2008, 2009 and 2010 |
The Company had no unrecognized tax benefit as of December 31, 2011 and 2010. The Company recognizes interest related to unrecognized income tax benefits in interest expense and penalties are recognized in other expense.
During the years ended December 31, 2011 and 2010, the Company did not recognize any interest expense or penalties with respect to income tax liabilities. The Company had no accrued liabilities for the payment of interest or penalties at December 31, 2011 and 2010.
102
Table of Contents
| 14) | Federal and State Income Taxes…continued |
The Company has assessed the need for a valuation allowance and determined that a valuation allowance is not necessary at December 31, 2011 and 2010. The Company believes that it is more-likely-than-not that the Company’s deferred tax assets will be realizable by offsetting taxable income in carryback years, and by offsetting future taxable income from reversing taxable temporary differences and anticipated future taxable income (exclusive of reversing temporary differences). In its assessment, the Company considered its strong earnings history, no history of tax credit carryforwards expiring unused, and no future net operating losses (for tax purposes) are expected.
Retained earnings at December 31, 2011 includes $3,600,000 for which no provision for federal income tax has been made. This amount represents the base year reserve for bad debts, which is essentially an allocation of earnings to pre-1988 bad debt deductions for federal income tax purposes only. This amount is treated as a permanent difference and deferred taxes are not recognized unless it appears that this bad debt reserve will be reduced and thereby result in taxable income in the foreseeable future. The Company is not currently contemplating any changes in its business or operations which would result in a recapture of this reserve for bad debts for federal tax income purposes.
| 15) | Earnings Per Share |
Basic earnings per share is computed by dividing net income by the weighted average number of shares of common stock outstanding during the period presented. Diluted earnings per share is computed by including the net increase in shares as if dilutive outstanding stock options were exercised, using the treasury stock method.
The following schedule contains the data used in the calculation of basic and diluted earnings per share:
| Years ended December 31, | ||||||||||||
| 2011 | 2010 | 2009 | ||||||||||
|
Net income available to common stockholders, basic and diluted |
$ | 17,471,000 | 42,330,000 | 34,374,000 | ||||||||
|
Average outstanding shares - basic |
71,915,073 | 69,657,980 | 61,529,944 | |||||||||
|
Add: dilutive stock options |
— | 2,365 | 1,696 | |||||||||
|
|
|
|
|
|
|
|||||||
|
Average outstanding shares - diluted |
71,915,073 | 69,660,345 | 61,531,640 | |||||||||
|
|
|
|
|
|
|
|||||||
|
Basic earnings per share |
$ | 0.24 | 0.61 | 0.56 | ||||||||
|
|
|
|
|
|
|
|||||||
|
Diluted earnings per share |
$ | 0.24 | 0.61 | 0.56 | ||||||||
|
|
|
|
|
|
|
|||||||
There were 1,568,000, 2,295,000, and 2,717,000 options excluded from the diluted average outstanding share calculation for December 31, 2011, 2010, and 2009, respectively, due to the option exercise price exceeding the market price of the Company’s common stock.
| 16) | Employee Benefit Plans |
The Company has a 401(k) and profit sharing plan. To be considered eligible for the plans, an employee must be 21 years of age and employed for a full calendar quarter. Employees can participate in the plan the first day of the quarter once they have met the eligibility requirements. Participants are at all times fully vested in all contributions. To be considered eligible for the employer discretionary contribution, an employee must be 21 years of age, worked one full calendar quarter, worked 501 hours in the plan year and be employed as of the last day of the plan year.
The profit sharing plan contributions consists of a 3 percent non-elective safe harbor contribution fully funded by the Company and an employer discretionary contribution. The employer discretionary contribution depends on the Company’s profitability. The total profit sharing plan expense for the years ended December 31, 2011, 2010, and 2009 was $2,043,000, $2,223,000 and $2,149,000 respectively.
103
Table of Contents
| 16) | Employee Benefit Plans…continued |
The 401(k) plan allows eligible employees to contribute up to 60 percent of their eligible annual compensation up to the limit set annually by the Internal Revenue Service. The Company matches an amount equal to 50 percent of the first 6 percent of an employee’s contribution. The Company’s contribution to the 401(k) for the years ended December 31, 2011, 2010 and 2009 was $1,644,000, $1,570,000, and $1,538,000, respectively.
The Company has a non-funded deferred compensation plan for directors and senior officers. The plan provides for participants’ elective deferral of cash payments of up to 50 percent of a participants’ salary and 100 percent of bonuses and directors fees. The total amount deferred for the plan was $362,000, $358,000, and $408,000, for the years ending December 31, 2011, 2010, and 2009, respectively. The participant receives an earnings credit at a rate equal to 50 percent of the Company’s return on average equity. The total earnings for the years ended December 31, 2011, 2010, and 2009 for the plan was $54,000, $116,000 and $124,000, respectively. In connection with several acquisitions, the Company assumed the obligations of deferred compensation plans for certain key employees. As of December 31, 2011, the liability related to the obligations was $1,288,000 and was included in other liabilities. The amount expensed related to the obligations during 2011, 2010 and 2009 was insignificant.
The Company has a Supplemental Executive Retirement Plan (“SERP”) which is intended to supplement payments due to participants upon retirement under the Company’s other qualified plans. The Company credits the participant’s account on annual basis for an amount equal to employer contributions that would have otherwise been allocated to the participant’s account under the tax-qualified plans were it not for limitations imposed by the IRS or the participation in the non-funded deferred compensation plan. Eligible employees include participants of the non-funded deferred compensation plan and employees whose benefits were limited as a result of IRS regulations. The Company’s required contribution to the SERP for the years ended December 31, 2011, 2010 and 2009 was $21,000, $10,000, and $20,000, respectively. The participant receives an earnings credit at a rate equal to 50 percent of the Company’s return on average equity. The total earnings for the years ended 2011, 2010, and 2009 for this plan was $9,000, $22,000, and $24,000, respectively.
The Company has elected to self-insure certain costs related to employee health and dental benefit programs. Costs resulting from noninsured losses are expensed as incurred. The Company has purchased insurance that limits its exposure on an aggregate and individual claims basis for the employee health benefit programs.
The Company has entered into employment contracts with 14 senior officers that provide benefits under certain conditions following a change in control of the Company.
| 17) | Stock Option Plans |
The Company has stock-based compensation plans outstanding. The Directors 1994 Stock Option Plan was approved to provide for the grant of stock options to outside Directors of the Company. The Directors 1994 Stock Option Plan expired in March of 2009 and has granted but unexpired stock options outstanding. The Employees 1995 Stock Option Plan was approved to provide the grant of stock options to certain full-time employees of the Company. The Employees 1995 Stock Option Plan expired in April 2005 and has granted but unexpired stock options outstanding. The 2005 Stock Incentive Plan provides awards to certain full-time employees and directors of the Company. The 2005 Stock Incentive Plan permits the granting of stock options, share appreciation rights, restricted shares, restricted share units, and unrestricted shares, deferred share units, and performance awards. Upon exercise of the stock options, the shares are obtained from the authorized and unissued stock.
The 1994, 1995, and 2005 plans also contain provisions authorizing the grant of limited stock rights, which permit the optionee, upon a change in control of the Company, to surrender his or her stock options for cancellation and receive cash or common stock equal to the difference between the exercise price and the fair market value of the shares on the date of the grant. The option price at which the Company’s common stock may be purchased upon exercise of stock options granted under the plans must be at least equal to the per share market value of such stock at the date the option is granted. All stock option shares are adjusted for stock splits and stock dividends. The term of the stock options may not exceed five years from the date the options are granted.
104
Table of Contents
| 17) | Stock Option Plans…continued |
Compensation cost is based on the fair value of the stock options at the grant date. Additionally, the compensation cost for the portion of awards outstanding for which the requisite service has not been rendered that are outstanding as of the required effective date are recognized as the requisite service is rendered on or after the required effective date. For the years ended December 31, 2011, 2010 and 2009 the compensation cost for the stock option plans was $74,000, $912,000 and $1,842,000, respectively, with a corresponding income tax benefit of $29,000, $359,000 and $726,000, respectively, resulting in a net income and cash flow from operations reduction of $45,000, $553,000 and $1,116,000, respectively. Total unrecognized compensation cost, net of income tax benefit, related to non-vested awards which are expected to be recognized over the next weighted period of 0.6 years was $5,000 as of December 31, 2011. The total fair value of shares vested for the year ended December 31, 2011 and 2010 was $1,532,000 and $1,762,000, respectively.
The per share weighted-average fair value of stock options on the date of grant was based on the Black Scholes option-pricing model. The Company uses historical data to estimate option exercise and termination within the valuation model. Employee and director awards, which have dissimilar historical exercise behavior, are considered separately for valuation purposes. The risk-free interest rate for periods within the contractual life of the stock option is based on the U.S. Treasury yield in effect at the time of the grant. The stock option awards generally vest upon six months or two years of service for directors and employees, respectively, and generally expire in five years. Expected volatilities are based on historical volatility and other factors. The following lists the various assumptions and fair value of the grants awarded during the years indicated. There were no grants awarded during 2011.
| Options Granted During | ||||||||||||
| 2011 | 2010 | 2009 | ||||||||||
|
Fair value of stock options - Black Scholes |
N/A | $ | 4.63 | $ | 4.26 | |||||||
|
Expected volatility |
N/A | 44 | % | 44 | % | |||||||
|
Dividend yield |
N/A | 2.74 | % | 2.74 | % | |||||||
|
Risk-free interest rate |
N/A | 1.40 | % | 1.40 | % | |||||||
|
Expected life |
N/A | 3.47 | 3.47 | |||||||||
At December 31, 2011, total shares available for stock option grants to employees and directors are 3,722,053. Changes in shares granted for stock options for the year ended December 31, 2011 are summarized as follows:
| Options |
Weighted
Average Exercise Price |
|||||||
|
Outstanding at December 31, 2010 |
2,241,310 | $ | 20.00 | |||||
|
Canceled |
(794,450 | ) | 20.90 | |||||
|
|
|
|||||||
|
Outstanding at December 31, 2011 |
1,446,860 | 19.52 | ||||||
|
|
|
|||||||
|
Excercisable at December 31, 2011 |
1,443,860 | 19.53 | ||||||
|
|
|
|||||||
The range of exercise prices on options outstanding and exercisable at December 31, 2011 is as follows:
| Options Exercisable | ||||||||||||||||||||
|
Price Range |
Options
Outstanding |
Weighted
Average Exercise Price |
Weighted
Average Life of Options |
Options
Exercisable |
Weighted
Average Exercise Price |
|||||||||||||||
|
$13.91 - $18.19 |
872,180 | $ | 16.94 | 1.5 years | 869,180 | $ | 16.95 | |||||||||||||
|
$18.74 - $24.73 |
574,680 | 23.43 | 0.1 years | 574,680 | 23.43 | |||||||||||||||
|
|
|
|
|
|||||||||||||||||
| 1,446,860 | 19.52 | 0.9 years | 1,443,860 | 19.53 | ||||||||||||||||
|
|
|
|
|
|||||||||||||||||
105
Table of Contents
| 18) | Parent Holding Company Information (Condensed) |
The following condensed financial information was the unconsolidated information for the Company:
Statements of Financial Condition
| December 31, | ||||||||
|
(Dollars in thousands) |
2011 | 2010 | ||||||
|
Assets |
||||||||
|
Cash on hand and in banks |
$ | 383 | 1,419 | |||||
|
Interest bearing cash deposits |
30,955 | 27,694 | ||||||
|
|
|
|
|
|||||
|
Cash and cash equivalents |
31,338 | 29,113 | ||||||
|
Investment securities, available-for-sale |
10,737 | 13,098 | ||||||
|
Other assets |
19,041 | 18,107 | ||||||
|
Investment in subsidiaries |
929,518 | 918,557 | ||||||
|
|
|
|
|
|||||
|
Total assets |
$ | 990,634 | 978,875 | |||||
|
|
|
|
|
|||||
|
Liabilities and Stockholders’ Equity |
||||||||
|
Dividends payable |
$ | 9,349 | 9,349 | |||||
|
Subordinated debentures |
125,275 | 125,132 | ||||||
|
Other liabilities |
5,783 | 5,811 | ||||||
|
|
|
|
|
|||||
|
Total liabilities |
140,407 | 140,292 | ||||||
|
|
|
|
|
|||||
|
Common stock |
719 | 719 | ||||||
|
Paid-in capital |
642,882 | 643,894 | ||||||
|
Retained earnings |
173,139 | 193,442 | ||||||
|
Accumulated other comprehensive income |
33,487 | 528 | ||||||
|
|
|
|
|
|||||
|
Total stockholders’ equity |
850,227 | 838,583 | ||||||
|
|
|
|
|
|||||
|
Total liabilities and stockholders’ equity |
$ | 990,634 | 978,875 | |||||
|
|
|
|
|
|||||
Statements of Operations
| Years ended December 31, | ||||||||||||
|
(Dollars in thousands) |
2011 | 2010 | 2009 | |||||||||
|
Income |
||||||||||||
|
Dividends from subsidiaries |
$ | 43,450 | 31,350 | 24,300 | ||||||||
|
Other income |
864 | 3,730 | 2,775 | |||||||||
|
Intercompany charges for services |
14,438 | 13,977 | 13,108 | |||||||||
|
|
|
|
|
|
|
|||||||
|
Total income |
58,752 | 49,057 | 40,183 | |||||||||
|
Expenses |
||||||||||||
|
Compensation, employee benefits and related expense |
9,185 | 8,287 | 7,793 | |||||||||
|
Other operating expenses |
11,827 | 12,990 | 12,845 | |||||||||
|
|
|
|
|
|
|
|||||||
|
Total expenses |
21,012 | 21,277 | 20,638 | |||||||||
|
Income before income tax benefit and equity in undistributed net (loss) income of subsidiaries |
37,740 | 27,780 | 19,545 | |||||||||
|
Income tax benefit |
2,176 | 1,374 | 1,942 | |||||||||
|
|
|
|
|
|
|
|||||||
|
Income before equity in undistributed net (loss) income of subsidiaries |
39,916 | 29,154 | 21,487 | |||||||||
|
Equity in undistributed net (loss) income of subsidiaries |
(22,825 | ) | 13,558 | 12,887 | ||||||||
|
|
|
|
|
|
|
|||||||
|
Net Income |
$ | 17,091 | 42,712 | 34,374 | ||||||||
|
|
|
|
|
|
|
|||||||
106
Table of Contents
| 18) | Parent Holding Company Information (Condensed)…continued |
Statements of Cash Flows
| Years ended December 31, | ||||||||||||
|
(Dollars in thousands) |
2011 | 2010 | 2009 | |||||||||
|
Operating Activities |
||||||||||||
|
Net income |
$ | 17,091 | 42,712 | 34,374 | ||||||||
|
Adjustments to reconcile net income to net cash provided by operating activities: |
||||||||||||
|
Subsidiary (income) loss in excess of dividends distributed |
22,825 | (13,558 | ) | (12,887 | ) | |||||||
|
Gain on sale of investments |
— | (3,013 | ) | (2,147 | ) | |||||||
|
Excess deficiencies (benefits) related to the exercise of stock options |
— | 4 | (75 | ) | ||||||||
|
Net (decrease) increase in other assets and other liabilities |
1,215 | (708 | ) | 1,356 | ||||||||
|
|
|
|
|
|
|
|||||||
|
Net cash provided by operating activities |
41,131 | 25,437 | 20,621 | |||||||||
|
|
|
|
|
|
|
|||||||
|
Investing Activities |
||||||||||||
|
Proceeds from sales, maturities and prepayments of securities available-for-sale |
1,376 | 3,671 | 2,267 | |||||||||
|
Purchases of investment securities available-for-sale |
— | (13,126 | ) | (285 | ) | |||||||
|
Equity contribution to subsidiaries |
(1,110 | ) | (105,841 | ) | (68,753 | ) | ||||||
|
Net addition of premises and equipment |
(1,920 | ) | (2,754 | ) | (4,451 | ) | ||||||
|
|
|
|
|
|
|
|||||||
|
Net cash used in investing activities |
(1,654 | ) | (118,050 | ) | (71,222 | ) | ||||||
|
|
|
|
|
|
|
|||||||
|
Financing Activities |
||||||||||||
|
Net increase (decrease) in other borrowed funds |
143 | (4,857 | ) | 65 | ||||||||
|
Cash dividends paid |
(37,395 | ) | (37,396 | ) | (32,021 | ) | ||||||
|
Excess (deficiencies) benefits related to the exercise of stock options |
— | (4 | ) | 75 | ||||||||
|
Proceeds from exercise of stock options and other stock issued |
— | 145,654 | 2,554 | |||||||||
|
|
|
|
|
|
|
|||||||
|
Net cash provided by (used in) financing activities |
(37,252 | ) | 103,397 | (29,327 | ) | |||||||
|
|
|
|
|
|
|
|||||||
|
Net increase (decrease) in cash and cash equivalents |
2,225 | 10,784 | (79,928 | ) | ||||||||
|
Cash and cash equivalents at beginning of year |
29,113 | 18,329 | 98,257 | |||||||||
|
|
|
|
|
|
|
|||||||
|
Cash and cash equivalents at end of year |
$ | 31,338 | 29,113 | 18,329 | ||||||||
|
|
|
|
|
|
|
|||||||
| 19) | Unaudited Quarterly Financial Data |
Summarized unaudited quarterly financial data is as follows:
| Quarters ended 2011 | ||||||||||||||||
|
(Dollars in thousands, except per share data) |
March 31 | June 30 | September 30 | December 31 | ||||||||||||
|
Interest income |
$ | 68,373 | 71,562 | 71,433 | 68,741 | |||||||||||
|
Interest expense |
11,669 | 11,331 | 11,297 | 10,197 | ||||||||||||
|
|
|
|
|
|
|
|
|
|||||||||
|
Net interest income |
56,704 | 60,231 | 60,136 | 58,544 | ||||||||||||
|
Gain (loss) on sale of investments |
124 | (591 | ) | 813 | — | |||||||||||
|
Provision for loan losses |
19,500 | 19,150 | 17,175 | 8,675 | ||||||||||||
|
Income (loss) before income taxes |
12,123 | 12,712 | (24,401 | ) | 16,756 | |||||||||||
|
Net income (loss) |
10,285 | 11,886 | (19,048 | ) | 14,348 | |||||||||||
|
Basic earnings (loss) per share |
0.14 | 0.17 | (0.27 | ) | 0.20 | |||||||||||
|
Diluted earnings (loss) per share |
0.14 | 0.17 | (0.27 | ) | 0.20 | |||||||||||
|
Dividends declared per share |
0.13 | 0.13 | 0.13 | 0.13 | ||||||||||||
|
Market range high-low close |
$ | 15.94-$14.09 | $ | 15.29-$12.97 | $ | 13.75-$9.23 | $ | 12.51-$9.09 | ||||||||
107
Table of Contents
| 19) | Unaudited Quarterly Financial Data…continued |
| Quarters ended 2010 | ||||||||||||||||
|
(Dollars in thousands, except per share data) |
March 31 | June 30 | September 30 | December 31 | ||||||||||||
|
Interest income |
$ | 73,398 | 73,818 | 72,103 | 69,083 | |||||||||||
|
Interest expense |
13,884 | 13,749 | 13,581 | 12,420 | ||||||||||||
|
|
|
|
|
|
|
|
|
|||||||||
|
Net interest income |
59,514 | 60,069 | 58,522 | 56,663 | ||||||||||||
|
Gain on sale of investments |
314 | 242 | 2,041 | 2,225 | ||||||||||||
|
Provision for loan losses |
20,910 | 17,246 | 19,162 | 27,375 | ||||||||||||
|
Income before income taxes |
12,826 | 16,005 | 11,330 | 9,512 | ||||||||||||
|
Net income |
10,070 | 13,222 | 9,445 | 9,593 | ||||||||||||
|
Basic earnings per share |
0.16 | 0.19 | 0.13 | 0.13 | ||||||||||||
|
Diluted earnings per share |
0.16 | 0.19 | 0.13 | 0.13 | ||||||||||||
|
Dividends declared per share |
0.13 | 0.13 | 0.13 | 0.13 | ||||||||||||
|
Market range high-low close |
$ | 15.94-$13.75 | $ | 18.88-$14.67 | $ | 16.73-$13.75 | $ | 15.76-$13.00 | ||||||||
| 20) | Fair Value of Assets and Liabilities |
Fair value is defined as the price that would be received to sell an asset or paid to transfer a liability in an orderly transaction between market participants at the measurement date. There is a fair value hierarchy which requires an entity to maximize the use of observable inputs and minimize the use of unobservable inputs when measuring fair value. The three levels of inputs that may be used to measure fair value are as follows:
| Level 1 | Quoted prices in active markets for identical assets or liabilities | |
| Level 2 | Observable inputs other than Level 1 prices, such as quoted prices for similar assets or liabilities; quoted prices in markets that are not active; or other inputs that are observable or can be corroborated by observable market data for substantially the full term of the assets or liabilities | |
| Level 3 | Unobservable inputs that are supported by little or no market activity and that are significant to the fair value of the assets or liabilities | |
The following is a description of the inputs and valuation methodologies used for assets and liabilities measured at fair value on a recurring basis. There have been no significant changes in the valuation techniques during the year ended December 31, 2011.
Investment securities: fair value for available-for-sale securities is estimated by obtaining quoted market prices for identical assets, where available. If such prices are not available, fair value is based on independent asset pricing services and models, the inputs of which are market-based or independently sourced market parameters, including but not limited to, yield curves, interest rates, volatilities, prepayments, defaults, cumulative loss projections, and cash flows. For those securities where greater reliance on unobservable inputs occurs, such securities are classified as Level 3 within the hierarchy.
Interest rate swap derivative agreements: fair values for interest rate swap derivative agreements are based upon the estimated amounts to settle the contracts considering current interest rates and are calculated using discounted cash flows.
108
Table of Contents
| 20) | Fair Value of Assets and Liabilities…continued |
The following schedules disclose the fair value measurement of assets and liabilities measured at fair value on a recurring basis:
|
Fair Value Measurements
At the End of the Reporting Period Using |
||||||||||||||||
|
(Dollars in thousands) |
Fair Value
12/31/11 |
Quoted Prices
in Active Markets for Identical Assets (Level 1) |
Significant
Other Observable Inputs (Level 2) |
Significant
Unobservable Inputs (Level 3) |
||||||||||||
|
Investment securities, available-for-sale |
||||||||||||||||
|
U.S. government and federal agency |
$ | 208 | — | 208 | — | |||||||||||
|
U.S. government sponsored enterprises |
31,155 | — | 31,155 | — | ||||||||||||
|
State and local governments |
1,064,655 | — | 1,064,655 | — | ||||||||||||
|
Corporate bonds |
62,237 | — | 62,237 | — | ||||||||||||
|
Collateralized debt obligations |
5,366 | — | 5,366 | — | ||||||||||||
|
Residential mortgage-backed securities |
1,963,122 | — | 1,963,122 | — | ||||||||||||
|
|
|
|
|
|
|
|
|
|||||||||
|
Total assets measured at fair value on a recurring basis |
$ | 3,126,743 | — | 3,126,743 | — | |||||||||||
|
|
|
|
|
|
|
|
|
|||||||||
|
Interest rate swap agreements |
$ | 8,906 | — | 8,906 | — | |||||||||||
|
|
|
|
|
|
|
|
|
|||||||||
|
Total liabilities measured at fair value on a recurring basis |
$ | 8,906 | — | 8,906 | — | |||||||||||
|
|
|
|
|
|
|
|
|
|||||||||
|
Fair Value Measurements
At the End of the Reporting Period Using |
||||||||||||||||
|
(Dollars in thousands) |
Fair Value
12/31/10 |
Quoted Prices
in Active Markets for Identical Assets (Level 1) |
Significant
Other Observable Inputs (Level 2) |
Significant
Unobservable Inputs (Level 3) |
||||||||||||
|
Investment securities, available-for-sale |
||||||||||||||||
|
U.S. government and federal agency |
$ | 211 | — | 211 | — | |||||||||||
|
U.S. government sponsored enterprises |
41,518 | — | 41,518 | — | ||||||||||||
|
State and local governments |
657,421 | — | 657,421 | — | ||||||||||||
|
Collateralized debt obligations |
6,595 | — | — | 6,595 | ||||||||||||
|
Residential mortgage-backed securities |
1,690,102 | — | 1,689,946 | 156 | ||||||||||||
|
|
|
|
|
|
|
|
|
|||||||||
|
Total assets measured at fair value on a recurring basis |
$ | 2,395,847 | — | 2,389,096 | 6,751 | |||||||||||
|
|
|
|
|
|
|
|
|
|||||||||
109
Table of Contents
| 20) | Fair Value of Assets and Liabilities…continued |
The following schedules reconcile the opening and closing balances for assets measured at fair value on a recurring basis using significant unobservable inputs (Level 3) during the years ended December 31, 2011 and 2010:
| Significant Unobservable Inputs (Level 3) | ||||||||||||
|
(Dollars in thousands) |
Total |
Collateralized
Debt Obligations |
Residential
Mortgage-backed Securities |
|||||||||
|
Balance as of December 31, 2010 |
$ | 6,751 | 6,595 | 156 | ||||||||
|
Total unrealized gains for the period included in other comprehensive income |
4,167 | 4,301 | (134 | ) | ||||||||
|
Amortization, accretion and principal payments |
(5,530 | ) | (5,530 | ) | — | |||||||
|
Transfers out of Level 3 |
(5,388 | ) | (5,366 | ) | (22 | ) | ||||||
|
|
|
|
|
|
|
|||||||
|
Balance as of December 31, 2011 |
$ | — | — | — | ||||||||
|
|
|
|
|
|
|
|||||||
| Significant Unobservable Inputs (Level 3) | ||||||||||||||||
|
(Dollars in thousands) |
Total |
State and Local
Governments |
Collateralized
Debt Obligations |
Residential
Mortgage-backed Securities |
||||||||||||
|
Balance as of December 31, 2009 |
$ | 9,988 | 2,088 | 6,789 | 1,111 | |||||||||||
|
Total unrealized gains for the period included in other comprehensive income |
3,381 | — | 3,276 | 105 | ||||||||||||
|
Amortization, accretion and principal payments |
(1,510 | ) | — | (1,510 | ) | — | ||||||||||
|
Sales, maturities and calls |
(3,020 | ) | — | (1,960 | ) | (1,060 | ) | |||||||||
|
Transfers out of Level 3 |
(2,088 | ) | (2,088 | ) | — | — | ||||||||||
|
|
|
|
|
|
|
|
|
|||||||||
|
Balance as of December 31, 2010 |
$ | 6,751 | — | 6,595 | 156 | |||||||||||
|
|
|
|
|
|
|
|
|
|||||||||
During the years ended December 31, 2011 and 2010, securities were transferred from Level 3 to Level 2 because observable market data became available.
The following is a description of the inputs and valuation methodologies used for assets recorded at fair value on a non-recurring basis. There have been no significant changes in the valuation techniques during the year ended December 31, 2011.
Other real estate owned: other real estate owned is carried at the lower of fair value at acquisition date or estimated fair value, less estimated cost to sell. Estimated fair value of other real estate owned is based on appraisals or evaluations. Other real estate owned is classified within Level 3 of the fair value hierarchy.
Collateral-dependent impaired loans, net of ALLL: loans included in the Company’s financials for which it is probable that the Company will not collect all principal and interest due according to contractual terms are considered impaired. Estimated fair value of collateral-dependent impaired loans is based on the fair value of the collateral, less estimated cost to sell. Collateral-dependent impaired loans are classified within Level 3 of the fair value hierarchy.
In determining fair values of other real estate owned and the collateral-dependent impaired loans, the Company considers the appraisal or evaluation as the starting point for determining fair value. The Company also considers other factors and events in the environment that may affect the fair value.
110
Table of Contents
| 20) | Fair Value of Assets and Liabilities…continued |
Goodwill: Goodwill is evaluated for impairment at the bank subsidiary level at least annually. As a result of a goodwill impairment assessment performed by an independent valuation firm for two of the Company’s bank subsidiaries, Mountain West and 1st Bank, a goodwill impairment charge was recorded during the third quarter of 2011. The key inputs used to determine the implied fair value of such bank subsidiaries and the corresponding amount of the impairment charge included quoted market prices of other banks, discounted cash flows and inputs from comparable transactions. These inputs are classified within Level 3 of the fair value hierarchy.
The following schedules disclose the fair value measurement of assets with a recorded change during the period resulting from re-measuring the assets at fair value on a non-recurring basis:
|
Fair Value Measurements
At the End of the Reporting Period Using |
||||||||||||||||
|
(Dollars in thousands) |
Fair Value
12/31/11 |
Quoted Prices
in Active Markets for Identical Assets (Level 1) |
Significant
Other Observable Inputs (Level 2) |
Significant
Unobservable Inputs (Level 3) |
||||||||||||
|
Other real estate owned |
$ | 38,076 | — | — | 38,076 | |||||||||||
|
Collateral-dependent impaired loans, net of allowance for loan and lease losses |
55,339 | — | — | 55,339 | ||||||||||||
|
Goodwill |
24,718 | — | — | 24,718 | ||||||||||||
|
|
|
|
|
|
|
|
|
|||||||||
|
Total assets measured at fair value on a non-recurring basis |
$ | 118,133 | — | — | 118,133 | |||||||||||
|
|
|
|
|
|
|
|
|
|||||||||
|
Fair Value Measurements
At the End of the Reporting Period Using |
||||||||||||||||
|
(Dollars in thousands) |
Fair Value
12/31/10 |
Quoted Prices
in Active Markets for Identical Assets (Level 1) |
Significant
Other Observable Inputs (Level 2) |
Significant
Unobservable Inputs (Level 3) |
||||||||||||
|
Other real estate owned |
$ | 17,492 | — | — | 17,492 | |||||||||||
|
Collateral-dependent impaired loans, net of allowance for loan and lease losses |
47,283 | — | — | 47,283 | ||||||||||||
|
|
|
|
|
|
|
|
|
|||||||||
|
Total assets measured at fair value on a non-recurring basis |
$ | 64,775 | — | — | 64,775 | |||||||||||
|
|
|
|
|
|
|
|
|
|||||||||
The following is a description of the methods used to estimate the fair value of all other assets and liabilities recognized at amounts other than fair value.
Assets
Cash and cash equivalents and accrued interest receivable: fair value is estimated at book value of such financial assets.
Loans held for sale: fair value is estimated at book value due to the insignificant time between origination date and sale date.
Loans receivable, net of ALLL: fair value is estimated by discounting the future cash flows using the rates at which similar notes would be written for the same remaining maturities. The market rates used are based on current rates the Banks would impose for similar loans and reflect a market participant assumption about risks associated with non-performance, illiquidity, and the structure and term of the loans along with local economic and market conditions.
Non-marketable equity securities: fair value is estimated at book value due to restrictions that limit the sale or transfer of such securities.
111
Table of Contents
| 20) | Fair Value of Assets and Liabilities…continued |
Liabilities
Accrued interest payable: fair value is estimated at book value of such financial liabilities.
Deposits: fair value of term deposits is estimated by discounting the future cash flows using rates of similar deposits with similar maturities. The market rates used were obtained from a knowledgeable independent third party and reviewed by the Company. The rates were the average of current rates offered by local competitors of the bank subsidiaries. The estimated fair value of demand, NOW, savings, and money market deposits is the book value since rates are regularly adjusted to market rates.
Advances from FHLB: fair value of non-callable FHLB advances is estimated by discounting the future cash flows using rates of similar advances with similar maturities. These rates were obtained from current rates offered by FHLB. The estimated fair value of callable FHLB advances was obtained from FHLB and the model was reviewed by the Company through discussions with FHLB.
Repurchase agreements, federal funds purchased and other borrowed funds: fair value of term repurchase agreements and other term borrowings is estimated based on current repurchase rates and borrowing rates currently available to the Company for repurchases and borrowings with similar terms and maturities. The estimated fair value for overnight repurchase agreements, federal funds purchased and other borrowings is book value.
Subordinated debentures: fair value of the subordinated debt is estimated by discounting the estimated future cash flows using current estimated market rates. The market rates used were averages of currently traded trust preferred securities with similar characteristics to the Company’s issuances and obtained from an independent third party.
Off-balance sheet financial instruments: commitments to extend credit and letters of credit represent the principal categories of off-balance sheet financial instruments. Rates for these commitments are set at time of loan closing, such that no adjustment is necessary to reflect these commitments at market value. The Company has an insignificant amount of off-balance sheet financial instruments.
The following presents the carrying amounts and estimated fair values of the Company’s financial instruments:
| December 31, 2011 | December 31, 2010 | |||||||||||||||
|
(Dollars in thousands) |
Carrying
Amount |
Fair Value |
Carrying
Amount |
Fair Value | ||||||||||||
|
Financial assets |
||||||||||||||||
|
Cash and cash equivalents |
$ | 128,032 | 128,032 | 105,091 | 105,091 | |||||||||||
|
Investment securities, available-for-sale |
3,126,743 | 3,126,743 | 2,395,847 | 2,395,847 | ||||||||||||
|
Loans held for sale |
95,457 | 95,457 | 76,213 | 76,213 | ||||||||||||
|
Loans receivable, net of allowance for loan and lease losses |
3,328,619 | 3,386,333 | 3,612,182 | 3,631,716 | ||||||||||||
|
Accrued interest receivable |
34,961 | 34,961 | 30,246 | 30,246 | ||||||||||||
|
Non-marketable equity securities |
49,694 | 49,694 | 65,040 | 65,040 | ||||||||||||
|
|
|
|
|
|
|
|
|
|||||||||
|
Total financial assets |
$ | 6,763,506 | 6,821,220 | 6,284,619 | 6,304,153 | |||||||||||
|
|
|
|
|
|
|
|
|
|||||||||
|
Financial liabilities |
||||||||||||||||
|
Deposits |
$ | 4,821,213 | 4,830,643 | 4,521,902 | 4,533,974 | |||||||||||
|
FHLB advances |
1,069,046 | 1,099,699 | 965,141 | 974,853 | ||||||||||||
|
Repurchase agreements and other borrowed funds |
268,638 | 268,642 | 269,408 | 269,414 | ||||||||||||
|
Subordinated debentures |
125,275 | 65,903 | 125,132 | 70,404 | ||||||||||||
|
Accrued interest payable |
5,825 | 5,825 | 7,245 | 7,245 | ||||||||||||
|
|
|
|
|
|
|
|
|
|||||||||
|
Total financial liabilities |
$ | 6,289,997 | 6,270,712 | 5,888,828 | 5,855,890 | |||||||||||
|
|
|
|
|
|
|
|
|
|||||||||
| 21) | Contingencies and Commitments |
The Company is a party to financial instruments with off-balance-sheet risk in the normal course of business to meet the financing needs of its customers. These financial instruments include commitments to extend credit and letters of credit, and involve, to varying degrees, elements of credit risk. The Company’s exposure to credit loss in the event of nonperformance by the other party to the financial instrument for commitments to extend credit is represented by the contractual amount of those instruments. The Company uses the same credit policies in making commitments and conditional obligations as it does for on-balance-sheet instruments.
112
Table of Contents
| 21) | Contingencies and Commitments…continued |
The Company had the following outstanding commitments:
| December 31, | ||||||||
|
(Dollars in thousands) |
2011 | 2010 | ||||||
|
Commitments to extend credit |
$ | 728,199 | 732,709 | |||||
|
Letters of credit |
20,463 | 25,250 | ||||||
|
|
|
|
|
|||||
|
Total outstanding commitments |
$ | 748,662 | 757,959 | |||||
|
|
|
|
|
|||||
The Company leases certain land, premises and equipment from third parties under operating and capital leases. Total rent expense for the years ended December 31, 2011, 2010, and 2009 was $3,239,000, $3,566,000, and $3,306,000, respectively. Amortization of building capital lease assets is included in depreciation. One of the Company’s subsidiaries has entered into lease transactions with two of its directors and the related party rent expense for the years ended December 31, 2011, 2010, and 2009 was $937,000, $902,000, and $703,000. The total future minimum rental commitments required under operating and capital leases that have initial or remaining noncancelable lease terms in excess of one year at December 31, 2011 are as follows:
|
(Dollars in thousands) |
Capital
Leases |
Operating
Leases |
Total | |||||||||
|
Years ending December 31, |
||||||||||||
|
2012 |
$ | 235 | 2,235 | 2,470 | ||||||||
|
2013 |
238 | 1,861 | 2,099 | |||||||||
|
2014 |
829 | 1,707 | 2,536 | |||||||||
|
2015 |
195 | 1,533 | 1,728 | |||||||||
|
2016 |
197 | 1,318 | 1,515 | |||||||||
|
Thereafter |
949 | 5,124 | 6,073 | |||||||||
|
|
|
|
|
|
|
|||||||
|
Total minimum lease payments |
2,643 | 13,778 | 16,421 | |||||||||
|
|
|
|
|
|||||||||
|
Less: Amount representing interest |
770 | |||||||||||
|
|
|
|||||||||||
|
Present value of minimum lease payments |
1,873 | |||||||||||
|
Less: Current portion of obligations under capital leases |
90 | |||||||||||
|
|
|
|||||||||||
|
Long-term portion of obligations under capital leases |
$ | 1,783 | ||||||||||
|
|
|
|||||||||||
The Company is a defendant in legal proceedings arising in the normal course of business. In the opinion of management, the disposition of pending litigation will not have a material affect on the Company’s consolidated financial position, results of operations or liquidity.
| 22) | Operating Segment Information |
Operating segments are defined as components of an enterprise about which separate financial information is available that is evaluated regularly by management in deciding how to allocate resources and in assessing performance. The Company’s operating segments include each of the individual bank subsidiaries, GORE and the Parent.
The accounting policies of the individual operating segments are the same as those of the Company described in Note 1. Transactions between operating segments are conducted at fair value, resulting in profits that are eliminated for reporting consolidated results of operations. Intersegment income primarily represents interest income on intercompany borrowings, management fees, and data processing fees received by individual bank subsidiaries or the Parent. Intersegment income, expenses and assets are eliminated in order to report results in accordance with GAAP. Expenses for centrally provided services are allocated based on the estimated usage of those services.
113
Table of Contents
| 22) | Operating Segment Information…continued |
The following schedules provide selected financial data for the Company’s operating segments:
| At or for the Year ended December 31, 2011 | ||||||||||||||||||||||||||||||||
|
(Dollars in thousands) |
Glacier |
Mountain
West |
First
Security |
Western |
1st
Bank |
Valley | Big Sky |
First Bank-
WY |
||||||||||||||||||||||||
|
Net interest income (loss) |
$ | 49,220 | 42,603 | 38,224 | 21,236 | 22,251 | 14,303 | 13,803 | 10,643 | |||||||||||||||||||||||
|
Provision for loan losses |
(16,800 | ) | (30,100 | ) | (9,950 | ) | (550 | ) | (1,950 | ) | — | (2,350 | ) | (700 | ) | |||||||||||||||||
|
|
|
|
|
|
|
|
|
|
|
|
|
|
|
|
|
|||||||||||||||||
|
Net interest income (loss) after provision for loan losses |
32,420 | 12,503 | 28,274 | 20,686 | 20,301 | 14,303 | 11,453 | 9,943 | ||||||||||||||||||||||||
|
Non-interest income |
15,571 | 22,608 | 7,384 | 8,949 | 4,900 | 5,130 | 3,619 | 2,684 | ||||||||||||||||||||||||
|
Core deposit intangibles amortization |
(119 | ) | (66 | ) | (261 | ) | (332 | ) | (530 | ) | (9 | ) | (5 | ) | (577 | ) | ||||||||||||||||
|
Goodwill impairment charge |
— | (23,159 | ) | — | — | (17,000 | ) | — | — | — | ||||||||||||||||||||||
|
Other non-interest expense |
(30,537 | ) | (52,769 | ) | (20,548 | ) | (17,113 | ) | (16,009 | ) | (9,562 | ) | (9,887 | ) | (7,929 | ) | ||||||||||||||||
|
|
|
|
|
|
|
|
|
|
|
|
|
|
|
|
|
|||||||||||||||||
|
Income (loss) before income taxes |
17,335 | (40,883 | ) | 14,849 | 12,190 | (8,338 | ) | 9,862 | 5,180 | 4,121 | ||||||||||||||||||||||
|
Income tax (expense) benefit |
(3,386 | ) | 16,087 | (2,936 | ) | (2,622 | ) | (1,928 | ) | (2,778 | ) | (1,457 | ) | (770 | ) | |||||||||||||||||
|
|
|
|
|
|
|
|
|
|
|
|
|
|
|
|
|
|||||||||||||||||
|
Net income (loss) |
$ | 13,949 | (24,796 | ) | 11,913 | 9,568 | (10,266 | ) | 7,084 | 3,723 | 3,351 | |||||||||||||||||||||
|
|
|
|
|
|
|
|
|
|
|
|
|
|
|
|
|
|||||||||||||||||
|
Assets |
$ | 1,376,715 | 1,130,766 | 1,102,203 | 808,512 | 785,730 | 462,300 | 385,434 | 390,917 | |||||||||||||||||||||||
|
Loans, net of ALLL |
749,032 | 636,601 | 544,838 | 248,167 | 232,708 | 185,261 | 218,148 | 128,238 | ||||||||||||||||||||||||
|
Goodwill |
8,900 | — | 18,582 | 22,311 | 24,718 | 1,770 | 1,752 | — | ||||||||||||||||||||||||
|
Deposits |
807,505 | 806,039 | 732,672 | 550,725 | 535,670 | 304,418 | 221,541 | 288,482 | ||||||||||||||||||||||||
|
Stockholders’ equity |
190,359 | 159,219 | 136,835 | 92,490 | 94,027 | 34,780 | 67,652 | 43,774 | ||||||||||||||||||||||||
| Citizens |
First Bank-
MT |
San
Juans |
GORE | Parent |
Eliminations
and Other |
Total
Consolidated |
||||||||||||||||||||||||||
|
Net interest income (loss) |
$ | 11,368 | 7,994 | 8,070 | — | (4,102 | ) | 2 | 235,615 | |||||||||||||||||||||||
|
Provision for loan losses |
(1,300 | ) | — | (800 | ) | — | — | — | (64,500 | ) | ||||||||||||||||||||||
|
|
|
|
|
|
|
|
|
|
|
|
|
|
|
|||||||||||||||||||
|
Net interest income (loss) after provision for loan losses |
10,068 | 7,994 | 7,270 | — | (4,102 | ) | 2 | 171,115 | ||||||||||||||||||||||||
|
Non-interest income |
3,641 | 946 | 1,687 | 915 | 35,082 | (34,917 | ) | 78,199 | ||||||||||||||||||||||||
|
Core deposit intangibles amortization |
(75 | ) | (266 | ) | (233 | ) | — | — | — | (2,473 | ) | |||||||||||||||||||||
|
Goodwill impairment charge |
— | — | — | — | — | — | (40,159 | ) | ||||||||||||||||||||||||
|
Other non-interest expense |
(8,174 | ) | (3,276 | ) | (7,158 | ) | (5,380 | ) | (16,065 | ) | 14,915 | (189,492 | ) | |||||||||||||||||||
|
|
|
|
|
|
|
|
|
|
|
|
|
|
|
|||||||||||||||||||
|
Income (loss) before income taxes |
5,460 | 5,398 | 1,566 | (4,465 | ) | 14,915 | (20,000 | ) | 17,190 | |||||||||||||||||||||||
|
Income tax (expense) benefit |
(1,716 | ) | (1,508 | ) | (374 | ) | 1,737 | 2,176 | (244 | ) | 281 | |||||||||||||||||||||
|
|
|
|
|
|
|
|
|
|
|
|
|
|
|
|||||||||||||||||||
|
Net income (loss) |
$ | 3,744 | 3,890 | 1,192 | (2,728 | ) | 17,091 | (20,244 | ) | 17,471 | ||||||||||||||||||||||
|
|
|
|
|
|
|
|
|
|
|
|
|
|
|
|||||||||||||||||||
|
Assets |
$ | 362,420 | 265,621 | 243,723 | 7,195 | 990,634 | (1,124,264 | ) | 7,187,906 | |||||||||||||||||||||||
|
Loans, net of ALLL |
149,818 | 109,495 | 131,327 | — | — | (5,014 | ) | 3,328,619 | ||||||||||||||||||||||||
|
Goodwill |
9,553 | 12,556 | 5,958 | — | — | — | 106,100 | |||||||||||||||||||||||||
|
Deposits |
238,314 | 186,361 | 195,067 | — | — | (45,581 | ) | 4,821,213 | ||||||||||||||||||||||||
|
Stockholders’ equity |
38,058 | 35,449 | 27,294 | 9,581 | 850,227 | (929,518 | ) | 850,227 | ||||||||||||||||||||||||
114
Table of Contents
| 22) | Operating Segment Information…continued |
| At or for the Year ended December 31, 2010 | ||||||||||||||||||||||||||||||||
|
(Dollars in thousands) |
Glacier |
Mountain
West |
First
Security |
Western |
1st
Bank |
Valley | Big Sky |
First Bank-
WY |
||||||||||||||||||||||||
|
Net interest income (loss) |
$ | 50,260 | 47,786 | 35,676 | 20,519 | 22,796 | 13,611 | 14,168 | 10,315 | |||||||||||||||||||||||
|
Provision for loan losses |
(20,050 | ) | (45,000 | ) | (8,100 | ) | (950 | ) | (2,150 | ) | (500 | ) | (3,475 | ) | (1,453 | ) | ||||||||||||||||
|
|
|
|
|
|
|
|
|
|
|
|
|
|
|
|
|
|||||||||||||||||
|
Net interest income (loss) after provision for loan losses |
30,210 | 2,786 | 27,576 | 19,569 | 20,646 | 13,111 | 10,693 | 8,862 | ||||||||||||||||||||||||
|
Non-interest income |
15,272 | 26,148 | 7,799 | 9,857 | 4,934 | 6,913 | 3,427 | 3,072 | ||||||||||||||||||||||||
|
Core deposit intangibles amortization |
(192 | ) | (172 | ) | (425 | ) | (519 | ) | (591 | ) | (42 | ) | (23 | ) | (577 | ) | ||||||||||||||||
|
Other non-interest expense |
(29,113 | ) | (51,203 | ) | (21,842 | ) | (17,257 | ) | (17,197 | ) | (9,252 | ) | (10,411 | ) | (8,752 | ) | ||||||||||||||||
|
|
|
|
|
|
|
|
|
|
|
|
|
|
|
|
|
|||||||||||||||||
|
Income (loss) before income taxes |
16,177 | (22,441 | ) | 13,108 | 11,650 | 7,792 | 10,730 | 3,686 | 2,605 | |||||||||||||||||||||||
|
Income tax (expense) benefit |
(2,989 | ) | 10,262 | (2,798 | ) | (3,112 | ) | (2,080 | ) | (3,272 | ) | (945 | ) | (498 | ) | |||||||||||||||||
|
|
|
|
|
|
|
|
|
|
|
|
|
|
|
|
|
|||||||||||||||||
|
Net income (loss) |
$ | 13,188 | (12,179 | ) | 10,310 | 8,538 | 5,712 | 7,458 | 2,741 | 2,107 | ||||||||||||||||||||||
|
|
|
|
|
|
|
|
|
|
|
|
|
|
|
|
|
|||||||||||||||||
|
Assets |
$ | 1,374,067 | 1,164,903 | 1,004,835 | 766,367 | 717,120 | 394,220 | 362,416 | 351,624 | |||||||||||||||||||||||
|
Loans, net of ALLL |
822,476 | 752,964 | 548,258 | 288,005 | 254,047 | 174,354 | 236,373 | 139,300 | ||||||||||||||||||||||||
|
Goodwill |
8,900 | 23,159 | 18,582 | 22,311 | 41,718 | 1,770 | 1,752 | — | ||||||||||||||||||||||||
|
Deposits |
740,391 | 770,058 | 713,098 | 577,147 | 468,966 | 276,567 | 199,599 | 258,454 | ||||||||||||||||||||||||
|
Stockholders’ equity |
172,224 | 178,765 | 122,807 | 86,606 | 107,234 | 31,784 | 64,656 | 40,322 | ||||||||||||||||||||||||
| Citizens |
First Bank-
MT |
San
Juans |
GORE | Parent |
Eliminations
and Other |
Total
Consolidated |
||||||||||||||||||||||||||
|
Net interest income (loss) |
$ | 10,591 | 7,457 | 7,562 | — | (5,973 | ) | — | 234,768 | |||||||||||||||||||||||
|
Provision for loan losses |
(2,000 | ) | (265 | ) | (750 | ) | — | — | — | (84,693 | ) | |||||||||||||||||||||
|
|
|
|
|
|
|
|
|
|
|
|
|
|
|
|||||||||||||||||||
|
Net interest income (loss) after provision for loan losses |
8,591 | 7,192 | 6,812 | — | (5,973 | ) | — | 150,075 | ||||||||||||||||||||||||
|
Non-interest income |
5,003 | 1,144 | 1,727 | 258 | 61,924 | (59,932 | ) | 87,546 | ||||||||||||||||||||||||
|
Core deposit intangibles amortization |
(93 | ) | (312 | ) | (234 | ) | — | — | — | (3,180 | ) | |||||||||||||||||||||
|
Other non-interest expense |
(8,631 | ) | (3,163 | ) | (5,419 | ) | (2,315 | ) | (14,613 | ) | 14,400 | (184,768 | ) | |||||||||||||||||||
|
|
|
|
|
|
|
|
|
|
|
|
|
|
|
|||||||||||||||||||
|
Income (loss) before income taxes |
4,870 | 4,861 | 2,886 | (2,057 | ) | 41,338 | (45,532 | ) | 49,673 | |||||||||||||||||||||||
|
Income tax (expense) benefit |
(1,700 | ) | (1,590 | ) | (1,045 | ) | 806 | 1,374 | 244 | (7,343 | ) | |||||||||||||||||||||
|
|
|
|
|
|
|
|
|
|
|
|
|
|
|
|||||||||||||||||||
|
Net income (loss) |
$ | 3,170 | 3,271 | 1,841 | (1,251 | ) | 42,712 | (45,288 | ) | 42,330 | ||||||||||||||||||||||
|
|
|
|
|
|
|
|
|
|
|
|
|
|
|
|||||||||||||||||||
|
Assets |
$ | 289,507 | 239,667 | 230,345 | 20,610 | 978,875 | (1,135,269 | ) | 6,759,287 | |||||||||||||||||||||||
|
Loans, net of ALLL |
154,914 | 106,290 | 139,014 | — | — | (3,813 | ) | 3,612,182 | ||||||||||||||||||||||||
|
Goodwill |
9,553 | 12,556 | 5,958 | — | — | — | 146,259 | |||||||||||||||||||||||||
|
Deposits |
207,473 | 165,816 | 184,217 | — | — | (39,884 | ) | 4,521,902 | ||||||||||||||||||||||||
|
Stockholders’ equity |
34,215 | 33,151 | 25,595 | 21,199 | 838,583 | (918,937 | ) | 838,204 | ||||||||||||||||||||||||
115
Table of Contents
| 22) | Operating Segment Information…continued |
| At or for the Year ended December 31, 2009 | ||||||||||||||||||||||||||||
|
(Dollars in thousands) |
Glacier |
Mountain
West |
First
Security |
Western |
1st
Bank |
Valley | Big Sky | |||||||||||||||||||||
|
Net interest income (loss) |
$ | 57,139 | 53,302 | 35,788 | 21,233 | 24,057 | 14,051 | 15,700 | ||||||||||||||||||||
|
Provision for loan losses |
(32,000 | ) | (50,500 | ) | (10,450 | ) | (3,200 | ) | (10,800 | ) | (1,200 | ) | (9,200 | ) | ||||||||||||||
|
|
|
|
|
|
|
|
|
|
|
|
|
|
|
|||||||||||||||
|
Net interest income (loss) after provision for loan losses |
25,139 | 2,802 | 25,338 | 18,033 | 13,257 | 12,851 | 6,500 | |||||||||||||||||||||
|
Non-interest income |
15,387 | 27,882 | 8,103 | 8,631 | 4,628 | 5,717 | 3,564 | |||||||||||||||||||||
|
Core deposit intangibles amortization |
(330 | ) | (184 | ) | (468 | ) | (571 | ) | (652 | ) | (42 | ) | (23 | ) | ||||||||||||||
|
Other non-interest expense |
(27,325 | ) | (51,525 | ) | (18,897 | ) | (16,342 | ) | (14,943 | ) | (9,229 | ) | (8,441 | ) | ||||||||||||||
|
|
|
|
|
|
|
|
|
|
|
|
|
|
|
|||||||||||||||
|
Income (loss) before income taxes |
12,871 | (21,025 | ) | 14,076 | 9,751 | 2,290 | 9,297 | 1,600 | ||||||||||||||||||||
|
Income tax (expense) benefit |
(2,803 | ) | 9,764 | (3,372 | ) | (2,813 | ) | (309 | ) | (2,740 | ) | (121 | ) | |||||||||||||||
|
|
|
|
|
|
|
|
|
|
|
|
|
|
|
|||||||||||||||
|
Net income (loss) |
$ | 10,068 | (11,261 | ) | 10,704 | 6,938 | 1,981 | 6,557 | 1,479 | |||||||||||||||||||
|
|
|
|
|
|
|
|
|
|
|
|
|
|
|
|||||||||||||||
|
Assets |
$ | 1,325,039 | 1,172,331 | 890,672 | 624,077 | 650,072 | 351,228 | 368,571 | ||||||||||||||||||||
|
Loans, net of ALLL |
895,489 | 892,804 | 547,050 | 304,291 | 283,138 | 178,745 | 258,817 | |||||||||||||||||||||
|
Goodwill |
8,900 | 23,159 | 18,582 | 22,311 | 41,718 | 1,770 | 1,752 | |||||||||||||||||||||
|
Deposits |
726,403 | 793,006 | 588,858 | 504,619 | 421,271 | 211,935 | 184,278 | |||||||||||||||||||||
|
Stockholders’ equity |
139,799 | 146,720 | 120,044 | 85,259 | 101,789 | 30,585 | 51,614 | |||||||||||||||||||||
|
First Bank-
WY |
Citizens |
First Bank-
MT |
San
Juans |
Parent |
Eliminations
and Other |
Total
Consolidated |
||||||||||||||||||||||
|
Net interest income (loss) |
$ | 3,964 | 10,437 | 7,900 | 8,021 | (6,265 | ) | — | 245,327 | |||||||||||||||||||
|
Provision for loan losses |
(1,683 | ) | (2,800 | ) | (985 | ) | (1,800 | ) | — | — | (124,618 | ) | ||||||||||||||||
|
|
|
|
|
|
|
|
|
|
|
|
|
|
|
|||||||||||||||
|
Net interest income (loss) after provision for loan losses |
2,281 | 7,637 | 6,915 | 6,221 | (6,265 | ) | — | 120,709 | ||||||||||||||||||||
|
Non-interest income |
4,187 | 4,235 | 929 | 1,329 | 52,466 | (50,584 | ) | 86,474 | ||||||||||||||||||||
|
Core deposit intangibles amortization |
(144 | ) | (111 | ) | (358 | ) | (233 | ) | — | — | (3,116 | ) | ||||||||||||||||
|
Other non-interest expense |
(2,011 | ) | (7,992 | ) | (3,189 | ) | (5,435 | ) | (13,769 | ) | 13,396 | (165,702 | ) | |||||||||||||||
|
|
|
|
|
|
|
|
|
|
|
|
|
|
|
|||||||||||||||
|
Income (loss) before income taxes |
4,313 | 3,769 | 4,297 | 1,882 | 32,432 | (37,188 | ) | 38,365 | ||||||||||||||||||||
|
Income tax (expense) benefit |
(230 | ) | (1,332 | ) | (1,426 | ) | (551 | ) | 1,942 | — | (3,991 | ) | ||||||||||||||||
|
|
|
|
|
|
|
|
|
|
|
|
|
|
|
|||||||||||||||
|
Net income (loss) |
$ | 4,083 | 2,437 | 2,871 | 1,331 | 34,374 | (37,188 | ) | 34,374 | |||||||||||||||||||
|
|
|
|
|
|
|
|
|
|
|
|
|
|
|
|||||||||||||||
|
Assets |
$ | 295,953 | 241,807 | 217,379 | 184,528 | 832,916 | (962,778 | ) | 6,191,795 | |||||||||||||||||||
|
Loans, net of ALLL |
150,155 | 151,731 | 114,113 | 144,655 | — | — | 3,920,988 | |||||||||||||||||||||
|
Goodwill |
— | 9,553 | 12,556 | 5,958 | — | — | 146,259 | |||||||||||||||||||||
|
Deposits |
247,256 | 159,763 | 143,552 | 148,474 | — | (29,263 | ) | 4,100,152 | ||||||||||||||||||||
|
Stockholders’ equity |
31,364 | 31,969 | 32,627 | 25,410 | 685,890 | (797,180 | ) | 685,890 | ||||||||||||||||||||
| 23) | Subsequent Event |
The Company announced on January 18, 2012 that it plans to combine its eleven bank subsidiaries into a single commercial bank. The bank subsidiaries will operate as separate divisions of Glacier under the same names, management teams and divisions as before the consolidation. As part of the consolidation, the Company will file with the appropriate federal and state bank regulators an application to merge the bank subsidiaries. The resulting bank Board of Directors and executive officers will be the Board of Directors and senior management team of the Parent. The consolidation is expected to be completed in early second quarter of 2012, following regulatory approvals. The Company does not expect the transaction to have a material effect on the Company’s financial position or results of operations.
116
Table of Contents
| Item 9. | Changes in and Disagreements with Accountants on Accounting and Financial Disclosure |
There have been no changes or disagreements with accountants on accounting and financial disclosure.
| Item 9A. | Controls and Procedures |
Evaluation of Disclosure Controls and Procedures. An evaluation was carried out under the supervision and with the participation of the Company’s management, including the Chief Executive Officer (“CEO”) and Chief Financial Officer (“CFO”), of the effectiveness of the disclosure controls and procedures. Based on that evaluation, the CEO and CFO have concluded that as of the end of the period covered by this report, the disclosure controls and procedures are effective to provide reasonable assurance that information required to be disclosed by the Company in reports that are filed or submitted under the Securities Exchange Act of 1934 are recorded, processed, summarized and timely reported as provided in the SEC’s rules and forms. As a result of this evaluation, there were no significant changes in the internal control over financial reporting during the three months ended December 31, 2011 that have materially affected, or are reasonable likely to materially affect, the internal control over financial reporting.
Management’s Report on Internal Control Over Financial Reporting Management is responsible for establishing and maintaining effective internal control over financial reporting as it relates to its financial statements presented in conformity with accounting principles generally accepted in the United States of America. The Company’s internal control system was designed to provide reasonable assurance to the Company’s management and Board of Directors regarding the preparation and fair presentation of published financial statements in accordance with accounting principles generally accepted in the United States of America. Internal control over financial reporting includes self monitoring mechanisms and actions are taken to correct deficiencies as they are identified.
There are inherent limitations in any internal control, no matter how well designed, misstatements due to error or fraud may occur and not be detected, including the possibility of circumvention or overriding of controls. Accordingly, even an effective internal control system can provide only reasonable assurance with respect to financial statement preparation. Further, because of changes in conditions, the effectiveness of an internal control system may vary over time.
Management assessed its internal control structure over financial reporting as of December 31, 2011. This assessment was based on criteria for effective internal control over financial reporting described in “Internal Control – Integrated Framework” issued by the Committee of Sponsoring Organizations of the Treadway Commission. Based on this assessment, management asserts that the Company and subsidiaries maintained effective internal control over financial reporting as it relates to its financial statements presented in conformity with accounting principles generally accepted in the United States of America.
BKD LLP, the independent registered public accounting firm that audited the financial statements for the year ended December 31, 2011, has issued an attestation report on the Company’s internal control over financial reporting. Such attestation report expresses an unqualified opinion on the effectiveness of the Company’s internal control over financial reporting as of December 31, 2011.
| Item 9B. | Other Information |
None
117
Table of Contents
| Item 10. | Directors, Executive Officers and Corporate Governance |
Information regarding “Directors and Executive Officers” is set forth under the headings “Election of Directors” and “Management – Executive Officers who are not Directors” of the Company’s 2012 Annual Meeting Proxy Statement (“Proxy Statement”) and is incorporated herein by reference.
Information regarding “Compliance with Section 16(a) of the Exchange Act” is set forth under the section “Compliance with Section 16(a) Filing Requirements” of the Company’s Proxy Statement and is incorporated herein by reference.
Information regarding the Company’s audit committee financial expert is set forth under the heading “Meetings and Committees of the Board of Directors – Committee Membership” in the Company’s Proxy Statement and is incorporated by reference.
Consistent with the requirements of the Sarbanes-Oxley Act, the Company has a Code of Ethics applicable to senior financial officers including the principal executive officer. The Code of Ethics can be accessed electronically by visiting the Company’s website at www.glacierbancorp.com. The Code of Ethics is also listed as Exhibit 14 to this report, and is incorporated by reference to the Company’s 2003 annual report Form 10-K.
| Item 11. | Executive Compensation |
Information regarding “Executive Compensation” is set forth under the headings “Compensation of Directors” and “Executive Compensation” of the Company’s Proxy Statement and is incorporated herein by reference.
| Item 12. | Security Ownership of Certain Beneficial Owners and Management and Related Stockholder Matters |
Information regarding “Security Ownership of Certain Beneficial Owners and Management” is set forth under the headings “Security Ownership of Certain Beneficial Owners and Management” of the Company’s Proxy Statement and is incorporated herein by reference.
| Item 13. | Certain Relationships and Related Transactions, and Director Independence |
Information regarding “Certain Relationships and Related Transactions, and Director Independence” is set forth under the heading “Transactions with Management” and “Corporate Governance – Director Independence” of the Company’s Proxy Statement and is incorporated herein by reference.
| Item 14. | Principal Accounting Fees and Services |
Information regarding “Principal Accounting Fees and Services” is set forth under the heading “Auditors – Fees Paid to Independent Registered Public Accounting Firm” of the Company’s Proxy Statement and is incorporated herein by reference.
118
Table of Contents
| Item 15. | Exhibits, Financial Statement Schedules |
List of Financial Statements and Financial Statement Schedules
| (a) | The following documents are filed as a part of this report: |
| (1) | Financial Statements and |
| (2) | Financial Statement schedules required to be filed by Item 8 of this report. |
| (3) | The following exhibits are required by Item 601 of Regulation S-K and are included as part of this Form 10-K: |
|
Exhibit
|
Exhibit |
|
| 3(a) | Amended and Restated Articles of Incorporation 1 | |
| 3(b) | Amended and Restated Bylaws 1 | |
| 10(a) * | Amended and Restated 1995 Employee Stock Option Plan and related agreements 2 | |
| 10(b) * | Amended and Restated 1994 Director Stock Option Plan and related agreements 2 | |
| 10(c) * | Amended and Restated Deferred Compensation Plan effective January 1, 2008 3 | |
| 10(d) * | Amended and Restated Supplemental Executive Retirement Agreement effective January 1, 2008 3 | |
| 10(e) * | 2005 Stock Incentive Plan and related agreements 4 | |
| 10(f) * | Employment Agreement dated January 1, 2012 between the Company and Michael J. Blodnick 5 | |
| 10(g) * | Employment Agreement dated January 1, 2012 between the Company and Ron J. Copher 5 | |
| 10(h) * | Employment Agreement dated January 1, 2012 between the Company and Don Chery 5 | |
| 14 | Code of Ethics 6 | |
| 21 | Subsidiaries of the Company (See item 1, “Subsidiaries”) | |
| 23 | Consent of BKD LLP | |
| 31.1 | Certification of Chief Executive Officer Pursuant to Section 302 of the Sarbanes-Oxley Act of 2002 | |
| 31.2 | Certification of Chief Financial Officer Pursuant to Section 302 of the Sarbanes-Oxley Act of 2002 | |
| 32 | Certification of Chief Executive Officer and Chief Financial Officer pursuant to 18 U.S.C. Section 1350, as adopted pursuant to Section 906 of the Sarbanes – Oxley Act of 2002 | |
| 101 | The following financial information from Glacier Bancorp, Inc’s Annual Report on Form 10-K for the year ended December 31, 2011 is formatted in XBRL: 1) the Consolidated Statements of Financial Condition, 2) the Consolidated Statements of Operations, 3) the Consolidated Statements of Stockholders’ Equity and Comprehensive Income, 4) the Consolidated Statements of Cash Flows, and 5) the Notes to Consolidated Financial Statements. | |
| 1 |
Incorporated by reference to Exhibits 3.i. and 3.ii included in the Company’s Quarterly Report on form 10-Q for the quarter ended June 30, 2008. |
| 2 |
Incorporated by reference to Exhibits 99.1 - 99.4 of the Company’s S-8 Registration Statement (No. 333-105995). |
| 3 |
Incorporated by reference to Exhibits 10(c) and 10(d) of the Company’s Annual Report on Form 10-K for the fiscal year ended December 31, 2008. |
| 4 |
Incorporated by reference to Exhibits 99.1 through 99.3 of the Company’s S-8 Registration Statement (No. 333-125024). |
| 5 |
Incorporated by reference to Exhibits 10.1 through 10.3 included in the Company’s Form 8-K filed by the Company on January 4, 2012. |
| 6 |
Incorporated by reference to Exhibit 14, included in the Company’s Form 10-K for the year ended December 31, 2003. |
| * |
Compensatory Plan or Arrangement |
All other financial statement schedules required by Regulation S-X are omitted because they are not applicable, not material or because the information is included in the consolidated financial statements or related notes.
119
Table of Contents
SIGNATURES
Pursuant to the requirements of Section 13 or 15 (d) of the Securities Exchange Act of 1934, the Registrant has duly caused this report to be signed on its behalf by the undersigned, thereunto duly authorized on February 28, 2012.
| GLACIER BANCORP, INC. |
|
By: /s/ Michael J. Blodnick |
| Michael J. Blodnick |
| President and CEO |
Pursuant to the requirements of the Securities Exchange Act of 1934, this report has been signed below on February 28, 2012, by the following persons on behalf of the registrant in the capacities indicated.
|
/s/ Michael J. Blodnick |
President, CEO, and Director | |||
| Michael J. Blodnick | (Principal Executive Officer) | |||
|
/s/ Ron J. Copher |
Executive Vice President and CFO | |||
| Ron J. Copher | (Principal Financial Accounting Officer) | |||
| Board of Directors | ||||
|
/s/ Everit A. Sliter |
Chairman | |||
| Everit A. Sliter | ||||
|
/s/ Sherry L. Cladouhos |
Director | |||
| Sherry L. Cladouhos | ||||
|
/s/ James M. English |
Director | |||
| James M. English | ||||
|
/s/ Allen J. Fetscher |
Director | |||
| Allen J. Fetscher | ||||
|
/s/ Dallas I. Herron |
Director | |||
| Dallas I. Herron | ||||
|
/s/ Craig A. Langel |
Director | |||
| Craig A. Langel | ||||
|
/s/ L. Peter Larson |
Director | |||
| L. Peter Larson | ||||
|
/s/ Douglas J. McBride |
Director | |||
| Douglas J. McBride | ||||
|
/s/ John W. Murdoch |
Director | |||
| John W. Murdoch | ||||
120