UNITED STATES
SECURITIES AND EXCHANGE COMMISSION
WASHINGTON, D.C. 20549
FORM
10-K
|
|
ANNUAL REPORT PURSUANT TO SECTION 13 OR 15(d) OF THE SECURITIES EXCHANGE ACT OF 1934
|
||
|
For the fiscal year ended
|
|
||
|
OR
|
|||
|
|
TRANSITION REPORT PURSUANT TO SECTION 13 OR 15(d) OF THE SECURITIES EXCHANGE ACT OF 1934
|
||
|
Commission File Number
|
|
||
|
|
|
|
|
(State of Incorporation)
|
(I.R.S. Employer Identification No.)
|
|
(
617
)
876-1400
(Address and phone number of principal executive offices)
|
Securities registered pursuant to Section 12(b) of the Act:
|
||||
|
Title of each class
|
Trading Symbol
|
Name of each exchange on which registered
|
||
|
|
|
|
||
Securities registered pursuant to Section 12(g) of the Act:
None
Indicate by check mark if the registrant is a well-known seasoned issuer, as defined in Rule 405 of the Securities Act.
Yes
ý
No
o
Indicate by check mark if the registrant is not required to file reports pursuant to Section 13 or 15(d) of the Act. Yes
o
No
ý
Indicate by check mark whether the registrant (1) has filed all reports required to be filed by Section 13 or 15(d) of the Securities Exchange Act of 1934 during the preceding 12 months (or for such shorter period that the registrant was required to file such reports) and (2) has been subject to such filing requirements for the past 90 days.
Yes
ý
No
o
Indicate by check mark whether the registrant has submitted electronically every Interactive Data File required to be submitted pursuant to Rule 405 of Regulation S-T (§232.405 of this chapter) during the preceding 12 months (or for such shorter period that the registrant was required to submit such files).
Yes
ý
No
o
Indicate by check mark whether the registrant is a large accelerated filer, an accelerated filer, a non-accelerated filer, a smaller reporting company, or an emerging growth company. See the definitions of "large accelerated filer," "accelerated filer," "smaller reporting company," and "emerging growth company" in Rule 12b-2 of the Exchange Act.
|
|
☒
|
Accelerated filer
|
☐
|
Non-accelerated filer
|
☐
|
Smaller reporting company
|
|
Emerging growth company
|
|
If an emerging growth company, indicate by check mark if the registrant has elected not to use the extended transition period for complying with any new or revised financial accounting standards provided pursuant to Section 13(a) of the Exchange Act.
o
Indicate by check mark whether the registrant is a shell company (as defined in Rule 12b-2 of the Act). Yes
☐
No
ý
The aggregate market value of GCP Applied Technologies' voting and non-voting common equity held by non-affiliates as of June 28,
2019
(the last business day of the registrant's most recently completed second fiscal quarter) based on the closing sale price of
$22.64
as reported on the New York Stock Exchange was
$
1,232,513,518
.
At February 20,
2020
, there were
72,869,772
shares of GCP Applied Technologies Common Stock,
$.01
par value, outstanding.
DOCUMENTS INCORPORATED BY REFERENCE
TABLE OF CONTENTS
|
PART I
|
||
|
PART II
|
||
|
PART III
|
||
|
PART IV
|
||
Presentation of Information
Unless the context requires otherwise, references to "GCP Applied Technologies Inc.", "GCP", "we", "us", "our" and "the Company" refer to GCP Applied Technologies Inc., and its consolidated subsidiaries for periods subsequent to its separation from W.R. Grace & Co. on February 3, 2016. For periods prior to February 3, 2016, these terms refer to the combined historical business and operations of W.R. Grace & Co.’s construction products and packaging technologies businesses as they were historically managed as part of W.R. Grace & Co. Unless the context requires otherwise, references to "Grace" refer to W.R. Grace & Co., and its consolidated subsidiaries, which is the Company’s former parent company. References in this Annual Report on Form 10-K to the "Separation" refer to the legal separation and transfer of Grace’s construction products and packaging technologies businesses to the Company through a dividend distribution of all of the then-outstanding common stock of GCP to Grace shareholders on February 3, 2016. Our references to "advanced economies" and "emerging regions" refer to classifications established by the International Monetary Fund.
Forward-Looking Statements
This document contains, and our other public communications may contain, forward-looking statements, that is, information related to future, not historical events. Such statements generally include the words "believes," "plans," "intends," "targets," "will," "expects," "suggests," "anticipates," "outlook," "continues" or similar expressions. Forward-looking statements include, without limitation, expected financial positions; results of operations; cash flows; financing plans; business strategy; operating plans; strategic alternatives; capital and other expenditures; competitive positions; growth opportunities for existing products; benefits from new technology and cost reduction initiatives, plans and objectives; and markets for securities. Like other businesses, we are subject to risks and uncertainties that could cause our actual results to differ materially from our projections or that could cause other forward-looking statements to prove incorrect. Factors that could cause actual results to materially differ from those contained in the forward-looking statements, or that could cause other forward-looking statements to prove incorrect, include, without limitation, risks related to: the cyclical and seasonal nature of the industries that GCP serves; foreign operations, especially in emerging regions; changes in currency exchange rates; the cost and availability of raw materials and energy; the effectiveness of GCP’s research and development, new product introductions and growth investments; acquisitions and divestitures of assets and gains and losses from dispositions; developments affecting GCP’s outstanding liquidity and indebtedness, including debt covenants and interest rate exposure; developments affecting GCP’s funded and unfunded pension obligations; warranty and product liability claims; legal proceedings; the inability to establish or maintain certain business relationships and relationships with customers and suppliers or the inability to retain key personnel; the handling of hazardous materials and the costs of compliance with environmental regulations; extreme weather events and natural disasters. These and other factors are identified and described in more detail in Item 1A of this Annual Report on Form 10-K, and GCP's Quarterly Reports on Form 10-Q and Current Reports on Form 8-K, which have been filed with the Securities and Exchange Commission ("SEC") and are available online at www.sec.gov. Our reported results should not be considered as an indication of our future performance. Readers are cautioned not to place undue reliance on GCP's projections and forward-looking statements, which speak only as of the date thereof. GCP undertakes no obligation to publicly release any revision to the projections and forward-looking statements contained in this document, or to update them to reflect events or circumstances occurring after the date of this document.
Trademarks and Trade Names
We own or have rights to trademarks, service marks, copyrights and trade names that we use in conjunction with the operation of our business, including, except as otherwise indicated, the trademarks, service marks or trade names used in this report. A mark designated with a circled “R” (e.g., ADVA
®
) means that the mark has been registered in the USA or other countries where we sell products. This report may also include trademarks, service marks and trade names of other companies. Each trademark, service mark or trade name of any other company appearing in this Annual Report on Form 10-K belongs to its holder. Unless otherwise indicated, use or display by us of other parties’ trademarks, service marks or trade names is not intended to and does not imply a relationship with the trade name owner, or endorsement or sponsorship by us of the trademark, service mark or trade name owner.
1
BUSINESS OVERVIEW
GCP Applied Technologies Inc. is a global provider of construction products and technologies that include admixtures and additives for concrete and cement, the VERIFI
®
in-transit concrete management system, high-performance waterproofing products and specialty construction products. The Company is a leader in its two global operating segments. The Specialty Construction Chemicals ("SCC") operating segment produces concrete admixtures, which enhance the properties of concrete and other cementitious construction materials, cement additives, which improve the performance of Portland cement, the most widely used construction material in the world, as well as in-transit concrete monitoring and management and specialty systems. The Specialty Building Materials ("SBM") operating segment produces building envelope, residential and specialty construction products that protect structures from water, vapor transmission, air penetration and fire damage.
GCP Applied Technologies Inc. was incorporated on May 1, 2015 for the purpose of holding the construction products and packaging technologies businesses of W. R. Grace & Co. On February 3, 2016, Grace shareholders received one common share of GCP for every one common share of Grace held and the construction products and packaging technologies businesses of Grace were transferred to GCP, thereby completing our legal separation from Grace ("the Separation"). On February 4, 2016, we began "regular way" trading on the New York Stock Exchange under the ticker symbol "GCP." On July 3, 2017, we completed the sale of our Darex Packaging Technologies ("Darex") business to Henkel AG & Co. KGaA (“Henkel”) for $1.06 billion in cash.
During the year ended
December 31, 2019
, we generated net sales of
$1,013.5 million
, income from continuing operations before income taxes of
$34.4 million
and net income of
$46.7 million
. Approximately
50%
of our
2019
sales were generated outside of the United States. We operate in more than
30
countries.
Business Strategy
GCP's objective is to grow our sales, earnings, cash flows
,
and return on invested capital through the implementation of our business strategies. We strive to deliver value to our various stakeholders, such as our stockholders, customers and employees
,
and manage our business operations and facilities in a sustainable manner. Our SCC and SBM segments produce and market a portfolio of high
-
performance products for leading global concrete and cement producers, architects, engineers, developers and contractors. Our products must satisfy our customers’ well-defined performance requirements and design specifications to provide high value, although they typically represent a low percentage of the total cost of our customers’ end-products or projects.
We implement the following growth strategies to accelerate progress toward achieving our objectives:
|
•
|
Leverage Global Presence and Construction Product Capabilities to Generate Sales Growth —
We utilize our worldwide sales and marketing organization, technical service and product support
,
research and development capabilities, and our manufacturing and sourcing operations to increase our geographic and customer penetration worldwide. We make targeted investments to expand our capabilities in product and market segments, technology and data analytics, and geographies where trends and economic cycles present the best opportunities.
|
|
•
|
Strengthen and Enhance Our Segment Positions with Product Innovation —
We seek to strengthen our position as an industry innovator by investing in research and development activities focused on commercializing differentiated products and solutions as well as creating new product categories. We introduce and support new construction material, chemistry, sensor and data analytic technologies and categories at our centralized research and development center in Cambridge, Massachusetts and at our regional global applications labs. Examples of our category creation and technology development successes include our multi-patented VERIFI
®
in-transit concrete management system, which provides in-transit data monitoring and management relative to concrete quality and truck delivery status, our PREPRUFE
®
fully
-
bonded pre-applied waterproofing technology, and our ICE & WATER SHIELD
®
self-adhesive underlayment for sloped roofs.
|
2
|
•
|
Maintain Strong Customer Focus —
A key aspect of our strategy is to deliver product and technology solutions to our customers that help improve the performance and longevity of their products or the structures they build, as well as the productivity of their manufacturing operations or product application processes. We believe that maintaining a close partnership with our customers, which includes providing on-site technical support, allows us to effectively focus our innovation efforts and respond to their changing demands at a global, regional and local level. Our goal is to demonstrate the value we provide, which includes outstanding product performance and technical service, as well as savings through reduced application cost and improved life-cycle performance.
|
|
•
|
Grow through Strategic Acquisitions —
Consistent with our business strategies, we may seek strategic acquisitions, partnerships and alliances to accelerate our customer and geographic penetration, extend our product portfolio, advance our technological capabilities, and bolster our manufacturing capacity and capability. We have completed six acquisitions since our separation from Grace, adding product, technology and selling capabilities with each transaction.
|
|
•
|
Increase Productivity by Optimizing Global Operations and Supply Chain —
Our productivity strategies and processes focus on our global operations, including our logistics and supply chains, as well as our general and administrative functions. We have developed procurement and product formulation expertise to manage our product costs and production efficiencies. Product formulations are optimized at our regional development labs. These formulations are designed to meet specific customer needs while also considering the costs of different raw material inputs. Our global supply chain organization balances local raw material supply with global contracts that maximize our buying power while ensuring our supply requirements. Our global manufacturing network also maximizes production and delivery efficiencies.
|
|
•
|
Drive Cash Flow Conversion and Adjusted EBIT Return on Invested Capital to Deliver Long-Term Value to Our Shareholders —
We believe our strategies will allow us to accelerate our cash flow conversion to invest in product development, research and development activities, strategic acquisitions, technical service and sales organizations, manufacturing operations, and to return excess capital to shareholders over time.
|
On February 27, 2019, we announced a comprehensive review of strategic alternatives to enhance shareholder value. Over the course of this review process, we contacted and engaged with both strategic industry players and private equity investors. However, this process did not result in a transaction that would provide adequate value to our shareholders. Accordingly, we have determined that the best opportunity to enhance shareholder value is to pursue our standalone strategic and financial plan. We will continue to evaluate opportunities to drive value for GCP shareholders as our industry continues to evolve.
PRODUCTS AND SEGMENTS
Specialty Construction Chemicals Operating Segment
We supply concrete admixtures, polymer fibers and in-transit monitoring and management systems to concrete producers. These products are used to improve the rheology, workability, quality, durability and other engineering properties of concrete, mortar, masonry and other cementitious construction materials. We also supply additives to cement manufacturers that are used to improve energy efficiency and reduce carbon dioxide in cement processing, enhance the characteristics of finished cement and improve ease of use.
Our cement additives and concrete admixtures help improve the environmental footprint of cement and concrete, and help our customers achieve their sustainability goals. Cement manufacturing is a significant source of carbon dioxide as it is energy intensive and the chemical reaction that takes place in the kiln generates carbon dioxide. Our cement additives make the grinding process more energy efficient and allow for use of supplemental cementitious materials. Our concrete additives disperse the cement particles more evenly, improving the workability during placement. For a given strength requirement, less cement produced in the Kiln is needed reducing the carbon footprint of the concrete.
We compete with several large international suppliers and regionally with smaller competitors. Competition for our products is based on product performance, technical support, the breadth of our manufacturing and distribution infrastructure and our ability to bring value to our customers in the construction industry. Our major global competitors are BASF and Sika.
3
The following table sets forth SCC sales as a percentage of GCP total revenue during the years ended December 31,
2019
,
2018
and
2017
:
|
Year Ended December 31,
|
||||||||||||||||||||
|
2019
|
2018
|
2017
|
||||||||||||||||||
|
(In millions)
|
Sales
|
% of GCP Revenue
|
Sales
|
% of GCP Revenue
|
Sales
|
% of GCP Revenue
|
||||||||||||||
|
Concrete
|
$
|
434.8
|
|
42.9
|
%
|
$
|
478.9
|
|
42.6
|
%
|
$
|
455.6
|
|
42.0
|
%
|
|||||
|
Cement
|
144.3
|
|
14.2
|
%
|
164.6
|
|
14.6
|
%
|
160.1
|
|
14.8
|
%
|
||||||||
|
Total SCC Revenue
|
$
|
579.1
|
|
57.1
|
%
|
$
|
643.5
|
|
57.2
|
%
|
$
|
615.7
|
|
56.8
|
%
|
|||||
The following table sets forth SCC sales by geographic region as a percentage of SCC total revenue during the years ended December 31,
2019
,
2018
and
2017
:
|
Year Ended December 31,
|
||||||||||||||||||||
|
2019
|
2018
|
2017
|
||||||||||||||||||
|
(In millions)
|
Sales
|
% of SCC Revenue
|
Sales
|
% of SCC Revenue
|
Sales
|
% of SCC Revenue
|
||||||||||||||
|
North America
|
$
|
278.0
|
|
48.0
|
%
|
$
|
286.7
|
|
44.6
|
%
|
$
|
256.4
|
|
41.6
|
%
|
|||||
|
Europe Middle East Africa (EMEA)
|
91.0
|
|
15.7
|
%
|
131.4
|
|
20.4
|
%
|
133.3
|
|
21.7
|
%
|
||||||||
|
Asia Pacific
|
152.5
|
|
26.3
|
%
|
165.9
|
|
25.8
|
%
|
160.9
|
|
26.1
|
%
|
||||||||
|
Latin America
|
57.6
|
|
10.0
|
%
|
59.5
|
|
9.2
|
%
|
65.1
|
|
10.6
|
%
|
||||||||
|
Total SCC Revenue
|
$
|
579.1
|
|
100.0
|
%
|
$
|
643.5
|
|
100.0
|
%
|
$
|
615.7
|
|
100.0
|
%
|
|||||
SCC consists of two product groups which include concrete and cement.
Concrete
The concrete product group includes concrete and decorative admixtures, as well as in-transit concrete monitoring and management and engineered systems.
Concrete admixtures allow concrete producers to use a limited selection of locally-sourced raw materials, such as cement and aggregates, to produce concrete and meet a wide variety of performance specifications. Our products are based on a set of core platform technologies formulated regionally into admixtures tailored to local end-use requirements.
Examples of our products include CONCERA
®
admixtures which enable the production of control flow concrete, a high-flowing, segregation-resistant concrete that allows for easier placement while using conventional mix designs. Our CLARENA
®
MC admixture product is a chemical additive that mitigates the effects of clay, which helps quarry owners extend the functional lifespan of their property, and, for ready mix producers, adds controllability to concrete containing aggregates with a high clay content. Our newly introduced CLARENA
®
RC40 admixture product is an environmentally-friendly solution for recycling and re-using returned concrete which significantly reduces concrete waste for our customers. MIRA
®
admixtures allow concrete to be produced with a lower amount of water, which improves the compressive strength and the long-term durability of the concrete. ADVA
®
admixtures are used to make flowable "self-compacting concrete" which is popular in precast concrete manufacturing where the rapid filling of large molds is a major driver of economics. ECLIPSE
®
admixtures are used to minimize the formation of shrinkage cracks in critical applications, such as bridge decks. STRUX
®
polymeric fibers are designed to improve the ductility of concrete which is a naturally brittle material. In some cases, STRUX
®
polymeric fibers may be used to replace steel reinforcement near the surface of concrete that will be exposed to corrosive de-icing salts.
Admixtures for decorative concrete are used to enhance the surface appearance and aesthetics of concrete. PIERI
®
surface retarders are used to obtain exposed aggregate finishes in precast and cast-in-place concrete, achieving the desired surface appearance. PIERI
®
release agents allow for the efficient removal of mold forms with a resulting higher-quality concrete surface.
4
Concrete production monitoring and management systems provide sophisticated process monitoring and control while concrete is in transit to the point of placement. Engineered systems combine proprietary products into high-performance offerings that further reduce installation costs. Our patented concrete production monitoring and management system, sold under the VERIFI
®
brand name, measures, monitors and manages critical concrete properties and systematically adds water or admixtures to maintain optimum concrete flow properties. Use of VERIFI
®
also results in increased product quality, lower material costs, optimized mix designs that reduce required cement content, fewer rejected loads resulting in less waste, increased logistics and jobsite efficiencies, and minimization of costly project delays. The use of VERIFI
®
significantly reduces the carbon footprint of a batch of concrete.
Our patented engineered floor system, which is marketed and sold under the DUCTILCRETE
®
brand name, enables the placement and long-term performance of smooth and level floors which is a necessity in modern industrial and commercial buildings. The flooring system provides customers with more sustainable, cost-effective, and low-maintenance surfaces with higher load-bearing capacity than traditional construction. The DUCTILCRETE
®
system is installed by our network of licensed contractors. The system offers labor and time savings while providing customers with higher quality flat floors.
Cement
Portland cement is the binding agent for concrete. National standards usually dictate the compressive strength and other properties that must be met by cement. Cement additives are used to reduce the energy required to mill cement to the desired fineness and improve the handling characteristics of the powdered material. These products are also used to adjust the performance of Portland cement, permitting our customers to optimize production economics.
Examples of our products include OPTEVA
®
HE quality improvers, which are cement additives that provide options for gaining higher early (HE) strength and are particularly effective for challenging cements. TAVERO
®
VM grinding aid additives help stabilize vertical roller mills during production by reducing water injection requirements and cement pre-hydration, while at the same time improving cement performance by delivering higher strengths and shorter setting time. HEA2
®
Cement Additives are used around the world to improve the energy efficiency of cement grinding operations. CBA
®
Cement Additives are used to produce higher cement strength, which provides a high level of process flexibility to the cement manufacturer. Increasingly, cement manufacturers seek to reduce the environmental impact of their manufacturing processes. Our additives provide greater flexibility in raw materials, enabling customers to achieve improvements such as reductions in energy use and CO
2
emissions.
5
The SCC product portfolio includes the following products:
|
Products
|
Uses
|
Customers
|
Key Brands
|
|||
|
Concrete admixtures
|
Chemicals and polymeric fibers used to reduce the production and in-place costs of concrete, increase the performance of concrete and improve the life cycle cost of structures
|
Ready-mix and precast concrete producers, engineers and specifiers
|
CONCERA
®
, CLARENA
®
, ADVA
®
, CLARENA
®
RC40, STRUX
®
, MIRA
®
, TYTRO
®
, POLARSET
®
, ECLIPSE
®
, DARACEM
®
, DARASET
®
, DCI
®
, RECOVER
®
, WRDA
®
, ZYLA
®
|
|||
|
Admixtures for decorative concrete
|
Products for architectural concrete include surface retarders, coatings, pigments and release agents used by concrete producers and contractors to enhance the surface appearance and aesthetics of concrete
|
Precast concrete producers and architects
|
PIERI
®
|
|||
|
Concrete production management and control systems
|
Proprietary sensors, algorithms and control systems which monitor and adjust the flow properties while in transit to construction sites, providing concrete producers quality control and operational efficiencies
|
Ready-mix concrete manufacturers, engineers, specifiers and contractors
|
VERIFI
®
|
|||
|
Engineered concrete slab systems
|
Proprietary systems designed to reduce the placement and life cycle cost of concrete slabs
|
Contractors, engineers and specifiers; developers and owners of industrial warehouses and manufacturing facilities
|
DUCTILCRETE®
|
|||
|
Cement additives
|
Formulated chemicals added to the milling stage of the cement manufacturing process to improve plant energy efficiency, enhance the performance of the finished cement, help our customers meet environmental regulations and reduce their CO
2
footprint
|
Cement manufacturers
|
OPTEVA
®
HE, TAVERO
®
VM, CBA
®
, SYNCHRO
®
, HEA2
®
, TDA
®
, ESE
®
|
|||
Specialty Building Materials Operating Segment
We manufacture and sell building and flooring materials used in both new construction and renovation/repair projects for the commercial, residential and infrastructure markets. Our products protect structures from water, vapor transmission, air penetration and fire damage, while reducing energy usage and improving the long-term durability of structures. They include waterproofing sheet and liquid membranes, weather barriers, roofing underlayments, polymeric injection systems and grouts for use in waterproofing and soil stabilization applications, air and vapor barriers, cementitious grouts, passive fire protection, a flooring barrier system and flooring installation products.
Our products are specified and installed on commercial, residential and infrastructure projects around the world. Our technology platforms, project selling competencies and international reach are the foundation of our industry leadership. We are dedicated to understanding local codes and construction practices so that our technology solutions address the regional needs of our customers. Our global specification sales organization emphasizes its technical expertise and has established relationships with key influencers and decision makers across the entire project selling value chain, including architects, engineers, consultants, general contractors, specialty contractors and other channel partners. We continue to expand our international presence in targeted regions with our core product lines and by adding new technologies.
As a global leader in waterproofing and air barrier technologies, our products are regularly specified and utilized to achieve the sustainability goals of contractors, designers and building owners. Developed and produced with performance and durability criteria in mind, many of our solutions contribute to sustainable construction. Our systems enable environmentally responsible design and contribute to long-standing industry rating systems, such as LEED. We remain committed to developing our solutions with sustainability at the forefront and supporting the evolution of highly efficient and long-lasting structures.
Our Specialty Building Materials product sales are global. We engage with global architectural and contracting firms, as well as local specifiers, engineers
,
contractors and building material distributors that influence the buying decisions for our products. Sales to a certain customer represented approximately 10% of SBM revenue during 2019, 2018 and 2017.
6
We compete globally with several large international construction materials suppliers, as well as regionally and locally with numerous smaller competitors. Competition for our products is based on product performance, technical support and service, brand name recognition and price. Our major competitors are Sika, RPM, Soprema and Carlisle.
The following table sets forth SBM sales as a percentage of GCP total revenue during the years ended December 31,
2019
,
2018
and
2017
:
|
Year Ended December 31,
|
||||||||||||||||||||
|
2019
|
2018
|
2017
|
||||||||||||||||||
|
(In millions)
|
Sales
|
% of GCP Revenue
|
Sales
|
% of GCP Revenue
|
Sales
|
% of GCP Revenue
|
||||||||||||||
|
Building Envelope
|
$
|
246.3
|
|
24.3
|
%
|
$
|
284.4
|
|
25.3
|
%
|
$
|
263.3
|
|
24.3
|
%
|
|||||
|
Residential Building Products
|
81.2
|
|
8.0
|
%
|
80.9
|
|
7.2
|
%
|
80.3
|
|
7.4
|
%
|
||||||||
|
Specialty Construction Products
|
106.9
|
|
10.5
|
%
|
116.6
|
|
10.3
|
%
|
125.1
|
|
11.5
|
%
|
||||||||
|
Total SBM Revenue
|
$
|
434.4
|
|
42.8
|
%
|
$
|
481.9
|
|
42.8
|
%
|
$
|
468.7
|
|
43.2
|
%
|
|||||
The following table sets forth SBM sales by geographic region as a percentage of SBM total revenue during the years ended December 31,
2019
,
2018
and
2017
:
|
Year Ended December 31,
|
||||||||||||||||||||
|
2019
|
2018
|
2017
|
||||||||||||||||||
|
(In millions)
|
Sales
|
% of SBM Revenue
|
Sales
|
% of SBM Revenue
|
Sales
|
% of SBM Revenue
|
||||||||||||||
|
North America
|
$
|
259.4
|
|
59.7
|
%
|
$
|
284.3
|
|
59.0
|
%
|
$
|
283.8
|
|
60.6
|
%
|
|||||
|
Europe Middle East Africa (EMEA)
|
102.5
|
|
23.6
|
%
|
109.3
|
|
22.7
|
%
|
111.3
|
|
23.7
|
%
|
||||||||
|
Asia Pacific
|
70.0
|
|
16.1
|
%
|
79.7
|
|
16.5
|
%
|
68.3
|
|
14.6
|
%
|
||||||||
|
Latin America
|
2.5
|
|
0.6
|
%
|
8.6
|
|
1.8
|
%
|
5.3
|
|
1.1
|
%
|
||||||||
|
Total SBM Revenue
|
$
|
434.4
|
|
100.0
|
%
|
$
|
481.9
|
|
100.0
|
%
|
$
|
468.7
|
|
100.0
|
%
|
|||||
SBM consists of three product groups which include building envelope, residential building products and specialty construction products.
Building Envelope Products
Building envelope products protect structures from water and help manage air and vapor transmission through building walls. The majority of sales in this product group are waterproofing sheet and liquid products that protect commercial structures, residential structures and infrastructure. Our waterproofing products are used in both above-grade and below-grade applications. Above grade, our products protect the material to which they are applied and minimize water infiltration into occupied spaces. Below grade, our products enable the construction of structures in challenging sites, such as locations with a high existing water table. Examples of these products include our innovative PREPRUFE
®
pre-applied sheet membrane, BITUTHENE
®
self-adhesive rubberized asphalt membrane, and our ELIMINATOR
®
liquid applied waterproofing system.
We pioneered the pre-applied waterproofing category with our Advanced Bond Technology™ brand in association with our PREPRUFE
®
products. Our unique technology allows a waterproofing membrane to be installed on the ground or on walls before concrete is placed for a foundation. This technology also allows waterproofing of walls normally inaccessible during the construction of a building, such as foundations in densely populated cities. Major projects around the world have successfully installed our PREPRUFE
®
waterproofing systems that continue to gain recognition for waterproofing performance. Our BITUTHENE
®
product line has a long track record of providing waterproofing in the most challenging conditions. Designers and contractors have relied on BITUTHENE
®
products for over 40 years and continue to specify our products by using the BITUTHENE
®
brand name. Our PERM-A-BARRIER
®
wall membranes protect the building structure from the damaging effects of the elements. By minimizing air and water vapor flow through the building exterior, PERM-A-BARRIER
®
Wall Membranes prevent premature deterioration of the building envelope and enhance thermal performance of the structure and save energy costs. Our ELIMINATOR
®
liquid applied waterproofing systems are used to protect and extend the life of bridges. Major bridge projects in North America, Europe and Asia have used our ELIMINATOR
®
systems over the last 20 years.
7
Residential Building Products
Residential building products consist of roofing underlayments, flashings and weather barriers. Roofing underlayments are placed below the outermost roof covering, such as shingles, to protect sloped roofs from water damage caused by wind-driven rain and ice dams. Our ICE & WATER SHIELD
®
roofing underlayments are known throughout the industry and are sold in North America through a network of distributors. The VYCOR
®
flashing portfolio consists of high performance self-adhered flashing products that provide premium protection against water infiltration in critical areas such as windows and doors. Our VYCOR
®
flashing products reduce the risk of mold and rot development, and contribute to energy efficiency by sealing air leakages in the building envelope.
Specialty Construction Products
Specialty construction products include fire protection, chemical injection systems and grouts, cementitious grouts and mortars, as well as specialty flooring products. Passive fire protection products are marketed under the MONOKOTE
®
brand. MONOKOTE
®
products reduce the rate of temperature rise in steel or concrete in the event of a fire, thereby prolonging the structural integrity of the building. Chemical injection systems and grouts are sold under the DE NEEF
®
brand and used for repairing cracks in concrete, sealing water leaks in commercial buildings and infrastructure and stabilizing soil. BETEC
®
cementitious grouts and mortars are used in applications where specific strength and/or flow are required. Examples of these applications include assembly of concrete precast elements for wind turbines, filling under rails for railroads and providing a high-strength surface for heavy machinery in industrial settings. Our KOVARA
®
flooring membrane is a moisture mitigation membrane installed between a concrete subfloor and surface flooring to protect the finished flooring from moisture and alkalinity related damage. Other flooring installation products include seam tapes, underlayments and tools and accessories used for the installation of carpet, ceramic, laminate, stone and other surface flooring.
The SBM product portfolio includes the following products:
|
Products
|
Uses
|
Customers
|
Key Brands
|
|||
|
Building envelope products
|
Structural barrier systems to prevent above and below ground water, vapor and air infiltration of the building envelope of commercial structures, including self-adhered sheet and liquid membranes, joint sealing materials, drainage composites and waterstops.
|
Architects, consultants and structural engineers; specialty waterproofing, masons, dry wall contractors and general contractors; specialty distributors
|
PREPRUFE
®
, BITUTHENE
®
,
ADPRUFE
®
, HYDRODUCT
®
, ADCOR
®
, SILCOR
®
, PERM-A-BARRIER
®
,
ELIMINATOR
®
, INTEGRITANK
®
|
|||
|
Residential building products
|
Specialty roofing membranes and flexible flashings for windows, doors, decks and detail areas, including fully adhered roofing underlayments, synthetic underlayments and self-adhered flashing
|
Roofing contractors, home builders and remodelers; building material distributors, lumberyards and home centers; architects and specifiers
|
ICE & WATER SHIELD®, TRI-FLEX®, VYCOR®
|
|||
|
Fire protection materials
|
Fire protection products spray-applied to the structural steel frame, encasing and insulating the steel and protecting the building in the event of fire and enhancing the heat resistance during a fire
|
Local contractors and specialty subcontractors and applicators; building materials distributors; industrial manufacturers; architects and structural engineers
|
MONOKOTE
®
|
|||
|
Chemical grouts
|
Products for repair and remediation in waterproofing applications and soil stabilization
|
Contractors; specialty distributors; municipalities; and other owners of large infrastructure facilities
|
DE NEEF
®
, HYDRO ACTIVE
®
, SWELLSEAL
®
, DE NEEF
®
PURe™
|
|||
|
Cementitious grouts and mortars
|
Cementitious grouts and mortars used for under filling and gap filling
|
Specialty contractors engaged in the repair of concrete, installation of new precast concrete elements and infrastructure repair
|
BETEC
®
|
|||
|
Specialty flooring products
|
Flooring moisture barriers and installation products
|
Distributors; contractors; home centers; flooring manufacturers; and large commercial end users
|
KOVARA
®
,
ORCON
®
|
|||
8
SALES AND MARKETING
Our two operating segments maintain global direct sales and technical service teams supporting customers in over
125
countries worldwide. Our global team sells products under annual and multi-year global, regional and local agreements and has developed deep segment and product application knowledge. We believe that our in depth understanding of our customers' needs, challenges and operations, as well as our ability to service at a high standard throughout the world, give both of our segments a competitive advantage. The majority of our products require local, regional, country and international code approvals related to their use, storage and performance. Our commercial organization supports and consults on committees and technical associations in order to ensure codes and product standards are consistently applied.
Our sales professionals work with leading architects, engineers, consultants and contractors across the globe seeking to have our products specified for use in thousands of projects on an annual basis. Our products have been used to build some of the world's most renowned structures. As part of our "go to market" strategy, the SCC team provides technical services to several thousand concrete and cement production facilities worldwide. In many cases, we also provide product dispensing equipment to our customers as an integral part of the concrete and cement production process.
MANUFACTURING, RAW MATERIALS AND SUPPLY CHAIN
Our operating segments share global supply chain processes, manufacturing facilities, as well as technical service and sales centers around the world, which provides cost efficiency.
We utilize internal and third-party manufacturing to produce our products to our specifications. Our low capital intensive plants along with third-party manufacturers provide us with flexibility in servicing our customers. Several of our plants ship products internationally, but most of our facilities are positioned to serve local market demand. We have the ability to respond quickly to changes in local demand by establishing or expanding manufacturing capacity with low capital investment. We have numerous multi-year supply and purchasing agreements with both our vendors and customers which helps us minimize volume disruptions. Construction demand is seasonal, resulting in demand variations requiring effective management of our manufacturing and distribution assets. For many of our SCC customers, we install and maintain a chemical dispensing and storage system for our products at their production facilities. We periodically replenish the on-site systems to give our customers instant access to our SCC products in the amounts they require twenty-four hours a day. We also install equipment on ready-mix trucks to monitor and manage concrete in transit to jobsites. Total customer-based equipment accounted for approximately
49%
of our
2019
annual capital spend.
The raw materials we use in our products are obtained from a variety of suppliers, including basic chemical and petrochemical producers. Many of our raw materials are organic chemicals derived from olefins, including specialty films and fibers. We also make significant purchases of inorganic materials, such as lignin and specialty materials, including plasticizers, films, ethylene derivatives, and rubber. We have multiple raw material sources and balance our purchasing requirements between local and global sources seeking to maximize performance and profitability. Global supply and demand factors, changes in currency exchange rates and petroleum prices can significantly impact the price of our key raw materials.
Our global supply chain team monitors the global market to identify cost and productivity opportunities. We seek to leverage our overall purchasing volumes for all regions. Since we manufacture a portion of our products in emerging regions using raw materials from suppliers in the U.S., Europe and other advanced economies, changes in the values of the currencies of these emerging regions compared to the U.S. dollar and the euro may adversely affect our raw material costs. This effect is partially mitigated by our reliance on local sourcing for some raw materials.
The construction business is cyclical in response to economic conditions, as well as seasonal since it is driven by weather conditions. Demand for our products is primarily driven by global non-residential and infrastructure construction activity and U.S. residential construction activity. We seek to increase profitability and minimize the impact of cyclical downturns in regional economies by introducing technically advanced high-performance products and rationalizing non-profitable geographies.
9
FINANCIAL INFORMATION ABOUT INDUSTRY SEGMENTS AND GEOGRAPHIC AREAS
Disclosure of financial information about industry segments and geographic areas for the years ended December 31,
2019
,
2018
and
2017
is provided in this Annual Report on Form 10-K in Item 8, "Financial Statements and Supplementary Data" under Note 18, "Operating Segment and Geographic Information" to the Consolidated Financial Statements, which is incorporated herein by reference. Disclosure of risks related to our foreign operations is provided in Item 1A, "Risk Factors".
BACKLOG OF ORDERS
While at any given time there may be some backlog of orders, backlog is not material with respect to our total annual sales. The changes in the backlog taking place from time to time are not significant.
RESEARCH ACTIVITIES AND INTELLECTUAL PROPERTY
We believe success in our industry is driven by technology and innovation. Growing our businesses and maintaining our margins is dependent on our ability to introduce new products and enhance existing products based on innovative technology, as well as our ability to obtain patent or other intellectual property protection. Our research and development programs emphasize development of new products and processes, improvement of existing products and processes and application of existing products and processes to new industries and uses.
Our world-class Global Innovation Center in Cambridge, Massachusetts houses the product research activities that support both of our operating segments. The global marketing resources that we believe are essential to a successful product development process are also located with our research and development group in Cambridge. Our Regional Technical Centers collaborate with Global Innovation Center to develop global technologies, as well as customized products and technologies for each region. Our technologies are supported in the field by a network of Regional Technical Centers, including facilities in Sorocaba, Brazil; Toh Guan, Singapore; Beijing, China; Atsugi, Japan; Epping, Australia; Manchester, UK and Heist, Belgium.
We maintain a global research and development and technical service workforce. We believe the collective technical expertise, industry knowledge and professionalism of the team is a significant differentiator for us.
We file patent applications globally on a routine basis and obtain grants in numerous countries around the world in support of our products, formulations, manufacturing processes, monitoring systems, equipment, and improvements. We also benefit from technological and commercial advantages protected under trade secret laws, including know-how and other proprietary information related to many of our products, technologies and internal quality control and testing methodologies. Entering
2020
, we have approximately 900-1,000 active patents and patent applications pending in countries around the world, including approximately 155-165 in the U.S. We estimate that our filing rate is between
60
and
110
patent applications globally on an annual basis, including priority and national stage application filings. The average number of patents filed, pending, granted, and maintained could go up or down from year to year, depending on various factors, some of which may not be within our control. It is our intent to continue to file for patents to protect our proprietary innovations and investments in research.
Research and development expenses were
$18.4 million
, $
20.2 million
and $
20.0 million
, respectively, during the years ended December 31,
2019
,
2018
and
2017
. These amounts include depreciation and amortization expenses related to research and development assets and expenses incurred in funding external research projects. The amount of research and development expenses relating to government- and customer-sponsored projects (rather than projects that we sponsor) was not material during these periods.
10
ENVIRONMENT, HEALTH AND SAFETY MATTERS
We are subject, along with other manufacturers of specialty chemicals, to stringent regulations under numerous regional, national, provincial, state and local environmental, health and safety laws and regulations related to the manufacture, storage, handling, disposal, disposition and stewardship of chemicals and other materials. Environmental laws require that certain responsible parties, as defined in the relevant statute, fund remediation actions regardless of legality of original disposal or ownership of a disposal site. We are involved in response actions to address the presence of hazardous substances or other materials as required by applicable laws.
We continuously seek to improve our environment, health and safety performance. We have expended funds to comply with environmental laws and regulations and expect to continue to do so in the future.
EMPLOYEE RELATIONS
As of
December 31, 2019
, we had approximately
2,000
employees, of which approximately
740
were employed in the United States.
Approximately
50
of our manufacturing employees in the United States are represented by five different local collective bargaining groups. We have operated without a labor work stoppage for more than
12
years.
We have works councils representing
eight
of the European countries in which we do business covering approximately
250
employees.
AVAILABLE INFORMATION
We maintain an Internet website at
www.gcpat.com
. Our Annual Report on Form 10-K, quarterly reports on Form 10-Q, current reports on Form 8-K, and amendments to those reports, filed or furnished pursuant to Sections 13(a) or 15(d) of the Securities Exchange Act of 1934, as amended, are available, free of charge, on our website as soon as reasonably practicable after such reports are electronically filed with, or furnished to, the Securities and Exchange Commission, or "SEC." Further, the SEC's website, www.sec.gov, contains reports and other information regarding our filings. These reports may be accessed through our website's investor relations page.
In addition, the charters for the Audit, Compensation, Nominating and Governance, and Corporate Responsibility Committees of our Board of Directors, our corporate governance principles and code of ethics are available, free of charge, on our website at http://investor.gcpat.com/corporate-governance/governance-documents. Printed copies of the charters, governance guidelines and code of ethics may be obtained free of charge by contacting GCP Shareholder Services by emailing investors@gcpat.com or by calling (617) 876-1400. The information on our website is not, and shall not be deemed to be, a part of this report or incorporated into any other filings we make with the SEC.
Our operations are subject to a number of risks, including those listed below. When considering investments in our company, you should carefully consider each of the following risk factors and all of the other information set forth in this Annual Report on Form 10-K. Based on the information currently known to us, we believe that the following information identifies the most significant risk factors affecting the Company and our business in each of these categories of risks. However, the risks and uncertainties the Company faces are not limited to those set forth in the risk factors described below. Additional risks and uncertainties not presently known to us or that we currently believe to be immaterial may also adversely affect our business and may be material. In addition, past financial performance may not be a reliable indicator of future performance, and historical trends should not be used to anticipate results or trends in future periods.
If any of the following risks and uncertainties develops into actual events, these events could have a material adverse effect on our business, financial condition or results of operations. In such case or in the case that an additional risk or uncertainty not presently known to us or that we currently believe to be immaterial develops into actual events or the materiality increases, the trading price of our common stock could decline.
11
Risks Relating to Our Business
We face significant competition and, if we are not able to respond to competition, our revenues may decrease.
We face significant competition from a variety of competitors in each of our markets. Some of our competitors have substantially greater financial, marketing, personnel and other resources than we do. New competitors also could enter our markets, certain of our competitors could consolidate and/ or certain of our customers could decide to self-manufacture or otherwise enter our markets, which may result in increased competitive pressures. We consider product quality, performance, customer service, on-time delivery, price, distribution capabilities and breadth of product offerings to be the primary competitive factors in our markets. Our competitors may be able to offer more attractive pricing, duplicate our strategies, or develop enhancements to products that could offer performance features that are superior to our products. Competitive pressures, including those described above, could adversely affect our competitive position, leading to a loss of market share or decreases in prices, either of which could have a material adverse effect on our business, financial condition or results of operations.
If we are not able to continue our technological innovation and successful introduction of new products, our customers may turn to other suppliers to meet their requirements.
The specialty chemicals and building materials industries, as well as the end-use applications into which we sell our products, experience ongoing technological change and product improvements. A key element of our business strategy is to invest in research and development activities with the goal of introducing new high-performance, technically differentiated products and innovative Internet of Things (IoT) solutions. We may not be successful in developing new technology and products that successfully compete with products introduced by our competitors, and our customers may not accept or may have lower demand for our new products. If we fail to keep pace with evolving technological innovations or fail to improve our products in response to our customers’ needs, then our business, financial condition and results of operations could be adversely affected as a result of reduced sales of our products.
The loss of a significant customer relationship or the delay of large or multiple contracts or a strategic project may negatively impact our financial performance.
A significant portion of our product sales are based on individual purchase orders with no guaranteed volumes and no committed purchase times beyond the specifics of the particular order. The loss of a significant customer relationship could adversely affect our operating results. Additionally, customers may not place expected orders or delay them for a variety of reasons, including, but not limited to:
|
•
|
delay in overall project timing, which may be due to a wide variety of economic, political, project-specific, weather-related, or other factors;
|
|
•
|
customer decisions to switch to a competitor, which may be driven by product quality, performance, pricing or service;
|
|
•
|
a decision by a customer to self-manufacture, thereby replacing our products;
|
|
•
|
merger or acquisition activities by or involving our customer;
|
|
•
|
significant downturn in the overall construction demand.
|
If we are unable to successfully execute our acquisition strategies or successfully integrate acquired businesses, our business, results of operations and financial condition could be adversely impacted.
We have in recent years completed a number of acquisitions that we believe will contribute to our future success. We continue to assess and may pursue opportunities to buy other businesses or technologies that could complement, enhance or expand our current businesses or product lines or might otherwise offer us growth opportunities. We may have difficulty identifying appropriate opportunities or, if we do identify opportunities, we may not be successful in completing transactions for a number of reasons. Any transactions that we are able to identify and complete may involve a number of risks, including:
|
•
|
the diversion of management's attention from our existing businesses to integrate the operations and personnel of the acquired or combined business or joint venture;
|
12
|
•
|
possible adverse effects on our operating results during the integration process;
|
|
•
|
failure of the acquired business to achieve expected operational objectives; and
|
|
•
|
our possible inability to achieve the intended objectives of the transaction.
|
In addition, we may not be able to successfully or profitably integrate, operate, maintain and manage any newly acquired operations or their employees. We may not be able to maintain uniform standards, controls, procedures and policies, which may lead to operational inefficiencies.
The length and depth of product and industry business cycles in our segments may result in periods of reduced sales, earnings and cash flows, and portions of our business are subject to seasonality, weather-related effects and other adverse events outside our control
Our construction business is cyclical in response to economic conditions and construction demand and is also seasonal and dependent on favorable weather conditions, with a decrease in construction activity during the winter months, periods of wet weather and times when other weather and climate conditions would impair construction activity. Extreme weather events, natural disasters and public health or safety emergencies (such as the coronavirus epidemic originating from China) on a global, regional or national level could also have material adverse impacts on our business and financial results. Moreover, it is possible that weather and climate volatilities and associated events could increase significantly in the future.
Prices of certain raw materials used in our production processes are volatile and can have a significant effect on our manufacturing and supply chain strategies as we seek to maximize our profitability. If we are unable to successfully adjust our strategies in response to volatile raw material prices, such volatility could have a negative effect on our earnings.
We use petroleum-based materials, natural gas derivatives and other materials to manufacture our products. Prices for these materials are volatile and can have a significant effect on our pricing, sales, manufacturing and supply chain strategies as we seek to maximize our profitability. Our ability to successfully adjust strategies in response to volatile raw material prices by increasing prices for our products and services, reducing costs or taking other actions is a significant factor in maintaining or improving our profitability. If we are unable to successfully adjust our strategies in response to volatile raw material prices, such volatility could have a negative effect on our sales and earnings in future periods.
A substantial portion of our raw materials are commodities whose prices fluctuate as market supply and demand fundamentals change. We attempt to manage exposure to price volatility of major commodities through:
|
•
|
long-term supply contracts;
|
|
•
|
customer contracts that permit adjustments for changes in prices of commodity-based materials and energy; and
|
|
•
|
forward buying programs that layer in our expected requirements systematically over time;
|
Although we regularly assess our exposure to raw material price volatility, we cannot always predict the prospects of volatility and we cannot always cover the risks we face in a cost-effective manner.
We have a policy of maintaining, when available, multiple sources of supply for raw materials. However, certain of our raw materials may be provided by single or sole sources of supply. We may not be able to obtain sufficient raw materials due to unforeseen developments that would cause an interruption in supply. Even if we have multiple sources of supply for raw materials, these sources may not make up for the loss of a major supplier.
Some of our products are either tolled or contract manufactured by third party providers, and similar potential exposures exist where these are single or sole supply relationships.
13
The global scope of our operations subjects us to the risks of doing business in foreign countries, which could adversely affect our business, financial condition and results of operations.
We operate our business on a global scale with approximately
50%
of our
2019
sales generated outside of the United States. We operate in over
30
countries and in over
30
currencies. We currently have many production facilities, technical centers and administrative and sales offices located outside of North America, including facilities and offices in Europe, Middle East, Africa, Asia Pacific and Latin America. We expect non-U.S. sales to continue to represent a significant portion of our revenue. Accordingly, our business is subject to risks related to the differing legal, political, social and economic conditions and regulatory requirements of many jurisdictions, as well as risks related to the political relationship between the foreign countries in which we conduct business and the United States. Risks inherent in non-U.S. operations include the following:
|
•
|
commercial agreements may be more difficult to enforce and receivables more difficult to collect;
|
|
•
|
intellectual property rights may be more difficult to enforce;
|
|
•
|
we may experience increased shipping costs, disruptions in shipping or reduced availability of freight transportation;
|
|
•
|
we may have difficulty transferring our profits or capital from foreign operations to other countries where such funds could be more profitably deployed;
|
|
•
|
we may experience unexpected adverse changes in export duties, quotas and tariffs and difficulties in obtaining export licenses;
|
|
•
|
some foreign countries have adopted, and others may impose, additional withholding taxes or other restrictions on foreign trade or investment, including currency exchange and capital controls;
|
|
•
|
foreign governments may nationalize private enterprises;
|
|
•
|
our business and profitability in a particular country could be affected by differing legal systems and customs and by political or economic repercussions on a domestic, country specific or global level from terrorist activities and the response to such activities.
|
In addition, our international sales and operations are subject to risks associated with changes in local government laws, regulations and policies, including those related to tariffs and trade barriers, investments, taxation, exchange controls, capital controls, employment regulations, and repatriation of earnings. Government policies on international trade and investments, such as economic and trade sanctions against certain countries, governments and/or individuals, import quotas, capital controls, taxes or tariffs, whether adopted by individual governments or regional trade blocs, can affect demand for our products and services, impact the competitive position or our products or prevent us from being able to manufacture or sell products in certain countries. The implementation of more restrictive trade policies, including the imposition of tariffs, or the renegotiation of existing trade agreements between the U.S. and other countries, such as the People’s Republic of China, or between any other countries where we sell large quantities of products and services or procure supplies and other materials incorporated into our products, including changes in applicable trade regulations as a result of the U.K.'s withdrawal from the EU ("Brexit"), could negatively impact our business, results of operations and financial condition. For example, a government's policies on tariffs and trade, or retaliation by another government against such policies, may result in decreased revenue, gross margin, earnings or growth rates and difficulty in managing inventory levels and collection of customer receivables. Our international sales and operations are also sensitive to changes in foreign national priorities, as well as to political and economic instability. Our success as a global business will depend, in part, upon our ability to succeed in differing legal, regulatory, economic, social and political conditions by developing, implementing and maintaining policies and strategies that are effective in each location where we do business.
14
We are exposed to currency exchange rate changes that impact our profitability and these risks could increase as a result of global political uncertainty and other risks in international markets.
We are exposed to currency exchange rate risk through our global operations. Changes in currency exchange rates may materially affect our operating results. For example, changes in currency exchange rates may affect the relative prices at which we and our competitors sell products in the same region and the cost of materials used in our operations. A substantial portion of our net sales and assets are denominated in currencies other than the U.S. dollar. When the U.S. dollar strengthens against other currencies, at a constant level of business, our reported sales, earnings, assets and liabilities are reduced because the foreign currencies translate into fewer U.S. dollars. In addition, since we manufacture a portion of our construction products in emerging regions using raw materials from suppliers in the U.S., Europe and other advanced economies, changes in the values of the currencies of these emerging regions versus the U.S. dollar, the euro and the currencies of other advanced economies in which we purchase raw materials, may adversely affect our raw material costs and results of operations.
We incur currency transaction risk whenever one of our operating subsidiaries enters into either a purchase or a sales transaction using a currency different from the operating subsidiary's functional currency. Given the volatility of exchange rates, we may not be able to manage our currency transaction risks effectively, which may expose our financial condition or results of operations to significant additional risk.
Certain of business activities outside of the United States require direct or indirect interaction with governmental entities. For example, in some countries our direct customer or one or several key stakeholders in projects that we sell products to would be state-controlled entities (SOEs). Due to this, we could be materially and adversely affected by violations of the U.S. Foreign Corrupt Practices Act ("FCPA") and similar worldwide anti-bribery laws in non-U.S. jurisdictions.
The FCPA and similar worldwide anti-bribery laws in non-U.S. jurisdictions generally prohibit companies and their intermediaries from making improper payments to non-U.S. officials for the purpose of obtaining or retaining business. Because certain of our customer relationships outside of the United States are with governmental entities, we are subject to such anti-bribery laws. Our policies mandate compliance with these anti-bribery laws. We operate in many parts of the world that have experienced governmental corruption to some degree, and in certain circumstances strict compliance with anti-bribery laws may conflict with local customs and practices. Despite our training and compliance programs, our internal control policies and procedures may not always protect us from reckless or criminal acts committed by our employees or agents. Violations of anti-bribery laws or allegations of such violations, could disrupt our business and result in a material adverse effect on our results of operations, financial condition and cash flows.
We have debt obligations that could restrict our business, adversely impact our financial condition, results of operations or cash flows or restrict our ability to return cash to shareholders.
As of
December 31, 2019
, we had $
349.2 million
of indebtedness outstanding. The amount of and terms governing the Company's indebtedness may have material effects on our business, including to:
|
•
|
require us to dedicate a substantial portion of our cash flow to debt payments, thereby reducing funds available for working capital, capital expenditures, acquisitions, research and development, distributions to holders of company common stock and other purposes;
|
|
•
|
restrict us from making strategic acquisitions or taking advantage of favorable business opportunities;
|
|
•
|
limit our flexibility in planning for or reacting to, changes in our business and the industries in which we operate;
|
|
•
|
increase our vulnerability to adverse economic, credit and industry conditions, including recessions;
|
|
•
|
make it more difficult for us to satisfy our debt service and other obligations;
|
|
•
|
place us at a competitive disadvantage compared to our competitors that have relatively less debt; and
|
|
•
|
limit our ability to borrow additional funds or to dispose of assets to raise funds, if needed, for working capital, capital expenditures, acquisitions, research and development and other purposes.
|
15
We may also incur substantial additional indebtedness in the future. If we incur additional debt, the risks related to our indebtedness may intensify.
We require liquidity to service the Company's debt and fund operations, capital expenditures, research and development efforts, acquisitions and other corporate expenses.
Our ability to fund operations, capital expenditures, research and development efforts, acquisitions and other corporate expenses, including repayment of our debt, depends on our ability to generate cash through future operating performance, which is subject to economic, financial, competitive, legislative, regulatory and other factors. Many of these factors are beyond our control. We cannot be certain that our businesses will generate sufficient cash or that future borrowings will be available to us in the amounts sufficient to fund all of our requirements, or at terms that are favorable. If we are unable to generate sufficient cash to fund all of our requirements, we may need to pursue one or more alternatives, such as to:
|
•
|
reduce or delay planned capital expenditures, research and development spending or acquisitions;
|
|
•
|
obtain additional financing or restructure or refinance all or a portion of our debt on or before maturity;
|
|
•
|
sell assets or businesses; and
|
|
•
|
sell additional equity.
|
Any reduction or delay in planned capital expenditures, research and development spending or acquisitions or sales of assets or businesses may materially and adversely affect our future revenue prospects. In addition, we cannot be certain that we will be able to raise additional equity capital, restructure or refinance any of our debt or obtain additional financing on commercially favorable or reasonable terms or at all.
Restrictions imposed by agreements governing our indebtedness limit our ability to operate our business, finance our future operations or capital needs or engage in other business activities. If we fail to comply with certain restrictions under these agreements, our debt could be accelerated and the Company may not have sufficient cash to pay the accelerated debt.
The agreements governing our indebtedness contain various covenants that limit, among other things, our ability, and the ability of certain of our subsidiaries, to:
|
•
|
incur certain liens;
|
|
•
|
enter into sale and leaseback transactions; and
|
|
•
|
consolidate, merge or sell all or substantially all of our assets or the assets of our guarantors.
|
As a result of these covenants, we are limited in the manner in which we can conduct our business, and may be unable to engage in favorable business activities or finance future operations or capital needs. Accordingly, these restrictions may limit our flexibility to operate our business. A failure to comply with the restrictions contained in these agreements, including maintaining the financial ratios required by our credit facilities, could lead to an event of default which could result in an acceleration of the indebtedness. We cannot assure you that our future operating results will be sufficient to enable us to comply with the covenants contained in the agreements governing our indebtedness or to remedy any such default. In addition, in the event that repayment of our debt is accelerated pursuant to the terms of these agreements, we may not have or be able to obtain sufficient funds to make such accelerated payments.
Our indebtedness exposes us to interest expense increases if interest rates increase.
We maintain a revolving line of credit with variable interest rates. As of
December 31, 2019
, we had approximately $
1.8
million, or
0.5%
, of our borrowings at variable interest rates exposing us to interest rate risk. If interest rates increase, our debt service obligations on the variable rate indebtedness would increase even though the amount borrowed would remain the same, and our net income would decrease.
16
We have unfunded and underfunded pension plan liabilities. We will require future operating cash flow to fund these liabilities. We have no assurance that we will generate sufficient cash to satisfy these obligations.
We maintain U.S. and non-U.S. defined benefit pension plans covering current and former employees who meet or met age and service requirements. Our net pension liability and cost is materially affected by the discount rate used to measure pension obligations, the longevity and actuarial profile of our workforce, the level of plan assets available to fund those obligations and the actual and expected long-term rate of return on plan assets. Significant changes in investment performance or a change in the portfolio mix of invested assets can result in corresponding increases and decreases in the valuation of plan assets or in a change in the expected rate of return on plan assets. In addition, any changes in the discount rate could result in a significant increase or decrease in the valuation of pension obligations, affecting the reported funded status of our pension plans, as well as the net periodic pension cost in the following years. Similarly, changes in the expected return on plan assets can result in significant changes in the net periodic pension cost in the following years.
The divestiture of our Darex business could adversely affect our results of operations.
In July 2017, we completed the sale of our Darex business to Henkel AG & Co. KGaA. Following the divestiture of our Darex business, we have become a smaller, less diversified company with a narrower business focus and lower operational scale, and we may be more vulnerable to changing market conditions, which could adversely affect our business and results of operations. Additionally, we are still engaged in post-acquisition matters with Henkel in certain regions, which could negatively affect our results of operations.
Our results of operations could be adversely affected by warranty claims and product liability.
We provide standard warranties that our products perform according to their specifications and do not have material defects. In particular, for a limited number of high value construction projects we warrant the performance of some products for periods of
5
to
25
years. Our products are generally sold to the commercial, residential and infrastructure construction markets, and they often constitute an integral part of our customers’ products. If our products do not meet specifications, are otherwise defective, or are used contrary to our instructions or in applications for which they are not designed, they may contribute to damage to our customers’ products, the end users of our customers’ products and buildings and other installations that contain our products. Although we take measures to avoid product defects and instruct our customers on the proper use of our products, if a substantial warranty claim or product liability lawsuit is brought against us, the cost of defending the claim or lawsuit could be significant and any adverse determination could have a material adverse effect on our results of operations. Even if we are successful in defending against a claim, the claim may divert management's and employees’ attention from our ongoing business activities and /or incurring significant costs, both of which may adversely affect our results of operations and ability to manage our ongoing business.
We manufacture and sell products into many global jurisdictions where our efforts to contractually limit our liability (e.g., by defining a maximum liability, disclaiming implied or other statutory forms of liability or by waiving certain types of damages, including consequential, indirect and non-proximately caused damages) may not be enforceable or may be found by a court to not apply in a particular situation.
We work with dangerous materials that can injure our employees, damage our facilities and disrupt our operations.
Some of our operations involve the handling of hazardous materials that may pose the risk of fire, explosion or the release of hazardous substances. Such events could result from operational failures, natural disasters or terrorist attacks, and might cause injury or loss of life to our employees and others, environmental contamination, and property damage. These events might cause a temporary shutdown of an affected plant or portion thereof, and we could be subject to penalties or claims as a result. A disruption of our operations caused by these or other events could have a material adverse effect on our results of operations.
17
We may be required to spend significant amounts of financial resources on environmental compliance.
As a manufacturer of specialty chemicals and specialty building materials, we are subject to stringent regulations under numerous U.S. federal, state, local and foreign environmental, health and safety laws and regulations relating to the generation, storage, handling, discharge, disposition and stewardship of hazardous wastes and other materials. We expend funds to comply with such laws and regulations and attempt to implement sustainable practices across our global operations. Legislative and regulatory uncertainties make it difficult for us to project future spending and we may be required to make substantial or unanticipated investments to remain in compliance.
Our business could be adversely affected if we are unable to retain or motivate key personnel or hire qualified personnel.
The market for highly-skilled workers and leaders in our industry is competitive. We believe that our future success depends in substantial part on our ability to recruit and retain talented and highly-skilled personnel for all areas of our organization. Doing so may be impacted by a number of factors, including fluctuations in economic and industry conditions, competitors’ hiring practices, and the effectiveness of our compensation programs. Our continued ability to compete effectively depends on our ability to retain and motivate our executives and other existing employees and attract new employees. If we do not succeed in retaining and motivating our existing key employees and attracting new key personnel, our results of operations could be negatively impacted.
Some of our employees are unionized, represented by works councils or employed subject to local laws that are less favorable to employers than the laws in the United States.
As of
December 31, 2019
, we had approximately
2,000
total employees, of which approximately
740
were employed in the United States. Of our total U.S. employees, approximately
50
are unionized. In addition, a large number of our employees are employed in countries in which employment laws provide greater bargaining or other rights to employees than the laws in the United States. Such employment rights require us to work collaboratively with the legal representatives of the employees to effect any changes to labor arrangements. For example, most of our employees in Europe are represented by works councils that have co-determination rights on any changes in conditions of employment, including salaries and benefits and staff changes, and may impede efforts to restructure our workforce. A strike, work stoppage or slowdown by our employees or significant dispute with our employees, whether or not related to these negotiations, could result in a significant disruption of our operations or higher ongoing labor costs.
Our business and financial condition could be adversely affected if we are unable to protect our material intellectual property or there is a loss in the actual or perceived value of our brands.
Our business and financial condition could be adversely affected if we are unable to protect our material patents, trademarks and other proprietary information. We have numerous valuable patents, trade secrets and know-how, domain names, trademarks and trade names, including certain marks that are significant to our business. We routinely seek to protect our patents, trademarks, and other confidential information and know-how by taking appropriate preventive and enforcement measures. Despite our efforts, unauthorized use or disclosure of our intellectual property could negatively impact our business and financial condition.
The reputation of our branded products depends on numerous factors, including the successful advertising and marketing of our brand names, consumer acceptance, continued trademark validity, the availability of similar products from our competitors, and our ability to maintain our products’ quality and technological advantages and claims of superior performance. A loss of a brand or the actual or perceived value of our brands could limit or reduce the demand for our products, and could negatively impact our business and financial condition.
18
We may be subject to infringement claims relative to third party intellectual property ("IP") rights that could adversely affect our business, despite our efforts to monitor the published patent and trademark applications of our competitors. Any claims that our products or processes infringe the IP rights of others, regardless of the merit or resolution of the claims, could cause us to incur significant costs in responding to, defending, and resolving the claims, and may divert the efforts and attention of our management and technical personnel from our business. If we are found to be infringing on the IP rights of others, we may be held liable for damages, and we may be required to change our processes, redesign our products, pay others to obtain a license under their IP rights, stop using the contested trademark or technology, or stop producing or selling the infringing product. On the other hand, even if we were to prevail in establishing non-infringement, invalidity, and/or non-enforceability of the IP rights being asserted against us, the existence of the lawsuit could prompt our customers to switch to products that are not the subject of the lawsuit.
We are subject to business continuity risks associated with centralization of certain functions.
We have centralized our manufacturing for certain Specialty Building Material products in single locations and certain administrative functions in designated centers around the world to improve efficiency and reduce costs. To the extent that these central locations are disrupted or disabled, manufacturing of certain SBM products or key business processes, such as invoicing, payments and general management operations, could be interrupted.
A failure of our information technology systems could adversely impact our business and operations.
We rely upon the capacity, reliability and security of our information technology (IT) infrastructure and our ability to expand and continually update this infrastructure in response to the changing needs of our business. Our IT systems are vulnerable to damages from computer viruses, malware or other malicious code, unauthorized access, cyber-attack, phishing attacks, ransomware, account takeovers, denial of service attacks, human error, disruption, loss or destruction of data, natural disasters, power outages and other similar disruptions. If we experience a problem with the functioning of an important IT system or a security breach of our IT systems, the resulting disruptions could have an adverse effect on our business. A material network breach in the security of our IT systems could include the theft of our intellectual property, trade secrets or customer information. To the extent that any disruptions or security breaches result in a loss or damage to our data it could cause significant damage to our reputation, affect our relationships with our customers, lead to claims against us and ultimately harm our business. In addition, we may be required to incur significant costs to protect against damage caused by these disruptions or security breaches in the future.
We are subject to data privacy regulations.
We and certain of our third-party vendors receive and store personal information in connection with our human resources operations and other aspects of our business. Regulations around data protection and data privacy in the U.S., Europe, including but not limited to the California Consumer Privacy Act (“CCPA”) and the General Data Protection Regulation (“GDPR”), and elsewhere in the world can be complex and interpretations of such regulations are evolving. Despite our internal controls and processes designed to protect sensitive information, there can be no assurance that such controls and processes will ensure we are fully compliant with all data protection and data privacy laws. Failure to adequately protect sensitive information and timely report any security incident may result in financial penalties that may be material to our financial results. In addition, our business may be materially impacted if a security incident causes significant damage to our relationships with our customers, employees, vendors or others.
19
If we are unable to realize expected benefits from our cost reduction and restructuring efforts, our results of operations may be adversely impacted
In order to operate more efficiently, reduce costs and improve profitability, we announce from time to time restructuring plans which include workforce reductions, global facility consolidations and other cost reduction initiatives. We announced restructuring plans in 2017, 2018 and in February and August of 2019 and may undertake further workforce reductions or restructuring actions in the future. These types of restructuring activities and initiatives are complex. If we do not successfully manage our current or future restructuring plans, we may not realize expected cost savings, operating efficiencies and profitability improvements and our operations could be adversely affected. Risks associated with these actions include workforce management issues, additional unexpected costs, unforeseen delays in the implementation of anticipated workforce reductions, adverse impact on employee morale and failure to meet operational targets due to the loss of employees. Any of such risks may impair our ability to achieve anticipated cost reductions or have a material adverse impact on our competitive position, results of operations, cash flows or financial condition.
Our effective income tax rate may fluctuate from quarter to quarter, which may affect our earnings and earnings per share.
Our quarterly effective income tax rate is influenced by our annual projected profitability in the various taxing jurisdictions in which we operate. Changes in the distribution of profits and losses among taxing jurisdictions may have a significant impact on our effective income tax rate, which in turn could have a material adverse effect on our results of operations. Factors that affect the effective income tax rate include, but are not limited to:
|
•
|
the requirement to exclude from our quarterly worldwide effective income tax calculations losses in jurisdictions in which no tax benefit can be recognized;
|
|
•
|
actual and projected full-year pretax income;
|
|
•
|
changes in tax laws in various taxing jurisdictions;
|
|
•
|
audits by taxing authorities;
|
|
•
|
the establishment of valuation allowances against deferred tax assets if it is determined that it is more likely than not that future tax benefits will not be realized.
|
These changes may cause fluctuations in our effective income tax rate and our results of operations which may affect our stock price.
Risks Relating to the Separation
If the distribution and certain related transactions fail to qualify under applicable Internal Revenue Code provisions, Grace, the Company and Grace shareholders could be subject to significant tax liabilities and, in certain circumstances, the Company could be required to indemnify Grace for taxes and other related amounts, which may be material, pursuant to indemnification obligations under the Tax Sharing Agreement.
As a condition to the distribution that effected the Separation, Grace was required to receive an opinion of counsel, in form and substance satisfactory to Grace in its sole discretion, regarding the U.S. federal income tax treatment of the distribution and certain related transactions. The opinion of counsel was based upon and relied on, among other things, certain facts and assumptions, as well as certain representations, statements and undertakings of Grace and us, including those relating to our and Grace's past and future conduct. If any of these representations, statements or undertakings were, or become, inaccurate or incomplete, or if Grace or GCP breach any of its covenants in the Separation documents, such as the Tax Sharing Agreement, the opinion of counsel may be invalid and the conclusions reached therein could be jeopardized.
Notwithstanding the opinion of counsel, the Internal Revenue Service (the “IRS”) could determine that the distribution and certain related transactions failed to qualify under applicable Internal Revenue Code provisions if it determines that any of the representations, assumptions or undertakings upon which the opinion of counsel were based were false or have been violated, or if it disagrees with the conclusions in the opinion of counsel. The opinion of counsel is not binding on the IRS and there can be no assurance that the IRS will not assert a contrary position.
20
If the distribution is determined to fail to qualify under applicable Internal Revenue Code provisions, then, in general, Grace may recognize taxable gain as if it had sold our common stock in a taxable sale for its fair market value (unless Grace and GCP jointly make an election under Section 336(e) of the Internal Revenue Code (the “Code”) with respect to the distribution, in which case, in general, we would (i) recognize taxable gain as if we had sold all of our assets in a taxable sale in exchange for an amount equal to the fair market value of our common stock and the assumption of all of our liabilities and (ii) obtain a related step up in the basis of our assets), and Grace shareholders at the time of the distribution who received shares of our common stock in the distribution would be subject to tax as if they had received a taxable distribution equal to the fair market value of such shares.
Under the Tax Sharing Agreement entered into between Grace and GCP, we may be required to indemnify Grace against any additional taxes and related amounts resulting from (1) an acquisition under certain circumstances of all or a portion of our equity securities or assets, whether by merger or otherwise (and regardless of whether we participated in or otherwise facilitated the acquisition), (2) other actions that we may take or fail to, or (3) any of our representations or undertakings made in connection with the Separation and the distribution being incorrect or violated. Any such indemnity obligations could be material. In addition, Grace, GCP and our respective subsidiaries may incur certain tax costs in connection with the Separation, including non-U.S. tax costs resulting from Separations in non-U.S. jurisdictions, which may be material.
In connection with the Separation, Grace agreed to indemnify the Company for certain liabilities and we have agreed to indemnify Grace for certain liabilities. If the Company is required to act on these indemnities to Grace, we may need to divert cash to meet those obligations and our financial results could be negatively impacted. The Grace indemnity may not be sufficient to insure the Company against the full amount of liabilities for which it may be allocated responsibility, and Grace may not be able to satisfy its indemnification obligations in the future.
Pursuant to the Separation and Distribution Agreement and the Tax Sharing Agreement, Grace agreed to indemnify us for certain liabilities, and we agreed to indemnify Grace for certain liabilities, and we agreed to indemnify Grace in each case for uncapped amounts, as discussed further in Note 16, "Related Party Transactions and Transactions with Grace,” to the Consolidated Financial Statements included under Item 8, "Financial Statements and Supplementary Data" of this Form 10‑K. Indemnities that we may be required to provide Grace are not subject to any cap, may be significant and could negatively impact our business, particularly indemnities relating to our actions that could impact the U.S. federal income tax treatment of the distribution and certain related transactions. Third parties could also seek to hold us responsible for any of the liabilities that Grace has agreed to retain. Further, the indemnity from Grace may not be sufficient to protect us against the full amount of such liabilities, and Grace may not be able to fully satisfy its indemnification obligations in the future. Moreover, even if we ultimately succeed in recovering from Grace any amounts for which we are held liable, we may be temporarily required to bear these losses ourselves. Each of these risks could negatively affect our business, results of operations and financial condition.
Certain of Grace’s insurance policies may not cover us for losses associated with occurrences prior to the Separation.
In connection with the Separation, we entered into agreements with Grace to address several matters associated with the Separation, including insurance coverage. Post-Separation, some of Grace’s insurance policies may not cover us for certain losses associated with occurrences prior to the Separation.
Risks Relating to Ownership of GCP Common Stock
Our share price may fluctuate significantly.
The market price of our common stock could fluctuate significantly due to a number of factors, many of which are beyond our control, including:
|
•
|
fluctuations in our quarterly or annual earnings results or those of other companies in our industry;
|
|
•
|
failures of our operating results to meet the estimates of security analysts or the expectations of shareholders or changes by security analysts in their estimates of our future earnings;
|
|
•
|
announcements made by us or our customers, suppliers or competitors;
|
|
•
|
changes in laws or regulations which adversely affect us or our industry;
|
21
|
•
|
changes in accounting standards, policies, guidance, interpretations or principles;
|
|
•
|
general economic, industry and stock market conditions;
|
|
•
|
future sales of company common stock by shareholders;
|
|
•
|
future issuances of our stock by us;
|
|
•
|
stockholder activism, which may disrupt operations, divert management and employee attention, cause uncertainty that could adversely affect our relationships with customers, suppliers and employees, and require us to incur significant fees and expenses; and
|
|
•
|
the other factors described in these “Risk Factors” and other parts of this Annual Report on this Form 10-K.
|
Provisions in the Company’s corporate documents, the Stockholder Rights Plan, the Tax Sharing Agreement and Delaware law could delay or prevent a change-in-control of the Company, even if that change may be considered beneficial by some Company shareholders.
The existence of some provisions in our certificate of incorporation, our bylaws, our stockholder rights plan and of Delaware law could discourage, delay or prevent a change in control of the Company that a shareholder may consider favorable. These provisions include:
|
•
|
authorization of a large number of shares of common or preferred stock that are not yet issued, which may permit our Board of Directors to issue shares to persons friendly to current management, thereby protecting the continuity of the Company's management, or which could be used to dilute the stock ownership of persons seeking to obtain control of the Company;
|
|
•
|
prohibition on shareholders calling special meetings and taking action by written consent; and
|
|
•
|
advance notice requirements for nominations of candidates for election to the Company's Board of Directors and for proposing matters to be acted on by shareholders at the annual shareholder meetings; and
|
We adopted a stockholder rights plan on March 15, 2019. The rights plan is not intended to prevent a takeover, and we believe it will enable all GCP stockholders to realize the full potential value of their investment in the Company and protect the Company and its stockholders from efforts to obtain control of GCP that are inconsistent with the best interests of GCP and its stockholders. The rights plan may impose a significant penalty upon any person or group that attempts to acquire us (or a significant percentage of our outstanding common stock) without the approval of the Board of Directors. The rights under the plan will expire on March 14, 2020, subject to a possible earlier expiration to the extent provided in the Rights Agreement, unless extended.
In addition, the Company is subject to Section 203 of the Delaware General Corporation Law, which may have an anti-takeover effect with respect to transactions not approved in advance by the Company's Board of Directors, including discouraging takeover attempts that might result in a premium over the market price for shares of company common stock.
We believe these provisions protect our shareholders from coercive or otherwise unfair takeover tactics by requiring potential acquirers to negotiate with our Board of Directors and by providing the Board of Directors with more time to assess any acquisition proposal as compared to its long-term plan as a standalone company. However, these provisions apply even if a proposal may be considered beneficial by some shareholders and could delay or prevent an acquisition that our Board of Directors determines is not in the best interests of GCP and our shareholders.
In addition, an acquisition or further issuance of our stock could trigger the application of Section 355(e) of the Code. Under the Tax Sharing Agreement, the Company would be required to indemnify Grace for any resulting tax and related amounts, and this indemnity obligation might discourage, delay or prevent a change of control that you may consider favorable.
22
Our bylaws include a forum selection clause, which could limit our stockholders' ability to obtain a favorable judicial forum for disputes with us.
Our bylaws provide that, unless we consent in writing to the selection of an alternative forum, the sole and exclusive forum for (i) any derivative action or proceeding brought on our behalf, (ii) any action asserting a claim of breach or a fiduciary duty owed by any of our directors or officers or other employees to us or to our stockholders, (iii) any action asserting a claim against us or any of our directors or officers or other employees arising pursuant to any provision of the Delaware General Corporation Law or our certificate of incorporation or bylaws or (iv) any action asserting a claim against us or any of our directors or officers or other employees governed by the internal affairs doctrines, will be a state court located within the State of Delaware (or, if no state court located within the State of Delaware has jurisdiction, the United States District Court for the District of Delaware). This forum selection provision of our bylaws may limit the ability of our stockholders to obtain a favorable judicial forum for disputes with us. It is also possible that, notwithstanding the forum selection clause included in our bylaws, a court could rule that such a provision in inapplicable or unenforceable.
The Company may issue preferred stock with terms that could dilute the voting power or reduce the value of company common stock.
Our certificate of incorporation authorizes us to issue, without the approval of our shareholders, one or more classes or series of preferred stock having such designation, powers, preferences and relative, participating, optional and other special rights, including preferences over our common stock respecting dividends and distributions, as our Board of Directors generally may determine. The terms of one or more classes or series of preferred stock could dilute the voting power or reduce the value of company common stock. For example, we could grant holders of preferred stock the right to elect some number of directors in all events or on the happening of specified events or the right to veto specified transactions. Similarly, the repurchase or redemption rights or liquidation preferences that we could assign to holders of preferred stock could affect the residual value of the common stock.
The Company does not expect to pay any cash dividends for the foreseeable future.
We currently intend to retain future earnings to finance our business. As a result, GCP does not expect to pay any cash dividends for the foreseeable future. All decisions regarding the payment of dividends by GCP will be made by our Board of Directors from time to time in accordance with applicable law. There can be no assurance that we will have sufficient surplus under Delaware law to be able to pay any dividends at any time in the future. This may result from extraordinary cash expenses, actual expenses exceeding contemplated costs, funding of capital expenditures, increases in reserves or other currently unknown reasons. If we do not pay dividends, the price of our common stock must appreciate in order for your investment to increase in value. This appreciation may not occur. Further, you may have to sell some or all of your shares of our common stock in order to generate cash flow from your investment.
None.
We operate manufacturing plants and other facilities, including offices, warehouses, labs and other service facilities, throughout the world which we may lease or own. Some of these plants and facilities are shared between our operating segments. We consider our major operating properties to be in good operating condition and suitable for their current use. We believe that, after taking into consideration planned expansion and exits of unprofitable geographic markets, the productive capacity of our plants and other facilities is generally adequate for current operations.
23
The following tables summarize our primary manufacturing facilities and principal regional office locations by operating segment and region as of
December 31, 2019
:
|
Total Number of Facilities—Occupied
|
|||||||||
|
North America
|
Europe Middle East Africa (EMEA)
|
Asia Pacific
|
Latin America
|
Total
|
|||||
|
Specialty Construction Chemicals
|
9
|
6
|
13
|
7
|
35
|
||||
|
Specialty Building Materials
|
5
|
3
|
2
|
—
|
10
|
||||
|
Shared Facilities
|
3
|
1
|
4
|
1
|
9
|
||||
|
17
|
10
|
19
|
8
|
54
|
|||||
|
Number of Facilities—Leased
|
|||||||||
|
North America
|
Europe Middle East Africa (EMEA)
|
Asia Pacific
|
Latin America
|
Total
|
|||||
|
Specialty Construction Chemicals
|
3
|
2
|
10
|
4
|
19
|
||||
|
Specialty Building Materials
|
1
|
3
|
1
|
—
|
5
|
||||
|
Shared Facilities
|
—
|
1
|
4
|
1
|
6
|
||||
|
4
|
6
|
15
|
5
|
30
|
|||||
|
Number of Facilities—Owned
|
|||||||||
|
North America
|
Europe Middle East Africa (EMEA)
|
Asia Pacific
|
Latin America
|
Total
|
|||||
|
Specialty Construction Chemicals
|
6
|
4
|
3
|
3
|
16
|
||||
|
Specialty Building Materials
|
4
|
—
|
1
|
—
|
5
|
||||
|
Shared Facilities
|
3
|
—
|
—
|
—
|
3
|
||||
|
13
|
4
|
4
|
3
|
24
|
|||||
Our global corporate headquarters is located in Cambridge, Massachusetts. Our EMEA principal regional office is located in Slough, United Kingdom, our Asia Pacific principal regional offices are located in Shanghai, China and Toh Guan, Singapore and our Latin America principal regional office is located in Sorocaba, Brazil. We own our principal manufacturing facilities located in Chicago, Illinois; Ezhou, China; and Mount Pleasant, Tennessee. We maintain other facilities which we either own, lease or hold under land lease arrangements. We operate numerous smaller facilities around the world. SCC requires a greater number of facilities than SBM to service its customers since many SCC products are water-based and delivered to numerous distributors, concrete production locations, cement production locations and job sites. Please refer to Note 5, "Properties and Equipment" and Note 6, "Lessee Arrangements", to our Consolidated Financial Statements included under Item 8, "Financial Statements and Supplementary Data" of this Form 10
‑
K for further information on our owned and leased facilities.
In connection with our credit agreement, we have executed security agreements with respect to certain of our larger facilities located in the United States. As of December 31, 2019, mortgages or deeds of trust were in effect with respect to our facilities in Mount Pleasant, Tennessee and Chicago, Illinois. Please refer to Note 8, "Debt and Other Borrowings,” to our Consolidated Financial Statements included under Item 8, "Financial Statements and Supplementary Data" of this Form 10
‑
K for further information on our debt arrangements.
Information with respect to this item may be found in Note 12, "Commitments and Contingencies," to the Consolidated Financial Statements included under Item 8, "Financial Statements and Supplementary Data" of this Form 10‑K, which is incorporated herein by reference.
Not applicable.
24
EXECUTIVE OFFICERS OF THE REGISTRANT
Our executive officers as of February 1, 2020 are listed in the following table. Each executive officer was elected by our Board of Directors to serve until their respective successor is duly appointed or until their earlier resignation, removal or death.
|
Name
|
Age
|
Position
|
||
|
R. S. Dearth
|
56
|
President and Chief Executive Officer
|
||
|
C. A. Merrill
|
56
|
Vice President and Interim Chief Financial Officer
|
||
|
J. E. Thompson
|
59
|
Vice President, General Counsel and Secretary
|
||
|
K. R. Holland
|
58
|
Vice President and Chief Human Resources Officer
|
||
|
N. B. Srinivasan
|
47
|
Executive Vice President, Global Head of Specialty Building Materials
|
||
|
B. Van Lent
|
57
|
Executive Vice President, Global Head of Specialty Construction Chemicals
|
||
Randall S. Dearth
has served as GCP’s President and Chief Executive Officer since August 1, 2019. Prior to that, he served as GCP’s President and Chief Operating Officer since September 2018. Prior to joining GCP, Mr. Dearth served as President, Chief Executive Officer and Chairman of the Board of Calgon Carbon Corporation, a NYSE-listed company that manufactures and markets products that remove contaminants from liquids and gases, from May 2014 to July 2018, and as President and Chief Executive Officer of Calgon Carbon from August 2012 to May 2014. From 2004 through July 2012, Mr. Dearth served as President and Chief Executive Officer of LANXESS Corporation (North America), a specialty chemicals company. Prior thereto, Mr. Dearth was President and Chief Executive Officer of Bayer Chemicals Corporation (North America) and held a number of global marketing roles with Bayer, both in the United States and Germany. Mr. Dearth has served on the Board of Directors of Stepan Company, a global chemical solutions company, since April 2012.
Craig A. Merrill
has served as GCP’s Interim Chief Financial Officer since October 15, 2019 and continues in the role as Vice President, Finance, Analytics and Strategy. Prior to becoming GCP’s Vice President, Finance, Analytics and Strategy, Mr. Merrill served as GCP’s Vice President, Global Marketing and Vice President & General Manager, Global Cement and Emerging Markets following the Company’s separation from W.R. Grace & Co. in 2016. At W.R. Grace & Co., he served as Vice President & General Manager in the Specialty Construction Chemicals division prior to the commencement of his service with GCP. Mr. Merrill began his career at W.R. Grace & Co. in 1990.
James E. Thompson
has served as GCP’s Vice President, General Counsel and Secretary since April 2019. Mr. Thompson leads GCP’s global legal team and oversees all aspects of legal strategy, corporate governance, compliance, commercial transactions, intellectual property, and government relations. Prior to joining GCP, Mr. Thompson served as Avon Products’ Senior Vice President and General Counsel from August 2017 until April 2019. Before joining Avon, he spent nine years at Chiquita Brands International, Inc. as an Executive Vice President, General Counsel and Secretary from 2006 to 2015. Prior to that, Mr. Thompson was Group Vice President and General Counsel to McLeod USA from 2003 to 2006. Mr. Thompson also served as Director, International Legal to Alticor Inc., the parent company of Amway Corporation. Mr. Thompson began his career as an attorney at Jones Day in Washington DC and Brussels, Belgium where he gained significant experience working on domestic and international antitrust and corporate law matters.
Kevin R. Holland
joined GCP in January of 2017 as Vice President and Chief Human Resources Officer. Prior to joining GCP, he served during 2016 as a Senior Vice President and Chief Human Resources Officer at BrightStar Corporation, a $12 billion mobile technology services company. From 2005 to 2016, Mr. Holland was employed at Chiquita Brands International, where he served in management roles of increasing responsibility culminating in his position as Executive Vice President and Chief Administrative Officer. Previous positions include senior human resource roles with global businesses, including Molson Coors Brewing Company (2003 to 2005) and FedEx Kinko's (1999 to 2003).
25
Naren B. Srinivasan
has served as GCP’s Executive Vice President, Global Head of Specialty Building Materials since July 2019. He leads GCP's Specialty Building Materials segment, as well as the Company’s Global Strategy, Innovation and Corporate Development activities. Between October 2017 and July 2019, Mr. Srinivasan served as GCP’s Vice President, Chief Strategy, Marketing and Business Development Officer. Between February 2016, the date of our separation from Grace, and October 2017, he served as GCP’s Vice President, Strategy and Corporate Development. Mr. Srinivasan joined Grace in October 2015 as Vice President, Strategy and Corporate Development, GCP. Prior to joining GCP, Mr. Srinivasan led the strategy and corporate development functions at The Hertz Corporation from July 2011 to September 2015 and MeadWestvaco Corporation from 2004 to 2011. Prior to that, he worked in mergers and acquisitions and private equity at Rothschild & Co, Evercore Partners, and Dillon, Read & Co.
Boudewijn Van Lent
joined GCP as Executive Vice President, Global Head of Specialty Construction Chemicals in March 2019. He leads GCP's Specialty Construction Chemicals segment. Prior to joining GCP, between September 2013 and February 2019, Mr. Van Lent served as Chief Executive Officer at Bilfinger Industrial Services Inc., an industrial services provider. He also held the role of President of North and South America at Rhein Chemie Corporation, a global manufacturer of specialty chemicals, as well as leadership positions at Celerant Consulting, Lanxess Corporation and Bayer.
Following are the executive officers that served at GCP during the year ended December 31, 2019 until their resignation or retirement.
Gregory E. Poling
served as GCP’s Chief Executive Officer since its separation from W.R. Grace & Co. (“Grace”) in February of 2016 until August 1, 2019. From August 1, 2019 to December 31, 2019, Mr. Poling served as Chairman of GCP’s Board of Directors. Mr. Poling had been employed with Grace since 1977. He held positions in sales, marketing, business development and general management across all of Grace's operating segments. From 1977 to 1999, Mr. Poling held positions of increasing responsibility in Grace's construction products business. In 2005, Mr. Poling became President of Grace Davison (one of Grace's two operating segments at the time which included Darex) and a Vice President of W. R. Grace & Co. On November 3, 2011, Mr. Poling was elected President and Chief Operating Officer of W. R. Grace & Co.
Dean P. Freeman
served as GCP’s Vice President and Chief Financial Officer since its separation from Grace on February 3, 2016 until October 15, 2019. Mr. Freeman joined Grace in September 2015 as Vice President, GCP Finance. He previously served as Interim Chief Executive Officer and President, from January to May 2014, and as Executive Vice President and Chief Financial Officer, from 2012 to October 2014, at Watts Water Technologies, a global provider of products and solutions for the residential, commercial and industrial markets. Mr. Freeman served as Senior Vice President of Finance and Treasurer of Flowserve Corporation from 2009 to 2011 and as Vice President, Finance and Chief Financial Officer of the Flowserve Pump Division from 2006 to 2009. Prior to Flowserve, Mr. Freeman served as Chief Financial Officer, Europe for The Stanley Works Corporation and held financial and management roles of increasing responsibility with United Technologies Corporation and SPX Corporation.
John W. Kapples
served as GCP’s Vice President, General Counsel and Secretary since its separation from Grace in February 2016 until March 15, 2019. Mr. Kapples joined Grace in December 2015 as Vice President and General Counsel, GCP. He previously served as Vice President at Medtronic plc from February 2015 to August 2015, where he assisted with legal transition and integration matters related to Medtronic's acquisition of Covidien plc. From 2006 to 2015, Mr. Kapples served as Vice President and Secretary at Covidien, a medical device company. Prior to Covidien, Mr. Kapples served in management and legal roles of increasing responsibility at Raytheon Company.
26
Our common stock is listed on the New York Stock Exchange ("NYSE") under the ticker symbol "GCP." There were
3,867
stockholders of record of our common stock as of
December 31, 2019
.
Recent Sales of Unregistered Equity Securities
None.
Issuer's Purchases of Equity Securities
None
27
STOCK PERFORMANCE GRAPH AND CUMULATIVE TOTAL RETURN
The graph below shows the cumulative total stockholder return, assuming the investment of
$100
on February 4, 2016 (and the reinvestment of dividends thereafter), in each of GCP common stock, the Standard & Poor's (S&P) 1000 Index and the S&P 1500 Specialty Chemicals Index. The comparisons in the graph below are based on historical data and are not indicative of, or intended to forecast, future performance of our common stock.
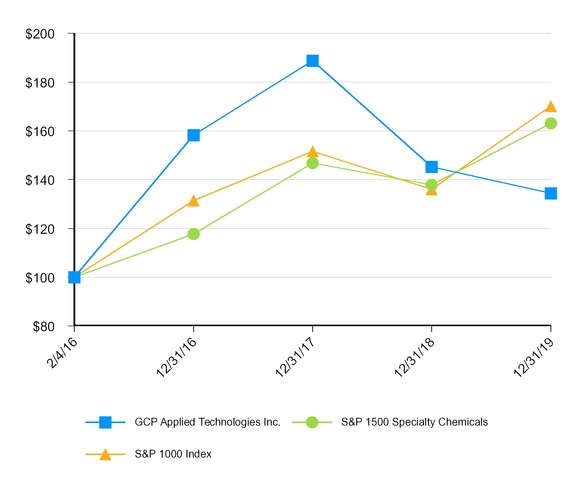
|
02/04/16
|
12/31/16
|
12/31/17
|
12/31/18
|
12/31/19
|
|||||||||||||||
|
GCP Applied Technologies Inc.
|
$
|
100
|
|
$
|
158
|
|
$
|
189
|
|
$
|
145
|
|
$
|
134
|
|
||||
|
S&P 1500 Specialty Chemicals Index
|
100
|
|
118
|
|
147
|
|
138
|
|
163
|
|
|||||||||
|
S&P 1000 Index
|
100
|
|
131
|
|
152
|
|
136
|
|
170
|
|
|||||||||
The following selected consolidated financial data should be read in conjunction with the information contained in Item 7, “Management’s Discussion and Analysis of Financial Condition and Results of Operations,” and the Consolidated Financial Statements and notes thereto included in Item 8, "Financial Statements and Supplementary Data", of this Annual Report on Form 10-K, which are incorporated herein by reference, in order to understand the factors that may affect the comparability of the information presented below.
28
On July 3, 2017 (the "Closing Date"), GCP completed the sale of its Darex business to Henkel for $1.06 billion in cash. As discussed further in Note 1, "Basis of Presentation and Summary of Significant Accounting and Financial Reporting Policies," to the Consolidated Financial Statements included under Item 8, "Financial Statements and Supplementary Data" of this Form 10‑K, the results of operations for Darex have been excluded from continuing operations and segment results for all periods presented. As discussed further in Note 21, "Discontinued Operations," to the Consolidated Financial Statements, the assets and liabilities of the Darex business in certain delayed close countries are categorized as “Assets held for sale” or “Liabilities held for sale” in the Consolidated Balance Sheets as of December 31, 2019 and 2018. Additionally, Darex has been reclassified and reflected as "discontinued operations" in the Consolidated Statements of Operations and Consolidated Statements of Cash Flows for all periods presented.
The statement of operations data for each of the years ended
December 31, 2019
,
2018
and
2017
, and the balance sheet data as of
December 31, 2019
and
2018
set forth below are derived from our audited Consolidated Financial Statements included under Item 8, "Financial Statements and Supplementary Data" of this Annual Report on Form 10-K. We derived the statement of operations data for the years ended December 31, 2016 and
2015
set forth below from our audited Consolidated Financial Statements included under Item 8, "Financial Statements and Supplementary Data" in our December 31,
2017
Annual Report on Form 10-K. We derived the balance sheet data as of December 31, 2016 and 2015 set forth below from our audited Consolidated Financial Statements included under Item 8, "Financial Statements and Supplementary Data" in our December 31, 2016 Annual Report on Form 10-K.
Prior to the Separation, our financial statements included expense allocations for certain functions provided by Grace as well as other Grace employees not solely dedicated to GCP, including, but not limited to, general corporate expenses related to finance, legal, information technology, human resources, communications, ethics and compliance, shared services, employee benefits and incentives and stock-based compensation. These expenses were allocated to GCP on the basis of direct usage when identifiable, with the remainder allocated on the basis of revenue, employee headcount or other measures. Management of the Company considers these allocations to be a reasonable reflection of the utilization of services by, or the benefits provided to, the Company. The allocations may not, however, reflect the expense the Company would have incurred as a standalone company for the periods presented prior to February 3, 2016. Actual costs that may have been incurred if the Company had been a standalone company would depend on a number of factors, including the chosen organizational structure, the functions which were outsourced or performed by employees and strategic decisions made in certain areas, such as information technology and infrastructure.
The selected consolidated financial data in this section are not intended to replace the Consolidated Financial Statements and are qualified in their entirety by the Consolidated Financial Statements and related notes included elsewhere in this Annual Report on Form 10-K.
29
|
Year Ended December 31,
|
||||||||||||||||||||
|
(In millions, except per share amounts)
|
2019
|
2018
|
2017
|
2016
|
2015
|
|||||||||||||||
|
|
||||||||||||||||||||
|
Net sales
|
$
|
1,013.5
|
|
$
|
1,125.4
|
|
$
|
1,084.4
|
|
$
|
1,046.5
|
|
$
|
1,092.4
|
|
|||||
|
Income (loss) from continuing operations
(1)
|
41.0
|
|
(15.8
|
)
|
(110.4
|
)
|
28.6
|
|
0.6
|
|
||||||||||
|
Income from discontinued operations, net of income taxes
(2)
|
5.7
|
|
31.3
|
|
664.3
|
|
45.2
|
|
40.1
|
|
||||||||||
|
Net income
(1)(2)
|
46.7
|
|
15.5
|
|
553.9
|
|
73.8
|
|
40.7
|
|
||||||||||
|
Net income attributable to noncontrolling interests
|
(0.4
|
)
|
(0.3
|
)
|
(0.5
|
)
|
(1.0
|
)
|
(0.6
|
)
|
||||||||||
|
Net income attributable to GCP shareholders
(1)(2)
|
46.3
|
|
15.2
|
|
553.4
|
|
72.8
|
|
40.1
|
|
||||||||||
|
Income (loss) from continuing operations attributable to GCP shareholders
(1)
|
40.6
|
|
(16.1
|
)
|
(110.9
|
)
|
27.6
|
|
—
|
|
||||||||||
|
|
||||||||||||||||||||
|
Basic earnings (loss) per share
(3)
|
||||||||||||||||||||
|
Income (loss) from continuing operations attributable to GCP shareholders
|
$
|
0.56
|
|
$
|
(0.22
|
)
|
$
|
(1.55
|
)
|
$
|
0.39
|
|
$
|
—
|
|
|||||
|
Income from discontinued operations, net of income taxes
|
$
|
0.08
|
|
$
|
0.43
|
|
$
|
9.29
|
|
$
|
0.64
|
|
$
|
0.57
|
|
|||||
|
Net income attributable to GCP shareholders
(4)
|
$
|
0.64
|
|
$
|
0.21
|
|
$
|
7.74
|
|
$
|
1.03
|
|
$
|
0.57
|
|
|||||
|
Weighted average number of basic shares
|
72.6
|
|
72.1
|
|
71.5
|
|
70.8
|
|
70.5
|
|
||||||||||
|
Diluted earnings (loss) per share
(3)(5)
|
||||||||||||||||||||
|
Income (loss) from continuing operations attributable to GCP shareholders
|
$
|
0.56
|
|
$
|
(0.22
|
)
|
$
|
(1.55
|
)
|
$
|
0.38
|
|
$
|
—
|
|
|||||
|
Income from discontinued operations, net of income taxes
|
$
|
0.08
|
|
$
|
0.43
|
|
$
|
9.29
|
|
$
|
0.63
|
|
$
|
0.57
|
|
|||||
|
Net income attributable to GCP shareholders
(4)
|
$
|
0.64
|
|
$
|
0.21
|
|
$
|
7.74
|
|
$
|
1.02
|
|
$
|
0.57
|
|
|||||
|
Weighted average number of diluted shares
|
72.9
|
|
72.1
|
|
71.5
|
|
71.7
|
|
70.5
|
|
||||||||||
|
Financial Position
|
||||||||||||||||||||
|
Total assets
|
$
|
1,302.1
|
|
$
|
1,281.9
|
|
$
|
1,703.0
|
|
$
|
1,089.8
|
|
$
|
833.1
|
|
|||||
|
Long-term debt
|
346.5
|
|
346.1
|
|
520.3
|
|
783.0
|
|
—
|
|
||||||||||
_____________________________________________________________________________
|
(1)
|
GCP recognized a loss on debt refinancing of
$59.8 million
during the year ended December 31, 2018 and incurred an $81.7 million charge associated with the 2017 Tax Act during the year ended December 31, 2017.
|
|
(2)
|
GCP recognized a net gain on the sale of Darex of approximately
$678.9 million
during the year ended December 31, 2017.
|
|
(3)
|
GCP's earnings per share amounts for 2015 were calculated using the shares that were distributed to Grace shareholders immediately following the Separation. For periods prior to February 3, 2016, it is assumed that there are no dilutive equity instruments as there were no GCP equity awards outstanding prior to the legal separation from Grace.
|
|
(4)
|
Amounts may not sum due to rounding.
|
|
(5)
|
Dilutive effect only applicable to periods where there is net income from continuing operations.
|
30
Management’s Discussion and Analysis of Financial Condition and Results of Operations, (the "MD&A"), describes the principal factors affecting the results of our operations, financial condition and liquidity, as well as our critical accounting policies and estimates that require significant judgment and thus have the most significant potential impact on our Consolidated Financial Statements. Our MD&A generally includes a discussion of results of operations, financial condition, liquidity and capital resources related to year-over-year comparisons between December 31, 2019 ("2019") and December 31, 2018 ("2018"), as well as December 31, 2018 and December 31, 2017 ("2017"). Discussions related to year-over-year comparisons between 2018 and 2017 are included in “Management’s Discussion and Analysis of Financial Condition and Results of Operations” in Part II, Item 7 of the Company’s Annual Report on Form 10-K for the year ended December 31, 2018 and incorporated herein by reference. Our MD&A is organized as follows:
|
•
|
Results of Operations
: This section provides an analysis of our financial results compared to the prior year.
|
|
•
|
Financial Condition, Liquidity and Capital Resources
: This section provides an analysis of our liquidity and changes in cash flows, as well as a discussion of available borrowings and contractual commitments.
|
|
•
|
Critical Accounting Policies and Estimates
. This section discusses accounting policies and estimates that require us to exercise significant judgments in their application. We believe these accounting policies and estimates are important to understanding the assumptions and judgments incorporated in our reported financial results.
|
The MD&A should be read in conjunction with our Consolidated Financial Statements and related notes in this Form 10-K. In addition to historical information, the MD&A contains forward-looking statements that involve risks and uncertainties. See “Information Related to Forward-Looking Statements” included above in this Form 10‑K and Item 1A, "Risk Factors" for a discussion of important factors that could cause our actual results to differ materially from our expectations. See "Analysis of Operations" for a discussion of our non-GAAP performance measures.
On July 3, 2017, we completed the sale of our Darex business to Henkel AG & Co. KGaA ("Henkel"). The results of operations of the Darex segment are presented as discontinued operations and, as such, have been excluded from continuing operations and segment results for all periods presented. Unless otherwise noted, the following discussion and analysis pertains only to our continuing operations.
RESULTS OF OPERATIONS
Business Description Summary
We are engaged in the production and sale of specialty construction chemicals and specialty building materials through two global operating segments:
|
•
|
Specialty Construction Chemicals.
Our Specialty Construction Chemicals ("SCC") operating segment provides products, services and technologies, such as in-transit monitoring and management systems, which reduce the cost and improve the performance and quality of cement, concrete, mortar, masonry, and other cementitious-based construction materials.
|
Specialty Building Materials.
Our Specialty Building Materials ("SBM") operating segment produces and sells sheet and liquid membrane systems and other products that protect both new and existing structures from water, air, and vapor penetration, as well as from fire damage. We also manufacture and sell specialized cementitious and chemical grouts used for soil consolidation and leak-sealing applications in addition to a moisture barrier system and installation tools for the flooring industry.
31
We operate our business on a global scale. Approximately
50%
of our sales were generated outside of the U.S. We conduct business in over
30
countries and in over
30
currencies. We manage our operating segments on a global basis to serve global markets. Currency fluctuations affect our reported results of operations, cash flows and financial position.
On February 27, 2019, we announced a comprehensive review of strategic alternatives with the goal of enhancing value for our shareholders. Over the course of this review process, we engaged with both strategic industry players and private equity investors. However, this process did not result in a transaction that would provide adequate value to our shareholders. Accordingly, we have determined that the best opportunity to enhance shareholder value is to pursue our standalone strategic and financial plan. We will continue to evaluate opportunities to drive value for GCP shareholders as our industry continues to evolve.
2019
Performance Summary
Following is a summary of our financial performance for
2019
compared with the prior year.
|
•
|
Net sales
decrease
d
9.9%
to
$1,013.5 million
.
|
|
•
|
Net income from continuing operations attributable to GCP shareholders was
$40.6 million
, or
$0.56
per diluted share, compared to a net loss of
$16.1 million
, or
$0.22
per diluted share, for the prior year. The change was primarily due to a loss on debt refinancing recognized during the prior-year and lower income taxes, partially offset by lower gross profit and a loss from pension mark-to-market adjustments compared to a gain during the prior-year.
|
|
•
|
Adjusted EPS was
$0.81
per diluted share compared to
$0.91
in the prior year.
|
|
•
|
Adjusted EBIT
decrease
d
14.4%
to
$101.8 million
.
|
|
•
|
Adjusted EBITDA
decrease
d
9.9%
to
$145.0 million
.
|
Analysis of Operations for
2019
,
2018
and
2017
We have set forth in the table below our key operating statistics with percentage changes for
2019
,
2018
and
2017
. Please refer to the Analysis of Operations (the "table") when reviewing our MD&A. In the table, we present financial information in accordance with U.S. GAAP, as well as certain non-GAAP financial measures, which we describe below in further detail. We believe that the non-GAAP financial information supplements our discussions about the performance of our businesses, improves year-to-year comparability, as well as provides insight to the information that our management uses to evaluate the performance of our businesses. Our management uses non-GAAP measures in financial and operational decision-making processes, for internal reporting, and as part of forecasting and budgeting processes since these measures provide additional transparency to our core operations.
In the table, we have provided reconciliations of these non-GAAP financial measures to the most directly comparable financial measures calculated and presented in accordance with U.S. GAAP. These non-GAAP financial measures should not be considered substitutes for financial measures calculated in accordance with U.S. GAAP, and the financial results that we calculate and present in the table in accordance with U.S. GAAP, as well as the corresponding reconciliations from those results, should be carefully evaluated as part of our MD&A.
32
The following are the non-GAAP financial measures presented in the table:
|
•
|
Adjusted EBIT (a non-GAAP financial measure)-
is defined as net income (loss) from continuing operations attributable to GCP shareholders adjusted for: (i) gains and losses on sales of businesses, product lines and certain other investments; (ii) currency and other financial losses in Venezuela; (iii) costs related to legacy product, environmental and other claims; (iv) restructuring and repositioning expenses, and asset impairments; (v) defined benefit plan costs other than service and interest costs, expected returns on plan assets and amortization of prior service costs/credits; (vi) third-party and other acquisition-related costs; (vii) other financing costs associated with the modification or extinguishment of debt; (viii) amortization of acquired inventory fair value adjustments; (ix) tax indemnification adjustments; (x) interest income, interest expense and related financing costs; (xi) income taxes; (xii) shareholder activism and other related costs; and (xiii) certain other items that are not representative of underlying trends. Adjusted EBIT Margin is defined as Adjusted EBIT divided by net sales. We use Adjusted EBIT to assess and measure our operating performance and determine performance-based employee compensation. We use Adjusted EBIT as a performance measure because it provides improved year-over-year comparability for decision-making and compensation purposes and allows management to measure the ongoing earnings results of our strategic and operating decisions.
|
|
•
|
Adjusted EBITDA (a non-GAAP financial measure)
- is defined as Adjusted EBIT adjusted for depreciation and amortization. Adjusted EBITDA Margin is defined as Adjusted EBITDA divided by net sales. We use Adjusted EBITDA as a performance measure in making significant business decisions.
|
|
•
|
Adjusted Earnings Per Share (a non-GAAP financial measure)-
is defined as earnings per share ("EPS") from continuing operations on a diluted basis adjusted for: (i) gains and losses on sales of businesses, product lines and certain other investments; (ii) currency and other financial losses in Venezuela; (iii) costs related to legacy product, environmental and other claims; (iv) restructuring and repositioning expenses and asset impairments; (v) defined benefit plan costs other than service and interest costs, expected returns on plan assets and amortization of prior service costs/credits; (vi) third-party and other acquisition-related costs; (vii) other financing costs associated with the modification or extinguishment of debt; (viii) amortization of acquired inventory fair value adjustments; (ix) tax indemnification adjustments; (x) shareholder activism and other related costs; (xi) certain discrete tax items; and (xii) certain other items that are not representative of underlying trends. We use Adjusted EPS as a performance measure to review our diluted earnings per share results on a consistent basis and in determining certain performance-based employee compensation.
|
|
•
|
Adjusted Gross Profit (a non-GAAP financial measure)
- is defined as gross profit adjusted for: (i) corporate and pension-related costs included in cost of goods sold; (ii) loss in Venezuela included in cost of goods sold; and (iii) amortization of acquired inventory fair value adjustment. Adjusted Gross Margin means Adjusted Gross Profit divided by net sales. We use this performance measure to understand trends and changes and to make business decisions regarding core operations.
|
|
•
|
Adjusted EBIT Return On Invested Capital (a non-GAAP financial measure)
- is defined as Adjusted EBIT (on a trailing four quarters basis) divided by stockholders' equity adjusted for: (i) cash and cash equivalents, (ii) debt, (iii) income tax assets and liabilities, (iv) defined benefit pension plan assets and liabilities, and (iv) certain other assets and liabilities. We manage our operations with the objective of maximizing sales, earnings and cash flow over time which requires that we successfully balance our growth, profitability and working capital and other investments to support sustainable, long-term financial performance. We use Adjusted EBIT Return On Invested Capital as a performance measure in evaluating operating results, making operating, investment and capital allocation decisions, and balancing the growth and profitability of our operations.
|
Adjusted EBIT, Adjusted EBIT Margin, Adjusted EBITDA, Adjusted EBITDA Margin, Adjusted EPS, Adjusted EBIT Return On Invested Capital, Adjusted Gross Profit and Adjusted Gross Margin do not purport to represent income measures as defined in accordance with U.S. GAAP. These measures are provided to investors and others to improve the year-to-year and peer-to-peer comparability of our financial results and to ensure that investors understand the information we use to evaluate the performance of our businesses.
33
Adjusted EBIT has material limitations as an operating performance measure because it excludes costs related to income and expenses from restructuring and repositioning activities which historically has been a material component of our net income (loss) from continuing operations attributable to GCP shareholders. Adjusted EBITDA also has material limitations as an operating performance measure because it excludes the impact of depreciation and amortization expense. Our business is substantially dependent on the successful deployment of capital, and depreciation and amortization expense is a necessary element of our costs. We compensate for the limitations of these measurements by using these indicators together with net income (loss) measured in accordance with GAAP to present a complete analysis of our results of operations. Adjusted EBIT and Adjusted EBITDA should be evaluated together with net income (loss) from continuing operations attributable to GCP shareholders measured in accordance with GAAP for a complete understanding of our results of operations.
34
We have provided in the following tables a reconciliation of these non-GAAP measures to the most directly comparable financial measures calculated and presented in accordance with U.S. GAAP.
|
Analysis of Operations
(In millions, except per share amounts)
|
Year Ended December 31,
|
% Change 2019 vs 2018
|
% Change 2018 vs 2017
|
||||||||||||||
|
2019
|
2018
|
2017
|
|||||||||||||||
|
Net sales:
|
|
|
|
||||||||||||||
|
Specialty Construction Chemicals
|
$
|
579.1
|
|
$
|
643.5
|
|
$
|
615.7
|
|
(10.0
|
)%
|
4.5
|
%
|
||||
|
Specialty Building Materials
|
434.4
|
|
481.9
|
|
468.7
|
|
(9.9
|
)%
|
2.8
|
%
|
|||||||
|
Total GCP net sales
|
$
|
1,013.5
|
|
$
|
1,125.4
|
|
$
|
1,084.4
|
|
(9.9
|
)%
|
3.8
|
%
|
||||
|
Net sales by region:
|
|
||||||||||||||||
|
North America
|
$
|
537.4
|
|
$
|
571.0
|
|
$
|
540.7
|
|
(5.9
|
)%
|
5.6
|
%
|
||||
|
Europe Middle East Africa (EMEA)
|
193.5
|
|
240.7
|
|
244.5
|
|
(19.6
|
)%
|
(1.6
|
)%
|
|||||||
|
Asia Pacific
|
222.5
|
|
245.6
|
|
229.2
|
|
(9.4
|
)%
|
7.2
|
%
|
|||||||
|
Latin America
|
60.1
|
|
68.1
|
|
70.0
|
|
(11.7
|
)%
|
(2.7
|
)%
|
|||||||
|
Total net sales by region
|
$
|
1,013.5
|
|
$
|
1,125.4
|
|
$
|
1,084.4
|
|
(9.9
|
)%
|
3.8
|
%
|
||||
|
Adjusted EBIT(A):
|
|
|
|||||||||||||||
|
Specialty Construction Chemicals segment operating income
|
$
|
56.6
|
|
$
|
40.2
|
|
$
|
63.4
|
|
40.8
|
%
|
(36.6
|
)%
|
||||
|
Specialty Building Materials segment operating income
|
85.8
|
|
113.6
|
|
109.4
|
|
(24.5
|
)%
|
3.8
|
%
|
|||||||
|
Corporate costs(B)
|
(32.8
|
)
|
(27.3
|
)
|
(36.4
|
)
|
20.1
|
%
|
(25.0
|
)%
|
|||||||
|
Certain pension costs(C)
|
(7.8
|
)
|
(7.6
|
)
|
(9.0
|
)
|
2.6
|
%
|
(15.6
|
)%
|
|||||||
|
Adjusted EBIT (non-GAAP)
|
$
|
101.8
|
|
$
|
118.9
|
|
$
|
127.4
|
|
(14.4
|
)%
|
(6.7
|
)%
|
||||
|
Loss on sale of product line
|
—
|
|
—
|
|
(2.1
|
)
|
—
|
%
|
100.0
|
%
|
|||||||
|
Currency and other financial losses in Venezuela
|
—
|
|
—
|
|
(39.1
|
)
|
—
|
%
|
100.0
|
%
|
|||||||
|
Currency losses in Argentina
|
—
|
|
(1.1
|
)
|
—
|
|
100.0
|
%
|
(100.0
|
)%
|
|||||||
|
Litigation settlement
|
—
|
|
—
|
|
(4.0
|
)
|
—
|
%
|
100.0
|
%
|
|||||||
|
Legacy product, environmental and other claims
|
(0.1
|
)
|
—
|
|
(0.6
|
)
|
(100.0
|
)%
|
100.0
|
%
|
|||||||
|
Repositioning expenses
|
(20.4
|
)
|
(9.6
|
)
|
(9.8
|
)
|
NM
|
|
(2.0
|
)%
|
|||||||
|
Restructuring expenses and asset impairments
|
(9.9
|
)
|
(14.8
|
)
|
(13.5
|
)
|
(33.1
|
)%
|
9.6
|
%
|
|||||||
|
Pension MTM adjustment and other related costs, net
|
(13.3
|
)
|
8.7
|
|
(14.1
|
)
|
NM
|
|
NM
|
|
|||||||
|
Gain on termination and curtailment of pension and other postretirement plans
|
1.2
|
|
0.2
|
|
6.6
|
|
NM
|
|
(97.0
|
)%
|
|||||||
|
Third-party and other acquisition-related costs
|
(0.1
|
)
|
(2.5
|
)
|
(6.8
|
)
|
(96.0
|
)%
|
(63.2
|
)%
|
|||||||
|
Other financing costs
|
—
|
|
—
|
|
(6.0
|
)
|
—
|
%
|
100.0
|
%
|
|||||||
|
Amortization of acquired inventory fair value adjustment
|
—
|
|
(0.2
|
)
|
(2.9
|
)
|
100.0
|
%
|
(93.1
|
)%
|
|||||||
|
Tax indemnification adjustments
|
(0.5
|
)
|
(0.5
|
)
|
(2.8
|
)
|
—
|
%
|
(82.1
|
)%
|
|||||||
|
Gain on Brazil tax recoveries, net (D)
|
0.6
|
|
—
|
|
—
|
|
100.0
|
%
|
—
|
%
|
|||||||
|
Shareholder activism and other related costs (E)
|
(5.3
|
)
|
—
|
|
—
|
|
(100.0
|
)%
|
—
|
%
|
|||||||
|
Interest expense, net
|
(20.0
|
)
|
(88.9
|
)
|
(61.1
|
)
|
(77.5
|
)%
|
45.5
|
%
|
|||||||
|
Income tax benefit (expense)
|
6.6
|
|
(26.3
|
)
|
(82.1
|
)
|
NM
|
|
(68.0
|
)%
|
|||||||
|
Net income (loss) from continuing operations attributable to GCP shareholders (GAAP)
|
$
|
40.6
|
|
$
|
(16.1
|
)
|
$
|
(110.9
|
)
|
NM
|
|
(85.5
|
)%
|
||||
|
Diluted EPS from continuing operations (GAAP)
|
$
|
0.56
|
|
$
|
(0.22
|
)
|
$
|
(1.55
|
)
|
NM
|
|
(85.8
|
)%
|
||||
|
Adjusted EPS (non-GAAP)
|
$
|
0.81
|
|
$
|
0.91
|
|
$
|
0.64
|
|
(11.0
|
)%
|
42.2
|
%
|
||||
35
|
Year Ended December 31,
|
% Change 2019 vs 2018
|
% Change 2018 vs 2017
|
|||||||||||||||
|
Analysis of Operations
(In millions) |
2019
|
2018
|
2017
|
||||||||||||||
|
Gross Profit:
|
|
|
|
|
|
|
|||||||||||
|
Specialty Construction Chemicals
|
$
|
207.7
|
|
$
|
206.9
|
|
$
|
218.8
|
|
0.4
|
%
|
(5.4
|
)%
|
||||
|
Specialty Building Materials
|
177.0
|
|
205.3
|
|
204.1
|
|
(13.8
|
)%
|
0.6
|
%
|
|||||||
|
Adjusted Gross Profit (non-GAAP)
|
$
|
384.7
|
|
$
|
412.2
|
|
$
|
422.9
|
|
(6.7
|
)%
|
(2.5
|
)%
|
||||
|
Amortization of acquired inventory fair value adjustment
|
—
|
|
(0.2
|
)
|
(2.9
|
)
|
100.0
|
%
|
(93.1
|
)%
|
|||||||
|
Loss in Venezuela in cost of goods sold
|
—
|
|
—
|
|
(0.8
|
)
|
—
|
%
|
100.0
|
%
|
|||||||
|
Corporate costs and pension costs in cost of goods sold
|
(1.6
|
)
|
(1.9
|
)
|
(2.1
|
)
|
(15.8
|
)%
|
(9.5
|
)%
|
|||||||
|
Total GCP Gross Profit (GAAP)
|
$
|
383.1
|
|
$
|
410.1
|
|
$
|
417.1
|
|
(6.6
|
)%
|
(1.7
|
)%
|
||||
|
Gross Margin:
|
|||||||||||||||||
|
Specialty Construction Chemicals
|
35.9
|
%
|
32.2
|
%
|
35.5
|
%
|
3.7 pts
|
|
(3.3) pts
|
|
|||||||
|
Specialty Building Materials
|
40.7
|
%
|
42.6
|
%
|
43.5
|
%
|
(1.9) pts
|
|
(0.9) pts
|
|
|||||||
|
Adjusted Gross Margin (non-GAAP)
|
38.0
|
%
|
36.6
|
%
|
39.0
|
%
|
1.4 pts
|
|
(2.4) pts
|
|
|||||||
|
Amortization of acquired inventory fair value adjustment
|
—
|
%
|
—
|
%
|
(0.3
|
)%
|
0.0 pts
|
|
0.3 pts
|
|
|||||||
|
Loss in Venezuela in cost of goods sold
|
—
|
%
|
—
|
%
|
(0.1
|
)%
|
0.0 pts
|
|
0.1 pts
|
|
|||||||
|
Corporate costs and pension costs in cost of goods sold
|
(0.2
|
)%
|
(0.2
|
)%
|
(0.2
|
)%
|
0.0 pts
|
|
0.0 pts
|
|
|||||||
|
Total GCP Gross Margin (GAAP)
|
37.8
|
%
|
36.4
|
%
|
38.4
|
%
|
1.4 pts
|
|
(2.0) pts
|
|
|||||||
|
Adjusted EBIT(A)(B)(C):
|
|||||||||||||||||
|
Specialty Construction Chemicals segment operating income
|
$
|
56.6
|
|
$
|
40.2
|
|
$
|
63.4
|
|
40.8
|
%
|
(36.6
|
)%
|
||||
|
Specialty Building Materials segment operating income
|
85.8
|
|
113.6
|
|
109.4
|
|
(24.5
|
)%
|
3.8
|
%
|
|||||||
|
Corporate and certain pension costs
|
(40.6
|
)
|
(34.9
|
)
|
(45.4
|
)
|
16.3
|
%
|
(23.1
|
)%
|
|||||||
|
Total GCP Adjusted EBIT (non-GAAP)
|
$
|
101.8
|
|
$
|
118.9
|
|
$
|
127.4
|
|
(14.4
|
)%
|
(6.7
|
)%
|
||||
|
Depreciation and amortization:
|
|||||||||||||||||
|
Specialty Construction Chemicals
|
$
|
24.4
|
|
$
|
24.2
|
|
$
|
21.3
|
|
0.8
|
%
|
13.6
|
%
|
||||
|
Specialty Building Materials
|
14.8
|
|
14.7
|
|
13.2
|
|
0.7
|
%
|
11.4
|
%
|
|||||||
|
Corporate
|
4.0
|
|
3.1
|
|
2.3
|
|
29.0
|
%
|
34.8
|
%
|
|||||||
|
Total GCP
|
$
|
43.2
|
|
$
|
42.0
|
|
$
|
36.8
|
|
2.9
|
%
|
14.1
|
%
|
||||
|
Adjusted EBITDA:
|
|||||||||||||||||
|
Specialty Construction Chemicals
|
$
|
81.0
|
|
$
|
64.4
|
|
$
|
84.7
|
|
25.8
|
%
|
(24.0
|
)%
|
||||
|
Specialty Building Materials
|
100.6
|
|
128.3
|
|
122.6
|
|
(21.6
|
)%
|
4.6
|
%
|
|||||||
|
Corporate and certain pension costs
|
(36.6
|
)
|
(31.8
|
)
|
(43.1
|
)
|
15.1
|
%
|
(26.2
|
)%
|
|||||||
|
Total GCP Adjusted EBITDA (non-GAAP)
|
$
|
145.0
|
|
$
|
160.9
|
|
$
|
164.2
|
|
(9.9
|
)%
|
(2.0
|
)%
|
||||
|
Adjusted EBIT Margin:
|
|||||||||||||||||
|
Specialty Construction Chemicals
|
9.8
|
%
|
6.2
|
%
|
10.3
|
%
|
3.6 pts
|
|
(4.1) pts
|
|
|||||||
|
Specialty Building Materials
|
19.8
|
%
|
23.6
|
%
|
23.3
|
%
|
(3.8) pts
|
|
0.3 pts
|
|
|||||||
|
Total GCP Adjusted EBIT Margin (non-GAAP)
|
10.0
|
%
|
10.6
|
%
|
11.7
|
%
|
(0.6) pts
|
|
(1.1) pts
|
|
|||||||
|
Adjusted EBITDA Margin:
|
|||||||||||||||||
|
Specialty Construction Chemicals
|
14.0
|
%
|
10.0
|
%
|
13.8
|
%
|
4.0 pts
|
|
(3.8) pts
|
|
|||||||
|
Specialty Building Materials
|
23.2
|
%
|
26.6
|
%
|
26.2
|
%
|
(3.4) pts
|
|
0.4 pts
|
|
|||||||
|
Total GCP Adjusted EBITDA Margin (non-GAAP)
|
14.3
|
%
|
14.3
|
%
|
15.1
|
%
|
0.0 pts
|
|
(0.8) pts
|
|
|||||||
36
|
Four Quarters Ended
|
|||||||||||
|
Analysis of Operations
(In millions)
|
December 31, 2019
|
December 31, 2018
|
December 31, 2017
|
||||||||
|
Calculation of Return on Stockholders' Equity and Adjusted EBIT Return On Invested Capital (trailing four quarters):
|
|||||||||||
|
Income (loss) from continuing operations attributable to GCP shareholders (trailing four quarters):
|
$
|
40.6
|
|
$
|
(16.1
|
)
|
$
|
(110.9
|
)
|
||
|
Stockholders' Equity (end of period)
|
541.1
|
|
481.4
|
|
492.0
|
|
|||||
|
Assets:
|
|||||||||||
|
Cash and cash equivalents
|
(325.0
|
)
|
(326.1
|
)
|
(721.5
|
)
|
|||||
|
Pension plans
|
(25.0
|
)
|
(22.5
|
)
|
(26.4
|
)
|
|||||
|
Income taxes
|
(26.1
|
)
|
(25.5
|
)
|
(30.2
|
)
|
|||||
|
Other current assets (F)
|
(8.2
|
)
|
(10.4
|
)
|
(6.0
|
)
|
|||||
|
Other assets (G)
|
(3.1
|
)
|
(4.1
|
)
|
(3.2
|
)
|
|||||
|
Assets held for sale*
|
(0.5
|
)
|
(4.1
|
)
|
(22.5
|
)
|
|||||
|
Subtotal
|
(387.9
|
)
|
(392.7
|
)
|
(809.8
|
)
|
|||||
|
Liabilities:
|
|||||||||||
|
Debt*
|
349.2
|
|
356.7
|
|
544.3
|
|
|||||
|
Income taxes
|
96.7
|
|
112.9
|
|
115.4
|
|
|||||
|
Pension plans
|
67.5
|
|
48.1
|
|
57.1
|
|
|||||
|
Other current liabilities (H)
|
20.3
|
|
50.4
|
|
210.2
|
|
|||||
|
Other liabilities (I)
|
2.2
|
|
1.7
|
|
14.4
|
|
|||||
|
Liabilities held for sale*
|
—
|
|
0.4
|
|
8.1
|
|
|||||
|
Subtotal
|
535.9
|
|
570.2
|
|
949.5
|
|
|||||
|
Total invested capital (end of period)
|
$
|
689.1
|
|
$
|
658.9
|
|
$
|
631.7
|
|
||
|
Return on Stockholders' Equity
|
7.5
|
%
|
(3.3
|
)%
|
(22.5
|
)%
|
|||||
|
Adjusted EBIT (trailing four quarters)
|
$
|
101.8
|
|
$
|
118.9
|
|
$
|
127.4
|
|
||
|
Adjusted EBIT Return On Invested Capital (non-GAAP)
|
14.8
|
%
|
18.0
|
%
|
20.2
|
%
|
|||||
___________________________________________________________________________________________________________________
|
(A)
|
Our segment operating income includes only our share of income of consolidated joint ventures.
|
|
(B)
|
Management allocates certain corporate costs to each operating segment to the extent such costs are directly attributable to the segments.
|
|
(C)
|
Certain pension costs include only ongoing costs, recognized quarterly, which include service and interest costs, expected returns on plan assets and amortization of prior service costs/credits. SCC and SBM segment operating income and corporate costs do not include any amounts for pension expense. Other pension-related costs, including annual mark-to-market adjustments, gains or losses from curtailments and terminations, as well as other related costs, are excluded from Adjusted EBIT. These amounts are not used by management to evaluate the performance of our businesses and significantly affect the peer-to-peer and period-to-period comparability of our financial results. Mark-to-market adjustments and other related costs are primarily attributable to changes in financial market values and actuarial assumptions and are not directly related to the operations of our businesses.
|
|
(D)
|
Gain on Brazil tax recoveries, net primarily consists of a $1.7 million pre-tax gain related to indirect tax recoveries, and $1.1 million of legal fees and other charges relating to indirect and income tax recoveries.
|
|
(E)
|
Shareholder activism and other related costs consist primarily of professional fees incurred in connection with the actions by certain of our shareholders seeking changes in the composition of our Board of Directors and nomination of candidates to stand for election at the 2019 and 2020 Annual Shareholders' Meetings, as well as other related matters.
|
|
(F)
|
Other current assets consist of income taxes receivable.
|
|
(G)
|
Other assets consist of capitalized financing fees.
|
|
(H)
|
Other current liabilities consist of income taxes, restructuring, repositioning, accrued interest and liabilities incurred in association with the Darex divestiture.
|
|
(I)
|
Other liabilities consist of other postretirement benefits liabilities and liabilities incurred in association with the Darex divestiture.
|
|
*
|
Consists of current and non-current components.
|
|
NM
|
Not meaningful.
|
37
Adjusted EPS
The following table reconciles our Diluted EPS (GAAP) to our Adjusted EPS (non-GAAP).
|
Year Ended December 31,
|
|||||||||||||||||||||||||
|
2019
|
2018
|
||||||||||||||||||||||||
|
(In millions, except per share amounts)
|
Pre-Tax
|
Tax Effect
|
After-Tax
|
Per Share
|
Pre-Tax
|
Tax Effect
|
After-Tax
|
Per Share
|
|||||||||||||||||
|
Diluted EPS from continuing operations (GAAP)
|
$
|
0.56
|
|
|
|
|
|
$
|
(0.22
|
)
|
|||||||||||||||
|
Currency losses in Argentina
|
—
|
|
—
|
|
—
|
|
—
|
|
1.1
|
|
—
|
|
1.1
|
|
0.02
|
|
|||||||||
|
Loss on debt refinancing
|
—
|
|
—
|
|
—
|
|
—
|
|
59.8
|
|
14.8
|
|
45.0
|
|
0.62
|
|
|||||||||
|
Legacy product, environmental and other claims
|
0.1
|
|
—
|
|
0.1
|
|
—
|
|
—
|
|
—
|
|
—
|
|
—
|
|
|||||||||
|
Repositioning expenses
|
20.4
|
|
5.1
|
|
15.3
|
|
0.21
|
|
9.6
|
|
2.4
|
|
7.2
|
|
0.10
|
|
|||||||||
|
Restructuring expenses
|
9.9
|
|
1.1
|
|
8.8
|
|
0.12
|
|
14.8
|
|
3.3
|
|
11.5
|
|
0.16
|
|
|||||||||
|
Pension MTM adjustment and other related costs, net
|
13.3
|
|
3.5
|
|
9.8
|
|
0.13
|
|
(8.7
|
)
|
(2.1
|
)
|
(6.6
|
)
|
(0.09
|
)
|
|||||||||
|
Gain on termination and curtailment of pension and other postretirement plans
|
(1.2
|
)
|
(0.3
|
)
|
(0.9
|
)
|
(0.01
|
)
|
(0.2
|
)
|
(0.1
|
)
|
(0.1
|
)
|
—
|
|
|||||||||
|
Third-party and other acquisition-related costs
|
0.1
|
|
—
|
|
0.1
|
|
—
|
|
2.5
|
|
0.6
|
|
1.9
|
|
0.03
|
|
|||||||||
|
Amortization of acquired inventory fair value adjustment
|
—
|
|
—
|
|
—
|
|
—
|
|
0.2
|
|
—
|
|
0.2
|
|
—
|
|
|||||||||
|
Shareholder activism and other related costs
|
5.3
|
|
1.3
|
|
4.0
|
|
0.05
|
|
—
|
|
—
|
|
—
|
|
—
|
|
|||||||||
|
Tax indemnification adjustments
|
0.5
|
|
—
|
|
0.5
|
|
0.01
|
|
0.5
|
|
(0.1
|
)
|
0.6
|
|
0.01
|
|
|||||||||
|
Discrete tax items, including adjustments to uncertain tax positions
(1)
|
—
|
|
18.6
|
|
(18.6
|
)
|
(0.26
|
)
|
—
|
|
(20.7
|
)
|
20.7
|
|
0.28
|
|
|||||||||
|
Gain on Brazil tax recoveries, net
|
(0.6
|
)
|
(0.2
|
)
|
(0.4
|
)
|
—
|
|
—
|
|
—
|
|
—
|
|
—
|
|
|||||||||
|
Adjusted EPS (non-GAAP)
|
$
|
0.81
|
|
|
|
|
|
|
|
$
|
0.91
|
|
|||||||||||||
__________________________
|
(1)
|
Discrete tax items consist primarily of tax benefits of $20.2 million in 2019 due to the release of uncertain tax benefit liabilities and charges of
$17.9 million
in 2018 related to the 2017 Tax Act. Please refer to Note 9, "Income Taxes," to our Consolidated Financial Statements included in Item 8, “Financial Statements and Supplementary Data” of this Form 10-K and "Income Taxes" below for additional discussion of the impact of the 2017 Tax Act and related uncertain tax benefits.
|
38
GCP Overview
Following is an overview of our financial performance for
2019
,
2018
and
2017
. A discussion of results of operations related to year-over-year comparisons between 2019 and 2018 is included below.
Net Sales and Gross Margin

The following table identifies the year-over-year increase or decrease in sales attributable to changes in volume and/or mix, product price, and the impact of currency exchange for
2019
:
|
|
Year Ended December 31, 2019 as a Percentage Increase (Decrease) from the Year Ended December 31, 2018
|
||||||||||
|
Net Sales Variance Analysis
|
Volume
|
Price
|
Currency Translation
|
Total Change
|
|||||||
|
Specialty Construction Chemicals
|
(10.8
|
)%
|
3.5
|
%
|
(2.7
|
)%
|
(10.0
|
)%
|
|||
|
Specialty Building Materials
|
(10.0
|
)%
|
1.7
|
%
|
(1.6
|
)%
|
(9.9
|
)%
|
|||
|
Net sales
|
(10.5
|
)%
|
2.7
|
%
|
(2.1
|
)%
|
(9.9
|
)%
|
|||
|
By Region:
|
|||||||||||
|
North America
|
(7.9
|
)%
|
2.1
|
%
|
(0.1
|
)%
|
(5.9
|
)%
|
|||
|
Europe Middle East Africa
|
(18.1
|
)%
|
2.8
|
%
|
(4.3
|
)%
|
(19.6
|
)%
|
|||
|
Asia Pacific
|
(8.5
|
)%
|
1.2
|
%
|
(2.1
|
)%
|
(9.4
|
)%
|
|||
|
Latin America
|
(12.4
|
)%
|
13.1
|
%
|
(12.4
|
)%
|
(11.7
|
)%
|
|||
Net sales of
$1,013.5 million
for
2019
decrease
d by $
111.9
million, or
9.9%
, compared with the prior year
.
The decrease was primarily due to lower sales volumes and the unfavorable impact of foreign currency translation, partially offset by price increases. Sales volumes decreased primarily due to lower project activity, mostly within SBM, and planned exits of unprofitable geographic markets within SCC.
Gross profit was $
383.1
million in
2019
, a decrease of $
26.8
million, or 6.6%, compared with the prior year, primarily due to lower sales volumes in SBM. Gross margin increased 140 basis points to
37.8%
in
2019
primarily due to improved pricing, exiting unprofitable geographic markets within SCC, improved productivity, and the favorable impact of restructuring activities, which more than offset unfavorable product mix.
39
Income (Loss) from Continuing Operations Attributable to GCP Shareholders

Income from continuing operations attributable to GCP shareholders was
$40.6 million
for
2019
, compared to a loss of
$16.1 million
for the prior year. The change was primarily due to: (i) lower interest expense due to debt refinancing and the related loss of
$59.8 million
recognized in the prior-year, (ii) income tax benefit compared to an income tax expense in the prior-year mostly due to the 2017 Tax Act, and (iii) lower selling, general and administrative expenses primarily due to savings from restructuring activities. The impact of these items was partially offset by a loss from pension mark-to-market adjustments compared to a gain in the prior-year, lower gross profit and lower income from our Transition Services Agreement (the "TSA") related to the sale of Darex.
Adjusted EBIT

40
Adjusted EBIT was
$101.8 million
for
2019
, a
decrease
of
14.4%
, compared with the prior year. The
decrease
was primarily due to lower SBM operating income and higher corporate costs, partially offset by higher SCC operating income. Adjusted EBIT margin of
10.0%
in 2019 remained consistent with the prior year as an increase in Adjusted Gross Margin was offset by reduced operating leverage due to lower sales volumes in SBM and higher corporate costs.
Adjusted EBITDA

Adjusted EBITDA was
$145.0 million
for
2019
, a
decrease
of
9.9%
, compared with the prior year. The
decrease
was primarily due to lower Adjusted EBIT. Adjusted EBITDA margin of
14.3%
in 2019 remained consistent with the prior year.
Return on Stockholders' Equity and Adjusted EBIT Return On Invested Capital


Return on Stockholders' Equity for 2019 was 7.5% compared to (3.3)% in the prior year. The change was primarily driven by income from continuing operations attributable to GCP shareholders of
$40.6 million
during 2019 compared to a loss of
$16.1 million
during the prior year.
Adjusted EBIT Return On Invested Capital for
2019
was
14.8%
, a
decrease
from
18.0%
in
2018
. The
decrease
was mainly driven by lower Adjusted EBIT.
41
Operating Segment Overview—Specialty Construction Chemicals (SCC)
The following is an overview of the financial performance of SCC for
2019
,
2018
, and 2017. A discussion of results of operations related to year-over-year comparisons between 2019 and 2018 is included below.
Net Sales and Gross Margin—SCC

Net sales were
$579.1 million
for
2019
, a
decrease
of
$64.4 million
,
or
10.0%
, compared with the prior year. The
decrease
was primarily due to lower sales volumes and the unfavorable impact of foreign currency translation, partially offset by improved pricing in all regions.
Sales volumes decreased
10.8%
in
2019
compared to the prior year primarily due to strategic exits from unprofitable geographic markets, as well as sales volume declines in North America and Asia Pacific. Sales volumes in our Concrete business decreased 10.5% primarily due to strategic exits from unprofitable geographic markets. Sales volumes decreased 11.9% in our Cement business primarily due to strategic exits from unprofitable geographic markets and lower volumes in Asia Pacific.
Gross profit was
$207.7 million
for
2019
, an
increase
of
$0.8 million
, or
0.4%
, compared with the prior year primarily due to improved pricing, partially offset by lower sales volumes. Gross margin increased 370 basis points to
35.9%
due to improved pricing, exiting unprofitable geographic markets, the favorable impact of restructuring activities and improved productivity, partially offset by lower sales volumes.
42
Segment Operating Income and Operating Margin—SCC

Segment operating income was
$56.6 million
for
2019
, an
increase
of
$16.4 million
, or
40.8%
, compared with the prior year, primarily due to lower operating expenses resulting from savings from restructuring activities, partially offset by lower TSA income. Segment operating margin of
9.8%
increase
d
360
basis points compared with the prior year, primarily due to higher gross margin.
Operating Segment Overview—Specialty Building Materials (SBM)
The following is an overview of the financial performance of SBM for
2019
,
2018
, and
2017
. A discussion of results of operations related to year-over-year comparisons between 2019 and 2018 is included below.
Net Sales and Gross Margin—SBM

Net sales were
$434.4 million
for
2019
, a
decrease
of
$47.5 million
, or
9.9%
, compared with the prior year. The decrease was primarily due to lower sales volumes and the unfavorable impact of foreign currency translation, partially offset by improved pricing in all regions.
43
Sales volumes decreased
10.0%
due to lower project activity primarily in North America, Asia Pacific and Latin America. Building Envelope volumes decreased 12.9% due to lower project activity primarily in North America, Asia Pacific and Latin America. Residential volumes were consistent with the prior year. Specialty Construction Products volumes decreased 8.6% primarily due to lower volumes in our injections business.
Gross profit was
$177.0 million
for
2019
, a
decrease
of
$28.3 million
, or
13.8%
, compared with the prior year primarily due to lower sales volumes. Gross margin decreased 190 basis points to
40.7%
compared with the prior year primarily due to unfavorable product mix.
Segment Operating Income and Operating Margin—SBM

Segment operating income was
$85.8 million
for
2019
, a
decrease
of
$27.8 million
, or
24.5%
, compared with the prior year primarily due to lower gross profit and an acquisition-related settlement gain related to Stirling Lloyd in the prior-year, partially offset by reduced operating expenses. Segment operating margin for 2019 was
19.8%
, a
decrease
of
380
basis points compared with the prior year. The decrease was primarily due to lower gross margin and lower sales volumes impacting operating leverage.
Corporate Overview

44
Corporate costs include certain functional support costs, the impacts of foreign exchange, certain performance-based employee incentive compensation, public company costs, and other costs that are not allocated to our operating segments.
Corporate costs were
$32.8 million
for
2019
, an
increase
of
$5.5 million
, or
20.1%
, compared with
2018
. The increase was primarily attributable to stock-based compensation expense reductions recognized in the prior year, gain on sale of assets recognized in the prior year and higher foreign exchange loss, mostly relating to Argentina. During 2019 and 2018, we recorded stock-based compensation expense reductions of
$2.4 million
and
$5.2 million
, respectively, related to remeasurement of PBUs granted in 2019, 2018 and 2017 based on their estimated expected payout at the end of the applicable performance period. Please refer to Note 17, "Stock Incentive Plans," in the Notes to the Consolidated Financial Statements included in Item 8, "Financial Statements and Supplementary Data" of this Annual Report on Form 10‑K.
Defined Benefit Pension and Gain on Termination and Curtailments
Defined benefit pension expenses include costs related to U.S. and non-U.S. defined benefit pension and other postretirement benefit (the "OPEB") plans that provide benefits to retirees and former employees of divested businesses where we retained these obligations.
In accordance with mark-to-market (the "MTM") accounting, pension costs recognized in our results of operations consist of the following two components: (i) "certain pension costs," which represent ongoing costs recognized quarterly, including service and interest costs, expected return on plan assets and amortization of prior service costs/credits; and (ii) "pension MTM adjustment and other related costs, net," which represent mark-to-market gains and losses recognized annually during the fourth quarter or during interim periods when significant events occur, such as plan amendments or curtailments. Mark-to-market gains and losses result from changes in actuarial assumptions, such as discount rates and the difference between actual and expected returns on plan assets. Additionally, we recognize applicable material events within "gain on termination and curtailment of pension and other postretirement plans" during the period in which they occur.
The following table summarizes pension costs for
2019
,
2018
and
2017
:
_______________________________
|
Years Ended December 31,
|
||||||||||||
|
(In millions)
|
2019
|
2018
|
2017
|
|||||||||
|
Certain pension costs
|
$
|
(7.8
|
)
|
$
|
(7.6
|
)
|
$
|
(9.0
|
)
|
|||
|
Pension MTM adjustment and other related costs, net(1)
|
(13.3
|
)
|
8.7
|
|
(14.1
|
)
|
||||||
|
Gain on termination and curtailment of pension and other postretirement plans
|
1.2
|
|
0.2
|
|
6.6
|
|
||||||
|
(1)
|
During 2018, we recognized $1.2 million of other related costs from the initial recognition of a liability for a non-U.S. OPEB retiree health care plan.
|
Certain pension costs were
$7.8 million
in 2019 and remained consistent with the prior year.
Pension MTM adjustment and other related costs, net were a loss of $
13.3
million in
2019
compared to a gain of
$8.7 million
in
2018
. The change was primarily attributable to lower market rates for a portfolio of U.S. and non-U.S. high quality corporate bonds for which the amount and timing of cash outflows approximate estimated payouts for the pension plans.
Components of pension costs presented in "Corporate costs and pension costs in costs of goods sold" in our Analysis of Operations represent service costs related to our manufacturing employees and amounted to $
1.6
million, $
1.9
million, and $
1.7
million, respectively, in 2019, 2018 and 2017.
45
Gain on termination and curtailment of pension and other postretirement plans presented in "Other expenses (income), net" was $
1.2
million and
$0.2
million, respectively, in 2019 and 2018. Such change was attributable to a curtailment gain resulting from the freeze of the accrual of plan benefits for all plan participants under the U.K. Retirement Plan in 2019.
Please refer to Note 10, "Pension Plans and Other Postretirement Benefit Plans" in the Notes to the Consolidated Financial Statements included in Item 8, "Financial Statements and Supplementary Data" of this Annual Report on Form 10‑K for further information on pension plans.
Restructuring, Asset Impairments and Repositioning Expenses
2019 Restructuring and Repositioning Plan (the “2019 Plan”)
On February 22, 2019, our Board of Directors (the "Board") approved a business restructuring and repositioning plan (the “2019 Plan”). The 2019 Plan is focused on our global supply chain strategy, processes and execution, including our manufacturing, purchasing, logistics, and warehousing operations. The plan also addresses our service delivery model, primarily in North America, to streamline the Company’s pursuit of combined admixture and VERIFI
®
opportunities.
We expect to incur total pre-tax costs in connection with the 2019 Plan of approximately
$15 million
to
$20 million
, of which approximately
$4 million
to
$7 million
are related to restructuring costs and asset impairments and approximately
$11 million
to
$13 million
are related to repositioning costs. In addition, we expect to incur
$2 million
to
$3 million
of capital expenditures associated with the Plan. As of December 31, 2019, we incurred
$0.7 million
of restructuring costs under the 2019 Plan since inception.
We expect to realize total annualized pre-tax cost savings associated with the 2019 Plan of approximately
$22 million
to
$28 million
by the end of 2021, which are expected to benefit both the SCC and SBM operating segments. During 2019, we achieved pre-tax cost savings of approximately
$6.6 million
, or approximately
$12.9 million
on an annualized basis, through a reduction in cost of goods sold as a result of supply chain, warehouse operations, and logistical enhancements. Substantially all of the activities under the 2019 Plan are expected to be settled in cash and completed by December 31, 2020.
2019 Phase 2 Restructuring and Repositioning Plan (the “2019 Phase 2 Plan")
On July 31, 2019, the Board approved a business restructuring and repositioning plan to further optimize the design and footprint of our global organization, primarily with respect to general administration and business support functions, and streamline cross-functional activities.
We expect to incur total pre-tax costs in connection with the 2019 Phase 2 Plan of approximately
$30 million
to
$35 million
, of which approximately
$23 million
to
$27 million
represent restructuring costs and asset impairments, and approximately
$7 million
to
$8 million
represent repositioning costs. In addition, we expect to incur approximately
$2 million
of capital expenditures within the 2019 Phase 2 program. As of December 31, 2019, we incurred
$3.1 million
of restructuring costs under the 2019 Phase 2 Plan since inception. Substantially all of the restructuring activities are expected to be completed by December 31, 2020.
We expect to realize total annualized pre-tax cost savings associated with the 2019 Phase 2 Plan of approximately
$30 million
to
$35 million
by the end of
2021
, which are expected to benefit both the SCC and SBM operating segments. During 2019, we achieved pre-tax cost savings of approximately
$3.1 million
, or approximately
$8.3 million
on an annualized basis, through a reduction in general and administrative expenses. With the exception of asset impairments, substantially, all of the restructuring and repositioning activities are expected to be settled in cash by December 31, 2021.
2018 Restructuring and Repositioning Plan (the “2018 Plan”)
On August 1, 2018, our Board of Directors approved a business restructuring and repositioning plan. The 2018 Plan was designed to streamline operations and improve profitability primarily within the concrete admixtures product line of our SCC segment by focusing on our core markets, rationalizing non-profitable geographies, reducing our global cost structure and accelerating the integration of VERIFI
®
into our global admixtures business.
46
Substantially
all of the restructuring
and repositioning activities
under the 2018 Plan have been completed as of December 31, 2019. Cumulative costs incurred under the 2018 Plan since its inception were
$22.0 million
for restructuring and asset impairments and
$10.6 million
for repositioning.
During 2019, we achieved annualized pre-tax cost savings of
$25 million
under the 2018 Plan. Approximately
75%
and
25%
of the total pre-tax cost savings were attributable to SCC and SBM, respectively, and related primarily to a reduction in cost of goods sold and selling, general and administrative expenses.
By the end of 2020
, we expect a total SCC revenue reduction of
$65 million
to
$75 million
as a result of exiting non-profitable geographic markets under the 2018 Plan. Such revenue reductions amounted to
$49 million
and
$10 million
, respectively, in 2019 and 2018.
2017 Restructuring and Repositioning Plan (the “2017 Plan”)
On June 28, 2017, our Board of Directors approved a restructuring and repositioning plan that includes actions to streamline our operations, reduce our global cost structure and reposition us as a construction products technologies company.
Restructuring and repositioning activities were substantially completed as of
December 31, 2018
. We achieved net annualized cost reductions of approximately
$29 million
, of which approximately
$14 million
was included within continuing operations and approximately
$15 million
was included within discontinued operations. These net cost reductions were primarily related to selling, general and administrative expenses. The net cost reductions were phased-in over the completion of the 2017 Plan, and the cost recovery generated from the Transition Services Agreement with Henkel, as described in Note 21, "Discontinued Operations" in the Notes to the Consolidated Financial Statements included in Item 8, "Financial Statements and Supplementary Data" of this Annual Report on Form 10‑K, largely offset the costs that were eliminated upon completion of the program.
Restructuring Expenses and Asset Impairments
The following table summarizes restructuring expenses and asset impairments incurred during each period:
|
Year Ended December 31,
|
|||||||||||
|
(In millions)
|
2019
|
2018
|
2017
|
||||||||
|
Severance and other employee costs
|
$
|
4.1
|
|
$
|
10.1
|
|
$
|
19.9
|
|
||
|
Facility exit costs
|
—
|
|
0.6
|
|
0.2
|
|
|||||
|
Asset impairments
|
4.3
|
|
4.5
|
|
1.2
|
|
|||||
|
Other associated costs
|
1.8
|
|
—
|
|
—
|
|
|||||
|
Total restructuring expenses and asset impairments
|
$
|
10.2
|
|
$
|
15.2
|
|
$
|
21.3
|
|
||
|
Less: restructuring expenses and asset impairments reflected in discontinued operations
|
0.3
|
|
0.4
|
|
7.8
|
|
|||||
|
Total restructuring expenses and asset impairments from continuing operations
|
$
|
9.9
|
|
$
|
14.8
|
|
$
|
13.5
|
|
||
For further information on the restructuring expenses and asset impairments, please refer to Note 14, "Restructuring and Repositioning Expenses, Asset Impairments", in the Notes to the Consolidated Financial Statements included in Item 8, "Financial Statements and Supplementary Data" of this Annual Report on Form 10‑K.
Repositioning Expenses
Repositioning expenses associated with all the plans discussed above, as well as our review of strategic, financial and operational alternatives, are primarily related to consulting, other professional services and other employee-related costs associated with our organizational realignment and advancing our technology strategy. Due to the scope and complexity of our repositioning activities, the range of estimated repositioning expenses could increase or decrease and the timing of incurrence could change.
47
The following tables summarize repositioning expenses and cash payments related to all the plans discussed above and the Strategic Alternatives Plan:
|
Year Ended December 31, 2019
|
|||||||||||||||||||||||
|
(In millions)
|
2019 Plan
(1)
|
2019 Phase 2 Plan
(2)
|
2018 Plan
(3)
|
2017 Plan
(4)
|
Strategic Alternatives Plan
(5)
|
Total
|
|||||||||||||||||
|
Repositioning expenses
|
$
|
8.8
|
|
$
|
2.4
|
|
$
|
5.3
|
|
$
|
0.8
|
|
$
|
3.1
|
|
$
|
20.4
|
|
|||||
|
Cash paid for repositioning expenses
|
$
|
5.6
|
|
$
|
1.0
|
|
$
|
10.5
|
|
$
|
2.1
|
|
$
|
2.0
|
|
$
|
21.2
|
|
|||||
|
Cash paid for capital expenditures
|
$
|
0.6
|
|
$
|
—
|
|
$
|
0.8
|
|
$
|
4.6
|
|
$
|
—
|
|
$
|
6.0
|
|
|||||
__________________________
|
(1)
|
As of
December 31, 2019
, cumulative repositioning costs and related cash payments, as well as cash paid for capital expenditures were
$8.8 million
,
$5.6 million
, and
$0.6 million
, respectively.
|
|
(2)
|
As of
December 31, 2019
, cumulative repositioning costs and related cash payments were
$2.4 million
and
$1.0 million
, respectively. There were no cash payments for capital expenditures since the Plan's inception.
|
|
(3)
|
As of
December 31, 2019
, cumulative repositioning costs and related cash payments, as well as cash paid for capital expenditures were
$10.6 million
,
$10.7 million
, and
$0.8 million
, respectively.
|
|
(4)
|
As of
December 31, 2019
, cumulative repositioning costs and related cash payments, as well as cash paid for capital expenditures were
$9.6 million
,
$9.4 million
, and
$11.3 million
, respectively.
|
|
(5)
|
As of
December 31, 2019
, cumulative repositioning costs and related cash payments were
$3.1 million
and
$2.0 million
, respectively. Repositioning costs consist primarily of professional service fees.
|
During 2018, we incurred repositioning expenses of
$5.3 million
and
$4.3 million
, respectively, related to the 2018 Plan and the 2017 Plan. During 2017, we incurred repositioning expenses related to the 2017 Plan of
$4.5 million
.
We exclude restructuring, asset impairments, and repositioning expenses from Adjusted EBIT, as discussed in the "Results of Operations" section above.
Interest and Financing Expenses
"Interest expense and related financing costs" included in the Consolidated Statements of Operations were $22.7 million and $92.4 million, respectively, for 2019 and 2018. The decrease of $69.7 million was primarily due to the loss on debt extinguishment from the redemption of our 9.5% Senior Notes which occurred in 2018 and lower interest expense on our 5.5% Senior Notes in 2019.
Please refer to the "Debt and Other Contractual Obligations" section below and Note 8, " Debt and Other Borrowings" in the Notes to the Consolidated Financial Statements included in Item 8, "Financial Statements and Supplementary Data" of this Annual Report on Form 10‑K for further information on our debt obligations related to the senior notes and other borrowings at December 31, 2019 and 2018
.
Income Taxes
Income tax (benefit) expense for
2019
,
2018
and
2017
was $
(6.6) million
,
$26.3 million
and
$82.1 million
respectively, on income (loss) from continuing operations before income taxes of $
34.4 million
,
$10.5 million
and
$(28.3) million
, respectively, in
2019
,
2018
and
2017
.
48
Tax Reform
The 2017 Tax Act, which was signed into law on December 22, 2017, has resulted in significant changes to the Internal Revenue Code. These changes include, but are not limited to, the federal corporate tax rate being reduced from 35% to
21%
, the elimination or reduction of certain domestic deductions and credits, along with limitations on deductions for interest expense and executive compensation. The 2017 Tax Act also transitions international taxation from a worldwide system to a modified territorial system and includes base erosion prevention measures on non-US earnings, which has the effect of subjecting certain earnings of our foreign subsidiaries to US taxation as global intangible low-taxed income (GILTI). We have elected to recognize the tax on GILTI as a period expense in the period the tax is incurred.
During 2017, we recorded a provisional net charge of
$81.7 million
related to the provisions of the 2017 Tax Act, which is comprised of a
$70.5 million
Transition Tax and an
$11.2 million
revaluation of net deferred tax assets. Changes in tax rates and tax laws are accounted for in the period of enactment.
During 2018, we recorded an increase to the provisional net charge of
$17.9 million
which is comprised of an expense of $20.2 million related to certain capital gains recognized resulting from the application of the Transition Tax, a $2.5 million benefit related to the Transition Tax, and an expense of $0.2 million for the effect on U.S. deferred taxes.
During 2019, as a result of clarifications issued in January 2019 by the Internal Revenue Service (IRS) in the final treasury regulations under Code Section 965, we decreased our liability for unrecognized tax benefits by
$20.2 million. In addition, the application of the final regulations resulted in an increase to our long-term tax payable by
$3.7 million
and an increase of our short-term tax payable by
$0.2 million. We have elected to pay the Transition Tax over the eight-year period as provided in the 2017 Tax Act. As of December 31, 2019, the unpaid balance of the Transition Tax obligation is
$41.4 million, net of overpayments and foreign tax credits. After considering overpayments, the outstanding payable is due between April 2022 and April 2025.
Repatriation
In general, it is our practice and intention to permanently reinvest the earnings of our foreign subsidiaries and repatriate earnings only when the tax impact is efficient. This position has not changed subsequent to the one-time transition tax under the Tax Act.
Effective Tax Rate
Our effective tax rate was approximately 19%,
250%
and
290%
in
2019
,
2018
and
2017
, respectively.
The change in the effective tax rate for 2019 compared to the same period in 2018 was primarily due to the finalization of Transition Tax regulations issued in January 2019, as well as the benefit of a Brazilian income tax refund and a lower valuation allowance charge.
Our 2019 effective tax rate of 19.2% differed from the 21% U.S. statutory rate primarily due to the finalization of Transition Tax regulations issued in January 2019, resulting in a tax benefit of $20.2 million, as well as the benefit of a Brazilian income tax refund of $3.2 million, and U.S. foreign tax credits generated of $2.0 million. These benefits were partially offset by a tax provision of $3.9 million due to changes to our 2017 income tax liability and Transition Tax, as well as the effect of foreign rate differential of $3.6 million, non-deductible expenses of $1.6 million and a valuation allowance increase of $1.0 million.
Our
2018
effective tax rate of 250.5% differed from the 21% U.S. statutory rate primarily due to impacts of the 2017 Tax Act of $17.9 million and an increase in valuation allowance of $6.8 million resulting from net operating losses in Germany, France, India, Turkey and Mexico, that do not benefit the effective tax rate.
Our 2017 effective tax rate of approximately
290.1%
differed from the 35% U.S. statutory rate primarily due to net expenses recognized during the year comprised of $81.7 million due to the 2017 Tax Act, $11.5 million due to non-deductible charges for the Venezuela deconsolidation, $11.4 million due to an increase in valuation allowance primarily due to the sale of Darex, offset by a $13.9 million benefit due to differences between book and tax basis in Venezuela and Mexico.
Income taxes paid in cash, net of refunds, were
$12.7 million
,
$23.1 million
, and
$11.2 million
, respectively, in
2019
,
2018
and
2017
. Our annual cash tax rate was approximately 36%,
220%
, and
40%
, respectively, in
2019
,
2018
, and
2017
.
49
Please refer to Note 9, "Income Taxes," in the Notes to the Consolidated Financial Statements included in Item 8, "Financial Statements and Supplementary Data" of this Annual Report on Form 10‑K for additional information regarding income tax.
Other Expenses (Income), Net
Other expenses (income), net were $4.3 million of expenses in 2019 compared to $26.7 million of income in the prior year. The change was primarily due to pension mark-to-market losses recognized in 2019 compared to mark-to-market gains during the prior year, lower TSA income in 2019 related to the sale of Darex and an acquisition-related settlement gain in the prior year related to Stirling Lloyd. The impact of these items was partially offset by foreign currency exchange gains in 2019 compared to losses in the prior-year.
FINANCIAL CONDITION, LIQUIDITY AND CAPITAL RESOURCES
Following is an analysis of our financial condition, liquidity and capital resources at
December 31, 2019
.
Our principal uses of cash generally have been capital investments, acquisitions and working capital investments. In connection with our Separation from Grace, we incurred
$800.0 million
of indebtedness, including
$750.0 million
borrowed to pay a distribution to Grace prior to the Separation and approximately
$50 million
retained to meet operating requirements and to pay Separation-related fees. We believe our liquidity and capital resources, including cash on hand and cash we expect to generate during
2020
and thereafter, future borrowings, if any, as well as other available liquidity and capital resources discussed further below, are sufficient to finance our operations and growth strategy and meet our debt obligations.
Divestiture of Darex
Upon the closing of the sale of Darex on July 3, 2017, we received proceeds of approximately
$1.06 billion
before deal and other one-time costs. We have used a portion of these proceeds primarily to repay indebtedness, for acquisitions, and for general corporate purposes.
The agreement governing our sale of Darex provides for a series of delayed closings in certain non-U.S. jurisdictions, including Argentina, China, Colombia, Indonesia, Peru and Venezuela for which sales proceeds of $68.7 million were received on the July 3, 2017 closing date. The delayed closings implement the legal transfer of the Darex business in the delayed closing jurisdictions in accordance with local law. During 2019, we completed the delayed closing in Indonesia and recognized a gain of $
9.6 million
on a pre-tax basis and $
7.2 million
on an after-tax basis based on $
12.7 million
of proceeds received. During 2018, we completed the delayed closings in Argentina, Colombia, Peru and China and recognized a gain associated with these delayed closings of
$43.5 million
on a pre-tax basis and
$31.5 million
on an after-tax basis based on
$55.4 million
of proceeds received. During 2017, we recognized a gain of $
880.8 million
on a pre-tax basis and
$678.9 million
on an after-tax basis based on
$1.0 billion
of proceeds received on the sale of Darex entities that closed on July 3, 2017
.
In January 2020, the delayed closing in Venezuela was completed. We do not expect to record a gain or a loss on the closing of the sale of the Darex business in Venezuela.
Up to the time of the delayed closings, the results of the operations of the Darex business within the delayed close countries are reported as “Income from discontinued operations, net of income taxes” in the Consolidated Statements of Operations and adjusted for an economic benefit payable to or recovered from Henkel
with the exception of operations in Venezuela which were deconsolidated during 2017.
The assets and liabilities of the Darex business in the remaining delayed close countries are categorized as assets or liabilities held for sale in the Consolidated Balance Sheets as of December 31, 2019 and 2018.
Cash Resources and Available Credit Facilities
At
December 31, 2019
, we had available liquidity of
$715.4 million
, consisting of
$325.0 million
in cash and cash equivalents, of which
$144.6 million
was held in the U.S.,
$344.1 million
under our revolving credit facility, and
$46.3 million
under various non-U.S. credit facilities.
Our non-U.S. credit facilities are extended to various subsidiaries that use them primarily to issue bank guarantees supporting trade activity and provide working capital during occasional cash shortfalls. We generally renew these credit facilities as they expire.
50
We expect to meet our U.S. cash and liquidity requirements with cash on hand, cash we expect to generate during 2020 and thereafter, future borrowings, if any, and other available liquidity, including royalties and service fees from our foreign subsidiaries. We may also repatriate future earnings from foreign subsidiaries if that results in minimal or no U.S. tax consequences. We expect to have sufficient cash and liquidity to finance our U.S. operations and growth strategy and to meet our debt obligations in the U.S. Please refer to Note 1, "Basis of Presentation and Summary of Significant Accounting and Financial Reporting Policies" in the Notes to the Consolidated Financial Statements included in Item 8, "Financial Statements and Supplementary Data" of this Annual Report on Form 10‑K for a discussion of our cash and cash equivalents.
The following table summarizes our non-U.S. credit facilities as of
December 31, 2019
.
|
(In millions) |
Maximum Borrowing Amount
|
Available Liquidity
|
Expiration Date
|
||||||
|
Singapore
|
$
|
6.0
|
|
$
|
6.0
|
|
2/3/2021
|
||
|
China
|
6.0
|
|
4.6
|
|
2/3/2021
|
||||
|
Canada
|
5.8
|
|
5.8
|
|
2/3/2021
|
||||
|
Australia
|
5.5
|
|
5.0
|
|
2/3/2021
|
||||
|
Korea
|
5.0
|
|
5.0
|
|
2/3/2021
|
||||
|
India
|
5.0
|
|
3.0
|
|
2/3/2021
|
||||
|
Mexico
|
2.4
|
|
2.4
|
|
3/31/2020
|
||||
|
Brazil
|
2.3
|
|
2.3
|
|
Open ended
|
||||
|
Other countries
|
13.0
|
|
12.2
|
|
Open ended
|
||||
|
Total
|
$
|
51.0
|
|
$
|
46.3
|
|
|
||
Analysis of Cash Flows
The following table summarizes our cash flows for the years ended
December 31, 2019
,
2018
and
2017
:
|
|
Year Ended December 31,
|
||||||||||
|
(In millions)
|
2019
|
2018
|
2017
|
||||||||
|
Net cash provided by (used in) operating activities from continuing operations
|
$
|
78.0
|
|
$
|
75.4
|
|
$
|
(1.0
|
)
|
||
|
Net cash used in investing activities from continuing operations
|
(61.1
|
)
|
(86.9
|
)
|
(160.9
|
)
|
|||||
|
Net cash used in financing activities from continuing operations
|
(5.0
|
)
|
(247.3
|
)
|
(292.0
|
)
|
|||||
2019 Compared to 2018
Net cash provided by operating activities from continuing operations during 2019 was
$78.0 million
compared to $75.4 million for 2018. The year-over-year change was primarily due to lower cash paid for interest and taxes, as well as lower inventory. The impact of these items was partially offset by higher cash paid for repositioning and restructuring, as well as increased cash used for accounts payable and customer volume rebates. During 2019 and 2018, restructuring payments were $11.3 million and $9.1 million, respectively, and repositioning payments were $21.2 million and $5.5 million, respectively.
Net cash used in investing activities from continuing operations during 2019 was
$61.1 million
compared to $86.9 million for 2018. The year-over-year change was primarily due to lower cash payments for acquisitions due to the purchase of RIW Limited ("RIW") in 2018.
Net cash used in financing activities from continuing operations during 2019 was
$5.0 million
compared to $247.3 million for 2018. The year-over-year change was primarily due to the redemption of the 9.5% Senior Notes and the issuance of the 5.5% Senior Notes, as well as payments for debt issuance costs, all of which occurred in 2018.
51
Debt and Other Contractual Obligations
Total debt outstanding at December 31, 2019 and 2018 was $
349.2 million
and
$356.7 million
, respectively.
On April 10, 2018, we redeemed our then existing 9.5% Senior Notes with an aggregate principal amount of $525.0 million due in 2023 (the “9.5% Senior Notes”), issued 5.5% Senior Notes with an aggregate principal amount of $350.0 million maturing on April 15, 2026 (the "5.5% Senior Notes") and entered into an amendment to our Credit Agreement to, among other things, (i) increase the aggregate principal amount available under our revolving credit facility to $350.0 million, (ii) extend the maturity date of the revolving credit facility thereunder to April 2023 and (iii) make certain other changes to the covenants and other provisions therein. Additionally, we borrowed $50.0 million in aggregate principal amount of revolving loans under the Credit Agreement, which was fully repaid during 2018. The aggregate cash payment of $587.9 million, which consisted of: (i) proceeds of $350.0 million from the issuance of the 5.5% Senior Notes, net of loan origination fees of $3.1 million, (ii) borrowings of $50.0 million under the Credit Agreement, and (iii) a cash payment of $191.0 million was used to redeem all of the then outstanding 9.5% Senior Notes in accordance with the terms of the indenture governing the 9.5% Senior Notes.
During 2018, we recognized a loss on debt extinguishment of $59.4 million related to the 9.5% Senior Notes which was included in "Interest expense and related financing costs" in the Consolidated Statements of Operations. In connection with the redemption of our 9.5% Senior Notes with the then outstanding principal balance of $525.0 million, we paid total cash proceeds of $587.9 million, including $53.3 million of a redemption premium and $9.6 million of accrued interest unpaid thereon through the redemption date, and wrote off $6.1 million of previously deferred debt issuance costs.
5.5% Senior Notes
The 5.5% Senior Notes were issued pursuant to an Indenture (the “Indenture”),
at $346.9 million, or 99.1% of their par value, resulting in a discount of $3.1 million, or 0.9%, which represented loan origination fees paid at the closing. We incurred additional deferred financing costs of $1.6 million during 2018. Interest is payable semi-annually in arrears on April 15 and October 15 of each year, commencing on October 15, 2018. During 2019 and 2018, we made interest payments of $19.2 million and $9.9 million, respectively. Our debt service requirements are expected to be funded through our existing sources of liquidity and operating cash flows.
Subject to certain conditions stated in the Indenture, we may, at our option and at any time and from time to time, redeem the 5.5% Senior Notes prior to their maturity date in whole or in part at certain redemption prices, as discussed in Note 8, "Debt and Other Borrowings," in the Notes to the Consolidated Financial Statements included in Item 8, "Financial Statements and Supplementary Data" of this Annual Report on Form 10‑K. Upon occurrence of a change of control, as defined in the Indenture, we will be required to make an offer to repurchase the 5.5% Senior Notes at a price equal to 101.00% of their aggregate principal amount repurchased plus accrued and unpaid interest, if any, to, but excluding, the date of repurchase.
The Indenture contains certain covenants and provides for customary events of default subject to customary grace periods in certain cases. Please refer to Note 8, "Debt and Other Borrowings," in the Notes to the Consolidated Financial Statements included in Item 8, "Financial Statements and Supplementary Data" of this Annual Report on Form 10‑K for additional information regarding our debt. As of December 31 2019 and 2018, we were in compliance with all covenants and conditions under the Indenture. There are no events of default under the Indenture as of December 31, 2019 and 2018.
Credit Agreement
On April 10, 2018, we entered into an amendment to our Credit Agreement and borrowed $50 million in aggregate principal amount of revolving loans under the Credit Agreement, as discussed above. The Credit Agreement contains conditions that would require mandatory principal payments in advance of the maturity date of the Revolving Credit Facility, as well as certain customary affirmative and negative covenants and events of default, as described in Note 8, "Debt and Other Borrowings," to our Consolidated Financial Statements. We were in compliance with all covenant terms as of December 31, 2019 and December 31, 2018. There are no events of default as of December 31, 2019 or December 31, 2018.
52
The interest rate per annum applicable to the Revolving Credit Facility is equal to, at our option, either: (i) a base rate plus a margin ranging from 0.5% to 1.0%, or (ii) LIBOR plus a margin ranging from 1.5% to 2.0%, based upon our total leverage ratio and our restricted subsidiaries' in both scenarios. During 2018, we made aggregate payments of $50.0 million on the Revolving Credit Facility. As of December 31, 2019 and 2018, there were no outstanding borrowings on the Revolving Credit Facility and $5.9 million and
$5.0 million
, respectively, in outstanding letters of credit, which resulted in available credit of $344.1 million and
$345.0 million
, respectively, under the Revolving Credit Facility. Interest payments on the Revolving Credit Facility amounted to
$0.2 million
during 2018. There were no such payments during 2019. Please refer to Note 8, "Debt and Other Borrowings," in the Notes to the Consolidated Financial Statements included in Item 8, "Financial Statements and Supplementary Data" of this Annual Report on Form 10‑K for additional information regarding our debt.
On July 3, 2017, we completed the sale of Darex to Henkel for approximately $1.06 billion in cash, subject to working capital and certain other adjustments. The sale of Darex is a permitted transaction under our Credit Agreement and the Indenture governing the 9.5% Senior Notes which were redeemed on April 10, 2018. Under the Credit Agreement and the Indenture governing the 9.5% Senior Notes, we were required to use net cash proceeds from the sale to prepay debt or make investments in the business over a period of approximately 18 months.
Contractual Obligations
The following is a summary of our contractual obligations as of
December 31, 2019
:
|
Payments Due By Period
|
|||||||||||||||||||
|
(In millions)
|
Less than 1 Year
|
1-3
Years
|
3-5
Years
|
More Than 5 Years
|
Total
|
||||||||||||||
|
Contractual Cash Obligations:
|
|||||||||||||||||||
|
Debt and other borrowings
(1)
|
$
|
2.7
|
|
$
|
0.2
|
|
$
|
0.2
|
|
$
|
346.1
|
|
$
|
349.2
|
|
||||
|
Expected interest payments on debt and other borrowings
(2)
|
20.6
|
|
38.5
|
|
38.5
|
|
38.5
|
|
136.1
|
|
|||||||||
|
Lease obligations
(3)
|
9.9
|
|
9.9
|
|
4.6
|
|
26.2
|
|
50.6
|
|
|||||||||
|
Transition income tax liability
(4)
|
—
|
|
5.2
|
|
21.1
|
|
15.1
|
|
41.4
|
|
|||||||||
|
Operating commitments
(5)
|
6.2
|
|
0.6
|
|
—
|
|
—
|
|
6.8
|
|
|||||||||
|
Pension funding requirements per ERISA (U.S.)
(6)
|
—
|
|
3.6
|
|
12.2
|
|
—
|
|
15.8
|
|
|||||||||
|
Pension funding requirements for pension plans (non-U.S.)
(7)
|
1.3
|
|
3.2
|
|
2.8
|
|
—
|
|
7.3
|
|
|||||||||
|
Total contractual cash obligations
|
$
|
40.7
|
|
$
|
61.2
|
|
$
|
79.4
|
|
$
|
425.9
|
|
$
|
607.2
|
|
||||
|
Other Commercial Commitments:
|
|||||||||||||||||||
|
Standby letters of credit
|
2.7
|
|
3.2
|
|
—
|
|
—
|
|
5.9
|
|
|||||||||
|
Total commitments
|
$
|
43.4
|
|
$
|
64.4
|
|
$
|
79.4
|
|
$
|
425.9
|
|
$
|
613.1
|
|
||||
______________________________________
|
(1)
|
Debt and other borrowings include principal maturities of the
$350.0 million
5.5%
Senior Notes due in 2026 and borrowings under various lines of credit, primarily by non-U.S. subsidiaries. Such amounts represent contractual cash obligations payable at maturity, net of debt issuance cost reductions of $3.9 million. Please refer to Note 8, "Debt and Other Borrowings," in the Notes to the Consolidated Financial Statements included in Item 8, "Financial Statements and Supplementary Data" of this Annual Report on Form 10‑K for further information on these arrangements.
|
|
(2)
|
Amounts are based on a 5.5% fixed interest rate for the 5.5% Senior Notes and variable interest rates in effect at
December 31, 2019
for the borrowings under various lines of credit outstanding as of
December 31, 2019
.
|
|
(3)
|
Includes undiscounted operating lease liability payments of $41.0 million and variable lease payments of $9.6 million which are not based on an index or a rate
|
|
(4)
|
Represents the Company's income tax liability of $
41.4 million
associated with the 2017 Tax Act, which will be paid over six years.
|
|
(5)
|
Amounts do not include open purchase commitments, which are routine in nature and normally settle within 90 days.
|
|
(6)
|
Based on the U.S. qualified pension plans' status as of December 31, 2019, minimum funding requirements under ERISA have been estimated for the next five years. Amounts in subsequent years or additional payments we may make at our discretion have not yet been determined.
|
|
(7)
|
Based on the non-U.S. pension plans' status as of
December 31, 2019
, funding requirements have been estimated for the next five years. Amounts in subsequent years have not yet been determined.
|
53
As of December 31, 2019, we had approximately $31.8 million of unrecognized tax benefits and
$10.6 million
of the associated interest and penalties pertaining to unrecognized tax benefits. Included in these amounts are
$2.6 million
indemnified by Grace. Our liability for unrecognized tax benefits decreased by
$20.8 million
during 2019. We also believe it is reasonably possible that in the next 12 months due to expiration of the statute of limitation that the amount of the liability for unrecognized tax benefits could further decrease by approximately
$1.6 million
, of which
$0.5 million
is indemnified by Grace. Unrecognized tax benefits represent a potential future cash outlay. We are unable to make a reasonably reliable estimate of the timing of the cash settlement for this liability since the timing of future tax examinations by various tax jurisdictions and the related resolution is uncertain. Please refer to Note 9, "Income Taxes", in the Notes to the Consolidated Financial Statements included in Item 8, "Financial Statements and Supplementary Data" of this Annual Report on Form 10‑K for further information on our unrecognized tax benefit.
The letters of credit of approximately
$5.9 million
are related primarily to customer advances and other performance obligations as of December 31, 2019. Please refer to Note 12, "Commitments and Contingencies," to the Consolidated Financial Statements included in Item 8, "Financial Statements and Supplementary Data" of this Annual Report on Form 10‑K for further information on guarantees, indemnification obligations and financial assurances, none of which were material at December 31, 2019.
Off-Balance-Sheet Arrangements
As of December 31, 2019, we had no significant off-balance-sheet arrangements other than guarantees, indemnification obligations and financial assurances which are described in Note 12, "Commitments and Contingencies," to the Consolidated Financial Statements included in Item 8, "Financial Statements and Supplementary Data" of this Annual Report on Form 10‑K. These arrangements are not material to our overall financial condition, results of operations, liquidity and capital resources, as well as market risk support or credit risk support.
Employee Benefit Plans
Defined Contribution Retirement Plan
We sponsor a defined contribution retirement plan for our employees in the U.S. which is a qualified plan under section 401(k) of the U.S. tax code. Under this plan, we contribute an amount equal to
100%
of employee contributions, up to
6%
of an individual employee's salary or wages. Effective January 1, 2018, we amended the defined contribution plan whereby we contribute up to an additional
2%
of
100%
of applicable employee compensation subject to a
three
year vesting requirement. Applicable employees include those beginning employment with us on or after January 1, 2018 who are not eligible to participate in GCP Applied Technologies Inc. Retirement Plan for Salaried Employees, which closed to new hires effective January 1, 2018. We incurred costs for this plan totaling
$4.6 million
,
$4.6 million
and
$4.8 million
, respectively, in
2019
,
2018
and
2017
.
Defined Benefit Pension Plans
We sponsor defined benefit pension plans for our employees in the U.S., the U.K. and a number of other countries. We also fund government-sponsored programs in other countries in which we operate. A portion of our defined benefit pension plans are advance-funded, and others are pay-as-you-go. The advance-funded plans are administered by trustees who direct the management of plan assets and arrange to have obligations paid when due. Our most significant advance-funded plans cover current and former salaried employees in the U.K. and certain of our U.S. employees who are covered by collective bargaining agreements. Our U.S. advance-funded plans are qualified under the U.S. tax code.
Fully-funded plans include several advance-funded plans where the fair value of the plan assets exceeds the projected benefit obligation ("PBO"). This group of plans was overfunded by
$25.0 million
as of
December 31, 2019
, and the overfunded status is reflected as "Overfunded defined benefit pension plans" in the Consolidated Balance Sheets. Underfunded plans include a group of advance-funded plans that are underfunded on a PBO basis by a total of
$40.8 million
as of
December 31, 2019
. Additionally, we have several plans that are funded on a pay-as-you-go basis; and therefore, the entire PBO of
$26.7
million at
December 31, 2019
is unfunded. The combined balance of the underfunded and unfunded plans was $
68.7
million as of
December 31, 2019
. This amount is presented as
$1.2 million
in "Other current liabilities" and
$67.5 million
in "Underfunded and unfunded defined benefit pension plans" on the Consolidated Balance Sheets.
54
Based on the U.S. funded plans' status as of
December 31, 2019
, there were no minimum required payments under ERISA. We made a contribution of
$0.1 million
to the U.S. pension plans in
2019
and no contributions to these plans in
2018
. We intend to fund non-U.S. pension plans based upon applicable legal requirements, as well as actuarial and trustee recommendations. We contributed
$2.6
million,
$5.0
million and
$3.4 million
, respectively, to the non-U.S. pension plans in
2019
,
2018
and
2017
. The decrease of $2.4 million in
2019
as compared to
2018
was primarily due to a $2.9 million discretionary contribution made to a pension plan in Brazil in the prior year.
Please refer to Note 10, "Pension Plans and Other Postretirement Benefit Plans," in the Notes to the Consolidated Financial Statements included in Item 8, "Financial Statements and Supplementary Data" of this Annual Report on Form 10‑K for further discussion on our pension and other postretirement benefit plans.
Inflation
We recognize that inflationary pressures may have an adverse effect on us through higher asset replacement costs and higher raw materials and other operating costs. We try to minimize these impacts through effective control of operating expenses and productivity improvements, as well as price increases to customers.
We estimate that the cost of replacing our property and equipment today is greater than its historical cost. Accordingly, our depreciation expense would be greater if the expense were stated on a current cost basis.
Venezuela
On July 3, 2017, we deconsolidated our GCP Venezuela subsidiary and recognized a corresponding pre-tax charge of
$36.7 million
. Such charge was reflected in “Loss in Venezuela” in the Consolidated Statements of Operations and primarily related to the recognition of unfavorable currency translation adjustments of
$33.4 million
for periods prior to January 1, 2010. In the periods subsequent to the deconsolidation, we began accounting for GCP Venezuela using the cost method and we no longer included the operating results of the Venezuela subsidiary in our consolidated financial results. During 2017, GCP Venezuela contributed net sales of $6.2 million and operating income of $3.2 million within continuing operations.
During 2018, we sold the remaining SCC operations within our Venezuela subsidiary. Both the proceeds from the sale and the loss on the sale did not have a material impact on the Consolidated Financial Statements. As of December 31, 2019, the remaining operations in GCP Venezuela represented the Darex operations which were sold to Henkel in January 2020 under the delayed close arrangement. The remaining investment in GCP Venezuela is classified as held for sale within the Company's Consolidated Balance Sheets as of December 31, 2019 and 2018 and not material.
Argentina
As of June 30, 2018, we concluded that Argentina is a highly inflationary economy since the three-year cumulative inflation rates commonly used to evaluate Argentina’s inflation currently exceed 100%. As a result, we began accounting for our operations in Argentina as a highly inflationary economy starting with July 1, 2018.
Effective July 1, 2018, the functional currency of our subsidiary operating in Argentina became the U.S. dollar and all remeasurement adjustments after the effective date are reflected in our results operations in the Consolidated Statements of Operations. During each of 2019 and 2018, we incurred losses of
$1.1 million
which are included in "Other expenses (income), net" in the Consolidated Statement of Operations, related to the remeasurement of these monetary net assets. During 2019 and 2018, net sales generated by the Argentina subsidiary were not material to our consolidated net sales. Monetary net assets denominated in local currency within our Argentina subsidiary were not material to our consolidated total assets as of December 31, 2019 and 2018.
55
CRITICAL ACCOUNTING POLICIES AND ESTIMATES
The preparation of financial statements in conformity with GAAP requires us to make estimates and assumptions that affect the reported amounts of assets, liabilities, revenue, expenses, as well as related disclosures of contingent assets and liabilities within the Consolidated Financial Statements. Changes in estimates are recognized in the period in which they are identified. We believe that our accounting estimates are appropriate and the related balances included within the Consolidated Financial Statements are reasonable. Actual amounts could differ from the initial estimates which may require adjustments in future periods that could have a material impact on our financial condition and results of operations. A description of our accounting policies is included in Note 1, "Basis of Presentation and Summary of Significant Accounting and Financial Reporting Policies" in the Notes to the Consolidated Financial Statements included in Item 8, "Financial Statements and Supplementary Data" of this Form 10‑K.
We believe that the assumptions and estimates associated with the critical accounting policies and estimates described in this section involve significant judgment and thus have the most significant potential impact on our Consolidated Financial Statements. An accounting estimate is considered critical if management is required to make assumptions and judgments about matters that were highly uncertain at the time the estimate was made, if different estimates reasonably could have been used, or if changes in the estimate are reasonably likely to occur from period to period that could have a material impact on our financial condition or results of operations. As a part of our disclosure controls and procedures, management has discussed the development, selection and disclosure of the critical accounting estimates with the Audit Committee of the GCP Board of Directors.
Contingent Liabilities
Contingent liabilities may arise from circumstances, such as legal disputes, environmental remediation, product liability and warranty claims, material commitments and income taxes. We establish liabilities for loss contingencies associated with these matters when we determine that it is probable that a liability has been incurred and its amount can be reasonably estimated. We base our assessment of probabilities on the facts and circumstances known at the time the financial statements are prepared. If we determine that a loss is probable, but only an estimated range of the potential loss amount exists, we record a liability equal to the minimum amount of the range and make subsequent adjustments, if necessary, as further information becomes available. Please refer to Item 3, "Legal Proceedings" and Note 12, "Commitments and Contingencies" in the Notes to the Consolidated Financial Statements included in Item 8, "Financial Statements and Supplementary Data" of this Form 10‑K for further information on contingent liabilities.
Goodwill
Goodwill represents the excess of purchase price over the fair value of identifiable net assets of businesses acquired. We review our goodwill for impairment annually, and whenever events or changes in circumstances indicate that the carrying amounts may not be fully recoverable. We assess goodwill for impairment at the reporting unit level, which we define as Specialty Construction Chemicals and Specialty Building Materials, by performing either a qualitative evaluation or a quantitative test.
Application of the goodwill impairment assessment requires judgment based on market and operational conditions at the time of the assessment. We first assess qualitative factors to determine whether the existence of events or circumstances indicates that it is more likely than not that the fair value of a reporting unit is less than its carrying value. Qualitative factors may include, but are not limited to, economic, market and industry conditions, cost factors and overall financial performance of the reporting unit. If we determine, based on this assessment, that it is more likely than not that the fair value of the reporting unit is less than its carrying value, we perform a quantitative goodwill impairment test by comparing these amounts. If the fair value of the reporting unit exceeds the carrying amount, no impairment loss is recognized. However, if the carrying amount exceeds its fair value, the goodwill of the reporting unit may be impaired. The amount of impairment loss, if any, is measured based upon the implied fair value of goodwill at the valuation date. Goodwill is deemed to be impaired when its carrying amount exceeds its implied fair value.
56
Fair value of each reporting unit is determined using a combined weighted average of the income-based approach and the market-based approach. In applying the income-based approach, the fair value of each reporting unit is determined in accordance with a discounted projected cash flow valuation model based on the estimated projected future cash flows and terminal value discounted at a rate which reflects the weighted average costs of capital. The inputs and assumptions that are most likely to impact the reporting unit's fair value include the discount rate, long-term sales growth rates and forecasted operating margins. In applying the market-based approach, we determine the reporting unit’s business enterprise fair value based on inputs and assumptions related to average revenue multiples and EBITDA multiples derived from our peer group which are weighted and adjusted for size, risk and growth of the individual reporting unit. Changes in these estimates and assumptions or a continued decline in general economic conditions could change our conclusions regarding goodwill impairment and potentially result in a non-cash impairment loss recognized in our results of operations in future periods.
We performed our annual impairment assessments related to goodwill as of October 31, 2019 and 2018. We determined, based upon the results of our qualitative assessments, that it was not likely that the fair values of the reporting units were less than their carrying amounts. As such, we did not perform quantitative assessments as a part of the impairment test and did not recognize impairment losses as a result of our analysis. We last performed a quantitative assessment as part of the impairment test in 2017, and the fair value of our reporting units was significantly in excess of their carrying values. If events occur or circumstances change that would more likely than not reduce the fair values of the reporting units below their carrying values, goodwill will be evaluated for impairment between annual tests. There were no impairment charges recognized during any of the periods presented in the Consolidated Statements of Operations.
Pension and Other Postretirement Benefits Expenses and Liabilities
We sponsor defined benefit pension plans for our employees in the United States, the United Kingdom, and a number of other countries, and fund government-sponsored programs in other countries where we operate. Please refer to Note 10, "Pension Plans and Other Postretirement Benefit Plans," in the Notes to the Consolidated Financial Statements included in Item 8, "Financial Statements and Supplementary Data" of this Form 10‑K and "Employee Benefit Plans" section presented above for a detailed discussion of our pension plans and other postretirement benefit plans.
In order to estimate our pension and other postretirement benefits expenses and liabilities, we select from a range of possible assumptions derived from participant demographics, past experiences and market indices. These assumptions are updated annually and primarily include discount rates, expected return on plan assets, mortality rates, retirement rates, and rate of compensation increase. The independent actuaries review our assumptions for reasonableness and use such assumptions to calculate our estimated liability and future pension expense. We review the actuarial reports for reasonableness and adjust our expenses, assets and liabilities to reflect the amounts calculated in the actuarial reports.
The two key assumptions used in determining our pension benefit obligations and pension expense are the discount rate and expected return on plan assets. Our most significant pension assets and pension liabilities are related to U.S. and U.K. pension plans.
The assumed discount rates for pension plans reflect currently available market rates for high-quality corporate bonds. For the U.S. pension plans, the assumed weighted average discount rate was selected in consultation with our independent actuaries based on a yield curve constructed from a portfolio of high quality bonds for which the timing and amount of cash outflows approximate the estimated payouts of the plan. For the U.K. pension plan, the assumed weighted average discount rate was selected in consultation with our independent actuaries based on a yield curve constructed from a portfolio of sterling-denominated high quality bonds for which the timing and amount of cash outflows approximate the estimated payouts of the plan.
We selected the expected return on plan assets for the U.S. qualified pension plans for
2019
and 2018 in consultation with our independent actuaries using an expected return model. The model determines the weighted average return for an investment portfolio based on the target asset allocation and expected future returns for each asset class which were developed using a building block approach based on observable inflation, available interest rate information, current market characteristics and historical results. For the expected return on plan assets for the U.K. pension plan, we considered the trustees' strategic investment policy together with long-term historical returns and investment community forecasts for each asset class.
57
Income Taxes
We are a global enterprise with operations in over
30
countries. This global reach results in a complexity of tax regulations, which require assessments of applicable tax law and judgments in estimating our ultimate income tax liability. Please refer to Note 1, "Basis of Presentation and Summary of Significant Accounting and Financial Reporting Policies" and Note 9, "Income Taxes," in the Notes to the Consolidated Financial Statements included in Item 8, "Financial Statements and Supplementary Data" of this Form 10‑K for additional details.
Stock-Based Compensation
We grant equity awards to certain key employees which include stock options, restricted share units (“RSUs”) and performance-based units (“PBUs”) with market conditions in accordance with provisions of the GCP Applied Technologies Inc. Equity and Incentive Plan (the "Plan"), as amended and restated on February 28, 2017.
We estimate the fair value of equity awards issued at the grant date. The fair value of the awards is recognized as stock-based compensation expense on a straight line basis, net of estimated forfeitures, for each separately vesting portion of the award over the employee’s requisite service period. We use the Black-Scholes option pricing model for determining the fair value of stock options granted and the Monte Carlo simulation model to estimate the fair value of PBUs with market conditions, both of which require management to make significant judgments and estimates regarding participant activity and market results. The use of different assumptions and estimates could have a material impact on the estimated fair value of these awards and the related stock-based compensation expense recognized during each period. The inputs and assumptions used in determining fair values of equity awards are the expected life, expected volatility, risk-free interest rate, expected dividend yield and correlation coefficient.
We make estimates of the expected forfeiture rate and recognize stock-based compensation expense during each reporting period based on the number of equity awards expected to vest which requires significant judgment. Stock-based compensation expense is adjusted as changes are made to the estimated forfeiture rates based on actual forfeiture activity during the vesting period. We consider many factors in developing estimated forfeiture rates, including voluntary termination behavior and future workforce reduction programs. Estimated forfeitures are trued up to actual forfeitures as each equity award vests.
We make estimates related to the likelihood of achieving performance goals for PBUs that vest upon the satisfaction of these goals. The number of shares ultimately provided to employees who received a PBU grant will be based on the level of achievement of these Company targets. PBUs are remeasured during each reporting period based on the expected payout of the award, which may range from 0% to 200% of the targets for such awards. PBUs granted in 2018 and 2017 are based on a three-year cumulative adjusted diluted earnings per share measure that is modified, up or down, based on the Company's total shareholder return ("TSR") relative to the performance of the Russell 3000 Index. PBUs granted in 2019 are based on a three-year cumulative adjusted diluted earnings per share measure that is modified, up or down, based on the Company's TSR relative to the performance of the Russell 3000 Specialty Chemicals and Building Materials Indices. As a result, these awards are subject to volatility until the payout is determined at the end of the performance period.
Acquisitions
We account for business acquisitions using the purchase method of accounting, in accordance with which assets acquired and liabilities assumed are recorded at their respective fair values at the acquisition date. The fair value of the consideration paid, including contingent consideration, is assigned to the assets acquired and liabilities assumed based on their respective fair values. Goodwill represents the excess of the purchase price over the estimated fair values of the assets acquired and liabilities assumed.
58
Significant judgment is used in determining fair values of assets acquired and liabilities assumed, including definite-lived intangible assets and their estimated useful lives. Fair value and useful life determinations are based on, among other factors, estimates of future expected cash flows, customer relationship attrition rates, royalty cost savings and appropriate discount rates used in computing present values. These judgments may materially impact the estimates used in allocating the purchase price based on acquisition date fair values to assets acquired and liabilities assumed, as well as our current and future operating results. Actual results may vary from these estimates which may result in adjustments to goodwill and acquisition date fair values of assets and liabilities during a measurement period or upon a final determination of asset and liability fair values, whichever occurs first. Adjustments to fair values of assets and liabilities made after the end of the measurement period are recorded within our operating results. Changes in the fair value of a contingent consideration liability resulting from a change in the underlying inputs are recognized in our operating results until such liability is settled.
Recent Accounting Pronouncements
Effective January 1, 2019, we adopted Accounting Standard Update (the "ASU") 2016-02,
Leases (Topic 842)
. The adoption of Topic 842 resulted in a recognition of operating lease right-of-use assets of $40.8 million and operating lease obligations of $40.9 million in the Consolidated Balance Sheets as of January 1, 2019. The adoption of Topic 842 did not result in significant accounting changes for finance leases which were not material as of January 1, 2019 and December 31, 2019. The adoption of Topic 842 related to lease arrangements in which the Company is a lessee did not have a material impact on the Company's results of operations and cash flows during 2019.
Effective January 1, 2018, we adopted ASU 2014-09,
Revenue from Contracts with Customers (Topic 606)
. The impact of this adoption was deemed immaterial to our net sales, loss from continuing operations before income taxes, loss from continuing operations, and net income during 2018.
For a summary of recently issued accounting pronouncements applicable to our Consolidated Financial Statements which is incorporated here by reference, please refer to Note 1, "Basis of Presentation and Summary of Significant Accounting and Financial Reporting Policies" in the Notes to the Consolidated Financial Statements included in Item 8, "Financial Statements and Supplementary Data" of this Form 10‑K.
59
Our global operations, raw materials, energy requirements and debt obligations expose us to various market risks. The following is a discussion of our primary market risk exposures, how these exposures may be managed and certain quantitative data pertaining to these exposures. We use derivative financial instruments to mitigate certain of these risks.
Currency Exchange Rate Risk
We operate in over
30
countries, and, as a result, our results of operations are exposed to changes in currency exchange rates. We attempt to minimize exposure to these changes by matching revenue streams in volatile currencies with expenditures in the same currencies using currency forward contracts or swaps. However, we do not have a policy of hedging all exposures, as management does not believe that such a level of hedging would be cost-effective. We do not hedge translation exposures that are not expected to affect cash flows in the near-term.
Commodity Price Risk
We operate in markets where the prices of raw materials and energy are commonly affected by cyclical movements in the economy and other factors. The principal raw materials used in our products include amines, polycarboxylates, rubber and latex, solvents, naphthalene, sulfonate, lignins and saccharides. These commodities are generally available to be purchased from more than one supplier. In order to minimize the risk of increasing prices on certain raw materials and energy, we use a centralized supply chain organization for sourcing in order to optimize procurement activities. We have a risk management committee to review proposals to hedge purchases of raw materials and energy, but we do not currently use financial instruments to hedge these costs.
Interest Rate Risk
As of
December 31, 2019
and
2018
, approximately
$1.8 million
and $11 million, respectively, of our borrowings were at variable interest rates. We are subject to minimal risk associated with variable interest rate fluctuations.
60
TABLE OF CONTENTS
|
|
||
___________________________________________________________
The Financial Statement Schedule II should be read in conjunction with the Consolidated Financial Statements and Notes thereto.
Report of Independent Registered Public Accounting Firm
To the
Board of Directors and Stockholders of GCP Applied Technologies Inc.
Opinions on the Financial Statements and Internal Control over Financial Reporting
We have audited the accompanying consolidated balance sheets of GCP Applied Technologies Inc. and its subsidiaries (the “Company”) as of December 31, 2019 and 2018, and the related consolidated statements of operations, of comprehensive income (loss), of stockholders' equity (deficit) and of cash flows for each of the three years in the period ended December 31, 2019, including the related notes and financial statement schedule listed in the accompanying index (collectively referred to as the “consolidated financial statements”). We also have audited the Company's internal control over financial reporting as of December 31, 2019, based on criteria established in Internal Control - Integrated Framework (2013) issued by the Committee of Sponsoring Organizations of the Treadway Commission (COSO).
In our opinion, the consolidated financial statements referred to above present fairly, in all material respects, the financial position of the Company as of December 31, 2019 and 2018, and the results of its operations and its cash flows for each of the three years in the period ended December 31, 2019 in conformity with accounting principles generally accepted in the United States of America. Also in our opinion, the Company maintained, in all material respects, effective internal control over financial reporting as of December 31, 2019, based on criteria established in Internal Control - Integrated Framework (2013) issued by the COSO.
Change in Accounting Principle
As discussed in Note 1 to the consolidated financial statements, the Company changed the manner in which it accounts for leases in 2019.
Basis for Opinions
The Company's management is responsible for these consolidated financial statements, for maintaining effective internal control over financial reporting, and for its assessment of the effectiveness of internal control over financial reporting, included in Management’s Report on Internal Control Over Financial Reporting appearing under Item 9A. Our responsibility is to express opinions on the Company’s consolidated financial statements and on the Company's internal control over financial reporting based on our audits. We are a public accounting firm registered with the Public Company Accounting Oversight Board (United States) (PCAOB) and are required to be independent with respect to the Company in accordance with the U.S. federal securities laws and the applicable rules and regulations of the Securities and Exchange Commission and the PCAOB.
We conducted our audits in accordance with the standards of the PCAOB. Those standards require that we plan and perform the audits to obtain reasonable assurance about whether the consolidated financial statements are free of material misstatement, whether due to error or fraud, and whether effective internal control over financial reporting was maintained in all material respects.
Our audits of the consolidated financial statements included performing procedures to assess the risks of material misstatement of the consolidated financial statements, whether due to error or fraud, and performing procedures that respond to those risks. Such procedures included examining, on a test basis, evidence regarding the amounts and disclosures in the consolidated financial statements. Our audits also included evaluating the accounting principles used and significant estimates made by management, as well as evaluating the overall presentation of the consolidated financial statements. Our audit of internal control over financial reporting included obtaining an understanding of internal control over financial reporting, assessing the risk that a material weakness exists, and testing and evaluating the design and operating effectiveness of internal control based on the assessed risk. Our audits also included performing such other procedures as we considered necessary in the circumstances. We believe that our audits provide a reasonable basis for our opinions.
Definition and Limitations of Internal Control over Financial Reporting
A company’s internal control over financial reporting is a process designed to provide reasonable assurance regarding the reliability of financial reporting and the preparation of financial statements for external purposes in accordance with generally accepted accounting principles. A company’s internal control over financial reporting
includes those policies and procedures that (i) pertain to the maintenance of records that, in reasonable detail, accurately and fairly reflect the transactions and dispositions of the assets of the company; (ii) provide reasonable assurance that transactions are recorded as necessary to permit preparation of financial statements in accordance with generally accepted accounting principles, and that receipts and expenditures of the company are being made only in accordance with authorizations of management and directors of the company; and (iii) provide reasonable assurance regarding prevention or timely detection of unauthorized acquisition, use, or disposition of the company’s assets that could have a material effect on the financial statements.
Because of its inherent limitations, internal control over financial reporting may not prevent or detect misstatements. Also, projections of any evaluation of effectiveness to future periods are subject to the risk that controls may become inadequate because of changes in conditions, or that the degree of compliance with the policies or procedures may deteriorate.
Critical Audit Matters
The critical audit matter communicated below is a matter arising from the current period audit of the consolidated financial statements that was communicated or required to be communicated to the audit committee and that (i) relates to accounts or disclosures that are material to the consolidated financial statements and (ii) involved our especially challenging, subjective, or complex judgments. The communication of critical audit matters does not alter in any way our opinion on the consolidated financial statements, taken as a whole, and we are not, by communicating the critical audit matter below, providing a separate opinion on the critical audit matter or on the accounts or disclosures to which it relates.
Goodwill Impairment Assessment
As described in Notes 1 and 7 to the consolidated financial statements, the Company’s consolidated goodwill balance was $209 million as of December 31, 2019. Management reviews its goodwill for impairment at the reporting unit level on an annual basis as of October 31, or more often if impairment indicators are present. Management first assesses qualitative factors to determine whether the existence of events or circumstances indicate that it is more likely than not that the fair value of a reporting unit is less than its carrying value. As disclosed by management, qualitative factors may include, but are not limited to, economic, market and industry conditions, cost factors and overall financial performance of the reporting unit. Based upon the results of the qualitative assessment, management determined that it was not likely that the respective fair values of their reporting units were less than their carrying amounts. As such, management did not perform the two-step goodwill impairment test and did not recognize impairment losses as a result of its analyses.
The principal considerations for our determination that performing procedures relating to the goodwill impairment assessment is a critical audit matter are there was a high degree of auditor subjectivity and effort in performing procedures to evaluate management’s qualitative impairment assessments.
Addressing the matter involved performing procedures and evaluating audit evidence in connection with forming our overall opinion on the consolidated financial statements. These procedures included testing the effectiveness of controls relating to management’s goodwill impairment assessments, including a control over the review of qualitative factors affecting the reporting units. These procedures also included, among others, (i) evaluating management’s qualitative assessments by analyzing financial performance of the reporting units, the Company’s market capitalization and other events or circumstances impacting the reporting units and (ii) comparing actual financial performance with forecasted financial performance used in previous impairment assessments to evaluate whether it is more likely than not that the fair value of each reporting unit is less than the carrying value.
/s/ PricewaterhouseCoopers LLP
Boston, Massachusetts
February 27, 2020
We have served as the Company’s auditor since
2015.
|
GCP Applied Technologies Inc.
Consolidated Statements of Operations |
|||||||||||
|
Year Ended December 31,
|
|||||||||||
|
(In millions, except per share amounts)
|
2019
|
2018
|
2017
|
||||||||
|
Net sales
|
$
|
|
|
$
|
|
|
$
|
|
|
||
|
Cost of goods sold
|
|
|
|
|
|
|
|||||
|
Gross profit
|
|
|
|
|
|
|
|||||
|
Selling, general and administrative expenses
|
|
|
|
|
|
|
|||||
|
Research and development expenses
|
|
|
|
|
|
|
|||||
|
Interest expense and related financing costs
|
|
|
|
|
|
|
|||||
|
Repositioning expenses
|
|
|
|
|
|
|
|||||
|
Restructuring expenses and asset impairments
|
|
|
|
|
|
|
|||||
|
Loss in Venezuela
|
|
|
|
|
|
|
|||||
|
Other expenses (income), net
|
|
|
(
|
)
|
(
|
)
|
|||||
|
Total costs and expenses
|
|
|
|
|
|
|
|||||
|
Income (loss) from continuing operations before income taxes
|
|
|
|
|
(
|
)
|
|||||
|
Benefit (provision) for income taxes
|
|
|
(
|
)
|
(
|
)
|
|||||
|
Income (loss) from continuing operations
|
|
|
(
|
)
|
(
|
)
|
|||||
|
Income from discontinued operations, net of income taxes
|
|
|
|
|
|
|
|||||
|
Net income
|
|
|
|
|
|
|
|||||
|
Less: Net income attributable to noncontrolling interests
|
(
|
)
|
(
|
)
|
(
|
)
|
|||||
|
Net income attributable to GCP shareholders
|
$
|
|
|
$
|
|
|
$
|
|
|
||
|
Amounts Attributable to GCP Shareholders:
|
|||||||||||
|
Income (loss) from continuing operations attributable to GCP shareholders
|
$
|
|
|
$
|
(
|
)
|
$
|
(
|
)
|
||
|
Income from discontinued operations, net of income taxes
|
|
|
|
|
|
|
|||||
|
Net income attributable to GCP shareholders
|
$
|
|
|
$
|
|
|
$
|
|
|
||
|
Earnings (Loss) Per Share Attributable to GCP Shareholders:
|
|||||||||||
|
Basic earnings (loss) per share:
|
|||||||||||
|
Income (loss) from continuing operations attributable to GCP shareholders
|
$
|
|
|
$
|
(
|
)
|
$
|
(
|
)
|
||
|
Income from discontinued operations, net of income taxes
|
$
|
|
|
$
|
|
|
$
|
|
|
||
|
Net income attributable to GCP shareholders
(1)
|
$
|
|
|
$
|
|
|
$
|
|
|
||
|
Weighted average number of basic shares
|
|
|
|
|
|
|
|||||
|
Diluted earnings (loss) per share:
(2)
|
|||||||||||
|
Income (loss) from continuing operations attributable to GCP shareholders
|
$
|
|
|
$
|
(
|
)
|
$
|
(
|
)
|
||
|
Income from discontinued operations, net of income taxes
|
$
|
|
|
$
|
|
|
$
|
|
|
||
|
Net income attributable to GCP shareholders
(1)
|
$
|
|
|
$
|
|
|
$
|
|
|
||
|
Weighted average number of diluted shares
|
|
|
|
|
|
|
|||||
______________________________
|
(1)
|
Amounts may not sum due to rounding.
|
|
(2)
|
Dilutive effect is only applicable to the years during which GCP generated net income from continuing operations.
|
The Notes to Consolidated Financial Statements are an integral part of these statements.
64
GCP Applied Technologies Inc.
Consolidated Statements of Comprehensive Income (Loss)
|
Year Ended December 31,
|
|||||||||||
|
(In millions)
|
2019
|
2018
|
2017
|
||||||||
|
Net income
|
$
|
|
|
$
|
|
|
$
|
|
|
||
|
Other comprehensive income (loss):
|
|
|
|||||||||
|
Defined benefit pension and other postretirement plans, net of income taxes
|
(
|
)
|
(
|
)
|
|
|
|||||
|
Currency translation adjustments, net of income taxes
|
|
|
(
|
)
|
|
|
|||||
|
(Loss) gain from hedging activities, net of income taxes
|
(
|
)
|
|
|
(
|
)
|
|||||
|
Total other comprehensive income (loss)
|
|
|
(
|
)
|
|
|
|||||
|
Comprehensive income (loss)
|
|
|
(
|
)
|
|
|
|||||
|
Less: Comprehensive income attributable to noncontrolling interests
|
(
|
)
|
(
|
)
|
(
|
)
|
|||||
|
Comprehensive income (loss) attributable to GCP shareholders
|
$
|
|
|
$
|
(
|
)
|
$
|
|
|
||
The Notes to Consolidated Financial Statements are an integral part of these statements.
65
|
Consolidated Balance Sheets |
|||||||
|
(In millions, except par value and shares)
|
December 31,
2019 |
December 31,
2018 |
|||||
|
ASSETS
|
|||||||
|
Current Assets
|
|||||||
|
Cash and cash equivalents
|
$
|
|
|
$
|
|
|
|
|
Trade accounts receivable (net of allowances of $7.5 million and $5.8 million, respectively)
|
|
|
|
|
|||
|
Inventories, net
|
|
|
|
|
|||
|
Other current assets
|
|
|
|
|
|
||
|
Current assets held for sale
|
|
|
|
|
|||
|
Total Current Assets
|
|
|
|
|
|||
|
Properties and equipment, net
|
|
|
|
|
|||
|
Operating lease right-of-use assets
|
|
|
|
|
|||
|
Goodwill
|
|
|
|
|
|||
|
Technology and other intangible assets, net
|
|
|
|
|
|||
|
Deferred income taxes
|
|
|
|
|
|||
|
Overfunded defined benefit pension plans
|
|
|
|
|
|||
|
Other assets
|
|
|
|
|
|
||
|
Non-current assets held for sale
|
|
|
|
|
|||
|
Total Assets
|
$
|
|
|
$
|
|
|
|
|
LIABILITIES AND STOCKHOLDERS' EQUITY
|
|
|
|||||
|
Current Liabilities
|
|
|
|||||
|
Debt payable within one year
|
$
|
|
|
$
|
|
|
|
|
Operating lease obligations payable within one year
|
|
|
|
|
|||
|
Accounts payable
|
|
|
|
|
|||
|
Other current liabilities
|
|
|
|
|
|||
|
Total Current Liabilities
|
|
|
|
|
|||
|
Debt payable after one year
|
|
|
|
|
|||
|
Operating lease obligations
|
|
|
|
|
|||
|
Income taxes payable
|
|
|
|
|
|||
|
Deferred income taxes
|
|
|
|
|
|||
|
Unrecognized tax benefits
|
|
|
|
|
|||
|
Underfunded and unfunded defined benefit pension plans
|
|
|
|
|
|||
|
Other liabilities
|
|
|
|
|
|||
|
Non-current liabilities held for sale
|
|
|
|
|
|||
|
Total Liabilities
|
|
|
|
|
|||
|
Commitments and Contingencies (Note 12)
|
|
|
|||||
|
Stockholders' Equity
|
|
|
|||||
|
Preferred stock, par value $0.01; authorized: 10,000,000 and 0 shares, respectively; no shares issued or outstanding (Note 13)
|
|
|
|
|
|||
|
Common stock issued, par value $0.01; 300,000,000 shares authorized; outstanding: 72,850,268 and 72,176,324, respectively
|
|
|
|
|
|||
|
Paid-in capital
|
|
|
|
|
|||
|
Accumulated earnings
|
|
|
|
|
|||
|
Accumulated other comprehensive loss
|
(
|
)
|
(
|
)
|
|||
|
Treasury stock
|
(
|
)
|
(
|
)
|
|||
|
Total GCP Stockholders' Equity
|
|
|
|
|
|||
|
Noncontrolling interests
|
|
|
|
|
|||
|
Total Stockholders' Equity
|
|
|
|
|
|||
|
Total Liabilities and Stockholders' Equity
|
$
|
|
|
$
|
|
|
|
The Notes to Consolidated Financial Statements are an integral part of these statements.
66
GCP Applied Technologies Inc.
Consolidated Statements of Stockholders' Equity (Deficit)
|
Common Stock
|
Treasury Stock
|
||||||||||||||||||||||||||||||||
|
(In millions)
|
Number of Shares
|
Par Value
|
Number of Shares
|
Cost
|
Additional Paid-In Capital
|
Accumulated Earnings / (Deficit)
|
Accumulated Other Comprehensive Loss
|
Noncontrolling Interests
|
Total Stockholders' Equity (Deficit)
|
||||||||||||||||||||||||
|
Balance, December 31, 2016
|
|
|
$
|
|
|
|
|
$
|
(
|
)
|
$
|
|
|
$
|
(
|
)
|
$
|
(
|
)
|
$
|
|
|
$
|
(
|
)
|
||||||||
|
Net income
|
—
|
|
—
|
|
—
|
|
—
|
|
—
|
|
|
|
—
|
|
|
|
|
|
|||||||||||||||
|
Issuance of common stock in connection with stock plans(1)
|
|
|
—
|
|
—
|
|
—
|
|
—
|
|
—
|
|
—
|
|
—
|
|
—
|
|
|||||||||||||||
|
Share-based compensation
|
—
|
|
—
|
|
—
|
|
—
|
|
|
|
—
|
|
—
|
|
—
|
|
|
|
|||||||||||||||
|
Exercise of stock options
|
|
|
—
|
|
—
|
|
—
|
|
|
|
—
|
|
—
|
|
—
|
|
|
|
|||||||||||||||
|
Share repurchases(2)
|
—
|
|
—
|
|
—
|
|
(
|
)
|
—
|
|
—
|
|
—
|
|
—
|
|
(
|
)
|
|||||||||||||||
|
Other comprehensive income
|
—
|
|
—
|
|
—
|
|
—
|
|
—
|
|
—
|
|
|
|
—
|
|
|
|
|||||||||||||||
|
Other changes to additional paid in capital(3)
|
—
|
|
—
|
|
—
|
|
—
|
|
|
|
—
|
|
—
|
|
—
|
|
|
|
|||||||||||||||
|
Dividends and other changes in noncontrolling interest
|
—
|
|
—
|
|
—
|
|
—
|
|
—
|
|
—
|
|
—
|
|
(
|
)
|
(
|
)
|
|||||||||||||||
|
Balance, December 31, 2017
|
|
|
$
|
|
|
|
|
$
|
(
|
)
|
$
|
|
|
$
|
|
|
$
|
(
|
)
|
$
|
|
|
$
|
|
|
||||||||
|
Net income
|
—
|
|
—
|
|
—
|
|
—
|
|
—
|
|
|
|
—
|
|
|
|
|
|
|||||||||||||||
|
Issuance of common stock in connection with stock plans(1)
|
|
|
—
|
|
—
|
|
—
|
|
—
|
|
—
|
|
—
|
|
—
|
|
—
|
|
|||||||||||||||
|
Share-based compensation
|
—
|
|
—
|
|
—
|
|
—
|
|
|
|
—
|
|
—
|
|
—
|
|
|
|
|||||||||||||||
|
Exercise of stock options
|
|
|
—
|
|
—
|
|
—
|
|
|
|
—
|
|
—
|
|
—
|
|
|
|
|||||||||||||||
|
Share repurchases(2)
|
—
|
|
—
|
|
|
|
(
|
)
|
—
|
|
—
|
|
—
|
|
—
|
|
(
|
)
|
|||||||||||||||
|
Other comprehensive loss
|
—
|
|
—
|
|
—
|
|
—
|
|
—
|
|
—
|
|
(
|
)
|
—
|
|
(
|
)
|
|||||||||||||||
|
Dividends and other changes in noncontrolling interest
|
—
|
|
—
|
|
—
|
|
—
|
|
—
|
|
—
|
|
—
|
|
(
|
)
|
(
|
)
|
|||||||||||||||
|
Balance, December 31, 2018
|
|
|
$
|
|
|
|
|
$
|
(
|
)
|
$
|
|
|
$
|
|
|
$
|
(
|
)
|
$
|
|
|
$
|
|
|
||||||||
|
Net income
|
—
|
|
—
|
|
—
|
|
—
|
|
—
|
|
|
|
—
|
|
|
|
|
|
|||||||||||||||
|
Issuance of common stock in connection with stock plans(1)
|
|
|
—
|
|
—
|
|
—
|
|
—
|
|
—
|
|
—
|
|
—
|
|
—
|
|
|||||||||||||||
|
Share-based compensation
|
—
|
|
—
|
|
—
|
|
—
|
|
|
|
—
|
|
—
|
|
—
|
|
|
|
|||||||||||||||
|
Exercise of stock options
|
|
|
—
|
|
—
|
|
—
|
|
|
|
—
|
|
—
|
|
—
|
|
|
|
|||||||||||||||
|
Share repurchases(2)
|
—
|
|
—
|
|
|
|
(
|
)
|
—
|
|
—
|
|
—
|
|
—
|
|
(
|
)
|
|||||||||||||||
|
Other comprehensive income
|
—
|
|
—
|
|
—
|
|
—
|
|
—
|
|
—
|
|
|
|
—
|
|
|
|
|||||||||||||||
|
Balance, December 31, 2019
|
|
|
$
|
|
|
|
|
$
|
(
|
)
|
$
|
|
|
$
|
|
|
$
|
(
|
)
|
$
|
|
|
$
|
|
|
||||||||
______________________________
|
(1)
|
|
|
(2)
|
During the years ended December 31, 2019, 2018 and 2017, GCP withheld and retained approximately
|
|
(3)
|
|
The Notes to Consolidated Financial Statements are an integral part of these statements.
67
|
GCP Applied Technologies Inc.
|
|||||||||||
|
Year Ended December 31,
|
|||||||||||
|
(In millions)
|
2019
|
2018
|
2017
|
||||||||
|
OPERATING ACTIVITIES
|
|
||||||||||
|
Net income
|
$
|
|
|
$
|
|
|
$
|
|
|
||
|
Less: Income from discontinued operations
|
|
|
|
|
|
|
|||||
|
Income (loss) from continuing operations
|
|
|
(
|
)
|
(
|
)
|
|||||
|
Reconciliation to net cash provided by (used in) operating activities:
|
|
|
|||||||||
|
Depreciation and amortization
|
|
|
|
|
|
|
|||||
|
Amortization of debt discount and financing costs
|
|
|
|
|
|
|
|||||
|
Unrealized loss on foreign currency
|
|
|
|
|
|
|
|||||
|
Stock-based compensation expense
|
|
|
|
|
|
|
|||||
|
Gain on termination and curtailment of pension and other postretirement benefit plans
|
(
|
)
|
(
|
)
|
(
|
)
|
|||||
|
Currency and other losses in Venezuela
|
|
|
|
|
|
|
|||||
|
Deferred income taxes
|
(
|
)
|
|
|
|
|
|||||
|
Loss on debt refinancing
|
|
|
|
|
|
|
|||||
|
Gain on disposal of property and equipment
|
(
|
)
|
(
|
)
|
(
|
)
|
|||||
|
Loss on sale of product line
|
|
|
|
|
|
|
|||||
|
Changes in assets and liabilities, excluding effect of currency translation:
|
|||||||||||
|
Trade accounts receivable
|
|
|
|
|
(
|
)
|
|||||
|
Inventories
|
|
|
(
|
)
|
(
|
)
|
|||||
|
Accounts payable
|
(
|
)
|
(
|
)
|
|
|
|||||
|
Pension assets and liabilities, net
|
|
|
(
|
)
|
(
|
)
|
|||||
|
Other assets and liabilities, net
|
(
|
)
|
(
|
)
|
|
|
|||||
|
Net cash provided by (used in) operating activities from continuing operations
|
|
|
|
|
(
|
)
|
|||||
|
Net cash used in operating activities from discontinued operations
|
(
|
)
|
(
|
)
|
(
|
)
|
|||||
|
Net cash provided by (used in) operating activities
|
|
|
(
|
)
|
(
|
)
|
|||||
|
INVESTING ACTIVITIES
|
|||||||||||
|
Capital expenditures
|
(
|
)
|
(
|
)
|
(
|
)
|
|||||
|
Businesses acquired, net of cash acquired
|
|
|
(
|
)
|
(
|
)
|
|||||
|
Proceeds from sale of product line
|
|
|
|
|
|
|
|||||
|
Other investing activities
|
|
|
(
|
)
|
|
|
|||||
|
Net cash used in investing activities from continuing operations
|
(
|
)
|
(
|
)
|
(
|
)
|
|||||
|
Net cash (used in) provided by investing activities from discontinued operations
|
(
|
)
|
|
|
|
|
|||||
|
Net cash (used in) provided by investing activities
|
(
|
)
|
(
|
)
|
|
|
|||||
|
FINANCING ACTIVITIES
|
|||||||||||
|
Borrowings under credit arrangements
|
|
|
|
|
|
|
|||||
|
Repayments under credit arrangements
|
(
|
)
|
(
|
)
|
(
|
)
|
|||||
|
Proceeds from issuance of long term note obligations
|
|
|
|
|
|
|
|||||
|
Repayments of long term note obligations
|
|
|
(
|
)
|
|
|
|||||
|
Cash paid for debt financing costs
|
|
|
(
|
)
|
|
|
|||||
|
Payments of tax withholding obligations related to employee equity awards
|
(
|
)
|
(
|
)
|
(
|
)
|
|||||
|
Proceeds from exercise of stock options
|
|
|
|
|
|
|
|||||
|
Noncontrolling interest dividend
|
|
|
(
|
)
|
(
|
)
|
|||||
|
Payments on finance lease obligations
|
(
|
)
|
|
|
|
|
|||||
|
Other financing activities
|
(
|
)
|
|
(
|
)
|
|
|
||||
|
Net cash used in financing activities from continuing operations
|
(
|
)
|
(
|
)
|
(
|
)
|
|||||
|
Net cash provided by financing activities from discontinued operations
|
|
|
|
|
|
|
|||||
|
Net cash used in financing activities
|
(
|
)
|
(
|
)
|
(
|
)
|
|||||
|
Effect of currency exchange rate changes on cash and cash equivalents
|
|
|
(
|
)
|
|
|
|||||
|
(Decrease) increase in cash and cash equivalents
|
(
|
)
|
(
|
)
|
|
|
|||||
|
Cash and cash equivalents, beginning of period
|
|
|
|
|
|
|
|||||
|
Cash and cash equivalents, end of period
|
$
|
|
|
$
|
|
|
$
|
|
|
||
|
Supplemental disclosures of cash flow information:
|
|||||||||||
|
Cash paid for income taxes, net of refunds
|
$
|
|
|
$
|
|
|
$
|
|
|
||
|
Cash paid for interest on note and credit arrangements
|
$
|
|
|
$
|
|
|
$
|
|
|
||
|
Supplemental disclosure of non-cash investing activities:
|
|||||||||||
|
Property and equipment purchases unpaid and included in accounts payable
|
$
|
|
|
$
|
|
|
$
|
|
|
||
The Notes to Consolidated Financial Statements are an integral part of these statements.
68
Notes to Consolidated Financial Statements
1.
Basis of Presentation and Summary of Significant Accounting and Financial Reporting Policies
GCP is engaged in the production and sale of specialty construction chemicals and specialty building materials through
two
operating segments. Specialty Construction Chemicals ("SCC") manufactures and markets concrete admixtures and cement additives and supplies in-transit monitoring systems for concrete producers. Specialty Building Materials ("SBM") manufactures and markets sheet and liquid membrane systems that protect structures from water, air and vapor penetration, fireproofing and other products designed to protect the building envelope.
On July 3, 2017 (the "Closing Date"), GCP completed the sale of its Darex Packaging Technologies ("Darex") business to Henkel AG & Co. KGaA (“Henkel”) for
$
1.06
billion
in cash. As discussed further below under "Discontinued Operations," the results of operations for Darex have been excluded from continuing operations and segment results for all periods presented.
Basis of Presentation
The accompanying Consolidated Financial Statements are presented on a consolidated basis and include all of the accounts and operations of GCP and its majority-owned subsidiaries, except as noted below with respect to the Company's Venezuela subsidiary. All intercompany balances and transactions have been eliminated in consolidation. The financial statements reflect the financial position, results of operations and cash flows of GCP in accordance with generally accepted accounting principles in the United States ("GAAP") and with the instructions to Form 10-K.
Discontinued Operations
On July 3, 2017, the Company completed the sale of Darex to Henkel. In conjunction with this transaction and applicable GAAP, the assets and liabilities related to Darex in the applicable delayed close countries have been reclassified and reflected as held for sale in the Consolidated Balance Sheets as of December 31, 2019 and 2018, as discussed further in Note 21, "Discontinued Operations". Additionally, Darex results of operations and cash flows have been reclassified and reflected as "discontinued operations" in the Consolidated Statements of Operations and Consolidated Statements of Cash Flows for all periods presented.
Deconsolidation of Venezuelan Operations
Prior to July 3, 2017, the Company included the results of its Venezuelan operations (“GCP Venezuela”) in the Consolidated Financial Statements using the consolidation method of accounting. Venezuelan exchange control regulations have resulted in an other-than-temporary lack of exchangeability between the Venezuelan bolivar and U.S. dollar, and have restricted GCP Venezuela’s ability to pay dividends and meet obligations denominated in U.S. dollars. These exchange regulations, combined with other regulations, have constrained availability of raw materials and have significantly limited GCP Venezuela’s ability to maintain normal production. As a result of these conditions, combined with the loss of scale in Venezuela resulting from the sale of the Company’s Darex-related operations and assets in Venezuela, GCP deconsolidated its Venezuelan operations as of July 3, 2017 in accordance with provisions of Financial Accounting Standards Board ("FASB") Accounting Standards Codification ("ASC") 810,
Consolidation
. During the year ended December 31, 2017, GCP recognized a pre-tax loss of
$
36.7
million
which is included in “Loss in Venezuela” in the Consolidated Statements of Operations. The loss is primarily related to the recognition of unfavorable cumulative translation adjustments of
$
33.4
million
associated with the Venezuelan business.
Subsequent to the deconsolidation, the Company began accounting for GCP Venezuela using the cost method of accounting. The Company's financial results no longer include the operating results of GCP Venezuela. The Company records cash and recognizes income from its Venezuelan operations in the Consolidated Financial Statements to the extent GCP is paid for inventory sold to or dividends are received from GCP Venezuela.
69
During 2018, the Company sold its remaining SCC operations within its Venezuela subsidiary. Both the proceeds from the sale and the loss on the sale did not have a material impact to the Consolidated Financial Statements. As of December 31, 2019 and 2018, the remaining operations within GCP Venezuela represent the Darex operations sold to Henkel in January 2020 under a delayed close arrangement. The Company does not expect to record a gain or a loss on the closing of the sale of the Darex business in Venezuela. The remaining investment in GCP Venezuela is classified as held for sale within the Company's Consolidated Balance Sheets as of December 31, 2019 and 2018 and is not material.
Separation from Grace
On January 27, 2016, GCP entered into a separation and distribution agreement pursuant to which W.R. Grace & Co. ("Grace") agreed to transfer its Grace Construction Products operating segment and the packaging technologies business, operated under the “Darex” name, of its Grace Materials Technologies operating segment to GCP (the "Separation"). The Separation occurred on February 3, 2016, by means of a pro rata distribution to Grace stockholders of all of the then-outstanding shares of Company common stock, at which time GCP became an independent public company and its common stock listed and began trading under the symbol "GCP" on the New York Stock Exchange.
Subsequent to the Separation, Grace continued providing to GCP certain general corporate services related to finance, information technology, human resources and other services under a transition services agreement which remained in place for a period of
18
months
from the Separation. During the year ended December 31, 2017, the activities related to the transition services agreement were complete. Please refer to Note 16, "Related Party Transactions and Transactions with Grace" for further information on the transition services agreement between GCP and Grace.
Subsequent to the Separation, Grace no longer represents a related party of the Company. All transactions between GCP and Grace have been included in these Consolidated Financial Statements.
Noncontrolling Interests
GCP conducts certain business through joint ventures with unaffiliated third parties. GCP consolidates the results of joint ventures in which it has controlling financial interest in the Consolidated Financial Statements. GCP reduces its consolidated net income (loss) by the amount of net income (loss) attributable to noncontrolling interests.
Summary of Significant Accounting and Financial Reporting Policies
Use of Estimates
The preparation of financial statements in conformity with GAAP requires management to make estimates and assumptions that affect the reported amount of assets and liabilities, disclosure of contingent assets and liabilities at the date of the Consolidated Financial Statements and the reported amounts of revenues and expenses for the periods presented. The Company assesses the estimates on an ongoing basis and records changes in estimates in the period they occur and become known. Actual results could differ from these estimates.
GCP's accounting measurements that are most affected by management's estimates related to future events are as follows:
|
•
|
Goodwill and indefinite-lived intangible assets, which are subject to an impairment assessment on an annual basis or more frequently if events occur or circumstances change that would more likely than not reduce their fair values below carrying values. Such impairment assessment requires judgment based on market and operational conditions at the time it is conducted since it is based on estimates and assumptions related to determining fair values of reporting units and indefinite-lived intangible assets, including future expected cash flow projections, discount and royalty rates, as well as forecasts of long term sales growth rates (please refer to Note 7, "Goodwill and Other Intangible Assets");
|
|
•
|
Realization values of net deferred tax assets which depend on projections of future taxable income (please refer to Note 9, "Income Taxes");
|
70
|
•
|
Contingent liabilities, which depend on an assessment of the probability of loss occurrence and an estimate of ultimate resolution cost, that may arise from circumstances, such as legal disputes, environmental remediation, product liability claims, material commitments (please refer to Note 12, "Commitments and Contingencies") and income taxes (please refer to Note 9, "Income Taxes");
|
|
•
|
Pension and postretirement liabilities that depend on assumptions regarding participant life spans, future inflation, discount rates and return on plan assets (please refer to Note 10, "Pension Plans and Other Postretirement Benefit Plans");
|
|
•
|
Fair values of assets acquired and liabilities assumed in a business combination recognized based on the purchase method of accounting, including finite-lived intangible assets and their useful lives. Such fair value estimates depend on assumptions related to future expected cash flow projections, customer attrition rates, royalty cost savings, and appropriate discount rates used in computing present values (please refer to Note 20, "Acquisitions and Dispositions"); and
|
|
•
|
Stock-based compensation expense which requires making estimates of fair value of equity awards issued at the grant date, as well as expected forfeiture rates and awards expected to vest. Such estimates require significant judgment since they are based on the assumptions related to participant activity, market results and employee voluntary termination behavior. Additionally, the Company makes estimates related to the likelihood of achieving performance goals for performance-based units (the "PBUs") that vest upon the satisfaction of these goals. PBUs are remeasured during each reporting period based on the expected payout of the award. As a result, stock-based compensation expense related to these awards is subject to volatility until the payout is determined at the end of the performance period (please refer to Note 17, "Stock Incentive Plans").
|
Acquisitions
The Company accounts for business acquisitions that meet the definition of a business combination using the acquisition method of accounting, in accordance with which assets acquired and liabilities assumed are recorded at their respective fair values at the acquisition date. The fair value of the consideration transferred in a business combination, including any contingent consideration, is allocated to the assets acquired and liabilities assumed based on their respective fair values. Goodwill represents excess of the purchase price over the estimated fair values of the assets acquired and liabilities assumed. Acquisitions that do not meet the definition of a business combination are accounted for as asset acquisitions, and the purchase price is allocated to the net assets acquired based on their relative fair values without recognizing goodwill.
Significant judgments are used in determining fair values of assets acquired and liabilities assumed. Fair value and intangible asset useful life determinations are based on, among other factors, estimates of future expected cash flows, customer attrition rates, royalty cost savings, and appropriate discount rates used in computing present values. These judgments may materially impact the estimates used in allocating the purchase price to assets acquired and liabilities assumed, as well as the Company’s current and future operating results. Actual results may vary from these estimates which may result in adjustments to goodwill and acquisition date fair values of assets and liabilities during a measurement period or upon a final determination of asset and liability fair values, whichever occurs first. Adjustments to fair values of assets and liabilities made after the end of the measurement period are recorded within the Company’s operating results.
Operating Segments
GCP reports financial results of each of its operating segments that engage in business activities that generate revenues and expenses. Operating segments represents GCP's operations that engage in business activities for which discrete financial information is available and regularly reviewed by GCP's chief operating decision maker in deciding how to allocate resources and assess the segments' performance.
Cash and Cash Equivalents
Cash and cash equivalents include cash on hand and highly liquid instruments with original maturities of
three
months or less that are readily convertible to known amounts of cash. The recorded amounts are presented at amortized cost within the "Cash and cash equivalents" in the Company's Consolidated Balance Sheets and approximate fair value.
71
Accounts Receivable, Allowance for Doubtful Accounts
Inventories
Inventories are stated at the lower of cost or net realizable value. Costs are determined on a first-in, first-out ("FIFO") basis and include direct and certain indirect costs of materials and production. GCP provides allowances for excess, obsolete or damaged inventories based on their expected selling price, net of completion and disposal costs. Abnormal costs of production are expensed as incurred.
Contract Assets and Contract Liabilities
Costs to Obtain a Contract
Long-Lived Assets
Properties and equipment are stated at cost, net of accumulated depreciation. Depreciation expense for properties and equipment is computed using the straight-line method and charged to results of operations to allocate the cost of the assets over their estimated useful lives. Estimated useful lives for properties and equipment range from: (i)
20
to
40
years for buildings, (ii)
3
to
7
years for information technology equipment, (iii)
3
to
10
years for operating machinery and equipment and (iv)
5
to
10
years for furniture and fixtures. Interest costs are capitalized as part of the historical cost of acquiring properties and equipment that constitute major project expenditures and require a period of time to get them ready for their intended use. Fully depreciated assets are retained in properties and equipment and related accumulated depreciation accounts until they are removed from service. Cost of disposed assets, net of accumulated depreciation, are derecognized upon their retirement or at the time of disposal, and the corresponding amount, net of any proceeds from disposal, is reflected in the Company's results of operations. Costs related to legal obligations associated with asset retirements, such as restoring a site to its original condition, are recognized as liabilities and corresponding assets at amounts equal to the net present value of estimated future cash flows that will be required to settle such liabilities. Capitalized asset costs are depreciated over the related asset's estimated useful life.
72
GCP reviews long-lived assets for impairment whenever events or changes in circumstances indicate that the carrying amount of an asset may not be fully recoverable based on indicators of impairment. For purposes of this test, long-lived assets are grouped with other assets and liabilities at the lowest level for which identifiable cash flows are largely independent of the cash flows of other assets and liabilities. If the Company determines that indicators of potential impairment are present, it assesses the recoverability of a long-lived asset group by comparing the sum of its undiscounted future cash flows to its carrying value. The future cash flow period is based on the future service life of the primary asset within the long-lived asset group. If the carrying value of the long-lived asset group exceeds its future cash flows, the Company determines fair values of the individual net assets within the long-lived asset group to assess for potential impairment. If the aggregate fair values of the individual net assets of the group are less than their carrying values, an impairment loss is recognized for an amount in excess of the group’s aggregate carrying value over its fair value. The loss is allocated to the assets within the group based on their relative carrying values, with no asset reduced below its fair value determined in accordance with an income-based approach utilizing projected discounted cash flows model.
During the years ended
December 31, 2019
,
2018
and
2017
, the Company recorded impairment charges of $
4.3
million
,
$
4.5
million
and
$
1.2
million
, respectively, related to GCP's Restructuring and Repositioning Plans. Please refer to Note 14, "Restructuring and Repositioning Expenses, Asset Impairments " for further information on impairment charges recognized during the years ended
December 31, 2019
,
2018
and
2017
.
73
Lessee Arrangements
Effective January 1, 2019, GCP has adopted FASB issued Accounting Standards Update ("ASU") 2016-02,
Leases (Topic 842).
GCP determines at contract inception whether the contract represents or contains a lease and conveys the right to control the use of an identified asset over a period of time in exchange for consideration. For leases with terms greater than 12 months, the Company recognizes right-of-use assets and lease obligations at the lease commencement date based on a present value of lease payments over the lease term. Lease payments included in the measurement of right-of-use assets and lease obligations consist of: (i) fixed payments, including periodic rent increases and excluding any lease incentives paid or payable to the Company by a lessor, and (ii) certain variable payments that depend on an index or a market rate measured on the commencement date. The Company estimates its incremental borrowing rate based on the remaining lease term and remaining lease payments, as well as other information available at lease commencement since a readily determinable implicit rate is not provided in the Company's leases. The Company has elected to utilize a portfolio approach as it pertains to the application of the appropriate discount rates to its portfolios of leases. The weighted average discount rate for operating leases was
5.33
%
as of
December 31, 2019
. Right-of-use assets for operating leases are initially measured on the lease commencement date and include any initial direct costs incurred, as well as lease obligation amounts, net of any lease incentives received from a lessor. Lease expense for operating leases is recognized on a straight-line basis over the lease term which includes: (i) a non-cancelable term during which the Company has a right to use an underlying asset, (ii) renewal options that extend the lease, are in the control of the lessor and reasonably certain to be exercised, and (iii) options to terminate the lease before the end of its non-cancelable term that are not reasonably certain to be exercised. Variable payments that are excluded from the measurement of right-of-use assets and lease obligations consist primarily of non-lease related services, the Company's proportionate share of operating expenses for the leased facilities and certain payments related to excess mileage and usage charges for the leased vehicles and equipment. Such variable payments are recognized as lease expense in the results of operations when the obligation is incurred. The Company does not record right-of-use assets and lease obligations for leases with an initial term of 12 months or less and recognizes lease expense on a straight-line basis over the lease term. Finance leases are included in "Properties and equipment, net", "Debt payable within one year" and "Debt payable after one year" in the Company's Consolidated Balance Sheets and not material at
December 31, 2019
and
2018
.
Goodwill
Goodwill arises from certain business combinations and represents the excess of a purchase price over the fair value of net tangible and identifiable intangible assets of the businesses acquired. GCP reviews its goodwill for impairment at the reporting unit level on an annual basis, or more often if impairment indicators are present based on events or changes in circumstances indicating that the carrying amount of goodwill may not be fully recoverable. Recoverability is assessed at the reporting unit level which is most directly associated with the business combination that resulted in the recognition of the goodwill. For the purpose of the goodwill impairment assessment based on the provisions of ASC 350,
Intangibles—Goodwill and Other
("ASC 350"), GCP has determined that it has
two
reporting units which are its operating segments.
In accordance with ASC 350, the Company first assesses qualitative factors to determine whether the existence of events or circumstances indicates that it is more likely than not that the fair value of a reporting unit is less than its carrying value. If the Company determines, based on this assessment, that it is more likely than not that the fair value of the reporting unit is less than its carrying value, it performs a quantitative goodwill impairment test by comparing these amounts. If the fair value exceeds the carrying amount, no impairment loss is recognized. However, if the carrying amount of the reporting unit exceeds its fair value, the goodwill of the reporting unit may be impaired. The amount of impairment loss, if any, is measured based upon the implied fair value of goodwill as of the valuation date. Goodwill is deemed to be impaired when its carrying amount exceeds its implied fair value.
74
Fair value of a reporting unit is determined using a combined weighted average of a market-based approach (utilizing fair value multiples of comparable publicly traded companies) and an income-based approach (utilizing discounted projected cash flows model). In applying the income-based approach, the fair value of each reporting unit is determined in accordance with the discounted projected cash flow valuation model based on the estimated projected future cash flows and terminal value discounted at the rate which reflects the weighted average costs of capital. The inputs and assumptions that are most likely to impact the reporting unit's fair value include the discount rate, long-term sales growth rates and forecasted operating margins. In applying the market-based approach, GCP determines the reporting unit’s business enterprise fair value based on inputs and assumptions related to average revenue multiples and earnings before interest, tax, depreciation and amortization multiples derived from its peer group which are weighted and adjusted for size, risk and growth of the individual reporting unit.
Application of the goodwill impairment assessment requires judgment based on market and operational conditions at the time of the evaluation, including management’s best estimates of the reporting unit’s future business activity and the related estimates and assumptions of future cash flows from the assets that include the associated goodwill. Different estimates and assumptions of forecasted long-term sales growth rates, operating margins, future cash flows, weighted average cost of capital discount rate, as well as peer company multiples used in the valuation models could result in different estimates of the reporting unit’s fair value as of each testing date. These periodic evaluations could cause management to conclude that impairment factors exist, requiring an adjustment of these assets to their then-current fair market values. Future business conditions could differ materially from the projections made by management which could result in additional adjustments and impairment charges.
GCP performed its annual impairment test as of October 31, 2019 and 2018 for the
two
reporting units and, based upon the results of the qualitative assessment, determined that it was not likely that their fair values were less than their carrying amounts. As such, the Company did not perform the two-step goodwill impairment test and did not recognize impairment losses as a result of its analyses. If events occur or circumstances change that would more likely than not reduce the fair values of the reporting units below their carrying values, goodwill will be evaluated for impairment between annual tests. There were
no
goodwill impairment charges recognized in any of the periods presented in the Consolidated Statements of Operations.
Indefinite-Lived Intangible Assets
GCP reviews its indefinite-lived intangible assets for impairment annually, or whenever events or changes in circumstances indicate that the carrying amounts may not be fully recoverable. Indefinite-lived intangible assets are tested for impairment by performing either a qualitative evaluation or a quantitative test which requires judgment based on market and operational conditions at the time of the evaluation. GCP first assesses qualitative factors to determine whether the existence of events or circumstances indicates that it is more likely than not that indefinite-lived intangible assets are impaired. If GCP determines, based on this assessment, that it is more likely than not that the assets are impaired, it performs a quantitative impairment test by comparing the assets' fair values with their carrying values. No impairment loss is recognized if the fair values exceed the carrying values. However, if the carrying values of the indefinite-lived intangible assets exceed their fair values, the amount of such excess is recognized as an impairment loss during the period identified and the assets' carrying values are written down to their fair values.
Fair values of the indefinite-lived intangible assets are determined based on a relief-from-royalty valuation method. The inputs and assumptions that are most likely to impact the intangible assets' fair values due to their sensitivity include the discount rate, royalty rate and long-term sales growth rates.
GCP performed its annual impairment assessment related to the indefinite-lived intangible assets as of October 31, 2019 and 2018. The Company determined, based upon the results of the qualitative assessment, that it was not likely that the fair values of the indefinite-lived intangible assets were less than their carrying amounts. As such, it did not perform the quantitative assessment as a part of the impairment test and did not recognize impairment losses as a result of its analysis. If events occur or circumstances change that would more likely than not reduce the fair values of the indefinite-lived intangible assets below their carrying values, the indefinite-lived intangible assets will be evaluated for impairment between annual tests. There were
no
impairment charges recognized during any of the periods presented in the Consolidated Statements of Operations.
75
Income
Tax
As a global enterprise, GCP is subject to a complex array of tax regulations and needs to make assessments of applicable tax law and judgments in estimating its ultimate income tax liability. Income tax expense and income tax balances represent GCP’s federal, state and foreign income taxes as an independent company. GCP files a U.S. consolidated income tax return, along with foreign and state corporate income tax filings, as required. GCP's deferred taxes and effective tax rate may not be comparable to those of historical periods prior to the Separation. Please refer to Note 9, "Income Taxes," for details regarding estimates used in accounting for income tax matters, including unrecognized tax benefits.
Deferred tax assets and liabilities are recognized with respect to the expected future tax consequences of events that have been recorded in the Consolidated Financial Statements. If it is more likely than not that all or a portion of deferred tax assets will not be realized, a valuation allowance is provided against such deferred tax assets. The assessment of realization of deferred tax assets is performed based on the weight of the positive and negative evidence available to indicate whether the asset is recoverable, including tax planning strategies that are prudent and feasible.
Tax benefits from an uncertain tax position are recognized only if it is more likely than not that the tax position will be sustained upon examination by the taxing authorities based on the technical merits of the position. Tax benefits recognized in the financial statements from such a position are measured based on the largest benefit that has a greater than fifty percent likelihood of being realized upon ultimate settlement. GCP evaluates such likelihood based on relevant facts and tax law.
Revenue Recognition
Pension Benefits
GCP's method of accounting for actuarial gains and losses relating to its global defined benefit pension plans is referred to as "mark-to-market accounting." In accordance with mark-to-market accounting, GCP's pension costs consist of two elements: 1) ongoing costs recognized quarterly, which include service and interest costs, expected returns on plan assets and amortization of prior service costs/credits; and 2) mark-to-market gains and losses recognized annually in the fourth quarter resulting from changes in actuarial assumptions, such as discount rates and the difference between actual and expected returns on plan assets. If a significant event occurs, such as a major plan amendment or curtailment, GCP's pension obligations and plan assets would be remeasured at an interim period and the mark-to-market gains or losses on remeasurement would be recognized in that period.
The net periodic pension costs and the defined benefit pension plan obligation are determined based on certain assumptions related to the estimated future benefits that employees earn while providing services, the amount of which cannot be completely determined until the benefit payments cease. Key assumptions used in accounting for employee benefit plans include the discount rate and the expected return on plan assets. Assumptions are determined based on Company data and appropriate market indicators in consultation with third-party actuaries and evaluated each year as of the plans’ measurement date. A change in any of these assumptions would have an effect on net periodic pension costs and the defined benefit pension plan obligation.
76
Stock-Based Compensation Expense
GCP grants equity awards, including stock options, restricted stock units (the "RSUs") and PBUs with market conditions which vest upon the satisfaction of a performance condition and/or a service condition. GCP estimates the fair value of equity awards issued at the grant date. The fair value of the awards is recognized as stock-based compensation expense on a straight line basis, net of estimated forfeitures, for each separately vesting portion of the award over the employee’s requisite service period which may be a stated vesting period during which employees render services in exchange for equity and/or liability instruments of the Company. Estimates related to equity award forfeitures are adjusted to their actual amounts at the end of the vesting period resulting in the recognition of cumulative stock-based compensation expense only for those awards that actually vest.
The fair value of RSUs is determined based on the number of shares granted and the closing market price of the Company’s common stock on the date of grant. The fair value of stock options is determined using the Black-Scholes option-pricing model which incorporates the assumptions related to the risk-free rate, options' expected term, expected stock price volatility and expected dividend yield. The risk-free rate is based on the U.S. Treasury yield curve published as of the grant date, with maturities approximating the expected term of the options. GCP estimates the expected term of the options based on the simplified method in accordance with the provisions of ASC Topic 718-20,
Awards Classified as Equity
, determined as the average term between the options’ vesting period and their contractual term. GCP estimates the expected stock price volatility based on an industry peer group’s historic stock prices over a period commensurate with the options’ expected term. The expected dividend yield is
zero
based on the Company’s history and expectation of not paying dividends on common shares.
During the years ended
December 31, 2019
,
2018
and
2017
, the Company granted performance-based restricted stock units (“PBUs”) to certain key employees. PBUs are performance-based units which are granted by the Company with market conditions. Such PBUs are expected to cliff vest over
three years
and will be settled in GCP common stock. PBUs granted in 2018 and 2017 are based on
3
-year cumulative adjusted diluted earnings per share measure that is modified, up or down, based on the Company's total shareholder return ("TSR") relative to the performance of the Russell 3000 Index. PBUs granted in 2019 are based on a three-year cumulative adjusted diluted earnings per share measure that is modified, up or down, based on the Company's TSR relative to the performance of the Russell 3000 Specialty Chemicals and Building Materials Indices. PBUs are remeasured during each reporting period based on their expected payout which may range between
0
%
to
200
%
based on the achievement of performance targets required for the awards' vesting. Therefore, the stock-based compensation expense recognized for these awards during each reporting period is subject to volatility until the final payout target is determined at the end of the applicable performance period.
PBUs granted during the years ended
December 31, 2019
,
2018
and
2017
were valued using a Monte Carlo simulation, which is commonly used for assessing the grant date fair value of equity awards with a relative TSR modifier. The risk-free rate is a continuous rate based on the U.S. Treasury yield curve published as of the grant date, based on maturity commensurate with the remaining performance period (expected term) of the PBUs. Expected volatility is based on the annualized historical volatility of GCP's stock price. Historical volatility is calculated based on a look-back period commensurate with the remaining performance period of the PBUs, or the longest available based on the Company's trading history as a public company. Correlation coefficients are used in the Monte Carlo valuation to simulate future stock prices. This includes correlations between: (i) the Company's stock price and the Index, and (ii) the stock price of each constituent included in the Index and the Index itself. The correlation coefficient is based on daily stock returns of the Company and the Index using a look-back period commensurate with the remaining performance period of the PBUs, or the longest available based on the Company's trading history as a public company. The expected dividend yield is
zero
based on the Company’s history and expectation of not paying dividends on common shares.
77
Research and Development Expense
Research and development costs are expensed as incurred and consist primarily of personnel expenses related to development of new products and enhancements to existing products. Research and development costs also include depreciation and amortization expenses related to research and development assets and expenses incurred in funding external research projects.
Restructuring and Repositioning Expenses
The Company records restructuring and repositioning expenses associated with the restructuring and repositioning actions approved by the Board of Directors. Restructuring actions are related to streamlining operations and improving profitability. Restructuring expenses generally include severance and other employee-related costs, contract termination costs, asset impairments, facility exit costs, moving and relocation, and other related costs. For the ongoing employee benefit arrangements provided to Company employees, GCP records severance and other employee termination costs associated with restructuring actions when the likelihood of future settlement is probable and the related benefit amounts can be reasonably estimated. For the one-time employee termination benefit arrangements, a liability for the termination benefits is measured at fair value and recognized on the communication date. Asset impairments are recorded in accordance with the Company's accounting policy on Long-Lived Assets described above.
Repositioning activities generally represent major strategic or transformational actions to enhance the value and performance of the Company, improve business efficiency or optimize the Company’s footprint. Repositioning expenses include professional fees for legal, consulting, accounting and tax services, employment-related costs, such as recruitment, relocation and compensation, as well as other expenses incurred that are directly associated with the repositioning activity. Repositioning activities may also include capital expenditures.
Foreign Currency Transactions and Translation
Certain transactions of the Company and its subsidiaries are denominated in currencies other than their functional currency. Foreign currency exchange gains (losses) generated from the settlement and remeasurement of these transactions are recognized in earnings and presented within “Other expenses (income), net” in the Company’s Consolidated Statements of Operations. Net foreign currency transaction and remeasurement gains (losses) reflected in “Other expenses (income), net” for the years ended
December 31, 2019
,
2018
and
2017
were losses of
$
0.3
million
,
$
2.9
million
and
$
1.0
million
, respectively.
Assets and liabilities of foreign subsidiaries are translated into U.S. dollars at current exchange rates, while revenues, costs and expenses are translated at average exchange rates during each reporting period. The resulting currency translation adjustments are included in "Accumulated other comprehensive loss" in the Consolidated Balance Sheets. The financial statements of any subsidiaries located in countries with highly inflationary economies are remeasured based on the currency designated as the functional currency, typically the U.S. dollar. Translation adjustments recognized as a result of such remeasurements are reflected in the results of operations in the Consolidated Statements of Operations.
78
Argentina
As of June 30, 2018, GCP concluded that Argentina is a highly inflationary economy since the three-year cumulative inflation rates commonly used to evaluate Argentina’s inflation currently exceed 100%. As a result, GCP began accounting for its operations in Argentina as a highly inflationary economy. Effective July 1, 2018, the functional currency of the Company's subsidiary operating in Argentina became the U.S. dollar and all remeasurement adjustments after the effective date are reflected in GCP's results operations in the Consolidated Statements of Operations. During each of the years ended December 31,
2019
and
2018
, the Company incurred losses of
$
1.1
million
related to the remeasurement of these monetary net assets which are included in "Other expenses (income), net" in the Consolidated Statements of Operations. Net sales generated by the Argentina subsidiary were not material to the Company's consolidated net sales during the years ended December 31,
2019
and 2018. Monetary net assets denominated in local currency within the Company's Argentina subsidiary were not material to GCP's consolidated total assets as of December 31,
2019
and
2018
.
Venezuela
GCP deconsolidated its Venezuelan operations as of July 3, 2017 and, as a result, the Company's financial results no longer include the operations of GCP Venezuela, including currency translation adjustments, beyond that date.
In May of 2017, the Venezuela government announced that it had completed its first auction under the new floating exchange rate (the "DICOM") mechanism at a rate of
2,010
bolivars per U.S. dollar, an increase of
176.1
%
from the previously published rate of
728
bolivar per U.S. dollar. As a result of the change in the exchange mechanism and devaluation of the bolivar, the Company recorded a foreign exchange remeasurement and impairment loss of
$
7.1
million
, of which
$
2.4
million
was from continuing operations and
$
4.7
million
was from discontinued operations. The loss from continuing operations of
$
2.4
million
consists of
$
1.6
million
included in “Loss in Venezuela” and
$
0.8
million
included in “Cost of goods sold” within the Consolidated Statements of Operations for the year ended December 31, 2017. During the three months ended June 30, 2017, the DICOM rate increased to
2,640
bolivars per U.S. dollar. As a result, the Company recorded a foreign exchange remeasurement loss of
$
1.2
million
during the year ended December 31, 2017, of which
$
0.3
million
was recognized in continuing operations and reflected in “Other expenses (income), net” within the Consolidated Statements of Operations and
$
0.9
million
was recognized in discontinued operations.
Earnings per Share
GCP computes basic earnings (loss) per share by dividing net income (loss) by the weighted average common shares outstanding during the period. Diluted earnings (loss) per share is determined by dividing net income (loss) by diluted weighted average shares outstanding during the period. Diluted weighted average shares reflect the dilutive effect, if any, of potential common shares which consist of employee equity awards. To the extent their effect is dilutive, employee equity awards are included in the calculation of diluted income per share based on the treasury stock method. Potential common shares are excluded from the calculation of dilutive weighted average shares outstanding if their effect would be anti-dilutive at the balance sheet date based on a treasury stock method or due to a net loss.
Reclassifications
Certain amounts in prior period financial statements have been reclassified to conform to the current period presentation. Such reclassifications have not materially affected previously reported amounts.
79
Recently Issued Accounting Standards
Goodwill
In January 2017, the FASB issued ASU 2017-04,
Intangibles—Goodwill and Other (Topic 350)
. The amendments in this update eliminate the requirement to calculate the implied fair value of goodwill (Step 2) when measuring a goodwill impairment loss. An impairment loss will be based on the excess of a reporting unit’s carrying amount over its fair value. The standard is effective for the Company for annual or any interim goodwill impairment tests to be performed beginning on or after January 1, 2020. Early adoption is permitted for interim or annual goodwill impairment tests performed on testing dates after January 1, 2017. GCP is currently evaluating the potential impact of this guidance on its Consolidated Financial Statements and related disclosures, but it does not expect such impact to be material.
Credit Losses
In June 2016, the FASB issued ASU 2016-13,
Financial Instruments- Credit Losses (Topic 326): Measurement of Credit Losses on Financial Instruments.
The amendments in this update introduce a new "expected loss" impairment model which applies to most financial assets measured at amortized cost and certain other instruments, including trade and other receivables, loans, held-to-maturity debt securities and other financial assets. Entities are required to estimate expected credit losses over the life of financial assets at inception and record an allowance against the assets’ amortized cost basis to present them at the amount expected to be collected. Additionally, the guidance amends the impairment model related to available for sale debt securities and requires entities to determine whether all or a portion of the unrealized loss on such debt security is a credit loss. The guidance is effective for fiscal years, and interim periods within those years, beginning after December 15, 2019. Early adoption of the newly issued guidance is permitted for fiscal years, and interim periods within those years, beginning after December 15, 2018. The standard should be applied as a cumulative-effect adjustment to retained earnings as of the beginning of the first reporting period in which the guidance is effective. GCP expects to adopt the guidance effective January 1, 2020. During the year ended December 31, 2019, GCP initiated the data collection initiative and began evaluating the potential impact of adopting the standard on its financial position, results of operations and related disclosures, but has not yet completed such assessment.
Other new pronouncements issued, but not effective until after December 31, 2019 are not expected to have a material impact on the Company's financial position, results of operations or liquidity.
80
Recently Adopted Accounting Standards
Leases
In February 2016, the FASB issued ASU 2016-02,
Leases (Topic 842)
whereas a lessee is required to recognize in the statement of financial position a lease liability related to making lease payments and a right-of-use asset representing its right to control the use of the underlying asset during the lease term, including optional payments that are reasonably certain to occur. The Company adopted Topic 842 effective January 1, 2019 and elected a transition option allowing it to forgo the application of comparative period presentation in the financial statements during the year of adoption. The Company's Consolidated Financial Statements for the year ended December 31, 2019 are presented in accordance with Topic 842, while the comparative periods have not been recast based on the new standard. The Company elected a package of practical expedients allowing it to forgo the reassessment of expired or existing contracts to determine their lease classification, initial direct costs and whether any of such contracts represent or contain leases. The Company also made an accounting policy election to combine lease and non-lease components into a single lease component for each class of underlying assets for the arrangements in which GCP is a lessee, with the exception of a non-lease component related to inventory purchases. The Company separates purchases of raw materials, labor and certain other inventory-related costs from lease components based on their relative standalone values determined based on observable market information. The Company did not elect the hindsight practical expedient related to determining the lease term.
The adoption of Topic 842 related to lease arrangements in which the Company is a lessee resulted in a recognition of operating lease right-of-use assets of
$
40.8
million
and operating lease obligations of
$
40.9
million
as of
January 1, 2019
. The adoption of Topic 842 did not result in significant accounting changes for finance leases which were not material as of January 1, 2019 and December 31, 2019. The adoption of Topic 842 related to lease arrangements in which the Company is a lessee did not have a material impact on the Company's results of operations and cash flows during the year ended December 31, 2019, as described in Note 6, "Lessee Arrangements."
The Company generates revenue from certain sales arrangements within the SCC operating segment related to VERIFI
®
and certain admixture contracts that include lease components, as discussed in Note 2, "Revenue from Lessor Arrangements and Contracts with Customers." Topic 842 provides a practical expedient which allows lessors to combine lease and non-lease components and account for them as one component if they have the same timing and pattern of transfer and the lease component is classified as an operating lease. The combined component is accounted for in accordance with Topic 842 if the lease component is predominant, and in accordance with Topic 606 if the non-lease component is predominant. Lessors are permitted to apply the practical expedient to all existing leases on a retrospective or prospective basis. The Company elected to apply the practical expedient prospectively based on a portfolio approach for certain classes of underlying assets. The Company does not include taxes (i.e. sales, use, value added or some excise taxes) in the contract consideration, variable lease payments or transaction price that are allocated among its products or services. The adoption of Topic 842 for the arrangements in which GCP is a lessor did not have a material impact on the Company's financial position as of December 31, 2019 and its results of operations and cash flows during the period then ended. Please refer to Note 2, "Revenue from Lessor Arrangements and Contracts with Customers" for further information on lease arrangements in which the Company is a lessor.
Derivatives and Hedging
In August 2017, the FASB issued ASU 2017-12,
Derivatives and Hedging (Topic 815).
The amendments in this update improve the financial reporting of hedging relationships to better portray the economic results of an entity's risk management activities in its financial statements by expanding and refining hedge accounting for both non-financial and financial risk components and aligning the recognition and presentation of the effects of the hedging instrument and the hedged item in the financial statements. GCP adopted the standard effective January 1, 2019. The standard did not have a material impact on the Company's financial position and its results of operations and cash flows upon adoption.
81
Revenue from Contracts with Customers
In May 2014, the FASB issued ASU 2014-09,
Revenue from Contracts with Customers (Topic 606).
GCP has adopted Topic 606 effective January 1, 2018 using the modified retrospective approach in accordance with which GCP has elected to apply the guidance to all open contracts that are not completed or that are active as of January 1, 2018 and not to retrospectively restate any of its contracts for modifications that occurred prior to the date of the adoption. Accordingly, such modifications are reflected in the amounts reported for satisfied and unsatisfied performance obligations, transaction price of such performance obligations, and allocations of the transaction price among contract components, as of the date of the initial application. The impact of applying this practical expedient was immaterial to the Company’s Consolidated Financial Statements.
The impact of the adoption of Topic 606 on the Company's net sales, income (loss) from continuing operations before income taxes, and income (loss) from continuing operations was immaterial for the year ended December 31, 2018. The cumulative impact on the Company's retained earnings at January 1, 2018 was also not material. Please refer to Note 2, "Revenue from Lessor Arrangements and Contracts with Customers" for further information on the Company's revenue recognition policies.
Stock Compensation
In May 2017, the FASB issued ASU 2017-09,
Compensation—Stock Compensation (Topic 718),
which provides guidance related to the changes to the terms or conditions of a share-based payment award that require an application of modification accounting pursuant to Topic 718. GCP adopted the standard effective January 1, 2018. Such adoption did not have a material impact on its financial position as of December 31, 2018 and results of operations for the year then ended.
Business Combinations
In January 2017, the FASB issued ASU 2017-01,
Business Combinations (Topic 805): Clarifying the Definition of a Business
, which clarifies the definition of a business when evaluating whether transactions should be accounted for as acquisitions (or disposals) of assets or business combinations. The amendments in this update indicate that the transaction does not meet a definition of a business if substantially all of the fair value of the gross assets acquired is concentrated in a single identifiable asset or a group of similar identifiable assets. If the threshold is not met, entities need to evaluate whether the set of assets and activities acquired meets the definition of a business and includes, at a minimum, an input and a substantive process that together significantly contribute to the entity's ability to create outputs. The standard should be adopted prospectively and is effective for the Company as of January 1, 2018, with early adoption permitted for certain transactions. GCP elected the early adoption of this standard during the year ended December 31, 2017 in conjunction with its acquisition of Stirling Lloyd Plc. Please refer to Note 20, "Acquisitions and Dispositions" for further information on this transaction.
Statement of Cash Flows
In August 2016, the FASB issued ASU 2016-15,
Statement of Cash Flows (Topic 230): Classification of Certain Cash Receipts and Payments,
which addresses a number of specific cash flow presentation issues with the objective of reducing existing diversity in practice. GCP adopted the standard effective January 1, 2018 and classified within the cash flows from financing activities a
$
53.3
million
payment related to the redemption premium on the extinguishment of its
9.5
%
Senior Notes, consistent with the provisions of the guidance. Such payment was included in "Repayments of long term note obligations" in the Consolidated Statements of Cash Flows. Please refer to Note 8, "Debt and Other Borrowings" for further discussion of this transaction. There was no other material impact on the Company's Consolidated Statements of Cash Flows for the year ended December 31, 2018 as a result of the standard adoption.
82
Income Taxes
2.
Revenue from Lessor Arrangements and Contracts with Customers
Short-Term Arrangements
The majority of the Company’s revenue is generated from short-term arrangements associated with the production and sale of concrete admixtures and cement additives within its SCC operating segment, as well as sheet and liquid membrane systems and other specialty products designed to protect the building envelope within its SBM operating segment. The products sold are priced based on the costs of producing goods and the value delivered to the customer. In these arrangements, the customer generally pays GCP for the contract price agreed upon within a short period of time, which is between
thirty
and
sixty days
. For such arrangements, the transfer of control takes place at a point in time when products are shipped to the customer. The evaluation of transfer of control for these goods does not involve significant judgment. Revenue from these contracts with customers is therefore typically recognized upon shipment of the product or delivery at the customer’s site depending on the shipping terms, provided the transaction price can be estimated appropriately and the Company expects to collect the consideration to which it is entitled in exchange for the products it ships.
The Company generates revenue from short-term arrangements within its SCC operating segment which involve selling concrete admixtures and providing dispensers to customers. GCP has determined at contract inception that the dispensers represent a lease since the customer has the right to control the use of the dispensers over a period of time in exchange for consideration. The Company has elected to apply the practical expedient to the dispenser asset class and combine lease and non-lease components related to dispenser maintenance services. Such components will be accounted for as one component since they have the same timing and pattern of transfer and the lease component is classified as an operating lease. The combined component is accounted for in accordance with Topic 842 since the lease component is predominant. Concrete admixtures sold as a part of these arrangements represent a separate non-lease component which does not get combined with the lease component since it does not meet the defined criteria. The Company allocates contract consideration between the lease component and concrete admixtures based on their relative stand-alone selling prices determined based on a cost plus a reasonable margin approach for the lease component and standalone selling prices for the concrete admixtures. The Company recognizes revenue for the concrete admixtures at a point of time when the control is transferred to the customer. The lease component is considered to have a short non-cancelable lease term which is generally
thirty days
or less and classified as an operating lease. The Company recognizes revenue for the lease component on a straight line basis over the lease term. GCP records dispensers as fixed assets and depreciates them over their estimated useful life of
10
years
.
Long-Term Arrangements
The Company generates revenue from long-term arrangements within its SCC operating segment, which generally consist of VERIFI
®
and Ductilcrete sales arrangements.
83
VERIFI
®
sales arrangements involve installing equipment on the customers’ trucks and at their plants, as well as performing slump management and truck location tracking services. The Company has determined at contract inception that the installed equipment represents a lease since the customer has the right to control the equipment use over a period of time in exchange for consideration. Slump management and truck location tracking services represent a non-lease component. The Company classifies these leases as operating and accounts for the lease and the non-lease components separately since it did not elect to apply the practical expedient to combine lease and non-lease components for the VERIFI
®
equipment asset class. Contract consideration for VERIFI
®
sales arrangements consists primarily of fixed installation fees and other fixed payments and gets allocated between the lease and non-lease components based on valuation techniques that estimate a relative stand-alone selling price of each component. The Company recognizes revenue for the lease component on a straight line basis over the lease term. VERIFI
®
equipment is recorded within "Properties and equipment, net" in the Consolidated Balance Sheets and depreciated over an estimated useful life of
7
years
. The services included within the non-lease component represent the Company’s stand-ready promise to perform a series of daily distinct services, which is combined into a single performance obligation. The Company recognizes revenue associated with such services over time since the customer simultaneously receives and consumes the benefits provided by such services. The transaction price in a VERIFI
®
sales arrangement consists of fixed installation fees and other fixed payments included in the contract consideration, as well as slump management fees which are dependent on the quantity of material poured and represent variable consideration. The Company excludes variable consideration from the contract consideration at lease commencement and allocates it between the lease and non-lease components based on their relative stand-alone selling prices. Revenue related to variable consideration for the lease and non-lease components is recorded at the time of the transfer of services to its customers, which is constrained by the amount for which a significant revenue reversal is not probable to occur. Revenue generated from VERIFI
®
sales arrangements represented less than
10
%
of the Company's consolidated revenue during the years ended
December 31, 2019
and 2018.
Ductilcrete sales arrangements include licenses without significant standalone functionality and usage fees received upfront, both of which represent separate performance obligations for which revenue is recognized over the period of related services. Additional performance obligations included in these arrangements are related to other fees and product sales for which revenue is recognized at a point in time once such performance obligations are satisfied. Revenue generated from Ductilcrete sales arrangements represented less than
10
%
of the Company's consolidated revenue during the years ended
December 31, 2019
and 2018.
The Company's revenue is principally recognized as goods and services are delivered and performance obligations are satisfied upon delivery. The Company has certain long-term arrangements resulting in remaining obligations for which the work has not been performed or has been partially performed. As of December 31, 2019, the aggregate amount of transaction price allocated to remaining performance obligations was
$
6.9
million
, including the estimated transaction price to be earned as revenue over the remaining term of these contracts, which is generally
one to five years
.
Lease elements within sales arrangements
Certain sales arrangements within the SCC operating segment related to certain admixture contracts and VERIFI
®
include lease components, as discussed above.
84
The following table summarizes the revenue recognized for these sales arrangements for the years ended December 31, 2019 and 2018 and distinguishes between the lease and non-lease components:
|
Year Ended December 31,
|
|||||||
|
(In millions)
|
2019
|
2018
|
|||||
|
Lease revenue
(1)
:
|
|||||||
|
Lease payments revenue
|
$
|
|
|
$
|
|
|
|
|
Variable lease revenue
|
|
|
|
|
|||
|
Total lease revenue
|
$
|
|
|
$
|
|
|
|
|
Service revenue
(2)
:
|
|||||||
|
Fixed installation revenue
|
$
|
|
|
$
|
|
|
|
|
Variable revenue
|
|
|
|
|
|||
|
Total service revenue
|
$
|
|
|
$
|
|
|
|
|
Total revenue
|
$
|
|
|
$
|
|
|
|
________________________________
|
(1)
|
Lease revenue consists of dispensers lease revenue, as well as an allocated portion of VERIFI® fixed fees and variable slump management fees. Lease revenue is included within "Net Sales" in the Consolidated Statements of Operations.
|
|
(2)
|
Service revenue consists of an allocated portion of VERIFI® fixed fees and variable slump management fees. Service revenue is included within "Net Sales" in the Consolidated Statements of Operations.
|
As of
December 31, 2019
and
2018
, the Company’s total trade accounts receivable balance was
$
183.7
million
and $
198.6
million
, respectively, of which
$
5.6
million
and
$
4.7
million
, respectively, was related to trade accounts receivable associated with lease revenue generated from certain SCC contracts.
The future minimum lease payments receivable under the operating leases were not material as of December 31, 2019.
Other revenue considerations
The Company generally provides warranties that its products will function as intended. GCP accrues a general warranty liability at the time of sale based on historical experience and on a transaction-specific basis according to individual facts and circumstances.
The Company accepts returns for certain products sales. These returns are at the discretion of the Company and typically are granted only within
six months
from the date of sale. GCP records these returns at the time of the sale based on historical experience and recognizes them as a reduction of transaction price.
Certain long-term agreements with customers may include one-time, upfront payments made to customers. GCP defers these costs and recognizes them as assets which get amortized over the term of the agreement as a reduction of gross sales.
Certain customer arrangements include conditions for volume rebates. GCP records a rebate allowance and reduces transaction price for anticipated selling price adjustments at the time of sale. GCP regularly reviews and estimates rebate accruals based on actual and anticipated sales patterns. The Company also evaluates contracts with customers that contain early payment discounts and reduces transaction price by the amount not expected to be collected due to such discounts in any given period.
85
3.
Inventories, net
The following is a summary of inventories presented in the Consolidated Balance Sheets at
December 31, 2019
and
December 31, 2018
:
|
December 31,
|
|||||||
|
(In millions)
|
2019
|
2018
|
|||||
|
Raw materials
|
$
|
|
|
$
|
|
|
|
|
In process
|
|
|
|
|
|||
|
Finished products and other
|
|
|
|
|
|||
|
Total inventories
|
$
|
|
|
$
|
|
|
|
The "Finished products and other" category presented in the table above includes "other" inventories, which consist of finished products purchased rather than produced by GCP of
$
10.6
million
and
$
12.9
million
, respectively, as of
December 31, 2019
and
December 31, 2018
.
4.
Derivative Instruments
The Company uses derivative instruments to partially offset its business exposure to foreign currency risk on net investments in certain foreign subsidiaries. The Company may choose not to hedge certain exposures for a variety of reasons including, but not limited to, accounting considerations or significant economic cost of hedging particular exposures. To protect the net investment in a foreign operation from fluctuations in foreign currency exchange rates, the Company may enter into foreign currency forward contracts to offset a portion of the changes in the carrying amounts of these investments due to fluctuations in foreign currency exchange rates.
During the year ended December 31, 2019, the Company entered into
four
forward contracts with an aggregate notional amount of
€
40.0
million
to hedge foreign currency exposure on net investments in certain of its European subsidiaries whose functional currency is the Euro. These forward contracts are designated as hedging instruments and recognized at fair value as assets or liabilities in the Consolidated Balance Sheets. Each contract has a notional amount of
€
10.0
million
and matures annually starting on June 15, 2020 through June 13, 2023. The contracts will settle in US Dollars upon maturity.
The forward contracts are designated and qualify as net investment hedges. The Company made an accounting policy election to assess effectiveness for its net investment hedges based on the spot rate method. With the spot rate method, changes in hedge fair values attributable to the differences between the forward rate and the spot rate at inception are excluded from the effectiveness assessment. The initial value of such amounts is measured at contract inception and recognized in earnings within “Other expenses (income), net” in the Consolidated Statements of Operations, consistent with the Company's accounting policy election to amortize it on a straight-line basis over the hedging instruments' contractual term. The change in the fair value of the net investment hedges included in their effectiveness assessment is recognized within "Currency Translation Adjustments, Net of Income Taxes" of Other Comprehensive Income (Loss) until the hedged net investments in foreign operations are sold or substantially liquidated.
The following table summarizes the fair value of the Company’s derivative instruments designated as net investment hedges as of
December 31, 2019
:
|
(In millions)
|
December 31, 2019
|
|||
|
Derivative asset
(1)
:
|
||||
|
Foreign exchange forward contracts
|
$
|
|
|
|
|
(1)
|
The fair value of derivative instruments is measured based on expected future cash flows discounted at market interest rates using observable market inputs and classified as Level 2 within the fair value hierarchy. Fair value of derivative assets is recorded within "Other Current Assets" and "Other Assets" in the Consolidated Balance Sheets.
|
86
The following table summarizes the amounts recorded in the Company's Consolidated Statements of Operations and Consolidated Statements of Comprehensive Income (Loss) related to forward contracts designated as net investment hedges for the year ended December 31,
2019
:
|
Year Ended December 31,
|
|||||||
|
(In millions)
|
2019
|
||||||
|
Other expenses (income), net
|
Currency Translation Adjustments
(1)
|
||||||
|
Gain on foreign exchange forward contracts
|
$
|
|
|
$
|
|
|
|
__________________________
|
(1)
|
The amount is presented net of tax liability of
$
|
5.
Properties and Equipment
The following is a summary of properties and equipment presented in the Consolidated Balance Sheets at
December 31, 2019
and
December 31, 2018
:
|
|
December 31,
|
||||||
|
(In millions)
|
2019
|
2018
|
|||||
|
Land
|
$
|
|
|
$
|
|
|
|
|
Buildings
|
|
|
|
|
|||
|
Machinery, equipment and other
|
|
|
|
|
|||
|
Information technology and equipment
|
|
|
|
|
|||
|
Projects under construction
|
|
|
|
|
|||
|
Properties and equipment, gross
|
|
|
|
|
|||
|
Accumulated depreciation
|
(
|
)
|
(
|
)
|
|||
|
Properties and equipment, net
|
$
|
|
|
$
|
|
|
|
6.
Lessee Arrangements
The Company leases manufacturing and office facilities, as well as certain vehicles and equipment, under operating leases. Certain manufacturing facilities are leased under land and building lease arrangements where lease terms as of
December 31, 2019
consist of a remaining non-cancelable lease term of up to
7.7
years
and renewal options that are reasonably certain to be exercised for an additional term of up to
18.6
years
. The weighted average remaining lease term for operating leases was
13.5
years
as of
December 31, 2019
. During the year ended December 31, 2019, the Company reassessed a lease term for one of its office facilities since it was no longer reasonably certain that the lease will be extended beyond its non-cancelable term ending on September 30, 2020. The lease liability and the right-of-use asset were each decreased by
$
4.2
million
due to the lease term decrease of
30.8
years
. As of December 31, 2019, the lease liability was valued at
$
0.1
million
and the right-of-use asset was valued at
$
0.2
million
following the lease term reassessment.
87
The following table summarizes components of lease expense for the year ended
December 31, 2019
:
|
Year Ended December 31,
|
|||
|
(In millions)
|
2019
|
||
|
Operating lease expense
|
$
|
|
|
|
Variable lease expense
|
|
|
|
|
Short-term lease expense
|
|
|
|
|
Total lease expense
|
$
|
|
|
The following table summarizes lease liability maturities as of December 31, 2019:
|
(In millions)
|
Amount
|
|||
|
2020
|
$
|
|
|
|
|
2021
|
|
|
||
|
2022
|
|
|
||
|
2023
|
|
|
||
|
2024
|
|
|
||
|
Thereafter
|
|
|
||
|
Total undiscounted lease payments
|
|
|
||
|
Less: imputed interest
|
(
|
)
|
||
|
Present value of lease payments
|
$
|
|
|
|
|
Less: operating lease obligations payable within one year
|
(
|
)
|
||
|
Long-term operating lease obligations
|
$
|
|
|
|
The following table summarizes supplemental cash flow information related to leases during the year ended December 31, 2019:
|
(In millions)
|
Amount
|
||
|
Cash paid for amounts included in the measurement of lease liabilities:
|
|||
|
Operating cash flows from operating leases
|
$
|
|
|
|
Operating lease right of use assets obtained in exchange for new lease obligations:
|
|||
|
Upon adoption of Topic 842, as of January 1, 2019
|
$
|
|
|
|
During the remainder of 2019
|
|
|
|
|
Total
|
$
|
|
|
As of December 31, 2018, future minimum noncancelable payments for operating leases are as follows:
|
(In millions)
|
||||
|
Year ending December 31,
|
Amount
|
|||
|
2019
|
$
|
|
|
|
|
2020
|
|
|
||
|
2021
|
|
|
||
|
2022
|
|
|
||
|
2023
|
|
|
||
|
Thereafter
|
|
|
||
|
Total
|
$
|
|
|
|
GCP's rent expense for operating leases was
$
14.3
million
and
$
15.1
million
, respectively, during the years ended December 31,
2018
and
2017
.
88
7.
Goodwill and Other Intangible Assets
Goodwill
The carrying amount of goodwill attributable to each operating segment and the changes in those balances during the years ended
December 31, 2019
and
2018
, are as follows:
|
(In millions)
|
SCC
|
SBM
|
Total
GCP |
||||||||
|
Balance, December 31, 2017
|
$
|
|
|
$
|
|
|
$
|
|
|
||
|
Foreign currency translation
|
(
|
)
|
(
|
)
|
(
|
)
|
|||||
|
Acquisitions
|
|
|
|
|
|
|
|||||
|
Balance, December 31, 2018
|
$
|
|
|
$
|
|
|
$
|
|
|
||
|
Foreign currency translation
|
(
|
)
|
|
|
|
|
|||||
|
Balance, December 31, 2019
|
$
|
|
|
$
|
|
|
$
|
|
|
||
Other Intangible Assets
As of
December 31, 2019
and
2018
, technology and other intangible assets of
$
80.7
million
and
$
89.0
million
, respectively, consisted of finite-lived intangible assets of
$
76.5
million
and
$
85.1
million
, respectively, and indefinite-lived intangible assets of
$
4.2
million
and
$
3.9
million
, respectively.
The following is a summary of the finite-lived intangible assets presented in the Consolidated Balance Sheets as of
December 31, 2019
and
2018
:
|
|
December 31, 2019
|
December 31, 2018
|
|||||||||||||||||||||
|
(In millions)
|
Gross Carrying
Amount
|
Accumulated
Amortization
|
Net Book Value
|
Gross Carrying
Amount |
Accumulated
Amortization |
Net Book Value
|
|||||||||||||||||
|
Customer relationships
|
$
|
|
|
$
|
|
|
$
|
|
|
$
|
|
|
$
|
|
|
$
|
|
|
|||||
|
Technology
|
|
|
|
|
|
|
|
|
|
|
|
|
|||||||||||
|
Trademarks
|
|
|
|
|
|
|
|
|
|
|
|
|
|||||||||||
|
Other
|
|
|
|
|
|
|
|
|
|
|
|
|
|||||||||||
|
Total
|
$
|
|
|
$
|
|
|
$
|
|
|
$
|
|
|
$
|
|
|
$
|
|
|
|||||
Total indefinite-lived intangible assets consisted of purchased technology, trademarks and trade names, as well as in-process research and development assets and amounted to
$
4.2
million
and
$
3.9
million
, respectively, at
December 31, 2019
and
2018
. During the year ended December 31, 2018, the in-process research and development assets of
$
1.5
million
were reclassified into amortizable technology intangible assets since the related research and development activities were completed. Please refer to Note 20, "Acquisitions and Dispositions" for further information on the intangible assets and goodwill acquired during the year ended December 31,
2018
.
Amortization expense related to finite-lived intangible assets was
$
9.5
million
,
$
9.5
million
and
$
6.4
million
, respectively, for the years ended December 31,
2019
,
2018
and
2017
.
89
As of
December 31, 2019
, the estimated future annual amortization expense for intangible assets is as follows:
|
(In millions)
|
Amount
|
||
|
Year ending December 31,
|
|||
|
2020
|
$
|
|
|
|
2021
|
|
|
|
|
2022
|
|
|
|
|
2023
|
|
|
|
|
2024
|
|
|
|
|
Thereafter
|
|
|
|
|
Total
|
$
|
|
|
8.
Debt and Other Borrowings
Components of Debt
The following is a summary of obligations related to the senior notes and other borrowings at
December 31, 2019
and
December 31, 2018
:
|
Year Ended December 31,
|
|||||||
|
(In millions)
|
2019
|
2018
|
|||||
|
5.5% Senior Notes due in 2026, net of unamortized debt issuance costs of $3.9 million and $4.4 million, respectively, at December 31, 2019 and 2018
|
$
|
|
|
$
|
|
|
|
|
Revolving credit facility due in 2023(1)
|
|
|
|
|
|||
|
Other borrowings(2)
|
|
|
|
|
|||
|
Total debt
|
|
|
|
|
|||
|
Less debt payable within one year
|
|
|
|
|
|||
|
Debt payable after one year
|
$
|
|
|
$
|
|
|
|
|
Weighted average interest rates on total debt obligations outstanding
|
|
%
|
|
%
|
|||
|
(1)
|
Represents borrowings under the Revolving Credit Facility with an aggregate principal amount of
$
|
|
(2)
|
Represents borrowings of $
|
The principal maturities of debt obligations outstanding, net of debt issuance costs, were as follows at
December 31, 2019
:
|
(In millions)
|
|||
|
Year ending December 31,
|
Amount
|
||
|
2020
|
$
|
|
|
|
2021
|
|
|
|
|
2022
|
|
|
|
|
2023
|
|
|
|
|
2024
|
|
|
|
|
Thereafter
|
|
|
|
|
Total debt
|
$
|
|
|
90
Debt Refinancing
On
April 10, 2018
, GCP redeemed its then existing
9.5
%
Senior Notes with an aggregate principal amount of
$
525.0
million
due in 2023 (the “
9.5
%
Senior Notes”). On April 10, 2018, the Company also issued
5.5
%
Senior Notes with an aggregate principal amount of
$
350.0
million
maturing on April 15, 2026 (the "
5.5
%
Senior Notes") and amended its Credit Agreement to, among other things, (i) increase the aggregate principal amount available under its revolving credit facility to
$
350.0
million
, (ii) extend the maturity date of the revolving credit facility thereunder to April 2023 and (iii) make certain other changes to the covenants and other provisions therein. Additionally, on April 10, 2018, the Company borrowed
$
50.0
million
in aggregate principal amount of revolving loans under the Credit Agreement which was fully repaid during the three months ended June 30, 2018. The aggregate cash payment of
$
587.9
million
, which consisted of: (i) proceeds of
$
350.0
million
from the issuance of the
5.5
%
Senior Notes, net of loan origination fees of
$
3.1
million
, (ii) borrowings of
$
50.0
million
under the Credit Agreement, and (iii) a cash payment of
$
191.0
million
was used to redeem all of the then outstanding
9.5
%
Senior Notes in accordance with the terms of the indenture governing the
9.5
%
Senior Notes.
The redemption of the
9.5
%
Senior Notes was accounted for as a debt extinguishment in accordance with provisions of ASC Topic 470-50,
Debt Modifications and Extinguishments
. During the year ended December 31, 2018, GCP recognized a loss on debt extinguishment of
$
59.4
million
which was included in "Interest expense and related financing costs" in the Consolidated Statements of Operations. In connection with the redemption of the
9.5
%
Senior Notes with then outstanding principal balance of
$
525.0
million
, GCP paid total cash proceeds of
$
587.9
million
, including
$
53.3
million
of a redemption premium and
$
9.6
million
of accrued interest unpaid thereon through the redemption date, and wrote off
$
6.1
million
of previously deferred debt issuance costs.
The amendment to the Credit Agreement among GCP and a syndicate of financial institutions resulted in an increase in a maximum borrowing capacity under the Revolving Credit Facility from
$
250.0
million
to
$
350.0
million
and extension of its maturity date to April 2023. During the year ended December 31, 2018, GCP wrote off
$
0.4
million
of deferred debt issuance costs related to a financial institution that exited the syndicate upon amendment of the Credit Agreement. As of December 31, 2018, debt issuance costs of
$
4.3
million
related to the financial institutions that remained in the syndicate are presented within "Other assets" in the Consolidated Balance Sheets and amortized over the term of the Revolving Credit Facility.
The total loss recognized on the debt refinancing transaction was
$
59.8
million
which was included in "Interest expense and related financing costs" in the Consolidated Statements of Operations and consisted of
$
59.4
million
related to the extinguishment of the
9.5
%
Senior Notes and
$
0.4
million
related to a deferred issuance costs write-off in connection with the amendment of the Credit Agreement.
On April 10, 2018, GCP issued
5.5
%
Senior Notes with an aggregate principal amount of
$
350.0
million
maturing on April 15, 2026. The
5.5
%
Senior Notes were issued at
$
346.9
million
, or
99.1
%
of their par value, resulting in a discount of
$
3.1
million
, or
0.9
%
, which represented loan origination fees paid at the closing. The Company incurred additional deferred financing costs of
$
1.6
million
related to the issuance. Interest is payable semi-annually in arrears on April 15 and October 15 of each year, which commenced on October 15, 2018.
The
5.5
%
Senior Notes were issued pursuant to an Indenture (the “Indenture”), by and among GCP, the guarantors party thereto (the “Note Guarantors”) and Wilmington Trust, National Association, as trustee. The
5.5
%
Senior Notes and the related guarantees rank equally with all of the existing and future unsubordinated indebtedness of GCP and the Note Guarantors and senior in right of payment to any existing and future subordinated indebtedness of GCP and the Note Guarantors. The
5.5
%
Senior Notes and related guarantees are effectively subordinated to any secured indebtedness of GCP or the Note Guarantors, as applicable, to the extent of the value of the assets securing such indebtedness and structurally subordinated to all existing and future indebtedness and other liabilities of GCP’s non-guarantor subsidiaries.
91
Subject to certain conditions stated in the Indenture, GCP may, at its option and at any time and from time to time prior to April 15, 2021, redeem the
5.5
%
Senior Notes in whole or in part at a redemption price equal to: (i)
100
%
of their principal amount redeemed, plus (ii) the applicable premium, as defined in the Indenture, plus (iii) accrued and unpaid interest, if any, to, but excluding, the applicable redemption date. In addition, GCP may, at its option, redeem up to
40
%
of the outstanding principal amount of the
5.5
%
Senior Notes at any time and from time to time prior to April 15, 2021 with the net cash proceeds from certain equity offerings at a redemption price equal to: (i)
105.5
%
of the principal amount redeemed, plus (ii) accrued and unpaid interest, if any, to, but excluding, the applicable redemption date. At any time and from time to time on or after April 15, 2021, GCP may, at its option, redeem the
5.5
%
Senior Notes in whole or in part at the redemption price equal: (i)
102.8
%
of the par value if redeemed after April 15, 2021, (ii)
101.4
%
of the par value if redeemed after April 15, 2022, and (iii)
100.0
%
of the par value if redeemed after April 15, 2023 and thereafter. Upon occurrence of a change of control, as defined in the Indenture, GCP will be required to make an offer to repurchase the
5.5
%
Senior Notes at a price equal to
101.0
%
of their aggregate principal amount repurchased plus accrued and unpaid interest, if any, to, but excluding, the date of repurchase.
The Indenture contains covenants that limit the ability of GCP and its subsidiaries, subject to certain exceptions and qualifications set forth therein, to (i) create or incur liens on certain assets, (ii) incur additional debt, (iii) make certain investments and acquisitions, (iv) consolidate, merge, or convey, transfer, or lease all or substantially all of their assets, (v) sell certain assets, (vi) pay dividends on or make distributions in respect of GCP’s capital stock or make other restricted payments, (vii) enter into certain transactions with GCP’s affiliates and (viii) place restrictions on distributions from and other actions by subsidiaries. As of
December 31, 2019
and 2018, the Company was in compliance with all covenants and conditions under the Indenture.
The Indenture provides for customary events of default which are subject in certain cases to customary grace periods and include, among others: (i) nonpayment of principal or interest, (ii) breach of other agreements in the Indenture, (iii) failure to pay certain other indebtedness, (iv) certain events of bankruptcy or insolvency, (v) failure to discharge final judgments aggregating in excess of
$
50.0
million
rendered against GCP or certain of its subsidiaries, (vi) and failure of the guarantee of the
5.5
%
Senior Notes by any of GCP’s significant subsidiaries to be in full force and effect. There are no events of default under the Indenture as of
December 31, 2019
and 2018.
Credit Agreement
On February 3, 2016, GCP entered into a Credit Agreement that provides for senior secured credit facilities (the “Credit Facilities”) in an aggregate principal amount of
$
525.0
million
, which consisted of: (i) the term loan (the "Term Loan") with an aggregate principal amount of
$
275.0
million
and (ii) a revolving credit facility (the "Revolving Credit Facility") of
$
250.0
million
due in 2021. During 2017, the Company fully repaid the outstanding principal balance on the Term Loan together with accrued and unpaid interest and extinguished the Term Loan under the Credit Agreement.
On April 10, 2018, GCP entered into an amendment to its Credit Agreement and borrowed
$
50.0
million
in aggregate principal amount of revolving loans under the Credit Agreement, as discussed above, which was fully repaid during the three months ended June 30, 2018.
92
The Credit Agreement contains conditions that would require mandatory principal payments in advance of the maturity date of the Revolving Credit Facility, as well as certain customary affirmative and negative covenants and events of default. Customary affirmative covenants include, but are not limited to (i) maintenance of legal existence and compliance with laws and regulations; (ii) delivery of consolidated financial statements and other information; (iii) payment of taxes; (iv) delivery of notices of defaults and certain other material events; and (v) maintenance of adequate insurance. Customary negative covenants include, but are not limited to (i) restrictions on dividends on and redemptions of, equity interests and other restricted payments; (ii) liens; (iii) loans and investments; (iv) the sale, transfer or disposition of assets and businesses; (v) transactions with affiliates; and (vi) a maximum total leverage ratio. Certain debt covenants may restrict the Company's ability as it relates to dividends, acquisitions and other borrowings. Events of default under the Credit Agreement include, but are not limited to: (i) failure to pay principal, interest, fees or other amounts under the Credit Agreement when due, taking into account any applicable grace period; (ii) any representation or warranty proving to have been incorrect in any material respect when made; (iii) failure to perform or observe covenants or other terms of the Credit Agreement subject to certain grace periods; (iv) a cross-default and cross-acceleration with certain other material debt; (v) bankruptcy events; (vi) certain defaults under ERISA; and (vii) the invalidity or impairment of security interests. The Company was in compliance with all covenant terms as of December 31, 2019 and 2018. There are no events of default as of December 31, 2019 and 2018.
The Revolving Credit Facility is secured on a first priority basis by a perfected security interest in, and mortgages on substantially all U.S. tangible and intangible personal property, financial assets and real property owned by the Company in Chicago, Illinois and Mount Pleasant, Tennessee; a pledge of
100
%
of the equity of each material U.S. subsidiary of the Company; and
65
%
of the equity of a U.K. holding company.
The interest rate per annum applicable to the Revolving Credit Facility is equal to, at GCP’s option, either: (i) a base rate plus a margin ranging from
0.5
%
to
1.0
%
, or (ii) LIBOR plus a margin ranging from
1.5
%
to
2.0
%
, based upon the total leverage ratio of GCP and its restricted subsidiaries in both scenarios. During the year ended December 31, 2018, GCP made aggregate payments of
$
50.0
million
on the Revolving Credit Facility. As of December 31, 2019 and 2018, there were
no
outstanding borrowings on the Revolving Credit Facility and approximately
$
5.9
million
and
$
5.0
million
, respectively, in outstanding letters of credit, which resulted in available credit of
$
344.1
million
and
$
345.0
million
, respectively, under the Revolving Credit Facility. Interest payments on the Revolving Credit Facility amounted to
$
0.2
million
during the year ended December 31, 2018. There were
no
such payments during the year ended December 31, 2019.
During 2017, the Company repaid the outstanding principal balance and extinguished the Term Loan under the Credit Agreement, which, together with accrued and unpaid interest, was
$
272.6
million
. In conjunction with the debt repayment, GCP wrote-off the net unamortized discount of
$
2.1
million
and the net unamortized debt issuance costs of
$
3.9
million
related to the Term Loan, which are reflected in "Interest expense and related financing costs" in the Consolidated Statements of Operations.
On January 27, 2016, GCP issued
$
525.0
million
aggregate principal amount of
9.5
%
Senior Notes maturing in 2023. Interest was payable semi-annually in arrears on February 1 and August 1 of each year. The
9.5
%
Senior Notes became callable at a premium over their face amount on February 1, 2019 and were redeemable prior to February 1, 2019 at a price that reflected a yield to the first call that was equivalent to the applicable Treasury bond yield plus
0.5
percentage points.
On April 10, 2018, GCP redeemed all of the then outstanding
9.5
%
Senior Notes, as described above, and paid
$
9.6
million
of accrued interest unpaid thereon through their redemption date.
93
Debt Issuance Costs
GCP recognizes expenses directly associated with obtaining the Revolving Credit Facility as debt issuance costs which are presented within "Other assets" in the Consolidated Balance Sheets. Such costs are amortized over the term of the Revolving Credit Facility and included in “Interest expense and related financing costs” in the Consolidated Statements of Operations. The remaining unamortized debt issuance costs related to the Revolving Credit Facility were
$
3.1
million
and
$
4.1
million
, respectively, as of December 31, 2019 and 2018. During the year ended December 31, 2018, GCP wrote off
$
0.4
million
of debt issuance costs related to a financial institution that exited the syndicate upon amendment of the Credit Agreement which governs the Revolving Credit Facility. During the year ended December 31, 2018, GCP incurred debt issuance costs of
$
2.2
million
due to the amendment of the Credit Agreement.
Debt issuance costs of
$
4.7
million
, including loan origination fees of
$
3.1
million
paid at the closing, are directly associated with issuing the
5.5
%
Senior Notes and presented as a reduction of the principal balance in the Consolidated Balance Sheets. Such costs are amortized over the term of the
5.5
%
Senior Notes and included in “Interest expense and related financing costs” in the Consolidated Statements of Operations. As of December 31, 2019 and 2018, the remaining unamortized debt issuance costs related to the
5.5
%
Senior Notes were
$
3.9
million
and
$
4.4
million
, respectively.
During the year ended December 31, 2018, GCP wrote off
$
6.1
million
of previously deferred debt issuance costs related to the
9.5
%
Senior Notes in connection with their redemption.
Debt Fair Value
At
December 31, 2019
and 2018, the carrying amounts and fair values of GCP's debt are as follows:
|
December 31, 2019
|
December 31, 2018
|
||||||||||||||
|
(In millions)
|
Carrying Amount
|
Fair Value
|
Carrying Amount
|
Fair Value
|
|||||||||||
|
5.5% Senior Notes due in 2026
|
$
|
|
|
$
|
|
|
$
|
|
|
$
|
|
|
|||
|
Other borrowings
|
|
|
|
|
|
|
|
|
|||||||
|
Total debt
|
$
|
|
|
$
|
|
|
$
|
|
|
$
|
|
|
|||
Fair value is determined based on Level 2 inputs, including expected future cash flows (discounted at market interest rates), estimated current market prices and quotes from financial institutions. The increase in fair value compared to the carrying value as of December 31, 2019, was due to decreases in interest rates in December 2019.
94
9.
Income Taxes
Provision for Income Taxes
The components of income (loss) before income taxes and the related (benefit) provision for income taxes for
2019
,
2018
and
2017
are as follows:
|
Year Ended December 31,
|
|||||||||||
|
(In millions)
|
2019
|
|
2018
|
|
2017
|
||||||
|
Income (loss) before income taxes:
|
|
|
|||||||||
|
Domestic
|
$
|
|
|
$
|
|
|
$
|
(
|
)
|
||
|
Foreign
|
|
|
|
|
(
|
)
|
|||||
|
Total
|
$
|
|
|
$
|
|
|
$
|
(
|
)
|
||
|
(Benefit) provision for income taxes:
|
|
|
|||||||||
|
Federal—current
|
$
|
(
|
)
|
$
|
|
|
$
|
|
|
||
|
Federal—deferred
|
|
|
(
|
)
|
|
|
|||||
|
State and local—current
|
|
|
(
|
)
|
(
|
)
|
|||||
|
State and local—deferred
|
(
|
)
|
(
|
)
|
|
|
|||||
|
Foreign—current
|
|
|
|
|
|
|
|||||
|
Foreign—deferred
|
(
|
)
|
(
|
)
|
|
|
|||||
|
Total
|
$
|
(
|
)
|
$
|
|
|
$
|
|
|
||
Tax Reform
The 2017 Tax Act (the "Act"), which was signed into law on December 22, 2017, has resulted in significant changes to the Internal Revenue Code. These changes include, but are not limited to, the federal corporate tax rate being reduced from
35%
to
21%
, the elimination or reduction of certain domestic tax deductions and credits, along with limitations on the deductibility of interest expense and executive compensation. The 2017 Tax Act also transitions international taxation from a worldwide system to a modified territorial system and includes base erosion prevention measures on non-US earnings, which subjects certain earnings of our foreign subsidiaries to US taxation as global intangible low-taxed income ("GILTI"). The Company has elected to recognize the tax on GILTI as expense in the period the tax is incurred.
During the year ended December 31, 2017, the Company recorded a provisional net charge of
$
81.7
million
related to the 2017 Tax Act, which was comprised of a
$
70.5
million
Transition Tax and a
$
11.2
million
revaluation of net deferred tax assets. Changes in tax rates and tax laws are accounted for in the period of enactment.
During the year ended December 31, 2018, the Company recorded an increase to the provisional net charge of
$
17.9
million
which is comprised of an expense of
$
20.2
million
related to certain capital gains recognized resulting from the application of the Transition Tax, a
$
2.5
million
benefit related to the Transition Tax, and an expense of
$
0.2
million
for the effect on U.S. deferred taxes.
During the year ended December 31, 2019, as a result of clarifications issued in January 2019 by the Internal Revenue Service (IRS) in the final treasury regulations under Code Section 965, GCP decreased its liability for unrecognized tax benefits by
$
20.2
million
. In addition, the application of the final regulations resulted in an increase to GCP’s long-term tax payable by
$
3.7
million
and an increase of GCP's short-term tax payable by
$
0.2
million
.
Transition Tax
The 2017 Tax Act eliminated the deferral of U.S. income tax on the historical unrepatriated earnings by imposing the Transition Tax, which was a one-time mandatory deemed repatriation tax on undistributed earnings. The Transition Tax was assessed on the U.S. shareholder's share of the foreign corporation's accumulated foreign earnings that had not previously been taxed. Earnings in the form of cash and cash equivalents was taxed at a
15.5%
and all other earnings were taxed at
8.0%
.
95
As of
December 31, 2019
, the unpaid balance of the Transition Tax obligation is
$
41.4
million
long term income tax payable, net of overpayments and foreign tax credits. After considering overpayments, the outstanding payable is due between April 2022 and April 2025.
Effective Tax Rate
The difference between the (benefit) provision for income taxes at the U.S. federal income tax rates of
21%
and
35%
and GCP's overall income tax provision are as follows:
|
Year Ended December 31,
|
|||||||||||
|
(In millions)
|
2019
|
2018
|
2017
|
||||||||
|
Tax provision (benefit) at U.S. federal income tax rate
|
$
|
|
|
$
|
|
|
$
|
(
|
)
|
||
|
Change in provision resulting from:
|
|
|
|||||||||
|
Deconsolidation of Venezuela
(1)
|
$
|
|
|
$
|
|
|
$
|
|
|
||
|
Devaluation in Venezuela
|
|
|
|
|
|
|
|||||
|
2017 Tax Act
|
|
|
(
|
)
|
|
|
|||||
|
Recognition of outside basis differences
|
(
|
)
|
|
|
(
|
)
|
|||||
|
U.S. foreign income inclusions
|
|
|
|
|
|
|
|||||
|
Effect of tax rates in foreign jurisdictions
|
|
|
|
|
(
|
)
|
|||||
|
Valuation allowance
|
|
|
|
|
|
|
|||||
|
State and local income taxes, net
|
|
|
|
|
(
|
)
|
|||||
|
Return to provision – change in estimate
|
(
|
)
|
(
|
)
|
|
|
|||||
|
Nondeductible expenses and non-taxable items
|
|
|
|
|
|
|
|||||
|
U.S. foreign income tax credits
|
(
|
)
|
(
|
)
|
|
|
|||||
|
Research and other state credits
|
(
|
)
|
(
|
)
|
(
|
)
|
|||||
|
Unrecognized tax benefits (2)
|
(
|
)
|
|
|
(
|
)
|
|||||
|
Equity compensation
|
(
|
)
|
(
|
)
|
(
|
)
|
|||||
|
Other
|
|
|
|
|
(
|
)
|
|||||
|
(Benefit) provision for income taxes
|
$
|
(
|
)
|
$
|
|
|
$
|
|
|
||
|
(1)
|
Amount in 2017 is offset by the benefit resulting from outside basis differences primarily in Mexico and Venezuela, which is included in the table above in "Recognition of outside basis differences."
|
|
(2)
|
Amounts in 2018 and 2019 are primarily related to an unrecognized tax benefit increase of
$
|
The income tax (benefit) provision for the years ended
December 31, 2019
,
2018
, and
2017
was (
$
6.6
million
),
$
26.3
million
and
$
82.1
million
, respectively, representing effective tax rates of
19.2
%
,
250.5
%
, and
290.1
%
, respectively.
The change in the Company's effective tax rate for the year ended December 31, 2019 compared to 2018 was primarily due to the finalization of Transition Tax regulations issued in January 2019, as well as the benefit in 2019 of a Brazilian income tax refund and a lower valuation allowance.
The decrease in the Company's effective tax rate for the year ended December 31, 2018 compared to 2017 was primarily due to impacts from the 2017 Tax Act including the decrease in the statutory tax rate and offsetting unrecognized tax benefits recorded, as well as an increase in valuation allowance.
The Company's 2019 effective tax rate of
19.2
%
differed from the 21% U.S. statutory rate primarily due to the finalization of Transition Tax regulations issued in January 2019, resulting in a tax benefit of
$
20.2
million
, as well as the benefit of a Brazilian income tax refund of
$
3.2
million
and U.S. foreign tax credits generated of
$
2.0
million
. These benefits were partially offset by a tax provision of
$
3.9
million
due to changes to GCP's 2017 income tax liability and Transition Tax as well as the effect of foreign rate differential of
$
3.6
million
, non-deductible expenses of
$
1.6
million
and a valuation allowance increase of
$
1.0
million
.
96
The Company's
2018
effective tax rate of
250.5
%
differed from the 21% U.S. statutory rate primarily due to impacts of the 2017 Tax Act of
$
17.9
million
and an increase in valuation allowance of
$
6.8
million
resulting from net operating losses in Germany, France, India, Turkey and Mexico that do not benefit the effective tax rate.
The Company's 2017 effective tax rate of approximately
290.1
%
differed from the 35% U.S. statutory rate primarily due to net expenses recognized during the year comprised of
$
81.7
million
due to the 2017 Tax Act,
$
11.5
million
due to non-deductible charges for the Venezuela deconsolidation,
$
11.4
million
due to an increase in valuation allowance primarily due to the sale of Darex, offset by a
$
13.9
million
benefit due to differences between book and tax basis in Venezuela and Mexico.
Deferred Tax Assets and Liabilities
The components of the deferred tax assets and liabilities at
December 31, 2019
and
2018
are as follows:
|
(In millions)
|
December 31, 2019
|
December 31, 2018
|
|||||
|
Deferred tax assets:
|
|
||||||
|
Foreign net operating loss carryforwards
|
$
|
|
|
$
|
|
|
|
|
Research and development
|
|
|
|
|
|||
|
Reserves and allowances
|
|
|
|
|
|||
|
Pension benefits
|
|
|
|
|
|||
|
Intangible assets/goodwill
|
|
|
|
|
|||
|
Stock compensation
|
|
|
|
|
|||
|
Interest Limitation Carryover
|
|
|
|
|
|||
|
Operating Lease Obligations
|
|
|
—
|
|
|||
|
Foreign tax credit carryforwards
|
|
|
|
|
|||
|
Other
|
|
|
|
|
|||
|
Total deferred tax assets
|
|
|
|
|
|||
|
Deferred tax liabilities:
|
|
|
|||||
|
Properties and equipment
|
(
|
)
|
(
|
)
|
|||
|
Other
|
(
|
)
|
(
|
)
|
|||
|
Operating Lease Right of Use
|
(
|
)
|
—
|
|
|||
|
Intangible assets/goodwill
|
(
|
)
|
|
|
|||
|
Outside basis difference in Verifi
®
|
(
|
)
|
(
|
)
|
|||
|
Total deferred tax liabilities
|
(
|
)
|
(
|
)
|
|||
|
Valuation Allowance:
|
|||||||
|
Foreign net operating loss carryforwards
|
(
|
)
|
(
|
)
|
|||
|
Foreign tax credit carryforwards
|
(
|
)
|
|
|
|||
|
Total Valuation Allowance
|
(
|
)
|
(
|
)
|
|||
|
Net deferred tax assets
|
$
|
|
|
$
|
|
|
|
In evaluating GCP's ability to realize its deferred tax assets, GCP considers all reasonably available positive and negative evidence, including recent earnings experience, expectations of future taxable income and the tax character of that income, the period of time over which temporary differences become deductible and the carryforward and/or carryback periods available to GCP for tax reporting purposes in the related jurisdiction. In estimating future taxable income, GCP relies upon assumptions and estimates about future activities, including the amount of future federal, state and foreign pretax operating income that GCP will generate; the reversal of temporary differences; and the implementation of feasible and prudent tax planning strategies. GCP records a valuation allowance to reduce deferred tax assets to the amount that it believes is more likely than not to be realized.
97
At December 31, 2019, GCP recorded a deferred tax asset of
$
1.2
million
for excess U.S. foreign tax credit carryovers. These credits may be carried back one year and forward ten years. Management believes it is not more likely than not that these credits will be utilized and has recorded a full valuation allowance against the deferred tax asset.
At December 31, 2018, GCP recorded a deferred tax asset of
$
12.2
million
on carryover interest, the current deductibility of which is limited under the new Tax Act. The carryover is largely driven by the one-time expense incurred during 2018 of
$
53.3
million
in redemption premium as discussed further in Note 8, Debt and Other Borrowings. The amount of this deferred tax asset component at December 31, 2019 is
$
10.3
million
.The interest limitation may be carried over indefinitely and GCP believes it is more likely than not that it will utilize the full carryover amount.
At
December 31, 2019
and
2018
, GCP has recorded a valuation allowance of
$
17.2
million
and
$
18.5
million
respectively, to reduce its net deferred tax assets to the amount that is more likely than not to be realized. The realization of deferred tax assets is dependent on the generation of sufficient taxable income in the appropriate tax jurisdictions. GCP believes it is more likely than not that the remaining deferred tax assets will be realized. If GCP were to determine that it would not be able to realize a portion of its deferred tax assets in the future, for which there is currently no valuation allowance, an adjustment to the deferred tax assets would be charged to earnings in the period such determination was made. Conversely, if GCP were to make a determination that it is more likely than not that deferred tax assets, for which there is currently a valuation allowance, would be realized, the related valuation allowance would be reduced and a benefit to earnings would be recorded.
In 2019, the Company decreased valuation allowances by
$
1.3
million
. Valuation allowances on foreign net operating losses decreased by
$
2.5
million
in total which was due to a
$
1.1
million
rate change impact reducing France net operating losses, foreign exchange impacts of
$
1.2
million
and a
$
0.2
million
benefit on net valuation releases. The impact of such items was offset by a valuation allowance increase on U.S foreign tax credit carryovers of
$
1.2
million
.
In 2018, the Company decreased valuation allowances by
$
5.4
million
. The decrease was due to a decrease in Japan net operating losses of
$
10.6
million
, foreign exchange impacts of
$
1.5
million
offset by
$
6.8
million
valuation allowance charges resulting primarily from net operating losses in Germany, France, India, Turkey and Mexico, the tax benefits of which are not expected to be realized.
As of
December 31, 2019
, the Company had net operating losses for income tax purposes of approximately
$
57.7
million
. These net operating losses consist primarily of Brazil, France and Germany net operating losses of
$
22.8
million
,
$
9.9
million
and
$
7.7
million
respectively, each with an unlimited carryover period, and
$
8.9
million
of India net operating losses that begin to expire in 2020. As of December 31, 2019, the Company had U.S. foreign tax credit carryovers of
$
1.2
million
that will expire in 2030.
Repatriation
In general, it is the Company's practice and intention to permanently reinvest the earnings of its foreign subsidiaries and repatriate earnings only when the tax impact is minimal and that position has not changed subsequent to the one-time transition tax under the Tax Act. Accordingly, no deferred taxes have been provided for withholding taxes or other taxes that would result upon repatriation of approximately
$
522.7
million
of unremitted earnings from foreign subsidiaries to the U.S. as those earnings continue to be permanently reinvested. The estimated unrecorded tax liability associated with these unremitted earnings is
$
6.6
million
.
Tax Sharing Agreement
In connection with the Separation, GCP and Grace entered into various agreements that govern the relationship between the parties going forward, including a tax matters agreement (the "Tax Sharing Agreement"). Under the Tax Sharing Agreement, which was entered into on the distribution date, GCP and Grace will indemnify and hold each other harmless in accordance with the principles outlined therein. Please refer to Note 16, "Related Party Transactions and Transactions with Grace" for further information on the Tax Sharing Agreement.
98
Unrecognized Tax Benefits
A reconciliation of the unrecognized tax benefits excluding interest and penalties, for the three years ended
December 31, 2019
, is presented below.
|
(In millions)
|
Unrecognized
Tax Benefits
|
||
|
Balance, December 31, 2016
|
$
|
|
|
|
Additions for prior year tax positions
|
|
|
|
|
Additions for current year tax positions
|
|
|
|
|
Reductions for expirations of statute of limitations
|
(
|
)
|
|
|
Reductions for prior year tax positions and reclassifications
|
(
|
)
|
|
|
Balance, December 31, 2017
|
$
|
|
|
|
Additions for prior year tax positions
|
|
|
|
|
Additions for current year tax positions
|
|
|
|
|
Reductions for expirations of statute of limitations
|
(
|
)
|
|
|
Reductions for prior year tax positions and reclassifications
|
(
|
)
|
|
|
Balance, December 31, 2018
|
$
|
|
|
|
Additions for prior year tax positions
|
|
|
|
|
Additions for current year tax positions
|
|
|
|
|
Reductions for expirations of statute of limitations
|
(
|
)
|
|
|
Reductions for prior year tax positions and reclassifications
|
(
|
)
|
|
|
Balance, December 31, 2019
|
$
|
|
|
The balance of unrecognized tax benefits as of December 31,
2019
,
2018
and
2017
, that if recognized, would affect GCP’s effective tax rate are
$
31.6
million
,
$
52.4
million
and
$
33.4
million
, respectively, GCP accrues potential interest and any associated penalties related to unrecognized tax benefit within "Benefit (provision) for income taxes" in the Consolidated Statements of Operations. The balances of unrecognized tax benefits in the preceding table do not include accrued interest and penalties. The total amount of interest and penalties accrued on unrecognized tax benefits and included in the Consolidated Balance Sheets as of
December 31, 2019
and
2018
was
$
10.6
million
and
$
10.4
million
, respectively, net of applicable federal income tax benefits.
Unrecognized tax benefits from GCP's operations are reflected in its Consolidated Financial Statements, including those that in certain jurisdictions have historically been included in tax returns filed by Grace. In such instances, unrecognized tax benefits related to GCP's operations may be indemnified by Grace. As of
December 31, 2019
,
2018
and
2017
, the amount of unrecognized tax benefits considered obligations of Grace (including both interest and penalties) were
$
2.6
million
,
$
3.0
million
and
$
3.8
million
, respectively. The Company has a corresponding receivable of the same amount from Grace.
The Company believes it is reasonably possible that in the next 12 months due to expiration of statute of limitation that the amount of the liability for unrecognized tax benefits could further decrease by approximately
$
1.6
million
, of which
$
0.5
million
is indemnified by Grace.
GCP files U.S. federal income tax returns, as well as income tax returns, in various state and foreign jurisdictions. Unrecognized tax benefits relate to income tax returns for tax years that remain subject to examination by the relevant tax authorities.
As of December 31, 2019, the tax years for which the Company remains subject to United States federal income tax assessment and state and local income tax assessment upon examination are 2016 and thereafter.
The Company is also subject to taxation in various foreign jurisdictions, including in Europe, the Middle East, Africa, Asia Pacific, Canada and Latin America. As of December 31, 2019, the Company is under, or may be subject to, audit or examination and additional assessments in respect of these particular jurisdictions in general for tax years 2012 and thereafter.
99
Foreign jurisdiction audits that have been initiated and/or are ongoing include an Indian audit relating to GCP Applied Technologies (India) Private Limited for taxable years 2016-2017, a Canadian audit relating to GCP Canada, Inc. for taxable years 2015-2016, a French audit for taxable years 2016-2017, and a Philippines audit relating to GCP Applied Technologies (Philippines) Inc. (a Darex entity) for taxable years 2016-2017. Since GCP Applied Technologies (Philippines) Inc. was sold in July 2017, any assessments pursuant to this audit will be reimbursed by GCP to the buyer.
10.
Pension Plans and Other Postretirement Benefit Plans
The following discussion of GCP's pension plans and other postretirement benefit plans includes amounts related to continuing operations and discontinued operations. Amounts attributed to results from discontinued operations in the current and prior years are distinguished below.
Pension Plans
GCP sponsors defined benefit pension plans, primarily in the U.S
.
and the U.K., in which GCP employees and former employees participate. These plans cover current and former employees of certain business units and divested business units who meet age and service requirements. Benefits are generally based on final average salary and years of service. GCP funds its U.S. qualified pension plans in accordance with U.S. federal laws and regulations. Non-U.S. pension plans are funded under a variety of methods as required under local laws and customs.
Overfunded and underfunded plans include several advance-funded plans for which the fair value of the plan assets offset the projected benefit obligation ("PBO"). The overfunded plans hold plan assets measured at fair value that exceeds the PBO. In contrast to the overfunded plans, the PBO of the underfunded plans is greater than the fair value of the plan assets. These plans are presented in the Consolidated Balance Sheets along with unfunded plans. Unfunded plans are funded on a pay-as-you-go basis and therefore, their PBO is unfunded entirely.
The following table presents the funded status of GCP's overfunded, underfunded and unfunded defined pension plans in continuing operations:
|
(In millions)
|
December 31,
2019 |
December 31,
2018 |
|||||
|
Overfunded defined benefit pension plans
|
$
|
|
|
$
|
|
|
|
|
Long-term pension liabilities:
|
|||||||
|
Underfunded defined benefit pension plans
|
(
|
)
|
(
|
)
|
|||
|
Unfunded defined benefit pension plans
|
(
|
)
|
(
|
)
|
|||
|
Total long-term pension liabilities related to underfunded and unfunded defined benefit pension plans
|
(
|
)
|
(
|
)
|
|||
|
Pension liabilities included in other current liabilities
|
(
|
)
|
(
|
)
|
|||
|
Net funded status
|
$
|
(
|
)
|
$
|
(
|
)
|
|
U.S. Pension Plans
On
May 3, 2017
, the Board of Directors approved an amendment to the GCP Applied Technologies Inc. Retirement Plan for Salaried Employees that closes the plan to new employees effective
January 1, 2018
and freezes the accrual of plan benefits for all plan participants as of
December 31, 2022
.
There were
no
curtailment gains recognized during the years ended December 31, 2019 and 2018 for the U.S. plans.
100
The Company recognized the following curtailment gains related to the U.S. plans for the year ended December 31, 2017:
|
(In millions) |
Year Ended December 31, 2017
|
|||
|
Net curtailment gains:
|
||||
|
Plan amendments
|
$
|
|
|
|
|
Restructuring activities
|
|
|
||
|
Total net curtailment gains from continuing operations
|
$
|
|
|
|
|
Total net curtailment gains from discontinued operations
|
|
|
||
|
Total net curtailment gains
|
$
|
|
|
|
The Company recognized the following pension mark-to-market (MTM) (losses) gains from continuing operations related to the interim and annual remeasurements of the U.S. plans' PBO and plan assets:
|
Year Ended December 31,
|
||||||||||||
|
(In millions) |
2019
|
2018
|
2017
|
|||||||||
|
Total MTM (losses) gains
|
$
|
(
|
)
|
$
|
|
|
$
|
(
|
)
|
|||
Non-U.S. Pension Plans
A High Court judgment on October 26, 2018 ruled that certain U.K. pension plans must gender-equalize a statutory minimum benefit (“Guaranteed Minimum Pension”, or “GMP”,) that is provided by most U.K. plans. This judgment resulted in increases to the pension benefits for many U.K. plan participants and was accounted for as a plan amendment resulting in the recognition of a prior service cost of
$
2.7
million
in "Accumulated Other Comprehensive Loss" as of December 31, 2018. Such amount will be recognized in the Company's results of operations in future periods and recorded annually as an amortization expense of
$
0.1
million
over
19
years
which represents expected lifetime of the affected participants.
In December 2019, the Board of Directors approved an amendment to the GCP Applied Technologies Inc. UK Retirement Plan that freezes the accrual of plan benefits for all plan participants starting December 31, 2019. As a result, the Company recognized a curtailment gain of
$
1.2
million
in continuing operations.
The Company recognized the following curtailment gains related to non-U.S. pension plans:
|
Year Ended December 31,
|
||||||||||||
|
(In millions) |
2019
|
2018
|
2017
|
|||||||||
|
Net curtailment gains:
|
||||||||||||
|
Total net curtailment gains from continuing operations
|
$
|
|
|
$
|
|
|
$
|
|
|
|||
|
Total net curtailment gains from discontinued operations(1)
|
|
|
|
|
|
|
||||||
|
Total net curtailment gains
|
$
|
|
|
$
|
|
|
$
|
|
|
|||
________________________________
|
(1)
|
During the year ended December 31, 2019, the Company recognized a curtailment gain of
$
|
101
The Company recognized the following mark-to-market (losses) gains related to interim and annual remeasurements of the non-U.S. plans' PBO and plan assets:
|
Year Ended December 31,
|
||||||||||||
|
(In millions) |
2019
|
2018
|
2017
|
|||||||||
|
Total MTM (losses) gains from continuing operations
|
$
|
(
|
)
|
$
|
|
|
$
|
|
|
|||
|
Total MTM gains from discontinued operations
|
|
|
|
|
|
|
||||||
|
Total MTM (losses) gains
|
$
|
(
|
)
|
$
|
|
|
$
|
|
|
|||
During the years ended
December 31, 2019
,
2018
and
2017
, adjustments for curtailments and pension mark-to-market remeasurements for both the U.S. and non-U.S. plans are presented in "Other expenses (income), net" in the Consolidated Statements of Operations.
Darex Divestiture Pension Plans Impact - U.S. and non-U.S.
In connection with the divestiture of the Darex operating segment, the Company recognized curtailment and settlement gains totaling
$
2.1
million
for the U.S. plans and
$
14.3
million
outside of the U.S during the year ended December 31, 2017 in "Income from discontinued operations, net of income taxes" in the Consolidated Statements of Operations. Additionally, GCP also recognized a non-U.S. mark-to-market gain of
$
0.1
million
in "Income from discontinued operations, net of income taxes" related to remeasurement at the time of the Darex sale during the year ended December 31, 2017. The Company also included non-U.S. plan service cost, interest cost and expected return on plan assets totaling
$
0.5
million
for the year ended December 31 2017 in "Income from discontinued operations, net of income taxes" in the Consolidated Statements of Operations.
102
Analysis of Plan Accounting and Funded Status
The following table summarizes the changes in benefit obligations, the fair values of retirement plan assets, and funded status during the years ended December 31,
2019
and
2018
, including amounts presented in both continuing and discontinued operations.
|
|
Defined Benefit Pension Plans
|
||||||||||||||||||||||
|
(In millions) |
U.S.
|
Non-U.S.
|
Total
|
||||||||||||||||||||
|
2019
|
2018
|
2019
|
2018
|
2019
|
2018
|
||||||||||||||||||
|
Change in Projected Benefit Obligation:
|
|
|
|
|
|||||||||||||||||||
|
Benefit obligation at beginning of year
|
$
|
|
|
$
|
|
|
$
|
|
|
$
|
|
|
$
|
|
|
$
|
|
|
|||||
|
Service cost
|
|
|
|
|
|
|
|
|
|
|
|
|
|||||||||||
|
Interest cost
|
|
|
|
|
|
|
|
|
|
|
|
|
|||||||||||
|
Amendments
|
|
|
|
|
|
|
|
|
|
|
|
|
|||||||||||
|
Settlements/curtailments
|
|
|
|
|
(
|
)
|
(
|
)
|
(
|
)
|
(
|
)
|
|||||||||||
|
Actuarial loss (gain)
|
|
|
(
|
)
|
|
|
(
|
)
|
|
|
(
|
)
|
|||||||||||
|
Benefits paid
|
(
|
)
|
(
|
)
|
(
|
)
|
(
|
)
|
(
|
)
|
(
|
)
|
|||||||||||
|
Currency exchange translation adjustments
|
|
|
|
|
|
|
(
|
)
|
|
|
(
|
)
|
|||||||||||
|
Benefit obligation at end of year
|
$
|
|
|
$
|
|
|
$
|
|
|
$
|
|
|
$
|
|
|
$
|
|
|
|||||
|
Change in Plan Assets:
|
|
|
|
|
|||||||||||||||||||
|
Fair value of plan assets at beginning of year
|
$
|
|
|
$
|
|
|
$
|
|
|
$
|
|
|
$
|
|
|
$
|
|
|
|||||
|
Actual return on plan assets
|
|
|
(
|
)
|
|
|
(
|
)
|
|
|
(
|
)
|
|||||||||||
|
Employer contributions
|
|
|
|
|
|
|
|
|
|
|
|
|
|||||||||||
|
Settlements
|
|
|
|
|
|
|
(
|
)
|
|
|
(
|
)
|
|||||||||||
|
Benefits paid
|
(
|
)
|
(
|
)
|
(
|
)
|
(
|
)
|
(
|
)
|
(
|
)
|
|||||||||||
|
Currency exchange translation adjustments
|
|
|
|
|
|
|
(
|
)
|
|
|
(
|
)
|
|||||||||||
|
Fair value of plan assets at end of year
|
$
|
|
|
$
|
|
|
$
|
|
|
$
|
|
|
$
|
|
|
$
|
|
|
|||||
|
Funded status at end of year (PBO basis)
|
$
|
(
|
)
|
$
|
(
|
)
|
$
|
|
|
$
|
|
|
$
|
(
|
)
|
$
|
(
|
)
|
|||||
|
Amounts recognized in the Consolidated Balance Sheets:
|
|
|
|
|
|||||||||||||||||||
|
Non-current assets
|
$
|
|
|
$
|
|
|
$
|
|
|
$
|
|
|
$
|
|
|
$
|
|
|
|||||
|
Current liabilities
|
(
|
)
|
(
|
)
|
(
|
)
|
(
|
)
|
(
|
)
|
(
|
)
|
|||||||||||
|
Non-current liabilities
|
(
|
)
|
(
|
)
|
(
|
)
|
(
|
)
|
(
|
)
|
(
|
)
|
|||||||||||
|
Non-current liabilities held-for-sale
|
|
|
|
|
|
|
(
|
)
|
|
|
(
|
)
|
|||||||||||
|
Net amount recognized
|
$
|
(
|
)
|
$
|
(
|
)
|
$
|
|
|
$
|
|
|
$
|
(
|
)
|
$
|
(
|
)
|
|||||
|
Amounts recognized in Accumulated Other Comprehensive Loss:
|
|
|
|
|
|||||||||||||||||||
|
Prior service credit
|
|
|
|
|
|
|
|
|
|
|
|
|
|||||||||||
|
Net amount recognized
|
$
|
|
|
$
|
|
|
$
|
|
|
$
|
|
|
$
|
|
|
$
|
|
|
|||||
103
|
|
Defined Benefit Pension Plans
|
||||||||||
|
U.S.
|
Non-U.S.
|
||||||||||
|
2019
|
2018
|
2019
|
2018
|
||||||||
|
Weighted Average Assumptions Used to Determine Benefit Obligations as of December 31:
|
|
|
|||||||||
|
Discount rate
|
|
%
|
|
%
|
|
%
|
|
%
|
|||
|
Rate of compensation increase
|
|
%
|
|
%
|
|
%
|
|
%
|
|||
|
Weighted Average Assumptions Used to Determine Net Periodic Benefit Cost for Years Ended December 31:
|
|
|
|
|
|||||||
|
Discount rate
|
|
%
|
|
%
|
|
%
|
|
%
|
|||
|
Expected return on plan assets
|
|
%
|
|
%
|
|
%
|
|
%
|
|||
|
Rate of compensation increase
|
|
%
|
|
%
|
|
%
|
|
%
|
|||
|
(In millions)
|
Year Ended December 31,
|
||||||||||||||||||||||
|
Components of Net Periodic Benefit Cost (Income) and Other Amounts Recognized in Other Comprehensive (Income) Loss
|
2019
|
2018
|
2017
|
||||||||||||||||||||
|
U.S.
|
Non-U.S.
|
U.S.
|
Non-U.S.
|
U.S.
|
Non-U.S.
|
||||||||||||||||||
|
Net Periodic Benefit Cost (Income):
|
|||||||||||||||||||||||
|
Service cost(1)
|
$
|
|
|
$
|
|
|
$
|
|
|
$
|
|
|
$
|
|
|
$
|
|
|
|||||
|
Interest cost
|
|
|
|
|
|
|
|
|
|
|
|
|
|||||||||||
|
Expected return on plan assets
|
(
|
)
|
(
|
)
|
(
|
)
|
(
|
)
|
(
|
)
|
(
|
)
|
|||||||||||
|
Amortization of prior service cost
|
|
|
|
|
|
|
|
|
|
|
|
|
|||||||||||
|
Gain on termination, curtailment and settlement of pension plans
|
|
|
(
|
)
|
|
|
(
|
)
|
(
|
)
|
(
|
)
|
|||||||||||
|
Pension mark-to-market adjustment
|
|
|
|
|
(
|
)
|
(
|
)
|
|
|
(
|
)
|
|||||||||||
|
Net periodic benefit cost (income)
|
$
|
|
|
$
|
|
|
$
|
(
|
)
|
$
|
|
|
$
|
|
|
$
|
(
|
)
|
|||||
|
Less: Net periodic benefit income from discontinued operations
|
|
|
(
|
)
|
|
|
|
|
(
|
)
|
(
|
)
|
|||||||||||
|
Net periodic benefit cost (income) from continuing operations
|
$
|
|
|
$
|
|
|
$
|
(
|
)
|
$
|
|
|
$
|
|
|
$
|
(
|
)
|
|||||
|
Other Changes in Plan Assets and Benefit Obligations Recognized in Other Comprehensive Loss (Income):
|
|||||||||||||||||||||||
|
Net prior service cost (credit)
|
$
|
|
|
$
|
|
|
$
|
|
|
$
|
|
|
$
|
|
|
$
|
(
|
)
|
|||||
|
Amortization of prior service cost
|
|
|
|
|
|
|
|
|
|
|
|
|
|||||||||||
|
Total recognized in other comprehensive (income) loss
|
$
|
|
|
$
|
|
|
$
|
|
|
$
|
|
|
$
|
|
|
$
|
(
|
)
|
|||||
|
Total recognized in net periodic benefit cost (income) and other comprehensive (income) loss
|
$
|
|
|
$
|
|
|
$
|
(
|
)
|
$
|
|
|
$
|
|
|
$
|
(
|
)
|
|||||
________________________________
|
(1)
|
Service cost component of net periodic benefit cost (income) is included in "Selling, general and administrative expenses" and "Cost of goods sold" in the Consolidated Statements of Operations. All other components of net periodic benefit cost (income) are presented in "Other expenses (income), net," within the Consolidated Statements of Operations.
|
The PBO reflects the present value of vested and non-vested benefits earned from employee services to date, based upon current services and estimated future pay increases for active employees. As of
December 31, 2019
, the measurement date for GCP's defined benefit pension plans, the PBO was
$
437.5
million
compared to
$
388.3
million
as of December 31,
2018
. The increase in the PBO was primarily due to a decrease in discount rates, partially offset by updates to mortality assumptions. As of
December 31, 2019
, the PBO was determined using the weighted average discount rates for U.S. plans and non-U.S. plans, which were
3.26
%
,
and
1.80
%
, respectively. The decrease in the discount rates was primarily due to the lower market rates for a portfolio of U.S. and non-U.S. high quality corporate bonds for which the amount and timing of cash outflow approximate estimated payouts for the pension plans.
104
The underfunded status of the U.S. defined pension plans increased to
$
48.9
million
for the year ended
December 31, 2019
compared to
$
31.0
million
in the prior year, while the overfunded status of the non-U.S. defined pension plans increased to
$
5.2
million
for the year ended
December 31, 2019
compared to
$
3.6
million
in the prior year. The changes in funded status for the U.S. pension plans were primarily due to the higher PBO partially offset by higher plan assets. Such changes for the non-U.S. plans were primarily due to the higher plan assets, partially offset by higher PBO.
A full remeasurement of pension assets and pension liabilities is performed annually based on GCP's estimates and actuarial valuations. Remeasurements may also occur during interim periods when significant events occur, such as plan curtailments or terminations. These remeasurements reflect the terms of the plan and use participant-specific information, as well as key assumptions provided by management.
The accumulated benefit obligation for all defined benefit pension plans, including those with related assets and liabilities presented as held for sale in the Consolidated Balance Sheets, was approximately
$
431
million
and
$
375
million
, respectively, as of
December 31, 2019
and
2018
.
As of December 31, 2019,
the estimated expected future benefit payments related to future services are as follows:
|
(In millions)
|
Pension Plans
|
Total
Payments |
|||||||||
|
U.S.
|
Non-U.S.(1)
|
||||||||||
|
Year ending December 31,
|
Benefit
Payments |
Benefit
Payments |
|||||||||
|
2020
|
$
|
|
|
$
|
|
|
$
|
|
|
||
|
2021
|
|
|
|
|
|
|
|||||
|
2022
|
|
|
|
|
|
|
|||||
|
2023
|
|
|
|
|
|
|
|||||
|
2024
|
|
|
|
|
|
|
|||||
|
2025 - 2029
|
$
|
|
|
$
|
|
|
$
|
|
|
||
________________________________________
|
(1)
|
Non-U.S. estimated benefit payments for
2020
and future periods have been translated at the applicable
December 31, 2019
exchange rates.
|
Discount Rate Assumption
The assumed discount rate for pension plans reflects the market rates for high-quality corporate bonds currently available and is subject to change based on overall market interest rates. For the U.S. qualified pension plans, the assumed weighted average discount rate of
3.26
%
as of
December 31, 2019
was selected in consultation with independent actuaries and is based on a yield curve constructed from a portfolio of high quality bonds for which the timing and amount of cash outflows approximates the estimated payouts of the plans.
As of
December 31, 2019
and
2018
, the benefit obligations of the U.K. pension plan represented approximately
84
%
of the total benefit obligation of the non-U.S. pension plans. As of
December 31, 2019
, the assumed weighted average discount rate of
1.57
%
for the U.K. plan was selected in consultation with independent actuaries based on a yield curve constructed from a portfolio of sterling-denominated high quality bonds for which the timing and amount of cash outflows approximates the estimated payouts of the plan. The assumed discount rates for the remaining non-U.S. pension plans were determined based on the nature of the liabilities, local economic environments and available bond indices.
Investment Guidelines for Advance-Funded Pension Plans
The investment goal for the U.S. qualified pension plans subject to advance funding is to earn a long-term rate of return consistent with the related cash flow profile of the underlying benefit obligation. The plans are pursuing a well-defined risk management strategy designed to reduce investment risks as their funded status improves.
105
The U.S. qualified pension plans have adopted a diversified set of portfolio management strategies to optimize the risk reward profile of the plans:
|
•
|
Liability hedging portfolio
: primarily invested in intermediate-term and long-term investment grade corporate bonds in actively managed strategies.
|
|
•
|
Growth portfolio
: invested in a diversified set of assets designed to deliver performance in excess of the underlying liabilities with controls regarding the level of risk.
|
|
•
|
U.S. equity securities- the portfolio contains domestic equities, a portion of which are passively managed and benchmarked to the S&P 500 and Russell 2000 and the remainder of which is allocated to an active portfolio benchmarked to the Russell 2000.
|
|
•
|
Non-U.S. equity securities- the portfolio contains non-U.S. equities in an actively managed strategy. Currency futures and forward contracts may be held for the sole purpose of hedging existing currency risk in the portfolio.
|
|
•
|
Other investments- may include (a) high yield bonds - fixed income portfolio of securities below investment grade; and (b) bank loans and other floating-rate securities. These portfolios combine income generation and capital appreciation opportunities from developed markets globally.
|
|
•
|
Liquidity portfolio
: invested in short-term assets intended to pay periodic plan benefits and expenses.
|
The expected long-term rate of return on assets for the U.S. qualified pension plans was
6.00
%
for the year ended
December 31, 2019
.
The expected return on plan assets for the U.S. qualified pension plans for
2019
was selected in consultation with GCP's independent actuaries using an expected return model. The model determines the weighted average return for an investment portfolio based on the target asset allocation and expected future returns for each asset class, which were developed using a building block approach based on observable inflation, available interest rate information, current market characteristics and historical results.
The target allocation of investment assets at
December 31, 2019
and the actual allocation at
December 31, 2019
and
2018
for GCP's U.S. qualified pension plans were as follows:
|
|
Target
Allocation |
Actual Allocation of Plan Assets
December 31, |
||||||
|
U.S. Qualified Pension Plans Asset Category:
|
2019
|
2019
|
2018
|
|||||
|
U.S. equity securities
|
|
%
|
|
%
|
|
%
|
||
|
Non-U.S. equity securities
|
|
%
|
|
%
|
|
%
|
||
|
Debt securities
|
|
%
|
|
%
|
|
%
|
||
|
Other investments
|
|
%
|
|
%
|
|
%
|
||
|
Total
|
|
%
|
|
%
|
|
%
|
||
106
The following tables present the fair value hierarchy for the U.S. qualified pension plan assets measured at fair value, which are held in a trust by GCP, as of
December 31, 2019
and
2018
.
|
|
Fair Value Measurements at December 31, 2019, Using
|
||||||||||||||
|
(In millions) |
Total
|
Quoted Prices in Active Markets for Identical Assets or Liabilities
(Level 1) |
Significant Other Observable Inputs
(Level 2) |
Significant Unobservable Inputs
(Level 3) |
|||||||||||
|
U.S. equity group trust funds
|
$
|
|
|
$
|
|
|
$
|
|
|
$
|
|
|
|||
|
Non-U.S. equity group trust funds
|
|
|
|
|
|
|
|
|
|||||||
|
Corporate bond group trust funds
|
|
|
|
|
|
|
|
|
|||||||
|
Other fixed income group trust funds
|
|
|
|
|
|
|
|
|
|||||||
|
Common/collective trust funds
|
|
|
|
|
|
|
|
|
|||||||
|
Total Assets
|
$
|
|
|
$
|
|
|
$
|
|
|
$
|
|
|
|||
|
|
Fair Value Measurements at December 31, 2018, Using
|
||||||||||||||
|
(In millions) |
Total
|
Quoted Prices in Active Markets for Identical Assets or Liabilities
(Level 1) |
Significant Other Observable Inputs
(Level 2) |
Significant Unobservable Inputs
(Level 3) |
|||||||||||
|
U.S. equity group trust funds
|
$
|
|
|
$
|
|
|
$
|
|
|
$
|
|
|
|||
|
Non-U.S. equity group trust funds
|
|
|
|
|
|
|
|
|
|||||||
|
Corporate bond group trust funds
|
|
|
|
|
|
|
|
|
|||||||
|
Other fixed income group trust funds
|
|
|
|
|
|
|
|
|
|||||||
|
Common/collective trust funds
|
|
|
|
|
|
|
|
|
|||||||
|
Total Assets
|
$
|
|
|
$
|
|
|
$
|
|
|
$
|
|
|
|||
Non-U.S. pension plans accounted for approximately
69
%
of total global pension assets at
December 31, 2019
and
2018
. Each of these plans, where applicable, follows local requirements and regulations. Some of the local requirements include the establishment of a local pension committee, a formal statement of investment policy and procedures and routine valuations by plan actuaries.
The target allocation of investment assets for non-U.S. pension plans varies depending on the investment goals of the individual plans. The plan assets of the U.K. pension plan represent approximately
91
%
and
92
%
, respectively, of the total non-U.S. pension plan assets for years ended
December 31, 2019
and
2018
. In determining the expected rate of return for the U.K. pension plan, the trustees' strategic investment policy has been considered together with long-term historical returns and investment community forecasts for each asset class. The expected return by sector has been combined with the actual asset allocation to determine the
2019
expected long-term return assumption of
2.14
%
.
107
The target allocation of investment assets at
December 31, 2019
and the actual allocation at
December 31, 2019
and
2018
, for the U.K. pension plan are as follows:
|
|
Target
Allocation |
Actual Allocation of Plan Assets
December 31, |
||||||
|
United Kingdom Pension Plan Asset Category:
|
2019
|
2019
|
2018
|
|||||
|
Diversified growth funds
|
|
%
|
|
%
|
|
%
|
||
|
Return-seeking fixed income investment
|
|
%
|
|
%
|
|
%
|
||
|
U.K. gilts
|
|
%
|
|
%
|
|
%
|
||
|
U.K. corporate bonds
|
|
%
|
|
%
|
|
%
|
||
|
Insurance contracts
|
|
%
|
|
%
|
|
%
|
||
|
Total
|
|
%
|
|
%
|
|
%
|
||
The plan assets for the other countries in aggregate represent approximately
9
%
and
8
%
, respectively, of total non-U.S. pension plan assets for years ended
December 31, 2019
and
2018
.
The following table presents the fair value hierarchy for the non-U.S. pension plan assets measured at fair value as of
December 31, 2019
:
|
|
Fair Value Measurements at December 31, 2019, Using
|
||||||||||||||
|
(In millions)
|
Total
|
Quoted Prices in Active Markets for Identical Assets or Liabilities
(Level 1) |
Significant Other Observable Inputs
(Level 2) |
Significant Unobservable Inputs
(Level 3) |
|||||||||||
|
Common/collective trust funds
|
$
|
|
|
$
|
|
|
$
|
|
|
$
|
|
|
|||
|
Government and agency securities
|
|
|
|
|
|
|
|
|
|||||||
|
Corporate bonds
|
|
|
|
|
|
|
|
|
|||||||
|
Insurance contracts and other investments(1)
|
|
|
|
|
|
|
|
|
|||||||
|
Cash
|
|
|
|
|
|
|
|
|
|||||||
|
Total Assets
|
$
|
|
|
$
|
|
|
$
|
|
|
$
|
|
|
|||
_________________________________________
|
(1)
|
At December 31, 2019, the fair value of the insurance contract has been determined using a discounted cash flow approach that maximizes observable inputs, such as current yields on similar instruments, but includes adjustments for certain risks that may not be observable, such as credit and liquidity risks.
|
108
The following table presents the fair value hierarchy for the non-U.S. pension plan assets measured at fair value as of
December 31, 2018
:
__________________________________________________
|
|
Fair Value Measurements at December 31, 2018, Using
|
||||||||||||||
|
(In millions)
|
Total
|
Quoted Prices in Active Markets for Identical Assets or Liabilities
(Level 1) |
Significant Other Observable Inputs
(Level 2) |
Significant Unobservable Inputs
(Level 3) |
|||||||||||
|
Common/collective trust funds
|
$
|
|
|
$
|
|
|
$
|
|
|
$
|
|
|
|||
|
Government and agency securities
|
|
|
|
|
|
|
|
|
|||||||
|
Corporate bonds
|
|
|
|
|
|
|
|
|
|||||||
|
Insurance contracts and other investments(1)
|
|
|
|
|
|
|
|
|
|||||||
|
Cash
|
|
|
|
|
|
|
|
|
|||||||
|
Total Assets
|
$
|
|
|
$
|
|
|
$
|
|
|
$
|
|
|
|||
|
(1)
|
At December 31, 2018, the fair value of the insurance contract has been determined using a discounted cash flow approach that maximizes observable inputs, such as current yields on similar instruments, but includes adjustments for certain risks that may not be observable, such as credit and liquidity risks.
|
The following table presents a summary of the changes in the fair value of the plans' Level 3 assets for the years ended
December 31, 2019
and
2018
:
|
(In millions)
|
Insurance Contracts
|
||
|
Balance, December 31, 2017
|
$
|
|
|
|
Actual return on plan assets
|
|
|
|
|
Transfers out for benefits paid
|
(
|
)
|
|
|
Currency exchange translation adjustments
|
(
|
)
|
|
|
Balance, December 31, 2018
|
$
|
|
|
|
Actual return on plan assets
|
|
|
|
|
Transfers out for premium
|
(
|
)
|
|
|
Currency exchange translation adjustments
|
|
|
|
|
Balance, December 31, 2019
|
$
|
|
|
Other Postretirement Benefit (OPEB) Plans
GCP provides postretirement health care benefits for certain qualifying retired employees. During the year ended December 31, 2018, GCP recognized a long-term liability of
$
2.0
million
; accumulated other comprehensive income of
$
0.6
million
, net of related tax impact of
$
0.2
million
; as well as expense of
$
1.2
million
, for the initial recognition of a non-U.S. OPEB retiree health care plan. As of
December 31, 2019
and December 31,
2018
, the related long-term liability of
$
2.2
million
and
$
1.7
million
respectively, accumulated other comprehensive income of
$
0.7
million
and
$
0.4
million
respectively, net of related tax impact of
$
0.2
million
and
$
0.1
million
respectively, are included within the Consolidated Balance Sheets. The related expense for the years ended
December 31, 2019
and December 31,
2018
was
$
0.1
million
and
$
1.3
million
, respectively. GCP had no OPEB activity during the year ended December 31, 2017.
109
Plan Contributions and Funding
GCP intends to satisfy its funding obligations under the U.S. qualified pension plans and to comply with all of the requirements of the Employee Retirement Income Security Act of 1974, as amended ("ERISA"). For ERISA purposes, funded status is calculated on a different basis than under GAAP. Based on the U.S. qualified pension plans' status as of
December 31, 2019
, there are
no
minimum requirements under ERISA for
2020
. We made a contribution of
$
0.1
million
to the U.S. pension plans in
2019
and
no
contributions to these plans in
2018
.
GCP intends to fund non-U.S. pension plans based on applicable legal requirements, as well as actuarial and trustee recommendations. GCP expects to contribute
$
1.3
million
to non-U.S. pension plans during the year ended December 31,
2020
. During the years ended December 31,
2019
and
2018
, GCP contributed
$
2.6
million and
$
5.0
million, respectively, to these non-U.S. plans.
Defined Contribution Retirement Plan
110
11.
Other Balance Sheet Accounts
The following is a summary of other current assets at
December 31, 2019
and
2018
:
|
(In millions)
|
December 31,
2019 |
December 31,
2018 |
|||||
|
Other Current Assets:
|
|
|
|||||
|
Non-trade receivables
|
$
|
|
|
$
|
|
|
|
|
Prepaid expenses and other current assets
|
|
|
|
|
|||
|
Income taxes receivable
|
|
|
|
|
|||
|
Total other current assets
|
$
|
|
|
$
|
|
|
|
The following is a summary of other current liabilities at
December 31, 2019
and
2018
:
|
(In millions)
|
December 31,
2019 |
December 31,
2018 |
|||||
|
Other Current Liabilities:
|
|
|
|||||
|
Accrued customer volume rebates
|
$
|
|
|
$
|
|
|
|
|
Accrued compensation
(1)
|
|
|
|
|
|||
|
Income taxes payable
|
|
|
|
|
|||
|
Accrued interest
|
|
|
|
|
|||
|
Restructuring liability
|
|
|
|
|
|||
|
Pension liabilities
|
|
|
|
|
|||
|
Other accrued liabilities
(2)
|
|
|
|
|
|||
|
Total other current liabilities
|
$
|
|
|
$
|
|
|
|
|
(1)
|
Accrued compensation presented in the table above includes salaries and wages, as well as estimated current amounts due under the annual and long-term employee incentive programs.
|
|
(2)
|
Other accrued liabilities presented in the table above as of December 31,
2019
and
2018
include
$
|
12.
Commitments and Contingencies
GCP enters into certain purchase commitments and is a party to many contracts containing guarantees and
indemnification obligations, as described below.
Purchase Commitments
GCP uses purchase commitments to ensure supply and minimize the volatility of certain key raw materials, including lignins, polycarboxylates, amines and other materials. Such commitments are for quantities that GCP fully expects to use in the course of its normal operations.
Guarantees and Indemnification Obligations
GCP is a party to many contracts containing guarantees and indemnification obligations which consist primarily of the following arrangements:
|
•
|
Product warranties with respect to certain products sold to customers in the ordinary course of business. These warranties typically provide assurances that products will conform to their specifications. GCP accrues a general warranty liability at the time of sale based on historical experience and on a transaction-specific basis according to individual facts and circumstances. As of
December 31, 2019
and
2018
and during the periods then ended, warranty-related liabilities and the associated expenses were immaterial to the Consolidated Financial Statements.
|
111
|
•
|
Performance guarantees offered to customers. GCP has not established a liability for these arrangements based on historical experience.
|
|
•
|
Contracts providing for the sale of a business unit or a product line in which GCP has agreed to indemnify the buyer against certain liabilities for conditions that existed prior to the closing of the transaction, including environmental and tax liabilities.
|
|
•
|
The Tax Sharing Agreement, which may require GCP, in certain circumstances, to indemnify Grace if the Separation, together with certain related transactions, does not qualify under Section 355 and certain other relevant provisions of the Internal Revenue Code (the "Code"). If GCP is required to indemnify Grace under the Tax Sharing Agreement, it could be subject to significant tax liabilities. Please refer to Note 9, "Income Taxes", for further information on this arrangement.
|
Environmental Matters
GCP is subject to loss contingencies resulting from extensive and evolving federal, state, local and foreign
environmental laws and regulations relating to the generation, storage, handling, discharge, disposition and
stewardship of hazardous waste and other materials. GCP recognizes accrued liabilities for anticipated costs
associated with response efforts if, based on the results of the assessment, it concluded that a probable liability
has been incurred and the cost can be reasonably estimated. As of
December 31, 2019
and
2018
, GCP did not have any material environmental liabilities.
GCP's environmental liabilities are reassessed whenever circumstances become better defined or response efforts and their costs can be better estimated. These liabilities are evaluated based on currently available information, including the progress of remedial investigations at each site, the current status of discussions with regulatory authorities regarding the method and extent of remediation at each site, existing technology, prior experience in contaminated site remediation and the apportionment of costs among potentially responsible parties.
Financial Assurances
Financial assurances have been established for a variety of purposes, including insurance, environmental and other matters. At
December 31, 2019
and
2018
, GCP had gross financial assurances issued and outstanding of approximately
$
5.9
million
and
$
5.0
million
, respectively, which were comprised of standby letters of credit. The letters of credit are related primarily to customer advances and other performance obligations as of December 31,
2019
and
2018
. These arrangements guarantee the refund of advance payments received from customers in the event that the product is not delivered or warranty obligations are not fulfilled in accordance with the contract terms. These obligations could be called by the beneficiaries at any time before the expiration date of the particular letter of credit if the Company fails to meet certain contractual requirements.
Lawsuits and Investigations
In Re: Library Gardens Balcony Litigation, Lead Case Beary v. Blackrock, Inc. Case No. RG15793054
was filed on November 12, 2015 in Alameda County Superior Court in California. It was the lead case in a consolidated lawsuit filed on behalf of six individuals who died and an additional seven individuals who were injured in a balcony collapse, which occurred on June 16, 2015 in Berkeley, California. The consolidated complaint named the Company as the sole party in the category of suppliers of materials and named twenty additional defendants in other categories, including categories for property owners, property managers, construction defendants and development and design defendants. The consolidated complaint alleged product liability against the Company concerning one of its products. The plaintiffs sought unspecified monetary damages against all defendants and punitive damages only against the building owners, building manager and two construction company defendants. During the year ended December 31, 2017, GCP reached an agreement with the plaintiffs to settle this matter for
$
4.0
million
which was paid by the Company during the period then ended and recorded in "Selling, general and administrative expenses" in the Consolidated Statements of Operations.
112
In addition to the matter identified above, GCP and its subsidiaries, from time to time, are parties to, or targets of, lawsuits, claims, investigations and proceedings which are managed and defended in the ordinary course of business. While GCP is unable to predict the outcome of these matters, it does not believe, based upon currently available facts, that the ultimate resolution of any of such pending matters will have a material adverse effect on its overall financial condition, results of operations or cash flows.
GCP Brazil Indirect Tax Claim
During the year ended December 31, 2019, the Superior Judicial Court of Brazil (the "Court") filed its final ruling in favor of GCP Brazil related to a claim whether a certain state value-added tax should be included in the calculation of federal gross receipts taxes. The Court decision is final and not subject to any appeals. The ruling allows the Company the right to recover, through offset of federal tax liabilities, amounts collected by the government from May 2012 to September 2017, including interest. Timing of the realization of these tax credits is dependent upon the generation of federal tax liabilities eligible for the offset. The Brazilian tax authorities have sought before the Court clarification of certain matters, including whether these credits should be recognized on a gross or net basis, and certain other matters that could affect the rights of Brazilian taxpayers regarding these credits. During the year ended December 31, 2019, the Company recorded in "Other expenses (income), net" a pre-tax gain of
$
1.3
million
, net of
$
0.4
million
of legal fees and other charges, as a result of the favorable Court decision. No amounts were recognized for the credits calculated based on the higher gross basis since there is uncertainty related to the recoverability of such amounts and the timing of the recovery.
Accounting for Contingencies
Although the outcome of each of the matters discussed above cannot be predicted with certainty, GCP has assessed its risk and has made accounting estimates and disclosures as required under GAAP.
13.
Stockholders' Equity
Stockholder Rights Plan
On March 15, 2019, the Board of Directors (the "Board") declared a dividend of
one
preferred share purchase right (a “Right”) for each outstanding share of GCP common stock with par value
$
0.01
per share and adopted a stockholder rights plan (the “Rights Agreement”). The dividend was distributed in a non-cash transaction on March 25, 2019 to the stockholders of record on that date. Each Right will allow its holder to purchase from the Company one one-hundredth of a share of Series A Junior Participating Preferred Stock, par value
$
0.01
per share (a “Preferred Share”) for
$
150
(the “Exercise Price”), once the Rights become exercisable. This portion of a Preferred Share will give the stockholder approximately the same dividend, voting and liquidation rights as would one share of GCP common stock. Prior to exercise, the Right does not give its holder any dividend, voting, or liquidation rights. The fair value of the dividend was not material on March 15, 2019.
The Rights will not be exercisable until
10
days after the public announcement that a person or group has become an “Acquiring Person” (as defined in the Rights Agreement) by obtaining beneficial ownership of
15
%
or more of the Company’s outstanding shares of common stock (provided, that if a stockholder’s beneficial ownership as of the Company’s announcement of the adoption of the Rights Agreement was at or above
15
%
, that stockholder’s existing ownership percentage would be grandfathered, but the Rights would become exercisable if at any time after such announcement, the stockholder increases its ownership percentage by
0.001
%
or more) (the “Distribution Date”). If a person or group becomes an Acquiring Person, all holders of Rights except the Acquiring Person may, for the Exercise Price, purchase shares of the Company’s common stock with a market value of
$
300
, based on the market price of the common stock prior to such acquisition. In addition, after a person or group becomes an Acquiring Person, but before an Acquiring Person owns
50
%
or more of the Company’s outstanding shares of common stock, the Board may extinguish the Rights by exchanging
one
share of common stock or an equivalent security for each Right, other than Rights held by the Acquiring Person. In addition, if the Company is later acquired in a merger or similar transaction after the Distribution Date, all holders of Rights except the Acquiring Person may, for
$
150
, purchase shares of the acquiring corporation with a market value of
$
300
based on the market price of the acquiring corporation’s stock, prior to such merger. The Rights will expire on March 14, 2020, subject to a possible earlier expiration to the extent provided in the Rights Agreement, unless extended.
113
Preferred Stock
The Company is authorized to issue up to
50,000,000
shares of Preferred Stock with a par value of
$
0.01
per share. On March 15, 2019, GCP designated
10,000,000
shares of its Preferred Stock with a par value of
$
0.01
per share as Series A Junior Participating Preferred Stock.
14.
Restructuring and Repositioning Expenses, Asset Impairments
GCP's Board of Directors approves all major restructuring and repositioning programs. Restructuring may involve the discontinuation of significant product lines or the shutdown of significant facilities. From time to time, GCP takes additional restructuring actions, including involuntary employee terminations that are not a part of a major program. Repositioning activities generally represent major strategic or transformational actions to enhance the value and performance of the Company, improve business efficiency or optimize the Company’s footprint.
Repositioning expenses associated with the Plans discussed below, as well as a review of strategic, financial and operational alternatives, are primarily related to consulting, professional services, and other employee-related costs associated with the Company’s organizational realignment and advancing its technology strategy. Due to the scope and complexity of the Company’s repositioning activities, the range of estimated repositioning expenses and capital expenditures could increase or decrease and the timing of incurrence could change.
2019 Restructuring and Repositioning Plan (the “2019 Plan”)
On February 22, 2019, the Board of Directors approved a business restructuring and repositioning plan (the “2019 Plan”). The 2019 Plan is focused on GCP’s global supply chain strategy, processes and execution, including its manufacturing, purchasing, logistics, and warehousing operations. The plan also addresses GCP’s service delivery model, primarily in North America, to streamline the Company’s pursuit of combined admixture and VERIFI
®
opportunities.
The Company expects to incur total pre-tax costs in connection with the 2019 Plan of approximately
$
15
million
to
$
20
million
, of which costs ranging from approximately
$
4
million
to
$
7
million
are related to restructuring and asset impairments, and costs of approximately
$
11
million
to
$
13
million
are related to repositioning. In addition, the Company expects to incur approximately
$
2
million
to
$
3
million
of capital expenditures associated with the program.
Total expected restructuring costs consist of approximately
$
2
million
to
$
3
million
of severance and other employee-related costs,
$
1
million
to
$
3
million
of other associated costs, and approximately
$
1
million
of asset impairments. As of December 31, 2019, GCP incurred
$
0.7
million
of restructuring costs in connection with the 2019 Plan, of which
$
0.4
million
was related to the SCC segment and
$
0.3
million
was related to the SBM segment.
Repositioning costs consist primarily of consulting services to assist GCP in advancing its technology strategy. During the year ended December 31, 2019, GCP incurred repositioning expenses of
$
8.8
million
related to the 2019 Plan. Additionally, the Company incurred
$
0.8
million
of capital expenditures under the 2019 Plan since its inception.
Cash payments made for repositioning under the 2019 Plan for the year ended December 31, 2019 were
$
6.2
million
, which included capital expenditures of
$
0.6
million
. With the exception of asset impairments, substantially all of the restructuring and repositioning expenses are expected to be settled in cash and completed by December 31, 2020.
2019 Phase 2 Restructuring and Repositioning Plan (the “2019 Phase 2 Plan")
On July 31, 2019, the Board approved a business restructuring and repositioning plan to further optimize the design and footprint of the Company's global organization, primarily with respect to its general administration and business support functions, and streamline cross-functional activities (the “2019 Phase 2 Plan”).
The Company expects to incur total pre-tax costs in connection with the 2019 Phase 2 Plan of approximately
$
30
million
to
$
35
million
, of which costs ranging from approximately
$
23
million
to
$
27
million
are related to restructuring and asset impairments and costs of approximately
$
7
million
to
$
8
million
are related to repositioning. The Company expects to incur approximately
$
2
million
of capital expenditures associated with the program.
114
Total expected restructuring activity costs consist of approximately
$
19
million
to
$
22
million
of severance and other employee-related costs and
$
4
million
to
$
5
million
of other associated costs. Total restructuring costs recognized under the 2019 Phase 2 Plan during the year ended December 31, 2019 were
$
3.1
million
, of which
$
1.8
million
was attributable to the SCC segment and
$
1.3
million
was attributable to the SBM segment. The 2019 Phase 2 Plan is expected to result in the net reduction of approximately
8
%
-
10
%
of the Company's workforce. Substantially all of the restructuring activities are expected to be completed by December 31, 2020.
Repositioning costs consist primarily of consulting services and employee-related costs to assist with the Company's organizational realignment. During the year ended December 31, 2019, GCP incurred repositioning expenses of
$
2.4
million
. Additionally, the Company incurred
$
0.1
million
of capital expenditures under the 2019 Phase 2 Plan since its inception.
Cash payments made for repositioning under the 2019 Phase 2 Plan for the year ended December 31, 2019 was
$
1.0
million
. With the exception of asset impairments, substantially all of the restructuring and repositioning expenses are expected to be settled in cash by
December 31, 2021
.
2018 Restructuring and Repositioning Plan (the “2018 Plan”)
On
August 1, 2018
, the Company's Board of Directors approved a business restructuring and repositioning plan. The 2018 Plan was designed to streamline operations and improve profitability primarily within the concrete admixtures product line of the SCC segment by focusing on the Company's core markets, rationalizing non-profitable geographies, reducing its global cost structure and accelerating the integration of VERIFI
®
into the Company’s global admixtures business. Substantially all of the restructuring actions have been completed as of
December 31, 2019
and resulted in the net reductions of approximately
8
%
-
10
%
of the Company's workforce.
As of
December 31, 2019
, the cumulative restructuring activity costs incurred under the 2018 Plan since its inception were
$
22.0
million
, of which
$
16.7
million
were attributable to the SCC segment and
$
5.3
million
were attributable to the SBM segment. Cumulative restructuring activity costs incurred to date consisted of
$
11.5
million
of severance and employee-related costs,
$
0.6
million
of facility exit costs,
$
8.0
million
of asset impairment charges and
$
1.9
million
of other associated costs.
Repositioning costs consisted primarily of consulting services to assist GCP in advancing its technology strategy and have been substantially completed as of December 31, 2019. During each of the years ended
December 31, 2019
and 2018, GCP incurred repositioning expenses of
$
5.3
million
. As of
December 31, 2019
, the cumulative repositioning activity costs and capital expenditures recognized for the 2018 Plan since its inception were approximately
$
10.6
million
and
$
0.9
million
, respectively.
As of
December 31, 2019
, cumulative cash payments made for repositioning under the 2018 Plan since its inception amounted to
$
11.5
million
, including capital expenditures of
$
0.8
million
, of which
$
11.3
million
was made during the year ended
December 31, 2019
. With the exception of asset impairments, the Company expects to settle all of the restructuring and repositioning expenses in cash by
December 31, 2020
.
2017 Restructuring and Repositioning Plan (the “2017 Plan”)
On June 28, 2017, the Board of Directors approved a restructuring and repositioning plan to streamline GCP's operations, reduce its global cost structure and reposition itself as a construction product technologies company.
Total costs expected to be incurred in connection with the 2017 Plan were
$
29
million
, of which
$
19
million
was related to restructuring activities and asset impairments, and
$
10
million
was related to repositioning activities.
Restructuring activities were substantially completed as of
December 31, 2018
. As of
December 31, 2019
, the cumulative restructuring activity costs recognized under the 2017 Plan since its inception were
$
19.1
million
which were attributable as follows: (i)
$
4.6
million
to the SCC segment, (ii)
$
3.3
million
to the SBM segment, (iii)
$
2.8
million
to the Corporate function, and (iv)
$
8.4
million
to discontinued operations. Cumulative restructuring activity costs incurred to date consisted of
$
17.4
million
of severance and employee-related costs,
$
1.5
million
of asset impairments, and
$
0.2
million
of facility exit costs.
Additionally, GCP expects to incur approximately
$
10
million
to
$
15
million
of capital expenditures related to repositioning, which includes the build-out of
two
manufacturing plants in Asia Pacific that will replace shared facilities sold as a part of the Darex divestiture. GCP expects all of its repositioning expenses to be classified within continuing operations and substantially completed by March 31, 2020.
115
As of
December 31, 2019
, the cumulative repositioning activity costs and capital expenditures recognized for the 2017 Plan since its inception were approximately
$
9.6
million
and
$
12.4
million
, respectively. During the year ended
December 31, 2019
, 2018, and 2017 GCP incurred repositioning expenses of
$
0.8
million
,
$
4.3
million
, and
$
4.5
million
, respectively.
During the year ended
December 31, 2019
, total cash payments related to such repositioning expenses were
$
6.7
million
, which included
$
4.6
million
for capital expenditures. As of
December 31, 2019
, cumulative cash payments made for repositioning under the 2017 Plan from its inception amounted to
$
20.8
million
, including capital expenditures. The Company expects to settle in cash substantially all of the costs related to the 2017 Plan.
Restructuring Expenses and Asset Impairments
The following restructuring expenses and asset impairment charges were incurred during each period:
|
Year Ended December 31,
|
|||||||||||
|
(In millions)
|
2019
|
2018
|
2017
|
||||||||
|
Severance and other employee costs
|
$
|
|
|
$
|
|
|
$
|
|
|
||
|
Facility exit costs
|
|
|
|
|
|
|
|||||
|
Asset impairments
|
|
|
|
|
|
|
|||||
|
Other associated costs
|
|
|
$
|
|
|
$
|
|
|
|||
|
Total restructuring expenses and asset impairments
|
$
|
|
|
$
|
|
|
$
|
|
|
||
|
Less: restructuring expenses and asset impairments reflected in discontinued operations
|
|
|
|
|
|
|
|||||
|
Total restructuring expenses and asset impairments from continuing operations
|
$
|
|
|
$
|
|
|
$
|
|
|
||
GCP incurred restructuring expenses and asset impairment charges related to its
two
operating segments and Corporate function as follows:
|
Year Ended December 31,
|
|||||||||||
|
(In millions)
|
2019
|
2018
|
2017
|
||||||||
|
SCC
|
$
|
|
|
$
|
|
|
$
|
|
|
||
|
SBM
|
|
|
|
|
|
|
|||||
|
Corporate
|
|
|
|
|
|
|
|||||
|
Total restructuring expenses and asset impairments from continuing operations
|
$
|
|
|
$
|
|
|
$
|
|
|
||
|
Restructuring expenses and asset impairments reflected in discontinued operations
|
|
|
|
|
|
|
|||||
|
Total restructuring expenses and asset impairments
|
$
|
|
|
$
|
|
|
|
$
|
|
|
|
Restructuring liabilities were
$
2.7
million
and
$
10.2
million
, respectively, as of
December 31, 2019
and
2018
. These liabilities are included within “Other current liabilities” in the Consolidated Balance Sheets. GCP settled in cash substantially all of the remaining liabilities related to the 2017 Plan during the year ended December 31, 2019.
116
The following table summarizes the Company’s restructuring liability activity:
|
2019 Plan
|
2019 Phase 2 Plan
|
2018 Plan
|
2017 Plan
|
||||||||||||||||||||||||||||||||
|
(In millions)
|
Severance and other employee costs
|
Severance and other employee costs
|
Severance and other employee costs
|
Facility exit costs
|
Other Costs
|
Severance and other employee costs
|
Facility exit costs
|
Other plans
|
Total
|
||||||||||||||||||||||||||
|
Balance, December 31, 2016
|
$
|
|
|
$
|
|
|
$
|
|
|
$
|
|
|
$
|
|
|
$
|
|
|
$
|
|
|
$
|
|
|
$
|
|
|
||||||||
|
Expenses
(1)
|
|
|
|
|
|
|
|
|
|
|
|
|
|
|
|
|
|
|
|||||||||||||||||
|
Payments
|
|
|
|
|
|
|
|
|
|
|
(
|
)
|
|
|
(
|
)
|
(
|
)
|
|||||||||||||||||
|
Impact of foreign currency and other
|
|
|
|
|
|
|
|
|
|
|
|
|
|
|
|
|
|
|
|||||||||||||||||
|
Balance, December 31, 2017
|
$
|
|
|
$
|
|
|
$
|
|
|
$
|
|
|
$
|
|
|
$
|
|
|
$
|
|
|
$
|
|
|
$
|
|
|
||||||||
|
Expenses
(1)
|
|
|
|
|
|
|
|
|
|
|
(
|
)
|
|
|
|
|
|
|
|||||||||||||||||
|
Payments
|
|
|
|
|
(
|
)
|
(
|
)
|
|
|
(
|
)
|
(
|
)
|
(
|
)
|
(
|
)
|
|||||||||||||||||
|
Impact of foreign currency and other
|
|
|
|
|
(
|
)
|
|
|
|
|
(
|
)
|
|
|
|
|
(
|
)
|
|||||||||||||||||
|
Balance, December 31, 2018
|
$
|
|
|
$
|
|
|
$
|
|
|
$
|
|
|
$
|
|
|
$
|
|
|
$
|
|
|
$
|
|
|
$
|
|
|
||||||||
|
Expenses
(1)
|
|
|
|
|
|
|
|
|
|
|
|
|
|
|
|
|
|
|
|||||||||||||||||
|
Payments
|
(
|
)
|
(
|
)
|
(
|
)
|
(
|
)
|
(
|
)
|
(
|
)
|
|
|
(
|
)
|
(
|
)
|
|||||||||||||||||
|
Impact of foreign currency and other
|
|
|
|
|
(
|
)
|
|
|
|
|
|
|
|
|
(
|
)
|
(
|
)
|
|||||||||||||||||
|
Balance, December 31, 2019
|
$
|
|
|
$
|
|
|
$
|
|
|
$
|
|
|
$
|
|
|
$
|
|
|
$
|
|
|
$
|
|
|
$
|
|
|
||||||||
|
(1)
|
Asset impairment charges of
$
|
Strategic Alternatives Plan
On February 27, 2019, the Company announced a comprehensive review of strategic alternatives with the goal of enhancing value for our shareholders. Over the course of this review, GCP engaged with both strategic industry players and private equity investors. This process did not result in a transaction that would provide adequate value to the Company's shareholders, and as a result, GCP has determined that it will be pursuing its standalone strategic and financial plan. During the year ended
December 31, 2019
, GCP incurred
$
3.1
million
of repositioning expenses related to its Strategic Alternatives Plan, primarily consisting of professional service fees. Cash payments made for repositioning under the Strategic Plan for the year ended
December 31, 2019
were
$
2.0
million
.
117
15.
Other Comprehensive Income (Loss)
The following tables present the pre-tax, tax and after-tax components of GCP's other comprehensive income (loss) for the years ended
December 31, 2019
,
2018
and
2017
.
|
Year Ended December 31, 2019
|
|||||||||||
|
(In millions)
|
Pre-Tax Amount
|
Tax Benefit/(Expense)
|
After-Tax Amount
|
||||||||
|
Defined benefit pension and other postretirement plans:
|
|||||||||||
|
Net unrealized actuarial loss and prior service cost
|
$
|
(
|
)
|
$
|
|
|
$
|
(
|
)
|
||
|
Benefit plans, net
|
(
|
)
|
|
|
(
|
)
|
|||||
|
Currency translation adjustments
(1)
|
|
|
(
|
)
|
|
|
|||||
|
Loss from hedging activities
|
(
|
)
|
|
|
(
|
)
|
|||||
|
Other comprehensive income attributable to GCP shareholders
|
$
|
|
|
$
|
|
|
$
|
|
|
||
|
Year Ended December 31, 2018
|
|||||||||||
|
(In millions)
|
Pre-Tax Amount
|
Tax Benefit/(Expense)
|
After-Tax Amount
|
||||||||
|
Defined benefit pension and other postretirement plans:
|
|
|
|||||||||
|
Assumption of net prior service cost
|
$
|
(
|
)
|
$
|
|
|
$
|
(
|
)
|
||
|
Benefit plans, net
|
(
|
)
|
|
|
(
|
)
|
|||||
|
Currency translation adjustments
|
(
|
)
|
|
|
(
|
)
|
|||||
|
Gain from hedging activities
|
|
|
|
|
|
|
|||||
|
Other comprehensive loss attributable to GCP shareholders
|
$
|
(
|
)
|
$
|
|
|
$
|
(
|
)
|
||
|
Year Ended December 31, 2017
|
|||||||||||
|
(In millions)
|
Pre-Tax
Amount |
Tax (Expense)/Benefit
|
After-Tax
Amount |
||||||||
|
Defined benefit pension and other postretirement plans:
|
|
|
|||||||||
|
Amortization of net prior service credit
|
$
|
(
|
)
|
$
|
|
|
$
|
(
|
)
|
||
|
Assumption of net prior service credit
|
|
|
(
|
)
|
|
|
|||||
|
Benefit plans, net
|
|
|
(
|
)
|
|
|
|||||
|
Currency translation adjustments
|
|
|
|
|
|
|
|||||
|
Loss from hedging activities
|
(
|
)
|
|
|
(
|
)
|
|||||
|
Other comprehensive income attributable to GCP shareholders
|
$
|
|
|
$
|
(
|
)
|
$
|
|
|
||
|
(1)
|
Currency translation adjustments are presented net of income tax expense related to the net investment hedge, as discussed in Note 4, "Derivative Instruments."
|
118
The following tables present the changes in accumulated other comprehensive loss, net of tax, for the years ended
December 31, 2019
,
2018
and
2017
.
|
Defined Benefit Pension and Other Postretirement Plans
|
Currency Translation Adjustments
|
Hedging Activities
|
Total
|
||||||||||||
|
(In millions)
|
|||||||||||||||
|
Balance, December 31, 2018
|
$
|
(
|
)
|
$
|
(
|
)
|
$
|
|
|
$
|
(
|
)
|
|||
|
Current-period other comprehensive income (loss)
|
(
|
)
|
|
|
(
|
)
|
|
|
|||||||
|
Balance, December 31, 2019
|
$
|
(
|
)
|
$
|
(
|
)
|
$
|
(
|
)
|
$
|
(
|
)
|
|||
|
(In millions)
|
Defined Benefit Pension and Other Postretirement Plans
|
Currency Translation Adjustments
|
Hedging Activities
|
Total
|
|||||||||||
|
Balance, December 31, 2017
|
$
|
|
|
$
|
(
|
)
|
$
|
(
|
)
|
$
|
(
|
)
|
|||
|
Other comprehensive (loss) income before reclassifications
|
(
|
)
|
(
|
)
|
|
|
(
|
)
|
|||||||
|
Amounts reclassified from accumulated other comprehensive income
|
|
|
|
|
(
|
)
|
(
|
)
|
|||||||
|
Net current-period other comprehensive (loss) income
|
(
|
)
|
(
|
)
|
|
|
(
|
)
|
|||||||
|
Balance, December 31, 2018
|
$
|
(
|
)
|
$
|
(
|
)
|
$
|
|
|
$
|
(
|
)
|
|||
|
(In millions) |
Defined Benefit Pension and Other Postretirement Plans
|
Currency Translation Adjustments
|
Hedging Activities
|
Total
|
|||||||||||
|
Balance, December 31, 2016
|
$
|
|
|
$
|
(
|
)
|
$
|
|
|
$
|
(
|
)
|
|||
|
Other comprehensive income (loss) before reclassifications
|
|
|
|
|
(
|
)
|
|
|
|||||||
|
Amounts reclassified from accumulated other comprehensive income
|
|
|
|
|
|
|
|
|
|||||||
|
Net current-period other comprehensive income (loss)
|
|
|
|
|
(
|
)
|
|
|
|||||||
|
Balance, December 31, 2017
|
$
|
|
|
$
|
(
|
)
|
$
|
(
|
)
|
$
|
(
|
)
|
|||
Please refer to Note 10, "Pension Plans and Other Postretirement Benefit Plans" for a discussion of pension plans and other postretirement benefit plans.
16.
Related Party Transactions and Transactions with Grace
Related Parties
All contracts with related parties are at rates and terms that GCP believes are comparable with those that could be entered into with independent third parties. Subsequent to the Separation, transactions with Grace represent third-party transactions.
119
Transition Services Agreement
In connection with the Separation, the Company entered into a transition services agreement pursuant to which GCP and Grace provided various services to each other on a temporary, transitional basis. The services provided by Grace to GCP included information technology, treasury, tax administration, accounting, financial reporting, human resources and other services. Following the Separation, Grace and GCP provided some of these services on a transitional basis, generally for a period of up to
18
months
. During the year ended December 31, 2017, the activities related to the transition services agreement were complete.
Tax Sharing Agreement
In connection with the Separation, the Company and Grace entered into a Tax Sharing Agreement which governs the parties’ respective rights, responsibilities and obligations with respect to tax liabilities and benefits, tax attributes, the preparation and filing of tax returns, the control of audits and other tax proceedings, as well as other matters regarding taxes. In general, and subject to the terms of the Tax Sharing Agreement, GCP is responsible for all U.S. federal, state and foreign taxes, including any related interest, penalties or audit adjustments, reportable on a GCP separate return (a return that does not include Grace or any of its subsidiaries). Grace is responsible for all U.S. federal, state and foreign income taxes, including any related interest, penalties or audit adjustments, reportable on a consolidated, combined or unitary return that includes Grace or any of its subsidiaries and GCP or any of its subsidiaries up to the Separation date. As of December 31, 2019 and 2018, GCP has recorded
$
3.5
million
and
$
3.9
million
, respectively, of indemnified receivables in "Other assets" and
$
1.0
million
and
$
1.8
million
, respectively, of indemnified payables in "Other current liabilities" in the Consolidated Balance Sheets.
In addition, the Tax Sharing Agreement imposes certain restrictions on GCP and its subsidiaries, including restrictions on share issuances, business combinations, sales of assets and similar transactions, that are designed to preserve the qualification of the Distribution, together with certain related transactions, under Section 355 and certain other relevant provisions of the Code. In the event that the Distribution, together with certain related transactions, does not qualify under Section 355 and certain other relevant provisions of the Code, the Tax Sharing Agreement provides specific rules for allocating tax liabilities. In general, under the Tax Sharing Agreement, each party is expected to be responsible for any taxes imposed on and certain related amounts payable by GCP or Grace that arise from the failure of the Distribution and certain related transactions to qualify under Section 355 and certain other relevant provisions of the Code, to the extent that the failure to qualify as such is attributable to actions, events or transactions relating to such party’s respective stock, assets or business, or a breach of the relevant representations or covenants made by such party in the Tax Sharing Agreement.
17.
Stock Incentive Plans
On May 11, 2017, GCP filed a Registration Statement on Form S-8 with the SEC for the purpose of registering an additional
8,000,000
shares of Common Stock, par value
$
0.01
per share, that may be issued under the GCP Applied Technologies Inc. Equity and Incentive Plan (the "Plan"), as amended and restated on February 28, 2017. GCP provides certain key employees equity awards in the form of stock options, restricted stock units (“RSUs”) and performance-based stock units (“PBUs”) under the GCP Applied Technologies Inc. Equity and Incentive Plan (the "Plan"). Certain employees and members of the Board of Directors are eligible to receive stock-based compensation, including stock, stock options, RSUs and PBUs.
Stock-Based Compensation Accounting
Total stock-based compensation expense is included in "Income (loss) from continuing operations before income taxes" in the Consolidated Statements of Operations and was
$
6.2
million
,
$
3.7
million
and
$
9.2
million
, respectively, during the years ended
December 31, 2019
,
2018
and
2017
. During the years ended December 31, 2019 and 2018, the Company recorded stock-based compensation expense reductions of
$
2.4
million
and
$
5.2
million
, respectively, related to remeasurement of PBUs granted in 2019, 2018 and 2017 based on their estimated expected payout at the end of the applicable performance period.
The total income tax benefits recognized for stock-based compensation arrangements were
$
1.5
million
,
$
0.6
million
and
$
4.8
million
, respectively, during the years ended
December 31, 2019
,
2018
and
2017
.
120
The Company issues new shares of common stock upon exercise of stock options. In accordance with certain provisions of the Plan, GCP withholds and retains shares issued to certain holders of GCP awards in order to fulfill statutory tax withholding requirements for the employees. During the years ended
December 31, 2019
,
2018
and
2017
, GCP retained approximately
151,900
shares,
45,100
shares and
47,000
shares, respectively, in a non-cash transaction with a cost of
$
3.8
million
,
$
1.4
million
and
$
1.3
million
, respectively, under such provisions which were reflected as "Share Repurchases" in the Consolidated Statements of Equity (Deficit). During the years ended December 31, 2019, 2018 and 2017, cash payments for such tax withholding obligations were
$
3.8
million
,
$
1.4
million
, and
$
1.3
million
, respectively.
As of
December 31, 2019
, approximately
7.9
million
shares of common stock were reserved and available for future grant under the Plan.
On February 24, 2020, the Compensation Committee of the Board of Directors authorized and approved the 2020 annual grant which had a value of approximately
$
7.2
million
and consisted of approximately
187,000
RSUs and a certain number of PBUs with a grant date of February 24, 2020. The Company is currently estimating the grant date fair value of PBUs and the number of PBUs included in the 2020 annual grant.
Stock Options
Stock options are non-qualified and are granted at exercise prices not less than
100
%
of the fair market value on the grant date. The awards issued before February 28, 2017 were granted at the exercise price equal to fair market value on the grant date determined as the average of the high market price and low market price of the Company’s stock from that trading day. The awards issued after February 28, 2017 were granted at the exercise price equal to fair market value on the grant date determined as the market closing price of the Company’s stock on that date. Stock option awards granted typically have a contractual term of
five
to
ten years
from the original date of grant. Generally, stock options are granted in three separate vesting tranches, with each tranche vesting over one, two and
three years
, respectively, from the date of grant.
The following assumptions were utilized in the Black-Scholes option pricing model for estimating the fair value of GCP's stock options granted during the years ended December 31,
2019
,
2018
and
2017
:
|
Year Ended December 31,
|
|||||
|
Assumptions used to calculate expense for stock options:
|
2019
|
2018
|
2017
|
||
|
Risk-free interest rate
|
1.70 -2.64%
|
2.68 - 2.80%
|
1.83 - 2.11%
|
||
|
Average life of options (years)
|
5.5 - 6.5
|
5.5 - 6.5
|
5.5 - 6.5
|
||
|
Volatility
|
28.02 - 28.59%
|
27.91 - 30.65%
|
31.42 - 31.96%
|
||
|
Weighted average grant date fair value per stock option
|
$
|
$
|
$
|
||
121
The following table sets forth the information related to stock options denominated in GCP stock during the year ended December 31,
2019
:
|
Stock Option Activity
|
Number Of
Shares (in thousands) |
Weighted
Average Exercise Price |
Weighted
Average Remaining Contractual Term (years) |
Aggregated
Intrinsic Value (in thousands) |
||||||||
|
Outstanding, December 31, 2018
|
|
|
$
|
|
|
|
$
|
|
|
|||
|
Options exercised
|
(
|
)
|
|
|
|
|
|
|||||
|
Options forfeited/expired/canceled
|
(
|
)
|
|
|
|
|
|
|||||
|
Options granted
|
|
|
|
|
|
|
|
|||||
|
Outstanding, December 31, 2019
|
|
|
$
|
|
|
|
$
|
|
|
|||
|
Exercisable, December 31, 2019
|
|
|
$
|
|
|
|
$
|
|
|
|||
|
Vested and expected to vest, December 31, 2019
|
|
|
$
|
|
|
|
$
|
|
|
|||
The weighted average grant date fair value of options granted during the years ended December 31, 2019, 2018, and 2017 was
$
8.66
,
$
10.63
, and
$
9.17
, respectively. The aggregate intrinsic values in the table above represent the total pre-tax intrinsic value, determined as the difference between GCP's closing stock price on the last trading day of
December 31, 2019
and 2018 and the exercise price, multiplied by the number of in-the-money options that would have been received by the option holders had all option holders exercised their in-the-money options at period end. The amount changes based on the fair market value of GCP's stock. Total intrinsic value of all options exercised during the
year
s ended
December 31, 2019
,
2018
and
2017
was
$
3.0
million
,
$
4.8
million
and
$
9.8
million
, respectively.
At
December 31, 2019
, total unrecognized stock-based compensation expense for stock options outstanding was
$
0.6
million
and is expected to be recognized over the weighted-average period of approximately
one year
.
Restricted Stock Units and Performance Based Units
RSUs and PBUs are granted with the exercise price equal to zero and are converted to shares immediately upon vesting.
As of
December 31, 2019
,
$
2.3
million
of total unrecognized compensation expense related to the RSU and PBU awards is expected to be recognized over the remaining weighted-average service period of approximately
1.5
years
.
RSUs
The Company grants RSUs which are time-based, non-performance units. RSUs generally vest over a
three
year period, with some awards vesting in substantially equal amounts each year over
three years
and some awards vesting
100
%
after the third year from the date of grant. A smaller number of RSUs were designated as sign-on awards which are used for purposes of attracting key employees and covering outstanding awards from prior employers. Such awards vest
100
%
after
two years
from the date of grant.
RSUs are recorded at fair value on the date of grant. The common stock-settled awards are considered equity awards, with the stock compensation expense being determined based on GCP’s stock price on the grant date.
122
The following table sets forth the RSU activity for the year ended
December 31, 2019
:
|
RSU Activity:
|
Number Of
Shares (in thousands) |
Weighted
Average Grant Date Fair Value |
||||
|
Outstanding, December 31, 2018
|
|
|
$
|
|
|
|
|
RSU's settled
|
(
|
)
|
|
|
||
|
RSU's forfeited
|
(
|
)
|
|
|
||
|
RSU's granted
|
|
|
|
|
||
|
Outstanding, December 31, 2019
|
|
|
$
|
|
|
|
|
Expected to vest as of December 31, 2019
|
|
|
$
|
|
|
|
The weighted average grant date fair value of RSUs granted during the years ended December 31,
2019
,
2018
and
2017
was
$
26.77
,
$
29.28
and
$
26.44
per share, respectively. During the years ended December 31,
2019
,
2018
and
2017
, GCP distributed
302,000
shares,
117,000
shares and
107,000
shares, respectively, to settle RSUs upon vesting. During the years ended December 31,
2018
and
2017
GCP also used
$
1.2
million
and
$
0.9
million
of cash, respectively, to settle RSUs upon vesting. GCP expects to settle in stock all future RSU vestings. The fair value of RSUs vested during the years ended December 31,
2019
,
2018
and
2017
was
$
7.4
million
,
$
4.8
million
and
$
3.8
million
, respectively.
PBUs
PBUs are performance-based units which are granted by the Company with market conditions. The performance criteria for PBUs granted in 2016 is based on a
3
-year cumulative adjusted earnings per share measure. The number of shares earned by employees was based on the achievement of applicable performance targets related to such measure and could range between
0
%
to
200
%
. During the year ended December 31, 2019, PBUs granted in 2016 were settled by the distribution of
76,461
shares of GCP common stock based on the actual performance of
68.7
%
achieved against the cumulative adjusted earnings per share measure during the years 2016-2018. The actual performance measure for the 2016 PBU grants was certified by the Compensation Committee during the period then ended. The performance criteria for PBUs granted in 2017 and 2018 include a
3
-year cumulative adjusted diluted earnings per share metric that is modified, up or down, based on the Company's total shareholder return ("TSR") relative to the performance of the Russell 3000 Index. For PBUs granted in 2019, such metric is modified, up or down, based on the Company's TSR relative to the performance of the Russell 3000 Specialty Chemicals and Building Materials Indices. The number of shares that ultimately vest, if any, is based on Company performance against these metrics, and can range from
0
%
to
200
%
of the target number of shares granted to employees. The 2019, 2018 and 2017 awards will become vested, if at all,
three years
from the grant date once actual performance is certified by the Board's Compensation Committee. Vesting is also subject to the employees' continued employment through the vesting date.
123
The following table summarizes the assumptions used in the Monte Carlo simulations for estimating the grant date fair values of PBUs granted during the years ended December 31,
2019
,
2018
and
2017
:
|
Year Ended December 31,
|
|||||
|
Assumptions used to calculate expense for PBUs:
|
2019
|
2018
|
2017
|
||
|
Expected term (remaining performance period)
|
|
|
|
||
|
Expected volatility
|
|
|
|
||
|
Risk-free interest rate
|
|
|
|
||
|
Expected dividends
|
|
|
|
||
|
Correlation coefficient
|
|
|
|
||
|
Average correlation coefficient of constituents
|
|
|
|
||
The following table sets forth the PBU activity for the year ended
December 31, 2019
:
|
PBU Activity:
|
Number Of
Shares (in thousands) |
Weighted
Average Grant Date Fair Value |
||||
|
Outstanding, December 31, 2018
|
|
|
$
|
|
|
|
|
PBU's settled
|
(
|
)
|
|
|
||
|
PBU's forfeited
|
(
|
)
|
|
|
||
|
PBU's granted
|
|
|
|
|
||
|
Outstanding, December 31, 2019
|
|
|
$
|
|
|
|
The weighted average grant date fair value of PBUs granted during the years ended December 31, 2019, 2018 and 2017 was
$
27.19
,
$
34.20
and
$
28.29
per share, respectively. During the year ended December 31, 2019, GCP distributed
76,461
shares to settle PBUs upon vesting. GCP expects to settle in stock all future PBU vestings. The fair value of PBUs vested during the year ended December 31, 2019 was
$
2.0
million
.
18.
Operating Segment and Geographic Information
GCP is engaged in the production and sale of specialty construction chemicals and specialty building materials through its
two
operating and reportable segments. Specialty Construction Chemicals ("SCC") operating segment manufactures and markets concrete admixtures and cement additives and supplies in-transit monitoring systems for concrete producers. Specialty Building Materials ("SBM") operating segment manufactures and markets sheet and liquid membrane systems that protect structures from water, air and vapor penetration, as well as fireproofing and other products designed to protect the building envelope.
124
Operating Segment Data
The following table presents information related to GCP's operating segments:
|
Year Ended December 31,
|
|||||||||||
|
(In millions)
|
2019
|
2018
|
2017
|
||||||||
|
Net Sales
|
|||||||||||
|
Specialty Construction Chemicals
|
$
|
|
|
$
|
|
|
$
|
|
|
||
|
Specialty Building Materials
|
|
|
|
|
|
|
|||||
|
Total net sales
|
$
|
|
|
$
|
|
|
$
|
|
|
||
|
Segment Operating Income
|
|||||||||||
|
Specialty Construction Chemicals segment operating income
|
$
|
|
|
$
|
|
|
$
|
|
|
||
|
Specialty Building Materials segment operating income
|
|
|
|
|
|
|
|||||
|
Total segment operating income
|
$
|
|
|
$
|
|
|
$
|
|
|
||
|
Depreciation and Amortization
|
|||||||||||
|
Specialty Construction Chemicals
|
$
|
|
|
$
|
|
|
$
|
|
|
||
|
Specialty Building Materials
|
|
|
|
|
|
|
|||||
|
Corporate
|
|
|
|
|
|
|
|||||
|
Total depreciation and amortization
|
$
|
|
|
$
|
|
|
$
|
|
|
||
|
Capital Expenditures
|
|
|
|
|
|||||||
|
Specialty Construction Chemicals
|
$
|
|
|
$
|
|
|
$
|
|
|
||
|
Specialty Building Materials
|
|
|
|
|
|
|
|||||
|
Corporate
|
|
|
|
|
|
|
|||||
|
Total capital expenditures
|
$
|
|
|
$
|
|
|
$
|
|
|
||
|
Total Assets
|
|||||||||||
|
Specialty Construction Chemicals
|
$
|
|
|
$
|
|
|
$
|
|
|
||
|
Specialty Building Materials
|
|
|
|
|
|
|
|||||
|
Corporate
|
|
|
|
|
|
|
|||||
|
Assets held for sale
|
|
|
|
|
|
|
|||||
|
Total assets
|
$
|
|
|
$
|
|
|
$
|
|
|
||
Reconciliation of Operating Segment Data to Financial Statements
Corporate expenses directly related to the operating segments are allocated to the segment's operating income. GCP excludes from the segments' operating income certain functional costs, certain impacts of foreign currency exchange (related primarily to Argentina for the year ended December 31, 2018 and Venezuela for periods up through its deconsolidation date of July 3, 2017, as discussed in Note 1, "Basis of Presentation and Summary of Significant Accounting and Financial Reporting Policies"), as well as certain corporate costs and other costs included in the table below. GCP also excludes from the segment's operating income certain ongoing defined benefit pension costs recognized during each reporting period, which include service and interest costs, the effect of expected returns on plan assets and amortization of prior service costs/credits. GCP believes that the exclusion of certain corporate costs and pension costs provides a better indicator of its operating segment performance since such costs are not managed at an operating segment level.
125
Total segment operating income for the years ended
December 31, 2019
,
2018
and
2017
is reconciled below to "Income (loss) from continuing operations before income taxes" presented in the Consolidated Statements of Operations:
|
Year Ended December 31,
|
|||||||||||
|
(In millions)
|
2019
|
2018
|
2017
|
||||||||
|
Total segment operating income
|
$
|
|
|
$
|
|
|
$
|
|
|
||
|
Corporate costs
(1)
|
(
|
)
|
(
|
)
|
(
|
)
|
|||||
|
Certain pension costs
|
(
|
)
|
(
|
)
|
(
|
)
|
|||||
|
Gain on Brazil tax recoveries, net
(2)
|
|
|
|
|
|
|
|||||
|
Loss on sale of product line
|
|
|
|
|
(
|
)
|
|||||
|
Currency and other financial losses in Venezuela
|
|
|
|
|
(
|
)
|
|||||
|
Litigation settlement
|
|
|
|
|
(
|
)
|
|||||
|
Legacy product, environmental and other claims
|
(
|
)
|
|
|
(
|
)
|
|||||
|
Shareholder activism and other related costs
|
(
|
)
|
|
|
|
|
|||||
|
Repositioning expenses
|
(
|
)
|
(
|
)
|
(
|
)
|
|||||
|
Restructuring expenses and asset impairments
|
(
|
)
|
(
|
)
|
(
|
)
|
|||||
|
Pension MTM adjustment and other related costs, net
|
(
|
)
|
|
|
(
|
)
|
|||||
|
Gain on termination and curtailment of pension and other postretirement plans
|
|
|
|
|
|
|
|||||
|
Third-party and other acquisition-related costs
|
(
|
)
|
(
|
)
|
(
|
)
|
|||||
|
Other financing costs
|
|
|
|
|
(
|
)
|
|||||
|
Amortization of acquired inventory fair value adjustment
|
|
|
(
|
)
|
(
|
)
|
|||||
|
Tax indemnification adjustments
|
(
|
)
|
(
|
)
|
(
|
)
|
|||||
|
Interest expense, net
(3)
|
(
|
)
|
(
|
)
|
(
|
)
|
|||||
|
Currency losses in Argentina
|
|
|
(
|
)
|
|
|
|||||
|
Net income attributable to noncontrolling interests
|
|
|
|
|
|
|
|||||
|
Income (loss) from continuing operations before income taxes
|
$
|
|
|
$
|
|
|
$
|
(
|
)
|
||
|
(1)
|
Management allocates certain corporate costs to each operating segment to the extent such costs are directly attributable to the segments. For the year ended December 31, 2017, corporate costs include approximately
$
|
|
(2)
|
Gain on Brazil tax recoveries, net primarily consists of a
$
|
|
(3)
|
Interest expense, net includes a loss of
$
|
126
Sales by Product Group
The following table sets forth sales by product group within the SCC operating segment and the SBM operating segment during the years ended December 31, 2019, 2018 and 2017:
|
|
Year Ended December 31,
|
||||||||||
|
(In millions)
|
2019
|
2018
|
2017
|
||||||||
|
Specialty Construction Chemicals:
|
|
|
|||||||||
|
Concrete
|
$
|
|
|
$
|
|
|
$
|
|
|
||
|
Cement
|
|
|
|
|
|
|
|||||
|
Total SCC Sales
|
$
|
|
|
$
|
|
|
$
|
|
|
||
|
Specialty Building Materials:
|
|
||||||||||
|
Building Envelope
|
$
|
|
|
$
|
|
|
$
|
|
|
||
|
Residential Building Products
|
|
|
|
|
|
|
|||||
|
Specialty Construction Products
|
|
|
|
|
|
|
|||||
|
Total SBM Sales
|
$
|
|
|
$
|
|
|
$
|
|
|
||
|
Total Sales
|
$
|
|
|
$
|
|
|
$
|
|
|
||
Disaggregation of Total Net Sales
The Company disaggregates its revenue from contracts with customers by operating segments, which it believes best depicts how the nature, amount, timing and uncertainty of revenue and cash flows are affected by economic factors.
Geographic Area Data
The following table sets forth net sales information related to the geographic areas in which GCP operates:
|
Year Ended December 31,
|
|||||||||||
|
(In millions)
|
2019
|
2018
|
2017
|
||||||||
|
Net Sales
|
|||||||||||
|
United States
|
$
|
|
|
$
|
|
|
$
|
|
|
||
|
Canada and Other
|
|
|
|
|
|
|
|||||
|
Total North America
|
|
|
|
|
|
|
|||||
|
Europe Middle East Africa
|
|
|
|
|
|
|
|||||
|
Asia Pacific
|
|
|
|
|
|
|
|||||
|
Latin America
|
|
|
|
|
|
|
|||||
|
Total
|
$
|
|
|
$
|
|
|
$
|
|
|
||
Sales are attributed to geographic areas based on customer locations. With the exception of the U.S. presented in the table above, there were no individually significant countries with sales exceeding
10%
of total sales during the years ended December 31, 2019, 2018 and 2017. There were no customers that individually accounted for
10%
or more of the Company’s consolidated operating revenues for the years ended December 31, 2019, 2018, or 2017. There were no customers that individually accounted for
10%
or more of the Company's accounts receivable balance as of December 31, 2019 and 2018.
Disaggregation of Long-Lived Assets
As a result of adopting Topic 842, the Company has recorded
$
29.3
million
of operating lease right-of-use-assets as of
December 31, 2019
. The Company disaggregates such assets by operating segments and geographic areas in which GCP operates. Please refer to Note 1, "Basis of Presentation and Summary of Significant Accounting and Financial Reporting Policies" and Note 6, "Lessee Arrangements" for further discussion on the accounting treatment and impact of adopting Topic 842.
127
The following table sets forth long-lived asset information related to the geographic areas in which GCP operates:
|
Year Ended December 31,
|
|||||||
|
(In millions)
|
2019
|
2018
|
|||||
|
Properties and Equipment, net
|
|
|
|||||
|
United States
|
$
|
|
|
$
|
|
|
|
|
Canada and Other
|
|
|
|
|
|||
|
Total North America
|
|
|
|
|
|||
|
Europe Middle East Africa (EMEA)
|
|
|
|
|
|||
|
Asia Pacific
|
|
|
|
|
|||
|
Latin America
|
|
|
|
|
|||
|
Total
|
$
|
|
|
$
|
|
|
|
|
Operating lease right-of-use assets
|
|||||||
|
United States
|
$
|
|
|
$
|
—
|
|
|
|
Canada
|
|
|
—
|
|
|||
|
Total North America
|
|
|
—
|
|
|||
|
Europe, Middle East, and Africa
|
|
|
—
|
|
|||
|
Asia Pacific
|
|
|
—
|
|
|||
|
Latin America
|
|
|
—
|
|
|||
|
Total
|
$
|
|
|
$
|
—
|
|
|
|
Goodwill, Intangibles and Other Assets
|
|||||||
|
United States
|
$
|
|
|
$
|
|
|
|
|
Canada and Other
|
|
|
|
|
|||
|
Total North America
|
|
|
|
|
|||
|
Europe Middle East Africa (EMEA)
|
|
|
|
|
|||
|
Asia Pacific
|
|
|
|
|
|||
|
Latin America
|
|
|
|
|
|||
|
Total
|
$
|
|
|
$
|
|
|
|
Total long-lived assets located in the United Kingdom represented approximately
20
%
of total long-lived assets as of December 31, 2019 and 2018. With the exception of the U.S. and the United Kingdom, there are no other individually significant countries with long-lived assets exceeding
10%
of total long-lived assets as of December 31, 2019 and 2018.
128
19.
Earnings Per Share
The following table sets forth a reconciliation of the numerators and denominators used in calculating basic and diluted earnings (loss) per share:
_______________________________
|
Year Ended December 31,
|
|||||||||||
|
(In millions, except per share amounts)
|
2019
|
2018
|
2017
|
||||||||
|
Numerators
|
|||||||||||
|
Income (loss) from continuing operations attributable to GCP shareholders
|
$
|
|
|
$
|
(
|
)
|
$
|
(
|
)
|
||
|
Income from discontinued operations, net of income taxes
|
|
|
|
|
|
|
|||||
|
Net income attributable to GCP shareholders
|
$
|
|
|
$
|
|
|
$
|
|
|
||
|
Denominators
|
|
|
|
|
|||||||
|
Weighted average common shares—basic calculation
|
|
|
|
|
|
|
|||||
|
Dilutive effect of employee stock awards
(1)
|
|
|
|
|
|
|
|||||
|
Weighted average common shares—diluted calculation
|
|
|
|
|
|
|
|||||
|
Basic earnings (loss) per share
|
|||||||||||
|
Income (loss) from continuing operations attributable to GCP shareholders
|
$
|
|
|
$
|
(
|
)
|
$
|
(
|
)
|
||
|
Income from discontinued operations, net of income taxes
|
$
|
|
|
$
|
|
|
$
|
|
|
||
|
Net income attributable to GCP shareholders
|
$
|
|
|
$
|
|
|
$
|
|
|
||
|
Diluted earnings (loss) per share
(1)
|
|||||||||||
|
Income (loss) from continuing operations attributable to GCP shareholders
|
$
|
|
|
$
|
(
|
)
|
$
|
(
|
)
|
||
|
Income from discontinued operations, net of income taxes
|
$
|
|
|
$
|
|
|
$
|
|
|
||
|
Net income attributable to GCP shareholders
|
$
|
|
|
$
|
|
|
$
|
|
|
||
|
(1)
|
Dilutive effect not applicable to the periods in which GCP generated a loss from continuing operations.
|
GCP uses the treasury stock method to compute diluted earnings (loss) per share. During the years ended December 31,
2018
and
2017
, there were
no
anti-dilutive shares based on the treasury stock method as a result of a loss from continuing operations incurred during the periods then ended. During the year ended December 31, 2019,
0.6
million
of anti-dilutive stock awards were excluded from the computation of diluted earnings per share based on the treasury stock method as a result of an income from continuing operations generated during the period.
As of December 31,
2018
and
2017
, total outstanding options of
1.5
million
and
1.6
million
, respectively, and total outstanding RSUs of
0.4
million
as of the end of each period were excluded from the computation of diluted loss per share due to a loss from continuing operations incurred during the years ended December 31,
2018
and
2017
.
129
The following table sets forth the weighted average options and RSUs excluded from the computation of dilutive shares and diluted loss per share that would have been reflected in the "Dilutive effect of employee stock awards" line in the table above:
________________________________
|
Year Ended December 31,
|
|||||||
|
(In millions of shares)
|
2019
|
2018
|
2017
|
||||
|
Dilutive effect:
(1)
|
|
|
|
||||
|
Options
|
N/A
|
|
|
|
|
||
|
RSUs
|
N/A
|
|
|
|
|
|
|
|
(1)
|
N/A - Dilutive effect is included in computation of diluted earnings per share under the treasury stock method for periods in which GCP generated income from continuing operations.
|
20.
Acquisitions and Dispositions
The Company did not complete any material acquisitions during the year ended December 31, 2019. Please refer to Note 1, "Basis of Presentation and Summary of Significant Accounting and Financial Reporting Policies" for further discussion regarding the accounting treatment for business acquisitions.
Acquisitions Completed in 2018
Clydebridge Holdings Limited
On May 4, 2018, GCP acquired
100
%
of the outstanding capital stock of Clydebridge Holdings Limited which owns
100
%
of RIW Limited (the "RIW"), a U.K.-based supplier of waterproofing solutions for commercial and residential construction applications. The acquisition has strengthened GCP’s position in the U.K. waterproofing market and has complemented its product portfolio within the SBM operating segment by adding waterproofing capabilities for a wider range of projects. The aggregate purchase price of
$
29.7
million
at the date of acquisition, net of cash acquired of
$
10.0
million
, consisted of a net cash payment of
$
29.8
million
, which was reduced by working capital adjustments of
$
0.1
million
. During the year ended December 31, 2018, the Company finalized certain closing adjustments with the seller by recording a
$
0.2
million
reduction in both consideration paid and inventories. The Company finalized the purchase price allocation and fair values of assets acquired and liabilities assumed during the year ended December 31, 2019.
The Company accounted for the acquisition as a business combination in accordance with provisions of ASC 805,
Business Combinations
("ASC 805"). The operating results of RIW have been reflected in the results of operations for the SBM operating segment from the date of the acquisition.
The following table summarizes the final allocation of the purchase price paid and the amounts of assets acquired and liabilities assumed for the acquisition based upon their estimated fair values at the date of acquisition. Such balances are reflected in the Consolidated Balance Sheets as of December 31, 2018:
|
(In millions)
|
Net Assets Acquired
|
||
|
Accounts receivable (approximates contractual value)
|
$
|
|
|
|
Inventories
|
|
|
|
|
Property, plant and equipment
|
|
|
|
|
Intangible assets
|
|
|
|
|
Goodwill
|
|
|
|
|
Accounts payable
|
(
|
)
|
|
|
Accrued liabilities
|
(
|
)
|
|
|
Deferred tax liabilities
|
(
|
)
|
|
|
Net assets acquired
|
$
|
|
|
130
At the closing of the acquisition of RIW, a portion of the consideration was placed into escrow which was ascribed to the purchase price and will be released to the sellers no later than December 30, 2020. The escrow was related to the sellers’ satisfaction of indemnity claims and general representations and warranties. During the year ended December 31, 2019, a portion of the consideration was released from the escrow based on the provisions of the related agreement.
Goodwill represents the excess of the consideration transferred over the fair value of the net assets acquired and has been assigned to the SBM operating segment. Goodwill is primarily the result of expected synergies from combining the operations of RIW with GCP's operations and is not deductible for tax purposes.
The following table presents the fair values of the intangible assets acquired and their weighted average amortization periods:
|
Amount
(in millions)
|
Weighted-Average Amortization Period
(in years)
|
||||
|
Customer relationships
|
$
|
|
|
|
|
|
Developed technology
|
|
|
|
||
|
Trademarks and trade names
|
|
|
|
||
|
Total
|
$
|
|
|
||
The Company used the income approach in accordance with the excess-earnings method to estimate the fair value of customer relationships, equal to the present value of the incremental after-tax cash flows attributable to the intangible asset. The Company used the income approach in accordance with the relief-from-royalty method to estimate the fair values of the trademarks and trade names, as well as developed technology which is equal to the present value of the after-tax royalty savings attributable to owning the intangible asset. The total weighted average amortization period of the intangible assets acquired is
10
years using methods that approximate the pattern in which the economic benefits are expected to be realized.
Acquisition-related costs incurred for the RIW acquisition during the year ended December 31, 2018 were included in "Selling, general and administrative expenses" in the Consolidated Statements of Operations and were not material. The Company did not present a proforma information summary for its consolidated results of operations for the year ended December 31, 2018 as if the acquisition of RIW occurred on January 1, 2017 because such results were not material.
Acquisitions Completed in 2017
Ductilcrete Technologies
On October 31, 2017, GCP acquired
100
%
of the share capital of Ductilcrete Technologies (the "Ductilcrete"), a U.S.-based technology leader for concrete engineered systems, for total consideration of
$
31.8
million
, net of
$
1.5
million
of cash acquired. The acquisition of Ductilcrete has expanded its technology platform with new product categories and engineered systems that allow it to access a wider range of customers.
The Company accounted for the acquisition as a business combination in accordance with provisions of ASC 805 and reflected Ductilcrete's operating results from the date of the acquisition within the operating results of the SCC operating segment.
The Company allocated the acquisition purchase price to the assets acquired and liabilities assumed determined from a market participant perspective and recognized the excess as goodwill which has been assigned to the SCC operating segment. As of December 31, 2017, the Company recognized
$
14.0
million
of goodwill, which is tax-deductible and amortized for tax purposes over
15
years. The goodwill is attributable to the revenue growth and operating synergies that GCP expects to realize from this acquisition.
During the year ended December 31, 2018, the Company finalized certain closing adjustments with the seller and its purchase price allocation by recording a
$
0.3
million
reduction in both consideration paid and accounts receivable.
131
The following table summarizes the final allocation of the purchase price paid and the amounts of assets acquired and liabilities assumed for the acquisition based upon their estimated fair values at the date of the acquisition. Such balances are reflected in the Consolidated Balance Sheets as of December 31, 2018:
|
(In millions)
|
Net Assets Acquired
|
||
|
Accounts receivable
|
$
|
|
|
|
Other current assets
|
|
|
|
|
Properties and equipment
|
|
|
|
|
Goodwill
|
|
|
|
|
Intangible assets
|
|
|
|
|
Accounts payable
|
(
|
)
|
|
|
Net assets acquired
|
$
|
|
|
The following table presents the fair values of the intangible assets acquired and their weighted average amortization periods:
|
Amount
(In millions)
|
Weighted-Average Amortization Period
(in years)
|
||||
|
Customer relationships
|
$
|
|
|
|
|
|
Technology
|
|
|
|
||
|
Trademarks
|
|
|
|
||
|
Total
|
$
|
|
|
||
Stirling Lloyd Plc
On May 17, 2017, GCP acquired
100
%
of the share capital of Stirling Lloyd Plc (the "Stirling Lloyd"), a UK-based global supplier of high-performance liquid waterproofing and coatings products, for total consideration of
$
91.1
million
, net of
$
16.1
million
of cash acquired. The Company believes that the addition of Stirling Lloyd and its products, which are used for the protection of infrastructure and buildings, opens new growth opportunities by offering additional selling channels for specialized end-market applications.
The Company elected the early adoption of ASU 2017-01,
Business Combinations (Topic 805): Clarifying the Definition of a Business,
in conjunction with the acquisition of Stirling Lloyd, as described in Note 1, "Basis of Presentation and Summary of Significant Accounting and Financial Reporting Policies", and accounted for the acquisition as a business combination. Stirling Lloyd's operating results have been reflected within the operating results of the SBM operating segment from the date of the acquisition. The Company allocated the acquisition purchase price to the assets acquired and liabilities assumed determined from a market participant perspective and recognized the excess of
$
59.6
million
as goodwill which has been assigned to the SBM operating segment. Goodwill is attributable to the revenue growth and operating synergies that GCP expects to realize from this acquisition and is not deductible for tax purposes. During the year ended December 31, 2017, the Company finalized its purchase price allocation.
132
The following table summarizes the final allocation of the purchase price paid and the amounts of assets acquired and liabilities assumed for the acquisition based upon their estimated fair values at the date of acquisition. Such balances are reflected in the Consolidated Balance Sheets as of December 31, 2017:
|
(In millions)
|
Net Assets Acquired
|
||
|
Accounts receivable
|
$
|
|
|
|
Other current assets
|
|
|
|
|
Inventories
|
|
|
|
|
Properties and equipment
|
|
|
|
|
Goodwill
|
|
|
|
|
Intangible assets
|
|
|
|
|
Accounts payable
|
(
|
)
|
|
|
Other current liabilities
|
(
|
)
|
|
|
Other liabilities
|
(
|
)
|
|
|
Net assets acquired
|
$
|
|
|
The following table presents the fair values of the intangible assets acquired and their weighted average amortization periods:
|
Amount
(In millions)
|
Weighted-Average Amortization Period
(in years)
|
||||
|
Customer relationships
|
$
|
|
|
|
|
|
Technology
|
|
|
|
||
|
Trademarks
|
|
|
|
||
|
Total
|
$
|
|
|
||
During the year ended December 31, 2018, the Company reached a settlement with the sellers of Stirling Lloyd related to certain warranty claims and received
$
3.1
million
of proceeds released from an escrow account as a result of such settlement. The proceeds of
$
3.1
million
were received after finalizing the purchase price allocation and completion of the measurement period. GCP recognized the proceeds in the results of operations during the year ended December 31, 2018, of which
$
2.6
million
was included in "Other expense (income), net" in the Consolidated Statements of Operations.
Revenue from RIW, Ductilcrete and Stirling Lloyd was not material individually, or in the aggregate, to the Company's consolidated revenue during the years ended December 31, 2019 and 2018. Net income from RIW, Ductilcrete and Stirling Lloyd was not material individually to the Company's consolidated "Income (loss) from continuing operations" during the years ended December 31, 2019 and 2018. In the aggregate, net income from RIW, Ductilcrete and Stirling Lloyd was not material to the Company's consolidated "Income (loss) from continuing operations" during the years ended December 31, 2019 and amounted to
$
13.5
million
during the year ended December 31, 2018.
Supplemental Pro Forma Information
During the year ended December 31, 2017, GCP completed acquisitions of Ductilcrete and Stirling Lloyd, which when considered in aggregate, were material to the Company's Consolidated Financial Statements. Stirling Lloyd contributed revenue of
$
33.1
million
and income from continuing operations of
$
2.8
million
to GCP for the period from May 17, 2017 to December 31, 2017, and Ductilcrete contributed revenue of
$
1.2
million
and income from continuing operations of
$
0.1
million
to GCP for the period from October 31, 2017 to December 31, 2017.
133
The following unaudited pro forma summary presents consolidated results of operations for GCP and these business combinations as if they had occurred on January 1, 2016:
|
(In millions)
|
Pro forma year ended December 31, 2017 (unaudited)
|
||
|
Revenue
|
$
|
|
|
|
Loss from continuing operations
|
$
|
(
|
)
|
GCP reflected non-recurring pro forma adjustments directly attributable to the business combinations in the pro forma revenue and loss from continuing operations reported above. The unaudited pro forma financial information is presented for informational purposes only and is not necessarily indicative of the results of operations that would have been achieved if these acquisitions had taken place on January 1, 2016. The non-recurring proforma adjustments are related to prepaid compensation expense, recognition of step-up in value of the acquired inventories adjusted to fair value on the acquisition date, interest expense and acquisition-related costs. These pro forma amounts have been calculated after applying GCP's accounting policies and adjusting the results of Stirling Lloyd and Ductilcrete to reflect the additional amortization expense that would have been charged assuming the intangible assets had been acquired on January 1, 2016.
During the year ended December 31, 2017, GCP incurred
$
2.1
million
of acquisition-related costs for the Ductilcrete and Stirling Lloyd acquisitions, which are included in "Selling, general and administrative expenses" in the Consolidated Statements of Operations for the year ended December 31, 2017.
Disposal of Non-core Halex Net Assets
On November 9, 2016, GCP acquired
100
%
of the stock of Halex Corporation ("Halex"), a North American supplier of specialty moisture barrier flooring underlayment products, seam tapes, as well as other flooring and accessories, for total consideration of
$
46.0
million
, net of
$
2.4
million
of cash acquired. The acquisition has expanded GCP's building envelope product portfolio and provided growth opportunities within the SBM operating segment. The acquisition of Halex was accounted for as a business combination.
134
21.
Discontinued Operations
On July 3, 2017, the Company completed the sale of Darex to Henkel for
$
1.06
billion
in cash (the “Disposition”). The agreement with Henkel governing the Disposition (the “Amended Purchase Agreement”) provides for a series of delayed closings in certain non-U.S. jurisdictions, including Argentina, China, Colombia, Indonesia, Peru and Venezuela for which sale proceeds were received on the July 3, 2017 closing date. The delayed closings implement the legal transfer of the Darex business in the delayed closing jurisdictions in accordance with local law. During the year ended December 31, 2019, the Company completed the delayed closing in Indonesia and recorded an after-tax gain of $
7.2
million
. During the year ended December 31, 2018, the Company completed the delayed closings in Argentina, Colombia, Peru and China and recorded an after-tax gain of
$
31.5
million
on the sale of the delayed close entities in these countries. During the year ended December 31, 2017, the Company recorded an after-tax gain of
$
678.9
million
on the sale of the Darex entities that closed on July 3, 2017. In January 2020, the delayed closing in Venezuela was completed. The Company does not expect to record a gain or a loss on the closing of the sale of the Darex business in Venezuela. Up to the time of the delayed closings, the results of the operations of the Darex business within the delayed close countries are reported as “Income from discontinued operations, net of income taxes” in the Consolidated Statements of Operations,
with the exception of operations in Venezuela which were deconsolidated during 2017.
As of December 31, 2018, a liability of
$
13.6
million
related to the consideration received by GCP for the delayed closings was recognized in “Other current liabilities.” During the year ended December 31, 2019, GCP reduced the liability by
$
13.1
million
which represented the sale proceeds received on July 3, 2017 for the delayed closing in Indonesia. The remaining liability of
$
0.5
million
for the consideration received on July 3, 2017 related to the delayed closing in Venezuela is recorded in “Other current liabilities” as of December 31, 2019.
The following table includes a reconciliation of the gain on the sale of the Darex business related to delayed close entities recorded during the years ended December 31,
2019
,
2018
, and
2017
:
|
Year Ended December 31,
|
|||||||||||
|
(In millions)
|
2019
|
2018
|
2017
|
||||||||
|
Net proceeds included in gain
|
$
|
|
|
$
|
|
|
$
|
|
|
||
|
Transaction costs
|
|
|
|
|
(
|
)
|
|||||
|
Net assets derecognized
|
(
|
)
|
(
|
)
|
(
|
)
|
|||||
|
Gain recognized before income taxes
|
|
|
|
|
|
|
|||||
|
Tax effect of gain recognized
|
(
|
)
|
(
|
)
|
(
|
)
|
|||||
|
Gain recognized after income taxes
|
$
|
|
|
$
|
|
|
$
|
|
|
||
In connection with the Disposition and the related gain, as noted above, the Company recorded tax expense of
$
2.4
million
,
$
12.0
million
, and
$
201.9
million
, respectively, within discontinued operations during the years ended December 31,
2019
,
2018
and 2017. As a result of the Disposition, GCP recorded an unrecognized tax benefit of
$
32.4
million
, which is reflected in the tax effect of the gain and within income tax expense in discontinued operations for the year ended December 31, 2017. There was no unrecognized tax benefit recorded in discontinued operations during the years ended December 31,
2019
and
2018
.
In connection with the Disposition, the Company and Henkel also entered into a Transition Services Agreement pursuant to which Henkel and the Company were to provide various services to each other in connection with the transition of the Darex business to Henkel. The services were related to real estate, information technology, accounts payable, payroll and other finance functions, as well as administrative services and covered various periods up to
36
months
following the closing date. The services substantially ended during the year ended December 31, 2018. The charges for such services generally allow the servicing party to recover all out-of-pocket costs and expenses and are recorded in "Other expenses (income), net" in the Consolidated Statements of Operations.
135
Additionally, in connection with the Disposition, the Company and Henkel entered into a Master Tolling Agreement, whereby Henkel will operate certain equipment at facilities being sold in order to manufacture and prepare for shipping certain products related to product lines that the Company continues to own. The Company and Henkel expect these services to be provided for a period of
32
months
following the closing date.
Under the Amended Purchase Agreement, GCP is required to indemnify Henkel for certain possible future tax liabilities. As of December 31, 2019 and 2018, GCP has recorded an indemnification payable of
$
0.9
million
as a result of the Disposition.
The following table sets forth the components of "Income from discontinued operations, net of income taxes" in the Consolidated Statements of Operations:
|
Year Ended December 31,
|
|||||||||||
|
(In millions)
|
2019
|
2018
|
2017
|
||||||||
|
Net sales
|
$
|
|
|
$
|
|
|
$
|
|
|
||
|
Cost of goods sold
|
|
|
|
|
|
|
|||||
|
Gross profit
|
|
|
(
|
)
|
|
|
|||||
|
Selling, general and administrative expenses
|
|
|
|
|
|
|
|||||
|
Research and development expenses
|
|
|
|
|
|
|
|||||
|
Restructuring expenses and asset impairments
|
|
|
|
|
|
|
|||||
|
Loss in Venezuela
|
|
|
|
|
|
|
|||||
|
Gain on sale of business
|
(
|
)
|
(
|
)
|
(
|
)
|
|||||
|
Other expenses (income), net
|
|
|
(
|
)
|
|
|
|||||
|
Income from discontinued operations before income taxes
|
|
|
|
|
|
|
|
||||
|
Provision for income taxes
|
(
|
)
|
(
|
)
|
(
|
)
|
|||||
|
Less: Net income attributable to noncontrolling interests
|
|
|
|
|
(
|
)
|
|||||
|
Income from discontinued operations, net of income taxes
|
$
|
|
|
$
|
|
|
$
|
|
|
||
The following table sets forth carrying amounts of the major classes of assets and liabilities of Darex which are classified as held for sale in the Consolidated Balance Sheets as of
December 31, 2019
and
2018
:
|
(In millions)
|
December 31, 2019
|
December 31, 2018
|
|||||
|
Trade accounts receivable
|
$
|
|
|
$
|
|
|
|
|
Inventories, net
|
|
|
|
|
|||
|
Current assets held for sale
|
|
|
|
|
|||
|
Properties and equipment, net
|
|
|
|
|
|||
|
Other assets
|
|
|
|
|
|||
|
Non-current assets held for sale
|
|
|
|
|
|||
|
Underfunded and unfunded defined benefit pension plans
|
|
|
|
|
|||
|
Non-current liabilities held for sale
|
$
|
|
|
$
|
|
|
|
22.
Quarterly Summary and Statistical Information (Unaudited)
On July 3, 2017, the Company completed the sale of Darex to Henkel. In conjunction with this transaction and applicable GAAP, the results of operations for Darex have been excluded from continuing operations and reflected as "discontinued operations" in the Consolidated Statements of Operations for all periods presented. Please refer to Note 21, "Discontinued Operations" for further information on the transaction.
136
The following tables present quarterly unaudited consolidated statement of operations information for the years ended December 31, 2019 and 2018:
|
Three Months Ended,
|
Year Ended,
|
|||||||||||||||||||
|
(In millions, except per share amounts)
|
March 31, 2019
(1)(2)
|
June 30, 2019
|
September 30, 2019
|
December 31, 2019
|
December 31, 2019
|
|||||||||||||||
|
Net sales
|
$
|
|
|
$
|
|
|
$
|
|
|
$
|
|
|
$
|
|
|
|||||
|
Gross profit
|
|
|
|
|
|
|
|
|
|
|
||||||||||
|
Net income
|
|
|
|
|
|
|
|
|
|
|
||||||||||
|
Income from continuing operations attributable to GCP shareholders
|
|
|
|
|
|
|
|
|
|
|
||||||||||
|
Income (loss) from discontinued operations, net of income taxes
:
|
|
|
(
|
)
|
(
|
)
|
(
|
)
|
|
|
||||||||||
|
Income attributable to GCP shareholders
|
$
|
|
|
$
|
|
|
$
|
|
|
$
|
|
|
$
|
|
|
|||||
|
Income (loss) per share
|
||||||||||||||||||||
|
Basic earnings (loss) per share:
|
||||||||||||||||||||
|
Income from continuing operations attributable to GCP shareholders
|
$
|
|
|
$
|
|
|
$
|
|
|
$
|
|
|
$
|
|
|
|||||
|
Income (loss)
from discontinued operations, net of income taxes
|
$
|
|
|
$
|
(
|
)
|
$
|
(
|
)
|
$
|
|
|
$
|
|
|
|||||
|
Net income attributable to GCP shareholders
|
$
|
|
|
$
|
|
|
$
|
|
|
$
|
|
|
$
|
|
|
|||||
|
Diluted earnings (loss) per share
(3):
|
||||||||||||||||||||
|
Income from continuing operations
|
$
|
|
|
$
|
|
|
$
|
|
|
$
|
|
|
$
|
|
|
|||||
|
Income (loss)
from discontinued operations, net of income taxes
|
$
|
|
|
$
|
(
|
)
|
$
|
(
|
)
|
$
|
|
|
$
|
|
|
|||||
|
Net income attributable to GCP shareholders
|
$
|
|
|
$
|
|
|
$
|
|
|
$
|
|
|
$
|
|
|
|||||
________________________________
|
(1)
|
During the three months ended March 31, 2019, GCP recognized a tax benefit of
$
|
|
(2)
|
During the three months ended March 31, 2019, GCP recognized an after tax gain of
$
|
|
(3)
|
Dilutive effect is only applicable to the periods during which GCP generated net income from continuing operations.
Per share results for the four quarters may differ from full-year per share results, as a separate computation of the weighted average number of shares outstanding is made for each quarter presented.
|
137
|
Three Months Ended,
|
Year Ended,
|
||||||||||||||||||
|
(In millions, except per share amounts)
|
March 31, 2018
(2)
|
June 30, 2018
(1)
|
September 30, 2018
(2)
|
December 31, 2018
|
December 31, 2018
|
||||||||||||||
|
Net sales
|
$
|
|
|
$
|
|
|
$
|
|
|
$
|
|
|
$
|
|
|
||||
|
Gross profit
|
|
|
|
|
|
|
|
|
|
|
|||||||||
|
Net (loss) income
|
(
|
)
|
(
|
)
|
|
|
|
|
|
|
|||||||||
|
(Loss) income from continuing operations attributable to GCP shareholders
|
(
|
)
|
(
|
)
|
|
|
|
|
(
|
)
|
|||||||||
|
Income from discontinued operations, net of income taxes:
|
|
|
|
|
|
|
|
|
|
|
|||||||||
|
(Loss) income attributable to GCP shareholders
|
$
|
(
|
)
|
$
|
(
|
)
|
$
|
|
|
$
|
|
|
$
|
|
|
||||
|
(Loss) income per share:
|
|||||||||||||||||||
|
Basic (loss) earnings per share:
|
|||||||||||||||||||
|
(Loss) income from continuing operations attributable to GCP shareholders
|
$
|
(
|
)
|
$
|
(
|
)
|
$
|
|
|
$
|
|
|
$
|
(
|
)
|
||||
|
Income from discontinued operations, net of income taxes
|
$
|
|
|
$
|
|
|
$
|
|
|
$
|
|
|
$
|
|
|
||||
|
Net (loss) income attributable to GCP shareholders
|
$
|
(
|
)
|
$
|
(
|
)
|
$
|
|
|
$
|
|
|
$
|
|
|
||||
|
Diluted (loss) earnings per share
(3)
:
|
|||||||||||||||||||
|
(Loss) income from continuing operations
|
$
|
(
|
)
|
$
|
(
|
)
|
$
|
|
|
$
|
|
|
$
|
(
|
)
|
||||
|
Income from discontinued operations, net of income taxes
|
$
|
|
|
$
|
|
|
$
|
|
|
$
|
|
|
$
|
|
|
||||
|
Net (loss) income attributable to GCP shareholders
|
$
|
(
|
)
|
$
|
(
|
)
|
$
|
|
|
$
|
|
|
$
|
|
|
||||
________________________________
|
(1)
|
GCP recognized a loss on debt refinancing of
$
|
|
(2)
|
During the three months ended March 31, 2018 and the three months ended September 30, 2018, GCP recognized an after tax gain of
$
|
|
(3)
|
Dilutive effect is only applicable to the periods during which GCP generated net income from continuing operations.
Per share results for the four quarters may differ from full-year per share results, as a separate computation of the weighted average number of shares outstanding is made for each quarter presented.
|
GCP APPLIED TECHNOLOGIES AND SUBSIDIARIES
FINANCIAL STATEMENT SCHEDULE II—VALUATION AND QUALIFYING ACCOUNTS AND RESERVES
(In millions)
For the Year Ended
December 31, 2019
|
Balance at beginning of period
|
Additions charged to costs and expenses
|
Deductions
|
Other, net
(1)
|
Balance at end of period
|
|||||||||||||||
|
Valuation and qualifying accounts deducted from assets:
|
|
|
|
|
|
||||||||||||||
|
Allowances for notes and accounts receivable
|
$
|
|
|
$
|
|
|
$
|
(
|
)
|
$
|
(
|
)
|
$
|
|
|
||||
|
Inventory obsolescence reserve
|
$
|
|
|
|
|
(
|
)
|
|
|
$
|
|
|
|||||||
|
Valuation allowance for deferred tax assets
|
$
|
|
|
|
|
(
|
)
|
(
|
)
|
$
|
|
|
|||||||
___________________________________________________________________________________________________________________
|
(1)
|
Various miscellaneous adjustments against reserves and effects of currency translation.
|
138
For the Year Ended
December 31, 2018
|
Balance at beginning of period
|
Additions charged to costs and expenses
|
Deductions
(1)
|
Other, net
(2)
|
Balance at end of period
|
|||||||||||||||
|
Valuation and qualifying accounts deducted from assets:
|
|
|
|
|
|
||||||||||||||
|
Allowances for notes and accounts receivable
|
$
|
|
|
$
|
|
|
$
|
(
|
)
|
$
|
(
|
)
|
$
|
|
|
||||
|
Inventory obsolescence reserve
|
$
|
|
|
|
|
(
|
)
|
|
|
$
|
|
|
|||||||
|
Valuation allowance for deferred tax assets
|
$
|
|
|
|
|
(
|
)
|
(
|
)
|
$
|
|
|
|||||||
___________________________________________________________________________________________________________________
|
(1)
|
Deductions from valuation allowance for deferred tax assets include
$
|
|
(2)
|
Various miscellaneous adjustments against reserves and effects of currency translation.
|
For the Year Ended
December 31, 2017
|
Balance at beginning of period
|
Additions charged to costs and expenses
|
Deductions
|
Other, net
(1)
|
Balance at end of period
|
|||||||||||||||
|
Valuation and qualifying accounts deducted from assets:
|
|
|
|
|
|
||||||||||||||
|
Allowances for notes and accounts receivable
|
$
|
|
|
$
|
|
|
$
|
|
|
$
|
|
|
$
|
|
|
||||
|
Inventory obsolescence reserve
|
$
|
|
|
|
|
(
|
)
|
(
|
)
|
$
|
|
|
|||||||
|
Valuation allowance for deferred tax assets
|
$
|
|
|
|
|
(
|
)
|
|
|
$
|
|
|
|||||||
___________________________________________________________________________________________________________________
|
(1)
|
Various miscellaneous adjustments against reserves and effects of currency translation.
|
139
None.
Management's Evaluation of Disclosure Controls and Procedures
As of the end of the period covered by this annual report, our principal executive officer and principal financial officer evaluated the effectiveness of our disclosure controls and procedures (as defined in Rule 13a-15(e) and 15d-15(e) of the Securities Exchange Act of 1934, as amended (the Exchange Act)). Based on the evaluation as of
December 31, 2019
, our principal executive officer and principal financial officer concluded that our disclosure controls and procedures were effective to provide reasonable assurance that the information required to be disclosed in reports that we file or submit under the Exchange Act is accumulated and communicated to management, and made known to our principal executive officer and principal financial officer, on a timely basis to ensure that it is recorded, processed, summarized and reported within the time periods specified in the SEC’s rules and forms.
Management’s Report on Internal Control Over Financial Reporting
Our management, with the participation of our principal executive officer and principal financial officer, is responsible for establishing and maintaining adequate internal control over financial reporting. Internal control over financial reporting is defined in Rules 13a-15(f) and 15d-15(f) of the Exchange Act as a process designed by, or under the supervision of, the company’s principal executive and principal financial officers and effected by the company’s board of directors, management and other personnel, to provide reasonable assurance regarding the reliability of financial reporting and the preparation of financial statements for external purposes in accordance with generally accepted accounting principles. Our internal control over financial reporting includes those policies and procedures that:
|
•
|
pertain to the maintenance of records that, in reasonable detail, accurately and fairly reflect our transactions and dispositions of our assets;
|
|
•
|
provide reasonable assurance that transactions are recorded as necessary to permit preparation of financial statements in accordance with GAAP, and that our receipts and expenditures are being made only in accordance with authorizations of our management and directors; and
|
|
•
|
provide reasonable assurance regarding prevention or timely detection of unauthorized acquisition, use or disposition of our assets that could have a material effect on our financial statements.
|
Because of its inherent limitations, internal control over financial reporting may not prevent or detect misstatements. Also, projections of any evaluation of effectiveness to future periods are subject to the risk that controls may become inadequate because of changes in conditions, or that the degree of compliance with the policies or procedures may deteriorate.
Our management assessed the effectiveness of the Company’s internal control over financial reporting as of
December 31, 2019
. In making this assessment, our management used the criteria set forth by the Committee of Sponsoring Organizations of the Treadway Commission (COSO) in
Internal Control - Integrated Framework (2013)
.
Based on our assessment, management, with the participation of our Chief Executive Officer and Interim Chief Financial Officer, concluded that, as of
December 31, 2019
, our internal control over financial reporting was effective based on those criteria.
The effectiveness of the Company’s internal control over financial reporting as of
December 31, 2019
has been audited by PricewaterhouseCoopers LLP, an independent registered public accounting firm, as stated in their report which is included under Item 8 of this Annual Report on Form 10-K.
140
Changes in Internal Control over Financial Reporting
There were no changes in our internal control over financial reporting during the fourth quarter of
2019
that have materially affected or are reasonably likely to materially affect our internal control over financial reporting.
None.
Information regarding members of our Board of Directors will be contained in our definitive proxy statement for the
2020
Annual Meeting of Stockholders ("
2020
Proxy Statement") under the captions “Proposal One: Election of Directors” and “Corporate Governance” and is incorporated herein by reference. Information regarding our executive officers is contained in Part I of this Form 10-K under the caption "Executive Officers of the Registrant." The information contained in the
2020
Proxy Statement under the captions “Corporate Governance - Section 16(a) Beneficial Ownership Reporting Compliance” and ”Corporate Governance - Audit Committee” is incorporated herein by reference.
We have adopted a code of ethics that applies to all of our directors, officers, employees and representatives. Information regarding our code of ethics will be contained in our
2020
Proxy Statement under the caption “Corporate Governance-Code of Ethics and Conflicts of Interest” and is incorporated herein by reference.
Information regarding the procedures by which our stockholders may recommend nominees to our Board of Directors will be contained in our
2020
Proxy Statement under the caption “Corporate Governance - Director Nomination Process; Shareholder Recommendations for Director Nominees” and is incorporated herein by reference.
This information will be contained in our
2020
Proxy Statement under the captions “Executive Compensation” and “Corporate Governance - Director Compensation” and is incorporated herein by reference.
141
Equity Compensation Plan Information
The following table provides certain information as of December 31, 2019 concerning the shares of the Company’s Common Stock that may be issued under existing equity compensation plans.
|
Plan Category
|
Number of securities to be issued upon exercise of outstanding options, warrants and rights (a)
(1)
|
Weighted-average exercise price of outstanding options, warrants and rights (b)
(2)
|
Number of securities remaining available for future issuance under equity compensation plans (excluding securities reflected in column (a))
(c)
|
|||||||
|
Equity compensation plans approved by security holders
|
1,981,727
|
|
$
|
22.66
|
|
7,893,866
|
|
|||
|
Equity compensation plans not approved by security holders
|
—
|
|
—
|
|
—
|
|
||||
|
Total
|
1,981,727
|
|
$
|
22.66
|
|
7,893,866
|
|
|||
__________________________
|
(1)
|
Under the Equity and Incentive Plan, there are
1,284,187
shares of GCP common stock to be issued upon the exercise of outstanding options,
541,702
shares to be issued upon completion of the performance period for stock-settled PBUs, based on achievement against the performance targets for PBUs granted during the year ended December 31,
2017
, and the maximum number of shares that could be earned with respect to PBUs granted during the years ended December 31,
2019
and
2018
, and
155,838
shares to be issued upon completion of the vesting period for stock-settled restricted stock unit awards (“RSUs”).
|
|
(2)
|
The calculation of weighted-average exercise price does not include outstanding PBUs and RSUs.
|
The additional information regarding security ownership of certain beneficial owners, as well as for directors and executive officers will be contained in our
2020
Proxy Statement under the caption “Other Information - Stock Ownership of Certain Beneficial Owners and Management” and is incorporated herein by reference.
This information will be contained in our
2020
Proxy Statement under the captions “Other Information - Transactions with Related Persons,” “Proposal One: Election of Directors” and “Corporate Governance - Number and Independence of Directors” and is incorporated herein by reference.
This information will be contained in our
2020
Proxy Statement under the caption “Proposal Two: Ratification of the Appointment of Independent Registered Public Accounting Firm - Principal Accountant Fees and Services” and is incorporated herein by reference.
142
(a) Financial Statements and Schedules.
|
(1) and (2)
|
The required information is set forth in Item 8—"Financial Statements and Supplementary Data."
|
(3) Exhibit Index:
|
Incorporated by Reference
|
||||||||
|
Exhibit No.
|
Exhibit Description
|
Form
|
Exhibit
|
Filing Date
|
||||
|
2.1
|
8-K
|
2.1
|
1/28/16
|
|||||
|
2.2
|
|
8-K
|
2.1
|
7/3/17
|
||||
|
3.1
|
8-K
|
3.1
|
2/4/16
|
|||||
|
3.2
|
8-K
|
3.1
|
5/3/18
|
|||||
|
3.3
|
8-K
|
3.1
|
3/15/19
|
|||||
|
3.4
|
8-K
|
3.2
|
5/3/18
|
|||||
|
4.1
|
8-K
|
4.1
|
4/10/18
|
|||||
|
4.2
|
8-K
|
4.2
|
4/10/18
|
|||||
|
4.3
|
8-K
|
4.1
|
3/15/19
|
|||||
|
4.4
|
Filed herewith
|
|||||||
|
10.1
|
8-K
|
10.1
|
1/28/16
|
|||||
|
10.2
|
8-K
|
10.2
|
1/28/16
|
|||||
|
10.3
|
8-K
|
10.3
|
1/28/16
|
|||||
|
10.4
|
8-K
|
10.4
|
1/28/16
|
|||||
|
10.5
|
8-K
|
10.5
|
1/28/16
|
|||||
|
10.6
|
8-K
|
10.1
|
2/4/16
|
|||||
143
|
Incorporated by Reference
|
||||||||
|
10.7
|
8-K
|
10.1
|
8/25/16
|
|||||
|
10.8
|
8-K
|
10.1
|
4/10/18
|
|||||
|
10.9
|
8-K
|
10.5
|
2/4/16
|
|||||
|
10.10
|
8-K
|
10.2
|
2/4/16
|
|||||
|
10.11
|
10-K
|
10.10
|
3/2/17
|
|||||
|
10.12
|
8-K
|
10.3
|
2/4/16
|
|||||
|
10.13
|
8-K
|
10.4
|
2/4/16
|
|||||
|
10.14
|
10-K
|
10.11
|
3/30/16
|
|||||
|
10.15
|
S-8
|
4.4
|
1/28/16
|
|||||
|
10.16
|
S-8
|
4.5
|
1/28/16
|
|||||
|
10.17
|
S-8
|
4.6
|
1/28/16
|
|||||
|
10.18
|
8-K
|
10.2
|
2/11/16
|
|||||
|
10.19
|
8-K
|
10.1
|
2/11/16
|
|||||
|
10.20
|
10-K
|
10.17
|
3/30/16
|
|||||
|
10.21
|
10-K
|
10.18
|
3/30/16
|
|||||
|
10.22
|
10-K
|
10.19
|
3/30/16
|
|||||
|
10.23
|
10-K
|
10.23
|
3/2/17
|
|||||
|
10.24
|
8-K
|
10.1
|
5/5/17
|
|||||
|
10.25
|
10-Q
|
10.1
|
5/9/17
|
|||||
|
10.26
|
10-Q
|
10.2
|
5/9/17
|
|||||
|
10.27
|
10-Q
|
10.3
|
5/9/17
|
|||||
|
10.28
|
8-K
|
10.1
|
7/12/18
|
|||||
|
10.29
|
10-Q
|
10.1
|
8/8/19
|
|||||
|
10.30
|
10-Q
|
10.2
|
8/8/19
|
|||||
|
10.31
|
Filed herewith
|
|||||||
|
10.32
|
Filed herewith
|
|||||||
|
21
|
Filed herewith
|
|||||||
|
23
|
Filed herewith
|
|||||||
|
31.1
|
Filed herewith
|
|||||||
|
31.2
|
Filed herewith
|
|||||||
144
|
Incorporated by Reference
|
||||||||
|
32
|
Filed herewith
|
|||||||
|
101.INS
|
XBRL Instance Document
|
Filed herewith
|
||||||
|
101.SCH
|
XBRL Taxonomy Extension Schema
|
Filed herewith
|
||||||
|
101.CAL
|
XBRL Taxonomy Extension Calculation Linkbase
|
Filed herewith
|
||||||
|
101.DEF
|
XBRL Taxonomy Extension Definition Linkbase
|
Filed herewith
|
||||||
|
101.LAB
|
XBRL Taxonomy Extension Label Linkbase
|
Filed herewith
|
||||||
|
101.PRE
|
XBRL Taxonomy Extension Presentation Linkbase
|
Filed herewith
|
||||||
* Management contract or compensatory plan.
(b) See Item 15(a)(3) above.
(c) See Item 15(a)(1) and (2) above.
145
Not applicable.
146
SIGNATURES
Pursuant to the requirements of Section 13 or 15(d) of the Securities Exchange Act of 1934, the registrant has duly caused this Report to be signed on its behalf by the undersigned, thereunto duly authorized.
|
|
GCP Applied Technologies Inc.
(Registrant)
|
|
|
By:
|
/s/ RANDALL S. DEARTH
|
|
|
Randall S. Dearth
President and Chief Executive Officer
(Principal Executive Officer)
|
||
|
By:
|
/s/ CRAIG A. MERRILL
|
|
|
Craig A. Merrill
Interim Chief Financial Officer
(Principal Financial Officer)
|
||
|
By:
|
/s/ KENNETH S. KOROTKIN
|
|
|
Kenneth S. Korotkin
Vice President, Controller and Chief Accounting Officer
(Principal Accounting Officer)
|
||
Dated:
February 27, 2020
Pursuant to the requirements of the Securities Exchange Act of 1934, this Report has been signed below by the following persons on behalf of the registrant and in the capacities indicated on
February 27, 2020
.
|
/s/ RANDALL S. DEARTH
|
President and Chief Executive Officer (Principal Executive Officer)
|
|
|
(Randall S. Dearth)
|
||
|
/s/ CRAIG A. MERRILL
|
Interim Chief Financial Officer (Principal Financial Officer)
|
|
|
(Craig A. Merrill)
|
||
|
/s/ KENNETH S. KOROTKIN
|
Vice President, Controller and Chief Accounting Officer
(Principal Accounting Officer)
|
|
|
(Kenneth S. Korotkin)
|
||
|
/s/ MARRAN H. OGILVIE
|
Director
|
|
|
(Marran H. Ogilvie)
|
||
|
/s/ CLAY KIEFABER
|
Director
|
|
|
(Clay Kiefaber)
|
||
|
/s/ GERALD G. COLELLA
|
Director
|
|
|
(Gerald G. Colella)
|
||
|
/s/ JANICE K. HENRY
|
Director
|
|
|
(Janice K. Henry)
|
||
|
/s/ JAMES F. KIRSCH
|
Director
|
|
|
(James F. Kirsch)
|
||
|
/s/ PHILLIP J. MASON
|
Director
|
|
|
(Phillip J. Mason)
|
||
|
/s/ ELIZABETH MORA
|
Non-Executive Chairman of the Board
|
|
|
(Elizabeth Mora)
|
||
|
/s/ DANNY R. SHEPHERD
|
Director
|
|
|
(Danny R. Shepherd)
|
||
147
TABLE OF CONTENTS
Part IItem 1. BusinessItem 1A. Risk FactorsItem 1B. Unresolved Staff CommentsItem 2. PropertiesItem 3. Legal ProceedingsItem 4. Mine Safety DisclosuresPart IIItem 5. Market For Registrant's Common Equity, Related Shareholder Matters and Issuer Purchases Of Equity SecuritiesItem 6. Selected Financial DataItem 7. Management's Discussion and Analysis Of Financial Condition and Results Of OperationsItem 7A. Quantitative and Qualitative Disclosures About Market RiskItem 8. Financial Statements and Supplementary DataItem 9. Changes in and Disagreements with Accountants on Accounting and Financial DisclosureItem 9A. Controls and ProceduresItem 9B. Other InformationPart IIIItem 10. Directors, Executive Officers and Corporate GovernanceItem 11. Executive CompensationItem 12. Security Ownership Of Certain Beneficial Owners and Management and Related Stockholder MattersItem 13. Certain Relationships and Related Transactions and Director IndependenceItem 14. Principal Accountant Fees and ServicesPart IVItem 15. Exhibits and Financial Statement SchedulesItem 16. Form 10-k Summary