GODADDY INC.
10-Ks and 10-Qs
|
|
|
|
|
|
|
|
|
|
|
|
|
|
|
|
|
|
|
|
|
|
|
|
|
|
|
|
|
|
|
|
|
|
|
|
|
|
|
|
|
UNITED STATES
SECURITIES AND EXCHANGE COMMISSION
Washington, D.C. 20549
FORM
10-K
(Mark One)
|
☒
|
ANNUAL REPORT PURSUANT TO SECTION 13 OR 15(d) OF THE SECURITIES EXCHANGE ACT OF 1934
|
|||
For the fiscal year ended
December 31, 2017
or
|
☐
|
TRANSITION REPORT PURSUANT TO SECTION 13 OR 15(d) OF THE SECURITIES EXCHANGE ACT OF 1934
|
|||
For the transition period from __________ to __________
Commission File Number:
001-36904

GoDaddy Inc.
(Exact name of registrant as specified in its charter)
|
Delaware
|
46-5769934
|
|||
|
(State or other jurisdiction of incorporation or organization)
|
(I.R.S. Employer Identification Number)
|
|||
|
14455 N. Hayden Road
|
||||
|
Scottsdale, Arizona 85260
|
||||
|
(Address of principal executive offices, including zip code)
|
||||
|
(480) 505-8800
|
||||
|
(Registrant's telephone number, including area code)
|
||||
Securities registered pursuant to Section 12(b) of the Act:
|
Title of each class
|
Name of each exchange on which registered
|
|
|
Class A Common Stock, par value $0.001 per share
|
New York Stock Exchange
|
|
Securities registered pursuant to Section 12(g) of the Act: None
Indicate by check mark if the registrant is a well-known seasoned issuer, as defined in Rule 405 of the Securities Act. Yes
☒
No
☐
Indicate by check mark if the registrant is not required to file reports pursuant to Section 13 or 15(d) of the Act. Yes
☐
No
☒
Indicate by check mark whether the registrant (1) has filed all reports required to be filed by Section 13 or 15(d) of the Securities Exchange Act of 1934 during the preceding 12 months (or for such shorter period that the registrant was required to file such reports), and (2) has been subject to such filing requirements for the past 90 days. Yes
☒
No
☐
Indicate by check mark whether the registrant has submitted electronically and posted on its corporate Web site, if any, every Interactive Data File required to be submitted and posted pursuant to Rule 405 of Regulation S-T (§232.405 of this chapter) during the preceding 12 months (or for such shorter period that the registrant was required to submit and post such files). Yes
☒
No
☐
Indicate by check mark if disclosure of delinquent filers pursuant to Item 405 of Regulation S-K (§229.405 of this chapter) is not contained herein, and will not be contained, to the best of registrant's knowledge, in definitive proxy or information statements incorporated by reference in Part III of this Form 10-K or any amendment to this Form 10-K.
☐
Indicate by check mark whether the registrant is a large accelerated filer, an accelerated filer, a non-accelerated filer, or a smaller reporting company. See the definitions of "large accelerated filer," "accelerated filer", "smaller reporting company" and "emerging growth company" in Rule 12b-2 of the Exchange Act.
|
Large accelerated filer
|
☒
|
Accelerated filer
|
☐
|
|
|
Non-accelerated filer (Do not check if a smaller reporting company)
|
☐
|
Smaller reporting company
|
☐
|
|
|
Emerging growth company
|
☐
|
|||
If an emerging growth company, indicate by check mark if the registrant has elected not to use the extended transition period for complying with any new or revised financial accounting standards provided pursuant to Section 13(a) of the Exchange Act.
☐
Indicate by check mark whether the registrant is a shell company (as defined in Rule 12b-2 of the Exchange Act). Yes
☐
No
☒
As of
June 30, 2017
, the aggregate market value of the registrant's Class A common stock held by non-affiliates, based upon the closing sales price for the registrant's Class A common stock as reported by the New York Stock Exchange, was
$3,685,245,433
. For the purpose of calculating the aggregate market value of shares held by non-affiliates, we have assumed that all outstanding shares are held by non-affiliates, except for shares beneficially owned by each of our executive officers, directors and 5% or greater stockholders. In the case of 5% or greater stockholders, we have not deemed such stockholders to be affiliates unless there are facts and circumstances indicating that such stockholders exercise any control over our company. This determination of affiliate status is not necessarily a conclusive determination for any other purpose.
As of
February 23, 2018
, there were
133,934,978
shares of
GoDaddy Inc.
's Class A common stock, $0.001 par value per share, outstanding and
33,999,841
shares of
GoDaddy Inc.
's Class B common stock, $0.001 par value per share, outstanding.
DOCUMENTS INCORPORATED BY REFERENCE
Portions of the registrant's Definitive Proxy Statement relating to the Annual Meeting of Stockholders are incorporated by reference into Part III of this Annual Report on Form 10-K where indicated. Such Definitive Proxy Statement will be filed with the Securities and Exchange Commission within 120 days after the end of the registrant's fiscal year ended
December 31, 2017
.
TABLE OF CONTENTS
|
Page
|
||
2
This Annual Report on Form 10-K, including the sections titled "Business," "Risk Factors," "Use of Proceeds" and "Management's Discussion and Analysis of Financial Condition and Results of Operations," contains certain forward-looking statements within the meaning of Section 27A of the Securities Act of 1933, as amended, and Section 21E of the Securities Exchange Act of 1934, as amended, involving substantial risks and uncertainties. The words "believe," "may," "will," "potentially," "plan," "estimate," "continue," "anticipate," "intend," "project," "expect" and similar expressions conveying uncertainty of future events or outcomes are intended to identify forward-looking statements. These statements include, among other things, those regarding:
|
•
|
our ability to continue to add new customers and increase sales to our existing customers;
|
|
•
|
our ability to develop new solutions and bring them to market in a timely manner;
|
|
•
|
our ability to timely and effectively scale and adapt our existing solutions;
|
|
•
|
our dependence on establishing and maintaining a strong brand;
|
|
•
|
the occurrence of service interruptions and security or privacy breaches;
|
|
•
|
system failures or capacity constraints;
|
|
•
|
the rate of growth of, and anticipated trends and challenges in, our business and in the market for our products;
|
|
•
|
our future financial performance, including our expectations regarding our revenue, cost of revenue, operating expenses, including changes in technology and development, marketing and advertising, general and administrative and Customer Care expenses, and our ability to achieve and maintain, future profitability;
|
|
•
|
our ability to continue to efficiently acquire customers, maintain our high customer retention rates and maintain the level of our customers' lifetime spend;
|
|
•
|
our ability to provide high quality Customer Care;
|
|
•
|
the effects of increased competition in our markets and our ability to compete effectively;
|
|
•
|
our ability to grow internationally;
|
|
•
|
the impact of fluctuations in foreign currency exchange rates on our business and our ability to effectively manage the exposure to such fluctuations;
|
|
•
|
our ability to effectively manage our growth and associated investments;
|
|
•
|
our ability to integrate recent or potential future acquisitions, including our recent acquisition of Host Europe Holdings Limited (HEG) and our proposed acquisition of Main Street Hub, and to deliver a broader range of cloud-based products built on a single global technology platform;
|
|
•
|
our ability to maintain our relationships with our partners;
|
|
•
|
adverse consequences of our substantial level of indebtedness and our ability to repay our debt;
|
|
•
|
our ability to maintain, protect and enhance our intellectual property;
|
|
•
|
our ability to maintain or improve our market share;
|
|
•
|
sufficiency of cash and cash equivalents to meet our needs for at least the next 12 months;
|
|
•
|
beliefs and objectives for future operations;
|
|
•
|
our ability to stay in compliance with laws and regulations currently applicable to, or which may become applicable to, our business both in the United States (U.S.) and internationally;
|
|
•
|
economic and industry trends or trend analysis;
|
|
•
|
our ability to attract and retain qualified employees and key personnel;
|
|
•
|
the amount and timing of any payments we make under tax receivable agreements (TRAs) or for tax distributions;
|
|
•
|
the future trading prices of our Class A common stock;
|
as well as other statements regarding our future operations, financial condition, growth prospects and business strategies.
3
We operate in very competitive and rapidly-changing environments, and new risks emerge from time-to-time. It is not possible for us to predict all risks, nor can we assess the impact of all factors on our business or the extent to which any factor, or combination of factors, may cause actual results to differ materially from those contained in any forward-looking statements we may make. In light of these risks, uncertainties and assumptions, the forward-looking events discussed in this report may not occur, and actual results could differ materially and adversely from those implied in our forward-looking statements.
You should not rely upon forward-looking statements as predictions of future events. Although we believe the expectations reflected in our forward-looking statements are reasonable, we cannot guarantee the future results, levels of activity, performance or events and circumstances described in the forward-looking statements will be achieved or occur. Neither we, nor any other person, assume responsibility for the accuracy and completeness of the forward-looking statements. We undertake no obligation to publicly update any forward-looking statements for any reason after the date of this report to conform such statements to actual results or to changes in our expectations, except as required by law. Given these risks and uncertainties, readers are cautioned not to place undue reliance on such forward-looking statements.
Unless expressly indicated or the context suggests otherwise, references to GoDaddy, we, us and our refer to GoDaddy Inc. and its consolidated subsidiaries, including Desert Newco, LLC and its subsidiaries (Desert Newco). We refer to Kohlberg Kravis Roberts & Co. L.P. (together with its affiliates, KKR), Silver Lake Partners (together with its affiliates, Silver Lake) and Technology Crossover Ventures (together with its affiliates, TCV) collectively as the Sponsors. We refer to YAM Special Holdings, Inc. as YAM. We refer to Robert R. Parsons, the sole beneficial owner of YAM, our founder and a member of our board of directors, as Bob Parsons.
4
Our customers have bold aspirations—the drive to be their own boss, write their own story and take a leap of faith to pursue their dreams. Launching that brewery, running that wedding planning service, organizing that fundraiser, expanding that web-design business or whatever sparks their passion. We are inspired by our customers, and are dedicated to helping them turn their powerful ideas into meaningful action. Our vision is to radically shift the global economy toward life-fulfilling independent ventures.
Overview
Our more than
17 million
customers are people and organizations with vibrant ideas—businesses, both large and small, entrepreneurs, charities and hobbyists. They are defined by their guts, grit and determination to transform their ideas into something meaningful. They wear many hats and juggle many responsibilities, and they need to make the most of their time. Our customers need help navigating today's dynamic Internet environment and want the benefits of the latest technology to help them succeed. We are a trusted partner and champion for organizations of all sizes in their quest to build a successful online presence.
We are a leading technology provider to small businesses, web design professionals and individuals, delivering simple, easy-to-use cloud-based products and outcome-driven, personalized Customer Care. We operate the world's largest domain marketplace, where our customers can find that unique piece of digital real estate perfectly matching their idea. We provide website building, hosting and security tools and services to help customers easily construct, expand and protect their online presence. As our customers grow, we provide applications and access to relevant third-party products and platforms helping them connect to their customers, manage and grow their businesses and get found online.
The Internet is no longer just an interconnected network of independent sites and pages—it is an entire ecosystem, with layers and levels of identity and presence. An online presence may have initially consisted of a simple and static website with basic information, often supported by limited search engine marketing. Now, our customers must manage their online identities and interact with their customers across many platforms, including social media channels, search engines, listing providers and e-commerce marketplaces, all while maintaining a strong and elegant mobile and desktop presence. We offer products and solutions to help our customers tackle this rapidly-changing technology landscape and evolve their online presence as their business and goals evolve. We develop the majority of our products internally and believe our solutions are among the best in the industry in terms of breadth, performance, functionality and ease of use.
Often technology companies force their customers to choose between technology and support, delivering one but not the other. At GoDaddy, we don't believe our customers should have to choose and strive to deliver both great technology and great customer support. We believe engaging with our customers in a proactive, consultative way helps them knock down the technology hurdles they face. Through the thousands of conversations we have with our customers every day, we receive valuable feedback enabling us to continually evolve our products and solutions and respond to their changing needs.
Our people and unique culture have been integral to our success. We live by the same principles that enable new ventures to survive and thrive: hard work, perseverance, conviction, an obsession with customer satisfaction and a belief that no one can do it better. We take responsibility for driving successful outcomes and are accountable to our customers, which we believe has been a key factor in enabling our rapid customer and revenue growth. We believe we have one of the most recognized technology brands in the U.S.
Our Size and Scale
Our combination of easy-to-use cloud-based products, personalized Customer Care, a powerful brand and a unique culture have helped us build an attractive business with strong financial performance.
|
•
|
We are the global market leader in domain name registration—a key on-ramp to establishing a business online in our connected economy—with more than
75 million
domains under management as of
December 31, 2017
, which, based on information reported in VeriSign's Domain Name Industry Brief represented more than
22%
of the world's registered domains.
|
|
•
|
As of
December 31, 2017
, we had more than
17 million
customers, with approximately
2.6 million
customers added in
2017
, of which
1.6 million
came through our acquisition of Host Europe Group (HEG).
|
5
|
•
|
As of
December 31, 2017
, we had nearly
1 million
customers who each spent more than
$500
a year.
|
|
•
|
In each of the five years ended
December 31, 2017
, our customer retention rate exceeded
85%
and our retention rate for customers who had been with us for over three years was approximately
91%
.
|
|
•
|
In
2017
, we generated
$2,618 million
in total bookings, up
21.5%
from
$2,155 million
in
2016
. In
2017
, we had
$2,232 million
of revenue, up
20.8%
from
$1,848 million
in
2016
.
|
|
•
|
As of
December 31, 2017
, we provided localized solutions in over
50
markets. In
2017
, approximately
33%
of our total bookings were attributable to customers outside of the U.S.
|
|
•
|
Our highly-rated Customer Care team of nearly
5,500
specialists, including nearly
1,900
outside the U.S., is focused on providing high-quality, personalized care. As a result of their ongoing dialogue with customers, our Customer Care team also drives bookings and in
2017
generated approximately
20%
of our total bookings.
|
Our Market
Our customers represent a large and diverse market which we believe is largely underserved. According to the U.S. Small Business Administration, there were approximately
29.7 million
small businesses in 2014. Based on data from the 2014 U.S. Census Bureau and the U.S. Small Business Administration, over
90%
of small businesses have fewer than
five
employees and approximately
24 million
, or over
80%
of, small businesses were non-employer firms. Furthermore, the Kauffman Index of Entrepreneurial Activity Report estimated that in 2015 there were approximately 530,000 new business owners created each month in the U.S. Moreover, according to a study performed by the International Finance Corporation and McKinsey Company, there are more than 420 million micro, small and medium enterprises (defined as one to 250 employees) worldwide. We believe our addressable market extends beyond small businesses and includes individuals and organizations, such as universities, community organizations, charities and hobbyists.
Despite the ubiquity and importance of the Internet to individual consumers, many small businesses and organizations have remained offline given their limited resources and inadequate tools. We believe approximately
60%
of small businesses do not have a website. However, as proliferation of mobile devices blurs the online/offline distinction into an "always online" world, having an impactful online presence is becoming a "must have" for small businesses worldwide.
What it means for small businesses and ventures to be online continues to evolve. Today, having an effective online presence often means having a combination of: (i) a secure and content rich website viewable from any device; (ii) presence on social media sites, (iii) search engines and an increasing number of horizontal and vertical marketplaces (e.g. Yelp and OpenTable); (iv) branded email communication; (v) online marketing; and (vi) Internet-enabled commerce ability with reservation and scheduling capabilities for service-based businesses and a product catalog and sales capabilities for product-based businesses. In addition, other needs such as telephony, payment processing, and accounting and tax preparation, which had traditionally been separate point solutions, can now be part of an integrated solution.
The shift toward dynamic online presence for small business has been fueled by the emergence of simple, yet powerful, cloud-based technologies that can easily be utilized by individuals with limited technical skills. Cloud technologies have helped enable the integration of front and back-end activities. Cloud-based products, which can be "rented" on a monthly or yearly basis, allow a business to more easily scale from a nascent idea to a thriving venture.
Our Customers
Our customers share common traits, such as tenacity and determination. They have an entrepreneurial spirit, strong work ethic and, above all, passion for their ventures, yet their specific needs vary depending on the type and stage of their ventures. They range from individuals who are thinking about starting a business to established ventures that are up and running but need help attracting customers, growing their sales, managing their business or expanding their operations. Most of our customers have fewer than five employees and most identify themselves as having little to no technology skills. They need our help to give their businesses a unique and secure digital identity. While our customers have differing degrees of resources and technical capabilities, they all share a desire to find tools to help them bring their ideas to life, enhance their connection with their existing customers and find new customers.
To serve our customers well at every phase of their ventures, we group them into multiple stages of growth, starting with "nascent" and evolving to "established and content." We have also identified groups with specialized needs, such as the "digital commerce" group made up of web-savvy individuals who utilize digital commerce platforms as their main source of revenue, and domain investors who buy, hold and sell domains as their primary business activity. We also serve a group of customers consisting
6
of web-designers and web-developers—who we call "Web Pros"—who are in the business of building, designing and managing the online presence of others. Each of these groups is unique in their needs, and we personalize our solutions to meet them at each stage in their lifecycle.
Our Opportunity—What Successful Ventures Need
Our customers are consumers themselves and use the Internet to get informed, research and shop for solutions, which makes them keenly aware of the need to have an impactful online presence. While our customers' needs change depending on where they are in their lifecycle, the most common customer needs we serve include:
|
•
|
Getting online and looking great
. Our customers want to develop an online presence by finding a name perfectly identifying their business, hobby or passion. They want to create a digital identity so their customers can find, engage and transact with them online. We believe a complete digital identity includes an elegant, mobile-enabled website and the ability to get found across various search engines, social media platforms and vertical marketplaces.
|
|
•
|
Growing their business and running their operations
. Our customers need to communicate with their existing customers and find new customers. They also need easy-to-use products and tools to help run their businesses, including productivity, marketing, payment and security tools.
|
|
•
|
Connecting with a real person when they need help.
Our customers sometimes need assistance to set up a website, launch a new feature or try something new. They need real people who are available 24/7/365 and in the manner that works best for them, whether by phone, by chat or in community forums.
|
|
•
|
Technology that grows with them and their customers
. Our customers need a simple platform and set of tools enabling their domain, website and other solutions to easily work together as their venture grows and becomes more complex. The right platform can meet the needs of entrepreneurs who may not be technologically savvy, Web Pros with more complex requirements and customers with a range of needs in between.
|
|
•
|
Reliability, security and performance
. Our customers expect reliable products and want to be confident their digital presence is secure. Our customers work on their ventures whenever and however they can and need solutions fitting their lifestyle and schedule.
|
|
•
|
Affordable solutions
. Our customers often have limited financial resources and are unable to make large, upfront investments in the latest technology. Our customers need affordable solutions leveling the playing field and giving them the tools to look and act like bigger ventures.
|
Our Solution—What We Do and How We Do It
We built GoDaddy to serve our customers by providing elegant, easy-to-use cloud-based products wrapped with personalized Customer Care. Our customers turn to us to:
|
•
|
Get a great domain name
. Every great idea needs a great name. Staking a claim with a domain name is an integral part of establishing an idea and presence online. When inspiration strikes, we are there to provide our customers with high-quality search, discovery and recommendation tools as well as the broadest selection of domains to help them find the right name for their venture.
|
|
•
|
Build a dynamic online presence
. GoCentral and other GoDaddy offerings enable anyone to create an elegant website or online store, for both desktop and mobile, regardless of technical skill. Our products, powered by a unified cloud platform, enable our customers to get found online by helping to enhance the information on their website and extending their website and its content to where they need to be, from search engine results (e.g. Google) to social media (e.g. Facebook) to vertical marketplaces (e.g. Yelp), all from one location. For more technically-sophisticated web designers, developers and customers, we provide high-performance, flexible hosting and security products that can be used with a variety of open source design tools. We design these solutions to be easy to use, effective, reliable, flexible and a great value.
|
|
•
|
Add back-office and marketing products
. Our customers want to spend their time on what matters most to them, selling their products or services or helping their customers do the same. We provide them with productivity tools such as domain-specific email, online storage and payment solutions to help run their ventures. We also provide robust marketing products, such as email marketing, to help them attract and retain customers.
|
|
•
|
Receive assistance from our highly-rated Customer Care team
. Our Customer Care team consists of nearly
5,500
specialists worldwide who are available 24/7/365 and provide care to customers with different levels of technical
|
7
sophistication. We strive to provide high-quality, consultative care and deliver a distinctive experience helping us create loyal customers who renew their subscriptions, purchase additional products and refer their family and friends to us. Our specialists are evaluated on customer outcomes and the quality of the experience they provide.
|
•
|
Receive high value
. We price most of our products at a few dollars per month while providing our customers with robust features and functionality. We believe our high-quality products and personalized Customer Care provide our customers with an affordable bridge between their available resources and their aspirations.
|
Our Advantages—Why We Win
We believe the following strengths provide us with competitive advantages in realizing the potential of our opportunity:
|
•
|
We are the leading domain name marketplace, a key on-ramp in establishing a digital identity
. We are the global market leader in domain name registration with more than
75 million
domains under management as of
December 31, 2017
. Based on information reported in VeriSign's Domain Name Industry Brief, we held over
22%
of the approximately
332 million
worldwide domain names under management as of
December 31, 2017
.
|
|
•
|
We provide a reliable and secure global platform and infrastructure.
Our investments in technology, including engineers, patents, online security, customer privacy, reliable infrastructure and data science capabilities, enable us to innovate and deliver personalized solutions to our customers. Our API-driven technology platform is built on state-of-the-art, open source technologies like Hadoop, OpenStack and other large-scale, distributed systems. Additionally, our platform allows our developers to create new and enhanced products or product features assembled from common building blocks leading to faster deployment cycles. We believe our products work well together and are more valuable and easier to use together than if our customers purchased them individually from other companies and tried to integrate them. As of
December 31, 2017
, we had
1,360
engineers,
230
issued patents and
150
pending patent applications in the U.S.
|
|
•
|
We operate an industry-leading Customer Care team that also drives bookings
. We give our customers much more than typical customer support. Our team is unique, blending personalized Customer Care with the ability to evaluate our customers' needs, which allows us to help and advise them as well as drive incremental bookings. Our Customer Care team contributed approximately
20%
of our total bookings in
2017
. Our customers respond to our personalized approach with high marks for customer satisfaction. Our proactive Customer Care model is a key component helping create long-term customer relationships, which is reflected in our high retention rates.
|
|
•
|
Our brand and marketing efficiency
. We believe GoDaddy is one of the most recognized technology brands in the U.S. Through a combination of cost-effective direct-marketing, brand advertising and customer referrals, we have added approximately one million net new customers organically each year from 2013 through 2017.
|
|
•
|
Our financial model
. Our stable and predictable business model is driven by efficient customer acquisition, high customer retention rates and increasing lifetime spend. In each of the
five
years ended
December 31, 2017
, our customer retention rate exceeded
85%
and our retention rate for customers who had been with us for over
three
years was approximately
91%
. We believe the breadth and depth of our product offerings and the high quality and responsiveness of our Customer Care team builds strong customer relationships and are keys to our high customer retention rate.
|
|
•
|
Our people and our culture
. We are a company whose people embody the grit and determination of our customers. Our world-class engineers, designers, marketers and Customer Care specialists share a passion for technology and its ability to change our customers' lives. We value hard work, extraordinary effort, living passionately, taking intelligent risks and working together toward successful customer outcomes. Our relentless pursuit of doing right for our customers has been a crucial ingredient of our growth.
|
|
•
|
Our scale
. We have achieved significant scale in our business enabling us to efficiently acquire new customers, serve our existing customers and continue to invest in growth.
|
|
•
|
In
2017
, we generated
$2,618 million
in total bookings up from
$1,250 million
in
2012
, representing a compound annual growth rate (CAGR) of
16%
.
|
|
•
|
In
2017
, we had
$2,232 million
of revenue up from
$911 million
in
2012
, representing a CAGR of
20%
.
|
|
•
|
In
2017
, we had
$476 million
of net cash provided by operating activities.
|
|
•
|
In the five years ended
December 31, 2017
, we invested to support our growth with
$1,371 million
in technology and development expenses and
$994 million
in marketing and advertising expenses.
|
8
Our Strategy—How We Grow
We're focused on helping our customers with individualized solutions for each phase of their journey. We leverage our team's deep understanding of what our customers need to develop new products and provide empathetic and targeted customer care. We are pursuing the following principal strategies to drive our business:
|
•
|
Expand and innovate our product and service offerings
to provide more comprehensive solutions for our customers and to offer more ways for new customers to find us
. We are working both to grow our core product offerings and create innovative new products, including:
|
|
•
|
Delivering the next generation of naming
. The first generation of naming included a limited set of generic top-level domains (gTLDs), such as .com and .net, and country code top-level domains (ccTLDs), such as .uk and .in. Hundreds of new gTLDs have been introduced in recent years, expanding the available inventory for us and our customers. Additionally, we have invested to expand the secondary market to help match buyers to sellers who already own domains. Our GoDaddy Investor mobile application helps investors watch and bid on domains at auction and stay on top of current bids from their mobile devices. We continue to invest in search, discovery and recommendation tools and transfer protocols for both primary and secondary domains.
|
|
•
|
Powering elegant and effortless presence
. We offer a range of products and services that help our customers get their ideas online. GoCentral combines a mobile-optimized website builder with an integrated set of marketing and e-commerce tools to help our customers create an audience for their idea or business, enabling them to design a professional website in under an hour. We continue to invest in GoCentral and other tools, templates and technology to make building, maintaining and updating a professional looking mobile or desktop presence simple and easy. Additionally, we are investing in products to help our customers drive their customer acquisition, retention and communication efforts by managing their presence across search engines, social networks and vertical marketplaces and keep their online presence and information secure.
|
|
•
|
Making the business of business easy
. Our business applications range from domain-specific email and email marketing to telephony services and payment tools to help our customers communicate with their customers and grow their ventures. In 2017, we introduced SmartLine, which allows our customers to add a second, separate phone line to an existing iOS or Android phone. We intend to continue investing in the breadth of our product offerings to help our customers connect with their customers and run their ventures.
|
|
•
|
Win the Web Pros.
We are investing in a suite of applications and services for web designers and developers to help them save time, make money and exceed client expectations. These client management applications make it easier for designers and developers to manage their clients' websites at any host, host websites on GoDaddy products such as Managed WordPress, and manage their overall business with capabilities such as client billing. Services for Web Pros also include administrative access and shopping features which make it easier to buy and manage multiple products for their clients, as well as enhanced technical support and discounts for reselling GoDaddy products. We support a variety of control panels and content management tools favored by Web Pros including cPanel, Plesk, Drupal, Joomla and more. As one of the largest global hosts of WordPress sites, many of our recent investments have focused on extending our reach into the WordPress community.
|
|
•
|
Go global
. As of
December 31, 2017
, approximately
42%
of our customers were located in international markets, notably Canada, India and the United Kingdom. We have made significant investments in the localization of our service offerings in markets outside of the U.S. and, as of
December 31, 2017
, we offered localized products and Customer Care in over
50
markets. To support our international growth, we will continue investing to develop our local capabilities across products, marketing programs, data centers and Customer Care. Our recent international acquisitions, including our acquisition of HEG, are an important part of this international growth.
|
|
•
|
Make it personal
. We seek to leverage data and insights to personalize the product and Customer Care experiences of our customers as well as tailor our solutions and marketing efforts to each of our customer groups. We are constantly seeking to improve our website, marketing programs and Customer Care to intelligently reflect where customers are in their lifecycle and identify their specific product needs. This allows us to interact more frequently with our customers. We intend to continue investing in our technology and data platforms to further enable our personalization efforts.
|
|
•
|
Wrap it with Care
. We believe our highly-rated Customer Care team is distinctive and essential to the lifetime value proposition we offer our customers. We continue to invest in our Customer Care team, including investing to expand our Customer Care service, improve the quality of our Customer Care resources and introduce enhanced tools and processes across our expanding global footprint.
|
9
|
•
|
Partner up
. Our flexible platform also enables us to acquire companies and quickly launch new products for our customers, including through partnerships such as Microsoft Office 365 for email and PayPal and Square for payments. We have also acquired companies and technologies to complement our product and service offerings and expand our geographic footprint. We intend to continue identifying value-added technology acquisition targets and partnership opportunities.
|
Products
We have designed and developed an extensive set of easy-to-use cloud-based technology products enabling our customers to establish a digital presence, connect with their customers and manage their ventures. We understand our customers' needs vary depending on the type and stage of their venture, which is why we offer our products both independently and bundled as suites of integrated products designed for specific activities.
Our domain name registration products enable us to engage customers at the initial stage of establishing a digital identity and often is an on-ramp for our other products. We believe our hosting and presence and business applications products increase our revenue and margin growth opportunities, frequently serve as starting points for our customer relationships, improve customer retention and significantly improve our value proposition to customers.
Domains
We are the global market leader in domain name registration. Securing a domain is a key component to creating a complete digital identity and our domain products often serve as the starting point in our customer relationships. As of
December 31, 2017
, approximately
92%
of our customers had purchased a domain from us, and as of
December 31, 2017
, we had more than
75 million
domains under management. In
2017
,
2016
and
2015
, we generated approximately
47%
,
50%
and
52%
of our total revenue, respectively, from sales of our domain products.
Our primary domains product offerings are:
Primary Registrations
. Using our website or mobile application, we offer customers the ability to search for and register available domain names with the relevant registry. Our inventory for primary registrations is defined by the number of top-level domains (TLDs) we offer. As of
December 31, 2017
,
401
different gTLDs (e.g. .com, .net and .org) and
69
different ccTLDs (e.g. .de, .ca, .in and .jp.) were available for purchase through GoDaddy. Since 2013, hundreds of new gTLDs have been launched, making it easier for companies and individuals to find and register new, easy-to-remember domain names tailored to their ventures, industry or interests. ccTLDs are important to our international expansion efforts as we have found international customers often prefer the ccTLD for the country or geographic market in which they operate. Our primary registration offering relies heavily on our search, discovery and recommendation tools which enable our customers to find a name matching their needs. We also sell domain registrations through relationships with third-party resellers.
A
ftermarket
. We operate one of the world's largest domain aftermarkets, which processes aftermarket, or secondary, domain name sales. Our aftermarket platform is designed to enable the seamless purchase and sale of an already registered domain name through an online auction, an offer and counter-offer transaction or a "buy now" transaction. Over the last three years, we have acquired more than
730,000
domain names to increase the inventory available to our customers. Our GoDaddy Investor mobile application helps investors watch and bid on domains at auction and stay on top of their current bids, all from their mobile devices. We operate a cross-registrar network that automates transaction execution across registrars thereby reducing the time required to complete a transaction. We receive a percentage of the sales price for each domain sold.
Domain Name Add-Ons
. Domain name add-ons are features a customer can add to a domain name registration. Our domain name privacy product allows our customers to register a domain name on an "unlisted" basis helping prevent privacy intrusions, deter domain-related spam and allow our customers to confidentially secure a domain for an unannounced product, service or idea. Domain name add-ons are typically purchased concurrently with domain name registrations and have minimal costs associated with their delivery.
Hosting and Presence
We offer a variety of hosting and presence products enabling our customers to create and manage their digital identity, or in the case of Web Pros, the digital identities of their end-customers. In each of
2017
,
2016
and
2015
, we derived approximately
38%
,
37%
and
37%
, respectively, of our total revenue from sales of our hosting and presence products.
10
Our primary hosting products are:
Shared Website Hosting
. The term "shared hosting" refers to the housing of multiple websites on the same server via the use of chroot environments. Shared hosting is our most popular hosting product. We operate, maintain and support shared website hosting in our owned and operated data centers and our leased co-located data centers using either Linux or Windows operating systems. We currently offer three tiers of shared website hosting plans to suit the needs and resources of our customers, all of which use industry standard cPanel or Parallels Plesk control panels. We also bundle our hosting plans with a variety of applications and products such as web analytics, secure sockets layer (SSL) certificates and WordPress. WordPress is the most used content management application on our shared hosting platform.
Website Hosting on Virtual Private Servers and Virtual Dedicated Servers
. Our broad range of virtual private server (VPS) and virtual dedicated server offerings allows our customers to select the server configuration best suited for their applications, requirements and growth. Our virtual private servers provide customers with a single virtual machine running on a single bare metal server that is running multiple other virtual machines for other customers. Our VPS product is designed to meet the requirements of customers with a need for greater control, more advanced technical capabilities and higher performance than that offered by our shared hosting plans. Our customers have the ability to tailor their virtual dedicated server plan based on a range of performance, storage, bandwidth and operating system needs.
Managed Hosting
. With our managed hosting products, we set up, monitor, maintain, secure and patch software and servers for our customers. We offer a variety of managed hosting plans to support our customers' needs including multiple tiers of Managed WordPress hosting on a platform optimized for WordPress. We also offer other managed environments that span across our VPS and Dedicated products like Joomla, Drupal and Magento and apps like Gallery. In addition to managed hosting plans tailored to our customers' needs, we also offer expert services, which provide additional support services.
Security
. Our security products include SSL certificates, malware scanners and malware removal. According to Netcraft, we are one of the world's largest provider of SSLs. An SSL validates a customer's website identity and encrypts online transaction information, such as credit card numbers, and communications sent to or by the website. We offer a variety of SSLs all of which provide high-grade, 256-bit encryption. Our SSL offerings include multiple domain SSLs and "wildcard" SSLs, which secure a singular website URL as well as subdomains on that URL (e.g. protectmyvisitors.com and cart.protectmyvisitors.com). We also offer "code signing certificates" designed to prove the identity of software authors and validate that the software has not been tampered with since its original distribution. Our website security scanner checks a customer's website at predetermined intervals for malware, blacklists, and uptime. When malware is detected, and a cleanup request has been initiated, our security team runs a remediation process to remove the malware and restore the site. Our Web Application Firewall (WAF) is a cloud-based firewall service that screens and protects real-time website traffic from threats such as SQL injection attacks and comment spammers, while also thwarting distributed denial of service (DDOS) attacks.
Our primary presence products are:
GoCentral
. GoCentral is an easy-to-use, do-it-yourself mobile-optimized online tool enabling customers, irrespective of their technical skills, to build effective websites and online stores. We offer a variety of plans, with pricing dependent on business and marketing features. With each of these plans, customers have access to vertically targeted professional designs which can be further customized using our editor by adding intent-driven sections, photos, videos or text. Our designs cover a wide range of categories with professionally written content for small businesses, organizations, families, weddings, and other ventures. Our websites and our tools are all designed to work great on mobile devices, with a focus on performance, which is critical for websites to appear in search engine rankings.
Our GoCentral product includes online appointments and online store capabilities allowing customers to transact business directly on their websites, and is optimized for mobile shopping and secure checkout via credit card, Apple Pay, Google Pay, Square, or PayPal. Our online store allows customers to manage inventory and shipping, while online appointments manages staff availability and helps remind customers of appointments. Both are integrated into our social and email marketing tools, to help customers generate more business.
Marketing
. Our GoCentral product line includes a range of marketing tools designed to help businesses acquire and engage customers. These capabilities are available in an integrated offering with our website and commerce tools, or as a stand-alone for customers using other website tools. The tools are designed for busy customers who may lack experience with online marketing, focusing on ease of use, mobile experience, and delivering business results. Search Engine Optimization helps our customers get their websites found on major search sites through search engine optimization using a simple step-by-step wizard with targeted recommendations on which search phrases are most likely to drive traffic to a customer's site. Business listings
11
capabilities bring business information to where customers are looking, including Facebook and Google My Business. Email marketing lets people build targeted campaigns, either from scratch or using website or commerce content.
Business Applications
We offer a variety of products designed to make the business of business easier for our customers. The products we offer include those developed in-house as well as third-party applications which we distribute and support, such as Microsoft Office 365. In
2017
,
2016
and
2015
, we derived approximately
15%
,
13%
and
11%
of our total revenue, respectively, from sales of our business applications products.
Our primary business applications products are:
Microsoft Office 365
. We offer fully-supported Microsoft Office 365 accounts that are easy to set up and use with our customers' domains. We offer Microsoft Office 365 in multiple plans ranging from email with calendar and contacts connected to a custom domain to a full suite of productivity tools, including file sharing and full desktop versions of Microsoft productivity applications, including Outlook, Word, Excel and PowerPoint. For customers wanting to protect their email data, we offer an email backup service (in partnership with SkyKick), and for customers needing to comply with regulatory requirements, we offer email add-on services such as HIPPA-enabled email, encryption services (in partnership with ProofPoint) and archiving services (in partnership with Sonian). We help make Microsoft Office 365 installation easy, allowing customers to get up and running in minutes, including "do-it-for-me" migrations services to move customers' existing email data to Office 365 accounts.
Email Accounts
. We offer a range of email service plans with a multi-feature web interface that connects to our customers' domains. The pricing of these plans depends on the customer's desired amount of storage and number of email addresses. All of our email accounts are advertising-free and include security functionality designed to provide protection from spam, viruses and other forms of online fraud, such as phishing.
Email Marketing
. Our email marketing product helps customers market their businesses through permission-based email. Customers can easily create and send newsletters, targeted advertising campaigns, promotions and surveys as well as connect email campaigns with their social media networks and track the results of campaigns.
Telephony
. We provide internet-based telephone services that can be accessed with either IP phones, or traditional local or cellular telephone services. In 2017, we launched our SmartLine plan, which includes a virtual number phone and mobile application, enabling customers to have two numbers on one phone to separate business communications from personal communications. All of our plans allow customers to make and receive phone calls, send/receive text and MMS messages using their Smartline number and chosen caller ID. In addition, Smartline offers customers a range of minutes and texts, a local or toll-free number and a mobile application to manage the service, as well as voicemail, voicemail transcription, email delivery of voicemail, customized business greetings, business hour settings and ability to block unwanted callers. We also offer single and multi-line VoIP phone systems, IP enabled phones, virtual phone numbers, virtual receptionist services, customizable phone tree, follow-me call forwarding and fax-on-demand.
Technology and Infrastructure
Our technology platform forms the core of many of our solutions, and we have invested significantly to develop a platform designed to be intelligent, fast, secure and scalable. Our technology and development expenses, including those expenses related to our technology platform, were
$356 million
,
$288 million
and
$270 million
in
2017
,
2016
and
2015
, respectively. We have built a scalable platform allowing us to provide faster business insights at lower costs, develop and introduce new products quickly and leverage economies of scale to reduce costs and enable next-generation hosting architecture. Our technology stack, which consists of physical infrastructure, infrastructure-as-a-service, and platform-as-a-service, allows our customers to build and manage their digital identities and enable access across multiple devices. We seek to continuously enhance the performance and reliability of our technology infrastructure by investing in faster data centers, improved network connectivity and improved resiliency, both domestically and internationally.
Physical infrastructure
Our physical technology infrastructure includes servers located in data centers around the world. We have also invested significantly in our peering architecture and utilize multiple peering sites allowing us to handle high IP transit traffic at low bandwidth costs. Our large technology infrastructure footprint allows us to leverage economies of scale through low server,
12
network, storage and processing costs by commoditizing hardware across various systems and leveraging virtualization where possible.
Infrastructure-as-a-Service
We leverage an Infrastructure-as-a-Service model geared toward the virtualization and automation of common physical data center components like servers, load balancers, switches and storage. We use open source solutions when possible to automate manual processes and thereby reduce the risk of human error as well as to lower costs. Additionally, we are beginning to use a single automated infrastructure based on OpenStack to enable next-generation services. In 2017, we started to leverage third-party public cloud offerings to augment our internal infrastructure-as-a-service model.
Platform-as-a-Service
Our platform provides our customers fast, simple and customer-centric products across the globe, by allowing us to easily and quickly build and deploy new products incorporating our data insights. Our investments in our platform capabilities include the following:
E-commerce Platform and Application Services.
While we continue to use our existing platform, we have developed and begun to implement a new e-commerce platform. We expect this new platform to enhance our value proposition to our customers by offering comprehensive, flexible and integrated solutions that can be rapidly scaled up or down, used across multiple platforms and integrated with third-party offerings. Both our existing and new platforms also allow resellers to easily sell our products, thereby broadening our distribution channels. We seek to continuously launch new and relevant applications and streamline our existing offerings in order to provide the best user experience to our customers.
Data Platform.
Our horizontal data platform helps us to be a trusted source of data about our customers and their online ventures through accurate, meaningful, and easily consumable data insights, which allows us to build best-in-class, personalized experiences for our customers. Our data platform is key to helping us deepen our customer and business insights; these insights enable innovation through instrumentation, experimentation and analysis.
Content and Marketing Platform.
Our content and marketing platforms leverage the latest tools, technology and operational and production models that enable us to deliver customer-centric digital experiences at an accelerated pace through multiple touchpoints and channels. Our content platform and content creation processes help us realize efficiencies and scalability, which enhance our ability to drive new, high quality products and customer experiences to market faster. We are focused on driving advancements in experimentation, the speed and volume of content creation, localization and content self-service, while ensuring platform availability and performance. We are also delivering new engagement marketing capabilities that improve business effectiveness and customer experiences.
Customer Care
We have nearly
5,500
Customer Care specialists who provide technical assistance 24/7/365 to customers located around the world. Our specialists use a consultative approach to advise customers of products best suiting their individual needs. This ability to provide real-time product suggestions while providing a world-class support experience allows our Customer Care team to provide an impactful contribution to bookings through the sale of product subscriptions. In each of
2017
,
2016
and
2015
, at least
20%
of our total bookings were generated from the sale of product subscriptions by our Customer Care team. Our revised merchandising strategies, such as free trials and an increased mix of monthly product subscriptions, drove more renewal billings to our website and away from the Customer Care team during
2017
, which we expect to continue in the future. The majority of our Customer Care specialists are located in our Arizona and Iowa facilities in the U.S. We have additional international specialists providing in-region support in native languages. In addition, our easy-to-use website contains extensive educational content designed to demystify the process of establishing an online presence and to assist customers in choosing the products best meeting their needs. We also provide a variety of online tutorials through blogs and other services including The GoDaddy Garage Blog and third-party sites like YouTube.
Our Customer Care team operates through a variety of channels to provide tailored and timely support to our customers, handling approximately 20 million contacts in
2017
. Our customers can choose their preferred Customer Care channel, including proactive and reactive chat and phone support. We take a consultative approach to our customer interactions, acting as a trusted partner to answer their questions, to guide them through technical solutions, to offer real-time product suggestions best suited to
13
their needs and to support them at each phase of their lifecycle. The effectiveness of our model is reflected in the high ratings we receive from our customers, the bookings generated by our Customer Care team and strong customer referrals.
The strength of our Customer Care team is our people. Our hiring process is extensive and highly selective, designed to yield individuals who will thrive in our team based on core values, character, work ethic and ability. Our new Customer Care hires spend over a month moving from classroom to a live "nesting" environment where they refine their customer and technology skills. With a commitment to life-long learning, we offer hundreds of classes to our employees spanning leadership, sales, service and technology. Our incentive program rewards outcomes, across both customer satisfaction and bookings goals. For these and many other reasons, as of
December 31, 2017
, approximately
38%
of our Customer Care specialists had been with us for at least
three
years.
Marketing
We believe GoDaddy is one of the most recognized technology brands in the U.S. We have established this high level of brand awareness primarily through our advertising campaigns across various platforms including television commercials, print, online and billboards. We have supplemented these advertising campaigns with athlete and celebrity sponsorships. Our strong brand has helped us attract and retain more than
17 million
customers as of
December 31, 2017
. We intend to continue investing in our brand as we seek to further grow our total customers, particularly internationally. Customer referrals are another highly efficient and cost-effective channel for acquiring customers.
We complement our brand marketing efforts with focused and metric-driven direct response marketing to acquire new customers. We use a variety of targeted online marketing programs for lead generation, including search engine marketing, search engine optimization and targeted email and social media marketing campaigns, as well as more traditional direct marketing and indirect channel partner marketing programs, to drive interest in our products and traffic to our websites. As part of this effort, we regularly run numerous campaigns simultaneously and constantly refine our media mix across our channels.
International
Central to our international strategy is a philosophy of localizing our product offerings and customer experience and deploying them through our global infrastructure. As of
December 31, 2017
, we had over
7 million
customers outside of the U.S. and derived approximately
33%
,
28%
and
26%
of our total bookings from international sales in
2017
,
2016
and
2015
, respectively.
We have built a dedicated team responsible for the internationalization and localization of our core product offerings as well as our Customer Care and marketing efforts, including through our acquisition of HEG in 2017. In conjunction with our localization efforts, we have added on-the-ground regional teams and increased our country and regional specific marketing spend. These investments have enabled us to successfully launch and expand our business outside the U.S. and as of
December 31, 2017
, we provided localized products and Customer Care in over
50
markets around the world. We have taken a rigorous approach to managing the level of investment we expect to make in each geographic market we enter based on a market tier approach. We expect to continue to expand internationally, growing our share and increasing penetration of the international markets we've entered in recent years.
Competition
We provide cloud-based solutions enabling individuals, businesses and organizations to establish an online presence, connect with customers and manage their ventures. The market for providing these solutions is highly fragmented and competitive. These solutions are also rapidly evolving, creating opportunity for new competitors to enter the market with point-solution products or address specific segments of the market. In some instances, we have commercial partnerships with companies with which we also compete. Given our broad product portfolio, we compete with niche point-solution products and broader solution providers. Our competitors include providers of:
|
•
|
domain registration services and web-hosting solutions such as Endurance, Donuts, United Internet and Web.com;
|
|
•
|
website creation and management solutions such as Automattic, Shopify, Squarespace, and Wix;
|
|
•
|
cloud-infrastructure services and online security providers such as Comodo, Symantec, Let's Encrypt and WP Engine;
|
|
•
|
alternative web presence and marketing solutions such as Constant Contact, Etsy, OpenTable, Yelp and Zillow; and
|
14
|
•
|
productivity tools such as business-class email, calendaring and file-sharing such as Dropbox, Microsoft and Google.
|
We expect continued competition from companies in the domain, hosting and presence markets such as Automattic, Endurance, Donuts, Squarespace, United Internet, Web.com and Wix. We also expect potential increased competition from companies like Google, Amazon, Facebook and Microsoft, which are providers of web-hosting, Internet marketing, ecommerce and other cloud-based services.
We believe the principal competitive factors include: product capabilities meeting customer requirements, a secure, reliable and integrated technology platform, cost-effective customer acquisition, brand awareness and reputation, customer service and support and overall customer satisfaction. We believe we compete favorably with respect to each of these factors. For additional information, see "Risk Factors."
Regulation
Our business is subject to regulation by ICANN, federal and state laws in the U.S. and the laws of other jurisdictions in which we do business.
ICANN
. The registration of domain names is governed by ICANN. ICANN is a multi-stakeholder private sector, not-for-profit corporation formed in 1998 for the express purposes of overseeing a number of Internet related tasks, including management of the DNS, allocation of IP addresses, accreditation of domain name registrars and registries and the definition and coordination of policy development for all of these functions. We are accredited by ICANN as a domain name registrar and thus our ability to offer domain name registration products is subject to our ongoing relationship with and accreditation by ICANN. The regulation of Internet domain names in the U.S. and in foreign countries is subject to change. For example, in 2016, the National Telecommunications and Information Administration, or the NTIA, an agency of the U.S. Department of Commerce, transitioned oversight of key Internet domain name functions to the global multi-stakeholder community.
ccTLD Authorities
. The regulation of ccTLDs is governed by national regulatory agencies of the country underlying the specific ccTLDs, such as China (.cn), Canada (.ca) and the United Kingdom (.uk). Our ability to sell ccTLDs is dependent on our and our partners' ability to maintain accreditation in good standing with these various international authorities.
Advertising and promotional information presented on our websites and in our products, and our other marketing and promotional activities, are subject to federal and state consumer protection laws regulating unfair and deceptive practices. U.S. federal, state, and foreign legislatures have also adopted laws and regulations regulating numerous other aspects of our business. Regulations relating to the Internet, including laws governing online content, user privacy, taxation, liability for third-party activities and jurisdiction, are particularly relevant to our business. Such laws and regulations are discussed below.
Communications Decency Act
. The CDA regulates content of material on the Internet, and provides immunity to Internet service providers and providers of interactive computer services for certain claims based on content posted by third parties. The CDA and the case law interpreting it generally provide that domain name registrars and website hosting providers cannot be liable for defamatory or obscene content posted by customers on their servers unless they participate in creating or developing the content.
Digital Millennium Copyright Act
. The DMCA provides domain name registrars and website hosting providers a safe harbor from liability for third-party copyright infringement. To qualify for the safe harbor, however, registrars and website hosting providers must satisfy numerous requirements, including adoption of a user policy providing for termination of service access of users who are repeat infringers, informing users of this policy, and implementing the policy in a reasonable manner. In addition, registrars and website hosting providers must expeditiously remove or disable access to content upon receiving a proper notice from a copyright owner alleging infringement of its protected works. A registrar or website hosting provider failing to comply with these safe harbor requirements may be found liable for copyright infringement.
Anti-Cybersquatting Consumer Pr
otection Act. The ACPA was enacted to address piracy on the Internet by curtailing a practice known as "cybersquatting," or the bad-faith registration of a domain name identical or similar to another party's trademark, or to the name of another living person, in order to profit from that name or mark. The ACPA provides that registrars may not be held liable for damages for registration or maintenance of a domain name for another person absent a showing of the registrar's bad faith intent to profit. Registrars may, however, be held liable if their activities are deemed outside the scope of basic registrar functions.
15
Lanham Act
. The Lanham Act governs trademarks and false advertising. Case law interpreting the Lanham Act has limited liability for many online service providers such as search engines and domain name registrars. Nevertheless, there is no statutory safe harbor for trademark violations comparable to the provisions of the DMCA and we may be subject to a variety of trademark claims in the future.
Privacy and Data Protection
. In the areas of personal privacy and data protection, the U.S. federal and various state and foreign governments have adopted or proposed limitations on, and requirements associated with, the collection, distribution, use, storage, and security of personal information of individuals. If our practices with respect to the collection, distribution, storage, or security of personal information are challenged, we may not be able to demonstrate adequate compliance with existing or future laws or regulations. In addition, in the European Union member states and certain other countries outside the U.S., data protection is more highly regulated and rigidly enforced. Regulators in the European Union have approved the General Data Protection Regulation (GDPR), a regulation that will take full effect on May 25, 2018, superseding at that time the 1995 European Union Data Protection Directive. The GDPR includes stringent operational requirements for processors and controllers of personal data, for companies established in the EU and those outside of the EU if they collect and use personal data, including payment card information, imposes significant penalties for non-compliance and has broader extra-territorial effect. With our acquisition of HEG, and as we conduct and expand our business across Europe and elsewhere, we expect compliance with these regulatory schemes to be more burdensome and costly for us.
Laws and regulations relating to our activities are unsettled in many jurisdictions, or may prove difficult or impossible to comply with in some jurisdictions. Additionally, federal, state, local and foreign governments are also considering legislative and regulatory proposals that would regulate the Internet and our activities in more and different ways than exist today. It also is impossible to predict whether new taxes will be imposed on our services, and depending upon the type of such taxes, whether and how we would be affected. Laws and regulations in the U.S. or in foreign jurisdictions may be applied in new or different manners in pending or future litigation. Further, other existing bodies of law, including the criminal laws of various jurisdictions, may be deemed to apply to our activities, or new statutes or regulations may be adopted in the future.
Intellectual Property and Proprietary Rights
Our intellectual property and proprietary rights are important to our business. We rely on a combination of trademark, patent, copyright and trade secret laws, confidentiality and access-related procedures and safeguards and contractual provisions to protect our proprietary technologies, confidential information, brands and other intellectual property.
We have also developed, acquired or licensed proprietary technologies for use in our business. As of
December 31, 2017
, we had
230
issued patents in the U.S. covering various aspects of our product offerings. Additionally, as of
December 31, 2017
, we had
150
pending U.S. patent applications and intend to file additional patent applications in the future.
We have non-disclosure, confidentiality and license agreements with employees, contractors, customers and other third parties, which limit access to and use of our proprietary information. Though we rely in part upon these legal and contractual protections, as well as various procedural safeguards, we believe the skill and ingenuity of our employees, the functionality and frequent enhancements to our solutions and our ability to introduce new products and features meeting the needs of our customers are more important to maintaining our competitive position in the marketplace.
We have an ongoing trademark and service mark registration program pursuant to which we register our brand names and product names, taglines and logos in the U.S. and other countries to the extent we determine appropriate and cost-effective. We also have common law rights in some unregistered trademarks that were established over years of use. In addition, we have a trademark and service mark enforcement program pursuant to which we monitor applications filed by third parties to register trademarks and service marks that may be confusingly similar to ours, as well as the use of our major brand names in social media, domain names and other Internet sites.
Despite our efforts to preserve and protect our intellectual property, unauthorized third parties may attempt to copy, reverse engineer or otherwise obtain access to our proprietary rights, and competitors may attempt to develop solutions that could compete with us in the markets we serve. Unauthorized disclosure of our confidential information or proprietary technologies by our employees or third parties could also occur. The risk of unauthorized use of our proprietary and intellectual property rights may increase as we continue to expand outside of the U.S.
Third-party infringement claims are also possible in our industry, especially as functionality and features expand, evolve and overlap across industries. Third parties, including non-practicing patent holders, have from time to time claimed, and could
16
claim in the future, that our processes, technologies or websites infringe patents they now hold or might obtain or be issued in the future.
Employees
As of
December 31, 2017
, we had
5,990
employees worldwide, including
3,588
in our Customer Care team,
1,360
in technology and development,
268
in marketing and advertising and
774
in general and administrative. Excluded from our employee figures are nearly
1,900
Customer Care specialists located in Bulgaria, China, Colombia, India, Mexico, the Philippines and the United Kingdom who are directly employed by third-party partners, but who are dedicated to GoDaddy on a full time basis. Substantially all of our employees are based in the U.S. and Europe. None of our employees is represented by a labor union or is party to any collective bargaining agreement in connection with his or her employment with us. However, certain of our employees in Germany are represented by an employee works council pursuant to local regulations.
Corporate Information
We were incorporated in Delaware on May 28, 2014. Our principal executive offices are located at 14455 N. Hayden Road, Scottsdale, Arizona 85260 and our telephone number is (480) 505-8800.
Available Information
Our website is located at www.godaddy.com, and our investor relations website is located at www.investors.godaddy.net. Our Annual Reports on Form 10-K, Quarterly Reports on Form 10-Q and our Proxy Statements are available through our investor relations website, free of charge, after we file them with the SEC. We also provide a link to the section of the SEC's website at www.sec.gov that has all of the reports we file or furnish with the SEC. You may read and copy any materials we file with the SEC at the SEC's Public Reference Room at 100 F Street, NE, Washington, D.C. 20549. You can get information on the operation of the Public Reference Room by calling the SEC at 1-800-SEC-0330.
17
Our operations and financial results are subject to various risks and uncertainties, including those described below. The risks and uncertainties described below are not the only ones we face. Additional risks and uncertainties we are unaware of, or we currently believe are not material, may also become important factors affecting us. If any of the following risks occur, our business, financial condition, operating results and growth prospects could be materially and adversely affected. In that event, the price of our Class A common stock could decline.
Risks Related to Our Business
If we are unable to attract and retain customers and increase sales to new and existing customers, our business and operating results would be harmed.
Our success depends on our ability to attract and retain customers and increase sales to new and existing customers. We derive a substantial portion of our revenue from domains and our hosting and presence products. The rate at which new and existing customers purchase and renew subscriptions to our products depends on a number of factors, including those outside of our control. Although our total customers and revenue have grown rapidly in the past, in recent periods our slower growth rates have reflected the size and scale of our business. We cannot be assured that we will achieve similar growth rates in future periods as our total customers and revenue could decline or grow more slowly than we expect. Our sales could fluctuate or decline as a result of lower demand for domain names, websites and related products, declines in our customers' level of satisfaction with our products and our Customer Care, the timeliness and success of product enhancements and introductions by us and those of our competitors, the pricing offered by us and our competitors, the frequency and severity of any system outages, breaches and technological change. Our revenue has grown historically due in large part to sustained customer growth rates and strong renewal sales of subscriptions to our domain name registration and hosting and presence products. Our future success depends in part on maintaining strong renewal sales. Our costs associated with renewal sales are substantially lower than costs associated with generating revenue from new customers and costs associated with generating sales of additional products to existing customers. Therefore, a reduction in renewals, even if offset by an increase in other revenue, would reduce our operating margins in the near term. Any failure by us to continue to attract new customers or maintain strong renewal sales could have a material adverse effect on our business, growth prospects and operating results. If we are unable to increase sales of additional products, such as personalized email accounts and other business applications products, to new and existing customers, our growth prospects may be harmed.
If we do not successfully develop and market products that anticipate or respond promptly to the needs of our customers, our business and operating results may suffer.
The markets in which we compete are characterized by constant change and innovation, and we expect them to continue to evolve rapidly. Our historical success has been based on our ability to identify and anticipate customer needs and design products providing small businesses and ventures with the tools they need to create, manage and augment their digital identity. To the extent we are not able to continue to identify challenges faced by small businesses and ventures and provide products responding in a timely and effective manner to their evolving needs, our business, operating results and financial condition may be adversely affected.
The process of developing new products and technology is complex and uncertain. If we fail to accurately predict customers' changing needs or emerging technological trends, or if we fail to achieve the benefits expected from our investments in technology, our business could be harmed. These product and technology investments include those we develop internally, such as our "do-it-yourself" website builder GoCentral, our hosting platforms, and our security products, those we acquire and develop as a result of acquisitions, such as SmartLine and Website Security, and those related to our partner programs, such as Microsoft. We must continue to commit significant resources to develop our technology in order to maintain our competitive position, and these commitments will be made without knowing whether such investments will result in products our customers will accept. Our new products or product enhancements could fail to attain meaningful customer acceptance for many reasons, including:
•
delays in releasing new products or product enhancements to the market;
•
our failure to accurately predict market demand or customer preferences;
•
defects, errors or failures in product design or performance;
•
negative publicity about product performance or effectiveness;
•
introduction of competing products (or the anticipation thereof) by other market participants;
18
•
poor business conditions for our customers or poor general macroeconomic conditions;
•
the perceived value of our products or product enhancements relative to their cost; and
•
changing regulatory requirements adversely affecting the products we offer.
There is no assurance we will successfully identify new opportunities, develop and bring new products to market on a timely basis, or that products and technologies developed by others will not render our products or technologies obsolete or noncompetitive, any of which could adversely affect our business and operating results. If our new products or enhancements do not achieve adequate acceptance by our customers, or if our new products do not result in increased sales or subscriptions, our competitive position will be impaired, our anticipated revenue growth may not be achieved and the negative impact on our operating results may be particularly acute because of the upfront technology and development, marketing and advertising and other expenses we may incur in connection with new products or enhancements.
Our brand is integral to our success. If we fail to protect or promote our brand, our business and competitive position may be harmed.
Protecting and maintaining awareness of our brand is important to our success, particularly as we seek to attract new customers globally. We have invested, and expect to continue to invest, substantial resources to increase our brand awareness, both generally and in specific geographies and to specific customer groups, such as Web Pros. There can be no assurance that our brand development strategies will enhance the recognition of our brand or lead to increased sales. Furthermore, our international branding efforts may prove unsuccessful due to language barriers and cultural differences. If our efforts to protect and promote our brand are not successful, our operating results may be adversely affected. In addition, even if our brand recognition and loyalty increases, our revenue may not increase at a level commensurate with our marketing spend.
A network attack, a security breach or other data security incident could delay or interrupt service to our customers, harm our reputation or subject us to significant liability.
Our operations depend on our ability to protect our network and systems against interruption or damage from unauthorized entry, computer viruses, denial of service attacks and other security threats beyond our control. We regularly experience DDOS attacks by hackers aimed at disrupting service to our customers and attempts to place illegal or abusive content on our or our customers' websites, and we may be subject to DDOS attacks or content abuse in the future. Our response to such DDOS attacks may be insufficient to protect our network and systems, especially as attacks (such as the DYN attack in October 2016) increase in size. In addition, there has been an increase in the number of malicious software attacks in the technology industry, including malware and ransomware, such as WannaCry. In addition, from time to time, activities of our customers or other parties may cause us to suspend or terminate customer accounts. We have suspended and terminated, and will in the future suspend or terminate, a customer's use of our products when the activities on their site breach our terms of service (for example, phishing or resource misuse), interfere with or harm other customers' websites sharing the same resources or otherwise violate applicable law. We may also suspend or terminate a customer's website if it is repeatedly targeted by DDOS or other attacks disrupting other customers' websites or servers or otherwise impacts our infrastructure.
We cannot guarantee our backup systems, regular data backups, security protocols, network protection mechanisms and other procedures currently in place, or that may be in place in the future, will be adequate to prevent or remedy network and service interruption, system failure, damage to one or more of our systems, data loss, security breaches or other data security incidents. Also, our products are cloud-based, and the amount of data we store for our customers on our servers has been increasing as our business has grown. Despite the implementation of security measures, our infrastructure may be vulnerable to computer viruses, worms, other malicious software programs, illegal or abusive content or similar disruptive problems caused by our customers, employees, consultants or other Internet users who attempt to invade or disrupt public and private data networks or to improperly access, use or obtain data. Any actual or perceived breach of our security, or any other data security incident, could damage our reputation and brand, expose us to a risk of loss or litigation and possible liability, subject us to regulatory or other government inquiries or investigations, require us to expend significant capital and other resources to alleviate problems caused by the breach, and deter customers from using our products, any of which would harm our business, financial condition and operating results.
19
If the security of the confidential information or personally identifiable information we maintain, including that of our customers and the visitors to our customers' websites stored in our systems, is breached or otherwise subjected to unauthorized access, our reputation may be harmed and we may be exposed to liability.
Our business involves the storage and transmission of confidential information, including personally identifiable information. In addition, as nearly all of our products are cloud-based, the amount of data we store for our customers on our servers (including personally identifiable information and other potentially sensitive information) has been increasing. We take measures intended to protect the security, integrity and confidentiality of the personal information and other sensitive information, including payment card information, we collect, store or transmit, but cannot guarantee that inadvertent or unauthorized use or disclosure will not occur or that third parties or our employees will not gain unauthorized access to this information despite our efforts. If third parties succeed in penetrating our security measures or those of our vendors and partners, or in otherwise accessing or obtaining without authorization the payment card information or other sensitive or confidential information we or our vendors and partners maintain, we could be subject to liability, loss of business, litigation, government investigations or other losses. Hackers or individuals who attempt to breach our security measures or those of our vendors and partners could, if successful, cause the unauthorized disclosure, misuse, or loss of personally identifiable information or other confidential information, including payment card information, suspend our web-hosting operations or cause malfunctions or interruptions in our networks.
If we or our partners experience any breaches of our security measures or sabotage, or otherwise suffer unauthorized use or disclosure of, or access to, personally identifiable information or other confidential information, including payment card information, we might be required to expend significant capital and resources to protect against or address these problems. We may not be able to remedy any problems caused by hackers or other similar actors in a timely manner, or at all. Because techniques used to obtain unauthorized access or to sabotage systems change frequently and generally are not recognized until after they are launched against a target, we and our vendors and partners may be unable to anticipate these techniques or to implement adequate preventative measures on a timely basis. Advances in computer capabilities, discoveries of new weaknesses and other developments with software generally used by the Internet community, such as the Meltdown and Spectre vulnerabilities, which exploit security flaws in chips manufactured in the last 20 years, the Shellshock vulnerability in the Linux Bash shell, or WannaCry or Petya ransomware attacks, also increase the risk that we, or our customers using our servers, will suffer a security breach. Our partners and we may also suffer security breaches or unauthorized access to personally identifiable information and other confidential information, including payment card information, due to employee error, rogue employee activity, unauthorized access by third parties acting with malicious intent or who commit an inadvertent mistake or social engineering. If a breach of our security or other data security incident occurs or is perceived to have occurred, the perception of the effectiveness of our security measures and our reputation could be harmed and we could lose current and potential customers.
Security breaches or other unauthorized access to personally identifiable information and other confidential information, including payment card information, could result in claims against us for unauthorized purchases with payment card information, identity theft or other similar fraud claims as well as for other misuses of personally identifiable information, including for unauthorized marketing purposes, which could result in a material adverse effect on our business or financial condition. Moreover, these claims could cause us to incur penalties from payment card associations (including those resulting from our failure to adhere to industry data security standards), termination by payment card associations of our ability to accept credit or debit card payments, litigation and adverse publicity, and regulatory or other government inquiries or investigations, any of which could have a material adverse effect on our business and financial condition. We expect to continue to expend significant resources to protect against security breaches and other data security incidents. The risk that these types of events could seriously harm our business is likely to increase as we expand the number of cloud-based products we offer and operate in more countries.
We are exposed to the risk of system failures and capacity constraints.
We have experienced, and may in the future experience, system failures and outages disrupting the operation of our websites or our products such as web-hosting and email, or the availability of our Customer Care operations. Our revenue depends in large part on the volume of traffic to our websites, the number of customers whose websites we host on our servers and the availability of our Customer Care operations. Accordingly, the performance, reliability and availability of our websites and servers for our corporate operations and infrastructure, as well as in the delivery of products to customers, are critical to our reputation and our ability to attract and retain customers.
We are continually working to expand and enhance our website features, technology and network infrastructure and other technologies to accommodate substantial increases in the volume of traffic on our godaddy.com and affiliated websites, the number of customer websites we host and our overall total customers. We may be unsuccessful in these efforts, or we may be unable to project accurately the rate or timing of these increases. In the future, we may be required to allocate resources, including
20
spending substantial amounts, to build, purchase or lease data centers and equipment and upgrade our technology and network infrastructure in order to handle increased customer traffic, as well as increased traffic to customer websites we host. We cannot predict whether we will be able to add network capacity from third-party suppliers or otherwise as we require it. In addition, our network or our suppliers' networks might be unable to achieve or maintain data transmission capacity high enough to process orders or download data effectively in a timely manner. Our failure, or our suppliers' failure, to achieve or maintain high data transmission capacity could significantly reduce consumer demand for our products. Such reduced demand and resulting loss of traffic, cost increases, or failure to accommodate new technologies could harm our business, revenue and financial condition. Our systems, including those of our data centers and Customer Care operations, are also vulnerable to damage from fire, power loss, telecommunications failures, computer viruses, physical and electronic break-ins and similar events. The property and business interruption insurance coverage we carry may not be adequate to compensate us fully for losses that may occur.
We rely on third parties to perform certain key functions, and their failure to perform those functions could result in the interruption of our operations and systems and could result in significant costs and reputational damage to us.
We rely on third parties to perform certain technology, processing, servicing and support functions on our behalf, and may in the future choose to transition a function previously managed by us to such third parties. For example, in 2018 we intend to transition from a combination of company-owned and co-located data centers to third-party cloud computing and hosting providers for the delivery of most of our products and storage of our data. In addition in 2018, we also intend to transition certain transactional accounting functions to a professional services firm. When we choose to transition a function to a third party, we may spend significant time and effort, incur higher costs than originally expected and experience delays in completing such transition. We may never realize any of the anticipated benefits of relying on such third parties, including acquisition of new customers, improved product features, and positive financial results. In addition, these third parties are vulnerable to operational and technological disruptions, which may negatively impact our ability to provide services to our customers, operate our business and fulfill our financial reporting obligations. We may have limited remedies against these third parties in the event of service disruptions. If third parties are unable to perform these functions on our behalf because of service interruptions or extended outages, or because those services are no longer available on commercially reasonable terms, our expenses could increase and our customers' use of our products could be impaired until equivalent services, if available, are identified, obtained and implemented, all of which could adversely affect our business.
Evolving technologies and resulting changes in customer behavior or customer practices may impact the value of and demand for domain names.
Historically, Internet users navigated to a website by directly typing its domain name into a web browser or navigation bar. The domain name serves as a branded, unique identifier not unlike a phone number or email address. However, people now use multiple methods to access websites. For example, people increasingly use search engines to find and access websites as an alternative to typing a website address directly into a web browser navigation bar. People increasingly use social networking and microblogging sites to find and access websites. Further, as people continue to access the Internet more frequently through applications on mobile devices, domain names may become less prominent and their value may decline. These evolving technologies and changes in customer behavior may have an adverse effect on our business and growth prospects.
We rely on our marketing efforts and channels to promote our brand and acquire new customers. These efforts may require significant expense and may not be successful or cost-effective.
We use a variety of marketing channels to promote our brand, including online keyword search, sponsorships and celebrity endorsements, television, radio and print advertising, email and social media marketing. If we lose access to one or more of these channels, such as online keyword search, because the costs of advertising become prohibitively expensive or for other reasons, we may become unable to promote our brand effectively, which could limit our ability to grow our business. Further, if our marketing activities fail to generate traffic to our website, attract customers and lead to new and renewal sales of our subscriptions at the levels we anticipate, our business and operating results would be adversely affected. There can be no assurance our marketing efforts will succeed or be cost-efficient, and if our customer acquisition costs increase, our business, operating results and financial performance could be adversely affected.
Our ability to increase sales of our products is highly dependent on the quality of our Customer Care. Our failure to provide high-quality Customer Care would have an adverse effect on our business, brand and operating results.
Our Customer Care team has historically contributed significantly to our total bookings. In each of
2017
,
2016
and
2015
, at least
20%
of our total bookings were generated from the sale of product subscriptions by our Customer Care team.
21
The majority of our current offerings are designed for customers who often self-identify as having limited to no technology skills. Our customers depend on our Customer Care to assist them as they create, manage and grow their digital identities. After launching their sites and leveraging our product offerings, customers depend on our Customer Care team to quickly resolve any issues relating to those offerings. Further, as we continue to broaden our portfolio of solutions, increase the size of our customer base and increase the size of our solution deployments within our customers' IT infrastructure, we must continue to adapt our customer support organization to ensure our customers continue to receive the high level of customer service which they have come to expect. Notwithstanding our commitment to Customer Care, our customers will occasionally encounter interruptions in service and other technical challenges and it is therefore critical we are there to provide ongoing, high-quality support to help our customers. We must continue to refine our efforts in Customer Care so we can adequately serve our domestic and international customers.
If we do not provide effective ongoing Customer Care, our ability to sell our products to new and existing customers could be harmed, and our high subscription renewal rates and cross-selling of our products may decline and our reputation may suffer, any of which could adversely affect our business, reputation and operating results.
We face significant competition for our products in the domain name registration and web-hosting markets and other markets in which we compete, which we expect will continue to intensify, and we may not be able to maintain or improve our competitive position or market share.
We provide cloud-based solutions enabling individuals, businesses and organizations to establish an online presence, connect with customers and manage their ventures. The market for these solutions is highly fragmented and competitive. These solutions are also rapidly evolving, creating opportunity for new competitors to enter the market with point-solution products or address specific segments of the market. In some instances, we have commercial partnerships with companies with which we also compete. Given our broad product portfolio, we compete with niche point-solution products and broader solution providers. Our competitors include providers of domain registration services, web-hosting solutions, website creation and management solutions, e-commerce enablement providers, cloud computing service and online security providers, alternative web presence and marketing solutions providers and providers of productivity tools such as business-class email.
We expect competition to increase in the future from competitors in the domain and hosting and presence markets, such as Endurance, United Internet, Web.com and Donuts, as well as competition from companies such as Google, Amazon and Microsoft, which provide web-hosting, other cloud-based services and domain name registration, and eBay and Facebook, which offer Internet marketing platforms. In addition, we face competition in the website and e-commerce site building market from competitors such as Wix, Squarespace and Shopify, and from providers of social media networks and applications including Facebook and Tencent. Some of our current and potential competitors have greater resources, more brand recognition and consumer awareness, more diversified product offerings, greater international scope and larger customer bases than we do, and we may therefore not be able to effectively compete with them. If these competitors and potential competitors decide to devote greater resources to the development, promotion and sale of products in the markets in which we compete, or if the products offered by these companies are more attractive to or better meet the evolving needs of our customers, our market share, growth prospects and operating results may be adversely affected.
In addition, in an attempt to gain market share, competitors may offer aggressive price discounts or alternative pricing models on the products they offer, such as so-called freemium pricing in which a basic offering is provided for free with advanced features provided for a fee, or increase commissions paid to their referral sources. As a result, increased competition could result in lower sales, price reductions, reduced margins and the loss of market share. Moreover, competitors and other third-parties may aggressively bid on Google AdWords, which could result in increased marketing expenses making it difficult for us to compete.
Furthermore, conditions in our market could change rapidly and significantly as a result of technological advancements, partnering by our competitors or continuing market consolidation. Innovative new start-up companies and large competitors making significant investments in technology and development may invent similar or superior products and technologies competing with our products and technology. Our current and potential competitors may also establish cooperative relationships among themselves or with third parties that may further enhance their ability to compete. The continued entry of competitors into the domain name registration and web-hosting markets, and the rapid growth of some competitors that have already entered each market, may make it difficult for us to maintain our market position. Our ability to compete will depend upon our ability to provide a better product than our competitors at a competitive price and supported by superior Customer Care. To remain competitive, we may be required to make substantial additional investments in research, development, marketing and sales in order to respond to competition, and there can be no assurance that these investments will achieve any returns for us or that we will be able to compete successfully in the future.
22
The future growth of our business depends in significant part on increasing our international bookings. Our recent and continuing international expansion efforts subject us to additional risks.
Bookings outside of the U.S. represented approximately
33%
,
28%
and
26%
of our totals for
2017
,
2016
and
2015
, respectively. In 2012, we began the process of localizing our products in numerous markets, languages and currencies, expanding our systems to accept payments in forms common outside of the U.S., focusing our marketing efforts in numerous non-U.S. geographies, tailoring our Customer Care offerings to serve these markets, expanding our infrastructure in various non-U.S. locations and establishing Customer Care operations in overseas locations. We have continued our international expansion efforts, such as our acquisition of HEG. Our international expansion efforts may be slow or unsuccessful to the extent we experience difficulties in recruiting, training, managing and retaining qualified personnel with international experience, language skills and cultural competencies in the geographic markets we target. Furthermore, as we continue to expand internationally, it may prove difficult to maintain our corporate culture, which we believe has been critical to our success. In addition, we have limited experience operating in foreign jurisdictions. Conducting and expanding international operations subjects us to new risks we have not generally faced in the U.S., including the following:
•
management, communication and integration problems resulting from language barriers, cultural differences and geographic dispersion of our customers and personnel;
•
language translation of, and associated Customer Care support for, our products;
•
compliance with foreign laws, including laws regarding online disclaimers, advertising, liability of online service providers for activities of customers especially with respect to hosted content,and more stringent laws in foreign jurisdictions relating to consumer privacy and protection of data collected from individuals and other third parties;
•
accreditation and other regulatory requirements to do business and to provide domain name registration, web-hosting and other products in foreign jurisdictions;
•
greater difficulty in enforcing contracts, including our universal terms of service and other agreements;
•
increased expenses incurred in establishing and maintaining office space and equipment for our international operations;
•
greater costs and expenses associated with international marketing and operations;
•
greater risk of unexpected changes in regulatory practices, tariffs and tax laws and treaties;
•
different or lesser degrees of protection for our or our customers' intellectual property and free speech rights in certain markets;
•
increased exposure to foreign currency risks;
•
increased risk of a failure of employees to comply with both U.S. and foreign laws, including export and antitrust regulations, anti-bribery regulations and any trade regulations ensuring fair trade practices;
•
heightened risk of unfair or corrupt business practices in certain geographies; and
•
the potential for political, social or economic unrest, terrorism, hostilities or war; and multiple and possibly overlapping tax regimes.
In addition, the expansion of our existing international operations and entry into additional international markets has required and will continue to require significant management attention and financial resources. In particular, we have invested, and intend to continue to invest, in product marketing, infrastructure and personnel to support our international expansion efforts. These increased marketing costs may increase our cost of acquiring international customers, which may delay our ability to achieve profitability or reduce our profitability in the future. We may also face pressure to lower our prices in order to compete in emerging markets, which could adversely affect revenue derived from our international operations. These and other factors associated with our international operations could impair our growth prospects and adversely affect our business, operating results and financial condition.
Mobile devices are increasingly used to access the Internet, and our cloud-based and mobile support products may not operate or be as effective when accessed through these devices, which could harm our business.
Historically, we designed our web-based products for use on a desktop or laptop computer; however, mobile devices, such as smartphones and tablets, are increasingly being used as the primary means for accessing the Internet and conducting e-commerce. We are dependent on the interoperability of our products with third-party mobile devices and mobile operating
23
systems, as well as web browsers we do not control. Any changes in such devices, systems or web browsers degrading the functionality of our products or giving preferential treatment to competitive products could adversely affect usage of our products. In the event our customers have difficulty accessing and using our products on mobile devices, our customer growth, business and operating results could be adversely affected.
We have made significant investments in recent periods to support our growth strategy. These investments may not succeed. If we do not effectively manage future growth, our operating results will be adversely affected.
We continue to increase the breadth and scope of our product offerings and operations. To support future growth, we must continue to improve our information technology and financial infrastructure, operating and administrative systems and ability to effectively manage headcount, capital and processes. We must also continue to increase the productivity of our existing employees and hire, train and manage new employees while maintaining our unique corporate culture. If we fail to manage our growth or change in a manner that fails to preserve the key aspects of our corporate culture, the quality of our platform, products and Customer Care may suffer, which could negatively affect our brand and reputation and harm our ability to retain and attract customers and employees.
We have incurred, and will continue to incur, expenses relating to our investments in international operations and infrastructure, such as the expansion of our offerings and marketing presence in India, Europe, Latin America and Asia; our targeted marketing spending to attract new customer groups, such as Web Pros and customers in non-U.S. markets; and investments in software systems and additional data center resources to keep pace with the growth of our cloud infrastructure and cloud-based product offerings. We have made significant investments in product development, corporate infrastructure and technology and development, and intend to continue investing in the development of our products and infrastructure and our marketing and Customer Care teams.
We are likely to recognize the costs associated with these investments earlier than some of the anticipated benefits, and the return on these investments may be lower or may develop more slowly than we expect. If we do not achieve the benefits anticipated from these investments, or if the achievement of these benefits is delayed, our operating results may be adversely affected.
We have experienced rapid growth over the last several years, which has the potential to strain our management, administrative, operational and financial infrastructure. The scalability and flexibility of our infrastructure depends on the functionality and bandwidth of our data centers, peering sites and servers. The significant growth in our total customers and the increase in the number of transactions we process have increased the amount of our stored customer data. Any loss of data or disruption in our ability to provide our product offerings due to disruptions in our infrastructure or services could result in harm to our brand or reputation. Moreover, as our customer base continues to grow and uses our platform for more complicated tasks, we will need to devote additional resources to improve our infrastructure and continue to enhance its scalability and security. If we do not manage the growth of our business and operations effectively, the quality of our platform and efficiency of our operations could suffer, which could harm our operating and business results.
In January 2016, we selected a new enterprise resource planning system. During the fourth quarter of 2016, we completed the human capital management portion of our system implementation. We began work on the system implementation of the financial portion in 2017, and expect to continue that work through late 2018. As we plan for and implement a new system, we may experience difficulties in managing our existing systems and processes, which could disrupt our operations, the management of our finances and the reporting of our financial results. We may also experience difficulties in implementing this new system at the same time we work on several other initiatives, such as transitioning certain transactional accounting functions to a professional services firm, implementing a new revenue recognition system and implementing controls and procedures over financial reporting at HEG pursuant to the Sarbanes-Oxley Act of 2002 (the Sarbanes-Oxley Act). Our failure to improve our systems and processes or complete such system implementation on a timely basis, or their failure to operate in the intended manner, may result in our inability to manage the growth of our business and successfully integrate our acquisitions, and to accurately forecast and report our results.
The failure to integrate successfully our businesses and operations with those of HEG in the expected time frame may adversely affect our future results.
On April 3, 2017, we completed the acquisition of all of the outstanding shares of HEG and certain loan notes issued by Host Europe Finance Co. Ltd. for
€1.7 billion
(approximately $1.9 billion) (the Transaction). GoDaddy and HEG operated as independent companies until the closing of the acquisition. We may not achieve the expected revenue and cost synergies associated with the HEG acquisition. We may face significant challenges in consolidating our functions with those of HEG and its
24
subsidiaries, integrating our technologies, organizations, procedures, policies, financial reporting and operations, as well as addressing differences in the business cultures of the two companies and retaining key personnel. The integration is complex and time consuming, and requires substantial resources and effort. We incurred transaction fees and professional service costs in connection with the Transaction, and we expect to incur significant integration and restructuring costs as we continue integrating operations. Although we expect that the realization of efficiencies related to the Transaction will offset incremental transaction, acquisition-related and restructuring costs over time, this net benefit may not be achieved in the near term, or at all.
The integration process and other disruptions resulting from the Transaction may negatively impact our ongoing operations or cause inconsistencies in standards, controls, financial reporting, procedures and policies, adversely affecting our relationships with our customers and other market participants, employees, regulators and others with whom we have business or other dealings. In addition, difficulties in integrating our businesses or regulatory functions with those of HEG could harm our reputation and adversely affect our growth prospects.
We may acquire other businesses or talent, which could require significant management attention, disrupt our business, dilute stockholder value and adversely affect our operating results.
As part of our business strategy, we have in the past made, and may in the future make, acquisitions or investments in companies, talent, products, domain portfolios and technologies we believe will complement our business and address the needs of our customers, such as our recent acquisitions of HEG, FreedomVoice and Sucuri, and our proposed acquisition of Main Street Hub. We cannot ensure we will be able to successfully integrate the acquired products, talent and technology, benefit from increased subscriptions and revenue and achieve desired revenue and expense synergies. In the future, we may not be able to find suitable acquisition candidates, and we may not be able to complete such acquisitions on favorable terms, if at all. If we do complete acquisitions, we may be unsuccessful in achieving the anticipated benefits of the acquisition and may fail to integrate the acquired business and operations effectively. In addition, any future acquisitions we complete could be viewed negatively by our customers, investors and industry analysts.
We may have to pay cash, incur debt or issue equity securities to pay for future acquisitions, each of which could adversely affect our financial condition or the value of our Class A common stock. Equity issuances in connection with potential future acquisitions may also result in dilution to our stockholders. In addition, our future operating results may be impacted by performance earn-outs or contingent bonuses. Furthermore, acquisitions may involve contingent liabilities, adverse tax consequences, additional equity-based compensation expense, adjustments for fair value of deferred revenue, the recording and subsequent amortization of amounts related to certain purchased intangible assets and, if unsuccessful, impairment charges resulting from the write-off of goodwill or other intangible assets associated with the acquisition, any of which could negatively impact our future results of operations.
In addition, if we are unsuccessful at integrating the operations or technologies associated with such acquisitions, into our company, the revenue and operating results of the combined company could be adversely affected. We may fail to identify all of the problems, liabilities or other shortcomings or challenges of an acquired company, including issues related to intellectual property, solution quality or architecture, regulatory compliance practices, employment practices, customer or sales channel issues and failure to integrate prior acquisitions. Any integration process may result in unforeseen operating difficulties and require significant time and resources, and we may not be able to manage the process successfully. In particular, we may encounter difficulties assimilating or integrating the companies, solutions, technologies, accounting systems, personnel or operations we acquire, particularly if the key personnel are geographically dispersed or choose not to work for us. Additionally, acquired companies may focus on achieving performance earn-outs or contingent payments rather than integrating with us. We may also experience difficulty in effectively integrating or preserving the different cultures and practices of the companies we acquire. Acquisitions may also disrupt our core business, divert our resources and require significant management attention that would otherwise be available for development of our existing business. We may not successfully evaluate or utilize the acquired technology, intellectual property or personnel, or accurately forecast the financial impact of an acquisition transaction, including accounting charges. If we fail to properly evaluate, execute or integrate acquisitions or investments, the anticipated benefits may not be realized, we may be exposed to unknown or unanticipated liabilities, and our business and growth prospects could be harmed.
If the rate of growth of small businesses and ventures is significantly lower than our estimates or if demand for our products does not meet expectations, our ability to generate revenue and meet our financial targets could be adversely affected.
Although we expect continued demand from small businesses and ventures for our products, it is possible the rate of growth may not meet our expectations, or the market may not grow, either of which would adversely affect our business. Our expectations for future revenue growth are based in part on assumptions reflecting our industry knowledge and experience serving
25
small businesses and ventures, as well as our assumptions regarding demographic shifts, growth in the availability and capacity of Internet infrastructure internationally and the general economic climate. If any of these assumptions proves to be inaccurate, our revenue growth could be significantly lower than expected.
Our ability to compete successfully depends on our ability to offer an integrated and comprehensive suite of products enabling our diverse base of customers to get their ideas online and start, grow and run their businesses and ventures. The success of our domains, hosting and presence and business applications offerings is predicated on the assumption that an online presence is, and will continue to be, an important factor in our customers' abilities to establish, expand and manage their businesses quickly, easily and affordably. If we are incorrect in this assumption, for example due to the introduction of a new technology or industry standard superseding the importance of an online presence or renders our existing or future products obsolete, then our ability to retain existing customers and attract new customers could be adversely affected, which could harm our ability to generate revenue and meet our financial targets.
We rely on search engines to attract a meaningful portion of our customers. If search engines change their search algorithms or policies regarding advertising, increase their pricing or suffer problems, our ability to attract new customers may be impaired.
Many of our customers locate our website and products through Internet search engines such as Google, Yahoo! and Bing. The prominence of our website in response to search inquiries is a critical factor in attracting potential customers to our websites. Search engines revise their algorithms from time to time in an attempt to optimize their search results. If search engines on which we rely for algorithmic listings modify their algorithms, our websites may appear less prominently or not at all in search results, which could result in reduced traffic to our websites that we may not be able to replace. Additionally, if the costs of search engine marketing services, such as Google AdWords, increase, we may incur additional marketing expenses or be required to allocate a larger portion of our marketing spend to this channel and our business and operating results could be adversely affected.
Furthermore, competitors may in the future bid on our brand names and other search terms we use to drive traffic to our websites. Such actions could increase our advertising costs and result in decreased traffic to our websites. In addition, search engines or social networking sites may change their advertising policies from time to time. Moreover, the use of voice recognition technology such as Alexa, Google Assistant or Siri may drive traffic away from search engines, potentially resulting in reduced traffic to our website. If any change to these policies delays or prevents us from advertising through these channels, it could result in reduced traffic to our website and sales of our subscriptions.
If we are unable to maintain our contractual relationships with existing partners or establish new contractual relationships with potential partners, we may not be able to offer the products and related functionality our customers expect.
We maintain a network of different types of partners, some of which create integrations with our products. For example, we partnered with Microsoft Corporation to offer Office 365 email and other productivity tools to our customers and we worked to make certain of our products interoperable with services such as Yelp, Facebook Pages and Google. In addition, we provided payment options for customers' websites through providers such as PayPal, Stripe, Square and Mercado Libre. We have invested and will continue to invest in partner programs to provide new product offerings to our customers and help us attract additional customers. However, our relationships with our partners may not be as successful in generating new customers as we anticipate, which could adversely affect our ability to increase our total customers. Further, these programs could require substantial investment while providing no assurance of return or incremental revenue. We also rely on some of our partners to create integrations with third-party applications and platforms used by our customers, such as the email encryption service provided by our partner ProofPoint. If our partners fail to create such integrations, or if they change the features of their applications or alter the terms governing use of their applications in an adverse manner, demand for our products could decrease, which would harm our business and operating results. If we are unable to maintain our contractual relationships with existing partners or establish new contractual relationships with potential partners, we may not be able to offer the products and related functionality our customers expect, and we may experience delays and increased costs in adding customers and may lose customers. Any ineffectiveness of our partner programs could materially adversely affect our business and results of operations.
Our quarterly and annual operating results may be adversely affected due to a variety of factors, which could make our future results difficult to predict and could cause our operating results to fall below investor or analyst expectations.
Our quarterly and annual operating results and key metrics have varied from period to period in the past, and may fluctuate in the future as a result of a number of factors, many of which are outside of our control, including:
•
our ability to attract new customers and retain existing customers;
26
•
the timing and success of introductions of new products;
•
changes in the growth rate of small businesses and ventures;
•
changes in renewal rates for our subscriptions and our ability to sell additional products to existing customers;
•
refunds to our customers could be higher than expected;
•
the timing of revenue recognition relative to the recording of the related expense;
•
any negative publicity or other actions which harm our brand;
•
the timing of our marketing expenditures;
•
the mix of products sold;
•
our ability to maintain a high level of personalized Customer Care and resulting customer satisfaction;
•
competition in the market for our products;
•
our ability to expand internationally;
•
changes in foreign currency exchange rates;
•
rapid technological change, frequent new product introductions and evolving industry standards;
•
our ability to implement new financial and other administrative systems, including our new enterprise resource planning system;
•
systems, data center and Internet failures, breaches and service interruptions;
•
actions by foreign governments that reduce access to the Internet for their citizens;
•
changes in U.S. or foreign regulations, such as the General Data Protection Regulation (GDPR), that could impact one or more of our product offerings or changes to regulatory bodies, such as ICANN, as well as increased regulation by governments or multi-governmental organizations, such as the International Telecommunications Union, a specialized agency of the United Nations or the European Union, that could affect our business and our industry;
•
a delay in the authorization of new TLDs by ICANN or our ability to successfully on-board new TLDs which would impact the breadth of our customer offerings;
•
shortcomings in, or misinterpretations of, our metrics and data which cause us to fail to anticipate or identify market trends;
•
terminations of, disputes with, or material changes to our relationships with third-party partners, including referral sources, product partners and payment processors;
•
reductions in the selling prices for our products;
•
costs and integration issues associated with our acquisition of HEG and any other acquisitions we may make;
•
changes in legislation affecting our collection of indirect taxes both in the U.S. and in foreign jurisdictions;
•
increases in rates of failed sales on our aftermarket platform for transactions in which we act as the primary obligor, resulting in higher than expected domain portfolio assets;
•
timing of expenses and tax distributions;
•
threatened or actual litigation; and
•
loss of key employees.
Any one of the factors above, or the cumulative effect of some of the factors referred to above, may result in significant fluctuations in our quarterly or annual operating results, including fluctuations in our key financial and operating metrics, our ability to forecast those results and our ability to achieve those forecasts. This variability and unpredictability could result in our failing to meet our revenue, bookings or operating results expectations or those of securities analysts or investors for any period. In addition, a significant percentage of our operating expenses are fixed in nature and based on forecasted revenue and bookings trends. Accordingly, in the event of revenue or bookings shortfalls, we are generally unable to mitigate the negative impact on operating results in the short term.
27
We may release guidance in our quarterly earnings conference calls, quarterly earnings releases, or otherwise, based on predictions by management, which are necessarily speculative in nature. Our guidance may vary materially from actual results for a variety of reasons, including that our cash generation may be uneven across quarters. If our revenue, bookings or operating results, or the rate of growth of our revenue, bookings or operating results, fall below the expectations of our investors or financial analysts, or below any forecasts or guidance we may provide to the market, or if the forecasts we provide to the market are below the expectations of analysts or investors, the price of our common stock could decline substantially. Such a stock price decline could occur even when we have met our own or other publicly stated revenue, bookings or earnings forecasts. Our failure to meet our own or other publicly stated revenue, bookings or earnings forecasts, or even when we meet our own forecasts but fall short of analyst or investor expectations, could cause our stock price to decline and expose us to lawsuits, including securities class action suits. Such litigation could impose substantial costs and divert management's attention and resources.
We have a history of operating losses and may not be able to maintain profitability in the future.
We had net income of
$140 million
in
2017
; however, we had net losses of
$22 million
and
$120 million
, in
2016
and
2015
, respectively. While we have experienced revenue growth over these same periods, we may not be able to sustain or increase our growth or maintain profitability in the future or on a consistent basis. We have incurred substantial expenses and expended significant resources upfront to market, promote and sell our products. We also expect to continue to invest for future growth. In addition, we expect to continue to incur significant accounting, legal and other expenses as a public company.
As a result of our increased expenditures, we will have to generate and sustain increased revenue to maintain future profitability. Maintaining profitability will require us to ensure revenues continue to increase while managing our cost structure and avoiding significant liabilities. Revenue growth may slow or decline, or we may incur significant losses in the future for a number of possible reasons, including general macroeconomic conditions, increased competition, a decrease in the growth of the markets in which we operate, or if we fail for any reason to continue to capitalize on growth opportunities. Additionally, we may encounter unforeseen operating expenses, difficulties, complications, delays and other unknown factors that may result in losses in future periods. If these losses exceed our expectations or our revenue growth expectations are not met in future periods, our financial performance will be harmed, and our stock price could be volatile or decline.
We may need additional equity, debt or other financing in the future, which we may not be able to obtain on acceptable terms, or at all, and any additional financing may result in restrictions on our operations or substantial dilution to our stockholders.
We may need to raise funds in the future, for example, to develop new technologies, expand our business, respond to competitive pressures and make acquisitions. We may try to raise additional funds through public or private financings, strategic relationships or other arrangements. Although our credit agreements limit our ability to incur additional indebtedness, these restrictions are subject to a number of qualifications and exceptions and may be amended with the consent of our lenders. Accordingly, under certain circumstances, we may incur substantial additional debt.
Our ability to obtain debt or equity funding will depend on a number of factors, including market conditions, interest rates, our operating performance, our credit rating and investor interest. Additional funding may not be available to us on acceptable terms or at all. If adequate funds are not available, we may be required to reduce expenditures, including curtailing our growth strategies, foregoing acquisitions or reducing our product development efforts. If we succeed in raising additional funds through the issuance of equity or equity-linked securities, then existing stockholders could experience substantial dilution. If we raise additional funds through the issuance of debt securities or preferred stock, these new securities would have rights, preferences and privileges senior to those of the holders of our Class A common stock. In addition, any such issuance could subject us to restrictive covenants relating to our capital raising activities and other financial and operational matters, which may make it more difficult for us to obtain additional capital and to pursue business opportunities, including potential acquisitions. Further, to the extent we incur additional indebtedness or such other obligations, the risks associated with our substantial leverage described elsewhere in this 10-K, including our possible inability to service our debt, would increase.
Because we are generally required to recognize revenue for our products over the term of the applicable agreement, changes in our sales may not be immediately reflected in our operating results.
As described in Note
2
to our consolidated financial statements, we generally recognize revenue from our customers ratably over the respective terms of their subscriptions in accordance with GAAP. Our subscription terms are typically one year, but can range from monthly terms to multi-annual terms of up to 10 years depending on the product. Accordingly, increases in sales during a particular period do not translate into immediate, proportional increases in revenue during such period, and a substantial portion of the revenue we recognize during a quarter is derived from deferred revenue from customer subscriptions we
28
entered into during previous quarters. As a result, our margins may suffer despite substantial sales activity during a particular period, since GAAP does not permit us to recognize all of the revenue from our sales immediately. Conversely, a decline in new or renewed subscriptions in any one quarter may not be reflected in our revenue for that quarter and the existence of substantial deferred revenue may prevent deteriorating sales activity from becoming immediately observable in our consolidated statements of operations. In addition, we may not be able to adjust spending in a timely manner to compensate for any unexpected bookings shortfall, and any significant shortfall in bookings relative to planned expenditures could negatively impact our business and results of operations.
Our failure to properly register or maintain our customers' domain names could subject us to additional expenses, claims of loss or negative publicity that could have a material adverse effect on our business.
System and process failures related to our domain name registration service may result in inaccurate and incomplete information in our domain name database. Despite testing, system and process failures may remain undetected or unknown, which could result in compromised customer data, loss of or delay in revenues, failure to achieve market acceptance, injury to our reputation or increased product costs, any of which could harm our business. Furthermore, the requirements for securing and renewing domain names vary from registry to registry and are subject to change. We cannot guarantee we will be able to readily adopt and comply with the various registry requirements. Our failure or inability to properly register or maintain our customers' domain names, even if we are not at fault, might result in significant expenses and subject us to claims of loss or to negative publicity, which could harm our business, brand and operating results.
We rely heavily on the reliability, security and performance of our internally developed systems and operations. Any difficulties in maintaining these systems may result in damage to our brand, service interruptions, decreased customer service or increased expenditures.
The reliability and continuous availability of the software, hardware and workflow processes underlying our internal systems, networks and infrastructure and the ability to deliver our products are critical to our business. Any interruptions resulting in our inability to timely deliver our products or Customer Care, or materially impacting the efficiency or cost with which we provide our products and Customer Care, would harm our brand, profitability and ability to conduct business. In addition, many of the software and other systems we currently use will need to be enhanced over time or replaced with equivalent commercial products or services, which may not be available on commercially reasonable terms or at all. Enhancing or replacing our systems, networks or infrastructure could entail considerable effort and expense. If we fail to develop and execute reliable policies, procedures and tools to operate our systems, networks or infrastructure, we could face a substantial decrease in workflow efficiency and increased costs, as well as a decline in our revenue.
We rely on a limited number of data centers to deliver most of our products. If we are unable to renew our data center agreements on favorable terms, or at all, our operating margins and profitability could be adversely affected and our business could be harmed.
We own one of our data centers and lease our remaining data center capacity from wholesale providers. We occupy our leased data center capacity pursuant to co-location service agreements with third-party data center facilities, which have built and maintain the co-located data centers for us and other parties. We currently serve all our customers from our GoDaddy-owned, Arizona-based data center as well as domestic and international co-located data center facilities located in Arizona, California, Missouri, Virginia, New York, France, Germany, the Netherlands, Singapore and the United Kingdom. Although we own the servers in these co-located data centers and engineer and architect the systems upon which our platforms run, we do not control the operation of these facilities, and we depend on the operators of these facilities to ensure their proper security and maintenance.
Despite precautions taken at our data centers, these facilities may be vulnerable to damage or interruption from break-ins, computer viruses, DDOS or other cyber-attacks, acts of terrorism, vandalism or sabotage, power loss, telecommunications failures, fires, floods, earthquakes, hurricanes, tornadoes and similar events. The occurrence of any of these events or other unanticipated problems at these facilities could result in loss of data (including personal or payment card information), lengthy interruptions in the availability of our services and harm to our reputation and brand. While we have disaster recovery arrangements in place, they have been tested in only very limited circumstances and not during any large-scale or prolonged disasters or similar events.
The terms of our existing co-located data center agreements vary in length and expire on various dates through
2028
. Only some of our agreements with our co-located data centers provide us with options to renew under negotiated terms. We also have agreements with other critical infrastructure vendors which provide all of our facilities, including our data centers, with bandwidth, fiber optics and electrical power. None of these infrastructure vendors are under any obligation to continue to provide
29
these services after the expiration of their respective agreements with us, nor are they obligated to renew the terms of those agreements.
Our existing co-located data center agreements may not provide us with adequate time to transfer operations to a new facility in the event of early termination. If we were required to move our equipment to a new facility without adequate time to plan and prepare for such migration, we would face significant challenges due to the technical complexity, risk and high costs of the relocation. Any such migration could result in significant costs for us and may result in data loss and significant downtime for a significant number of our customers which could damage our reputation, cause us to lose current and potential customers and adversely affect our operating results and financial condition.
Undetected or unknown defects in our products could harm our business and future operating results.
The products we offer or develop, including our proprietary technology and technology provided by third parties, could contain undetected defects or errors. For example, in early 2017 we discovered a small number of recently issued SSL certificates failed due to a software bug inadvertently introduced during a routine code change. We revoked the SSL certificates potentially affected by the bug as a precautionary matter, remedied the bug, contacted affected customers, and initiated a new certificate request on their behalf at no additional cost. The performance of our products could have unforeseen or unknown adverse effects on the networks over which they are delivered as well as, more broadly, on Internet users and consumers and third-party applications and services utilizing our solutions. These adverse effects, defects and errors, and other performance problems relating to our products could result in legal claims against us that harm our business and damage our reputation. The occurrence of any of the foregoing could result in compromised customer data, loss of or delay in revenues, an increase in our annual refund rate, which has ranged from
7.2%
to
6.5%
of total bookings from
2015
to
2017
, loss of market share, failure to achieve market acceptance, diversion of development resources, injury to our reputation or brand and increased costs. In addition, while our terms of service specifically disclaim certain warranties, and contain limitations on our liability, courts may still hold us liable for such claims if asserted against us.
Privacy concerns relating to our technology could damage our reputation and deter existing and new customers from using our products.
From time to time, concerns have been expressed about whether our products or processes compromise the privacy of customers and others. Concerns about our practices with regard to the collection, use, disclosure or security of personally identifiable information, including payment card information, or other privacy related matters, even if unfounded, could damage our reputation and adversely affect our operating results. As we continue to grow our business organically and through acquisitions, the amount of data we store for our customers and related to our employees on our servers (including personally identifiable information) has been increasing. Any systems failure or compromise of our security resulting in the release of our users' or customers' data could seriously limit the adoption of our product offerings, as well as harm our reputation and brand and, therefore, our business. We expect to continue to expend significant resources to protect against security breaches. The risk that these types of events could seriously harm our business is likely to increase as we expand the number of cloud-based products we offer and operate in more countries.
We are subject to privacy and data protection laws and regulations as well as contractual privacy and data protection obligations. Our failure to comply with these or any future laws, regulations or obligations could subject us to sanctions and damages and could harm our reputation and business.
We are subject to a variety of laws and regulations, including regulation by various federal government agencies, including the Federal Trade Commission (FTC), Federal Communications Commission, and state and local agencies. We collect personally identifiable information, including payment card information, and other data from our current and prospective customers, website users and employees. The U.S. federal and various state and foreign governments have adopted or proposed limitations on, or requirements regarding, the collection, distribution, use, security and storage of personally identifiable information of individuals, including payment card information, and the FTC and many state attorneys general are applying federal and state consumer protection laws to impose standards on the online collection, use and dissemination of data. Self-regulatory obligations, other industry standards, policies, and other legal obligations may apply to our collection, distribution, use, security or storage of personally identifiable information or other data relating to individuals, including payment card information. These obligations may be interpreted and applied inconsistently from one jurisdiction to another and may conflict with one another, other regulatory requirements or our internal practices. Any failure or perceived failure by us to comply with U.S., E.U. or other foreign privacy or security laws, policies, industry standards or legal obligations or any security incident resulting in the unauthorized access to, or acquisition, release or transfer of, personally identifiable information or other data relating to our customers, employees and others, including payment card information, may result in governmental enforcement actions,
30
litigation, fines and penalties or adverse publicity and could cause our customers to lose trust in us, which could have an adverse effect on our reputation and business.
We expect there will continue to be newly enacted and proposed laws, regulations and industry standards concerning privacy, data protection and information security in the U.S., the European Union and other jurisdictions, and we cannot yet determine the impact such future laws, regulations and standards may have on our business. Such laws, regulations, standards and other obligations could impair our ability to, or the manner in which we, collect or use information we utilize to target advertising to our customers, thereby having a negative impact on our ability to maintain and grow our total customers and increase revenue. Future restrictions on the collection, use, sharing or disclosure of our users' data or additional requirements for express or implied consent of users for the use and disclosure of such information could require us to modify our products, possibly in a material manner, and could limit our ability to develop and implement new product features.
In particular, with regard to transfers to the U.S. of personal data (as such term is used in the 1995 EU Data Protection Directive and applicable European Union member state legislation, and as similarly defined under the GDPR and the proposed ePrivacy Regulation) from our employees and European customers and users, we rely upon the U.S.-EU Privacy Shield (a replacement framework for the U.S.-EU Safe Harbor Framework adopted in July 2016), as well as EU Model Clauses in certain circumstances. Both the U.S.-EU Privacy Shield and EU Model Clauses may be subject to legal challenge and may be modified or invalidated, and we may be unsuccessful in maintaining legitimate means for our transfer and receipt of personal data from the European Economic Area (EEA). We may experience reluctance or refusal by current or prospective European customers to use our products, and we may find it necessary or desirable to make further changes to our handling of personal data of EEA residents. The regulatory environment applicable to the handling of EEA residents' personal data, and our actions taken in response, may cause us to assume additional liabilities or incur additional costs, and could result in our business, operating results and financial condition being harmed. Additionally, we and our customers may face a risk of enforcement actions by data protection authorities in the EEA relating to personal data transfers to us and by us from the EEA. Any such enforcement actions could result in substantial costs and diversion of resources, distract management and technical personnel and negatively affect our business, operating results and financial condition.
In addition, several foreign countries and governmental bodies, including the European Union and Canada, have laws and regulations concerning the collection and use of personally identifiable information obtained from their residents, including payment card information, which are often more restrictive than those in the U.S. Laws and regulations in these jurisdictions apply broadly to the collection, use, storage, disclosure and security of personally identifiable information, including payment card information identifying, or which may be used to identify, an individual, such as names, email addresses and, in some jurisdictions, Internet Protocol (IP) addresses. Although we are working to comply with those laws and regulations applicable to us, these and other obligations may be modified and interpreted in different ways by courts, and new laws and regulations may be enacted in the future. Within the EEA, the GDPR will take full effect on May 25, 2018 and, at that time, will supersede the 1995 European Union Data Protection Directive and will be directly applicable across EU member states. The GDPR includes more stringent operational requirements for processors and controllers of personal data, for companies established in the EEA and those outside the EEA that collect and use personal data, including payment card information, imposes significant penalties for non-compliance and has broader extra-territorial effect. As the GDPR is a regulation rather than a directive, it applies throughout EEA, but permits member states to enact supplemental requirements if they so choose. Noncompliance with the GDPR can trigger fines of up to the greater of €20 million or 4% of global annual revenues. Further, following a referendum in June 2016 in which voters in the United Kingdom approved an exit from the EU, the United Kingdom has initiated a process to leave the EU. This has created uncertainty with regard to the future regulation of data protection in the United Kingdom.
Any new laws, regulations, other legal obligations or industry standards, or any changed interpretation of existing laws, regulations or other standards may require us to incur additional costs and restrict our business operations. For example, many jurisdictions have enacted laws requiring companies to notify individuals of data security breaches involving certain types of personal data. These mandatory disclosures regarding a security breach could result in negative publicity to us, which may cause our customers to lose confidence in the effectiveness of our data security measures which could impact our operating results.
If our privacy or data security measures fail to comply with current or future laws, regulations, policies, legal obligations or industry standards, we may be subject to litigation, regulatory investigations, fines or other liabilities, as well as negative publicity and a potential loss of business. Moreover, if future laws, regulations, other legal obligations or industry standards, or any changed interpretations of the foregoing, limit our customers' ability to use and share personally identifiable information, including payment card information, or our ability to store, process and share such personally identifiable information or other data, demand for our products could decrease, our costs could increase and our business, operating results and financial condition could be harmed.
31
Failure to adequately protect and enforce our intellectual property rights could substantially harm our business and operating results.
The success of our business depends in part on our ability to protect and enforce our patents, trademarks, copyrights, trade secrets and other intellectual property rights. We attempt to protect our intellectual property under patent, trademark, copyright and trade secret laws, and through a combination of confidentiality procedures, contractual provisions and other methods, all of which offer only limited protection.
As of
December 31, 2017
, we had
230
issued patents in the U.S. covering various aspects of our product offerings. Additionally, as of
December 31, 2017
, we had
150
pending U.S. patent applications and intend to file additional patent applications in the future. The process of obtaining patent protection is expensive and time-consuming, and we may not be able to prosecute all necessary or desirable patent applications at a reasonable cost or in a timely manner. We may choose not to seek patent protection for certain innovations and may choose not to pursue patent protection in certain jurisdictions, and under the laws of certain jurisdictions, patents or others intellectual property may be unavailable or limited in scope. Furthermore, it is possible that our patent applications may not issue as granted patents, that the scope of our issued patents will be insufficient or not have the coverage originally sought, that our issued patents will not provide us with any competitive advantages, and that our patents and other intellectual property rights may be challenged by others or invalidated through administrative processes or litigation. In addition, issuance of a patent does not assure that we have an absolute right to practice the patented invention, or that we have the right to exclude others from practicing the claimed invention. As a result, we may not be able to obtain adequate patent protection or to enforce our issued patents effectively.
In addition to patented technology, we rely on our unpatented proprietary technology and confidential proprietary information, including trade secrets and know-how. Despite our efforts to protect the proprietary and confidential nature of such technology and information, unauthorized parties may attempt to misappropriate, reverse engineer or otherwise obtain and use them. The contractual provisions in confidentiality agreements and other agreements we generally enter into with employees, consultants, partners, vendors and customers may not prevent unauthorized use or disclosure of our proprietary technology or intellectual property rights and may not provide an adequate remedy in the event of unauthorized use or disclosure of our proprietary technology or intellectual property rights. Moreover, policing unauthorized use of our technologies, products and intellectual property is difficult, expensive and time-consuming, particularly in foreign countries where the laws may not be as protective of intellectual property rights as those in the U.S. and where mechanisms for enforcement of intellectual property rights may be weak. To the extent we expand our international activities, our exposure to unauthorized copying and use of our products and proprietary information may increase. We may be unable to determine the extent of any unauthorized use or infringement of our products, technologies or intellectual property rights.
As of
December 31, 2017
, we had
406
registered trademarks in
63
countries, including the GoDaddy logo and mark in all international markets in which we operate or intend to operate. We have also registered, or applied to register, the trademarks associated with several of our leading brands in the U.S. and in certain other countries. Competitors and others may have adopted, and in the future may adopt, tag lines or service or product names similar to ours, which could impede our ability to build our brands' identities and possibly lead to confusion. In addition, there could be potential trade name or trademark infringement claims brought by owners of other registered and common law trademarks or trademarks incorporating variations of the terms or designs of one or more of our trademarks and opposition filings made when we apply to register our trademarks.
From time to time, legal action by us may be necessary to enforce our patents, trademarks and other intellectual property rights, to protect our trade secrets, to determine the validity and scope of the intellectual property rights of others or to defend against claims of infringement or invalidity. Such litigation could result in substantial costs and diversion of resources, distract management and technical personnel and negatively affect our business, operating results and financial condition. If we are unable to protect our intellectual property rights, we may find ourselves at a competitive disadvantage. Any inability on our part to protect adequately our intellectual property may have a material adverse effect on our business, operating results and financial condition.
We may be a party to intellectual property claims and litigation asserted by third parties, and may be subject to additional claims and litigation in the future, which could result in significant costs and substantially harm our business and results of operations.
In recent years, there has been significant litigation in the U.S. and abroad involving patents and other intellectual property rights. Companies providing web-based and cloud-based products are increasingly bringing, and becoming subject to, suits alleging infringement of proprietary rights, particularly patent rights. The possibility of intellectual property infringement claims also may increase to the extent we face increasing competition and become increasingly visible. Any claims we assert
32
against perceived infringers could provoke these parties to assert counterclaims against us alleging that we infringe their intellectual property rights. In addition, our exposure to risks associated with the use of intellectual property may increase as a result of acquisitions we make or our use of software licensed from or hosted by third parties, as we have less visibility into the development process with respect to such technology or the care taken to safeguard against infringement risks. Third parties may make infringement and similar or related claims after we have acquired or licensed technology that had not been asserted prior to our acquisition or license. Many companies are devoting significant resources to obtaining patents that could affect many aspects of our business. This may prevent us from deterring patent infringement claims, and our competitors and others may now and in the future have larger and more mature patent portfolios than we have.
We have in the past, and expect to face in the future, claims and litigation by third parties that we infringe upon or misappropriate their intellectual property rights. Defending patent and other intellectual property claims and litigation is costly and can impose a significant burden on management and employees, and there can be no assurances that favorable final outcomes will be obtained in all cases. In addition, plaintiffs may seek, and we may become subject to, preliminary or provisional rulings in the course of any such litigation, including potential preliminary injunctions requiring us to cease offering certain of our products or features. We may decide to settle such lawsuits and disputes on terms that are unfavorable to us. Similarly, if any litigation to which we are a party is resolved adversely, we may be subject to an unfavorable judgment that may not be reversed upon appeal. The terms of such a settlement or judgment may require us to cease offering certain of our products or features or pay substantial amounts to the other party. In addition, we may have to seek a license to continue practices found to be in violation of a third party's rights, which may not be available on reasonable terms, or at all, and may significantly increase our operating costs and expenses. As a result, we may also be required to develop alternative non-infringing technology or discontinue offering certain products or features. The development of alternative non-infringing technology, products or features could require significant effort and expense or may not be feasible. Our business, financial condition and results of operations could be adversely affected by intellectual property claims or litigation.
We are involved in numerous lawsuits, including putative class action lawsuits, that are expensive and time consuming and could adversely affect our business, financial condition and results of operations.
In addition to intellectual property claims, we are also involved in other types of litigation and claims, including employment, commercial and consumer protection claims. For example, we have faced or continue to face claims related to the Fair Labor Standards Act, the Telephone Consumer Protection Act, the American with Disabilities Act and the Arizona Consumer Fraud Act (and similar state consumer protection statutes). Plaintiffs in such current and future litigation matters often file such lawsuits on behalf of a putative class and typically claim substantial statutory damages and attorneys' fees, and often seek changes to our products, features or business practices. As a result, although the results of any such current or future litigation, regardless of the underlying nature of the claims, cannot be predicted with certainty, the final outcome of any current or future claims or lawsuits we face could adversely affect our business, financial condition and results of operations. Any negative outcome from claims or litigation, including settlements, could result in payments of substantial monetary damages or fines, attorneys' fees or costly and undesirable changes to our products, features or business practices. Further, claims or litigation brought against our customers or business partners may subject us to indemnification obligations or obligations to refund fees to, and adversely affect our relationships with, our customers or business partners. Such indemnification or refund obligations or litigation judgments or settlements that result in the payment of substantial monetary damages, fines and attorneys' fees may not be sufficiently covered by our insurance policies if at all.
In addition, during the course of any litigation, regardless of its nature, there could be public announcements of the results of hearings, motions, preliminary rulings or other interim proceedings or developments. If securities analysts or investors perceive these results to be negative, it could have a substantial adverse effect on the trading price of our Class A common stock. Regardless of whether any claims against us have any merit, these claims are time-consuming and costly to evaluate and defend, and can impose a significant burden on management and employees. Further, because of the substantial amount of discovery required in connection with litigation, there is a risk that some of our confidential business or other proprietary information could be compromised by disclosure.
Activities of customers or the content of their websites could damage our reputation and brand or harm our business and financial results.
As a provider of domain name registration and hosting and presence products, we may be subject to potential liability for the activities of our customers on or in connection with their domain names or websites or for the data they store on our servers. Although our terms of service prohibit illegal use of our products by our customers and permit us to take down or suspend websites or take other appropriate actions for illegal use, customers may nonetheless engage in prohibited activities or upload or store content with us in violation of applicable law or the customer's own policies, which could subject us to liability.
33
Furthermore, our reputation and brand may be negatively impacted by the actions of customers that are deemed to be hostile, offensive or inappropriate. We do not proactively monitor or review the appropriateness of the domain names our customers register or the content of their websites, and we do not have control over customer activities. The safeguards we have in place may not be sufficient to avoid harm to our reputation and brand, especially if such hostile, offensive or inappropriate use is high profile.
Several U.S. federal statutes may apply to us with respect to various activities of our customers, including: the Digital Millennium Copyright Act of 1998 (the DMCA), which provides recourse for owners of copyrighted material who believe their rights under U.S. copyright law have been infringed on the Internet; the Communications Decency Act of 1996 (the CDA), which regulates content on the Internet unrelated to intellectual property; and the Anticybersquatting Consumer Protection Act (the ACPA), which provides recourse for trademark owners against cybersquatters. The DMCA and the CDA generally protect online service providers like us that do not own or control website content posted by customers from liability for certain activities of customers, such as the posting of defamatory or obscene content, unless the online service provider is participating in the unlawful conduct. For example, the safe harbor provisions of the DMCA shield Internet service providers and other intermediaries from direct or indirect liability for copyright infringement. However, under the DMCA, we must follow the procedures for handling copyright infringement claims set forth in the DMCA including expeditiously removing or disabling access to the allegedly infringing material upon the receipt of a proper notice from, or on behalf of, a copyright owner alleging infringement of copyrighted material located on websites we host. Under the CDA, we are generally not responsible for the customer-created content hosted on our servers and thus are generally immunized from liability for torts committed by others. Consequently, we do not monitor hosted websites or prescreen the content placed by our customers. Under the safe harbor provisions of the ACPA, domain name registrars are shielded from liability in many circumstances, including cybersquatting, although the safe harbor provisions may not apply if our activities are deemed outside the scope of registrar functions.
Although these statutes and case law in the U.S. have generally shielded us from liability for customer activities to date, court rulings in pending or future litigation or future regulatory or legislative amendments may narrow the scope of protection afforded us under these laws. For example, there are currently efforts underway in Congress to amend the CDA in ways that could expose us to an increased risk of litigation, which could have a material adverse effect on our business. Neither the DMCA nor the CDA generally apply to claims of trademark violations, and thus they may be inapplicable to many of the claims asserted against our company. Furthermore, notwithstanding the exculpatory language of these bodies of law, the activities of our customers have resulted in, and may in the future, result in threatened or actual litigation against us. If such claims are successful, our business and operating results could be adversely affected, and even if the claims do not result in litigation or are resolved in our favor, these claims, and the time and resources necessary to resolve them, could divert the resources of our management and adversely affect our business and operating results.
In addition, laws governing these activities are unsettled in many international jurisdictions and it may be difficult or impossible for us to comply with such laws. Also, other existing bodies of law, including the criminal laws of various states, may be deemed to apply or new statutes or regulations may be adopted in the future, any of which could expose us to further liability and increase our costs of doing business.
We may face liability or become involved in disputes over registration and transfer of domain names and control over websites.
As a provider of web-based and cloud-based products, including as a registrar of domain names and related products, we may become aware of disputes over ownership or control of customer accounts, websites or domain names. We could face potential liability for our failure to renew a customer's domain. We could also face potential liability for our role in the wrongful transfer of control or ownership of accounts, websites or domain names. The safeguards and procedures we have adopted may not be successful in insulating us against liability from such claims in the future. In addition, we may face potential liability for other forms of account, website or domain name hijacking, including misappropriation by third parties of our customer accounts, websites or domain names and attempts by third parties to operate accounts, websites or domain names or to extort the customer whose accounts, websites or domain names were misappropriated. Furthermore, we are exposed to potential liability as a result of our domain privacy product, wherein the identity and contact details for the domain name registrant are masked. Although our terms of service reserve our right to take certain steps when domain name disputes arise related to our privacy product, including the removal of our privacy service, the safeguards we have in place may not be sufficient to avoid liability, which could increase our costs of doing business.
Occasionally one of our customers may register a domain name identical, or similar, to a third party's trademark or the name of a living person. These occurrences have in the past and may in the future lead to our involvement in disputes over such domain names. Disputes involving registration or control of domain names are often resolved through the Uniform Domain Name
34
Dispute Resolution Policy (the UDRP), ICANN's administrative process for domain name dispute resolution, or less frequently through litigation under the ACPA, or under general theories of trademark infringement or dilution. The UDRP generally does not impose liability on registrars, and the ACPA provides that registrars may not be held liable for registration or maintenance of a domain name absent a showing of the registrar's bad faith intent to profit from the trademark at issue. However, we may face liability if we act in bad faith or fail to comply in a timely manner with procedural requirements under these rules, including forfeiture of domain names in connection with UDRP actions. In addition, domain name registration disputes and compliance with the procedures under the ACPA and UDRP typically require at least limited involvement by us and, therefore, increase our cost of doing business. The volume of domain name registration disputes may increase in the future as the overall number of registered domain names increases. Moreover, as the owner or acquiror of domain name portfolios containing domains we provide for resale, we may face liability if one or more domain names in our portfolios are alleged to violate another party's trademark. While we screen the domains we acquire to mitigate the risk of third-party infringement claims, we may inadvertently register or acquire domains that infringe or allegedly infringe third-party rights. Moreover, advertisements displayed on websites associated with domains registered by us may contain allegedly infringing content placed by third parties. We may face liability and increased costs as a result of such third-party infringement claims.
Our use of open source technology could impose limitations on our ability to commercialize our products.
We use open source software in our business, including in our products. It is possible some open source software is governed by licenses containing requirements that we make available source code for modifications or derivative works we create based upon the open source software, and that we license such modifications or derivative works under the terms of a particular open source license or other license granting third parties certain rights of further use. By the terms of certain open source licenses, we could be required to release the source code of our proprietary software, and to make our proprietary software available under open source licenses, if we combine our proprietary software with open source software in certain manners.
Although we monitor our use of open source software in an effort to avoid subjecting our products to conditions we do not intend, we cannot be certain all open source software is reviewed prior to use in our proprietary software, that programmers working for us have not incorporated open source software into our proprietary software, or that they will not do so in the future. Any requirement to disclose our proprietary source code or to make it available under an open source license could be harmful to our business, operating results and financial condition. Furthermore, the terms of many open source licenses have not been interpreted by U.S. courts. As a result, there is a risk that these licenses could be construed in a way that could impose unanticipated conditions or restrictions on our ability to commercialize our products. In such an event, we could be required to seek licenses from third parties to continue offering our products, to make our proprietary code generally available in source code form, to re-engineer our products or to discontinue the sale of our products if re-engineering could not be accomplished on a timely basis, any of which could adversely affect our business, operating results and financial condition.
Our business depends on our customers' continued and unimpeded access to the Internet and the development and maintenance of Internet infrastructure. Internet access providers may be able to block, degrade or charge for access to certain of our products, which could lead to additional expenses and the loss of customers.
Our products depend on the ability of our customers to access the Internet. Currently, this access is provided by companies having significant market power in the broadband and Internet access marketplace, including incumbent telephone companies, cable companies, mobile communications companies and government-owned service providers. Some of these providers have the ability to take measures including legal actions, that could degrade, disrupt, or increase the cost of user access to certain of our products by restricting or prohibiting the use of their infrastructure to support our offerings, charging increased fees to our users to provide our offerings, or regulating online speech. In some jurisdictions, our products and services may be subject to government-initiated restrictions or blockages. Such interference could result in a loss of existing users, advertisers, goodwill, and increased costs, and could impair our ability to attract new users, thereby harming our revenue and growth. Moreover, the adoption of any laws or regulations adversely affecting the growth, popularity or use of the Internet, including laws impacting Internet neutrality, could decrease the demand for our products and increase our operating costs. The legislative and regulatory landscape regarding the regulation of the Internet and, in particular, Internet neutrality, in the U.S. is subject to uncertainty.
The Federal Communications Commission (FCC) passed Open Internet rules in February 2015, effective in June 2015, generally providing for Internet neutrality with respect to fixed and mobile broadband Internet service. On December 14, 2017, the FCC voted to repeal these Internet neutrality regulations and return to a "light touch" regulatory framework. However, the repeal has not yet taken effect and a number of parties have stated their intent to appeal this order; thus the future impact of such repeal and any changes thereto remains uncertain. Any changes in the legislative and regulatory landscape regarding Internet neutrality, or otherwise regarding the regulation of the Internet, could harm our business. For example, to the extent any laws,
35
regulations or rulings permit Internet service providers to charge some users higher rates than others for the delivery of their content, Internet service providers could attempt to use such law, regulation or ruling to impose higher fees or deliver our content with less speed, reliability or otherwise on a non-neutral basis as compared to other market participants, and our business could be adversely impacted. Internationally, government regulation concerning the Internet, and in particular, network neutrality, may be developing or non-existent. Within such a regulatory environment, we could experience discriminatory or anti-competitive practices impeding both our and our customers' domestic and international growth, increasing our costs or adversely affecting our business.
Our business is exposed to risks associated with credit card and other online payment chargebacks, fraud and new payment methods.
A majority of our revenue is processed through credit cards and other online payments. If our refunds or chargebacks increase, our processors could require us to create reserves, increase fees or terminate their contracts with us, which would have an adverse effect on our financial condition.
Our failure to limit fraudulent transactions conducted on our websites, such as through the use of stolen credit card numbers, could also subject us to liability and adversely impact our reputation. Under credit card association rules, penalties may be imposed at the discretion of the association for inadequate fraud protection. Any such potential penalties would be imposed on our credit card processor by the association. Under our contracts with our payment processors, we are required to reimburse them for such penalties. However, we face the risk that we may fail to maintain an adequate level of fraud protection and that one or more credit card associations or other processors may, at any time, assess penalties against us or terminate our ability to accept credit card payments or other form of online payments from customers, which would have a material adverse effect on our business, financial condition and operating results.
We could also incur significant fines or lose our ability to give customers the option of using credit cards to pay for our products if we fail to follow payment card industry data security standards, even if there is no compromise of customer information. Although we believe we are in compliance with payment card industry data security standards and do not believe there has been a compromise of customer information, it is possible that at times either we or any of our acquired companies may not have been in full compliance with these standards. Accordingly, we could be fined, which could impact our financial condition, or certain of our products could be suspended, which would cause us to be unable to process payments using credit cards. If we are unable to accept credit card payments, our business, financial condition and operating results may be adversely affected.
In addition, we could be liable if there is a breach of the payment information we store. Online commerce and communications depend on the secure transmission of confidential information over public networks. We rely on encryption and authentication technology to authenticate and secure the transmission of confidential information, including customer credit card numbers. However, we cannot ensure this technology will prevent breaches of the systems we use to protect customer payment data. Although we maintain network security insurance, we cannot be certain our coverage will be adequate for liabilities actually incurred or insurance will continue to be available to us on reasonable terms, or at all. In addition, some of our partners also collect or possess information about our customers, and we may be subject to litigation or our reputation may be harmed if our partners fail to protect our customers' information or if they use it in a manner inconsistent with our policies and practices. Data breaches can also occur as a result of non-technical issues. Under our contracts with our processors, if there is unauthorized access to, or disclosure of, credit card information we store, we could be liable to the credit card issuing banks for their cost of issuing new cards and related expenses.
Moreover, in the future we may explore accepting various forms of payment that may have higher fees and costs than our current payment methods. If our customers utilize alternative payment methods, our payment costs could increase and our operating results could be adversely impacted.
We are dependent on the continued services and performance of our senior management and other key employees, the loss of any of whom could adversely affect our business, operating results and financial condition.
Our future performance depends on the continued services and contributions of our senior management and other key employees to execute on our business plan and to identify and pursue new opportunities and product innovations. The loss of services of senior management or other key employees could significantly delay or prevent the achievement of our development and strategic objectives. The loss of the services of our senior management or other key employees for any reason could adversely affect our business, financial condition and operating results.
36
Our corporate culture has contributed to our success, and if we cannot maintain this culture, we could lose the innovation, creativity and teamwork fostered by our culture, and our business may be harmed.
We believe a critical contributor to our success has been our corporate culture, which we believe fosters innovation, creativity, a customer-centric focus, collaboration and loyalty. Our corporate culture is central to our devoted Customer Care team which is a key component of the value we offer our customers. As we continue to evolve our business, we may find it difficult to maintain these important aspects of our corporate culture, which could limit our ability to innovate and operate effectively. Difficulty in preserving our corporate culture will be exacerbated as we continue to expand internationally, grow our employee base and expand our solutions. Any failure to preserve our culture could also negatively affect our ability to retain and recruit personnel, continue to perform at current levels or execute on our business strategy.
If we are unable to hire, retain and motivate qualified personnel, our business would suffer.
Our future success and ability to innovate depends, in part, on our ability to continue to attract and retain highly skilled personnel. The loss of the services of any of our key personnel, the inability to attract or retain qualified personnel or delays in hiring required personnel, may seriously harm our business, financial condition and operating results. Our ability to continue to attract and retain highly skilled personnel, specifically employees with technical and engineering skills and employees with language skills and cultural knowledge of the geographic markets we have recently expanded to or that we intend to expand to in the near future, will be critical to our future success. Competition for highly skilled personnel is frequently intense, particularly in U.S. tech hubs such as the San Francisco Bay area, Seattle and the Boston area. To the extent we hire personnel from competitors, we may be subject to allegations that they have been improperly solicited or divulged proprietary or other confidential information. We are limited in our ability to recruit global talent by U.S. immigration laws, including those related to H1-B visas. The demand for H-1B visas to fill highly-skilled IT and computer science jobs is greater than the number of H-1B visas available each year; for the U.S. government's 2018 fiscal year, the U.S. issued 85,000 H-1B visas out of 199,000 requests. In addition, the regulatory environment related to immigration under the new presidential administration may increase the likelihood that immigration laws may be modified to further limit the availability of H1-B visas. If a new or revised visa program is implemented, it may impact our ability to recruit, hire and retain qualified skilled personnel, which could adversely impact our business, operating results and financial condition.
We issue equity awards to certain of our employees as part our hiring and retention efforts. As a public company, the ability of our employees to sell their stock received pursuant to equity awards in the public market may lead to a larger than normal turnover rate. In addition, we are required under GAAP to recognize compensation expense in our operating results for employee equity-based compensation under our equity grant programs, which may negatively impact our operating results and may increase the pressure to limit equity-based compensation.
The requirements of being a public company may strain our resources.
As a public company, we are subject to the reporting requirements of the Securities Exchange Act of 1934, as amended (the Exchange Act), the Sarbanes-Oxley Act and the listing standards of the New York Stock Exchange (the NYSE). We expect the requirements of these rules and regulations will continue to increase our legal, accounting and financial compliance costs, make some activities more difficult, time-consuming and costly, and place significant strain on our personnel, systems and resources. Management's attention may be diverted from other business concerns, which could adversely affect our business and operating results.
The Sarbanes-Oxley Act requires us, among other things, to maintain effective disclosure controls and procedures and internal control over financial reporting. We continue to develop and refine our disclosure controls and other procedures designed to ensure that information required to be disclosed by us in the reports we will file with the SEC is recorded, processed, summarized and reported within the time periods specified in SEC rules and forms, and that information required to be disclosed in reports under the Exchange Act is accumulated and communicated to our principal executive and financial officers. We also continue to improve our internal control over financial reporting. In order to maintain and improve the effectiveness of our disclosure controls and procedures and internal control over financial reporting, we have expended, and anticipate we will continue to expend, significant resources, including legal and accounting-related costs and significant management oversight.
If we fail to maintain an effective system of disclosure controls and internal control over financial reporting, our ability to produce timely and accurate financial statements or comply with applicable regulations could be impaired.
In our management's report for
2017
, we determined our internal control over financial reporting is effective. In addition, our independent registered public accounting firm provided an unqualified attestation report to that effect. In the event that our
37
chief executive officer, chief financial officer, or independent registered public accounting firm determines in the future that our internal control over financial reporting is not effective as defined under Section 404 of the Sarbanes-Oxley Act, we could be subject to one or more investigations or enforcement actions by state or federal regulatory agencies, stockholder lawsuits or other adverse actions requiring us to incur defense costs, pay fines, settlements or judgments, thereby causing investor perceptions to be adversely affected and potentially resulting in restatement of our financial statements for prior periods and a decline in the market price of our stock.
In addition, our current internal controls and any new controls we implement may become inadequate because of changes in conditions in our business or information technology systems or changes in the applicable laws, regulations and standards. We have also recently acquired, and may acquire in future, companies that were not subject to the Sarbanes-Oxley regulations and accordingly were not required to establish and maintain an internal control infrastructure meeting the standards promulgated under the Sarbanes-Oxley Act. Any failure to design or operate effective controls, any difficulties encountered in their implementation or improvement, or any failure to implement adequate internal controls for our acquired companies could harm our operating results or cause us to fail to meet our reporting obligations. Not correctly designing controls nor fully recognizing, understanding or testing the state of or changes in our internal control environment could also adversely affect the results of management evaluations and independent registered public accounting firm audits of our internal control over financial reporting, about which we are required to include in our periodic reports filed with the SEC. Ineffective disclosure controls and procedures and internal control over financial reporting could also cause investors to lose confidence in our reported financial and other information, which would likely have a negative effect on the trading price of our Class A common stock. In addition, if we are unable to continue to meet these requirements, we may not be able to remain listed on the NYSE in the future.
Economic conditions in the United States and international economies may adversely impact our business and operating results.
General macro economic conditions, such as a recession or economic slowdown in the U.S. or internationally, could adversely affect demand for our products and make it difficult to accurately forecast and plan our future business activities. Spending patterns of small businesses and ventures are difficult to predict and are sensitive to the general economic climate, the economic outlook specific to small businesses and ventures, the then-current level of profitability experienced by these groups and overall consumer confidence. To the extent conditions in the national and global economy change, our business could be harmed as customers may reduce or postpone spending or choose not to purchase or renew subscriptions to our products as they may be considered discretionary by many of our current and potential customers. In particular, the United Kingdom held a referendum in June 2016 in which voters approved an exit from the EU, commonly referred to as "Brexit." In March 2017, the United Kingdom notified the EU of its intention to exit as provided in Article 50 of the Treaty on European Union. The terms of the withdrawal are subject to negotiation and it is unclear what economic impact Brexit will have. It is possible the level of economic activity in this region will be adversely impacted, which could adversely affect our operating results. Uncertain and adverse economic conditions may also lead to a decline in the ability of our customers to use or access credit, including through credit cards, as well as increased refunds and chargebacks, any of which could adversely affect our business. In addition, changing economic conditions may also adversely affect third parties with which we have entered into relationships and upon which we depend in order to grow our business. As a result, we may be unable to continue to grow in the event of future economic slowdowns.
We are subject to export controls and economic sanctions laws that could impair our ability to compete in international markets and subject us to liability if we are not in full compliance with applicable laws.
Our business activities are subject to various restrictions under U.S. export controls and trade and economic sanctions laws, including the U.S. Commerce Department's Export Administration Regulations and economic and trade sanctions regulations maintained by the U.S. Treasury Department's Office of Foreign Assets Control (OFAC). If we fail to comply with these laws and regulations, we could be subject to civil or criminal penalties and reputational harm. U.S. export control laws and economic sanctions laws also prohibit certain transactions with U.S. embargoed or sanctioned countries, governments, persons and entities.
We employ a number of screening and other remedial measures designed to prevent users in embargoed countries and prohibited persons from purchasing or accessing our products or services. Even though we take precautions to prevent transactions with U.S. sanctions targets, there is risk that in the future we could provide our products to such targets despite such precautions. Changes in the list of embargoed countries and regions or prohibited persons may require us to modify these procedures in order to comply with governmental regulations. Our failure to screen customers properly could result in negative consequences to us, including government investigations, penalties and reputational harm.
38
Changes in our products or changes in export and import regulations may create delays in the introduction and sale of our products in international markets or, in some cases, prevent the sale of our products to certain countries, governments or persons altogether. Any change in export or import regulations, shift in the enforcement or scope of existing regulations, or change in the countries, governments, persons or technologies targeted by such regulations, could result in decreased use of our products or decreased ability to sell our products to existing or potential customers. Any decreased use of our products or limitation on our ability to sell our products internationally could adversely affect our growth prospects.
Due to the global nature of our business, we could be adversely affected by violations of anti-bribery and anti-corruption laws.
The global nature of our business creates various domestic and local regulatory challenges. The U.S. Foreign Corrupt Practices Act of 1977, as amended (the FCPA), the U.K. Bribery Act 2010 (the U.K. Bribery Act), U.S. Travel Act and similar anti-bribery and anti-corruption laws in other jurisdictions generally prohibit companies and their intermediaries from making improper payments to foreign government officials and other persons for the corrupt purpose of obtaining or retaining business, directing business to any person or securing any advantage. In addition, companies are required to maintain records accurately and fairly representing their transactions and having an adequate system of internal accounting controls. We face significant risks if we fail to comply with the FCPA and other anti-corruption and anti-bribery laws prohibiting companies and their employees and third-party intermediaries from authorizing, offering or providing, directly or indirectly, improper payments or benefits to foreign government officials, political parties and private-sector recipients for an illegal purpose.
We operate in areas of the world in which corruption by government officials exists to some degree and, in certain circumstances, compliance with anti-bribery and anti-corruption laws may conflict with local customs and practices. We operate in several countries and sell our products to customers around the world, which results in varied and potentially conflicting compliance obligations. In addition, changes in laws could result in increased regulatory requirements and compliance costs which could adversely affect our business, financial condition and results of operations. While we are committed to complying, and training our employees to comply, with all applicable anti-bribery and anti-corruption laws, we cannot assure our employees or other agents will not engage in prohibited conduct and render us responsible under the FCPA or the U.K. Bribery Act.
If we are found to be in violation of the FCPA, the U.K. Bribery Act or other anti-bribery and anti-corruption laws (either due to acts or inadvertence of our employees, or due to the acts or inadvertence of others), we could suffer criminal or civil penalties or other sanctions, which could have a material adverse effect on our business. Any violation of the FCPA or other applicable anti-corruption or anti-bribery laws could result in whistleblower complaints, adverse media coverage, investigations, loss of export privileges, severe criminal or civil sanctions and, in the case of the FCPA, suspension or debarment from U.S. government contracts, which could have a material and adverse effect on our reputation, business, operating results and growth prospects. In addition, responding to any enforcement action may result in a materially significant diversion of management's attention and resources and significant defense costs and other professional fees.
Unanticipated changes in effective tax rates or adverse outcomes resulting from examination of our income or other tax returns could adversely affect our operating results and financial condition.
We are subject to income taxes in the U.S. and various foreign jurisdictions, and our domestic and international tax liabilities will be subject to the allocation of expenses in differing jurisdictions. Our future effective tax rates could be subject to volatility or adversely affected by a number of factors, including:
•
changes in the valuation of our deferred tax assets (DTAs) and liabilities (DTLs);
•
expected timing and amount of the release of any tax valuation allowances;
•
expiration of, or detrimental changes in, research and development tax credit laws;
•
tax effects of equity-based compensation;
•
costs related to intercompany restructurings;
•
changes in tax laws, regulations or interpretations thereof; or
•
future earnings being lower than anticipated in countries where we have lower statutory tax rates and higher than anticipated earnings in countries where we have higher statutory tax rates.
In addition, we may be subject to audits of our income, sales and other transaction taxes by federal and state and foreign tax authorities. Outcomes from these audits could have an adverse effect on our operating results and financial condition.
39
In December 2017, the Tax Cuts and Jobs Act (TJCA) was enacted, making many significant changes to U.S. tax laws. The consequences of these changes, including whether and how state, local and foreign jurisdictions will react to such changes, have not yet been fully determined. Changes in corporate tax rates, the realizability of the net DTAs relating to our U.S. operations, the taxation of foreign earnings and the deductibility of expenses contained in the TJCA or other tax reform legislation could have a material impact on the value of our DTAs, could result in significant one-time charges and could increase our future U.S. tax expense. Furthermore, changes to the taxation of undistributed foreign earnings could change our future intentions regarding reinvestment of such earnings. The foregoing items could have an adverse effect on our operating results, cash flow or financial condition.
Our business is subject to the risks of earthquakes, fire, power outages, floods and other catastrophic events and to interruption by man-made events such as terrorism.
A significant natural disaster, such as an earthquake, fire or flood could have a material adverse impact on our business, operating results and financial condition. Natural disasters could lead to significant power outages and otherwise affect our data centers as well as our infrastructure vendors' abilities to provide connectivity and perform services on a timely basis. In the event our or our service providers' IT systems' abilities are hindered by any of the events discussed above, we and our customers' websites could experience downtime, and our products could become unavailable. In addition, acts of terrorism and other geopolitical unrest could cause disruptions in our business or the business of our infrastructure vendors, partners or customers or the economy as a whole. Any disruption in the business or operations of our data center hosting providers or customers could have a significant adverse effect on our operating results and financial performance. All of the aforementioned risks may be further increased if our disaster recovery plans prove to be ineffective in the event of such a disaster.
Risks Related to Our Industry
Governmental and regulatory policies or claims concerning the domain name registration system and the Internet in general, and industry reactions to those policies or claims, may cause instability in the industry and disrupt our business.
ICANN is a multi-stakeholder, private sector, not-for-profit corporation formed in 1998 for the express purposes of overseeing a number of Internet related tasks, including managing the DNS allocation of IP addresses, accreditation of domain name registrars and registries and the definition and coordination of policy development for all of these functions. We are accredited by ICANN as a domain name registrar and thus our ability to offer domain name registration products is subject to our ongoing relationship with, and accreditation by, ICANN.
ICANN has been subject to strict scrutiny by the public and governments around the world, as well as multi-governmental organizations such as the United Nations, with many of those bodies becoming increasingly interested in Internet governance.
Additionally, we continue to face the possibility that:
•
the new structure and accountability mechanisms contained in ICANN's new bylaws are not fully tested, which may result in ICANN not being accountable to its stakeholders and unable to make, implement or enforce its policies;
•
the U.S. or another government or intergovernmental organization may reassess ICANN's role in overseeing the domain name registration market;
•
the Internet community, the U.S. government or other governments may (i) refuse to recognize ICANN's authority or support its policies, (ii) attempt to exert pressure on ICANN, or (iii) enact laws in conflict with ICANN's policies, each of which could create instability in the domain name registration system;
•
governments, via ICANN's Governmental Advisory Committee (GAC), may seek greater influence over ICANN policies and contracts with registrars and may advocate changes that may adversely affect our business;
•
some of ICANN's policies and practices, such as ICANN's position on privacy and proxy domain name registrations, and the policies and practices adopted by registries and registrars, could be found to conflict with the laws of one or more jurisdictions, or could be materially changed in a way that negatively impacts the sale of our products;
•
the terms of the Registrar Accreditation Agreement (the RAA) under which we are accredited as a registrar, could change in ways that are disadvantageous to us or under certain circumstances could be terminated by ICANN, thereby preventing us from operating our registrar service, or ICANN could adopt unilateral changes to the RAA that are unfavorable to us, that are inconsistent with our current or future plans, or that affect our competitive position;
40
•
International regulatory or governing bodies, such as the International Telecommunications Union, a specialized agency of the United Nations, or the European Union, may gain increased influence over the management and regulation of the domain name registration system, leading to increased regulation in areas such as taxation, privacy and the monitoring of our customers' hosted content;
•
ICANN or any third-party registries may implement policy changes impacting our ability to run our current business practices throughout the various stages of the lifecycle of a domain name;
•
the U.S. Congress or other legislative bodies in the U.S. could take action unfavorable to us or influencing customers to move their business from our products to those located outside the U.S.;
•
ICANN could fail to maintain its role, potentially resulting in instability in DNS services administration;
•
some governments and governmental authorities outside the U.S. have in the past disagreed, and may in the future disagree, with the actions, policies or programs of ICANN and registries relating to the DNS, which could fragment the single, unitary Internet into a loosely-connected group of one or more networks, each with different rules, policies and operating protocols; and
•
multi-party review panels established by ICANN's new bylaws may take positions unfavorable to our business.
If any of these events occur, they could create instability in the domain name registration system and may make it difficult for us to continue to offer existing products and introduce new products, or serve customers in certain international markets. These events could also disrupt or suspend portions of our domain name registration product and subject us to additional restrictions on how the registrar and registry products businesses are conducted, which would result in reduced revenue.
In addition, the requirements of the GDPR are known to be in conflict with ICANN's policies and contracts related to how registrars collect, transmit and publish the personal information of domain name registrants in publicly accessible WHOIS directories. We are working with ICANN and our industry counterparts to reconcile these differences. If ICANN is unable or unwilling to harmonize these policies and contracts with the GDPR, our efforts to comply with the GDPR may cause us to violate our existing ICANN contractual obligations. The result is we could experience difficulties in selling domain names and keeping our existing customer domain names under management if we are unable to reach an amicable contractual solution with ICANN, which could have a material adverse effect on our operations and revenue.
ICANN periodically authorizes the introduction of new TLDs, and we may not have the right to register new domain names to our customers based on such TLDs, which could adversely impact our business and results of operations.
ICANN has periodically authorized the introduction of new TLDs and made domain names related to them available for registration. Our competitive position depends in part on our ability to secure access to these new TLDs. A significant portion of our business relies on our ability to sell domain name registrations to our customers, and any limitations on our access to newly-created TLDs could adversely impact our ability to sell domain name registrations to customers, and thus adversely impact our business.
In 2013, ICANN significantly expanded the number of gTLDs, which resulted in the delegation of new gTLDs commencing in 2014, which we refer to as the Expansion Program. We and certain of our competitors have expended resources filing gTLD applications under the Expansion Program to pursue the acquisition of gTLD operator rights. For example, we secured the rights to become the registry for .godaddy, a gTLD. The Expansion Program could substantially change the domain name industry in unexpected ways and is expected to result in an increase in the number of domains registered by our competitors. If we do not properly manage our response to the change in business environment, and accurately predict the market's preference for specific gTLDs, it could adversely impact our competitive position or market share.
The relevant domain name registry and ICANN impose a charge upon each registrar for the administration of each domain name registration. If these fees increase, it would have a significant impact upon our operating results.
Each registry typically imposes a fee in association with the registration of each domain name. For example, VeriSign, Inc. (VeriSign), the registry for .com and .net, has a current list price of $7.85 annually for each .com registration, and ICANN currently charges $0.18 annually for most domain names registered in the gTLDs falling within its purview. The fee charged by VeriSign for each .com registration increased from $6.86 per year to $7.34 per year in July 2010 and increased again to $7.85 per year in January 2012. In 2016, VeriSign and ICANN agreed VeriSign will continue to be the exclusive registry for the .com gTLD through November 2024. As part of this agreement, the current list price of $7.85 annually for each .com registration will remain in place, unless VeriSign can demonstrate to the U.S. Department of Commerce that technology changes or market conditions no
41
longer warrant pricing restrictions. If efforts to remove these pricing restrictions were successful, costs to our customers could be higher, which may have an adverse impact on our results of operations.
We have no control over ICANN, VeriSign or any other domain name registries and cannot predict their future fee structures. While we do not currently do so, we have the discretion to impose service fees on our customers in the future. In addition, pricing of new gTLDs is generally not set or controlled by ICANN, which in certain instances has resulted in aggressive price increases on certain particularly successful new gTLDs. The increase in these fees with respect to any new gTLD either must be included in the prices we charge to our customers, imposed as a surcharge or absorbed by us. If we absorb such cost increases or if surcharges result in decreases in domain registrations, our business, operating results and financial performance may be adversely affected.
Our business and financial condition could be harmed materially if small consumers and small businesses and ventures were no longer able to rely upon the existing domain name registration system.
The domain name registration market continues to develop and adapt to changing technology. This development may include changes in the administration or operation of the Internet, including the creation and institution of alternate systems for directing Internet traffic without using the existing domain name registration system. The widespread acceptance of any alternative system, such as mobile applications or closed networks, could eliminate the need to register a domain name to establish an online presence and could materially and adversely affect our business.
Changes in state taxation laws and regulations may discourage the registration or renewal of domain names for e-commerce.
Due to the global nature of the Internet, it is possible that any U.S. or foreign federal, state or local taxing authority might attempt to regulate our transmissions or levy transaction, income or other taxes relating to our activities. Tax authorities at the international, federal, state and local levels are regularly reviewing the appropriate treatment of companies engaged in e-commerce. New or revised international, federal, state or local tax regulations may subject either us or our customers to additional sales, income and other taxes. We cannot predict the effect of current attempts to impose sales, income or other taxes on e-commerce. New or revised taxes, in particular sales and other transaction taxes, would likely increase the cost of doing business online and decrease the attractiveness of advertising and selling goods and services over the Internet. New taxes could also create significant increases in internal costs necessary to capture data and to collect and remit taxes. Any of these events could have an adverse effect on our business and results of operations.
Risks Related to Our Company and Our Organizational Structure
Our only material asset is our economic interest in Desert Newco, and we are accordingly dependent upon distributions from Desert Newco to pay our expenses, taxes and dividends (if and when declared by our board of directors).
We are a holding company and have no material assets other than our ownership of limited liability company units of Desert Newco (LLC Units). We have no independent means of generating revenue or cash flows. We intend to cause Desert Newco to make distributions to us, as its managing member, in an amount sufficient to cover all expenses, applicable taxes payable and dividends, if any, declared by our board of directors. To the extent we need funds and Desert Newco is restricted from making such distributions under applicable law or regulation or under any present or future debt covenants or is otherwise unable to provide such funds, it could materially adversely affect our business, financial condition, results of operations and cash flows.
Our ability to pay taxes and expenses, including payments under the TRAs, may be limited by our structure.
Our principal asset, either directly or through our wholly owned subsidiary GD Subsidiary Inc., is a controlling equity interest in Desert Newco. As such, we have no independent means of generating revenue or cash flows. Desert Newco is treated as a partnership for U.S. income tax purposes and, as such, is generally not subject to income tax in most jurisdictions. Instead, taxable income is allocated to holders of its LLC Units, including us. Accordingly, we incur income taxes on our allocable share of any net taxable income of Desert Newco.
Pursuant to the amended and restated limited liability company agreement of Desert Newco (the New LLC Agreement), Desert Newco will make cash distributions to the owners of LLC Units, calculated using an assumed tax rate, to help fund their tax obligations in respect of the cumulative taxable income in excess of cumulative taxable losses of Desert Newco allocated to them. In addition to tax expenses, we also incur expenses related to our operations, plus payments under the TRAs, which we expect will be significant. We intend to cause Desert Newco to make distributions or, in the case of certain expenses, payments in
42
an amount sufficient to allow us to pay our taxes and operating expenses, including distributions to fund any ordinary course payments due under the TRAs. However, Desert Newco's ability to make such distributions may be subject to various limitations and restrictions.
We are a holding company with no operations and rely on Desert Newco to provide us with funds necessary to meet any financial obligations. If we do not have sufficient funds to pay tax or other liabilities or to fund our operations (as a result of Desert Newco's inability to make distributions to us due to various limitations and restrictions or as a result of the acceleration of our obligations under the TRAs), we may have to borrow funds and thus our liquidity and financial condition could be materially and adversely affected. To the extent we are unable to make payments under the TRAs for any reason, such payments will be deferred and will accrue interest at a rate equal to one year LIBOR plus 500 basis points until paid.
We are required to pay certain pre-IPO owners for certain tax benefits we may claim, and we expect the payments we are required to make to be substantial.
Any exchanges of LLC Units (together with the corresponding shares of Class B common stock) for shares of our Class A common stock or cash are expected to produce favorable tax attributes for us. When we acquire LLC Units from our pre-IPO owners through these exchanges, both the existing tax basis and anticipated tax basis adjustments are likely to increase (for tax purposes) our depreciation and amortization deductions and therefore reduce the amount of income tax we would be required to pay in the future in the absence of this existing and increased basis. This existing and increased tax basis may also decrease gain (or increase loss) on future dispositions of certain assets to the extent the tax basis is allocated to those assets. In addition, certain acquired net operating losses (NOLs) and other tax attributes are available to us as a result of the pre-IPO organizational transactions. Under the TRAs, we generally expect to retain the benefit of approximately 15% of the applicable tax savings after our payment obligations below are taken into account.
We are a party to five TRAs with our pre-IPO owners. Under four of these agreements, we are generally required to pay to certain pre-IPO owners, in the aggregate, approximately 85% of the amount of savings, if any, in U.S. federal, state and local income tax we are deemed to realize (using the actual applicable U.S. federal income tax rate and an assumed combined state and local income tax rate) as a result of (1) any existing tax attributes of LLC Units acquired in the pre-IPO organizational transactions, the benefit of which is allocable to us as a result of such transactions (including the allocable share of Desert Newco's existing tax basis in its assets), (2) NOLs available as a result of such transactions and (3) tax benefits related to imputed interest.
Under the fifth of these agreements, we are generally required to pay to certain pre-IPO owners approximately 85% of the applicable savings, if any, in U.S. federal, state and local income tax we are deemed to realize (using the actual applicable U.S. federal income tax rate and an assumed combined state and local income tax rate) as a result of (1) any step-up in tax basis created as a result of exchanges of their LLC Units for shares of our Class A common stock or cash, (2) any existing tax attributes associated with their LLC Units, the benefit of which is allocable to us as a result of such exchanges (including the allocable share of Desert Newco's existing tax basis in its assets), (3) tax benefits related to imputed interest and (4) payments under the TRA.
The TRAs allow our pre-IPO owners to transfer their rights under the TRAs to third parties, who would then succeed to the rights of our pre-IPO owners under the TRAs. In the event of such a transfer, we would be required to make the payments described above to the new TRA parties in accordance with the terms of the TRAs.
As of
December 31, 2017
, we have recorded a liability under the TRAs of
$153.0 million
payable to certain pre-IPO owners. This is the amount of liability we currently deem probable and estimable, which takes into account limitations on the use of the favorable tax attributes due to limitations of taxable income. Because we anticipate these favorable tax attributes being greater than our taxable income, the excess deductions allocated to us will increase the amount of our NOL carryforwards. We have determined it is more-likely-than- not we will be unable to utilize all of our DTAs subject to the TRAs; therefore, we have not recorded a liability under the TRAs related to the tax savings we may realize from the utilization of NOL carryforwards and the amortization related to basis adjustments under Code Section 754 created by exchanges of LLC Units. If utilization of these DTAs becomes more-likely-than-not in the future, at such time, we will record liabilities under the TRAs of up to an additional
$559.5 million
as a result of basis adjustments under Code Section 754 and up to an additional
$224.4 million
related to the utilization of NOL and credit carryforwards, which will be recorded through charges to our statements of operations. However, if these tax attributes are not utilized in future years, it is reasonably possible no amounts would be paid under the TRAs. In this scenario, the reduction of the liability under the TRAs would result in a benefit to our statements of operations. These potential additional liabilities were calculated considering the U.S. federal corporate tax rate reduction enacted in
December 2017
as part of the TCJA, as discussed in Note
14
to our consolidated financial statements.
43
The payment obligations under the TRAs are obligations of GoDaddy Inc., and we expect the payments we are required to make under the TRAs will be substantial. Assuming no material changes in the relevant tax law and that we earn sufficient taxable income to realize all tax benefits subject to the TRAs, we expect the tax savings associated with (1) the pre-IPO organizational transactions and (2) future exchanges of LLC Units (together with the corresponding shares of Class B common stock) as described above would aggregate to approximately
$1.9 billion
over 15 years, based on the December 29, 2017 closing price of
$50.28
per share of our Class A common stock and assuming all exchanges occurred on the last day of
2017
. Under such scenario, we would be required to pay the other parties to the TRAs approximately 85% of such amount, or approximately
$1.6 billion
, over such 15 year period. The actual amounts will materially differ from these hypothetical amounts, as the potential future tax savings we will be deemed to realize, and TRA payments to be made by us, will be calculated based in part on the market value of our Class A common stock at the time of exchange and the prevailing applicable U.S. federal tax rate (plus the assumed combined state and local tax rate) applicable to us over the life of the TRAs and will be dependent on our generating sufficient future taxable income to realize the benefit. Payments under the TRAs are not conditioned on Desert Newco's pre-IPO owners' continued ownership of LLC Units. These hypothetical amounts were calculated considering the U.S. federal corporate tax rate reduction enacted in
December 2017
as part of the TCJA, as discussed in Note
14
to our consolidated financial statements.
The actual existing tax basis and increase in tax basis, as well as the amount and timing of any payments under the TRAs, will vary depending upon a number of factors, including the timing of exchanges by the holders of LLC Units, the price of our Class A common stock at the time of the exchange, whether such exchanges are taxable, the amount and timing of the taxable income we generate in the future, the U.S. federal tax rate then applicable and the portion of our payments under the TRAs constituting imputed interest. Payments under the TRAs are expected to give rise to certain additional tax benefits attributable to either further increases in basis or in the form of deductions for imputed interest, depending on the TRA and the circumstances. Any such benefits are covered by the TRAs and will increase the amounts due thereunder. In addition, the TRAs will provide for interest, at a rate equal to one year LIBOR plus 100 basis points, accrued from the due date (without extensions) of the corresponding tax return to the date of payment specified by the TRAs. Under the TRAs, to avoid interest charges, we have the right, but not the obligation, to make TRA payments in advance of the date the payments are otherwise due.
Payments under the TRAs will be based on the tax reporting positions we determine. Although we are not aware of any issue that would cause the IRS to challenge existing tax basis, a tax basis increase or other tax attributes subject to the TRAs, if any subsequent disallowance of tax basis or other benefits were so determined by the IRS, we would not be reimbursed for any payments previously made under the applicable TRAs (although we would reduce future amounts otherwise payable under such TRAs). In addition, the actual state or local tax savings we realize may be different than the amount of such tax savings we are deemed to realize under the TRAs, which will be based on an assumed combined state and local tax rate applied to our reduction in taxable income as determined for U.S. federal income tax purposes as a result of the tax attributes subject to the TRAs. As a result, payments could be made under the TRAs in excess of the tax savings we realize in respect of the attributes to which the TRAs relate.
In certain cases, payments under the TRAs may be accelerated or significantly exceed the actual benefits we realize in respect of the tax attributes subject to the TRAs.
The TRAs provide (1) in the event we materially breach any of our material obligations under the agreements, whether as a result of failure to make any payment within three months of when due (provided we have sufficient funds to make such payment), failure to honor any other material obligation required thereunder or by operation of law as a result of the rejection of the agreements in a bankruptcy or otherwise or (2) if, at any time, we elect an early termination of the agreements, our (or our successor's) obligations under the applicable agreements (with respect to all LLC Units, whether or not LLC Units have been exchanged or acquired before or after such transaction) would accelerate and become payable in a lump sum amount equal to the present value of the anticipated future tax benefits calculated based on certain assumptions, including that we would have sufficient taxable income to fully utilize the deductions arising from the tax deductions, tax basis and other tax attributes subject to the applicable TRAs. Under the terms of the TRAs, we may not elect an early termination of the TRAs without the consent of (i) each of certain affiliates of the Sponsors and Bob Parsons until such affiliate has exchanged all of its LLC Units (together with the corresponding shares of Class B common stock) for shares of Class A common stock and (ii) a majority of our directors, other than directors designated or nominated by stockholders affiliated with the Sponsors and Bob Parsons.
Additionally, the TRAs provide that upon certain mergers, asset sales, other forms of business combinations or other changes of control, our (or our successor's) tax savings under the applicable agreements for each taxable year after any such event would be based on certain assumptions, including that we will have sufficient taxable income to fully utilize the deductions arising from the tax basis and other tax attributes subject to the applicable TRAs. Furthermore, the TRAs will determine the tax
44
savings by excluding certain future tax attributes we obtain the use of as a result of acquiring other entities to the extent such tax attributes are the subject of tax receivable agreements we enter into in connection with such acquisitions.
As a result of the foregoing, (1) we could be required to make payments under the TRAs that are greater than or less than the specified percentage of the actual tax savings we realize in respect of the tax attributes subject to the agreements and (2) if we materially breach a material obligation under the agreements or if we elect to terminate the agreements early, we would be required to make an immediate lump sum payment equal to the present value of the anticipated future tax savings, which payment may be made significantly in advance of the actual realization of such future tax savings. In these situations, our obligations under the TRAs could have a substantial negative impact on our liquidity and could have the effect of delaying, deferring or preventing certain mergers, asset sales, other forms of business combinations or other changes of control. There can be no assurance we will be able to fund or finance our obligations under the TRAs.
In certain circumstances, Desert Newco will be required to make distributions to us and to its pre-IPO owners. The distributions Desert Newco will be required to make may be substantial.
Desert Newco is treated as a partnership for U.S. income tax purposes and, as such, is generally not subject to income tax in most jurisdictions. Instead, taxable income is allocated to holders of its LLC Units, including us. Pursuant to the New LLC Agreement, Desert Newco will make pro rata cash distributions, or tax distributions, to the owners of LLC Units, including us, calculated using an assumed tax rate, to help each of the holders of the LLC Units to pay taxes on such holder's allocable share of the cumulative taxable income, reduced by cumulative taxable losses. Under the tax rules, Desert Newco is required to allocate net taxable income disproportionately to its owners in certain circumstances. Because tax distributions will be determined based on the holder of LLC Units who is allocated the largest amount of taxable income on a per unit basis, but will be made pro rata based on ownership, Desert Newco will be required to make tax distributions that, in the aggregate, will likely exceed the amount of taxes Desert Newco would have paid if it were taxed on its net income at the assumed rate.
Funds used by Desert Newco to satisfy its tax distribution obligations will not be available for reinvestment in our business. Moreover, the tax distributions Desert Newco will be required to make may be substantial, and may exceed (as a percentage of Desert Newco's income) the overall effective tax rate applicable to a similarly situated corporate taxpayer. In addition, because these payments will be calculated with reference to an assumed tax rate, and because of the disproportionate allocation of net taxable income, these payments will likely significantly exceed the actual tax liability for many of the owners of Desert Newco.
As a result of potential differences in the amount of net taxable income allocable to us and to the other owners of Desert Newco, as well as the use of an assumed tax rate in calculating Desert Newco's distribution obligations, we may receive distributions significantly in excess of our tax liabilities and obligations to make payments under the TRAs. To the extent, as currently expected, we do not distribute such cash balances as dividends on our Class A common stock and instead, for example, hold such cash balances or lend them to Desert Newco, our existing shareholders would benefit from any value attributable to such accumulated cash balances as a result of their ownership of Class A common stock.
We will not be reimbursed for any payments made to our pre-IPO owners under the TRAs in the event any tax benefits are disallowed.
If the IRS challenges the tax basis or NOLs giving rise to payments under the TRAs, and the tax basis or NOLs are subsequently disallowed, the recipients of payments under those agreements will not reimburse us for any payments we previously made to them. Any such disallowance would be taken into account in determining future payments under the TRAs and would, therefore, reduce the amount of any such future payments. Nevertheless, if the claimed tax benefits from the tax basis or NOLs are disallowed, our payments under the TRAs could exceed our actual tax savings, and we may not be able to recoup payments under the TRAs that were calculated on the assumption that the disallowed tax savings were available.
Our pre-IPO owners continue to have significant influence over our company, and their interests may differ from those of our public stockholders.
As of
December 31, 2017
, funds affiliated with the Sponsors as well as Bob Parsons controlled approximately 28% of the combined voting power of our Class A and Class B common stock. In
2017
, we ceased to be a controlled company within the meaning of the NYSE listing standards and are now required to comply with additional NYSE corporate governance standards, including: that a majority of our board of directors consists of "independent directors," as defined under the rules of the NYSE; that the compensation of our executive officers be determined, or recommended to the board of directors for determination, by majority vote of the independent directors or by a compensation committee comprised solely of independent directors; and that
45
director nominees be selected, or recommended to the board of directors for selection, by majority vote of the independent directors or by a nomination committee comprised solely of independent directors.
A majority of our board currently consists of "independent directors" as defined by the NYSE, and we have a fully independent compensation committee. We have taken advantage of phase-in provisions permitting our nominating and corporate governance committee not to consist of a majority of independent directors during the year following loss of controlled company status. We intend to have a fully independent nominating and corporate governance committee within that time period.
GoDaddy Inc. and Desert Newco are parties to a stockholder agreement with funds affiliated with the Sponsors as well as Bob Parsons and certain specified other holders of LLC Units from time to time, including our executive officers. The stockholder agreement provides that our stockholders affiliated with KKR, Silver Lake and Bob Parsons are entitled to nominate members of our board of directors. The parties to the stockholder agreement agree to vote for these nominees as well as other directors recommended by our nominating and corporate governance committee.
As a result, based on their ownership of our voting stock and the approval rights in the stockholder agreement, such affiliated owners have the ability to nominate five members of our board of directors, and thereby to exercise significant influence over our management and affairs. In addition, they are able to significantly influence the outcome of all matters requiring stockholder approval, including mergers and other material transactions, and are able to significantly influence a change in the composition of our board of directors or prevent a change in control of our company that could deprive our stockholders of an opportunity to receive a premium for their Class A common stock as part of a sale of our company and might ultimately affect the market price of our Class A common stock.
As of
December 31, 2017
, the Continuing LLC Owners owned approximately 21% of the outstanding LLC Units. Because they hold their ownership interest in our business through Desert Newco, rather than through the public company, the Continuing LLC Owners may have conflicting interests with our public stockholders. For example, the Continuing LLC Owners may have different tax positions from us which could influence their decisions regarding whether and when to dispose of assets, whether and when to incur new or refinance existing indebtedness, especially in light of the existence of the TRAs, and whether and when GoDaddy Inc. should terminate the TRAs and accelerate its obligations thereunder; provided that any decision to terminate the TRAs and accelerate the obligation thereunder would also require the approval of a majority of the directors of GoDaddy Inc., other than directors designated or nominated by stockholders affiliated with the Sponsors or Bob Parsons. In addition, the structuring of future transactions may take into consideration these Continuing LLC Owners' tax or other considerations even where no similar benefit would accrue to us.
Further, our amended and restated certificate of incorporation provides that, to the fullest extent permitted by law, the doctrine of corporate opportunity will not apply to the Sponsors, Bob Parsons or their respective affiliates, the directors they nominate or our other non-employee directors in a manner that would prohibit them from investing in competing businesses or doing business with our partners or customers.
In addition, under the terms of the TRAs, we may not elect an early termination of the TRAs without the consent of each of certain affiliates of the Sponsors and Bob Parsons until such affiliate has exchanged all of its LLC Units (and Class B common stock) for shares of Class A common stock. Accordingly, we may be prevented from terminating the TRAs in circumstances where we determine it would be beneficial for us to do so, including potentially in connection with future strategic transactions.
Our substantial indebtedness could adversely affect our financial condition, our ability to raise additional capital to fund our operations, our ability to operate our business, our ability to react to changes in the economy or our industry, divert our cash flow from operations for debt payments and prevent us from meeting our debt obligations.
As of
December 31, 2017
, our total indebtedness was approximately
$2.5 billion
. In
February 2017
, we amended our credit facility to provide for: (i) the refinancing of our existing
$1,072.5 million
seven
-year term loan (the Refinanced Term Loan), (ii) a second
$1,425.0 million
tranche (the Acquisition Term Loan), which we drew down upon on
April 3, 2017
to provide a portion of the financing for our acquisition of HEG, and (iii) the refinancing of our existing
$150.0 million
five
-year revolving credit facility, which increased to
$200.0 million
upon the closing of our acquisition of HEG (the Refinanced Revolving Credit Loan). In
November 2017
, we further amended our credit facility to refinance the term loans at a lower interest rate margin. All other terms, including the maturity date of
February 15, 2024
, were unchanged by this refinancing.
46
Our substantial indebtedness could have a material adverse effect on our business and financial condition, including:
•
requiring a substantial portion of cash flow from operations to be dedicated to the payment of principal and interest on our indebtedness, thereby reducing our ability to use our cash flow to fund our operations, capital expenditures and pursue future business opportunities;
•
increasing our vulnerability to adverse economic, industry or competitive developments;
•
exposing us to increased interest expense, as our degree of leverage may cause the interest rates of any future indebtedness, whether fixed or floating rate interest, to be higher than they would be otherwise;
•
exposing us to the risk of increased interest rates because certain of our indebtedness bears interest at variable rates;
•
creating a risk of foreclosure if we default on our debt and are unable to pay any accelerated obligations;
•
making it more difficult for us to satisfy our obligations with respect to our indebtedness, and any failure to comply with the obligations of any of our debt instruments, including restrictive covenants, could result in an event of default accelerating our obligation to repay indebtedness;
•
restricting us from making strategic acquisitions;
•
limiting our ability to obtain additional financing for working capital, capital expenditures, product development, satisfaction of debt service requirements, acquisitions and general corporate or other purposes; and
•
limiting our flexibility in planning for, or reacting to, changes in our business or market conditions and placing us at a competitive disadvantage compared to our competitors who may be better positioned to take advantage of opportunities our leverage prevents us from exploiting.
We may incur significant additional indebtedness in the future. Although the credit agreement governing substantially all of our indebtedness contain restrictions on the incurrence of additional indebtedness and entering into certain types of other transactions, these restrictions are subject to a number of qualifications and exceptions. Additional indebtedness incurred in compliance with these restrictions could be substantial. These restrictions also do not prevent us from incurring obligations, such as trade payables. To the extent we incur additional indebtedness, the substantial leverage risks described above would be exacerbated.
Certain of our debt agreements impose significant operating and financial restrictions on us and our subsidiaries, which may prevent us from capitalizing on business opportunities.
The credit agreement governing our credit facility imposes significant operating and financial restrictions on us. These restrictions limit the ability of our subsidiaries, and effectively place restrictions on our ability to, among other things:
•
incur or guarantee additional debt or issue disqualified equity interests;
•
pay dividends and make other distributions on, or redeem or repurchase, capital stock;
•
make certain investments;
•
incur certain liens;
•
enter into transactions with affiliates;
•
merge or consolidate;
•
enter into agreements restricting the ability of restricted subsidiaries to make certain intercompany dividends, distributions, payments or transfers; and
•
transfer or sell assets.
As a result of the restrictions described above, we will be limited as to how we conduct our business and we may be unable to raise additional debt or equity financing to compete effectively or to take advantage of new business opportunities. The terms of any future indebtedness we may incur could include more restrictive covenants. We cannot assure you that we will be able to maintain compliance with these covenants in the future and, if we fail to do so, that we will be able to obtain waivers from the lenders or amend the covenants.
47
Our failure to comply with the restrictive covenants described above as well as other terms of our indebtedness or the terms of any future indebtedness from time to time could result in an event of default, which, if not cured or waived, could result in our being required to repay these borrowings before their due date. If we are forced to refinance these borrowings on less favorable terms or are unable to refinance these borrowings, our results of operations and financial condition could be adversely affected.
Some provisions of Delaware law and our amended and restated certificate of incorporation and amended and restated bylaws may deter third parties from acquiring us and diminish the value of our Class A common stock.
Our amended and restated certificate of incorporation and amended and restated bylaws provide for, among other things:
•
a classified board of directors with staggered three year terms;
•
the ability of our board of directors to issue one or more series of preferred stock with voting or other rights or preferences that could have the effect of impeding the success of an attempt to acquire us or otherwise effect a change in control;
•
advance notice for nominations of directors by stockholders and for stockholders to include matters to be considered at stockholder meetings;
•
certain limitations on convening special stockholder meetings; and
•
certain provisions of our amended and restated certificate of incorporation and amended and restated bylaws that may be amended only by the affirmative vote of the holders of at least two-thirds in voting power of all outstanding shares of our stock entitled to vote thereon, voting together as a single class, if affiliates of KKR and Silver Lake collectively own less than 40% in voting power of our stock entitled to vote generally in the election of directors.
In addition, while we have opted out of Section 203 of the Delaware General Corporation Law (the DGCL), our amended and restated certificate of incorporation contains similar provisions providing that we may not engage in certain business combinations with any interested stockholder for a three year period following the time the stockholder became an interested stockholder, unless:
•
prior to such time, our board of directors approved either the business combination or the transaction resulting in the stockholder becoming an interested stockholder;
•
upon consummation of the transaction resulting in the stockholder becoming an interested stockholder, the interested stockholder owned at least 85% of the votes of our voting stock outstanding at the time the transaction commenced, excluding certain shares; or
•
at or subsequent to that time, the business combination is approved by our board of directors and by the affirmative vote of holders of at least two-thirds of the votes of our outstanding voting stock not owned by the interested stockholder.
Generally, a business combination includes a merger, asset or stock sale or other transaction resulting in a financial benefit to the interested stockholder. Subject to certain exceptions, an interested stockholder is a person who, together with that person's affiliates and associates, owns, or within the previous three years owned, 15% or more of the votes of our outstanding voting stock. For purposes of this provision, voting stock means any class or series of stock entitled to vote generally in the election of directors. Our amended and restated certificate of incorporation provides that KKR, Silver Lake, Bob Parsons, their respective affiliates and any of their respective direct or indirect designated transferees (other than in certain market transfers and gifts) and any group of which such persons are a party do not constitute interested stockholders for purposes of this provision.
Under certain circumstances, this provision will make it more difficult for a person who would be an interested stockholder to effect various business combinations with our company for a three year period. This provision may encourage companies interested in acquiring us to negotiate in advance with our board of directors because the stockholder approval requirement would be avoided if our board of directors approves either the business combination or the transaction resulting in the stockholder becoming an interested stockholder. These provisions also may have the effect of preventing changes in our board of directors and may make it more difficult to accomplish transactions stockholders may otherwise deem to be in their best interests.
These provisions in our amended and restated certificate of incorporation and amended and restated bylaws may discourage, delay or prevent a transaction involving a change in control of our company that is in the best interest of our minority stockholders. Even in the absence of a takeover attempt, the existence of these provisions may adversely affect the prevailing market price of our Class A common stock if they are viewed as discouraging future takeover attempts. These provisions could
48
also make it more difficult for stockholders to nominate directors for election to our board of directors and take other corporate actions.
Risks Relating to Owning Our Class A Common Stock
Our share price may be volatile, and you may be unable to sell your shares.
Technology stocks have historically experienced high levels of volatility. The trading price of our Class A common stock is likely to be highly volatile and could be subject to wide fluctuations in response to various factors, some of which are beyond our control and may not be related to our operating performance. These fluctuations could cause you to lose all or part of your investment in our common stock. Since shares of our Class A common stock were sold in our initial public offering (IPO) in April 2015 at a price of $20.00 per share, the reported high and low sales prices of our Class A common stock have ranged from
$23.59
to
$61.77
per share through
February 23, 2018
. Factors that may cause the market price of our Class A common stock to fluctuate include:
•
price and volume fluctuations in the overall stock market from time to time;
•
significant volatility in the market price and trading volume of technology companies in general, and of companies in our industry;
•
actual or anticipated changes in our results of operations or fluctuations in our operating results;
•
whether our operating results meet the expectations of securities analysts or investors;
•
changes in the expectations of investors or securities analysts;
•
actual or anticipated developments in our competitors' businesses or the competitive landscape generally;
•
litigation involving us, our industry or both;
•
regulatory developments in the U.S., foreign countries or both;
•
general economic conditions and trends;
•
major catastrophic events;
•
sales of large blocks of our stock; or
•
departures of key personnel.
In addition, if the market for technology stocks or the stock market in general experiences a loss of investor confidence, the trading price of our Class A common stock could decline for reasons unrelated to our business, operating results or financial condition. The trading price of our Class A common stock might also decline in reaction to events affecting other companies in our industry even if these events do not directly affect us.
In the past, following periods of volatility in the market price of a company's securities, securities class action litigation has often been brought against that company. If our stock price is volatile, we may become the target of securities litigation. Securities litigation could result in substantial costs and divert our management's attention and resources from our business, and this could have a material adverse effect on our business, operating results and financial condition.
Sales of outstanding shares of our Class A common stock into the market in the future could cause the market price of our Class A common stock to drop significantly.
If certain of our existing stockholders sell, or indicate intent to sell, substantial amounts of our Class A common stock in the public market after the market standoff and other legal restrictions on resale lapse, the trading price of our Class A common stock could decline.
Pursuant to the stockholder agreement, each of the Sponsors and Bob Parsons have agreed, subject to certain limited exceptions, not to transfer, sell, exchange, assign, pledge, hypothecate, convey or otherwise dispose of or encumber any shares of our Class A common stock (including shares of Class A common stock issuable upon the exchange of LLC Units) during the three-year period following our IPO without the consent of each of KKR and Silver Lake, for so long as each of KKR and Silver Lake is entitled to nominate at least one director to our board of directors. If these additional shares are sold, or if it is perceived they will be sold, in the public market, the trading price of shares of our Class A common stock could decline. This restriction on transfer will terminate on April 7, 2018.
49
If securities analysts do not publish research or reports about our business, or if they downgrade our stock, the price of our stock could decline.
The trading market for our Class A common stock could be influenced by any research and reports securities or industry analysts publish about us or our business. In the event securities analysts cover our company and one or more of these analysts downgrade our stock or publish unfavorable research about our business, our stock price would likely decline. If one or more of these analysts cease coverage of our company or fail to publish reports on us regularly, demand for our stock could decrease, which could cause our stock price and trading volume to decline.
We do not intend to pay dividends on our Class A common stock.
We do not expect to pay dividends to the holders of our Class A common stock for the foreseeable future. Our ability to pay dividends on our Class A common stock is limited by our existing indebtedness, and may be further restricted by the terms of any future debt incurred or preferred securities issued by us or our subsidiaries or by law. Payments of future dividends, if any, will be at the discretion of our board of directors after taking into account various factors, including our business, operating results and financial condition, current and anticipated cash needs, plans for expansion and any legal or contractual limitations on our ability to pay dividends. As a result, any capital appreciation in the price of our Class A common stock may be your only source of gain on your investment in our Class A common stock.
If, however, we decide to pay a dividend in the future, we would need to cause Desert Newco to make distributions to GoDaddy Inc. in an amount sufficient to cover such dividend. Deterioration in the consolidated financial condition, earnings or cash flow of Desert Newco for any reason could limit or impair its ability to make distributions to us.
50
None.
Our corporate headquarters are located in Scottsdale, Arizona and consist of approximately
153,000
square feet of owned office space. We also own our offices in Hiawatha, Iowa, which consist of approximately
75,000
square feet used primarily for Customer Care and product development. We lease additional Customer Care centers and offices located throughout the U.S. as well as internationally in Australia, Bulgaria, Colombia, China, Germany, India, Mexico, the Philippines, Romania, Serbia, Spain and the United Kingdom.
We provide our cloud-based products via a network of data centers including (i) an approximately
320,000
square foot data center we own and operate in Phoenix, Arizona; (ii) co-located data centers located throughout the U.S. in Arizona, California, Missouri, Virginia and New York; and (iii) co-located data centers located internationally in France, Germany, the Netherlands, Singapore and the United Kingdom. Our data center leases expire on various dates through
2028
.
We believe our existing facilities are sufficient for our current needs. In the future, we may need to add new facilities and expand our existing facilities as we increase our employee base, grow our infrastructure, further expand our international operations and evolve our business. We believe suitable additional or substitute space will be available on commercially reasonable terms to meet our future needs.
We are currently subject to litigation incidental to our business, including patent infringement litigation and trademark infringement claims, as well as putative class actions, employment, commercial and consumer protection claims and other litigation of a non-material nature. Although the results of any such current or future litigation, regardless of the underlying nature of the claims, cannot be predicted with certainty, the final outcome of any current or future claims or lawsuits we face could adversely affect our business, financial condition and results of operations.
Regardless of the final outcome, defending lawsuits, claims and proceedings in which we are involved is costly and can impose a significant burden on management and employees. We may receive unfavorable preliminary or interim rulings in the course of litigation, and there can be no assurances that favorable final outcomes will be obtained.
Not applicable.
51
Our Class A common stock has traded on the NYSE under the symbol "GDDY" since
April 1, 2015
. Prior to that date, there was no public market for our Class A common stock. The following table sets forth, for the period indicated, the range of high and low sales prices per share of our Class A common stock, as reported by the NYSE.
|
2017
|
2016
|
|||||||||||
|
High ($)
|
Low ($)
|
High ($)
|
Low ($)
|
|||||||||
|
First quarter
|
38.00
|
|
34.40
|
|
33.23
|
|
23.88
|
|
||||
|
Second quarter
|
44.22
|
|
36.02
|
|
33.58
|
|
28.11
|
|
||||
|
Third quarter
|
45.37
|
|
40.78
|
|
35.53
|
|
28.13
|
|
||||
|
Fourth quarter
|
51.35
|
|
43.12
|
|
37.40
|
|
31.63
|
|
||||
The closing sales price of our Class A common stock, as reported by the NYSE, on
February 23, 2018
was
$61.48
per share.
Stock Performance Graph
The following performance graph and related information shall not be deemed to be "soliciting material" or "filed" for purposes of Section 18 of the Exchange Act nor shall such information be incorporated by reference into any filing of GoDaddy Inc. under the Exchange Act or the Securities Act, except to the extent we specifically incorporate it by reference in such filing.
The graph set forth below compares the cumulative total return to stockholders on our Class A common stock relative to the cumulative total returns of the Standard & Poor's 500 Index (the S&P 500) and the Dow Jones Internet Composite Index. An investment of $100 (with reinvestment of all dividends) is assumed to have been made in our Class A common stock and in each index on
April 1, 2015
, the date our Class A common stock began trading on the NYSE, with relative performance is tracked through
December 31, 2017
. The returns shown are based on historical results and are not intended to suggest future performance.
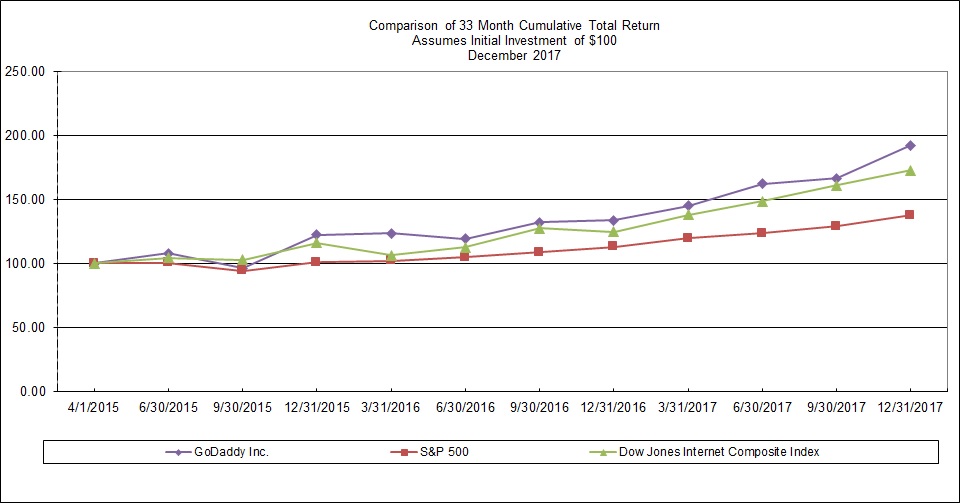
52
Holders of Record
As of
December 31, 2017
, there were
11
holders of record of our Class A common stock, although we believe there are a significantly larger number of beneficial owners of our Class A common stock because many shares are held by brokers and other institutions on behalf of stockholders.
Dividend Policy
We have not paid any dividends on our Class A common stock and do not intend to pay dividends on our Class A common stock in the foreseeable future. If, however, we decide to pay a dividend in the future, we would need to cause Desert Newco to make distributions to us in an amount sufficient to cover such dividend. If Desert Newco makes such distributions to us, the other holders of LLC Units will be entitled to receive pro rata distributions.
Our ability to pay dividends on our Class A common stock is limited by the covenants of our indebtedness and may be further restricted by the terms of any future debt or preferred securities incurred or issued by us or our subsidiaries. See "Management's Discussion and Analysis of Financial Condition and Results of Operations—Liquidity and Capital Resources." In addition, Desert Newco is generally prohibited under Delaware law from making a distribution to unit holders (including us) to the extent that, at the time of the distribution, after giving effect to the distribution, liabilities of Desert Newco (with certain exceptions) exceed the fair value of its assets. Subsidiaries of Desert Newco are generally subject to similar legal limitations on their ability to make distributions to Desert Newco.
53
You should read the following selected consolidated financial data in conjunction with "Management's Discussion and Analysis of Financial Condition and Results of Operations" and our consolidated financial statements and the related notes appearing in "Financial Statements and Supplementary Data."
We were incorporated in
May 2014
and, pursuant to the organizational transactions described in Note
6
to our consolidated financial statements, became a holding company whose principal asset is a controlling equity interest in Desert Newco. As the sole managing member of Desert Newco, we operate and control the business and affairs of Desert Newco and its subsidiaries. As a result, we consolidate Desert Newco's financial results and report non-controlling interests related to the portion of Desert Newco not owned by us. Because the pre-IPO organizational transactions were considered transactions between entities under common control, the financial statements for periods prior to our April 2015 IPO have been adjusted to combine the previously separate entities for presentation purposes.
The consolidated statements of operations data for the years ended December 31,
2017
,
2016
and
2015
and the consolidated balance sheets data as of
December 31, 2017
and
2016
are derived from our audited consolidated financial statements and the related notes appearing in "Financial Statements and Supplementary Data." The consolidated statements of operations data for the years ended December 31,
2014
and
2013
, and the consolidated balance sheets data as of December 31,
2015
,
2014
and
2013
are derived from our audited consolidated financial statements not included in this Form 10-K. Our historical results are not necessarily indicative of the results to be expected in any future period.
54
|
Year Ended December 31,
|
|||||||||||||||||||
|
2017
|
2016
|
2015
|
2014
|
2013
|
|||||||||||||||
|
Consolidated Statements of Operations Data:
|
(in millions, except shares in thousands and per share amounts)
|
||||||||||||||||||
|
Total revenue
|
$
|
2,231.9
|
|
$
|
1,847.9
|
|
$
|
1,607.3
|
|
$
|
1,387.3
|
|
$
|
1,130.8
|
|
||||
|
Costs and operating expenses:
(1)
|
|||||||||||||||||||
|
Cost of revenue (excluding depreciation and amortization)
|
775.5
|
|
657.8
|
|
565.9
|
|
518.4
|
|
473.9
|
|
|||||||||
|
Technology and development
|
355.8
|
|
287.8
|
|
270.2
|
|
250.8
|
|
206.0
|
|
|||||||||
|
Marketing and advertising
|
253.2
|
|
228.8
|
|
202.2
|
|
164.7
|
|
145.5
|
|
|||||||||
|
Customer care
|
292.3
|
|
242.1
|
|
221.5
|
|
190.5
|
|
150.9
|
|
|||||||||
|
General and administrative
|
282.4
|
|
221.2
|
|
219.7
|
|
172.0
|
|
145.8
|
|
|||||||||
|
Depreciation and amortization
|
205.8
|
|
160.1
|
|
158.8
|
|
152.8
|
|
140.6
|
|
|||||||||
|
Total costs and operating expenses
|
2,165.0
|
|
1,797.8
|
|
1,638.3
|
|
1,449.2
|
|
1,262.7
|
|
|||||||||
|
Operating income (loss)
|
66.9
|
|
50.1
|
|
(31.0
|
)
|
(61.9
|
)
|
(131.9
|
)
|
|||||||||
|
Interest expense
|
(83.0
|
)
|
(57.2
|
)
|
(69.2
|
)
|
(85.0
|
)
|
(71.0
|
)
|
|||||||||
|
Loss on debt extinguishment
|
(7.3
|
)
|
—
|
|
(21.4
|
)
|
—
|
|
—
|
|
|||||||||
|
Tax receivable agreements liability adjustment
|
123.2
|
|
(12.5
|
)
|
—
|
|
—
|
|
—
|
|
|||||||||
|
Other income (expense), net
|
7.0
|
|
(1.9
|
)
|
1.0
|
|
0.8
|
|
1.9
|
|
|||||||||
|
Income (loss) from continuing operations before income taxes
|
106.8
|
|
(21.5
|
)
|
(120.6
|
)
|
(146.1
|
)
|
(201.0
|
)
|
|||||||||
|
Benefit (provision) for income taxes
|
18.9
|
|
(0.4
|
)
|
0.2
|
|
2.8
|
|
1.1
|
|
|||||||||
|
Income (loss) from continuing operations
|
125.7
|
|
|
(21.9
|
)
|
|
(120.4
|
)
|
|
(143.3
|
)
|
|
(199.9
|
)
|
|||||
|
Income from discontinued operations, net of income taxes (includes $33.2 gain on disposal, net of tax)
|
14.1
|
|
—
|
|
—
|
|
—
|
|
—
|
|
|||||||||
|
Net income (loss)
|
139.8
|
|
(21.9
|
)
|
(120.4
|
)
|
(143.3
|
)
|
(199.9
|
)
|
|||||||||
|
Less: net income (loss) attributable to non-controlling interests
|
3.4
|
|
(5.4
|
)
|
(44.8
|
)
|
—
|
|
—
|
|
|||||||||
|
Net income (loss) attributable to GoDaddy Inc.
|
$
|
136.4
|
|
$
|
(16.5
|
)
|
$
|
(75.6
|
)
|
$
|
(143.3
|
)
|
$
|
(199.9
|
)
|
||||
|
Net income (loss) attributable to GoDaddy Inc. per share of Class A common stock—basic
(2)
:
|
|||||||||||||||||||
|
Continuing operations
|
$
|
1.17
|
|
$
|
(0.21
|
)
|
$
|
(0.81
|
)
|
$
|
(1.11
|
)
|
$
|
(1.58
|
)
|
||||
|
Discontinued operations
|
0.08
|
|
—
|
|
—
|
|
—
|
|
—
|
|
|||||||||
|
Net income (loss) attributable to GoDaddy Inc.
|
$
|
1.25
|
|
|
$
|
(0.21
|
)
|
|
$
|
(0.81
|
)
|
|
$
|
(1.11
|
)
|
|
$
|
(1.58
|
)
|
|
Net income (loss) attributable to GoDaddy Inc. per share of Class A common stock—diluted
(2)
:
|
|||||||||||||||||||
|
Continuing operations
|
$
|
0.71
|
|
$
|
(0.21
|
)
|
$
|
(0.81
|
)
|
$
|
(1.11
|
)
|
$
|
(1.58
|
)
|
||||
|
Discontinued operations
|
0.08
|
|
—
|
|
—
|
|
—
|
|
—
|
|
|||||||||
|
Net income (loss) attributable to GoDaddy Inc.
|
$
|
0.79
|
|
|
$
|
(0.21
|
)
|
|
$
|
(0.81
|
)
|
|
$
|
(1.11
|
)
|
|
$
|
(1.58
|
)
|
|
Weighted-average shares of Class A common stock outstanding
(2)
:
|
|||||||||||||||||||
|
Basic
|
108,779
|
|
79,835
|
|
58,676
|
|
38,826
|
|
38,826
|
|
|||||||||
|
Diluted
|
177,054
|
|
79,835
|
|
58,676
|
|
38,826
|
|
38,826
|
|
|||||||||
55
|
(1)
|
Costs and operating expenses include equity-based compensation expense as follows:
|
|
Technology and development
|
$
|
37.1
|
|
$
|
23.2
|
|
$
|
18.2
|
|
$
|
10.4
|
|
$
|
4.7
|
|
||||
|
Marketing and advertising
|
7.3
|
|
8.1
|
|
6.1
|
|
6.1
|
|
2.6
|
|
|||||||||
|
Customer care
|
3.6
|
|
3.9
|
|
2.9
|
|
0.8
|
|
0.6
|
|
|||||||||
|
General and administrative
|
28.4
|
|
21.6
|
|
13.2
|
|
12.8
|
|
8.5
|
|
|||||||||
|
(2)
|
Amounts for periods prior to our IPO have been retrospectively adjusted to give effect to the pre-IPO organizational transactions described in Note
6
to our consolidated financial statements. The prior period amounts do not consider the
26,000
shares of Class A common stock sold in our IPO. See Note
16
to our consolidated financial statements.
|
|
December 31,
|
|||||||||||||||||||
|
2017
|
2016
|
2015
|
2014
|
2013
|
|||||||||||||||
|
Consolidated Balance Sheets Data:
|
(in millions)
|
||||||||||||||||||
|
Cash and cash equivalents
|
$
|
582.7
|
|
$
|
566.1
|
|
$
|
348.0
|
|
$
|
139.0
|
|
$
|
95.4
|
|
||||
|
Prepaid domain name registry fees
|
532.3
|
|
479.1
|
|
456.3
|
|
425.6
|
|
404.1
|
|
|||||||||
|
Property and equipment, net
|
297.9
|
|
231.0
|
|
225.0
|
|
220.9
|
|
183.2
|
|
|||||||||
|
Total assets
|
5,738.3
|
|
3,786.9
|
|
3,498.8
|
|
3,260.7
|
|
3,208.1
|
|
|||||||||
|
Deferred revenue
|
1,861.6
|
|
1,576.2
|
|
1,416.2
|
|
1,250.6
|
|
1,086.2
|
|
|||||||||
|
Total debt
(1)
|
2,482.3
|
|
1,072.5
|
|
1,083.5
|
|
1,469.5
|
|
1,132.9
|
|
|||||||||
|
Total liabilities
|
5,191.8
|
|
3,072.7
|
|
2,817.8
|
|
2,850.3
|
|
2,337.6
|
|
|||||||||
|
(1)
|
Total debt includes long-term debt, unamortized original issue discount and unamortized debt issuance costs.
|
Key Metrics
In addition to our results determined in accordance with GAAP, we believe the following operating metrics are useful as supplements in evaluating our ongoing operational performance and help provide an enhanced understanding of our business.
|
Year Ended December 31,
|
|||||||||||||||||||
|
2017
|
2016
|
2015
|
2014
|
2013
|
|||||||||||||||
|
(unaudited)
|
|||||||||||||||||||
|
Total bookings (in millions)
|
$
|
2,618.2
|
|
$
|
2,155.5
|
|
$
|
1,914.2
|
|
$
|
1,675.2
|
|
$
|
1,397.9
|
|
||||
|
Total customers at period end (in thousands)
|
17,339
|
|
14,740
|
|
13,774
|
|
12,709
|
|
11,584
|
|
|||||||||
|
Average revenue per user
|
$
|
139
|
|
$
|
130
|
|
$
|
121
|
|
$
|
114
|
|
$
|
104
|
|
||||
Total bookings
.
Total bookings represents cash receipts from the sale of products to customers in a given period adjusted for products where we recognize revenue on a net basis and without giving effect to certain adjustments, primarily net refunds granted in the period. Total bookings provides valuable insight into the sales of our products and the performance of our business since we typically collect payment at the time of sale and recognize revenue ratably over the term of our customer contracts. We report total bookings without giving effect to refunds granted in the period because refunds often occur in periods different from the period of sale for reasons unrelated to the marketing efforts leading to the initial sale. Accordingly, by excluding net refunds, we believe total bookings reflects the effectiveness of our sales efforts in a given period.
Total customers
. We define a customer as an individual or entity, as of the end of a period, having an account with one or more paid product subscriptions. A single user may be counted as a customer more than once if the user maintains paid subscriptions in multiple accounts. Total customers is an indicator of the scale of our business and is a critical factor in our ability to increase our revenue base.
56
Average revenue per user (ARPU)
.
We calculate ARPU as total revenue during the preceding 12 month period divided by the average of the number of total customers at the beginning and end of the period. ARPU provides insight into our ability to sell additional products to customers, though the impact to date has been muted due to our continued growth in total customers.
Reconciliation of Bookings
The following table reconciles total bookings to total revenue, its most directly comparable GAAP financial measure.
|
Year Ended December 31,
|
|||||||||||||||||||
|
2017
|
2016
|
2015
|
2014
|
2013
|
|||||||||||||||
|
Total Bookings:
|
(unaudited; in millions)
|
||||||||||||||||||
|
Total revenue
|
$
|
2,231.9
|
|
$
|
1,847.9
|
|
$
|
1,607.3
|
|
$
|
1,387.3
|
|
$
|
1,130.8
|
|
||||
|
Change in deferred revenue
(1)
|
214.4
|
|
163.5
|
|
165.9
|
|
166.4
|
|
169.1
|
|
|||||||||
|
Net refunds
|
170.0
|
|
141.9
|
|
137.8
|
|
116.2
|
|
96.1
|
|
|||||||||
|
Other
|
1.9
|
|
2.2
|
|
3.2
|
|
5.3
|
|
1.9
|
|
|||||||||
|
Total bookings
|
$
|
2,618.2
|
|
|
$
|
2,155.5
|
|
|
$
|
1,914.2
|
|
$
|
1,675.2
|
|
|
$
|
1,397.9
|
|
|
|
(1)
|
Change in deferred revenue also includes the impact of realized gains or losses from the hedging of bookings in foreign currencies.
|
57
You should read the following discussion and analysis of our financial condition and results of operations together with our consolidated financial statements and related notes included in "Financial Statements and Supplementary Data." Some of the information contained in this discussion and analysis, including information with respect to our plans and strategies for our business, includes forward-looking statements involving significant risks and uncertainties. As a result of many factors, such as those set forth in "Risk Factors," our actual results may differ materially from the results described in, or implied by, these forward-looking statements.
(Throughout this discussion and analysis, dollars are in millions, excluding ARPU or unless otherwise noted.)
Overview
We are the global market leader in domain registration. Securing a domain is a necessary first step to creating a digital identity and our domain products often serve as the starting point in our customer relationships. As of
December 31, 2017
, approximately
92%
of our customers had purchased a domain from us and we had approximately
75.0 million
domains under management. Based on information reported in VeriSign's Domain Name Industry Brief, we had over
22%
of the world's domains registered as of
December 31, 2017
.
We also offer hosting, presence and business applications products and services enhancing our value proposition to our customers by enabling them to create, manage and syndicate their, or their customers', digital identities. While these products are often purchased in conjunction with, or subsequent to, an initial domain registration, they are also frequently the starting points in our customer relationships. As we have grown, our hosting, presence and business applications products have become increasingly important parts of our business, constituting nearly
53%
of total revenue in
2017
.
Financial Highlights
Below are our key financial highlights for
2017
, with comparisons to
2016
.
|
•
|
Total revenue of
$2,231.9 million
, an increase of
20.8%
.
|
|
•
|
International revenue of
$727.4 million
, an increase of
46.1%
.
|
|
•
|
Total bookings
(1)
of
$2,618.2 million
, an increase of
21.5%
.
|
|
•
|
Net income of
$139.8 million
.
|
|
•
|
Total customers increased
17.6%
to
17.3 million
.
|
|
•
|
ARPU increased
7.4%
to
$139
.
|
|
•
|
Net cash provided by operating activities of
$475.6 million
, an increase of
23.1%
.
|
(1)
A reconciliation of total bookings to total revenue, its most directly comparable GAAP financial measure, is set forth in "Selected Financial Data—Reconciliation of Bookings."
58
Our Financial Model
We have developed a stable and predictable business model driven by efficient customer acquisition, high customer retention rates and increasing lifetime spend. We grew our total customers from
13.8 million
as of
December 31, 2015
to
17.3 million
as of
December 31, 2017
, primarily through a combination of our industry leading products built on a single cloud platform, brand advertising, direct marketing efforts, customer referrals and world-class customer care. We also added approximately
1.6 million
customers from our acquisition of HEG in April 2017. In each of the
five
years ended
December 31, 2017
, our customer retention rate exceeded
85%
and our retention rate for customers who had been with us for over
three
years was approximately
91%
. We believe the breadth and depth of our product offerings and the high quality and responsiveness of our Customer Care team build strong relationships with our customers and are key to our high level of customer retention.
We generate bookings and revenue from sales of product subscriptions, including domain products, hosting and presence offerings and business applications, as described below. We offer our product subscriptions on a variety of terms, which are typically one year, but can range from monthly to multi-annual terms of up to ten years depending on the product. We monitor total bookings as we typically collect payment at the time of sale and recognize revenue ratably over the term of our customer contracts. Accordingly, we believe total bookings is an indicator of the expected growth in our revenue and the operating performance of our business. See "Selected Financial Data—Reconciliation of Bookings" for a reconciliation of total revenue to total bookings.
Domains
. We generated
47%
of our
2017
total revenue from the sale of domain products, primarily from domain registrations and renewals, domain add-ons such as privacy and aftermarket sales. Total revenue from domain products grew at a CAGR of
11.5%
over the three years ended
December 31, 2017
.
Hosting and Presence
. We generated
38%
of our
2017
total revenue from the sale of hosting and presence products, primarily from a variety of website hosting offerings, website builder products, security products and e-commerce products. These products generally have higher margins than conventional domain registrations. Total revenue from hosting and presence products grew at a CAGR of
18.6%
over the three years ended
December 31, 2017
.
Business Applications
. We generated
15%
of our
2017
total revenue from the sale of business applications products, primarily from productivity tools such as domain-specific email accounts, which generally also have higher margins than conventional domain registrations. Total revenue from business applications products grew at a CAGR of
41.2%
over the three years ended
December 31, 2017
.
Revenue derived from each of our product categories has increased in each of the last three years ended
December 31, 2017
, with our hosting, presence and business applications products growing faster in recent periods. This mix shift has favorably impacted our margins.
In each of the
five
years ended
December 31, 2017
, greater than
85%
of our total revenue, excluding the impact of purchase accounting, was generated by customers who were also customers in the prior year. To track our growth and the stability of our customer base, we monitor, among other things, revenue, retention rates and ARPU generated by our annual customer cohorts over time, as well as corresponding marketing and advertising spend. We define an annual customer cohort to include each customer who first became a customer during a calendar year. For example, in calendar year
2010
, we acquired
2.3 million
customers, who we collectively refer to as our
2010
cohort. During the same time period, we spent
$94 million
in marketing and advertising expenses. By the end of
2017
, the
2010
cohort had generated an aggregate of
$1,250 million
of total bookings, and we expect this cohort will continue to generate bookings and revenue in the future. For the six years ended
December 31, 2017
, the average bookings retention rate of the
2010
cohort was approximately
93%
. Over this period, ARPU, excluding the impact of purchase accounting, for the
2010
cohort grew from
$91
in
2012
to
$170
in
2017
, representing a CAGR of
13%
. We selected the
2010
cohort for this analysis because we believe the
2010
cohort is representative of the spending patterns and revenue impact of our other cohorts. We believe our cohort analysis is important to illustrate the long-term value of our customers.
59
Key Metrics
As described in "Selected Financial Data," we monitor the following key metrics to help us evaluate our business and assess operational performance. These operational measures are supplemental to our GAAP results and we believe they are useful in evaluating our business. A reconciliation of total bookings to total revenue, its most directly comparable GAAP financial measure, is set forth in "Selected Financial Data—Reconciliation of Bookings."
|
|
Year Ended December 31,
|
||||||||||
|
|
2017
|
2016
|
2015
|
||||||||
|
|
(unaudited; customers in thousands)
|
||||||||||
|
Total bookings
|
$
|
2,618.2
|
|
$
|
2,155.5
|
|
$
|
1,914.2
|
|
||
|
Total customers at period end
|
17,339
|
|
14,740
|
|
13,774
|
|
|||||
|
Average revenue per user
|
$
|
139
|
|
$
|
130
|
|
$
|
121
|
|
||
Total bookings
. Total bookings increased
12.6%
from
$1,914.2 million
in
2015
to
$2,155.5 million
in
2016
and increased
21.5%
to
$2,618.2 million
in
2017
. These increases were primarily driven by increases in total customers and domains under management, continued increases in aftermarket domain sales, broadened customer adoption of non-domain products and an increased growth rate associated with our greater international presence, partially offset by the impact of adverse movements in foreign currency exchange rates. Additionally, the acquisition of HEG in April 2017 contributed to our bookings growth in
2017
.
Total customers.
As of December 31,
2017
,
2016
and
2015
, we had
17,339
,
14,740
and
13,774
total customers, respectively. Our customer growth primarily resulted from our increased international presence, our ongoing marketing and advertising initiatives, our enhanced and expanded product offerings and approximately
1.6 million
customers added from our acquisition of HEG in April 2017.
Average revenue per user
. ARPU increased
6.8%
from
$121
in
2015
to
$130
in
2016
and increased
7.4%
to
$139
in
2017
, primarily due to broadened customer adoption of our products resulting in increased customer spend and revenue from acquired businesses, partially offset by the impact of adverse movements in foreign currency exchange rates. Our ARPU growth in
2017
is muted by the impact of the acquisition of HEG as our trailing 12 month revenue includes only nine months of HEG's results, while all of the customers acquired from HEG are included in the average customers calculation.
60
Results of Operations
The following table sets forth our consolidated results of operations for the periods presented and as a percentage of our total revenue for those periods. The period-to-period comparison of financial results is not necessarily indicative of future results.
|
Year Ended December 31,
|
|||||||||||||||||
|
2017
|
2016
|
2015
|
|||||||||||||||
|
$
|
% of Total Revenue
|
$
|
% of Total Revenue
|
$
|
% of Total Revenue
|
||||||||||||
|
Revenue:
|
|||||||||||||||||
|
Domains
|
$
|
1,057.2
|
|
47.4
|
%
|
$
|
927.8
|
|
50.2
|
%
|
$
|
840.8
|
|
52.3
|
%
|
||
|
Hosting and presence
|
847.9
|
|
38.0
|
%
|
678.7
|
|
36.7
|
%
|
592.0
|
|
36.8
|
%
|
|||||
|
Business applications
|
326.8
|
|
14.6
|
%
|
241.4
|
|
13.1
|
%
|
174.5
|
|
10.9
|
%
|
|||||
|
Total revenue
|
2,231.9
|
|
100.0
|
%
|
1,847.9
|
|
100.0
|
%
|
1,607.3
|
|
100.0
|
%
|
|||||
|
Costs and operating expenses:
|
|||||||||||||||||
|
Cost of revenue (excluding depreciation and amortization)
|
775.5
|
|
34.7
|
%
|
657.8
|
|
35.6
|
%
|
565.9
|
|
35.2
|
%
|
|||||
|
Technology and development
|
355.8
|
|
15.9
|
%
|
287.8
|
|
15.5
|
%
|
270.2
|
|
16.8
|
%
|
|||||
|
Marketing and advertising
|
253.2
|
|
11.3
|
%
|
228.8
|
|
12.4
|
%
|
202.2
|
|
12.6
|
%
|
|||||
|
Customer care
|
292.3
|
|
13.1
|
%
|
242.1
|
|
13.1
|
%
|
221.5
|
|
13.8
|
%
|
|||||
|
General and administrative
|
282.4
|
|
12.8
|
%
|
221.2
|
|
12.0
|
%
|
219.7
|
|
13.7
|
%
|
|||||
|
Depreciation and amortization
|
205.8
|
|
9.2
|
%
|
160.1
|
|
8.7
|
%
|
158.8
|
|
9.9
|
%
|
|||||
|
Total costs and operating expenses
|
2,165.0
|
|
97.0
|
%
|
1,797.8
|
|
97.3
|
%
|
1,638.3
|
|
102.0
|
%
|
|||||
|
Operating income (loss)
|
66.9
|
|
3.0
|
%
|
50.1
|
|
2.7
|
%
|
(31.0
|
)
|
(2.0
|
)%
|
|||||
|
Interest expense
|
(83.0
|
)
|
(3.7
|
)%
|
(57.2
|
)
|
(3.1
|
)%
|
(69.2
|
)
|
(4.3
|
)%
|
|||||
|
Loss on debt extinguishment
|
(7.3
|
)
|
(0.3
|
)%
|
—
|
|
—
|
%
|
(21.4
|
)
|
(1.3
|
)%
|
|||||
|
Tax receivable agreements liability adjustment
|
123.2
|
|
5.5
|
%
|
(12.5
|
)
|
(0.7
|
)%
|
—
|
|
—
|
%
|
|||||
|
Other income (expense), net
|
7.0
|
|
0.3
|
%
|
(1.9
|
)
|
(0.1
|
)%
|
1.0
|
|
0.1
|
%
|
|||||
|
Income (loss) from continuing operations before income taxes
|
106.8
|
|
4.8
|
%
|
(21.5
|
)
|
(1.2
|
)%
|
(120.6
|
)
|
(7.5
|
)%
|
|||||
|
Benefit (provision) for income taxes
|
18.9
|
|
0.8
|
%
|
(0.4
|
)
|
—
|
%
|
0.2
|
|
—
|
%
|
|||||
|
Income (loss) from continuing operations
|
125.7
|
|
5.6
|
%
|
(21.9
|
)
|
(1.2
|
)%
|
(120.4
|
)
|
(7.5
|
)%
|
|||||
|
Income from discontinued operations, net of income taxes
|
14.1
|
|
0.6
|
%
|
—
|
|
—
|
%
|
—
|
|
—
|
%
|
|||||
|
Net income (loss)
|
139.8
|
|
6.2
|
%
|
|
(21.9
|
)
|
(1.2
|
)%
|
|
(120.4
|
)
|
(7.5
|
)%
|
|||
|
Less: net income (loss) attributable to non-controlling interests
|
3.4
|
|
0.1
|
%
|
(5.4
|
)
|
(0.3
|
)%
|
(44.8
|
)
|
(2.8
|
)%
|
|||||
|
Net income (loss) attributable to GoDaddy Inc.
|
$
|
136.4
|
|
6.1
|
%
|
$
|
(16.5
|
)
|
(0.9
|
)%
|
$
|
(75.6
|
)
|
(4.7
|
)%
|
||
Comparison of Years Ended December 31,
2017
,
2016
and
2015
Revenue
We generate substantially all of our revenue from sales of product subscriptions, including domain registrations and renewals, hosting and presence offerings and business applications. Our subscription terms are typically one year, but can range from monthly to multi-annual terms of up to ten years depending on the product. We generally collect the full amount of subscription fees at the time of sale, but recognize revenue ratably over the applicable contract term.
61
Domains revenue primarily consists of revenue from the sale of domain registration subscriptions, domain add-ons and aftermarket domain sales. Domain registrations provide a customer with the exclusive use of a domain during the applicable contract term. After the contract term expires, unless renewed, the customer can no longer access the domain.
Hosting and presence revenue primarily consists of revenue from the sale of subscriptions for our website hosting products, website building products and services, website security products, an online shopping cart and online visibility products.
Business applications revenue primarily consists of revenue from the sale of subscriptions for third-party productivity applications, email accounts and email marketing tools.
Revenue is presented net of refunds, and we maintain a reserve to provide for refunds granted to customers. Our reserve is an estimate based on historical refund experience. Refunds reduce deferred revenue at the time they are granted and result in a reduced amount of revenue recognized over the applicable subscription terms compared to the amount originally expected.
The following table presents our revenue for the periods indicated:
|
Year Ended December 31,
|
2017 to 2016
|
2016 to 2015
|
|||||||||||||||||||||||
|
2017
|
2016
|
2015
|
$ change
|
% change
|
$ change
|
% change
|
|||||||||||||||||||
|
Domains
|
$
|
1,057.2
|
|
$
|
927.8
|
|
$
|
840.8
|
|
$
|
129.4
|
|
14
|
%
|
$
|
87.0
|
|
10
|
%
|
||||||
|
Hosting and presence
|
847.9
|
|
678.7
|
|
592.0
|
|
169.2
|
|
25
|
%
|
86.7
|
|
15
|
%
|
|||||||||||
|
Business applications
|
326.8
|
|
241.4
|
|
174.5
|
|
85.4
|
|
35
|
%
|
66.9
|
|
38
|
%
|
|||||||||||
|
Total revenue
|
$
|
2,231.9
|
|
$
|
1,847.9
|
|
$
|
1,607.3
|
|
$
|
384.0
|
|
21
|
%
|
$
|
240.6
|
|
15
|
%
|
||||||
2017
compared to
2016
Total revenue increased
$384.0 million
, or
20.8%
, from
$1,847.9 million
in
2016
to
$2,231.9 million
in
2017
. The increase was primarily driven by
$155.1 million
in total revenue from our acquisition of HEG in April 2017 as well as growth in total customers and ARPU. The increase in customers impacted each of our revenue lines, as the additional customers purchased subscriptions across our product portfolio.
Domains.
Domains revenue increased
$129.4 million
, or
13.9%
, from
$927.8 million
in
2016
to
$1,057.2 million
in
2017
. This increase was primarily driven by our acquisition of HEG, the increase in domains under management from
63.5 million
as of
December 31, 2016
to
75.0 million
as of
December 31, 2017
, international growth, strong renewals and increased aftermarket domain sales. Domains under management in
2017
includes approximately 1.0 million .uk domains for which we provided free initial registration to the owners of the associated third-level domains (e.g. .co.uk) following the
2017
launch of the .uk ccTLD.
Hosting and presence.
Hosting and presence revenue increased
$169.2 million
, or
24.9%
, from
$678.7 million
in
2016
to
$847.9 million
in
2017
. The increase was primarily driven by our acquisition of HEG as well as increased revenue from our website hosting, website building and website security products and services.
Business applications
. Business applications revenue increased
$85.4 million
, or
35.4%
, from
$241.4 million
in
2016
to
$326.8 million
in
2017
. The increase was primarily driven by increased customer adoption of our expanded email and productivity solutions.
2016
compared to
2015
Total revenue increased
$240.6 million
, or
15.0%
, from
$1,607.3 million
in
2015
to
$1,847.9 million
in
2016
. The increase was primarily driven by growth in total customers and ARPU, as well as revenue from acquired businesses. The increase in customers impacted each of our revenue lines, as the additional customers purchased subscriptions across our product portfolio.
Domains
. Domains revenue increased
$87.0 million
, or
10.3%
, from
$840.8 million
in
2015
to
$927.8 million
in
2016
. This increase was primarily attributable to the 3.1% increase in domains under management from 61.6 million as of
62
December 31, 2015 to 63.5 million as of December 31, 2016 driven by our international growth and strong renewals. Increased aftermarket domain sales driven by our domain portfolio acquisitions also contributed to the revenue increase.
Hosting and presence.
Hosting and presence revenue increased
$86.7 million
, or
14.6%
, from
$592.0 million
in
2015
to
$678.7 million
in
2016
. The increase was primarily attributable to increased revenue from our website hosting, website building and website security products and services.
Business applications
. Business applications revenue increased
$66.9 million
, or
38.3%
, from
$174.5 million
in
2015
to
$241.4 million
in
2016
. The increase was primarily driven by increased customer adoption of our expanded email and productivity solutions.
Costs and Operating Expenses
Cost of revenue
Costs of revenue are the direct costs we incur in connection with selling an incremental product to our customers. Substantially all cost of revenue relates to domain registration fees paid to the various domain registries, payment processing fees, third-party commissions and licensing fees for third-party productivity applications. Similar to our billing practices, we pay domain costs at the time of purchase for the life of each subscription, but recognize the costs of service ratably over the term of our customer contracts. The terms of registry pricing are established by agreements between registries and registrars, and can vary significantly depending on the TLD. We expect cost of revenue to increase in absolute dollars in future periods as we expand our domains business, increase our sales of third-party productivity applications, increase our customer base and expand our international presence. Cost of revenue may increase or decrease as a percentage of total revenue, depending on the mix of products sold in a particular period and the sales and marketing channels used.
|
|
Year Ended December 31,
|
2017 to 2016
|
2016 to 2015
|
||||||||||||||||||||||
|
|
2017
|
2016
|
2015
|
$ change
|
% change
|
$ change
|
% change
|
||||||||||||||||||
|
Cost of revenue
|
$
|
775.5
|
|
$
|
657.8
|
|
$
|
565.9
|
|
$
|
117.7
|
|
18
|
%
|
$
|
91.9
|
|
16
|
%
|
||||||
2017
compared to
2016
.
Cost of revenue increased
$117.7 million
, or
17.9%
, from
$657.8 million
in
2016
to
$775.5 million
in
2017
. This increase was primarily attributable to our acquisition of HEG, increased domain costs driven by the increase in domains under management, higher registration costs associated with many new gTLDs and increased aftermarket domain sales, increased software licensing fees primarily related to increased sales of email and productivity solutions and increased third-party commissions driven by the increased aftermarket domain sales.
2016
compared to
2015
. Cost of revenue increased
$91.9 million
, or
16.2%
, from
$565.9 million
in
2015
to
$657.8 million
in
2016
. This increase was primarily attributable to increased domain costs driven by the increase in domains under management, higher registration costs associated with many new gTLDs and increased aftermarket domain sales, increased software licensing fees primarily related to increased sales of email and productivity solutions, increased third-party commissions driven by increased aftermarket domain sales as well as increased payment processing fees due to the overall bookings increase.
Technology and development
Technology and development expenses represent the costs associated with the creation, development and distribution of our products and websites. These expenses primarily consist of personnel costs associated with the design, development, deployment, testing, operation and enhancement of our products, as well as costs associated with the data centers and systems infrastructure supporting those products, excluding depreciation expense. We expect technology and development expense to increase in absolute dollars as we continue to enhance existing products, develop new products and geographically diversify our data center footprint. Technology and development expenses may increase or decrease as a percentage of total revenue depending on our level of investment in additional personnel and the expansion of our global infrastructure footprint. Our investments in additional technology and development expenses are made to enhance our integrated technology infrastructure and to support our new and enhanced product offerings and the overall growth of our business.
63
|
|
Year Ended December 31,
|
2017 to 2016
|
2016 to 2015
|
||||||||||||||||||||||
|
|
2017
|
2016
|
2015
|
$ change
|
% change
|
$ change
|
% change
|
||||||||||||||||||
|
Technology and development
|
$
|
355.8
|
|
$
|
287.8
|
|
$
|
270.2
|
|
$
|
68.0
|
|
24
|
%
|
$
|
17.6
|
|
7
|
%
|
||||||
2017
compared to
2016
.
Technology and development expenses increased
$68.0 million
, or
23.6%
, from
$287.8 million
in
2016
to
$355.8 million
in
2017
. This increase was primarily attributable to our acquisition of HEG as well as increased compensation-related costs driven by higher average headcount associated with the continued growth of our business.
2016
compared to
2015
. Technology and development expenses increased
$17.6 million
, or
6.5%
, from
$270.2 million
in
2015
to
$287.8 million
in
2016
. This increase was primarily attributable to increased compensation-related costs driven by increased average headcount associated with the continued growth of our business.
Marketing and advertising
Marketing and advertising expenses represent the costs associated with attracting and acquiring customers, primarily consisting of fees paid to third parties for marketing and advertising campaigns across television and radio, search engines, online display, social media and event sponsorships. These expenses also include personnel costs and affiliate program commissions. We expect marketing and advertising expenses to fluctuate both in absolute dollars and as a percentage of total revenue depending on both the mix of internal and external marketing resources used and the size and scope of our future campaigns, particularly related to new product introductions and the growth of our international business.
|
|
Year Ended December 31,
|
2017 to 2016
|
2016 to 2015
|
||||||||||||||||||||||
|
|
2017
|
2016
|
2015
|
$ change
|
% change
|
$ change
|
% change
|
||||||||||||||||||
|
Marketing and advertising
|
$
|
253.2
|
|
$
|
228.8
|
|
$
|
202.2
|
|
$
|
24.4
|
|
11
|
%
|
$
|
26.6
|
|
13
|
%
|
||||||
2017
compared to
2016
.
Marketing and advertising expenses increased
$24.4 million
, or
10.7%
, from
$228.8 million
in
2016
to
$253.2 million
in
2017
. The increase was primarily attributable to increased discretionary advertising spend driven by our international growth and new product launches as well as our acquisition of HEG.
2016
compared to
2015
. Marketing and advertising expenses increased
$26.6 million
, or
13.2%
, from
$202.2 million
in
2015
to
$228.8 million
in
2016
. The increase was primarily attributable to increased discretionary advertising spend driven by our international growth and new product launches.
Customer Care
Customer care expenses represent the costs to advise and service our customers, primarily consisting of personnel costs. We expect these expenses to increase in absolute dollars in the future as we expand our domestic and international Customer Care teams due to increases in total customers. We expect Customer Care expenses to fluctuate as a percentage of total revenue depending on the level of personnel required to support the continued growth of our business.
|
|
Year Ended December 31,
|
2017 to 2016
|
2016 to 2015
|
||||||||||||||||||||||
|
|
2017
|
2016
|
2015
|
$ change
|
% change
|
$ change
|
% change
|
||||||||||||||||||
|
Customer care
|
$
|
292.3
|
|
$
|
242.1
|
|
$
|
221.5
|
|
$
|
50.2
|
|
21
|
%
|
$
|
20.6
|
|
9
|
%
|
||||||
2017
compared to
2016
.
Customer care expenses increased
$50.2 million
, or
20.7%
, from
$242.1 million
in
2016
to
$292.3 million
in
2017
. The increase was primarily driven by headcount additions to support the continued growth of our business and our international expansion as well as our acquisition of HEG.
2016
compared to
2015
. Customer care expenses increased
$20.6 million
, or
9.3%
, from
$221.5 million
in
2015
to
$242.1 million
in
2016
. The increase was primarily driven by the continued growth of our business as well as increased costs associated with the continued expansion of our international third-party Customer Care locations.
64
General and administrative
General and administrative expenses primarily consist of personnel costs for our administrative functions, professional service fees, office rent for all locations, all employee travel expenses, acquisition-related expenses and other general costs. We expect general and administrative expenses to increase in absolute dollars in the future as a result of our overall growth, increased personnel costs and public company expenses.
In 2015, general and administrative expenses include
$29.7 million
of additional expenses related to certain payments made following the completion of the IPO, including
$26.7 million
paid to the Sponsors in connection with the termination of the transaction and monitoring fee agreement and
$3.0 million
paid to Bob Parsons in connection with the termination of the executive chairman services agreement. Following these payments, we were no longer obligated to make future payments under either of these agreements.
|
|
Year Ended December 31,
|
2017 to 2016
|
2016 to 2015
|
||||||||||||||||||||||
|
|
2017
|
2016
|
2015
|
$ change
|
% change
|
$ change
|
% change
|
||||||||||||||||||
|
General and administrative
|
$
|
282.4
|
|
$
|
221.2
|
|
$
|
219.7
|
|
$
|
61.2
|
|
28
|
%
|
$
|
1.5
|
|
1
|
%
|
||||||
2017
compared to
2016
.
General and administrative expenses increased
$61.2 million
, or
27.7%
, from
$221.2 million
in
2016
to
$282.4 million
in
2017
. The increase was primarily due to our acquisition and integration of HEG, increased professional service fees primarily associated with our debt financings and the sale of PlusServer, increased compensation-related costs associated with the continued growth of our business as well as an increase in indirect tax accruals associated with our international operations.
2016
compared to
2015
. General and administrative expenses increased
$1.5 million
, or
0.7%
, from
$219.7 million
in
2015
to
$221.2 million
in
2016
. Excluding the termination payments discussed above, general and administrative expenses increased $31.2 million, or 16.4%, from $190.0 million in 2015 to $221.2 million in 2016. This increase was primarily due to increased compensation-related costs driven by increased average headcount associated with the continued growth of our business as well as increased acquisition-related expenses.
Depreciation and amortization
Depreciation and amortization expenses consist of charges relating to the depreciation of the property and equipment used in our operations and the amortization of acquired intangible assets. Depreciation and amortization may increase or decrease in absolute dollars in future periods depending on our future level of capital investments in hardware and other equipment as well as amortization expense associated with future acquisitions.
|
|
Year Ended December 31,
|
2017 to 2016
|
2016 to 2015
|
||||||||||||||||||||||
|
|
2017
|
2016
|
2015
|
$ change
|
% change
|
$ change
|
% change
|
||||||||||||||||||
|
Depreciation and amortization
|
$
|
205.8
|
|
$
|
160.1
|
|
$
|
158.8
|
|
$
|
45.7
|
|
29
|
%
|
$
|
1.3
|
|
1
|
%
|
||||||
2017
compared to
2016
.
Depreciation and amortization expenses increased
$45.7 million
, or
28.5%
, from
$160.1 million
in
2016
to
$205.8 million
in
2017
. This increase primarily results from the finite-lived intangible assets and property and equipment acquired as part of our acquisition of HEG in April 2017.
2016
compared to
2015
. There were no material changes in depreciation and amortization expense.
Interest expense
|
|
Year Ended December 31,
|
2017 to 2016
|
2016 to 2015
|
||||||||||||||||||||||
|
|
2017
|
2016
|
2015
|
$ change
|
% change
|
$ change
|
% change
|
||||||||||||||||||
|
Interest expense
|
$
|
83.0
|
|
$
|
57.2
|
|
$
|
69.2
|
|
$
|
25.8
|
|
45
|
%
|
$
|
(12.0
|
)
|
(17
|
)%
|
||||||
2017
compared to
2016
.
Interest expense increased
$25.8 million
, or
45.1%
, from
$57.2 million
in
2016
to
$83.0 million
in
2017
. The increase was primarily driven by additional interest from the Acquisition Term Loan entered into in April
65
2017 to finance a portion of our acquisition of HEG, partially offset by interest savings resulting from the refinancing of our debt in February and November 2017 as well as the benefit from our cross-currency and interest rate swaps.
2016
compared to
2015
. Interest expense decreased
$12.0 million
, or
17.3%
, from
$69.2 million
in
2015
to
$57.2 million
in
2016
, primarily driven by interest savings resulting from our repayment of a
$300.0 million
senior note to YAM in April 2015.
Loss on debt extinguishment
In 2017, we recognized a $7.3 million loss on debt extinguishment related to the refinancings of our term loans and the August 2017 prepayment of the Bridge Loan. See Note
10
to our consolidated financial statements for additional discussion.
In
April 2015
, we recognized a
$21.4 million
loss on debt extinguishment as a result of the repayment of a senior note to YAM, which consisted of prepayment premium of
$13.5 million
and the write-off of
$7.9 million
of unamortized original issue discount and deferred debt issuance costs.
Liquidity and Capital Resources
Overview
Other than the receipt of proceeds from our IPO in
April 2015
, our principal sources of liquidity have been cash flow generated from operations, long-term debt borrowings and stock option exercises. Our principal uses of cash have been to fund operations, acquisitions and capital expenditures, as well as make interest payments and mandatory principal payments on our long-term debt. We have also used our cash to repurchase LLC Units and make distributions to holders of LLC Units.
In general, we seek to deploy our capital in a systematically prioritized manner focusing first on requirements for operations, then on growth investments, and finally on equity holder returns. Our strategy is to deploy capital from any potential source, whether debt, equity or internally generated cash, depending on the adequacy and availability of the source of capital and which source may be used most efficiently and at the lowest cost at such time. Therefore, while cash from operations is our primary source of operating liquidity and we believe our internally-generated cash flows are sufficient to support our day-to-day operations, we may use a variety of capital sources to fund our needs for less predictable investment decisions such as strategic acquisitions and share repurchases.
We have incurred significant long-term debt, as described below, to fund acquisitions and for our working capital needs. As a result of our debt, we are limited as to how we conduct our business and we may be unable to raise additional debt or equity financing to compete effectively or to take advantage of new business opportunities, strategic acquisitions or share repurchases. However, the restrictions under our debt agreements are subject to a number of qualifications and may be amended with lender consent.
We believe our existing cash and cash equivalents and internally-generated cash flows will be sufficient to meet our anticipated operating cash needs for at least the next 12 months. However, our future capital requirements will depend on many factors including our growth rate, the timing and extent of spending to support domestic and international development efforts, continued brand development and advertising spend, the expansion of Customer Care and general and administrative activities, the introduction of new and enhanced product offerings, the costs to support new and replacement capital equipment, the completion of strategic acquisitions or share repurchases. Should we pursue additional strategic acquisitions or share repurchases, we may need to raise additional capital, which may be in the form of additional long-term debt or equity financings.
Acquisition of HEG
On April 3, 2017, we completed the acquisition of HEG, as described in Note
3
to our consolidated financial statements, for €1.7 billion. The acquisition was financed using the Acquisition Term Loan and the Bridge Loan, both of which are discussed below.
Credit Facility
Our Credit Facility consists of the Term Loan and the Acquisition Term Loan, both maturing on February 15, 2024, and the Revolving Credit Loan maturing on February 15, 2022. See further discussion of the Credit Facility in Note
10
to our consolidated financial statements.
66
The Credit Facility is subject to customary fees for loan facilities of this type, including a commitment fee on the Revolving Credit Loan. The term loans are required to be repaid in quarterly installments of
0.25%
of the original principal, with the balance due at maturity. The term loans must be repaid with proceeds from certain asset sales and debt issuances and with a portion of our excess cash flow, up to
50.0%
, depending on our net leverage ratio. The Credit Facility is guaranteed by all of our material domestic subsidiaries and is secured by substantially all of our and such subsidiaries' real and personal property.
The Credit Facility contains covenants restricting, among other things, our ability, or the ability of our subsidiaries, to incur indebtedness, issue certain types of equity, incur liens, enter into fundamental changes including mergers and consolidations, sell assets, make restricted payments including dividends, distributions and investments, prepay junior indebtedness and engage in operations other than in connection with acting as a holding company, subject to customary exceptions. The refinanced Revolving Credit Loan also contains a financial covenant requiring us to maintain a maximum net leverage ratio of
5.75:1.00
when our usage exceeds
35.0
% of the maximum capacity. The net leverage ratio is calculated as the ratio of first lien secured debt less cash and cash equivalents to consolidated EBITDA (as defined in the Credit Facility). As of
December 31, 2017
, we were in compliance with all such covenants and had no amounts drawn on the Revolving Credit Loan.
As further discussed in Note
11
to our consolidated financial statements, we have hedged a portion of our long-term debt through the use of cross-currency and interest rate swap derivative instruments. These instruments help us manage and mitigate our risk of exposure to changes in foreign currency exchange rates and interest rates. See "Quantitative and Qualitative Disclosures About Market Risk" for additional discussion of our hedging activities.
Bridge Loan and Sale of PlusServer
On April 3, 2017, we entered into the Bridge Loan to finance a portion of the HEG acquisition, as described in Note
10
to our consolidated financial statements. In connection with the acquisition, we committed to a formal plan to sell PlusServer as its business model differs from ours, and therefore its operating results are reported within discontinued operations. The terms of the Bridge Loan required that, in the event of a sale or other disposition of PlusServer, 100% of the net cash proceeds from such sale or disposition be used to prepay the Bridge Loan. As described in Note
4
to our consolidated financial statements, on August 31, 2017, we sold all of the outstanding shares of PlusServer, receiving net proceeds of
$447.7 million
. As a result of the sale, we recorded a gain on disposal of
$33.2 million
, which is included in discontinued operations. The proceeds, in combination with an additional
$148.9 million
of our existing cash and cash equivalents, were used to prepay the Bridge Loan in its entirety. Following this prepayment, the underlying bridge credit agreement was canceled. In addition, we have recorded an income tax liability of approximately
€19.0 million
owed under German income tax laws as a result of the sale. We expect to pay this tax in 2018.
Secondary Offerings and LLC Unit Repurchase
As discussed in Note
6
to our consolidated financial statements, we have completed several underwritten public offerings in which certain stockholders, including the Sponsors, YAM and certain of our executive officers sold shares of our Class A common stock. We did not receive any proceeds from the shares sold by the selling stockholders in these offerings. We used the net proceeds from the shares sold by us to pay expenses incurred in connection with the offerings. Each offering included the exchange of LLC Units (together with the corresponding shares of Class B common stock) for Class A common stock by the selling stockholders, which resulted in increases in additional paid-in capital, with offsetting reductions in non-controlling interests, and material increases to the liability under the TRAs.
In May 2017, we repurchased 7.3 million LLC units from the Sponsors and YAM for an aggregate of
$275.0 million
, or $37.44 per share, which is the same per share price, net of discounts and commissions, paid by the underwriters to the selling stockholders in the offering. In connection with this repurchase, the corresponding shares of Class B common stock held by the Sponsors and YAM were canceled. The repurchase did not result in an incremental liability under the TRAs; however, it did increase the per unit basis of the remaining LLC Units held by each of the selling stockholders. This results in a deferral of the recording of the liability under the TRAs until the future exchange of LLC Units by such selling stockholders.
Tax Cuts and Jobs Act of 2017
On
December 22, 2017
, the Tax Cuts and Jobs Act of 2017 was signed into law making significant changes to the Internal Revenue Code, including a U.S. federal corporate tax rate decrease from
35%
to
21%
effective for tax years beginning after
December 31, 2017
. This rate decrease resulted in an
$86.2 million
reduction in the liability under the TRAs, as described in Note
15
to our consolidated financial statements, and a
$7.9 million
net benefit for income taxes, as described in Note
14
to our consolidated financial statements.
67
Tax Receivable Agreements
As described in "Critical Accounting Policies and Estimates—Payable to Related Parties Pursuant to the TRAs," we are a party to five TRAs. As of
December 31, 2017
, the liability under the TRAs was
$153.0 million
, as described in Note
15
to our consolidated financial statements. We currently do not expect to begin making payments related to the existing liability under the TRAs until
2021
.
We may record additional liabilities under the TRAs when LLC Units are exchanged in the future and as our estimates of the future utilization of the tax attributes, NOLs and other tax benefits change. We expect to make payments under the TRAs, to the extent they are required, within 150 days after our U.S. federal income tax return is filed for each fiscal year. Interest on such payments will begin to accrue from the due date (without extensions) of such tax return at a rate equal to the one-year LIBOR plus 100 basis points. Under the TRAs, to avoid interest charges, we have the right, but not the obligation, to make TRA payments in advance of the date the payments are otherwise due.
Because we are a holding company with no operations, we rely on Desert Newco to provide us with funds necessary to meet any financial obligations. If we do not have sufficient funds to pay TRA, tax or other liabilities or to fund our operations (as a result of Desert Newco's inability to make distributions to us due to various limitations and restrictions or as a result of the acceleration of our obligations under the TRAs), we may have to borrow funds and thus our liquidity and financial condition could be materially and adversely affected. To the extent we are unable to make payments under the TRAs for any reason, such payments will be deferred and will accrue interest at a rate equal to one-year LIBOR plus 500 basis points until paid.
Tax Distributions to Desert Newco's Owners
Tax distributions are required under the terms of Desert Newco's limited liability company agreement. Any required payments are calculated each quarter based on a number of variables, including Desert Newco's taxable income or loss, allocations of taxable income among Desert Newco's owners based on principles detailed within the Treasury Regulations, tax deductions for stock option exercises and vested RSUs and changing ownership percentages among Desert Newco's owners. In addition, under the tax rules, Desert Newco is required to allocate taxable income disproportionately to its unit holders. Because tax distributions are determined based on the holder of LLC Units who is allocated the largest amount of cumulative taxable income on a per unit basis, but are made pro rata based on ownership, Desert Newco is required to make tax distributions that, in the aggregate, will likely exceed the amount of taxes Desert Newco would have otherwise paid.
During 2017 and 2016, Desert Newco paid total distributions of
$10.0 million
and
$18.4 million
, respectively, as discussed in Note
18
to our consolidated financial statements. Distributions paid in 2015 were not material. An accrual for tax distributions was not required at
December 31, 2017
.
Cash Flows
The following table summarizes our cash flows for the periods indicated:
|
|
Year Ended December 31,
|
||||||||||
|
|
2017
|
2016
|
2015
|
||||||||
|
Net cash provided by operating activities
|
$
|
475.6
|
|
$
|
386.5
|
|
$
|
259.2
|
|
||
|
Net cash used in investing activities
|
(1,570.1
|
)
|
(183.4
|
)
|
(144.4
|
)
|
|||||
|
Net cash provided by financing activities
|
1,107.5
|
|
15.1
|
|
94.4
|
|
|||||
|
Effect of exchange rate changes on cash and cash equivalents
|
3.6
|
|
(0.1
|
)
|
(0.2
|
)
|
|||||
|
Net increase in cash and cash equivalents
|
$
|
16.6
|
|
$
|
218.1
|
|
$
|
209.0
|
|
||
Operating Activities
Our primary source of cash from operating activities has been cash collections from our customers. We expect cash inflows from operating activities to be primarily affected by increases in total bookings. Our primary uses of cash from operating activities have been for domain registration costs paid to registries, personnel costs, discretionary marketing and advertising costs, technology and development costs and interest payments. We expect cash outflows from operating activities to be affected by the timing of payments we make to registries and increases in personnel and other operating costs as we continue to grow our business and increase our international presence.
68
Net cash provided by operating activities increased
$89.1 million
from
$386.5 million
in
2016
to
$475.6 million
in
2017
, primarily resulting from our bookings growth and the contribution from HEG.
Net cash provided by operating activities increased
$127.3 million
from
$259.2 million
in
2015
to
$386.5 million
in
2016
, driven by our bookings growth and a reduction in interest payments primarily resulting from the repayment of a senior note to YAM in April 2015.
Investing Activities
Our investing activities primarily consist of strategic acquisitions and purchases of property and equipment related to growth in our data centers and to support the overall growth of our business and our increased international presence. We expect our investing cash flows to be affected by the timing of payments we make for capital expenditures and the strategic acquisition or other growth opportunities we decide to pursue.
Net cash used in investing activities increased
$1,386.7 million
from
$183.4 million
in
2016
to
$1,570.1 million
in
2017
. This increase was primarily due to a
$1,758.4 million
increase in business acquisitions, a
$50.7 million
increase in purchases of intangible assets and a
$21.7 million
increase in capital expenditures, partially offset by
$447.7 million
in net proceeds received from the sale of PlusServer in August 2017.
Net cash used in investing activities increased
$39.0 million
from
$144.4 million
in
2015
to
$183.4 million
in
2016
. This increase was primarily due to a $53.8 million increase in business acquisitions and a $5.7 million increase in capital expenditures, partially offset by $23.5 million of intangible assets purchased in 2015.
Financing Activities
Excluding our IPO proceeds, our financing activities primarily consist of long-term debt borrowings, repurchases of LLC Units from the Sponsors and YAM, the repayment of principal on long-term debt, stock option activity and the payment of tax distributions to holders of LLC Units.
Net cash provided by financing activities increased
$1,092.4 million
from
$15.1 million
in
2016
to
$1,107.5 million
in
2017
. The increase was driven by net proceeds from the issuance of the Acquisition Term Loan and Bridge Loan of
$1,421.4 million
and
$531.7 million
, respectively, and
$22.9 million
related to sales of Class A common stock in
2017
. These inflows were offset by the
$596.6 million
prepayment of the Bridge Loan in August 2017, $275.0 million of LLC Unit repurchases in May 2017 and
$39.7 million
in payments of financing-related costs associated with our debt financings in
2017
.
Net cash provided by financing activities decreased
$79.3 million
from
$94.4 million
in 2015 to
$15.1 million
in
2016
. This decrease was primarily due to the receipt of net IPO proceeds of $482.4 million in 2015 and an $18.0 million increase in tax distribution payments, partially offset by the repayment of long-term debt of $375.0 million in 2015, the payment of debt extinguishment fees of $13.5 million in 2015 and a $35.8 million increase in proceeds received from stock option and warrant exercises and our employee stock purchase plan.
Deferred Revenue
Deferred revenue consists of sales of products not yet recognized as revenue at the end of a period. Deferred revenue as of
December 31, 2017
was
$1,861.6 million
, and is expected to be recognized as revenue as follows:
|
2018
|
2019
|
2020
|
2021
|
2022
|
Thereafter
|
Total
|
|||||||||||||||||||||
|
Domains
|
$
|
638.5
|
|
$
|
174.1
|
|
$
|
70.3
|
|
$
|
40.9
|
|
$
|
22.6
|
|
$
|
33.4
|
|
$
|
979.8
|
|
||||||
|
Hosting and presence
|
444.7
|
|
120.2
|
|
42.0
|
|
11.2
|
|
5.1
|
|
4.7
|
|
627.9
|
|
|||||||||||||
|
Business applications
|
181.6
|
|
47.2
|
|
16.7
|
|
4.8
|
|
2.1
|
|
1.5
|
|
253.9
|
|
|||||||||||||
|
$
|
1,264.8
|
|
$
|
341.5
|
|
$
|
129.0
|
|
$
|
56.9
|
|
$
|
29.8
|
|
$
|
39.6
|
|
$
|
1,861.6
|
|
|||||||
69
Contractual Obligations
The following table summarizes our material contractual obligations and commitments as of
December 31, 2017
:
|
Payments due by period
|
|||||||||||||||
|
1 year
|
2-3 years
|
4-5 years
|
5+ years
|
||||||||||||
|
Long-term debt, including current maturities
(1)
|
$
|
25.0
|
|
$
|
50.0
|
|
$
|
50.0
|
|
$
|
2,357.3
|
|
|||
|
Interest on long-term debt
(2)
|
95.8
|
|
188.9
|
|
184.7
|
|
102.3
|
|
|||||||
|
Lease financing obligation
(3)
|
3.2
|
|
6.7
|
|
7.2
|
|
8.4
|
|
|||||||
|
Operating leases
(4)
|
28.8
|
|
42.1
|
|
27.1
|
|
41.7
|
|
|||||||
|
Capital leases
(5)
|
5.1
|
|
4.6
|
|
—
|
|
—
|
|
|||||||
|
Service agreements
(6)
|
27.6
|
|
23.6
|
|
6.8
|
|
1.3
|
|
|||||||
|
TRA payments
(7)
|
—
|
|
—
|
|
40.7
|
|
112.3
|
|
|||||||
|
(1)
|
See Note
10
to our consolidated financial statements for information regarding the terms of our long-term debt agreements.
|
|
(2)
|
Interest on long-term debt excludes both the amortization of deferred debt issuance costs and original issue discount and the expected benefits associated with our interest rate swap. Interest on our variable rate debt is calculated using the rate in effect at December 31, 2017.
|
|
(3)
|
See Note
12
to our consolidated financial statements for information regarding the terms of our lease financing obligation.
|
|
(4)
|
We lease office and data center space (including commitments for specified levels of power) under non-cancelable operating leases expiring at various dates through
March 2028
.
|
|
(5)
|
We lease certain computer equipment and software under capital leases. The lease payments above include the amounts representing interest.
|
|
(6)
|
We have long-term agreements with certain vendors to provide for software and equipment maintenance, specified levels of bandwidth and other services.
|
|
(7)
|
Reflects the estimated timing of TRA payments as of
December 31, 2017
. Such payments could be due later than estimated depending on the timing of our use of the underlying tax attributes. As of
December 31, 2017
, we have recorded a liability of
$153.0 million
payable to the related parties under the TRAs, reflecting limitations on the use of the favorable tax attributes due to limitations of taxable income. The estimated amounts payable under the TRAs do not consider any future exchanges of LLC Units, which will have a material impact on this liability. See "Risk Factors-Risks Related to Our Company and Our Organizational Structure" and Note
15
to our audited consolidated financial statements for additional information regarding our liability under the TRAs.
|
Off-Balance Sheet Arrangements
As of
December 31, 2017
and
2016
, we had no off-balance sheet arrangements that had, or which are reasonably likely to have, a material effect on our consolidated financial statements.
Critical Accounting Policies and Estimates
We prepare our consolidated financial statements in accordance with GAAP, and in doing so, we have to make estimates, assumptions and judgments affecting the reported amounts of assets, liabilities, revenues and expenses, as well as the related disclosure of contingent assets and liabilities. We base our estimates, assumptions and judgments on historical experience and on various other factors we believe to be reasonable under the circumstances, and we evaluate these estimates, assumptions and judgments on an ongoing basis. Different assumptions and judgments would change the estimates used in the preparation of our consolidated financial statements, which, in turn, could change our results from those reported. We refer to estimates, assumptions and judgments of this type as our critical accounting policies and estimates, which we discuss further below. We review our critical accounting policies and estimates with the audit committee of our board of directors on an annual basis.
See Note
2
to our consolidated financial statements for a summary of our significant accounting policies.
Revenue Recognition
We recognize revenue over the period during which products or services are delivered to the customer. Customers are billed for products, generally in advance, based on their selected contract term. Cash received in advance of the provision of products is recorded as deferred revenue.
We commence revenue recognition when all of the following conditions are satisfied:
|
•
|
there is persuasive evidence of an arrangement;
|
|
•
|
the service has been or is being provided to the customer;
|
|
•
|
the collection of the fees is reasonably assured; and
|
70
|
•
|
the amount of fees to be paid by the customer is fixed or determinable.
|
We may sell multiple products to customers at the same time. For example, we may design a customer website and separately offer other products such as hosting and an online shopping cart, or a customer may combine a domain registration with other products such as private registration or email. Revenue arrangements with multiple deliverables are divided into separate units of accounting if each deliverable has stand-alone value to the customer. The majority of our revenue arrangements consist of multiple-element arrangements, with revenue for each unit of accounting recognized as the product or service is delivered to the customer.
Consideration is allocated to each deliverable at the inception of an arrangement based on relative selling prices. We determine the relative selling price for each deliverable based on our vendor-specific objective evidence of selling price (VSOE), if available, or our best estimate of selling price (BESP), if VSOE is not available. We establish VSOE for certain of our products when a consistent number of stand-alone sales of these products have been priced within a reasonably narrow range. We are unable to establish VSOE when we lack pricing consistency, primarily related to our marketing strategies and variability in pricing due to promotional activity.
Our process for determining BESP requires judgment and considers multiple factors that may vary over time depending upon the unique facts and circumstances related to each deliverable. For products where VSOE is not available, we determine BESP by considering our overall pricing objectives and market conditions. Significant factors taken into consideration include historical and expected discounting practices, the size, volume and term length of transactions, customer demographics, the geographic areas in which our products are sold and our overall go-to-market strategy.
We have determined third-party evidence of selling price (TPE) is not a practical alternative due primarily to the significant variability among available third-party pricing information for similar products and differences in the features of our product offerings compared to other parties.
We sell our products directly to customers and also through a network of resellers. In certain cases, we act as a reseller of products provided by others. The determination of gross or net revenue recognition is reviewed on a product by product basis and is dependent on whether we act as principal or agent in the transaction.
We maintain a reserve to provide for refunds granted to customers. Our reserve is an estimate based on historical refund experience. Refunds reduce deferred revenue at the time they are granted and result in a reduced amount of revenue recognized over the contract term of the applicable product compared to the amount originally expected. Our annual refund rate has ranged from
7.2%
to
6.5%
of total bookings from
2015
to
2017
.
See Notes
2
and
8
to our consolidated financial statements for additional information regarding revenue recognition and deferred revenue, including discussion regarding the impact of the new revenue recognition standard, which we will adopt effective
January 1, 2018
.
Equity-Based Compensation
Our equity-based awards are comprised of options and restricted stock units (RSUs) and are accounted for using the fair value method. We grant options at exercise prices equal to the fair market value of our Class A common stock as reported on the NYSE on the date of grant. We measure and recognize compensation expense for equity-based awards made to employees and directors based on the grant date fair values of the awards. RSUs are measured based on the fair market value of the underlying common stock on the date of grant. For options with service or performance-based vesting conditions, the grant date fair value is estimated using the Black-Scholes option-pricing model, which requires management to make assumptions and apply judgment in determining the grant date fair value.
The most significant assumptions and judgments include estimating the expected option term, the expected stock price volatility and the risk-free interest rates. The assumptions used in our option pricing model represent management's best estimates. If factors change and different assumptions are used, our equity-based compensation expense could be materially different in the future.
In addition to the above assumptions, we also estimate a forfeiture rate for our awards, which is based on an analysis of historical forfeitures. We will continue to evaluate the appropriateness of the forfeiture rate based on our actual forfeiture experience, analysis of employee turnover and other factors. Changes in our estimated forfeiture rate can have a significant impact on our equity-based compensation expense since the cumulative effect of adjusting the forfeiture rate is recognized in the
71
period in which the estimate is changed. If a revised forfeiture rate is higher than the previously estimated forfeiture rate, an adjustment is made resulting in a decrease to the equity-based compensation expense previously recognized. If a revised forfeiture rate is lower than the previously estimated forfeiture rate, an adjustment is made resulting in an increase to the equity-based compensation expense previously recognized.
On a quarterly basis, we estimate when and if performance-based awards will be earned. Equity-based compensation expense is recognized only for awards considered probable of being earned. The grant date fair value of each award ultimately expected to vest is recognized as equity-based compensation expense, net of estimated forfeitures, over the requisite service period.
We will continue to use judgment in evaluating the assumptions related to our equity-based awards on a prospective basis. As we continue to accumulate additional data related to our awards, we may refine our estimates, which could materially impact our future equity-based compensation expense.
See Notes
2
and
7
to our consolidated financial statements for additional information regarding equity-based compensation.
Business Combinations
We include the results of operations of acquired businesses in our consolidated financial statements as of the respective dates of acquisition. Accounting for business combinations requires us to make significant estimates and assumptions, especially at the acquisition date, with respect to tangible and intangible assets acquired, liabilities assumed and pre-acquisition contingencies. The purchase price of acquisitions, including estimates of the fair value of contingent consideration when applicable, is allocated to the tangible and intangible assets acquired and the liabilities assumed based on their estimated fair values on the respective acquisition dates, with the excess recorded as goodwill. We use our best estimates and assumptions to assign fair value to the tangible and intangible assets acquired and liabilities assumed at the acquisition date. The estimates are inherently uncertain and subject to refinement. We continue to collect information and reevaluate these estimates and assumptions quarterly and record any qualifying adjustments to the preliminary estimates to goodwill provided we are within the measurement period. Contingent consideration is adjusted to fair value in subsequent periods as an increase or decrease in general and administrative expenses. Acquisition-related costs are expensed as incurred.
See Notes
2
and
3
to our consolidated financial statements for additional information regarding business combinations.
Goodwill and Indefinite-Lived Intangible Assets
We make estimates, assumptions and judgments when valuing goodwill and other intangible assets in connection with the initial purchase price allocations of our acquisitions, as well as when evaluating the recoverability of our goodwill and other intangible assets on an ongoing basis. We assess our goodwill and indefinite-lived intangible assets for impairment at least annually during the fourth quarter. We will also perform an assessment at other times if and when events or changes in circumstances indicate the carrying value of these assets may not be recoverable.
We first make a qualitative assessment of whether it is more-likely-than-not our single reporting unit's fair value is less than its carrying value to determine whether it is necessary to perform a quantitative impairment test. The qualitative assessment includes considering various factors including macroeconomic conditions, industry and market conditions and our historical and projected operating results. We are only required to perform the quantitative test if our qualitative assessment determines our single reporting unit's fair value is not greater than its carrying value. We may elect to perform the quantitative test without considering such qualitative factors.
Our qualitative analyses during
2017
,
2016
and
2015
did not indicate any impairment of our goodwill and indefinite-lived intangible assets, and accordingly, no impairment was recorded. As of
December 31, 2017
, we believe such assets are recoverable; however, there can be no assurances these assets will not be impaired in future periods. Any future impairment charges could adversely impact our results of operations.
See Notes
2
and
5
to our consolidated financial statements for additional information regarding goodwill and indefinite-lived intangible assets.
72
Income Taxes
We are subject to U.S. federal, state and foreign income taxes. We are a controlling member in Desert Newco, which has been, and will continue to be, treated as a partnership for U.S. income tax purposes. Under these provisions, Desert Newco is considered a pass-through entity and generally does not pay income taxes on its taxable income in most jurisdictions. Instead, Desert Newco's members, of which we are one, are liable for income taxes based on their taxable income. Desert Newco is liable for income taxes in certain foreign jurisdictions, in those states not recognizing its pass-through status and for certain subsidiaries not taxed as pass-through entities. We have acquired the outstanding stock of various entities taxed as corporations, which are now wholly-owned by us or our subsidiaries. Where required or allowed, these subsidiaries file and pay tax as a consolidated group for U.S. federal and state income tax purposes and internationally, primarily within the United Kingdom and Germany. We anticipate this structure to remain in existence for the foreseeable future.
We account for income taxes under the asset and liability method, which requires the recognition of DTAs and DTLs for the expected future tax consequences of events included in the financial statements. Under this method, we determine DTAs and DTLs on the basis of the differences between the financial statements and tax bases of assets and liabilities by using enacted tax rates in effect for the year in which the differences are expected to reverse. The effect of a change in tax rates on DTAs and DTLs is recognized in income in the period in which the enactment date occurs.
We recognize DTAs to the extent we believe these assets are more-likely-than-not to be realized. In making such a determination, we consider all available positive and negative evidence, including future reversals of existing taxable temporary differences, projected future taxable income, tax planning strategies and recent results of operations.
We recognize tax benefits from uncertain tax positions only if it is more-likely-than-not the tax position will be sustained on examination by the taxing authorities based on the technical merits of the position. The tax benefits recognized from such positions are measured based on the largest benefit having a greater than
50
% likelihood of being realized upon ultimate settlement.
See Notes
2
and
14
to our consolidated financial statements for additional information regarding income taxes.
Payable to Related Parties Pursuant to the TRAs
We are a party to five TRAs. Under four of these agreements, we are generally required to pay to certain pre-IPO owners approximately
85%
of the amount of calculated tax savings, if any, we are deemed to realize (using the actual applicable U.S. federal income tax rate and an assumed combined state and local income tax rate) as a result of (1) any existing tax attributes associated with LLC Units acquired in the pre-IPO organizational transactions, the benefit of which is allocable to us as a result of such transactions (including the allocable share of Desert Newco's existing tax basis in its assets), (2) NOLs available as a result of the such transactions and (3) tax benefits related to imputed interest.
Under the fifth of these agreements, we are generally required to pay our other pre-IPO owners approximately
85%
of the amount of the calculated tax savings, if any, we are deemed to realize (using the actual applicable U.S. federal income tax rate and an assumed combined state and local income tax rate) as a result of (1) any step-up in tax basis created as a result of exchanges of their LLC Units (together with the corresponding shares of Class B common stock) for shares of our Class A common stock, (2) any existing tax attributes associated with their LLC Units, the benefit of which is allocable to us as a result of such exchanges (including the allocable share of Desert Newco's existing tax basis in its assets), (3) tax benefits related to imputed interest and (4) payments under the TRA.
The TRAs allow our pre-IPO owners to transfer their rights under the TRAs to third parties, who would then succeed to the rights of our pre-IPO owners under the TRAs. In the event of such a transfer, we would be required to make the payments described above to the new TRA parties in accordance with the terms of the TRAs.
When LLC Units are exchanged, we receive certain tax attributes, including the OBAs created from the original acquisition of the LLC Units plus any anticipated basis adjustments. The OBAs entitle us to the depreciation and amortization previously allocable to the original owner of such units. The anticipated basis adjustments will increase, for tax purposes, our depreciation and amortization deductions. To the extent these deductions are used to reduce our taxable income, thereby resulting in actual tax savings, we will be required to pay the original owners approximately
85%
of such savings, which is recorded as an additional liability under the TRAs. This increase in tax basis also creates additional DTAs and may also decrease gains, or increase losses, on future dispositions of certain assets to the extent tax basis is allocated to those assets.
73
For purposes of calculating the income tax savings we are deemed to realize under the TRAs, we will calculate the federal income tax savings using the actual applicable U.S. federal income tax rate and will calculate the state and local income tax savings using
5%
for the assumed combined state and local tax rate, which represents an approximation of our combined state and local income tax rate, net of federal income tax benefits.
The term of the TRAs commenced upon the completion of our IPO and will continue until all such tax benefits have been utilized or expire, unless we exercise our rights to terminate the agreements or payments under the agreements are accelerated in the event we materially breach any of our material obligations under the agreements.
In the pre-IPO reorganization transactions, we received certain tax attributes, including the OBAs and NOL carryforwards, from certain of our pre-IPO owners, which entitle us to the depreciation and amortization previously allocable to such parties. These deductions are allowed prior to the utilization of any NOL or tax credit carryforwards against income taxes.
Based on current projections of taxable income, and before deduction of any specially allocated depreciation and amortization, we anticipate having enough taxable income to utilize a portion of these specially allocated deductions related to the OBAs. Accordingly, as of
December 31, 2017
and
2016
, our liability under the TRAs was
$153.0 million
and
$202.6 million
, respectively.
The projection of future taxable income involves significant judgment. Actual taxable income may differ from our estimates, which could significantly impact the liability under the TRAs. We have determined it is more-likely-than-not we will be unable to utilize all of our DTAs subject to TRAs; therefore, we have not recorded a liability under the TRAs related to the tax savings we may realize from the utilization of NOL carryforwards and the amortization related to basis adjustments under Code Section 754 created by exchanges of LLC Units, including those associated with secondary offerings. If utilization of these DTAs becomes more-likely-than-not in the future, at such time, we will record liabilities under the TRAs of up to an additional
$559.5 million
as a result of basis adjustments under Code Section 754 and up to an additional
$224.4 million
related to the utilization of NOL and credit carryforwards, which will be recorded through charges to our statements of operations. However, if the tax attributes are not utilized in future years, it is reasonably possible no amounts would be paid under the TRAs. In this scenario, the reduction of the liability under the TRAs would result in a benefit to our statements of operations.
See Notes
2
and
15
to our consolidated financial statements for additional information regarding the payable to related parties pursuant to the TRAs.
The TRAs are subject to a number of risks and uncertainties. For a description of these risks, see "Risk Factors—Risks Related to Our Company and Our Organizational Structure."
Indirect Taxes
We are subject to indirect taxation in some, but not all, of the various states and foreign jurisdictions in which we and our subsidiaries conduct business. Laws and regulations attempting to subject communications and commerce conducted over the Internet to various indirect taxes are becoming more prevalent, both in the U.S. and internationally, and may impose additional burdens on us in the future. Increased regulation could negatively affect our business directly, as well as the businesses of our customers. Taxing authorities may impose indirect taxes on the Internet-related revenue we generate based on regulations currently being applied to similar, but not directly comparable, industries. There are many transactions and calculations where the ultimate indirect tax determination is uncertain. In addition, domestic and international indirect taxation laws, or interpretations thereof, are subject to change. We may be audited in the future, which could result in changes to our indirect tax estimates. We continually evaluate those jurisdictions in which nexus exists, and believe we maintain adequate indirect tax accruals.
As of
December 31, 2017
, our accrual for estimated indirect tax liabilities was
$18.8 million
, reflecting our best estimate of the probable liability, based on an analysis of our business activities, revenues subject to indirect taxes and applicable regulations. Although we believe our indirect tax estimates and associated liabilities are reasonable, the final determination of indirect tax audits, litigation or settlements could be materially different than the amounts established for indirect tax contingencies. Due to the complexity and uncertainty surrounding indirect tax laws in certain international locations, we believe it is reasonably possible, based on currently available information and analysis, that we may incur additional losses related to indirect taxes, which management estimates to be within the range of
$0
to
$10.0 million
as of
December 31, 2017
.
See Note
12
to our consolidated financial statements for additional information regarding indirect taxes.
74
Loss Contingencies
We are subject to the possibility of various loss contingencies arising from uncertain and unresolved matters in the ordinary course of business and from events or actions by others having the potential to result in a future loss. Such contingencies may include, but are not limited to, intellectual property claims, labor and employment claims, breach of contract claims, regulatory proceedings, product service level commitments and losses resulting from other events and developments. We consider the likelihood of loss, the impairment of an asset or the incurrence of a liability, as well as our ability to reasonably estimate the amount of loss, in determining loss contingencies.
When a loss is considered probable and reasonably estimable, we record a liability in the amount of our best estimate for the ultimate loss. When there appears to be a range of possible costs with equal likelihood, a liability is recorded based on the low-end of such range. However, the likelihood of a loss with respect to a particular contingency is often difficult to predict and determining a meaningful estimate of the loss or a range of loss may not be practicable based on the information available and the potential effect of future events and decisions by third parties impacting the ultimate resolution of the contingency. It is also not uncommon for such matters to be resolved over many years, during which time relevant developments and new information must be continuously evaluated to determine both the likelihood of potential loss and whether it is possible to reasonably estimate a range of possible loss. When a loss is probable but a reasonable estimate cannot be made, disclosure is provided.
Disclosure is also provided when it is reasonably possible a loss will be incurred, or when it is reasonably possible the amount of a loss will exceed the recorded amounts. We regularly review all contingencies to determine whether the likelihood of loss has changed and to assess whether a reasonable estimate of the loss or range of loss can be made. As discussed above, development of a meaningful estimate of loss, or a range of potential loss, is complex when the outcome is directly dependent on negotiations with, or decisions by, third parties such as regulatory agencies, court systems in various jurisdictions and other interested parties. Such factors bear directly on whether it is possible to reasonably estimate a range of potential loss and boundaries of high and low estimates.
See Note
12
to our consolidated financial statements for additional information regarding loss contingencies.
Recent Accounting Pronouncements
See Note
2
to our consolidated financial statements for information regarding recent accounting pronouncements.
75
We are exposed to market risk in the ordinary course of business. Market risk represents the risk of loss that may impact our financial position due to adverse changes in financial market prices and rates. Our market risk exposure is primarily a result of fluctuations in foreign currency exchange rates and variable interest rates. Consequently, we may employ policies and procedures to mitigate such risks, including the use of derivative financial instruments. We do not enter into derivative transactions for speculative or trading purposes.
As a result of the use of derivative instruments, we are exposed to the risk that counterparties to our contracts may fail to meet their contractual obligations. To mitigate such counterparty credit risk, we enter into contracts only with carefully selected financial institutions based upon ongoing evaluations of their creditworthiness. As a result, we do not believe we are exposed to any undue concentration of counterparty risk with respect to our derivative contracts as of December 31, 2017.
Foreign Currency Risk
We manage our exposure to changes in foreign currency exchange rates through the use of foreign exchange forward contracts and cross-currency swap contracts. See Note
11
to our consolidated financial statements for a summary of the notional amounts and fair values of our foreign currency exchange and cross-currency swap contracts.
Foreign Exchange Forward Contracts
A portion of our bookings, revenue and operating expenses is denominated in foreign currencies, which are subject to exchange rate fluctuations. Our most significant foreign currency exposures are the Euro, the British pound, the Indian rupee, the Canadian dollar and the Australian dollar. Our reported bookings, revenues and operating results may be impacted by fluctuations in foreign currency exchange rates. Fluctuations in foreign currency exchange rates may also cause us to recognize transaction gains and losses in our consolidated statements of operations; however, to date, such amounts have not been material. With our acquisition of HEG, and as our international operations continue to grow, our exposure to fluctuations in currency rates will increase, which may increase the costs associated with this growth. During
2017
, our total bookings growth in constant currency would have been approximately
20
basis points higher and our total revenue growth would have been approximately
30
basis points higher. Constant currency is calculated by translating bookings and revenue for each month in the current period using the foreign currency exchange rate for the corresponding month in the prior period, excluding any hedging gains or losses realized during the period.
We utilize foreign exchange forward contracts to manage the volatility of our bookings and revenue related to foreign currency transactions. These forward contracts reduce, but do not eliminate, the impact of adverse currency exchange rate fluctuations. We designate these forward contracts as cash flow hedges for accounting purposes. Changes in the intrinsic value of these hedges are recorded as a component of AOCI. Gains and losses, once realized, are recorded as a component of AOCI and are amortized to revenue over the same period in which the underlying hedged amounts are recognized. At
December 31, 2017
, the total notional amount of such contracts was
$241.3 million
, all having remaining maturities of
twelve months
or less, and the realized and unrealized loss included in accumulated other comprehensive income totaled $6.3 million.
Cross-Currency Swap Contract
In order to manage variability due to movements in foreign currency rates related to a Euro-denominated intercompany loan, we entered into a five-year Cross-Currency Swap in April 2017. The Cross-Currency Swap, which matures on April 3, 2022, had a notional amount of
€1,234.0 million
at
December 31, 2017
and converts the fixed rate Euro-denominated interest and principal receipts on the intercompany loan into fixed U.S. dollar interest and principal receipts. The Cross-Currency Swap, which is designated as a cash flow hedge and recognized as an asset or liability at fair value, effectively creates a fixed-rate U.S. dollar intercompany loan from a fixed rate Euro-denominated intercompany loan, thereby reducing our exposure to foreign currency fluctuations between the Euro and U.S. dollar. Changes to the fair value of our Cross-Currency Swap due to changes in the value of the U.S. dollar relative to the Euro would be largely offset by the net change in the fair values of the underlying hedged items.
Interest Rate Sensitivity
Interest rate risk reflects our exposure to movements in interest rates associated with our variable-rate debt. Total borrowings under our Credit Facility were
$2,482.3 million
as of
December 31, 2017
. These borrowings bear interest at a rate equal to, at our option, either (a) LIBOR plus
2.25%
per annum or (b)
1.25%
per annum plus the highest of (i) the Federal Funds Rate plus
0.5%
, (ii) the Prime Rate or (iii) one-month LIBOR plus
1.0%
.
76
In April 2017, in connection with the closing of the Acquisition Term Loan, we entered into a five-year pay-fixed rate, receive-floating rate interest rate swap arrangement to effectively convert a portion of the variable-rate debt to fixed. The interest rate swap, the notional amount of which was
$1,315.5 million
at
December 31, 2017
, matures on April 3, 2022 and swaps the variable interest rate on our LIBOR-based borrowings for a fixed rate of 5.44%. The objective of the interest rate swap, which is designated as a cash flow hedge, is to manage the variability of cash flows in the interest payments related to the portion of the variable-rate debt designated as being hedged.
For the balance of our long-term debt not subject to the Interest Rate Swap, the effect of a hypothetical 10% change in interest rates would not have had a material impact on our interest expense.
.
77
|
Index to Consolidated Financial Statements
|
|
|
Page
|
|
78
Report of Independent Registered Public Accounting Firm
To the Stockholders and the Board of Directors of GoDaddy Inc.
Opinion on the Financial Statements
We have audited the accompanying consolidated balance sheets of GoDaddy Inc. (the Company) as of
December 31, 2017
and
2016
, and the related consolidated statements of operations, comprehensive income (loss), stockholders'/members' equity, and cash flows for each of the three years in the period ended
December 31, 2017
, and the related notes (collectively referred to as the "financial statements"). In our opinion, the financial statements present fairly, in all material respects, the consolidated financial position of the Company at
December 31, 2017
and
2016
, and the consolidated results of its operations and its cash flows for each of the three years in the period ended
December 31, 2017
, in conformity with U.S. generally accepted accounting principles.
We also have audited, in accordance with the standards of the Public Company Accounting Oversight Board (United States) (PCAOB), the Company's internal control over financial reporting as of
December 31, 2017
, based on criteria established in Internal Control-Integrated Framework issued by the Committee of Sponsoring Organizations of the Treadway Commission (2013 framework) and our report dated
February 27, 2018
expressed an unqualified opinion thereon.
Basis for Opinion
These financial statements are the responsibility of the Company's management. Our responsibility is to express an opinion on the Company's financial statements based on our audits. We are a public accounting firm registered with the PCAOB and are required to be independent with respect to the Company in accordance with the U.S. federal securities laws and the applicable rules and regulations of the Securities and Exchange Commission and the PCAOB.
We conducted our audits in accordance with the standards of the PCAOB. Those standards require that we plan and perform the audit to obtain reasonable assurance about whether the financial statements are free of material misstatement, whether due to error or fraud. Our audits included performing procedures to assess the risks of material misstatement of the financial statements, whether due to error or fraud, and performing procedures that respond to those risks. Such procedures included examining, on a test basis, evidence regarding the amounts and disclosures in the financial statements. Our audits also included evaluating the accounting principles used and significant estimates made by management, as well as evaluating the overall presentation of the financial statements. We believe that our audits provide a reasonable basis for our opinion.
/s/ Ernst & Young LLP
We have served as the Company's auditor since 2004.
Phoenix, Arizona
February 27, 2018
79
GoDaddy Inc.
(In millions, except shares in thousands and per share amounts)
|
December 31,
|
|||||||
|
|
2017
|
2016
|
|||||
|
Assets
|
|||||||
|
Current assets:
|
|||||||
|
Cash and cash equivalents
|
$
|
582.7
|
|
$
|
566.1
|
|
|
|
Short-term investments
|
12.3
|
|
6.6
|
|
|||
|
Accounts and other receivables
|
18.4
|
|
8.0
|
|
|||
|
Registry deposits
|
34.7
|
|
20.6
|
|
|||
|
Prepaid domain name registry fees
|
351.5
|
|
307.0
|
|
|||
|
Prepaid expenses and other current assets
|
59.9
|
|
24.5
|
|
|||
|
Total current assets
|
1,059.5
|
|
932.8
|
|
|||
|
Property and equipment, net
|
297.9
|
|
231.0
|
|
|||
|
Prepaid domain name registry fees, net of current portion
|
180.8
|
|
172.1
|
|
|||
|
Goodwill
|
2,859.9
|
|
1,718.4
|
|
|||
|
Intangible assets, net
|
1,326.0
|
|
716.5
|
|
|||
|
Other assets
|
14.2
|
|
16.1
|
|
|||
|
Total assets
|
$
|
5,738.3
|
|
$
|
3,786.9
|
|
|
|
Liabilities and stockholders' equity
|
|||||||
|
Current liabilities:
|
|||||||
|
Accounts payable
|
$
|
59.6
|
|
$
|
61.7
|
|
|
|
Accrued expenses and other current liabilities
|
469.6
|
|
143.0
|
|
|||
|
Payable to related parties for tax distributions
|
—
|
|
10.0
|
|
|||
|
Deferred revenue
|
1,264.8
|
|
1,043.5
|
|
|||
|
Long-term debt
|
16.7
|
|
4.0
|
|
|||
|
Total current liabilities
|
1,810.7
|
|
1,262.2
|
|
|||
|
Deferred revenue, net of current portion
|
596.8
|
|
532.7
|
|
|||
|
Long-term debt, net of current portion
|
2,410.8
|
|
1,035.7
|
|
|||
|
Payable to related parties pursuant to tax receivable agreements
|
153.0
|
|
202.6
|
|
|||
|
Other long-term liabilities
|
75.0
|
|
39.5
|
|
|||
|
Deferred tax liabilities
|
145.5
|
|
—
|
|
|||
|
Commitments and contingencies
|
|
|
|||||
|
Stockholders' equity:
|
|||||||
|
Preferred stock, $0.001 par value - 50,000 shares authorized; none issued and outstanding
|
—
|
|
—
|
|
|||
|
Class A common stock, $0.001 par value - 1,000,000 shares authorized; 132,993 and 88,558 shares issued and outstanding as of December 31, 2017 and 2016, respectively
|
0.1
|
|
0.1
|
|
|||
|
Class B common stock, $0.001 par value - 500,000 shares authorized; 35,006 and 78,554 shares issued and outstanding as of December 31, 2017 and 2016, respectively
|
—
|
|
0.1
|
|
|||
|
Additional paid-in capital
|
484.4
|
|
608.3
|
|
|||
|
Retained earnings (accumulated deficit)
|
87.7
|
|
(48.7
|
)
|
|||
|
Accumulated other comprehensive income (loss)
|
(85.7
|
)
|
2.7
|
|
|||
|
Total stockholders' equity attributable to GoDaddy Inc.
|
486.5
|
|
562.5
|
|
|||
|
Non-controlling interests
|
60.0
|
|
151.7
|
|
|||
|
Total stockholders' equity
|
546.5
|
|
714.2
|
|
|||
|
Total liabilities and stockholders' equity
|
$
|
5,738.3
|
|
$
|
3,786.9
|
|
|
See accompanying notes to consolidated financial statements.
80
GoDaddy Inc.
(In millions, except shares in thousands and per share amounts)
|
|
Year Ended December 31,
|
||||||||||
|
|
2017
|
2016
|
2015
|
||||||||
|
Revenue:
|
|||||||||||
|
Domains
|
$
|
1,057.2
|
|
$
|
927.8
|
|
$
|
840.8
|
|
||
|
Hosting and presence
|
847.9
|
|
678.7
|
|
592.0
|
|
|||||
|
Business applications
|
326.8
|
|
241.4
|
|
174.5
|
|
|||||
|
Total revenue
|
2,231.9
|
|
1,847.9
|
|
1,607.3
|
|
|||||
|
Costs and operating expenses
(1)
:
|
|||||||||||
|
Cost of revenue (excluding depreciation and amortization)
|
775.5
|
|
657.8
|
|
565.9
|
|
|||||
|
Technology and development
|
355.8
|
|
287.8
|
|
270.2
|
|
|||||
|
Marketing and advertising
|
253.2
|
|
228.8
|
|
202.2
|
|
|||||
|
Customer care
|
292.3
|
|
242.1
|
|
221.5
|
|
|||||
|
General and administrative
|
282.4
|
|
221.2
|
|
219.7
|
|
|||||
|
Depreciation and amortization
|
205.8
|
|
160.1
|
|
158.8
|
|
|||||
|
Total costs and operating expenses
|
2,165.0
|
|
1,797.8
|
|
1,638.3
|
|
|||||
|
Operating income (loss)
|
66.9
|
|
|
50.1
|
|
(31.0
|
)
|
||||
|
Interest expense
|
(83.0
|
)
|
(57.2
|
)
|
(69.2
|
)
|
|||||
|
Loss on debt extinguishment
|
(7.3
|
)
|
—
|
|
(21.4
|
)
|
|||||
|
Tax receivable agreements liability adjustment
|
123.2
|
|
(12.5
|
)
|
—
|
|
|||||
|
Other income (expense), net
|
7.0
|
|
(1.9
|
)
|
1.0
|
|
|||||
|
Income (loss) from continuing operations before income taxes
|
106.8
|
|
|
(21.5
|
)
|
|
(120.6
|
)
|
|||
|
Benefit (provision) for income taxes
|
18.9
|
|
(0.4
|
)
|
0.2
|
|
|||||
|
Income (loss) from continuing operations
|
125.7
|
|
(21.9
|
)
|
(120.4
|
)
|
|||||
|
Income from discontinued operations, net of income taxes (includes $33.2 gain on disposal, net of tax)
|
14.1
|
|
—
|
|
—
|
|
|||||
|
Net income (loss)
|
139.8
|
|
(21.9
|
)
|
(120.4
|
)
|
|||||
|
Less: net income (loss) attributable to non-controlling interests
|
3.4
|
|
(5.4
|
)
|
(44.8
|
)
|
|||||
|
Net income (loss) attributable to GoDaddy Inc.
|
$
|
136.4
|
|
$
|
(16.5
|
)
|
$
|
(75.6
|
)
|
||
|
Net income (loss) attributable to GoDaddy Inc. per share of Class A common stock—basic
(2)
:
|
|||||||||||
|
Continuing operations
|
$
|
1.17
|
|
$
|
(0.21
|
)
|
$
|
(0.81
|
)
|
||
|
Discontinued operations
|
0.08
|
|
—
|
|
—
|
|
|||||
|
Net income (loss) attributable to GoDaddy Inc.
|
$
|
1.25
|
|
$
|
(0.21
|
)
|
$
|
(0.81
|
)
|
||
|
Net income (loss) attributable to GoDaddy Inc. per share of Class A common stock—diluted
(2)
:
|
|||||||||||
|
Continuing operations
|
$
|
0.71
|
|
$
|
(0.21
|
)
|
$
|
(0.81
|
)
|
||
|
Discontinued operations
|
0.08
|
|
—
|
|
—
|
|
|||||
|
Net income (loss) attributable to GoDaddy Inc.
|
$
|
0.79
|
|
$
|
(0.21
|
)
|
$
|
(0.81
|
)
|
||
|
Weighted-average shares of Class A common stock outstanding
(2)
:
|
|||||||||||
|
Basic
|
108,779
|
|
79,835
|
|
58,676
|
|
|||||
|
Diluted
|
177,054
|
|
79,835
|
|
58,676
|
|
|||||
|
___________________________
|
|||||||||||
|
(1)
Costs and operating expenses include equity-based compensation expense as follows:
|
|||||||||||
|
Technology and development
|
$
|
37.1
|
|
$
|
23.2
|
|
$
|
18.2
|
|
||
|
Marketing and advertising
|
7.3
|
|
8.1
|
|
6.1
|
|
|||||
|
Customer care
|
3.6
|
|
3.9
|
|
2.9
|
|
|||||
|
General and administrative
|
28.4
|
|
21.6
|
|
13.2
|
|
|||||
(2)
Amounts for periods prior to our
April 1, 2015
initial public offering have been retrospectively adjusted to give effect to the organizational transactions described in Note
1
. The prior period amounts do not consider the
26,000
shares of Class A common stock sold in our initial public offering. See Note
16
.
See accompanying notes to consolidated financial statements.
81
GoDaddy Inc.
Consolidated Statements of Comprehensive Income (Loss)
(In millions)
|
Year Ended December 31,
|
|||||||||||
|
2017
|
2016
|
2015
|
|||||||||
|
Net income (loss)
|
139.8
|
|
(21.9
|
)
|
(120.4
|
)
|
|||||
|
Foreign exchange forward contracts gain (loss)
|
(9.3
|
)
|
(0.4
|
)
|
3.4
|
|
|||||
|
Unrealized swap gain (loss), net
|
(39.2
|
)
|
—
|
|
—
|
|
|||||
|
Change in foreign currency translation adjustment
|
(86.5
|
)
|
(0.1
|
)
|
—
|
|
|||||
|
Comprehensive income (loss)
|
4.8
|
|
|
(22.4
|
)
|
|
(117.0
|
)
|
|||
|
Less: comprehensive income (loss) attributable to non-controlling interests
|
(43.2
|
)
|
—
|
|
—
|
|
|||||
|
Comprehensive income (loss) attributable to GoDaddy Inc.
|
$
|
48.0
|
|
|
$
|
(22.4
|
)
|
|
$
|
(117.0
|
)
|
See accompanying notes to consolidated financial statements.
82
GoDaddy Inc.
Consolidated Statements of Stockholders'/Members' Equity
(In millions, except shares in thousands)
|
Members'
Equity
|
Class A Common Stock
|
Class B Common Stock
|
Additional
Paid-in
Capital
|
Retained Earnings (Accumulated
Deficit)
|
Accumulated Other Comprehensive Income (Loss)
|
Non-
Controlling
Interests
|
Total Stockholders'
Equity
|
||||||||||||||||||||||||||||||
|
Shares
|
Amount
|
Shares
|
Amount
|
||||||||||||||||||||||||||||||||||
|
Balance at December 31, 2014
|
$
|
410.4
|
|
—
|
|
$
|
—
|
|
—
|
|
$
|
—
|
|
$
|
—
|
|
$
|
—
|
|
$
|
—
|
|
$
|
—
|
|
$
|
—
|
|
|||||||||
|
Net loss
|
(43.4
|
)
|
—
|
|
—
|
|
—
|
|
—
|
|
—
|
|
(32.2
|
)
|
—
|
|
(44.8
|
)
|
(77.0
|
)
|
|||||||||||||||||
|
Equity-based compensation expense
|
8.7
|
|
—
|
|
—
|
|
—
|
|
—
|
|
31.7
|
|
—
|
|
—
|
|
—
|
|
31.7
|
|
|||||||||||||||||
|
Effect of the pre-IPO organizational transactions
|
(375.9
|
)
|
38,826
|
|
0.1
|
|
90,425
|
|
0.1
|
|
61.6
|
|
—
|
|
—
|
|
314.1
|
|
375.9
|
|
|||||||||||||||||
|
Issuance of Class A common stock in initial public offering, net of offering costs
|
—
|
|
26,000
|
|
—
|
|
—
|
|
—
|
|
480.6
|
|
—
|
|
—
|
|
—
|
|
480.6
|
|
|||||||||||||||||
|
Liability pursuant to the tax receivable agreements resulting from the pre-IPO organizational transactions
|
—
|
|
—
|
|
—
|
|
—
|
|
—
|
|
(151.6
|
)
|
—
|
|
—
|
|
—
|
|
(151.6
|
)
|
|||||||||||||||||
|
Stock option exercises and other
|
0.2
|
|
1,582
|
|
—
|
|
(27
|
)
|
—
|
|
20.8
|
|
—
|
|
3.2
|
|
(14.1
|
)
|
9.9
|
|
|||||||||||||||||
|
Issuance of Class A common stock under employee stock purchase plan
|
—
|
|
675
|
|
—
|
|
—
|
|
—
|
|
11.5
|
|
—
|
|
—
|
|
—
|
|
11.5
|
|
|||||||||||||||||
|
Balance at December 31, 2015
|
—
|
|
67,083
|
|
0.1
|
|
90,398
|
|
0.1
|
|
454.6
|
|
(32.2
|
)
|
3.2
|
|
255.2
|
|
681.0
|
|
|||||||||||||||||
|
Net loss
|
—
|
|
—
|
|
—
|
|
—
|
|
—
|
|
—
|
|
(16.5
|
)
|
—
|
|
(5.4
|
)
|
(21.9
|
)
|
|||||||||||||||||
|
Equity-based compensation expense
|
—
|
|
—
|
|
—
|
|
—
|
|
—
|
|
56.8
|
|
—
|
|
—
|
|
—
|
|
56.8
|
|
|||||||||||||||||
|
Stock option exercises
|
—
|
|
9,187
|
|
—
|
|
—
|
|
—
|
|
114.8
|
|
—
|
|
—
|
|
(59.8
|
)
|
55.0
|
|
|||||||||||||||||
|
Effect of exchanges of LLC Units
|
—
|
|
11,844
|
|
—
|
|
(11,844
|
)
|
—
|
|
15.3
|
|
—
|
|
—
|
|
(15.3
|
)
|
—
|
|
|||||||||||||||||
|
Liability pursuant to the tax receivable agreements resulting from exchanges of LLC Units
|
—
|
|
—
|
|
—
|
|
—
|
|
—
|
|
(38.5
|
)
|
—
|
|
—
|
|
—
|
|
(38.5
|
)
|
|||||||||||||||||
|
Distributions to holders of LLC Units
|
—
|
|
—
|
|
—
|
|
—
|
|
—
|
|
—
|
|
—
|
|
—
|
|
(23.0
|
)
|
(23.0
|
)
|
|||||||||||||||||
|
Issuance of Class A common stock under employee stock purchase plan
|
—
|
|
202
|
|
—
|
|
—
|
|
—
|
|
5.0
|
|
—
|
|
—
|
|
—
|
|
5.0
|
|
|||||||||||||||||
|
Other
|
—
|
|
242
|
|
—
|
|
—
|
|
—
|
|
0.3
|
|
—
|
|
(0.5
|
)
|
—
|
|
(0.2
|
)
|
|||||||||||||||||
|
Balance at December 31, 2016
|
—
|
|
88,558
|
|
0.1
|
|
78,554
|
|
0.1
|
|
608.3
|
|
(48.7
|
)
|
2.7
|
|
151.7
|
|
714.2
|
|
|||||||||||||||||
83
GoDaddy Inc.
Consolidated Statements of Stockholders'/Members' Equity (continued)
(In millions, except shares in thousands)
|
Members'
Equity
|
Class A Common Stock
|
Class B Common Stock
|
Additional
Paid-in
Capital
|
Retained Earnings (Accumulated
Deficit)
|
Accumulated Other Comprehensive Income (Loss)
|
Non-
Controlling
Interests
|
Total Stockholders'
Equity
|
||||||||||||||||||||||||||||||
|
Shares
|
Amount
|
Shares
|
Amount
|
||||||||||||||||||||||||||||||||||
|
Net income
|
—
|
|
—
|
|
—
|
|
—
|
|
—
|
|
—
|
|
136.4
|
|
—
|
|
3.4
|
|
139.8
|
|
|||||||||||||||||
|
Equity-based compensation expense
|
—
|
|
—
|
|
—
|
|
—
|
|
—
|
|
76.4
|
|
—
|
|
—
|
|
—
|
|
76.4
|
|
|||||||||||||||||
|
Sales of Class A common stock
|
—
|
|
721
|
|
—
|
|
—
|
|
—
|
|
21.3
|
|
—
|
|
—
|
|
—
|
|
21.3
|
|
|||||||||||||||||
|
Stock option exercises
|
—
|
|
6,000
|
|
—
|
|
—
|
|
—
|
|
80.9
|
|
—
|
|
—
|
|
(19.8
|
)
|
61.1
|
|
|||||||||||||||||
|
Issuance of Class A common stock under employee stock purchase plan
|
—
|
|
572
|
|
—
|
|
—
|
|
—
|
|
17.4
|
|
—
|
|
—
|
|
—
|
|
17.4
|
|
|||||||||||||||||
|
Repurchases of LLC Units
|
—
|
|
—
|
|
—
|
|
(7,345
|
)
|
—
|
|
(275.0
|
)
|
—
|
|
—
|
|
—
|
|
(275.0
|
)
|
|||||||||||||||||
|
Effect of exchanges of LLC Units
|
—
|
|
36,203
|
|
—
|
|
(36,203
|
)
|
(0.1
|
)
|
28.7
|
|
—
|
|
—
|
|
(28.7
|
)
|
(0.1
|
)
|
|||||||||||||||||
|
Liability pursuant to the tax receivable agreements resulting from exchanges of LLC Units
|
—
|
|
—
|
|
—
|
|
—
|
|
—
|
|
(73.6
|
)
|
—
|
|
—
|
|
—
|
|
(73.6
|
)
|
|||||||||||||||||
|
Gain (loss) on swaps and foreign currency hedging, net
|
—
|
|
—
|
|
—
|
|
—
|
|
—
|
|
—
|
|
—
|
|
(48.5
|
)
|
—
|
|
(48.5
|
)
|
|||||||||||||||||
|
Change in foreign currency translation adjustment
|
—
|
|
—
|
|
—
|
|
—
|
|
—
|
|
—
|
|
—
|
|
(86.5
|
)
|
—
|
|
(86.5
|
)
|
|||||||||||||||||
|
Accumulated other comprehensive income (loss) attributable to non-controlling interests
|
—
|
|
—
|
|
—
|
|
—
|
|
—
|
|
—
|
|
—
|
|
46.6
|
|
(46.6
|
)
|
—
|
|
|||||||||||||||||
|
Vesting of restricted stock units
|
—
|
|
939
|
|
—
|
|
—
|
|
—
|
|
—
|
|
—
|
|
—
|
|
—
|
|
—
|
|
|||||||||||||||||
|
Balance at December 31, 2017
|
$
|
—
|
|
132,993
|
|
$
|
0.1
|
|
35,006
|
|
$
|
—
|
|
|
$
|
484.4
|
|
|
$
|
87.7
|
|
|
$
|
(85.7
|
)
|
|
$
|
60.0
|
|
|
$
|
546.5
|
|
||||
See accompanying notes to consolidated financial statements.
84
|
|
Year Ended December 31,
|
||||||||||
|
|
2017
|
2016
|
2015
|
||||||||
|
Operating activities
|
|||||||||||
|
Net income (loss)
|
$
|
139.8
|
|
$
|
(21.9
|
)
|
$
|
(120.4
|
)
|
||
|
Adjustments to reconcile net income (loss) to net cash provided by operating activities:
|
|||||||||||
|
Depreciation and amortization
|
205.8
|
|
160.1
|
|
158.8
|
|
|||||
|
Equity-based compensation
|
76.4
|
|
56.8
|
|
40.4
|
|
|||||
|
Loss on debt extinguishment
|
7.3
|
|
—
|
|
21.4
|
|
|||||
|
Deferred taxes
|
(34.5
|
)
|
(3.8
|
)
|
(3.0
|
)
|
|||||
|
Tax receivable agreements liability adjustment
|
(123.2
|
)
|
12.5
|
|
—
|
|
|||||
|
Domain portfolio cost of revenue
|
4.4
|
|
10.7
|
|
3.7
|
|
|||||
|
Gain on sale of PlusServer
|
(33.2
|
)
|
—
|
|
—
|
|
|||||
|
Other
|
8.9
|
|
9.8
|
|
8.0
|
|
|||||
|
Changes in operating assets and liabilities, net of amounts acquired:
|
|||||||||||
|
Registry deposits
|
(10.1
|
)
|
(1.9
|
)
|
(0.9
|
)
|
|||||
|
Prepaid domain name registry fees
|
(13.5
|
)
|
(22.8
|
)
|
(30.7
|
)
|
|||||
|
Accounts payable
|
(8.4
|
)
|
19.6
|
|
13.5
|
|
|||||
|
Accrued expenses and other current liabilities
|
32.6
|
|
10.0
|
|
9.5
|
|
|||||
|
Deferred revenue
|
220.0
|
|
160.8
|
|
165.6
|
|
|||||
|
Other operating assets and liabilities
|
3.3
|
|
(3.4
|
)
|
(6.7
|
)
|
|||||
|
Net cash provided by operating activities
|
475.6
|
|
386.5
|
|
259.2
|
|
|||||
|
Investing activities
|
|||||||||||
|
Purchases of short-term investments
|
(28.3
|
)
|
(10.5
|
)
|
(7.3
|
)
|
|||||
|
Maturities of short-term investments
|
22.6
|
|
8.4
|
|
5.8
|
|
|||||
|
Business acquisitions, net of cash acquired
|
(1,876.9
|
)
|
(118.5
|
)
|
(64.7
|
)
|
|||||
|
Purchases of intangible assets
|
(52.0
|
)
|
(1.3
|
)
|
(23.5
|
)
|
|||||
|
Proceeds received from sale of PlusServer
|
447.7
|
|
—
|
|
—
|
|
|||||
|
Purchases of property and equipment
|
(83.2
|
)
|
(61.5
|
)
|
(55.8
|
)
|
|||||
|
Other investing activities, net
|
—
|
|
—
|
|
1.1
|
|
|||||
|
Net cash used in investing activities
|
(1,570.1
|
)
|
(183.4
|
)
|
(144.4
|
)
|
|||||
|
Financing activities
|
|||||||||||
|
Proceeds received from:
|
|||||||||||
|
Acquisition Term Loan
|
1,421.4
|
|
—
|
|
—
|
|
|||||
|
Bridge Loan
|
531.7
|
|
—
|
|
—
|
|
|||||
|
Sales of Class A common stock, net of expenses
|
22.9
|
|
—
|
|
482.4
|
|
|||||
|
Option and warrant exercises
|
61.1
|
|
55.0
|
|
12.7
|
|
|||||
|
Issuance of Class A common stock under employee stock purchase plan
|
17.4
|
|
5.0
|
|
11.5
|
|
|||||
|
Payments made for:
|
|||||||||||
|
Repurchases of LLC Units and distributions to holders of LLC Units
|
(285.0
|
)
|
(18.8
|
)
|
(0.8
|
)
|
|||||
|
Repayment of Bridge Loan
|
(596.6
|
)
|
—
|
|
—
|
|
|||||
|
Repayment of term loans
|
(15.3
|
)
|
(11.0
|
)
|
(11.0
|
)
|
|||||
|
Repayment of senior note
|
—
|
|
—
|
|
(300.0
|
)
|
|||||
|
Repayment of revolving credit loan
|
—
|
|
—
|
|
(75.0
|
)
|
|||||
|
Financing-related costs
|
(39.7
|
)
|
—
|
|
(13.5
|
)
|
|||||
|
Capital leases and other financing obligations
|
(10.4
|
)
|
(15.1
|
)
|
(11.9
|
)
|
|||||
|
Net cash provided by financing activities
|
1,107.5
|
|
15.1
|
|
94.4
|
|
|||||
|
Effect of exchange rate changes on cash and cash equivalents
|
3.6
|
|
(0.1
|
)
|
(0.2
|
)
|
|||||
|
Net increase in cash and cash equivalents
|
16.6
|
|
218.1
|
|
209.0
|
|
|||||
|
Cash and cash equivalents, beginning of period
|
566.1
|
|
348.0
|
|
139.0
|
|
|||||
|
Cash and cash equivalents, end of period
|
$
|
582.7
|
|
$
|
566.1
|
|
$
|
348.0
|
|
||
85
|
|
Year Ended December 31,
|
||||||||||
|
|
2017
|
2016
|
2015
|
||||||||
|
Supplemental cash flow information:
|
|||||||||||
|
Cash paid during the period for:
|
|||||||||||
|
Interest on long-term debt, net of swap benefit
|
$
|
88.3
|
|
$
|
46.5
|
|
$
|
59.1
|
|
||
|
Income taxes, net of refunds received
|
$
|
16.6
|
|
$
|
4.0
|
|
$
|
2.3
|
|
||
|
Supplemental information for non-cash investing and financing activities:
|
|||||||||||
|
Acquisition date fair value of contingent consideration
|
$
|
11.6
|
|
$
|
5.6
|
|
$
|
0.9
|
|
||
|
Accrued capital expenditures at period end
|
$
|
7.4
|
|
$
|
13.1
|
|
$
|
5.0
|
|
||
|
Property and equipment acquired under capital leases
|
$
|
6.3
|
|
$
|
7.1
|
|
$
|
11.1
|
|
||
See accompanying notes to consolidated financial statements.
86
GoDaddy Inc.
Notes to Consolidated Financial Statements
(In millions, except shares in thousands and per share amounts)
1.
Organization and Background
Description of Business
We are a leading technology provider to small businesses, web design professionals and individuals, delivering simple, easy-to-use cloud-based products and outcome-driven, personalized customer care. We operate the world's largest domain marketplace and provide website building, hosting and security tools to help customers easily construct and protect their online presence and tackle the rapidly-changing technology landscape. As our customers grow, we provide applications helping them connect to their customers, manage and grow their businesses and get found online.
Organization
Following the completion of our initial public offering (IPO) and other related organizational transactions in
2015
, we became the sole managing member of Desert Newco, LLC and its subsidiaries (Desert Newco). As a result, we consolidate its financial results and report non-controlling interests representing the economic interests held by its other members. Non-controlling interests exclude any net income (loss) attributable directly to GoDaddy Inc. We owned approximately
79%
of Desert Newco's outstanding limited liability company units (LLC Units) as of
December 31, 2017
.
The pre-IPO organizational transactions were considered transactions between entities under common control. As a result, the financial statements for periods prior to the IPO have been adjusted to combine the previously separate entities for presentation purposes. See Note
6
.
On
December 16, 2011
, investment funds managed by Kohlberg Kravis Roberts & Co. L.P. (KKR), Silver Lake Partners (Silver Lake) and Technology Crossover Ventures (TCV, and collectively with KKR and Silver Lake, the Sponsors) along with
87
other investors purchased a controlling interest in Desert Newco from YAM Special Holdings, Inc. (YAM), an entity owned by Robert R. Parsons (Bob Parsons), Desert Newco's founder and a member of our board of directors.
Basis of Presentation
Our consolidated financial statements have been prepared in accordance with generally accepted accounting principles in the United States (GAAP), and include our accounts and the accounts of our subsidiaries. All material intercompany accounts and transactions have been eliminated in consolidation.
Prior Period Reclassifications
Reclassifications of certain immaterial prior period amounts have been made to conform to the current period presentation.
Use of Estimates
GAAP requires us to make estimates and assumptions affecting amounts reported in our financial statements. Our more significant estimates include:
|
•
|
the determination of the best estimate of selling price of the deliverables included in multiple-deliverable revenue arrangements;
|
|
•
|
the fair value of assets acquired and liabilities assumed in business acquisitions;
|
|
•
|
the assessment of recoverability of long-lived assets, including property and equipment, goodwill and intangible assets;
|
|
•
|
the estimated reserve for refunds;
|
|
•
|
the estimated useful lives of intangible and depreciable assets;
|
|
•
|
the grant date fair value of equity-based awards;
|
|
•
|
the fair value of financial instruments;
|
|
•
|
the recognition, measurement and valuation of current and deferred income taxes;
|
|
•
|
the recognition and measurement of amounts payable under tax receivable agreements (TRAs) or as tax distributions to Desert Newco's owners; and
|
|
•
|
the recognition and measurement of loss contingencies, indirect tax liabilities and certain accrued liabilities.
|
We periodically evaluate these estimates and adjust prospectively, if necessary. We believe our estimates and assumptions are reasonable; however, actual results may differ from our estimates.
Segment and Reporting Unit
As of December 31, 2017, our chief operating decision maker function was comprised of our Chief Executive Officer and Chief Operating Officer who collectively review financial information presented on a consolidated basis for purposes of allocating resources and evaluating financial performance for the entire company. Accordingly, we have
a single
operating segment and reporting unit.
2.
Summary of Significant Accounting Policies
Cash and Cash Equivalents
Cash and cash equivalents includes cash on hand, other highly liquid investments purchased with a remaining maturity of
90
days or less at the date of acquisition and receivables related to third-party payment processor transactions normally received within
72
hours. Amounts receivable for payment processor transactions totaled
$26.9 million
and $
15.5 million
at
December 31, 2017
and
2016
, respectively.
88
Short-Term Investments
Our short-term investments consist of certificates of deposit, time deposits and commercial paper with a remaining maturity in excess of
90
days at the date of acquisition, which are carried at fair value. The estimated fair value of our short-term investments is determined based on quoted market prices and approximated historical cost. We did not have any material realized or unrealized gains or losses on sales of short-term investments during any of the periods presented.
We classify our short-term investments as available-for-sale at the time of purchase and reevaluate such classification at each balance sheet date. We may sell our short-term investments at any time for use in current operations or for other purposes, such as consideration for acquisitions, even if they have not yet reached maturity. As a result, we classify our short-term investments, including investments with maturities beyond
12
months, as current assets.
Registry Deposits
Registry deposits represent amounts on deposit with, or receivable from, various domain name registries to be used by us to make payments for future domain registrations or renewals.
Prepaid Domain Name Registry Fees
Prepaid domain name registry fees represent amounts charged by a registry at the time a domain is registered or renewed. These amounts are amortized to cost of revenue over the same period revenue is recognized for the related domain registration contracts.
Property and Equipment
Property and equipment is stated at cost. Depreciation, including for assets acquired under capital leases, is recorded over the shorter of the estimated useful life or the lease term of the applicable assets using the straight-line method beginning on the date an asset is placed in service. We regularly evaluate the estimated remaining useful lives of our property and equipment to determine whether events or changes in circumstances warrant a revision to the remaining period of depreciation. Maintenance and repairs are charged to expense as incurred.
Property and equipment consisted of the following:
|
|
Estimated
Useful Lives
|
December 31,
|
||||||||
|
|
2017
|
2016
|
||||||||
|
Computer equipment
|
3 years
|
$
|
355.0
|
|
$
|
283.3
|
|
|||
|
Software
|
3 years
|
33.9
|
|
27.3
|
|
|||||
|
Land
|
Indefinite
|
9.0
|
|
9.0
|
|
|||||
|
Buildings, including improvements
|
5-40 years
|
147.4
|
|
123.1
|
|
|||||
|
Building acquired under lease financing obligation
|
40 years
|
18.1
|
|
18.1
|
|
|||||
|
Leasehold improvements
|
Lesser of useful life or remaining lease term
|
60.6
|
|
36.1
|
|
|||||
|
Other
|
1-20 years
|
22.0
|
|
12.1
|
|
|||||
|
Total property and equipment
|
646.0
|
|
509.0
|
|
||||||
|
Less: accumulated depreciation and amortization
|
(348.1
|
)
|
(278.0
|
)
|
||||||
|
Property and equipment, net
|
$
|
297.9
|
|
$
|
231.0
|
|
||||
The gross carrying amount of property and equipment includes
$31.5 million
and
$34.8 million
of computer equipment and software under capital leases as of
December 31, 2017
and
2016
, respectively. The accumulated depreciation of the leased assets was
$22.4 million
and
$23.8 million
as of
December 31, 2017
and
2016
, respectively.
Depreciation and amortization expense related to property and equipment, including amounts related to assets under capital leases, was
$88.8 million
,
$69.9 million
and
$61.3 million
during
2017
,
2016
and
2015
, respectively.
89
Capitalized Internal-Use Software Costs
Costs incurred to develop software for internal-use during the application development phase and for our websites are capitalized and amortized over such software's estimated useful life. Costs related to the design or maintenance of internal-use software are included in technology and development expenses as incurred. Costs capitalized during all periods presented have not been material.
Goodwill and Indefinite-Lived Intangible Assets
Goodwill represents the excess of the purchase price over the estimated fair value of net tangible and identifiable intangible assets acquired in business combinations. Indefinite-lived intangible assets consist of the GoDaddy trade names and branding acquired from YAM and our acquired domain portfolio. Goodwill and indefinite-lived intangible assets are not amortized to earnings, but are assessed for impairment at least annually. As individual domains are sold, our indefinite-lived domain portfolio intangible asset is reduced by the allocated carrying cost of each domain, which is included in cost of revenue.
We assess impairment annually for our single reporting unit and our indefinite-lived trade names and branding during the fourth quarter of each year. We also perform an assessment at other times if events or changes in circumstances indicate the carrying value of the assets may not be recoverable. If, based on qualitative analysis, we determine it is more-likely-than-not the fair value of our reporting unit is less than its carrying amount, a quantitative impairment test is performed. Our qualitative analysis did not indicate impairment during any of the periods presented.
Our indefinite-lived domain portfolio is reviewed for impairment annually during the fourth quarter of each year. We also perform an assessment at other times if events or changes in circumstances indicate the carrying amount of the asset may not be fully recoverable. Any identified impairment loss is treated as a permanent reduction in the carrying amount of the asset. We did not record an impairment loss during any of the periods presented.
Long-Lived and Finite-Lived Intangible Assets
Finite-lived intangible assets are amortized over the following estimated useful lives:
|
Customer relationships
|
3-9 years
|
|
Developed technology
|
5-7 years
|
|
Trade names
|
3-10 years
|
Customer relationships are primarily amortized based on expected customer attrition. Developed technology and finite-lived trade names are amortized on a straight-line basis. We regularly evaluate the estimated remaining useful lives of our intangible assets to determine whether events or changes in circumstances warrant a revision to the remaining period of amortization.
Long-lived and finite-lived intangible assets are reviewed for impairment whenever events or changes in circumstances indicate the carrying amount of an asset may not be fully recoverable. An impairment loss is recognized if the sum of the expected long-term undiscounted cash flows the asset is expected to generate is less than its carrying amount. Any write-downs are treated as permanent reductions in the carrying amount of the respective asset. We did not record an impairment loss during any of the periods presented.
Debt Issuance Costs
We defer and amortize issuance costs, underwriting fees and related expenses incurred in connection with the issuance of debt instruments using the effective interest method over the terms of the respective instruments. Debt issuance costs, other than those associated with our revolving credit loan, are reflected as a direct reduction of the carrying amount of the related debt liability. Debt issuance costs related to our revolving credit loan are reflected as an asset.
Derivative Financial Instruments
We are exposed to changes in foreign currency exchange rates as well as changes in interest rates associated with our variable-rate debt. Consequently, we use derivative financial instruments to manage and mitigate such risks. We do not enter into derivative transactions for speculative or trading purposes.
90
Our derivative financial instruments include foreign exchange forward contracts with financial institutions to hedge certain forecasted sales transactions denominated in currencies other than the United States (U.S.) dollar. In addition, we have entered into an interest rate swap on a portion of our long-term debt and a cross-currency swap on our intercompany debt to manage the variability of cash flows due to movements in interest rates and foreign currency exchange rates. We have designated each of these instruments as a cash flow hedge.
We expect each derivative instrument qualifying for hedge accounting will be highly effective at reducing the risk associated with the exposure being hedged. For each derivative instrument designated as a hedge, we formally document the related risk management strategy and objective, including identification of the hedging instrument, the hedged item and the risk of exposure, as well as how hedge effectiveness will be assessed prospectively and retrospectively over the instrument's term. To assess effectiveness of our swap instruments, we use regression analysis performed utilizing the Hypothetical Derivative Method to compare the change in fair value of the derivative instrument designated as the hedging instrument to the change in the fair value of a similarly modeled hypothetical derivative using the same discount rate. Following our initial quantitative assessment, we may perform subsequent assessments on a qualitative basis unless facts and circumstances change such that we can no longer qualitatively assert that our hedges are highly effective.
We reflect unrealized gains or losses on our cash flow hedges as a component of accumulated other comprehensive income (loss) (AOCI). Gains and losses, once realized, are recorded as a component of AOCI and are amortized to earnings over the same period in which the underlying hedged amounts are recognized. At inception, and each reporting period, we evaluate the effectiveness of each of our hedges, and all hedges were determined to be effective.
Our derivative instruments are recorded at fair value on a gross basis. For cash flow reporting purposes, proceeds received or amounts paid upon the settlement of a derivative instrument are classified in the same manner as the related item being hedged, primarily within cash flows from operating activities.
Leases
We lease office and data center space in various locations. Rent expense under operating leases is recognized on a straight-line basis over the lease term taking into consideration rent abatements, scheduled rent increases and any lease incentives.
We record assets and liabilities for estimated construction costs incurred under build-to-suit lease arrangements to the extent we are involved in the construction of structural improvements or take construction risk prior to commencement of a lease. Upon completion of the construction project, we evaluate our level of continuing involvement in the facility. If we maintain significant continuing involvement, we continue to account for the facility as a financing obligation. Otherwise, we record a sale of the facility back to the landlord, and accordingly, the related construction assets and liabilities are removed from our consolidated financial statements.
Foreign Currency
Our functional and reporting currency is the U.S. dollar. Assets denominated in foreign currencies are remeasured into U.S. dollars at period-end exchange rates. Foreign currency-based revenue and expense transactions are measured at transaction date exchange rates. Foreign currency remeasurement gains and losses are recorded in other income (expense), net and were
$(1.5) million
,
$(4.6) million
and
$(3.5) million
during
2017
,
2016
and
2015
, respectively.
For certain of our foreign subsidiaries whose functional currency is other than the U.S. dollar, we translate revenue and expense transactions at average exchange rates. We translate assets and liabilities at period-end exchange rates and include foreign currency translation gains and losses as a component of AOCI.
Revenue Recognition
Revenue is recorded when persuasive evidence of an arrangement exists, delivery of the product has occurred, the selling price is fixed or determinable and collectability is reasonably assured. Payments received in advance of revenue recognition are recorded as deferred revenue. Revenue is recognized net of applicable transaction-based taxes collected from customers.
91
We maintain a reserve to provide for refunds granted to customers. Our reserve is an estimate based on historical refund experience. Refunds reduce deferred revenue at the time they are granted and result in a reduced amount of revenue recognized over the contract term of the applicable product compared to the amount originally expected.
Consideration provided to customers for sales incentives or service disruption credits is recorded as a reduction of revenue at the later of the time the related revenue is recognized or when such consideration is offered. Such incentives and credits were not material in any of the periods presented.
Revenue arrangements with multiple deliverables are divided into separate units of accounting if each deliverable has stand-alone value to the customer. The majority of our revenue arrangements consists of multiple-element arrangements, with revenue for each unit of accounting recognized as the product or service is delivered to the customer. Our multiple-element arrangements may include a combination of some or all of the following: domain registrations, website hosting products, website building products and services, website security products and other cloud-based products. Each of these products has stand-alone value and is sold separately.
Consideration is allocated to each deliverable at the inception of an arrangement based on relative selling prices. We determine the relative selling price for each deliverable based on our vendor-specific objective evidence of selling price (VSOE) or our best estimate of selling price (BESP), if VSOE is not available. We have determined third-party evidence of selling price (TPE) is not a practical alternative due primarily to the significant variability among available third-party pricing information for similar products and differences in the features of our product and service offerings compared to other parties.
We establish VSOE for certain of our products when a consistent number of stand-alone sales of these products have been priced within a reasonably narrow range. We are unable to establish VSOE when we lack pricing consistency, primarily related to our marketing strategies and variability in pricing due to promotional activity.
For products where VSOE is not available, we determine BESP by considering our overall pricing objectives and market conditions. Significant factors taken into consideration include historical and expected discounting practices, the size, volume and term length of transactions, customer demographics, the geographic areas in which our products and services are sold and our overall go-to-market strategy.
We sell our products and services directly to customers and also through a network of resellers. In certain cases, we act as a reseller of products provided by others. The determination of gross or net revenue recognition is reviewed on a product by product basis and is dependent on whether we act as principal or agent in the transaction. Revenue associated with sales through our network of resellers and for certain aftermarket domain sales is recorded on a gross basis as we have determined we are the primary obligor in the contractual arrangements with end customers. Commissions paid are expensed as a cost of revenue over the same period in which the associated revenue is recognized.
Our revenue is categorized as follows:
Domains.
Domains revenue primarily consists of domain registrations and renewals, domain privacy, domain application fees, domain back-orders, aftermarket domain sales and fee surcharges paid to ICANN. Domain registrations provide a customer with the exclusive use of a domain during the applicable contract term. After the contract term expires, unless renewed, the customer can no longer access the domain. Consideration is recorded as deferred revenue at the time of sale, and revenue, other than for aftermarket domain sales, is recognized as the product or service is delivered to the customer. Aftermarket domain revenue is recognized when control of the domain is transferred to the buyer.
Hosting and presence.
Hosting and presence revenue primarily consists of website hosting products, website building products and services, website security products, an online shopping cart and online visibility products. Consideration is recorded as deferred revenue at the time of sale, and revenue is recognized as the product or service is delivered to the customer.
Business applications.
Business applications revenue primarily consists of third-party productivity applications, email accounts and email marketing tools. Consideration is recorded as deferred revenue at the time of sale, and revenue is recognized as the product or service is delivered to the customer.
92
Operating Expenses
Cost of Revenue (excluding depreciation and amortization)
Costs of revenue are the direct costs we incur in connection with selling an incremental product to our customers. Substantially all cost of revenue relates to domain registration fees paid to the various domain registries, payment processing fees, third-party commissions and licensing fees for third-party productivity applications.
Technology and Development
Technology and development expenses represent the costs associated with the creation, development and distribution of our products and websites. These expenses primarily consist of personnel costs associated with the design, development, deployment, testing, operation and enhancement of our products, as well as costs associated with the data centers and systems infrastructure supporting those products, excluding depreciation expense.
Marketing and Advertising
Marketing and advertising expenses represent the costs associated with attracting and acquiring customers, primarily consisting of fees paid to third parties for marketing and advertising campaigns across television and radio, search engines, online display, social media and event sponsorships. These expenses also include personnel costs and affiliate program commissions.
Advertising costs are expensed either as incurred, at the time a commercial initially airs or when a promotion first appears in the media. Advertising expenses were
$205.8 million
,
$194.0 million
and
$177.6 million
during
2017
,
2016
and
2015
, respectively. Prepaid advertising, which is included within prepaid expenses and other current assets, was
$9.6 million
and
$1.3 million
at
December 31, 2017
and
2016
, respectively. At
December 31, 2017
, we had contractual commitments for certain marketing agreements with future payments totaling
$1.1 million
due in 2018 and
$0.2 million
due in 2019.
Customer Care
Customer care expenses represent the costs to advise and service our customers, primarily consisting of personnel costs.
General and Administrative
General and administrative expenses primarily consist of personnel costs for our administrative functions, professional service fees, office rent for all locations, all employee travel expenses, acquisition-related expenses and other general costs.
Equity-Based Compensation
Equity-based awards are accounted for using the fair value method. Restricted stock units (RSUs) are measured based on the fair market value of the underlying common stock on the date of grant. Grant date fair values for stock options are determined using the Black-Scholes option pricing model and a single option award approach. The measurement date for performance vesting awards is the date on which the applicable performance criteria are approved by our board of directors. The fair value of shares issued under our employee stock purchase plan is estimated on the first day of each offering period using the Black-Scholes option pricing model. An estimate of future award forfeitures, which is based on historical data, is utilized in our equity-based compensation calculations. We regularly estimate when and if performance-based awards will be earned and record equity-based compensation expense only for awards considered probable of being earned.
Key assumptions used in the determination of fair value for stock options are as follows:
Expected term.
The expected term represents the period the options are expected to be outstanding. Because of the lack of sufficient historical data necessary to calculate the expected term, we use the simple average of the vesting period and the contractual term to estimate the expected term.
Expected volatility.
We determine the expected stock price volatility based on the historical volatilities of our peer group since there is not a sufficient trading history for our Class A common stock. Industry peers consist of several public companies in the technology industry similar to us in size, stage of life cycle and financial leverage. We
93
intend to continue to consistently apply this process using the same or similar public companies until a sufficient trading history of our Class A common stock becomes available. If circumstances change such that the identified companies are no longer similar to us, we will revise our peer group to substitute more suitable companies in this calculation.
Expected dividend yield.
We do not use a dividend rate due to our expectation of not paying dividends in the foreseeable future.
Risk-free interest rate.
We base the risk-free interest rate on the yield curve of a zero-coupon U.S. Treasury bond with a maturity equal to the expected term of the option on the grant date.
The fair value of options granted was estimated using the following weighted-average assumptions:
|
|
Year Ended December 31,
|
|||||||
|
|
2017
|
2016
|
2015
|
|||||
|
Expected term (in years)
|
6.1
|
|
6.1
|
|
6.3
|
|
||
|
Expected volatility
|
37.4
|
%
|
37.7
|
%
|
39.1
|
%
|
||
|
Risk-free interest rate
|
2.0
|
%
|
1.4
|
%
|
1.7
|
%
|
||
Income Taxes
We account for income taxes under the asset and liability method, which requires the recognition of deferred tax assets (DTAs) and liabilities (DTLs) for the expected future tax consequences of events included in the financial statements. Under this method, we determine DTAs and DTLs on the basis of the differences between the financial statement and tax bases of assets and liabilities by using enacted tax rates in effect for the year in which the differences are expected to reverse. The effect of a change in tax rates on DTAs and DTLs is recognized in the period in which the enactment date occurs.
We recognize DTAs to the extent we believe these assets are more-likely-than-not to be realized. In making such a determination, we consider all available positive and negative evidence, including future reversals of existing taxable temporary differences, projected future taxable income, tax planning strategies and recent results of operations.
We record uncertain tax positions on the basis of a two-step process in which (1) we determine whether it is more-likely-than-not the tax positions will be sustained on the basis of the technical merits of the position and (2) for those tax positions meeting the more-likely-than-not recognition threshold, we recognize the largest amount of tax benefit that is more than
50%
likely to be realized upon ultimate settlement with the related tax authority.
Interest and penalties related to income taxes are included in benefit (provision) for income taxes, and were not material during any of the periods presented.
On
December 22, 2017
, the Tax Cuts and Jobs Act of 2017 was signed into law. See Note
14
for further discussion.
Payable to Related Parties Pursuant to the TRAs
Concurrent with the completion of the IPO, we became a party to
five
TRAs with our pre-IPO owners. Under four of the TRAs, we are generally required to pay to certain pre-IPO owners approximately
85%
of the amount of calculated tax savings, if any, we are deemed to realize (using the actual applicable U.S. federal income tax rate and an assumed combined state and local income tax rate) as a result of (1) any existing tax attributes associated with LLC Units acquired in the pre-IPO organizational transactions, the benefit of which is allocable to us as a result of such transactions (including the allocable share of Desert Newco's existing tax basis in its assets), (2) net operating loss (NOL) carryforwards available as a result of such transactions and (3) tax benefits related to imputed interest.
Under the fifth of these agreements, we are generally required to pay our other pre-IPO owners of approximately
85%
of the amount of the calculated tax savings, if any, we are deemed to realize (using the actual applicable U.S. federal income tax rate and an assumed combined state and local income tax rate) as a result of (1) any step-up in tax basis created as a result of exchanges of their LLC Units (together with the corresponding shares of Class B common stock) for shares of our Class A common stock, (2) any existing tax attributes associated with their LLC Units, the benefit of which is allocable to us as a result
94
of such exchanges (including the allocable share of Desert Newco's existing tax basis in its assets), (3) tax benefits related to imputed interest and (4) payments under the TRAs.
When LLC Units are exchanged, we receive certain tax attributes, including the original basis adjustments (the OBAs) created from the original acquisition of the LLC Units plus any anticipated basis adjustments. The OBAs entitle us to the depreciation and amortization previously allocable to the original owner of such units. The anticipated basis adjustments will increase, for tax purposes, our depreciation and amortization deductions. To the extent these deductions are used to reduce our taxable income, thereby resulting in actual tax savings, we will be required to pay the original owners approximately
85%
of such savings, which is recorded as an additional liability under the TRAs when deemed probable. Adjustments to the liability under the TRAs based on changes in anticipated future taxable income are recorded in our statements of operations.
Unutilized depreciation and amortization deductions related to the OBAs and the anticipated basis adjustments are converted to NOL carryforwards. If the utilization is considered to be more-likely-than-not, a liability under the TRAs relating to NOL carryforwards is recorded.
Fair Value Measurements
Fair value is defined as an exit price, representing the amount that would be received to sell an asset, or paid to transfer a liability, in an orderly transaction between market participants. The framework for measuring fair value provides a three-tier hierarchy prioritizing inputs to valuation techniques used in measuring fair value as follows:
Level 1
— Observable inputs such as quoted prices for identical assets or liabilities in active markets;
Level 2
— Inputs, other than quoted prices for identical assets or liabilities in active markets, which are observable either directly or indirectly; and
Level 3
— Unobservable inputs in which there is little or no market data requiring the reporting entity to develop its own assumptions.
We hold certain assets required to be measured at fair value on a recurring basis. These may include reverse repurchase agreements, commercial paper or other securities, which are classified as either cash and cash equivalents or short-term investments. We classify these assets within Level 1 or Level 2 because we use either quoted market prices or alternative pricing sources utilizing market observable inputs to determine their fair value. In addition, Level 2 assets and liabilities include derivative financial instruments associated with hedging activity, as further discussed in Note
11
. Derivative financial instruments are measured at fair value on the contract date and are subsequently remeasured each reporting period using inputs such as spot rates, discount rates and forward rates. There are not active markets for the hedge contracts themselves; however, the inputs used to calculate the fair value of the instruments are tied to active markets.
Our contingent consideration liabilities are classified within Level 3 and valued using discounted cash flow valuation methods encompassing significant unobservable inputs. The inputs include estimated operating results scenarios for the applicable performance periods, probability weightings assigned to operating results scenarios and the discount rates applied. Our contingent consideration liabilities relate to future earn-out payments associated with our acquisitions. No material adjustments to the fair value of contingent consideration were made during any of the periods presented.
95
The following tables set forth assets and liabilities measured at fair value on a recurring basis:
|
December 31, 2017
|
|||||||||||||||
|
Assets:
|
Level 1
|
Level 2
|
Level 3
|
Total
|
|||||||||||
|
Cash and cash equivalents:
|
|||||||||||||||
|
Reverse repurchase agreements
(1)
|
$
|
—
|
|
$
|
130.0
|
|
$
|
—
|
|
$
|
130.0
|
|
|||
|
Commercial paper
|
—
|
|
50.0
|
|
—
|
|
50.0
|
|
|||||||
|
Short-term investments:
|
|||||||||||||||
|
Certificates of deposit and time deposits
|
0.4
|
|
—
|
|
—
|
|
0.4
|
|
|||||||
|
Commercial Paper
|
—
|
|
11.9
|
|
—
|
|
11.9
|
|
|||||||
|
Derivative assets
|
—
|
|
—
|
|
—
|
|
—
|
|
|||||||
|
Total assets measured and recorded at fair value
|
$
|
0.4
|
|
$
|
191.9
|
|
$
|
—
|
|
$
|
192.3
|
|
|||
|
Liabilities:
|
|||||||||||||||
|
Contingent consideration liabilities
|
$
|
—
|
|
$
|
—
|
|
$
|
20.7
|
|
$
|
20.7
|
|
|||
|
Derivative liabilities
|
—
|
|
206.4
|
|
—
|
|
206.4
|
|
|||||||
|
Total liabilities measured and recorded at fair value
|
$
|
—
|
|
$
|
206.4
|
|
$
|
20.7
|
|
$
|
227.1
|
|
|||
|
(1)
|
Reverse repurchase agreements include a
$70.0 million
repurchase agreement with Morgan Stanley, callable with
31
days notice, and a
$60.0 million
one-week repurchase agreement with Wells Fargo.
|
|
December 31, 2016
|
|||||||||||||||
|
Assets:
|
Level 1
|
Level 2
|
Level 3
|
Total
|
|||||||||||
|
Cash and cash equivalents:
|
|||||||||||||||
|
Reverse repurchase agreements
(1)
|
$
|
—
|
|
$
|
130.0
|
|
$
|
—
|
|
$
|
130.0
|
|
|||
|
Commercial paper
|
—
|
|
55.9
|
|
—
|
|
55.9
|
|
|||||||
|
Short-term investments:
|
|||||||||||||||
|
Certificates of deposit and time deposits
|
6.6
|
|
—
|
|
—
|
|
6.6
|
|
|||||||
|
Derivative assets
|
—
|
|
0.7
|
|
—
|
|
0.7
|
|
|||||||
|
Total assets measured and recorded at fair value
|
$
|
6.6
|
|
$
|
186.6
|
|
$
|
—
|
|
$
|
193.2
|
|
|||
|
Liabilities:
|
|||||||||||||||
|
Derivative liabilities
|
$
|
—
|
|
$
|
0.1
|
|
$
|
—
|
|
$
|
0.1
|
|
|||
|
Total liabilities measured and recorded at fair value
|
$
|
—
|
|
$
|
0.1
|
|
$
|
—
|
|
$
|
0.1
|
|
|||
|
(1)
|
Reverse repurchase agreements include an
$80.0 million
repurchase agreement with Morgan Stanley, callable with
31
days notice, and a
$50.0 million
one-week repurchase agreement with Wells Fargo.
|
We have no other material assets or liabilities measured at fair value on a recurring basis.
Business Combinations
We include the results of operations of acquired businesses as of the respective acquisition dates. Purchase price is allocated to the tangible and intangible assets acquired and the liabilities assumed based on their estimated fair values, with the excess recorded as goodwill. If applicable, we estimate the fair value of contingent consideration payments in determining the purchase price. Measurement period adjustments to provisional purchase price allocations are recognized in the period in which they are determined, with the effect on earnings of changes in depreciation, amortization or other income resulting from such changes calculated as if the accounting had been completed at the acquisition date. Contingent consideration is adjusted to fair value in subsequent periods as an increase or decrease in general and administrative expenses. Acquisition-related costs are expensed as incurred.
96
Concentrations of Risks
Our financial instruments exposed to concentrations of credit risk consist primarily of cash and cash equivalents and short-term investments. Although we deposit cash with multiple banks, these deposits, including those held in foreign branches of global banks, may exceed the amount of insurance provided on such deposits. These deposits may generally be redeemed upon demand and bear minimal risk.
No single customer represented over
10%
of our total revenue for any period presented.
In order to reduce the risk of downtime of the products we provide, we have established data centers in various geographic regions. We have internal procedures to restore products in the event of disaster at any of our data center facilities. We serve our customers and users from data center facilities operated either by us or third parties, which are located in Arizona, California, Missouri, Virginia, New York, France, Germany, the Netherlands, Singapore and the United Kingdom. Even with these procedures for disaster recovery in place, the availability of our products could be significantly interrupted during the implementation of restoration procedures.
Recent Accounting Pronouncements
Revenue Recognition
In
May 2014
, the Financial Accounting Standards Board (FASB) issued a new standard on revenue recognition from contracts with customers. The new standard requires an entity to recognize revenue when it transfers promised goods or services to customers in an amount reflecting the consideration to which the entity expects to be entitled to in exchange for those goods or services. The FASB has issued several amendments to the new standard, including clarification on identifying performance obligations, principal-versus-agent implementation guidance, collectability assessment, sales taxes and other similar taxes collected from customers, noncash consideration, contract modification and completed contracts at transition. These amendments are intended to address implementation issues raised by stakeholders and provide additional practical expedients to reduce the cost and complexity of applying the new standard.
We will adopt the new standard effective
January 1, 2018
using the modified retrospective transition method. We finalized our assessment of the new standard and the adoption of this guidance will not have a material impact on our consolidated financial statements or our internal controls over financial reporting.
Other Accounting Standards
In
February 2016
, the FASB issued new guidance related to accounting for leases. The new standard requires the recognition of assets and liabilities arising from lease transactions on the balance sheet and the disclosure of key information about leasing arrangements. For leases with a term of 12 months or less, a lessee can make an accounting policy election by class of underlying asset to not recognize an asset and corresponding liability. We will adopt the new standard on January 1, 2019. In transition, lessees are required to recognize and measure leases at the beginning of the earliest period presented using a modified retrospective approach. While we continue to evaluate the effect of adopting this guidance, we expect our operating leases disclosed in
Note 12
will be subject to the new guidance. We will recognize right-of-use assets and lease liabilities in our consolidated balance sheets upon adoption, which will increase our total assets and liabilities.
In
June 2016
, the FASB issued new guidance for the accounting for credit losses on instruments that will require entities to measure all expected credit losses for financial instruments held at the reporting date based on historical experience, current conditions and reasonable supportable forecasts. This replaces the existing incurred loss model and is applicable to the measurement of credit losses on financial instruments measured at amortized cost and also applies to some off-balance sheet credit exposures. The guidance is effective for annual and interim reporting periods beginning after
December 15, 2019
, with early adoption permitted. We are currently evaluating the timing of our adoption and the expected impact of this new guidance.
In
November 2016
, the FASB issued new guidance requiring amounts generally described as restricted cash and restricted cash equivalents to be included with cash and cash equivalents when reconciling the amounts shown on the statement of cash flows. Our adoption of this guidance on
January 1, 2018
is not expected to have a material impact.
In
January 2017
, the FASB issued new guidance clarifying the definition of a business for determining whether transactions should be accounted for as acquisitions or disposals of assets or businesses. If substantially all of the fair value of the gross assets acquired (or disposed of) is concentrated in a single asset or a group of similar assets, the assets acquired (or
97
disposed of) are not considered to be a business. Our early adoption of this guidance effective
October 1, 2017
did not have a material impact.
In
January 2017
, the FASB issued new guidance simplifying the goodwill impairment test, eliminating the requirement for an entity to determine the fair value of its assets and liabilities (including unrecognized assets and liabilities) at the impairment testing date following the procedure that would be required in determining the fair value of assets acquired and liabilities assumed in a business combination. Instead, an entity will be required to perform its annual, or interim, goodwill impairment test by comparing the fair value of a reporting unit with its carrying amount. An entity will be required to recognize an impairment charge for the amount by which the carrying amount exceeds the reporting unit's fair value; however, the loss recognized should not exceed the total amount of goodwill allocated to the reporting unit. The guidance is effective for annual and interim reporting periods beginning after
December 15, 2019
, with early adoption permitted. We are currently evaluating the timing of our adoption and the expected impact of this new guidance.
In
May 2017
, the FASB issued new guidance to amend the scope of modification accounting for share-based payment arrangements. The amendment provides guidance on the types of changes to the terms or conditions of share-based payment awards which would require an entity to apply modification accounting. Our adoption of this guidance on
January 1, 2018
is not expected to have a material impact.
On
December 22, 2017
, the Tax Cuts and Jobs Act of 2017 was signed into law. See Note
14
for further discussion.
3.
Business Acquisitions
Acquisition of Host Europe Holdings Limited
On
April 3, 2017
, we completed the acquisition of HEG, a United Kingdom-based provider of domains, web hosting, applications hosting and managed hosting services to small and medium-sized customers throughout Europe. Pursuant to the terms of the purchase agreement, we purchased all of the outstanding shares of HEG and certain loan notes issued by Host Europe Finance Co. Ltd. for total consideration transferred of
€1.7 billion
. We funded the acquisition with the proceeds from the Acquisition Term Loan and the Bridge Loan, both of which are further described in Note
10
, and incurred
$18.6 million
in nonrecurring transaction costs in connection with the acquisition, which were recognized within general and administrative expense. As a result of the acquisition, HEG became our wholly-owned subsidiary. We believe the acquisition will allow us to leverage HEG's existing footprint to accelerate our expansion in Europe through the delivery of a broader range of cloud-based products.
Our operating results include HEG's results from the closing date. The purchase price was preliminarily allocated to the tangible and intangible assets acquired and liabilities assumed based on their estimated fair values as of the acquisition date, with the excess recorded to goodwill. The recognition of goodwill, none of which is deductible for income tax purposes, was made based on the strategic and synergistic benefits we expect to realize from the acquisition. During the measurement period, which will not exceed one year from closing, we will continue to obtain information to assist us in finalizing the acquisition date fair values.
98
The following table summarizes the preliminary estimated fair values of the HEG assets acquired and liabilities assumed, as adjusted for certain measurement period adjustments primarily related to refinements in the fair values of acquired DTLs and the net assets held for sale:
|
Total purchase consideration
(1)
|
$
|
1,849.5
|
|
|
|
Fair value of assets acquired:
|
||||
|
Cash and cash equivalents
|
27.2
|
|
||
|
Other current assets
|
66.3
|
|
||
|
Assets held for sale
(2)
|
497.5
|
|
||
|
Property and equipment, net
|
61.9
|
|
||
|
Intangible assets, net
|
595.7
|
|
||
|
Other assets
|
9.3
|
|
||
|
Amount attributable to assets acquired
|
1,257.9
|
|
||
|
Fair value of liabilities assumed:
|
||||
|
Accounts payable and accrued expenses
|
62.8
|
|
||
|
Current portion of deferred revenue
|
45.5
|
|
||
|
Liabilities directly associated with the assets held for sale
(2)
|
93.0
|
|
||
|
Other long-term liabilities
|
14.0
|
|
||
|
Deferred tax liabilities
|
177.6
|
|
||
|
Amount attributable to liabilities assumed
|
392.9
|
|
||
|
Goodwill
|
$
|
984.5
|
|
|
|
(1)
|
The purchase consideration was translated using the Euro to U.S. dollar exchange rate in effect on the closing date, April 3, 2017, of approximately
1.066
.
|
|
(2)
|
Assets held for sale and liabilities directly associated with the assets held for sale, represented those of HEG's PlusServer managed hosting business (PlusServer), which met the criteria for held for sale designation at the acquisition date and was sold in August 2017. See Note 4 for further discussion.
|
During the fourth quarter of
2017
, we revised our preliminary legal entity purchase accounting valuations for HEG, primarily resulting in a shift of goodwill and intangible assets among various tax jurisdictions and functional currencies. The impact to such assets from movements in foreign currency rates subsequent to the date of acquisition are reflected in cumulative translation adjustment, a component of AOCI.
The purchase price allocation to identifiable finite-lived intangible assets acquired was as follows:
|
Finite-lived Intangible Assets
|
Estimated
Useful Lives
|
|||||
|
Trade names
|
10 years
|
$
|
75.2
|
|
||
|
Developed technology
|
6 years
|
62.4
|
|
|||
|
Customer relationships
|
9 years
|
458.1
|
|
|||
|
$
|
595.7
|
|
||||
We valued trade names by applying the relief-from-royalty method, which is a variation of the income approach. This valuation method is based on the application of a royalty rate to the forecasted revenue expected from the trade names. Projected cash flows were then discounted using a rate of return reflecting the relative risk of achieving the cash flows as well as the time value of money. Our valuation of developed technology also used the relief-from-royalty method, in which the forecasted revenue associated with each of the domain and hosting technologies was estimated assuming useful lives ranging from
six
to
eight
years. A royalty rate, calculated considering factors such as market competition, profitability and market share, was applied to the forecasted revenue. The projected cash flows were then discounted using a rate of return reflecting the risk and uncertainty of their achievement relative to the overall business. Customer relationships were valued using the multi-period excess earnings method under the income approach, which reflects the present value of the projected cash flows expected to be generated by the customer relationship assets less charges representing the contribution of other assets to those cash flows. We determined the assumptions used in developing these valuations based on our future plans, historical data, current and anticipated market conditions, estimated growth rates and market comparables. The acquired finite-lived intangible assets have a total weighted-average amortization period of
8.8 years
.
99
Property and equipment was valued using the cost approach, which estimates value by determining the current cost of replacing an asset with another of equivalent economic utility. The cost to replace a given asset reflects the estimated reproduction or replacement cost for the property, less an allowance for loss in value due to depreciation. Deferred revenue was valued using the income approach, in which we estimated costs required to fulfill the obligation associated with the deferred revenue and then applied an appropriate profit margin. The result was then discounted to represent value at a risk adjusted rate. Preliminary estimated DTLs primarily represent the expected future tax consequences of temporary differences between the fair values of the assets acquired and liabilities assumed and their respective tax bases.
The determination of fair value requires considerable judgment and is sensitive to changes in the underlying assumptions. Our estimates with respect to certain tax-related accounts are preliminary and subject to change pending the filing of pre-acquisition tax returns, which may result in material changes. Any qualifying changes will be recorded as adjustments to the respective assets and liabilities, with any residual amounts allocated to goodwill.
In 2017, HEG contributed approximately
$155.1 million
of our total revenue and a net loss of approximately
$17.2 million
within our income from continuing operations.
The following unaudited pro forma consolidated results of operations for 2017 and 2016 assume the closing of the HEG acquisition occurred as of January 1, 2016. The unaudited pro forma results include certain estimated purchase accounting adjustments, which are primarily comprised of amortization of acquired intangible assets, fair value adjustments to reduce deferred revenue assumed in the acquisition and interest expense on debt incurred to finance the acquisition. For the purpose of the pro forma, the short-term bridge financing was assumed to commence on January 1, 2016 and therefore no interest expense on this loan is included in 2017. In addition, we have made pro forma adjustments in 2017 to exclude nonrecurring transaction costs directly attributable to the acquisition. As required by U.S. GAAP, we have made pro forma adjustments to include these deal costs in 2016. The pro forma results of operations are presented for informational purposes only and do not include any anticipated cost savings or other effects of future integration efforts. As such, they may not be not indicative of the results we would have achieved if the acquisition had taken place on January 1, 2016, nor are they intended to be a projection of our future results.
|
Year Ended December 31,
|
|||||||
|
Pro forma Consolidated Results of Operations (unaudited)
|
2017
|
2016
|
|||||
|
Total revenue
|
$
|
2,315.1
|
|
$
|
2,058.4
|
|
|
|
Net income (loss) attributable to GoDaddy Inc.
|
143.9
|
|
(40.0
|
)
|
|||
|
Net income (loss) from continuing operations attributable to GoDaddy Inc.
|
128.8
|
|
(46.1
|
)
|
|||
|
Net income (loss) from continuing operations attributable to GoDaddy Inc. per share of Class A common stock - basic
|
1.23
|
|
(0.53
|
)
|
|||
|
Net income (loss) from continuing operations attributable to GoDaddy Inc. per share of Class A common stock - diluted
|
0.75
|
|
(0.53
|
)
|
|||
Other 2017 Acquisition
In April 2017, we completed an acquisition for consideration consisting of cash of
$45.7 million
,
$9.0 million
payable in future periods upon expiration of the contractual holdback period,
$15.0 million
of time-based milestone payments and additional contingent earn-out payments of up to
$15.0 million
subject to the achievement of certain revenue and integration milestones. We recognized a liability of
$33.7 million
representing the estimated aggregate acquisition-date fair value of the future payments. Pro forma financial information is not presented because this acquisition was not material to our results of operations.
The aggregate purchase price was allocated based upon our assessment of acquisition-date fair values with
$63.9 million
allocated to goodwill,
none
of which is tax deductible,
$28.5 million
to identified finite-lived intangible assets and
$13.0 million
of net liabilities assumed. Identified finite-lived intangible assets, which were valued using income-based approaches, consist of developed technology, customer relationships and trade names. The acquired finite-lived intangible assets have a total weighted-average amortization period of
5.5 years
.
100
2016 Acquisitions
During 2016, we completed
six
acquisitions for cash of
$125.5 million
, including
$7.0 million
payable in future periods following the expiration of contractual holdback periods, and additional contingent earn-out payments of up to
$6.0 million
subject to the achievement of certain revenue targets. The aggregate purchase price was allocated based upon our assessment of acquisition-date fair values with
$59.3 million
attributed to indefinite-lived domain portfolio intangible assets,
$55.0 million
to goodwill, of which
$37.5 million
is not tax-deductible,
$21.4 million
to other identified finite-lived intangible assets and
$11.3 million
of net liabilities assumed. We also recorded a
$1.1 million
reduction of our existing deferred revenue from prior transactions with one of the acquired businesses. These acquisitions were not material to our results of operations, either individually or in the aggregate.
2015 Acquisitions
During
2015
, we completed
four
acquisitions for cash of
$64.7 million
and additional immaterial contingent earn-out payments. The aggregate purchase price was allocated based upon our assessment of acquisition-date fair values with
$60.2 million
attributed to an indefinite-lived domain portfolio intangible asset,
$3.2 million
to other identified finite-lived intangible assets,
$2.2 million
to tax-deductible goodwill and
$0.9 million
of net liabilities assumed. These acquisitions were not material to our results of operations, either individually or in the aggregate.
Other Acquisition-Related Payments
During 2017, we made approximately
$10.8 million
of aggregate holdback and contingent consideration payments related to prior acquisitions. Payments in 2016 and 2015 were not material.
4.
Sale of PlusServer
In connection with the HEG acquisition, we committed to a formal plan to sell PlusServer as its business model differs from ours. The operating results of PlusServer from the acquisition date to the date of its sale are reported within discontinued operations. On
August 31, 2017,
we sold all of the outstanding shares of PlusServer, receiving net proceeds of
$447.7 million
. As a result of the sale, we recorded a gain on disposal of
$33.2 million
, which includes the reclassification of the associated cumulative translation adjustment on PlusServer's net assets.
5.
Goodwill and Intangible Assets
The following table summarizes changes in our goodwill balance:
|
Balance at December 31, 2015
|
$
|
1,663.4
|
|
|
Goodwill related to 2016 acquisitions
|
55.0
|
|
|
|
Balance at December 31, 2016
|
1,718.4
|
|
|
|
Goodwill related to 2017 acquisitions
|
1,048.4
|
|
|
|
Impact of foreign currency translation
|
93.1
|
|
|
|
Balance at December 31, 2017
|
$
|
2,859.9
|
|
101
Intangible assets, net are summarized as follows:
|
December 31, 2017
|
|||||||||||||||
|
Gross Carrying
Amount |
Accumulated
Amortization |
Domains Sold
|
Net Carrying
Amount |
||||||||||||
|
Indefinite-lived intangible assets:
|
|||||||||||||||
|
Trade names and branding
|
$
|
445.0
|
|
n/a
|
|
n/a
|
|
$
|
445.0
|
|
|||||
|
Domain portfolio
|
171.0
|
|
n/a
|
|
$
|
(18.8
|
)
|
152.2
|
|
||||||
|
Finite-lived intangible assets:
|
|||||||||||||||
|
Customer-related
|
868.0
|
|
$
|
(320.4
|
)
|
n/a
|
|
547.6
|
|
||||||
|
Developed technology
|
184.5
|
|
(82.2
|
)
|
n/a
|
|
102.3
|
|
|||||||
|
Trade names
|
94.4
|
|
(15.5
|
)
|
n/a
|
|
78.9
|
|
|||||||
|
$
|
1,762.9
|
|
$
|
(418.1
|
)
|
$
|
(18.8
|
)
|
$
|
1,326.0
|
|
||||
|
|
December 31, 2016
|
||||||||||||||
|
Gross Carrying
Amount |
Accumulated
Amortization |
Domains Sold
|
Net Carrying
Amount |
||||||||||||
|
Indefinite-lived intangible assets:
|
|||||||||||||||
|
Trade names and branding
|
$
|
445.0
|
|
n/a
|
|
n/a
|
|
$
|
445.0
|
|
|||||
|
Domain portfolio
|
120.5
|
|
n/a
|
|
$
|
(14.4
|
)
|
106.1
|
|
||||||
|
Finite-lived intangible assets:
|
|||||||||||||||
|
Customer-related
|
367.4
|
|
$
|
(245.4
|
)
|
n/a
|
|
122.0
|
|
||||||
|
Developed technology
|
226.0
|
|
(187.0
|
)
|
n/a
|
|
39.0
|
|
|||||||
|
Trade names
|
11.9
|
|
(7.5
|
)
|
n/a
|
|
4.4
|
|
|||||||
|
$
|
1,170.8
|
|
$
|
(439.9
|
)
|
$
|
(14.4
|
)
|
$
|
716.5
|
|
||||
During 2017, we completed three purchases of intangible assets for
$52.0 million
in cash. The assets purchased consisted of
$50.5 million
in indefinite-lived domain portfolios and
$1.5 million
in customer-related intangible assets. The purchased customer-related intangible assets were valued at cost and are amortized over
36 months
. Transaction costs were immaterial and were expensed as incurred.
During 2015, we purchased a customer-related intangible asset for
$22.5 million
in cash. The purchased intangible asset was valued at cost and is amortized over
48 months
based on expected customer attrition. Transaction costs were immaterial and were expensed as incurred.
Customer-related intangible assets, developed technology and trade names have weighted-average useful lives from the date of purchase of
104 months
,
73 months
and
111 months
, respectively. Amortization expense was
$117.0 million
,
$90.2 million
and
$97.5 million
during
2017
,
2016
and
2015
, respectively. The weighted-average remaining amortization period for amortizable intangible assets was
86 months
as of
December 31, 2017
.
102
Based on the balance of finite-lived intangible assets at
December 31, 2017
, expected future amortization expense is as follows:
|
Year Ending December 31:
|
|||
|
2018
|
$
|
130.3
|
|
|
2019
|
111.1
|
|
|
|
2020
|
104.5
|
|
|
|
2021
|
81.8
|
|
|
|
2022
|
80.2
|
|
|
|
Thereafter
|
220.9
|
|
|
|
$
|
728.8
|
|
|
6.
Stockholders' Equity
Initial Public Offering
On
April 7, 2015
, we completed our IPO and sold
26,000
shares of Class A common stock at a public offering price of
$20.00
per share, including
2,500
shares purchased by affiliates of certain members of our board of directors (the Board). We received
$480.6 million
in proceeds, net of underwriting discounts, commissions and direct expenses. We primarily used the net IPO proceeds to make certain payments to the Sponsors and Bob Parsons as described in Note
18
and to repay the senior note payable to YAM and all amounts drawn on our revolving credit loan as described in Note
10
.
In connection with the IPO, we completed a series of organizational transactions, including:
|
•
|
the amendment and restatement of Desert Newco's limited liability company agreement to, among other things, appoint us as sole managing member and reclassify all LLC Units as non-voting units;
|
|
•
|
the issuance of a total of
90,425
shares of Class B common stock to Desert Newco's pre-IPO owners on a one-to-one basis with the number of LLC Units owned; and
|
|
•
|
the acquisition, by merger, of four members of Desert Newco (the Reorganization Parties), for which we issued an aggregate of
38,826
shares of Class A common stock as consideration for the
38,826
aggregate LLC Units held by such entities (the Investor Corp Mergers). See Note
14
.
|
Restatement of Certificate of Incorporation
Our amended and restated certificate of incorporation authorized the issuance of up to
1,000,000
shares of Class A common stock, up to
500,000
shares of Class B common stock and up to
50,000
shares of undesignated preferred stock, each having a par value of
$0.001
per share. Shares of Class A common stock have both economic and voting rights. Shares of Class B common stock have no economic rights, but do have voting rights. Holders of Class A and Class B common stock are entitled to one vote per share and, except as otherwise required, will vote together as a
single
class on all matters on which stockholders generally are entitled to vote.
We are required to, at all times, maintain (i) a
one-to-one
ratio between the number of shares of Class A common stock outstanding and the number of LLC Units owned by us and (ii) a one-to-one ratio between the number of shares of Class B common stock and LLC Units owned by Desert Newco's pre-IPO owners. We may issue shares of Class B common stock only to the extent necessary to maintain these ratios. Shares of Class B common stock are transferable only together with an equal number of LLC Units if we, at the election of a pre-IPO owner, exchange LLC Units for shares of Class A common stock.
Secondary Offerings and LLC Unit Repurchase
We have completed several underwritten public offerings in which certain stockholders, including the Sponsors, YAM and certain of our executive officers sold shares of our Class A common stock. We did not receive any proceeds from the shares sold by the selling stockholders in these offerings. We used the net proceeds from the shares sold by us to pay expenses incurred in connection with the offerings. Each offering included the exchange of LLC Units (together with the corresponding shares of Class B common stock) for Class A common stock by the selling stockholders, which resulted in increases in additional paid-in
103
capital, with offsetting reductions in non-controlling interests, and material increases to the liability under the TRAs (see Note
15
). Significant details for each offering are as follows:
|
Offering Date
|
Offering Price Per Share ($)
|
Shares Sold by GoDaddy (#)
|
Proceeds Received by GoDaddy ($)
|
Aggregate Shares Sold by Selling Stockholders (#)
|
LLC Units Exchanged by Selling Stockholders (#)
|
Increase in Additional Paid-in Capital ($)
|
||||||||||||
|
December 2017
(1)
|
47.32
|
|
50
|
|
2.4
|
|
7,228
|
|
4,689
|
|
4.7
|
|
||||||
|
September 2017
|
44.00
|
|
50
|
|
2.2
|
|
20,000
|
|
13,774
|
|
10.8
|
|
||||||
|
May 2017
|
38.50
|
|
100
|
|
3.7
|
|
27,615
|
|
16,701
|
|
10.8
|
|
||||||
|
April 2016
|
30.25
|
|
—
|
|
—
|
|
18,975
|
|
10,382
|
|
8.8
|
|
||||||
|
(1)
|
Following the December 2017 secondary offering, TCV no longer owns shares of GoDaddy's common stock.
|
In May 2017, we repurchased
7,345
LLC units from the Sponsors and YAM for an aggregate of
$275.0 million
, or
$37.44
per share, which is the same per share price, net of discounts and commissions, paid by the underwriters to the selling stockholders in the offering. In connection with this repurchase, the corresponding shares of Class B common stock held by the Sponsors and YAM were canceled. In May 2017, we also sold an aggregate of
521
shares of Class A common stock to certain executives for total proceeds of
$19.2 million
.
7.
Equity-Based Compensation Plans
On
March 31, 2015
, we adopted the 2015 Equity Incentive Plan (the 2015 Plan) and reserved a total of
10,285
shares of Class A common stock for issuance thereunder. The shares reserved for issuance under the 2015 Plan also included up to
28,133
shares rolled over from our previous equity plan and from certain other option plans assumed in connection with acquisitions. The number of shares reserved for issuance are increased automatically, on
January 1st
of each year, by a number equal to the least of (i)
20,571
shares, (ii)
4%
of the total shares of all classes of common stock outstanding as of the last day of the preceding year or (iii) such other amount as may be determined by our Board. On January 1, 2017, an additional
6,684
shares were reserved for issuance pursuant to the 2015 Plan. As of
December 31, 2017
,
16,024
shares were available for issuance as future awards under the 2015 Plan.
On March 31, 2015, we adopted the 2015 Employee Stock Purchase Plan (the ESPP) and reserved a total of
2,000
shares of Class A common stock for issuance thereunder. The number of shares reserved for issuance are increased automatically, on
January 1st
of each year, by a number equal to the least of (i)
1,000
shares, (ii)
1%
of the total shares of all classes of common stock outstanding as of the last day of the preceding year or (iii) such other amount as may be determined by our Board. On January 1, 2017, an additional
1,000
shares were reserved for issuance pursuant to the ESPP. As of
December 31, 2017
,
2,551
shares were available for issuance under the ESPP.
We grant options at exercise prices equal to the fair market value of our Class A common stock on the grant date. We grant both options and RSUs vesting solely upon the continued employment of the recipient as well as awards vesting upon the achievement of annual or cumulative financial-based targets. We recognize the grant date fair value of equity-based awards as compensation expense over the required service period of each award, taking into account the probability of our achievement of associated performance targets.
We apply the straight-line attribution method to recognize equity-based compensation expense associated with awards not subject to graded vesting. For awards subject to graded vesting and performance based awards, we recognize expense separately for each vesting tranche. We also estimate when and if performance based awards will be earned. If an award is not considered probable of being earned, no amount of expense is recognized. If the award is deemed probable of being earned, expense is recorded over the estimated service period.
104
The following table summarizes our option activity:
|
Number of
Shares of Class A Common Stock (#)
|
Weighted-
Average
Grant-
Date Fair
Value ($)
|
Weighted-
Average
Exercise
Price ($)
|
Weighted-
Average
Remaining
Contractual
Life
(in years)
|
Aggregate
Intrinsic
Value ($)
|
||||||||||
|
Outstanding at December 31, 2014
|
26,652
|
|
8.27
|
|
||||||||||
|
Granted
|
3,926
|
|
9.77
|
|
23.66
|
|
||||||||
|
Exercised
|
(1,749
|
)
|
7.65
|
|
35.5
|
|
||||||||
|
Forfeited
|
(1,410
|
)
|
13.47
|
|
||||||||||
|
Outstanding at December 31, 2015
|
27,419
|
|
10.25
|
|
||||||||||
|
Granted
|
2,136
|
|
11.97
|
|
30.93
|
|
||||||||
|
Exercised
|
(9,187
|
)
|
5.99
|
|
242.4
|
|
||||||||
|
Forfeited
|
(1,740
|
)
|
17.25
|
|
||||||||||
|
Outstanding at December 31, 2016
|
18,628
|
|
14.06
|
|
||||||||||
|
Granted
|
2,077
|
|
15.07
|
|
38.03
|
|
||||||||
|
Exercised
|
(6,000
|
)
|
10.18
|
|
187.1
|
|
||||||||
|
Forfeited
|
(1,245
|
)
|
23.46
|
|
||||||||||
|
Outstanding at December 31, 2017
|
13,460
|
|
18.63
|
|
6.6
|
426.0
|
|
|||||||
|
Vested at December 31, 2017
|
6,737
|
|
12.72
|
|
5.6
|
253.1
|
|
|||||||
The following table summarizes our RSU activity:
|
Number of
Shares of Class A Common Stock (#) |
Weighted-
Average Grant- Date Fair Value ($) |
|||||
|
Outstanding at December 31, 2014
|
87
|
|
||||
|
Granted
|
52
|
|
31.50
|
|
||
|
Vested
|
(46
|
)
|
||||
|
Forfeited
|
—
|
|
||||
|
Outstanding at December 31, 2015
|
93
|
|
||||
|
Granted
|
3,129
|
|
30.98
|
|
||
|
Vested
|
(241
|
)
|
||||
|
Forfeited
|
(224
|
)
|
||||
|
Outstanding at December 31, 2016
|
2,757
|
|
||||
|
Granted
|
2,877
|
|
38.68
|
|
||
|
Vested
|
(939
|
)
|
||||
|
Forfeited
|
(496
|
)
|
||||
|
Outstanding at December 31, 2017
|
4,199
|
|
||||
At
December 31, 2017
, total unrecognized compensation expense related to non-vested stock options and RSUs was
$36.6 million
and
$87.8 million
, respectively, with expected remaining weighted-average recognition periods of approximately
1.7 years
and
2.5 years
, respectively. We currently believe the performance targets related to the vesting of performance awards will be achieved. If such targets are not achieved, or are subsequently determined to not be probable of being achieved, we will not recognize any compensation expense for performance awards, and will reverse any previously recognized expense on such awards.
105
8.
Deferred Revenue
Deferred revenue consisted of the following:
|
December 31,
|
|||||||
|
2017
|
2016
|
||||||
|
Current:
|
|||||||
|
Domains
|
$
|
638.5
|
|
$
|
531.2
|
|
|
|
Hosting and presence
|
444.7
|
|
370.8
|
|
|||
|
Business applications
|
181.6
|
|
141.5
|
|
|||
|
$
|
1,264.8
|
|
$
|
1,043.5
|
|
||
|
Noncurrent:
|
|||||||
|
Domains
|
$
|
341.3
|
|
$
|
311.1
|
|
|
|
Hosting and presence
|
183.2
|
|
163.4
|
|
|||
|
Business applications
|
72.3
|
|
58.2
|
|
|||
|
$
|
596.8
|
|
$
|
532.7
|
|
||
9.
Accrued Expenses and Other Current Liabilities
Accrued expenses and other current liabilities consisted of the following:
|
December 31,
|
|||||||
|
2017
|
2016
|
||||||
|
Derivative liabilities
|
$
|
206.4
|
|
$
|
—
|
|
|
|
Accrued payroll and employee benefits
|
98.7
|
|
74.0
|
|
|||
|
Tax-related accruals
|
78.5
|
|
15.8
|
|
|||
|
Accrued acquisition-related expenses and acquisition consideration payable
|
32.9
|
|
13.4
|
|
|||
|
Accrued marketing and advertising expenses
|
10.3
|
|
9.8
|
|
|||
|
Current portion of capital lease obligation
|
4.8
|
|
6.9
|
|
|||
|
Accrued other
|
38.0
|
|
23.1
|
|
|||
|
$
|
469.6
|
|
$
|
143.0
|
|
||
10.
Long-Term Debt
Long-term debt consisted of the following:
|
December 31,
|
|||||||
|
|
2017
|
2016
|
|||||
|
Term loans (effective interest rate of 4.1% at December 31, 2017 and 4.9% at December 31, 2016)
|
$
|
2,482.3
|
|
$
|
1,072.5
|
|
|
|
Revolving Credit Loan
|
—
|
|
—
|
|
|||
|
Total
|
2,482.3
|
|
1,072.5
|
|
|||
|
Less: unamortized original issue discount on long-term debt
(1)
|
(33.0
|
)
|
(30.5
|
)
|
|||
|
Less: unamortized debt issuance costs
(1)
|
(21.8
|
)
|
(2.3
|
)
|
|||
|
Less: current portion of long-term debt
|
(16.7
|
)
|
(4.0
|
)
|
|||
|
$
|
2,410.8
|
|
$
|
1,035.7
|
|
||
|
(1)
|
Original issue discount and debt issuance costs are amortized to interest expense over the life of the related debt instruments using the effective interest method.
|
106
Credit Facility
Our amended and restated secured credit agreement (the Credit Facility) included a
$1,100.0 million
original balance term loan maturing on May 13, 2021 and an available
$150.0 million
revolving credit loan maturing on May 13, 2019.
In
February 2017
, we refinanced the Credit Facility to provide for: (i) a
$1,072.5 million
seven
-year term loan (the Term Loan), (ii) a second
$1,425.0 million
tranche (the Acquisition Term Loan), which was issued on
April 3, 2017
upon the completion of our acquisition of HEG, and (iii) a
$150.0 million
five
-year revolving credit facility, which increased to
$200.0 million
upon the completion of our acquisition of HEG (the Revolving Credit Loan). See Note
3
for further information regarding our acquisition of HEG.
The refinanced Term Loan was issued at a
0.25%
discount on the face of the note at original issue for net proceeds of
$1,069.8 million
and matures on
February 15, 2024
. Pursuant to the terms of the amended credit agreement, we drew down the
$1,425.0 million
Acquisition Term Loan upon completion of the HEG acquisition. This loan was issued at a
0.25%
discount at original issue for net proceeds of
$1,421.4 million
and has the same maturity date and interest rate as the Term Loan. A portion of the Acquisition Term Loan is hedged by an interest rate swap. See Note
11
for discussion of this hedging instrument and its impact on the interest rate associated with this loan.
The refinanced Revolving Credit Loan matures on
February 15, 2022
and bears interest at a rate equal to, at our option, either (a) LIBOR plus a margin ranging from
2.00%
to
2.50%
per annum or (b) the higher of (i) the Federal Funds Rate plus
0.5%
, (ii) the Prime Rate or (iii) one-month LIBOR plus
1.0%
plus a margin ranging from
1.00%
to
1.50%
per annum, with the margins determined based on our first lien net leverage ratio. The refinanced Revolving Credit Loan also contains a financial covenant requiring us to maintain a maximum net leverage ratio of
5.75
:1.00 when our usage exceeds
35.0%
of the maximum capacity. The net leverage ratio is calculated as the ratio of first lien secured debt less cash and cash equivalents to consolidated EBITDA (as defined in the Credit Facility).
In
November 2017
, we refinanced the Credit Facility such that borrowings under the term loans bear interest at a rate equal to, at our option, either (a) LIBOR plus
2.25%
per annum or (b)
1.25%
per annum plus the highest of (i) the Federal Funds Rate plus
0.5%
, (ii) the Prime Rate or (iii) one-month LIBOR plus
1.0%
. In addition, the refinancing allows for an additional
0.25%
reduction in the interest rate margins upon improvement in our corporate credit rating. The maturity date of the term loans was unchanged.
In evaluating the above refinancings, we compared the net present value cash flows of the previous instruments and the refinanced instruments to determine whether the terms of the new debt and original instruments were "substantially different" on a creditor-by-creditor basis. In each case, certain of the creditors in the loan syndication did not reinvest in the refinanced debt, and we accounted for their proportionate share of the unamortized original issue discount and deferred financing costs as an aggregate
$2.0 million
loss on debt extinguishment. As the cash flows for all of the continuing creditors varied by less than
10%
between the old and new instruments, we concluded that debt modification accounting was appropriate and aggregate fees paid to the lenders of
$3.7 million
were recorded as additional discount. In addition,
$3.3 million
in aggregate fees paid to third parties were recorded as general and administrative expense.
In addition to paying interest on the outstanding principal under the term loans, we are required to pay a commitment fee of
0.375%
per annum for any unutilized commitments under the Revolving Credit Loan.
Significant terms of the refinanced Credit Facility are as follows:
|
•
|
we are required to prepay outstanding term loans, subject to certain exceptions, with percentages of excess cash flow, proceeds of non-ordinary course asset sales or dispositions of property, insurance or condemnation proceeds and proceeds from the incurrence of certain debt;
|
|
•
|
we are restricted by certain covenants, including, among other things, limitations on our ability to incur additional indebtedness, sell assets, incur additional liens, make certain fundamental changes, pay distributions and make certain investments;
|
|
•
|
we are required to maintain certain financial ratios; and
|
|
•
|
all obligations are unconditionally guaranteed by all of our material domestic subsidiaries and is secured by substantially all of our and such subsidiaries real and personal property.
|
107
In
April 2015
, we made a payment of
$75.0 million
to repay all amounts drawn on the Revolving Credit Loan. At
December 31, 2017
, we have
$200.0 million
available for borrowing under the Revolving Credit Loan, and were not in violation of any covenants of the Credit Facility.
The estimated fair value of the term loans was
$2,488.5 million
at
December 31, 2017
based on observable market prices for these loans, which are traded in a less active market and therefore classified as a Level 2 fair value measurement.
Bridge Loan
On
April 3, 2017
, we entered into a credit agreement pursuant to which we borrowed an aggregate principal amount of
€500 million
(approximately
$533.0 million
on the date of issuance) (the Bridge Loan) in connection with the HEG acquisition. Following the sale of PlusServer on
August 31, 2017
, as further discussed in Note
4
, we prepaid the Bridge Loan in its entirety and the underlying bridge credit agreement was canceled. Accordingly, we recognized a
$5.3 million
loss on debt extinguishment, representing the remaining unamortized original issue discount and debt issuance costs on this loan. As the Bridge Loan was contractually required to be repaid with any proceeds received from the sale of PlusServer, interest expense attributable to the Bridge Loan of
$12.4 million
in
2017
was recorded within discontinued operations.
Senior Note Repayment
In April 2015, we made a payment to YAM totaling
$316.0 million
to repay a senior note, consisting of principal of
$300.0 million
, prepayment premium of
$13.5 million
, which was recorded as a loss on debt extinguishment, and accrued interest of
$2.5 million
. Additionally, in connection with the repayment,
$7.9 million
of unamortized original issue discount and deferred financing costs were recorded as a loss on debt extinguishment. Following this payment, the senior note was canceled.
Future Debt Maturities
Aggregate principal payments, exclusive of any unamortized original issue discount and debt issuance costs, due on long-term debt as of
December 31, 2017
are as follows:
|
Year Ending December 31:
|
|||
|
2018
|
$
|
25.0
|
|
|
2019
|
25.0
|
|
|
|
2020
|
25.0
|
|
|
|
2021
|
25.0
|
|
|
|
2022
|
25.0
|
|
|
|
Thereafter
|
2,357.3
|
|
|
|
$
|
2,482.3
|
|
|
11.
Derivatives and Hedging
We are exposed to changes in foreign currency exchange rates, primarily relating to debt and certain forecasted sales transactions denominated in currencies other than the U.S. dollar, as well as to changes in interest rates as a result of our variable-rate debt. Consequently, we use derivative financial instruments to manage and mitigate such risk. We do not enter into derivative transactions for speculative or trading purposes.
108
The following table summarizes our outstanding derivative instruments, all of which are designated as cash flow hedges, on a gross basis:
|
Notional Amount
|
Derivative Assets
|
Derivative Liabilities
|
|||||||||||||||||||||||||
|
|
December 31, 2017
|
December 31, 2016
|
December 31, 2017
|
December 31, 2016
|
December 31, 2017
|
December 31, 2016
|
|||||||||||||||||||||
|
Balance Sheet Location
(2)
|
Fair Value
|
Balance Sheet Location
(2)
|
Fair Value
|
Balance Sheet Location
(2)
|
Fair Value
|
Balance Sheet Location
(2)
|
Fair Value
|
||||||||||||||||||||
|
Derivative Instrument:
|
|||||||||||||||||||||||||||
|
Level 2:
|
|||||||||||||||||||||||||||
|
Foreign exchange forward contracts
|
$
|
241.3
|
|
$
|
—
|
|
PP
|
$
|
—
|
|
PP
|
$
|
0.7
|
|
ACC
|
$
|
4.4
|
|
ACC
|
$
|
0.1
|
|
|||||
|
Cross-currency swap
(1)
|
1,478.3
|
|
—
|
|
PP
|
—
|
|
PP
|
—
|
|
ACC
|
182.9
|
|
ACC
|
—
|
|
|||||||||||
|
Interest rate swap
|
1,315.5
|
|
—
|
|
PP
|
—
|
|
PP
|
—
|
|
ACC
|
19.1
|
|
ACC
|
—
|
|
|||||||||||
|
Total hedges
|
$
|
3,035.1
|
|
$
|
—
|
|
$
|
—
|
|
$
|
0.7
|
|
$
|
206.4
|
|
$
|
0.1
|
|
|||||||||
|
(1)
|
The notional value for the cross-currency swap reflects
€1,234.0 million
translated to U.S. dollar at the foreign currency rate in effect at December 31, 2017 of approximately
1.20
.
|
|
(2)
|
PP = Prepaid expenses and other current assets; ACC = Accrued expenses and other current liabilities.
|
The following table summarizes the effect of our designated cash flow hedging derivative instruments on AOCI:
|
Unrealized Gains (Losses) Recognized in Other Comprehensive Income
|
|||||||||||
|
|
Year Ended December 31,
|
||||||||||
|
2017
|
2016
|
2015
|
|||||||||
|
Derivative Instrument:
|
|||||||||||
|
Foreign exchange forward contracts
(1)
|
$
|
(9.3
|
)
|
$
|
(0.4
|
)
|
$
|
3.4
|
|
||
|
Cross-currency swap
|
(20.1
|
)
|
—
|
|
—
|
|
|||||
|
Interest rate swap
|
(19.1
|
)
|
—
|
|
—
|
|
|||||
|
Total hedges
|
$
|
(48.5
|
)
|
$
|
(0.4
|
)
|
$
|
3.4
|
|
||
|
(1)
|
Amounts include gains and losses realized upon contract settlement but not yet recognized into earnings from AOCI.
|
109
The following table summarizes the locations and amounts of gains (losses) recognized within earnings related to our cash flow hedging relationships:
|
Year Ended December 31,
|
|||||||||||||||||||||||||||||||||||
|
2017
|
2016
|
2015
|
|||||||||||||||||||||||||||||||||
|
Revenue
|
Interest Expense
|
Other Income (Expense), Net
|
Revenue
|
Interest Expense
|
Other Income (Expense), Net
|
Revenue
|
Interest Expense
|
Other Income (Expense), Net
|
|||||||||||||||||||||||||||
|
Foreign Exchange Forward Contracts:
|
|||||||||||||||||||||||||||||||||||
|
Reclassified from AOCI into income
|
$
|
0.8
|
|
$
|
—
|
|
$
|
—
|
|
$
|
1.8
|
|
$
|
—
|
|
$
|
—
|
|
$
|
—
|
|
$
|
—
|
|
$
|
—
|
|
||||||||
|
Cross-Currency Swap:
|
|||||||||||||||||||||||||||||||||||
|
Reclassified from AOCI into income
(1)
|
—
|
|
21.6
|
|
(163.8
|
)
|
—
|
|
—
|
|
—
|
|
—
|
|
—
|
|
—
|
|
|||||||||||||||||
|
Interest Rate Swap:
|
|||||||||||||||||||||||||||||||||||
|
Reclassified from AOCI into income
|
—
|
|
(12.8
|
)
|
—
|
|
—
|
|
—
|
|
—
|
|
—
|
|
—
|
|
—
|
|
|||||||||||||||||
|
Total hedges
|
$
|
0.8
|
|
$
|
8.8
|
|
$
|
(163.8
|
)
|
$
|
1.8
|
|
$
|
—
|
|
$
|
—
|
|
$
|
—
|
|
$
|
—
|
|
$
|
—
|
|
||||||||
|
(1)
|
The amount reflected in other income (expense), net for
2017
includes
$162.8 million
reclassified from AOCI to offset the earnings impact of the remeasurement of the Euro-denominated intercompany loan hedged by the cross-currency swap.
|
As of December 31, 2017, we estimate that approximately
$11.0 million
of net deferred gains related to our cash flow hedges will be recognized in earnings over the next 12 months. No amounts were excluded from our effectiveness testing during any of the periods presented.
Risk Management Strategies
Foreign Exchange Forward Contracts
We enter into foreign exchange forward contracts with financial institutions to hedge certain forecasted sales transactions denominated in foreign currency. We designate these forward contracts as cash flow hedges, which are recognized as either assets or liabilities at fair value. At
December 31, 2017
, the total notional amount of such contracts was
$241.3 million
, all having maturities of
twelve months
or less.
Cross-Currency Swap Contract
In April 2017, in order to manage variability due to movements in foreign currency rates related to a Euro-denominated intercompany loan, we entered into a
five
-year cross-currency swap arrangement (the Cross-Currency Swap). The Cross-Currency Swap, which matures on April 3, 2022, had an amortizing notional amount of
€1,243.3 million
at inception (approximately
$1,325.4 million
). It converts the
3.00%
fixed rate Euro-denominated interest and principal receipts on the intercompany loan into fixed U.S. dollar interest and principal receipts at a rate of
5.44%
. Pursuant to the contract, the Euro notional value will be exchanged for the U.S. dollar notional value at maturity. The Cross-Currency Swap has been designated as a cash flow hedge. Accordingly, it is recognized as an asset or liability at fair value and the unrealized gains and losses on the contract are included in gain (loss) on swaps and foreign currency hedging, net within AOCI. Gains and losses are reclassified to interest income or expense over the period the hedged loan affects earnings. As such, amounts recorded in other comprehensive income (loss) (OCI) will be recognized in earnings within or against interest expense when the hedged interest payment is accrued each month. In addition, an amount is reclassified from AOCI to other income (expense), net each reporting period to offset the earnings impact of the hedged instrument.
Interest Rate Swap Contract
In April 2017, in connection with the closing of the Acquisition Term Loan, we entered into a
five
-year pay-fixed rate, receive-floating rate interest rate swap arrangement (the Interest Rate Swap) to effectively convert a portion of the variable-rate debt to fixed. The Interest Rate Swap, which matures on
April 3, 2022
, had an amortizing notional amount of
$1,325.4 million
at inception
110
and swaps the variable interest rate on our LIBOR-based borrowings for a fixed rate of
5.44%
. The objective of the Interest Rate Swap, which is designated as a cash flow hedge and recognized as an asset or liability at fair value, is to manage the variability of cash flows in the interest payments related to the portion of the variable-rate debt designated as being hedged. The unrealized gains and losses on the contract are included in gain (loss) on swaps and foreign currency hedging, net within AOCI. Amounts recorded in OCI will be recognized in earnings within or against interest expense when the hedged interest payment is accrued each month.
12.
Commitments and Contingencies
Lease Financing Obligation
In April 2013, we entered into an
11
-year lease agreement for new office space in Tempe, Arizona under which we occupied the total available space commencing in
September 2014
. The lease agreement allowed for rent abatement during the first full year, with rent payments of
$0.3 million
per month thereafter, consisting of both base rent and a tenant improvement allowance. The lease provides us with
two
consecutive options to extend the term for
five
years each. In the event we choose to extend the term of the lease, the monthly rent for each additional term will be based on
95%
of the then-prevailing market rate.
As a result of our involvement during the construction period, we were considered to be the owner of the construction project for accounting purposes. Upon completion of construction in
September 2014
, we did not meet the sale-leaseback criteria for derecognition of the building assets and liabilities; therefore, we were required to record an asset representing the total cost of the building paid by the lessor and the lease is accounted for as a financing obligation. We capitalized
$18.1 million
of construction costs incurred by the lessor, which are being depreciated over an estimated useful life of
40
years. Rent payments are treated as principal and interest payments on the lease financing obligation, with an amount recorded as estimated land lease expense each period. The lease financing obligation at the end of the lease term will approximate the net book value of the building to be relinquished to the lessor. As of
December 31, 2017
, the lease financing obligation totaled
$19.6 million
, of which
$19.4 million
is included in other long-term liabilities.
Future minimum payments under this lease as of
December 31, 2017
are as follows:
|
Year Ending December 31:
|
|||
|
2018
|
$
|
3.2
|
|
|
2019
|
3.2
|
|
|
|
2020
|
3.5
|
|
|
|
2021
|
3.6
|
|
|
|
2022
|
3.6
|
|
|
|
Thereafter
|
8.4
|
|
|
|
$
|
25.5
|
|
|
Leases
We lease office space, data center space (including commitments for specified levels of power) and certain computer equipment under non-cancelable operating and capital leases expiring at various dates through
March 2028
. Total operating lease rent expense was
$38.3 million
,
$43.3 million
and
$42.2 million
during
2017
,
2016
and
2015
, respectively.
111
Future minimum lease obligations under capital leases and non-cancelable operating leases with initial terms in excess of one year at
December 31, 2017
are as follows:
|
Year Ending December 31:
|
Capital
Leases |
Operating
Leases |
||||||
|
2018
|
$
|
5.1
|
|
$
|
28.8
|
|
||
|
2019
|
3.5
|
|
24.7
|
|
||||
|
2020
|
1.1
|
|
17.4
|
|
||||
|
2021
|
—
|
|
14.6
|
|
||||
|
2022
|
—
|
|
12.5
|
|
||||
|
Thereafter
|
—
|
|
41.7
|
|
||||
|
Total minimum payments
|
9.7
|
|
$
|
139.7
|
|
|||
|
Less: amount representing interest
|
(0.4
|
)
|
||||||
|
Capital lease obligation
|
$
|
9.3
|
|
|||||
Service Agreements
We have entered into long-term agreements with certain vendors to provide for software and equipment maintenance, specified levels of bandwidth and other services. Under these arrangements, we are required to make periodic payments. Future minimum obligations under these non-cancelable agreements with initial terms in excess of one year at
December 31, 2017
are as follows:
|
Year Ending December 31:
|
|||
|
2018
|
$
|
27.6
|
|
|
2019
|
15.9
|
|
|
|
2020
|
7.7
|
|
|
|
2021
|
4.9
|
|
|
|
2022
|
1.9
|
|
|
|
Thereafter
|
1.3
|
|
|
|
Total minimum payments
|
$
|
59.3
|
|
Litigation
From time-to-time, we are a party to litigation and subject to claims incidental to our business, including patent infringement litigation and trademark infringement claims, as well as putative class actions, commercial and consumer protection claims, labor and employment claims, breach of contract claims and other asserted and unasserted claims. We investigate claims as they arise and accrue estimates for resolution of legal and other contingencies when losses are probable and estimable. The amounts currently accrued for such matters are not material. While the results of such normal course claims and legal proceedings, regardless of the underlying nature of the claims, cannot be predicted with certainty, management does not believe, based on current knowledge and the likely timing of resolution of various matters, any additional reasonably possible potential losses above the amounts accrued for such matters would be material. Regardless of the final outcomes, legal proceedings may have an adverse effect on us because of defense costs, diversion of management resources and other factors.
Indemnifications
In the normal course of business, we have made indemnities under which we may be required to make payments in relation to certain transactions, including to our directors and officers to the maximum extent permitted under applicable state laws and indemnifications related to certain lease agreements. In addition, certain advertiser and reseller partner agreements contain indemnification provisions, which are generally consistent with those prevalent in the industry. We have not incurred material obligations under indemnification provisions historically, and do not expect to incur material obligations in the future. Accordingly, we have not recorded any liabilities related to such indemnities as of
December 31, 2017
and
2016
.
We include service level commitments to our customers guaranteeing certain levels of uptime reliability and performance for our hosting and premium DNS products. These guarantees permit those customers to receive credits in the
112
event we fail to meet those levels, with exceptions for certain service interruptions including but not limited to periodic maintenance. We have not incurred any material costs as a result of such commitments during any of the periods presented, and have not recorded any liabilities related to such obligations as of
December 31, 2017
and
2016
.
Indirect Taxes
We are subject to indirect taxation in some, but not all, of the various states and foreign jurisdictions in which we conduct business. Laws and regulations attempting to subject communications and commerce conducted over the Internet to various indirect taxes are becoming more prevalent, both in the U.S. and internationally, and may impose additional burdens on us in the future. Increased regulation could negatively affect our business directly, as well as the businesses of our customers. Taxing authorities may impose indirect taxes on the Internet-related revenue we generate based on regulations currently being applied to similar, but not directly comparable, industries. There are many transactions and calculations where the ultimate indirect tax determination is uncertain. In addition, domestic and international indirect taxation laws are complex and subject to change. We may be audited in the future, which could result in changes to our indirect tax estimates. We continually evaluate those jurisdictions in which nexus exists, and believe we maintain adequate indirect tax accruals.
As of
December 31, 2017
and
2016
, our accrual for estimated indirect tax liabilities was
$18.8 million
and
$6.1 million
, respectively, reflecting our best estimate of the probable liability based on an analysis of our business activities, revenues subject to indirect taxes and applicable regulations. Although we believe our indirect tax estimates and associated liabilities are reasonable, the final determination of indirect tax audits, litigation or settlements could be materially different than the amounts established for indirect tax contingencies. Due to the complexity and uncertainty surrounding indirect tax laws in certain international locations, we believe it is reasonably possible, based on currently available information and analysis, that we may incur additional losses related to indirect taxes, which management estimates to be within the range of
$0
to
$10.0 million
as of
December 31, 2017
.
13.
Defined Contribution Plan
We maintain defined contribution 401(k) plans covering eligible U.S. employees, who may contribute up to
100%
of their compensation, subject to limitations established by the Internal Revenue Code. We match employee contributions on a discretionary basis. Expense for our matching contributions was
$9.9 million
,
$8.5 million
and
$8.6 million
during
2017
,
2016
and
2015
, respectively.
We maintain defined contribution benefit plans covering eligible foreign employees. Expense related to such plans was not material in any period presented.
14.
Income Taxes
Overview
We are subject to U.S. federal, state and foreign income taxes with respect to our allocable share of any taxable income or loss of Desert Newco, as well as any stand-alone income or loss we generate. Desert Newco has been and will continue to be treated as a partnership for U.S. income tax purposes and for most applicable state and local income tax purposes. As such, Desert Newco is considered a pass-through entity and generally does not pay income taxes on its taxable income in most jurisdictions. Instead, Desert Newco's taxable income or loss is passed through to and included in the taxable income or loss of its members, including us. Despite its partnership treatment, Desert Newco is liable for income taxes in certain foreign jurisdictions in which it operates, in those states not recognizing its pass-through status and for certain of its subsidiaries not taxed as pass-through entities. We have acquired the outstanding stock of various domestic and foreign entities taxed as corporations, which are now owned
100%
by us or our subsidiaries. Where required or allowed, these subsidiaries also file and pay tax as a consolidated group for U.S. federal and state income tax purposes and internationally, primarily within the United Kingdom and Germany. We anticipate this structure to remain in existence for the foreseeable future.
Tax Cuts and Jobs Act of 2017
On
December 22, 2017
, the Tax Cuts and Jobs Act of 2017 (the TCJA) was signed into law making significant changes to the Internal Revenue Code. Changes include, but are not limited to, a U.S. federal corporate tax rate decrease from
35%
to
21%
effective for tax years beginning after
December 31, 2017
, the transition of U.S international taxation from a worldwide tax system to a territorial system and a one-time transition tax on the mandatory deemed repatriation of cumulative foreign earnings. We have calculated the impact of the TCJA in accordance with our understanding of the TCJA and guidance available
113
as of the date of this filing, as shown below. The one-time transition tax on the mandatory deemed repatriation of foreign earnings had no effect on our benefit (provision) for income taxes as a result of an estimated accumulated deficit in the earnings of our controlled foreign corporations as of the measurement date. We do not expect the provisions of the TCJA unrelated to the rate reduction or one-time transition tax to have a material impact, primarily due to our corporate structure.
On
December 22, 2017
, the SEC issued guidance to address the application of GAAP in situations when a registrant does not have the necessary information available, prepared or analyzed (including computations) in reasonable detail to complete the accounting for certain income tax effects of the TCJA. The completion of our
2017
income tax returns, future guidance and additional information and interpretations with the respect to the TCJA may cause us to adjust the provisional amounts recorded as of
December 31, 2017
. In accordance with the SEC's guidance, we will record such adjustments as current tax expense in the period in which relevant guidance or additional information becomes available and our analysis is complete.
In
January 2018
, the FASB released guidance on the accounting for the global intangible low-taxed income (GILTI) provisions of the TCJA. The GILTI provisions impose a tax on foreign income in excess of a deemed return on tangible assets of foreign corporations. The guidance allows an accounting policy election either to account for deferred taxes related to GILTI inclusions or to treat any taxes on GILTI inclusions as period costs. We are still evaluating the potential impacts.
Benefit (Provision) for Income Taxes
Our tax benefit (provision) includes U.S. federal, state and foreign income taxes. The domestic and foreign components of our income (loss) from continuing operations before income taxes were as follows:
|
|
Year Ended December 31,
|
||||||||||
|
|
2017
|
2016
|
2015
|
||||||||
|
U.S.
|
$
|
180.6
|
|
$
|
(28.5
|
)
|
$
|
(121.2
|
)
|
||
|
Foreign
|
(73.8
|
)
|
7.0
|
|
0.6
|
|
|||||
|
Income (loss) from continuing operations before income taxes
|
$
|
106.8
|
|
$
|
(21.5
|
)
|
$
|
(120.6
|
)
|
||
Our benefit (provision) for income taxes was as follows:
|
|
Year Ended December 31,
|
||||||||||
|
|
2017
|
2016
|
2015
|
||||||||
|
Current:
|
|||||||||||
|
Federal
|
$
|
(1.4
|
)
|
$
|
(0.3
|
)
|
$
|
(0.3
|
)
|
||
|
State
|
(0.6
|
)
|
(0.3
|
)
|
(0.1
|
)
|
|||||
|
Foreign
|
(9.5
|
)
|
(3.5
|
)
|
(2.4
|
)
|
|||||
|
(11.5
|
)
|
(4.1
|
)
|
(2.8
|
)
|
||||||
|
Deferred:
|
|||||||||||
|
Federal
|
9.6
|
|
3.1
|
|
2.4
|
|
|||||
|
State
|
0.8
|
|
0.3
|
|
0.4
|
|
|||||
|
Foreign
|
20.0
|
|
0.3
|
|
0.2
|
|
|||||
|
30.4
|
|
3.7
|
|
3.0
|
|
||||||
|
Benefit (provision) for income taxes
|
$
|
18.9
|
|
$
|
(0.4
|
)
|
$
|
0.2
|
|
||
114
A reconciliation of the statutory U.S. federal income tax rate to our effective income tax rate was as follows:
|
|
Year Ended December 31,
|
||||||||||
|
|
2017
|
2016
|
2015
|
||||||||
|
Expected benefit (provision) at U.S. federal statutory tax rate of 35%
|
$
|
(37.4
|
)
|
$
|
7.5
|
|
$
|
42.2
|
|
||
|
Effect of TCJA U.S. federal rate reduction from 35% to 21%, net of the effect on valuation allowances
|
7.9
|
|
—
|
|
—
|
|
|||||
|
Effect of Desert Newco's corporate subsidiaries
|
27.4
|
|
(0.1
|
)
|
2.8
|
|
|||||
|
TRA liability adjustment
|
24.3
|
|
(3.8
|
)
|
—
|
|
|||||
|
Foreign earnings
|
(15.3
|
)
|
(0.9
|
)
|
(2.2
|
)
|
|||||
|
State taxes, net of federal benefit
|
(3.1
|
)
|
0.1
|
|
5.4
|
|
|||||
|
Income of non-controlling interests
|
0.9
|
|
(1.8
|
)
|
(15.6
|
)
|
|||||
|
Other
|
(0.4
|
)
|
0.1
|
|
(0.7
|
)
|
|||||
|
Effect of changes in valuation allowances, excluding effect of TCJA U.S. federal rate reduction
|
14.6
|
|
(1.5
|
)
|
(31.7
|
)
|
|||||
|
Benefit (provision) for income taxes
|
$
|
18.9
|
|
$
|
(0.4
|
)
|
$
|
0.2
|
|
||
The TCJA changed the U.S. federal corporate statutory tax rate from
35%
to
21%
. The application of this rate reduction to the ending DTAs and DTLs in our U.S. entities provisionally impacted our benefit for income taxes by a net of
$7.9 million
. This net benefit results from a
$327.4 million
reduction in deferred tax expense, which was primarily offset by a
$335.3 million
increase in the associated valuation allowance as we concluded, based primarily on our limited operating history and our historical losses, that the majority of our U.S. DTAs will more-likely-than-not not be realized. The increase in the impact of foreign earnings primarily results from our acquisition of HEG. The TRA liability adjustment primarily represents the non-deductible portion of the benefit resulting from the provisional decrease in the liability under the TRAs due to the TCJA rate reduction.
Deferred Taxes
The components of our net (DTL) DTAs were as follows:
|
|
December 31,
|
||||||
|
|
2017
|
2016
|
|||||
|
DTAs
:
|
|||||||
|
NOLs
|
$
|
247.8
|
|
$
|
164.8
|
|
|
|
Credits and incentives
|
3.0
|
|
2.7
|
|
|||
|
Investment in Desert Newco
|
429.9
|
|
180.6
|
|
|||
|
Deferred interest
|
10.9
|
|
10.8
|
|
|||
|
TRA liability
|
16.8
|
|
14.1
|
|
|||
|
Unrealized gains/losses
|
9.7
|
|
—
|
|
|||
|
Other
|
4.4
|
|
2.2
|
|
|||
|
Valuation allowance
|
(711.1
|
)
|
(361.5
|
)
|
|||
|
Total
DTAs
|
11.4
|
|
13.7
|
|
|||
|
DTLs:
|
|||||||
|
Identified intangible assets
|
(155.8
|
)
|
(8.7
|
)
|
|||
|
Total DTLs
|
(155.8
|
)
|
(8.7
|
)
|
|||
|
Net (DTL) DTAs
|
$
|
(144.4
|
)
|
$
|
5.0
|
|
|
During
2017
, the DTAs associated with our investment in Desert Newco increased
$674.6 million
due to exchanges of LLC Units in the secondary offerings discussed in Note
6
, exchanges of additional LLC Units and stock option exercises. Our DTAs were provisionally reduced by a net of
$7.9 million
as a result of the TCJA U.S. federal rate reduction, as discussed above. Preliminary purchase accounting for our
2017
acquisitions resulted in an increase to our DTLs of
$173.7 million
,
115
primarily related to intangible assets not deductible for tax purposes. In
2017
, we also recorded additional DTAs of
$201.6 million
as a result of our portion of Desert Newco's losses, primarily those resulting from the impact of an Internal Revenue Service approved filing election made in the current year, offset by a provisional decrease of
$118.7 million
as a result of the TCJA rate reduction.
As a result of the pre-IPO organizational transactions and the IPO, we acquired LLC Units and have recognized a DTA for the difference between the financial reporting and tax basis of our investment in Desert Newco. In addition, we acquired certain tax attributes from these transactions, including
$89.2 million
of NOL and credit carryforwards, net of tax. During
2016
, the DTAs associated with our investment in Desert Newco increased
$183.6 million
due to exchanges of LLC Units in the secondary offering discussed in Note
6
, exchanges of additional LLC Units and stock option exercises. In
2016
, we also recorded additional DTAs of
$36.7 million
as a result of our portion of Desert Newco's losses.
Based primarily on our limited operating history and our historical losses, we believe there is significant uncertainty as to when we will be able to utilize our NOLs, credit carryforwards and other DTAs. Therefore, we have recorded a valuation allowance against the DTAs for which we have concluded it is more-likely-than-not they will not be realized. As part of the acquisition of HEG, our valuation allowance increased as we believe there is significant uncertainty as to our ability to utilize our NOLs and other carryforwards related to the HEG entities in the United Kingdom.
As of
December 31, 2017
, we have U.S. federal, state and foreign gross NOLs, credits and incentives, a portion of which will begin to expire in
2030
and continue through
2036
, as follows:
|
Gross NOLs, Credits and Incentives
|
Portion Subject to a Valuation Allowance
|
||||||
|
Federal NOLs and credits
|
$
|
913.5
|
|
$
|
893.9
|
|
|
|
State NOLs, credits and incentives
|
1,118.8
|
|
1,101.0
|
|
|||
|
Foreign NOLs
|
30.3
|
|
30.0
|
|
|||
|
Total NOLs, credits and incentives
|
$
|
2,062.6
|
|
$
|
2,024.9
|
|
|
Other
We have filed all income tax returns for years through
2016
, other than for Germany for which the
2016
pre-acquisition HEG tax returns have not yet been filed. These returns are subject to examination by the taxing authorities in the respective jurisdictions, generally for three or four years after they were filed. Based on our analysis of tax positions taken on income tax returns filed, we have determined no material liabilities related to uncertain income tax positions were required. Although we believe the amounts reflected in our tax returns substantially comply with applicable U.S. federal, state and foreign tax regulations, the respective taxing authorities may take contrary positions based on their interpretation of the law. A tax position successfully changed by a taxing authority could result in an adjustment to our benefit for income taxes in the period in which a final determination is made.
As of
December 31, 2017
, we have provided income taxes on the earnings of foreign subsidiaries, except to the extent such earnings are considered indefinitely reinvested. We have determined the amount of unrecognized DTL related to these temporary differences to be immaterial.
15.
Payable to Related Parties Pursuant to the TRAs
In the Investor Corp Mergers, we received certain tax attributes, including the OBAs and NOL carryforwards, from the Reorganization Parties. These OBAs entitle us to the depreciation and amortization previously allocable to such parties, which are allowed prior to the utilization of any NOL or tax credit carryforwards against income taxes. If these additional depreciation and amortization deductions are greater than our taxable income, the excess deductions allocated to us will increase the amount of our NOL carryforwards.
Based on then current projections of taxable income, and before deduction of any specially allocated depreciation and amortization, we anticipated having enough taxable income to utilize a portion of these specially allocated deductions related to the OBAs. Accordingly, as of
December 31, 2015
, we recorded a liability under the TRAs of
$151.6 million
, with an offsetting
116
reduction to additional paid-in capital, representing approximately
85%
of the calculated tax savings based on the portion of the OBAs we anticipated being able to utilize in future years.
During
2016
, we increased this liability through 1) a
$38.5 million
reduction of additional paid-in-capital resulting from exchanges of LLC Units in the secondary offering discussed in Note
6
and 2) a
$12.5 million
charge to our statements of operations, which was primarily due to: (i) an increase in our ownership of Desert Newco, (ii) the finalization of Desert Newco's
2015
taxable income allocated to us and (iii) changes in estimated
2016
taxable income. As of
December 31, 2016
, the liability under the TRAs was
$202.6 million
.
During
2017
, we decreased this liability through: (i) an
$86.2 million
benefit to our statements of operations resulting from the U.S. federal corporate tax rate reduction enacted in
December 2017
as part of the TCJA, as discussed in Note
14
, (ii) a
$33.6 million
benefit to our statements of operations resulting from the impact of an Internal Revenue Service approved filing election made in the current year, (iii) a
$12.2 million
increase in additional paid-in capital resulting from an immaterial adjustment related to our accounting for this liability and (iv) a
$3.4 million
benefit to our statements of operations primarily resulting from our increased ownership of Desert Newco and changes in forecasted taxable income. These decreases were offset by an increase in this liability through an aggregate
$85.8 million
reduction in additional paid-in capital resulting from exchanges of LLC Units in the secondary offerings discussed in Note
6
. As of
December 31, 2017
, the liability under the TRAs was
$153.0 million
.
The projection of future taxable income involves significant judgment. Actual taxable income may differ from our estimates, which could significantly impact the liability under the TRAs. We have determined it is more-likely-than-not we will be unable to utilize all of our DTAs subject to TRAs; therefore, we have not recorded a liability under the TRAs related to the tax savings we may realize from the utilization of NOL carryforwards and the amortization related to basis adjustments under Code Section 754 created by exchanges of LLC Units, including those associated with secondary offerings. If utilization of these DTAs becomes more-likely-than-not in the future, at such time, we will record liabilities under the TRAs of up to an additional
$559.5 million
as a result of basis adjustments under Code Section 754 and up to an additional
$224.4 million
related to the utilization of NOL and credit carryforwards, which will be recorded through charges to our statements of operations. However, if the tax attributes are not utilized in future years, it is reasonably possible no amounts would be paid under the TRAs. In this scenario, the reduction of the liability under the TRAs would result in a benefit to our statements of operations. These potential additional liabilities were calculated considering the U.S. federal corporate tax rate reduction enacted in
December 2017
as part of the TCJA, as discussed in Note
14
.
16.
Income (Loss) Per Share
Basic income (loss) per share is computed by dividing net income (loss) attributable to GoDaddy Inc. by the weighted-average number of shares of Class A common stock outstanding during the period. Diluted income (loss) per share is computed giving effect to all potentially dilutive shares. In periods when we have a net loss, potentially issuable shares are excluded from the calculation of earnings per share as their inclusion would have an antidilutive effect.
For purposes of calculating loss per share for periods prior to the IPO, including
2015
for which a portion of the period preceded the IPO, we treated the pre-IPO organizational transactions as a merger of entities under common control. Therefore, we have retrospectively reflected loss per share as though these transactions had occurred as of the earliest period presented. For all periods prior to the IPO, we allocated our historical net loss between the Class A stockholders and the non-controlling interests based on their respective share ownership. These calculations do not consider the
26,000
shares of Class A common stock sold in our IPO.
117
A reconciliation of the numerator and denominator used in the calculation of basic and diluted net income (loss) per share is as follows:
|
|
Year Ended December 31,
|
||||||||||
|
|
2017
|
2016
|
2015
|
||||||||
|
Numerator:
|
|||||||||||
|
Income (loss) from continuing operations
|
$
|
125.7
|
|
$
|
(21.9
|
)
|
$
|
(120.4
|
)
|
||
|
Income from discontinued operations, net of income taxes
|
14.1
|
|
—
|
|
—
|
|
|||||
|
Net income (loss)
|
139.8
|
|
|
(21.9
|
)
|
|
(120.4
|
)
|
|||
|
Less: net income (loss) attributable to non-controlling interests
|
3.4
|
|
(5.4
|
)
|
(73.0
|
)
|
|||||
|
Net income (loss) attributable to GoDaddy Inc.
|
$
|
136.4
|
|
$
|
(16.5
|
)
|
$
|
(47.4
|
)
|
||
|
Denominator:
|
|||||||||||
|
Weighted-average shares of Class A common stock outstanding—basic
|
108,779
|
|
79,835
|
|
58,676
|
|
|||||
|
Effect of dilutive securities:
|
|||||||||||
|
Class B common stock
|
57,999
|
|
—
|
|
—
|
|
|||||
|
Options and vesting LLC Units
|
8,791
|
|
—
|
|
—
|
|
|||||
|
RSUs and ESPP shares
|
1,485
|
|
—
|
|
—
|
|
|||||
|
Weighted-average shares of Class A Common stock outstanding—diluted
|
177,054
|
|
|
79,835
|
|
|
58,676
|
|
|||
|
Net income (loss) attributable to GoDaddy Inc. per share of Class A common stock—basic:
|
|||||||||||
|
Continuing operations
|
$
|
1.17
|
|
$
|
(0.21
|
)
|
$
|
(0.81
|
)
|
||
|
Discontinued operations
|
0.08
|
|
—
|
|
—
|
|
|||||
|
Net income (loss) attributable to GoDaddy Inc.
|
$
|
1.25
|
|
|
$
|
(0.21
|
)
|
|
$
|
(0.81
|
)
|
|
Net income (loss) attributable to GoDaddy Inc. per share of Class A common stock—diluted:
(1)
|
|||||||||||
|
Continuing operations
|
$
|
0.71
|
|
$
|
(0.21
|
)
|
$
|
(0.81
|
)
|
||
|
Discontinued operations
|
0.08
|
|
—
|
|
—
|
|
|||||
|
Net income (loss) attributable to GoDaddy Inc.
|
$
|
0.79
|
|
|
$
|
(0.21
|
)
|
|
$
|
(0.81
|
)
|
|
(1)
|
The dilutive income per share calculations exclude the net income (loss) attributable to non-controlling interests.
|
The following number of weighted-average potentially dilutive shares were excluded from the calculation of diluted income (loss) per share because the effect of including such potentially dilutive shares would have been antidilutive:
|
|
Year Ended December 31,
|
|||||||
|
|
2017
|
2016
|
2015
|
|||||
|
Class B common stock
|
—
|
|
82,068
|
|
90,366
|
|
||
|
Options and vesting LLC Units
|
—
|
|
13,517
|
|
15,159
|
|
||
|
RSUs and ESPP shares
|
—
|
|
363
|
|
139
|
|
||
|
—
|
|
95,948
|
|
105,664
|
|
|||
118
Shares of Class B common stock do not share in our earnings and are not participating securities. Accordingly, separate presentation of income (loss) per share of Class B common stock under the two-class method has not been presented. Each share of Class B common stock (together with a corresponding LLC Unit) is exchangeable for
one
share of Class A common stock. Total shares of common stock outstanding were as follows:
|
December 31,
|
|||||
|
|
2017
|
2016
|
|||
|
Class A common stock
|
132,993
|
|
88,558
|
|
|
|
Class B common stock
|
35,006
|
|
78,554
|
|
|
|
167,999
|
|
167,112
|
|
||
17.
Geographic Information
Revenue by geography is based on the customer's billing address, and was as follows:
|
|
Year Ended December 31,
|
||||||||||
|
|
2017
|
2016
|
2015
|
||||||||
|
U.S.
|
$
|
1,504.5
|
|
$
|
1,350.1
|
|
$
|
1,192.6
|
|
||
|
International
|
727.4
|
|
497.8
|
|
414.7
|
|
|||||
|
$
|
2,231.9
|
|
$
|
1,847.9
|
|
$
|
1,607.3
|
|
|||
No
individual international country represented more than
10%
of total revenue in any period presented.
Property and equipment, net by geography was as follows:
|
Year Ended December 31,
|
|||||||
|
|
2017
|
2016
|
|||||
|
U.S.
|
221.2
|
|
216.7
|
|
|||
|
France
|
31.6
|
|
—
|
|
|||
|
International
|
45.1
|
|
14.3
|
|
|||
|
$
|
297.9
|
|
$
|
231.0
|
|
||
Other than France,
no
individual international country represented more than
10%
of property and equipment, net in any period presented.
18.
Related Party Transactions
Tax Distributions to Desert Newco's Owners
Desert Newco is subject to an operating agreement containing numerous provisions related to allocations of income and loss, as well as timing and amounts of distributions to its owners. This agreement also includes a provision requiring cash distributions enabling its owners to pay their taxes on income passing through from Desert Newco. In addition, under the tax rules, Desert Newco is required to allocate taxable income disproportionately to its unit holders. Because tax distributions are determined based on the holder of LLC Units who is allocated the largest amount of cumulative taxable income for the current year on a per unit basis, but are made pro rata based on ownership, Desert Newco is required to make tax distributions that, in the aggregate, will likely exceed the amount of taxes Desert Newco would have otherwise paid.
During 2017, Desert Newco paid total distributions of
$10.0 million
based on ownership as of the various payment dates as follows:
$4.0 million
to YAM,
$2.3 million
to SLP,
$2.1 million
to KKR,
$1.2 million
to TVC and
$0.4 million
to other Desert Newco owners. During 2016, Desert Newco paid total distributions of
$18.4 million
based on ownership as of the various payment dates as follows:
$7.3 million
to YAM,
$4.1 million
to SLP,
$3.9 million
to KKR,
$2.2 million
to TVC and
$0.9 million
to other Desert Newco owners. Distributions paid in 2015 were not material.
An accrual for tax distributions was not required at
December 31, 2017
.
119
Sponsors
Amounts paid to affiliates of KKR related to their participation as lenders under our Credit Facility were as follows:
|
|
Year Ended December 31,
|
||||||||||
|
|
2017
|
2016
|
2015
|
||||||||
|
Principal
|
$
|
0.1
|
|
$
|
0.1
|
|
$
|
5.3
|
|
||
|
Interest and other fees
|
0.3
|
|
0.8
|
|
1.4
|
|
|||||
As of
December 31, 2017
and
2016
, affiliates of KKR held
$15.4 million
and
$2.9 million
, respectively, of the outstanding principal balance of the Term Loan as participating lenders.
On
December 16, 2011
, we entered into a transaction and monitoring fee agreement with affiliates of certain of the Sponsors pursuant to which those entities provided management and advisory services. In April 2015, we made a final aggregate payment of
$26.7 million
upon the termination of this agreement following the completion of the IPO, which was charged to general and administrative expense. Following this payment, we have no further obligations under this agreement. In addition, on
December 16, 2011
, we entered into a separate indemnification agreement with such parties, pursuant to which we agreed to provide customary indemnification to them and their affiliates.
Bob Parsons and YAM
On
December 16, 2011
, we entered into an executive chairman services agreement with Bob Parsons pursuant to which we were obligated to provide customary benefits related to his service to us. In
April 2015
, we paid
$3.0 million
upon the termination of this agreement following the completion of the IPO, which was charged to general and administrative expense. Following this payment, we have no further obligations under this agreement.
Payments made to YAM, other than those associated with the repayment of the senior note in April 2015, as described in Note
10
, were as follows:
|
|
Year Ended December 31,
|
||||||||||
|
|
2017
|
2016
|
2015
|
||||||||
|
Interest on the senior note
|
$
|
—
|
|
$
|
—
|
|
$
|
9.2
|
|
||
YAM has indemnified us for certain taxes related to periods prior to
December 16, 2011
and we have agreed to provide customary indemnification to Bob Parsons related to his service to us.
Other
In the ordinary course of business, we purchase and lease computer equipment, technology licensing and software maintenance and support from affiliates of Dell Inc. (Dell) of which Silver Lake and its affiliates have a significant ownership interest. During
2017
,
2016
and
2015
, we paid
$15.2 million
,
$15.4 million
and
$17.5 million
, respectively, to Dell.
120
19.
Accumulated Other Comprehensive Income (Loss)
The following table presents OCI activity accumulated in equity:
|
Foreign Currency Translation Adjustments
|
Net Unrealized Gains (Losses) on Cash Flow Hedges
(1)
|
Total Accumulated Other Comprehensive Income (Loss)
|
|||||||||
|
Balance as of December 31, 2015
|
$
|
(0.2
|
)
|
$
|
3.4
|
|
$
|
3.2
|
|
||
|
Other comprehensive income (loss) before reclassifications
|
(0.1
|
)
|
1.4
|
|
1.3
|
|
|||||
|
Amounts reclassified from AOCI
|
—
|
|
(1.8
|
)
|
(1.8
|
)
|
|||||
|
Other comprehensive income (loss) - 2016
|
(0.1
|
)
|
(0.4
|
)
|
(0.5
|
)
|
|||||
|
Balance as of December 31, 2016
|
(0.3
|
)
|
3.0
|
|
2.7
|
|
|||||
|
Other comprehensive income (loss) before reclassifications
|
(39.6
|
)
|
(202.7
|
)
|
(242.3
|
)
|
|||||
|
Amounts reclassified from AOCI
|
(46.9
|
)
|
154.2
|
|
107.3
|
|
|||||
|
Other comprehensive income (loss) - 2017
|
(86.5
|
)
|
(48.5
|
)
|
(135.0
|
)
|
|||||
|
$
|
(86.8
|
)
|
$
|
(45.5
|
)
|
(132.3
|
)
|
||||
|
Less: AOCI attributable to non-controlling interests
|
(46.6
|
)
|
|||||||||
|
Balance as of December 31, 2017
|
$
|
(85.7
|
)
|
||||||||
|
(1)
|
Amounts shown for our foreign exchange forward contracts include gains and losses realized upon contract settlement but not yet recognized into earnings from AOCI.
|
The sale of PlusServer in August 2017 resulted in the reclassification from AOCI of
$46.9 million
in cumulative foreign currency translation adjustments, which was reported in the gain on disposal within discontinued operations. The income tax impact associated with this reclassified amount was not material.
See Note
11
for the effect on net income (loss) of amounts reclassified from AOCI related to our cash flow hedging instruments. The income tax impact associated with these reclassified amounts was not material in any period presented.
121
20.
Selected Quarterly Financial Data (Unaudited)
The following table contains selected unaudited consolidated statements of operations information for each quarter of
2017
and
2016
. The following information reflects all normal recurring adjustments necessary for a fair presentation of the information for the periods presented. The operating results for any quarter are not necessarily indicative of results for any future period.
|
Three Months Ended
|
|||||||||||||||||||||||||||||||
|
Dec. 31, 2017
|
Sept. 30, 2017
|
Jun. 30, 2017
|
Mar. 31, 2017
|
Dec. 31, 2016
|
Sept. 30, 2016
|
Jun. 30, 2016
|
Mar. 31, 2016
|
||||||||||||||||||||||||
|
Total revenue
|
$
|
602.2
|
|
$
|
582.2
|
|
$
|
557.8
|
|
$
|
489.7
|
|
$
|
485.9
|
|
$
|
472.1
|
|
$
|
456.2
|
|
$
|
433.7
|
|
|||||||
|
Operating income
|
23.0
|
|
32.1
|
|
6.1
|
|
5.7
|
|
17.9
|
|
21.2
|
|
9.7
|
|
1.3
|
|
|||||||||||||||
|
Income (loss) from continuing operations
|
98.3
|
|
7.1
|
|
23.4
|
|
(3.1
|
)
|
(0.8
|
)
|
8.3
|
|
(11.1
|
)
|
(18.3
|
)
|
|||||||||||||||
|
Net income (loss)
|
94.8
|
|
30.0
|
|
18.1
|
|
(3.1
|
)
|
(0.8
|
)
|
8.3
|
|
(11.1
|
)
|
(18.3
|
)
|
|||||||||||||||
|
Net income (loss) attributable to GoDaddy Inc.
|
92.6
|
|
22.4
|
|
20.8
|
|
0.6
|
|
(1.9
|
)
|
4.8
|
|
(8.9
|
)
|
(10.5
|
)
|
|||||||||||||||
|
Net income (loss) attributable to GoDaddy Inc. per share of Class A common stock—basic:
|
|||||||||||||||||||||||||||||||
|
Continuing operations
|
$
|
0.74
|
|
$
|
0.05
|
|
$
|
0.25
|
|
$
|
0.01
|
|
$
|
(0.02
|
)
|
$
|
0.06
|
|
$
|
(0.11
|
)
|
$
|
(0.15
|
)
|
|||||||
|
Discontinued operations
|
(0.02
|
)
|
0.15
|
|
(0.05
|
)
|
—
|
|
—
|
|
—
|
|
—
|
|
—
|
|
|||||||||||||||
|
Net income (loss) attributable to GoDaddy, Inc.
|
$
|
0.72
|
|
|
$
|
0.20
|
|
|
$
|
0.20
|
|
|
$
|
0.01
|
|
|
$
|
(0.02
|
)
|
|
$
|
0.06
|
|
|
$
|
(0.11
|
)
|
|
$
|
(0.15
|
)
|
|
Net income (loss) attributable to GoDaddy Inc. per share of Class A common stock—diluted:
|
|||||||||||||||||||||||||||||||
|
Continuing operations
|
$
|
0.56
|
|
$
|
0.04
|
|
$
|
0.13
|
|
$
|
0.01
|
|
$
|
(0.02
|
)
|
$
|
0.05
|
|
$
|
(0.11
|
)
|
$
|
(0.15
|
)
|
|||||||
|
Discontinued operations
|
(0.02
|
)
|
0.13
|
|
(0.03
|
)
|
—
|
|
—
|
|
—
|
|
—
|
|
—
|
|
|||||||||||||||
|
Net income (loss) attributable to GoDaddy, Inc.
|
$
|
0.54
|
|
$
|
0.17
|
|
$
|
0.10
|
|
$
|
0.01
|
|
$
|
(0.02
|
)
|
$
|
0.05
|
|
$
|
(0.11
|
)
|
$
|
(0.15
|
)
|
|||||||
21.
Subsequent Events
In
January 2018
, we entered into a definitive agreement to acquire Main Street Hub, a provider of social media engagement optimization services, for approximately
$125.0 million
in cash and additional contingent earn-out payments of up to
$50.0 million
. This transaction is expected to close in the second quarter of
2018
, subject to customary regulatory and other closing requirements.
122
None.
Evaluation of Disclosure Controls and Procedures
Our management, with the participation of our Chief Executive Officer (CEO) and our Chief Financial Officer (CFO), evaluated the effectiveness of our disclosure controls and procedures pursuant to Rule 13a-15 under the Securities Exchange Act of 1934, as amended (the Exchange Act), as of the end of the period covered by this Annual Report on Form 10-K.
Based on this evaluation, our CEO and CFO concluded that, as of
December 31, 2017
, our disclosure controls and procedures are designed at a reasonable assurance level and are effective to provide reasonable assurance that information we are required to disclose in reports we file or submit under the Exchange Act is recorded, processed, summarized and reported within the time periods specified in the SEC's rules and forms, and that such information is accumulated and communicated to our management, including our CEO and CFO, as appropriate, to allow timely decisions regarding required disclosure.
Changes in Internal Control Over Financial Reporting
In April 2017, we acquired HEG which operated under its own set of systems and internal controls. During
2017
, we transitioned certain of HEG's processes to our internal control processes and we expect to transition more of such processes during
2018
. Other than with respect to our transition of HEG to our systems and control environment as described above, during the year ended
December 31, 2017
, there were no changes in our internal control over financial reporting identified in connection with the evaluation required by paragraph (d) of Rule 13a-15 or Rule 15d-15 that have materially affected, or are reasonably likely to materially affect, our internal control over financial reporting.
Limitations on Effectiveness of Controls and Procedures
In designing and evaluating the disclosure controls and procedures, management recognizes that any controls and procedures, no matter how well designed and operated, can provide only reasonable assurance of achieving the desired control objectives. In addition, the design of disclosure controls and procedures must reflect the fact that there are resource constraints and management is required to apply its judgment in evaluating the benefits of possible controls and procedures relative to their costs.
Management's Report on Internal Control over Financial Reporting
Our management is responsible for establishing and maintaining adequate internal control over financial reporting (as defined in Rule 13a-15(f) of the Exchange Act). Our management assessed the effectiveness of our internal control over financial reporting as of
December 31, 2017
. In making this assessment, our management used the criteria set forth by the Committee of Sponsoring Organizations of the Treadway Commission in Internal Control—Integrated Framework (2013 framework). Based on our assessment under this framework, our management concluded that our internal control over financial reporting was effective as of
December 31, 2017
. The effectiveness of our internal control over financial reporting as of
December 31, 2017
has been audited by Ernst & Young LLP, an independent registered public accounting firm, as stated in their report included herein.
In accordance with guidance issued by the Securities and Exchange Commission, registrants are permitted to exclude material business combinations from their final assessment of internal control over financial reporting for the first fiscal year in which an acquisition occurred. Our management's evaluation of internal control over financial reporting excluded the internal control activities of HEG, which we acquired in April 2017 as discussed in Note 3 to our consolidated financial statements. We have included the results of HEG in our consolidated financial statements from the date of acquisition. Total revenue excluded from our assessment of internal control over financial reporting represented approximately
6.9%
of our consolidated total revenue in
2017
. Total HEG assets excluded from our assessment of internal control over financial reporting represented approximately
3.0%
of our consolidated total assets as of
December 31, 2017
.
123
Report of Independent Registered Public Accounting Firm
To the Stockholders and the Board of Directors of GoDaddy Inc.
Opinion on Internal Control over Financial Reporting
We have audited GoDaddy Inc.'s internal control over financial reporting as of
December 31, 2017
, based on criteria established in Internal Control-Integrated Framework issued by the Committee of Sponsoring Organizations of the Treadway Commission (2013 framework) (the COSO criteria). In our opinion, GoDaddy Inc. (the Company) maintained, in all material respects, effective internal control over financial reporting as of
December 31, 2017
, based on the COSO criteria.
As indicated in the accompanying Management's Report on Internal Control Over Financial Reporting, management's assessment of and conclusion on the effectiveness of internal control over financial reporting did not include the internal controls of Host Europe Holdings Limited, which is included in the
2017
financial statements of the Company and constituted approximately
3.0%
of total assets as of
December 31, 2017
and
6.9%
of revenues for the year then ended. Our audit of internal control over financial reporting of the Company also did not include an evaluation of the internal control over financial reporting of Host Europe Holdings Limited.
We also have audited, in accordance with the standards of the Public Company Accounting Oversight Board (United States) (PCAOB), the
2017
financial statements of the Company and our report dated
February 27, 2018
expressed an unqualified opinion thereon.
Basis for Opinion
The Company's management is responsible for maintaining effective internal control over financial reporting and for its assessment of the effectiveness of internal control over financial reporting included in the accompanying Management's Report on Internal Control Over Financial Reporting. Our responsibility is to express an opinion on the Company's internal control over financial reporting based on our audit. We are a public accounting firm registered with the PCAOB and are required to be independent with respect to the Company in accordance with the U.S. federal securities laws and the applicable rules and regulations of the Securities and Exchange Commission and the PCAOB.
We conducted our audit in accordance with the standards of the PCAOB. Those standards require that we plan and perform the audit to obtain reasonable assurance about whether effective internal control over financial reporting was maintained in all material respects.
Our audit included obtaining an understanding of internal control over financial reporting, assessing the risk that a material weakness exists, testing and evaluating the design and operating effectiveness of internal control based on the assessed risk, and performing such other procedures as we considered necessary in the circumstances. We believe that our audit provides a reasonable basis for our opinion.
Definition and Limitations of Internal Control Over Financial Reporting
A company's internal control over financial reporting is a process designed to provide reasonable assurance regarding the reliability of financial reporting and the preparation of financial statements for external purposes in accordance with generally accepted accounting principles. A company's internal control over financial reporting includes those policies and procedures that (1) pertain to the maintenance of records that, in reasonable detail, accurately and fairly reflect the transactions and dispositions of the assets of the company; (2) provide reasonable assurance that transactions are recorded as necessary to permit preparation of financial statements in accordance with generally accepted accounting principles, and that receipts and expenditures of the company are being made only in accordance with authorizations of management and directors of the company; and (3) provide reasonable assurance regarding prevention or timely detection of unauthorized acquisition, use, or disposition of the company's assets that could have a material effect on the financial statements.
Because of its inherent limitations, internal control over financial reporting may not prevent or detect misstatements. Also, projections of any evaluation of effectiveness to future periods are subject to the risk that controls may become inadequate because of changes in conditions, or that the degree of compliance with the policies or procedures may deteriorate.
/s/ Ernst & Young LLP
Phoenix, Arizona
February 27, 2018
124
None.
The information required by this item will be included in our Proxy Statement for the
2018
Annual Meeting of Stockholders to be filed with the SEC within
120
days of the year ended
December 31, 2017
(the
2018
Proxy Statement) and is incorporated herein by reference. The information required by this item regarding delinquent filers pursuant to Item 405 of Regulation S-K will be included under the caption "Section 16(a) Beneficial Ownership Reporting Compliance" in the
2018
Proxy Statement and is incorporated herein by reference.
Code of Ethics
We have adopted a Code of Business Conduct and Ethics applicable to all of our employees, executive officers and directors. Our Code of Business Conduct and Ethics is available on our website in the Investor Relations section under the menu entry: Governance/Governance Documents (https://aboutus.godaddy.net/investor-relations/governance/default.aspx). To the extent mandated by legal requirements, we intend to disclose on our website any amendments to our Code of Business Conduct and Ethics, or any waivers of its requirements.
The information required by this item will be included in the
2018
Proxy Statement and is incorporated herein by reference.
The information required by this item will be included in the
2018
Proxy Statement and is incorporated herein by reference.
The information required by this item will be included in the
2018
Proxy Statement and is incorporated herein by reference.
The information required by this item will be included in the
2018
Proxy Statement and is incorporated herein by reference.
125
We have filed the following documents as part of this Annual Report on Form 10-K:
Consolidated Financial Statements
Our consolidated financial statements are listed in the "Index to Consolidated Financial Statements" under Item 8 "Financial Statements and Supplementary Data."
Financial Statement Schedules
All other schedules have been omitted because they are either not required, not applicable or the required information is otherwise included.
126
Exhibit Index
|
Incorporated by Reference
|
|||||||
|
Exhibit
Number
|
Exhibit Description
|
Form
|
File No.
|
Exhibit
|
Filing Date
|
||
|
2.1
|
8-K
|
001-36904
|
2.1
|
4/6/2015
|
|||
|
2.2#
|
8-K
|
001-36904
|
2.1
|
12/9/2016
|
|||
|
2.3
|
8-K
|
001-36904
|
2.2
|
12/9/2016
|
|||
|
2.4#
|
8-K
|
001-36904
|
2.1
|
7/18/2017
|
|||
|
3.1
|
8-K
|
001-36904
|
3.1
|
4/6/2015
|
|||
|
3.2
|
8-K
|
001-36904
|
3.2
|
4/6/2015
|
|||
|
4.1
|
S-1/A
|
333-196615
|
4.1
|
3/19/2015
|
|||
|
4.2
|
8-K
|
001-36904
|
10.3
|
4/6/2015
|
|||
|
4.3
|
8-K
|
001-36904
|
10.4
|
4/6/2015
|
|||
|
4.4
|
8-K
|
001-36904
|
10.2
|
4/6/2015
|
|||
|
4.5
+
|
S-8
|
333-203166
|
4.2
|
4/1/2015
|
|||
|
4.6+
|
10-Q
|
001-36904
|
4.1
|
11/2/2016
|
|||
|
4.7
+
|
S-8
|
333-203166
|
4.4
|
4/1/2015
|
|||
|
4.8
+
|
S-1/A
|
333-196615
|
10.10
|
2/13/2015
|
|||
|
4.9
+
|
S-1/A
|
333-196615
|
10.11
|
2/13/2015
|
|||
|
4.10
+
|
S-1/A
|
333-196615
|
10.28
|
3/19/2015
|
|||
|
10.1
|
8-K
|
001-36904
|
10.1
|
4/6/2015
|
|||
|
10.2
|
8-K
|
001-36904
|
10.5
|
4/6/2015
|
|||
|
10.3
|
8-K
|
001-36904
|
10.6
|
4/6/2015
|
|||
|
10.4
|
8-K
|
001-36904
|
10.7
|
4/6/2015
|
|||
|
10.5
|
8-K
|
001-36904
|
10.8
|
4/6/2015
|
|||
|
10.6
|
8-K
|
001-36904
|
10.9
|
4/6/2015
|
|||
|
10.7
|
S-1
|
333-196615
|
10.16
|
6/9/2014
|
|||
|
10.8
|
S-1
|
333-196615
|
10.17
|
6/9/2014
|
|||
|
10.9
|
8-K
|
001-36904
|
10.1
|
2/16/2017
|
|||
127
|
Incorporated by Reference
|
|||||||
|
Exhibit
Number
|
Exhibit Description
|
Form
|
File No.
|
Exhibit
|
Filing Date
|
||
|
10.10
|
8-K
|
001-36904
|
10.1
|
4/4/2017
|
|||
|
10.11
|
8-K
|
001-36904
|
10.1
|
11/22/2017
|
|||
|
10.12
|
8-K
|
001-36904
|
10.1
|
5/26/2017
|
|||
|
10.13
|
8-K
|
001-36904
|
10.2
|
5/26/2017
|
|||
|
10.14
|
S-1/A
|
333-196615
|
10.18
|
8/14/2014
|
|||
|
10.15
|
S-1/A
|
333-196615
|
10.20
|
2/24/2015
|
|||
|
10.16
+
|
S-1/A
|
333-196615
|
10.22
|
2/24/2015
|
|||
|
10.17
|
S-1/A
|
333-196615
|
10.20
|
2/24/2015
|
|||
|
10.18+
|
10-Q
|
001-36904
|
10.1
|
11/8/2017
|
|||
|
10.19+
|
10-Q
|
001-36904
|
10.2
|
11/8/2017
|
|||
|
10.20+
|
S-1/A
|
333-196615
|
10.25
|
2/24/2015
|
|||
|
10.21
+
|
10-Q
|
001-36904
|
10.1
|
8/4/2016
|
|||
|
10.22
+
|
10-Q
|
001-36904
|
10.1
|
11/2/2016
|
|||
|
10.23+
|
8-K
|
001-36904
|
10.1
|
3/10/2016
|
|||
|
10.24+
|
10-Q
|
001-36904
|
10.2
|
5/8/2017
|
|||
|
10.25+
|
10-Q
|
001-36904
|
10.1
|
5/8/2017
|
|||
|
10.26+
|
8-K
|
001-36904
|
10.1
|
2/2/2018
|
|||
|
10.27
|
8-K
|
001-36904
|
10.1
|
5/10/2017
|
|||
|
21.1*
|
|||||||
|
23.1
*
|
|||||||
|
24.1
*
|
|||||||
|
31.1
*
|
|||||||
|
31.2
*
|
|||||||
|
32.1
**
|
|||||||
|
+
|
Indicates management contract or compensatory plan or arrangement.
|
|
|
#
|
Schedules and exhibits have been omitted pursuant to Item 601(b)(2) of Regulation S-K. GoDaddy Inc. agrees to furnish supplementally to the SEC a copy of any omitted schedule or exhibit upon request.
|
|
|
*
|
Filed herewith.
|
|
|
**
|
The certifications attached as Exhibit 32.1 accompanying this Annual Report on Form 10-K, are deemed furnished and not filed with the Securities and Exchange Commission and are not to be incorporated by reference into any filing of GoDaddy Inc. under the Securities Act of 1933, as amended, or the Securities Exchange Act of 1934, as amended, whether made before or after the date of this Annual Report on Form 10-K, irrespective of any general incorporation language contained in such filing.
|
|
128
None.
129
SIGNATURES
Pursuant to the requirements of Section 13 or 15(d) of the Securities Exchange Act of 1934, the registrant has duly caused this report to be signed on its behalf by the undersigned, thereunto duly authorized.
|
GODADDY INC.
|
|||
|
Date:
|
February 27, 2018
|
/s/ Scott W. Wagner
|
|
|
Scott W. Wagner
Chief Executive Officer
|
|||
POWER OF ATTORNEY
Each person whose signature appears below constitutes and appoints Scott W. Wagner and Ray E. Winborne, and each of them, as his or her true and lawful attorney-in-fact and agent, with full power of substitution and resubstitution, for him or her and in his or her name, place and stead, in any and all capacities, to sign any and all amendments to this Annual Report on Form 10-K, and to file the same, with all exhibits thereto, and other documents in connection therewith, with the Securities and Exchange Commission, granting unto said attorneys-in-fact and agents, and each of them, full power and authority to do and perform each and every act and thing requisite and necessary to be done in connection therewith, as fully to all intents and purposes as he or she might or could do in person, hereby ratifying and confirming all that said attorneys-in-fact and agents, or any of them, or their or his substitutes, may lawfully do or cause to be done by virtue thereof.
Pursuant to the requirements of the Securities Exchange Act of 1934, this report has been signed below by the following persons on behalf of the registrant and in the capacities and on the dates indicated:
|
Signature
|
Title
|
Date
|
|||
|
/s/ Scott W. Wagner
|
Chief Executive Officer and Director
(Principal Executive Officer) |
February 27, 2018
|
|||
|
Scott W. Wagner
|
|||||
|
/s/ Ray E. Winborne
|
Chief Financial Officer
(Principal Financial Officer) |
February 27, 2018
|
|||
|
Ray E. Winborne
|
|||||
|
/s/ Rebecca Morrow
|
Chief Accounting Officer
(Principal Accounting Officer) |
February 27, 2018
|
|||
|
Rebecca Morrow
|
|||||
|
/s/ Charles J. Robel
|
Chairman of the Board of Directors
|
February 27, 2018
|
|||
|
Charles J. Robel
|
|||||
|
/s/ Herald Y. Chen
|
Director
|
February 27, 2018
|
|||
|
Herald Y. Chen
|
|||||
|
/s/ Mark Garrett
|
Director
|
February 27, 2018
|
|||
|
Mark Garrett
|
|||||
|
/s/ Blake J. Irving
|
Director
|
February 27, 2018
|
|||
|
Blake J. Irving
|
|||||
|
/s/ Gregory K. Mondre
|
Director
|
February 27, 2018
|
|||
|
Gregory K. Mondre
|
|||||
|
/s/ John I. Park
|
Director
|
February 27, 2018
|
|||
|
John I. Park
|
|||||
|
/s/ Bob Parsons
|
Director
|
February 27, 2018
|
|||
|
Bob Parsons
|
|||||
|
/s/ Elizabeth S. Rafael
|
Director
|
February 27, 2018
|
|||
|
Elizabeth S. Rafael
|
|||||
|
/s/ Brian H. Sharples
|
Director
|
February 27, 2018
|
|||
|
Brian H. Sharples
|
|||||
|
/s/ Lee E. Wittlinger
|
Director
|
February 27, 2018
|
|||
|
Lee E. Wittlinger
|
|||||
130
TABLE OF CONTENTS
Part IItem 1. BusinessItem 1A. Risk FactorsItem 1B. Unresolved Staff CommentsItem 2. PropertiesItem 3. Legal ProceedingsItem 4. Mine Safety DisclosuresPart IIItem 5. Market For Registrant's Common Equity, Related Stockholder Matters and Issuer Purchases Of Equity SecuritiesItem 6. Selected Financial DataItem 7. Management's Discussion and Analysis Of Financial Condition and Results Of OperationsItem 7A. Quantitative and Qualitative Disclosures About Market RiskItem 8. Financial Statements and Supplementary DataItem 9. Changes in and Disagreements with Accountants on Accounting and Financial DisclosureItem 9A. Controls and ProceduresItem 9B. Other InformationPart IIIItem 10. Directors, Executive Officers and Corporate GovernanceItem 11. Executive CompensationItem 12. Security Ownership Of Certain Beneficial Owners and Management and Related Stockholder MattersItem 13. Certain Relationships and Related Transactions, and Director IndependenceItem 14. Principal Accounting Fees and ServicesPart IVItem 15. Exhibits, Financial Statement SchedulesItem 16. Form 10-k Summary